Status of the World's Soil Resources Report Chapters 9 - UofK
303
FINAL DRAFT NOT FOR CITATION Status of the World’s Soil Resources Report Chapters 9 - 16 Regional Assessments of Soil Changes Rome, March 2015 Status of the World’s Soil Resources Report, Regional Assessments of Soil Changes | Chapters 9 - 16
-
Upload
khangminh22 -
Category
Documents
-
view
1 -
download
0
Transcript of Status of the World's Soil Resources Report Chapters 9 - UofK

FINAL DRAFT
NOT FOR CITATION
Status of the World’s Soil Resources Report
Chapters 9 - 16
Regional Assessments of Soil Changes
Rome, March 2015
Status of the World’s Soil Resources Report, Regional Assessments of Soil Changes | Chapters 9 - 16

Status of the World’s Soil Resources Report, Regional Assessments of Soil Changes | Chapters 9 - 16
2

Status of the World’s Soil Resources Report, Regional Assessments of Soil Changes | Chapters 9 - 16
3

Table of Contents 9 Regional Assessment of Soil Changes in Africa South of the Sahara .................................. 11
9.1 Introduction .................................................................................................................... 11
9.2 Stratification of the region ............................................................................................. 12
9.3 General soil threats in the region ................................................................................... 15
9.4 The most important soil threats in Sub-Saharan Africa ................................................. 22
9.5 Case studies .................................................................................................................... 35
9.6 Summary of conclusions and recommendations ............................................................ 47
10. Regional Assessment of Soil Change in Asia .................................................................... 60
10.1. Introduction ................................................................................................................. 60
10.2. Stratification of the region .......................................................................................... 60
10.3 General threats to soils in the region ............................................................................ 63
10.4. Major threats to soils in the region .............................................................................. 70
10.5. Case studies ................................................................................................................. 78
10.6 Conclusion ................................................................................................................... 89
11. Regional assessement of soil changes in Europe and Eurasia .......................................... 103
11.1 Introduction ................................................................................................................ 103
11.2. Stratification of the region ........................................................................................ 104
11.3 General threats to soils in the region .......................................................................... 107
11.4. Major threats for ecosystem in Europe and Eurasia .................................................. 111
11.5. Case studies ............................................................................................................... 117
11.6 Conclusion and References ........................................................................................ 130
12. Regional assessment of soil changes in Latin America and the Caribbean ..................... 136
12.1 Introduction ................................................................................................................ 136
12.2. Biomes, ecoregions and general soil threats in the region. ....................................... 137
12.3. General soil threats in the region .............................................................................. 143
12.4. Major threats to soil .................................................................................................. 146
12.5. Case studies ............................................................................................................... 153
Status of the World’s Soil Resources Report, Regional Assessments of Soil Changes | Chapters 9 - 16
4

12.6 Conclusions and recommendations ............................................................................ 160
13. Regional Assessment of Soil Changes in the Near East and North Africa ................... 172
13.1. Introduction ............................................................................................................... 172
13.2. Major land use systems in the Near East and North Africa ...................................... 174
13.3 Major threats to soils in the region ......................................................................... 176
13.4. Major soil threats in the region ................................................................................. 182
13.5. Case studies ............................................................................................................... 195
13.6. Conclusions ............................................................................................................... 202
14. Regional Assessment of Soil Changes in North America ................................................ 215
14.1 Introduction ................................................................................................................ 215
14.2 Regional Stratification and Soil Threats .................................................................... 216
14.3 Soil Threats ................................................................................................................ 219
14.4 Major Soil Threats ..................................................................................................... 227
14.5 Case Study: Canada ................................................................................................... 234
14.6 Conclusions and Recommendations .......................................................................... 241
15. Regional Assessment of Soil Change in the Southwest Pacific ....................................... 251
15.1 Introduction ............................................................................................................. 251
15.2 The major land types in the region ......................................................................... 251
15.3 Climate .................................................................................................................... 253
15.4 Land use .................................................................................................................. 254
15.5 Threats to soils in the region ................................................................................... 261
15.6 Case studies ............................................................................................................ 276
15.7 Conclusions ............................................................................................................. 285
15.8 References ............................................................................................................... 286
16. Regional Assessment Soil Change in Antarctica ............................................................. 297
16.1 Antarctic soils and environment (state) .................................................................. 297
16.2 Pressures/threats to Antarctic soil environment ...................................................... 297
16.3 Response ................................................................................................................. 299
16.4 References ............................................................................................................... 300 Status of the World’s Soil Resources Report, Regional Assessments of Soil Changes | Chapters 9 - 16
5

List of Figures
Figure 9.1: Agro-ecological zones in Africa South of the Sahara.
Figure 9.2: Urban Areas extension and Urbanization Indexes for the Sub-Saharan African countries
Figure 9.3: The fertility rate (the number of children a woman is expected to bear during her lifetime) for 1970 and 2005
Figure 9.4: Percentage of population living below the poverty line
Figure 9.5: Major Land Use Systems in Senegal
Figure 9.6: Proportional extent of major land use systems in the Senegal
Figure 9.7: Extent of dominant degradation type in Senegal
Figure 9.8: Average rate of degradation in Senegal
Figure 9.9: Impact of degradation on ecosystem services in the local study areas in Senegal
Figure 9.10: Broad soil patterns of South Africa. Source: Land Type Survey Staff, 2003
Figure 9.11: The national stratification used for land degradation assessment in South Africa, with local municipality boundaries resulting in 18 land use classes. Source: Pretorius (2009).
Figure 9.12: Actual water erosion prediction map of South Africa. Source: Le Roux (2012).
Figure 9.13: Topsoil pH derived from undisturbed (natural) soils. Source: Beukes et al., 2008a
Figure 9.14: Change in land-cover between 1994 and 2005 as part of the Five Class Land-cover of South Africa after logical corrections. Source: Schoeman et al. (2010)
Figure 10.1: Length of the available growing period in Asia (in days/year)
Figure 10.2 Threats to soils in the Asia region by country (The figure was drawn based on the data in van Lynden and Oldeman, 1997).
Figure 10.2: Threats to soils in the Asia region by country
Figure 10.3: Nitrogen surplus or depletion and nutrient use efficiency in crop production in Asia in 2010
Figure 10.4: Soil degradation types in India Status of the World’s Soil Resources Report, Regional Assessments of Soil Changes | Chapters 9 - 16
6

Figure 10.5: Indonesian peatland overlayed with land cover as of 2011
Figure 10.6: Distribution map of radioactive Cs concentration in soil in Fukushima prefecture (reference date of November 5, 2011)
Figure 10:7: Distribution map of the parameters of USLE and classification of estimated soil loss
Figure 10.8: Estimate CH4 emission from rice paddy in Asia
Figure 11.1: Terrestrial eco-regions of the European and Former Soviet Union region. Figure 11.2: Main areas of irrigation.
Figure 11.3: Soil salinization on the territory of the European Region
Figure 11.4: Some types and extent of soil degradation in Ukraine
Figure 11.5: Soil map and soil degradation extent in Uzbekistan
Figure 12.1: Biomes in Latin America and the Caribbean.
Figure 12.2: Urbanization area (Km2) and Index (%) in LAC Region
Figure 12.3: Carbon concentrations (left) and carbon stocks (right) in the main ecosystems of Mexico Figure 12.4: Organic carbon content in soils of Latin America and the Caribbean.
Figure 12.5: Regional set of 2000 tree cover and 2000 to 2012 forest loss
Figure 12.6: Some relationships between climate conditions of the humid tropics and ecological processes in the Amazonian forest ecosystems
Figure 12.7: Expansion of the agricultural frontier under rainfed conditions (Source: Viglizzo and Jobbagy, 2010).
Figure 12.8: Degree of land degradation in Argentina
Figure 12.9: Percentage of areas affected by wind (a) and water erosion (b) in Argentina
Figure 12.10 - Cuba soils map using WRB classification and 1: 2 500 000 scale (Gardi et al. 2014). Figure 12.11: Predominant types of land degradation in Cuba.
Figure 12.12: Extent of land degradation in land use system units in Cuba.
Figure 12.13: Intensity of land degradation in Cuba.
Figure 13.1: Land use systems in the Near East and North Africa. Status of the World’s Soil Resources Report, Regional Assessments of Soil Changes | Chapters 9 - 16
7

Figure 13.2. Urban areas (1000 km2) and Urbanzation Index (%) in the Near East and North Africa. Figure 13.3: Layout of the project site source (a) and Concepual design and layout of bioremediation system (b). Source: Balba et al., 1998). Figure 13.4: Rate of Water erosion in Iran
Figure 13.5: Number of days with sandstorms in 2012
Figure 13.6: Internal and external dust sources in recent years in Iran.
Figure 13.7: Assessment of Water and Wind Erosion in Tunisia
Figure 13.8: Soil Conservation in Tunisia
Figure 13.9: Types of ecosystem services most affected in Tunisia.
Figure 14.1: Level II Ecological regions of North America.
Figure 14.2: Map of Superfund sites in the contiguous U.S.
Figure 14.3: Areas in U.S. threatened by salinization and sodification.
Figure 14.4: Risk of soil salinization in Canada 2011.
Figure 14.5: Urban Areas extension and Urbanization Indexes for the North American countries
Figure 14.6: Estimated sheet and rill erosion on cropland in the contiguous U.S.
Figure 14.7: Risk of water erosion in Canada 2011.
Figure 14.8: Risk of wind erosion in Canada 2011.
Figure 14.9: Soil organic carbon change in Canada 2011.
Figure 14.10: Residual soil N in Canada 2011.
Figure 14.11: Indicator of risk of water contamination by phosphorus
Figure 15.1: Major land types and nations in the Southwest Pacific region (to be drafted)
Figure 15.2: Change in the percentage area of all land prepared for crops and pastures under different tillage practices in Australia, 1996-2010
Figure 15.3: (a) Trends in winter rainfall in south-western Australia for the period 1900–2012. The 15-year running average is shown by the black line. (b) Annual mean temperature anomaly time series map for south-western Australia
Status of the World’s Soil Resources Report, Regional Assessments of Soil Changes | Chapters 9 - 16
8

Figure 15.4: Percentage of sites sampled (2005–12) with soil pH at 0–10 cm depth below the established target of pHCa 4.8 (left) and critical pHCa 4.5 (right).
Figure 15.5: Agricultural lime sales 2005–12 in the south-west of Western Australia based on data for 85–90% of the market.
Figure 15.6: MODIS image for 0000 23 September 2009 showing Red Dawn extending from south of Sydney to the Queensland/NSW border and the PM10 concentrations at that time.
List of Tables
Table 9.1: Agro-ecological zones of sub-Saharan Africa
Table 9.2: Classes of nutrient loss rate
Table 9.3: Nutrient balance in some SSA countries
Table 9.4 Definitions of the five land-cover classes on which the land-cover change was based. Source: Schoeman et al. (2010).
Table 9.5 Summary of Soil Threats Status, trends and uncertainties in Africa South of the Sahara
Table 10.1: Soil organic carbon change in selected countries in Asia
Table 10.2 Harmonized area statistics of degraded and wastelands of India
Table 10.3 Emission factors of drained tropical peatland under different land uses and the 95% confidential interval (IPCC, 2014)
Table 10.4 Summary of Soil Threats Status, trends and uncertainties in Asia
Table 11.1: The percentage of agricultural land area of total land area in the countries of the European region (FAOSTAT)
Table 11.2: The areas of saline soils in the countries with major extent of soil salinization in the European region
Table 11.3: Types and extent of soil degradation in Ukraine
Table 11.4: Summary of Soil Threats Status, trends and uncertainties in Europe and Eurasia
Table 12.1: Taxonomic richness, mean abundance, and biomass of macroinvertebrates in different land use systems in Yurimaguas, Peru.
Status of the World’s Soil Resources Report, Regional Assessments of Soil Changes | Chapters 9 - 16
9

Table 12.2 Summary of Soil Threats Status, trends and uncertainties in in Latin America and the Caribbean
Table 13.1: Land degradation caused by water erosion in the NENA region
Table 13.2: Soil degradation caused by wind erosion in the NENA region
Table 13.3: Ranking of soil threats in the Near East and North Africa Region Table 13.4 Summary of Soil Threats Status, trends and uncertainties in the Near East and North Africa Table 14.1 Summary of Soil Threats Status, trends and uncertainties in North America Table 15.1: Summary of current primary drivers of land-use and the associated implications for soil resources in the Southwest Pacific region.
Table 15.2: Current population, project population (UNDESA 2013) and Gross Domestic Production per capita (World Bank 2014) for countries of the region.
Table 15.3: Estimated annual land–atmosphere (net) carbon (C) exchange rate for New Zealand’s major vegetation types (Trotter et al. 2004).
Table 15.4 Summary of Soil Threats Status, trends and uncertainties in the Southwest Pacific
List of Boxes
Box 11.1 Untitled
Status of the World’s Soil Resources Report, Regional Assessments of Soil Changes | Chapters 9 - 16
10

9 Regional Assessment of Soil Changes in Africa South of the Sahara Assessment of Soil Changes in Africa South of the Sahara
Regional Coordinator: Victor Chude (ITPS/Nigeria)
Regional Lead Author: Ayoade Ogunkunle (Nigeria)
Contributing Authors: Victor Chude (ITPS/Nigeria), Isaurinda Dos Santos (ITPS/Cape Verde), Tekalign Mamo (ITPS/Ethiopia), Garry Paterson (South Africa), Ndaye Soumare (Senegal), Liesl Wiese (South Africa). Martin Yemefack (ITPS/Cameroon).
=====================================================================
9.1 Introduction Land degradation in sub-Saharan Africa is intensifying at an alarming rate, accompanied by
the lowest agriculture and livestock yields of any region in the world. And while cereal production has grown marginally over the past two decades, more than 70 percent of this growth is due to crop expansion rather than yield increases. The region also suffers from the world’s highest rate of deforestation, with some countries having lost more than 10 per cent of forest cover in the past five years alone (IFAD, 2009).
There is a growing recognition, among both policy-makers and soil specialists, that soil degradation is one of the root causes of declining agricultural productivity in sub-Saharan Africa (SSA) and that, unless controlled, many parts of the continent will suffer increasingly from food insecurity (Lal, 1990, UNEP 1982). The consequences of allowing the productivity of Africa’s soil resources to continue on its present downward spiral will be severe, not only for the economies of individual countries, but for the welfare of the millions of rural households dependent on agriculture for meeting their welfare in the Continent as a whole (FAO, 1999).
Soil degradation is the decline in soil quality caused by natural factors or, more often, by its improper use, usually for agricultural, pastoral, industrial or urban purposes. Soil degradation may be exacerbated by climate change and encompasses physical, chemical and biological deterioration. Examples of soil degradation cited by Charman and Murphy (2005) are loss of organic matter, decline in soil fertility, decline in structural condition, topsoil loss and erosion, adverse changes in salinity, acidity or alkalinity, the effects of toxic chemicals, pollutants and excessive flooding.
There is no consensus on the exact extent and severity of land degradation or it impacts in SSA as a whole (Reich et al., 2001; GEF, 2006). However, it has been estimated that, annually, an area of about 5–8 million hectares of formerly productive land goes out of cultivation due to degradation globally (TerrAfrica, 2006). Lack of information and knowledge is considered to be one of the major obstacles for reducing land degradation, improving agricultural productivity, and facilitating the adoption of sustainable land management (SLM) among smallholder farmers (Liniger et al., 2011).
Four continental-scale studies have assessed the extent of soil degradation in Africa. A literature review by Dregne (1990) of 33 countries found compelling evidence of serious land degradation in sub-regions of 13 countries: Algeria, Ethiopia, Ghana, Kenya, Lesotho, Mali, Morocco, Nigeria, Swaziland, Tanzania, Tunisia, Uganda, and Zimbabwe. In another literature review, focused
Status of the World’s Soil Resources Report, Regional Assessments of Soil Changes | Chapters 9 - 16
11

on drylands only, Dregne and Chou (1992) estimated that 73 percent of drylands were degraded and 51 percent severely degraded. They concluded that 18 percent of irrigated lands, 61 percent of rainfed lands, and 74 percent of rangelands located in drylands are degraded. The Global Assessment of Soil Degradation (GLASOD) expert survey found that 65 percent of soils on agricultural lands in Africa had become degraded since the middle of this century, as had 31 percent of permanent pastures, and 19 percent of woodlands and forests (Oldeman et al., 1991). Serious degradation affected 19 percent of agricultural land and a high proportion (72 percent) of degraded land was in drylands. The most widespread cause of degradation was water erosion, followed by wind erosion, chemical degradation (three-quarters from nutrient loss, the rest from salinization), and physical degradation. In terms of causes of degradation, overgrazing was responsible for half of all degradation, followed by agricultural activities, deforestation, and overexploitation. The Land Degradation Assessment in Drylands project (LADA) started in 2006 with the general purpose of creating the basis for informed policy advice on land degradation at global, national and local level. This goal is to be realized through the assessment of land degradation at different spatial and temporal scales and the creation of a baseline at global level for future monitoring (FAO, 2010). Two of the six countries involved (Senegal and South Africa) are within SSA and national results are reported at the end of this chapter.
Lal (1995) calculated continent-wide soil erosion rates from water using data from the mid to late 1980s, and then used these rates to compute cumulative soil erosion for 1970-90. The highest erosion rates occurred in the Maghreb region of Northwest Africa, the East African highlands, eastern Madagascar, and parts of Southern Africa. Excluding the 42.5 percent of arid lands and deserts with no measurable water erosion, Lal found that the land area affected by erosion fell into the following six classes of erosion hazard: none, 8 percent; slight, 49 percent; low, 17 percent; moderate, 7 percent; high, 13 percent; and severe, 6 percent. Soils host the majority of the world's biodiversity and healthy soils are essential to securing food and fiber production, providing an adequate and clean water supply over the long term, as well as providing cultural functions. Ecosystem services provided by soils are especially integral to the carbon and water cycles. Major increases in combined agricultural production have been associated with different kinds of soil degradation, especially since the agricultural growth came in part from extensive clearing of new agricultural lands. Yet, even with this expansion, arable land per capita declined from just under 0.5 hectare in 1950 to just under 0.3 hectare in 1990 (FAO, 1993). During this time period, yield increases on land already in production thus contributed far more to total production. For example, more than 90 percent of the growth in developing-country cereal production between 1961 and 1990 came from yield growth (World Bank, 1992). Agricultural expansion and yield growth at such a scale would be associated with some degradation of soil resources. However, the type and extent of degradation vary in the different ecological/farming systems, this affects the natural endowments in these regions and is also reflected in the kind of agricultural activities (Scherr, 1997).
9.2 Stratification of the region The region consists of a variety of relief, climate, lithology, soils and agricultural systems. A
combination of some of these have been used to stratify the region to agro-ecological zones (AEZs) (FAO/IIASA, 2002; HarvestChoice, 2010). Table 9.1 shows the AEZs into which the region has been grouped and some of their characteristics, while Figure 8.1.1 shows the distribution of the AEZs in the region.
9.2.1 Arid Zone
Status of the World’s Soil Resources Report, Regional Assessments of Soil Changes | Chapters 9 - 16
12

The arid zone occupies 36 percent of the land area of SSA, most of which is in West and East Africa. Rainfall is low and extremely variable in this zone, receiving 0 to 500 mm of rainfall annually which is capable of sustaining plant life for less than 90 plant growth days (or length of growing season).
Figure 9.1 Agro-ecological zones in Africa South of the Sahara (FAO/IIASA, 2002)
Table 9.1 Characteristics and Distribution of Agro-ecological zones in Africa
Zone Definitiona
Rainfall range (mm)
Area (percent) Area of zone (percent)
West Africa
Central Africa
East Africa
Southern Africa
Arid <90 pgd 0–500 54 1 52 20 36 Semi-arid 90–180 pgd 500–1000 20 7 18 34 18 Sub-humid 180–270 pgd 1000–1500 16 29 16 38 22
Humid >270 pgd 1500+ 10 59 2 7 19 Highlandsb <20°C n.a.c 0 4 12 1 5 Total 100 100 100 100 100
Status of the World’s Soil Resources Report, Regional Assessments of Soil Changes | Chapters 9 - 16
13

Total area (106 km2)
7.3 5.3 5.8 3.2
pgd = plant growth days; b: Areas with mean daily temperature during the growing period is less than 20°C; c: n.a. = not available; Source: ILCA, 1987, after Jahnke, 1982.
The arid zone is mostly associated with sandy soils (Arenosols, Psamments) which are weakly differentiated and are often of aeolian origin. Water and air move freely through these soils, which are low in all nutrients.
The accompanying vegetation consists of short annual grasses, legumes, scattered shrubs and trees. Mobile herds of sheep, goats, cattle and camels utilise the herbage and shrubs, while farmers use most of the trees and shrubs for fuel. The low rainfall and its erratic distribution makes prevents sustainable cropping in most years. Since arable farming is unreliable, it is mostly restricted to opportunistic cultivation of short-season millets, except in topographically favourable sites such as oases or irrigated areas. Opportunities for livestock development are limited but existing techniques could be improved upon, if not to increase productivity, then at least to sustain it.
9.2.2 Semi-arid zone
The semi-arid zone receives 500 to 1000 mm of rainfall annually which sustains 90 to 180 plant growing days. This zone occupies 18percent of the land area of SSA and is found in all regions except central Africa. The low rainfall and the long dry season make the semi-arid zone a relatively healthy environment for humans and livestock. Arenosols (Psamments) and Cambisols (Inceptisols) are widespread and include coarse sandy soils, fine sands, and loamy sandy soils. Water retention is poor and nutrient contents, including N, P and S levels, are generally low. The permeability of the undisturbed soil is good, but algal skins contribute to the formation of surface crusts. The natural vegetation is an open, low-tree grassland, but has been severely modified in many regions.
The lower rainfall areas of this zone are used for grazing, while cropping and crop–livestock systems dominate the areas with higher rainfall where farmers commonly grow millet, sorghum, groundnut, maize and cowpeas.
9.2.3 Sub-humid zone
The sub-humid zone occupies 22 percent of SSA, mainly in southern and central Africa, receiving 1000 to 1500 mm of rain annually which sustains plants for 180 to 270 plant growing days. Within the climatic definition, this is a very varied zone in terms of climate, soils and land use. Luvisols (Alfisols) and Cambisols (Inceptisols) occur widely, parent material is often strongly weathered, and the levels of mineral nutrients as well as the clay fraction are low. Cambisols (Inceptisols) have fewer constraints to plant production than the older, more weathered soils, since their high base status provides adequate Ca and eliminates constraints related to low pH levels. The fertility of many soils in this zone is low, especially due to leaching of NO3, accompanied by the loss of cations and P adsorbtion. In addition, structural stability in these soils can be poor, with crusting and hardening occurring when soils are dry.
The natural vegetation is of medium height or low woodland with understory shrubs and a ground cover of medium to tall, mainly perennial, grasses; Hyparrhenia spp. are common.
Status of the World’s Soil Resources Report, Regional Assessments of Soil Changes | Chapters 9 - 16
14

Food and cash crops are grown, including cassava, yams, maize, fruits, vegetables, rice, millet, groundnut, cowpeas and cotton. From these crops, products such as cottonseed cakes and the residues of the crops are available as feed for livestock. In some areas of this zone farmers grow soybean and leguminous forage crops.
9.2.4 Humid zone
The humid zone occupies 19 percent of SSA mostly in central and West Africa, receives more than 1500 mm of rainfall annually which sustains plants for 270 to 365 plant growing days and is found at low latitudes, north and south of the equator. Soils in this zone include Ferralsols (Oxisols), Acrisols (Ultisols) and Luvisols (Alfisols), the last of which are commonly encountered at the forest-savannah boundary. This zone consists of rain forest and derived savannahs with natural vegetation dominated by tall, closed forest which may be evergreen or semi-deciduous and is often floristically rich. The herbaceous vegetation often contains large amounts of the major nutrients, while the top soil contains relatively large amounts of organic matter, which markedly improves its characteristics. Removal of the trees therefore interrupts the nutrient cycle.
The soils are highly weathered and hence have high levels of iron and aluminium oxides and low levels of phosphorous. The organic matter content is therefore generally low and the soils are fragile and easily degraded when the vegetative cover is lost. This zone has limited potential for livestock development, particularly because of the threat of the trypanosomiasis-transmitting tsetse fly.
9.2.5 Highlands zone
The highland zone represents 5percent of the land area of SSA, most of which is in eastern Africa; half of this zone is in Ethiopia. This zone occupies areas above 1500 m altitude that have a mean daily temperature of less than 20 ºC. The main highland areas in sub-Saharan Africa (SSA) are in Ethiopia, Kenya, Uganda, Rwanda, Burundi, western Zaire, Tanzania, Angola and Lesotho. There are also many other areas above the 1500 m contour and some of these afford tsetse-free grazing, e.g. Fouta Djallon and Bamenda. The highland areas vary in climate, topography, soils and land use.
Topography varies from gently rolling hills to deeply incised valleys and steep slopes. Soils are sometimes deep and fertile Vertisols and Nitosols, but shallow soils of inherently low fertility are widespread. In many mountain grassland soils only have a very shallow surface horizon that is fertile. Undisturbed upland areas are normally stable, although some soils exhibit 'slumping' even where undisturbed. Cultivating the so-called 'duplex' soils5 and soils that form a surface crust on slopes results in high run off and torrents of water carrying large amounts of soil, unless soil conservation measures are taken and soils are sufficiently covered with vegetation. The zone receives bimodal rainfall (>1000 mm annually) and there are two growing seasons. Farmers grow forages and animal traction, through grazing, is of increasing importance as the population pressure encourages crop–livestock integration, especially since the cool highlands are a high potential area for crop–livestock integration.
9.3 General soil threats in the region The various threats to soil health and ecosystem services in SSA include: (1) erosion (by
water or wind), (2) loss of soil organic matter, (3) soil nutrient depletion, (4) loss of soil biodiversity, (5) soil contamination, (6) soil acidification, (7) salinization and sodification, (8) waterlogging, (9) compaction, crusting and sealing/capping (Mabogunje, 1995; Oldeman, 1991; Meadows and Hoffman, 2002; World Bank, 1997; IFPRI, 1999).
Status of the World’s Soil Resources Report, Regional Assessments of Soil Changes | Chapters 9 - 16
15

9.3.1 Erosion by water and wind
About 77 percent of Africa is affected by erosion. Serious erosion areas in Africa can be found in the Republic of South Africa, Sierra Leone, Guinea, Ghana, Liberia, Kenya, Zaire, Central African Republic, Ethiopia, Senegal, Mauritania, Nigeria, Niger, Sudan and Somalia.
According to the GLASOD results (ISRIC/UNEP, 1990), about 494 million ha of the land in Africa is affected by one form of degradation or another, 227 million ha (46 percent) of this is by water erosion, 187 million ha (38 percent) by wind erosion, 62 million ha (12 percent) by chemical degradation and 18 million ha (4 percent) by physical degradation. The intensity of water erosion has been described as very high to extreme in about 102 million ha (45 percent), moderate in about 67 million ha (30 percent) and slight in about 58 million ha (25 percent) of the area affected (Oldeman, 1991)
Water erosion: This is the most widespread soil degradation type in SSA. Water erosion increases on slopes where vegetation cover is (seasonally) reduced due to deforestation, overgrazing or cultivation that leaves the soil surface bare. It is further aggravated by a loss of soil structure and reduced infiltration rates. The areas particularly affected are humid and sub-humid zones. Almost 70 percent of Uganda was degraded by soil erosion and soil nutrient depletion between 1945 and 1990. More than 20 percent of agricultural land and pastures have been irreversibly degraded.
Water erosion poses the greatest threat to Nigerian soils and affects over 80 percent of the land (NEST, 1991). Wind, sheet, gully and beach erosion affect different parts of the country at varying intensities, but attention will focus here on the impact of erosion on agricultural land. While wind erosion is confined to the arid north, sheet erosion by water is ubiquitous throughout the country. Areas most prone to sheet erosion are where farming has cleared the original vegetation, and the soils became impoverished scrubland. Gully erosion is by far the most alarming type of erosion in Nigeria, particularly in the Eastern region, because it often threatens settlements and roads. Although it affects a small fraction (less than 0.1 percent) of Nigeria's 924,000 km2 of landmass, gully erosion claims large amounts of public funds annually for remedial action.
Wind erosion: Wind erosion occurs most frequently in the arid and semi-arid parts of SSA, especially in areas with sandy or loamy soils. Wind erosion leads to loss of topsoil over extended areas causing soil fertility decline. Bielders et al. (1985) stated that wind erosion can remove up to 80 tons of soil from one ha in a given year. In SSA wind erosion is second in importance to water erosion, constituting 38 percent of the total erosion in the region (ISRIC/UNEP, 1990) and affecting about 186 million ha of land in the region. The intensity is strong in about 9 million ha (5 percent), moderate in 89 million ha (48 percent) and light in 89 million ha (48 percent) (Oldeman, 1991). Over 99 percent of wind erosion in Africa occurs in the dry land zone, with less than 1 percent affecting the humid zone.
Wind erosion is a natural process that commonly occurs in deserts and on coastal sand dunes and beaches. During drought, it can also occur in agricultural regions where vegetation cover is reduced. If the climate becomes drier or windier, wind erosion is likely to increase. Climate change forecasts suggest that wind erosion will increase over the next 30 years due to more droughts and more variable climate. This will cause:
• less rain, which will support less vegetation
• lower soil moisture, which will decrease the ability of soil particles to bind together into larger, heavier aggregates
Status of the World’s Soil Resources Report, Regional Assessments of Soil Changes | Chapters 9 - 16
16

• increased wind speeds, which will result in more force exerted on the ground surface and more wind erosion (if the wind speed doubles, the erosion rate will increase eight times)
• large losses of soil and nutrients
• more large dust storms, which will impact soils and the community
• poorer air quality, increased respiratory health risks, and temperature and rainfall changes due to atmospheric pollution (all off-site effects).
9.3.2 Loss of Soil Organic Matter
Land degradation leads to a release of carbon to the atmosphere through oxidation of soil organic matter (Oldeman et al., 1991). Africa’s major role in the global carbon cycle can be attributed to the substantial releases of carbon associated with land use conversions from forest or woodlands to agriculture (Smith, 2008), which accounted for approximately 15 percent of the global net flux of Carbon from just land use changes in the 1990s (Houghton and Hackler, 2006). Land management following conversion also impacts carbon status, soil fertility, and agricultural sustainability as repeatedly suggested by Lal (2006), Ringius (2002), and others (Graff-Zivin and Lipper, 2008; Tieszen et al., 2004). Soils often continue to lose carbon over time following land conversion (Woomer et al., 2004; Tschakert et al., 2004; Liu et al., 2004), resulting in further reductions in crop yields and continued impoverishment; however, these carbon stocks can be replenished with combinations of residue retention, manuring, nitrogen (N) fertilization, agroforestry, and conservation practices (Lal, 2006).
In most sub-humid and semi-arid areas, much of the grazing land is burned annually during the dry season to remove the old and coarse vegetation and encourage the growth of young and more nutritious grasses. Burning causes the loss of soil organic matter (released as CO2) and thus impairs the sustainability of agricultural production. It exposes the soil to the erosive forces of the wind during the dry season and of the rain during the rainy season. Furthermore, the annual burn of the vegetation severely reduces the return of organic matter to the soil; thus losing its benefits (fertility, better structure, water retention, biodiversity, etc.); and the soil becomes biologically, chemically and physically poorer (FAO, 2001). Land degradation further leads to a release of carbon to the atmosphere through oxidation of soil organic matter resulting from soil disturbance and the resulting newly exposed soil surfaces to the elements.
In agricultural land, a main issue has been the need to produce increasing quantities of food in an economic and institutional context that did not allow for productivity increases to significantly materialize. This has led to: (i) the rapid expansion of agricultural land (over 65 percent in the last three decades); and (ii) the shortening of the fallow periods in traditional, extensive land use systems, which reduced the rehabilitation of soil fertility through natural processes. The increased use of fire as a clearing tool has further led to the loss of nutrients in many systems. Importantly, fertilizer consumption did not increase to compensate for the loss of soil nutrients resulting from the intensification of land use. Hence, there has been widespread mining of soil organic matter and nutrients. As a consequence of their geological origins, in combination with bad land management, many of SSAs croplands are now characterized by low organic matter contents, often in combination with a low pH and aluminum toxicity. On degraded soils with low organic matter, inorganic fertilizers are also easily leached, and this process has devastating long-term effects for agricultural productivity and downstream water resources.
9.3.3 Soil Nutrient Depletion
Status of the World’s Soil Resources Report, Regional Assessments of Soil Changes | Chapters 9 - 16
17

Soils in a large part of SSA are highly weathered and inherently low in organic matter. Because of the increasing pressure on land, natural replenishment of nutrients during fallow periods is now insufficient to maintain soil productivity over the long-term. Insufficient nutrient replacement in agricultural systems on land with poor to moderate potential results in soil degradation. Whereas soil moisture stress inherently constrains land productivity on 85 percent of soils in Africa (Eswaran et al., 1997), soil fertility degradation now places an additional serious human-induced limitation on productivity.
The low nutrient status of most soils is further exacerbated by insufficient use of fertilizers and manure and mono-cropping. Overall use of inorganic fertilizers in SSA is just 12 kg/ha, the lowest in the world, and soil nutrient depletion is widespread in croplands. Approximately 25 percent of soils in Africa are acidic, and therefore deficient in phosphorus (P), calcium and magnesium with often toxic levels of aluminum (McCann, 2005). Use of fertilizer in the region is the lowest in the world with average applications of less than 9 kg of Nitrogen and 6 kg of Phosphorus per ha, compared with typical crop requirements of 60 kg of nitrogen and 30 kg of phosphorus per ha. Recent research estimates that, on average, every country in SSA had a negative soil nutrient balance; the amount of nitrogen, phosphorus and potassium (K) added as inputs was significantly less than the amount removed as harvest or lost by erosion and leaching (Swift and Shepherd, 2007). Although many farmers have developed soil management strategies to cope with the poor quality of their soil, low inputs of nutrients, including organic matter, contribute to poor crop growth and the depletion of soil nutrients.
Stoorvogel et al. (1993) calculated nutrient balances for arable soils in 38 sub-Saharan countries and for 35 crops for 1982-1983 and 2000. Subtracting values of the output (made up of harvest, removal of residues, leaching, denitrification and erosion) from the values of the input (made up of fertilizers, manures, rain, dust, biological N-fixation and sedimentation), they reported alarming average nutrient losses for SSA as follows: 1982-1983: 22 kg N, 2.5 kg P and 15 kg K; 2000: 26 kg N, 3 kg P and 19 kg K. This is clear evidence of increased nutrient mining over time. Other estimations claim that each year four million tons of nutrients are harvested annually in SSA against <¼ M tons returned to the soils in the form of fertilizers.
Sub-national studies of nutrient depletion found annual losses of 112 kg per hectare of N, 2.5 kg of P, and 70 kg of K in the western Kisii highlands of Kenya; and significantly lower losses in southern Mali (Smaling 1993; Smaling et al., 1997). Farm monitoring and modeling of nutrient cycles for the western highlands of Kenya found that more nitrogen (63 kg per hectare) was being lost through leaching, nitrification, and volatilization than through removal of crop harvests (43 kg per hectare). Depending on the type of farm management practice, net nitrogen balances on cropped land varied between -39 and 110 kg per hectare per year, and net phosphorus balances between -7 and 31 kg per hectare per year (Shepherd and Soule, 1998).
The average nutrient loss in SSA soils was estimated to be 24 kg nutrients/ha per year (10 kg N; 4 kg P2O5, 10 kg K2O) in 1990 and 48 kg nutrients/ha per year in 2000, i.e. a loss equivalent to 100 kg fertilizers/ha per year. Countries with the highest depletion rates such as Kenya and Ethiopia, also have severe soil erosion (FAO, 2001).
9.3.4 Loss of soil biodiversity
Biodiversity loss occurs in a number of ways including destruction of habitat and land use change, introduction of new species and harvesting and hunting of individual wild species. It has been estimated that in the mid-1980s in Sub-Saharan Africa (SSA), 65 % of the ‘original’ ecosystems had
Status of the World’s Soil Resources Report, Regional Assessments of Soil Changes | Chapters 9 - 16
18

been converted (Perrings and Lovett, 1999). Loss of soil biodiversity is considered the fourth major threat in SSA. The most important factors affecting soil biodiversity are: habitat fragmentation; resource availability (amount and quality of nutrients and energy sources); temporal heterogeneity (seasonal effects); spatial heterogeneity (spatial differences in the soil), climate variability; and, interactions within the biotic community.
Habitat destruction and/or fragmentation remains the primary threat to soil biodiversity loss in Africa. For instance, the once great equatorial forest that stretched from western Africa into eastern Africa is presently in small pockets represented by Lamto forest in Ivory Coast, Mbalmayo forest in Cameroun, Congo forest in DR Congo, Kabale, Budongo and Mabira forests in Uganda and Kakamega forest in Kenya. The surrounding communities still rely heavily on these forests for basic needs such as fuelwood, charcoal, timber, poles, and other building materials. Due to human encroachments, the forests are threatened hence are presently a mosaic of different land uses, among them patches of secondary forest and fallow, arable fields and significant remnants of primary vegetation. Soil biota is consequently not spared. Studies by Okwakol (2000), Birang (2002) and Ayuke et al (2012) have shown that up to 50% of soil macrofauna species have been lost due to emanating habitat destruction and/or fragmentation, especially of these natural ecosystems.
Other threats to soil biodiversity in SSA include land use and land cover change, mainly through conversion of natural ecosystems, particularly forests and grasslands, to agricultural land and urban areas. In a study conducted across different ecosystems of Eastern (Kenya), Western (Nigeria, Burkina Faso, Ghana, Niger) and Southern Africa (Malawi), Ayuke et al. (2011) demonstrated a substantial reduction in the number of species and abundance of soil macrofauna groups, such as earthworms and termites, due to conversion of native or undisturbed ecosystems into arable systems. Continuous cultivation also further exacerbates soil biodiversity loss due to loss of soil organic matter and hence food resources for the soil organisms (Ayuke et al., 2012). It is likely that land clearing and deforestation will continue, further threatening genetic diversity as more species are lost (IAASTD, 2009). Sub-Saharan Africa suffers the world’s highest annual deforestation rate due to overexploitation of the forest resources and conversion of forested land to agriculture. Whereas deforestation occurs throughout the continent, particularly affected are the moist forests of Western Africa and the highland forests of the Horn of Africa (FAO, 2007).
Lemenih (2004) reported that in Ethiopia, deforestation and subsequent cultivation of the tropical dry Afromontane forest soils also endangered the native forest biodiversity, not only through the outright loss of habitat, but also by deteriorating the soil seed banks. The results showed that the contribution of woody species to the soil seed bank declined from 5.7 % after 7 years to nil after 53 years of continuous cultivation. However, soil quality and native flora degradation are reversible through reforestation and reforestation of abandoned farm fields with fast-growing tree species was shown to restore soil quality. Tree plantations established on degraded sites also fostered the recolonization of diverse native forest flora under their canopies. An important result from studying the effects of reforestation is that good silviculture, particularly selection of appropriate tree species, can significantly affect the rate and magnitude of both soil quality and biodiversity restoration processes.
In many African cultures, harvesting of soil fauna groups such as the termite alates and queens, chafer grubs for food, and the use of earthworms as bait by fishermen can also be a threat to soil biodiversity (Ayuke, unpublished), and may in the long run contribute to substantial loss of many species of soil fauna.
Status of the World’s Soil Resources Report, Regional Assessments of Soil Changes | Chapters 9 - 16
19

Harsh climatic conditions and/or climate change may also contribute to changes in soil biodiversity in SSA. Contrary to our hypothesis, more than average numbers of earthworm and termite taxa were found under relatively warmer, drier conditions (Ayuke et al 2011). This is contrary to the observation that earthworm and termite diversity increases with increases in rainfall or soil moisture, as generally found in temperate climates (Bohlen et al., 1995; Curry, 2004). However, seasonality of rainfall in the tropical regions means rainfall amounts per season may be more important than the annual total. We attributed lower taxonomic richness among the sites in Eastern Africa to less favourable conditions arising from high rainfall and low temperatures at higher altitudes (Ayuke et al., 2011).
Intense management practices that include application of pesticides and frequent cultivation, affect soil organisms, often altering community composition of soil fauna. Soil biological and physical properties (e.g., temperature, pH, and water-holding characteristics) and microhabitat are altered when natural habitat is converted for agricultural production (Crossley et al., 1992). Changes in these soil properties may be reflected in the distribution and diversity of soil meso-fauna. Organisms adapted to high levels of physical disturbance become dominant within agricultural communities, thereby reducing richness and diversity of soil fauna (Paoletti et al., 1993).
The extent of soil sterilization and loss of soil biodiversity in SSA has yet to be quantified on a large-scale across regions, but unsustainable soil management practices deplete soil organic matter, promote soil degradation and may cause soil fauna and flora imbalances. Land degradation will persevere as long as land users ignore an agro-biological approach to manage soil (Van der Merwe et al., 2002).
9.3.5 Soil Contamination (Pollution)
Chemicals (fertilizers and pesticides) have had negative effects on the environment in most SSA countries. Soil pollution through agrochemical use (including fertilizers and pesticides) in SSA has been of less concern compared to other continents; mainly most farmers cannot afford to apply high levels of such chemicals. However, with the increasing push towards higher fertilizer use to increase production, with parallel pesticide and herbicide use, efforts will be needed to reduce the associated negative impacts on soil quality (IAASTD, 2009).
In a United Nations Environment Programme (UNEP, 2007) report on environmental assessment in Ogoni land, southeastern Nigeria, r drinking water, air and agricultural soil in 10 communities contained over 900 times the permissible levels of hydrocarbon and heavy metals resulting from crude oil spills. The report acknowledged that recovery after extensive compliance with recommendations may take 30 years. A cursory look at published research work shows that heavy metal pollution is a continental trend in SSA. Heavy metal (Pb, Cd, Hg, Cu, Co, Zn, Cr, Ni, As) pollution of soils have been reported in Nigeria, Kenya, Ghana and Angola (Fakayode and Onianwa, 2002, UNEP, 2007, Odai et al, 2008).
Experience from South Africa indicates that, on a national basis, the areas of Urban, Forestry and Mining have all increased over the 10-year period, whereas cultivation areas have decreased. Urban has increased from 0.8 percent to 2 percent, Forestry from 1.2 percent to 1.6 percent, and Mining from 0.1 percent to 0.2 percent, while Cultivated has decreased from 12.4 percent to 11.9 percent.
The increase in urban and mining areas are the biggest concern in terms of soil conservation and future use since urban development involves soil sealing which irreversibly removes soils from
Status of the World’s Soil Resources Report, Regional Assessments of Soil Changes | Chapters 9 - 16
20

other land uses, while mining results in serious chemical and physical soil degradation which can only be restored to limited levels.
9.3.6 Soil acidification
The extremely acid soils, which are mainly the acid sulphate soils (both potential and actual) occupy a small area around the Niger delta and occur sporadically along the coastal plains of West Africa. Other acid soils occupy about 15 percent of the continent and are mainly found in the moist parts of the semi-arid zones and the sub-humid areas. Many of the Acrisols (Ultisols) and some Lixisols (Alfisols) have acid surface and subsurface horizons which, coupled to the moisture stress conditions, makes these soils extremely difficult to manage under low-input conditions. In West Africa, the annual additions of dust from the Sahara brought by the Harmattan winds raise the pH of the surface horizons and so the problem is less acute but subsoil acidity remains (Eswaran et al., 1996). Another region of acid soils occurs south of the tropic of Capricorn and includes parts of South Africa (Beukes et al., 2008) where it poses a serious soil chemical problem as one of the greatest production-limiting factors.
9.3.7 Salinization and Sodification
Salinization is defined as a change in the salinity status of the soil. This can be caused by improper management of irrigation schemes mainly in the arid and semi-arid regions covering small areas. Irrigation induced soil acidity is especially aggravated when applied to soils unsuitable for irrigation (De Villiers et al., 2003). Salinization can also be caused if sea water or fossil groundwater intrudes into coastal regions or in closed basins with aquifers of different salt content when there is excessive use of groundwater. Salinization also takes place where human activities lead to an increased evapotranspiration from soils on salt containing parent material or with saline ground water (Oldeman, 2002).
In the arid and semi-arid parts of Africa, soil salinity and alkalinity is a major problem affecting about 24 percent of the continent. Soils with pH>8.5 are also designated as alkaline (Eswaran et al., 1996). Soil salinity and sodicity problems are common in arid and semi-arid regions where rainfall is insufficient to leach salts and excess sodium ions out of the rhizosphere. More than 80 Mha of such soils are found in Africa (Mohsin et al., 2011).
Increasing temperatures may result in high evaporative demands that may activate the capillary rise of salts, leading to soil salinization. The results of a study in Sudan showed a significant increase in salinity in the Dongla area in the north where the annual rainfall is the lowest compared to the areas of Khartoum and Gezira in the south,. Fluctuation and erratic distribution of rainfall, together with an increase in temperature, have an impact on the fertility of soils in the study area which leads to a reduction in crop productivity and decrease in biodiversity. These factors lead to more degradation of natural resources and displacement of rural people to urban areas (Elhagwa et al., 2011).
9.3.8 Waterlogging
Human intervention in natural drainage systems may lead to waterlogging or flooding by river water. Most waterlogging threats are due to effects of human-induced hydromorphy. Causes include a rising water table (for example, due to construction of reservoirs or irrigation) or increased flooding caused by higher peak flows of rivers. Flooding in paddy fields is a deliberate technology for providing the proper environment for paddy rice, hence it is not considered a threat to ecosystem
Status of the World’s Soil Resources Report, Regional Assessments of Soil Changes | Chapters 9 - 16
21

services. It is estimated (Oldeman et al., 1991) that waterlogging constitutes 1.5percent of the non-erosion soil degradation threats in Africa.
9.3.9 Compaction, Crusting and Sealing
The population of the Sub-Saharan Africa is approximately 12% of the world population (830 millions) and it has been grown at a rate of 2.6%/year, during the last decade. In this region there is a tendence towards the concentration of growing populations in moderately large cities. Several Sub-Saharan countries have recently experienced accelerated urban expansion, recording since early 1970s among the highest urban growth rate in the world (up to 5% per year – Todaro, 2000). There are numerous examples of single-city dominance in the region. For instance, in Mozambique, Maputo accounts for 83 per cent of the country’s urban population, while the figures for Dakar, Lome, Kampala and Harare are 65, 60, 52 and 50 per cent respectively (World Bank 2002). Nigeria and South Africa represents exceptions, having several large and well distributed urban centres. South Africa and Nigeria are also the countries recording the highest amount of ISA and among the highest Urbanization Index (the ratio between the total area of the country and the urbanized area) (Figure 9.2).
Figure 9.2: Urban Areas extension and Urbanization Indexes for the Sub-Saharan African countries
9.4 The most important soil threats in Sub-Saharan Africa Of the threats (factors of degradation) to soils and related ecosystem functions in SSA listed
in section 9.3, the most critical are soil erosion, loss of soil organic matter and soil nutrient depletion (UNEP, 2013). Within the context of this report, the next threat of high importance is considered the loss of soil biodiversity. These four threats, which are interrelated, are discussed in greater detail in this section.
9.4.1 Erosion by Water and Wind Status of the World’s Soil Resources Report, Regional Assessments of Soil Changes | Chapters 9 - 16
22

Soil erosion can be a natural process but is also often caused or accelerated by human activities that involve inappropriate land use. In order to understand the threat of erosion, it is equally important to understand the causes responsible for the high levels of erosion.
Direct Causes of Soil Erosion
Expansion of land for agriculture: A main issue in the region has been the need to produce
increasing quantities of food in an economic and institutional context that did not allow the achievement of production increases through improved yields rather than by increasing production areas. This has led to: (i) the rapid expansion of agricultural land (over 65 percent in the last three decades PDF-B, 2007); (ii) the shortening of the fallow periods in traditional, extensive land use systems, which reduced the rehabilitation of soil fertility through natural processes; (iii) the increased use of fire as a clearing tool which has further led to the loss of nutrients in many systems. It is important to note that fertilizer consumption did not increase to compensate for the loss of soil nutrients resulting from the intensification of land use. Hence, there has been widespread mining of soil nutrients and soil organic matter. As a consequence of the type of soils that occur in the region and the general bad land management, many of SSA croplands are now characterized by low soil organic matter contents and soils that have a low pH and suffer from aluminium toxicity. On degraded soils with low organic matter, inorganic fertilizers are also easily leached, and this process has devastating long-term effects for agricultural productivity. Alternative means of maintaining soil fertility, such as crop rotation with biological nitrogen fixing (BNF) species, application of green manure, agroforestry, composting, rock phosphates, etc., proved to be highly effective at the local scale, but have not been sufficiently spread to have an impact at a national let alone continental scale.
Overgrazing: In rangelands, there has been much debate on the impacts of high grazing pressures on vegetation composition. The current understanding is that continued high grazing pressure may affect rangeland productivity, particularly in the long-term. Vegetation studies also show that high grazing pressures lead to changes in species composition, which may reduce the resilience of rangelands for droughts (Hein and De Ridder, 2006). In other words, during a drought, degraded rangelands show a much stronger decline in productivity than non-degraded rangelands. Recent years have seen droughts with severe impacts on livestock and local livelihoods in parts of Niger and in the East African drylands (Uganda and Kenya).
Deforestation: Most forests and woodlands of SSA suffer from rapid deforestation. Deforestation is driven by a number of processes, in particular: (i) the continued demand for agricultural land; (ii) local use of wood for fuel, charcoal production and construction purposes; (iii) large-scale timber logging, often without effective institutional control of harvest rates and logging methods; (iv) population movements and resettlement schemes in forested areas. For instance, the amount of cropped land in SSA has increased by about 40 million ha in thirty years (1975-2005), most of it at the expense of forests and woodlands (PDF-B, 2007). Due to the limited amount of arable lands available and the current insufficient production rates, continued expansion would be at the expense of other uses, such as rangeland and forest land. In addition, poaching is an important threat to biodiversity contained in the forests (and rangelands), also inside national parks. Whereas hunting locally provides a valuable source of food, poaching inside protected areas and on protected species has contributed to the rapid decrease in numbers of a range of species, such as gorillas and rhinos.
Socio-economic causes of soil erosion Status of the World’s Soil Resources Report, Regional Assessments of Soil Changes | Chapters 9 - 16
23

Population Expansion: Behind these direct drivers of erosion is the impact of a continuously growing population (Figure 9.3). Currently, the SSA population is growing at 2.1 percent per year, and, in the next 15 years, SSA will have to accommodate at least 250 million (33 percent) additional people (UNDP, 2005). With the increase in population comes an increased demand for living space and food which will directly affect soil use in the region.
Figure 9.3: The fertility rate (the number of children a woman is expected to bear during her lifetime) for 1970 and 2005 (http://www.fooddeserts.org/).
Poverty: The general poverty and the low potential of the farming systems characteristic of SSA negate sustainable agricultural growth and poverty reduction. Poverty is extensive in the pastoral/agro-pastoral, highland perennial and forest based farming systems which constitute one-third of the total SSA production systems (FAO and World Bank, 2001). From Figure 9.4 it is clear that SSA has many countries where a large percentage of the population is living below the poverty line.
Status of the World’s Soil Resources Report, Regional Assessments of Soil Changes | Chapters 9 - 16
24

Figure 9.4: Percentage of population living below the poverty line (CIA World Factbook, 2012)
Climate Change: Climate change is predicted to affect SSA agro-ecosystems on a significant scale in the coming decades. The continent has a long history of rainfall fluctuations of varying lengths and intensities, with the worst droughts experienced during the 1910s, affecting East and West Africa alike. They were generally followed by increasing rainfall amounts, but negative trends were observed again from 1950 onwards, culminating in the droughts of the early 1970s and mid - 1980s. These will, no doubt have had great impact on the susceptibility to erosion.
Water erosion extent and distribution in the region: Water erosion constitutes 46 percent and wind erosion 38 percent of the land degradation
types in SSA (FAO, 2005; Nachtergaele, 2006). The most recent continent-wide assessment shows that 494 million ha, or 22 percent of the agricultural land (including rangelands) in Africa, is affected by water erosion (Oldeman et al. 1991). The study confirms common field observations that overgrazing is the main cause of soil erosion, followed by inappropriate cultivation techniques on arable crop land. In this context it is important to note that the number of cattle in Africa almost doubled in the period 1961-1994, while the area of grazing lands hardly increased (FAO-Agrostat, 1999). The expected intensification of use on currently cultivated lands, expansion of cultivation into more marginal areas, reduction in grazing lands and increasing numbers of livestock set the stage for serious erosion problems in the future.
Important erosion areas in Africa can be found in South Africa, Sierra Leone, Guinea, Ghana, Liberia, Kenya, Nigeria, Zaire, Central African Republic, Ethiopia, Senegal, Mauritania, Niger, Sudan and Somalia. More than 20 percent of agricultural land and pastures in Africa has been irreversibly degraded mainly by soil erosion (UNSO/SEED/BDP, 1999).
Status of the World’s Soil Resources Report, Regional Assessments of Soil Changes | Chapters 9 - 16
25
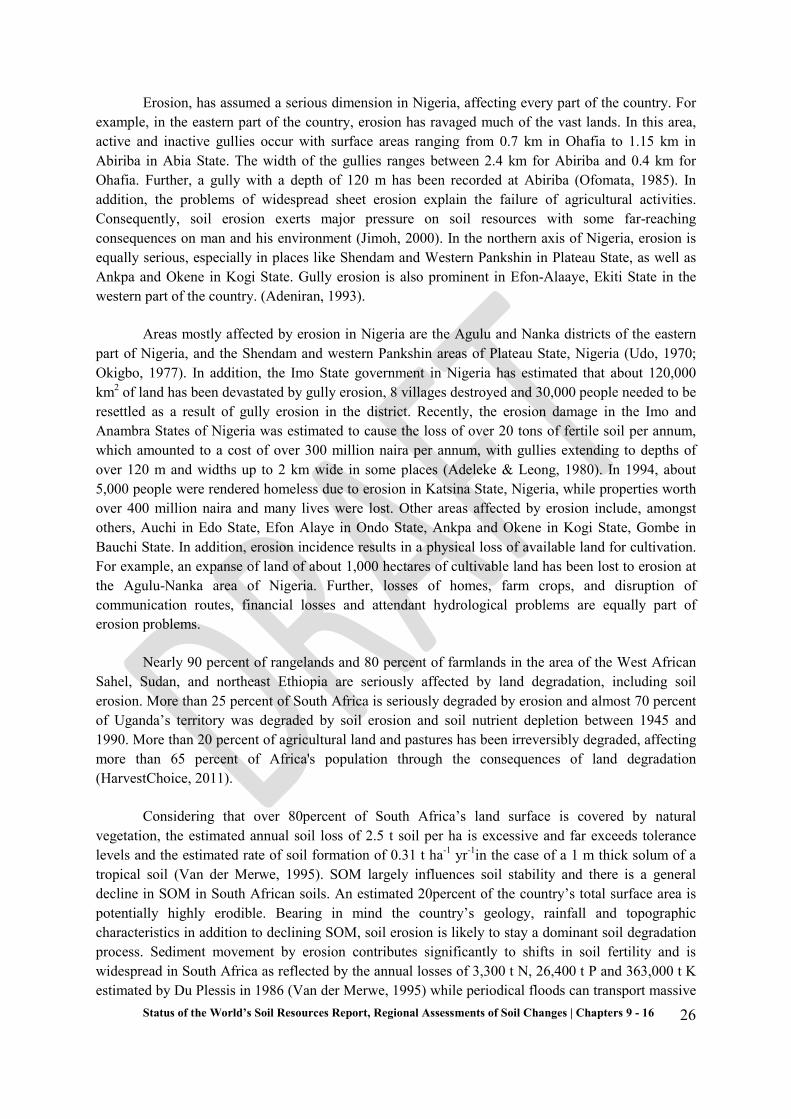
Erosion, has assumed a serious dimension in Nigeria, affecting every part of the country. For example, in the eastern part of the country, erosion has ravaged much of the vast lands. In this area, active and inactive gullies occur with surface areas ranging from 0.7 km in Ohafia to 1.15 km in Abiriba in Abia State. The width of the gullies ranges between 2.4 km for Abiriba and 0.4 km for Ohafia. Further, a gully with a depth of 120 m has been recorded at Abiriba (Ofomata, 1985). In addition, the problems of widespread sheet erosion explain the failure of agricultural activities. Consequently, soil erosion exerts major pressure on soil resources with some far-reaching consequences on man and his environment (Jimoh, 2000). In the northern axis of Nigeria, erosion is equally serious, especially in places like Shendam and Western Pankshin in Plateau State, as well as Ankpa and Okene in Kogi State. Gully erosion is also prominent in Efon-Alaaye, Ekiti State in the western part of the country. (Adeniran, 1993).
Areas mostly affected by erosion in Nigeria are the Agulu and Nanka districts of the eastern part of Nigeria, and the Shendam and western Pankshin areas of Plateau State, Nigeria (Udo, 1970; Okigbo, 1977). In addition, the Imo State government in Nigeria has estimated that about 120,000 km2 of land has been devastated by gully erosion, 8 villages destroyed and 30,000 people needed to be resettled as a result of gully erosion in the district. Recently, the erosion damage in the Imo and Anambra States of Nigeria was estimated to cause the loss of over 20 tons of fertile soil per annum, which amounted to a cost of over 300 million naira per annum, with gullies extending to depths of over 120 m and widths up to 2 km wide in some places (Adeleke & Leong, 1980). In 1994, about 5,000 people were rendered homeless due to erosion in Katsina State, Nigeria, while properties worth over 400 million naira and many lives were lost. Other areas affected by erosion include, amongst others, Auchi in Edo State, Efon Alaye in Ondo State, Ankpa and Okene in Kogi State, Gombe in Bauchi State. In addition, erosion incidence results in a physical loss of available land for cultivation. For example, an expanse of land of about 1,000 hectares of cultivable land has been lost to erosion at the Agulu-Nanka area of Nigeria. Further, losses of homes, farm crops, and disruption of communication routes, financial losses and attendant hydrological problems are equally part of erosion problems.
Nearly 90 percent of rangelands and 80 percent of farmlands in the area of the West African Sahel, Sudan, and northeast Ethiopia are seriously affected by land degradation, including soil erosion. More than 25 percent of South Africa is seriously degraded by erosion and almost 70 percent of Uganda’s territory was degraded by soil erosion and soil nutrient depletion between 1945 and 1990. More than 20 percent of agricultural land and pastures has been irreversibly degraded, affecting more than 65 percent of Africa's population through the consequences of land degradation (HarvestChoice, 2011).
Considering that over 80percent of South Africa’s land surface is covered by natural vegetation, the estimated annual soil loss of 2.5 t soil per ha is excessive and far exceeds tolerance levels and the estimated rate of soil formation of 0.31 t ha-1 yr-1in the case of a 1 m thick solum of a tropical soil (Van der Merwe, 1995). SOM largely influences soil stability and there is a general decline in SOM in South African soils. An estimated 20percent of the country’s total surface area is potentially highly erodible. Bearing in mind the country’s geology, rainfall and topographic characteristics in addition to declining SOM, soil erosion is likely to stay a dominant soil degradation process. Sediment movement by erosion contributes significantly to shifts in soil fertility and is widespread in South Africa as reflected by the annual losses of 3,300 t N, 26,400 t P and 363,000 t K estimated by Du Plessis in 1986 (Van der Merwe, 1995) while periodical floods can transport massive
Status of the World’s Soil Resources Report, Regional Assessments of Soil Changes | Chapters 9 - 16
26

amounts of sediment and nutrients within catchments. The Demoina flood in 1984, for instance, deposited as much as 34 million tons of sediment in the Mfolozi flats (Scotney & Dijkhuis, 1990) and using a siltation approach, it was estimated in 1985 that, according to the siltation load carried by the Tugela River, soil loss from the catchment area is as high as 4.4 t ha -1 yr-1 (De Villiers et al., 2002). It has been estimated that water erosion affects 6.1 million ha of cultivated soils in South Africa. Of this, 15 percent is seriously affected, 37 percent moderately and the rest slightly.
Wind Erosion in the region
Soil erosion by wind occurs mainly in the arid and semiarid regions. The occurrence of wind erosion at any place is a function of weather events interacting with soil and land management through its effects on soil structure, tilth and vegetation cover. At the southern fringe of the Sahara Desert, a special dry and hot wind, locally termed Harmattan, occurs. These North-easterly or Easterly winds normally blow in the winter (dry) season under a high atmospheric pressure system. When the wind force of Harmattan is beyond the threshold value, sand particles and dust particles will be blown away from the land surface and transported for several hundreds of kilometers to the Atlantic Ocean (WMO, 2005). Areas in SSA most susceptible to wind erosion are the southern fringe areas of the Sahara, Botswana, Namibia, Zimbabwe, Tanzania and South Africa (Favis-Mortlock, 2005). Wind erosion physically removes the lighter, less dense soil constituents such as organic matter, clays, and silts, thus removing the most fertile part of the soil and lowering soil productivity (Lyles, 1975).
It is estimated that 25 percent of South Africa is affected by wind erosion (Laker, 2005), amounting to an estimated 10.9 million ha. Of this area, 7 percent is seriously affected, 29 percent moderately and 64 percent slightly (Barnard et al., 2002). This is particularly obvious on drift sands in the coastal areas, as well as on cultivated land in the highveld areas. The seriousness of wind erosion can be deduced from the situation in the Eastern Cape Province where there are over 14,000 ha of drift sand (Barnard et al., 2002). Most of South Africa’s prime agricultural soils in the relatively arid western part of the country are wind-blown sand deposits (De Villiers et al., 2002).
Wind erosion may cause off-site effects, such as the covering of the terrain with wind-borne
soil particles from distant sources. For Africa, it is estimated that more than 100 million tonnes of dust per annum is blown westward over the Atlantic. The amount of dust arising from the Sahel zone has been reported to be around or above 270 million tonnes per year which corresponds to a loss of 30 mm per m2 per year or a layer of 20 mm soil particles over the entire area (WMO, 2005).
9.4.2 Loss of Soil Organic Matter
The decline in the level of soil organic matter is the root cause of most soil degradation, since all the physical, chemical and biological problems follow a drop in SOM content. Soil organic matter is a key component of any terrestrial ecosystem, and any variation in its abundance and composition has important effects on many of the processes that occur within the system. The magnitude of organic matter and soil carbon stock results from equilibrium between the inputs (mostly from biomass detritus) into and outputs from the system (mostly decomposition and volatilization). These are driven by various parameters of natural or human origins (Schlesinger and Palmer Winkler, 2000; Amundson, 2001). The decrease of organic matter in topsoils can have dramatic negative effects on water holding capacity of the soil, on structure stability and compactness, nutrient storage and supply
Status of the World’s Soil Resources Report, Regional Assessments of Soil Changes | Chapters 9 - 16
27

and on soil biological components such as mycorrhizas and nitrogen-fixing bacteria (Sombroek et al., 1993).
Direct Causes of SOM decline
Apart from climatic factors that influence carbon changes in the soil, inappropriate land uses and practices such as monoculture cereal production, intensive tillage, short to no fallow and the virtual absence of crop rotation systems contribute to SOM decline. The long-term effects of these management actions are now being experienced.
The carbon balance of terrestrial ecosystems can be changed markedly by the direct impact of human activities. Land use change is responsible for 20percent of the global anthropogenic CO2 emissions during the 1990s (IPCC, 2007) and is the main primary net C release source in Africa, much of it through burning of forests (Williams et al., 2007). The impact of land use change varies according to the land use types. The clearing of forests or woodlands and their conversion into farmland in the tropics reduces the soil carbon content mainly through reduced production of detritus, increased erosion rates and decomposition of soil organic matter by oxidation. Various reviews agree that the loss amounts to 20 to 50 percent of the original carbon in the topsoil, with deeper layers less affected, if at all (Sombroek et al., 1993; Murty et al., 2002; Guo and Gifford, 2002). Conversion of forests to pasture did not change soil carbon (Guo and Gifford, 2002) or may actually increase the soil organic matter content (Sombroek et al., 1993). Changes in soil carbon under shifting cultivation were half as large as the original amount before the land was cleared for use (Detwiler, 1986). Commercial logging and tree harvesting did not result in long-term decreases in soil organic matter (Knoepp and Swank, 1997; Houghton et al., 2001; Yanai et al., 2003). Changes in the amount of soil organic matter following conversion of natural forests to other land uses depend on several factors such as the type of forest ecosystem undergoing change (Rhoades et al., 2000), the post conversion land management, the climate (Pastor and Post, 1986) and the soil type and texture (Schjønning et al., 1999).
Socio-economic causes of SOM decline
In Sub-Saharan Africa, the increasing demand for food compels farmers to reduce the length of fallow periods, cultivate continuously, overgraze fields, or remove much of the above-ground biomass for fuel, animal fodder and building materials. Such practices can result in the reduction of SOM, water holding capacity, nutrients, as well as enhance soil erosion (Lal, 2004).
Extent of SOM decline in the region
SOM decline, like the negative nutrient balances, threatens soil productivity. The concentration of organic carbon in the top soil is reported to average 12 mg kg-1 for the humid zone, 7 mg kg-1 for the sub-humid zone and 4 mg kg-1 or less in the semi-arid zone (Windmeijer and Andriesse, 1993). The inherently low soil organic carbon is due to the low root growth of crops and natural vegetation, but also the rapid turnover rates of organic materials with high soil temperature in the presence of micro-fauna, particularly termites (Bationo et al. 2003). There is much evidence for rapid decline of soil organic C levels with continuous cultivation of crops in Africa (Bationo et al., 1995). For the sandy soils, average annual losses in soil organic C may be as high as 5 percent, whereas for sandy loam soils, reported losses seem much lower with an average of 2 percent (Pieri, 1989). Results from long-term soil fertility trials indicate that losses of up to 0.69 t carbon hectare-1
Status of the World’s Soil Resources Report, Regional Assessments of Soil Changes | Chapters 9 - 16
28

year-1 in the soil surface layers is common in Africa, even with high levels of organic inputs (Nandwa, 2003).
Responses to SOM decline
Appropriate land management could revert the trend of SOM decline and contribute to soil carbon sequestration. Increasing the SOM content could help reverse these problems and is crucial for future African agriculture and food production (Bationo et al., 2007; Sanchez, 2000). Several studies have shown that a synergetic effect exists between mineral fertilizers and organic amendments in Sub-Saharan Africa that leads to both higher yields and SOC content (Palm et al., 2001, Vagen et al., 2004; Bationo et al., 2007).
Barnard et al. (2002) noted that the importance of establishing and maintaining an effective and intimate association between soils and growing plants cannot be overemphasized. Biological measures for stabilizing slopes and decreasing the rate of runoff are essential. It is often necessary to undertake some form of land shaping prior to this, together with chemical amelioration and nutrient augmentation.
There is abundant evidence that soil organic matter plays a major role in stabilizing soil and in preventing its physical, chemical and biological deterioration. This has been demonstrated under South African conditions by several scientists as reported on by Barnard et al. (2002), including the work of Fölscher 1984) who pointed out that the dominant activity of micro-organisms played a vital role in the chemo-biological condition of soils. Under predominantly chemo-heterotrophic activity, physical and chemical stability could be expected, while under chemo-autotrophic activity, acidification and nutrient decline could be forecast. Much more attention therefore needs to be paid to the dynamic nature of soil and its physical, chemical and biological interactions.
Because nitrogen dynamics are so important in establishing a stable C:N ratio in soil, alternative sources of natural forms of nitrogen, such as the inclusion of suitable legumes, needs attention. Rhizobial and mycorrhizal associations need to be stimulated and soil organic carbon and nutrient levels need to be systematically monitored and evaluated. Other soil quality indicators relating to specific situations need to be developed and utilized, with emphasis on earthworm population as indicator of soil quality. Reduced, minimum and no-till systems also need to be investigated and implemented where possible, as is taking place worldwide and increasingly in many parts of South Africa (Van der Merwe et al., 2000).
Land degradation leads to a release of carbon to the atmosphere through oxidation of soil organic matter. In the context of the present concern with increase in atmospheric CO2, it has been suggested that this process could be reversed: by improved agricultural practices and reclamation of degraded land, soil organic matter could be gradually built up again, a process known as carbon sequestration. Among the land use changes which could be promoted with this objective in mind are improved agricultural practices, the introduction of agroforestry, and reclamation of degraded land. By such means, the carbon stored in soils could be substantially increased by amounts of the order of 30-50 t ha-1. Thus land use changes which are beneficial to local communities would, in addition, fulfil a global environmental objective.
9.4.3 Soil Nutrient Depletion Nearly 3.3 percent of agricultural gross domestic product (GDP) in Sub-Saharan
Africa is lost annually due to soil and nutrient losses (HarvestChoice, 2011). In Africa, harvesting grains and crop residues from the land impact heavily on soil carbon content, while the
Status of the World’s Soil Resources Report, Regional Assessments of Soil Changes | Chapters 9 - 16
29

insufficient replacement of soil nutrients with fertilizers contributes to negative nutrient balances (Gray, 2005). Soil fertility decline has been described as the single most important constraint on food production and security in SSA. Soil fertility decline (also described as soil productivity decline) is a deterioration of chemical, physical and biological soil properties. The main contributing processes to nutrient depletion, besides soil erosion, are:
• Decline in organic matter and soil biological activity. • Degradation of soil structure and loss of other soil physical qualities. • Reduction in availability of major nutrients (N, P, K) and micro-nutrients. • Increase in toxicity, due to acidification or pollution. For a first assessment of the state of nutrient depletion in 1990, nutrient balances were
calculated for the arable lands of 38 countries in SSA, with four classes of nutrient-loss rates established (Table 9.2). The average nutrient loss was estimated to be 24 kg nutrients/ha per year (10 kg N; 4 kg P2O5, 10 kg K2O) in 1990 and 48 kg nutrients/ha per year in 2000, i.e. a loss equivalent to 100 kg fertilizers/ha per year. Countries with the highest depletion rates, such as Kenya and Ethiopia (Table 9.3), also have severe soil erosion.
SSA (kg/ha per year Table 9.2. Classes of nutrient loss rate (kg/ha/yr.) Source: Stoorvogel and Smaling (1990)
Direct causes of nutrient decline
Fertility decline is caused by a negative balance between output (harvesting, burning, leaching, and so on) and input of nutrients and organic matter (manure/fertilizers, returned crop residues, mineral deposition through flooding). The estimate of nutrient depletion in SSA is widely quoted. Some scientists, however, have expressed concern about the approach used, as it is based on approximation and aggregation at country level which could be misleading, masking the “bright” spots and the “hot” spots where urgent nutrient replenishment is required. Assessment of fertility decline at micro-watershed or community level would be more appropriate, but would be costly and time consuming.
Socio-economic causes of nutrient decline
Class Low Moderate High Very High
N <10 10-40 21-40 >40
P2O5 <4 4-7 8-15 >15
K2O <10 10-40 21-40 >40
Status of the World’s Soil Resources Report, Regional Assessments of Soil Changes | Chapters 9 - 16
30

There are various factors that indirectly influence nutrient depletion in SSA and they vary between ecological regions and between countries within a given ecological region. The cash requirement to buy mineral fertilizer can exceed the total annual cash income for many SSA smallholders (World Bank, 1998). Farm-level fertilizer prices in Africa are among the highest in the world (Bationo et al. 2012). The cost of 1 metric ton of urea, for example, costs about US$90 in Europe, US$500 in Western Kenya and US$700 in Malawi. These high prices can be attributed to the removal of subsidies, high transaction costs, poor infrastructure, and poor market development, inadequate access to foreign exchange and credit facilities, transportation costs and lack of training to promote and utilize fertilizers. For example, it costs about $15, $30 and $100 to move 1 t fertilizer 1,000 km in the USA, India and SSA respectively (Bationo et al. 2012).
Many farmers do not follow recommended fertilizer application rates because of cash or labour constraints. In much of Southern and Western Africa there is a dry season lasting 7 to 8 months. In the first weeks of the rainy season many farm operations such as planting, weeding, and fertilizing must take place in rapid succession. Farmers who weed maize twice at critical periods can achieve a higher yield with half the amount of fertilizer used by farmers who only weed once (Kabambe and Kumwenda, 1995), but many farmers do not have sufficient labour to weed more often.
Output price instability is an important factor posing risks for fertilizer users in Western
Africa (Byerlee et al., 1994). When markets are sparse, as they are in many rural areas dominated by subsistence production, the variations in market prices of crops tend to be wider than in regions where markets are more fully developed.
Extent of nutrient decline in the region The results of an FAO study (1983-2000) showed N, P and K balances by land use system
and by country, revealing a generally downward trend in soil fertility in Africa. Densely populated and hilly countries in the Rift Valley area (Kenya, Ethiopia, Rwanda and Malawi) had the most negative values, owing to high ratios of ‘cultivated land’ to ‘total arable land’, relatively high crop yields and erosion. For SSA as a whole, the nutrient balances were: -22 kg/ha in 1983 and -26 kg/ha in 2000 for N; -2.5 kg/ha in 1983 and -3.0 in 2000 for P; and -15 kg/ha in 1983 and -19 kg/ha in 2000 for K. Table 8.1.3 lists nutrient balances for several SSA countries. The prediction for 2000 was for a more negative nutrient balance for almost all countries. This was influenced by the optimistic FAO estimates for crop production in 2000 and the expected decrease in fallow areas in 2000. All African countries, except Mauritius, Reunion, and Libya, show negative nutrient balances every year. In the semiarid, arid, and Sudano-Sahelian areas that are more densely populated, soils lose 60-100 kilograms of nitrogen, phosphorus, and potassium (NPK) per hectare each year. The soils of these areas are shallow, highly weathered, and subject to intensive cultivation with low level use of fertilizer.
Short growing seasons contribute to additional pressure on the land. In other important
agricultural areas, such as those located in the sub-humid and humid regions and in the savannas and forest areas, nutrient losses vary greatly. Rates of nutrient depletion range from moderate (30 - 60 kilograms of NPK per hectare per year) in the humid forests and wetlands in southern Central Africa, to high (> 60 kilograms NPK per hectare per year) in the East African highlands. In 1993-95 the difference between nutrient inputs and nutrient losses in the continent ranged from -14 kilograms of
Status of the World’s Soil Resources Report, Regional Assessments of Soil Changes | Chapters 9 - 16
31

NPK per hectare per year in South Africa to 136 kilograms in Rwanda. Burundi and Malawi also experienced rates of nutrient depletion above 100 kilograms of NPK per hectare per year.
More countries fall into the high depletion range than the medium range. Nutrient imbalances are highest where fertilizer use is particularly low and nutrient loss, mainly from soil erosion, is high. The low gains in nutrients, inherently low mineral stocks in these soils, and the harsh climate of the interior plains and plateaus aggravate the consequences of nutrient depletion. The estimated net annual losses of nutrients vary considerably by sub-region: 384,800 metric tons for North Africa, 110,900 metric tons for South Africa, and 7,629,900 metric tons for Sub-Saharan Africa as a whole. This represents a total loss of US$1.5 billion per year in terms of the cost of nutrients as fertilizers.
Table 9.3 Nutrient balance in some SSA countries (Stoorvogel and Smaling, 1990)
Country N P K
1982-84 2000 1982-84 2000 1982-84 2000
(kg/ha/year)
Benin -14 -16 -1 -2 -9 -11
Botswana 0 -2 1 0 0 -2
Cameroon -20 -21 -2 -2 -12 -13
Ethiopia -41 -47 -6 -7 -26 -32
Ghana -30 -35 -3 -4 -17 -20
Kenya -42 -46 -3 -1 -29 -36
Malawi -68 -67 -10 -10 -44 -48
Mali -8 -11 -1 -2 -7 -10
Nigeria -34 -37 -4 -4 -24 -31
Rwanda -54 -60 -9 -11 -47 -61
Senegal -12 -16 -2 -2 -10 -14
United Republic of Tanzania -27 -32 -4 -5 -18 -21
Zimbabwe -31 -27 -2 2 -22 -26
More nitrogen and potassium than phosphorus get depleted from African soils. Nitrogen and
potassium losses primarily arise from leaching and soil erosion. These soil problems result mainly from continuous cropping of cereals without rotation with legumes, inappropriate soil conservation practices, and inadequate amounts of fertilizer use. Guinea Bissau and Nigeria experience the highest annual losses of nitrogen and potassium in West Africa. Nitrogen loss in East Africa is highest in Burundi, Ethiopia, Malawi, Rwanda, and Uganda, and phosphorus loss is highest in Burundi, Malawi, and Rwanda (IFPRI, 1999).
Status of the World’s Soil Resources Report, Regional Assessments of Soil Changes | Chapters 9 - 16
32

Responses to nutrient decline The negative nutrient balances clearly indicate that not enough nutrients are being applied in
most areas (Bationo et al., 2012). The common annual use of nutrients in SSA averages about 10 kilograms of NPK per hectare. Fertilizer tends to be used mostly on cash and plantation crops because of the high profitability of fertilizer application in the production of export crops. Food crops get less fertilizer because of unfavourable crop/fertilizer price ratios and financial constraints faced by farmers. To maintain current average levels of crop production without depleting soil nutrients, Africa will require approximately 11.7 million metric tons of NPK each year, roughly three times more than it currently uses (3.6 million metric tons) (Henao and Baanante, 1999) Sub-Saharan Africa will need by far the largest proportion (76 percent) of this amount, since the current average level of fertilizer use is so low. Total nutrient requirements per hectare per year in this sub-region range from Botswana's 24.5 kg ha -1 NPK (a figure 350 percent above current usage) to Reunion's 437.3 kg ha-
1NPK (about 20 NPK per hectare less than the country consumes). Burkina Faso would have to increase its NPK consumption more than 11 times to maintain crop production levels without depleting nutrients and Swaziland would have to double its consumption. Estimated average use for SSA as a whole would have to increase about 4 times to meet nutrient needs at the current level of production. Generally, more nitrogen is required than potassium, and more potassium than phosphorus.
9.4.4 Loss of soil biodiversity
Biodiversity is the term used to describe the total variety of living organisms (plants, animals, fungi, and microbes) that exist on our planet. Biologists have found it convenient to consider biodiversity from three different angles: genetic diversity; species diversity and ecosystem diversity. Genetic diversity refers to the variety of genes (biochemical units of hereditary information) and is therefore a measure of variability, both within and between species. Species diversity is considered here as a measure of the total number of species in a given area. The world's species diversity is usually estimated at between 5 and 30 million species, though only about 1.4 million of these have actually been named by scientists. Ecosystem diversity relates to the variety of habitats (e.g. forests, wetlands, coral reefs, rivers, savannas, deserts, soils) within which species occur. Ecosystems are by definition composed of complex, interdependent groups of species (plus non-biological components) and they contribute to the maintenance of the natural cycles of water, oxygen, carbon, nitrogen, sulphur, and other elements, as well as to the flows of energy upon which all life depends (IUCN, 1990).
There is a clear and important connection between biodiversity and human well-being. Human dependence on climate, nutrient cycles and ecosystem stability is clearly very great, given that humans require food from species that are part of the earth's biodiversity and which are dependent on other species and ecosystems for stability.
Intense management practices that include application of pesticides and frequent cultivation affect soil organisms, often altering community composition of soil fauna. Soil biological and physical properties (e.g., temperature, pH, and water-holding characteristics), as well as microhabitats, are altered when natural habitats are converted for agricultural production (Crossley et al., 1992). Changes in these soil properties may be reflected in the distribution and diversity of soil meso-fauna. Organisms adapted to high levels of physical disturbance become dominant within agricultural communities, thereby reducing richness and diversity of soil fauna (Paoletti et al., 1993).
Status of the World’s Soil Resources Report, Regional Assessments of Soil Changes | Chapters 9 - 16
33

The extent of soil sterilization and loss of soil biodiversity has not been quantified to the authors’ knowledge but unsustainable soil management practices deplete SOM, promote soil degradation and cause soil fauna and flora imbalances. Using earthworm population as indicator of good soil quality, a bare minimum of intensively cultivated soils in South Africa are resilient. Land degradation will persevere as long as land users ignore an agro-biological approach to manage soil (Van der Merwe et al., 2002).
Soil biodiversity refers to all organisms living in the soil. Depending on the size class, organisms may be divided into macro-, meso- and microfauna. Beyond that, bacteria, fungi, protozoa and algae are grouped as microorganisms. Ecological functions and soil biodiversity are important because of their role in: soil structure formation, stability of structure and functions, fertility, buffering and in providing possibilities to have the soil acting as a carbon sink.
Soil organisms are major components of all soils. Often their biomass is low compared with the mineral or humus fraction, but the organism activity is absolutely crucial for a functioning soil. The soil biota can be regarded as the “biological engine of the earth” and is implicated in most of the key functions that the soil provides in terms of ecosystem services, by driving many fundamental nutrient cycling processes, soil structural dynamics, degradation of pollutants, and regulation of plant communities. Microbial driven soil processes play key roles in mediating global climate change by acting as C sources and sinks and by generating greenhouse gases such as nitrogen oxides and methane (Breure, 2004).
There is some experimental evidence that there may be threshold levels of soil biodiversity below which functions decline (e.g. Van der Heijden et al., 1998; Liiri et al., 2002; Seta¨la¨ and McLean, 2004). However, in many instances this is at experimentally prescribed levels of diversity that rarely prevail in nature. Many studies demonstrate high levels of functional redundancy in soil communities (e.g. Seta¨la¨ et al. (2005). It can be argued that high biodiversity within trophic groups is advantageous since the group is likely to function more efficiently under a variety of environmental circumstances, due to an inherently wider potential. More diverse systems may be more resilient to perturbation since, if a proportion of components are removed or compromised in some way, others that prevail will be able to compensate (Kibblewhite et al., 2008).
Human practices that threaten soil biodiversity
Soil management strongly influences soil biodiversity in agricultural ecosystems with different practices cause shifts in habitat quality and substrate availability, resulting in changes in abundance of individual species. The question is which management practices threaten the functioning of which soil ecosystems. Many processes carried out by soil organisms persist in native ecosystems, as well as in intensively cultivated soil. There is only a limited insight to what extent these changes in management intensities are accompanied by changes in the spectrum of soil microorganisms responsible for the processes involved. The most important factors affecting soil biodiversity are:
- Habitat fragmentation;
- Resource availability (amount and quality of nutrients and energy sources);
- Temporal heterogeneity (seasonal effects);
- Spatial heterogeneity (spatial differences in the soil);
- Climate variability;
Status of the World’s Soil Resources Report, Regional Assessments of Soil Changes | Chapters 9 - 16
34

- Interactions within the biotic community;
Reduction in diversity of soil macro fauna is one of the most profound ecological consequences of modern agriculture, for instance the number of earthworm species is largely decreased in agricultural soils. The biodiversity of appropriate soil organisms can lead to the control (natural biological suppression) of plant root diseases. The management practices used in many agro-ecosystems (e.g. monocultures, extensive use of tillage, chemical inputs) degrade the fragile web of community interactions between pests and their natural enemies and lead to increased incidence of pests and diseases. Decline in soil biodiversity is expected to affect soil turnover, decrease natural soil aggregation, increase crusting, reduce infiltration rates, and thus exacerbate soil erosion. The main driving forces that influence biodiversity in agricultural soils include intensification of land-use, influence of crops/plants, fertilizers and pH, tillage practices, crop residue retention, pesticides, herbicides and pollution (Breure, 2004).
Lemenih (2004) reported that in Ethiopia, deforestation and subsequent cultivation of the tropical dry Afromontane forest soils also endangered the native forest biodiversity, not only through the outright loss of habitat, but also by deteriorating the soil seed banks. The results showed that the contribution of woody species to the soil seed bank declined from 5.7 percent after 7 years to nil after 53 years of continuous cultivation. However, soil quality and native flora degradation are reversible through reforestation and reforestation of abandoned farm fields with fast-growing tree species was shown to restore soil quality. Tree plantations established on degraded sites also fostered the recolonization of diverse native forest flora under their canopies. An important result from studying the effects of reforestation is that good silviculture, particularly selection of appropriate tree species, can significantly affect the rate and magnitude of both soil quality and biodiversity restoration processes.
9.5 Case studies 9.5.1 SENEGAL
Introduction
The main objective of the national land resources assessment undertaken in Senegal between 2000 and 2010 was to identify, per land use system, the status and trends of land degradation and the major sustainable land management interventions present in the country. This assessment used national and local technical expertise including that of the land users themselves. The findings have been reported in several documents, maps and web-sites (CSE, 2010).
The methodology was based on the fact that land degradation is often largely driven by the way men use the environment in which they live. Therefore the level of degradation or sustainable use of a given land resource depends to a great extent on the needs and objectives of the land user, which are limited by his technical knowledge and his level of access to production factors (capital, labor etc…). This takes place within an integrated production system (Jouve, 1992). Consequently the mapping of the different production (or land use) systems is, together with the identification of areas with similar geographic characteristics, a necessary activity to define the units in which both the degradation and the management is to be described. In Senegal the « Framework for characterization and mapping of agricultural land use » (George and Petri, 2005) was followed to achieve this.
In Senegal the following major land use systems were identified and characterized: Status of the World’s Soil Resources Report, Regional Assessments of Soil Changes | Chapters 9 - 16
35
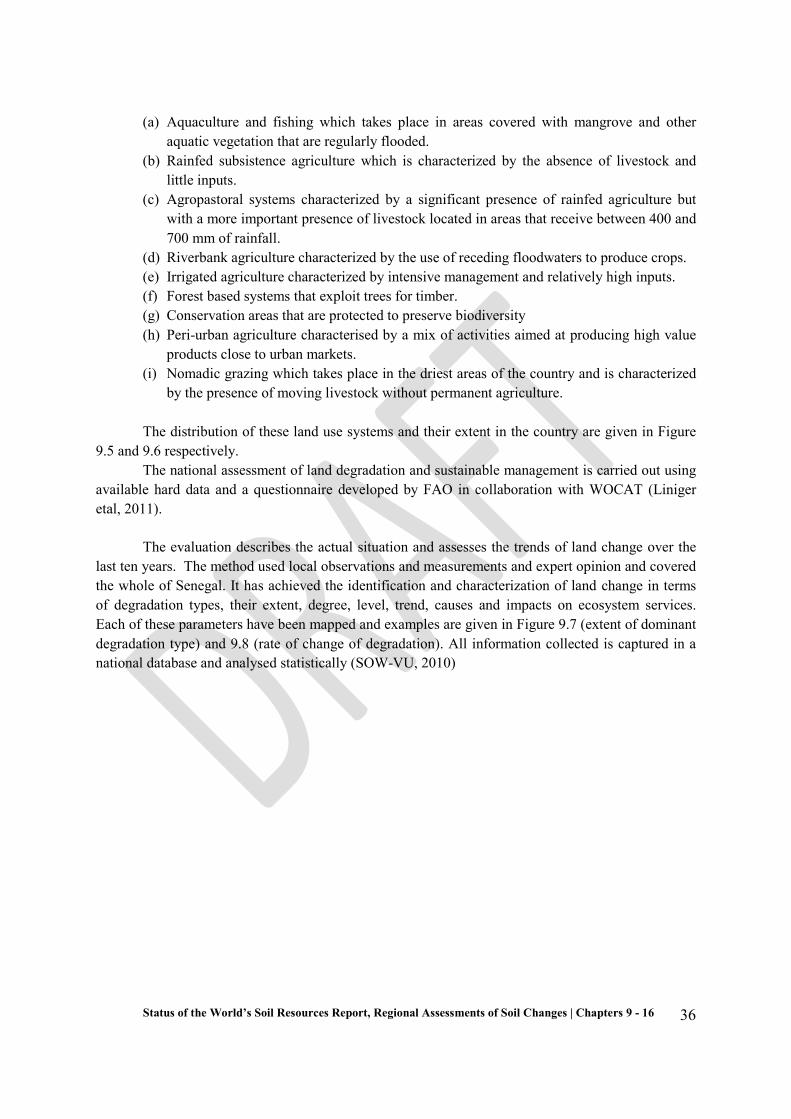
(a) Aquaculture and fishing which takes place in areas covered with mangrove and other
aquatic vegetation that are regularly flooded. (b) Rainfed subsistence agriculture which is characterized by the absence of livestock and
little inputs. (c) Agropastoral systems characterized by a significant presence of rainfed agriculture but
with a more important presence of livestock located in areas that receive between 400 and 700 mm of rainfall.
(d) Riverbank agriculture characterized by the use of receding floodwaters to produce crops. (e) Irrigated agriculture characterized by intensive management and relatively high inputs. (f) Forest based systems that exploit trees for timber. (g) Conservation areas that are protected to preserve biodiversity (h) Peri-urban agriculture characterised by a mix of activities aimed at producing high value
products close to urban markets. (i) Nomadic grazing which takes place in the driest areas of the country and is characterized
by the presence of moving livestock without permanent agriculture. The distribution of these land use systems and their extent in the country are given in Figure
9.5 and 9.6 respectively. The national assessment of land degradation and sustainable management is carried out using
available hard data and a questionnaire developed by FAO in collaboration with WOCAT (Liniger etal, 2011).
The evaluation describes the actual situation and assesses the trends of land change over the last ten years. The method used local observations and measurements and expert opinion and covered the whole of Senegal. It has achieved the identification and characterization of land change in terms of degradation types, their extent, degree, level, trend, causes and impacts on ecosystem services. Each of these parameters have been mapped and examples are given in Figure 9.7 (extent of dominant degradation type) and 9.8 (rate of change of degradation). All information collected is captured in a national database and analysed statistically (SOW-VU, 2010)
Status of the World’s Soil Resources Report, Regional Assessments of Soil Changes | Chapters 9 - 16
36

Figure 9.5: Major Land Use Systems in Senegal
Figure 9.6: Proportional extent of major land use systems in the Senegal.
Status of the World’s Soil Resources Report, Regional Assessments of Soil Changes | Chapters 9 - 16
37

Figure 9.7: Extent of dominant degradation type in Senegal.
Figure 9.8: Average rate of degradation in Senegal.
Some other examples of analysis, which show the strength of the system, are for instance:
(1) The analysis of the socio-economic drivers of land degradation in the country indicated that poverty and population pressure to be the main drivers, while governance and education are also significant. Land tenure and conflict situations are reported to be of minor importance as drivers of land degradation in Senegal.
(2) Population pressure and poverty lead in a majority of cases to deforestation and overgrazing, and together with lack of access to extension services lead to unsustainable soil and crop management. Urbanisation and Mining are minor pressures in the country.
(3) Impacts of land degradation on ecosystem goods and services was most important on the productive service (15percent of the area), while impacts on the ecological
Status of the World’s Soil Resources Report, Regional Assessments of Soil Changes | Chapters 9 - 16
38
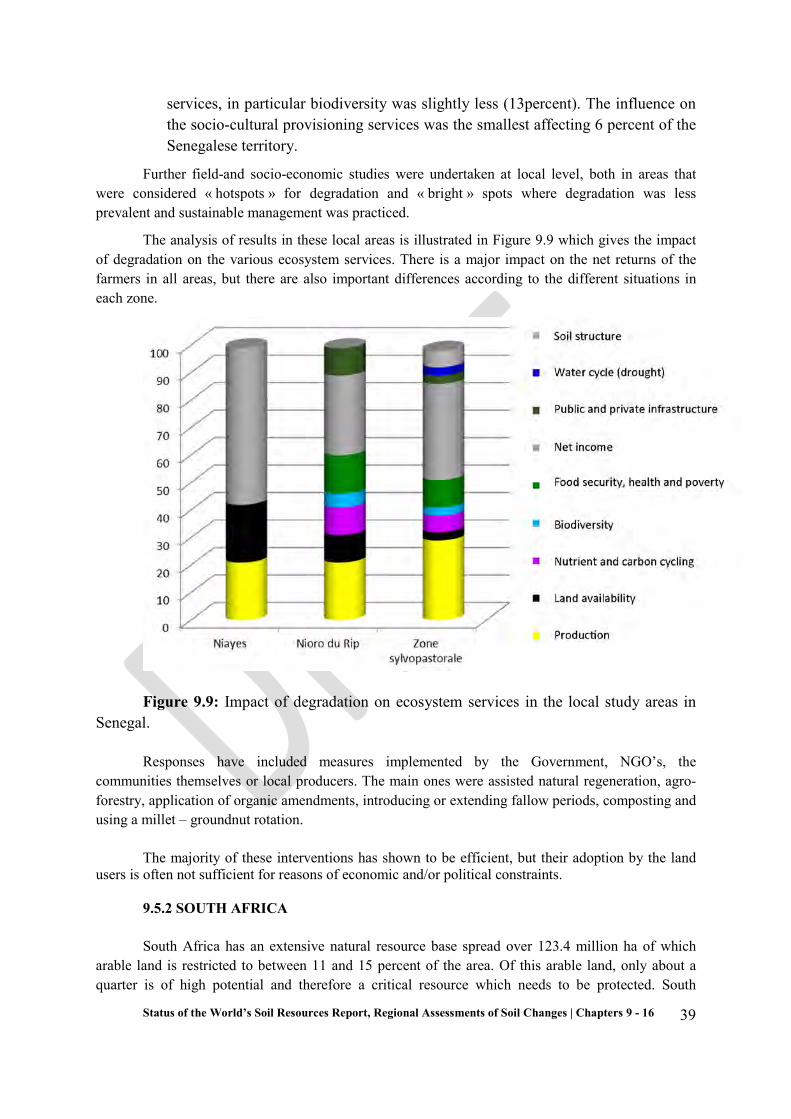
services, in particular biodiversity was slightly less (13percent). The influence on the socio-cultural provisioning services was the smallest affecting 6 percent of the Senegalese territory.
Further field-and socio-economic studies were undertaken at local level, both in areas that were considered « hotspots » for degradation and « bright » spots where degradation was less prevalent and sustainable management was practiced.
The analysis of results in these local areas is illustrated in Figure 9.9 which gives the impact of degradation on the various ecosystem services. There is a major impact on the net returns of the farmers in all areas, but there are also important differences according to the different situations in each zone.
Figure 9.9: Impact of degradation on ecosystem services in the local study areas in Senegal.
Responses have included measures implemented by the Government, NGO’s, the communities themselves or local producers. The main ones were assisted natural regeneration, agro-forestry, application of organic amendments, introducing or extending fallow periods, composting and using a millet – groundnut rotation.
The majority of these interventions has shown to be efficient, but their adoption by the land users is often not sufficient for reasons of economic and/or political constraints.
9.5.2 SOUTH AFRICA
South Africa has an extensive natural resource base spread over 123.4 million ha of which arable land is restricted to between 11 and 15 percent of the area. Of this arable land, only about a quarter is of high potential and therefore a critical resource which needs to be protected. South
Status of the World’s Soil Resources Report, Regional Assessments of Soil Changes | Chapters 9 - 16
39

Africa’s soils are diverse and complex as a result of varied soil formation and weathering processes. The largest proportion of soils (81 percent) are characterized by slightly weathered and calcareous soils, soil over 30 percent are sandy soils (< 10 percent clay) and almost 60 percent of soils have low organic matter content (Scotney et al., 1990). The most important limitations in the country are shallow depth, extremes of texture, rockiness, severe wetness and high erosion hazard. In terms of soil management, it is important to note that agriculture in South Africa has a dualistic nature, with a well-developed commercial sector on the one hand, and a predominantly subsistence or small-scale agricultural sector in communal areas on the other.
The first (and to date only) nationwide study of soil distribution was done by the Land Type Survey Staff (2003) from 1970 to 2003, aiming to delineate areas known as land types at 1:250,000 scale such that each land type displays a marked degree of uniformity in terms of terrain form soil pattern and climate. This includes an in-depth analysis of a number of soil profiles, termed modal profiles, selected to represent the range of soils encountered during the survey. Soils from 2,380 profiles across the country were described and analyzed for morphological and chemical data and classified according to the binomial classification system developed for South Africa (McVicar et al., 1977). Each land type includes a collection of soils and their relative distribution in terms of area per landscape position, as well as their characteristics in terms of physical and chemical properties. The resultant national map of broad soil patterns is shown in Figure 9.10.
Figure 9.10 Broad soil patterns of South Africa. Source: Land Type Survey Staff, 2003.
A number of subsequent national studies was conducted since 2006 to assess the status of soils, land use trends, land degradation and sustainable land management implementation in the country, a summary of which is provided in this section. There is much evidence of mismanagement of soil resources which has led to widespread erosion by both wind and water, loss of soil fertility, compaction and acidification.
Status of the World’s Soil Resources Report, Regional Assessments of Soil Changes | Chapters 9 - 16
40

National land degradation assessment
Since land use is considered the single most important driver of land (and soil) degradation, land degradation assessments were conducted based on land use categories. For this purpose, a national stratification map was developed for South Africa based on amendments to the Land Use System Approach as described by Nachtergaele and Petri (2008) as well as Pretorius (2009), deriving the following 18 land use classes:
• Desert • Azonal vegetation • Savanna • Forest • Grassland • Nama-Karoo • Indian Ocean Coastal Belt • Succulent Karoo • Fynbos • Albany Thicket • Open Water • Urban • Cultivated – commercial – rain-fed • Cultivated – irrigated • Cultivated – subsistence – rain-fed • Plantations • Mines • Protected areas
By integrating the Local Municipality (LM) boundaries with those of Land Use, a total of 2,447 unique units were derived for further assessment as illustrated in Figure 9.11. Land degradation and sustainable land management implementation was assessed in the 2,447 mapping units from 2008 to 2010 based on a participatory approach as part of a Land Degradation Assessment in Drylands (LADA) project. The approach relied strongly on the inputs from a range of experienced contributing specialists and land users who were conversant with the areas to be assessed. Data capturing was done through a series of 33 Participatory Expert Assessment (PEA) Workshops throughout the country, involving 728 contributing specialists (Wiese et al, 2011).
In terms of soil, the main forms of degradation at a national level were soil erosion by water, biological degradation and chemical soil degradation. In terms of soil erosion, sheet and gully erosion were considered the most serious threats, with river or stream bank erosion and off-site sedimentation considered less critical. Soil acidification and salinization were also highlighted, although their occurrence was more localized and area-specific.
Status of the World’s Soil Resources Report, Regional Assessments of Soil Changes | Chapters 9 - 16
41

Figure 9.11 The National stratification used for land degradation assessment in South Africa, incorporating local municipality boundaries with 18 land use classes. Source: Pretorius (2009).
Erosion assessment
A separate spatial study was conducted on the extent of gully erosion in South Africa (Le Roux et al., 2008), as well as the national erosion potential in terms of soils, climate and topography (Le Roux, 2012). The assessment of water erosion susceptibility indicated that around 20percent (26 million ha) of South Africa is classified as having a moderate to severe erosion risk (mainly based on sheet-rill erosion). The affected areas are concentrated in the south-eastern and north-eastern interior, mainly in the Eastern Cape, KwaZulu-Natal, Mpumalanga and Limpopo Provinces, where a combination of high (often intense) rainfall, duplex soils derived from sodium-rich parent materials and steep slopes occur (see Figure 9.12).
These natural conditions are often exacerbated by poor land use practices, such as incorrect cultivation methods, overgrazing by livestock and higher than desirable population density. Under such circumstances, potential soil loss can easily be in the “Very High” class of more than 50 t ha-1 yr-
1 (Le Roux et al., 2006).
Status of the World’s Soil Resources Report, Regional Assessments of Soil Changes | Chapters 9 - 16
42
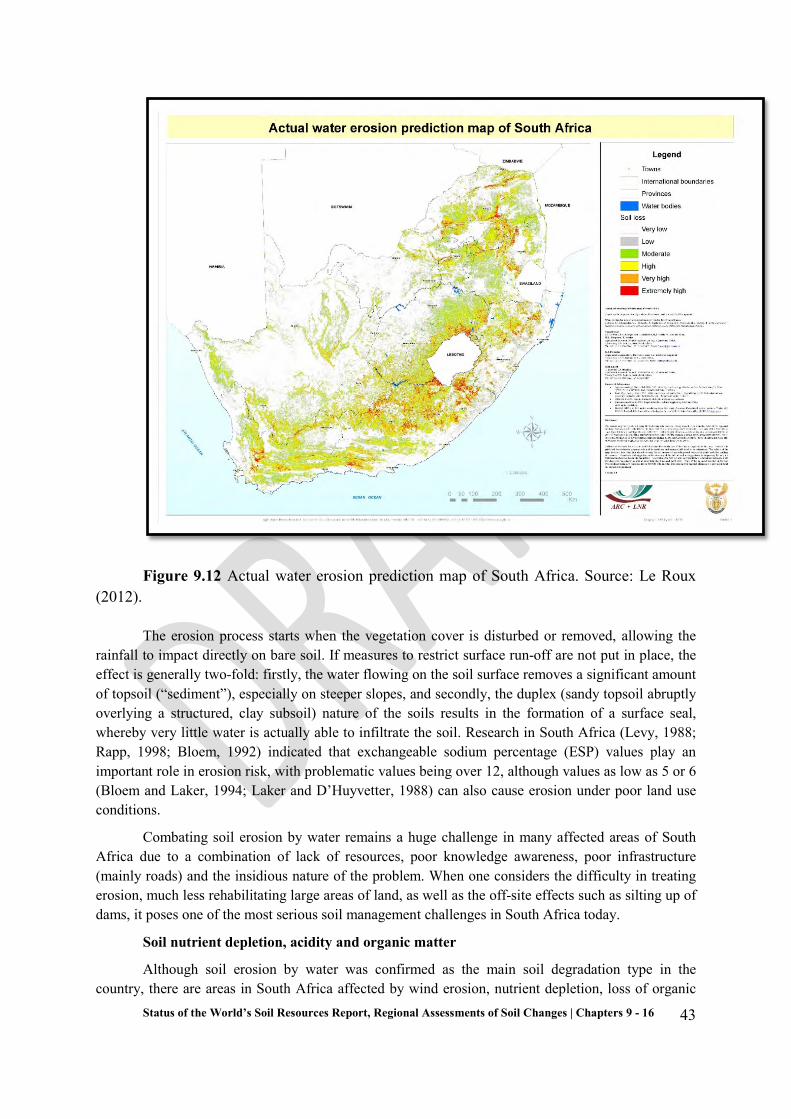
Figure 9.12 Actual water erosion prediction map of South Africa. Source: Le Roux (2012).
The erosion process starts when the vegetation cover is disturbed or removed, allowing the rainfall to impact directly on bare soil. If measures to restrict surface run-off are not put in place, the effect is generally two-fold: firstly, the water flowing on the soil surface removes a significant amount of topsoil (“sediment”), especially on steeper slopes, and secondly, the duplex (sandy topsoil abruptly overlying a structured, clay subsoil) nature of the soils results in the formation of a surface seal, whereby very little water is actually able to infiltrate the soil. Research in South Africa (Levy, 1988; Rapp, 1998; Bloem, 1992) indicated that exchangeable sodium percentage (ESP) values play an important role in erosion risk, with problematic values being over 12, although values as low as 5 or 6 (Bloem and Laker, 1994; Laker and D’Huyvetter, 1988) can also cause erosion under poor land use conditions.
Combating soil erosion by water remains a huge challenge in many affected areas of South Africa due to a combination of lack of resources, poor knowledge awareness, poor infrastructure (mainly roads) and the insidious nature of the problem. When one considers the difficulty in treating erosion, much less rehabilitating large areas of land, as well as the off-site effects such as silting up of dams, it poses one of the most serious soil management challenges in South Africa today.
Soil nutrient depletion, acidity and organic matter
Although soil erosion by water was confirmed as the main soil degradation type in the country, there are areas in South Africa affected by wind erosion, nutrient depletion, loss of organic
Status of the World’s Soil Resources Report, Regional Assessments of Soil Changes | Chapters 9 - 16
43

matter, soil acidity, salinity and sodicity as well as pollution from mining and industrial sources. Desktop assessments of soil nutrient depletion, acidity and organic matter in South Africa were conducted during 2007-2008 (Beukes et al., 2008a,b; Du Preez et al., 2010; Du Preez et al., 2011a,b; Rantoa et al., 2009).
Nutrient depletion and acidity
A multitude of soil nutrient and acidity studies have been conducted over time in South Africa (Bierman, 2001; Bloem, 2002; Buhman et al., 2006; Conradie, 2004; Eweg, 2004; Farina et al., 1993; Mandaringana et al, 2005; Manson, 2006; Meyer et al, 2008; Miles and Manson, 2000; Thibaud, 2005) included extensive reviews of international and national documentation, interviews with experts from various national and provincial institutions, as well as the processing of data available from a number of national databases and soil analytical laboratories. Detailed results are reported per province (nine provinces in South Africa), but only a national summary is presented here (Beukes et al., 2008a,b) with focus on the agricultural sector.
The impact of the dualistic nature of South African agriculture on soil nutrient depletion was clearly evident, with soils from the resource-poor/small-scale/upcoming farmers generally being acidified, severely P depleted, and N, K, Ca and Mg deficient (Manson, 1996; Beukes et al., 2008b). In addition, these farmers produce crops at two levels, the first being in home gardens where relatively high fertility levels are evident. This is mainly because these gardens are located next to the homesteads and are therefore easier to manage. The second level consists of crop fields which are larger and usually far from the homesteads, which makes them less secure in terms of livestock access, transport problems and the fact that most smallholder farmers are risk-averse due to their limited resources. These fields are therefore generally severely nutrient depleted, especially in terms of P and K deficiencies, while N, Mg and Ca deficiencies are also often noted.
Conversely, commercial agriculture operates on a much larger scale and higher levels of management and inputs are maintained on these farms to ensure higher productivity. This is especially important in the sugar, vine and fruit farming sectors due to higher costs for crop establishment and maintenance. Soils in the commercial sector generally exhibit P deficiency as the main nutrient concern, with K deficiency also occurring in many areas. This may be different under commercial pastures, for example in KwaZulu-Natal, where P deficiency is almost negligible and K, Ca and Mg appear well supplied (Beukes et al., 2008b).
Naturally occurring acid soils are generally associated with high rainfall areas and certain geological materials which, in South Africa, are located in the western and southern Cape coastal belts, KwaZulu-Natal, Mpumalanga and Limpopo Province (see Figure 9.13). The extent of anthropogenic soil acidity in the country is not easy to estimate, but general trends can be observed. In the winter rainfall region, approximately 560,000 ha is under cultivation, 60 percent of which soils indicate problems with acidity. In Kwa-Zulu-Natal, roughly 35 percent of the more than 660,000 ha cultivated soils have acid saturation values above 15 percent, while the summer rainfall area west of the Drakensberg, 37 percent of topsoils in the cropped area are acidified (Beukes, 1995).
Status of the World’s Soil Resources Report, Regional Assessments of Soil Changes | Chapters 9 - 16
44

Figure 9.13 Topsoil pH derived from undisturbed (natural) soils. Source: Beukes et al., 2008a.
Soil organic matter
Although data on soil organic carbon in South Africa is limited, fragmented and uncoordinated, general trends of SOC content can be derived from a range of studies conducted (Barnard et al., 2000; McKean, 1993, Du Toit and Du Preez, 1993, Le Roux, et al., 2005; Mills and Fey, 2004; Prinsloo et al., 1990; Van Antwerpen and Meyer, 1996; Birru, 2002; Du Preez et al., 2010; Du Preez et al., 2011a,b). A review of SOC research estimated that approximately 58 percent of South African soils contain < 0.5 percent organic C, 38 percent contain 0.5–2 percent organic C and 4 percent have > 2 percent organic C. These organic C contents vary greatly as a function of soil types, climate, vegetation, topography and soil texture, and are greatly influenced by management practices such as overgrazing, high levels of soil disturbance during cultivation and the use of fire in rangeland management which result in organic C losses. Soil organic matter losses were generally associated with dryland cropping, but was not always the case under irrigation. Increases in SOM is a slow process, but has been achieved by implementing zero/minimum tillage, mulching and reversion of cropland to perennial pastures, with these increases mainly occurring in the upper 300 mm of soil. In most instances, however, these changes were restricted to the upper 50 mm of soil.
Loss of SOM results in lower nitrogen and sulphur reserves, but not necessarily lower phosphorus reserves and also coincided with changes in the composition of amino sugars, amino acids and lignin. It further resulted in a decline of water stable aggregates which are essential in the prevention of soil erosion.
Status of the World’s Soil Resources Report, Regional Assessments of Soil Changes | Chapters 9 - 16
45

Rantoa et al. (2009) used data from the approximately 2,200 modal profiles from the land type survey to estimate organic carbon stocks in South African soils with reference to master horizons, diagnostic horizons, soil forms and land cover classes. In summary, the average organic carbon content in the master horizons ranges from 16 percent in the O horizon to 0.3 percent in the C horizons. In the diagnostic horizons, the highest average organic C in topsoils ranged from 21 percent in the O horizons to 1.4 percent in the orthic A horizons. In the diagnostic subsoil horizons, however, values ranged from 1.2 percent in podzol B to 0.2 percent in the dorbank horizons.
Land Cover Change Assessment
Land use trends give an indication of land conversion from one land use to another, which directly affects soil use properties as a function of management. A study of land-cover change was conducted in 2010 based on land-cover data from 1994/1995, 2000 and 2005 using a cost-effective approach using Earth Observation data. The study was based on changes in five land-cover classes of urban, mining, forestry, cultivation and other. These five classes are defined in Table 9.4 (Schoeman et al., 2010).
Table 9.4 Definitions of the five land-cover classes on which the land-cover change was based. Source: Schoeman et al. (2010).
Land-cover class Class definition
Urban Human settlements, both rural and urban
Mining Areas covered by mining and related mining activities (also includes mine dumps)
Forestry and plantations All forestry and plantations including woodlots and clear fell areas (excludes indigenous natural forests)
Cultivation All areas used for agricultural activities, including old
fields and subsistence agriculture
Other All other areas not covered by those listed above
The land-cover change results (Figure 9.14) indicated that at a national level, there was a total increase of 1.2 percent in transformed land, specifically associated with Urban, Cultivation, Plantation Forestry and Mining. This represents an increase from 14.5 percent transformed land in 1994 to 15.7 percent in 2005 across South Africa. On a national basis the areas of Urban, Forestry and Mining have all increased over the 10-year period, whereas cultivation areas have decreased. Urban has increased from 0.8 percent to 2 percent, Forestry from 1.2 percent to 1.6 percent, and Mining from 0.1 percent to 0.2 percent, while Cultivated has decreased from 12.4 percent to 11.9 percent. The spatial patterns do, however, vary geographically across provinces in South Africa.
The increase in urban and mining areas are the biggest concern in terms of soil conservation and future use since urban development involves soil sealing which irreversibly removes soils from other land uses, while mining results in serious chemical and physical soil degradation which can only
Status of the World’s Soil Resources Report, Regional Assessments of Soil Changes | Chapters 9 - 16
46
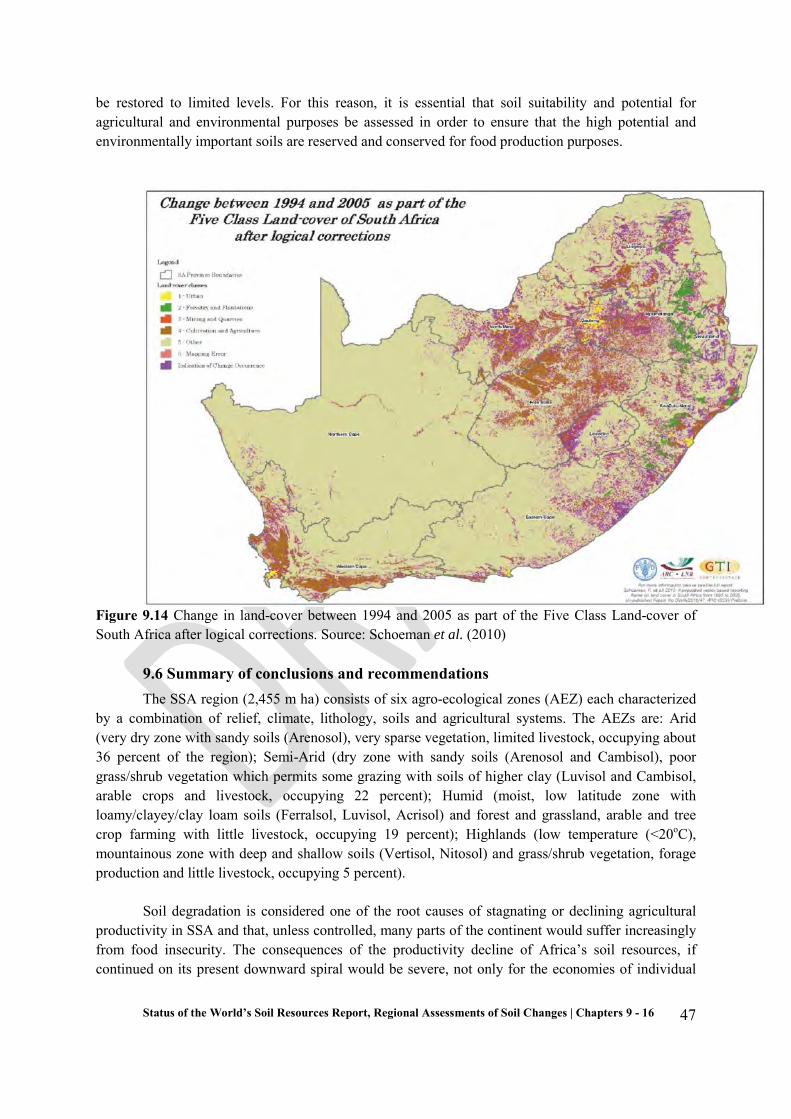
be restored to limited levels. For this reason, it is essential that soil suitability and potential for agricultural and environmental purposes be assessed in order to ensure that the high potential and environmentally important soils are reserved and conserved for food production purposes.
Figure 9.14 Change in land-cover between 1994 and 2005 as part of the Five Class Land-cover of South Africa after logical corrections. Source: Schoeman et al. (2010)
9.6 Summary of conclusions and recommendations The SSA region (2,455 m ha) consists of six agro-ecological zones (AEZ) each characterized
by a combination of relief, climate, lithology, soils and agricultural systems. The AEZs are: Arid (very dry zone with sandy soils (Arenosol), very sparse vegetation, limited livestock, occupying about 36 percent of the region); Semi-Arid (dry zone with sandy soils (Arenosol and Cambisol), poor grass/shrub vegetation which permits some grazing with soils of higher clay (Luvisol and Cambisol, arable crops and livestock, occupying 22 percent); Humid (moist, low latitude zone with loamy/clayey/clay loam soils (Ferralsol, Luvisol, Acrisol) and forest and grassland, arable and tree crop farming with little livestock, occupying 19 percent); Highlands (low temperature (<20oC), mountainous zone with deep and shallow soils (Vertisol, Nitosol) and grass/shrub vegetation, forage production and little livestock, occupying 5 percent).
Soil degradation is considered one of the root causes of stagnating or declining agricultural productivity in SSA and that, unless controlled, many parts of the continent would suffer increasingly from food insecurity. The consequences of the productivity decline of Africa’s soil resources, if continued on its present downward spiral would be severe, not only for the economies of individual
Status of the World’s Soil Resources Report, Regional Assessments of Soil Changes | Chapters 9 - 16
47

countries, but also for the welfare of the millions of rural households dependent on agriculture for meeting their livelihood needs.
There is no consensus on the extent and severity of soil degradation or its impacts in the component regions or in SSA as a whole, but it has been estimated that of the about 494 million ha of land in SSA affected by soil degradation, 46 percent is by water erosion, 38 percent by wind erosion, 12 percent by chemical degradation and 4 percent by physical degradation. In terms of causes of degradation, overgrazing accounted for half of all degradation, followed by agricultural activities, deforestation, and overexploitation. The four types of soil change that are considered as major threats are soil erosion, soil organic matter depletion, soil nutrient depletion and loss of soil biodiversity that are discussed in detail in the report. At national level detailed information is available about soil degradation as illustrated by the documented results in Senegal and South Africa.
Soil degradation constitutes great threats to ecosystem services, particularly sustainable food production and security in SSA. Soil degradation in SSA is caused by several factors including overgrazing, deforestation, inappropriate cultivation techniques, and expansion of cultivation to marginal lands, population increase, climate change and poverty. Soil degradation is increasing in the region, with over 20 percent of land in most of the SSA countries already being degraded, affecting over 65 percent of the population and resulting in significant adverse effects on food production and general human livelihoods. There is obviously an urgent need for pro-active interventions to arrest and reverse soil degradation. Agricultural lands are especially prone to erosion and nutrient depletion. Reported yield losses range from moderate (2 percent decline over several decades) to catastrophic levels (>50 percent), depending on crop, soil type, climate, and production systems, with most studies reporting significant losses. Direct economic losses due to declining yields and lost nutrients are large in terms of the relevant national economies.
Rehabilitation of degraded land and conservation of those not yet degraded is the most desirable step for every country in the region, but this can only be achieved if the characteristics of the soil resources are well defined and quantified and soil monitoring systems established in every country.
Status of the World’s Soil Resources Report, Regional Assessments of Soil Changes | Chapters 9 - 16
48

Table 9.5 Summary of Soil Threats Status, trends and uncertainties in Africa South of the Sahara.
REFERENCES:
Very poor
Poor Fair GoodVery good
In condition In trend
Soil erosion Erosion constitutes>80% of land degradation in SSA, affecting about 22% of agricultural land and all countries in the region. The majority of causes related to the exposure of the bare soil surface by cultivation, deforestation overgrazing and drought. Important erosion areas are South Africa, Ethiopia, Sierra Leone, Guinea, Ghana, Nigeria, Zaire, Morocco (water), Botswana, Namibia, and South Africa (wind).
↙ ● ●
Organic carbon change
The replacement of the natural vegetation reduces nearly always the soil carbon level. Further carbon release from the soil is caused by complete crop removal from farmlands, the high rate of organic matter decomposition by microbial decomposition accentuated by high soil temperature and termite activities in parts of SSA.
↙ ◒ ◒
Nutrient imbalance Nutrient imbalance, which is generally manifested by the deficiency of key essential nutrients is mainly due to the fact that fertilization has not been soil and crop specific, farmers are unable to pay the price for fertilizers and the inability to follow the rates that are recommended. Nearly all countries in the region show a negative nutrient balance.
↙ ● ◒
Loss of soil biodiversity
SSA suffers the world's highest annual deforestation rate. The areas most affected are the in the moist areas of West Africa and the highland forests of the Horn of Africa. Cultivation, introduction of new species, oil exploration and pollutions reduce the population of soil organisms thus reducing faunal and microbial activities.
↙ ○ ○
Soil acidification Over 25% of soils in Africa are acidic. Most of these occur in the moister parts of the Continent. In South Africa it poses as a serious chemical problem and the greatest production-limiting factor. ↙ ● ◒
Salinisation Salinisation is the build-up of salt in the soil due to irrigation from ground water high soluble salt and poor drainage. It can lead to a decrease in soil productivity.
Waterlogging Most waterlogging threats are due to rise in water table due to poor infiltration/drainage or occurrence of impervious layer in the subsoil. Waterlogging generally reduces crop productivity, but in paddy fields are deliberate and beneficial.
○ ○
Compaction The major cause of compaction is impact of pressure on the soil from heavy machinery.It is more serious in forested regions where land clearing (and even other cultivation activities) cannot be done without mechanization.
○ ○
Sealing and land take
These constitute problems mainly in peri-urban agriculture and dry season vegetable production valley sites. ○ ○
Soil pollution Soil contamination by chemicals (fertilizers, petroleum products, pesticides, herbicides, mining) has affected agricultural productivity and other ecosystem services negatively. Nigeria and South africa may be most affected.
↙ ○ ○
Symbol Definition Stable~ Variable↙ Deteriorating↗ Improving○ Evidence and consensus is low◒ Limited evidence or limited consensus● Adequate high-quality evidence and high level of consensus
Condition and Trend ConfidenceThreat to soil
functionSummary
Status of the World’s Soil Resources Report, Regional Assessments of Soil Changes | Chapters 9 - 16
49

Adeleke, B.O. & Leong, G.L. ,1980. Certificate Physical and Human Geography, Oxford University Press Ltd, 42-43.
Adeniran, J.R., 1993. “The Study of Flood Hazards in Nigeria”. An Unpublished Seminar Paper, Department of Geography, University of Ilorin.
Amundson, R. 2001.The carbon budget in soils, Annu. Rev. Earth Pl. Sc., 29, 535–56
Anthony D. Barnosky , Nicholas Matzke , Susumu Tomiya , Guinevere O. U. Wogan , Brian Swartz , Tiago B. Quental Charles Marshall , Jenny L. McGuire , Emily L. Lindsey , Kaitlin C. Maguire , Ben Mersey & Elizabeth A. Ferrer. 2011. Has the Earth’s sixth mass extinction already arrived? Macmillan Publishers Ltd.atpanit (Eds.), Responses to Land Degradation. Proc. 2nd. International Conference on Land Degradation and Desertification, Khon Kaen, Thailand. Oxford Press, New Delhi, India.
Barnard, R.O. 2000. Carbon sequestration in South African soils. ARC-ISCW Report No GW/A/2000/48. (ARC-Institute for Soil, Climate and Water: Pretoria).
Barnard, R.O., Van der Merwe, A.J., Nell, J.P., De Villiers, M.C., Van der Merwe, G.M.E. & Mulibana, N.E., 2002. Technical Country report/in-depth study on problem soils including degraded soils in South Africa: Extent, present use, management and rehabilitation (with emphasis on salt-affected soils). 4th Meeting of FAO Global Network Integrated Soil Management for Sustainable Use of Salt-Affected Soils. Valencia, Spain. May 2001.
Bationo A., Buerkert A., Sedogo M.P., Christianson B.C., Mokwunye A.U., 1995. A critical review of crop residue use as soil amendment in the West African Semi-arid tropics. In: Powell JM,Fernandez-Rivera S, Williams TO, Renard C (eds) Livestock and sustainable nutrient cycling in mixed farming systems of Sub-Saharan Africa, vol 2. International Livestock Centre for Africa (ILCA), Addis Ababa, pp 305–322. Technical papers. In: Proceedings of an International Conference, 22–26 Nov 1993, Addis Ababa
Bationo A., Mokwunye U., Vlek P.L.G, Koala S., Shapiro B.I., 2003. Soil fertility management for sustainable land use in the West African Sudano-Sahelian zone. In: Gichuru MP et al (eds) Soil Fertility Management in Africa: a regional perspective. Academy of Science Publishers (ASP)and Tropical Soil Biology and Fertility of CIAT, Nairobi
Bationo, A., Kihara, J., Vanlauwe, B., Waswa, B.,Kimetu, J., 2007. Soil organic carbon dynamics, functions and management in West African agroecosystems. Agricultural Systems 94, 13-25.
Bationo, Andre, Alfred Hartemink, Obed Lungu, Mustapha Naimi, Peter Okoth, Eric Smaling, Lamourdia Thiombiano, and Boaz Waswa 2012. Knowing the African Soils to Improve Fertilizer Recommendations.
Beukes, D.J. 1995. Benefits from Identifying and Correcting Soil Acidity in Agriculture. ARC-ISCW, Pretoria, ISBN: 1-86849-021-1, 12pp.
Beukes, D.J., Stronkhorst, L.D. and Jezile, G.G. 2008a. Development of a soil protection strategy and policy for South Africa: An overview of the soil acidity problem in South Africa. ARC-ISCW Report Nr. GW/A/2008/08.
Beukes, D.J., Stronkhorst, L.D. and Jezile, G.G. 2008b. Development of a soil protection strategy and policy for South Africa: An overview of the soil nutrient depletion in South Africa. ARC-ISCW Report Nr. GW/A/2007/162.
Status of the World’s Soil Resources Report, Regional Assessments of Soil Changes | Chapters 9 - 16
50

Bielders, C.L., K. Michels, and J-L. Rajot. 1985. On-Farm Evaluation of Ridging and Residue Management Practices to Reduce Wind Erosion in Niger. Soil Sci. Soc. Am. J. 54:1157–1161.
Bierman, C.R., 2001. Grondvrugbaarheid en bemesting in die Noordwes Provinsie met verwysing na volhoubare droelandgewasverbouing. MSc Thesis, University of the Free State, Bloemfontein. 36pp.
Birru, T.C. 2002. Organic matter restoration by conversion of cultivated land to perennial pasture on three agro-ecosystems in the Free State. M.Sc. dissertation. (University of the Free State: Bloemfontein).
Bloem, A.A. 1992. Criteria for the adaptation and design and management of centre-pivot irrigation systems to the infiltration potential of soils (in Afrikaans). M.Sc. dissertation, University of Pretoria.
Bloem, A.A. 2002. Databasis- en navorsingsresultate dui stikstoflewering van gronde aan. SA Graan/Grain, Julie 2002. p44.
Bloem, A.A. and Laker, M.C. 1994. Criteria for the adaptation and design and management of centre-pivot irrigation systems to the infiltrability of soils. Water SA. 20: 127-132.
Breure, Anton M. 2004.Soil biodiversity: Measurements, indicators, threats and soil functions. International Conference, Soil and Compost eco-biology.September 15th – 17th 2004, León – Spain
Buhmann, C., Beukes, D.J. and Turner, D.P. 2006. Plant nutrient status of soils of the Lusikisiki area, Eastern Cape Province. S Afr J Plant Soil 23 (2), 93-98.
Byerlee, D.A.,P. Anandajayasekeram, A. Diallo, G. Gelaw, P.W. Heisey, M. Lopez−Pereira, W. Mwangi, M. Smale, R. Tripp, and S. Waddington. 1994.''Maize Research in Sub−Saharan Africa: An Overview of Past Impacts and Future Prospects." CIMMYT Economics working Paper 9403. Mexico, D.F. International Maize and Wheat Improvement Center (CIMMYT). Mimeo.Change Biology 8, 345-360.
Charman P.E.V. and B.W. Murphy 2005. (eds), Soils - Their Properties and Management, Oxford University Press in association with NSW Department of Land and Water Conservation, Melbourne, Vic., 237-245.
Conradie, W.J., 1994. Vineyard Fertilization. Proceedings of a work session on vineyard fertilization, held at Nietvoorbij on 30 September 1994. ARC-Fruit, Vine and Wine Research Institute, Nietvoorbij, Stellenbosch. 41pp.
Crossley, D. A., Jr., Mueller, B. R., and Perdue, J. C., 1992. Biodiversity of Microarthropods in agricultural soils: relations to processes, Agric. Ecosyst. Environ., 40:37-46.
De Villiers, M.C., Pretorius, D.J., Barnard, R.O., Van Zyl, A.J. & Le Clus, C.F., 2002. Land degradation assessment in dryland areas:South Africa.. FAO Land Degradation Assessment in Dryland Project. Rome, Italy.
Detwiler, R.P., 1986: Land use change and global carbon cycle: The role of tropical soils. Biogeochemistry, 2, 67-93.
Dregne, H. & Chou, N.1992. Global desertification: dimensions and costs. In: H. Dregne, ed. Degradation and restoration of arid lands. Lubbock, Texas Tech. University.
Dregne, H. E. 1990. Erosion and soil productivity in Africa. Journal of Soil &Water Conservation, vol. 45, no. 4, 431–436.
Status of the World’s Soil Resources Report, Regional Assessments of Soil Changes | Chapters 9 - 16
51
Du Preez, C.C., Mnkeni, P.N.S. and Van Huyssteen, C.W. 2010. Knowledge review on land use and soil organic matter in South Africa. 2010 19th World Congress of Soil Science, Soil Solutions for a Changing World, 1 – 6 August 2010, Brisbane, Australia.
Du Preez, C.C., Mnkeni, P.N.S. and Van Huyssteen, C.W. 2011a. Knowledge review on land use and soil organic matter in South Africa 1. Spatial variability and rangeland stock production. S. Afr. J. Sci. 207: 27-34.
Du Preez, C.C., Mnkeni, P.N.S. and Van Huyssteen, C.W. 2011b. Knowledge review on land use and soil organic matter in South Africa 2: Arable crop production. S. Afr. J. Sci. 207: 35-42.
Du Toit, M.E., Du Preez, C.C. 1993. Relationship between organic matter content of certain virgin orthic topsoils, soil properties and climatic data in South Africa. South African Journal of Plant and Soil 10, 168-173.
Duffy, J.E., Gamfeldt, L., O’Connor, M.I., 2012. A global synthesis reveals biodiversity loss as a major driver of ecosystem change. Nature 486, 105-108.
Elhagwa Abdalla, Bushra Meheissi and Nimat El Basher, 2011. Indicators of impact of climate change on salinity distribution and land-use in Sudan Agricultural Research Corporation, Wad Medani. Sudan Proceedings of the Global Forum on Salinization and Climate Change (GFSCC2010) Valencia, 25–29 October 2010.
Eswaran H, Almaraz R, van den Berg E and Reich P 1996. An Assessment of the Soil Resources of Africa in Relation to Productivity. World Soil Resources, Soil Survey Division, USDA Natural Resources Conservation Service, Washington D.C. 20013.
Eswaran, H., P. Reich, and F. Beinroth. 1997. Global distribution of soils with acidity. In: Plant-Soil Interactions at Low pH. Moniz, A.C. et al. (eds.). Brazilian Soil Science Society. pp. 159-164
Eweg, M.J. 2004. Changing fertiliser practices in the small-scale sector of the South African sugar industry: The role of Extension. Proc S Afr Sug Technol Ass (2004) 78, 393-402.
FAO & World Bank. 2001. Farming Systems and Poverty. Improving Farmers’ livelihoods in a Changing World. Rome and Washington.
FAO, 2007. State of the World's Forests 2007. Food and Agriculture Organization of the United Nations, Rome.
FAO, 2010. Land Degradation Assessment for Dry Lands (LADA), FAO, Rome
FAO. 1993. The conservation and rehabilitation of African lands. FAO Rorne, ARCl9014: 38 pp.
FAO.1999. Integrated Soil Management for Sustainable Agriculture and Food Security in Southern and East Africa. Agritex.
FAO.2001. Soil Fertility Management in Support of Food Security in Sub-Saharan Africa.
FAO/IIASA, 2002. Global Agro-ecological Assessment for Agriculture in the 21st century: Methodology and Results. Fischer, G., Shah, M., van Velthuizen, H. and Nachtergaele, F. O. IIASA, Laxenburg and FAO, Rome.
Fakayode, S.O. and Onianwa, P.C. 2002. Heavy metal contamination of soil, and bioaccumulation in Guinea grass (Panicum maximum) around Ikeja Industrial, 11—Advances in Soil Science, ed. R. Lal and B. Stewart. New York: Springer- Verlag. 59, 499–510.
Status of the World’s Soil Resources Report, Regional Assessments of Soil Changes | Chapters 9 - 16
52

Farina, M.P.W., Manson, A.D. and Johnston, M.A. 1993. Maize in Natal. Fertilizer Guidelines. Natal Maize 6, 1-12.
Favis-Mortlock, Dave 2005. Erosion little and large. Soil Erosion Site www.soilerosion.net/doc/erosion_little_large.html
Folscher, W.J., 1984. Stikstofdinamika in grond. In: Proceedings of the nitrogen symposium. Soil and Irrigation Research Institute, Private BagX79, Pretoria.
GEF, 2006. (Global Environment Facility), Evaluation Office Monitoring and Evaluation Policy Evaluation Document, No. 1, 42pp.
Gray, K. M. 2005. Changing soil degradation trends in Senegal with carbon sequestration payments. A M. Sc. thesis Montana State University, 135 pp.
Guo, L.B., Gifford, R.M., 2002. Soil carbon stocks and land use change: a meta analysis. Global HarvestChoice, 2010. "Agro-ecological Zones of Sub-Saharan Africa." International Food Policy Research Institute, Washington, DC. and University of Minnesota, St. Paul, MN.
HarvestChoice, 2011. "Tsunami-wrecked Farmland: Insights from Droppr." International Food Policy Research Institute, Washington, DC, and University of Minnesota, St. Paul, MN.
Hein L, De Ridder N. 2006. Desertification in the Sahel: A reinterpretation. Global Change Biology 12 : 751–758.doi: 10. 1111/j.1365-2486.2006.01135.x
Hooper, D.U., Adair, E.C., Cardinale, B.J., Byrnes, J.E.K., Hungate, B.A., Matulich, K.L., Gonzalez, A., Houghton R.A., Hackler J.L., 2006. Emissions of carbon from land use change in Sub-Saharan Africa. Journal of Geophysical Research-Biogeosciences, 111(G2): G02003. doi:10.1029/2005JG000076,2006.
Houghton, J. T., Y. Ding, D. J. Griggs, M. Noguer, P. J.van der Linden, and D. Xiaosu, Eds., 2001: Climate Change 2001: The Scientific Basis: Contributions of Working Group I to the Third Assessment Report of the Intergovernmental Panel on Climate Change. Cambridge University Press, 881 pp
IAASTD, 2009. International Assessment of Agricultural Knowledge, Science and Technology for Development. Agriculture at a Crossroads. Synthesis Report. 106pp
IFAD 2009. The Strategic Investment Program for Sustainable Land Management in Sub-Saharan Africa.
IFPRI, 1999. Soil Degradation A Threat to Developing-Country Food Security by 2020? Food, Agriculture, and the Environment Discussion Paper 27. (Sara J. Scherr). International Food Policy Research Institute 2033 K Street, N.W. Washington, DC 20006-1002 U.S.A.
ILCA, 1987. Assessment of Agricultural Research Priorities: An International Perspective. ACIAR Monograph, 4th Edition, ILCA's Strategy and Long-Term Plan, Addis Ababa, Ethiopia.
IPCC, 2007. Fourth Assessment report. Impacts, Adaptation and Vulnerability. Contribution of Working Group II to the Fourth Assessment Report of the Intergovernmental Panel on Climate Change, Cambridge University Press.
ISRIC/UNEP. 1990 World map of the status of human-induced soil degradation, ISRIC, Wageningen, the Netherlands.
Status of the World’s Soil Resources Report, Regional Assessments of Soil Changes | Chapters 9 - 16
53
Jahnke, H. E. 1982. Livestock production systems and livestock development in tropical Africa. Kiel, Germany: Kieler Wissenschaftsverlag Vauk.
Jimoh, H.I. “Individual Rainfall Events and Sediment Generation on Different Surfaces in Ilorin, Nigeria”, A Ph. D. Thesis submitted to the Department of Geography, University of Ilorin, Ilorin, 220 pp.
Joshua Graff Zivin and Leslie Lipper, 2008. Poverty, Risk, and the Adoption of Soil Carbon Sequestration. Environment and Development Economics 13: 353-373. Available at: http://works.bepress.com/josh_graffzivin/26
Julio Henao and Carlos Baanante, 1999. Nutrient depletion in the agricultural soils of Africa. 2020 Brief 62. A 2020 Vision For Food, Agriculture and Environment, IFPRI.
Kabambe, V.H. and J.D.T. Kumwenda. 1995. "Weed management and nitrogen rate effects on maize yield in Malawi." In: D. Jewell, S.R. Waddington, J.K. Ransom, K.V. Pixley (eds.) Maize Research for Stress Environments Harare, Zimbabwe: CIMMYT.
Kibblewhite, M.G K Ritz and M.J Swift 2008. Soil Health in Agricultural Systems Phil. Trans. R. Soc. B 2008 363, doi: 10.1098/rstb.2007.2178.
Knoepp, J. D. and Swank, W. T. 1997.Forest management effects on surface soil carbon and nitrogen, Soil Sci. Soc. Am. J., 61 928–61 935.
Laker, M.C. 2005. Appropriate plant nutrient management for sustainable agriculture in Southern
Laker, M.C. and D’Huyvetter, J.H.H. 1988. Slope-erodibility relationships for different soils in a semi-arid region of Ciskei. Proceedings of the Fifth International Soil Conservation Conference, Bangkok, 18th-29th January 1988. Pp. 641-653.
Lal R., 2006. Enhancing crop yields in the developing countries through restoration of the soil organic carbon pool in agricultural lands. Land Degradation and Development, 17: 197–209. doi:10.1002/ldr696.
Lal, R. (1995). Erosion-crop productivity relationships for soils of Africa. Soil Science Society of America Journal, 59(3), 661-667.
Lal, R. 1990. Soil erosion and land degradation: The global risks. In Soil degradation, Vol.
Lal, R. 2004. Soil carbon sequestration to mitigate climate change, Geoderma, 123, 1–22.
Land Type Survey Staff. 2003. Land types of South Africa. (ARC-Institute for Soil, Climate and Water: Pretoria).
Le Roux, J.J. 2012. Water erosion risk assessment in South Africa: towards a methodological framework. Report No. GW/A/2012/28. ARC-Institute for Soil, Climate and Water, Pretoria.
Le Roux, J.J., Morgenthal, T.L., Malherbe, J., Pretorius, D.J. and Sumner, P.D. 2008. Water erosion prediction at national scale for South Africa. Water SA, 34: 305-314.
Le Roux, J.J., Morgenthal, T.L., Malherbe, J., Smith, H.J., Weepener, H.L. and Newby, T.S. 2006. Improving spatial soil erosion indicators in South Africa. Report No. GW/A/2006/51. ARC-Institute for Soil, Climate and Water, Pretoria.
Le Roux, P.A.L., Hensley, M., Du Preez, C.C., Kotze, E., Van Huyssteen, C.W., Collins, N.B., Zere, T.B. 2005 The Weatherley catchment: Soil organic matter and vegetation baseline study. WRC Report No. KV170/50. (Water Research Commission: Pretoria)
Status of the World’s Soil Resources Report, Regional Assessments of Soil Changes | Chapters 9 - 16
54

Lemenih, Mulugeta 2004. Effects of Land Use Changes on Soil Quality and Native Flora Degradation and Restoration in the Highlands of Ethiopia: Implications for sustainable land management. Doctoral Dissertation. ISSN 14016230, ISBN 91576 6540-0
Levy, G.J. 1988. The effects of clay mineralogy and exchangeable cations on some of the hydraulic properties of soil. Unpublished D.Sc. thesis, University of Pretoria.
Liiri, M., Setala, H., Haimi, J., Pennanen, T. & Fritze, H. 2002 Relationship between soil microarthropod species diversity and plant growth does not change when the system is disturbed. Oikos 96, 137–149. (doi:10.1034/j.1600-0706.2002.960115.x)
Liniger, H. P., Studer, R. M., Hauert, C., & Gurtner, M. (2011). Sustainable Land Management in Practice–Guidelines and Best Practices for Sub-Saharan Africa.TerrAfrica. 2006. Assessment of the Nature and Extent of Barriers and Bottlenecks to Scaling Sustainable Land Management Investments throughout Sub-Saharan Africa. Unpublished TerrAfrica report.
Lyles, L. 1975. Possible effects of wind erosion on soil productivity. Journal of Soil Conservation, 30: 279-283.
Mabogunje, Akin L.1995.The Environmental Challenges in Sub Saharan Africa. Environment, African Technology Forum Volume 8, Number 1, 4-11.
MacVicar, C.N., De Villiers, J.M., Loxton, R.F., Verster, E., Lambrechts, J.J.N., Merryweather, F.R., Le Roux, J., Van Rooyen, T.H. and Harmse, H.J. von M. 1977. Soil classification - A binomial system for South Africa. Scientific Bulletin No 390, Pretoria: Department of Agricultural Technical Services.
Mandiringana, O.T., Mkile, Z., Van Averbeke, W., Van Ranst, E. and Verplanke, H. 2005. Mineralogy and Fertility Status of Selected Soils of the Eastern Cape Province, South Africa. Comm Soil Sci and Plant Anal, 36, 2431-2446.
Manson, A.D. 1996. The fertility status of land used for small-scale cropping in KwaZulu-Natal. Cedara Report No. N/A/96/9. KwaZulu-Natal Department of Agriculture, Cedara, South Africa. 9pp.
Martius, Holm Tiessen, Paul L.G. Vlek, 2002. Managing Organic Matter in Tropical Soils: Scope and Limitations, Springer Science & Business Media, Jan 31, - Nature - 235 pp.
McCann, J.C. 2005. Maize and grace: Africa’s encounter with a new world crop 1500-2000. Harvard Univ. Press, Cambridge.
McKean, S.G. 1993. Soil organic matter patterns, processes and effects in two contrasting savannas. M.Sc. dissertation. (University of Witwatersrand: Johannesburg).
Meadows, M. E. and M. T. Hoffman 2002. The nature, extent and causes of land degradation in South Africa: legacy of the past, lessons for the future? Royal Geographical Society, 34 (4), 39-44.
Meyer, J.H., Harding, R., Rampersad, A.L. and Wood, R.A., 1998. Monitoring long term soil fertility trends in the South African sugar industry using the FAS Analytical Database. Proc S Afr Sug Technol Ass (1998) 72, 61-68.
Miles, N. and Manson, A.D. 2000. Nutrition of planted pastures. Pp. 180-232. In N Tainton (Ed). Pasture Management in South Africa. University of Natal Press, Pietermaritzburg, South Africa.
Mills, A.J., Fey, M.V. 2004. Soil carbon and nitrogen in five contrasting biomes of South Africa exposed to different land uses. South African Journal of Plant and Soil. 21, 94-102.
Status of the World’s Soil Resources Report, Regional Assessments of Soil Changes | Chapters 9 - 16
55

Murty, D., Krischbaum, M. F., McMurtrie, R. E., and McGilvray, H. 2002. Does conversion of forest to agricultural land change soil carbon and nitrogen? A review of the literature, Glob. Change Biol., 8, 105–123.
Nachtergaele, F. and Petri M. 2008. Mapping Land Use Systems at global and regional scales for Land Degradation Assessment Analysis. FAO.
Nandwa S. M. 2003. Perspectives on soil fertility in Africa. In: Gichuru MP et al., (eds) Soil fertility management in Africa: a regional perspective. Academy of Science Publishers (ASP) and Tropical Soil Biology and Fertility of CIAT, Nairobi.
NEST 1991.. Nigeria’s Threatened Environment: a National Profile. Nigeria: A NEST Publication.
Odai, S.N., E. Mensah, D. Sipitey, S. Ryo and E. Awuah, 2008. Heavy metals uptake by vegetables cultivated on urban waste dumpsites: Case study of Kumasi, Ghana. Res. J. Environ. Toxicol., 2: 92-99.
Ofomata, G.E.K. , 1985. Soil erosion in Nigeria: the views of a Geomorphologist. University of Nigeria Inaugural Lecture Series No.7.
Okigbo, D., 1977. “Farming Systems and Soil Erosion in West Africa”, in Greenland, J & Lal, R. (eds), Soil and Water Conservation and Management in the Humid Tropics, U.K: John Wiley & Sons.
Oldeman, L. R. 1991. Global extent of soil degradation Biannual report. Wageningen: International Soil Reference and Information Centre.
Oldeman, L.R., R. T. A. Hakkeling, and W. G. Sombroek. 1991. World Map of the status of human- induced soil degradation: An explanatory note. Wageningen, The Netherlands and Nairobi, Kenya: International Soil Reference and Information Centre and United Nations Environment Programme
Oldeman, R. 2002. “Assessment of Methodologies for Drylands Land Degradation Assessment.” First Meeting of Technical Advisory Group and Steering Committee of the Land Degradation Assessment in Drylands. FAO, Rome, January 22 25. Wageningen, The Netherlands.
Palm, C.A., Gachengo, C.N., Delve, R.J., Cadisch, G. and Giller, K.E. 2001. Organic inputs for soil fertility management in tropical agroecosystems: application of an organic resource database. Agriculture, Ecosystem and Environment, 83, 27-42.
Paoletti, M. G., Foissner, W., and Coleman, D. C., 1993, Soil Biota, Nutrient Cycling and farming Systems. Lewis, Boca Raton, Fl.
Pastor, J. and W. M. Post, 1986. Influence of climate, soil moisture and succession on forest carbon and nitrogen cycles. Biogeochemistry 2: 3-27.
Perrings Charles and Jon Lovett, 1999. Policies for Biodiversity Conservation: The Case of Sub-Saharan Africa. International Affairs, 75, 281–305.
Pieri, C., 1989. Fertilité des terres de savane. Bilan de trente ans de recherche et de développement agricoles au Sud du Sahara. Ministère de la Coopération. CIRAD, Paris, 444 pp
Pretorius, D., 2009. Mapping Land Use Systems at a National Scale for Land Degradation Assessment Analysis in South Africa. Department of Agriculture. South Africa.
Status of the World’s Soil Resources Report, Regional Assessments of Soil Changes | Chapters 9 - 16
56

Project Development Facility (PDF-B), 2007. Strategic Investment Programme for Sustainable Land Management in Sub-Saharan Africa Activity 1.4 Assessment of the Barriers and Bottlenecks to Scaling-Up Sustainable Land Management Investments throughout Sub Saharan Africa.
Rantoa, N.R., Du Preez, C.C. and Van Huyssteen, C.W. 2009. Estimating organic carbon stocks in South African Soils. MSc. Thesis, University of the Free State, Bloemfontein, South Africa.
Rapp, I. 1998. Effects of soil properties and experimental conditions on the rill erodibility of selected soils. Unpublished Ph.D. thesis, University of Pretoria.
Reich, P.B., Tilman, D., Isbell, F., Mueller, K., Hobbie, S.E., Flynn, D.F.B., Eisenhauer, N., 2012. Impacts of Biodiversity Loss Escalate through Time as Redundancy Fades. Science 336, 589-592.
Reich, P.F., S.T. Numbem, R.A. Almaraz and H. Eswaran. 2001. Land resource stresses and desertifi-cation in Africa. In: Bridges, E.M., I.D. Hannam, L.R. Oldeman, F.W.T. Pening de Vries, S.J. Scherr, and S. Somp
Rhoades C.C., Eckert G.E., Coleman D.C., 2000. Soil carbon differences among forest, agriculture, and secondary vegetation in lower montane Ecuador. Ecological Applications 10, 497–505.
Ringius L., 2002. Soil carbon sequestration and the CDM: Opportunities and challenges for Africa. Climate Change, 54: 471–495.
Sanchez, P. A., 2000. Linking climate change research with food security and poverty reduction in the tropics, Agr. Ecosyst. Environ. 82, 371–383.
Scherr, Sara J. 1997 Soil Degradation A Threat to Developing-Country Food Security by 2020? Food, Agriculture, and the Environment Discussion Paper 27 Environmental Economics and Natural Resource Management in Developing Countries, World Bank, Washington, DC, 22–24 January 1992, FAO, Rome.
Schjønning P., Thomsen I. K., Møberg J. P., de Jonge H., Kristensen K., Christensen B. T. (1999): Turnover of organic matter in differently textured soils: I. Physical characteristics of structurally disturbed and intact soils. Geoderma 89: 177-198.
Schlesinger, P. and Palmer Winkler, J. 2000. Soils and the global carbon cycle in: The Carbon Cycle, edited by: Wigley, T. M. L. and Schimel, D. S., Cambridge University Press, Cambridge, 93–101.
Schoeman, F., Newby, T.S., Thompson, M.W. and Ven den Berg, E.C. 2010. South African National Land-Cover Change Map. ARC-ISCW Report Number: GW/A/2010/47.
Scotney, D.M. & Dijkhuis, F.J., 1990. Changes in the fertility status of South African soils. S. Afr. J. Science 86, 395-402.
Scotney, D.M., Volschenk, J.E. and Van Heerden, P.S. 1990. The potential and utilization of natural agricultural resources of South Africa. Department of Agricultural Development, Pretoria, 11pp.
Seta¨la¨, H. & McLean, M. A. 2004 Decomposition rate of organic substrates in relation to the species diversity of soil saprophytic fungi. Oecologia 139, 98–107. (doi:10.1007/s00442-003-1478-y)
Status of the World’s Soil Resources Report, Regional Assessments of Soil Changes | Chapters 9 - 16
57

Seta¨la¨, H., Berg, M. P. & Jones, T. H. 2005 Trophic structure and functional redundancy in soil communities. In: Biological diversity and function in soils (eds R. D. Bardgett, M. B. Usher & D. W. Hopkins), pp. 236–249. Cambridge, UK: Cambridge University Press.
Shepherd, K. D., and M. J. Soule. 1998. Soil fertility management in West Kenya. Agriculture, Eco systems and Environment 71 (1-3): 133- 147.
Smaling, E. 1993. An agro- ecological frame work for integrated nutrient management, with special reference to Kenya. Doctoral thesis, Agricultural University, Wageningen, the Netherlands.
Smaling, E., S. Nandwa, and B. Janssen. 1997. Soil fertility in Africa is at stake. In Replenishing soil fertility in Africa, ed. R. J. Buresh and P. A. Sanchez. SSSA Special Publication. Madison, Wisconsin, U.S.A.: Soil Science Society of America and American Society of Agronomy.
Smit, M.L. 2004. The effect of cropping systems and tillage practices on some fertility indicators of a Swartland soil near Malmesbury. M.Sc. Agric. Dissertation. (University of the Free State: Bloemfontein).
Smith P., 2008. Soil organic carbon dynamics. In A.K. Braimoh & P.L.G. Vick, eds. Land Use and Soil Resources. Springer Science + Business Media B.V.
Sombroek, W., Nachtergaele, F. O., and Hebel, A.: Amounts, dynamics and sequestering of carbon in tropical and subtropical soils, Ambio, 22, 417–426, 1993.
Stoorvogel, J. J., E. M. A. Smaling, and B. H. Janssen. 1993. Calculating soil nutrient balances in Stoorvogel, J.J. and Smaling, E.M.A. 1990.Assessment of soil nutrition depletion in Sub-Saharan Africa: 1983-2000. Report No. 28. Winand Staring Centre, Wageningen, the Netherlands.
Swift, M.J. and Shepherd, K.D. 2007. (Eds). Africa’s Soils: Science and Technology for improved soil management in Africa. World Agroforestry Centre, Nairobi.
TerrAfrica,,2006. World overview of conservation approaches and technologies (WOCAT) and Food and Agriculture Organization of the United Nations (FAO).
Thibaud, G.R. 2005. NPK fertilization and liming in no-till. In A Venter, T Matchett, W Mackenzie, D MacNicol, B Berry , B Russell & V Brummer (Eds). A Guide to No-till Crop Production in KwaZulu-Natal. No-Till Club, Howick, ISBN 0-621-30095-0.
Tieszen L.L., Tappan G.G., Toure A., 2004. Sequestration of carbon in soil organic matter in Senegal – an Overview. Journal of Arid Environments, 59: 409–425. doi.org/10.1016/j.jaridenv.2004.04.002.
Todaro, M. 2000. Economic Development. Essex: Pearson Education Limited.
Tschakert P., Khouma M., Sene M., 2004. Biophysical potential for soil carbon sequestration in agricultural systems of the Old Peanut Basin of Senegal. Journal of Arid Environments, 3: 511–533. doi.org/10.1016/j.jaridenv.2004.03.026.
Udo, R.K.,1970, Geographical regions of Nigeria, London: Heinemann, Ibadan, Nigeria.
UNDP. 2005. Population Division of the Department of Economic and Social Affairs of the United Nations Secretariat, World Population Prospects: The 2004 Revision and World Urbanization Prospects.
UNEP, 2011. Environmental Assessment of Ogoniland. United Nations Environmental Programme, 262pp.
Status of the World’s Soil Resources Report, Regional Assessments of Soil Changes | Chapters 9 - 16
58

UNEP. 1982. World’s soil policy. Nairobi, Kenya: United Nations Environment Programme.
UNEP. 2007. Global Environment Outlook 4 (GEO-4). Nairobi, 572 pp.
UNEP. 2013. Second Global Conference on Land – Oceans Connection (GLOC-2) 2-4 October, 2013, Montego Bay, Jamaica.
UNSO/SEED/BDP, 1999. Promoting Farmer Innovation: Harnessing local environmental knowledge in East Africa Regional Land Management (RELMA) Unit Workshop Report No. 2, Urban Food Production: A Survival Strategy of Urban Households. Report of a Workshop on East and Southern Africa held in Nairobi, Kenya. 3rd to 5th May 1998 (ISBN 9966-896-35-X).
Vågen, T.G., R. Lal, and B.R. Singh., 2005. Soil carbon sequestration in sub-Saharan Africa: A review. Land Degrad. Dev. 16:53–71. doi:10.1002/ldr.64
Van Antwerpen, R., Meyer, J.H. 1996. Soil degradation under sugarcane cultivation in Northern KwaZulu-Natal. Proceedings of the South African Sugar Technology Association 70, 29-33.
Van der Merwe, A.J., De Villiers, M.C., Barnard, R.O., Beukes, D.J., Laker, M.C. & Berry, W.A.J. 2000. Technical report on guidelines on the management and rehabilitation of acid and fertility declined soils in South Africa. Proc. 2nd MADS-SEA-Network Meeting, 18-22 September. Pretoria.
Wiese, L., Lindeque, L. and De Villiers, M. 2011. Land Degradation Assessment in Drylands Project Policy Report. ARC-ISCW Project Nr. GW/A/2011/52.
Williams, C. A., Hanan, N. P., Neff, J. C., Scholes, R. J., Berry, J. A., Denning, A. S., Baker, Windmeijer P.N., Andriesse W., 1993 Inland valleys in West Africa: an agro-ecological characterization of rice-growing environments. Publication 52. ILRI, International Institute for Land Reclamation and Improvement, Wageningen.
WMO 2005, World Meteorological Organization ISBN 92-63-10989-3, 34pp.
Woomer, P.L., Toure, A., and Sall, M. 2004. Carbon stocks in Sahel transition zone, J. Arid Environ.
World Bank 1998. Soil Fertility Management in Sub−Saharan Africa. WORLD BANK TECHNICAL PAPER NO. 408
World Bank, 1992. Background paper for World Development Report 1992. Trade and the Environment: A Survey of the Literature.
World Bank. 1997. World Development Report 1997: The State in a Changing World. New York: Oxford University Press. © World Bank. https://openknowledge.worldbank.org/handle/10986/5980 License: CC BY 3.0 IGO.”
World Bank 2002. World Development Report 2002: Building Institutions for Markets. Oxford: Oxford University Press.
Yanai, R.D., S.V. Stehman, M.A. Arthur, C.E. Prescott, A.J. Friedland, T.G. Siccama, and D. Binkley. 2003. Detecting change in forest floor carbon.
Status of the World’s Soil Resources Report, Regional Assessments of Soil Changes | Chapters 9 - 16
59

10. Regional Assessment of Soil Change in Asia Regional Coordinator/Author: Kazuyuki Yagi (ITPS/Japan)
Contributing Authors: Fahmuddin Agus (Indonesia), Tomohito Arao (Japan), Milkha S. Aulakh (ITPS/India), Zhaohai Bai (China), Rodel Carating (The Philippines), Kangho Jung (South Korea), Atsunobu Kadono (Japan), Masayuki Kawahigashi (Japan), Seung Heon Lee (South Korea), Lin Ma (China), G.P. Obi Reddy (India), G. S. Sidhu (India), Yusuke Takata (Japan), Tran Minh Tien (Vietnam), Renkou Xu (China), Xiaoyuan Yan (China), Kazunari Yokoyama (Japan), Fusuo Zhang (China), Dongmei Zhou (China).
======================================================================
10.1. Introduction This chapter describes the status of soil resources in the member countries of Asian Soil
Partnerships (ASP), which is consisted of East Asia (5 countries: China, DPR Korea, Japan, Mongolia, and Republic of Korea), Southeast Asia (11 countries: Brunei Darussalam, Cambodia, Indonesia, Lao PDR, Malaysia, Myanmar, Philippines, Singapore, Thailand, Timor Leste, and Viet Nam), and South Asia (8 countries: Afghanistan, Bangladesh, Bhutan, India, Maldives, Nepal, Pakistan, and Sri Lanka).
Asia is the Earth's largest and most populous continent, located primarily in the eastern and northern hemispheres. The Region of Asia, consisted of above mentioned ASP countries, covers 4.1% of the Earth's total surface area and comprises 16% of its land area. With approximately 3.9 billion people, it hosts 55% of the world's current human population. Thus, the population density of the region is as high as 1.87 person ha-1, which is much higher than the world average of 0.54 person ha-1. Like most of the world, Asia has a high growth rate in the modern era. For instance, during the 20th century, Asia's population nearly quadrupled, as did the world population.
In general, the Region of Asia, through their warm and seasonal humid climate, is blessed with natural resources for agriculture. The unique combination of the monsoon climate and the exceptionally large lowland area is the driving force that makes this region the rice basket of the world (Kyuma, 2004), and has assured the sustainability of staple food production for a long time, which enabled these countries to sustain a large population within limited arable land. However, recently, Asian countries are facing rapid changes in both socio-economical and natural aspects, which have extraordinary impacts on agro-environment in the region. Rapid economical development and urbanization are changing land management systems in many countries. Climate change is another source of the risks. Those impacts have extended to the status of soil resources in the region.
10.2. Stratification of the region
10.2. 1 Climate and agro-ecology The map of Asia shows many vast rivers with large alluvial plains and deltas, including the
Yellow, Yangtze, Mekong, Chao Phraya, Irrawaddy, Ganges, Brahmaputra, and Indus. The Himalayas mountain system, which main range runs more than 2,400 km, separates the Indian subcontinent from the rest of Asia. Many of Asia's major rivers have their source in the Himalayas and adjacent plateaus. The rivers create fertile land for farming. At the east and southeast shores of the
Status of the World’s Soil Resources Report, Regional Assessments of Soil Changes | Chapters 9 - 16
60

continent, a number of chain islands, or island arcs, are located, many of which are characterized mountainous landscape with volcanic activities.
Most of the areas of Asian region have a strong influence of Asian monsoon, a seasonal reversing wind accompanied by corresponding changes in precipitation. Thus, this region is often called “Monsoon Asia”. The Asian monsoon is a most significant component of the global climate system, influencing lifestyle and livelihood, and providing water resources in the region (Salinger et al., 2014). The East Asian monsoon carries moist air from the Pacific Ocean and Indian Ocean to East and Southeast Asia in summer. Reversely, it carries cold and dry air from the Eurasian Continent in winter. In south Asia, winds blow from the south-west direction from the Indian Ocean onto the Indian landmass during the months of June through September and bring rains to most parts of the subcontinent. Subsequently later in the year, around October, winds reverse direction and start blowing from a north-easterly direction, from subcontinent onto the Indian Ocean, which carries less moisture and brings rain to only limited parts of India. However, dry area extends in north-western interior parts of the region due to less influence of oceanic winds. Due to the wide diversity of climate, the region is stratified into different agro-ecological zones (Fig. 10.1)
Figure 10.1: Length of the available growing period in Asia (in days/year) (Fischer et al., 2012)
Another distinctive feature of monsoon Asia is very high shares of the area and production of rice in the world (Kyuma, 2004). Some 90% of the total acreage as well as annual output of rice are
Status of the World’s Soil Resources Report, Regional Assessments of Soil Changes | Chapters 9 - 16
61
concentrated in the region, making it rightly deserve the name “rice granary” of the world. A large presipitation, that is generally concentration in the rainy season, on the one hand, and the occurrence of extensive lowlands are the two determining factors for the dominance of rice cultivation in Monsoon Asia. Particularly, a vast expanse of lowlands is a unique feature of the region, resulting from a combination of geological instability and high presipitation of the region. Rice cultivation emerged as an adaptation to extensively inundated lowlands, but with time it was expanded even to the land that could support rice only with irrigation. High productivity and high sustainability are the outstanding advantages of rice cultivation, while upland cultivation in Monsoon Asia for dry footed crops has been handicapped by low soil fertility and high susceptibility to soil erosion.
10.2. 2 Previous regional soil assessment
Based on the report by Oldeman (1991), the GLASOD project estimated that human-induced soil degradation in Asia region (including non-ASP west Asian countries) accounted for 31% of the inhabited land area, which was the highest in the global regions. The percentages of degraded soils by water erosion, wind erosion, chemical degradation and physical degradation in Asia were to be 59%, 30%, 10%, and 2%, respectively. Deforestation was identified as the most dominant causative factor for soil degradation in Asia, followed by agricultural activities and overgrazing. In most of Asian countries the mining of soil nutrients is pushing the average crop yields in to decline. Fertile soil is washed away by the erosive forces of water, or blown away by wind. This so-called first generation of environmental problems not only leads to negative nutrient balance, but also causes habitat destruction and loss of biodiversity (Oldeman, 2000).
Following GLASOD, the need for more detailed and more country-specific degradation assessment became apparent. In 1993, the members of the Asian Network on Problem Soils recommended the preparation of a qualitative assessment for South and Southeast Asia at a scale of 1:5 million. This recommendation was acknowledged by FAO and UNEP. FAO assigned ISRIC to prepare a new physiographic map and database at 1:5 Million, while UNEP formulated a project document for the Assessment of the Status of Human-induced Soil Degradation in South and Southeast Asia (ASSOD) with 16 national institutions on natural resources in the region and ISRIC as the coordinating institution for this project. As results, the ASSOD project output revised sub-regional Guidelines for General Assessment of the Status of Human-Induced Soil Degradation and regional maps on the status of human-induced soil degradation at a scale of 1:5M together with digitized version of the map (van Lynden and Oldeman, 1997).
The brief account of different soil degradation types (as per ASSOD) is described as below (and also shown in Fig. 10.2):
Water erosion: Water erosion covers 21% of the total land area in the region (or 46% of the total degraded area). It is predominant in large parts of China (>180 Mha) except for the northern parts, on the Indian subcontinent (>90 Mha) and in the sloping parts of Indochina (40 Mha), the Philippines (10 Mha) and Indonesia (22.5 Mha). In relative terms (as percentage of the total country area) moderate to extreme water erosion is particularly important in India (10%), the Philippines (38%), Pakistan (12.5%), Thailand (15%) and Vietnam (10%).
Wind erosion: Wind erosion (9% of the total area, 20% of all degradation) is concentrated mainly in the most western and northern arid and semi-arid desert regions of Pakistan (>9 Mha on-site
Status of the World’s Soil Resources Report, Regional Assessments of Soil Changes | Chapters 9 - 16
62

and >2 Mha off-site), India (20 Mha on-site, 3.6 Mha offsite) and China (>70 Mha on-site, >8.5 Mha off-site). Although large parts of these regions may be considered deserts, some human-induced wind erosion was also reported by some organizations.
Chemical deterioration: Chemical deterioration is distributed in patches, probably also partly due to different perceptions of this type of degradation. About 11% of the total (or 24% of the degraded) area is affected by some kind of chemical deterioration. High relative extents of chemical deterioration (>30% of total country area) can be observed in Bangladesh, Cambodia, Sri Lanka, Malaysia, Pakistan and Thailand, generally with negligible to light impact.
Physical deterioration: Occurrence of physical deterioration (affecting about 4% of the total area or 9% of the total degraded area) is even more disperse and infrequent than chemical deterioration, with waterlogging and aridification as the main subtypes, in particular in Bangladesh, China , India, and Pakistan. Compaction or crusting/sealing has been allotted relatively little importance, except for Thailand and the Philippines. Its occurrence has nevertheless been mentioned in some other country reports. Waterlogging and compaction as a result of paddy cultivation has not been considered as degradation, at least not under current land use. Loss of productive function as a result of urbanisation, industrialisation and infrastructure has been indicated by a few countries, but
can be assumed to be of more importance in general.
10.3 General threats to soils in the region
10.3.1 Erosion (by wind and water) Soil erosion is the most important threat of soil in Asia. Water erosion by rainfall and surface
water flow is dominant in humid regions with torrential rains such as South and East Asia. On the other hand, wind is the crucial driving force inducing soil erosion in desserts. This threat is discussed below in section 10.4. 1 in detail.
Figure 10.2 Threats to soils in the Asia region by country (The figure was drawn based on the data in van Lynden and Oldeman, 1997).
0
10
20
30
40
50
60
70
Rel
ativ
e di
strib
utio
n of
deg
rade
d so
il(a
s %
of t
otal
land
are
a pe
r cou
ntry
)
Water erosion Wind erosionChemical deterioration Phisical deterioration
Status of the World’s Soil Resources Report, Regional Assessments of Soil Changes | Chapters 9 - 16
63

10.3.2 Soil organic carbon change Available data for evaluating soil organic carbon (SOC) change in Asian countries are limited
because not all the Asian countries monitor SOC stock and its change. However, available literature’s data show that increases in crop yield retain SOC in croplands of East and Southeast Asia. Also, there is a tendency that SOC accumulation occurs in forest area. Whereas, SOC is decreasing in South Asia, because crop residues are widely used as fuel and fodder, and not returned to the soil. In Indonesia, three anthropogenic activities, i.e. deforestation, poor land management, and intensive cropping, present a great threat to SOC change in mineral and peat soils (section 10.5.2). The degradation of grassland generally caused great losses of SOC stock. This threat is discussed below in section 10.4.2 in detail.
10.3.3 Soil contamination Sources of contamination of arable land in most Asian countries include (i) parent material,
(ii) mining, (iii) smelting, (iv) agrochemicals and sewage sludge applications, and (v) livestock manure uses (Luo et al., 2009). There is an urgent need to reduce hazardous chemical concentrations of Cd, As, Pb, Cu and Zn, especially in paddy soil and rice grains. In many regions of Southeast Asia (Bangladesh, India, China, Vietnam, Taiwan, Thailand and Nepal), arsenic is naturally present in groundwater and represents a threat to sustainable agriculture (Smedley, 2003; Brammer and Ravenscroft, 2009). Such enrichment is magnified considerably when mining, as it is the case of the Ron Phibun district, in southern Thailand (Williams et al., 1996). Arsenic contamination particularly affects rice, as this crop not only requires large amounts of water, but also under the anaerobic conditions favoured in rice fields, As is mainly present as As(III) and this form is the most readily available to plants (Brammer and Ravenscroft, 2009). The agricultural rice soils of the Guandu Plain in Taiwan are seriously contaminated with As and Pb (Chang et al., 1999; 2007). Cadmium pollution of paddy fields were found in downstream of a Zn mineralized area in Thailand (Simmons et al., 2005). China contributes ca. 28% of global Hg emissions with India, Japan and the Korea Democratic Republic also among the 10 countries that contribute the most to global Hg emissions (Li et al., 2009).
According to the Agricultural Land Soil Pollution Prevention Law in Japan, the maximum allowable limit of Cd in paddy field was set in terms of the Cd concentration in rice grains produce in the field, not the soil Cd concentration of the field. This is because the amount of bio-available Cd in soil is affected dramatically by water management practices used for rice cultivation (Asami, 1981).
With rapid industrialization, urbanization and intensive use of farmland, China is now facing serious soil pollution (Ministry of Environmental Protection, the People’s Republic of China, 2014). About 19.4% of the farming land has high levels of Cd, Ni and As. Soil contamination has been estimated to cause a reduction of more than 107 t of food supply annually (Wei and Chen, 2001). In 2006-2010, China's Ministry of Environmental Protection and Ministry of Land and Resources jointly launched a nationwide investigation of soil pollution status, covering an area of 6.3 million square kilometers. In 2014, a Communiqué on Nationwide Soil Contamination was issued by the two ministries indicating that the overall situation of soil environment in China is not optimistic. Some regions are heavily polluted and there is concern on the quality of farmland soils and other soil environmental issues also caused by anthropogenic activities, e.g., those related to mining and industrial activities causing atmospheric deposition and livestock manures (Luo et al., 2009). Trace elements are the pollutants of major concern, especially in the southern area of China. Currently, the evaluation of soil pollution is primarily based on the Environmental quality standard for soils which was promulgated and implemented in 1995, but this needs further improvement because of its
Status of the World’s Soil Resources Report, Regional Assessments of Soil Changes | Chapters 9 - 16
64

stringent limitations. At present, the Ministry of Agriculture is working on Implementation Plan on Prevention and Control of Heavy Metal Pollution in Agricultural Products Origins.
Historic and current rates of intensive pesticide and fertilizer use in agricultural land and industrial development have caused the accumulation of organic pollutants and heavy metals in soils of Indonesia. Earlier research showed high concentration of organo-chlorines in vegetables (Dibiyantoro, 1998), but the residue levels in food stuff has gradually reduced to below acceptable daily intake level as established by WHO (Shoiful et al., 2012; Rahmawati et al., 2013). The tapioca industry in Java is now recognized as a contributor to cyanide levels in river water above background levels (Indrayatie et al., 2013). Mining plays an important role in the Indonesia economy, however; artisanal and small-scale mining (ASGM) can have a major impact on the environment (Limbong et al., 2003; Prasetyo et al., 2010). During ASGM Hg is used to recover Au from the ore during grinding. The process is inefficient and releases a significant amount of Hg to soil, water and the atmosphere (Limbong et al., 2003; Edinger et al., 2008). Tailings from Hg amalgamation is then leached with cyanide and in the final waste contaminated with metals and cyanide is released into the environment (Veiga et al., 2009). Many of the ASGM operations also release As and Sb to the environment, depending on the composition of the host ore (Edinger et al., 2008). Such operations are illegal in the sense that they operate under no formal legal construct. However, as a consequence of Indonesia signing the Minamata Convention on Hg, control of ASGM operations has been decentralized to Provincial Government control and environmental protection has become a primary objective for government regulation.
10.3.4 Soil acidification
There is large area of acid soils distributed in tropical and subtropical regions of Asia, mainly in Southeast Asia, parts of East Asia and parts of South Asia. Acid sulphate soils distribute in coastal plains of Southeast Asia and southern China. The total area of acid sulphate soils is 7.5 million hm2 in Southeast Asia and 112 thousand hm2 in China (Shamshuddin et al., 2014). The soils in these regions are also sensitive to external acid such as acid deposition (Hicks et al., 2008).
In Vietnam, as an example, Ferralitic, Basaltic, and Grey degraded soils, which cover about 1/3 of total natural area of the country, have a strongly potential of acidification in correlation with degeneration because of their nature (NISF, 2012). One very important contribution in soil acidification in Vietnam is the unbalanced and unsuitable application of chemical fertilizers. The data revises from International Fertilizers Association (IFA) showed that from 1961 to 2012, total NPK chemical fertilizers used in Vietnam increased 31 times (IFA, 2012). The increasing of fertilizers application; together with the unbalanced use; lead to inadequate presentations of acidic factors in soil solution. Some types of fertilizers (include organic fertilizers) were considered as physiologically acidic fertilizers, which can make the soil become more acidic (Nguyen, 2014). Another reason for acidification process in Vietnam is the presence of sulphate soil. The area of sulphate soil in Red River delta has increased 7,000 ha and the content of S in this soil also strongly increased. In Mekong river delta, the area has reduced 261,000 ha and contents of total exchangeable cations and total dissolved salts have also reduced. Increase in temperature, change of precipitation, and sea level rise due to climate change may also make negative effects into this process in Vietnam.
The total area of Indonesian acid upland soils (pH <5 and <50% base saturation) is about 102.8 million ha and about 55.8 million ha of these is suitable for various types of agriculture and
Status of the World’s Soil Resources Report, Regional Assessments of Soil Changes | Chapters 9 - 16
65

plantation (Puslitbangtanak, 2000). Relatively low cost technologies are widely available for rectifying soil acidity problems, and these include liming, organic matter application, balance fertilization and selection of acid tolerant crops. Farming practices, such as application of acidifying fertilizers like as ammonium sulphate aggravates the problem (Kamprath, 1984).
In China, acid soils are mainly distributed in tropical and subtropical regions south of the Yangtze River. The total area is about 204 million ha and occupies 22.7% of total land area in the country. In past three decades, accelerated soil acidification occurred in southern China due to serious acid deposition and heavy application of ammonium-based fertilizers. In subtropical region of China, soil pH was decreased averagely by 0.23 units for cereal cropland and 0.30 units for cash cropland, respectively (Guo et al., 2010). Soil acidification in cropland in China was accelerated mainly by ammonium-based fertilizers, while acid deposition was mainly responsible for acidification in forest soils. Although the emission of SO2 was reduced by 20% in China in past ten years, acid deposition is still serious and its impact on soil acidification will not be eliminated in near future (Zhao et al., 2009).
Tea plants are cultivated extensively in subtropical regions of China, Japan, Southeast Asia and parts of South Asia, which led to serious acidification of soils in tea gardens (Wang et al., 2010). Soil acidification induced by the cultivation of vegetables in greenhouse is a new phenomenon because acidification and salinization occurred simultaneously in the soils. Excess application of ammonium-based fertilizers and lack of leaching were responsible for acidification and salinization of soils in vegetable greenhouse (Guo et al., 2010).
10.3.5 Soil salinization and sodification
The threat of salinisation/sodification in Asia region is various. In semiarid and arid zones of central and west Asia, salt-affected soils are widely distributed. On the other hand, salt-affected soils are developed in certain coastal area in monsoon zones, mainly by salt water intrusion in South and Southeast Asia and by coastal tideland reclamation. Although these coastal areas affected is relatively small, but it become a serious problem for lowland rice production. This threat is discussed below in section 10.4 (3) in detail.
10.3.6 Loss of soil biodiversity
Potentially the greatest contributor to soil biodiversity loss in Asia is land use change. In China, for example, an assessment of land-use change across the country indicated that the largest changes were associated with the development of productive cultivated land to urban areas, thereby putting less productive land into agricultural production. Conversion of cultivated, forest, and grasslands were estimated to be 1475 x 104 ha, 269 x 104 ha, and 536 x 104 ha, respectively, between 1996 and 2008 (Wang et al. 2012). Although there are attempts at land restoration such as the coastal lands in the Jiangsu Province, China, a higher biodiversity of soil macrofauna in uncultivated land and forests persisted compared to less diverse wheat farms and bulrush land (Baoming et al. 2014). Soil fauna diversity is significantly impacted by land use with a strong relationship between vegetation and macrofauna distribution and composition (Baoming et al. 2014). In Thailand, forested land area has decreased by more than 50% in the past 40 years (Fisher and Hirsch 2008). Although reforestation measures can be used to restore degraded lands, difficulties with establishment of native trees in these areas may lead to the use of substitute trees, resulting in long lasting effects on soil biodiversity. For
Status of the World’s Soil Resources Report, Regional Assessments of Soil Changes | Chapters 9 - 16
66

example, a study of soil microbial communities of an Acacai tree plantation established on degraded land in Thailand found reduced microbial activities compared to natural evergreen forest, suggesting that key microbes may be lost (Doi and Ranamukhaarachchi 2013).
Studies in India have also indicated an effect of land use change on soil organisms. The Nilgiri biosphere reserve in the Western Ghats of India, a global hotspot for aboveground biodiversity, has been under pressure because of a high population density (Mujeeb Rahman et al. 2012). In this area, land management had a significant effect on soil macrofauna, with larger densities and diversity found in the forest sites and a clear response of macro-invertebrates to land use (Rossi and Blanchart, 2005). Interestingly, there was a high similarity in macrofauna between primary forest and disturbed forest plots indicating potential for land restoration. A separate morphological analysis of soil invertebrate density at 15 different land use sites (from intensively managed agricultural systems to pristine forests) identified the soil faunal groups, earthworms, termites, ants, grasshoppers, crickets, mole crickets, bugs, coccids, cicadas, woodlice, centipedes, millipedes, and spiders (Mujeeb Rahman et al. 2012). The natural forests had significantly higher taxonomic richness at the family level than soils from the annual cropping system and significantly higher total number of individuals than annual crops, agroforestry and plantations. The highest richness (identified to family level) was found in the sites with the least anthropogenic disturbance and the greatest diversity of earthworms, ants and termites (determined to species level) were found in the more complex forest ecosystems. An earlier study in the region recorded almost double the number of earthworm species in soils from forest compared to pasture (Blanchart and Julka, 1997). These results indicate a decrease in earthworm biodiversity associated with forest loss and a lower diversity of soil macrofauna with more intensive land use.
In addition to anthropogenic pressures on soil biodiversity, natural disturbances such as tsunamis can affect soil biodiversity. Tsunami affected areas in the Phang Nga province of Thailand had a higher proportion of prokaryotes (archaea and bacteria; 83.25%) compared to non-affected areas (72.5%), whereas the non-affected areas were more hospitable to eukaryotes (animals, plants, fungi and protists) (Samboonna et al. 2014). Increased occurrences of tsunamis and other natural disasters may result in losses to above and belowground biodiversity.
There has not been a comprehensive analysis of threats to soil biodiversity in Asia completed to date. Scientific evaluation of soil biodiversity over large regions has been extremely difficult due to: 1) size of organisms, 2) large abundance and diversity of organisms, 3) lack of research and gaps in the information collected. In paddy rice cultivation and upland farming with sustainable agriculture, crop rotation and organic amendments have generally maintained good soil microbial diversity. However, loss of significant microbial diversity is notable in large-scale and intensive vegetable production areas due to: 1) continuous monoculture cropping, 2) over-cultivation, 3) intensive use of chemical fertilizers, 4) chemical fumigation of soils to prevent soil-borne diseases, 5) soil contamination and non target effects of chemical pesticides (i.e., fungicides, nematicides, herbicides and insecticides), and 6) over-application of herbicides for weed control. The loss of diversity in the soil is conducive to further diseases and other cropping issues from processes 2) to 6). Recently, these management practices have created concerns and prompted environmental and safety-oriented consumers to promote organic farming and accelerate the branding of sustainably produced agricultural products based on scientific evidence, thus, encouraging farmers to consider soil biodiversity in their farming practices. So far, in China, Taiwan and the Philippines, the evaluation of microbial diversity has been recorded by private sectors and shows high soil microbial diversity in
Status of the World’s Soil Resources Report, Regional Assessments of Soil Changes | Chapters 9 - 16
67

organically managed paddy fields in Taiwan and the Philippines, as well as upland crops in southern China. However, in soils of the semi-arid areas of northern China, the loss of microbial diversity is more severe than Japan. Here the processes/factors mentioned above (1, 6) may lead to soil drying, increases in salt concentrations and a loss of stable soil surface, potentially resulting in loss of soil organisms, although research exploring the loss of ecosystem functions and services from these soils has yet to been conducted.
10.3.7 Water logging Water logging problem occur in two facets, i.e. permanent in natural swampland and
occasional in flood prone areas along the flat coastal areas and flood plains of main rivers. Constructed wetlands such as paddy field is intentionally flooded as part of the management system. Anthropogenic activities such as poor drainage system due to construction for settlement, industrial and urban development deforestation in the upstream areas increase the threat to water logging in the flood prone areas.
In the GLASOD estimate, waterlogging affects 4.6 Mha, largely in the irrigated areas of India and Pakistan. It is closely linked with salinization. The progressive rise in the water table beneath the Indo-Gangetic plains since the commencement of large scale irrigation schemes in the 1930s has been monitored (e. g. Ahmad and Kutcher, 1992). For India, the figure given is more than twice the GLASOD estimate. For Pakistan, four sources quoted give total areas affected of 3.7, 1.6, 2.1 and 2.1 M ha, compared with the GLASOD value of 0.96 Mha. Since the Pakistan country data come from at least two independent surveys, show good agreement and are believed to result from detailed field surveys, the country estimates are preferred.
10.3.8 Nutrient imbalance Harvested crops remove nitrogen, phosphorus, and other nutrients from agricultural soils.
Hence, sustaining agricultural production requires replacing those nutrients, whether through biological processes like nitrogen fixation or through the addition of animal wastes or mineral fertilizer to fields (Vitousek et al., 2009). Balanced nutrient supply is essential for achieving high crop yields, but excessive and/or imbalanced nutrient input may pose risk on the environment, human health and ecosystems. The nutrient inputs largely varied between regions/counties due to diverse economies, which is especially true for Asia where were highly diverse.
In some countries or regions in Asia, removal of nutrients from the soil in crop harvest appears substantially to exceed inputs as natural replacement and fertilizers. For example, such negative soil nutrient balance has been reported for each of the 15 agro-climatic regions of India (Biswas and Tewatia, 1991; Tandon, 1992).
Another problem is caused by the imbalance in fertilizer application. Fertilizer use in the regions is often dominated by nitrogen (N), relative to phosphorous (P) and potassium (K). This trend originated in the early years of the 'green revolution'. When fertilizers are first applied to a soil, a high response is frequently obtained from nitrogen. The improved crop growth depletes the soil of other nutrients; "In such systems, nitrogen is simply used as a shovel to mine the soil of other nutrients" (Tandon, 1992). Long-term experiments in India show depletion of soil P and K are higher for plots with N fertilizer, and depletion of K still higher with N+P fertilizer (Tandon, 1992). In Indonesia, the use of N fertilizer in Indonesia has been continually increasing since late 1960s, and reaching 2.4 million Mg year-1 in 2012. However, the consumption of P and K has not followed the same trends as
Status of the World’s Soil Resources Report, Regional Assessments of Soil Changes | Chapters 9 - 16
68

that of N (IFADATA, 2007). This is partly due to easier access and thus cheaper N fertilizers and the rapid crop response to N fertilization. A study on nutrient balances in intensified rice field found a positive balance for N, P, Ca, Mg and Na, but negative balance for K and Si (Husnain et al., 2010).
For secondary and micronutrient, an increasing incidence of sulphur and zinc deficiency is occurring in the region. Sulphur deficiency has been reported for India, Pakistan and Sri Lanka, and zinc deficiency for India and Pakistan (FAO/RAPA, 1992). For Bangladesh, 3.9 M ha are reported deficient in sulphur and 1.75 M ha in zinc, including areas of continuous swamp rice cultivation (Bangladesh, 1992; Shaheed, 1992). Pakistan, because of its generally alkaline soils, is particularly liable to micronutrient deficiencies, which are being increasingly reported (Twyford, 1994).
On the other hand, nutrient additions to many fields in some Asian countries far exceed those in the United States and Northern Europe, and much of the excess fertilizer is lost to the environment, degrading both air and water quality. This important threat to soil is described more in detain in the section 10.4.4.
10.3.9 Compaction Slightly compacted soil condition is preferable for soil productivity by reducing soil erosion
and keeping soil structure. Highly compacted soil is, however, a physically deteriorated condition affecting to plant productivity under various land uses. Decrease in soil porosity affecting to water content, hydraulic conductivity, and gas permeability is major disadvantage brought by soil compaction. Loading of heavy equipment strongly compress surface soil and/or subsoil in cropland, grassland and timber forests.
Mechanization of cultivation and harvest in Asian countries has increased, resulting in soil erosion and soil compaction due to tractor loading (Zhang et al., 2006). Some studies in India showed that the soil compactness in sub surface soils as indicated by increased bulk density as high as 1.80 g/cm3 due to use of heavy machinery in conjunction with puddling activities, was observed in soils of rice wheat cropping areas (Sidhu et al., 2014; Singh et al., 2009; Aggarwal et al., 1995; Kukal et al., 2003). Heavy machines for harvesting and skidding logs also remarkably compress soil accompanied by rutting on the ground and organic matter removal (Kozlowski, 1999; Hattori et al., 2013). Increase in area of plantation forest in Asia, especially fast increase in China in a few decades (FAO, 2006), probably promotes heavy equipment application for management of the plantation forest, leading to compaction of soils. Livestock trampling is also a major cause of surface soil compaction in grassland and hilly region for grazing (Drewry and Paton, 2000). Soil compaction due to heavy grazing leads intense land degradation in the steppe region like in Mongolia and Inner Mongolia of China occupied by huge rangeland (Kruemmelbein et al, 2008). Water surface runoff followed by soil erosion is a fatal problem in compressed agricultural and forested areas. Soils in urban greenery area are commonly compressed by human traffic and vehicles for park management, resulting in damages of plant roots and productivity (Jim, 1998) because over 50% of root density concentrates in soil up to 50cm depth in urban park vegetation (Millward et al., 2011). Surface runoff on compacted soil generates flooding, enabling transport contaminants such as heavy metals, and persistent organic pollutants into receiving water environments.
10.3.10 Sealing and capping Sealing and capping on ground surface is mainly required in urban area to construct road and
buildings. Although the rate of the impervious surface area (ISA) covers only 0.43% of global land Status of the World’s Soil Resources Report, Regional Assessments of Soil Changes | Chapters 9 - 16
69

area (Schneider et al., 2009), ISA estimated by the nighttime satellite image data and population distribution datasets keep increasing along with increasing in urban population (Elvidge et al., 2007). More than half of global population concentrates into cities1. Asia region has the largest ISA within the global regions (Schneider et al., 2009). China has the largest ISA in Asia followed by India, Indonesia, Japan and Bangladesh (Elvidge et al., 2007). Increase in the ISA causes environmental issues, such as urban heat island (Changnon, 1992), increase in surface water runoff (Booth, 1991), and reduction of carbon sequestration due to reduction of forested area (Milesi et al., 2003). Research on sealing soils (Technosols in the WRB classification system) has not been well documented yet as compared to research on the influence of sealing on microclimate, heat balances or water flow in urban area. Inter-regional differences in properties of sealed soils are not clear, but in general, construction processes of sealing physically and chemically affect soils due to disturbance of surface and sub soil by excavation and filling, and addition of construction materials. Tremendous soils generated every year in Japan by excavation for flattening of land surface. To decrease the surplus soils, part of such soils is promoted to reuse on site or at another place. Soils sealed by constructions are compressed to enhance soil physical strength, making soils massive structure. Constructive additives such as lime to enhance sub-base strength of a road make soils alkaline (Jim, 1998). Pervious asphalt paving and inter-locking cover for light traffic road are now recommended to drain rainwater by infiltration to sub-soil. The infiltration treatment can make soil solution and drainage water alkaline. Cracks on a paved road surface due to heavy traffic enables rainwater to infiltrate into subsoil, reducing strength of the roadbed and making sub-soil alkaline.
10.4. Major threats to soils in the region
10.4.1 Erosion Soil erosion is one of the major threats of soil quality in Asia. Soil erosion is the action of
exogenic processes such as water flow and wind to get rid of soil from a location in which the soil was originally placed. The processes inducing soil erosion are various with climate. Asia can be divided into some climate zones: tropical and subtropical in South Asia, humid subtropical and temperate in East Asia, semiarid in China, and arid in Mongolia and East Asia. Most regions of Asia are affected by Asian-Australian monsoon which causes dry and wet seasons. Water erosion is the major type of erosion in regions with dry and wet season covering South Asia to East Asia. On the other hand, wind is the crucial driving force inducing soil erosion in desserts.
Soil erosion by rainfall and surface water flow is generally affected by five factors: rainfall erosivity, soil erodibility, topography, surface coverage, and support practices. In humid regions, soil erosion is little of concern for well-established forests and paddy fields while bare lands such as logged forests and construction areas and upland crop fields in slopes are exposed to high risk of soil erosion. Annual soil loss in paddy fields has been generally reported lower than 1 t ha-1 in case studies (Chen et al., 2012; Choi et al., 2012; Kim et al., 2013) while soil loss of upland crop in slope is much greater, for example, 38 Mt ha-1 without conservation practices in South Korea (Jung et al., 2005). In semiarid regions, soil erosion is also of concern especially for slope areas due to less vegetation; several hundred mm of rainfall in the rainy season induces huge gully erosion in the region. Therefore, soil erosion is regarded as the most important threat of soil in Asia, especially for poorly-covered lands and bare soil.
The main threats of soil erosion by water are found in the hilly and mountainous landscapes in Indonesia. These natural conditions, and anthropogenic influence on land cover, as well as intensive
Status of the World’s Soil Resources Report, Regional Assessments of Soil Changes | Chapters 9 - 16
70

soil management, make the steep and high density populated islands of Java, Sumatra and Sulawesi the most threatened. Approaches in coping with erosion problems ranged from engineering such as terracing, sediment pit construction and waterways improvement to vegetative measures including agroforestry approaches, contour strips and cover crops (Agus and Widianto, 2004).
The Philippines, being a monsoon country and rainfall is high, erosion by water is one of the major causes of land degradation. In the 2013 Land Degradation Assessment final report by the Bureau of Soils and Water Management, the estimated annual soil loss for the whole country based on the 2003 Land Use System Map is about 10.70 t ha-1 yr-1 with the highest estimated annual soil loss at 10.77 t ha-1 yr-1. Paningbatan (1987) estimates that soil loss of about 10 t ha-1 can be considered tolerable for Philippine condition. USDA as quoted by Schertz (1983) established in 1950s soil loss tolerance values at about 5 to 12 t ha-1 yr-1 at soil bulk density of 1,200 kg m-3. An analysis made by the Department of Environment and Natural Resources (DENR) on the state of the Philippine environment showed that, overall, 75 percent of total croplands is vulnerable to erosion of various degrees. Promotion of sustainable land management such as application of various soil conservation and management strategies in highland agriculture as well as other technologies like agroforestry and multiple-story cropping are being promoted. As a member of the UN Convention to Combat Desertification (UNCCD), the Department of Agriculture, other government agencies, the academe, and on-government organizations aggressively pursue various programs. Practically all these approaches engage the highland farmers as partners in development rather than treat them as the cause of the problem.
In South Korea, deviation of annual precipitation was 251 mm yr-1 between 1981 and 2010 and rainfall erosivity ranged from 2.264 MJ mm ha-1 yr-1 hr-1 and 6,856 MJ mm ha-1 yr-1 hr-1 in the same period (Park et al, 2011). Rainfall erosivity on national average was 4,276 mm ha-1 yr-1 with EI30 data between 1973 and 1996 (Jung et al., 2004) and was 4,147 MJ mm ha-1 yr-1 hr-1 with EI60 data between 1981 and 2010 (Park et al., 2011). The variation of rainfall is expected to increase with climate change based on RCP scenario (CCIC, 2010), which implies that a probability of the extreme rainfall erosivity would increase in future. Soil erodibility in South Korea was 0.027 Mt hr MJ-1 mm-1 and ranged from 0.001 Mt hr MJ-1 mm-1 to 0.102 Mt hr MJ-1 mm-1 with soil series. The soil erodibility of paddy fields are the greatest as 0.036 Mt hr MJ-1 mm-1 followed by those of upland crop fields (0.026 Mt hr MJ-1 mm-1) and forests (0.020 Mt hr MJ-1 mm-1) (Jung et al., 2014). Differences in soil erodibility between land use types are affected by geological characteristics. Forests are located in mountains and upland crop fields are generally placed in low slope below mountains. It means that forests and upland crop fields have been chronically exposed to overland flow and soil erosion, which resulted in the current status with less easily-eroded particles such silt and very fine sand. In the other hands, paddy fields in plain lands have been established with sediments having greater soil erodibility. Annual soil loss in paddy fields has been generally reported lower than 1 Mt ha-1 in case studies because paddy is protected from rain drop by flooded water and ridges store water inside paddy fields (Chen et al., 2012; Choi et al.; 2012, Kim et al., 2013). Soil erosion is tolerable in well-performed forests and grasslands (Kitahara et al., 2000; Lee, 1994). Soil loss in grasslands reached a half of that in bare soil in the first year when grass seeds were spread in spring, soil loss in grasslands abruptly decreased to 3% or less of that in bare soil after the second year (Jung, 1998; Jung and Oh, 1993). Soil loss of upland crop fields is, however, much greater than paddy fields and forests. National average of soil loss in upland crop fields was 38 Mt ha-1 in South Korea (Jung et al., 2005). A variety of conservation practices have been applied to reduce soil erosion including agronomic and engineering practices. In low slopes, agronomic practices such as mulching and grass strip are available to
Status of the World’s Soil Resources Report, Regional Assessments of Soil Changes | Chapters 9 - 16
71
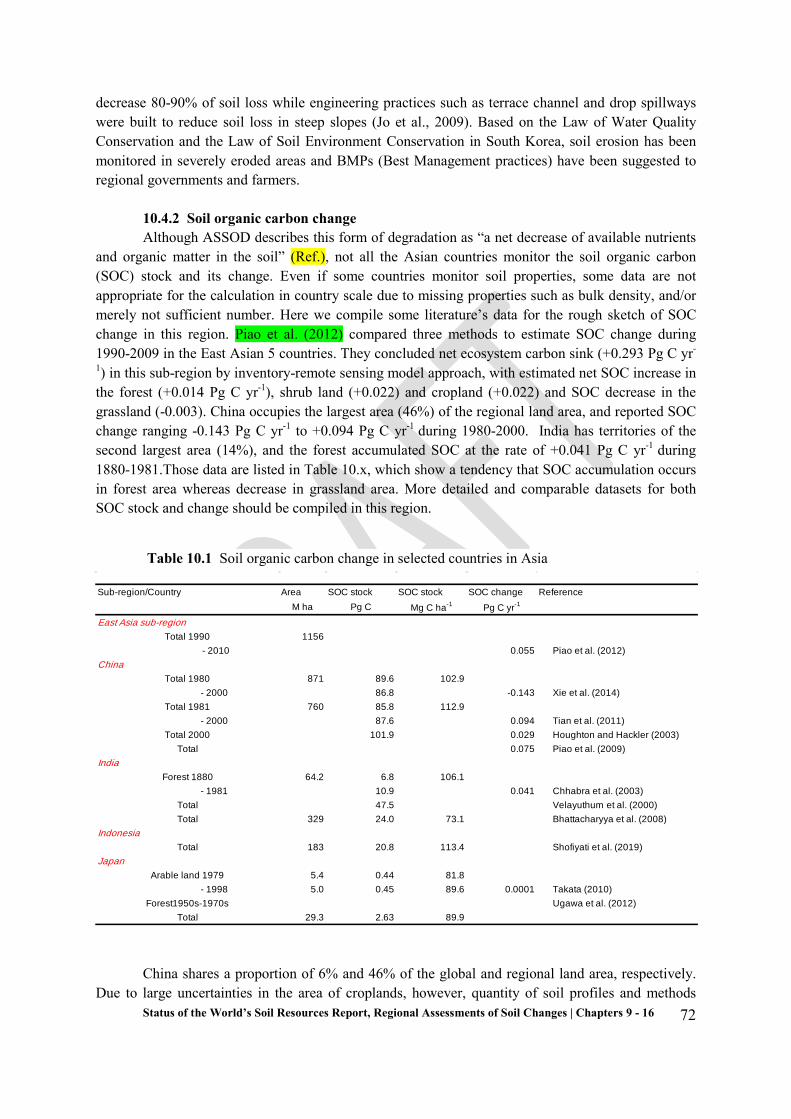
decrease 80-90% of soil loss while engineering practices such as terrace channel and drop spillways were built to reduce soil loss in steep slopes (Jo et al., 2009). Based on the Law of Water Quality Conservation and the Law of Soil Environment Conservation in South Korea, soil erosion has been monitored in severely eroded areas and BMPs (Best Management practices) have been suggested to regional governments and farmers.
10.4.2 Soil organic carbon change Although ASSOD describes this form of degradation as “a net decrease of available nutrients
and organic matter in the soil” (Ref.), not all the Asian countries monitor the soil organic carbon (SOC) stock and its change. Even if some countries monitor soil properties, some data are not appropriate for the calculation in country scale due to missing properties such as bulk density, and/or merely not sufficient number. Here we compile some literature’s data for the rough sketch of SOC change in this region. Piao et al. (2012) compared three methods to estimate SOC change during 1990-2009 in the East Asian 5 countries. They concluded net ecosystem carbon sink (+0.293 Pg C yr-
1) in this sub-region by inventory-remote sensing model approach, with estimated net SOC increase in the forest (+0.014 Pg C yr-1), shrub land (+0.022) and cropland (+0.022) and SOC decrease in the grassland (-0.003). China occupies the largest area (46%) of the regional land area, and reported SOC change ranging -0.143 Pg C yr-1 to +0.094 Pg C yr-1 during 1980-2000. India has territories of the second largest area (14%), and the forest accumulated SOC at the rate of +0.041 Pg C yr-1 during 1880-1981.Those data are listed in Table 10.x, which show a tendency that SOC accumulation occurs in forest area whereas decrease in grassland area. More detailed and comparable datasets for both SOC stock and change should be compiled in this region.
China shares a proportion of 6% and 46% of the global and regional land area, respectively. Due to large uncertainties in the area of croplands, however, quantity of soil profiles and methods
Table 10.1 Soil organic carbon change in selected countries in Asia
Sub-region/Country Area SOC stock SOC stock SOC change ReferenceM ha Pg C Mg C ha-1 Pg C yr-1
East Asia sub-regionTotal 1990 1156
- 2010 0.055 Piao et al. (2012)China
Total 1980 871 89.6 102.9 - 2000 86.8 -0.143 Xie et al. (2014)
Total 1981 760 85.8 112.9 - 2000 87.6 0.094 Tian et al. (2011)
Total 2000 101.9 0.029 Houghton and Hackler (2003)Total 0.075 Piao et al. (2009)
IndiaForest 1880 64.2 6.8 106.1
- 1981 10.9 0.041 Chhabra et al. (2003)Total 47.5 Velayuthum et al. (2000)Total 329 24.0 73.1 Bhattacharyya et al. (2008)
IndonesiaTotal 183 20.8 113.4 Shofiyati et al. (2019)
JapanArable land 1979 5.4 0.44 81.8
- 1998 5.0 0.45 89.6 0.0001 Takata (2010)Forest1950s-1970s Ugawa et al. (2012)
Total 29.3 2.63 89.9
Status of the World’s Soil Resources Report, Regional Assessments of Soil Changes | Chapters 9 - 16
72

applied for scaling up from soil profiles to a national level, estimations of SOC storage in the 0-100cm soil showed high variability, ranging from 50 to 183 Pg (Xie et al., 2014). Using data from the Second National Soil Survey in 1980s, Xie et al. (2014) have estimated that the SOC stocks in the paddy (29.87 Mha), upland (125.89 Mha), forest (249.32 Mha) and grassland soils (278.51 Mha) were 2.91, 10.07, 34.23, and 37.71Pg C, respectively. Farmland and forests possessed respective SOC sequestration rate of 23.62 and 11.72 Tg C yr-1, respectively, resulting in 0.472 and 0.234 Pg SOC, respectively, being accumulated in these soils during the period 1980 to 2000. However, degradations of grassland have depleted 3.56 Pg C over this period. An amount of 2.86 Pg C was therefore lost, roughly accounting for 3.4% of the total SOC storage in China.
With an artificial neural network model to link SOC change to six parameters, i.e. latitude, longitude, elevation, soil and land use type, original SOC in early 1980s, Yu et al. (2009) estimated an increase of 260 Tg C occurred in Chinese cropland in the period 1980 to 2000 in the top soils (0-20 cm). The increase of SOC content is mainly attributed to the largely increase in crop yields and the increased residues retained in fields. SOC storage in grassland is experiencing depletion especially in the Northwest and Southwest part of China, mainly due to the degradation of grassland. Nationally, an area of 5.29 M ha grassland had degraded during the period from 1986 to 1999. (Han and Gao, 2005). Unlike grassland ecosystem, SOC storage in forestland has been estimated to accumulate atmospheric carbon dioxide (CO2). Holding an area of 249.32 M ha, the national forestland had accumulated 234 to 304 Tg SOC in the period of 1980 to 2000, mainly attributed to forest expansion and regrowth (Zhou et al., 2006; Xie et al., 2007).
On the contrary to the above analysis, some literatures report recent Chinese soils as a carbon sink. Tian et al. (2011) estimated SOC change using two process-based terrestrial ecosystem models with considering factors including climate change and land use change etc. They concluded that biomass and soils in China accumulated organic carbon at a rate of 0.121 and 0.094 Pg C yr-1 during 1981-2000, respectively. Piao et al. (2009) adopted bottom-up approach and showed consistent results (0.105 and 0.075 Pg C yr-1, respectively) in the same period, while Houghton and Hackler (2003) reported net C loss from Chinese ecosystems (-0.008 PgC yr-1) in 1990s, including loss in biomass (-0.028 Pg C yr-1) and net C sink in soils (0.029 Pg C yr-1).
Velayuthum et al. (2000) have estimated soil organic C stock in different soil orders and different agro-ecological regions in India (Sehgal et al., 1992). For top 1 m depth they have estimated soil organic C stock as 47.5 PgC, which is double the previous estimates of Dadhwal and Nayak (1993) and Gupta and Rao (1994). Crop residues are widely used as fuel and fodder, and not returned to the soil. This results in a decrease in soil organic master content. In Bangladesh, the average organic master (presumably of topsoils) is said to have declined by 50%, from 2% to 1 %, over the past 20 years (Bangladesh, 1992). For the Indian State of Haryana, soil test reports over 15 years show a decrease in soil carbon (Chaudhary and Aneja, 1991). Decreased organic master leads to: degradation of soil physical properties, including water holding capacity, as has developed in India (Indian Council of Agricultural Research, personal communication); reduced nutrient retention capacity; longer release of nutrients, including micronutrients, from mineralization of organic master. As a consequence of all these effects, there may be longer response to fertilizer.
The threat to soil organic carbon (SOC) change in Indonesia’s mineral and peat soils is mainly caused by either one or combination of these three anthropogenic activities i.e. deforestation, poor land management, and intensive cropping (Hartanto et al., 2003; Lal, 2004). In lowland rice with
Status of the World’s Soil Resources Report, Regional Assessments of Soil Changes | Chapters 9 - 16
73
mineral soils SOC tend to be maintained or increased because of anoxic condition (Kyuma, 2004). Land use types greatly influence soil loss. Annual crop based systems associates with high erosion with the absence of soil conservation measures (Valentin et al., 2008). For peatland the threat on SOC occurs when peat forest is cleared and drained (Page et al., 2011). The change from saturated to unsaturated conditions which lead to the enhancement of aerobic microbial activities are the main factor of SOM loss through microbial decomposition (Hooijer et al., 2014; Agus and Subiksa, 2008). Peat fire is another cause of SOC loss. Maintaining high water table is the key to reducing SOC losses through both pathways. More details on the loss of soil carbon in Indonesia is described in the country case study section at 10.5 (2).
Permanent meadows and pastures area occupied 73% of land area of Mongolia, while forest and arable land area accounted for 7% and 0.4%, respectively (FAOSTAT, 2012). In contrast to China, due to the decrease in forest area (loss of 8.19×10² km2 yr-1) during 1990s and 2000s, forest biomass in Mongolia has decreased at a rate of 0.004 PgC yr−1 (Piao et al., 2009). Li et al. (2005) reported net ecosystem exchange in a Mongolian steppe under grazing using the eddy covariance technique and suggested the steppe was almost carbon neutral.
Forest area occupied 69% of land area of Japan, while arable land and permanent meadows and pastures area accounted for 12% and 2%, respectively (FAOSTAT, 2012). Total SOC stock in forest area was estimated separately by Morisada et al. (2004) and Ugawa et al. (2012) using bottom-up approach with different data set. The former used 3,391 soil profile data sampled from 1950s to 1970s and calculated weighed average SOC stock as 90 Mg C ha-1 (0-30cm) and 188 Mg C ha-1 (0-100cm). The latter compiled 4 km mesh (c.a. 3,000 profiles) data sampled from 1999 to 2003 and estimated average SOC stock as 69.4 Mg C ha-1 (0-30cm). Since Japanese forest area have not been changed or even increased during recent 40 years, the difference of SOC value would be attributed to the difference of methodology of sampling. Assuming the average SOC stock represented the total forest area (25.0×10⁶ ha), total SOC stock in forest area would be in the range of 1.7 to 2.2 Pg C. Takata (2010) compiled soil survey data (1979-1998) to calculate SOC stock in Japanese arable soils, and reported that 0.44 Pg C in 1979 increased very slightly to 0.45 Pg C mainly due to increase of both area and stock per unit area in grassland.
10.4.3 Soil salinization and sodification The threat of salinisation/sodification in Asia region is various. In semiarid and arid zones of
central and west Asia, salt-affected soils are widely distributed. On the other hand, salt-affected soils are developed in certain coastal area in monsoon zones, mainly by salt water intrusion in South and Southeast Asia and by coastal tideland reclamation. Although these coastal areas affected is relatively small, but it become a serious problem for lowland rice production.
In the GLASOD estimate, the region is estimated to have 42 Mha affected by salinization, nearly all in the dry zone. There are approximately 4 M ha in both India and Pakistan. In relation to irrigated land, the percentage affected appears as 10% for India, 23% for Pakistan and 9% for Sri Lanka, although these values should be reduced since some of the salinization results from saline intrusion into unirrigated land. The values for strong salinization are important, for this by definition refers to land abandoned from cultivation. The absence of strong salinization from areas of Pakistan under similar irrigation and land management systems to those of India suggests a reporting bias. Country estimates show wide ranges of values. It should be noted that some of these include naturally occurring saline soils. For India all are higher than the GLASOD value of 4 Mha, ranging between 7
Status of the World’s Soil Resources Report, Regional Assessments of Soil Changes | Chapters 9 - 16
74

and 26 Mha. For Pakistan, there is better agreement; leaving aside three estimates of 9-16 Mha, the GLASOD and six country estimates lie in the range 4-8 Mha. Two apparently independent surveys, by the Soil Survey of Pakistan and the Water and Power Development Authority, show relative agreement at 5.3 and 4.2 Mha, respectively.
In Bangladesh, an extension inland of coastal soil salinity has been noted in recent years, where the reduced river flows, consequent upon irrigation, is not sufficient to dilute and displace sea water. In Sri Lanka, small areas of light salinization have appeared on irrigated lands of the Mahaweli scheme; the problem has not yet reached serious proportions, but should be monitored.
Estimates of the extent of saline soils need to be associated with the dates of survey. Through successful reclamation, the extent of saline soils has been reduced in some areas, particularly as a consequence of the series of Salinity Control and Reclamation Projects (SCARP) in Pakistan. For example in the Pakistan Punjab the area of waterlogged and saline soils, which had risen from 61 000 ha in 1960 to 68 000 in 1966, had been reduced to 23 000 ha by 1985 (Chopra, 1989).
Tideland reclamation projects have been carried out for several centuries in the western coast of Korea. Tideland reclamation in Korea began at the Ganghwa island in Gyeonggi-Do in 1235 (the 22nd year of King Gojong, Goryeo Dynasty). The reclamation at this age was on a small scale, and gradually enlarged. However, the modern reclamation projects were restarted in 1960's along with the national development program. During the recent decades, more than 20,000 hectares of farmland has been converted yearly into industrial estate or other purposes. Therefore, as compensation, tideland reclamation projects have been continued. Since 1945, 75,738 ha of tideland have been reclaimed in 185 project areas by the Korean government and private companies for the development of paddy fields (Park, 2001).
The main constraints of the new land reclaimed from the tideland for crop production are soil salinity, a high water table with poor drainage, and an unfavorable soil chemical composition. Resalinization of the surface soil caused by evapotranspiration during the dry season makes the problem worse for upland crops to be cultivated on the newly reclaimed lands, since this hydrological process is accompanied by capillary rise of saline water form ground water resources. However, such high soil salinity condition in reclaimed tidelands can be suitably managed by controlling the amount and quality of irrigation water (Jung et al., 2002). Soil characteristics in a reclaimed land changes continuously as desalinazation progressed. The changes in soil salinity is one of the major constrains in agricultural use of the reclaimed land. New reclaimed saline soils have poor chemical properties and physical soil characteristics of soil thickness, soil structure and water logging. So it is difficult to grow many cultivated crops economically (Park, 1991).
10.4.4 Nitrogen imbalance Balanced nutrient supply is essential for achieving high crop yields, but excessive and/or
imbalanced nutrient input may pose risk on the environment, human health and ecosystems. Nutrient losses could be via emission to the air and discharge to the water through runoff, leaching and erosion. The nutrient inputs largely varied between regions/counties due to diverse economies, which is especially true for Asia where were highly diverse. FAO has predicted that 60% of the world population increase will be in Asia in the coming 4 decades (FAO, 2014), hence feeding the increasing population with less environmental pollution is of great importance for Asia and for the
Status of the World’s Soil Resources Report, Regional Assessments of Soil Changes | Chapters 9 - 16
75
world as well. Innovations, in both science and farming practice, are urgently needed to achieve this goal.
Nutrient cycles link agricultural systems to their societies and surroundings. Above all, inputs of nitrogen in particular are essential for high crop yields, as well as those of phosphorous, but downstream and downwind losses of these same nutrients diminish environmental quality and human well-being (Vitousek et al., 2009). In this section, the issues of nitrogen imbalances in agriculture of Asia are highlighted as an important threat to soil.
The nutrient balances differed among Asian countries and were substantially related to the economic development (Vitousek et al., 2009). In this study, among 6 countries representing developing (China and India), developed (Japan and South Korea) and least developed countries (Laos and North Korea). China has the highest input (505 kg N ha-1 of arable land), which is nearly 10 times of that in Laos (59 kg N ha-1). On the other hand, the mean N output was 108 kg N ha-1 in China, while halved (44 kg N ha-1) in North Korea. The N input was dominated by fertilizer application, especially for booming economies as China and India, where the fertilizer N inputs accounted for 76% and 62%, respectively, of the total N inputs. In the least developed countries, such as Laos and North Korea, the N input mainly consists of animal manure, crop straw and biological N fixation. For developed countries, such as Japan and South Korea, the N inputs were more evenly contributed by fertilizer and manure. However, because of relatively high N input, higher N losses were observed in China, Japan and South Korea, compared with the least developed countries. The nitrogen use efficiency (NUE) was relatively high in Laos and North Korea, on the expense of depleting the soil N. The average soil N depleted rate was ranging from 10-30 kg N ha-1 yr-1 in Laos and North Korea, while the soil N accumulated in China by 26 kg N ha-1 yr-1.
In the least developed countries, manures were considered as precious nutrient resource for crop production. This was also the case in China before 1980s, when artificial fertilizer was not subsidized. After 1980s fertilizer was more widely used than manure in China. The amount of fertilizer application rate in China was far exceeding those countries in the Asia, and even in USA and EU (Ju et al., 2010; Vitousek et al., 2009). In China, more than 50% of the manure were discharged to the water body without treatment, due to lack of strict regulations in 2005 (Ma et al., 2010), In contrast, the environment was highly protected in Japan, more than 80% of the manure was treated and then applied to the crop land (Mishima, 2011). The N inputs and outputs also showed large variations between different crops. The higher nutrient inputs and accumulation in cash crop production were observed in China (Yan et al., 2013). Both of the livestock and cash crop production are expected to increase extensively in the near future, as well as the increase of urbanization rate and human population in Asia (FAO, 2014). This may enhance the variation of the N inputs and outputs in Asia in the future.
The N surplus and depletion varied among Asian countries, ranging from -37 kg N ha-1 yr-1 in Nepal to 76 kg N ha-1 yr-1 in United Arab (Fig. 10.3) and 7 out the 43 countries in Asia were confronted with the N depletions, which also resulted in low crop yields. The high inputs of the nutrients in United Arab ensured the booming development of cereals and cash crop production, which increased hundreds of times in the past 50 years (FAO, 2014).
The NUE were defined by the N output as crop production divided by the “N inputs” that are added through fertilizer, biological N fixation and N deposition (Ma et al., 2010). The average NUE
Status of the World’s Soil Resources Report, Regional Assessments of Soil Changes | Chapters 9 - 16
76

decreased from 131% in Laos to 19% in United Arab. The NUE was more than 100% in Laos, Nepal and Myanmar, because these countries highly relied on the recycle N inputs, such as manure and crop straw. The NUE showed a reverse trend of N surplus among countries, which decreased from high N depletion countries, such as Nepal, Laos, to the high N surplus countries, such as United Arab and China. None of these crop production systems were sustainable in high N depletion or surplus countries. Though the lower N losses and higher NUE were observed in the least developed countries, the continuous N depletion will limit the high crop yields, which may worsen the food security problems in these countries. High amount of N accumulation may lead to the higher N losses, which results in serious environment problems (Guo et al., 2009; Liu et al., 2013).
The average N losses varied among regions from 23 kg N ha-1 yr-1 in Afghanistan to 327 kg N ha-1 yr-1 in China (Fig. 10.5). This was due to the differences in N input rate, the crop production structure and the area of arable land. Large area of arable land are not be utilized in Afghanistan, Iraq, Mongolia and Syria, due to various reasons. The contribution of the different N loss pathways differed among countries, for example, ammonia emission contributed to 50% of the N losses in Philippines, but only 22% of the N losses in Laos.
In conclusion, the N inputs and outputs are highly diverse between countries in Asia, mainly impacted by development of their economies and polices. The nutrient imbalance in Asia could have much impact on crop production and environmental protection. These impacts may be enlarged in the near future as the rapid development of livestock and cash crop production. Both of the N imbalance and the N losses can be improved greatly, without sacrificing the crop yield, such as balanced N fertilizer application and maximum manure N application standard which already proved be effective in EU (Velthof et al., 2009). The recent studies showed that the crop yield can be increased by 20-30% in China without increasing input of fertilizer, through the ISSM technologies (Chen et al., 2014). However, in the least developed countries, more efforts would be desirable to produce more fertilizer, to ensure the high crop yields, as happened in China during the past 30 years. For the developed countries, the mixed crop and livestock production systems could be the best choice to mitigate the nutrient losses.
0 50 100 150
r
Nitrogen use efficiency %
-50 0 50 100Afghanistan
ArmeniaAzerbaijan
BangladeshCambodia
ChinaNorth Korea
GeorgiaIndia
IndonesiaIranIraq
IsraelJapan
JordanKazakhstanKyrgyzstan
LaosLebanonMongoliaMyanmar
NepalPalestinian
PakistanPhilippines
South KoreaSaudi Arabia
Sri LankaSyrian
TajikistanThailand
Timor-LesteTurkey
TurkmenistanUnited ArabUzbekistan
Viet Nam
Nitrogen surplus or depletion (kg N/ha)
Figure 10.3 Nitrogen surplus or depletion, and nutrient use efficiency in crop production in Asia in 2010
Status of the World’s Soil Resources Report, Regional Assessments of Soil Changes | Chapters 9 - 16
77

10.5. Case studies
10.5.1 Case study for India India is situated between 08°04' and 37°06' N latitude and 68°07' and 97°25' E longitude.
Total geographical area of India is 328.2 M ha out of which 141 M ha is under cultivation. The country is surrounded by Arabian Sea in the west, Bay of Bengal in the east and the Himalayas in the north. It stretches from 3,214 km north to south and 2,933 km east to west. Physiographically, India is divided into four broad physiographic divisions: (i) Himalayan Range (Northern Mountains); (ii) Hill regions, Indian Peninsula and Eastern plateau; (iii) The great Indo-Gangetic plains and Coastal plains; and (iv) the Islands (Singh, 1971). India is endowed with diversified climates having three distinct main seasons (rainy, winter and summer). The country is influenced by monsoonal type climate and rainfall. Annual rainfall varies from less 100 mm in cold desert area of Jammu & Kashmir and Lahaul Spiti areas to 100 mm in Thar Desert of Rajasthan to over 11,000 mm in Cherrapunji in Meghalaya. Mean annual temperature in the country varies from 8 to 28°C. Variation in the mean summer and mean winter temperature in the northern region is <10°C and in the south, it is <5°C. In all, 20 Agro-ecological Regions (AERs) have been identified and are subdivided into 60 Agro-Ecological Sub-Regions. Inceptisols are the dominant soils covering 39.75% of TGA, followed by Entisols (28.08%), Alfisols (13.55%), Vertisols (8.52%), Aridisols (4.28%), Ultisols (2.51%) and Mollisols (0.4%) and others (2.92%) (Bhattacharyya et al., 2013).
Degraded and Wastelands of India: Velayutham and Bhattacharyya (2000) reported that total area under soil degradation in India is 45.9%, out of which 37.0% area is affected by water erosion, followed by wind erosion (4.0%), salinization (2.2%), loss of nutrients (1.1%) and waterlogged (1.6%). Land not fit for agriculture (ice-caps, salt-flats, arid mountain and rock outcrops) constitute 5.5%. About 27.5% soils have no degradation problem and remaining 9.8% area is under stable terrain, i.e. natural conditions. Recently the NAAS reconciled the soil degradation status of the country based on reconciliation of database gathered from different organizations (Fig. 10.4). Soil erosion by water is one of the most serious degradation in the Indian context affecting 82.57% area of TGA, followed by wind erosion (12.40%), acidic soils (17.94%), salt-affected soils (6.74%), waterlogged soils (0.88%) and mining and industrial waste (0.19%).
Status of the World’s Soil Resources Report, Regional Assessments of Soil Changes | Chapters 9 - 16
78

Figure 10.4 Soil degradation types in India
Table 10.2 Harmonized area statistics of degraded and wastelands of India
Degradation type Arable land (M ha)
Open forest (<40% canopy) (M ha)
Data source
Erosion Water erosion (>10 tonnes/ha/yr)
73.27 9.30 Soil Loss Map of India–CSWCR&TI
Wind erosion (Aeolian)
12.40 – Wind Erosion Map of India–CAZRI
Sub-total 85.67 9.30 Chemical degradation Exclusively salt- affected soils#
5.44 Salt-Affected Soils Map of India, CSSRI, NBSS&LUP, NRSA and others
Sal t-affected and water eroded soils
1.20 0.10 Acid Soil Map of India NBSS&LUP Acidic (pH < 5.5) and water
Exclusively acidic soils (pH< 5.5)#
5.09 -
Acidic soils (pH< 5.5) and eroded soils
5.72 7.13
Sub-total 17.45 7.23 Physical degradation Mining and 0.19 Wasteland Map of India–NRSA
Status of the World’s Soil Resources Report, Regional Assessments of Soil Changes | Chapters 9 - 16
79

industrial waste Waterlogging (permanent Surface inundation) $
0.88
Sub total 1.07 Total 104.19 16.53 Grand total (Arable land and open forest)
120.72
Notes: Forest Survey of India Map (1999) was used to exclude degraded land under dense forest; Unculturable Wastelands: Barren rock y/stony waste: 6 M ha, are the source for runoff water and building material; Snow covered/Ice-caps: 6 M ha, are best source of water and are not treated as wastelands
#For acid soils, areas under paddy growing and plantation crops were also included in the total acid soils
$Sub-surface waterlogging not considered. Source: NBSS&LUP
10.5.2 Case study for Indonesia The topography, climate, soil parent materials and anthropogenic factors determine the
various types and degree of soil threats in Indonesia. These threats include soil carbon depletion both for mineral and organic soils, erosion by water, soil contamination, soil acidification and nutrient imbalance. Among them, soil organic carbon depletion in peat is the major one.
Soil erosion threats are found in almost all hilly and mountainous landscapes of Indonesian archipelago due to very high (>2000 mm) annual rainfalls in 83% land area of Indonesian archipelago. Most of other sloping areas with lower rainfall are also affected by erosion due to high intensity monsoonal rainfall during the rainy season (Agus et al., 2002). Besides being prone to erosion, the high rainfall also leads to leaching of basic cations and hence soil acidification. The main problems associated with managing acid soil are low pH, P-fixation, low basic cation concentration, low cation exchange capacity (CEC) and toxicity of soluble Al and Fe.
The total area of Indonesian acid upland soils (pH <5 and <50% base saturation) is about 102.8 million ha (Puslitbangtanak, 2000). Relatively low cost technologies are widely available for rectifying soil acidity problems, and these include liming, organic matter application, balance fertilization and selection of acid tolerant crops (Kamprath, 1984; Von Uexküll and Mutert, 1995). Nutrient imbalance is related to insufficient and imbalance fertilizer uses (Tan et al., 2005). For various systems the use of nitrogen fertilizer in Indonesia has been continually increasing since the late 1960s, and reaching 2.4 million Mg year-1 in 2012, but the consumption of P and K has not followed the same trends (IFADATA, 2007) due to easier access, cheaper and rapid crop response to the former. For intensive vegetable crops, over fertilization has led to accumulation of N, P, Ca, Mg and Na, but negative balance of K and Si (Husnain et al., 2010; Widowati et al., 2011). K deficiency was also reported in newly developed rice field (Sukristiyonubowo et al., 2012). For low input systems, however, nutrients removal through harvest is seldom sufficiently replenished by proper fertilization.
Soil organic carbon depletion
Status of the World’s Soil Resources Report, Regional Assessments of Soil Changes | Chapters 9 - 16
80
Depletion of soil organic carbon (SOC) is considered as one of the major threats as, under extreme cases; it is related to soil physical, chemical and biological degradation. The rate of SOC depletion in mineral soils is relatively small. In peat soils, organic C is the main soil constituent and the rate of depletion is high for drained organic soils (IPCC 2014; Agus et al., 2011).
The loss of carbon from mineral soil
Research finding varies on the trend of soil organic matter depletion (Agus et al., 2013). Murty et al. (2002) suggested that SOC stock decreased by about 30% when forest is converted to continue agricultural production. Forest that transforms to degraded land would lose 50% of its C stock, but when forest is converted to plantation it will lose about 30% of C stock. Likewise, SOC stocks in the 0–15 cm of Dipterocarp forest in Sumatra decreased by 48.1 Mg ha-1 when this forest is degraded to Imperata grassland. However, Imperata grasslands do not necessarily associated with low SOC. In some cases, this grassland may have similar C content as forests (Santoso et al., 1997). For Sumatra, van Noordwijk et al. (1997) found some decrease in SOC when forest is converted to cropland. Tanaka et al. (2009), on the other hand, did not observe significant difference in SOC between secondary forests, 9 and 19 year old oil palm plantations and a 30 yr old rubber plantation.
Management systems can restore SOC. Intensive organic matter management increased 32% and 15% SOC in the 0-45 cm soil layer, in the first and second cycles of oil palm, relative to secondary forest as the initial land use (Mathews et al., 2010). Regular application of palm fronds increased SOC, especially in the 20% part of plantation area receiving an equivalent of 4.8 Mg C ha-1 yr-1 from palm fronds (Haron et al., 1998). If degraded land is converted to plantation, it will gain about 30% SOC stock (Murty et al., 2002; Germer and Sauerborn, 2008). In East Kalimantan, natural regeneration from Imperata grassland to secondary forest increased 14% soil carbon content from14.5 g kg-1 to 16.5 g kg-1 (van der Kamp et al., 2009). In Java, agricultural top soil with continuous rice cropping accumulated more than 1.7 Tg C per year over the period of 1990-2000 (Minasny et al., 2012). Kyuma (2004) also suggested that SOC in newly established paddy rice soils tend to increase with time. Strategies to increase the soil carbon pool include soil restoration and woodland regeneration, no-till farming, cover crops, nutrient management, manuring and sludge application, improved grazing, water conservation and harvesting and efficient irrigation (Lal, 2003).
The loss of carbon from organic soils
Indonesian peatland area is estimated to be about 14.9 million ha (Ritung et al., 2011) storing around 27 Pg C (Agus et al., 2013). This huge C store is formed under saturated condition in concave areas with the rate of peat formation in the range of 0-3 mm thickness (Noor, 2001) or equivalent to zero to about 1.5 Mg C ha yr-1 carbon accumulation (Agus and Subiksa, 2008; Parish et al., 2007). This relatively slow process has led to peat domes formation that takes place between 6800 to 4200 years (Andriesse, 1994). In some cases the formation may even reach 26000 years (Page et al., 2002).
Carbon stock in peat ranges from 420 to 820 Mg C ha-1. Peat depth ranges from 0.5 to more than 10 m (Agus et al., 2011) and the peat C stock is strongly determined by peat thickness (Warren et al., 2012). Under saturated natural condition, low rates of the peat C is emitted in the forms of CO2 and CH4 due to anaerobic microbial activities. As peat forest is cleared and drained, the peat become unsaturated and CO2 emission escalates at the rate far exceeding the sequestration. Currently, from the 14.9 Mha peatland area, forested areas amounted 52%, shrub is about 21.7% and the rest are
Status of the World’s Soil Resources Report, Regional Assessments of Soil Changes | Chapters 9 - 16
81

agriculture and settlement areas. The threat to peat soil C loss is parallel with the level of development. Peatland area of Sumatra and Kalimantan has been mostly affected by drainage and thus losing carbon. On the other hand, Papua peatland are mostly conserved (Figure 10.5).
At the same time CH4 emission become almost undetectable. The major processes of carbon loss from drained peatland are (i) peat decomposition under aerobic condition and (ii) peat fire. Natural phenomena such as long drought aggravate peat fire risks (Page et al., 2002; IPCC, 2014; Parish et al., 2007; Agus and Subiksa, 2008; Wӧsten et al., 2008).
Literature varies in the estimate of peat carbon loss through decomposition. IPCC (2014) based on research data from Malaysia and Indonesia presented the peat CO2-C emission factors based on land cover classes. Degraded forest is expected to emit as much as 5.3 Mg CO2-C ha-1 yr-1. Various agricultural and forestry uses emits a wide range of CO2-C as shown in Table 10. 3. The 95% confidential interval was very wide for each land cover class suggesting the need for site specific emission factors. For a case study in Riau Province, Husnain et al. (2014) showed insignificant difference in peat emissions under an oil palm plantation, an Acacia plantation, a secondary forest and a rubber plantation. They were 18.0 ± 6.8; 16.1 ± 5.3; 16.6 ± 6.8; 14.2 ± 4.6 Mg CO2-C ha-1 yr-1, respectively. For bare land sites it was between 15.2 ± 8.2 and 18.2 ± 6.5 Mg CO2-C ha-1 yr-1. Similar with that of IPCC (2014), Marwanto and Agus (2014) and Dariah et al. (2014) found emission from oil palm plantation to be about 10 to 11 Mg CO2-C ha-1 yr-1.
A study in Central Kalimantan Province revealed a linear relationship between average water table depth and peat CO2 emission where the degraded drained forest emit about 2.7 Mg CO2-C ha-1 yr-1 in area with zero mean water table depth and about 15 Mg CO2-C ha-1 yr-1 for the area where average water table depth is 1 m (Hooijer et al., 2014). Regardless of the variation, these values explain the rapid carbon depletion in drained peatland.
Peat fire is another important process that may cause a huge amount of carbon loss in short period of time. Literature is in agreement of the importance of peat fire as one of the main cause of peat carbon loss (Page et al., 2002; Hooijer et al., 2014). However, determination of peat C loss through peat fire is a future research challenge, especially with regards to the activity data determination, i.e. the volume (area and depth) of burnt scars (IPCC, 2014).
Table 10.3 Emission factors of drained tropical peatland under different land uses and the 95% confidential interval (IPCC, 2014)
Land cover type1) Emission
(Mg CO2-C ha-1 yr-1)
95% Confidence level2)
(Mg CO2-C ha-1 yr-1)
Drained forest land and cleared forest land (shrubland)
5.3 -0.7 9.5
Plantations, drained, unknown or long rotations
15 10 21
Plantations, drained, short rotations, e.g. acacia
20 16 24
Status of the World’s Soil Resources Report, Regional Assessments of Soil Changes | Chapters 9 - 16
82

Plantations, drained, oil palm 11 5.6 17
Plantations, shallow-drained (typically less than 0.3 m), typically used for agriculture, e.g. sago palm
1.5 -2.3 5.4
Cropland and fallow, drained 14 6.6 26
Cropland, drained, paddy rice 9.4 -0.2 20
Grassland, drained 9.6 4.5 17
1)Emission of primary peat forest is assumed zero. 2)Some confidence intervals contain negative values because calculation was based on error propagation of uncertainties. However, all underlying CO2 fluxes were positive.
10.5.3 Case study for Japan The Japan islands are located in the one of the most active parts of the Circum-Pacific Ring of
Fire. The major islands are Hokkaido, Honshu, Shikoku, and Kyushu. There are 110 active volcanos in Japan (16 volcanos in Hokkaido, 38 volcanos in Honshu, 11 volcanos in Kyushu). Large quantities of tephras from volcanoes have been deposited on the Pleistocene terraces, and it is a main parent material of Japanese soil (Andosols). Japan’s total land area is about 378,000 km2. About 72% of the Japan’s land area is mountainous, and rivers are characterized by their steep gradients and relatively short lengths. About two-thirds of the total land area consists of forest area. The plains cover only about 28% of the total land area. Most plains are located along the seacoast. Arable lands accounted
Figure 10.5 Indonesian peatland map overlaid with land cover map as of 2011 (http://www.ukp.go.id/informasi-publik/cat_view/20-geospasial)
Status of the World’s Soil Resources Report, Regional Assessments of Soil Changes | Chapters 9 - 16
83

for 12.1% of the total land surface and it mainly distributed in the plains. The climate of Japan is influenced by a monsoonal flow that carries moist air from the Indian Ocean and Pacific Ocean. In general, Japan has four distinct seasons that is spring (Mar. to May), summer (Jun. to Aug.), autumn (Sep. to Nov.) and winter (Dec. to Feb.).
Japanese arable land was extended to 4.5 million hectares in 2014, paddy field accounted for 54% of total arable land. Gray lowland soils (Fluvic Hydragric Anthrosols or Gleyic Fluvisols (IUSS-ISRIC-FAO 2006)) was the largest cultivated soil area in Japanese arable land, and followed by Gley soils (Gleyic Fluvisols), Andosols (Aluandic or Silandic Andosols), Brown forest soils (Haplic Cambisols), Brown lowland soils (Haplic Fluvisols), and Wet Andosols (Gleyic Andosols). Urban sprawl and other changes in land use (including abandonment of cultivation) had caused a loss of agricultural land area by about one million hectares from 1973 to 2001. The urbanization (sealing) was advanced at flat lowland area (paddy fields) where distributed Gray Lowlands soils and Gley soils at this period. Additionally, declines in the Andosols with expanding urbanization were observed widely over the flat upland fields in middle part of Hunshu islands. On the contrary, upland fields sited at steep slope in western part of Japan, where distributed Brown Forest Soils, were mainly changed to abandoned fields (Takata et al., 2011).
Soil organic carbon change
Spatio-temporal variation of soil organic carbon (SOC) content in arable land were evaluated by model based (Yagasaki and Shirato, 2014) and monitoring based (Takata et al., 2010) approach. In the model based approach, SOC stock change was simulated using the original Rothamsted Carbon model (Coleman and Jenkinson, 1999) and two modified Rothamsted Carbon model (Shirato et al., 2011; Takata et al., 2011). The rate of changes in the total SOC stock in Japanese agricultural lands evaluated with 10 year intervals were estimated to be -0.95 Tg C yr-1 during 1980 and 1990. A greater loss of SOC, equal to -1.06 Tg C yr−1, was found subsequently from 1990 to 2000.
Agricultural soil monitoring project named “Basic Soil-Environmental monitoring” in Japan has been conducted since 1979. This soil monitoring project has repeated 5-year interval on about 20,000 fixed points. The rate of changes in the total SOC stock, which evaluated by monitoring method, was 2.3 Tg C yr-1 from 1979 to 1989. Monitoring approach indicated that SOC was increased in arable land. However, monitoring method was also detected a greater loss of SOC, and it equal to -2.3 Tg C yr−1, was found from 1989 to 1998. During 1989 and 1998, agricultural land area was decreased from 5.4 to 5.0 million hectares. At the same time, soil carbon content in arable land was gradually increased from 88 to 90 t C ha-1 from 1989 to 1998. These results indicated that a decline of SOC stock in Japanese arable land was mainly influenced by the fluctuation of arable land area.
Spatial variation of SOC content in forest soil has been monitored since 2005. The mean SOC content of forest soil at 0-30cm was 69.4 t C ha-1 (Ugawa et al., 2012), and it was lower than the value of 90 t C ha-1 in arable land.
Heavy metal contamination
Rapid industrialization during the 1960s in Japan polluted arable soil by heavy metals such as cadmium (Cd), Copper (Cu), and Arsenic (As). There were four main pollution sources of heavy metals for arable land that are mining activity, factories and incinerators, fertilizer, and precipitation
Status of the World’s Soil Resources Report, Regional Assessments of Soil Changes | Chapters 9 - 16
84

and irrigation water (Makino et al., 2010). Japanese government enacted the Agricultural Land Soil Pollution Prevention Law in 1970 to regulate heavy metal pollution. The Agricultural Land Soil Pollution Prevention Law designated Cd, As, and Cu as hazardous substances to be regulated. The allowable limitation of Cd was set in terms of the Cd concentration in rice grains (1 mg kg-1). The allowable limitation of As and Cu were set to 15 (1M HCl soluble) and 125 (0.1M HCl soluble) mg kg soil -1, respectively. The amount of bioavailable Cd in soil is affected by many factors, so setting an allowable concentration in terms of the soil Cd content is impractical (Asami, 1981). The polluted arable land had been extended to 7,592 ha (Cd; 7,050 ha, Cu; 1,405 ha, As; 391 ha). About 92 % of the total polluted area had been remediated by uncontaminated soil dressing (MOE, 2014).
Radioactive Cs contamination
As a result of the accident at the Fukushima Dai-ichi Nuclear Power Station (FDNPS) operated by the Tokyo Electric Power Company, radioactive cesium (Cs) was released into the surrounding environment. To determine the extent of decontamination required in arable land and to consider management options, Ministry of Agriculture, Forestry and Fishery (MAFF) surveyed and measured soil Cs concentrations in 3461 agricultural fields, and used these data to construct a distribution map of radioactive Cs concentration in agricultural soil in eastern Japan (Takata et al., 2014). The distribution map of radioactive Cs concentration in agricultural soil is shown in Fig. 10.6. Contamination level 4 (>25,000 Bq kg-1) was observed in only a 20 km evacuation area surrounding FDNPS (EA-20km) and the deliberate evacuation area (DEA); 77% of the level 4 areas were observed in the EA-20km. Farmers of level 4 contaminated fields were advised to solidify their topsoil with a fixation agent to prevent scattering of contaminated soil in a topsoil removal operation. Contamination level 3 (10,000–25,000 Bq kg-1), which indicated a need to remove topsoil, was distributed in only the EA-20km and DEA; 55% of the areas were observed in the EA-20km. Eighty percent of fields with contamination level 2 (5,000–10,000 Bq kg-1) were distributed in the evacuation zone, with the remaining 20% distributed in the non-evacuation zone in Fukushima Prefecture. Paddy fields with contamination level 2 (2,100 ha) have three options for decontamination; topsoil removal, fine-textured topsoil removal using water, and topsoil burying. Upland fields, orchards, and meadows that are at contamination level 2 (1,200 ha) have two options for decontamination; topsoil removal
Figure 10.6 Distribution map of radioactive Cs concentration in soil in Fukushima prefecture (reference date of November 5, 2011)
Status of the World’s Soil Resources Report, Regional Assessments of Soil Changes | Chapters 9 - 16
85

and topsoil burying.
Nutrient imbalance
The soil surface nitrogen (N) and phosphate (P) balance has been improving in Japanese arable land (Mishima et al., 2009; Mishima et al., 2010). These values serve as the index of the impact of arable land on the environment and as the farm-gate balance of nutrients. The soil surface N (and P) balance is defined as the total N (P) input (N kg ha-1) minus the total N (P) output (N kg ha-1). Chemical fertilizer application declined consistently during the period from 1985 to 2005 in Japan. And, the application rate of livestock manure had peak in 1990 and declined thereafter. Crop production remained constant during this period. The surplus N and P (positive value of soil surface N balance) declined from 89.9 to 49.3 kg N ha-1 and from 153 to 105 kg P ha-1 during 1985 to2005, respectively (Mishima et al., 2009; Mishima et al., 2010). However, this trend was not consistent at the regional level because organic amendment application was largely affected by the movement of livestock excreta (Mishima et al., 2009) and soil type (Leon et al., 2012). High surplus P and low crop P uptake compared with N, P input for crop production could be reduced, thereby reducing negative environmental effects such as eutrophication of soil and water and conserving limited P resources.
From the Basic Soil-Environmental monitoring project, there are excess soil Ca in paddy field, upland field and orchard field during 1979-1998 (MAFF, 2008). However, soil Mg deficit was gradually increased at this period. So, the balance of Ca and Mg has been getting worse in Japanese arable land. Also, soil pH of paddy field gradually decreased from 5.8 to 5.7 during 1979 to 1998 (MAFF, 2008).
Soil erosion
Spatial estimation of soil loss in arable land at a national scale was carried out using the Universal Soil Loss Equation (USLE) and environmental inventories (Kohyama et al., 2009). Hourly rainfall and runoff factors (R; resolution 1 km) were calculated by the amount of precipitation analyzed by radar-AMeDAS. Topographic factor (LS) was shown in Fig 10.7. It was calculate using digital elevation model (resolution 50 m) and ALOS satellite image. Soil erodibility factor (K) of arable land was calculated using physic-chemical soil properties (soil texture, soil organic matter content, etc.) measured in “Basic Soil-Environmental monitoring project” (Taniyama, 2003). The K factor of arable land was determined by soil series group. The K factor was relatively higher in clayey lowland soil group than humic Andosol groups. Cover and management factor (C) of each crop was determined by Taniyama (2003), and it was delineated using the agro-environmental census data map (Kohyama et al., 2003).
Loss of soil in Japanese arable land was categorized into 6 classes as Class I; less than 1 t ha-1 yr-1, Class II; 1-5 t ha-1 yr-1, Class III; 5-10 t ha-1 yr-1, Class IV; 10-30 t ha-1 yr-1, Class V; 30-50 t ha-1 yr-1, Class VI; more than 50 t ha-1 yr-1. The proportion of these classes were 43 % in Class I, 18 % in Class II, 9 % in Class III, 12 % in Class IV, 5 % in Class V and 14 % in Class VI. Highly erodible zones were mainly distributed in western Japan where are characterized by complex topography and heavy precipitation area.
Status of the World’s Soil Resources Report, Regional Assessments of Soil Changes | Chapters 9 - 16
86

10.5.4 Case study for greenhouse gas emissions from paddy fields Rice is the staple crop for the majority of the world’s population. In Asia, rice cultivation
areas roughly account for 89% of the world (Yan et al., 2003). While industriously feeding the world’s population, rice production is an important source of greenhouse gas emissions, notably methane (CH4) and nitrous oxide (N2O). Thereinto, CH4 is converted from substrate by methanogenic bacteria in strictly anaerobic environments, while N2O is an intermediate production of nitrification and denitrification. Both of these two gases possess greater infrared absorbing capability than carbon dioxide (CO2) on a mass basis, 25 times for CH4 and 298 times for N2O, respectively.
Using the tier 1 method described in the 2006 Intergovernmental Panel on Climate Change (IPCC) Guidelines for National Greenhouse Gas Inventories (IPCC, 2007), and country-specific
Figure 10.7 Distribution map of the parameters of USLE and classification of estimated soil loss (Class I; less than 1 t ha-1 yr-1, Class II; 1-5 t ha-1 yr-1, Class III; 5-10 t ha-1 yr-1, Class IV; 10-30 t ha-1 yr-1, Class V; 30-50 t ha-1 yr-1, Class VI; more than 50 t ha-1 yr-1)
Status of the World’s Soil Resources Report, Regional Assessments of Soil Changes | Chapters 9 - 16
87

estimates of rice harvest area and data on agricultural activities, Yan and colleagues estimated that global CH4 emission for 2000 was 25.6 Tg CH4 yr-1, with a 95% uncertainty range of 14.8 to 41.7 Tg CH4 yr-1, largely lower than earlier estimates (Yan et al., 2009). Rice paddies in monsoon Asia countries shared a dominant amount of 23.7 Tg CH4 yr-1. China, with an amount of 7.41 Tg CH4 yr-1, was estimated to be the largest CH4 emission country, followed by India, Bangladesh, Indonesia, Vietnam, Myanmar and Thailand. The areas with the greatest emission intensity were the delta regions of large rivers in Bangladesh, Myanmar, and Vietnam, the island of Java in Indonesia, central Thailand, southern China and the southwestern portion of the Korea (Fig. 10.8).
CH4 emission from rice fields is the net result of three processes: production, oxidation and transport. By effecting one or more of these processes, organic amendment, water regime during the rice-growing season, water status in pre-season have been extensively proven to be the main influencing factors. Appropriate agricultural managements of organic amendment and water regime therefore should be promoted to mitigate CH4 emissions, such as off-season straw incorporation and midseason drainage (Yan et al., 2009).
Unlike CH4, N2O emission from rice paddies was much lower than that for upland crops, because under a flooded environment, nitrification is weak and denitrification proceeds to the end step with N2 as the dominant product. The majority of N2O emissions from rice paddies usually occur shortly after the implement of mid-season drainage and nitrogen fertilizer additions (Yan et al., 2000). The availability of substrates and soil moisture condition are critical controlling factors for N2O emission since they affect activity of nitrifiers and denitrifiers. The fertilizer-induced N2O emission factor for rice fields averages approximately 0.3%, probably fluctuating dependent on water regime
(Akiyama et al., 2005). Mitigation of N2O emissions from paddy fields should also not be overlooked in consideration of the excessive nitrogen fertilizer consumption by rice production. Since a tradeoff relationship between CH4 and N2O emissions from rice paddies is frequently observed, any mitigation options pursued should take their comprehensive global warming potential fully into account.
Figure 10.8 Estimate CH4 emission from rice paddy in Asia (Source: Yan et al., 2009).
Status of the World’s Soil Resources Report, Regional Assessments of Soil Changes | Chapters 9 - 16
88

10.6 Conclusion In Asia region, management of land and water resources has been identified as one of the
priority issues for achieving sustainable food security by raising land productivity, reversing land degradation and water loss, and increasing biodiversity and the quality of the environment. Asian countries have also committed themselves to strengthening regional cooperation and national capacities to develop a more integrated approach to the management of natural resources. An integrated approach is needed to improve the ability of countries to plan and monitor the better use and management of their land resources to increase agricultural productivity while maintaining land and environmental quality.
However, since the GLASOD and ASSOD projects were accomplished in 1980s and 1990s, any extended assessments of the status of soil resources have not been carried out in the region, although scientific communications amongst experts in the region have been continued at various occasions, such as the activities of the East and Southeast Asia Federation of Soil Science Societies (ESAFS). It is suggested by a number of country reports in the region that rapid socio-economical change and resulting changes of land use and its management, as well as climate change, have had great impacts on the soil resources in Asian countries. Therefore, there is an increasing need to conduct a new extended assessment for recent change of soil resources in the region.
In response to that, a regional conference on soil information was held in Nanjing, China, on February 2012, to share latest soil information and advanced science and technologies on soil resources in Asian region. The conference recognized the benefits to be gained from further sharing our information and data on soil survey, soil mapping and capacity development, and was the occasion for establishing the initial Asia Soil Partnership (ASP). One of the outcomes of the Nanjing conference was the signing of the Nanjing Communiqué (GSP, 2012), which put the following goals as the priorities:
a) sharing and transferring soil knowledge and new technology within and beyond the region;
b) providing soil information to all those with an interest in the sustainable use of soil and land resources;
c) building consistent and updated Asian soil information systems and starting to contribute to the global soil information system through initiatives such as GlobalSoilMap.net;
d) training new generations of experts in soil science and land management.
After the endorsement of the global Plans of Action in GSP, the next step in the Asian Region is the development of the regional implementation plan sustainable soil management, which can make the plans in the Nanjing Communiqué into practice.
Status of the World’s Soil Resources Report, Regional Assessments of Soil Changes | Chapters 9 - 16
89

Table 10.4 Summary of Soil Threats Status, trends and uncertainties in Asia
References
Aggarwal et al., 1995
Agus F, Henson IE, Sahardjo BH, Harris N, van Noordwijk M, Killeen TJ. 2013. Review of emission factors for assessment of CO2 emission from land use change to oil palm in Southeast Asia. In: T.J. Killeen & J. Goon (eds.) Roundtable for Sustainable Palm Oil (RSPO), Kuala Lumpur. pp 7-27. http://www.rspo.org/file/GHGWG2/3_review_of_emission_factors_Agus_et_al.pdf
Agus et al., 2011
Agus, F., and Subiksa, I. GM. 2008. Lahan Gambut: Potensi untuk Pertanian dan Aspek Lingkungan (Peatland: The potential for Agriculture and environmental aspects). Booklet. Balai Penelitian Tanah (Indonesian Soil Research Institute) and World Agroforestry Centre (ICRAF) SE Asia, Bogor, Indonesia.
Agus, F. and Widianto. 2004. Petunjuk Praktis Konservasi Tanah Lahan Kering (Practical guidelines for upland soil conservation). World Agroforestry Centre (ICRAF) Southeast Asia. Bogor. 102 pp.
Very poor Poor Fair Good Very good In condition In trend
Soil erosion Serious water erosion occurs in regions with dry and wet seasons covering South Asia to East Asia, particularly in the hilly and mountainous landscapes. However, it is of little concern for well-established forests and paddy fields. Wind erosion is concentrated mainly in the most western and northern arid and semi-arid regions of Afghanistan, Pakistan, India, and China.
↙ ● ◒
Organic carbon change Increase in crop yield retains Soil organic carbon (SOC) in croplands of East and Southeast Asia. Whereas, SOC is decreasing in South Asia, because crop residues are widely used as fuel and fodder, and not returned to the soil. The degradation of grassland has caused great losses of SOC stock.
~ ◒ ◒
Salinization and sodification
The threat of salinisation/sodification in the Asia region is widespread but variable. In semiarid and arid zones of central Asia, salt-affected soils are widely distributed. On the other hand, salt-affected soils are developed in certain coastal areas in monsoon zones, mainly by salt water intrusion in South and Southeast Asia.
~ ● ◒
Nutrient imbalance Negative soil nutrient balances have been reported for N, P, and K in many South Asian countries. Whereas, large excess of nutrients, in particular N, causes serious environmental problems in other countries.
↙ ● ●
Contamination Rapid urbanization, industrialization, and intensive farming causes contamination of heavy metals (Cd, Ni, As, Pb, Zn, etc.) and pesticide in various parts of Asia, which, in turn, poses a serious risk to human health.
↙ ◒ ◒
Sealing and capping Rapid urbanization and development of mega-cities significantly increased the rate of impervious surface area (ISA). Asia region has the largest ISA within the global regions. ↙ ◒ ◒
Soil acidification There is substantial area of acid soils distributed in tropical and subtropical regions of Asia, mainly in Southeast Asia, parts of East and South Asia. This is mainly coused by unbalanced and unsuitable application of chemical fertilizers. Distribution of acid sulfate soils in tropical Asia also limits crop production.
↙ ● ◒
Compaction Mechanization of land management has increased compaction of surface soil and/or subsoil in cropland, grassland and timber forests. Increase in livestock trampling is also a major cause of surface soil compaction in grassland and hilly region.
↙ ◒ ◒
Waterlogging Anthropogenic activities such as poor drainage system and deforestation in the upstream areas increase the threat to waterlogging in the flood prone areas. ↙ ◒ ○
Loss of soil biodiversity Limited information is available for soil biodiversity in Asia. Some reports show high microbial biodiversity in the soils of organic farming lands. ~ ○ ○
Symbol Definition
− Stable~ Variable↙ Deteriorating↗ Improving○ Evidence and consensus is low◒ Limited evidence or limited consensus● Adequate high-quality evidence and high level of consensus
Condition and Trend ConfidenceThreat to soil function Summary
Status of the World’s Soil Resources Report, Regional Assessments of Soil Changes | Chapters 9 - 16
90

Agus et al., 2002
Ahmad, M. and Kutcher, G.P. 1992. Irrigation planning with environmental considerations: a case study of Pakistan's Indus basin. World Bank Technical Paper 166. World Bank, Washington DC, 196 pp.
Akiyama, H., Yagi, K., Yan, X.Y., 2005. Direct N2O emissions from rice paddy fields: Summary of available data. Global Biogeochemical Cycles 19.
Andriesse, 1994
Asami, T. 1981. Maximum allowable limits of heavy metals in rice and soil. In: Kitagawa, K. and Yamane, I. (Eds.), Heavy Metal Pollution in Soils of Japan, pp. 257–274, Japan Scientific Societies Press, Tokyo.
Bangladesh. 1992. Land Degradation. Paper presented to FAO 21st Regional Conference for Asia and the Pacific, New Delhi.
Baoming, G.E., Zhang, D., Tang, B., Zhou, C., 2014. Effect of land cover on biodiversity and composition of a soil macrofauna community in a reclaimed coastal area at Yancheng, China. Turkish Journal of Zoology, 38: 229-233.
Bhattacharyya, T., Pal,D. K. Mandal, C., Chandran, P., Ray,S. K. Sarkar, Dipak, Velmourougane, K., Srivastava, A., Sidhu, G. S., Singh, R. S., Sahoo, A. K., Dutta, D. , Nair, K. M., Srivastava, R., Tiwary, P., Nagar, A. P. and Nimkhedkar, S. S. 2013. Soils of India: historical perspective, classification and recent advances. Current Science, 104(10): 25.
Bhattacharyya et al., 2008
Biswas, A. and Tewatia, R.K. 1991. Nutrient balance in agro-climatic regions of India - an overview. Fert. News 36(6): 13- 18.
Blanchart, E., Julka J.M., 1997. Influence of forest disturbance on earthworm (Oligochaeta) communities in the Western Ghats (South India). Soil Biol. Biochem. 29:303–306
Booth D. 1991. Urbanization and the natural drainage system-impacts, solutions and prognoses. Northwest Environmental Journal.
Brammer and Ravenscroft, 2009
CCIC, 2010
Changnon. 1992. Inadvertent weather modification in urban areas: Lessons for global climate change., Bulletin of the American Meteorological Society, 73, 619-627.
Chaudhary, M.K. and Aneja, D.R. 1991. Impact of green revolution on long-term sustainability of land and water resources in Harayana. Indian Journal of Agricultural Economics 45: 428-32.
Chen, S.K., Liu, C.W., and Chen, Y.R. 2012. Assessing soil erosion in a terraced paddy field using experimental measurements and universal soil loss equation. Catena 95: 131-141.
Status of the World’s Soil Resources Report, Regional Assessments of Soil Changes | Chapters 9 - 16
91

Chen, X., et al. 2014. Producing more grain with lower environmental costs. Nature, 514(7523), 486-489.
Chhabra et al., 2003
Choi, D.H., Jung, J.W., Yun, K.S., Lee, K.S., Choi, W.J., Lim, S.S., Park, H.N., Yim, B.J., Hwang, T.H. 2012. Estimation of TOC concentration using BOO, COD in runoff from paddy fields. J. Korean Soc. Water Environ. 28: 813-818.
Coleman K and Jenkinson DS 1996. RothC-26.3 – A model for the turnover of carbon in soil. In: Powlson DS, Smith P, Smith JU(Eds.). Evaluation of Soil Organic Matter Models, Using Existing Long-Term Datasets. Springer, Berlin, pp. 237–246.
Chopra, H. 1989. Land degradation: dimensions and casualties. Indian Journal of Agricultural Economics 44: 45-54.
Dadhwal and Nayak (1993)
Dariah et al. (2014)
Dibiyantoro, A.L.H. 1998. Pesticide Residues on Some Vegetables, and Reductions Possible by Integrated Pest Management. Pp. 374-379. In I.R. Kennedy, J.H. Skerritt, G.I. Johnson, and E. Highley (eds.) Seeking Agricultural Produce Free of Pesticide Residues, Proceedings of an International Workshop held in Yogyakarta, Indonesia, 17–19 February 1998. http://ageconsearch.umn.edu/bitstream/135195/2/PR085.pdf
Doi, R., Ranamukhaarachchi, S.L., 2013. Slow restoration of soil microbial functions in an Acacia plantation established on degraded land in Thailand. Int. J. Environ. Sci. Technol. 10: 623-634
Drewry, J.J., Paton, R.J. 2000. Effects of cattle treading and natural amelioration on soil physical properties and pasture under dairy farming in Southland, New Zealand. New Zealand Agr. Res. 43, 377-386
Edinger et al., 2008
Elvidge C.D., Tuttle B.T., Sutton P.C., Baugh K.E., Howard A.T., Milesi C., Bhaduri B.L., Nemani R. 2007. Global distribution and density of constructed impervious surfaces Sensors, 7, 1962-1979
FAO. 2006. Global planted forests thematic study: results and analysis, by A. Del Lungo, J. Ball & J. Carle. Planted Forests and Trees Working Paper No. 38. Rome (also available at www.fao.org/forestry/site/10368/en).
FAO. (2014). http://faostat.fao.org/site/291/default.aspx. Rome. Italy.
FAOSTAT, 2012
FAO/RAPA. 1992. Environmental Issues in Land and Water Development. FAO/RAPA, Bangkok. 488 pp. (Includes country papers on Bangladesh, India, Nepal, Pakistan and Sri Lanka.)
Fisher, R., Hirsch, P., 2008. Poverty and agrarian-forest interactions in Thailand. Geogr. Res. 46:74-84.
Status of the World’s Soil Resources Report, Regional Assessments of Soil Changes | Chapters 9 - 16
92

Fischer, G..Nachtergaele, F.O., Prieler, S., Teixeira, E., Toth, G.,Velthuizen, H.v., Verelst, L. and Wiberg, D., 2012. Global Agro-Ecological Zones (GAEZ v3.0) - Model Documentation. IIASA Laxenburg and FAO, Rome.
Germer, J., & Sauerborn, J. 2008. Estimation of the impact of oil palm plantation establishment on greenhouse gas balance. Environmental Development & Sustainability,10, 697-716.
GSP, 2012. Nanjing Communiqué on Asian Soil Partnership. http://www.fao.org/globalsoilpartnership/regional-partnerships/asia/en/
Guo JH, Liu XJ, Zhang Y, Shen JL, Han WX, Zhang WF, Christie P, Goulding, KWT, Vitousek PM, Zhang FS. 2010. Significant Acidification in major Chinese croplands. Science, 327:1008-1010.
Guo et al., 2009
Gupta and Rao (1994)
Han YW, Gao JX (2005) Analysis of main ecological problems of grasslands and relevant countermeasures in China. Research of Environmental Sciences, 18, 60–62 (in Chinese).
Haron, K., Brookes, P.C., Anderson, J.M. & Zakaria, Z.Z. 1998. Microbial biomass and soil organic matter dynamics in oil palm (Elaeis guineensis Jacq.) plantations, West Malaysia. Soil Biology and Biochemistry, 30, 547–552.
Hartanto, H., Prabhu, R., Widayat, A.S.E., and Asdak, C. 2003. Factors affecting runoff and soil erosion: plot-level soil loss monitoring for assessing sustainability of forest management. Forest Ecology and Management, 180:361–374.
Hattori D., Tanaka K., Okamura IK., Kendawang JJ., Ninomiya I., Sakurai K. 2013. Effects of soil compaction on the growth and motality of planted dipterocarp seedlings in a logged-over tropical rainforest in Sarawak, Malaysia. For. Ecol. Manag., 310, 770-776
Hicks WK, Kuylenstierna JCI, Owen A, Dentener F, Seip HM, Rodhe H. 2008. Soil sensitivity to acidification in Asia: status and prospects. AMBIO, 37: 295-303.
Hooijer, A. S. Page, P. Navratil, R. Vernimmen, M. Van der Vat, K. Tansey, K. Konecny, F. Siegert, U. Ballhorn and N. Mawdsley. 2014. Carbon emissions from drained and degraded peatland in Indonesia and emission factors for measurement, reporting and verification (MRV) of peatland greenhouse gas emissions ‒ a summary of KFCP research results for practitioners. IAFCP, Jakarta, Indonesia.
Houghton, R.A., and Hackler J.L. 2003. Sources and sinks of carbon from land-use change in China, Global Biogeochemical Cycles, 17: 1034, doi:10.1029/2002GB001970.
Husnain et al. (2014)
Husnain, Masunaga, T., Wakatsuki, T. 2010. Field assessment of nutrient balance under intensive rice-farming systems, and its effects on the sustainability of rice production in Java Island, Indonesia. Journal of agricultural, food and environmental science. Volume 4, Issue 1
IFA, Global supply and demand outlook for fertilizer and raw materials. www.fertilizer.org, 2012
Status of the World’s Soil Resources Report, Regional Assessments of Soil Changes | Chapters 9 - 16
93

IFADATA. 2007. Production and International Trade Statistics. International Fertilizer Industry Association. Available at URL. http://www.fertilizer.org/ifa/statistics.asp. Retrieved 12 October 2014
Intergovernmental Panel on Climate Change (IPCC) (1997), Revised 1996 IPCC Guidelines for National Greenhouse Gas Inventories: Reference Manual, vol. 3, Bracknell, U. K.
IPCC, 2014
Jim CY 1998: Physical and chemical properties of a Hong Kong roadside soil in relation to urban tree growth. Urban Ecosyst., 2, 171-181.8.
Jim CY. (1998) Soil characteristics and management in an urban park in Hong Kong. Env. Manage, 22, 683-695.
Jo, I.S., Jung, P.K., Kim, L.Y., Ha, S.K., and Chung, D.Y. 2009. Soil Physical properties and soil conservation. Korean. J. Soil. Sci. Fert. 42(s): 28-52.
Ju et al., 2010
Jung et al., 2014
Jung, 1998
Jung, K.H., Kim, W.T., Hur, S.O., Ha, S.K. Jung, P.K. and Jung, Y.S. 2004 USLE/RUSLE factors for national scale soil loss estimation based on the digital detailed soil map. Korean. J. Soil. Sci. Fert. 37(4): 199-206.
Jung, P.K. and Oh, S.J. 1993. Soil loss with grass species in grasslands conversed from mountainous forests. pp 149-153. In: Research report 1992. National Institute of Agricultural Technology. Suwon. Republic of Korea.
Jung, Y. S., and C. H., Ryu. 2005. Soil problems and agricultural water management of the reclaimed land in Korea. The CASS-RDA water management Symposium, Pekeing, China.
Jung, Y. S., J. H. Joo, S. Y. Yoon. 2002. A Management guideline for soil and irrigation water in the reclaimed saline land. IAS., Kangwon Nat. Univ. Korea.
Jung, K.H., Sonn, Y.K. Hong, S.Y., Hur, S.O. and Ha, S.K. 2005. Assessment of national soil loss and potential erosion area using the digital detailed soil map. Korean. J. Soil. Sci. Fert. 38(2):59-65.
Kamprath, E. 1984. Crop response to lime on soils in the tropics. p. 349-368 In Adam, F. (ed.), Soil acidity and liming, Second edition, Agronomy 12, Soil Science Society of America, Madison, WI. USA .
Kim, M.K. Kwon, S.I. Jung, K.B., Hong, S.C., Chae, M.J., Yun, S.K., So, K.H. 2013. Small-scale pond effects on reducing pollutants load from a paddy field. Korean J. Environ. Agri. 32(4): 355-358.
Kitahara, H., Okura, Y., Sammori, T. and Kawanami, A. 2000. Application of universal soil loss equation (USLE) to mountainous forests in Japan. J. For. Res. 5: 231-236.
Kohyama et al., 2003
Kohyama et al., 2009
Status of the World’s Soil Resources Report, Regional Assessments of Soil Changes | Chapters 9 - 16
94

Kohyama et al., 2012 USLE parameter data of 1 km grid to estimate soil erosion in farmland, Inventory, 10, 3-9 (in Japanese).
Kozlowski T. (1999) Soil compaction and growth of woody plants. Scand. J. For. Res., 14, 596-619.
Kruemmelbein J, Peth S. and Horn R. (2008) Determination of pre-compression stress of a variously grazed steppe soil under static and cyclic loading. Soil Till. 99, 139-148.
Kukal et al., 2003
Kyuma, K. 2004, ‘Paddy soil science’, Kyoto University Press and Trans Pacific Press.
Lal R. 2004. Soil carbon sequestration impacts on global climate change and food security. Science, 304, 1623–1627.
Lal,R. 2003
Lee, K.S. 1994. Application of GIS to the Universal Soil Loss Equation for Quantifying Rainfall Erosion in Forest Watersheds. J. Korean For. Soc. 83(3): 322-330.
Leon et al., 2012. Factors controlling organic amendment application rate and long-term change in application rate in Japanese paddy field using longitudinal questionnaire survey dataset (the Basic Soil Environment Monitoring Project, Stationary Monitoring, 1979-1998), Soil Sci. Plant Nutr., 58, 104-120
Li et al., 2009
Li, S. et al. (2005) Net ecosystem carbon dioxide exchange over grazed steppe in central Mongolia. Global Change Biology 11: 1941-1955.
Limbong et al., 2003
Liu, X., et al. (2013). Enhanced nitrogen deposition over China. Nature, 494(7438), 459-462.
Luo, Y., Wu, L., Liu, L., Han, C., and Li, Z. (2009) Heavy Metal Contamination and Remediation in Asian Agricultural Land, MARCO Symposium 2009 “Challenges for Agro-Environmental Research in Monsoon Asia”, http://www.niaes.affrc.go.jp/marco/marco2009/english/program/S-1_LuoYM.pdf
Ma, L., et al. , 2010. Modeling nutrient flows in the food chain of China. Journal of environmental quality, 39(4), 1279-1289.
MAFF (Ministry of Agriculture, Forestry and Fishery) 2008. Trend and Issue of cultivated soil in Japan, Available at: http://www.maff.go.jp/j/study/dozyo_kanri/01/pdf/ref_data1.pdf
Makino T 2010. Heavy metal pollution of soil and risk alleviation methods based on soil chemistry, PEDOLOGIST, 53, 38-49
Marwanto and Agus, 2014.
Mathews. J., Tan, T.H. & Chong, K.M. 2010. Indication of soil organic carbon augmentation in oil palm cultivated inland mineral soils of Peninsular Malaysia. The Planter, Kuala Lumpur, 86, 293-313.
Minasny B, McBratney AB, Hong SY, Sulaeman Y, Kim MS, Zhang YS, Kim HY, Han KH. 2012. Continous rice cropping has been sequestering carbon in soils in Java and South
Status of the World’s Soil Resources Report, Regional Assessments of Soil Changes | Chapters 9 - 16
95

Korea for the past 30 years. Global Biogeochemical Cycle (26): 1-8. GB3207. doi: 10.1029/2012GB004406.
Ministry of Environmental Protection, the People’s Republic of China (2014) China alerted by serious soil pollution, http://english.mep.gov.cn/News_service/media_news/201404/t20140421_270801.htm
Mishima, 2011
Mishima et al., 2010. Recent trends in phosphate balance nationally and by region in Japan, Nutr. Cycling Agroecosystem, 86, 69-77
Mishima et al., 2010. Recent trend in residual nitrogen on national and regional scales in Japan and its relation with groundwater quality, Nutr. Cycling Agroecosystem, 83, 1-11
Mishima et al., 2009
Milesi C Elvidge CD Nemani RR Running SW (2003) Assessing the impact of urban land development on net primary productivity in the Southeastern United States, Remote Sensing of Environment, 86, 401-410
Millward AA., Paudel K., Briggs SE. (2011) Naturalization as a strategy for improving soil physical characteristics in a forested urban park. Urban Ecosyst. 14, 261-278.
MOE, 2014
Morisada K. et al. 2004. Organic carbon stock in forest soils in Japan. Geoderma 119: 21-32.
Mujeeb Rahman, P., Varma, R.V., Sileshi, G.W., 2012. Abundance and diversity of soil invertebrates in annual crops, agroforestry and forest ecosystems in the Nilgiri biosphere reserve of Western Ghats, India. Agroforest. Syst. 85:165-177.
Murty, D., Kirschbaum, M. U. F., McMurtrie, R. E., & McGilvray, A. 2002. Does conversion of forest to agricultural land change soil carbon and nitrogen? A review of the literature. Global Change Biology, 8, 105–123.
NISF, National Institute for Soils and Fertilizers, The basic information of main soils unit of Vietnam, Thegioi publishers, Hanoi, 2012.
Nguyen, N.D., Adequate use of Sulphur, Vietnam Agriculture Newspaper, Feb 10th, 2014
Noor, 2001
Oldeman L.R. (1991) Global extent od soil degradation. ISRIC Bi-Annual Report 1991-1992, pp. 19-36
Oldeman, L.R., R.T.A. Hakkeling and W.G. Sombroek, 1991. World Map of the Status of Human-induced Soil Degradation: An Explanatory Note, second revised edition. ISRIC/UNEP.
Oldeman L.R. 2000. Impact of soil degradation: A Global Scenario. In Proceedings of International Conference on Managing Natural Resources for Sustainable Agricultural Production in the 21st Century, held in New Delhi, India, pp79-86.
Page, S. E., Rieley, J.O., and Banks, C. J. 2011: Global and regional importance of the tropical peatland carbon pool, Glob. Change Biol., 17, 798–818.
Page et al., 2002.
Status of the World’s Soil Resources Report, Regional Assessments of Soil Changes | Chapters 9 - 16
96

Paningbatan 1987.
Parish et al., 2007.
Park, C.W., Sonn, Y.K., Hyun, B.K., Song, K.C., Chun, H.C., Moon, Y.H., Yun, S.G. 2011. The redetermination of USLE rainfall erosion factor for estimation of soil loss at Korea. Korean. J. Soil. Sci. Fert. 44(6): 977-982.
Park, K.R. 1991. Suitability Assessment and Production management of upland field crops in the reclaimed saline land, In Training manual agricultural use of reclaimed coastal land. Eds. A.M. Mashali, Choi, W.Y., and D.W. West. pp.174-192. FAO and Chonnam National University, Kwangju, Korea.
Park, S.H., 2001. Tideland reclamation, In Rice Culture in Asia. Eds. S.K. Kwun et al. p.116-118 KCID, Ansan. Korea.
Piao et al. (2012)
Piao, S., et al. (2009) The carbon balance of terrestrial ecosystems in China, Nature 458: 1009-1013.
Prasetyo et al., 2010
Puslitbangtanak (Pusat Penelitian dan Pengembangan Tanah dan Agroklimat). 2000. Atlas Sumber Daya Tanah Eksplorasi Indonesia. Skala 1:1.000.000 (Exploration soil resource atlas, at 1:1,000,000 scale). Puslitbangtanak, Bogor.
Rahmawati, S., Margana, G., Yoneda, M., Oginawati, K. 2013. Organochlorine pesticide residue in Catfish (Clarias sp.) collected from local fish cultivation at Citarum watershed, West Java Province, Indonesia. Procedia Environmental Sciences 17:3–10.
Ritung et al., 2011
Rossi, J.P., Blanchart, E., 2005. Seasonal and land use induced variations of soil macrofauna composition in the Western Ghats, southern India. Soil Biol. Biochem. 37:1093–1104
Sakuramot, N., Yokoyama, K., and Iekushi, T. (2010) Advocacy of positive environmental assessment using soil microbial diversity and its vitality. Proceeding of AFITA2010 International Conference 137-140.
Salinger, M.J., Shrestha, M.L., Ailikun, Dong, W., McGregor, J.L., and Wang, S. 2014, Climate in Asia and the Pacific: Climate variability and change. In Climate in Asia and the Pacific’, M. Manton and L.A. Stevenson eds., Asia-Pacific Network for Global Change Research, Springer Science+Buisiness Media, Dordrecht.
Santoso D, Adiningsih S, Mutert E, Fairhurst T, Van Noordwijk M (1997) Site improvement and soil fertility management for reclamation of Imperata grasslands by smallholder agroforestry. Agroforestry Systems, 36, 181-202.
Schertz (1983)
Schneider A, Friedl MA, Potere D 2009: A new map of global urban extent from MODIS satellite data. Environ. Res. Lett., 4, 044003(11pp)
Status of the World’s Soil Resources Report, Regional Assessments of Soil Changes | Chapters 9 - 16
97

Sehgal, J. and Abrol, I. P. 1992. Land degradation statue: India. Desertification Bulletin 21: 24-31.
Shaheed, S.M. 1992. Environmental issues in land development in Bangladesh. In: Environmental Issues in Land and Water Development. FAO/RAPA, Bangkok. pp. 105-27.
Shamshuddin J, Azura AE, Shazana MARS, Fauziah CI, Panhwar QA, Naher UA. 2014. Properties and measurement of acid sulfate soils in Southeast Asia for sustainable cultivation of rice, oil palm, and cocoa. Advances in Agronomy, 124: 91-142.
Shirato et al., 2011. Using different versions of the Rothamsted Carbon model to Simulate soil carbon in long-term experimental plots subjected to paddy-upland rotation in Japan, Soil Sci. Plant Nutr. 57, 597-606
Shofiyati et al., 2019
Shoiful, A., Fujita, H., Watanabe, I., Honda. K. 2012. Concentrations of organochlorine pesticides (OCPs) residues in foodstuffs collected from traditional markets in Indonesia. Chemosphere 90(5): 1742–1750.
Sidhu et al., 2014
Simmons RW, Pongsakul P, Saiyasitpanich D, Klinphoklap S. (2005) Elevated levels of cadmium and zinc in paddy soils and elevated levels of cadmium in rice grain downstream of a zinc mineralized area in Thailand: implications for public health. Environ Geochem Health; 27: 501-11
Singh et al., 2009
Singh, R.L. (1971). Regional Geography. Editor R. L. Singh, Silver Jubilee Publication. National Geographical Society of India, Varanasi-5.
Smedley, 2003
Somboonna, N., Wilantho, A., Jankaew, K., Assawamakin, A., Sangsrakru, D., Tangphatsornruang, S., Tongsima, S., 2014. Microbial ecology of Thailand tsunami and non-tsunami affected terrestrials. PLoS ONE 9: doi:10.1371/journal.pone.0094236.
Sukristiyonubowo, Ritung, S., Nugroho, K. 2012. Nitrogen and potassium balances of newly opened wetland rice field. International Research Journal of Agriculture Science and Soil Science Sukristiyonubowo
Takata Y 2010. Estimation of soil carbon stock changes in Japanese agricultural soils using national resource inventory. Proceedings of an international workshop on evaluation and sustainable management of soil carbon sequestration in Asian countries. Indonesian Soil Research Institute (ISRI), Food & Fertilizer Technology Center for the Asian and Pacific Region (FFTC) and National Institute for Agro-environmental Sciences (NIAES), pp 15-28.
Status of the World’s Soil Resources Report, Regional Assessments of Soil Changes | Chapters 9 - 16
98

Takata Y et al., 2011: Process of the decline in the cultivated soil area with land use changes in Japan. Jpa. J. Soil Sci. Plant Nutr., 82, 15-24. (in Japanese with English summary)
Takata Y et al. 2011. Phosphate adsorption coefficient can improve the validity of RothC model for Andosols, Soil Sci. Plant Nutr., 57, 421-428
Takata, T., Kohyama, K., Obara, H., Maejima, Y., Ishitsuka, N., Saito, T., and Taniyama, I. (2014) Spatial prediction of radioactive Cs concentration in agricultural soil in East Japan, Soil Sci. Plant Nutr., 60, 393-403.
Takata et al., 2010
Tan, Z.X., R. Lal, and K.D. Wiebe. 2005. Global soil nutrient depletion and yield reduction. J. Sustainable Agric.26: 123-146.
Tanaka, S., Tachibe, S., Wasli, M.E.B., Lat, J., Seman, L., Kendawang, J.J., Iwasaki, K. K., & Sakurai, K., 2009. Soil characteristics under cash crop farming in upland areas of Sarawak, Malaysia. Agriculture, Ecosystems and Environment, 129, 293–301.
Tandon, H.L.S. 1992. Assessment of Soil Nutrient Depletion. Paper presented to FADINAP seminar, Fertilization and the environment, Chiang Mai, Thailand.
Taniyama I., 2003. Study of soil factor related to production of surface runoff from cropland and development of MI. In Agriculture, Forestry and Fisheries Research Council (eds.) Comprehensive evaluation of implication of agriculture, forestry, fisheries and trade of products on natural resources and the environment. Tokyo: Agriculture, Forestry and Fisheries Research Council, p. 149-52 (in Japanese).
Tian, H. et al., (2011) China's terrestrial carbon balance: Contributions from multiple global change factors. Global Biogeochemical Cycles 25: 1.
Twyford, I. 1994. Fertilizer Use and Crop Yields. Paper presented to 4th National Congress of the Soil Science Society of Pakistan, Islamabad. 1992.
Ugawa S. et al. (2012) Carbon stocks of dead wood, litter, and soil in the forest sector of Japan: general description of the National Forest Soil Carbon Inventory. Bulletin of FFPRI 11: 207-221.
Valentin, C., Agus, F., Alamban, R., Boosaner, A., Bricquet, J.P., Chaplot, V., de Guzman, T., de Rouw, A., Janeau, J.L., Orange, D., Phachomphonh, K., Do Duy Phai, Podwojewski, P., Ribolzi, O., Silvera, N., Subagyono, K., Thiébaux, J.P., Tran Duc Toan, and Vadari, T. 2008. Runoff and sediment losses from 27 upland catchments in Southeast Asia: Impact of rapid land use changes and conservation practices. Agriculture, Ecosystem and Environment 128(4):225-238.
Status of the World’s Soil Resources Report, Regional Assessments of Soil Changes | Chapters 9 - 16
99

van der Kamp J, Yassir I, Buurman P. 2009. Soil carbon changes upon secondary succesion in Imperata grasslands (East Kalimantan, Indonesia). Geoderma, 149: 76-83. doi: 10.1016/j.geoderma. 2008.11.033
van Lynden, G.W.J. and Oldeman, L.R. (1997) The assessment of the status of human-induced soil degradation in South and Southeast Asia. International Soil Reference and Information Centre, Wageningen, The Netherlands.
van Noordwijk M, Cerri P, Woomer PL, Nugroho K, Bernoux M. 1997. Soil carbon dynamic in the humid tropical forest zone. Geoderma (79):187-225, doi: 10.1016/S0016-7061(97)00042-6.
Veiga et al., 2009
Velayutham , M. and Bhattacharyya, T. (2000) Soil Resource Management. In Natural Resource Management for Agricultural Production in India ( J.S. P. Yadav and G. B. Singh Eds.) Published by Secretary General International Conference on Managing Natural Resources for Sustainable Agricultural Production in the 21st Century .
Velthof, G. L., et al. (2009). Integrated assessment of nitrogen losses from agriculture in EU-27 using MITERRA-EUROPE. Journal of Environmental Quality, 38(2), 402-417.
Vitousek, P.M., et al. (2009). Nutrient imbalances in agricultural development. Science, 324(5934), 1519.
von Uexküll and Mutert, 1995
Wang, J., Chen, Y., Shao, X., Zhang, Y., Cao, Y., 2012. Land-use changes and policy dimension driving forces in China: Present, trend and future. Land Use Policy, 29:737-749.
Wang H, Xu RK, Wang N, Li XH. 2010. Soil acidification of Alfisols as influenced by tea plantation in eastern China. Pedosphere, 20:799-806.
Warren et al., 2012
Wei and Chen, 2001
Widowati, W., De Neve, L.R., Sukristiyonubowoo, S., Setyorini, D., Kasno, A., Sihaputar, I.A., and Sukristiyohastomo. 2011. Nitrogen balances and nitrogen uses efficiency of intensive vegetable rotations in South East Asian tropical Andisols. Nutrient Cycling in Agroecosystems, 91(2):131-143.
Williams et al., 1996
Wӧsten et al., 2008
Status of the World’s Soil Resources Report, Regional Assessments of Soil Changes | Chapters 9 - 16
100

Xie et al., 2014
Xie ZB, Zhu JG, Liu G et al. (2007) Soil organic stocks in China and changes from 1980s to 2000s. Global Change Biology, 13, 1989–2007.
Yagasaki Y and Shirato Y 2014. Assessment on the rates and potentials of soil organic carbon sequestration in agricultural lands in Japan using a process-based model and spatially explicit land-use change inventories – Part 1: Historical trend and validation based on nation-wide soil monitoring. Biogeosciences, 11, 4429-4442
Yan, X., Du, L., Shi, S., Xing, G., 2000. Nitrous oxide emission from wetland rice soil as affected by the application of controlled-availability fertilizers and mid-season aeration. Biology and Fertility of Soils 32, 60-66.
Yan, X.Y., Akimoto, H., Ohara, T., 2003. Estimation of nitrous oxide, nitric oxide and ammonia emissions from croplands in East, Southeast and South Asia. Global Change Biology 9, 1080-1096.
Yan, X.Y., Akiyama, H., Yagi, K., Akimoto, H., 2009. Global estimations of the inventory and mitigation potential of methane emissions from rice cultivation conducted using the 2006 Intergovernmental Panel on Climate Change Guidelines. Global Biogeochemical Cycles 23.
Yan, Z., et al. (2013). Phosphorus in China’s intensive vegetable production systems: Overfertilization, soil enrichment, and environmental implications. Journal of environmental quality, 42(4), 982-989.
Yokoyama, K. (1993) Evaluation of biodiversity of soil microbial community. Biology International special issue29 "Symbiosphere: Ecological Complexity for Promoting Biodiversity, International Union of Biological Sciences P74-78.
Yokoyama, K. and Taguchi, Y-h. (2013) Microbiology and biodiversity-based modeling of suppression of cottony leak of scarlet runner bean in soils with diverse and uniform ecology. Journal of Agricultural Science and Application 2(1),35-44.
Yu YY, Guo ZT, Wu HB, Kahmann JA, Oldfield F (2009) Spatial changes in soil organic carbon density and storage of cultivated soils in China from 1980 to 2000. Global Biogeochemical Cycles, 23, GB2021, doi: 2010.1029/2008GB003428.
Zhang, X.Y., Cruse, R.M., Sui, Y.Y., and Jhao, Z.: Soil compaction induced by small tractor traffic in northeast China. SSSAJ, 70, 613-619 (2006).
Zhao Y, Duan L, Xing J, Larssen T, Nielsen CP, Hao JM. 2009. Soil acidification in China: Is controlling SO2 emissions enough? Environmental Science & Technology, 43: 8021-8026.
Zhou GY, Liu SG, Li ZA, Zhang DQ, Tang XL, Zhou CY, Yan JH, Mo JM (2006) Old-growth forests can accumulate carbon in Soils. Science, 314, 1417.
Status of the World’s Soil Resources Report, Regional Assessments of Soil Changes | Chapters 9 - 16
101

Status of the World’s Soil Resources Report, Regional Assessments of Soil Changes | Chapters 9 - 16
102

11. Regional assessement of soil changes in Europe and Eurasia Assessment of Soil Changes in Europe and Eurasia Region
Regional Coordinator/Lead Author: Pavel Krasilnikov (ITPS/Russia)
Contributing Authors: Irina Alyabina (Russia), Dominique Arrouays (ITPS/France), Svyatoslav Balyuk (Ukraine), Marta Camps Arbestain (ITPS/New Zealand), Laziza Gafurova (Uzbekistan), Hakki Emrah Erdogan (Turkey), Elena Havlicek (Switzerland), Maria Konyushkova (Russa), Ramazan Kuziev (Uzbekistan), Marc van Liederkerke (Belgium), Vitaliy Medvedev (Ukraine), Luca Montanarella (ITPS/Italy), Panos Panagos (Greece), Manuela Ravina da Silva (Sweden), Bülent Sönmez (Turkey).
====================================================================
11.1 Introduction The majority of reports on the global state of soil degradation regards the European region as
less disturbed compared with the situation in other regions: according to an ISRIC estimation (Oldeman, 1998) an average cumulative loss of productivity during the post-second world war period due to human-induced soil degradation was estimated as 7.9%, while in Africa it was 25%, and in Central America it was as high as 36.8%. However, the extent of soil degradation in Europe seems to be underestimated, because soil degradation on the territory of the European region has many facets, not all considered in the previous estimate. The processes of human induced soil degradation started in many parts of this region in ancient times, because many centres of agrarian civilization emerged here several millennia ago: Greece, Anatolia, and Amu Darya delta are just the most remarkable examples. Since that time the pressure on the land increased because of growing population and intensive migration of people due to a decline in natural resources and climatic fluctuations. The western part of the European region in comparison to other regions of the world has a history of over 200 years of industrialization which induces additional pressures on the soil. Soil changes can occur naturally but are now under an increasing threat from a wide range of anthropogenic pressures. Today these pressures represent the main reason for soil degradation in many parts of Europe. Soil resources are being over-exploited, degraded and irreversibly lost due to poor management practices, industrial activities and land-use changes. Soil threats in the region put into risk its key role on being the basis for provision of food, feed, fibre and energy as well as for the ecosystem services and mitigation of climate change.
The knowledge on the state of soil resources in European region is good because of the generally high development of soil science and soil monitoring in the countries of the region. An overview of the state of soil resources and the development of land degradation for the whole region remains difficult because of the lack of harmonization of the data obtained at different dates using different methodology (Jones and Montanarella, 2003; Morvan et al., 2008).
In this review we are focusing on the anthropogenic degradation, i.e. alteration of soil properties that leads to the decline in soil productivity and ecosystem services induced by human activities. The latter include improper agricultural use, and soil disturbance and contamination due to urbanization, industrial and mining activities.
Status of the World’s Soil Resources Report, Regional Assessments of Soil Changes | Chapters 9 - 16
103

11.2. Stratification of the region The European region as considered in this report covers a large area that includes Europe
sensu stricto plus Turkey and the Former Soviet Union. The extension of the region determines the diversity of bioclimatic and soil resources and consequently of land use. The importance of agriculture varies among the countries of the region (Table 11.1). In the terms of area under agricultural use, the five leaders are Kazakhstan, Moldova, United Kingdom, Ukraine and Turkmenistan and the five least agricultural countries are Greenland, Norway, Finland, Sweden, and the Russian Federation. For the countries with the most extensive agriculture it should be noted that the figures require interpretation: for example, high percentage of agricultural lands in Kazakhstan does not mean that the country has the highest pressure on natural ecosystems, because it has almost 90% of rangelands among its agricultural lands. The countries with the least percentage of agricultural lands are represented with the coldest countries of the region, where bioclimatic condition do not allow the extension of agricultural activities.
Table 11.1. The percentage of agricultural land area of total land area in the countries of the European region (FAOSTAT)
Area name Agricultural area of total land area, %
Area name Agricultural area of total land area, %
Kazakhstan 77.00 Republic of Moldova 76.05 United Kingdom 71.35 Ukraine 71.32 Turkmenistan 69.29 Hungary 64.41 Uzbekistan 63.04 Denmark 62.82 Ireland 62.79 Romania 61.67 Serbia 57.81 Azerbaijan 57.54 Spain 57.44 Netherlands 57.12 Armenia 56.21 Kyrgyzstan 55.96 Greece 55.38 Czech Republic 55.09 Serbia and Montenegro 54.81 France 53.81 Poland 53.17 Turkey 52.27 Luxembourg 49.95 Italy 49.76 Germany 48.59 Bulgaria 47.95
Belgium 45.57 Belarus 44.20 Lithuania 43.69 Liechtenstein 42.44 Slovakia 42.17 Bosnia and
Herzegovina 42.07 Andorra 41.81 Albania 41.69 Channel Islands 41.34 Portugal 41.17 Austria 39.59 Georgia 38.34 Montenegro 38.19 Switzerland 38.11 Tajikistan 33.47 Malta 30.34 Latvia 27.80 Slovenia 24.62 Croatia 21.98 Estonia 20.45 Iceland 18.43 San Marino 16.67 Cyprus 15.38 Russian Federation 13.17 Sweden 7.66 Finland 7.47
Status of the World’s Soil Resources Report, Regional Assessments of Soil Changes | Chapters 9 - 16
104
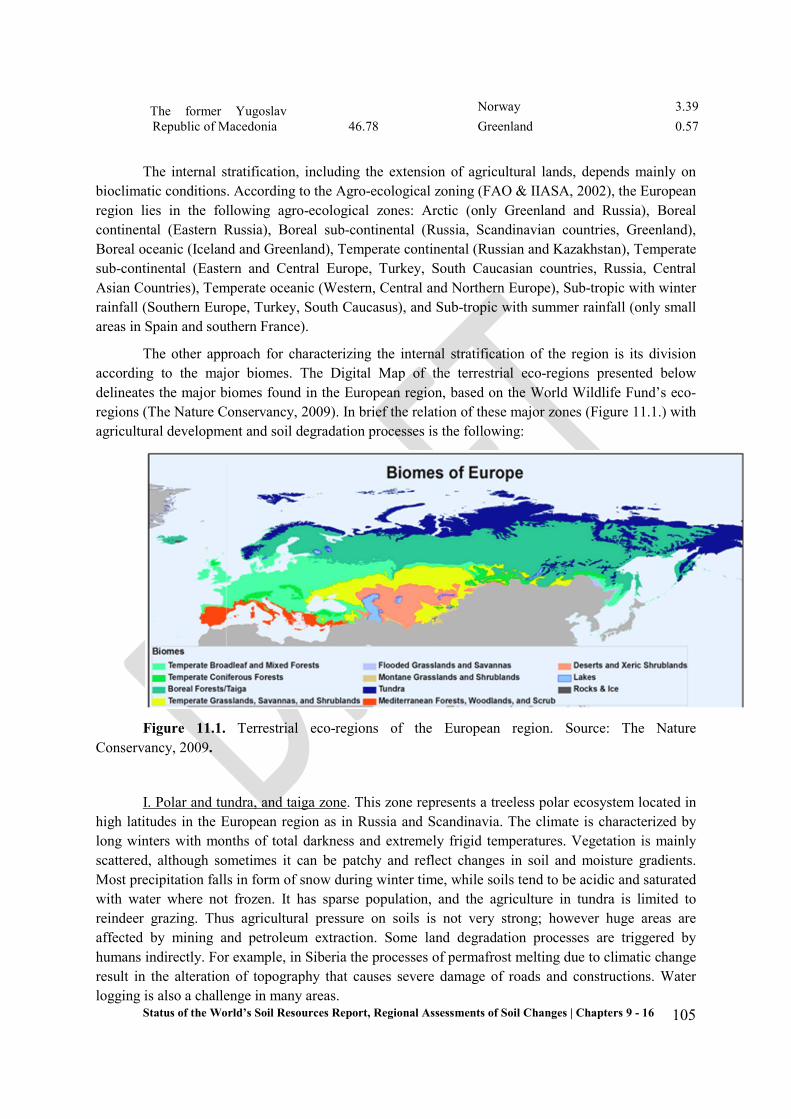
The former Yugoslav Republic of Macedonia 46.78
Norway 3.39 Greenland 0.57
The internal stratification, including the extension of agricultural lands, depends mainly on bioclimatic conditions. According to the Agro-ecological zoning (FAO & IIASA, 2002), the European region lies in the following agro-ecological zones: Arctic (only Greenland and Russia), Boreal continental (Eastern Russia), Boreal sub-continental (Russia, Scandinavian countries, Greenland), Boreal oceanic (Iceland and Greenland), Temperate continental (Russian and Kazakhstan), Temperate sub-continental (Eastern and Central Europe, Turkey, South Caucasian countries, Russia, Central Asian Countries), Temperate oceanic (Western, Central and Northern Europe), Sub-tropic with winter rainfall (Southern Europe, Turkey, South Caucasus), and Sub-tropic with summer rainfall (only small areas in Spain and southern France).
The other approach for characterizing the internal stratification of the region is its division according to the major biomes. The Digital Map of the terrestrial eco-regions presented below delineates the major biomes found in the European region, based on the World Wildlife Fund’s eco-regions (The Nature Conservancy, 2009). In brief the relation of these major zones (Figure 11.1.) with agricultural development and soil degradation processes is the following:
Figure 11.1. Terrestrial eco-regions of the European region. Source: The Nature
Conservancy, 2009.
I. Polar and tundra, and taiga zone. This zone represents a treeless polar ecosystem located in high latitudes in the European region as in Russia and Scandinavia. The climate is characterized by long winters with months of total darkness and extremely frigid temperatures. Vegetation is mainly scattered, although sometimes it can be patchy and reflect changes in soil and moisture gradients. Most precipitation falls in form of snow during winter time, while soils tend to be acidic and saturated with water where not frozen. It has sparse population, and the agriculture in tundra is limited to reindeer grazing. Thus agricultural pressure on soils is not very strong; however huge areas are affected by mining and petroleum extraction. Some land degradation processes are triggered by humans indirectly. For example, in Siberia the processes of permafrost melting due to climatic change result in the alteration of topography that causes severe damage of roads and constructions. Water logging is also a challenge in many areas.
Status of the World’s Soil Resources Report, Regional Assessments of Soil Changes | Chapters 9 - 16
105

II. Boreal Forest/Taiga. These ecosystems cover extensive areas with low annual temperature in northerly latitudes, with large expansion in central and eastern Russia, with a medium precipitation of 40-100 cm/year and partly in the form of snow. Predominant tree species are coniferous including Abies, Picea, Larix and Pinus as well as deciduous such as Betula spp. and Populus spp. The ground cover is mainly dominated by mosses and lichens. These biomes are known for its slow regeneration of mature forests, due to challenging climate and soil conditions as well as sensitive to acid rains and other form of pollutants. Agriculture in the taiga is restricted to relatively small areas used for livestock and production of such crops as rye, flax, millet, and vegetables. About 10-20 years ago soil acidification induced by industrial contamination of the atmosphere, so called “acid rains”, was an important menace to soil quality in Northern Europe; but nowadays the pressure of technogenic acid precipitation is strongly reduced (Jones et al., 2010).
III. Broad-leaf and mixed forest zone. This zone stretches across the European region from the British Isles to Western Siberia, and most of this territory is actually under cultivation. The forests in the temperate climate experience a wide range of variability in temperatures and precipitation. Species such as oak (Quercus spp.), beech (Fagus spp.), birch (Betula spp.), and maple (Acer spp.) typify the composition of this biome. Structurally, these forests are characterized by 4 layers: a canopy composed of mature full-sized dominant species and a slightly lower layer of mature trees, a shrub layer, and understory layer of grasses and other herbaceous plants. In contrast to tropical rain forests, most biodiversity is concentrated much closer to the forest floor. The zone has favorable humid climate and soils with a relatively high natural productivity. The anthropogenic pressure is strong, both due to the intensive agriculture and to high population density. The main threat to soils in this zone is water erosion favored by intensive deforestation, and capping due to high urbanization rate and a dense the road network. The high degree of industrialization in this biome results in extensive contamination of the soils.
IV. Temperate coniferous forest. This ecosystem is also called as temperate evergreen forests and is known for sustaining the highest levels of biomass in any terrestrial ecosystem after tropical rainforest. The area has warm summers and cool winters, resulting in a high variation of the vegetation, e.g. needle leaf trees, broadleaf evergreen trees or a mix of both types. The temperate evergreen forests are common in the coastal areas of regions with mild winters and heavy rainfall, or inland in drier climates or hilly areas. Predominant tree species include pine, cedar, fir, and redwood. Since in Europe this biome is mostly located in mountainous regions, the use of these areas is not very intensive.
III. Temperate grassland zone. This zone possesses the soils with the highest natural productivity such as Chernozems and Kastanozems which results in an intensive use of the land for agriculture that in places occupies up to 90-95% of the total land area. The main threats to soils in this zone are water and wind erosion. These processes are the main reasons for the loss of organic carbon in soils; however, the loss of carbon by mineralization from arable lands is also a common process. Since the population density and the development of industry are high in this zone, also capping and contamination are considered to be threats for the soils of the steppe areas. In places, especially in endorheic valleys, soil salinization may be observed.
IV. Mediterranean zone. This zone by definition is typical for the regions around the Mediterranean Sea. The ecosystems are characterized by hot and dry summers with cool and moist winters, with precipitation mostly during the winter months. Plant species are uniquely adapted to the stressful conditions of long, hot and dry summer. Most of the vegetation is adapted to fire and depend
Status of the World’s Soil Resources Report, Regional Assessments of Soil Changes | Chapters 9 - 16
106

on this disturbance for their persistence. Some species undertake seasonal movement in function of resource availability. The natural communities in this biome are highly sensitive to habitat fragmentation, grazing, and alteration of fire regimes (over burning or fire suppression), whereas native species are at risk from exotic species that establish and are easily spread in these communities. Therefore, it is possible to restore its communities, however fire regimes must be restored and the exotic species controlled effectively (WWF, 2014). The ecosystems and soils are vulnerable here due to dryness of climate and to abundance of shallow limestone soils. In many countries digression of pastures represents a serious problem. Erosion, organic carbon loss, and decline in biodiversity are the main challenges for the areas with Mediterranean climate. In places soil salinity may also limit the agricultural use of soils.
V. Subarid and arid zone. This zone includes deserts and semi- deserts mostly in Central Asia, but also in some areas in Anatolia (see Camci Çetin et al., 2007) and in the Iberian Peninsula (not shown at the Fig. 8.3.1.). The vegetation in this zone is sparse, and all the ecosystems are subject to desertification. The main threats to soils in the zone are salinization, sodification, and wind erosion. Salinization is a natural process in many areas, also favored by initially saline parent material of marine origin. However, the most menacing process is irrigation-induced soil salinization that leads to a drastic decline in soil fertility.
11.3 General threats to soils in the region Soil threats in the European region are complex, and although they are unevenly spread in the
region, their dimension is continental and frequently inter-linked. Soil threats not countered in time will lead to soil degradation, and the capacity of the soil to carry out its vital ecosystem functions will be lost. When many threats occur simultaneously, the combined effect tends to aggravate soil degradation (Jones et al., 2005). The implications of climate change on soil quality and land degradation tend to affect soil moisture content, anomalies have been recorded and projections of abnormalities stated in the Mediterranean and north European region (Calaca et al., 2006; Wong et al., 2011; García-Ruiz et al. 2011). For all central and northern Europe, where soil moisture levels exceed 75% of the field capacity, evapotranspiration has been measured to increase by about 0.3mm/day. More frequent and severe droughts will cause soil water retention mechanisms to collapse, leading to the onset of erosion and desertification (Jones et al., 2012). However, the impacts of climate change on soil degradation are yet an uncertain factor from an international scientific perspective (Kovats et al., 2014). General threats to soils in the European region include:
(1) Erosion (by wind and water)
According to a recent report (Jones et al., 2010) 105 million ha, or 16% of Europe's total land area (excluding Russia), were estimated to be affected by water erosion in the 1990s. 42 million ha are affected by wind erosion. A recent new model of soil erosion by water constructed by the JRC has estimated the surface area affected in EU‐27 at 1.3 million km². Almost 20% is subjected to a soil loss in excess of 10 t/ha/yr. In Russia the area affected by medium and strong water erosion is 51 million ha, or 26% of the agricultural land area (about 3.5% of the total land area) (Ministry of Natural Resources, 2006). In Ukraine the area affected by water and wind erosion is about one third of all the agricultural lands, or 14.4 million hectares. In Moldova the area affected by water erosion is about 840 thousand hectares or 33.6% of the total area of arable lands in the republic (Leah, 2012). In Belorussia the area affected by water erosion is 467 thousand hectares, and by wind erosion – 89 thousand hectares; totally eroded lands cover about 10% of the territory of the country. In Turkey, where 80% of soils are located on slopes steeper than 15%, the area affected by moderate, severe and
Status of the World’s Soil Resources Report, Regional Assessments of Soil Changes | Chapters 9 - 16
107

very severe erosion is 61.3 million hectares, or 78.7% of the total area of the country; wind erosion is active at the area of about 500 thousand hectares (Senor & Bayramin, 2013). The area of eroded soils in South Caucasus varies between 35 and 43% of total agricultural lands due to mountainous topography of the region. In Central Asia the total area affected by water erosion is over 30 million hectares, and by wind erosion – about 67 million hectares; in Uzbekistan up to 80% of agricultural land is affected by water erosion, and in Tajikistan the area of agricultural lands affected by water erosion is estimated between 60 and 97% according to different sources (CACILM, 2006). Long-term observations showed that on soil erosion on average decreased the yield of leguminous crops by 15%, of wheat – by 32%, potatoes – by 45%, and perennial grasses - by 25% (State Committee of Russian Federation on Land Resources and Land Planning, 1999).
(2) Soil organic carbon change
Organic matter is a key component of soil, controlling many vital functions (Jones et al., 2010). The loss of organic matter in soils is due both to erosion and to the increased rate of mineralization of organic carbon in arable soils. Methodologically it is difficult to separate erosion and mineralization-driven loss of humus in soils, but it should be kept in mind that soils with negligible erosional loss commonly also lose organic carbon under cultivation. The process of soil organic matter loss differs in rate in mineral and peat soils. In the latter group soil degradation after drainage may be fairly quick, producing intensive flux of carbon dioxide to the atmosphere and in places leading to complete mineralization of the organic layer and exposure of infertile underlying sediments. This threat is discussed below in section 8.3.4.3 in detail.
(3) Soil contamination
Due to more than 200 years of industrialization, soil contamination is a widespread problem in Europe. The most frequent contaminants are heavy metals and mineral oil. The number of sites where potentially polluting activities have taken place now stands at approximately 3 million. The issue is discussed in detail below in section 11.4.1.
(4) Soil acidification
Acidification involves the loss of base cations (e.g. calcium, magnesium, potassium, sodium) through leaching and replacement by acidic compounds, mainly soluble aluminum and iron complexes. Acidification is always accompanied by a decrease in a soil's capacity to neutralize acid, a process which is naturally irreversible when compared to human lifespan. Regulatory controls initiated in recent decades to mitigate global warming have had a significant impact on the emissions of pollutants that cause acidification, mainly decreased SO2 emissions. By 2020, it is expected that the risk of ecosystem acidification will only be an issue at some hot spots, in particular at the border area between the Netherlands and Germany (EEA, 2010a). Recovery from acid deposition is characterised by decreased concentrations of sulphate, nitrate and aluminium in soils. An increase in pH and acid-neutralising capacity (ANC), coupled with higher concentrations of base cations, would, in turn, improve the potential for biological recovery. However, given the delay in the response of soil to decreases in acid deposition, it is reasonable to suggest that many decades will be required for affected sites to recover fully. Additional information on trends in acidification is presented in the SOER 2010 Air Pollution Assessment (EEA, 2010a).
Status of the World’s Soil Resources Report, Regional Assessments of Soil Changes | Chapters 9 - 16
108

(5) Salinization and sodification
Salinization is the result of the accumulation of salts from irrigation water and fertilizers. High levels of salt eventually make soils unsuitable for plant growth. Improper irrigation and the use of highly mineralized water irrigation water leads to quick accumulation of soluble salts in soil profiles. It affects approximately 3.8 million ha in Europe. Though a number of practices of saline soil reclamation exist, most of them are expensive and not very effective, and all of them are site-specific, thus making salinity control a challenging task. Geographically this threat is localized in the drier parts of the region, mostly in central Asia, in southern Russia, in Turkey, Azerbaijan, Greece, Hungary, and Spain. This threat is discussed in more detail in section 11.4.4 below.
(6) Loss of soil biodiversity
Soil biodiversity reflects the enormous variety of organisms, from bacteria to mammals, which shape the metabolic capacity of terrestrial ecosystems and many soil functions. Soil biodiversity is affected by all of the threats and degradation processes listed. Soil biota provide numerous essential services, including releasing nutrients in forms that can be used by plants and other organisms, purifying water by removing contaminants and pathogens, contributing to the composition of the atmosphere by participating in the carbon cycle, and providing a major source of genetic and chemical resources (e.g. antibiotics).
Soil biology and ecology are relatively young sciences and even in a continent where
scientific investigations have been carried out for centuries, it is very difficult to find historical and systematic records of soil biodiversity across Europe. For this reason, baseline data that can be used for evaluating possible soil biodiversity decline in Europe are very rare. Among the exceptions, historical data exists on mushroom distribution and demonstrates substantial decline of diversity in some areas of Europe, including the Netherlands and Switzerland.
Despite the lack of data specific to soil biodiversity loss, changes can be inferred by
the vegetation and land use/land cover dynamics, and by the changes in agricultural and land management practices. The continuous increase of the areas under intensive agriculture, the expansion of artificial (urbanized) areas, soil contamination, compaction and the contraction of natural and semi-natural ecosystems, can be considered as a proxy of soil biodiversity decline. In a recent paper, Gardi et al. (2013) present an assessment of the potential threats to soil biodiversity in Europe. Based on the “Budget Allocation” method, a group of soil biodiversity experts ranked the most relevant threats for soil biodiversity. Human intensive exploitation, soil organic matter decline, habitat disruption, soil sealing were ranked as the most important threats for soil biodiversity, with climate change, genetically modified organisms, soil compaction and the spread of invasive species also considered important. Among the human intensive exploitation we have areas of high population density and/or intensive agricultural activity (e.g. cereals and industrial crops, animal husbandry, greenhouses, fruit orchards, vineyards and horticulture). In contrast, in some regions the abandonment of agricultural land has allowed natural vegetation to recover with the western European countries having higher abandonment than the conversion of semi-natural ecosystem into agricultural land in recent years, while the opposite occurred in the eastern countries.
Status of the World’s Soil Resources Report, Regional Assessments of Soil Changes | Chapters 9 - 16
109

(7) Water logging
Water logging occurs in many soils affected either by high groundwater table or by rainwater stagnation due to poor permeability. Most waterlogged soils have excessive moisture due to natural reasons, but also improper irrigation practices or disturbance of landscape hydrology by construction, mining, and traffic activities may cause waterlogging. The Russian Federation is the country that has the most extensive area of waterlogged soils in the world. Excessively moist soils, both mineral and organic, occupy 360 million hectares (21% of the territory of the country). Among the agricultural lands of Russia 23.9 million hectares or 10.1% are waterlogged. Unlike Russia, where the distribution of waterlogging is mostly due to natural reasons, in Central Asia excessive moisture is caused by irrigation. In Uzbekistan, the groundwater table is less than 2 meters below the surface in about one-third of irrigated lands. The area of waterlogged lands varies from 40% in the Fergana Valley to 80% in downstream Amu Darya. In dry areas waterlogging is commonly associated with salinization.
(8) Nutrient imbalance
The situation with the balance of nutrients in soils is much better in the European region than in the majority of other parts of the world. However, an important heterogeneity in the distribution of the nutrients supply in soils may be observed. In Western Europe the concentration of nutrients in soils is high due to application of high doses of fertilizer (Grizetti et al., 2007). The absolute leader in the use of nitrogen fertilizers are The Netherlands where in places the dose exceed 170 kg of N per ha; Germany, France, and the United Kingdom also apply nitrogen fertilizers intensively. The highest doses of phosphorus fertilizers in doses higher than 21 kg P per ha are used in some regions of Italy, Spain, France and Greece. These regions are running a risk of contamination of the ecosystem with excessive fertilizers rather than face the deficiencies in nutrients and lower production (e.g., for France: Lemercier et al., 2008, Follain et al., 2009). In the former Soviet Union republics, in contrast, the use of fertilizers is much lower, though Russia and Belorussia are major exporters of mineral fertilizers. Partly the restricted use of fertilizers is due to high natural productivity of soils in these countries, and partly due to the economic reasons. Underutilization of fertilizers in Central Asia is caused by their economic (un)availability for small farmers.
(9) Compaction
Compaction can be induced by the use of heavy machinery in agriculture. Compaction reduces the capacity of soil to store and conduct water, makes it less permeable for plant roots and increases the risk of soil loss by water erosion. Estimates of areas at risk of soil compaction vary. Some authors estimate that 36% of European subsoil have a high or very high susceptibility to compaction (Jones et al., 2011). Other sources report 32% of soils as being highly susceptible and 18% moderately affected (Jones et al., 2011). In Russia and Central Asian region soil compaction is also a challenge, especially if it is favored by natural tendency of soils to compression, for example, in soils with vertic or natric properties, or in heavy textured soils. These soils are located mainly in the southern part of Russian Federation, and in many places in Kazakhstan, Uzbekistan, Kyrgyzstan and Tajikistan.
(10) Sealing and capping
Status of the World’s Soil Resources Report, Regional Assessments of Soil Changes | Chapters 9 - 16
110

Sealing occurs when agricultural or non-developed land is lost to urban sprawl, industrial development or transport infrastructure. It normally includes the removal of topsoil layers and leads to the loss of important soil functions, such as food production, water storage or temperature regulation. The population of the Europe is approximately 11% of the world population (740 millions) and it has been grown at a rate of 0.15%/year, during the last decade. The urbanization rate is very high in small and highly developed countries in Western Europe, and the expansion of urban and industrial soils is intensive that makes soil sealing an important challenge for Europe. The issue is discussed in more detail in section 8.3.4.2 below.
11.4. Major threats for ecosystem in Europe and Eurasia
11.4.1 Soil Contamination Local contamination of soils is generally associated with intensive industrial activities,
inadequate waste disposal, mining, military activities or accidents. Management of these contaminated sites is a tiered process starting with a preliminary survey (searching for sites that are likely to be contaminated), followed by performing site investigations where the actual extent of contamination and its environmental impacts are defined, and finally implementing remedial and after care measures. Due to improvements in data collection, the number of recorded contaminated sites in Europe is expected to grow as investigations continue. If current trends continue and no changes in legislation are made, the numbers reported above are expected to increase by 50% by 2025 (Jones et al., 2012; EEA, 2014). There is some evidence of progress in remediation of contaminated sites, although the rate is slow. In recent years, around 17,000 sites have already been treated while many industrial plants have attempted to change their production processes to generate less waste. In addition, most countries now have legislation to control industrial wastes and prevent accidents. In theory, this should limit the introduction of pollutants into the environment. However, recent events − such as the flooding of industrial sites in Germany during extreme weather events leading to the dispersal of organic pollutants and the collapse of a dam at an aluminium plant in Hungary in October 2010 − shows that soil contamination can still occur from potentially polluting sites. Trends in the deposition of heavy metals from industrial emissions are discussed in the SOER 2010 Assessment on Air Pollution (EEA, 2010b).
Diffuse soil contamination is one of the specific threats to soils in European region even if it is barely or not directly apparent, covering very large areas. The contaminants include inorganic (metallic trace-elements, radionuclide) and organic (natural and xenobiotic molecules) compounds. The diversity of contaminants (particularly of the POPs, in constant evolution due to agrochemical developments) and the transformation of organic compounds in soils (by biological activity) into diverse metabolites hinders economic feasibility of soil surveys. The most widespread metallic trace elements in European soils comprise notably As, Cd, Cr, Cu, Hg, Ni, Pb, Zn that are mobilized in origin and transported to distant areas. The real extent of soil diffuse contamination by metallic trace elements is not clearly known. Even if some member states of EU and some other countries have already implemented long-term soil surveys, they lack a harmonized soil monitoring system. Radionuclides originate from nuclear accidents and nuclear testings, but there are also other sources such as fertilizers application (P). The most common xenobiotic chemicals include PAH, PCB and many pesticides still in use or inherited form the past (e.g. DDT and its metabolites).
Status of the World’s Soil Resources Report, Regional Assessments of Soil Changes | Chapters 9 - 16
111

The case study of Austria (section 11.5.1) includes the description of (i) local and diffuse pollution affecting the soils of this country, (ii) the effect of regulation on contamination trends, and (iii) the remediation activities being carried out.
11.4.2 Sealing and capping Soil sealing is especially intensive in Western Europe. On average, built-up and other manmade areas account for around 4% of the total area in EEA countries (data exclude Greece, Switzerland and United Kingdom), but not all of this is actually sealed (EEA, 2009). Member States with high sealing rates exceeding 5% of the national territory are Malta, the Netherlands, Belgium, Germany and Luxembourg (Prokop et al., 2011).The EEA has produced a high resolution soil sealing layer map for the whole of Europe for the year 2006 based on the analysis of satellite images. Much more detail can be found in the SOER Assessments on the Urban Environment (EEA, 2010c) and Land Use (EEA, 2010d), as well as in Prokop et al. (2011).
Productive soil continues to be lost to urban sprawl and transport infrastructures. Between 1990 and 2000, the sealed area in the EU-15 increased by 6% and at least 275 hectares of soil were lost per day in the EU, amounting to 1,000 km²/year. Between 2000 and 2006, the EU average loss increased by 3%, but by 14% in Ireland and Cyprus, and by 15% in Spain year (Prokop et al., 2011). Huber et al. (2008) provides an interesting insight into the development of baselines and thresholds to monitor soil sealing. See also the SOER 2010 Assessment on Land Use (EEA; 2010b) for additional details on urbanisation.
Soil sealing causes adverse effects on, or complete loss of, soil functions and prevents soil from fulfilling important ecological functions. Fluxes of gas, water and energy are reduced, affecting, for example, soil biodiversity. The water retention capacity and groundwater recharge of soil are reduced, resulting in several negative impacts such as a higher risk of floods. The reduction in the ability of soil to absorb rainfall, leading to rapid flow of water from sealed surfaces to river channels, results in damaging flood peaks. Above-ground biodiversity is affected through fragmentation of habitats and the disruption of ecological corridors. These indirect impacts affect areas much larger than the sealed areas themselves. Built-up land is lost for other uses such as agriculture and forestry, as sealed soils are often fertile and high value soils. Soil sealing appears to be almost irreversible and may result in an unnecessary loss of good quality soil. Soil sealing can lead to the contamination of soil and groundwater sources because of higher volumes of unfiltered runoff water from housing, roads and industrial sites. This is exacerbated during major flood events and was clearly demonstrated by the 2002 floods on the Elbe which deposited levels of dioxins, PCBs and mercury from industrial storage areas to the soils of floodplains, in excess of national health thresholds (Umlauf et al., 2005).
In the Russian Federation the density of population is low, and the area of settlements constitutes only 0.3% of the national territory. However, the vicinities of megacities suffer intensive urban sprawl and land use change from agricultural use to summer houses.
11.4.3 Soil organic matter decline Soil organic matter is essentially derived from residual plant and animal material, transformed
(humified) by microbes and decomposed under the influence of temperature, moisture and ambient soil conditions. The stable fraction of organic substances in soil is known as complexed organic matter (previously referred as humus). Soil organic matter (SOM) plays a major role in maintaining
Status of the World’s Soil Resources Report, Regional Assessments of Soil Changes | Chapters 9 - 16
112

soil functions because of its influence on soil structure and stability, water retention, soil biodiversity, and as a source of plant nutrients. The primary constituent of SOM is soil organic carbon. Some 45% of soils in Europe have a low or very low organic matter content (0–2% organic carbon). This is particularly evident in the soils of many southern European countries, but is also evident in parts of France, the United Kingdom, Germany, Norway and Belgium. A key driver is the conversion of woodland and grassland to arable crops. The soils of EU-27 Member States are estimated to store between 73 and 79 billion tons of carbon, which is equivalent to almost 50 times our annual greenhouse gas emissions. However, intensive and continuous arable production may lead to a decline of soil organic matter. In 2009, European cropland emitted an average of 0.45 tons of CO2 per hectare (much of which resulted from land conversion) (EEA, 2011). The conversion of peatlands and their use is particularly worrying. For instance, although only 8% of the farmland in Germany is on peatland, it is responsible for about 30% of the total greenhouse gas emissions of its whole farming sector (EC DG ENV & JRC; 2010). However, with appropriate management practices, soil organic matter can be maintained and even increased. Apart from peatlands, particular attention should be paid to the preservation of permanent pastures and the management of forests soils, as carbon age in the latter can be as high as 400-1,000 years (EC DG ENV & JRC; 2010). Keeping carbon stocks is thus essential for the fulfilment of present and future emission reduction commitments of the EU. In Russia more than 56 million hectare of mineral soils of the lands used in agriculture are characterized by the loss of organic matter (Shoba et al., 2010), in Ukraine – 18.4 million hectares (Laktionova et al., 2010), in Moldova – more than 1 million hectare (Leah, 2012). Turkey was reported to have about 70% of agricultural soils (Senol and Bayramin, 2013), but the rate and extent of dehumification are unknown yet. In South Caucasus republics the loss in organic matter was not well documented; it is mostly related to the fact that in mountainous countries the separation of erosion and mineralization-driven loss of humus is difficult. Similar situation exists in the data reported for Central Asia: the cultivation of virgin lands in Kazakhstan resulted in the loss of approximately 570 million tons of carbon from soils, but a significant part has been transported by the wind.
Several factors are responsible for a decline in SOM and many of them relate to human activity: conversion of grassland, forests and natural vegetation to arable land; deep ploughing of arable soils; drainage, fertiliser use; tillage of peat soils; crop rotations with reduced proportion of grasses; soil erosion; and wild fires (Kibblewhite et al., 2005). High soil temperatures and moist conditions accelerate soil respiration and thus increase CO2 emissions (Brito et al., 2005). Excess nitrogen in the soil from high fertiliser application rates and/or low plant uptake can cause an increase in mineralisation of organic carbon which, in turn, leads to an increased loss of carbon from soils. Maximum nitrogen values are reached in areas with high livestock populations, intensive fruit and vegetable cropping, or cereal production with imbalanced fertilisation practices. While in extreme situations, the surplus soil nitrogen can be as high as 300 kg N ha-1 (EC, 2002), estimates show that 15% of land in the EU-27 exhibits a surplus in excess of 40 kg N ha-1. For reference, while rates vary from crop to crop, the IRENA Mineral Fertiliser Consumption indicator (EEA, 2005a) estimates that average application rates of nitrogen fertiliser for EU-15 in 2000 ranged from 8–179 kg N ha-1.
There is growing realisation of the role of soil, in particular peat, as a store of carbon and its role in managing terrestrial fluxes of atmospheric carbon dioxide (CO2). Other than in tropical ecosystems, soil contains about twice as much organic carbon as above-ground vegetation. Soil organic carbon stocks in the EU-27 are estimated to be between 73 to 79 billion tonnes, of which about 50% is to be found in the peatlands and forest soils of Sweden, Finland and the United Kingdom (Schils et al., 2008). Peat soils contain the highest concentration of organic matter in all
Status of the World’s Soil Resources Report, Regional Assessments of Soil Changes | Chapters 9 - 16
113

soils. Peatlands are currently under threat from unsustainable practices such as drainage, clearance for agriculture, fires, climate change and extraction. The current area of peatland in the EU is estimated at more than 318 000 km2, mainly in the northern latitudes. While there is no harmonised exhaustive inventory of peat stocks in Europe, the CLIMSOIL report (Schils et al., 2008) estimated that more than 20% (65 000 km2) of all peatlands have been drained for agriculture, 28% (almost 90 000 km2) for forestry and 0.7% (2 273 km2) for peat extraction. The degradation of organic soils is especially pronounced in Belorussia, where about 190 thousand hectares of peat soils are strongly degraded: the peat layer was completely mineralized, and infertile sands were exposed at the area of 18.2 thousand hectares. In the Russian Federation the mineralization of peat is estimated at extensive drained areas with Histosols located mainly in the north of the European part of the country. The total area of drained peatland was estimated as 3.86 million hectares (Inisheva, 2005), but the area of deeply degraded drained peat soils is unknown. Actually extensive areas of once drained peatlands are abandoned due to the movement of agriculture to more climatically favorable regions due to market reasons. These dry peatlands are subjected to fires in rainless summer periods; in 2010 peat fires in Central European Russia caused a real ecological catastrophe that made millions of people moving from their homes and provoked a partial collapse of air transportation because of dense smoke over thousands of square kilometers. Also a common practice in Russia is forest drainage for the improvement of forest productivity in waterlogged areas. Actually about 3 million hectares of forested organic soils are drained in Russia, mainly in its European part. Though the productivity of wood increased, the loss of organic carbon from soils is also evident. In Ireland peatlands are widely used for energy production, and annual production of peat in the country peaked in 1995 at 8.0 Mt (Devlin, Talbot, 2014).
11.4.4 Salinization and sodification The accumulation of salt in soil is commonly referred to as salinization. While naturally saline
soils exist in certain parts of Europe, the main concern is the increase in salt content in soils resulting from human interventions such as inappropriate irrigation practices, use of salt-rich irrigation water and/or poor drainage conditions. Locally, the use of salt for de-icing can be a contributing factor. The primary method of controlling soil salinity is to use excess water to flush the salts from the soil (in most cases where salinization is a problem, this must inevitably be done with high quality irrigation water).
Thresholds to define saline soils are highly specific and depend on the type of salt and land use practices (Huber et al., 2008). Excess levels of salts are believed to affect around 3.8 million ha in Europe (EEA, 1995). While naturally saline soils occur in Spain, Hungary, Greece and Bulgaria, artificially induced salinization is affecting significant parts of Sicily and the Ebro Valley in Spain and more locally in other parts of Italy, Hungary, Greece, Portugal, France and Slovakia (Figure 11.2).
In the post-Soviet countries saline soils cover the most extensive areas in Kazakhstan, Russia, Uzbekistan, Turkmenistan, Ukraine, and Azerbaijan (Figure 11.3). In other countries saline soils are present only locally, either on the marine marsh deposits or in the areas of salt mining. For example, in Belorussia salt-affected soils occupy less that 1 thousand hectares in the potassium fertilizers mines in Solikamsk region (Golovatyi et al., 2010). The area occupied by saline soils in different countries is shown in Table 11.2.
Table 11.2.The areas of saline soils in the countries with major extent of soil salinization in the European region
Status of the World’s Soil Resources Report, Regional Assessments of Soil Changes | Chapters 9 - 16
114

Country Area of salt-affected soil, mln ha
Data source
Kazakhstan
111.5 Borovskii, 1982
Russia 54.0 Shishov and Pankova, 2006
Uzbekistan 20.8 Kuziev and Sektimenko, 2009
Turkmenistan
14.1 Pankova, 1992
Ukraine 4.0 Novikova, 2009
Turkey 1.5 Senor and Bayramin, 2013
Spain 0.63 Toth et al., 2008
Hungary 0.56 Tóth and Szendrei, 2006
Azerbaijan 0.51 Ismyilov, 2013
Kazakhstan. The area of saline soils in Kazakhstan, including Solonetz, alkaline soils, and complexes of Solonetz with other soils is 111.55 million hectares, or 41% of the national territory (Borovskii, 1982). Saline soils are present everywhere except of mountainous territories. They are common in the steppe zone covering about 30% of its area; in dry steppe, semi-desert and desert zones these soils occupy up to 50% of the area. Salt-affected soils are represented mainly by Solonetz and alkaline soils. Solonchaks cover only 1-3% of the area of salt-affected soils in the steppe zone, and 7-13% of the area of salt-affected soils in the semi-desert and desert zones.
Russian Federation. The area of salt-affected soils in Russia, including Solonetz, alkaline soils and combinations of salt-affected soils with other soil groups, is 54 million hectares or 3.3% of the total area of the country. The category of salt-affected soils includes all the soils with a salic horizon starting within the first 1 meter. Salt-affected soils in Russia are located in the European part of the country and Eastern Siberia within the steppe, dry steppe and semi-desert zones. The major part of the area is occupied with Solonetz and alkaline soils. In Eastern Siberia and in the Far East salt-affected soils are localized in closed inter-mountain basins with dry steppe landscapes and semiarid to arid climate. In Yakutia (Sakha) salt-affected soils form over permafrost in thermo-karst depressions (so-called alases) in taiga larch forest. Sporadically saline soils are present along the northern and eastern shores of the country, but their area is insignificant and they are not reflected at small scaled soil maps (Shishov and Pankova, 2006).
Status of the World’s Soil Resources Report, Regional Assessments of Soil Changes | Chapters 9 - 16
115

Figure 11.2. Soil salinization on the territory of the European region: original map prepared by I.
Alyabina basing on the maps of former Soviet Union (Afonin et al., 2008), European Union (Tóth et al., 2008) and Turkey (GDRS, 1987)
Uzbekistan. The area of salt-affected soils in Uzbekistan is 20.8 million hectares, or 46.5% of the country’s territory. Saline soils are met ubiquitously with an exception of mountainous regions and well drained flood valleys. Salt-affected soils in the country are represented by Solonchaks of closed depressions and of the bottom of the mostly dried Aral Sea, by Salic Calcisols of uplifted areas such as Ustyurt plateau and Kyzyl-Kum desert, by Takyric Salic Fluvisols of alluvial and deltaic plains, and by extensive irrigated soils of various grades of human-induced salinization.
Turkmenistan. The area of salt-affected soils in Turkmenistan is 14.1 million hectares or 28.7% of the total area of the country. These soils are distributed all over the country, but the major concentration of saline soils is observed in the western part of the country close to the Caspian Sea. Most of these soils are not classified as Solonchaks and belong to the groups of Salic Calcisols and Takyric Salic Calcisols.
Ukraine. The area covered by salt-affected soils in Ukraine is about 4 million hectares or 6.6% of the national territory (Novikova, 2009). Most of these lands are not used in agriculture; they are located mostly in the southern and eastern parts of the country within the steppe and forested steppe zones. Most of these soils are classified as Solonetz and other soils with various grades of alkalinity.
Turkey. The major salt affected soils localized in Turkey are as follows; Konya-Eregli, the Aksaray and Malya plains of Central Anatolia, and the alluvial plains of lower Seyhan, Igdır, Menemen, Bafra, Söke, Acıpayam and Salihli of all the major river systems. The distribution of the salt-affected arable lands are: 60% slightly saline, 19.6% saline, 0.4% alkali and 8% saline-alkali respectively. Although sodium salts are the main components of the salt-affected soils, magnesium
Status of the World’s Soil Resources Report, Regional Assessments of Soil Changes | Chapters 9 - 16
116
soils in Denizli-Acıpayam, potassium-nitrate-alkali soils in Nigde- Bor, Kayseri, and gypsiferous soils in Central Anatolia are also common in Turkey.
Spain. In Spain 3% of the 3.5 million hectares of irrigated land is severely affected, reducing markedly its agricultural potential while another 15 % is under serious risk. Soil salinization is a frequent problem in arid and semiarid regions like Southeast Spain (Hernández Bastida et al., 2004). In these areas, agriculture with a great water requirement combined with high water tables and an adverse climate (increased occurrence of extreme drought events) have forced irrigation with poor quality water, causing processes of soil degradation and salinization, limiting crop growth and the production capacity (Pérez-Sirvent et al., 2003; Acosta et al., 2011).
Hungary. In Hungary Solonchak soils that are per definition saline soils, occupy a total area of only 4.7 thousand hectares and are mainly located in low-lying areas, typically shorelines of saline/sodic lakes, in the region between the Danube and Tisza Rivers, but they also occur in patches east of the Tisza River. These soils are not cropped, but sustain native halophyte vegetation which is grazed. Solonchak-Solonetz soils with a total area of 65.9 thousand hectares are also located mostly between the Danube and Tisza Rivers, but above deeper groundwater level, ca at 1m. These soils sustain a native halophyte vegetation which is grazed. Mollic Gleyic Solonetz soils occupy total area 274.9 thousand hectares and are characterized by large exchangeable sodium percent and not high salt content. Mollic Solonetz with a total area 212.2 thousand hectares have minor limitations for cultivation of crops and are typically ploughed.
Azerbaijan. The area of salt-affected soils in Azerbaijan is estimated to be 510 thousand hectares or 5.9% of the territory of the country. The saline soils are located mainly on the coastal plain of the Kaspian Sea, in the Kura-Araksinskaya depression and at the Salyan, Mugansk, and Milsk plains. These soils are represented mainly by Solonchaks, Salic Gleysols and in rare cases by Salic Calcisols.
While several studies show that salinization levels in soils in countries such as Spain, Greece and Hungary are increasing (De Paz et al., 2004), systematic data on trends across Europe are not available.
11.5. Case studies
11.5.1 Case study: Austria
Austria is a relatively small country that is land-locked in central Europe and shares borders with eight countries (Gentile et al., 2009). Austria’s location in the middle of Europe gives rise to specific environmental issues such as the pressures from intensive freight transit traffic (e.g. air emissions, habitat disruption) and the trans-boundary exchange of acidifying air pollutants and tropospheric ozone precursors (e.g. damage to forests and soil). In addition, only 37% of the national territory is suitable for permanent settlements. This is due to the country’s geo-morphological conditions with more than 60% of the territory occupied by mountains. As a consequence, urban sprawl and land consumption occurs in restricted areas, with resulting high pressures on the environment.
Overall, the Austrian soils are in a good condition, but their ecological functionality is at risk from diffuse and local accumulation of pollutants, intensive use of land, sealing and erosion. The more affected areas are located in the Alpine region, where forest soils are threatened by air deposition, and in urban areas, where sealing and contamination put urban soils under a growing
Status of the World’s Soil Resources Report, Regional Assessments of Soil Changes | Chapters 9 - 16
117

pressure. Sealing is also present in rural areas due to the increasing urban sprawl and new road construction. In arable land, soil erosion causes considerable stress due to a combination of insufficient erosion protection measures and inappropriate soil management. Soil erosion is higher on steeper slopes and land under permanent crops (vineyards, orchards), as well as on land cultivated with maize, sugar beet, potatoes and vegetables.
The use of heavy machinery, especially in case of wet soil conditions, often results in the compaction of the topsoil, which can reach in some cases the subsoil layer. Soil compaction mainly occurs in areas with intensive agriculture and, locally, in other areas due to forest management activities.
Floods happen occasionally in the floodplains of eastern Austria after extraordinary weather conditions (heavy rainfalls) whereas landslides occur quite often in the alpine regions with steep slopes. Adequate management measures for the protection of forests and afforestation, as well as technical engineering measures, are being implemented to prevent the consequences of such events and reduce the risks.
Salinization is found in the areas around the lake Neusiedl, which is located in the north-eastern part, at the Hungarian border. Salinization is causing problems only in small areas with intensively managed and irrigated agricultural soils. Information on decline of organic matter is scarce. Some areas of arable land show low organic matter content.
Contamination from heavy metals is mainly due to long-range trans-boundary air pollution, especially in forest soils due to the high filter capacity of vegetation cover and the barrier effects of the Alps to air mass circulation. Contamination by heavy metals and persistent organic pollutants can also be found in restricted areas originating from local industrial or agricultural sources.
The restructuring of the industrial sector and in particular the decline of the heavy industry in the 1990s did not have observable effects on environmental pressures. Despite the decrease of the overall production, the contribution of this sector to the overall emissions is still considerable. Adverse effects of soil degradation are still to be expected, despite the continuing improvement in the implementation of regulations and the reduction of pollutant emissions, since many pollutants (e.g. heavy metals) are accumulating in the soil. The major indirect impacts are on biodiversity and the quality of groundwater resources.
The threats to soil in Austria
Contamination
Diffuse contamination
Soil surveys targeted at the four most relevant heavy metals (mercury, lead, cadmium and copper) showed increased lead and cadmium concentrations in topsoil with respect to background values in the regions of the Northern and Southern Limestone Alps. This may be attributed both to local sources of pollution and to long-range trans-boundary air pollution. Lead enrichment is particularly relevant in grassland and forest soils - the latter due to the high filtering effect of the vegetation cover. In these sites, the guidance values for lead established by the Austrian Standard (ÖNORM L 1075, 2004) were exceeded in more than 5% and over 3% of the monitored sites respectively.
Cadmium concentrations exceeded the guidance value in 5% of the monitoring sites in forests and in 6 % of the sites in grassland areas.
Status of the World’s Soil Resources Report, Regional Assessments of Soil Changes | Chapters 9 - 16
118
On the other hand, soil pollution with mercury and copper only occurs in restricted areas. In particular, copper contamination can be found mostly in the surroundings of industrial sites processing copper ore and in areas with intensive animal husbandry. The latter is due to the application of high amounts of pig manure with high copper content, originated by the use of copper-enriched ready-made food. Other sources of copper inputs in soil are sewage sludge and compost as well as the application of pesticides containing copper. About 2% of the forest and grassland monitored sites exceeded the guidance value for copper.
Contamination from Persistent Organic Pollutants (POPs) was found in a limited number of sites, some of which required to be cleaned-up. POP pollution is mainly occurring in urban areas and around industries. It can also derive from long-range trans-boundary air pollution.
Emissions of POPs have been substantially reduced in the past years, which should have resulted in lower concentrations in the soil. However, a systematic survey targeted at organic pollutants in soil has not been carried out. For this and other reasons, such as the low mobility of these pollutants and the appearance on the market of new chemical products, the importance of the problem may be expected to increase in the future (Umweltbundesamt, 2004 and 2007b).
Contamination from local sources
In Austria, soil contamination requiring clean up may be present at 2500 sites. Potentially polluting activities are estimated to have occurred at 80000 sites (including the 2500 sites already mentioned) and investigation is needed to establish whether remediation is required. By contrast, approximately 70 heavily contaminated sites have been cleaned up in the past two decades. Industrial production and commercial services, municipal and industrial waste treatment, and oil storage are reported to be the most important sources. National reports indicate that heavy metals, polycyclic aromatic hydrocarbons, cyanides and mineral oil are the most frequent soil contaminants at investigated sites. Nearly two-thirds of the remediation expenditure come from public budgets. Although considerable efforts have been made already, it will take decades to clean up a legacy of contamination. New contamination is not expected due to the implementation of prevention measures in place.
Salinization
In Austria, salinization is of little relevance as compared to other soil threats. According to a survey carried out in the period 1958-1970 (agricultural soil mapping), the areas where soil is affected by salts amounted to only 2500 ha. In addition, soda-containing soils are estimated to cover 2000 ha. In these areas, strict rules for agricultural production apply, due to nature protection issues. Finally, conditions for salinization occur in small these areas in Eastern Austria. In particular, these are areas with a negative water balance, salt-sensible soils, low groundwater table and salty groundwater. Future changes in climate and land management practices could lead to the salinization of soils also in these areas. More recent information is not available.
Erosion
Soil erosion in Austria is mainly caused by unsustainable agricultural practices, construction of buildings and roads, and the use of leisure infrastructures. Recent estimates report that about 13% of the agricultural land or more than 5% of the total territory is potentially under a high risk for water erosion. The spatial distribution of potential erosion risk is very heterogeneous. The most affected
Status of the World’s Soil Resources Report, Regional Assessments of Soil Changes | Chapters 9 - 16
119

areas include the productive areas of the southeast and northeast plains and hills, the Alpine foreland and the Carinthian basin (Strauss & Klaghofer, 2006).
Except for the results of some scientific studies, Information on wind erosion is scarce. Loss of soil by wind has been observed in the lowlands of Eastern Austria. The areas at risk are the areas with sandy soils and, in the dry season, some areas covered with black soils (Chernozems). In the past, some measures, such as reforestation of lowlands, were carried out to protect soil against wind. New windbreaks are planted annually, thus increasing the protected areas by several thousand hectares per year. The presence of wind erosion risk in sandy areas has been acknowledged since the 18th century. This early recognition of the problem and the measures adopted have resulted in the stabilisation of the erosion in these areas. (Strauss & Klaghofer, 2006).
Soil erosion is not expected to increase in the future due to the implementation of prevention and reduction measures. However, major pressures may come from future climate and land use changes (conversion of grassland into arable land) or significant changes in crop rotation, although these are not very likely to occur.
Decline in soil organic matter
According to the results of a recent monitoring programme that consisted in particular in measuring the content of organic carbon in topsoil, more than half of all grassland and forest sites have a content of organic matter in topsoil of over 8% (high). On the other hand, in arable land, most of the monitored sites show an organic matter content ranging from 2% to 4% (medium), while a low or very low content (< 2%) is found in a quarter of the sites. In the areas with low organic matter content, the natural soil functions will be at risk in the long run (Umweltbundesamt, 2004). Measurements of organic matter content in topsoil also provide an indication of the content in soil organic carbon.
Overall, the organic carbon stock in Austrian soils is not expected to be reduced in the future, due to the implementation of soil organic matter preservation measures in agriculture. However, there is currently a lack of sound data for the assessment of changes of soil organic matter. Major pressures may come from future climate and land use changes (e.g. conversions of grassland into arable land and urban expansion).
Sealing
Following a generalised trend in Europe, the sealing of the soil due to the increase of built up areas and transport infrastructures has shown a growing trend in Austria in the past decades, against a slight increase in population.
In total, about 6% (or around 4800 km²) of the country area is occupied by buildings or transport infrastructures, and about 40 per cent of this area is sealed. About half of the new residential buildings in 2001 were single family dwellings or semi-detached houses which, in comparison to multi-family residences or other high-density structures, occupy a considerably larger surface area (Umweltbundesamt, 2006). In the period 2001-2006, the average increase in built-up areas was about 17 ha/day. This resulted in a daily increment of soil actually sealed of 5 ha in 2005 and 2006. Although slightly decreasing year after year since 2001, this figure still exceeds by a factor five the relevant policy target (Umweltbundesamt, 2007a). These high rates may lead to the saturation of the available space in some regions. In Vorarlberg, for example, one fifth of the permanent settlement area is already built-up.
Status of the World’s Soil Resources Report, Regional Assessments of Soil Changes | Chapters 9 - 16
120

These increases are due to changes in the standard of living and lifestyles, as well as associated settlement and transport activities, rather than population growth. This is particularly evident in rural regions where the built up area continues to grow despite a net decrease in population.
Hydro-geological risks
Erosion and erosion control have been a major issue for a long time in Austria, due to its specific geo-morphological configuration, for which more than 60% of the territory is occupied by mountains and presents extremely high relief energies. The focus of past and current activities has been on the control of torrents and avalanches, as these are major threats to human life in alpine environments (Strauss & Klaghofer, 2006).
According to BMLFUW (2001), about 67% of the territory may be classified as either part of a torrent watershed, avalanche watershed or a general risk area. The regional coverage ranges from 16% in Burgenland to 91% in Tyrol. The amount of budget available for measures against these risks increased with more than 45%, from 70 million EUR in 2001 to 102 million EUR in 2005 (BMLFUW, 2006).
In case of extraordinary weather conditions (heavy rainfalls), floods happen occasionally in the floodplains of eastern Austria. The flood events in August 2002 affected large parts of the national territory. Particularly Upper Austria and Lower Austria suffered heavy damage, as floods reached areas that were previously considered safe. More details on this event can be found in the special chapter on floods of the 7th State of Environment report (Umweltbundesamt, 2004).
Cross-cutting issues
Brownfields
In general, the remediation of contaminated sites based on fit-for-use remediation goals should be seen not only as bringing an improvement to the status of the environment through the restoration of soil functions but also as bringing benefits to economy and society. In Austria, there is a potential for brownfield redevelopment. The average consumption of green-field areas for housing and traffic was 17 ha/day in the period 2001-2006. If the present trend for land consumption continues at the same rate, the areas allocated for housing and traffic would be doubled in 50 years. On the other hand, only 37% of the national territory is suitable for permanent settlements.
According to an unofficial definition, brownfields are sites of formerly industrial or commercial used land, now derelict or underused, or sites that have been affected by former uses of the site or surrounding land, require intervention to go back to beneficial use, and may have effective or suspected contamination problems. The number of brownfield sites in Austria is in the range of 3.000-6.000, covering an area between 8.000 and 13.000 ha. According to estimates based on their previous use, about 85% of the industrial brownfield sites may present no or little contamination and could be revitalised and reused without public funding for remediation.
Considering an increase of industrial brownfield sites of about 3 ha per day, about a quarter of the annual land requirement for housing and economic activities could be saved by reconverting brownfields to a productive use. To this purpose some measures have been proposed. These include policy measures, sustainable and innovative land management, and mechanisms for the involvement of all stakeholder groups. However, redevelopment activities are yet .to be started. For more details see (Umweltbundesamt, 2007b).
Status of the World’s Soil Resources Report, Regional Assessments of Soil Changes | Chapters 9 - 16
121
Soil services
The main soil services in Austria include:
• protection of groundwater and spring water in mountain areas, resulting in general in the availability of water in sufficient quality and quantities (about 99% of drinking water supplies originate from groundwater);
• high diversity and mosaic distribution of geology and soils enables a high level of diversity of landscapes and biodiversity;
• availability of highly productive soils for agricultural and forestry production;
• availability of soils for building purposes, which is limited due to the relatively small permanent settlement area available (37 % of the total territory).
Main impacts of soil degradation in Austria:
• biodiversity decline from soil sealing and contamination;
• impairment of groundwater quality from diffuse pollution and local contamination (there may be 2500 sites in Austria needing remediation, of which less 3% have been cleaned-up since 1989);
• destruction of natural landscapes from soil sealing and unsustainable agricultural practices.
Hot spots
The Alpine region is an environmental sensitive area with a high level of diversity of landscapes, soils, flora and fauna. This region is under threat of acidification and contamination from deposition of air-borne pollutants on the one hand, and erosion and landslides because of steep slopes on the other hand.
Some industrial areas are seriously contaminated from diffuse sources. These include, in particular, the city of Linz, the Inn valley in Tyrol and Arnoldstein in Carinthia. In addition, a high concentration of sites which are potentially contaminated can be found in the most urbanised and industrialised regions, in particular the cities of Vienna, Linz and Salzburg, the Inn valley in Tyrol and the Mur and Mürz valley in Styria.
Outlooks
Soil resources in Austria are on average in a good condition; however soil functions are still being threatened by the deposition of airborne pollutants, a legacy of contamination in industrial and urban areas and the continuing increase of built-up areas.
There are some uncertainties on future trends of soil contamination due to the lack of data on the presence in soil of organic pollutants and the appearance on the market of new chemical products whose effects on the environment are not fully understood (Umweltbundesamt, 2004 and 2007b). However, the inputs of pollutants (in particular lead, cadmium and POPs) in the soil are expected to decrease, since emission and thus depositions are diminishing due to the implementation of regulations and preventive measures in place. On the other hand, acidifying substances, in particular NOx from traffic sources, are expected to increase. Moreover, soil contamination and its adverse effects are still to be expected in the long run since many pollutants (e.g. heavy metals and POPs) have low mobility and a high persistence and accumulate in the soil. In addition, the increase of the
Status of the World’s Soil Resources Report, Regional Assessments of Soil Changes | Chapters 9 - 16
122

emissions of acidifying substances may result in an increase of the pressures on forests and forest soils. The major indirect impacts will be in terms of the loss of biodiversity and the quality of groundwater resources.
In urban and industrial areas, no new contamination is expected due to prevention measures in place. Nevertheless, the clean-up of historical contamination will continue to pose a challenge. In fact, although considerable efforts have been made already, in particular in the investigation and monitoring of contamination, slow progress is made in the implementation of remedial measures. If recent trends continue in the future, it will take decades to clean-up the legacy of contamination.
The amount of soil actually sealed through the construction of buildings and infrastructures is currently increasing at a rate of 5 ha/day. This figure exceeds five times the 2010 sustainability target. As in Austria only 37% of the territory is suitable for permanent settlements, high increases of built-up areas may also lead to the saturation of the available space. This is more likely to occur in some regions currently registering the highest rates, especially in rural areas. On the other hand, the redevelopment of brownfields and the clean-up of historical contamination are expected to provide opportunities for the reduction of the consumption of green-land, as well as opportunities for economic and technological development, and job creation. Brownfields in Austria could cover about one quarter of the current needs for land.
Soil degradation in agricultural areas, especially erosion, compaction and decline in organic matter content is not expected to increase in the future due to the implementation of prevention and reduction measures (such as the measures included in the national Agri-Environmental Programme). For the same reasons, the organic carbon stock in Austrian soils is expected to remain stable on average. However, major pressures may still come from future changes in climate, land use (conversion of grassland into arable land) and crop rotation, or from increases in livestock.
Climate change and the development of the tourist sector may result in increased hydro-geological risks.
The measures included in the national Agri-Environmental Programme are contributing to the reduction of soil degradation, especially erosion, compaction and decline in organic matter content.
Investigations and monitoring of historical contamination are quite advanced. More is known on contaminated sites but remediation activities are progressing slowly. In Austria, remediation is aimed at removing the source of contamination and restoring the soil functions to a certain extent. The objective is to make the soil again fit for specific uses, in particular for the protection of groundwater resources (ultimately, the source for 99% of drinking water supplies). Further progress with the clean-up of historical contamination and brownfield redevelopment will also provide opportunities for the reduction of land consumption, economic and technological development, and job creation.
11.5.2. Case study: UKRAINE
About 60 % of the soils of Ukraine are Chernozems – soils known for their unique structure, chemical properties and inherent fertility. These soils are distinguished by a very deep (more than 1 m) humus-enriched layer, perfectly expressed granular structure, almost optimal bulk density and a good and satisfactory stock of nutrients. However, these favorable soil properties are only present in soils under virgin ecosystems. Chernozems, the best soil in the world («tsar of soil», after Vasiliy Dokuchaev), are very sensitive to anthropogenic intervention particularly when intensively tilled they rapidly degrade. These soils are characterized by a significant decline of their potential of productivity
Status of the World’s Soil Resources Report, Regional Assessments of Soil Changes | Chapters 9 - 16
123
(that is for Ukraine equals to 80-90 million tons of grain crops or up to 2 tons per person per year) and it is almost impossible to maintain good ecological conditions on their surface.
The fragility of the soils of Ukraine are well studied and known. Nevertheless, this has not been an obstacle for intensive development leading to their severe degradation. About a third part of the arable territory is eroded, 30% of organic matter is lost, approximately 40% of soils have a compacted layer, the stocks of nutrients are noticeably decreased, numerous problems are observed on ameliorated soils (Balyuk and Medvedev, 2012).
Comparison of cultivated soils with virgin analogues shows that for the last 40-50 years the most typical processes were (Bulygin et al., 1998; Grekov et al., 2011; Medvedev, 2012):
- loss of humus in arable soils with a rate of 0.5 - 1.5 tons per hectare per year was the losses rate at the end of the 1980’ s. Between 2005 and 2009 the rate of organic matter loss was 0.42-0.51 tons per hectare per year;
- increasing deficiency of labile nutrients, especially nitrogen (from -41.4 kg per hectare in 2001 to – 56.4 kg per hectare in 2009) and potassium (from -32.9 to – 64.2 kg per hectare between 2001 and 2009);
- acidification of Chernozems, especially expressed in the Cherkassy and Sumy regions ( the drop in рН was 0.3-0.5 units);
-compaction, especially expressed in the western forested steppe and as a whole widespread on 40% of arable land, characterized by a destruction of structure, lumpiness and crusting;
- reduction of the depth of soil upper layer due to erosion, which reaches several centimeters in Chernozems (modeled data) and in the drained soils of Polissiya;
-secondary alkalinization and salinization of irrigated soils, with a reduction of peat depth.
Among other negative processes of local importance are contamination with radionuclides and heavy metals, water logging, flooding, iron, calcium carbonate, and aluminum accumulation, desertification, alkalinization and soda formation. Types and extent of degradations of arable soils in Ukraine is shown in Table 11.3. and presented in Figure 11.3. The estimation of soil degradation has been performed using the technique proposed by van Lynden (1997), using as the sources of data the materials of agrichemical certification of fields which is conducted each 5 years starting from 1965, the database of the National Scientific Center «Institute for Soil Science and Agrochemistry Research named after O.N. Sokolovsky», including the information on morphological, physical, physicochemical and chemical properties of more than 2500 soil profiles, and also the materials of long field experiences on tillage and application of fertilizers (Laktionova et al., 2010; Grekov et al., 2011).
Soil degradation in Ukraine is considered mainly as a result of the use of inappropriate agrarian technology. Chernozems are vulnerable to mechanical deformation due to their low bulk density before tillage in the spring and to the influence of moisture owing to low stability of swelling smectite minerals, predominating in their mineralogical composition.
The problem has become aggravated because the activities in the frameworks of state and regional programs of soils protection practically finished in 1991. However important results have been obtained on key parameters of these programs up to the end of 1980th. Unfortunately, during the last two decades the extent of measures aimed at the increase in soil fertility have been significantly reduced.
Status of the World’s Soil Resources Report, Regional Assessments of Soil Changes | Chapters 9 - 16
124

Soil degradation in Ukraine amplifies because of underestimation of real threats to the present and especially the future generations, the absence of effective mechanisms of performance of laws on soil protection, unbalanced and scientifically unreasonable land tenure. Combating soil degradation requires rising awareness among all the layers of society, wide educational activity, active propagation of knowledge, and gradual formation of a new attitude to soil resources.
Table 11.3. Types and extent of soil degradation in Ukraine
Type of degradation Extent, % of
arable land
Fertility decline and reduced humus content 43.2
Compaction 38.2
Sealing and crusting 37.5
Water erosion, surface wash 16.8
Soil acidification 14.1
Waterlogging 12.9
Soil pollution by radionuclides 10.9
Wind erosion: loss of topsoil 10.5
Soil contamination with pesticides and other organic contaminants
9.2
Soil contamination with heavy metals 8.0
Salinization / alkalinization 4.3
Water erosion: terrain deformation by gullying
2.6
Off-site effects of water erosion 2.5
Lowering of the soil surface 0.4
Wind erosion: terrain deformation 0.4
Status of the World’s Soil Resources Report, Regional Assessments of Soil Changes | Chapters 9 - 16
125

Desertification 0.2
Soil degradation in Ukraine is caused mainly because of the use of inappropriate agrarian
technology. Chernozems are vulnerable to mechanical deformation due to their low bulk density before tillage in the spring, and the low stability of swelling smectite minerals, that predominate their mineralogical composition.
The problem has become aggravated because the activities in the frameworks of state and regional programs of soils protection practically finished in 1991. However, important results have been obtained on key parameters of these programs up to the end of 1980th. Unfortunately, during the last two decades the extent of measures aimed at the increase in soil fertility have been significantly reduced.
Soil degradation in Ukraine is underestimated and is a real threat to the present and especially the future generations. The absence of effective mechanisms and laws on soil protection and the unbalanced and unreasonable land tenure arrangements in place aggravates the matter. Combating soil degradation requires rising awareness among all the layers of society, wide educational activity, active propagation of knowledge, and gradual formation of a new attitude to soil resources.
Figure 11.3. Some types and extent of soil degradation in Ukraine (Medvedev, 2012)
Status of the World’s Soil Resources Report, Regional Assessments of Soil Changes | Chapters 9 - 16
126

11.5.3. Case study: Uzbekistan Uzbekistan is one of the flattest countries of Central Asia with about 80% of the national
territory consisting of plains; the mountains are located at the extreme east of the republic. The climate of Uzbekistan is continental dry with significant daily and seasonal fluctuations in air temperature. The summer is long and hot, the autumn is relatively wet, and the weather in winter is variable. The arid climate favors desertification and maintains relict accumulations of soluble salts in soils and sediments.
The entire area of the lands in the Republic of Uzbekistan is 44.9 million hectares, and the agricultural lands constitute 46.1% of the territory of the country. The distribution of soils in Uzbekistan reflects a complex system of pedo-geographical regularities (Fig. 11.4). The westernmost part of the republic is occupied by a desert zone that can be subdivided into a sub - boreal (Central Kazakhstan) and a subtropical (Turan) desert. The limit between the two types of deserts corresponds with the northern limit of possible cotton cultivation. In the lower belt of the piedmont subtropical semi - desert there occur mainly Calcisols which are replaced, when elevation increases, by mountainous Cambisols under steppes and forest vegetation. Anthropogenic factors strongly modify the morphology and pedogenesis of the soils. Irrigated soils are mainly transformed into Anthrosols; some of the soils in Amu Darya delta have been cultivated and irrigated for more than 3 thousand years. The territory of the Republic of Uzbekistan is vulnerable to negative environmental impacts due to its natural climatic conditions. Irrigation agriculture is localized in the plain and piedmont parts of the republic and is determined by the level of agriculture, its intensity and the difference in the quality of agricultural lands.
The natural drivers of land degradation and desertification are the following:
- Climatic characteristics, such as aridity, continentality, wind action etc., which cause such phenomena as drought, hot winds, deflation, atmospheric transportation of sand, salts, and dust;
- Topography with strong inclination during showers favors the development of water erosion and landslides. However, flat topography with depressions creates conditions for waterlogging and salt accumulation. Topography also favors the formation of specific intensive winds that play an important role in wind erosion;
- The peculiarities of parent material are reflected in soil profile (texture, gypsum and salts content) and also determine the susceptibility of soils to wind erosion, karst phenomena, and the soil buffering capacity;
- Extreme natural phenomena such as forest and grassland fires, floods etc. also affect the development of soils. Anthropogenic factors affecting land resources provoke degradation processes in the following ways:
- Irrigation without a proper drainage system, inappropriate regulation of the collector-drainage water leads to salinization and waterlogging;
- Irrational use of pastures leads to overgrazing, formation of exposed soil surface, destruction of soil structure and, as a result – to the development of deflation under the effect of wind and high temperature;
- Irrational forestry strategy, excessive logging cause soil erosion on the slopes in mountainous areas, soil deflation and expansion of sands on the fertile lands on the plains (Arabov, 2014).
The effect of other economic activities such as industry, municipal and domestic wastes, transport emissions, mining spoil with no reclamation also contributes to land degradation. The natural processes of land degradation and desertification are slow; their effect becomes evident after decades and hundreds of years. However, human activities accelerate these natural processes, and the results of degradation processes appear in a short period of time.
BOX
Status of the World’s Soil Resources Report, Regional Assessments of Soil Changes | Chapters 9 - 16
127

An illustrative example of the menacing scale of ecological and socioeconomic disasters caused by inappropriate use of natural resources is the tragedy of the Aral Sea. Its volume has been reduced more than 13 times, and its area – more than 7 times. The shoreline moved hundreds of kilometers. Water mineralization reached 120 g per liter in the western part and 280 g per liter in the eastern part of the sea (Arabov, 2014). The sea divided into two parts and is now on the verge of extinction: only small components are left, the deepest western part and Small Aral in Kazakhstan, separated with a dam. Most of the shore is surrounded with a rind of salt covers over marshy clays and sands. The regional processes overlapped global climatic changes and resulted in the intensification of seasonal droughts. Aral catastrophe aggravated the continentality of climate, increasing dryness and temperature in summer season and extending cold and severe winters. In the Aral region the number of days with the temperature over 40°C doubled, while in the rest of the Uzbekistan territory it increased about 1.5 times. According to expert evaluation, in 2035-2050 the air temperature can increase in the region extra 1.5-3.0°C. On the dried surface of the sea bottom one can observe extensive white salt crusts, in places covered with wind-blown sand. This territory is a new desert called Aral Kum that covers 5 million hectares. The extending Aral Kum desert already absorbed 2 million hectares of arable lands, provoked degradation of pastures, riparian forest, other vegetation. Satellite images illustrate penetration of plumes of salts and dust of Aral Kum for 800-1000 km deep to the densely populated zones.
The plain territory of the basins of Amu Darya and Syr Darya is a lowland with no natural
drainage. It acts as an accumulator of easily soluble salts in the topsoil due to the dry climate, the low precipitation and the strong evaporation. That is why the development of irrigation agriculture, starting from piedmont areas, requires strong attention to actual or relict salt accumulation in the sediments and farmers have to be aware of the danger of secondary salinization. Actually in the republic salt-affected soils constitute more than 46% of the total area of irrigated lands, including moderately saline – 25%, and strongly saline – more than 6%. Various degrees of salinity are typical for the Republic of Karakalpakstan, Bukhara, Khorezm, Dzhizak, Syrdarya, Andijan, Kashkadarya, Navoi, Samarkand, Surkhandarya regions, and for some districts in Tashkent and Fergana regions. In the Samarkand region, the prevailing type of salinity is magnesium-carbonate salts accumulation. Salinization of some newly irrigated lands is followed by the formation of gypsum-enriched soils that are difficult to reclaim. Gypsum layers and horizons impede water infiltration and decrease the efficiency of washing of salts from the soil profile. The total area of gypsum-containing soils is about 350 thousand hectares.
Status of the World’s Soil Resources Report, Regional Assessments of Soil Changes | Chapters 9 - 16
128

Figure 11.4. Soil map and soil degradation extent in Uzbekistan (Arabov, 2010)
On the territory of Uzbekistan there are all the types of erosion: surface runoff and irrigation erosion, destructive mudflows, wind erosion and direct negative effect of wing on plants. Wind erosion and negative wind effect on plants affect 21.4 million hectares or 80% of all the agricultural lands (Figure 11.5). Among 3.7 million hectares of irrigated lands 2.8 million hectares, or 75% are eroded to various extents. Agriculture also suffers from water and irrigation erosion. Moderately and strongly eroded soils constitute 12% of the agricultural land pool and about 5% in the irrigated land pool (Kurbanov, 2001).
The major part of the country is occupied by pastures that cover an area of 20.6 million hectares and serve as the main source of fodder for livestock (Arabov, 2014). Rational use and protection of the soils of pastures have a special place and are an issue in natural resources conservation and use. Their state in endangered because during the last 70-80 years the soils of pastures suffered a drastic decrease in humus and nutrients content, were affected by salinization and by water and wind erosion. Other negative processes include soil compaction, alkalinization, decline in biological activity and, as a result, a loss of soil
Thus, the key challenges in soil degradation in Uzbekistan are secondary salinization of irrigated lands; waterlogging of irrigated agricultural lands; depletion of soils – the loss of humus and nutrients, compaction; surface runoff and irrigation erosion in mountainous and piedmont areas; deflation and pasture digression in desert regions of transhumance; deforestation and loss of biological diversity; soil contamination with agrochemicals and industrial waste; desertification in the regions neighboring the bottom of dried Aral Sea; inappropriate methods of land management;
Status of the World’s Soil Resources Report, Regional Assessments of Soil Changes | Chapters 9 - 16
129

violation of the rules of plant breeding; insufficient irrigation; violation of the rules and norms of rational use of pastures (Gafurova et al., 2012).
In the Republic of Uzbekistan land protection and its rational use is a national task. Article 55 of the Constitution reads: "The earth, minerals, water, flora and fauna, and other natural resources are national wealth, requiring their rational use and protection of the State." In order to provide comprehensive rehabilitation, conservation, improvement of soil fertility of pastures, its protection and improvement of environmental conditions it is necessary to make the following steps:
- to develop a system of agriculture, biological bases of fertility improvement aimed at restoring and enhancing soil fertility, taking into account the analysis of the current land-reclamation, physical, chemical and ecological status of farming practices and;
-Develop more rapid methods of large scale soil mapping and automate the process of compiling maps and assessment of the soils of pastures, the use of remote sensing and GIS technologies;
- Develop effective ways to prevent the processes of surface, gully and wind erosion, the methods of prediction of soil erodibility, for the recovery and improving the fertility of eroded soils;
- To prevent the development of the processes of soil salinity, to develop new, more effective and innovative ways of desalinization and reclamation of saline soils;
- To conduct targeted research to establish the soil contamination by various toxicants, including fluorine, heavy metals, pesticides and others, and to develop measures to prevent soil pollution by these substances;
- To expand the development of unified science-based recommendations for the assessment of soil fertility of pastures, which will promote the rational land use in the republic.
11.6 Conclusion and References The inherent complexity and spatial variability of soil makes the evaluation of the impact of
any change difficult. Transformations of features such as texture and mineralogical composition will only occur over geological time spans while properties such as pH, organic matter content or microbial activity will show a more rapid reaction. In addition, the response of a particular soil type may be both positive and negative depending on the function in question. For example, rising temperatures and precipitation may support increased agricultural productivity on soils previously deemed marginal, but such a transformation can lead to a deterioration of soil biological diversity and an increased risk of erosion. Quantitative assessments of future trends in soil characteristics and properties are limited. As a consequence, this chapter provides an outlook only for a selected number of issues, which were not discussed before. Considerably more effort is required to model changes in the state of soil conditions in relation to drivers such as changes in land use and climate.
Status of the World’s Soil Resources Report, Regional Assessments of Soil Changes | Chapters 9 - 16
130

Table 11.4 Summary of Soil Threats Status, trends and uncertainties in in Europe and Eurasia
Very poor
Poor Fair GoodVery good
In condition In trend
Sealing and capping In densely populated Western Europe soil sealing is one of the most threatening phenomena. ↙ ● ●
Salinization and sodification
Salinization is a widespread threat in Central Asia, and it is challenging in some areas in Spain, Hungary, Turkey, and Russia.
↙ ● ●
Contamination Soil contamination is a widespread problem in Europe. The most frequent contaminants are heavy metals and mineral oil. The situation is improving in most regions.
↗ ● ◒
Organic carbon change
The loss of organic carbon is evident in most agricultural soils. Peatland drainage in northern countries also leads to rapid organic carbon loss. In Russia, extensive areas of agricultural lands were abandoned that resulted in quick organic matter accumulation; however, actually these areas partly returned to agricultural use.
~ ◒ ◒
Nutrient imbalance In the western part of the region the loss of nutrients is compensed by application of high doses of fertilizers. In the eatern part the use of fertilizers is insufficient, and in most soils nutrient mining results in intensive mineral weathering.
~ ◒ ◒
Soil erosion Water erosion is active in all the cultivated mountainous and rolling areas; the worst situation is observed in Turkey, Tajikistan and Kyrgyzstan. Due to the attention paid to this threat it is controlled in most areas, especially in the EU.
↗ ● ◒
Loss of soil biodiversity
Loss of biodiversity is expected in the most urbanized and contaminated areas of the region. However, there are almost no qualtitative estimations of the biodiversity loss in soils.
↙ ○ ○
Soil acidification Acidification due to acid rains was a challenge in Northern and Western Europe. Actually the situation is improving, though several decades would be needed for complete soil recovery.
↗ ◒ ◒
Waterlogging Waterlogging is mostly associated with irrigation that is basic for Central Asian countries. Most cultivated irrigated soils there are waterlogged. This phenomena in Central Asua is commonly associated with salinization.
~ ● ◒
Compaction The use of heavy machinery and overgrazing are threatening in almost all the agricultural areas. ~ ◒ ◒
Symbol
~↙↗○◒
●
Condition and Trend ConfidenceThreat to soil
functionSummary
Definition
Limited evidence or limited consensusAdequate high-quality evidence and high level of consensus
StableVariableDeterioratingImprovingEvidence and consensus is low
Status of the World’s Soil Resources Report, Regional Assessments of Soil Changes | Chapters 9 - 16
131

Afonin, A.N., Greene, S.L., Dzyubenko, N.I., Frolov, A.N. (edit.), 2008. Interactive Agricultural ecological atlas of Russia and neighboring countries. Economic Plants and their Diseases, Pests and Weeds [Online], http://www.agroatlas.ru
Arabov S.A. (ed.) 2010. Atlas of soil resources of the Republic of Uzbekistan. Goskomzemgeodezkadastr of the Republic of Uzbekistan, State Scientific Production Enterprise «Kartografiya». Tashkent. (In Russian)
Arabov S.A. (ed.) 2014. National report on the state of land resources of the Republic of Uzbekistan. Goskomzemgeodezkadastr of the Republic of Uzbekistan, State Scientific Production Enterprise «Kartografiya». Tashkent. (In Russian)
Baliuk S.A., Medvedev V.V. (edit). 2012. Strategy of balanced use, reproduction and management of soil resources of Ukraine. Kiev. « Agrarian science », pp. 240 (ukr.).
BMLFUW, 2001. Österreichs Land- und Forstwirtschaft, Umwelt und Wasserwirtschaft 2001. BMLFUW, 2006. Facts and Figures 2006. Borovskii, V.M. 1982. Formation of saline soils and haologeochemical regions of Kazakhstan. Nauka
publ., Alma-Ata. 256 p. (In Russian) Bulygin S.J., Breus N.M., Seminozenko Т.А. 1998 To a technique of definition of a degree of soil
erodity on slopes. Soil Science, № 6, pp. 714-718 (rus). Calanca, P.; Roesch, A.; Jasper, K.; Wild, M.; 2006. Global warming and the summertime
evapotranspiration regime of the Alpine region. Climatic Change 79: 65–78. Camci Çetin S., Karaca A., K. Haktanir, Yildiz H. 2007. Global Attention to Turkey Due to
Desertification. Environ Monit Assess 128: 489–493. Central Asian Countries Initiative for Land Management (CACILM). 2006. CACILM
Multicountry Partnership Framework Project Document. Asian Development Bank. 70 p. Devlin, G., Talbot, B. 2014. Deriving cooperative biomass resource transport supply strategies in
meeting co-firing energy regulations: A case for peat and wood fibre in Ireland. Applied Energy, 113: 1700-1709.
EC (European Commission). 2006. Proposal from the Commission to the Council, the European Parliament, the European Economic and Social Committee and the Committee of the Regions. for a Directive of the European Parliament and of the Council establishing a framework for the protection of soil and amending Directive 2004/35/EC. COM(2006) 232 final. European Commission, Brussels.EEA (European Environment Agency). 2007. Progress in management of contaminated sites (CSI 015). European Environment Agency.
EEA (European Environment Agency). 2009. Degree of soil sealing 100 m — EEA Fast Track Service Precursor on Land Monitoring. ETC/LUSI. European Environment Agency.
EEA (European Environment Agency). 2010a. The European Environment State and Outlook 2010: Freshwater Quality, Copenhagen, Denmark. Available at: http://www.eea.europa.eu/soer/europe/freshwater-quality, accessed 30-10-2014.
EEA (European Environment Agency). 2010b. The European environment — state and outlook 2010: air pollution. European Environment Agency, Copenhagen.
EEA (European Environment Agency). 2010c. Exposure of ecosystems to acidification, eutrophication and ozone (CSI 005). European Environment Agency.
EEA (European Environment Agency). 2010d. The European environment — state and outlook 2010: land use. European Environment Agency, Copenhagen.
EEA (European Environment Agency), 2014, Progress in Management of Contaminated Sites, 2014, http://www.eea.europa.eu/data-and-maps/indicators/progress-in-management-of-contaminated-sites-3/assessment.
Status of the World’s Soil Resources Report, Regional Assessments of Soil Changes | Chapters 9 - 16
132

ESTAT, Statistical portal. http://epp.eurostat.ec.europa.eu/, Statistical Office of the European Communities.
Follain S, Schvartz C, Denoroy P, Villette C, Arrouays D, Walter C, Lemercier B, Saby NPA. 2009. From quantitative to agronomic assessment of soil available phosphorus content of French arable topsoils. Agronomy for Sustainable Development, 29, 371-380.
Follain S, Schvartz C, Denoroy P, Villette C, Arrouays D, Walter C, Lemercier B, Saby NPA. 2009. From quantitative to agronomic assessment of soil available phosphorus content of French arable topsoils. Agronomy for Sustainable Development, 29, 371-380.
Gafurova L., Abdrakhmanov T., Zhabborov Z., Saidova M. 2012. Soil degradation. Tashkent. P. 18-204. (In Uzbek)
García-Ruiz, J.M., J.I. López-Moreno, S.M. Vicente-Serrano, T. Lasanta-Martínez, and S. Baguería; 2011. Mediterranean water resources in a global change scenario. Earth-Science Reviews, 105(3-4), 121-139.
GDRS 1987. General Management Planning of Turkey (Soil Conservation Main Plan). Ministry of Agriculture, Forestry and Villages. General Directorate of Rural Services. Ankara.
Gentile A.R., Barceló-Cordón S., Van Liedekerke M. 2009. Soil Country Analyses – Austria. Luxembourg: Office for Official Publications of the European Communities. 56 p.
Grekov В.О., Datsko L.V., Zhilkin V.A., Maistrenko M.I., Datsko M.O. et al. Methodical instructions for soil protection. The State Center of Soil Fertility Protection. Kyiv. 2011, pp. 108 (In Ukranian).
Grizzetti B., Bouraoui F., Aloe A. 2007. Spatialised European Nutrient Balance. Institute for Environment and Sustainability. EUR 22692 EN
IFPRI, 1999. Soil Degradation A Threat to Developing-Country Food Security by 2020? Food, Agriculture, and the Environment Discussion Paper 27. (Sara J. Scherr). International Food Policy Research Institute 2033 K Street, N.W. Washington, DC 20006-1002 U.S.A.
Inisheva L.I. (ed.) 2005. Concept of protection and rational use of peatlands of Russia. Central Peat Research Institute Publ., Tomsk. 99 p. (In Russian)
Ismayilov A. 2013. Soil Resources of Azerbaijan. P.16-36 In: “Soil Resources of Mediterranean and Caucasus Countries”, Y. Yigini, P. Panagos, and L. Montanarella, (eds). Office for Official Publications of the European Communities, Luxembourg.
Jeffery, S.; Gardi, C.; Jones, A.; Montanarella, L.; Marmo, L.; Miko, L.; Ritz, K.; Peres, G.; Römbke, J.; van der Putten, W. H. (eds.); 2010. European Atlas of Soil Biodiversity. European Commission, Publications Office of the European Union, Luxembourg.
Jones A., Panagos P., Barcelo S., Bouraoui F., Bosco C., Dewitte O., Gardi C., Erhard M., Hervás J., Hiederer R., Jeffery S., Lükewille A., Marmo L., Montanarella L., Olazábal C., Petersen J.-E., Penizek V., Strassburger T., Tóth G., Van Den Eeckhaut M., Van Liedekerke M., Verheijen F., Viestova E., Yigini Y. 2011. The State of Soil in Europe. Luxembourg: Publications Office of the European Union. 71 p.
Kovats, R.S., R. Valentini, L.M. Bouwer, E. Georgopoulou, D. Jacob, E. Martin, M. Rounsevell, and J.-F. Soussana; 2014. Europe. In: Climate Change 2014: Impacts, Adaptation, and Vulnerability. Part B: Regional Aspects. Contribution of Working Group II to the Fifth Assessment Report of the Intergovernmental Panel on Climate Change [Barros, V.R., C.B. Field, D.J. Dokken, M.D. Mastrandrea, K.J. Mach, T.E. Bilir, M. Chatterjee, K.L. Ebi, Y.O. Estrada, R.C. Genova, B. Girma, E.S. Kissel, A.N. Levy, S. MacCracken, P.R. Mastrandrea, and L.L. White (eds.)]. Cambridge University Press, Cambridge, United Kingdom and New York, NY, USA, pp. 1267-1326.
Status of the World’s Soil Resources Report, Regional Assessments of Soil Changes | Chapters 9 - 16
133

Kurbanov E.K. (ed.) 2001. Atlas: Land Resources of the Republic of Uzbekistan. 2001. Goskomzemgeodezkadastr of the Republic of Uzbekistan, Publ. «Patent-press». Tashkent. (In Russian)
Kuziev R.K., Sektimenko V.E., 2009. The Soils of Uzbekistan. Extremum Press, Tashkent. 351 p. (In Russian)
Laktionova T.M., Medvedev V.V., Savchenko K.V., Bihun О.М., Shejko S.M., Nakisko S.G. Structure and the order of data base using «Soils Properties of Ukraine». (Instruction) Kharkiv. "Apostrophe". 2010, pp. 96 (In Ukranian).
Leah, T.2012. Land resources management and soil degradation factors in the Republic of Moldova, The 3rd International Symposium "Agrarian Economy and Rural Development - realities and perspectives for Romania", Bucharest, Romania, October 11-13, 2012. P. 194-200.
Lemercier B, Gaudin L, Walter C, Aurousseau P, Arrouays D, Schvartz C, Saby NPA, Follain S, Abrassart J. 2008. Soil phosphorus monitoring at the regional level by means of a soil test database. Soil Use and Management, 24, 131-138.
Lynden G.W.J. van. 1997. Guidelines for the Assessment of Soil Degradation in Central and Eastern Europe (SOVEUR Project). Revised edition, ISRIC.Wageningen.22 p.
Medvedev V.V. 2012. Soil monitoring of the Ukraine. The concept. Results. Tasks. (2-nd reconsidered and added edition). The City printing house, Kharkiv. 536 p. (In Russian).
Melendez-Pastor I., Hernández E.I., Navarro-Pedreño J., Gómez I. 2012. Mapping Soil Salinization of Agricultural Coastal Areas in Southeast Spain, Remote Sensing - Applications, Dr. Boris Escalante (Ed.), InTech, Available from: http://www.intechopen.com/books/ remotesensing-applications/mapping-soil-salinization-of-agricultural P.117-140.
Ministry of Natural Resorces. 2006. State Report “On the State and Protection of Environment in Russian Federation in 2005. Land Resorces of Rsuuian Federation for the 1st of Janiuary 2006. Moscow, 45 p. (In Russian)
Morvan X.P.P. Saby N.P.A. Arrouays D. Le Bas C. Jones R.J.A. Verheijen F.G.A. Bellamy P.H. Stephens M. Kibblewhite M.G. 2008. Soil monitoring in Europe: a review of existing systems and requirements for harmonisation. Sci. Tot. Env., 391, 1-12.
National report on the state of land resources of the Republic of Uzbekistan. 2014. Tashkent. Novikova A.V. 2009. The study of saline and solonetz soils: their genesis, melioration, and ecology.
Dkukarnya, Kharkiv. 720 p. (In Russian) Oldeman, L.R., 1998. Soil Degradation: A Threat to Food Security? Report 98/01, International
Soil Reference and Information Centre, Wageningen. 14 p. Pankova E.I. 1992. Genesis of salinization in the soils of deserts. Dokuchaev Soil Science Institute
Publ., Moscow. 136 p. (In Russian) Prokop, G.; Jobstmann, H.; Schönbauer, A.; 2011. Overview of best practices for limiting soil
sealing or mitigating its effects in EU-27. Final report of a study contract for the European Commission, DG Environment. European Communities, Brussels.
Saby NPA, Marchant BP, Lark RM, Jolivet CC, Arrouays D. 2011. Robust geostatistical prediction of trace elements across France. Geoderma, 162: 303-311.
Senol S., Bayramin I. 2013. Soil Resources of Turkey. P.225-237 In: “Soil Resources of Mediterranean and Caucasus Countries”, Y. Yigini, P. Panagos, and L. Montanarella, (eds)., Office for Official Publications of the European Communities, Luxembourg.
Shishov L.L., Pankova E.I. (eds.) 2006. Salt-affected Soils of Russia. Publ. Center “Akademkniga”, Moscow. 857 p. (In Russian)
Status of the World’s Soil Resources Report, Regional Assessments of Soil Changes | Chapters 9 - 16
134

Shoba S.A., Alyabina I.O., Kolesnikova V.M., Molchanov E.N., Rojkov V.A., Stolbovoi V.S., Urusevskaya I.S., Sheremet B.V., Konyushkov D.E. 2010. Soil Resources of Russia. Soil-Geographic Database. GEOS, Moscow. (in Russian)
State Committee of Russian Federation on Land Resources and Land Planning. 2000. Report 1999. Pskov. 68 p. (In Russian)
Strauss, P. & Klaghofer, E. (2006): Status of soil erosion in Austria. In: Soil Erosion in Europe (Eds.: J.Boardman, J.Poesen), John Wiley, London, New York, 205–212.
Tóth, G., Adhikari. K., Várallyay, Gy., Tóth, T., Bódis, K. and Stolbovoy, V. 2008. Updated Map of Salt Affected Soils in the European Union. In. Tóth, G., Montanarella, L. and Rusco, E. (eds.) 2008. Threats to Soil Quality in Europe EUR 23438 EN 151 pp Luxembourg: Office for Official Publications of the European Communities. pp. 65-77.
Tóth, T., and G. Szendrei. 2006. Types and distribution of salt affected soils in Hungary, and the characterisation of the processes of salt accumulation. Topographia Mineralogica Hungariae. IX: 7-20. (In Hungarian).
Umweltbundesamt, 2004: The environmental situation in Austria. 7th Report on the State of the Environment inn Austria, report of the Federal Minister of Environment to the National Assembly of the Austrian Parliament. Download from: http://www.umweltbundesamt.at/en/umweltkontrolle/ukb2004
Umweltbundesamt, 2006. Website on spatial planning - land consumption. http://www.umweltbundesamt.at/en/umweltschutz/raumordnung/flaechenverbrauch/
Umweltbundesamt, 2007a. 8th Report on the State of the Environment in Austria. Vienna INTERNET: http://www.umweltbundesamt.at/en/umweltkontrolle/ukb2007/ (in German; summaries available in English). Last accessed December 2007.
Umweltbundesamt, 2007b. Website on brownfields in Austria. http://www.umweltbundesamt.at/en/umweltschutz/altlasten/projekte1/nat/brach_kurz/.
Villanneau EJ, Saby NPA, Orton TG, Jolivet CC, Boulonne L, Caria G, Barriuso E, Bispo A, Briand O, Arrouays D. 2013. First evidence of large-scale PAH trends in French soils. Environmental Chemistry Letters, 11(1), 99-104.
Wetterlind JM, Richer de Forges AC, Nicoullaud B, Arrouays D. 2012. Changes in U and Th content in topsoil after long term phosphorous fertilization. Soil Use and Management, 28, 101-107. World Wildlife Fund. Terrestrial Ecoregions. Available at: http://www.worldwildlife.org/biome-
categories/terrestrial-ecoregions (accessed 3 November 2014). Wong, W.K., B. Stein, E. Torill, H. Ingjerd, and H. Hege; 2011. Climate change effects on
spatiotemporal patterns of hydroclimatological summer droughts in Norway. Journal of Hydrometeorology, 12(6), 1205-1220,
Yesekin B.K., Bogachev V.P., Duskaev K.K., Rodionov A.M., Medvedeva N.Yu., Daukeev S.Zh., Bekeev A.T. 2000. Report on the state of environment in the Republic of Kazakhstan. http://enrin.grida.no/htmls/kazahst/soe2/soe/
Gafurova L., Abdrakhmanov T., Zhabborov Z., Saidova M. 2012. Soil degradation. Tashkent. P. 18-204. (In Uzbek)
Status of the World’s Soil Resources Report, Regional Assessments of Soil Changes | Chapters 9 - 16
135

12. Regional assessment of soil changes in Latin America and the Caribbean
Regional Assessment of Soil Changes in Latin America and the Caribbean Region
Regional Coordinator: Maria de Lourdes Mendonça-Santos (ITPS/Brazil)
Regional Lead Author: Juan Comerma (Venezuela)
Contributing Authors: Julio Alegre (ITPS/Peru), Ildefonso Pla Sentis (Spain), Carlos Cruz Gaistardo (Mexico), Rodrigo Vargas (Mexico), Diego Tassinari (Brazil), Moacir de Souza Dias Junior (Brazil), Sebastián Santayana Vela (Peru), Maria Laura Corso (Argentina), Vanina Pietragalla (Argentina), María Nery Urquiza Rodríguez (Cuba), Candelario Alemán García (Cuba), Segundo Sacramento Urquiaga Caballero (Peru/Brazil), Maria de Lourdes Mendonça-Santos (ITPS/Brazil), Miguel Taboada (ITPS/Argentina), Olegario Muniz (Cuba), Carlos Henriquez (ITPS/Costa Rica) and David Espinosa (ITPS/Mexico).
======================================================================
12.1 Introduction This section discusses the status of the soil resources in Latin America and the Caribbean
(LAC), that encompasses the following countries, according to FAO: Antigua and Barbuda, Argentina, Bahamas, Barbados, Belize, Bolivia, Brazil, Chile, Colombia, Costa Rica, Cuba, Dominica, Dominican Republic, Ecuador, El Salvador, Grenada, Guatemala, Guyana, Haiti, Honduras, Jamaica, Mexico, Nicaragua, Panama, Paraguay, Peru, Saint Lucia, Saint Kitts and Nevis, Saint Vincent and the Grenadines, Suriname, Trinidad and Tobago, Uruguay and Venezuela. The emphasis will be on man-induced changes, and not on natural causes, although it is not always easy to separate them.
The Latin American region extends from Mexico at latitude of 32 degrees North to Tierra del Fuego at 55 degrees South and also includes the Caribbean islands. The presence of 12 out of 14 terrestrial biomes (Olson et al. 2001) the rugged relief in Central America and along the western side of South America, and the large lowlands in central South America that also include interior wetlands makes this area the largest bio-diverse region in the world. In fact, 8 out of the 17 like-minded mega-diverse countries of the world are located in Latin America: Bolivia, Brazil, Colombia, Costa Rica, Ecuador, Mexico, Peru, and Venezuela (LMMD, 2009).
In terms of natural resources, Latin America is one of the richest regions of the world. With only 8% of the population, it has 23% of the world’s potential cropland, 12% of the actually cultivated land, 46% of the globe’s tropical forest and 31% of fresh water of the planet (Garret, 1997). This means that it can still provide around 800 million hectares of land that could be potentially used for agriculture (Laegreid, et al., 1999). However, most of these areas are under tropical rain forest and deforestation would initiate several soil degradation processes with dramatic effects on many ecosystem functions so this data has to be taking with care. Agricultural conversion of natural ecosystems (grass-shrub-savannas and forest) as a percentage in LAC is of the order of 30%, representing slightly over 600 million hectares of agro ecosystems, a figure similar to Africa but smaller than Europe and much smaller than Asia. Compared to other regions of the world, these agro ecosystems had a medium to low intensity use of fertilizers and irrigation in the 20th Century (UNDP,
Status of the World’s Soil Resources Report, Regional Assessments of Soil Changes | Chapters 9 - 16
136

2000), but this use increased dramatically during the 21th Century because of agriculture expansion in temperate and subtropical plains from the Continent (Grau & Aide, 2008; Viglizzo & Jobbagy, 2010).
Another important characteristic of this region is that agriculture started in the mountains, mostly due to the presence of serious diseases (malaria) in the lowlands. Consequently, the sloping lands, like the Andes and the Central America Mountains, have been cultivated the longest, starting with the Incas and Mayas. Mountainous areas in LAC still have high populations that practice both, intensive agriculture like horticulture, but also extensive land uses like pastures and coffee. Only afterwards the exploitation started of the flatter lowlands, with tropical, subtropical and temperate climates, such as the Pampas and Cerrados. This is where most of the present intensive farming that includes the use of fertilizers and machinery in cereals, legumes and other crops takes place (Viglizzo & Jobbagy, 2010).
The main soil threats are related to natural features of physiography and the type of vegetation cover. Anthropic and cultural features such as the agricultural practices being applied that are a consequence of land tenure, insufficient research and especially a lack of extension services play also an important role.
Water erosion and landslides clearly predominate in the sloping lands of the mountains, especially when they are burned and overgrazed. Loss in soil carbon mostly occurs after deforestation and changes of the land use to permanent grassland. In semiarid and arid areas, where irrigation is applied, salinity and sodicity becomes important. In areas with more intense land use with farm machinery, sealing/capping and compaction occurs. Also in these areas, when amendments, fertilizers and other agrochemicals are used, threats of nutrient imbalance, acidification, contamination and loss of biodiversity occur. Waterlogging and flooding in the region is not only limited to flooded rice fields, occurring also as a consequence of the combination of higher rainfall - promoted by ENSO (The El Niño Southern Oscillation) phenomenon and land use changes decreasing ground cover by perennial vegetation. Acidification will also be present mostly in deltas when the drainage of marine clays will produce acid sulphate soils.
Overall, the most important ecosystems services affected in LAC are: 1) Climate regulation through carbon and nitrogen cycles, especially due to the immense deforestation rates until 2004, of the humid tropical forests, mostly in the Amazon Basin; 2) Water regulation through a change in quantity and quality of water production in the mountains, also due to deforestation of sloping lands accompanied by strong water erosion and landslides, and 3) Lost of biodiversity is another ecosystem service threatened by deforestation and change in land use/land cover (Viglizzo & Frank, 2006, Gardi et al., 2014).
12.2. Biomes, ecoregions and general soil threats in the region. In this report we follow the stratification based on Biomes (environmental portion with
similar climate, fauna and flora) used by the Soil Atlas of Latin America and the Caribbean (Gardi et al. 2014, Figure 12.1), which limits are almost coincident with those of soils-landscape, in order to give information on soil land use and ecosystem services affected by soil threats. We will describe and discuss the Biomes from the most extensive to the least extensive but this sequence does not necessarily follow their significance and gravity for soil threats.
Status of the World’s Soil Resources Report, Regional Assessments of Soil Changes | Chapters 9 - 16
137

Figure 12.1: Biomes in Latin America and the Caribbean (according to WWF-World Wildlife Fund - Olson et al., 2001).
Tropical and Subtropical moist Broadleaf Forest is by far the most extensive Biome in LAC. Essentially it is a permanent very humid, high temperature forest. The landscape goes from flat plains to rolling slopes. The soils are dominated by medium to highly weathered, in general acid and unfertile Acrisols, Ferralsols and Plinthosols. This Biome has the greatest biodiversity of plant and animals and also shows little resilience to human intervention. It spreads from the eastern coasts of Mexico and Central America, part of the Caribbean islands, the Pacific Coast of Colombia, the Atlantic coast of Guyana and Venezuela, and down to the most of the Amazon basin in Ecuador, Peru and Brazil, and finally to the western and southern coast of Brazil.
Considering that this Biome in LAC has had the largest deforestation rate (FAO, 2005; 2010) and that this practice removes a large and continuous addition of organic matter to the soil, the loss of land cover and soil organic carbon becomes the most important threat to degradation of the ecosystem functions.. Another threat in deforested areas is water erosion, when heavy rains, will find a bare soil, and even with gently or moderate slopes which are common, will produce important erosion problems. As most of the nutrients in these soils are contained in the organic matter of the topsoil, its
Status of the World’s Soil Resources Report, Regional Assessments of Soil Changes | Chapters 9 - 16
138

removal and rapid decomposition will affect soil biodiversity, and in the long run nutrient imbalances may appear. Ecosystem services affected after human intervention include: carbon and nitrogen cycle in their contribution to climate regulation. If large extensions are considered then the water quality after erosion, and landscape stability may also be affected.
Tropical and Subtropical Grasslands, Savannahs and Shrub lands are the second largest biome in LAC. The climate is characterized by a wet and dry periods and high temperatures. The vegetation is predominantly grasses with different densities of trees. In general the topography is flat to gently undulating. For the most part, and especially in Brazil (Cerrados), eastern Venezuela and Colombia, the dominant soils are acid low fertile Acrisols, Ferralsols and Arenosols, while in the younger surfaces, the dominant soils are more fertile Luvisols, Phaeozems and Vertisols.
In these areas there has been an important growth of annual crops like corn, soybean, sorghum, beans, cassava, cotton and grasses like Brachiarias and legumes like Stylosantes. Lately, sugarcane and other biofuel crops are also being planted (Miyake et al. 2012). Brazil, that has the largest areas of savannahs in LAC, around 200 million hectares, has 55 million of introduced pastures, and 22 million in annual crops (Sousa, 2011). In general, these soils are low in organic matter, very unfertile, acid in the topsoil as well as in the subsoil. These soil conditions require the use of amendments like gypsum and limestone, fertilizers like rock phosphate, and inoculants, to counteract the acidity and infertility of the soils. Erosion has been the main threat, but after good research and extension, conservation tillage is increasing and solving the problem. Another threat has been compaction, not only by farm machinery but also by overgrazing. In grasslands when little fertilizers are used, a problem of nutrient imbalance has been reported (Guimarães, 2013). In agricultural lands there is a growing imbalance of nutrients, especially in recent years with the intensification of agriculture, where fertilizer use is far from meeting the demand of crops (Urquiaga et al., 2014). This is a threat for all LAC, but because of higher inputs of fertilizers lately, it is foreseen that some problems with contamination may be present in the future.
Ecosystem services affected in this Biome are, in a positive way the provision of food, but as negatives, the carbon and nitrogen cycle by a higher rate of organic matter decomposition, the loss of water quality due to erosion and incorporation of sediments and biodiversity losses (Viglizzo & Frank 2006; Viglizzo & Jobbagy 2010).
Deserts and Xeric Shrub lands occupy the third place in extension in LAC. They are characterized by low precipitation, high evaporation and quite windy conditions. The temperatures are variable: in the tropics, like in northern Brazil, the coastal area of Peru and in the Caribbean coast of Venezuela and Colombia they are quite warm; but, in northern and central Mexico and Chile a cold period occurs. In all cases, vegetation is dominated by cactuses and thorny shrubs that are very sparse and resistant to drought. The most typical soils are calcareous or gypsiferous, shallow, saline or sodic reflecting the extremely poor leaching processes. Calcisols, Gypsisols, Arenosols, Regosols and Solonchaks are common soil groups.
This Biome, especially due to its water stress, needs irrigation for a stable agricultural development. Irrigation requires not only a source of water, but also water of good quality and a good drainage system to leach soluble salts, common in this Biome. Preventing salinization is difficult but restoring is even harder. The use of waste water from cities may bring additional problems like contamination with heavy metals. Due to the little vegetation coverage and the presence of strong winds, it is common that wind erosion increases after the intervention of man.
Status of the World’s Soil Resources Report, Regional Assessments of Soil Changes | Chapters 9 - 16
139

Ecosystem services that may be affected are productivity of the soils due to salinization. At the same time water quality may worsen for the same reason.
Temperate Grasslands, Savannahs and Shrublands has been largely studied and documented by various authors (Paruelo, et al., 2005; Satorre, 2005; Viglizzo & Frank, 2006; Álvarez et al., 2009; Lavado & Taboada, 2009; Viglizzo & Jobbágy, 2010). This bioma is predominantly located in the Argentinian Pampas. In its central plains, they are dominated by grasses on flat to gently sloping lands, with a temperate climate, and rains ranging from 1500 mm in the northeast to 400 mm in the southwest. They have some of the most fertile soils of the world, the Phaeozems, although in the area more than 13 million hectares with natural saline-sodic soils (i.e. Solonetzs) also appear.
Despite the wide adoption of no-tillage, intensive annual cultivation, with prevalence of soybean and the lack of rotation with other crops or pastures, has resulted in soil degradation by wind and water erosion, waterlogging, compaction, sealing/capping, and soil fertility depletion (Satorre 2005; Lavado & Taboada 2009; Alvarez et al. 2009; Sainz Rozas et al., 2011; Viglizzo & Jobbagy, 2010). Market driven deforestation to produce annual crops (soybean, cotton, etc) also promoted salinization/sodification in lowlands after regional groundwater rises (Paruelo et al. 2005; Viglizzo & Jobbagy 2010).
Dry Tropical and Subtropical broadleaf Forest occur in many different places in LAC, that have in common to be situated below 1000 m elevation, have high temperatures and at least one dry season, when the trees lose their leaves. These forests are more common in hilly and mountainous landscapes, with medium fertile soils like Luvisols, and Cambisols. Large populations live in these areas and deforestation and annual burning is common. They occur from western Mexico, Costa Rica, Cuba, north of Venezuela and Colombia, coast of Ecuador and Peru and central and the north east of Brazil.
This Biome is very attractive for agricultural developments in LAC, due to the fertility of their soils, and the climatic conditions favorable for human habitation and for the growth of many crops for human consumption, like corn, beans, potatoes, sugarcane, fruits and coffee. Large areas with grasses are used for extensive pasturing. Deforestation is the first threat, and is rather irreversible as the dry period makes it difficult for a natural reforestation to occur. As the accumulations of organic matter in these soils is medium or low, deforestation will bring the threat of organic carbon loss and the increases of soil temperature in bare soils will increase the rate of decomposition. On steeper slopes, due to the difficulties to cultivate, the most common type of land use will be extensive pastures, where after few years, the threat of soil compaction appears, shown by the formation of small terraces where the cows are walking. This compaction also reduces rainfall infiltration and consequently increases water erosion.
Ecosystem services affected are the carbon and nitrogen cycles and the climate regulation due to the decrease in organic matter with cultivation. Water production and quality may decrease due to compaction by overgrazing and farm machinery, increasing erosion. As erosion reaches high levels in many slopes, landscape stability can also be affected.
Montain Grasslands and Shrublands are present at high altitudes throughout the Andes, but mostly in Peru and Bolivia. Locally they are called Punas or Paramos. They occur above 3000 m or even higher, and are dominated by grasses and small shrubs. Temperatures during the day may be quite high, but during the night may freeze. In general these area are quite dry. The topography may
Status of the World’s Soil Resources Report, Regional Assessments of Soil Changes | Chapters 9 - 16
140

be mountainous or large mesas or high plains. Soils are generally rich in organic matter, but rather shallow. Predominant groups are Regosols, Leptosols and in the drier zones Solonchaks.
Most of the land remains bare land, or is used for extensive pastures. Most of the pastures are natural, but also some introduced and adapted to these conditions. In some areas, especially in northern South America, some areas are also used for intensive horticultural crops, like potatoes, carrots, quinoa, etc. In these cases, some conservation practices, irrigation and high inputs of organic and inorganic fertilizers are used throughout the year (Comerma et al, 1971). Although there is no data on impacts, it is suspected that contamination of soils and water, due to excessive fertilizers and other agrochemicals may be occurring. This may also affect soil biodiversity, which may be very important, as this Biome is very unique in external vegetation and fauna.
This Biome is of extreme importance for some ecosystem services, like water production, being the highest part of many watersheds and a continuous source of pristine water, in many cases related to the process of thawing. Many soils in this area are quite rich in organic matter in the topsoil, and attention should be paid to the C and N cycle as a service. The soil gene population, due to its unique nature, should also be studied and protected.
Tropical and Subtropical Coniferous Forests, occur in subtropical high and medium altitudes, mostly in Mexico and down to Nicaragua. Small patches are noted in the Dominican Republic, southern Brazil and Chile-Argentine. They occur mostly in mountainous landscapes and under many different geologic materials, including volcanic ashes. Most of the soils are Umbrisols, Luvisols, Leptosols and Andosols. The vegetation is dominated by many types of conifers with a varied undergrowth.
Deforestation for the establishment of pastures and wood harvesting are major land uses. In many cases they are accompanied by burning. They create threats for lowering organic carbon and water erosion. Ecosystem services mostly affected are the water production/ regulation, C and N cycling and landscape stability.
Temperate broadleaf and mixed Forest is a temperate permanent forest in southern Chile. It occurs mainly in valleys and side slopes of high mountains, very humid, cold but with few variations during the year. Soils, are shallow and mostly Alisols, Andosols, Cambisols, and Histosols.
Because of low temperatures and a rough relief, land use is mostly protected areas with few valleys used for pasture. As human intervention is very low, threats and affection of ecosystem services is very limited.
Flooded Grasslands and Savannahs in LAC occur in tropical alluvial plains, mostly in Brazil, Bolivia and Paraguay (Pantanal) considered the largest flooded plain in the world, forming a highly productive environment, recognized by UNESCO as a World Natural Heritage Site and Biosphere Reserve, still being one of the 35 Major Regions Natural Planet (Wilderness). Other important areas occur in Venezuela and Colombia in flat alluvial plains. They all have in common the predominance of native pastures adapted to flooding, few trees in the higher places, and a seasonal period of flooding alternated with a dry season. Predominant soils are Gleysols, Stagnosols, Vertisols, Plinthosols, and Histosols. The most widespread use of this Biome in LAC is pastures for bovine and lately bubaline cattle. Its strategic importance in this use is the supply of green pastures for the dry season.
Status of the World’s Soil Resources Report, Regional Assessments of Soil Changes | Chapters 9 - 16
141

Economic development in the Pantanal region, especially on the plateau of Rio Taquari Basin, intensified input sediments in the Pantanal lowlands, giving rise to the most serious environmental and socioeconomic problem, causing serious impacts to the environment and the socio-economy of this region (Galdino et al., 2006).
The main ecosystem service is the provision of food and fibers, interacting with the service of water regulation. But, this ecosystem is so unique and rich in flora and fauna that, soil biota and gene should be of prime importance and remain to be investigated and protected
Mediterranean Forest and Shrubs occupy a small strip of Chile near their coast line. It has a warm temperate climate, dry during the warm period and rainy in the winter time. The vegetation, relief and soils are very heterogeneous, as they represent a transition between tropics and temperate, dry and humid. Most common soil groups are Regosols, Leptosols and Andisols. The degree of intervention is so high that there are few spots with original vegetation.
Because of its Mediterranean climate the natural productivity of the area is very high. This has been utilized by Chileans to create very important agricultural development areas, especially in
the valleys. Irrigation, tillage and high levels of fertilizers and other agrochemicals are used to obtain high yields. Deforestation has produced important erosion threats, high inputs have produced contamination, and salinization, in the drier zones is also a threat due to the quality of irrigation water and inadequate management.
Ecosystem services affected positively are provision of food, negatively are water quality and possible human health and loss of biodiversity, related to contamination.
Mangroves are the smallest Biome in extension in LAC. They mostly occur along coast line of all LAC countries, but generally are associated with the Deltas of important rivers like the Amazon and the Orinoco. They are located where there is a mixture of fresh and saline water and where the Mangrove can grow. They provide many ecological services and are considered very fragile as disturbances can produce irreversible consequences. Soils are mostly Histosols, Gleysols and Acid Sulphate soils.
Mangroves are mostly protected areas due to the difficulties related to drainage and the predominance of reduced or organic soils. In the cases where development projects have been implemented, the main land uses are pasture, rice or plantations like oil palm or bananas. Especially when Mangroves are underlain by marine sediments, it is very common that after drainage, oxidation of Iron Sulphide (pyrite) will occur, producing an extreme acidification of the soils and resulting in the formation of acid sulphate soils. These are extremely difficult to reclaim. This is an extreme case of the threat acidification. After drainage, another threat that appears is the loss of organic carbon and water, creating subsidence of the surface.
Ecosystem services affected are reduction of productivity, especially if acid sulphate soils are formed. The Carbon and Nitrogen cycles and water quality will also be affected. An affected will be the cultural heritage, as many local tribes (example Waraos, in the Orinoco Delta) have been living on the natural products extracted from this ecosystem for more than 4000 years.
Status of the World’s Soil Resources Report, Regional Assessments of Soil Changes | Chapters 9 - 16
142

12.3. General soil threats in the region In the section above the Biomes and the most important soil threats that occur in each one of
them has been described.. In recent years with more drastic climate change-intensity and concentration of rains and evaporation- there may be shifts in the speed of threats such as massive erosion, flooding and desertification. At the same time other soil threats and ecosystems services like organic carbon changes, biodiversity, crop production and water quantity and quality are also affected.
12.3.1 Erosion (by water and wind)
This threat is considered one of the most important in the region, because it impacts a very large population especially concentrated in the mountainous regions of the Andes and Central America and Mexico, and Caribbean. Water erosion and landsliding are mostly present in steep slopes that has been deforested and/or in dry areas of the mountains, and that are used by small farmers and by overgrazed pasture lands. It is also present in gentle slopes in the cerrados as well as part of the pampas that are subjected to intensive cultivation. Its value lies on the fact that by erosion there is a removal of the fertile topsoil, or by landslides, affecting crop productivity, making tillage more difficult and also producing sediments that will affect other fields, infrastructures and causing flooding in flat areas downstream.
12.3.2 Soil organic carbon change
Changes in organic carbon occur mostly if the supply by the vegetation is decreased, like with deforestation, or if mineralization is increased, like by plowing (Sánchez, 1981). LAC contains about half of the tropical forest of the world, and until recently, it had the highest rate of deforestation, drastically reducing the amount of organics debris supplied to soils . The region also has some of the best soils of the world, as happens in the Pampas. These soils are rich in organic matter content and very fertile, but continuous cropping has increased mineralization reducing organic carbon. In both cases soils are becoming less productive limiting their ecological services (Lavado & Taboada 2009; Viglizzo & Jobbagy, 2010; Gardi et al. 2014). Recently, D’Accunto et al. (2014) found that uncropped agricultural borders to be highly effective in the mitigation of soil organic carbon losses.
12.3.3. Salinization and sodification
Natural or primary salinization and sodification are rather common in arid and semiarid regions of LAC, like Mexico, Cuba, northern South America, Peru, Northeast Brazil and southern Argentine. Man-induced threats are also present in these regions because irrigation is common, the water quality used and the lack of drainage induces the problem. Even though it may nor occupy large surfaces, salt accumulation is considered quite important because it affects severely crop productivity, is very difficult to prevent and even more difficult to reclaim. It has been estimated (AQUASTAT, 1997) that 18.4 million has in LAC caused by irrigation are affected by salinization. The problem also appears under humid climates, where large plains with high and saline groundwater and sodic soils (i.e. Solonetzes) may be salinized in topsoil by upward soluble salt rises promoted by land decovering and overgrazing (Taboada et al., 2011, Bandera 2013, Di Bella et al. 2015).
12.3.4 Nutrients imbalance
The largest proportion of soils in LAC are acid and with natural low fertility. As a result, amendments and fertilizers are required for a sustainable production, especially because the areas for
Status of the World’s Soil Resources Report, Regional Assessments of Soil Changes | Chapters 9 - 16
143

agriculture and animal production are already limited. On the other hand a special case of nutrient imbalance was observed in the last years because of the increase of acid ions sources in the soils -even in very fertile soils- due to high amounts of N-fertilizers (ammonia) applied in high input production systems (Espinosa & Molina 1999). A general and extensive threat of “nutrient impoverishment” was found in coffee and sugar cane plantations in Andisoils for example, causing lower yields in a short term (Bertsch et al., 2002). Nutrient imbalance could also appear in the highly fertile Pampas region, where the farmers historically applied low amount of fertilizers (Lavado & Taboada 2009). The imbalance could be higher if there would not be the great contribution of biological nitrogen fixation (FBN) in agriculture and livestock production of the region (Urquiaga et al., 2012; Franzluebbers et al. 2014). The contribution of BNF is important mainly for soybean crop in the region and legume pastures in the sub region of the South Cone (Alves et al., 2003; Campillo, et al., 2003, 2005).
12.3.5 Loss of soil biodiversity
In LAC preserved areas can represent a bank of original soil biodiversity (Alegre et al., 1996, White et. al 2005; Urquiaga et al. 2014).
Ferraro & Ghersa (2007) found that the community of microarthopods was highly sensible to crop management and resulting soil condition. Microbiological indices and enzymatic activity are also important upcoming indicators and have been used in different studies in the region (Balotta et al. 2004; Sicardi et al. 2004; Nogueira et al. 2006; Green et al. 2007; Franchini et al. 2007; de Moraes Sa & Lal. 2009; Romaniuk et al. 2012; Henríquez et al. 2014).
12.3.6 Compaction
In LAC there are two main causes of compaction; livestock production and machinery transit. Overgrazing by cattle and sheep causes degradation of pastures and increased erosion as found in mountainous regions, the Cerrado, coffee plantations and the arid Patagonia (Bertiller et al…2002..; Henriquez et al. 2011, Taboada et al. 2011, Pais et al. 2013). The intense use of farm machinery, especially in the Cerrados and the Pampas also led to shallow soil compaction and poor structural conditions in topsoil, especially associated with soybean monocropping and long winter fallow periods (Taboada et al. 1998, Botta et al., 2009, 2010, Alvarez et al. 2014; Franzluebbers et al. 2014).
12.3.7 Waterlogging
Many flat areas are affected by episodic human-induced waterlogging and ponding, which were promoted by poor topsoil structural and drainage conditions (e.g. low infiltration rates), associated with extreme events of heavy rainfall associated to the periodic climate phenomena of “El Niño” and “La Niña”, and hurricanes. This was observed both in agricultural and livestock production soils throughout the region. There are increasing problems of catastrophic flooding, landslides and sedimentation (Pla, 2003; 1996a; 2011; Restrepo et al. 2006).
12.3.8. Soil acidification
Natural acidification is a common process in soils of LAC and particularly is very intense in tropical areas of the region, due to high rainfall, the type of parental material and constitutive minerals (Kämpf et al. 2009; Fassbender and Bornemisza 1987). As industrialization is not intensive and widespread in the region, soil pollution from industrial gases is not common. Anthropogenic
Status of the World’s Soil Resources Report, Regional Assessments of Soil Changes | Chapters 9 - 16
144

acidification in soil could also appear due to the excessive N-fertilization rates in crops like banana, vegetables, oil palm and intensive coffee systems (Sánchez 1981; Espinosa & Molina 1999).
12.3.9. Soil contamination
Different human activities may result in the pollution of soils and related water bodies, such as high-input agriculture (e.g.fertilizers, agrochemicals, etc), mining and oil spills (Nriagu, 1994; Malm, 1998; Mol et al. 2001). Residues of herbicides like glyphosate were observed in soils and groundwater in fields devoted to no till farming (Ometo et al. 2000; Christoffolleti et al. 2008; Cerdeira et al., 2011; Aparicio et al., 2013).
On the other hand the use of mercury compounds in mining activities or the use of huge amounts of water for shale oil exploitation is causing downstream pollution in soils and waters (Nriagu, 1994; Malm, 1998; Mol et al. 2001). Also there is an increasing use of agricultural by-products and sludges, which may build up N levels in groundwater and eutrophicate lagoons (Torri and Lavado, 2008).
12.3.10 Sealing
According to sources from the United Nations, in 2015 the population of Latin America is 630 Millions (8.6% of the world’s population), which is expected to increase by 25% until 2050. Most Latin American countries are in stage 3 or in evolution to stage 4 of the demographic transition model, with low death rate and leveraging birth rate resulting in slower population growth over time.
Today 79.8% of the population in Latin America live in urban areas (12.7% of the world’s urban population) and prospects for 2050 indicate a further increase to 86.2%.These numbers make this region the second-most urbanized area of the world, slightly lower than North America (81.6%) and well above the global average of 54.0%. In figure 12.2 are presented the extensions of Urban Areas and the Urbanization Indexes for the countries of Latin America and the Caribbean. In relation with the population, Brazil, Argentina and Mexico have the larger Urban Area extenisons, while the highest Urbanization Indexes are associated with the small states with high population densities.
Status of the World’s Soil Resources Report, Regional Assessments of Soil Changes | Chapters 9 - 16
145

Figure 12.2: Urban Areas extension and Urbanization Indexes for the Latin American and Caribbean countries
12.4. Major threats to soils Among the general threats to soil that occur in the region, the four most important ones in
LAC will be discussed in more detail.
12.4.1 SOIL EROSION
Soil water erosion is the main soil degradation process worldwide and in LAC, as well. Wind erosion is also highly relevant in specific areas with arid and semiarid climate, with rainfall lower than 600 mm.
A high proportion of the land is on steep slopes, and the main limitation for their agricultural use is water erosion (Alegre et al. 1990; Pla, 1993; 1996a; Duvert et al. 2010; PNUMA-CEPAL, 2010). The problems of accelerated water erosion are not only active in those steep slopes, but also in large agricultural areas with more gentle slopes . - In general, the increasing erosion in LAC is mainly due to the fast growth of the human population and the lack of planning , through deforestation, over-grazing, and inappropriate agricultural practices linked to both subsistence and large-scale high-input commercial agricultural developments (Pla, 1996a).
Erosion is mostly caused by water and some estimates suggest that 42% of flood events could contribute to 70% of sediment export (Duvert et al. 2010). In drier areas of Mexico and Argentine on the other hand, wind erosion prevails. Estimations of areas affected in the region vary, but a conservative figure is around 15% of South America and 26% in Central America (Oldeman, 1991b).
Although there is clear evidence that large and increasing areas of lands are being affected by different processes of soil erosion, most of the existing evaluations of the type, extension and intensity of soil erosion at country or regional level are not very precise or objective. Mass and landslide erosion processes were not differentiated from surface erosion problems (Hincapie & Ramirez, 2010), leading to a often wrong identification of the origin of erosion processes (Pla, 1992; 1993; 2011). The magnitude of the soil erosion problems is highly variable, with values ranging 5-50 % or 100-1000 Mg/km2 year of average soil losses in the Andes and Central America. Probably almost 50% of the agricultural lands are negatively affected by surface soil erosion at different levels, with 15-25%, depending on the regions, strongly affected (Oldeman et al, 1991a, b).
New regional information has been mostly generated through indirect or remote sensing , usually without sufficient ground-truthing (Bai et.al., 2008; Nachtergaele et.al., 2011). Some indirect recent evaluations based only on soil cover and slope show reduction in the area with risks of soil erosion to only 5% (Comisión Europea, 2013),. In those evaluations, the processes of mass erosion have not received any attention or is confused with the very different processes of surface erosion (Pla, 2011).
The control of soil erosion and the derived effects will depend on an appropriate land use and management planning supported by appropriate soil governance (FAO, 2012). In many LAC countries, the application of conservation measures is limited by lack of integration between conservation and development, the lack of legislation or ways to implement it, and the shortage of local basic information, trained personnel and of economic resources (Pla, 1996b). With very few isolated and temporal exceptions, there have not been policies and well oriented subsidies or
Status of the World’s Soil Resources Report, Regional Assessments of Soil Changes | Chapters 9 - 16
146

incentives through marketing prices and credits, to induce a sustainable land management. Besides, most of the agricultural research is usually oriented towards the use of inputs for short-term increase of production. This has contributed indirectly to growing environmental problems, including soil erosion.
The main objective of research on soil erosion in LAC must be to collect and evaluate data to generate technology for prediction and control of soil erosion. The understanding of the basic erosion processes in each particular situation is required for an effective technology transfer (Pla, 2003). Some empirical models to predict erosion (USLE, RUSLE) are used indiscriminately, without having scientific evidence of their applicability to a particular situation. The uncritical use of results from that kind of models based on empirical relations lead to gross errors in planning land use and management (Pla, 2011). However, RUSLE equation has been successfully adopted as a basis for soil use regulations in some countries (Alegre et al. 1990).
The possible use of already available indigenous practices must be used in research to reach an understanding of the biophysical and human factors behind such practices, to see if they can be adopted or adapted to the present social-economic situation.
Finally, the institutional support is essential for developing and assuring continuity of the required research in soil erosion and conservation practices in LAC countries (Pla, 2003).
12.4.2. SOIL ORGANIC CARBON CHANGE
The soil organic carbon is essentially the main component of humus, organic compound having a stable C/N ratio, varying around 10 to 13 in most soils of LAC and of the world (Palm & Sanchez 1990; Sisti et al., 2004, Jantalia et al., 2007). From this, one may deduce that only it will be possible to increase the SOC content if the N content also increases to maintain the relationship (Boddey et al., 2012 a, b, 2014). The reverse is also true, increasing one unit of soil N availability due to the mineralization of soil organic nitrogen, it is expected to release between 10 to 13 units of C, equivalent to around 40 kg of CO2.
Figure 12.3 shows soil organic carbon contents and stocks (taking into account soil bulk
density) in different LAC ecosystems.
Status of the World’s Soil Resources Report, Regional Assessments of Soil Changes | Chapters 9 - 16
147
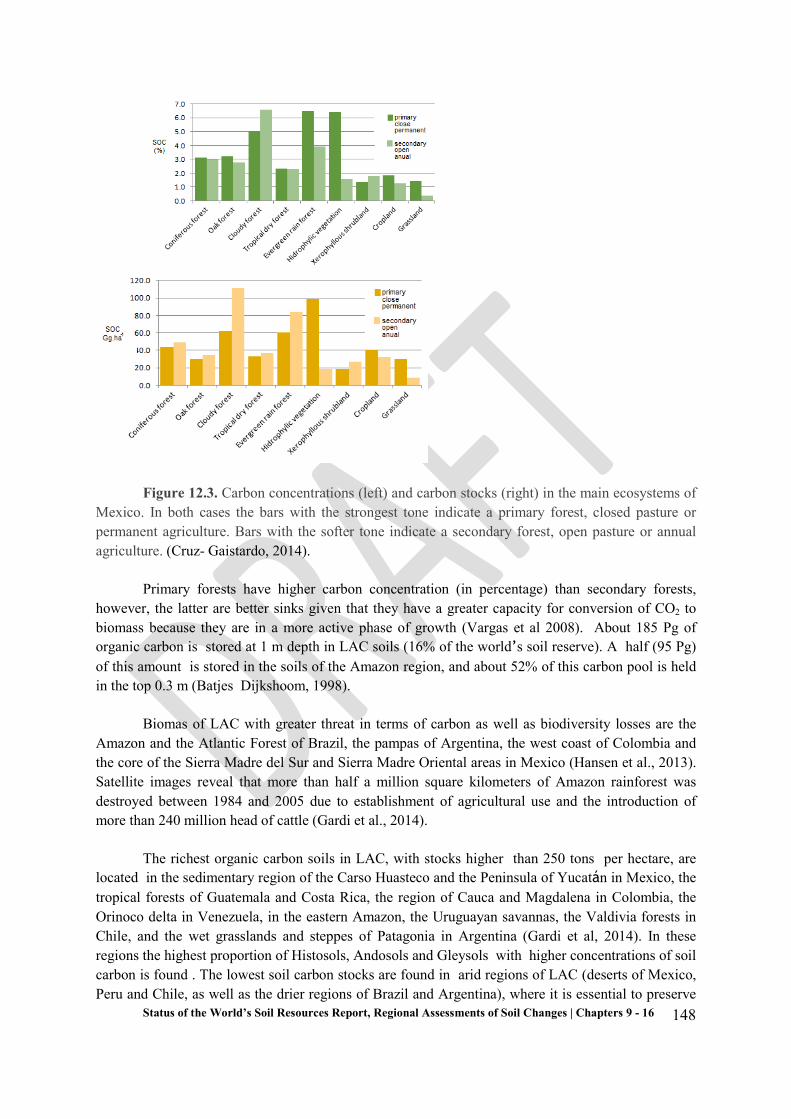
Figure 12.3. Carbon concentrations (left) and carbon stocks (right) in the main ecosystems of Mexico. In both cases the bars with the strongest tone indicate a primary forest, closed pasture or permanent agriculture. Bars with the softer tone indicate a secondary forest, open pasture or annual agriculture. (Cruz- Gaistardo, 2014).
Primary forests have higher carbon concentration (in percentage) than secondary forests, however, the latter are better sinks given that they have a greater capacity for conversion of CO2 to biomass because they are in a more active phase of growth (Vargas et al 2008). About 185 Pg of organic carbon is stored at 1 m depth in LAC soils (16% of the world’s soil reserve). A half (95 Pg) of this amount is stored in the soils of the Amazon region, and about 52% of this carbon pool is held in the top 0.3 m (Batjes Dijkshoom, 1998).
Biomas of LAC with greater threat in terms of carbon as well as biodiversity losses are the Amazon and the Atlantic Forest of Brazil, the pampas of Argentina, the west coast of Colombia and the core of the Sierra Madre del Sur and Sierra Madre Oriental areas in Mexico (Hansen et al., 2013). Satellite images reveal that more than half a million square kilometers of Amazon rainforest was destroyed between 1984 and 2005 due to establishment of agricultural use and the introduction of more than 240 million head of cattle (Gardi et al., 2014).
The richest organic carbon soils in LAC, with stocks higher than 250 tons per hectare, are located in the sedimentary region of the Carso Huasteco and the Peninsula of Yucatán in Mexico, the tropical forests of Guatemala and Costa Rica, the region of Cauca and Magdalena in Colombia, the Orinoco delta in Venezuela, in the eastern Amazon, the Uruguayan savannas, the Valdivia forests in Chile, and the wet grasslands and steppes of Patagonia in Argentina (Gardi et al, 2014). In these regions the highest proportion of Histosols, Andosols and Gleysols with higher concentrations of soil carbon is found . The lowest soil carbon stocks are found in arid regions of LAC (deserts of Mexico, Peru and Chile, as well as the drier regions of Brazil and Argentina), where it is essential to preserve
Status of the World’s Soil Resources Report, Regional Assessments of Soil Changes | Chapters 9 - 16
148

the scarce carbon (less than 20 ton.ha-1) due to the fragility of the ecosystems found there (Figure 12.4).
Figure 12.4: Organic carbon stock (or density) in soils of Latin America and the Caribbean, expressed in Gigagrams per hectare (Gardi et al., 2014).
Land use changes from forestry to another, urban or livestock use, cause the greater loss of soil carbon in LAC (Lal, 2005; Lal, 2006; van der Werf et al., 2010; INPE, 2010).
Status of the World’s Soil Resources Report, Regional Assessments of Soil Changes | Chapters 9 - 16
149

Figure 12.5: Regional set of 2000 tree cover and 2000 to 2012 forest loss. (A) Mexico and Guatemala, centered at 16.3°N, 90.8°W; (B) Brazil, centered at 5.3°S, 50.2°W and (C) Argentina, centered at 27.0°S, 62.3°W. (Hansen et al, 2013).
The loss of ground cover due to deforestation exposes the soil to direct precipitation that could cause erosion, and compaction of soil surface microstructure in addition to carbon loss. Deforestation of tropical forests prevents returning to the soil about 15 tons of vegetable debris per hectare each year. Agricultural soils only return on average only 2 tons of residues per hectare each year (Hughes et al., 1999).
Global tropical rainforest bioma reaches 32% of global forest cover loss, nearly half of which occurs in South American rainforests. Several studies have been carried out and information is documented in the region related to deforestation and reforestation (CIAT, 2014; Gardi et al. 2014). The tropical dry forests of South America had the highest rate of tropical forest loss, due to deforestation dynamics in the Chaco woodlands of Argentina, Paraguay and Bolivia (Grau & Aide,
Status of the World’s Soil Resources Report, Regional Assessments of Soil Changes | Chapters 9 - 16
150

2008; Viglizzo & Jobbagy, 2010). Brazil is a global exception in terms of forest change, with a dramatic policy-driven reduction of deforestation in Amazon Basin (INPE 2010, Sparovek, 2012; INPE, 2013) . (Figure 12.5).
The litter on the ground also influences carbon fluxes to the mineral soil. A conserved forest can accumulate up to 10 tons of litter per hectare; however when this forest is degrading its accumulation rate drops to 2 tons per hectare (Cruz- Gaistardo et al., 2010). In an extreme case of erosion litter would completely disappear. The loss of soil carbon results in the loss of natural fertility and the existing biodiversity. These factors lead to extreme soil degradation, and could affect the local to regional economy (Smith et al., 2007).
In temperate Pampas of Argentina and Uruguay, grassland and pastures conversion to agriculture caused soil organic carbon stocks to decrease from 27 Mg ha-1 to 19-20 Mg ha-1 in the first 20 cm of soil profile (Alvarez et al. 2009).
Most important cities in LAC, such as Mexico City, Lima, Buenos Aires, São Paulo, Rio de Janeiro, Santiago and Bogota, perform control tasks of urban wastes rich in organic carbon in order to reduce pollution, especially in surrounding rural areas that function as receptors (Da Silva et al., 2008). In the region of Santiago de Chile there are currently generated just over 200 Gg of urban sludge and muds, which are produced each day by about 7 million people (CEPAL, 2010). These wastes are currently evaluated for their intensive application for permanent farmland. It is known that this type of sludge may need up to three years to be mineralized, dissolved and available to plants, with the natural risk that the concentration of metals (mainly zinc and copper) increase in the soil (Gonzalez Martineaux, 2008). Important efforts are made in Brazil for growing rice in not flooded areas and to mechanically cut the sugar cane without resorting to direct burning. In Colombia and Cuba the use of organic fertilizers are widely promoted (Willer et al., 2009).
International policy initiatives, such as the United Nations Framework Convention of Climate Change Reducing Emissions from Deforestation and forest Degradation (REDD) program, often lack the institutional investment and scientific capacity to begin implementation of a program that can make use of the global observational record; in other words, the policy is far ahead of operational capabilities. Brazil’s use of Landsat data in documenting trends in deforestation was crucial to its policy formulation and implementation. To date, only Brazil produces and shares spatially explicit information on annual forest extent and change (UNFCCC, 2013; INPE, 2010, 2013).
Most soil sampling sites in LAC have been selected to address targets and questions related to fertility or taxonomy, but they were not selected to specifically quantify carbon in different reservoirs (above- and below-ground) that can be used for payment for environmental services . To this end, Mexico and Brazil are currently conducting national soil surveys designed to quantify soil carbon by increasing the number of sites within a systematic grid and using state-of-the-art instrumentation. For example, field spectrophotometers, electromagnetic readings in the visible and infrared region of the light spectrum, and also by using micrometeorological towers of carbon fluxes between terrestrial ecosystems and the atmosphere (Vargas et al, 2013). In the case of Mexico there are currently 11,000 sites with systematic information of all carbon reservoirs obtained in the same space-time axis, with subsequent re-sampling or continuous monitoring.
Status of the World’s Soil Resources Report, Regional Assessments of Soil Changes | Chapters 9 - 16
151

12.4.3. SOIL SALINIZATION
Salt-affected soils are found mainly in arid and semi-arid regions. Salinization caused by irrigation affects 18.4 million ha in LAC, particularly in Argentina, Brazil, Chile, Mexico and Peru (AQUASTAT, 1997). In large plains areas of the Continent, many of them affected by natural salinization, land use changes and overgrazing also promoted topsoil salimization (Taboada et al. 2011; Bandera 2013; Di Bella et al. 2015).
Around 85 million ha are affected by excess of salts and sodium in Argentina, including arid and semi-arid zones (Szabolcs, 1979). Information provided by Bandera (2013) indicates that Argentina has approximately 600,000 ha of irrigated soils affected by salinity problems, which is the third largest area in a country after Russia and Australia. In Argentina there are also areas of soils affected by salts in humid and sub humid climates, where salts come from groundwater. This is the case of the Pampa Deprimida (Depressed) the Buenos Aires East-Center (9 million ha), Buenos Aires Northwest (2.5 million ha) and Submeridional Lowlands of Chaco and Santa Fe provinces (3 million ha).
The irrigated agricultural area of the northeast region of Brazil is around 500 thousand ha, where 25–30% is in process of salinization (Heinze, 2002). Irrigation-induced salinization is an important land degradation process that affects crop yield in the Brazilian semi-arid region, and gypsum has been used as a corrective measure for saline soils (Moreira et al., 2014). The use of gypsum in the irrigation water improves soil physical and chemical properties and can be considered as an alternative for the reclamation of saline-sodic and sodic alluvial soils in Northeast Brazil (Silveira et al., 2008).
The salinity of soils on the cultivated land in the coastal valleys in northern Chile, (Azapa and Lluta valleys) is generated by the salinity of irrigation water.
In Colombia, soils susceptible to salinization cover approximately 86 592 km2, of which 90.39% are located in dry regions (Casierra-Posada et al, 2007). Areas susceptible to salinization are located in the Caribbean region, inter-Andean valleys and highlands, and current and future agricultural production zones.
In Cuba the soils with primary salinity, only occupy restricted areas, often near to sea coasts. Secondary salinity affects the majority of Cuban soils. The main causes of secondary salinity are: increase of saline groundwater level, deforestation of hilly lands and use of saline water for irrigation (Alvarez et al., 2008). In Cuba there are 160 000 ha rice crops, of which approximately 100 000 ha have problems of salinity and/or sodicity, in varying degrees (Borroto, 1986).
In Ecuador, approximately 8.1 million ha, corresponds to agricultural soils, of which 25% are dedicated to agricultural activity both crops of short cycle (rice, maize, cassava, soy, watermelon, melon, tomato, pepper) as a permanent (cocoa, coffee, sugarcane, banana) and 63%, natural and artificial pastures. One of the most serious problems facing this ecosystem, is the increase in salinity caused by irrigation with waters of medium quality, use excessive of fertilizers in fertirrigation rather than sustainable systems that some years later would be virtually unprofitable and would put at risk the production of some species. Soil salinity constitutes one of the main causes for crop yield reduction. A significant part of the Ecuadorian highland soils are considered as high-salinity because
Status of the World’s Soil Resources Report, Regional Assessments of Soil Changes | Chapters 9 - 16
152

of their pyroclastic nature, the effects of erosion and the poor use of irrigation water (Jaramillo et al., 2014).
In Mexico, approximately 20 percent of agricultural land irrigated (6 million ha) is affected by salinity and sodicity problems. In 1964 it was estimated in the irrigation districts of Culiacán, Fuerte River, Río Mayo, and Rio Yaqui, with a total area of 610,701 ha, 36% of their land (218,495 ha) had some kind of salt affectation (Palacios-Vélez, 2012).
The lack of complete feasibility studies prior to implementing irrigation projects in Peru has caused increased drainage and salinity problems in the Coastal Area where it affects 2 500 km2. In all irrigation projects on the coast, drainage- and salinity problems have developed within a few years after the start of irrigation projects. (Cornejo, 1970). More than 300 000 ha (40% of cultivated land in Peru's Coastal Valleys) were affected by soil salinity in the 1970's. About 25% (roughly 190 000 ha) were characterized by light to extreme salinity (>4 dS/m), enough to have negative effects on crop productivity (World Bank, 2007). Currently, there is little interest of the Government to stop degradation of land, while updated information, is sorely lacking and dates back to 1970's (Santayana, 2012).
In Venezuela, the existence of problems of salinity was recognized in soils in the arid and semi-arid areas of the States of Zulia, Falcón, Lara, Anzoátegui and Trujillo (Villafañe, 1995). Falcon was one of the major vegetable producer states in Venezuela, until soil degradation by salts and its negative effects on yields caused the abandonment of farms in this area.
12.5. Case studies 12.5.1. ARGENTINA
Argentina is the eighth largest country of the world, with 2.780.400 km2 located in the American Continent, with 70% of its territory under arid, semiarid and dry sub-humid climates and the remaining 30% under humid and subhumid climates. Regions under humid and subhumid temperate and subtropical climates (i.e. Pampean, Chaco and Mesopotamia) concentrate the production of cereals, oilseeds, industrial crops, forages, forest plantations, domestic livestock and dairy of the country (SIIA, 2015). The agricultural use of soils started in Argentina at the end of 19° Century in consonance with the arrival of European immigrants and governmental colonization policies (Barski & Gelman, 2001; Viglizzo and Jobbagy, 2010). Agriculture and livestock grazing expanded until mid 20° Century, because of the incorporations of new lands into production and use of low intensive production practices (Viglizzo and Jobbagy, 2010). However, this resulted in moderate to severe land degradation, not only in agricultural but also in dryland areas of Argentina (Secretaría de Agricultura, Ganadería y Pesca – Consejo Federal Agropecuario, 1995). Agriculture was intensified after the end of 20° Century, especially in the Pampean region, with the use of more productive cereal varieties and hybrids, genetically modified crops , fertilizers and no till farming (Paruelo et al. 2005; Satorre, 2005; Viglizzo and Jobbagy, 2010).
In the last decade, land use changes moved the agricultural frontier northeasterly, northwesterly and westerly (Figure 12.7), advancing to areas under drier climates and/or less fertile soils (Paruelo et al. 2005; Viglizzo and Jobbagy, 2010). As a result, the cultivated area increased from about 15 to 32 million hectares from 1988 to 2010, and the bulk grain production from about 20 to near 100 million tons in the same period (SIIA, 2015). At the same time, the basket of produced crops
Status of the World’s Soil Resources Report, Regional Assessments of Soil Changes | Chapters 9 - 16
153

shortened. In 1990 it was composed by 37% wheat, 30% soybean and 13% maize, and 24 years later (2014) it did by 61% soybean, 19% maize and only 11% wheat (SIIA, 2015). This simplification was largely favored by export-oriented demands for oil and biofuel soybean (Gobierno Argentino, 2014) . Although this production system was highly successful in terms of fuel saving and adoption by farmers, it was denounced to drive smaller farmers, that are not able to face uneven competition, out of business (Pengue, 2005).
Status of the World’s Soil Resources Report, Regional Assessments of Soil Changes | Chapters 9 - 16
154

Figure 12.7. Expansion of the agricultural frontier under rainfed conditions (Source: Viglizzo and Jobbagy, 2010).
Agriculture during the 20° Century decreased soil carbon stocks by 27-50%, which was ascribed to the roturation of organic C – rich grasslands and prairie soils with mold board and disc ploughs, and the loss of crop diversity (Studdert et al., 1997; Viglizzo and Jobbagy, 2010; Sainz Rozas et al., 2011; Caride et al., 2012; Milesi Delaye et al., 2013). The potential of no till farming to increase soil organic C stocks is still in discussion. In a review of 42 no-till vs plough till data sets from field experiments conducted in the Pampean region, Steinbach & Álvarez (2006) concluded that a 2.76 Mg ha-1 organic C increase was observed in no-till systems compared with tilled systems, with
Status of the World’s Soil Resources Report, Regional Assessments of Soil Changes | Chapters 9 - 16
155

a relatively higher increase of organic C in areas of low organic matter level. However, Álvarez et al. (2009) observed no significant change in topsoil organic C content because of the adoption of continuous no tillage in conventionally tilled loam, silty loam, and silty clay loam soils in well-managed farms of the region.
No till farming is considered to improve topsoil physical properties, especially when combined with suitable crop rotations and pastures (Álvarez et al., 2014). However, the prevalence of soybean monocropping in the Pampean and Chaco regions promoted unfavorable topsoil physical conditions such as laminar and massive aggregation, shallow compaction and decreased infiltration rates (Sasal et al., 2006; Álvarez & Steinbach, 2009; Álvarez et al., 2009, 2014). These structural forms were found to decrease soybean yields under rainfed conditions (Bacigaluppo et al., 2011).
Fertilizer use in Argentina has been quite low until the mid-90’s and despite the eight-fold increase in fertilizer use in the last two decades, negative budgets of nitrogen, phosphorus and sulphur still persist in the Pampean region (Lavado & Taboada, 2009; Viglizzo and Jobbagy, 2010). Nutrient removal by grains has exceeded application by 2.3-3.2, 1.4-2.0, and 2.0-2.6 times for N, P, and S in the last four years.This represents a special issue in the case of phosphorus, which have decreased to deficient levels in several areas (Sainz Rozas et al., 2012), and for which the country does not have commercial reserves.
During the 20°Century, more than 1,2 million hectares (32%) were affected by moderate and severe soil water erosion, characterized by 47 to 131 Mg ha-1 y-1 soil losses and 5 to 20 cm surface horizon thickness decreases (Secretaría de Agricultura, Ganadería y Pesca - Consejo Federal Agropecuario, 1995). According to estimations by Viglizzo and Frank (2010), the widespread adoption of no tillage helped to control erosion losses, which fell down to only 7 Mg ha-1 y-1. However, more field data are needed to check these estimations.
Salt affected soils cover more than 70 million hectares in Argentina, being the third country in the world by its surface (FAO, 1976). At less 600 000 ha irrigated soils under arid and semiarid climates are affected by man-made salinization, often related to unsuitable drainage management and/or poor water quality. In subhumid and humid regions, there are about 12 million hectares of naturally salinized soils. In these areas made-man salinization was also promoted by livestock grazing (Taboada et al. 2011), complementary irrigation (Andriulo et al., 1998) deforestation (Nosetto et al., 2012) or afforestation (Jobbagy & Jackson, 2004).
A detailed evaluation of the state of land degradation in the drier areas of Argentina came to the following conclusions (FAO, 2010):
Eighty one percent (81%), or more than 1.240.000 km2 of the evaluated systems, present some process of degradation. The degree of degradation of dry lands, defined as the intensity of the process varies from non-degraded to extreme (Figure 12.8). This result is obtained after adding all degradation processes identified, among others: water and wind erosion, salinization and loss of vegetative cover.
Within the degrading processes analyzed, 50% of the surface is mainly affected by processes of biological degradation (variation of vegetative cover, loss of habitats, and decrease of biomass), of which 26% present a strong degree of degradation. The rate of degradation is slow in 40% of the areas with biological degradation, while almost 20% of these areas present a high rate of increase.
Status of the World’s Soil Resources Report, Regional Assessments of Soil Changes | Chapters 9 - 16
156
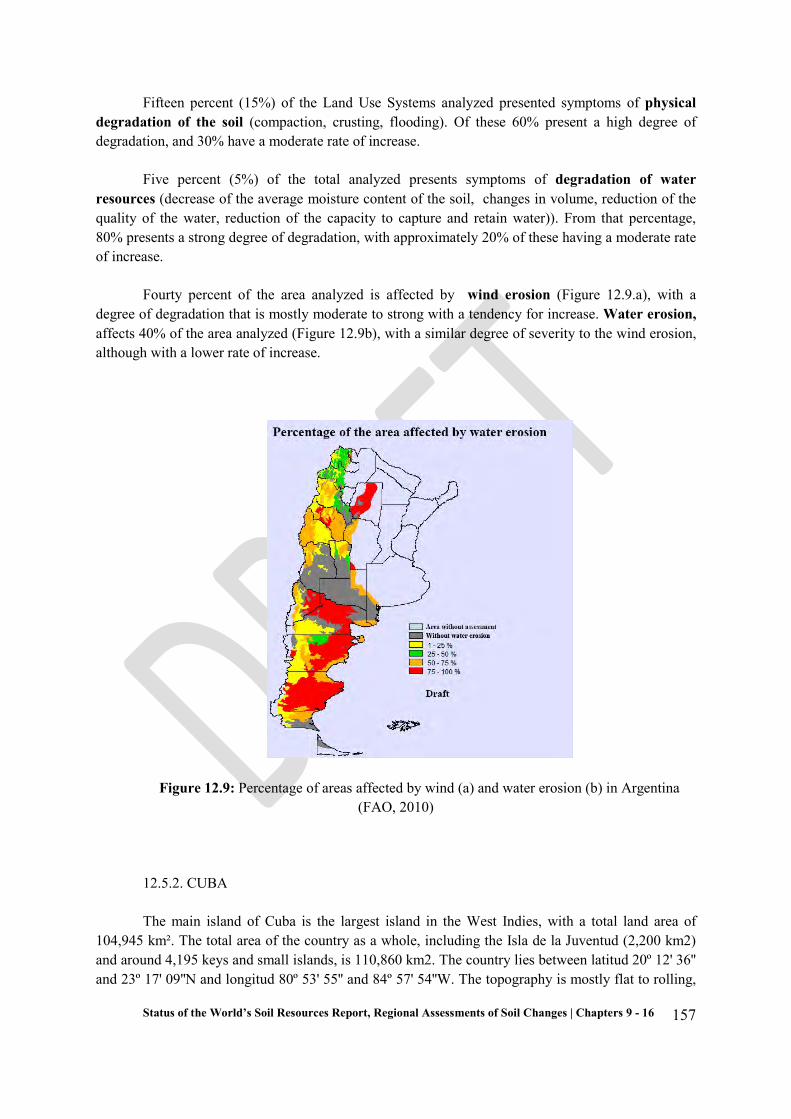
Fifteen percent (15%) of the Land Use Systems analyzed presented symptoms of physical degradation of the soil (compaction, crusting, flooding). Of these 60% present a high degree of degradation, and 30% have a moderate rate of increase.
Five percent (5%) of the total analyzed presents symptoms of degradation of water resources (decrease of the average moisture content of the soil, changes in volume, reduction of the quality of the water, reduction of the capacity to capture and retain water)). From that percentage, 80% presents a strong degree of degradation, with approximately 20% of these having a moderate rate of increase.
Fourty percent of the area analyzed is affected by wind erosion (Figure 12.9.a), with a degree of degradation that is mostly moderate to strong with a tendency for increase. Water erosion, affects 40% of the area analyzed (Figure 12.9b), with a similar degree of severity to the wind erosion, although with a lower rate of increase.
Figure 12.9: Percentage of areas affected by wind (a) and water erosion (b) in Argentina (FAO, 2010)
12.5.2. CUBA
The main island of Cuba is the largest island in the West Indies, with a total land area of 104,945 km². The total area of the country as a whole, including the Isla de la Juventud (2,200 km2) and around 4,195 keys and small islands, is 110,860 km2. The country lies between latitud 20º 12' 36'' and 23º 17' 09''N and longitud 80º 53' 55'' and 84º 57' 54''W. The topography is mostly flat to rolling,
Status of the World’s Soil Resources Report, Regional Assessments of Soil Changes | Chapters 9 - 16
157
with rugged hills and mountains in the southeast and south-central area. The Cuban mountain range system is formed by four massifs covering 1,959,400 ha, equivalent to 18% of the surface of the Cuban archipelago. The surface cover of Cuba consists of cropland and crop/natural vegetation mosaics (44%), shrub lands, savanna and grasslands (24%), forests (23%) and wetlands (9%).
Mean annual rainfall is 1335 mm, with a pronounced seasonal variation between the driest and wettest months. Rainfall levels vary widely across the country, from 300 mm annually in the Guantánamo area of the south to more than 3,000 mm in the north. Mean annual temperature is 25°C (Cuba, 2014).
Over the last three decades, significant variations have been detected in the country’s climatic patterns (Centella et al. 1997). An overall increase in temperature has been accompanied by a reduction in annual rainfall totals of 10-20% and an increase in inter-annual variation in rainfall of 5-10%, with reduced rainfall in the rainy season and increased rainfall in the dry season (Lapinel et al. 1993; Goldenberg et al., 2001). At the same time, the frequency of unseasonal droughts has increased. .The National Environment Strategy 2007/2010 is the guiding document for Cuban environmental policy. It defines the five main environmental issues in Cuba (land degradation, factors affecting forest coverage, pollution, loss of biological diversity and water scarcity) and proposes the policies and instruments for their prevention, solution or minimization in order to improve environmental protection and the rational use of national resources. Land degradation is considered the most important of the five issues.
Cuba presents a wide variety of soils, including those developed over sedimentary limestone (Nitisols, Ferralsols and Lixisols), and others over older rocks (Cambisols and Phaeozems). Cuba has complete soil studies at 1:250.000; 1:50.000 and 1:25.000 scales. (Gardi et al., 2014).
The most recent assessment of land degradation at local and national level was carried out between 2006 and 2010, using a standard methodology (Liniger et al., 2011; Bunning et al., 2011).In parallel, the sustainable land management practices applied to stop or reverse the degradation process in the country were inventoried in each land use system (AMA, 2010). A first set of 23 thematic maps at 1: 250 000 scale was produced in 2010 and these were updated in 2013 (IGT-AMA, 2014).
Fifteen different types of degradation, affecting the whole country to a lesser or more serious degree were recognized (Figures 12.11 and 12.12). The main types of degradation in terms of extent are: (1) loss of topsoil by water erosion covers more than thirty thousand km2 and is present in all provinces; (2) the loss of vegetative cover has a similar extent and also occurs in every province; (3) processes of salinization and compaction cover between 10 and 20 thousand km2 in 14 and 11 provinces respectively; (4) loss of habitat condition and areas affected by fire occupy up to 5000 km2 each in 9 provinces of the country. The other types of degradation such as of aridity, loss of soil fertility, reduced organic matter content and reduced quality of surface and groundwater occupy areas that do not exceed 5000 km2, but affect food production.
Status of the World’s Soil Resources Report, Regional Assessments of Soil Changes | Chapters 9 - 16
158

Figure 12.11: Predominant types of land degradation in Cuba
Figure 12.12: Extent of land degradation in land use system units in Cuba.
As far as the intensity of degradation is concerned, 12% of Cuban territory is classified as grade 1 (slight), while 68% is grade 2 (slight or moderate intensity) and 19% is grade 3 (strong or intense degradation). The last two grades are mainly located in the central and eastern area (Figure 12.13).
Status of the World’s Soil Resources Report, Regional Assessments of Soil Changes | Chapters 9 - 16
159

Figure 12.13: Intensity of land degradation in Cuba
A systematic local inventory of land degradation processes was carried out in the dryland areas of Cuba that occupy a total area of nearly 10,000 km2, and occur mainly in the eastern region of the country, between Camagüey and Guantanamo, covering 6 provinces and 20 municipalities. Surveys were carried out in the most representative areas of Camaguey-Tunas, Granma and Guantanamo covering soil health, water quality and quantity, vegetation status and biodiversity, among others. Since 2001, the country established different programs and strategies based in Soil Sustainable Management in order to combat soil degradation, the most important is the National Program for Soil Melioration and Conservation that is regulated by Soil Institute. During these years at least 500 000 ha are benefited by these programs financially supported by Cuban government (Instituto de Suelos, 2001).
12.6 Conclusions and recommendations LAC has different biomas and probably the largest potential of cropland in the world.
Although soils of the region are subjected to a number of threats, three main of them were identified: soil erosion, organic carbon losses and salinization. Other threats such as imbalance of nutrients, loss of biodiversity, compaction, waterlogging, contamination and sealing and capping are also frequent but today less important.
Status of the World’s Soil Resources Report, Regional Assessments of Soil Changes | Chapters 9 - 16
160

The most important ecosystem services affected in LAC are: climate regulation through the disturbance of the C and N cycles due to deforestation, and water regulation and food production in sloping lands. Deforestation and erosion because of inadequate land uses represent the initial cause of various man-induced threats to soil quality.
An enhanced natural resource information system is necessary in many countries of LAC, in order to perform a better diagnosis of soil conditions and their level of degradation. This will allow identifying possible solutions, including land use planning and appropriate legislation.
A big effort should be done in order to implement a sustainable soil management in the region, taking into account all of these mentioned aspects and the particular characteristics of each country. A participatory process is required for the success of the final goal, which are the protection of the soil resource for food security and the production of ecosystems services for the future human well being.
Very poor
Poor Fair GoodVery good
In condition In trend
Soil erosion Widespread across the region. Landslides are accelerated by land use in highland areas ↙ ● ◒
Organic carbon change
It is promoted by deforestation, roturation of grasslands and monoculture. ↙ ◒ ◒
Salinization and sodification
Caused by inadequate irrigation technology and water quality. Land use changes also promote salinization. ↙ ● ●
Nutrient imbalance
Most countries have negative nutrient balances due to over-extraction. In some cases over fertilization also causes nutrient imbalance. ↙ ◒ ◒
Loss of soil biodiversity
Suspected to occur in deforested and over-exploited agricultural areas ↙ ~ ○ ◒
Compaction Caused by overgrazing and intensive agricultural traffic↙ ◒ ◒
Waterlogging Due to deforestation and poor structural conditions in agriculturial areas ● ●
Soil acidification It is still limited to some areas with overuse of N fertilizers ~ ○ ○
Contamination Industrial sources cause soil contamination in some places. Non point soil pollution prevails in sites with intensive agriculture (e.g. herbicides residues). ~ ○ ◒
Sealing and capping
In some valleys and floodplains, urbanization has expanded onto fertile soils. ~ ◒ ◒
Symbol
~↙↗○◒
●Limited evidence or limited consensusAdequate high-quality evidence and high level of consensus
StableVariableDeterioratingImprovingEvidence and consensus is low
Condition and Trend ConfidenceThreat to soil
functionSummary
Definition
Status of the World’s Soil Resources Report, Regional Assessments of Soil Changes | Chapters 9 - 16
161

Table 12.2 Summary of Soil Threats Status, trends and uncertainties in in Latin America and the Caribbean
REFERENCES
Alegre, J.C.; C. Felipe-Morales, and La Torre. 1990. Soil Erosion Studies in Peru. Journal of Soil and Water Conservation. 45:417-420.
Alegre, J.C., Pashansi B., Lavelle P. 1996. Dynamics of soil physical properties in Amazonina agroecosytem inocultated by earthworms. SSSAJ 60: 1522-1529
Álvarez, A., Baños, R., Otero, L. 2008. Salinidad y uso de aguas salinas para la irrigación de cultivos y forrajes en Cuba. Instituto de Investigaciones de Pastos y Forrajes. Ministerio de la Agricultura de Cuba.
Álvarez, C. R., M. A. Taboada, F. H. Gutiérrez Boem, A. Bono, P. L. Fernández, P. Prystupa. 2009. Topsoil properties as affected by tillage systems in the Rolling Pampa region of Argentina. Soil Science Society of America Journal 73: 1242-1250. (Online ISSN: 1435-0661 Print ISSN: 0361-5995).
Álvarez, C.R.; Taboada, M.A.; Perelman, S.B.; Morrás, H.J. 2014. Topsoil structure in no-tilled soils in the Rolling Pampas, Argentina. Soil Research 52, 533-542.
Alves, B.J.R. ; Boddey, R.M. ; Urquiaga, S. 2003. The success of BNF in soybean in Brazil. Plant & Soil. V.252, p. 1-9.
AMA, 2010. “Alcance, resultados e impactos del proyecto LADA en Cuba”. http://www.educambiente.co.cu/Desercuba/index.php?option=com_content&view=article&id=45:lada&catid=36:miscelaneas
Aparicio, V.C.; De Gerónimo, E.; Marino, D.; Primost, J.; Carriquiriborde, P.; Costa, J.L. 2013. Environmental fate of glyphosate and aminomethylphosphonic acid in surface waters and soil of agricultural basins. Chemosphere. 93(9):1866-1873.
AQUASTAT. 1997. Tablas resumen para America Latina y el Caribe. FAO.http/www.fao.org/GEO-2-199.
Bacigaluppo, S.; Bodrero, M.L.; Balzarini, M.; Gerster, G.R.; Andriani, J. M.; Enrico, J. M.; Dardanelli, J.L. 2011. Main edaphic and climatic variables explaining soybean yield in Argiudolls under no-tilled systems. European Journal of Agronomy. 35: 247-254.
Bai Z. G.; Dent, D.L.; Olsson, L. and Schaepman, M.E.: 2008 Proxy global assessment of land degradation. Soil Use and Management Vol 24 Issue 3:223-234.
Balotta, E.L.; Colozzi Filho, A.A.; Andrade, D.S.; Dick, R. P. 2004. Long-term tillage and crop rotation effects on microbial biomass and C and N mineralization in a Brazilian Oxisol. Soil and Tillage Research 77 (2): 137–145.
Bandera, R. 2013. Rehabilitación de suelos salino-sódicos: evaluación de enmiendas y de especies forrajeras. Tesis presentada para optar al título de Magíster de la Universidad de Buenos Aires, Área Recursos Naturales. 66p.
Barski, O., Gelman, J. 2001. Historia del agro argentino. Desde la Conquista hasta fines del siglo XX. Buenos Aires: Grijalbo Mondadori, 460 p.
Status of the World’s Soil Resources Report, Regional Assessments of Soil Changes | Chapters 9 - 16
162

Batjes, J.A. Dijkshoorm, 1998. Carbon and nitrogen stocks in the soils of the Amazon Region. Geoderma 89 1999 273–28. International Soil Reference and Information Centre ISRIC , Wageningen, Netherlands.
Bertsch F., Henríquez C., Ramírez F. y Sancho F. 2002. Site-specific nutrient management in the Highlands of Cartago province (Costa Rica). Better Crops International 16(1):16-19.
Bertiller M.B.; Ares, J.O.; Bisigato, A.J. 2002. Multiscale indicators of land degradation in the Patagonia Monte, Argentina. Envionmental Management. 30(5):704-715.
Boddey, R.M.; Alves, B.J.R; Jantalia, C.P.; Machado, P.L.O.A.; Soares, L.H.B.; Urquiaga, S. 2012b. Praticas mitigadoras das emissões de gases de efeito estufa na agropecuária brasileira. In: CARBON STOCKS AND GREENHOUSE GAS EMISSIONS IN BRAZILIAN AGRICULTURE Boddey, R.M.; Lima, M.L.; Alves, B.J.R.; Machado, P.L.O.de A.; Urquiaga, S. Ed. Embrapa, Brasilia, DF, 2012b, pp 327-347.
Boddey, R.M.; Alves, B.J.R; Urquiaga, S.; Jantalia, C.P.; Martin –Neto, L.; Madari, B.E.; Milori, D.M.B. Machado, P.L.O.A. 2012a. Estoques de carbono nos solos do Brasil. Quantidade e mecanismos de acúmulo e preservação. In: CARBON STOCKS AND GREENHOUSE GAS EMISSIONS IN BRAZILIAN AGRICULTURE Boddey, R.M.; Lima, M.L.; Alves, B.J.R.; Machado, P.L.O.de A.; Urquiaga, S. Ed. Embrapa, Brasilia, DF, pp 33-82.
Boddey, R.M.; Lima, M.L.; Alves, B.J.R.; Machado, P.L.O.de A.; Urquiaga, S. 2014. Carbon stocks and greenhouse gas emissions in Brazilian agriculture. Embrapa, Brasilia, DF, 374P.
Borroto, M y Castillo, D. 1986. Ponencia sobre suelos salinos en Cuba y metodología para su mejoramiento. Ministerio de la Agricultura. La Habana: 35 p.
Botta, G.F.; Tolon-Becerra, A.; Lastra-Bravo, X.; Tourn, M. 2010. Tillage and traffic effects (planters and tractors) on soil compaction and soybean (Glycine max L.) yields in Argentinean pampas. Soil Till. Res., 110(1): 167–174.
Botta, G.F.; Tolon-Becerra, A.; Melcon, F.B. 2009. Seedbed compaction produced by traffic on four tillage regimes in the rolling Pampas of Argentina. Soil Till. Res., 105(1): 128–134.
Bunning, S.; McDonagh, J. and Rioux, J. 2011. Manual for local level assessment of land degradation and sustainable land management. LADA Technical Report No 11. FAO, Rome.
Campillo, R., Urquiaga, S., Pino, I, Montenegro, A., 2003. Estimación de la fijación biológica de nitrógeno en leguminosas forrajeras mediante la metodología del 15N. Agricultura Tecnica. v.63, p.169 - 179, 2003.
Campillo, R., Urquiaga, S., Undurraga, P., Pino, I., Boddey, R.M. 2005. Strategies to optimise biological nitrogen fixation in legume/grass pastures in the southern region of Chile. Plant and Soil, 2005.v.273, p.57 - 67.
Caride, C., Piñeiro, G.; Paruelo, J. M. 2012. How does agricultural management modify ecosystem services in the Argentine Pampas? The effects on soil C dynamics. Agriculture, Ecosystems and Environment. 154: 23-33.
Casierra-Posada, F., Pachón, C.A. and Niño-Medina, R.C. 2 007. Análisis bromatológico en frutos de tomate ( Lycopersicon esculentum Mill.) afectados por salinidad por NaCl. Revista U.D.C.A Actualidad & Divulgación Científica 10(2):95-104.
Status of the World’s Soil Resources Report, Regional Assessments of Soil Changes | Chapters 9 - 16
163

Centella A., Naranjo L., Paz L., Cárdenas P., Lapinel B., Ballester M., Pérez R., Alfonso A., González C., Limia M. y Sosa M. 1997. Variaciones y cambios del clima en Cuba. Informe Técnico. Centro Nacional de Clima, Instituto de Meteorología. La Habana, Cuba, 58 pp.
Christoffoleti, P.J.; Galli, A.J.B.; Carvalho, S.J.P.; Moreira, M.S.; Nicolai, M.; Foloni, L.L.; Martins, B.A.B.; Ribeiro, D.N. 2008. Pest Management Science. Special Issue: Glyphosate-Resistant Weeds and Crops 64 (4): 422–427.
CIAT 2014.
CEPAL 2010.
Cerdeira, A.L.; Gazziero, D.L.P.; Duke, S.O.; Matallo, M.B. 2011. Agricultural Impacts of Glyphosate-Resistant Soybean Cultivation in South America. J. Agric. Food Chem., 2011, 59 (11): 5799–5807
Comerma, J; Larralde R.; Soriano J. 1971. Aumento de la productividad agrícola a través de los trabajos de conservación de suelos. México I Seminario Latinoamericano FAO/PNUD/ México. Evaluación sistemática de los recursos de tierras y aguas, 23 pag; Agronomía Tropical 23: 95- 113
Comision Europea. 2013. Cambio climático y degradación de los suelos en América Latina: escenarios, políticas y respuestas. Programa EUROCLIMA, Dirección General de Desarrollo y Cooperación-EuropeAid, Comisión Europea. Bruselas. 188p.
Cornejo, A. 1970. Resources of Arid South America, in Arid Lands in Transition, Harold E. Dregne, editor, AAAS. pp. 345-380.
Cruz-Gaistardo C. 2014. Inventario de Gases de Efecto Invernadero 2014. Reporte Bianual para el sector USCUSS, sector suelos. PNUD-FAO-CONAFOR, México.
Cruz-Gaistardo C., Díaz V., Martínez J. 2010. Inventario Estatal Forestal y de Suelos. Secretaría del Medio Ambiente del Estado de Aguascalientes, México.
CUBA. 2014. Anuario Estadístico 2013. Oficina Nacional de Estadísticas.
D'Accunto, L; Semmartin, M,; Ghersa, C.M. 2014. Uncropped field margins to mitigate soil carbon losses in agricultural landscapes. Agricultural, Ecosystems and Environment 183: 60-68.
Da Silva A, Donini Mancini Sandro, 2008. Compostagem: A reciclagem da major parte dos residuos urbanos. Universidade Estadual Paulista, Brasil.
de Moraes Sa, J.C.; Lal, R. 2009. Stratification ratio of soil organic matter pools as an indicator of carbon sequestration in a tillage chronosequence on a Brazilian Oxisol. Soil and Tillage Research 103 (1): 46–56.
Di Bella, C.R.; Rodríguez, A.M.; Jacobo, E.J.; Golluscio, R.A.; Taboada, M. A. 2015. Impact of cattle grazing on temperate coastal salt marsh soils. Soil Use and Management (in press).
Duvert, C., Gratiot, N., Evrard, O., Navratil, O., Némery, J., Prat, C., Esteves, M., 2010. Drivers of erosion and suspended sediment transport in three headwater catchments of the Mexican Central Highlands. Geomorphology 123:243-D256.
Espinosa, J.; Molina E. 1999. Acidez y encalado de los suelos. International Plant Nutrition Institute IPNI. 46 p.
Status of the World’s Soil Resources Report, Regional Assessments of Soil Changes | Chapters 9 - 16
164
FAO. 1976. Soils Bulletin No. 31 ‘Prognosis of salinity and alkalinity’. FAO, Rome. Available at: http://www.fao.org/docrep/x5871e/x5871e03.htm#TopOfPage
FAO. 2005. Global Forest Resources Assessment 2005: Progress towards sustainable forest management (FAO Forestry Paper 147). Rome: FAO Forestry Department. 320 p. Available at: http://www.fao.org/docrep/008/a0400e/a0400e00.HTM. Access on September 3rd 2014.
FAO 2010. Proyecto Evaluación de la Degradación de la Tierra en zonas secas, LADA. http://www.fao.org/nr/lada/
FAO. 2012. Directrices voluntarias sobre la Gobernanza responsable de la tenencia de la tierra, la pesca y los bisques en el contexto de la seguridad alimentaria nacional. CF. Available at: http://www.fao.org/docrep/016/i2801s/i2801s.pdf
Fassbender, H. ; Bornemisza E., 1987. Química de suelos con énfasis en suelos de América Latina. 2da Ed. San José Costa Rica, IICA. 420p
Franchini, J.C. ; Crispino, C.C. ; Souza, R.A. ; Torres, E. ; Hungria, M. 2007. Microbiological parameters as indicators of soil quality under various soil management and crop rotation systems in southern Brazil. Soil and Tillage Research 92(1–2):18–29.
Franzluebbers, A.J., Sawchik, J., Taboada, M.A. 2014. Agronomic and environmental impacts of pasture-crop rotations in temperate North and South America. Agriculture, Ecosystems and Environment 190, 18-26.
Galdino, S., Vieira, L.M., Pellegrin, L.A. (Eds.), 2006. Impactos Ambientais e Socioeconômicos na Bacia do Rio Taquari – Pantanal. Embrapa Pantanal, Corumbá, MS. 356p. ISBN 85-98893-05-6.
Gardi, C., Angelini, M., Barceló, S., Comerma, J., Cruz Gaistardo, C., Encina Rojas, A., Jones, A., Krasilnikov, P., Mendonça Santos Brefin, M.L., Montanarella, L., Muniz Ugarte, O., Schad, P., Vara Rodríguez, M.I., Vargas, R. (eds), 2014. Atlas de suelos de América Latina y el Caribe, Comisión Europea - Oficina de Publicaciones de la Unión Europea, L-2995 Luxembourg, 176 pp.
Garret, L. J., 1997. Desafíos para la visón 2020 en América Latina: la alimentación y la agricultura desde 1970. Instituto internacional de investigaciones sobre políticas alimentarias. (IFPRI). Washington, D.C. EE.UU
Gobierno Argentino. 2014. Aceite de soja: Argentina lidera ventas en la región. Argentina. Portal Público de Noticias. Available at: http://www.argentina.ar/temas/economia-y-negocios/29800-aceite-de-soja-argentina-lidera-ventas-en-la-region
Goldenberg S.B., Landsea C.W., Mestas -Nunez A.M. y Gray W.M. 2001. ‘‘The recent increase in Atlantic hurricane activity: Causes and implications.’’ (“El reciente incremento en la actividad de huracanes en el Atlántico: Causas e implicaciones”) Science, 293 (20 de Julio), 474–79.
González Martineaux S. 2008. Evaluación del uso agrícola de lodos de plantas de tratamiento de aguas servidas de la ciudad de Santiago de Chile. INIA.
Guimarães, L.R. 2013. Nutrient management challenges in Brazil and Latin America. The second global conference on Land-Ocean Connections (GLOC-2), Montego Bay, October 3.
Grau, H. R., and M. Aide. 2008. Globalization and land-use transitions in Latin America. Ecology and Society 13(2):16.
Status of the World’s Soil Resources Report, Regional Assessments of Soil Changes | Chapters 9 - 16
165

Green, V.S.; Stott, D.E.; Cruz, J.C.; Curi, N. 2007. Tillage impacts on soil biological activity and aggregation in a Brazilian Cerrado Oxisol. Soil and Tillage Research 92 (1–2): 114–121.
Hansen M. C, P. V. Potapov, R. Moore, M. Hancher, S. A. Turubanova, A. Tyukavina, D. Thau, S. V. Stehman, S. J. Goetz, T. R. Loveland, A. Kommareddy, A. Egorov, L. Chini, C. O. Justice, J. R. G. Townshend. 2013. High-Resolution Global Maps of 21st-Century Forest Cover Change. Science 342.
Henríquez C., Ortíz O., Largaespada K., Portuguéz P., Vargas M., Villalobos P., Gómez D. 2011. Determinación de la resistencia a la penetración, al corte tangencial, densidad aparente y temperatura en un suelo cafetalero, Juan Viñas, Costa Rica. Agronomía Costarricense. 35(1):175-184.
Henríquez C., Uribe L., Valenciano A., Nogales R. 2014. Actividad enzimática del suelo –Deshidrogenasa, Glucosidasa, Fosfatasas y Ureasa- Bajo diferentes cultivos. Agronomía Costarricense. 38(1):43-54.
Heinze, B. 2002. Importância da agricultura irrigada para o desenvolvimento da região
nordeste do Brasil, Brasília - DF. Monografia, MBA, Ecobusiness Scholl, FVG. Publicações IICA/braulioheinze.pdf. Disponível em: www.iica.org.br/docs/publicacoes.
Hincapié, E., and F. Ramírez. 2010. Riesgo de erosion en suelos de ladera de la zona
cafetera. Avances Técnicos 400. 8p. Cenicafé. Manizales (Colombia)
Hughes R. Flint, Kauffman J. Boone, and Jaramillo Víctor J., 1999. Biomass, Carbon, and nutrient dynamics of secondary forest in a humid tropical region of México. Ecology 80:1892–1907. http://dx.doi.org/10.1890/0012-9658 (1999) 080 [1892:BCANDO] 2.0.CO;2.
IGT-AMA, 2014. “Mapas CSMB Cartografia del Sistema de Monitoreo Biofísico” Instituto de Geografía tropical y la Agencia de medio Ambiente. La Habana. http://www.infogeo.cu/index.php/ct-menu-item-2/monitoreo-biofisico/si-proyectos/17-proyectos/34-mapas-de-lada.
Instituto de Suelos. 2001. Programa Nacional de Mejoramiento y Conservación de Suelos. La Habana, Cuba. Agrinfor, 39 p.
Instituto Nacional de Pesquisas Espaciais (INPE) 2010: Deforestation estimates in the Brazilian Amazon, INPE, São Jose ́ dos Campos, http://www.obt.inpe.br/prodes/, 2010.
Instituto Nacional de Pesquisas Espaciais (INPE) 2013. Monitoring of the Brazilian Amazonian Forest by satélite, 2002-2012. Instituto Nacional de Pesquisas Espaciais, São José dos Campos, SP, Brazil, 2013.
Jantalia, C.P.; Resck, D.V.S. ; Alves, B.J.R. ; Zotarelli, L.;Urquiaga, S. ; Boddey, R.M. 2007. Tillage effect on C stocks of a clayey Oxisol under a soybean-based cropo rotation in the Brasilian Cerrado region. Soil & Tillage Research, v.95, p. 97-109.
Jaramillo, V., Arahana, V. and Torres, M. 2014. Determination of the level of tolerance to salinity in in vitro conditions of the plants of tomate de árbol (Solanum betaceum) from different localities of the ecuatorian highlands. Edited by: Cesar Zambrano, Ph.D.
Jobbagy, E.; Jackson, R.B. 2004. Groundwater use and salinization with grassland
afforestation. Global Change Biology. 10 (8): 1299–1312. Status of the World’s Soil Resources Report, Regional Assessments of Soil Changes | Chapters 9 - 16
166

Kämpf N., Curi N., Marques J., 2009. Intemperismo e ocorrência de minerais no ambiente do solo. Ing. Química e mineralogía do solo. Parte I. Conceitos básicos. Ed. Vander de Freitas Melo & Luis Alleoni. Sociedad Brasileira de Ciência do solo. Pp 333-379.
Laegreid M., O.C. Bockman and E.O. Kaarstad. 1999. Agriculture, Fertilizers and the Environment. CABI Publishing- Norks Hydro, 294 pages
Lal, R., 2005. Forest soils and carbon sequestration. Forest Ecology and Management 220, 242-258
Lal. R. 2006. Soil Carbon Sequestration in Latin America. In: Lal, R., Carlos C. Cerri, Matial Bernoux, Jorge Etcheverd, Eduardo Cerri Editors. Carbon Sequestration in Soils of Latin America. Food Products Press. An Imprint of The Haworth Press, Inc. New York, London, Oxford. 49-64.
Lapinel B., Rivero R.E. y Cutié V. 1993. La sequía en Cuba: Análisis del período 1931-1990 (inédito). Informe Científico-Técnico, Centro Meteorológico Territorial, Camagüey, 40 pp.
Lavado R. S.; M. A. Taboada. 2009. The Argentinean Pampas: A key region with a negative nutrient balance and soil degradation needs better nutrient management and conservation programs to sustain its future viability as a world agroresource. Journal of Soil and Water Conservation 65, 150A-153A.
Liniger, H.P.; van Lynden, G,; Nachtergaele, F.; Schwilch, G.and Biancalani, R. 2011. Questionnaire for mapping land degradation and sustainable land management v2.0. LADA Technical Report No 9. FAO, Rome.
Malm, O. 1998. Gold Mining as a Source of Mercury Exposure in the Brazilian Amazon. Environmental Research 77(2):73–78.
Milesi Delaye, L. A.; Irizar, A. B.; Andriulo, A. E.; Mary, B. 2013. Effect of Continuous Agriculture of Grassland Soils of the Argentine Rolling Pampa on Soil Organic Carbon and Nitrogen. Applied and Environmental Soil Science. Article ID 487865, 17 pages. Available at: http://dx.doi.org/10.1155/2013/487865.
Miyake, S.; M. Renouf; A. Peterson¸ C. McAlpine & C. Smith. 2012. Land-use and environmental pressures resulting from current and future bioenergy crop expansion: A review. Journal of Rural Studies 1-12.
Mol, J.H.; Ramlal, J.S.; Lietar, C.; Verloo, M. 2001. Mercury Contamination in Freshwater, Estuarine, and Marine Fishes in Relation to Small-Scale Gold Mining in Suriname, South America. Environmenta Research Section A. 86:183- 197.
Moreira, L.; Dos Santos Teixeira, A.; Galvão, L. 2014. Laboratory Salinization of Brazilian Alluvial Soils and the Spectral Effects of Gypsum. Remote Sens. 6:2647-2663.
Nachtergaele, F.O.; Petri, M. and Biancalani, R. 2011. Global Land Degradation
Information System (GLADIS) manual v 1.0. LADA Technical Report No 17. FAO, Rome.
Nogueira, M.A.; Albino, U.B.; Brandão-Junior, O.; Braun, G.; Cruz, F.M.; Dias, B.A.; Duarte, R.T.D.; Gioppo, N.M.R.; Menna, P.; Orlandi, J.M.; Raimam, M.P.; Rampazo, L.G.M.; Santos, M.A.; Silva, M.E.Z.; Vieira, F.P.; Torezan, J.M.D.; Hungria, M.; Andrade, G. 2006. Promising indicators for assessment of agroecosystems alteration among natural, reforested and
Status of the World’s Soil Resources Report, Regional Assessments of Soil Changes | Chapters 9 - 16
167

agricultural land use in southern Brazil. Agriculture, Ecosystems and Environment 115 (1–4): 237–247.
Nosetto, M.D.; Jobbágy, E.G.; Brizuela, A.B.; Jackson, R.B. 2012. The hydrologic consequences of land cover change in central Argentina. Agriculture, Ecosystems and Environment. 154: 2–11
Nriaugu, J. 1994. Mercury pollution from the past mining of gold and silver in the Americas. Science of The Total Environment 149(3):167–181.
Oldeman, L. R.; van Engelen, V. W. P.; Pulles, J. H. M. , 1991a . The extent of human-induced soil degradation. In: Oldeman, L. R.; Hakkeling, R. T. A.; Sombroek, W. G. World map of the status of humam-induced soil degradation: an explanatory note. Wageningen: International Soil Reference and Information Centre; Nairobi: United Nations Environment Programme, 1991. p. 27-33.
Oldeman, L., Hakkeling, R., and Sombroek, W. 1991b. World Map of the status of human- induced soil degradation. Wageningen. GLASOD-ISRIC.
Olson, D. M., Dinerstein, E., Wikramanayake, E. D., Burgess, N. D., Powell, G. V., Underwood, E. C., & Kassem, K. R. (2001). Terrestrial Ecoregions of the World: A New Map of Life on Earth A new global map of terrestrial ecoregions provides an innovative tool for conserving biodiversity. BioScience,51(11), 933-938[Online].
Ometo, J.P.H.B.; Martinelli, L.A.; Ballester, M.V.; Gessner, A.; Krusche,A.V.; Victoria, R.L.; Williams, M. 2000. Effects of land use on water chemistry and macroinvertebrates in two streams of the Piracicaba river basin, south-east Brazil. Freshwater Biology 44 (2): 327–337.
Pais, P.S.M., Dias Junior, M.C., Dias, A. C., Iori, P., Guimarães, P.T.G. & Santos, G.A. 2013. Load bearing capacity of a Red-Yellow Latosol cultivated with coffee plants subjected to different weed managements. Ciênc. agrotec., 37(2):145-151.
Palacios-Vélez, O. 2012. Problemas de drenaje y salinidad en los Distritos de Riego de México: Panorámica. Postgrado de Hidrociencias, Campus Montecillo del Colegio de Postgraduados en Ciencias Agrícolas. México.
Palm, C. and P. Sanchez. 1990 Decomposition and nutrient release patterns of the leaves of three tropical legumes. Biotropica 22 (4) : 330-338
Paruelo, J. M.; J. P. Guerschman & S. R. Verón. 2005. Expansión agrícola y cambios en el uso del suelo. Revista Ciencia Hoy vol. 15 (nº 87): 14-23.
Pengue, W. 2005. Transgenic crops in Argentina: The ecological and social debt. Bulletin of Science, Technology & Society. 25 (4): 314-322.
Pla, I. 1992. La Erodabilidad de los Andisoles en Latino América. Suelos Ecuatoriales 22(1): 33-43. Sta Fe de Bogotá (Colombia)
Pla, I. 1993. Erosión de suelos de ladera del trópico Andino y Centroamericano. En: (F. Munevar y col, ed.) Manejo Integrado de Recursos Naturales en Ecosistemas Tropicales para una Agricultura Sostenible. 21-36. ICA. Sta Fe de Bogotá (Colombia)
Pla, I. 1996a. Degradación de suelos en zonas de ladera de América Latina. In (F. Bertsch y C. Monreal, ed.): El Uso Sostenible del Suelo en Zonas de Ladera: El Papel Esencial de los Sistemas de Labranza Conservacionista. 28-49. FAO-MAG. San Jose (Costa Rica)
Status of the World’s Soil Resources Report, Regional Assessments of Soil Changes | Chapters 9 - 16
168
Pla, I. 1996b. Sistemas y prácticas de conservación de suelos y aguas. En “Planificación y Manejo Integrado de Cuencas Hidrográficas en Zonas Áridas y Semiáridas de América Latina” .131-160.FAO-PNUMA. Santiago de Chile. (Chile)
Pla, I. 2003. Erosion research in Latin-America. En: 25 Years of Assessment of Erosion (D. Gabriels y W. Cornelius ed). 19-27. Univ. of Gent. Gent (Bélgica)
Pla, I. 2011. Evaluación y Modelización Hidrológica para el Diagnóstico y Prevención de “Desastres Naturales”. Gestión y Ambiente 14 (3): 17-22. UN-Medellín (Colombia).
PNUMA-CEPAL. 2010. Gráficos Vitales de Cambio Climático para América Latina y El Caribe. Santiago de Chile. CEPAL
Restrepo, J.D.; Kjerfve, B.; Hermelin, M.; Restrepo, J.C. 2006: Factors controlling sediment yield in a major South American drainage basin: the Magdalena River, Colombia. Journal of Hydrology 316:213–32.
Romaniuk, R.; Giuffré, L.; Costantini, A.; Bartoloni, N.; Nannipieri, P. 2012. A comparison of indexing methods to evaluate quality of soils: the role of soil microbiological properties. Soil Research 49 (8: 733-741
Sainz Rozas, H.R.; Echeverria, H.E.; Angelini, H.P. 2011 Organic carbon and pH levels in agricultural soils of the pampa and extra-pampean regions of Argentina. Ciencia del Suelo 2011, 29, 29-37.
Sainz Rozas, H.; Echeverria, H.; Angelini, H. 2012. Available phosphorus in agricultural soils of the pampa and extra-pampas regions of Argentina. RIA, Revista de Investigaciones Agropecuarias. 38:, 33-39.
Sánchez, P. 1981. Suelos del trópico. Características y manejo. Instituto Interamericano de cooperación para la agricultura IICA. San José, Costa Rica. 634 p.
Santayana, S. 2012. Problemas de drenaje y salinidad en la costa peruana. XI Congreso Nacional de Ingeniería Agrícola.Lima, Perú.
http://www.lamolina.edu.pe/eventos/agricola/2012/XI_Congreso/ponencias/ponencia_12.pdf
Sasal, M. C.; Andriulo, A.; Taboada, M. A. 2006. Soil porosity characteristics on water dynamics under direct drilling in Argiudolls of the Argentinean Rolling Pampas. Soil and Tillage Research. 87, 9-18.
Satorre E. H. 2005. Cambios tecnológicos en la agricultura Argentina actual. Revista Ciencia Hoy 15 n° 87: 24-31.
Secretaría de Agricultura, Ganadería y Pesca-Consejo Federal Agropecuario (SAGyP-CFA). 1995. El deterioro de las tierras en la República Argentina. Alerta Amarillo. Secretaría de Agricultura, Ganadería y Pesca, 287 p. ISBN 987-95327-3-2
Sicardi, M.; Garcı́a-Préchac, F.; Frioni, L. 2004. Soil microbial indicators sensitive to land use conversion from pastures to commercial Eucalyptus grandis (Hill ex Maiden) plantations in Uruguay. Applied Soil Ecology 27 (2): 125–133.
SIIA. 2015. Sistema Integrado de Información Agropecuaria. Presidencia de la Nación, Ministerio de Agricultura, Ganadería y Pesca. Available at: http://www.siia.gov.ar/
Status of the World’s Soil Resources Report, Regional Assessments of Soil Changes | Chapters 9 - 16
169

Silveira, K., Ribeiro, M., De Oliveira, L., Heck, R. and Silveira, R. 2008. Gypsum-saturated water to reclaim alluvial saline sodic and sodic soils. Sci. agric. (Piracicaba, Braz.) [online]. Vol. 65, No 1.
Sisti, C.P.J. ; Santos, H.P. dos ; Kochhann, R.A. ; Alves, B.J.R. ; Urquiaga, S. ; Boddey, R.M. 2004. Change in carbon and nitrogen stocks in soil under 13 years of conventional or zero tillage in southern Brazil. Soil & Tillage Research, v.76, p. 39-58.
Smith, P., D. Martino, Z. Cai, D. Gwary, H. Janzen, P. Kumar, B. McCarl, S. Ogle, F. O'Mara, C. Rice, B. Scholes, O. Sirotenko, 2007: Agriculture. In Climate Change 2007: Mitigation. Contribution of Working Group III to the Fourth Assessment Report of the Intergovernmental Panel on Climate Change [B. Metz, O.R. Davidson, P.R. Bosch, R. Dave, L.A. Meyer (eds)], Cambridge University Press, Cambridge, United Kingdom and New York, NY, USA.
Sousa, D. M. 2011. Solo: Recurso fundamental para o desenvolvimento da Agricultura na Savana tropical. EMBRAPA-Cerrados. XIX Congreso Venezolano de la Ciencia del Suelo.Calabozo, Noviembre.
Spavorek G, G Bemdes, A.G.Barreto and L.Klug. 2012. Environ. Sci. Policy 16:65-72.
Steinbach, H.S.; Álvarez, R. 2006. Changes in soil organic carbon contents and nitrous oxide emissions after introduction of no-till in Pampean agroecosystems. Journal of Environmental Quality. 35: 3-13.
Studdert, G. A..; Echeverría, H. E.; Casanovas, E.M. 1997. Crop-pasture rotation for sustaining the quality and productivity of a Typic Argiudoll. Soil Science Society of America Journal. 61 (5): 1466-1472.
Szabolcs, I. 1979. Review on Research of Salt Affected Soils. Natural Resources Research XV, UNESCO, Paris.
Taboada, M. A., G. Rubio, E. J. Chaneton. 2011. Grazing impacts on soil physical, chemical and ecological properties in forage production systems. p. 301-320. En: J. L. Hatfield, T. J. Sauer (ed.) Soil management: building a stable base for agriculture. American Society of Agronomy and Soil Science Society of America.
Taboada, M.A., F.G. Micucci, D.J. Cosentino y R.S. Lavado. 1998. Comparison of compaction induced by conventional and zero tillage in two soils of the Rolling Pampa of Argentina. Soil and Tillage Research, 49: 57 – 63.
Torri, S.I.; Lavado, R.S. 2008. Dynamics of Cd, Cu and Pb added to soil through different kinds of sewage sludge. Waste Management. 28 (5): 821-832
UNFCCC. 2013.. Non-Annex I national communications. Link: http://unfccc.int/national_reports/non-annex_i_natcom/items/2979.php
UNEP United Nation Development Programme. 2000. A Guide to World Resources. World Resources Institute. Washington, D.C. 389 pages.
Urquiaga, S, Alves, B.J.R. J, Antalia, C.P., Martins, M.R., Boddey, R.M. 2014 A cultura de milho e seu impacto nas emissões de GEE no Brasil In: Eficiência nas cadeias produtivas e o abastecimento global.1 ed.Sete Lagoas, MG : ABMS, 2014, p. 61-71.
Status of the World’s Soil Resources Report, Regional Assessments of Soil Changes | Chapters 9 - 16
170

Urquiaga, S., Xavier, R. P., Morais, R. F. de, Batista, R. B., Schultz, N., LEITE, J. M., Maia e Sá, J., Barbosa, K. P., Resende, A. S. de, Alves, B.J.R, Boddey, R. 2012 Evidence from field nitrogen balance and 15N natural abundance data for the contribution of biological N2 fixation to Brazilian sugarcane varieties. Plant and Soil, v.356, p.5 - 21,
van der Werf, G. R., Randerson, J. T., Giglio, L., Collatz, G. J., Mu, M., Kasibhatla, P. S., Morton, D. C., DeFries, R. S., Jin, Y., and van Leeuwen, T. T. 2010. Global fire emissions and the contribution of deforestation, savanna, forest, agricultural, and peat fires (1997– 2009), Atmos. Chem. Phys., 10, 11707–11735, doi:10.5194/acp- 10-11707-2010, 2010.
Vargas R., Allen, M.F., Allen, E.B. 2008. Biomass and carbon accumulation in a fire chronosequence of a seasonally dry tropical forest. Global Change Biology 14, 109-124, doi:110.1111/j.1365-2486.2007.01462.x.
Vargas, R., Yepez, E.A., Andrade, J.L., Angeles, G., Arredondo, T., Castellanos, A.E., Delgado-Balbuena, J., Garatuza-Payan, J., Gonzales del Castillo, E., Oechel, W., Rodriguez, J.C., Sanchez-Azofeifa, G.A., Velasco, E., Vivoni, E.R., Watts, C., 2013. Progress and opportunities for monitoring greenhouse gases fluxes in Mexican ecosystems: the MexFlux network. Atmosfera 26, 325-336.
Viglizzo E. F., E. Jobbágy (Eds.). 2010. Expansión de la frontera agropecuaria en Argentina y su impacto ecológico-ambiental. Ediciones INTA. Buenos Aires (ISBN Nº 978-987-16723-83-9).
Viglizzo, E.F. & F. C. Frank. 2006. Land-use options for Del Plata Basin in South America: Tradeoffs analysis based on ecosystem service provision. Ecol. Econ. 57: 140-151.
Villafañe, R. 1995. Detección de suelos afectados por sales en áreas bajo riego de los estados Portuguesa, Barinas y Lara, Venezuela. Agronomía Tropical. 54(3): 445-456.
White D., Arca, M., Alegre, J., Yanggen, D., Labarta, R., Weber, J.C., Sotelo, S. & Vidaurre, H.. 2005. The Peruvian Amazon: Development Imperatives and challenges. pp 332-354 In: Palm, C.A., Vosti, S.A., Sanchez, P.A., Ericksen, P.J., (Eds). Slash and Burn: the search for alternatives. Columbia University Presss, New York, USA. 463 pp.
Willer, Helga and Lukas Kilcher (Eds.), 2009. The World of Organic Agriculture. Statistics and Emerging Trends 2009. FIBL-IFOAM Report. IFOAM, Bonn; FiBL, Frick; ITC, Geneva
World Bank. 2007. Republic of Peru environmental sustainability: a key to poverty reduction in Peru. Washington, DC: http://documents.worldbank.org/curated/en/2007/06/7910058/republic-peru-environmental-sustainability-key-poverty-reduction-peru.
Status of the World’s Soil Resources Report, Regional Assessments of Soil Changes | Chapters 9 - 16
171

13. Regional Assessment of Soil Changes in the Near East and North Africa Assessment of Soil Changes in the Near East and North Africa Region.
Regional Coordinator: Seyed Kazem Alavi Panah (ITPS/Iran)
Regional Lead Author: Mubarak Abdelrahman Abdalla (Sudan)
Contributing Authors: Hedi Hamrouni (Tunisia), Abdullah AlShankiti (ITPS/Saudi Arabia), Elsiddig Ahmed El Mustafa El Sheikh (ITPS/Sudan), Ali Akbar Noroozi (Iran).
======================================================================
13.1. Introduction The Near East and North Africa (NENA) region, which includes Tunisia, Algeria, Morocco,
Libya, Egypt, Sudan, South Sudan, Jordan, Israel, Lebanon, Syria, Palestine, Iraq, Yemen, Saudi Arabia, Oman, Qatar, United Arab Emirates, Kuwait, Bahrain and Iran, has a land area of approximately 14.9 million km2 that is nearly completely hyper-arid, arid or semi-arid. The region occupies the heart area of the world drylands where land resources in the region face three climatic constraints: aridity, recurrent drought, and desertification, which is also human induced. South Sudan is the only country in the region which falls within the dry sub-humid tropical zone; Desert conditions may reach up to 100 percent in Libya, Egypt, Bahrain, Kuwait, Qatar and the United Arab Emirates (FAO, 2013).
The soils of the Maghreb region (Morocco, Tunisia, Libya and Algeria) reflect three broad divisions: (i) along the Mediterranean and Atlantic coasts productive Kastanozems (Xerolls) and Luvisols (Alfisols) occur (SEDENOT, 1999; MADRPM. 2000; Halitima, 1988) (ii) Leptosols (lithic subroups) and Cambisols (Inceptisols) are found in the Atlas Mountains away from the coast *Rayan et al., 2000); (iii) the Calcisols (Calcids), Gypsisols (Gypsids), Leptosols and Cambisols are found in the southern part (Jones et al., 2013). The Vertisols, Arenosols (Psamments), Fluvisols (Fluvents), Calcisols and Gypsisols (Aridisols) are the dominants soils in Sudan and Egypt. In the Mashreq region (Jordan, Syria, Lebanon, Iraq and Palestine), the soils of the valleys are Arenosols (Psamments) and Fluvisols (Fluvents), whereas in the highlands, steppe and desert regions, the main orders are Calcisols (Calcids) and Cambisols (Aridisols), Arenosols (Psamments) and Leptosols (Lithic subgroups) and Vertisols which are calcareous in the subsoil horizons. In the Persian Gulf (Oman, Kingdom Saudi Arabia, Kuwait, Bahrain, United Arab Emirates, Yemen, Iran and Qatar), alluvial soils rich in silt and desert soils, sandy soils poor in organic carbon in which evaporate Tertiary Formations played an important role on the formation of contemporary minerals (Abbaslou et al., 2013).
Agriculture, linked to other sectors, is the main source of income for many countries in the region but arable land constitutes only 6.8 percent of the total land area, while about 26 percent is used for pasture and about 7 percent is under forest (Hamdallah, 1997). Based on the type of agriculture practiced, Dregne and Chou (1992) divided the productive land in the region into: irrigated land (0.7 percent, 8.5Million ha), rainfed (2.2 percent, 27.7 Million ha), rangelands (40 percent, 495.6 Million ha) and extremely arid land (57 percent, 705.2 Million ha). These proportions may vary considerably by country, for instance productive lands represent 30 percent of the total areas in Syria
Status of the World’s Soil Resources Report, Regional Assessments of Soil Changes | Chapters 9 - 16
172
and Lebanon, but only 3 percent in Egypt, Algeria and Sudan and reach a minimum of 0.5 percent in Saudi Arabia, Oman and Mauritania (Mamdouh Nasr, 1999).
Natural resource degradation, especially where agriculture is practiced, is a real threat in all countries of the region and remains a major limitation to the reliable supply of food. In most countries of the NENA region in Asia, salinization, water and wind erosion, loss of vegetation cover, soil physical degradation including compaction and surface crusting are the main threats of the soil ecosystem serving capacity. The expansion of agriculture in marginal land has greatly aggravated water erosion and consequently soil degradation. In over 95 percent of the countries due to extreme climatic conditions, overgrazing and unsuitable cropping patterns, accumulation of salts have rendered them unproductive (Abahussain et al., 2002). The oriented near east-sub region (Iran, Iraq, Egypt, Jordan, Lebanon, Sudan and Syria) is the most affected part of the NENA region by land degradation (FAO, 2004). For example, Nasr (1999) reported that rainfed cropland represents only 3 percent (almost 30 million ha) of the region’s total drylands, of which about 22 million ha (73 percent) are estimated by UNDCPAC to be degraded. The scope of degradation of rainfed cropland is greatest in the countries of northern Africa: Algeria (93 percent), Morocco (69 percent), Tunisia (69 percent) and, exceptionally, Egypt (10 percent). The extent of degradation in the countries of the Middle East, i.e. Iraq (72 percent), Syria (70 percent), is higher than that in the Arab Golf Countries: Oman (50 percent), Qatar (25 percent), and Bahrain (20 percent). The Arab Centre for the Study of Arid Zones and Dry Lands (CAMRE/UNEP/ACSAD, 1996) has estimated that land degradation affects approximately 49, 29, 17 and 9 percent of the oriented Near East, Nile Valley of Egypt, North Africa and Gulf Cooperation Council Countries. More than one process of degradation can occur in one farming system. Degradation is quite serious in one of the largest country in the region (Sudan) which considered as a country with high agricultural potential (Ayoub, 1998). In this part of the region (Sudan) and in the last 35 years, the 46 million ha lying in the semi-arid zone which is the center of production of field crops, the gum Arabic tree and cattle region (i.e. zone of both animal and rainfed husbandry), has encountered intensive soil degradation. In North Africa, causes of soil degradation are divided among overgrazing (68 percent), over cultivation (21 percent), deforestation (10.5 percent) and overexploitation of vegetation for about 0.5 percent (Thomas and Middleton, 1994). In the newly created country of the region (South Sudan), there are very limited studies on estimates and impact of land degradation. However, there are indications that land use changes have deteriorated the quality of the land in many places (Dima, 2006). Land degradation in certain regions could affects adjacent areas for instance degradation in rangelands where rainfall is low, has negative effects on resources of the rainfed areas. As one of the most vulnerable regions to climate change (FAO, 2011), agriculture faces major losses due to land degradation (e.g. by the year 2050, rice, soybeans, maize and barley grain yields rare expected to decrease by about 11, 28, 19 and 20 percent, respectively) (FAO, 1994). Recent studies in the economic cost of land degradation were reported by Hussein et al. (2008) and estimated at 9 billion USD year-1 (e.g. 2.1-7.4 percent of the GDP).
The main soil threats, erosion (by water and wind), salinity/ sodicity, soil contamination and organic C depletion, will discussed in this report. Major causes of soil degradation in the region are due to many factors among them: excessive irrigation/poor drainage, wind and water erosion, water logging, deteriorated soil fertility, over-grazing, loss of soil cover, land miss-management, sand encroachment, overuse of herbicides and pesticides and chemical fertilizers (FAO, 2004). Data correlating land degradation with yield at global level is scarce, however, recent studies (2000-2010) showed that land losses due to degradation in North Africa is the highest among selected countries at globe level which has resulted in a considerable food gap of 0.6X10⁶ metric ton (Keith Wiebe, 2003). Efforts to contain continuous the issue of land degradation are many. Most important is the political
Status of the World’s Soil Resources Report, Regional Assessments of Soil Changes | Chapters 9 - 16
173

will of governors. In this respect, the 21st summit of African leaders (2013) has urged member states to place land degradation at the centre of the debate on the Post-2015 Development Agenda, and recognize it as one of the sustainable development goals. The agricultural sector in this region contributes about 10 percent of the region GDP, but however, characterized by fragile resource base.
13.2. Major land use systems in the Near East and North Africa
Land use systems in the region have been identified and broadly delimited, based on a range of characteristics (Nachtergaele and Petri, 2011), their geographical location is indicated in Figure 13.1. They can be combined in three major systems: irrigated crop based, rainfed mixed and livestock based, that are briefly discussed below (Dixon et al., 2001).
Irrigated land use systems
Given the arid and semiarid nature of much of North Africa and the Near East, Irrigated farming systems have always been of crucial importance in generating much of the region's agricultural output. The system contains both large and small-scale irrigation schemes with high population densities and generally very small farm sizes. The prevalence of poverty within both systems is moderate. Traditionally, areas within the Large-scale Irrigation Sub-System have been linked primarily to perennial surface water resources, such as the Nile (Egypt and Sudan) and Euphrates valleys (Syria and Iraq), but the intensification of traditional karez or qanat systems has also led to the evolution of large-scale irrigated areas wherever sub-surface water is abundant. More recently, the availability of deep drilling and pumping technologies has permitted the development of new areas drawing entirely on subterranean aquifers. Large-scale schemes are found across all zones and include high-value cash and export cropping and intensive vegetable and fruit cropping. Patterns of water use vary greatly but, throughout the region, inappropriate policies on water pricing and centralised management systems have meant that water is seldom used efficiently. Significant economic and environmental externalities have arisen through excessive utilisation of non-recharged aquifers while, in a number of cases, the excessive application of irrigation water has resulted in rising groundwater tables, soil salinisation and sodification problems. The Small-scale irrigated systems also occur widely across the region, and although not as important as the larger schemes in terms of numbers of people involved, or in the amount of food and other crops produced, it is a significant element in the survival of many people in arid and remote mountain areas. This sub-system, which may be of considerable antiquity, typically develops along small perennial streams and at oases, or where flood and spate irrigation is feasible. It sometimes also draws on shallow aquifers and boreholes, although these rarely penetrate to the depths seen in the large schemes. The major crops grown within small-scale irrigation areas are mixed cereals, fodder and vegetables. These areas also provide important focal points for socio-economic activity, but intense local competition for limited water resources between small rural farmers and other users is becoming increasingly evident.
Rainfed mixed crop and livestock land use systems
The rainfed agricultural and livestock systems are the most important land use system in the region in terms of population engaged in agriculture - but contains less than 10 percent of the land area, thus leading to moderately high population densities. It covers two, sometimes overlapping slopes. The first occurs in high terraces and is dominated by rainfed cereal and legume cropping, with tree crops, fruits and olives on terraces, together with vines. In Yemen, higher reaches are reserved for
Status of the World’s Soil Resources Report, Regional Assessments of Soil Changes | Chapters 9 - 16
174

qat trees and coffee, which are traditionally the most important tree crops in mountain regions. The second slope is based primarily on the raising of livestock (mostly sheep) on communally managed lands. In some cases, both the livestock and the people who control them are transhumant, migrating seasonally between lowland steppe in the more humid winter season and upland areas in the dry season. This type of livestock keeping is still important in Iran and Morocco. Poverty within this system is extensive, as markets are often distant, infrastructure is poorly developed and the degradation of natural resources is a serious problem. In the lowlands where rainfed production is feasible, an increasing area is now benefiting from the availability of new drilling and pumping technologies, which have made it possible to use supplementary winter irrigation on wheat and full irrigation on summer cash crops. There is some dry-season grazing of sheep migrating from the steppe areas. The more humid areas (with 600 to 1000 mm annual rainfall) that occur at the Caspian and Mediterranean coastal areas are characterised by tree crops (olives and fruit), melons and grapes. There is also some protected cropping with supplementary irrigation, for potatoes, vegetables and flowers. Common crops are wheat, barley, chickpeas, lentils, and the fodder crops - vetches and medics. Poverty is moderate, but would be higher without extensive off-farm income from seasonal labour migration.
Figure 13.1. Land use systems in the Near East and North Africa.
Livestock based land use systems in sparsely covered areas.
The Pastoral Land Use System, mainly involving sheep and goats but also with some cattle and camels includes large areas of semiarid steppe lands, and is characterised by low population densities, with more densely populated areas around irrigated settlements. There are irrigated croplands scattered throughout the system, thus boosting the agricultural population - and helping to
Status of the World’s Soil Resources Report, Regional Assessments of Soil Changes | Chapters 9 - 16
175
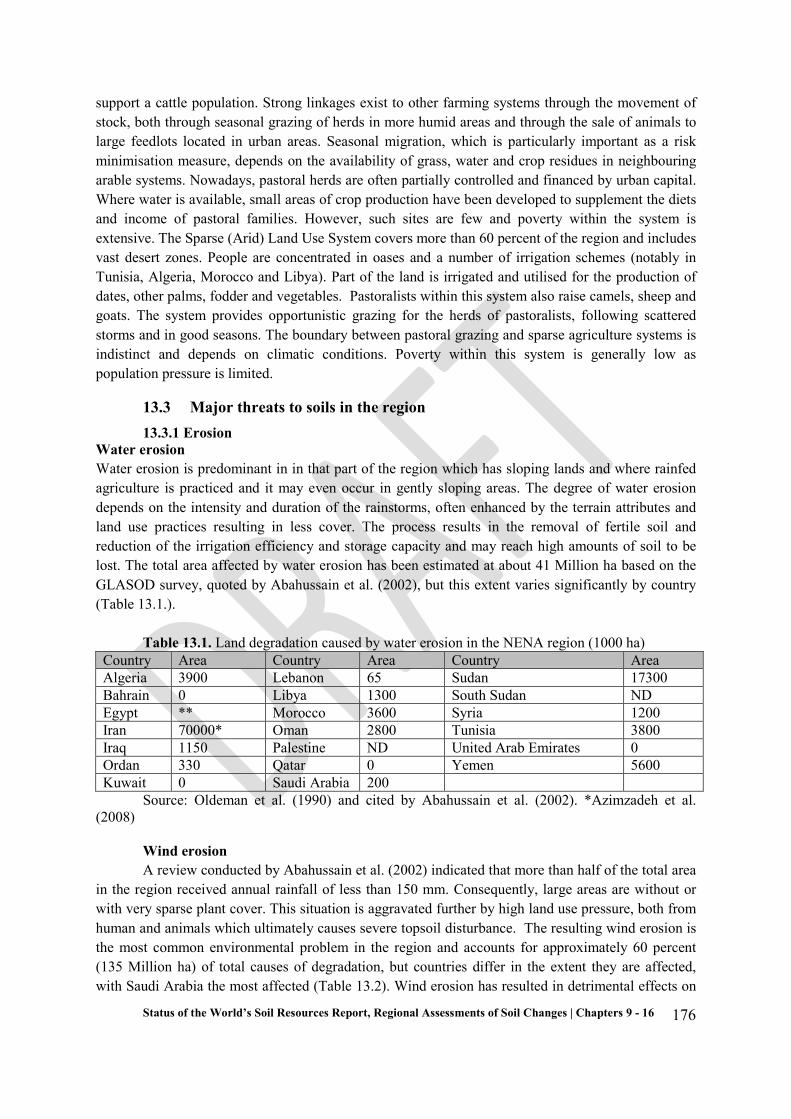
support a cattle population. Strong linkages exist to other farming systems through the movement of stock, both through seasonal grazing of herds in more humid areas and through the sale of animals to large feedlots located in urban areas. Seasonal migration, which is particularly important as a risk minimisation measure, depends on the availability of grass, water and crop residues in neighbouring arable systems. Nowadays, pastoral herds are often partially controlled and financed by urban capital. Where water is available, small areas of crop production have been developed to supplement the diets and income of pastoral families. However, such sites are few and poverty within the system is extensive. The Sparse (Arid) Land Use System covers more than 60 percent of the region and includes vast desert zones. People are concentrated in oases and a number of irrigation schemes (notably in Tunisia, Algeria, Morocco and Libya). Part of the land is irrigated and utilised for the production of dates, other palms, fodder and vegetables. Pastoralists within this system also raise camels, sheep and goats. The system provides opportunistic grazing for the herds of pastoralists, following scattered storms and in good seasons. The boundary between pastoral grazing and sparse agriculture systems is indistinct and depends on climatic conditions. Poverty within this system is generally low as population pressure is limited.
13.3 Major threats to soils in the region 13.3.1 Erosion
Water erosion Water erosion is predominant in in that part of the region which has sloping lands and where rainfed agriculture is practiced and it may even occur in gently sloping areas. The degree of water erosion depends on the intensity and duration of the rainstorms, often enhanced by the terrain attributes and land use practices resulting in less cover. The process results in the removal of fertile soil and reduction of the irrigation efficiency and storage capacity and may reach high amounts of soil to be lost. The total area affected by water erosion has been estimated at about 41 Million ha based on the GLASOD survey, quoted by Abahussain et al. (2002), but this extent varies significantly by country (Table 13.1.).
Table 13.1. Land degradation caused by water erosion in the NENA region (1000 ha) Country Area Country Area Country Area Algeria 3900 Lebanon 65 Sudan 17300 Bahrain 0 Libya 1300 South Sudan ND Egypt ** Morocco 3600 Syria 1200 Iran 70000* Oman 2800 Tunisia 3800 Iraq 1150 Palestine ND United Arab Emirates 0 Ordan 330 Qatar 0 Yemen 5600 Kuwait 0 Saudi Arabia 200
Source: Oldeman et al. (1990) and cited by Abahussain et al. (2002). *Azimzadeh et al. (2008)
Wind erosion A review conducted by Abahussain et al. (2002) indicated that more than half of the total area
in the region received annual rainfall of less than 150 mm. Consequently, large areas are without or with very sparse plant cover. This situation is aggravated further by high land use pressure, both from human and animals which ultimately causes severe topsoil disturbance. The resulting wind erosion is the most common environmental problem in the region and accounts for approximately 60 percent (135 Million ha) of total causes of degradation, but countries differ in the extent they are affected, with Saudi Arabia the most affected (Table 13.2). Wind erosion has resulted in detrimental effects on
Status of the World’s Soil Resources Report, Regional Assessments of Soil Changes | Chapters 9 - 16
176

land quality by removing the fertile top soils and the accumulation of eroded materials in irrigation canals, agricultural fields (sand encroachment) and water harvesting points which affect the cropped areas in the region severely. For example, the largest irrigated scheme in the world (Gezira scheme, Sudan) has been badly affected by moving sands from the surrounding areas.
Table 13.2. Soil degradation caused by wind erosion in the NENA region (1000 ha).
Country Area Country Area Country Area Algeria 12 000 Lebanon Sudan 71 000 Bahrain ND Libya 24 000 South Sudan NA Egypt 1400 Morocco 600 Syria 3000 Iran 20 000* Oman 4 000 Tunisia 4000 Iraq 3 000 Palestine ND United Arab Emirates 1100 Ordan 3 000 Qatar 200 Yemen 6 000 Kuwait 300 Saudi Arabia 50 000
Source: FAO (1990) and cited by Abahussain et al. (2002). *Azimzadeh et al. (2008). Over the last 10 years, wind erosion has decreased the soil level outside the scheme by 10 cm, whereas soil depth increased inside the scheme by 30 cm (and any level beyond 20 cm prevents irrigation water flow). Inside the scheme, the topsoil texture has changed from clayey to more sandy. Dune displacement in the scheme was about 3-5 meters month-1 during the season of active sand movement (Al-amin, 1999). This situation has forced famers to put considerable land out of production because of irrigation problems related to sand filling of irrigation canals and slope changes (Mohammed et al., 1995). The continental sands of Kordofan and Darfur (Sudan) which support the world major source of gum Arabic tree (Acacia senegal L.) encounter sever wind erosion due to overgrazing and mismanagement, which endangers the dominance of the species in the area. Omar et al. (1998) gave the example of sand encroachment into the cultivation areas of south Kuwait that has forced famers to cut out 35 percent of their total cultivable land. Water and wind erosion are also prevalent in the western area of Libya (Jifara Plain and Jebal Naffusah) where agricultural development is dominant, and in El-Witia area in the southwestern Jifara Plain as observed by the Remote Sensing Center in Tripoli (Ben-Mahmoud et al., 2000). For example, fertile cultivated soils in El-Witia, Libya classified as class 1, has decreased (1986 to 1996) from 66000 to 44900 ha (31 percent reduction), whereas low fertile soils have increased from 97000 to 134000 ha (38 percent increase). In addition, the area covered with sand dunes has increased from 32000 to 104000 ha (a 52 percent increase). The Nile Valley system represents the most fertile lands (around 2.63 million ha) in Egypt and probably in the whole region where wind erosion and salinity have degraded the soil resource (El-Kholei, 2012). Processes of sand encroachment and mobile dunes are estimated to cover more than 16 percent of the total area of Egypt. These conditions lead to active sand encroach on the fringes of the cultivated areas practically in most areas of Egypt with an estimate of about 0.76 million ha that were reported to be affected by sand encroachment and active dunes (causing reduction in productivity could reach 25 percent of the potential productivity of the affected areas). The annual soil loss was estimated to be about 1.0 million ha. In Jordan, the flat topography (<8 percent) and low annual rainfall < 200 mm) are responsible for active and strong winds carrying sediments. The severity of wind erosion in the country was reported by Taimeh (2009). Earlier, Khresat et al. (1998) reported that erosion by wind and water is considered the major cause of soil degradation in the north-western part of Jordan.
13.3.2 Soil Organic Carbon Change
Status of the World’s Soil Resources Report, Regional Assessments of Soil Changes | Chapters 9 - 16
177

Organic carbon in the soil is stored as organic matter in the form of soil fauna, roots, microbes, residues of vegetation and fungi that interact with mineral and fresh organic matter to gradually create stable humus. There is very little information in the region relating to OC changes. The prevailing arid and semi-arid conditions combined with high temperatures result in very low contents of Soil Organic Carbon in most of the region. Although in many countries of the region, the reduction in topsoil OC cannot be overlooked, a case of a very long-term (more than 70 years) management practices (e.g. sewage sludge application) that aimed at increasing C in sandy to loamy sandy soils has resulted in an increase of only 1.33 percent, which indicates a very slow OC accumulation (Abd Elnaim et al., 1987).
13.3.3 Soil Contamination
Soil contamination in the region is linked to countries with high population, high oil production or heavy mining. The increase of population is coupled with huge increase in both solid and liquid wastes that are dumped on land- and water resources causing degradation through pollution. The overuse of chemical fertilizers and the residues of applied pesticides are sources of pollution of soil and water resources. In Egypt, the construction of the High Dam reduced soil fertility as the results of sediment load reduction. This in turn forced farmers to heavily rely on inorganic fertilizers which led high levels of nitrogen and phosphorous causing an off-site impact on quater quality (NAP, 2002). The discharge of industrial effluents and agricultural drainage water and navigation activities into the Nile, main canals and drains contaminate the surface water resource. The most important industrial areas that directly affect the water quality of the River Nile system include fertilizer and sugar factories; cement and fertilizer plants; iron and steel, coke and chemicals (EEAA, 1994). Consequently, these pollutants then accumulated in rivers where, at high concentrations (Biochemical Oxygen Demand and phosphates and total dissolved salts) cause harmful chemical and biological impacts. Other sources of soil pollution are mainly due to heavy mining, agro-chemical residues, oil and other industries.
13.3.4 Soil Acidification Acidification in the region is not frequent and is restricted to coastal areas with high rainfall
that tends to leach bases from the soil. Land use that removes all harvested materials may also result in soil mining and acidification. The excessive use of nitrogenous fertilizers, in particular the use of acidifying fertilizers (e.g. ammonium sulfate) has in some cases caused reduction in pH. However, in Vertisols with high cation exchange capacity (over 60 cmole kg-1), this reduction is found to be temporary because such soils have very good buffering capacities, which can restore the initial soil pH.
13.3.5 Soil Salinization/Sodification Previous analyses (Hussein, 2001) revealed 11.2 percent of the Middle East soils are affected
by various levels of soil salinization. Salt-affected soils vary in extent by country from 10-15 percent in Algeria to over 50 percent in Iraq. About 12.1 percent area of Kuwait is affected to various levels of salinization (Shahid et al., 1992). In the UAE 33.6 percent area is salinized (EAD 2009). About 50 percent of the reclaimed lands in the Euphrates plain in Iraq and Syria were seriously affected by salinization and water logging, and about 54 percent of the cultivated area in Saudi Arabia suffers from moderate salinization (CAMRE/UNEP/ACSAD, 1996). In Egypt, 93 percent of the cultivated lands are affected by salinization and water logging. The salt-affected area in Iran has increased from 15.5 Mha, 18 Mha, 23 Mha (in 1960, 1980 and 1990, respectively) to 25 Mha in (Qadir et al., 2008).
Status of the World’s Soil Resources Report, Regional Assessments of Soil Changes | Chapters 9 - 16
178

In the United Arab Emirates, areas along the coastal sabkha (salt marshes or lagoonal deposits) are considered highly degraded due to high levels (28.8 dSm-1) of salinity (Abdelfattah, 2012). In the coastal region of the Abu Dhabi Emirate, salinity is more than 200 dS m-1 (Abdelfattah and Shahid, 2007). Saline and sodic soils are influenced by climate, agricultural practices, irrigation methods and policies related to land management (FAO, 1997). Low annual precipitation and high temperatures have also contributed to problems of salinity. In many countries of the region, where irrigation completely depends on underground water, over-irrigation has caused the formation of a shallow water table leading to increased salinization and degradation of the soil resource base. Yield reduction due to salinization and/or water logging amounts to 25 percent in Egypt, and has led to a complete loss of productivity and abandoned agricultural lands in several countries. From the very scattered information on the extent and characteristics of salt-affected soils, salinity and sodicity in the region is rapidly increasing, both in irrigated as in non-irrigated areas. Salinity, sodicity or the combination of both in some countries of the region are seriously affecting productive areas like in the Nile Delta of Egypt, and the Euphrates Valley in Iraq and Syria. The situation is further complicated by association with problems of water logging and high CaCO3 (up to 90 percent in UAE, Al Barshamgi, 1997).
13.3.6 Loss of Soil Biodiversity
The impact of soil degradation on biodiversity has received little attention in the countries of the region and there is not sufficient information available. Nevertheless, it is estimated that the region is home to one-tenth of the recorded plants worldwide or about 25 000 species of plants (25% of which are endemic to the region and10% of which are of medicinal value and many are a source of food). This indicates the importance of the region as a sink for genetic resource (Abahussain et al., 2002). The lack of proper conservation practices, overgrazing of herds of camels ruminants, and deforestation for fuel are the causes for serious losses of plant cover and valuable genetic resources, including below-ground biodiversity that is rarely quantified in this region. Proper and sustainable utilization practices of plant species producing valuable commodities and products could be a viable solution to poverty-stricken nomads and local population. Due to harsh conditions in the region, thousands of plant genetic resources were run off and still about 800 plant species are threatened to disappear (Al-Eisawi, 1998) and this loss of plant species is likely to result in changes in soil biodiversity. Iran is renowned for having one of the richest plant reserves in the world, supporting some 12 000 species of plants, the majority of which are endemic (Iran NAP, 2004). In the Elmalha area of Sudan, Bakheit (2011) collected information on some famine foods He focused on the availability and distribution of famine foods and their role in times of famine. Obviously, these are species that are considered as alternatives during crisis and are greatly threatened by genetic erosion due to soil degradation. Soil degradation studies in South Sudan indicated the disappeared of palatable grasses such as Panicum turgidum and appearance of less palatable grasses such as Aristidia funiculate which covers 40% of the pasture area that resulted in disappearance of many wild animals and decrease in biodiversity (Elfaig, 2010). The study pointed out that drought, irrational use of forest and pasture and the increase in population pressure were the main causes of this environmental degradation.
In Tunisia, more than 27 years of open grazing in the Bou Hdma National Park has caused severe loss of perennials and increased density of annuals (Belgacem et al., 2013). Their study reported that grazing has reduced total plant cover and contribution of perennials by approximately 38% and 72% respectively, while annuals were affected 100%. Overgrazing of rangelands generally cause replacement of highly competitive palatable species with less desirable plants. In the south of the sea coast of Egypt, overgrazing during the period from 1974 to 1979 has decreased the total density vegetation by more than15%, mainly due to a decrease in some perennial herbs, while at the
Status of the World’s Soil Resources Report, Regional Assessments of Soil Changes | Chapters 9 - 16
179

same time the total cover increased by about 38%, due mainly to perennial shrubs and succulents. Also in Egypt, mount Elba and the surrounding valleys are characterized by considerable runoff that endangers the diversified natural plant communities. Some of these plant species are considered to be of high genetic resource value as they are adapted to the desert conditions. In Lebanon biodiversity is threatened by many factors, chief among them are erosion, urban development and overgrazing resulting in dominance of xerophytes at the expense of other species (Zahreddine et al., 2007), while the increased level poverty in the Ramallah area, Palestine has forced 83% of the farmers to be involved in collection of medicinal plants for commercial use (Abu Hammad and Tumeizi, 2012).
13.3.7 Water Logging
Water logging is a common constraint in irrigated areas of the region because of insufficient drainage coupled with the dominant heavy textured alluvial soils and seepage from the conveyance canals. Soil salinity, sodicity and water logging conditions have definite adverse impacts on soil productivity, which was estimated to be in the range of 30-35 percent of the potential productivity. In Egypt in many areas of the old Nile Valley this has led to increased soil salinity and in certain areas, soil sodicity. In the Sewa oasis for instance, the rate of water table rise during the period 1962-1977 was 1.33 cm year-1 and abruptly increased to 4.6 cm year-1 and therefore subjected fertile soil to degradation (Misak et al., 1997).
Waterlogging has also become a serious problem in many of the United Arab Emirates agricultural farms due to poor drainage caused by the presence of strong and tick hardpan, excessive use of irrigation water and sea water intrusion that in many areas reaches the surface causing complete vegetation failure (Abdelfattah, 2008). In Tunisia, of the 410 000 ha of irrigated areas about 87000 ha, representing 22 percent, are considered affected in varying degrees by water logging. This is important because it affects the largest number of irrigated areas. This hydromorphy affects most of the irrigated areas on valley of Medjerda from Ghardimaou up to Kalaat Andalous and the majority of Oasis (i.e. 29-67 percent of the North, 35 percent in the Oasis of Kibili and Toezure and to a lesser extent it affects the plains of Dorsal, irrigated areas of Gabes and those of Cap Bon (14-20 percent). It also affects some irrigated areas in the far north (Nefza, Sejnane and Mateur) and some irrigated areas of the Centre, as well as some plains of Dorsal (Kef, Siliana and Zaghouan).
13.3.8 Nutrient Balance Change The problem of nutrient-constrained agriculture is particularly acute in the region. If we
consider the current developments associated with land-use pressure manifested in intensification of cropping systems which are causes of soil degradation, nutrients depletion increasingly affects land productivity. In some countries like Sudan, continuous cultivation of more than 80 years decreased base saturation percentage by 25 to 42 percent indicating leaching of soluble anions and cations with irrigation water down the soil profile. Soil degradation due to nutrient depletion in Sudan is largely concentrated in the arid and semi-arid parts in southern Kordofan and Darfur, and the dry sub-humid and moist sub-humid zones of south-western Sudan. Such degradation is clearly related to agricultural activities and deforestation ratios of 45 and 55 percent, respectively.
13.3.9 Compaction
Status of the World’s Soil Resources Report, Regional Assessments of Soil Changes | Chapters 9 - 16
180

Soil compaction and crusting are the most serious forms of physical degradation affecting several irrigated areas in Libya, especially in sandy soils (Binmahmoud et al., 2000). Most soil compaction in the region is caused by tillage practices, for example in Iran tilling for more than 50 years rendered surface soil to water run off due to an increase of up to 33 percent of soil bulk density. Surface compaction and crusting in the Arabian Peninsula especially the United Arab Emirates is serious due to land filling and levelling for infrastructure development and compaction increased from a bulk density of 1.15 to 1.66 g cm-3 (i.e. 44 percent) and water infiltration has dropped from 267 to 52 mm h-1 (i.e. 81 percent). Soil compaction due to extensive tillage operations in the furrow slice (to 30 cm) is a major physical degradation in soils with high clay content where heavy mechanization is practiced. A very clear example (Biro et al., 2013) are found in rainfed farming of eastern Sudan where three decades (1979-2009) of cultivation has increased compaction in the 0-5 and 5-15 cm depth from 1.33, 1.42 g cm-3 (in the woodland) and 1.37, 1.56 g cm-3 (in the fallow land) to 1.56, 1.72 g cm-3 (i.e. ≅ 16 percent). This has lost the status of this scheme as one of the major centres of food production in Sudan. This increase in compaction is comparable to the increase in Bulk density found (13 percent) during a half century of conversion of a forest land in Jordan to cultivation of wheat and barley (Khresat et al., 2008). The military activities in the Al Salmi area located at the western border of Kuwait have resulted in huge disturbance and causes soil and vegetation degradation (AL-Dousari et al., 2000). As a result, these activities showed that in this area, the soil pores are sealed due to a reduction in infiltration rate by about 19.5 to 64.4 percent (i.e from 178.2 in natural soils to 31.9 cm-3 min-1) and increase in bulk density by 26-33 percent. In the Kabd area located in southwest of Kuwait City, pressure on land has resulted in compaction measured at 20 percent higher in non-protected area (bulk density of 1.8 g cm-3) compared to 1.5 g cm-3 in protected area (Misak et al., 2002). Further, in Kuwait, grazing, quarrying, camping, agricultural and animal production has increased compaction by 12.9 to 23.4 percent (Al-Awdhi et. al, 2005).
13.3.10 Sealing/Capping The population of the region is approximately 6.2 percent of the world population and it is
expected to increase at a rate of 35.6 million year-1 in the coming 10 years. The region is characterized by a fragile ecosystem which is endangered by among the highest annual population increase rate (3 percent) in the world which put enormous pressure on land resources capacity to provide goods and services. Human settlement on scarce good agricultural land or in areas of adequate rainfall for agriculture occurs in many countries of the region and jeopardize land role as a source of food. For example, in Egypt, the net population density has exceeded the 360 ha-1 threshold and has also reached twice of that. Added to that, during a period from 1987 to 2007, the cultivated land in the Delta and Nile Valley in Egypt has increased to about 7 260 000 ha, but human settlement and land allocated to roads and irrigation canals and drains has increased by 33.6 percent and 40 percent, respectively. Recent studies (ESCWA, 2007) showed that urban encroachment on the highly fertile agricultural land in Egypt is one of the recent problems that have affected the agricultural sector of Egypt. For example, in El-Mahalla El-Kobra in the Gharbiya Governorate, Egypt, urbanization during the period from 1950 to 1987 and from 1987 to 1995, has increased at an annual rate of 10 percent and 33 percent, respectively. This has resulted in an annual loss of agricultural land by an average of 0.4 percent and 5 percent of the previous periods, respectively.
Iran has the largest urbanized area, in absolute terms, followed by Saudi Arabia, Kazakhstan and Iraq, while the highest Urbanization Index are in Bahrain, Palestine Israel and Lebanon (Figure 13.2).
Status of the World’s Soil Resources Report, Regional Assessments of Soil Changes | Chapters 9 - 16
181
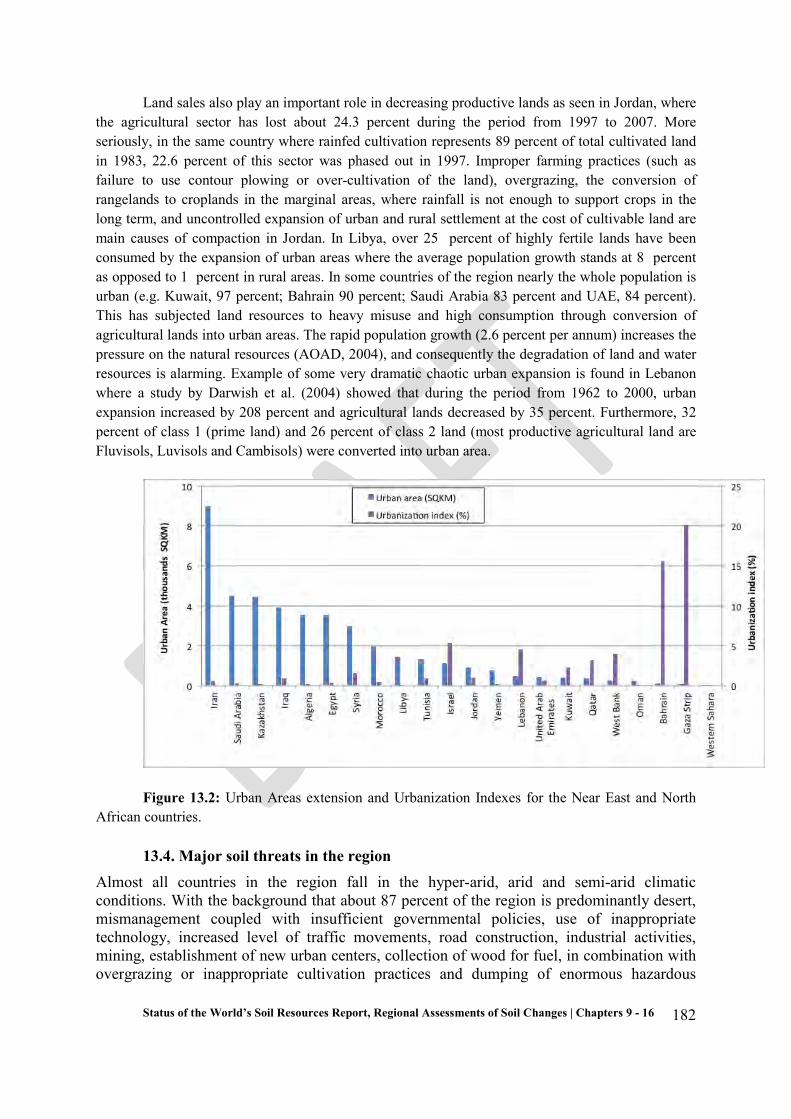
Land sales also play an important role in decreasing productive lands as seen in Jordan, where the agricultural sector has lost about 24.3 percent during the period from 1997 to 2007. More seriously, in the same country where rainfed cultivation represents 89 percent of total cultivated land in 1983, 22.6 percent of this sector was phased out in 1997. Improper farming practices (such as failure to use contour plowing or over-cultivation of the land), overgrazing, the conversion of rangelands to croplands in the marginal areas, where rainfall is not enough to support crops in the long term, and uncontrolled expansion of urban and rural settlement at the cost of cultivable land are main causes of compaction in Jordan. In Libya, over 25 percent of highly fertile lands have been consumed by the expansion of urban areas where the average population growth stands at 8 percent as opposed to 1 percent in rural areas. In some countries of the region nearly the whole population is urban (e.g. Kuwait, 97 percent; Bahrain 90 percent; Saudi Arabia 83 percent and UAE, 84 percent). This has subjected land resources to heavy misuse and high consumption through conversion of agricultural lands into urban areas. The rapid population growth (2.6 percent per annum) increases the pressure on the natural resources (AOAD, 2004), and consequently the degradation of land and water resources is alarming. Example of some very dramatic chaotic urban expansion is found in Lebanon where a study by Darwish et al. (2004) showed that during the period from 1962 to 2000, urban expansion increased by 208 percent and agricultural lands decreased by 35 percent. Furthermore, 32 percent of class 1 (prime land) and 26 percent of class 2 land (most productive agricultural land are Fluvisols, Luvisols and Cambisols) were converted into urban area.
Figure 13.2: Urban Areas extension and Urbanization Indexes for the Near East and North African countries.
13.4. Major soil threats in the region Almost all countries in the region fall in the hyper-arid, arid and semi-arid climatic conditions. With the background that about 87 percent of the region is predominantly desert, mismanagement coupled with insufficient governmental policies, use of inappropriate technology, increased level of traffic movements, road construction, industrial activities, mining, establishment of new urban centers, collection of wood for fuel, in combination with overgrazing or inappropriate cultivation practices and dumping of enormous hazardous
Status of the World’s Soil Resources Report, Regional Assessments of Soil Changes | Chapters 9 - 16
182
wastes in soils, would possibly trigger causative factors of erosion, salinity/ sodicity, pollution and soil C loss to be dominant.
13.4.1. Water and Wind Erosion Wind and water erosion in the region are due to a complex interaction of factors related to the
resilience of the land resources, the land use and management and socio-economic conditions. A link is made to the prevailing land uses in the different countries of the region. At the same time the consequences and responses are discussed. Erosion caused by Rainfed farming FAO (2004) reported that the annual soil loss in Iran due to erosion is 1 to 2 billion t year-1 (i.e 76 percent of total area is under erosion threat). This clearly shows that in this country, the ratio of the area affected by wind erosion to total country surface area is 0.119 which is 6 folds that of global estimates (0.0181). Others reported that soil erosion in Iran is a serious problem and is estimated to be 20–30-times more than can be tolerated (Jalalian et al., 1996) with total soil mass transported across the fallow field was measured at 220.93 kg/m per year and soil loss at 13.56 to 19 ton ha-1 year-1. In the north-west of Yazd in Yazd-Ardakan plain, Yazd province of Iran, total soil mass transported was measured at 220.93 kg m-1 year-1 and soil loss at 1.356 kg m-2 or about 13.56 t ha-1 year-1 causing topsoil C reduction at an average rate of 4 percent month-1 (Azimzadeh et al., 2008). Also in Iran, NAP (2004) reported a lack of equal access for farmers to inputs as an additional cause of soil erosion. This is due to various driving forces like poverty, lack of security and awareness, inadequate extension, absence of technical knowledge and financing. In other occasions, driving forces for erosion process were reported to be interrelated and resulting in different degrees of degradation. In El Bayadh region of Algeria, soils on limestone covers were classified as moderately, vulnerable and highly vulnerable to degradation as a function of their vegetation cover (Belaroui et al., 2014). The authors described that the Algerian steppe has in recent years become the scene of an ecological and climatic imbalance. Generally, in the southern part of the Mediterranean region, overgrazing and cultivation of vulnerable land in arid and desert regions have induced severe wind erosion. In Morocco, erosion is a serious ago-environmental threat and was found to cause soil losses generally between12 t ha−1 yr−1 and 14 ha−1 yr−1. In some areas of the Rif Mountains these values reach 30 to 70 t-1 ha-1year-1 (Benmansour et al., 2013). Using radioisotopes (137Cs), these authors found that the contribution of tillage process in sloping lands during the last 50 years was significant resulted in translocation of soils within the field. A study by Dahan et al. (2012) described that in Morocco, soil erosion is a result of several factors. The most important being increased population pressure over limited natural resources, over exploitation of forestry assets, removal of natural vegetation from the slope lands, overgrazing, cultivation of vulnerable lands in arid and desert regions, and inappropriate land management (mainly tillage). They also reported that water erosion mainly accelerated by man is the main cause of soil degradation and for the deterioration of water quality that it entails. Soil erosion in Morocco affects up to 40 percent of its territory with the total annual soil loss evaluated at 100 million tons and this is equivalent to 50 million m3 annual reduction in the storage capacity of the dams. In El Bayadh region of Algeria, the Sirocco wind (hot, dry wind blowing northwards from the Sahara) with a speed of 1.1 to 2.9 m s-1 is a dust blown wind causing wind erosion (Belaroui et al., 2014). A recent study (Houyou et al., 2014) showed that 20 million hectares of steppe lands that encountered high risk of wind erosion due to low rainfall, weak crop development in a sandy soil is crucially threatened by more intensive erosion due to newly adopted governmental policies favoring extensive rainfed cereal cropping. Their study showed that this decision has led to very high erosion
Status of the World’s Soil Resources Report, Regional Assessments of Soil Changes | Chapters 9 - 16
183

rates (74.4 Mg ha-1year-1), indicating that such cropping system is a unsustainable and the decision should be revised. In Tunisia, an over-all soil loss due to water erosion was estimated to be 23000 ha year-1 and occurred in the isohytes above 200 mm. In some areas of Syria, soil loss due water erosion was estimated to range from 10 to 60 kg ha-1 (under forest) and from 200 to 2550 kg ha-1 (under burned forest) and could reach 960 to 3280 kg ha-1 (under agricultural land). The population growth (4.0 percent) between 1984 to 1999 in the village Im Mial, northwestern of Syria, higher than the national average (3.0 percent), has forced farmer to practice continuous rainfed barley production (Nielsen and Zöbisch, 2001). This has resulted in a very sparsely vegetation and extensive wind erosion. Grazing and tillage are considered the main land use types that enhance water erosion. The highest soil loss was recorded in grazed mountains which lost up to 5 times more soil than those under grazing in protected areas (Shinjo et al., 2000). However, soil loss in tilled slopes is ≅ 1 to 4 folds that from grazed areas. Records of estimates of areas under serious water erosion in northern Iraq showed an increase from 12 percent in 1954 (Gibbs, 1954) to around 22 percent (Hussein et al., 1998) in 1997 which indicates an annual increase rate of 0.2 percent year-1. The main reason is found to be the mismanagement of cropland and rangeland during the past four decades. In Yemen the annual soil loss due to water erosion can reach up to 169 Mm-3 in regions with annual rainfall of 650 mm (Al-Hemiary, 2001). In Jordan, water and wind erosion are both serious in the country. Water erosion in the country occurs in limited areas (only 2.5 percent of total area in Jordan) with annual rainfall more than 400 mm and a slope greater than 25 percent. But in the Badia region with very low rainfall, soils are also subject to water erosion because they are bare and subject to the direct, although infrequent, impact of raindrops. The consequent formation of a slowly permeable seal and crust has enhanced runoff and water erosion (Rawajfih et al., 2005). In Palestine the perception of farmers, land ownership, and geomorphology of the land has great effects on farmer’s willingness to adopt conservation measures where net profit was found to 3.5 to 6 times higher than without conservation measures (Abu Hammad and Bǿrresen, 2006). From the available literature, the risk of water erosion in Lebanon was earlier (FAO, 1986) estimated to be 50-70 t ha -1 year-1, increased to 150 t ha -1 year-1 (Bou Kheir et al., 2006) and could reach values of about 317 t ha-1 year-1. Some farmers in Lebanon are reluctant to change their cultivation practices like plowing up and down slopes of more than 20 percent. They also expand cultivation in steep lands, though they are aware that this aggravates water erosion. They justify that is necessary for tractor performance and steep lands are the only available pieces for extensive agriculture (Zurayk et al., 2001). In general human activities including: encroachment into agricultural land, cultivation of fragile soils, over-grazing, deforestation and overexploitation of woody resources, uncontrolled use of fire for agricultural and forest clearing, unsustainable agricultural practices, poor irrigation practices and inefficient water use and chaotic urban sprawl on fertile lands and forests were identified as causes of water erosion in Lebanon (NAP, 2003). In Sudan, studies showed that in areas affected by water erosion, about 74 percent of respondent households are exposed to food shortage and severe food shortage (Akuot Gareng Apiu Anyar, 2006). The expansion of mechanized rain-fed agriculture (1970-1990) at the expense of rangelands and forests, that led to land degradation by enhancing the soil erosion and consequently the crop yield declined sharply due to the decreased fertility. This is mainly due to the rapid growth of population (2.6 annum-1: UNFPA, 2003) that stimulated the evolution of mechanized-rainfed agriculture from 500 ha in 1940s to 2.3 million ha in 2003. In the coastal part of Sudan, although total annual rainfall is low (≅ 75 mm), the sandy texture of the soils makes rain erosivity very high (Elagib, 2011). With the observed increasing seasonality of rainfall and intensity, high runoff and erosivity in such areas could be expected to cause heavy soil degradation through soil loss. Studies on factors contributing to wind erosion in Sudan showed that in rain-fed agricultural zones, deep ploughing and leveling of the surface soil caused an increase in its susceptibility to wind erosion, which, in turn, has
Status of the World’s Soil Resources Report, Regional Assessments of Soil Changes | Chapters 9 - 16
184

led to a severe decline in its fertility and, in some places, the formation of sand dunes. The fragility index (degraded land in ha divided by population) is a good measure of the extent of growing pressure in fragile ecosystem. In Sudan, this value is very high in the hyper arid (31.1 percent), arid (30.5 percent), and semi-arid (22.5 percent) and low in Dry sub-humid (7.9 percent) and moist sub-humid (8 percent) zones (Ayoub, 1998). Erosion caused by other land uses In Lebanon, the increasing population pressure on land for construction materials has greatly enhanced unregulated mining activities and this resulted in large number of open quarries. Darwish et al. (2011) reported that, during the period from 1989 and 2005, quarries increased by about 63 percent, covering an area of 5267 ha. Quarries additionally destroyed 676 ha (three times arable land), 137 ha (one third of forest land), and 737 ha (double for pasture) of productive lands, respectively. This is the more serious because quarries are established in sloping lands (62.2 percent) and therefore acts as the triggering and acceleration of water erosion processes. The high population density in countries like Kuwait (120 person km-2) has a profound influence on soil disturbance through uncontrolled human activities. The Nabkha (stabilized aeolian landform developed as result of the deposition of wind-driven sediments around desert shrubs) along the coastal plain in Kuwait is used as land degradation indicator (Khalaf and Al-Awadhi, 2012). The average annual sand drift rate in Kuwait is about 20 m3 (m width) −1 yr−1 and negatively affects farms causing adverse environmental and economic impacts (Khalafa and Al-Jjimi, 1993) while Al-Awadhi and Cermak (1998) calculated the average sand movement in Kuwait as 7.8X10⁴ kg/m width/year. In the Jalal-Alzor (Kuwait), human activities like the use of off-road vehicles in the absence of conservation measures has resulted in soil disturbance and accelerated soil erosion with consequent increase in rate of deflated sand from 220.5 kg m-1 width in 1989 to 400 kg m-1 in 2007 which indicates a total rate increase by 81 percent in the last 20 years (cited by Al-Awadhi, 2013). Grazing also was found to enhance soils loss by water. In the Matash Mountains of the Alborz Mountain range in Talesh Region, Iran (slope of 16 percent and 1286mm of precipitation per annum), soil loss due to open grazing was 26.6 times of that occurred which occurred in manual range harvesting (Sadeghi et al., 2007). In Sudan the dominant type of housing is traditional huts made from forest products. These building are liable to renewal every two years on average. This practice exacerbates the process of soil erosion in the study area. Conserving and restoring the vegetation cover in such areas were achieved through adoption of muddy buildings and consequently the tree species stocking density around the villages adopted the intervention of muddy buildings is relatively better compared to the control. Additionally, food security is greatly linked to soil degradation in the region (FAO, 2013). Fuel wood or charcoal production for domestic use is the last factor inducing soil erosion, while deforestation for agriculture in semi-arid lands around settlement areas is the main cause of soil degradation, for instance in the Jifara Plain of Libya. Duststorms
Dust storm is evident in the region and widely reported. It carries toxic elements like Pb with concentrations as low as 20 to 288 mg kg–1 in Oman to higher levels of 742 mg kg–1 in Bahrain and 1762 mg kg–1 in Saudi Arabia (Madany et al., 1994; Al-Rajhi et al., 1996). The problem of sand drifting and dune migration is of special interest in some countries of the region such as Saudi Arabia with approximately one-third of the country is covered by moving sand. Al-Harthi (2002) found that these storms have resulted in dunes movement of 9.9 m year-1 (for 4.9 m-high dune) up to 16.5 m
Status of the World’s Soil Resources Report, Regional Assessments of Soil Changes | Chapters 9 - 16
185

year-1 (for 1.9-m high dunes). This problem is enhanced by man’s activities like overgrazing and activities that may destroy the desert pavement, which protects the underneath loose sand. In Kuwait, the sand drift potential was found to be as high as 354 vector units (Al-Awadhi et al., 2005) and sandstorms are very frequent in summer especially when the wind speed exceeds 6ms-1 with an annual amount of sand drift is measured at about 7.8×10⁴ kgm-1 width (Al-Awadhi and Misak, 2000). As cited by Goudie and Middleton (2001), estimates of rates of dust deposition exist for a number of sites at varying distances from the Sahara (origin: include southern Algeria, Nubian Desert in southern Egypt and Northern Sudan) to western Europe are less than 1 g m-2, 5.1 g m-2 in Spain while over Sardinia, Corsica, Crete and the SE Mediterranean, most values are between 10 and 40 g m-2. Long-range transport of Saharan dust to the central Mediterranean is characterised by events lasting 2-4 days, compared to an average duration of just 1 day for events reaching the Eastern Mediterranean from the Arabian Desert (Dayan et al., 1991). Several studies reported the frequency of dust storms in the Arabian Peninsula and found that the average quantity of dust falling on Kuwait and Riyadh were 191and 392 tons km–2 year–1 (cited by Ibrahim and El-Gaely, 2012). A recent study (Jish Prakash et al., 2014) on impact of dust storms on the Arabian Peninsula and the Red Sea reported that Strong wind (velocities exceeding 15m s−1) entrained large quantities of dust particles into the atmosphere with sources from the lower Tigris and Euphrates in Iraq, areas from Kuwait, Iran, UAE and within the basin of the Arabian desert (which includes the Rub’ al Khali, An Nafud and Ad Dahna). They also reported that frequent dust outbreaks and some 15 to 20 dust storms per year have profound effects on all aspects of human activity and natural processes in this region. However, the total amount of dust generated by the storm reached 93.76Mt, of which 80 percent deposited within the area, around 6 percent (5.3 Mt) deposited in the Arabian Sea and Persian Gulf received 15 (1.2 Mt) in the Red Sea (i.e. roughly, 6 Mt of annual dust deposition). In the Middle East, more than 60 dust storms occurred during the period 2003-2011 having important impacts on the neighboring countries like Iran (Hamidi et al., 2013). Some countries (e.g. Iraq) are wostly affected by dust storms in the Middle East where about 122 dust storms and 283 dusty day’s year-1 were recorded and could expected to increase to 300 dusty days and dust storms a year in the next 10 years (Kobler, 2013).
Consequences of soil erosion
Erosion processes remove the fertile part of the soils and thus reduce the effective depth to be exploited by roots and the amount of water available to plants. This is considered a major constraint limiting the agricultural arable land in Morocco (Dahan et al., 2012). Moreover, the uncontrolled runoff in the Maghreb region (Morocco, Algeria, Tunisia) from the terraces has reached the stages of gully formation whereas in the last century, sheet and gully erosion have become common due to increased population, deforestation, overgrazing, and expansion of cultivated on steep land (Dregne, 2002). Studies on effects of erosion on land productivity in the region are not many. Research on barley in Aridisols of Egypt (Afifi et al, 1992; Wassif et al., 1995) found a declining yield of 2 kg ha-1 Mg-1 of soil erosion which is equivalent to 0.21 percent Mg-1 soil erosion. On the other hand in Iran soil erodibility by water was negatively correlated with wheat yields (Vaezi, 2012). The agricultural productivity of oasis in countries like Sudan and Egypt are considered as significant sites of agriculture developments and are threatened by the adverse impacts of sand encroachment and mobile dunes.
Responses to soil erosion
Status of the World’s Soil Resources Report, Regional Assessments of Soil Changes | Chapters 9 - 16
186

Research efforts for containing erosion are very diverse and site- and country specific. In the sandy depression of El-Farafra, Egypt, which suffers from wind erosion, Sallam et al. (1995) reported that mixing sandy soils with gray shale at a ratio of 15 percent (w/w) was found to improve the quality of these soils. Organic manures, compost and synthetic soil conditioners are used to contain wind erosion. Compost alone or combined with hydrogels conditioners was found to decrease erosion by 58 to 74 percent (El-Hady and Abo-Sedera, 2006). Water erosion could be stopped in Morocco through increasing levels of C in the topsoil using conservation measures (Mrabet et al., 2001). Irrespective of rotation, conservation measures increased topsoil C by 44 percent and they indicate that systems with increased C generally characterized by diminished erosion and C additions exceed losses. Government’s policy responses play vital role in increasing green cover in desert soils like the governments of Egypt and Iraq (Nielsen and Adriansen, 2005). The Iraqi case illustrates the effects of deliberate government policies in draining the marshlands resulting in significant land degradation. Recent efforts have been devoted to the re-establishment of the southern-Iraq marshes and indicate that they are being re-flooded and that vegetation is returning. The Egyptian government promoted land reclamation after the 1952 revolution aiming at increasing agricultural production. This reclamation was executed through international funded developmental projects and local funding and involved distributing small areas of lands to graduates. Efforts of containing water erosion in rainfed farming in Yemen depend on the establishment and maintenance of terraces as conservation structures and these are labour intensive. These responses suffered from a labour shortage caused by the migration of Yemeni to oil countries and consequently the policy could not be implemented and the degradation of such structures followed. In Jordan, the use of polyacrylamide (PAM) at application rates of 10 to 30 kg ha-1 was found to be very effective in reducing runoff and soil loss by up to 23 percent and 53.9 percent, respectively and increased dry matter crop yield by 35 to 56 percent (Abu-Zreig et al., 2007). Interestingly, this study developed an increased threshold runoff value of 0.56 mm rainfall in control sites to 1.11 mm in PAM plots (i.e close to 100 percent). Also Abu-Zreig, (2006) pointed out that PAM with more surface area (30 percent) reduced soil loss by approximately 46 percent compared to the 24 percent reduction with less surface area (20 percent).
Soil conservation as mitigation of erosion has also been done by planting trees and grass along Wadis. Construction of diversion banks and dams across hydrological constructions has been carried out on slopes and stream beds in Libya. Some short-term effective efforts to contain wind erosion (Mohammed et al., 1996) using windbreaks were found to reduce wind speed by about 20 percent and in turn sand deposition. However, sand deposition also occurred within the belt which after sometime starts to act as a zero permeability wind breaks. This study suggested control of sands in the source area as in the log-term using shelterbelts may not be sufficient. There are some legislations and socio-economic factors at individual country to reverse land degradation due to erosion. In the mechanized rainfed projects of Sudan, farmers should abide to leave 10 percent of the cultivated area for forest trees. To protect soil against erosion after fire, in Lebanon, a ministerial decision (181/98) was introduced a five year ban on grazing on public land after fires to enhance land cover recovery.
13.4.2. Soil Salinization/Sodification Salt-affected soils in the region vary geographically with climate, agricultural activities,
irrigation methods and policies related to land management. They are mainly confined to irrigated farming systems in the arid and semi-arid zones. The salts present are either of intrinsic origin (e.g. Egypt, Sudan and Iran), sea water intrusion (coastal regions) or irrigated from underground waters
Status of the World’s Soil Resources Report, Regional Assessments of Soil Changes | Chapters 9 - 16
187

with various degrees of salinity. In the irrigated zones of Morocco, continuous irrigation has resulted in soil salinization. Secondary salinization due to irrigation with saline water is also reported in the region. In Libya, Sudan, Iran, Iraq, and UAE, large tracts of lands have been degraded due to heavy irrigation with groundwater for crop intensification. In the southern part of the Jordan Valley, soils are characterized by high salt content, poor permeability and high gypsum contents (Taimeh, 2009). Salinity, sodicity or the combination of both are seriously affecting productive areas like in the Nile Delta of Egypt, and the Euphrates Valley in Iraq and Syria. The situation is further complicated by association with problems of water logging and high CaCO3 (up to 90 percent in UAE, Al Barshamgi, 1997). In Kuwait and UAE soil salinization is mainly confined to coastal areas to larger extent and irrigated farms to a lesser extent.
Local soil conditions can worsen the situation, for instance in the southern part of the Jordan
Valley, the soil is characterized by high salt content, poor permeability and high gypsum contents (Taimeh, 2009). The degradation is expected to be worse when low quality irrigation water (example treated waste water) replaces fresh water. In Libya, El-Tantaw (2005) reported that soils of Jifara Plain are usually calcareous and often shallow, with huge areas of calcrete outcrops developed during the Pleistocene epoch. Gypsum encrustation is commonplace in the drier parts below an annual precipitation total of 200 mm. These are often related to land use practices that overtax the system, include erosion, salinization, water logging and chemical degradation. Seawater intrusion in agricultural lands causing salinity problems is dominant in coastal areas of the region. An example is the Batinah aquifers of the Sultanate of Oman where still the advancing of seawater is monitored to be at an alarming pace (Naifer et al., 2011). This was mainly due to the agricultural expansion since 1980’s which accelerated the overuse of underground water and thereby disturbing the water balance which ultimately cause water intrusion from the sea. Some authors believe that salinity problems in the region are mainly due to inadequate irrigation water management (Al-Hiba, 1997). In almost all countries of the region with coastal boards, heavy extraction of ground water has ended with intrusion of seawater into aquifers and thereby raising the content of salts in the water. Irrigation with such water (in Bahrain, 90 percent of irrigation water originates from underground). In the Jifara Plain, Libya, increased human pressure on aquifers causes seawater intrusion in the coastal zones and an imbalance between excessive irrigation and inefficient drainage causes water logging and secondary salinization. Causes of such build up in salinity are (1) improper functioning or absence of drainage systems, (2) rise in ground water salinity in presence of high evapotranspiration and (3) high salinity in irrigation water. Siadat, et al, (1997) recognized natural factors and human-induced factors that cause salinity in Iran. The natural causes of soil salinity in Iran are geological conditions, climatic factors (evaporation, rainfall, and wind), salt transport by water, and intrusion of saline bodies of water into the coastal aquifers. But what seems to be of greater concern and importance is the human-induced salinity. This type of salinity stems from poor water management, following over-grazing, and improper land leveling. Also, excessive use of ground waters which enhances saline water intrusion. Secondary salinization due to irrigation with saline water is also reported in the region. In Tadla's irrigated perimeter, Morocco, soil degradation through secondary soil salinity and sodicity are caused by heavy irrigation with ground- and surface water together with the agricultural intensification. In Algeria, secondary salinization constitutes about 10 to 15 percent of the total irrigated land but about 90 percent of the agricultural farms in Al Ain in the United Arab Emirates area are affected by salinity (Abdelfattah, 2009). It is clear that in some countries of the region especially in the Vertisols of Sudan, secondary salinization due to irrigation does not develop, despite more than 80 years of irrigation (EC of 120 to 220 μS cm-1). This is mainly due to the low salt content of Nile water.
Status of the World’s Soil Resources Report, Regional Assessments of Soil Changes | Chapters 9 - 16
188

Consequences of salinization The salinity in the region has badly affected cropping systems and in many cases has
tremendously reduced crop yields. For example, soil salinity in the Jifara plain in Libya has caused wheat yields to decrease from 5 t ha-1 (in 1980s) to only 0.5 t ha-1 (1987). In Iran the annual economic losses due to salinity are estimated at more than one billion US$ (Qadir et al., 2008). The coastal area is one of the most highly populated regions of Oman, especially in the Batinah area where about 52 percent of land under is cultivation and suffers from salinity. Naifer et al. (2011) showed that when salinity increases from low (less than 2.5 dSm-1) to medium (7.5 dSm-1) and to high (more than 7.5 dSm-1) levels, damage is equivalent to US$ 1,604 ha-1 and US$ 2,748 ha-1, respectively. Soil salinity, sodicity and water logging conditions would have definite adverse impacts on soil productivity, which was estimated to be in the range of 30-35 percent of the potential productivity.
Responses to Salinisation
There are many responses in the region to contain the salinity threat such as: (1) direct leaching of salts, (2) planting salt tolerant varieties, (3) domestication of native wild halophytes for use in agro-pastoral systems, (4) phytoremediation (bioremediation), (5) chemical amelioration and (6) the use of organic amendments. In Iraq and Egypt, surface and subsurface drainage systems have been installed to control rising water tables and arrest soil salinity. In Iran, Syria and other Gulf countries, crop-based management, and fertilizers are used to combat salinization (Qadir et al., 2007). In Iran, Haloxylon aphyllum, Haloxylon persicum, Petropyrum euphratica and Tamarix aphylla are potential species for saline environments (Djavanshir et al., 1996), whereas Atriplex is a potential fodder shrub in the arid lands which could bring annual income as high as 200 USD ha-1 (Koocheki, 2000; Tork Nejad and Koocheki, 2000). Salt tolerant breeding efforts of crops (e.g. wheat, barley, alfalfa, sorghum etc.) are also recognized as response management in saline environment, though most work findings are based on controlled environment, those from real field are not too many. The use of organic amendment in Egypt showed that the mixed application of farmyard manure and gypsum (1:1) significantly reduces soil salinity and sodicity (Abd Elrahman et al., 2012). Recently, phytoremediation or plant based reclamation is introduced in the region. In Sudan there are very good responses for control of sodicity relying on phytoremediation which is not like the traditional use of gypsum. The production of H+ proton in the rhizosphere during N-fixation from some legumes like hyacinth bean (Dolichos lablab L.) removed similar amount of Na+ to gypsum application which indicates its importance in calcite dissolution of calcareous salt affected soils (Mubarak and Nortcliff, 2010). In Oman a broad range of policy, institutional, regulatory and physical options to manage groundwater demand better and improve, albeit modestly, water supplies were assessed.
13.4.3. Soil Organic Carbon Change
Information on Soil Carbon changes in the region are scarce and records on the estimates of soil C sequestration are basically confined to the drylands ecosystems of the West Asia-North Africa (WANA) carried by Lal (2002), the data are very useful and can be applied in this region. This study indicated that the total loss of soil-C from the WANA region could be about 6 to 12 Pg. Despite the low soil C levels in the region (generally less than 5 g kg-1), with effective control measures of degraded soils, the region could however, sequester C at the rate of 0.1 to 0.2 Mg ha-1 year-1 (for irrigated crop land) and 0.05 to 0.1 Mg ha-1 year-1 for both rainfed and rangeland. In other words, with desertification control, reclamation of salt-affected soils, intensification of agriculture on undegraded
Status of the World’s Soil Resources Report, Regional Assessments of Soil Changes | Chapters 9 - 16
189
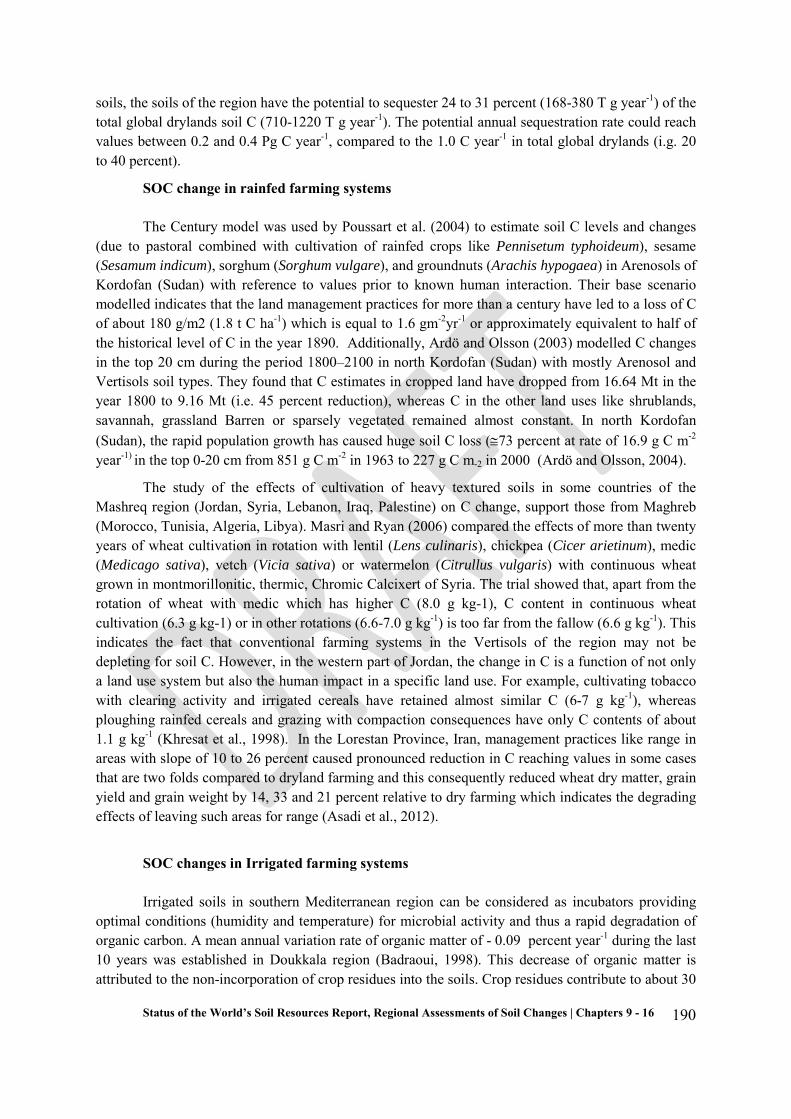
soils, the soils of the region have the potential to sequester 24 to 31 percent (168-380 T g year-1) of the total global drylands soil C (710-1220 T g year-1). The potential annual sequestration rate could reach values between 0.2 and 0.4 Pg C year-1, compared to the 1.0 C year-1 in total global drylands (i.g. 20 to 40 percent).
SOC change in rainfed farming systems The Century model was used by Poussart et al. (2004) to estimate soil C levels and changes
(due to pastoral combined with cultivation of rainfed crops like Pennisetum typhoideum), sesame (Sesamum indicum), sorghum (Sorghum vulgare), and groundnuts (Arachis hypogaea) in Arenosols of Kordofan (Sudan) with reference to values prior to known human interaction. Their base scenario modelled indicates that the land management practices for more than a century have led to a loss of C of about 180 g/m2 (1.8 t C ha-1) which is equal to 1.6 gm-2yr-1 or approximately equivalent to half of the historical level of C in the year 1890. Additionally, Ardö and Olsson (2003) modelled C changes in the top 20 cm during the period 1800–2100 in north Kordofan (Sudan) with mostly Arenosol and Vertisols soil types. They found that C estimates in cropped land have dropped from 16.64 Mt in the year 1800 to 9.16 Mt (i.e. 45 percent reduction), whereas C in the other land uses like shrublands, savannah, grassland Barren or sparsely vegetated remained almost constant. In north Kordofan (Sudan), the rapid population growth has caused huge soil C loss (≅73 percent at rate of 16.9 g C m-2
year-1) in the top 0-20 cm from 851 g C m-2 in 1963 to 227 g C m-2 in 2000 (Ardö and Olsson, 2004).
The study of the effects of cultivation of heavy textured soils in some countries of the Mashreq region (Jordan, Syria, Lebanon, Iraq, Palestine) on C change, support those from Maghreb (Morocco, Tunisia, Algeria, Libya). Masri and Ryan (2006) compared the effects of more than twenty years of wheat cultivation in rotation with lentil (Lens culinaris), chickpea (Cicer arietinum), medic (Medicago sativa), vetch (Vicia sativa) or watermelon (Citrullus vulgaris) with continuous wheat grown in montmorillonitic, thermic, Chromic Calcixert of Syria. The trial showed that, apart from the rotation of wheat with medic which has higher C (8.0 g kg-1), C content in continuous wheat cultivation (6.3 g kg-1) or in other rotations (6.6-7.0 g kg-1) is too far from the fallow (6.6 g kg-1). This indicates the fact that conventional farming systems in the Vertisols of the region may not be depleting for soil C. However, in the western part of Jordan, the change in C is a function of not only a land use system but also the human impact in a specific land use. For example, cultivating tobacco with clearing activity and irrigated cereals have retained almost similar C (6-7 g kg-1), whereas ploughing rainfed cereals and grazing with compaction consequences have only C contents of about 1.1 g kg-1 (Khresat et al., 1998). In the Lorestan Province, Iran, management practices like range in areas with slope of 10 to 26 percent caused pronounced reduction in C reaching values in some cases that are two folds compared to dryland farming and this consequently reduced wheat dry matter, grain yield and grain weight by 14, 33 and 21 percent relative to dry farming which indicates the degrading effects of leaving such areas for range (Asadi et al., 2012).
SOC changes in Irrigated farming systems Irrigated soils in southern Mediterranean region can be considered as incubators providing
optimal conditions (humidity and temperature) for microbial activity and thus a rapid degradation of organic carbon. A mean annual variation rate of organic matter of - 0.09 percent year-1 during the last 10 years was established in Doukkala region (Badraoui, 1998). This decrease of organic matter is attributed to the non-incorporation of crop residues into the soils. Crop residues contribute to about 30
Status of the World’s Soil Resources Report, Regional Assessments of Soil Changes | Chapters 9 - 16
190

percent the total forage consumption in Morocco. The high temperature, widespread of use of tillage, clean fallow, overgrazing, no practice of residue recycling coupled with climate conditions in countries like Morocco are main causes of rapid organic matter decomposition and turnover, therefore, very low levels are converted into humus. Rate of C change as influenced by land use is also soil type driven and indicates that clay soils tend to counteract decomposition and hence reduces chances of C loss. For example, in clay soils of Morocco, Bessam and Marbet (2003) reported that in 7 years of continuous tilling soil reduced OC in the 0-20 cm profile by 17 percent (i.e. 0.33 g kg -1 year-1). As cultivation of such soils advances, it was possible to store more C (by 3.7 percent) with time (11 years) in the entire 0-20 cm depth but not the top 2.5 cm due to incorporation. This should not be looked as credit to the system but rather the decrease in topsoil C increases vulnerability to degradation by erosion due to reduction in topsoil buffering capacity or resilience. It is apparent that continuous cultivation not always consumes soil C. There are exceptions, however, in some cases with cropping of more than 80 years in the irrigated Vertisols of the Gezira Scheme of Sudan. Carbon content in furrow slice (0-10 and 10-35cm) of permanent fallow (4 and 4.61 g kg-1) were lower than that in cultivated plots (6.35 and 5.44 g kg-1) by about 37 and 15 percent, respectively which indicates that C loss due to cultivation in such soils is not a small problem (Elias and Alaily, 2002). Physical protection of C in heavy textured soils, despite long-term (about 30 years) cultivation with intensive tillage has decreased C in the top 0-15 cm by 15 to 24 percent relative to wood and fallow lands (Biro et al., 2013). Carbon in desert soil could likely be increased by irrigation of alfalafa rotated with wheat or wheat rotated with fallow which was shown to have increased C in the top 0-10, 10-20 and 20-30 cm depths by 5.1-6.8, 3.0-4.6 and 6.8-11.6 folds, respectively (Fallahzade and Hajabbasi, 2012a). This is likely a useful land use to create a stabilize soil aggregates that consequently reduces the vulnerability of desert soils to erosion by either wind or water. However, C could also be decreased by 24 to 47 percent during bio-remediation (land farming processes) of soils contaminated with hydrocarbon of petroleum origin where microbial activities are greatly enhanced due to aeration (Besalatpour et al., 2011).
SOC change and forest clearing Conversion of land use system practiced in light soils of the region other than tree plantations
(which were found to be the best system to conserve C) seem to result in C loss. For example, in the sandy soils of western Sudan, taking tree C in the 0-30 cm depth as reference, three years of sole cropping or mixed with trees caused about 41 to 47 percent C reduction (El Tahir et al., 2008). In Jordan, land resources have been altered by rapid land use change and accelerated by changeable socio-economic factors including high population growth, urbanization and agricultural intensification. Such pressure has made farmers to convert a forest located in Ajloun to cultivation of wheat (Triticum spp.) and barley (Hordeum spp). After more than 50 years of cultivation, Khresat et al. (2008) reported that soil C in the top 0-20 cm of mostly Inceptisols, Mollisols and Vertisols has decreased from 6.73 g kg-1 to 4.70 g kg-1 (i.e 30 percent reduction). In Iran, the conversion of forest or pasture to arable lands in five cultivation sites where tillage has been practiced for 40-50 years had caused 30-68 percent loss of topsoil (0-20 cm) OC, specifically from 3.86-9.84 to 3.25-8.06 kg m-2 (Golchin and Asgari, 2008). This practice also mixes OC down the profile leaving less OC on the topsoil for surface protection against degradation by erosion and also of more than 10 percent loss in the capacity of soils to retain nutrients. Also, the change from pasture to dryland farming in the Inceptisol of Iran has degraded soil and reduced OC by about 67 percent and may take very long time to recover to the initial state. For example, 30 to 60 years are required to restore soil C to the initial content of rangeland ecosystems of Chaharmahal and Bakhtiari Province in Central Iran due to more
Status of the World’s Soil Resources Report, Regional Assessments of Soil Changes | Chapters 9 - 16
191

than 100 years of cultivation where OC in the top 0-15 and 15-30 cm was reduced by 25-34 percent (Chigani et al., 2012). It is clear that, the change in OC depends on soil type where continuous cultivation of Cambisols and Vertisols in north Iran tends to decrease C by 29 to 74 percent and 11 to 59 percent as compared to grass or forest use, respectively. Additionally, a study on soil quality indicators that is potentially sensitive to land degradation due to land use change was carried out in a protected (more than twenty years) range pasture (Isfahan Province, Iran) and a forest area and some annual and perennial grasses (Nael et al., 2004). Their study showed that C content in the protected range was close to double (1.7 folds) as compared to rational and uncontrolled grazing over more than three decades. Also, cultivation of forest land with arable crops is a practice that consumes about 60 percent of stored C. This study clearly indicated that in the dryland of this region, decisions that protect forest and control grazing are favourable for soil C storage. This clearly shows that inappropriate agricultural activities or land use change are the main driver imposing negative effects on soil quality and consequent reduction in ecosystem services. In another study, a four decade of conversion from forest oak (Querous brantii Lindl.) to vegetable cultivation (tomato and snap bean) has caused a loss of C by almost 53 percent (Fallahzade and Hajabbasi, 2012b). The high pressure on land due to rapid increase in population has forced appreciable oak (Quercus brontii) forest areas in the Lordegan region of central Zagrous Mountain in Iran to be converted into either wheat (Triticum aestivum) and barley (Hordeum vulgare) cultivation or agroforestry uses. More than 20 years of deforestation and forest cultivation has decreased soil C in the 0-30 cm depth by 52 and 61 percent, respectively (Hajabbasi et al., 1997). It is also evident that, not only the land use system affecting C change, but the component of the system imposes clear C change. In the Saman plain of central Iran, C content of the 0-30 cm of a Mollisol under either permanent pastures, more than 45 years conversion of pastures to almond orchards for more than 45 years or two years of almond orchards converted to alfalfa remained (7.1-7.4 g kg-1) without clear change (Raiesi, 2007). However, the same study proved that five years of conversion to alfalfa cropping improved C content over previous land use systems by about 43 percent which also indicates that cultivation might also improve C sequestration.
13.4.4. Soil Contamination Land degradation due to accumulation of contaminants is concentrated in either oil producing
countries or those that are heavily populated. In agricultural soils, contamination is generally restricted to irrigated farming systems. In some instances, the over use of chemicals (fertilizers, pesticides and herbicides) has sharply increased the amount of chemical nutrients in the drainage water causing water eutrophication (NAP, 2002). Since the construction of the Aswan High Dam of Egypt in 1970, fertilizers and pesticides are heavily used in order to substitute the loss of fertile sediments. FAO (2012) reported that during the period from 1950 to 1990, chemical fertilizer increased more than 4-fold (i.e. from 2,143 in the 1950s up to 11,700 tons in 1990). These chemical fertilizers and the residues of applied pesticides have caused the contamination of soil and water resources in the Nile Delta. In Iran, contamination of soil with petroleum hydrocarbons during transportation, leakage from tanks, accidental spillage, pipeline ruptures, or dumping of oily (landfilling) is increasing and this threatens soil functions. Such contamination may decrease seed germination of grasses by more than 50 percent (Besalatpour et al., 2008) – although this may not necessarily affect their subsequent performance − and dry matter accumulation in sunflower and safflower by 50 and 73 percent, respectively (Besalatpour et al., 2008). The two Gulf wars in 1990 and 1991 contributed to such contamination through the detonation of oil wells (Al-Senafy et al., 1997; Misak et al., 2009). Contamination of soil by heavy metals is also highly expected in these
Status of the World’s Soil Resources Report, Regional Assessments of Soil Changes | Chapters 9 - 16
192

areas (Misak et al., 2009). In central Iran, farmers are extensively using sewage sludge as a fertilizer for vegetable production and, in the absence of regulation; heavy metals tend to accumulate in the soil (Afyuni et al., 2006). The so-called “global dust belt” that extends from the west coast of North Africa, through the Middle East, into Central Asia (see section 7.3) and therefore transport of mineral dust in this area is notable. This dust may carry contaminants and this has been in fact the main source of soil pollution with heavy metals in the Arabian Peninsula. It was found to carry high levels of lead (65 mg kg-1 in Muscat, 742 mg kg-1 in Bahrain and 1762 mg kg-1 in Riyadh, Saudi Arabia) and nickle (43 to 3033 mg kg–1 in Muscat (Yaghi and Abdul-Wahab, 2004). In general, driving forces for soil contamination depends on the distribution of contaminants influenced by high intensity rainfall of short duration that results in short runoff, dust storms, and human induced factors such as mixing residual oil with soil, transport to new areas and dumping in selected sites.
Responses to soil contamination
Case study: Kuwait experience in remediation of oil contamination After the Iraqi war, over 300 oil lakes (covering an area of 46 km2) were formed. The depth of such oil was reported as maximum as 2 meter and penetrated the soil to varying depths. To restore oil degraded areas, in 1994 the Kuwait Institute for Scientific Research and Japan Petroleum Energy Centre attempted biological technologies for remediation and rehabilitation of oil beds (Figure 13.3a and 13.3b). In a pilot (1920 m2) scale and field demonstrations (Kuwait), heavily oil‐contaminated soil was remediated (for 12-18 months) using bioremediation techniques involving enhanced land farming techniques, windrow composting piles, and static bioventing piles. Within this period, such techniques have resulted in 80 to 90.5 percent reduction in the total petroleum hydrocarbons and total alkanes (Al‐Awadhi, 1996; Balba et al., 1998). However, although this technology is considered to be economical, energy efficient, and environmentally friendly with minimal residue disposal problems, the volatilization of airborne volatile organic compounds in the atmosphere during the process of degradation may lead to serious human health risk (Hejazi et al., 2003).
Status of the World’s Soil Resources Report, Regional Assessments of Soil Changes | Chapters 9 - 16
193

Figure 13.3: Layout of the project site source (a) and Concepual design and layout of bioremediation system (b). Source: Balba et al., 1998.
Regional policies for combating desertification
In most of NENA countries and array of sectoral policies, strategies mobilization of internal resources, several activities and action plans were developed for the protection of natural resources (promotion of sustainable agriculture, soil conservation, sustainable management and conservation of natural resources and combating desertification). This is achieved through development of an effective land use planning systems. These policies are mainly the formulation of National Envriromental Strategy, ratification of the UNCCD, National Environmental Action Plan, Water Strategy and Plocies, National Strategy for Agricultural Development, Biodiversity Strategy and Action Plan, National Strategy and Action Plan for Drought Mitigation. However, many of these policies and strategies (e.g. Ordan) are of protective measures, emphasis should be more on rehabilitation and inclusion of the dimension of economic and social cost of land degradation (Al Karadsheh et al., 2012). Iran has implemented 9 strategis including integration of sustainable development concepts into ministerial and organizational programmes, population control, review of existing laws, directing financial resources towards the realization of NAP objectives and expansion of applied research. The Egyptian NAP has formulated combating strategies according to agro-ecological zones and consequently developed various activities in each zone. Lebanon has initiated a large-scale reforestation program and very active in fighting the root causes behind land degradation mainly by promoting the development of rural areas and reducing regional disparities. The national efforts to combat desertification in Oman have concentrated on development and conservation of water resources, improvement of land capability and rehabilitation of rangeland. The Saudi NAP has implemented an array of activities including capacity buidling, controlling urbanization, sustainable agricltural develoment, improvement of water sector, legislations for conservation of natural resources, rehabilitation of degraded rangelands, forest development and sanddune stabilization. Sudan has launched its NAP based on integrating strategies for poverty alleviation with progrmmes to
Status of the World’s Soil Resources Report, Regional Assessments of Soil Changes | Chapters 9 - 16
194

combat desertification and these include activities for improvement of land resources, production systems and protection of the environment. Syria has also implemenetd many projects that are derived from the NAP which are mainly aimed at expansion of plant cover, controlling desert invasion, establishment of pastures protected areas and green oasis, sand dune fixation and afforestation. The recent NAP of the UAE has implemented activities according to to priority strategies leaded by improvement of affected ecological systems, role of combating programmes in conservation of biodiversity and reduction of climate change effects, increased awareness of desertification and coping with interantional development efforts in combating desertification. Most projects of the NAP in Yemen aimed at increasing productivity through provision of improved inputs relied on groundwater but did not consider environmental impacts conservation of land and water resources and they were at experimental levels.
13.5. Case studies 13.5.1. Case study: Iran
Soil nutrient changes
Change in land use and use of fertilizers are the main factor of soil nutrient change in Iran (Shiranpoor et al., 2012). A study in Gilan Province compared the status of forest soils and the same soils turned into tea gardens over a period of 10 to 40 years and showed a significant decline in the amounts of nitrogen, potassium, phosphorus, calcium and exchangeable magnesium. Deforestation effects on soil nutrient losses have been studied in Kajoor watershed in Sari city where results indicated significant losses of organic matter and phosphorus (Khazayi et al., 2012). Land uses and different management types were compared in the Taleghan area that established an unfavourable effect of irrigation and monoculture, while garden and pasture land uses scored better (Sohrabi and Zehtabian, 2012).
Soil pollution changes
In Iran, surveys carried out in areas where soil pollution occurs, indicate that heavy elements make up the most soil contaminants. These pollutants may originate from a mixture of sources, including geological, mining, industrial pollution, petroleum, sewage sludge application and excessive usage of fertilizers on agricultural soils.
Losses and sequestration of soil carbon
Loss of organic matter in soils of Iran is among the most important consequences of soil erosion. Establishing plantations on barren land and optimal management have a dramatic increasing effect on soil carbon sequestration. Forest ecosystem in equilibrium with trees and vegetation cover is the principal reservoir of organic carbon. Varamesh et al. (2010) assessed reforestation effect ranging Tehran Cheetgar Park to increase carbon sequestration and improving soil characteristics. Their study indicated that soil carbon sequestration of Acasia S, is equal to 78 ton/ha, in Conifer Sp, is 57ton/ha. In general, the carbon sequestration process leads to improvement of soil and water quality, increase fertility; improved soil hydrology system as well as preventing erosion and reduce of nutrient loss.
Salinity changes
Yazdani-Nejad and Torabi-Golsefidi (2013) examined the spatial variations and salinity zoning of agricultural soil in southern Tehran. About 30.4 percent of the country covering 20,000
Status of the World’s Soil Resources Report, Regional Assessments of Soil Changes | Chapters 9 - 16
195

hectares is without any salinity problem. These lands are located mainly in areas where irrigation water from deep wells is used. 42.4 percent of the land has an electrical conductivity of 2 to 4 dS/m, in these, the use of deep wells, used wastewater for irrigation due to water use restrictions. Zones with conductivity of 4 to 8 dS/m occupy 22.6 percent of the land located in the flat plains in the southern part which frequently irrigate with waste water and low-level wells and low-quality water from the Kan River downstream. 4.5 percent of the land with the electrical conductivity of 8 to 13 dS/m is located in lowland areas. In conclusion the position of the land in the landscape, the depth of the water table and the quality of the irrigation water determine the salinization of the land. Other factors that may play a role are the length of the interval between irrigation schedules and the texture of the soils (Ojee et al., 2014).
Water erosion
In Iran about 40 percent have low erosion rate (less than 10 tons per hectare), 25 percent of the area has a moderate rate of water erosion (10 to 20 tons per hectare), 23 percent area ofthe country have high erosion (20 to 50 tons per hectare) rates And 12 percent also have very high erosion (more than 50 tons per ha) (Omidvar, 2007). Figure 13.4. shows the erosion rates in different regions of Iran.
Figure 13.4: Rate of Water erosion in Iran (Soil Conservation and Watershed Management
Research Institute (SCWMRI, 2008) Results of recent research conducted in the watersheds of the country in recent years, suggest
an increased rate of erosion according to various models used (Hosseinkhani, 2013; Kavian et al.,
Status of the World’s Soil Resources Report, Regional Assessments of Soil Changes | Chapters 9 - 16
196

2014; Karam et al., 2010); Hosseini et al., 2014); Zomorodian et al., 2012; Bayat et al., 2010; Naderi et al., 2010 and Zare-Bidaki et al., 2014). Land-use change is one of the most important factors that exacerbate erosion in basins (Mohamadzade et al., 2014; Ajami et al., 2012).
Wind erosion In deserts and arid areas, the rapid change in temperature causes a pressure gradient in
different parts resulting in strong and constant winds. Due to these strong winds and the lack of moisture and vegetation, both small and large soil particles are transported which leads to soil erosion and deposition (Mehrshahy and Nakoonam, 2009). The approximate area of sand dunes (Reg) of Iran is estimated to cover 12 million hectares. Half of which are active or semi-active (Refahi, 2004) .Harvest levels and the density of air deposits in a 40-year period show wind erosion has a growing trend in recent years. A change in sediment textures with evaporates deposits such as salts and gypsum has also significantly increased. Studies show that both human and climatic factors have an important role in the development of wind erosion. The most important climatic factors are rainfall patterns, rising temperature, intense evaporation from the playa and reduced intake of water. Strong winds strengths also reduce the moisture level of the soil and enhance wind erosion rates. The second factor is related to land use and concerns the reduction of water entering the playa by dam construction, excessive pressure on pastures and agricultural land in recent years (Hosseinzade et al., 2011). The origin of the dust is both internal as external to the country. Since 2006 up to now new international entries, mostly affect the West and South West of the region that start from Iraq and Syria. Nevertheless, other areas such as parts of Jordan, Kuwait and northern Saudi Arabia are also involved in the creation of dust in Iran (Jalali et al., 2012). Although many recent dust storms in Iran have foreign origin, this does not signify that domestic centres have no part in this phenomenon (Fattahi, 2012).
Figure 13.5 shows days with dust storms in 2012, while Figure 13.6 shows the origin of dust storms in 2012.
Figure 13.5. Number of days with sandstorms in 2012 (Meterological Organization of Iran)
Status of the World’s Soil Resources Report, Regional Assessments of Soil Changes | Chapters 9 - 16
197

Figure 13.6. Internal and external dust sources in recent years in Iran (Geoinformatic
Institute, University of Tehran)
13.6.2 Case Study: Tunisia
Between 2006 and 2010 a detailed study was undertaken to assess land degradation in the country. A standardized methodology was adopted to map in an interdisciplinary way all aspects of land degradation (type, extent, degree, trends and impact on ecosystem services) at a national scale, involving a large number of national institutions and stakeholders, together with international expertise (FAO, 2011a) . In addition an inventory was made of successful local practices that combatted land degradation (FAO, 2011b). This study was complemented with three investigations at local level (in Kasserine, Siliana and Médenine) that allowed refining socio economic pressures and drivers (FAO, 2011c). Since then the results have been expanded and refined.
Major outcomes of the investigation, relevant for the present assessment of soil change and its impact on ecosystem goods and services were:
1. The preparation of a national land use system map. The scale of this map is 1:500 000 and is based on a rasterized database at 30 arcseconds. It was prepared using a standard methodology (Nachtergaele and Petri, 2011). The draft map was validated by regional institutions in the country and was later refined (by simplifying the pastoral classes and by introducing a specific unit that concerned alfa-alfa areas which make up 170 000 ha in the country). The units in established are used as the assessment units for all land degradation features at national level.
2. Land degradation assessment mapping. The assessment used a standard methodology (Liniger et al., 2011) that allowed the participatory mapping of the major types (soil, water and biological) and sub-types (for instance water erosion, compaction, decline in ground water quality or reduction of vegetative cover etc…) of ecosystem degradation. At the same time the intensity (degree) and the trend of the ongoing ecosystem change was evaluated on the basis of arbitrary classes (typically ranging from none to severe or slow to fast) in a participatory way involving various stakeholders in the assessment and using hard data where they were available. The direct pressures (for instance improper soil management, deforestation or natural causes etc…) and the indirect socio economic causes (For instance lack of knowledge or investment etc…) was also determined in the same participatory way, as was the impact on ecosystem goods and
Status of the World’s Soil Resources Report, Regional Assessments of Soil Changes | Chapters 9 - 16
198

services. Examples illustrating the outcome of the assessment are given in the following maps which evaluate water erosion (Figure 13.7a) and wind erosion (Figure 13.7b). Differences in extent of ongoing degradation processes in the country could also be mapped.
3. Sustainable land management mapping. In each unit of the national map the prevailing land management practices were inventoried using a standard methodology (Liniger et al., 2011). This allowed characterizing the practices in terms of type of intervention (agronomic, vegetative etc…) and in terms of objectives (prevention, mitigation or rehabilitation). At the same time the extent, the trend and the efficiency of the conservation practices were assessed. Examples of outputs are given for the main conservation types used in the country (Figure 13.8.) and the impact of soil degradation on ecosystem goods and services (Figure 13.9.).
Status of the World’s Soil Resources Report, Regional Assessments of Soil Changes | Chapters 9 - 16
199

Figure 13.7. Assessment of Water (a) and Wind Erosion (b) in Tunisia
Status of the World’s Soil Resources Report, Regional Assessments of Soil Changes | Chapters 9 - 16
200

Figure 13.8. Soil Conservation in Tunisia
Status of the World’s Soil Resources Report, Regional Assessments of Soil Changes | Chapters 9 - 16
201

Figure 13.9. Type of ecosystem service most affected.
13.6. Conclusions Although there is a wealth of local and national studies of soil change in the region, a
systematic and standardized approach is lacking. Results on extent and intensity of the soil change processes still refer to the GLASOD study carried out in the late nineteen eighties.
The degradation of natural resources in arable lands is considered as one of the main threat to
agricultural production in all countries of the region. Ecosystem service quality and capacity is greatly reduced by degradation caused by salinity, erosion, contamination and management factors that lead to a loss of soil organic matter. Water erosion is predominant in that part of the region which has sloping lands and where rainfed agriculture is practiced where it may even occur in gently sloping areas. Wind erosion is also a causative factor of topsoil removal. Population increase has resulted in soil disturbance due to uncontrolled human activities such as mining and open quarries that have triggered and accelerated erosion processes. Degradation due to salinity and sodicity varies geographically with climate, agricultural activities, irrigation methods and land management policies and is mainly restricted to irrigated farming systems. Causative factors are of intrinsic origin, sea intrusion or irrigation from underground waters with elevated salt content. Degradation due to contamination is mainly found in countries with high population, high oil production or heavy mining. In irrigated farming systems with overuse of chemicals the loads of toxic elements in underground
Status of the World’s Soil Resources Report, Regional Assessments of Soil Changes | Chapters 9 - 16
202
waters is increased. Salinity has greatly reduced crops yield (e.g. from 5 to 0.5 t ha-1) and increased economic annual losses to nearly 1 billion $ or is equivalent to US$ 1,604 ha-1 and US$ 2,748 ha-1. In some countries the damage on soil productivity was estimated to be in the range of 30-35 percent of the potential productivity.
Responses to reverse degradation caused by erosion include improving soil resilience through increasing C inputs using organic manures, compost and synthetic soil conditioners and soil conservation measures in sloping lands. Positive government policies and legislations and socio-economic factors at individual country were found to reverse land degradation due to erosion. Efforts of reclaiming salt-affected soils are mainly salt leaching and drainage interventions, crop-based management, chemical and organic amendments, fertilizers, salt tolerant plants and crop management and phytoremediation. Containing degradation caused by oil contamination include certain land farming techniques that could cause partly the elimination of hydrocarbon through decomposition of improved biological activities and bio-remediation using some grass species With effective desertification control, the potential annual C sequestration rate could reach values between 0.2 to 0.4 Pg C year-1, compared to the 1.0 Pg C year-1 in total global drylands. Ranking of soil threats is given in Table 13.3.
Status of the World’s Soil Resources Report, Regional Assessments of Soil Changes | Chapters 9 - 16
203

Table 13.4 Summary of Soil Threats Status, trends and uncertainties in the Near East and North Africa
Very poor
Poor Fa ir GoodVery good
In condition
In trend
Soil erosion Wind eros ion and dust s torms are a problem throughout the region. Sand s tabi l i zation in source areas i s di ffi cul t and expens ive to undertake. Water eros ion can be control led with adapted management.
↙ ● ●
Salinization and sodification
Sal inization i s a widespread poblem in the region due to the high temperatures , inappropriate i rrigation practices and sea water intrus ion in coasta l areas . There i s adequate research and technica l knowledge in the region to counteract the problem. Socio-economic conditions hamper widespread implementation in some countries .
↙ ● ●
Organic carbon change High temperatures throughout most of the region resul t in a very high turnover of soi l organic Carbon. SOC change i s sens i tive to soi l management changes .
↙ ◒ ◒
Contamination Contamination i s loca l ly a s igni ficant problem in the region particularly in urbanized areas that produce waste dumped on the land and in oi l producing areas .
↙ ● ●
Sealing and capping Substantia l expans ion of hous ing, quarrying (Lebanon, Kuwait) and infrastructures i s a concern. There are no rel iable data on sea l ing and capping (Clear example, Egypt).
↙ ● ●
Compaction Compaction i s a problem where heavy clay soi l s are intens ively ti l led (e.g. ra infed and i rrigated Verti sols of Sudan)and to less extent by off-road vehicles (Al Sa lmi , Kuwait)
↙ ◒ ◒
Loss of soil biodiversity The extent of loss of soi l biodivers i ty due to human impact i s largely unknown in the NENA region. More s tudies need to be undertaken to understand the scope of the problem.
↙ ○ ○
Soil acidification Given the dry conditions throughout most of the region, acidi fication i s restricted to some coasta l areas with higher ra infa l l .
− ● ●
Nutrient imbalance Nutrient imbalances occur in areas with continuous cul tivation where nutrients are lost in harvested crops and no engagement in fa l lowing, manuring or minera l ferti l i zer appl ication (e.g. Bejaagropastora l i s ts , Kassa la 's Border Area, Sudan)
− ○ ○
Waterlogging Waterlogging i s a very loca l i zed problem in the region l imited to flash floods , heavi ly i rrigated areas and excess ive ri se in subsoi l water level . e.g. soi l s of the Ni le Va l ley and Delta and Siwa Oas is of Egypt
− ● ●
Symbol Definition
− Stable~ Variable↙ Deteriorating↗ Improving○ Evidence and consensus i s low◒ Limited evidence or l imited consensus● Adequate high-qual i ty evidence and high level of consensus
Condition and Trend Confidence
Threat to soil function Summary
Status of the World’s Soil Resources Report, Regional Assessments of Soil Changes | Chapters 9 - 16
204

References
Abahussain, A.A., Abdu, A. Sh., Al-Zubari, W. K., El-Deen, N. A. & Abdul Raheem, M. 2002. Desertification in the arab region: analysis of current status and trends. J. Arid Environ,. 51: 521–545.
Abbaslou, H. Abtahi, A., Peinado, F. J. M., Owliaie, H. & Khormali, F. 2013. Mineralogy and Characteristics of Soils Developed on Persian Gulf and Oman Sea Basin, Southern Iran: Implications for Soil Evolution in Relation to Sedimentary Parent Material. Soil Sci., 178: 568-584.
Abd Elnaim, Omran, E. M., M. S., Waly, T. M. & E1 Nashar, B. M. B. 1987. Effects of prolonged sewage irrigation on some physical properties of sandy soil. Biological Wastes, 22: 269-274.
Abd Elrahman, S.H., Mostafa, M.A.M., Taha, T.A., Elsharawy, M.A.O. & Eid, M.A. 2012. Effect of different amendments on soil chemical characteristics, grain yield and elemental content of wheat plants grown on salt-affected soil irrigated with low quality water. Annals Agric. Sci., 57: 175-182.
Abdelfattah, M.A. & Shahid, S. A. 2007. A Comparative characterization and classification of soils in Abu Dhabi Coastal area in relation to arid and semi-arid conditions using USDA and FAO Soil Classification Systems. Arid Land Res. and Manage., 21: 245-271.
Abdelfattah, M.A. 2012. Land degradation indicators and management options in the desert environment of Abu Dhabi, United Arab Emirates. Soil Survey Horizon, 3-10.
Abdelfattah, M.A., Shahid, S.A. & Othman, Y.R. 2008. A model for salinity mapping using remote sensing and geographic information systems-A case study from Abu Dhabi, United Arab Emirates. p. 92 In Forum handbookm 2nd. International Salinity Forum Adelaide, Australia. 30 March-4 April 2008.
Abu Hammad & Tumeizi, A. 2012. Land degradation: Socioeconomic and environmental causes and consequences in the Mediterranean. Land Degrad. Develop., 23: 216–226.
Abu Hammad. & Bǿrresen, T. 2006. Socioeconomic factors affecting farmers’ perceptions of land degradation and stonewall terraces in central Palestine. Environ. Manage., 37: 380-394.
Abu-Zreig, M. 2006. Control of rainfall-iinduced soil erosion with various types of polyacrylamide (8 pp). J. Soils and Sedi., 6: 137-144.
Abu-Zreig, M., Al-Sharif, M. & Amayreh, J. 2007. Erosion control of arid land in Jordan with two anionic polyacrylamides. Arid Land Res. Manage., 21:315–328.
Afifi, M. Y., Genead, A.Y., Atta, S. Kh & Aly, A.A. 1992. Impact of rainfall erosion and management practices on properties and productivity of Maryut soil. Desert Institute Bulltin Egypt 42: 173–184.
Afyuni, M., Rezaeinejad, Y. & Schulin, R. 2006. Extractability and plant uptake of Cu, Zn, Pb and Cd from a sludge-amended Haplargid in Central Iran. Arid Land Res.and Manage., 20: 29-41.
Status of the World’s Soil Resources Report, Regional Assessments of Soil Changes | Chapters 9 - 16
205

Al Barshamgi, A. 1997. Soil Resource in the UAE. Regiomal Workshop on Management of Salt-affected Soils in the Arab Gulf States. Abu-Dhabi, UAE, 29 October-2 November, 1997. As cited
Al Karadsheh, E., Akroush, S. & Mazahreh, S. 2012. Land Degradation in Ordan-Review of knowledge resources. ICARDA.
Al-Amin, N. K. N. 1999. The physical potential of indigenous vegetation and other means to suppress sand movement in a secondary desertification source area near the White Nile in Gezira region (Sudan).University of Gezira. Wad-Medani, Sudan (PhD thesis).
Alavipanah, S. K., Amiri, R., Matinfar, H.R., Rafiei, A. & Shamsipour, A.A.. 2000. Cross Sensor analysis of TM and ETM+ spectral information content in arid and urban areas. World Applied Sci. J., 2: 665-673.
Alavipanah, S. K., Komaki, Ch. B., Goorabi, A. & Matinfar, H.R. 2007. Characterizing Land Cover Types and Surface Condition of Yardang Region in Lut Desert (Iran) Based upon Landsat Satellite Images. World Applied Sci. J., 2: 212-228.
Al-Awadhi, J. M. 2013. A case assessment of the mechanisms involved in human-induced land degradation in northeast Kuwait. Land Degrad. Develop., 24: 2–11.
Al-Awadhi, J.M. & Misak, R.F. 2000. Field assessment of aeolian sand processes and sand control measures in Kuwait. Kuwait J. Sci. & Eng., 27: 156-176.
Al-Awadhi, J.M. & Cermak, J. 1998. Sand trap for field measurements of aeolian sand-drift rate in the Kuwaiti desert. In: Omar, S., Misak, R., Al-Ajmi, D. (Eds.), Sustainable Development in Arid Zones. Proceedings of the International Conference on Desert Development in the Arab Gulf Countries, Kuwait. A.A. Balkema, Rotterdam, The Netherlands, pp. 177–188.
Al-Awadhi, N., Al-Daher, R., ElNawawy, A., and Balba, M.T. 1996. Bioremediation of oilcontaminated soil in Kuwait. I. Landfarming to remediate oil-contaminated soil. Soil Sediment Contamin. 5: 243–260.
Al-Awadhi, J.M., Al-Helal, A. & Al-Enezi, A. 2005. Sand drift potential in the desert of Kuwait. J. Arid Environ., 63: 425-438.
Al Barshamgi, A. 1997. Soil Resources in the UAE. Proceedings of the Regional Workshop on Management of Salt-Affected Soils in the Arab Gulf States. Abu-Dhabi, United Arab Emerates 29 October-2 November, 1997.
Alberto, F., Machı´n, J. & Aragüés, R. 1983. Razones y distribucio´ n espacial de la salinidad de los suelos y aguas superficiales de la Cuenca del Ebro. Seminario ‘‘El sistema integrado del Ebro’’. Barcelona, 23-25 febrero 1983, 10pp.
Al-Dousari, A. M., Misak, R. & Shahid, S. 2000. Soil compaction and sealing in Al-Salmi area, western Kuwait. Land Degrad. Develop., 11: 401-418.
Al-Eisawi, D. 1998. Medicinal plants and biodiversity. Paper presented at the Workshop on National Biodiversity Planning, Arabian Gulf University, 12–14 October, 1998, Bahrain. 9 pp.
Status of the World’s Soil Resources Report, Regional Assessments of Soil Changes | Chapters 9 - 16
206

Al-Harthi, A.A. 2002. Geohazard assessment of sand dunes between Jeddah and Al-Lith, western Saudi Arabia. Environ. Geology ,42:360-369.
Al-Hemiary, A. A. 2001. The state of land and water resources in Yemen. In: Regional Land Resources Information Systems Workshop. Cairo, Egypt 3-6 September, 2001.
Al-Hiba, M. 1997. Improvement of irrigation and drainage systems for soil salinity in the Arab Region. In: Regional Workshop on Management of Salt-affected Soils in the Arab Gulf States. Abu-Dhabi, UAE, 29 October-2 November, 1997.
Al-Rajhi, M.A., Seaward, M.R.D. & Al-Aamer, A.S. 1996. Metal levels in indoor and outdoor dust in Riyadh, Saudi Arabia. Environ. Int., 22: 315-324.
Al‐Senafy, M. N., Viswanathan, M. N., Senay, Y. & Sumait, A. 1997. Soil contamination from oil lakes in northern Kuwait. J. Soil Contamin., 6: 481-494.
Ardö, J. & Olsson, L. 2003. Assessment of soil organic carbon in semi-arid Sudan using GIS and the CENTURY model. J. Arid Environ., 54: 633-651.
Ardö, J. &. Olsson, L. 2004. Soil carbon sequestration in traditional farming in Sudanese drylands. Environ. Manage., 33: 318-329.
Asadi, H., Raeisvandi, A., Rrabiei, B. & Ghadiri, H. 2012. Effect of land use and topography on soil properties and agronomic productivity on calcareous soils of a semiarid region, Iran. Land Degrad. Develop., 23: 496–504.
Ayoub, A.T. 1998. Land degradation, rainfall variability and food production in the Sahelian zone of the Sudan. Land Degrad. Develop., 10: 489-500.
Azimzadeh, H.R., Ekhtesasib, M.R., Refahic, H.Gh., Rohipourd, H. & Gorji, M. 2008. Wind erosion measurement on fallow lands of Yazd-Ardakan plain, Iran. Desert, 13:167-174.
Badraoui, M. 1998. Eff ects of intensive cropping under irrigati on on soil quality in Morocco. In Badraoui ed. Proceedings of the 16th world Congress of Soil Science, B5-Post Congress tour in Morocco, AMSSOL, Rabat.
Bakheit, S.A. 2011. Availability and Contents of Famine Foods in Northern Darfur. University of Khartoum, 2011 (MA thesis).
Balba, M.T., Al-Daher, Al-Awadhi, N., Chino, H. & Tsuji, H. 1998. Bioremediation of oil-contaminated desert soil: The Kuwaiti experience. Environ. Int., 24: 163-173.
Belaroui, K., Djediai, H. & Megdad, H. 2014. The influence of soil, hydrology, vegetation and climate on desertification in El-Bayadh region (Algeria). Desalin. Water Treat., 52: 2144-2150.
Belgacem, A.O., Tarhouni, M.& Louhaichi, M. 2013. Effect of protection of Mediterranean arid zone of southern Tunisai: A case study from Bou Hedma National Park. Land Degrad. Develop., 24: 57-62.
Ben-Mahmoud, R., Mansur, S. & AL-Gomati, A. 2000. Land degradation and desertification in Libya, Land Degradation and Desertification Research Unit, Libyan Center for Remote Sensing and Space Science, Tripoli, Libya.
Status of the World’s Soil Resources Report, Regional Assessments of Soil Changes | Chapters 9 - 16
207

Benmansour, M., Mabit, L., Nouira, A., Moussadek, R., Bouksirate, H. , Duchemin, M.& Benkdad, A. 2013. Assessment of soil erosion and deposition rates in a Moroccan agricultural field using fallout 137Cs and 210Pbex. J. Environ. Radioact., 115: 97-106.
Besalatpour A, Hajabbasi, M.A., Khoshgoftarmanesh, A.H. & Dorostkar, V. 2011. Land farming process effects on biochemical properties of petroleum-contaminated soils. Soil and Sed. Contamin., 20:234-248.
Besalatpour, A., Hajabbasi, M. A., Khoshgoftarmanesh, A. H. & Dorostkar, V. 2011. 'Landfarming Process Effects on Biochemical Properties of Petroleum-Contaminated Soils', Soil and Sed. Contamin., 20: 234- 248.
Besalatpour, A., A. H. Khoshgoftarmanesh, Hajabbasi, M. A. & Afyuni, M. 2008. Germination and Growth of Selected Plants in a Petroleum Contaminated Calcareous Soil. Soil and Sed. Contamin., 17: 665-676.
Bessam, F. & Marbet, R.. 2003. Long-term changes in soil organic matter under conventional tillage and no-tillage systems in semiarid Morocco. Soil Use Manag. 19: 139-143.
Bestalatpour, A.A., Hajabbasi, M. A. & Khoshgoftarmannesh, A.H. 2010. Reclamation of a Petroleum-Contaminated Calcareous Soil Using Phytostimulation. Soil and Sed. Contamin., 19:547–559.
Biro, K. B., Pradhan, M., Buchroithner & Makeschin, F. 2013. Land use/land cover change analysis and its impact on soil properties in the northern part of Gadarif region, Sudan. Land Degrad. Develop., 24: 90–102.
Bou Kheir R., Cerdan, O. & Abdallah, C. 2006. Regional soil erosion risk mapping in Lebanon. Geomorphology, 82: 347–359.
Bridges, E. M. & Oldeman, L. R. 1999. Global Assessment of Human-Induced Soil Degradation. Arid Soil Res. Rehabilit., 13: 319-325.
CAMRE/UNEP/ACSAD. 1996. State of Desertification in the Arab Region and the Ways and Means to deal with it. Council of Arab Ministers Responsible for the Environment (CAMRE), United Nations Environment Programme (UNEP), Arab Center for Studies of Arid Zones and Drylands (ACSAD), Damascus, Syria (in Arabic with English summary). 444 pp.
Chigani, H. K., Khajeddin, S. J. & Karimzadeh., H. R. 2012. Soil-vegetation relationship of three arid land plant species and their use in rehabilitating degraded sites. . Land Degrad. Develop., 23: 92-101.
Darwish, T. G. F. & Khawlie, M. 2004. Assessing Soil Degradation by Landuse-Cover Change in Coastal Lebanon. Lebanese Sci. J., 5: 45-59.
Darwish, T., Khater, C. Jomaa, I. Stehouwer, R. Shaban, A. & Hamze, M. 2011. Environmental impact of quaaries on natural resources in Lebanon. Land Degrad. Develop., 22: 345–358.
Dayan, U., Heffter, J., Miller, J. & Gutman, G., 1991. Dust intrusion into the Mediterranean basin. J. Applied Meteorology, 30: 1185-1199.
Status of the World’s Soil Resources Report, Regional Assessments of Soil Changes | Chapters 9 - 16
208

DGACTA-Ministère Agriculture –Tunisie 2005. Examen et évaluation de la situation actuelle de la salinisation dans les périmètres irrigués- Phase 1 -Projet PISEAU1.
Dima, S J. 2006. Land use systems in South Sudan and their impacts on land degradation: A paper presented at the Conference on Environmental Management Plan in Post Conflict South Sudan, Juba Raha Hotel, 31/10-03/11/2006.
Dixon, J. and Gulliver, A., 2001. Farming Systems and Poverty. FAO and World Bank, Rome and Washington.
Djavanshir, K., Dasmalchi, H. & Emararty, A. 1996. Ecological and ecophysiological survey on sexual Euphrate poplar and Athel trees in Iranian deserts. Journal of Biaban, (Iran) 1: 67–81.
Dregne, H. and Chou, N. 1992. Global desertification dimensions and cost. In H.E. Dregne (ed.). Degradation and Restoration of Arid Lands Texas: Texas University Press, 1992: 249-282.
Dregne, H.E. 2002. Land Degradation in the Drylands, Arid Land Res. Manage., 16: 99-132.
EAD. 2009. Soil survey of Abu Dhabi Emirate. Environment Agency Abu Dhabi, United Arab Emirates. 5 Volumes.
EEAA. 1994. Industrial Wastewater Pollution Abatement in Kafr El-Zayat, Pre- Feasibility Study, Technical Cooperation Office for the Environment.
El Tahir, B.A., Ahmed, D.M., Ardö, J., Gafaar, A.M. & Salih, A.A. 2008. Changes in soil properties following conversion of Acacia senegal plantation to other land management systems in North Kordofan State, Sudan. J. Arid Environ., 73: 499-505.
Elagib, N.A. 2011. Changing rainfall, seasonality and erosivity in the hyper-arid zone of Sudan. Land Degradation and Development 22: 505-512.
El-Hady, O.A. & Abo-Sedera, S.A. 2006.Conditioning Effect of Composts and Acrylamide Hydrogels on a Sandy Calcareous Soil. II-Physico-bio-chemical Properties of the Soil. Int. J. Agric. Biol., 8: 876–884.
Elias, E.A. & Alaily, F. 2002. Effects of long-term irrigation on soluble salts and exchangeable cations in Vertisols from Gezira. Geograficky Casopis, 54: 343-353.
El-Kholei, A. 2012. Country Study on Status of Land Tenure, Planning and Management in Oriental Near East Countries. Food and Agriculture Organization of the United Nations, Regional Office for the Near East (RNE), Oriental Near East Sub-Region (SNO).
El-Tantawi, A. M. M. 2005. Climate Change in Libya and Desertification of Jifara Plain Using Geographical Information System and Remote Sensing Techniques. der Johannes Gutenberg-Universität (PhD thesis).
Fallahzadeh, J. & Hajabbasi, M. A. 2012a. Land Use change effects on carbohydrate fractions, total and particulated organic matter of forest soils in central Zagros Mountain, Iran. J. App. Sci., 12:387-392.
Fallahzadeh, J. & Hajabbasi, M. A. 2012b. The effects of irrigation and cultivation on the quality of desert soil in central Iran. . Land Degrad. Develop. 23:53-61.
Status of the World’s Soil Resources Report, Regional Assessments of Soil Changes | Chapters 9 - 16
209

FAO 2000. Global Assessment of Soil Degradation GLASOD. FAO, Rome
FAO, 2004. Regional Workshop on Promoting LADA Program in western Asia and the Near East. Damascus, Syria 25-28, July, 2004.
FAO, 2011. Regional Priority Framework for the Near East. Food and Agriculture Organization of the United Nations FAO Regional Office for the Near East 2011.
FAO, 2012. Country Study on Status of Land Tenure, Planning and Management in Oriental Near East Countries. Viale delle Terme di Caracalla, 00153 Rome, Italy.
FAO, 2013. The 3rd Regional Multi-Stakeholder Workshop on Food Security and Nutrition. 4-6 November 2013, Tunis, Tunisia. Regional Office for the Near East and North Africa, Food and Agriculture Organization of the United Nations, Cairo, Egypt.
FAO, 2013. Statistical Analysis of Select Food and Agricultural Indicators for the Near East and North Africa. FAO, Viale delle Terme di Caracalla, 00153 Rome, Italy.
FAO. 1997. Regiomal Workshop on Management of Salt-affected Soils in the Arab Gulf States. Abu-Dhabi, UAE, 29 October-2 November, 1995.
Gibbs, G.K. 1954. Report to the Government of Iraq on Soil Conservation. Report No. 242, FAO, Rome.
Golchin, A. & Asgari, H. 2008. Land use effects on soil quality indicators in north-eastern Iran. Australian Journal of Soil Research 46: 27–36.
Goudie, A.S. & Middleton, N.J.. 2001. Saharan dust storms: nature and consequences. Earth-Science Reviews, 56: 179-204.
Hajabbasi, M. A., Jalalian, A. & Karimzadeh, H.R. 1997. Deforestation effects on soil physical and chemical properties, Lordegan, Iran. Plant Soil, 190: 301-308.
Halitima, A. 1988. Sols des régions arides. OPU, Alger, 384p.
Hamdallah, G. 1997. An overview of the salinity status of the Near East Region. In Proceedings of the Regional Workshop on Management of salt-affected soils in the Persian Gulf Status, Abu Dhabi, UAE 29/10-2/11/1995.
Hamidi, M., Mohammad Reza Kavianpour1 & Yaping Shao. 2013. Synoptic Analysis of Dust Storms in the Middle East. Asia-Pacific J. Atmos. Sci., 49 (3): 279-286.
Hejazi, R.F., Hussain, T. & Khan, F.I. 2003. Landfarming operation of oily sludge in arid region: human health risk assessment. J. Hazard. Mat. 99: 287–302.
Herrero, J. & Aragüés, R. 1988. Suelos afectados por salinidad en Arago´ n. Surcos de Arago´ n 9, 5–8.
Houyou, Z., Bielders, C. L., Benhorma H.A., Dellal, A. & Boutmedjet, A. 2014. Evidence of strong land degradation by wind erosion as a result of rainfed cropping in the Algerian Steppe: A case study at Laghout. Land Degrad. Develop., DOI: 10.1002/ldr.2295
Hussein, M.A. 2008. Costs of environmental degradation: An analysis in the Middle East and North Africa region. Manag. Environ. Qual., 19: 305-317.
Status of the World’s Soil Resources Report, Regional Assessments of Soil Changes | Chapters 9 - 16
210
Hussein, H. 2001. Development of environmental GIS database and its application to desertification study in middle east. PhD thesis, Graduate School of Science and Technology, Chiba University, Japan.
Hussein, M.H., 1998. Water erosion assessment and control in Northern Iraq. Soil Till. Res., 45: 161–173.
Ibrahim, M.M. & Gehan A. El-Gaely. 2012. Short-term effects of dust storm on physiological performance of some wild plants in Riyadh, Saudi Arabia. Afric. J. Agric. Res., 7 (47): 6305-6312.
ICID (International Commission on Irrigation and Drainage). 2002. Irrigation and Food Production Information about ICID Network Countries. Available at http://www.icid.org/index_e.html.
Jalalian A, A.M., Ghahsareh & Karimzadeh, H.R. 1996. Soil erosion estimates for some watersheds in Iran. The First International Conference on Land Degradation 10–14 June, Adana, Turkey, pp. 12–13.
Jish Prakash, P., Stenchikov, G., Kalenderski, S., Osipov, S. & Bangalath, H. 2014. The impact of dust storms on the Arabian Peninsula and the Red Sea. Atmos. Chem. Phys. Discuss., 14: 1918-19245.
Jones, A., Breuning-Madsen, H., Brossard, M., Dampha, A., Deckers, J., Dewitte, O., Gallali, T., Hallett, S., Jones, R., Kilasara, M., Le Roux, P., Micheli, E., Montanarella, L., Spaargaren, O., Thiombiano, L., Van Ranst, E., Yemefack, M. & Zougmore R., (eds.), 2013, Soil Atlas of Africa. European Commission, Publications Office of the European Union, Luxembourg. 176 pp.
Keith Wiebe. 2003. Linking Land Quality, Agricultural Productivity, and Food Security. Resource Economics Division, Economic Research Service, U.S. Department of Agriculture. Agricultural Economic Report No. 823.
Khalafa, F.I. & Al-Jimi, D. 1993. Aeolian processes and sand encroachment problems in Kuwait. Geomorphology, 6: 111-134.
Khresat, S. A., Rawajfih, Z. & Mohammad, M. 1998. Land degradation in north-western Jordan: causes and processes. J. Arid Environ., 39: 623–629.
Khresat, S., Al-Bakir, J. & Al-Tahran, R. 2008. Impacts of land use/cover change on soil properties in the Mediterranean region of northwestern Jordan. Land Degrad. Develop., 19: 397-407.
Kobler, M. 2013. Dust storms of Iraq, UN Secretary General for Iraq, A ministerial meeting in Nairobi, Kenya. http://www.term123.com/dust-storms-of-iraq/#mh32BcOB4S6cRkIG.99
Koocheki, A. 2000. Potential of saltbush (Atriplex spp.) as a fodder shrub for the Arid Lands of Iran. In G. Gintzburger; M. Bounejmate and A. Nefzaoui (eds). Fodder shrub development in arid and semi-arid zones. ICARDA. pages 178- 183.
LADA. 2008. Mapping land use systems at global and regional scales for land degradation assessment analysis. Nachtergaele F. and Petri M. LADA Technical Report n.8, version 1.1.
Status of the World’s Soil Resources Report, Regional Assessments of Soil Changes | Chapters 9 - 16
211

Lal, R. 2002. Carbon sequestration in dryland ecosystems of West Asia and North Africa. Land Degrad. Develop., 13: 45–59.
Madany, I.M., Akhter, M.S. & Al-Jowder, O.A. 1994. The correlations between heavy metals in residential indoor dust and outdoor street dust in Bahrain. Environ. Int., 20: 483-492.
MADRPM. 2000. Atlas de l’Agriculture. Colloque National de l’Agriculture et du Développement Rural. Ministère de l’Agriculture du Développement Rural et des Pêches Maritimes. Rabat, Maroc.
Mamdouh Nasr. 1999. Assessing Desertification and Water Harvesting in the Middle East and North Africa: Policy Implications, ZEF – Discussion Papers On Development Policy No. 10, Center for Development Research, Bonn, July 1999, pp. 59.
Masri, Z. & Ryan, J. 2006. Soil organic matter and related physical properties in a Mediterranean wheat-based rotation trial. Soil Till. Res., 87: 146–154.
Misak, R.F., Khalaf, F.I. & Omar, S.A.S. 2009. Managing the hazarads of drought and shifting sands in dry lands: The cast study of Kuwait. In: Developments in Soil Classification, Land Use Planning and Policy Implications: Innovative Thinking of of Soil Inventory for Land Use Planning and Management of Land Resources Sabir A. Shahid, Faisal K. Taha and Mahmoud A. Abdelfattah (eds); 731-752.
Mohammed, A.E., Stigter, C. J. & Adam, H.S. 1995.: Moving sand and its consequences on and near a severely desertified environment and a protective shelterbelt. Arid Soil Res. Rehabilit., 9: 423-435.
Mohammed, A.E., Stigter, C.J. & Adam, H.S. 1996. On shelterbelt design for combating sand invasion. Agric., Ecosyst. Environ., 57: 81-90.
Mougenot, B., Pouget, M. & Epema, G. 1993. Remote sensing of salt affected soils. Remote Sens. Rev., 7: 241–259.
Mrabet, R., Ibno-Namr, K., Bessam, F. & Saber, N. 2001. Soil chemical quality changes and implications for fertilizer management after 11-years of no-tillage wheat production systems in semiarid Morocco. Land Degrad. Develop., 12: 505-517.
Mubarak, A. R. & Nortcliff, S. 2010. Calcium Carbonate Solubilization through H-Proton Release from some Legumes Grown in Calcareous Saline-Sodic Soil. Land Degrad. Develop. 21: 29-39.
Nachtergaele, F. and Petri, M., 2011. Mapping land use systems at global and regional scales for land degradation assessment analysis. . LADA Technical Report n.8, version 1.1. FAO, Rome.
Naifer, A., Al-Rawahy, S.A. & Zekri, S. 2011. Economic Impact of Salinity: The Case of Al-Batinah in Oman. Int. J. Agric. Res., 6: 134-142.
NAP, 2003. Causes and Effects of Desertification. In National Action Programme to Combat Desertification. pp 99-109, Ministry of Agriculture, Lebanon.
NAP, 2002. National Action Plan for Combating Desertification, Egypt, Cairo.
Status of the World’s Soil Resources Report, Regional Assessments of Soil Changes | Chapters 9 - 16
212

Nielsen, T. L. & Zöbisch, M. A. 2001. Multi-factorial causes of land-use change: land-use dynamics in the agro-pastoral village of Im Mial, northwestern Syria. Land Degrad. Develop., 12: 143-161.
Nielsen, T. T. & Adriansen, H. K. 2005. Government policies and land degradation in the Middle East. Land Degrad. Develop., 16: 151–161.
Omar, S.A.S., Madouh, T., El-Bagouri, I., Al-Mussalem, Z. & Al-Telaihi, H. 1998. Land degradation factors in arid irrigated areas: the case of Wafra in Kuwait. Land Degrad. Develop., 9: 283-294.
Poussart, N., Ardö, J. & Olsson, L. 2004. Effects of Data Uncertainties on Estimated Soil Organic Carbon in the Sudan. Environ. Manage., 33: 405-415.
Qadir, M., Qureshi, A.S. & Cheragh, S.A.M. 2008. Extent and characterisation of salt-affected soils in Iran and strategies for their amelioration and management. Land Degrad. Develop., 19: 214-227.
Qadir, M., A.S. Qureshi & M.S. Cheraghi. 2007. Extent and characterization of Salt-prone land resources in Iran and strategies for amelioration and management. Land Degrad. Develop. 19:214-227.
Radwan, S. S. , Al-Awadhi, H. & El-Nemr, I. M. 2000. Cropping as a Phytoremediation Practice for Oily Desert Soil with Reference to Crop Safety as Food. Int. J. Phyt., 2: 383-396.
Raiesi, F. 2007. The conversion of overgrazed pastures to almond orchards and alfalfa cropping systems may favor microbial indicators. Agric., Ecosyst. Environ., 121: 309-318.
Rawajfih, Z., Khersat, S. A. & Buck, B. 2005. Arid soils of the Badia region of northeastern Jordan: Potential use for sustainable agriculture. Arch. Agron. Soil Sci., 51: 25 – 32.
Sadeghi, S. H. R., Ghaderi Vangah, B. & Safaeeian, N.A. 2007. Comparison between effects of open grazing and manual harvesting of cultivated summer rangelands of northern Iran on infiltration, runoff and sediment yield. Land Degrad. Develop., 18: 608–620.
Sallam, A.S., Elwan, A. A. & Rabi, F. H. 1995. Shale Deposits of El‐Farafra Depression (Egypt) as Soil Conditioner for Sandy Soils. Arid Soil Res. Rehabilit., 9: 209-217.
Sayyari, M.H. & Mahmoodi, S. 2002. An investigation on reason of soil salinity and alkalinity in some part of Khorasan Province (Dizbad-e-Pain Region) In Paper presented at the 17th World Congress of Soil Science (Symposium No. 33; Paper No. 1981), 14–21 August 2002, Bangkok.
SEDENOT, 1999-2000. Sustainable feeding systems through local resources in small farms in the North West of Tunisia. Inter-University Belgium and Tunisia Co-operation Project.
Shinjo, H., Fujita, H., Gintzbuger, G & Kosaki, T. 2000. Impact of grazing and tillage on water erosion in northeastern Syria. Soil Sci. Plant Nutr., 46: 151-162.
Shoga'a Aldeen, A.H., Majid, N. M., Azani, A. M., Abd. Ghani, A. N. & Mohamed, S. 2013. Agroforestry Impacts on Soil Fertility in the Rima'a Valley, Yemen, J. Sust. Forest., 32: 286-309.
Status of the World’s Soil Resources Report, Regional Assessments of Soil Changes | Chapters 9 - 16
213

Siadat, H. & Saadat Boroujeni, S. 1998. Study of wheat growth and yield in farmers' fields under saline conditions. Iranian Journal of Soil and Water Sciences.
Siadat, H., Bybordi, M. & Malakouti, M.J. 1997. Salt-affected soils of Iran: A country report. International symposium on Sustainable Management of Salt Affected Soils in the Arid Ecosystem. Cairo. Egypt.
Soil Survey Staff. 2013. Simplified Guide to Soil Taxonomy. USDA-Natural Resources Conservation Service, National Soil Survey Center, Lincoln, NE.
Soleimani, M., Afyuni, M., Hajabbasi, M. A. , Nourbakhsh, F., Sabzalian, M. R. & Christensen, J. H. 2010. Phytoremediation of an aged petroleum contaminated soil using endophyte infected and non-infected grasses. Chemosphere, 81: 1084-1090.
Taimeh, A. 1998. Rainfed Agriculture in Jordan. Review paper. Rainfed Agriculture in the Arab World, Organized by the Academy of Science and Technology, Egypt, and ICARDA,7-9/5/1998, Cairo, Egypt.
Taimeh, A. 2009. Soils of Jordan, A Book under preparation, first draft. Jordan.
Thomas, D.S.G. & Middelton, N.J. 1994. Desertification: exploring the myth. Jhon Willey and Sons Ltd., Chichester, UK. Xiv+194 pages. ISBN 0471-94815-2.
Tiessen, H., Feller, C., Sampaio, E.V.S.B. & Garn, P. 1998. Carbon Sequestration and Turnover in Semiarid Savannas and Dry Forest. Climatic Change, 40: 105-117.
Tork Nejad, A. & Koocheki, A. 2000. Economic aspects of fourwing saltbush (Atriplex canescens) in Iran In Gintzburger G., Bounejmate M., Nefzaoui A. (eds) Fodder Shrub Development in Arid and Semiarid Zones, vol. 1, International Center for Agricultural Research in the Dry Areas (ICARDA): Aleppo; 184–186.
Vaezi, A.R. 2012. Soil Degradation and Wheat Yield in Dry-Farming Lands in A Semi-Arid Region, Iran.
Wassif, M. M., Atta, S. Kh. & Tadros, S.F. 1995. Water erosion of calcareous soil and its productivity under rainfed agriculture of Egypt. Egypt. J. Soil Sci., 35: 15–31.
Yaghi, B. & Abdul-Wahab, S. A. 2004. Levels of heavy metals in outdoor and indoor dusts in Muscat, Oman. Int. J. Environ. Stud., 61: 307-314.
Zahreddine, H.G., Barker, D. J., Quigley, M. F., Sleem, K. & Struve, D. K. 2007. Patterns of woody plant species diversity in Lebanon as affected by climatic and soil properties. Lebanese Sci. J., 8:21-44.
Zurayk, R., El-Awar, F., Hamadeh, S., Talhouk, S., Sayegh, C., Chehab, A. & Al Shab, K. 2001. Using indigenous knowledge in land use investigations: a participatory study in a semi-arid mountainous region of Lebanon. Agric., Ecosyst. Environ., 86: 247–262.
Status of the World’s Soil Resources Report, Regional Assessments of Soil Changes | Chapters 9 - 16
214
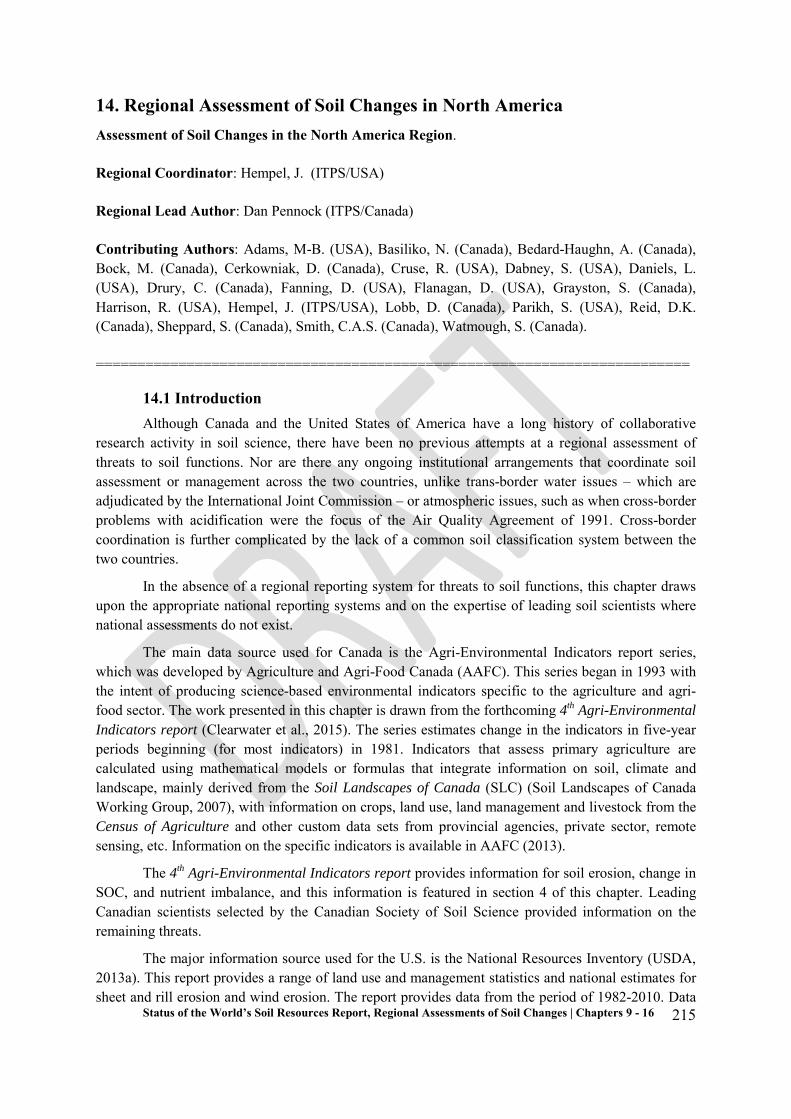
14. Regional Assessment of Soil Changes in North America Assessment of Soil Changes in the North America Region.
Regional Coordinator: Hempel, J. (ITPS/USA)
Regional Lead Author: Dan Pennock (ITPS/Canada)
Contributing Authors: Adams, M-B. (USA), Basiliko, N. (Canada), Bedard-Haughn, A. (Canada), Bock, M. (Canada), Cerkowniak, D. (Canada), Cruse, R. (USA), Dabney, S. (USA), Daniels, L. (USA), Drury, C. (Canada), Fanning, D. (USA), Flanagan, D. (USA), Grayston, S. (Canada), Harrison, R. (USA), Hempel, J. (ITPS/USA), Lobb, D. (Canada), Parikh, S. (USA), Reid, D.K. (Canada), Sheppard, S. (Canada), Smith, C.A.S. (Canada), Watmough, S. (Canada).
========================================================================
14.1 Introduction Although Canada and the United States of America have a long history of collaborative
research activity in soil science, there have been no previous attempts at a regional assessment of threats to soil functions. Nor are there any ongoing institutional arrangements that coordinate soil assessment or management across the two countries, unlike trans-border water issues – which are adjudicated by the International Joint Commission – or atmospheric issues, such as when cross-border problems with acidification were the focus of the Air Quality Agreement of 1991. Cross-border coordination is further complicated by the lack of a common soil classification system between the two countries.
In the absence of a regional reporting system for threats to soil functions, this chapter draws upon the appropriate national reporting systems and on the expertise of leading soil scientists where national assessments do not exist.
The main data source used for Canada is the Agri-Environmental Indicators report series, which was developed by Agriculture and Agri-Food Canada (AAFC). This series began in 1993 with the intent of producing science-based environmental indicators specific to the agriculture and agri-food sector. The work presented in this chapter is drawn from the forthcoming 4th Agri-Environmental Indicators report (Clearwater et al., 2015). The series estimates change in the indicators in five-year periods beginning (for most indicators) in 1981. Indicators that assess primary agriculture are calculated using mathematical models or formulas that integrate information on soil, climate and landscape, mainly derived from the Soil Landscapes of Canada (SLC) (Soil Landscapes of Canada Working Group, 2007), with information on crops, land use, land management and livestock from the Census of Agriculture and other custom data sets from provincial agencies, private sector, remote sensing, etc. Information on the specific indicators is available in AAFC (2013).
The 4th Agri-Environmental Indicators report provides information for soil erosion, change in SOC, and nutrient imbalance, and this information is featured in section 4 of this chapter. Leading Canadian scientists selected by the Canadian Society of Soil Science provided information on the remaining threats.
The major information source used for the U.S. is the National Resources Inventory (USDA, 2013a). This report provides a range of land use and management statistics and national estimates for sheet and rill erosion and wind erosion. The report provides data from the period of 1982-2010. Data
Status of the World’s Soil Resources Report, Regional Assessments of Soil Changes | Chapters 9 - 16
215

are gathered annually by the National Resources Conservation Agency and major reports are released at five-year intervals. Information for specific threats such as salinization was also provided by the STATSGO2 database (Soil Survey Staff, 2014). Leading U.S. soil scientists selected by the Soil Science Society of America also provided information for the U.S.
14.2 Regional Stratification and Soil Threats 14.2.1: Regional Stratification and Land Cover
The spatial framework used in the North American regional report is the multi-level Ecological Regions of North America developed by the Commission for Environmental Cooperation (Commission for Environmental Cooperation, 1997). For this chapter the Level II ecoregions are used as a consistent geographical reference (Figure 14.1).
The contiguous 48 United States, Hawaii, Puerto Rico, and the U.S. Virgin Islands cover almost 88Bha of land and water; about 71 percent of this area is non-Federal rural land – nearly 57 Bha (USDA, 2013). The non-Federal rural lands of the US are predominantly rangeland (165 Mha), forest land (166 Mha), and cropland (146 Mha) with smaller areas composed of developed land, pastureland and water.
Rangeland is dominant in the western one-half of the U.S. in the Cold Deserts, Warm Deserts, Great Plains, South Central Semi Arid Prairies and Western Cordillera ecoregions. The dominant land cover in forest land is in the northwest, north central and eastern one-third of the country in the Western Cordillera, Mixed Wood Plains, Ozark, Ouachita-Appalachian Forests ecoregions.
Cropland is the dominant land cover in the Central USA Plains, South Eastern USA Plains, the Mississippi Alluvial and Southeast USA coastal plains, Temperate Prairies, West Central Semi-Arid Prairies, South Central Semi-Arid Prairies and Mediterranean California ecoregions.
Cropland in the US has increased by about 1Mha from 2007 to 2010, following a steady decline in area in the previous 25 years. These gains can be attributed to land withdrawn from the Conservation Reserve Program as grain prices were at near-record levels. This has led to an increased threat to the soil resource from erosion and loss of terrestrial C. Although the National Resources Inventory tracks the area in specific conservation measures such as terracing, according to the Conservation Technology Information Center there has not been a national survey of crop residue management practices since 2004; at that time 45.6 Mha was in conservation tillage out of a total of 112 Mha of cropland (Conservation Technology Information Center, 2014).
Total farmland in Canada increased from 1981 (65.9 Mha) to 2006 (67.6 Mha) (all values from AAFC 2013). The largest agricultural region (54.7 Mha) occurs in the Temperate Prairies and West-Central Semi-Arid Prairies ecoregions in southern Alberta, Saskatchewan, and Manitoba. In 2006 approximately 29 Mha of farmland in this region was cropped, primarily to cereal grains, oilseeds and pulse crops, and 18 Mha was in pasture. Approximately 1.4 Mha was in tillage summerfallow, where land is fallowed during the growing season with weed suppression by one or more tillage operations. The area under tillage summerfallow has declined greatly from 5.3 Mha in 1991and this decline has reduced soil degradation in this region.
Farmland in Ontario and Quebec (8.9 Mha) is concentrated in the Mixed Wood Plains ecozone. In 2006 5.6 Mha of this was cropped, primarily to forages, maize, cereal grains, and oilseeds (soybeans). The area of pastures in this region has declined from 1.7 Mha in 1991 to 1.1 Mha in 2006. Tillage practices in this region have also undergone a major shift, with the percentage of cropland
Status of the World’s Soil Resources Report, Regional Assessments of Soil Changes | Chapters 9 - 16
216

under conventional tillage decreasing from 80% in 1991 to 50% in 2006 and conservation tillage and no-tillage increasing from 16% to 26% and 4 to 24% respectively over the same period.
Farmland in British Columbia (2.8 Mha in 2006) is dominated by forage production and pasture dispersed through the Western Cordillera and Cold Desert ecoregions. Finally the Atlantic Highlands and Mixed Wood Plains ecoregions in Atlantic Canada have 1.1 Mha of farmland, dominantly in forages but with significant areas of potato production in New Brunswick and Prince Edward Island.
Overall the greatest shift in Canadian agriculture has been the adoption of no-till and reduced tillage systems. The 2011 Census of Agriculture (Statistics Canada, 2015) reports that of 29.6 M ha seeded in 2011, 16.7 M ha were in no-till and a further 7.2 M ha were in tillage systems that left most residue on the soil surface; only 5.6 M ha were in conventional (i.e., most residue turned into the soil) tillage.
Wetlands are extensive in both Canada and the US and are subject to considerable alteration by human activity. Bridgham et al. (2006) estimate that the historical area of wetlands in Canada of 150 Mha has been reduced to 130 Mha by land-use conversion. In the conterminous US they estimate a reduction from 90 Mha historically to current levels of 43 Mha.
The area of forested land in Canada is estimated at 348 Mha (Natural Resources Canada, 2012) and forest is the dominant land cover in the Northern Forests, Boreal Plain, Boreal Cordillera, Western Cordillera, and Marine West Coast Forest ecoregions. Forest harvest activity has decreased in the period from 2004, and approximately 0.7 Mha were harvested in 2010 (Natural Resources Canada, 2012). Canada’s National Forest Inventory shows that gross deforestation rates were typically in the order of 64,400 ha yr-1 circa 1990, and decreased to 44,800 ha/yr by 2010, corresponding to about 0.02% of Canada’s forest area (Natural Resources Canada, 2012). Deforestation minus afforestation (according to UNFCCC definitions) amounts to a net loss of 35,000 ha yr-1. Overall, there is a definite decrease in total deforestation rate from the 1990s to present, which is expected to continue in coming years, but at a lower rate of decrease (Masek et al., 2011). The expansion of agriculture is the largest source of forest conversion, accounting for 2/3 gross deforestation. Urban and industrial development is the next largest driver at approximately 17%, followed by forestry at half that rate. The Boreal Plains ecozone spanning central Alberta, Saskatchewan, and Manitoba (generally termed the Prairie provinces)is the dominant location of deforestation over the 1990–2008 time period, contributing just under half the nation’s deforestation for most years and largely due to agricultural conversion (Masek et al., 2011).
The Tundra (233 Mha), Taiga (200 Mha), and Arctic Cordillera (21.7 Mha) ecoregions are vulnerable to effects of climate change. Permafrost soils in these regions are estimated to contain 39% of all organic C in Canada (Tarnocai and Bockheim 2011) and hence the interaction of soils and climate in these regions is a major concern.
Status of the World’s Soil Resources Report, Regional Assessments of Soil Changes | Chapters 9 - 16
217
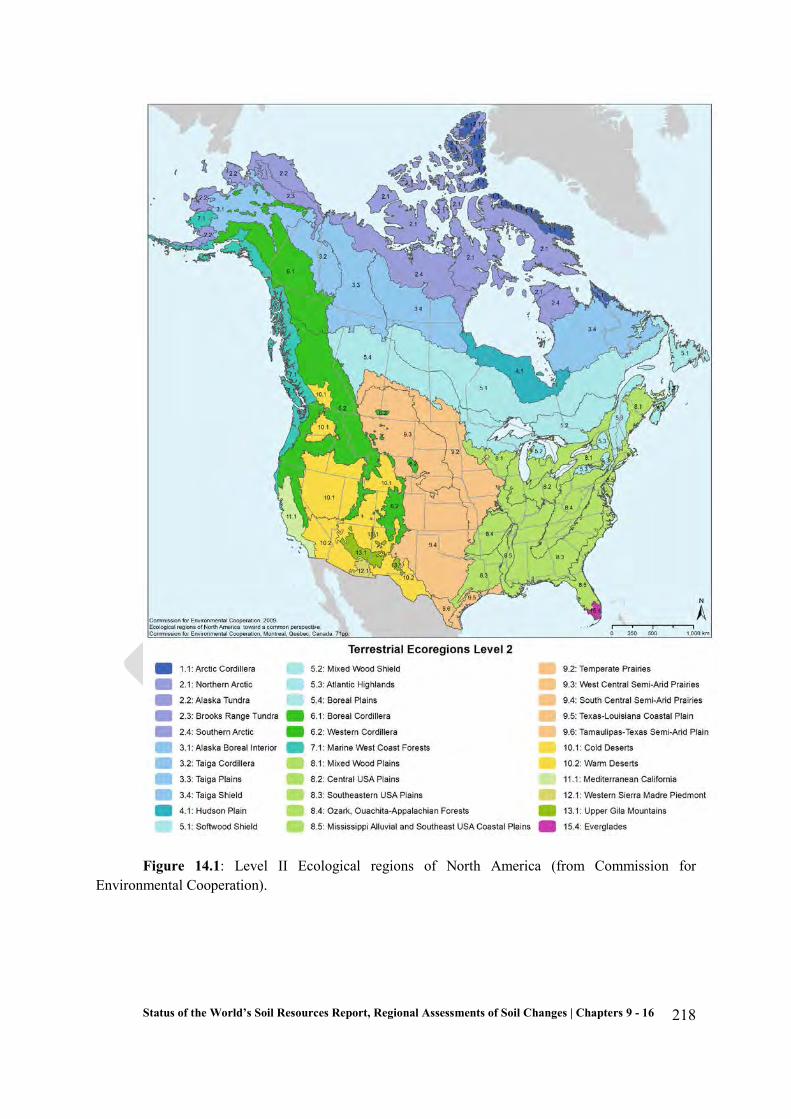
Figure 14.1: Level II Ecological regions of North America (from Commission for Environmental Cooperation).
Status of the World’s Soil Resources Report, Regional Assessments of Soil Changes | Chapters 9 - 16
218

14.3 Soil Threats This section focuses on the status and trends for six threats to soil functioning: acidification,
contamination, salinization, sealing/capping, compaction, and waterlogging. Four threats that are judged to be the most serious (erosion, nutrient imbalance, carbon change, and soil biodiversity) are discussed in greater detail in the following section.
14.3.1 Soil Acidification
While many native forest communities are well-adapted to strongly acidic (pH < 5.5) soil conditions, most managed agricultural and horticultural plants suffer from enhanced metal phytotoxicity (Al, Fe, Mn, etc.), reduced N and P availability, and decreased microbiological activity because soils have become acidified below their optimum range. Excessive soil acidification also poses environmental risks of enhanced surface water acidification, sediment losses due to loss of vegetation, and increased loadings of soluble metals into groundwater. Soil acidification is enhanced by a range of anthropogenic effects, including excessive inputs of acidic atmospheric deposition, intensive removal of aboveground biomass, and exposure of sulfidic materials by mining, construction, dredging, and other disturbances.
Acidic deposition (from rain that has low pH and significant amounts of sulfate and nitrate) contributes to base cation depletion and soil acidification in industrialized regions of the world (Menz and Seip, 2004). These effects, however, have been documented only rarely in the US Coarse-textured soils in high-altitude forests that were originally low in pH and base saturation are particularly susceptible to degradation and loss of function. Finer-textured and more highly buffered soils are much more resistant to the negative effects of acidic deposition. The Clean Air Act Amendments of 1990 resulted in significant declines in sulfate emissions (http://nadp.sws.uiuc.edu/ntn/), although emissions of nitrogen oxides have remained elevated due to transportation and agricultural sources. Some lakes in the Adirondacks have shown significant improvement in water quality as a result of the Clean Air Act Amendments . Research by Driscoll et al. (2001) has shown, however, that tighter controls on atmospheric emissions will be needed if soil and stream chemistry in this region is to return to pre-industrial levels in a reasonable time range. Alternatively aerial application of calcium sources such as wollastonite (CaSiO3) to acidifed catchments can accelerate the return of base saturation to pre-industrial levels (Driscoll et al. 2014), but the widespread applicability of this reclamation approach is limited. Localized, highly acidic deposition from heavy metal smelter and other industrial facilities also impacted large areas of land such as the Copper Basin in Tennessee, where many square miles of land were denuded by open air smelting of metal sulfide ores. Current concerns center on the effects on soil fertility and acidification from the interaction between intensive biomass harvesting and acidic deposition on forest soils (Adams et al., 2000).
Sulfidic materials (as defined by Soil Taxonomy) are routinely exposed by mining, construction, and dredging activities. This exposure can rapidly lower the pH of local soils and water to < 4.0 via sulfuricization processes (Kittrick et al., 1982). While most active mining operations now isolate sulfidic materials from contact with groundwater and surface water via the application of appropriate acid-base accounting procedures (Skousen et al., 2002), construction-related impacts have become increasingly more common since the 1970s due to larger scale excavations and the construction industry’s lack of recognition of risk (Fanning et al., 2004; Orndorff and Daniels, 2004). Once exposed, sulfidic materials require large inputs of liming agents (e.g. ~ 31 Mg of agricultural lime per 1000 Mg material for 1% pyritic-S) to become properly neutralized and stabilized.
Status of the World’s Soil Resources Report, Regional Assessments of Soil Changes | Chapters 9 - 16
219
In Canada, the major risks associated with soil acidification occur in forested areas. As in the U.S., areas most at risk from acidification are in regions dominated by coarse-textured soils that have low base cation weathering rates and that receive high levels of acid deposition (Ouimet at al., 2006). These areas of coarse-textured soils include much of Softwood Shield and Mixed Wood Shield ecoregions and the southern, coastal parts of British Columbia (Aherne and Posch, 2013) in regions where glacial parent materials were derived from igneous rocks. Both the loss of essential base cations and the mobilization of metals, such as Al and Mn, can have adverse impacts on forest vegetation. It has been proposed that the ratio of base cations or Ca to Al (i.e., base cations (Bc)/Al or Ca/Al) in soil solution is a useful indicator of the potential risk to trees from soil acidification (Cronan and Grigal, 1995; Sverdrup and Warfvinge, 1993). Critical loads are also increasingly used to estimate the risk of soil acidification (Whitfield et al., 2010).
Aherne and Posch (2013) estimated critical loads for acid deposition for upland forest soils in Canada (~2,600,000 km2). They reported that in 2006, because of acid deposition levels, 4.5% of the mapped area (~100,000 km2) was at risk based on a Bc/Al ratio of 1.0 and 20.3% (~500,000 km2) of the area was at risk based on a Bc/Al ratio of 10.0. Exceedance of the critical load was primarily driven by elevated anthropogenic emissions from large point sources, such as the activities in the Athabasca Oil Sands region and in ore smelting near Sudbury, Ontario. In addition, exceedance in central and eastern Canada was associated with long-range (transboundary) air pollution and emissions from shipping along the St. Lawrence River.
In Canada, national emissions of SO2 and NOx decreased by 21% and 3%, respectively, between 2008 and 2010 (Canadian Council of Ministers of the Environment (CCME), 2103). This decrease will reduce the risk of soil acidification in Canada. Emission reductions, however, vary by province. The bulk of the reduction in SO2 and NOx emissions has been in Ontario in central Canada. Minimal decreases or even increases in emissions, associated primarily with the oil and gas industry (CCME 2013), have occurred in British Columbia and Alberta in western Canada. Currently, the risk of soil acidification caused by acid deposition is generally decreasing over much of eastern Canada but is unchanged or increasing in parts of western provinces, such as Alberta and British Columbia.
14.3.2 Soil Contamination
Soils can be compromised via industrial, mining, municipal, residential, and agricultural activities. In North America, metals (Pb, Cd, Cr, and As), salts (Na and K), pesticides (herbicides and insecticides), pathogens, and nutrients (N and P) contaminate soils to varying degrees and with great spatial variation. There are also chemicals of emerging concern), including engineered nanoparticles, pharmaceuticals and personal care products, and perfluorinated compounds which occur in small concentrations but, because of their high reactivity or potential to be endocrine disrupting, they may pose significant risks to human health and the environment.
In the United States, there are thousands of organic- and metal-contaminated sites of varied scope and significance. To address, monitor, and remediate the myriad of sites, the U.S. Environmental Protection Agency oversees the Superfund program, which is charged with the clean-up of the nation’s hazardous waste sites. This effort follows the National Priorities List (NPL), which defines the known releases or threatened releases of contaminants in the U.S. and its territories (EPA, 2014a). As of September 29, 2014, there are 1,322 final sites on the NPL with 1,163 having completed measures to address the contamination threat and an additional 49 proposed sites (Figure 14.2). In addition, there are vast areas of low-level soil contamination across the U.S. which are not monitored by the EPA.
Status of the World’s Soil Resources Report, Regional Assessments of Soil Changes | Chapters 9 - 16
220

In Canada, because it has a huge expanse of soil and a relatively small population, soil contamination in a spatial context is a relatively minor issue.
Figure 14.2: Map of Superfund sites in the contiguous U.S. Yellow indicates final EPA National Priorities List sites and red indicates proposed sites. Data is from US EPA CERCLIS database and mapped using Google maps.
However, the most agriculturally productive soils and greatest density of population and industry occur concomitantly along the narrow region close to the southern border. This is also the region where there is the greatest potential for soil contamination. In addition, the hinterland has widely dispersed petroleum and mineral resource industries that form hot spots of soil contamination (Doyle et al., 2003).
More insidious is non-point-source, dispersed contamination (Chan et al., 1986). For example, field crop soils surveyed throughout the Mixed Wood Plains ecoregions of southern Ontario in Canada showed elevated levels of Ba, Cd, Mo, Pb, Sb, Se, Nb, U, and Zn, which were speculatively attributed to non-specific urban sources such as road dust (Sheppard et al., 2009a). Watmough and Hutchinson (2004) came to a similar conclusion about Pb in forest soils of Southern Ontario. Toxicity in soil from such sources, however, is a relatively remote possibility.
There is concern about soil contamination by agricultural activities, especially as farms increase in size and effectively become industrial point sources. For example, soils in areas of livestock facilities have been found to have metal levels that exceed Canadian soil quality guidelines (Sheppard and Sanipelli, 2012). Some of these metals came from livestock pharmaceuticals (e.g., Bi in teat dips). The contribution of livestock manures containing antibiotic residues to the development of antibiotic-resistant genes in the environment is a growing public concern. In a few cases, the naturally occurring, trace element bioavailability of some Canadian soils has resulted in food crops with amount of elements that exceed guideline concentrations. The most notable are spatially isolated cases of Cd in durum wheat and sunflowers (Grant et al., 1998).
As industrialization and urbanization increase, concomitant with increased agricultural activities in decreasing land areas, the potential for soil contamination remains an important issue. Although soil contaminants in the U.S. and Canada are ubiquitous in areas close to human
Status of the World’s Soil Resources Report, Regional Assessments of Soil Changes | Chapters 9 - 16
221
populations, the specific threats posed by these contaminants to human health and environmental quality are not well defined. There is a need for improvements in assessments of soil contamination to better protect human health and environmental quality and ensure food safety and security.
14.3.3 Soil Salinization
Soil salinization is a serious threat to the ecosystem services provided by the soil resource in regard to food and fiber production in many parts of North America. The movement and accumulation of salts that cause saline conditions in the soil are affected by the soil water balance. Processes such as climate shifts, improper irrigation and drainage, farming and management practices affect this balance. Soil salinity is a dynamic soil condition and can spread or become more severe in areas that are already saline, especially if the land is not managed properly.
These resource concerns are especially prevalent in western portions of the US (Figure 14.3) (Soil Survey Staff, 2014). Similar threats to food and fiber production are also associated with sodic conditions in the soil. In the US, saline soils occupy approximately 2.2 Mha of cropland and another 31 Mha are at risk of becoming saline (USDA, 2011).
In Canada, the Risk of Soil Salinization (RSS) Indicator has been developed as part of the Agri-Environmental Indicators program to assess the state and trend of the risk of dryland soil salinization on the Canadian Prairies as a result of changing land use and management practices. Two of the primary conditions required for dryland salinization—water deficits and an inherent salt content in the soil and/or ground water—occur to a significant extent only in the Prairie region of Canada. The risk of salinization on other agricultural lands in Canada is negligible. The risk of soil sodicity is not assessed as part of this index and is not believed to be a major risk in western Canada.The RSS is derived by calculating a unit-less Salinity Risk Index (SRI) which considers a combination of factors that control or influence the salinization process (Wiebe et al., 2010).
In terms of the state of soil salinity in Canada, approximately 1 M ha of surface soils on the Prairies is affected by moderate to severe soil salinity (Wiebe et al., 2006). In 2011, 85% of the land area in the agricultural region of the Canadian Prairies was rated as having a very low risk of salinization (Figure 14.4).
From 1981 to 2011, the trend has been a 19% increase in the land area in the Very Low and Low risk classes. Over the same 30-year period, the land area in the Moderate, High, and Very High risk classes decreased from 15% to 8%. These improvements were largely attributed to the reduction in tillage summerfallow, mentioned above, and to a 4.8-Mha increase of permanent cover (a 14% increase from 1981 to 2011). A reduction in risk has been observed in all Prairie provinces. The greatest decline was recorded in Saskatchewan, where the area of summerfallow decreased by more than 5 million ha and the area of permanent cover increased by more than 3 million ha. Changes in land use and management practices have reduced the risk of salinization and indicate a trend towards improved soil health and agri-environmental sustainability.
Status of the World’s Soil Resources Report, Regional Assessments of Soil Changes | Chapters 9 - 16
222

Figure 14.3: Areas in U.S. threatened by salinization and sodification (from NRCS)
Status of the World’s Soil Resources Report, Regional Assessments of Soil Changes | Chapters 9 - 16
223

Figure 14.4: Risk of soil salinization in Canada 2011(from 4th Agri-Environmental Indicators report (Clearwater et al., 2015)).
14.3.4 Soil Sealing/Capping
The population of the North America is approximately 5% of the world population (340 millions) and it has been grown at a rate of 0.9%/year, during the last decade. In the United States, the loss of soil due to this threat is significant and has been steadily increasing since 1982, as documented by the USDA Natural Resources Conservation Service’s National Resources Inventory Program (NRI) (USDA, 2013). Between 1982 and 2007, it is estimated that 16.5 Mha of land were developed for urban or transportation uses. By 2007, the U.S. had an estimated total of 45 Mha of areas developed into urban uses. Of the newly developed land, 41% was previously forest land, 27% was cropland, 17% was pasture, and 13% was rangeland. In regard to land categories, 35% of the land in the U.S. that was developed into urban uses during the period of 1982 to 2007 was classified as prime farmland. Prime farmland is land that has the best combination of soil physical and chemical characteristics for producing food, feed, forage, fiber, and oilseed crops and has the soil quality, growing season, and moisture supply needed to economically produce sustained high yields of crops
Status of the World’s Soil Resources Report, Regional Assessments of Soil Changes | Chapters 9 - 16
224

when treated and managed at high levels. Prime farmland is also the most economically viable land to develop as it typically has the lowest degree of limitations for conversion into urban development. This increases the pressure even further on land with the best soil. Using the 2007 NRI information as a base, the trajectory of prime farmland (cropland portion) conversion and the loss of potential food production is immense over the next 25 years. With this rate of loss, the U.S. will lose the equivalent of 10M metric tons of corn in 2022 due to sealing/capping activities.
The drivers for soil sealing in Canada are very similar to those in the United States. The growth of metropolitan centers has been particularly rapid since the 1990s in areas surrounding Toronto, Kitchener-Waterloo, Ottawa, and Vancouver and, most recently, in areas surrounding urban centers in Saskatchewan and Alberta. Between 1996 and 2006, urban land increased by more than 10% nationally. It now totals nearly 0.13 Mha (Statistics Canada, 2009), or 0.25% of the total land area in Canada. Given land-cover data extracted from a suburban U.S. city (specifically, San Jose with 59% impervious surface by area [Xiao et al., 2013]) and the fact that suburbs now make up the majority of Canada’s metropolitan population (Gordon and Janzen, 2013), it is estimated that more than 1,300 km2 of soil was capped through urban expansion between the 1990s and 2000s. It is noteworthy that this expansion has occurred largely on highly productive soils (Francis et al., 2012; Hofmann et al., 2005). Major interregional highway construction and expansion (e.g., highway twinning) has also been ongoing, particularly in Ontario, British Columbia, and Alberta. Total road length (in two lane equivalents) in Canada increased by more than 17% between 1990 and 2009 (Transport Canada, 2012; United States Department of Transportation, 2014), and, assuming a conservative average road width of 10 m, roads now cover more than 10,000 km2. However, it is important to note that a portion of this impervious area is also included in the estimated urban area described above.
In the past few decades, areas used for agriculture and forest harvest have decreased (Natural Resources Canada (NRCAN), 2014; Francis et al., 2012; Hofmann et al., 2005). Thus, it is assumed that sealing as a result of new construction for agriculture service and forest industrial roads is relatively minor. However, the overall existing extent of unpaved roads in Canada that serve the needs of these industries is substantial.
In figure 14.5 are reported the data on Urban Area extensions and Urbanization Indexes for US A and Canada.
Status of the World’s Soil Resources Report, Regional Assessments of Soil Changes | Chapters 9 - 16
225

Figure 14.5: Urban Areas extension and Urbanization Indexes for the North American countries.
14.3.5 Soil Compaction
Soil compaction is an acknowledged threat to the ability of the soil resource to provide a wide range of essential ecosystem services, including food and fiber production and maintenance of good water quality. Compaction decreases the water infiltration capacity of the soil, increases runoff and erosion, reduces plant growth, and reduces the penetration, size, and distribution of roots. It restricts water and air movement in the soil. It also causes nutrient stresses and slow seedling emergence. Soils in North America that are most susceptible to the threat of compaction are located in managed agricultural and forested regions.
The most common cause of soil compaction (or the formation of hardpans) is agricultural traffic, including tractors, harvesting equipment, and implement wheels, on moist soils (soil moisture is at or above field capacity). Wheeled traffic compacts soil aggregates, in some cases destroying the aggregates completely, which results in a dense soil with few large pores and limited aeration. Compaction can reduce yields up to 50% in some areas, depending upon the depth of compaction and its severity (Wolkowski and Lowery, 2008).
The type and condition of a soil have an effect on the potential of compaction to occur. Soils lows in organic matter tend to be more susceptible to compaction because their ability to form strong aggregates is decreased. Soils high in clay content compact more easily because clay particles adhere to water, which makes it easier for them to move against each other. In the U.S., Ultisols in the Coastal Southeast USA Coastal Plains ecozone are especially susceptible to compaction due to their highly weathered state and low organic carbon levels (Simoes et al., 2009).
In Canada, there has not been a national-scale assessment of compaction since McBride et al. (2000). Generally, fine-textured soils in the Mixed Wood Plains ecozone under cropping systems with a high potential for soil structure degradation and compaction (e.g., those for the production of maize, soybeans, vegetable, and root crops) were judged to have the highest risk for compaction. In the period from 1981 to 1996, the area of fine-textured soils under high-risk cropping practices had grown substantially (e.g., as much as 61% in Ontario). This area expansion of potentially compaction-inducing cropping practices has continued to the present day. Agricultural soils in western Canada and the U.S. are generally believed to have a lower risk for soil compaction. The exception is irrigated soil
Status of the World’s Soil Resources Report, Regional Assessments of Soil Changes | Chapters 9 - 16
226

in this region, where the wetter soil conditions can contribute to higher compaction levels. As well, adoption of conservation tillage (which limits compaction) has also been lower on irrigated land.
Soil compaction also occurs in forestry operations throughout Canada and the U.S., especially where roads and landings have been constructed. Generally, finer-textured soils are at the greatest risk, but the amount of organic matter in coarser textured soils can form a strong negative relationship with the potential for compaction (Krzic et al., 2004). Compaction has been shown to reduce regeneration of species such as aspen (Populus tremuloides Michx.) and white spruce (Picea glauca [Moench] Voss) (Kabzems, 2012), but little is known about its general impact on soil functions.
14.3.6 Waterlogging and Wetlands
The threat of waterlogging to the sustainable use of soil resources is difficult to assess because waterlogging is not considered a threat in all cases. Wetland areas that are nearly or permanently waterlogged provide many positive benefits to the environment. Wetlands are some of the most biologically diverse habitats on earth and are of great benefit to many species of wildlife. They also act as a filter, trap sediments, improve water quality, are a carbon sink, and reduce peaks of floodwater runoff. Until 2014, the Wetland Reserve Program in the United States was a voluntary program offered to landowners to protect, restore, and enhance wetlands on their property. Nearly 1 Mha has been enrolled in this program (USDA, 2014).
Much of the drainage of wetlands in North America has been concentrated on freshwater mineral wetlands (Bridgham et al. 2006), which are wetlands dominated by Gleysolic soils rather than organic soils. Bridgham et al. (2006) estimate that both the US and Canada have experienced over 50% conversion of this class of wetlands (i.e., a reduction from 36 Mha to 16 Mha in Canada and from 76 Mha to 31 Mha in the US).
In North America, the primary driver of large-scale waterlogging on non-wetland soils is flooding due to dam construction for hydroelectric power, flood control, and mining activities (Maynard et al., 2014). This includes upstream flooding associated with dam construction and high spring water levels and downstream flooding associated with controlled releases during high-water periods and for hydroelectric power generation during the winter.
Another indirect driver is deforestation, which can reduce infiltration and/or evapotranspiration. It has been proposed that reduced evapotranspiration in northern Alberta contributes to a significant rise in the water table when deforestation is coupled with wet climatic periods (Carrera-Hernandez et al., 2011).
Concern about waterlogging has been growing due to the substantial increase in the frequency and severity of extreme precipitation events in recent years in some regions (Brimelow et al., 2014), even though this may not indicate an overall increase in mean annual precipitation for most regions. Waterlogging related to all of the above causes is exacerbated by increased precipitation.
14.4 Major Soil Threats Four threats to soil functions were selected as major threats and are covered in more detail in
this section. The main criteria for their selection was the area of land effected by these threats – all four of these threats operate in most agricultural (and many non-agricultural) landscapes, whereas the threats covered in section 2.2 tend to be more locally focused. Data on these four threats for Canada are covered in more detail in the following section, and this section focuses on North American-scale drivers and specific results for the United States of America.
Status of the World’s Soil Resources Report, Regional Assessments of Soil Changes | Chapters 9 - 16
227

14.4.1 Soil Erosion
Soil erosion in the United States and Canada accelerated after the arrival of European settlers, who cleared extensive areas for agriculture and subsequently plowed and overgrazed the land (Montgomery, 2008). Soils rapidly degraded and erosion increased as settlement spread from east to west. In the United States, erosion was greatest on the east coast in the early 1800s, in the mid-south during the early 1900s, and in the Great Plains during the “Dust Bowl” (1930s). Some badly degraded lands were abandoned and then reverted to secondary growth forests, a process that slowed erosion rates. Wind erosion was very significant in Prairie Canada during the 1930s. and soils that were badly degraded due to wind erosion were subsequently stabilized and converted to permanent pasture.
Agricultural mechanization, commercial nitrogen availability, and federal policies encouraging maximum crop production led to cash crop intensification throughout the middle of the 20th century in both the U.S. and Canada. Forage-based rotations were shortened or eliminated, field sizes were increased by the removal of hedgerows and fences, and tillage intensity remained high. As a result, the potential for soil erosion increased during this period. In the late 20th and early 21st centuries higher crop yields and improved herbicide technology supporting the adoption of conservation tillage helped reduce the potential for water and wind erosion. Federal farm programs in the late 20th and early 21st centuries had both favorable and unfavorable impacts on soil erosion rates. In Canada, the most significant cropping change was the major reduction in summerfallow (i.e., the practice of leaving land fallow for one growing season and suppressing weed growth by one or more tillage events) in the two Prairie ecoregions in Canada, which substantially reduced the risk of wind erosion.
In the United States, the National Resources Inventory (NRI) has reported statistically robust estimates of water (sheet and rill) erosion and wind erosion on privately owned cropland, since 1982 at 5-year intervals (USDA, 2013), based on an expansive monitoring network and an assumed historic average climate for each location. The estimated decrease in sheet and rill erosion between 1982 and 2002 was 39%, and that between 1982 and 2010 was 41%. In the same periods, wind erosion decreased by 41% and 46%, respectively.
In 2010, the most intense sheet and rill erosion was in the Temperate Prairie and Mixed Wood Plains ecoregions of the Midwest U.S. and the adjacent area of the Southeastern USA Plains ecoregion and the Palouse (Cold Desert ecoregions in the state of Washington) (Figure 14.6). These areas and the West-Central Semi-Arid Prairies ecoregion also had the highest wind erosion rates.
If 2010 NRI estimates of sheet and rill erosion plus wind erosion are averaged across all U.S. cropland, the average annual rate is about 10 Mg ha-1, and 57% of this is due to sheet and rill erosion (USDA, 2013). Tolerable annual soil erosion rates ("T") used in the U.S. typically range from 2 to 11 Mg ha-1, depending upon the soil type. The criteria used to calculate T have been widely criticized (Johnson, 1987) and the overall average soil loss rate is one order of magnitude greater than estimated soil renewal rates, which are less than 1 Mg ha-1 per year (Alexander, 1988; Montgomery, 2007). In addition, erosion varies spatially and may greatly exceed T, at any specific NRI point, due to the soil, slope, management, and climate at that location.
Status of the World’s Soil Resources Report, Regional Assessments of Soil Changes | Chapters 9 - 16
228

Figure 14.6: Estimated sheet and rill erosion on cropland in the contiguous U.S. (from 2010 National Resources Inventory (USDA, 2013)).
The state of soil erosion in Canada and the drivers of change are covered in more detail in section 4 of this chapter. Soil erosion on undisturbed forested land in Canada is generally believed to be low (Maynard et al., 2014) and no national estimates exist for rates of erosion on disturbed forest land.
Not all forms of erosion are considered in the national estimates and this leads to considerable overall uncertainty in estimates. In the United States, the NRI erosion assessment does not include ephemeral gully or tillage erosion. Tillage erosion is within-field soil redistribution by tillage implements and has been extensively documented in both the US and Canada. Both of these processes may result in degradation rates comparable to those from wind and water erosion. The best estimate of soil erosion rates must include estimates of these processes. When included, average U.S. cropland soil erosion rates exceed published soil development rates by more than one order of magnitude. In the projected future, an increased frequency of extreme rainfall events due to climate change will likely increase the water soil erosion threat in many parts of the U.S. and Canada.
In Canada, the national Agri-Environmental Indicators program does include an assessment of tillage erosion, which is known to be of equal or greater significance than wind and water erosion on some landscapes. Gully erosion is not included in the Canadian monitoring system, but its incidence in Canada is believed to be limited. Although accelerated erosion associated with forest harvest is a concern, there are no recent national-level surveys of its incidence in Canada.
14.4.2 Nutrient Imbalance
Many regions of North America have experienced and continue to experience nutrient applications in excess of plant requirements. These surpluses lead to elevated levels of N and P in
Status of the World’s Soil Resources Report, Regional Assessments of Soil Changes | Chapters 9 - 16
229

soils, which cause a range of environmental problems and are a source of considerable societal concern throughout North America.
The greatest issue with nutrient imbalance in North America is the impact of elevated N and P levels in soil from past and present agricultural activities on water quality. The linkage of elevated soil N and P levels to water quality problems ranges from algal blooms due to eutrophication in Lake Winnipeg in Manitoba (Schindler et al., 2012), at the northern edge of the agricultural zone, to the seasonal hypoxia in the shallow coastal waters of the Louisiana shelf in the northern Gulf of Mexico, at the southern end of the agricultural zone (Alexander et al., 2008).
Estimates on excess nutrient levels presented by Foley et al. (2010, Supplementary Information Maps S6e and S6f) show that excess application of N continues in may regions of North America whereas little excess application of P occurs. Excess N application of between 60 to 100 kg ha-1 occurs in much of the Temperate Prairie and Mixed Wood Plains ecoregions in both the USA and Canada, throughout the Mississippi River valley, and in pockets in the Southeast USA Coastal Plains ecoregion. Hence over-application of N is an on-going issue whereas elevated P levels may be largely due to historical over-application.
The linkage between agricultural practices and N and P loads in waterways has been shown by many studies. For example, recent studies on the Missouri River (Brown et al., 2011) and the entire Mississippi River basin (Alexander et al., 2008) using the SPARROW (Spatially Referenced Regressions On Watershed Attributes) model by U.S. Geological Survey researchers found that the majority of both total N and total P in these waterways is from agricultural land. Specifically, 52% of total N reaching the Gulf of Mexico was from maize-and soybean-producing land with a further 14% from all other crops in the basin and 37% of total P was from rangeland/pasture land with a further 25% from maize- and soybean-producing land. Considerable regional variations occur. For example, in the western sections of the Missouri River basin where cattle grazing is the dominant land use, as much as 34% of total N was from manure whereas in the Mississippi River basin as a whole, only 5% of total N was from rangeland and pasture land.
The relationship between soil properties, management, and particular N and P fractions is complex (Sharpley and Wang, 2014; Harmel et al., 2006). Harmel et al. (2006) examined the relationship between soil and site attributes and N and P fractions in nutrient loads from watersheds in 15 states and 2 provinces. Particulate N and P loss contributed, on average, three times as much as dissolved forms to loads, indicating the overriding effect of soil erosion and transport on N and P loads. Median particulate N loads were greater in areas of conventional tillage (which experience higher erosion rates on average) and lower in areas of conservation tillage and no-till land, although no differences were observed for particulate P. There was a weak relationship between soil test P and all forms of P load, again indicating the importance of existing or legacy soil P content. Dissolved N and P loads were highest in areas of no-till land. The buildup of P at the soil surface in no-till systems was also implicated in the increase of dissolved P load in the Maumee River system (which drains into Lake Erie) since 1995, although the response of this system to management changes was very complex (Sharpley and Wang, 2014).
Excess soil nitrogen can also leach from the soil as nitrate. This threat is most severe in situations where surface aquifers are used as potable water sources in humid or sub-humid climates (net annual recharge) with coarse-textured soils utilized for intensive agricultural production.
Status of the World’s Soil Resources Report, Regional Assessments of Soil Changes | Chapters 9 - 16
230

Examples in Canada include Prince Edward Island, the Abbotsford aquifer, BC and Kings County, Nova Scotia. The indicator of risk of water contamination by nitrogen (IROWC-N) in the Canadian Agri-Environmental Indicators have doubled from ~5 mg N L-1 in 1981 to a value approaching the Canadian drinking water guideline for nitrate (10 mg N L-1) in 2006 in the Atlantic Highlands and the Canadian portions of the Mixed Wood Highlands (AAFC, 2013).
Country-specific information for nutrient imbalance in Canada is given in section 14.5 of this report.
N levels in excess of plant requirements in soils are also linked to other environmental issues, especially the enhanced release of the potent greenhouse gas, N2O, from soils. In both Canada and the U.S., agriculture accounts for 6 to 7% of total GHG emissions (EPA, 2014; Environment Canada, 2013), and N2O emissions from agricultural soils account for 75% of the agricultural total in the U.S. and 65% in Canada. Highest N2O emissions occur under anaerobic conditions and hence are intimately linked to changes in waterlogging in agricultural landscapes. Health concerns are also linked to forms of N in groundwater and fertilizer application, although the direct link to human health can be difficult to ascertain (Manassaram et al., 2006).
14.4.3 Soil Organic Carbon Change
Assessment of soil organic carbon (SOC) in the U.S. and Canada currently includes a number of approaches aimed at either directly measuring or modeling SOC change over time. Both countries utilize national-scale modeling of SOC change for GHG emissions inventories and reporting.
Models of SOC changes currently show increases in the US. These increases in SOC are primarily due to less intensive agriculture (McLauchlan et al., 2006), and reducing tillage intensity (West et al., 2008). Models generally predict that converting areas from native vegetation (i.e. prairies and native forest) to crop and forest plantations result in decreased SOM; however, in some cases, high-productivity crops and SOC-conserving management may enhance SOC. For instance, Ogle et al. (2010) estimated that SOC in US croplands increased by 14.6 and 17.5 Tg y-1 during 1990-1995 and 1995-2000, respectively, primarily due to reductions in tillage intensity.
For agricultural soils in Canada, national-level modeling indicates that improvements in farm management have resulted in a dramatic shift from stable SOC levels (i.e., additions are equal to losses) during the mid-1980s, to a situation where the majority of cropland had increasing SOC levels in the mid-1990s through to 2011 (discussed in more detail in section 4 of this chapter).
There is currently high uncertainty associated with SOC models (Ogle et al., 2010) such as CENTURY (National Resource Ecology Laboratory, 2007), the SOC model most commonly used in the U.S. and Canada to predict SOC change. Improving model parameterization and adding additional SOC measurements over time could help reduce uncertainty. Such information could be used to better calibrate, estimate and potentially reduce model uncertainty as well as directly track SOC change (Jandl et al., 2014). The national-level modeling is also limited by the lack of data on SOC stocks and change deeper in the soil profile. Models and researchers generally consider subsurface SOC, as a relatively stable pool. Little direct evidence has been provided, however, that SOC stabilized under previous conditions will remain stable with changing conditions, such as with climate change, and some studies have show that previously stable SOC may be rapidly converted to CO2 (Fontaine et al., 2007; Fang et al., 2005).
Status of the World’s Soil Resources Report, Regional Assessments of Soil Changes | Chapters 9 - 16
231

There are currently two major US-wide efforts that sample soil over time, the Forest Inventory and Analysis (FIA; Gillespie, 1999) of US forests, and the Rapid C assessment (USDA, 2013b), which includes all vegetated areas. The FIA samples soil to a maximum depth of 20 cm, so its utility in monitoring whole-profile SOC over time is limited (Waltman et al., 2010; Jandl et al., 2014). The Rapid C assessment (USDA, 2013b) samples soil profiles to 100 cm depth. It is currently uncertain what depth is required to truly understand SOC and potential changes in SOC (Harrison et al., 2011). Some studies have shown that results of monitoring SOC change vs. land management depend more on maximum soil sampling depth than on treatments (Liebig et al., 2005; Khan et al., 2007; Harrison et al., 2011).
Field data on losses of SOC in Canadian soils after conversion from native land to cropland, and for different tillage, crop rotation and fertilizer management practices were compiled from a total of 62 studies by VandenBygart et al. (2003). They demonstrated that 24 ± 6% of the SOC was lost after native land was converted to agricultural land. In the past two decades, no-till (NT) increased the storage of SOC in Mollisols (Chernozems) of the two Prairie ecoregions by 2.9 ± 1.3 Mg ha–1; however, in the moister soils of central and eastern Canada, conversion to NT did not increase SOC. More recent studies using meta-analyses (Congreves et al., 2014) of long-term agricultural management effects on SOC in Ontario indicated trends towards higher SOC with NT than under CT practises, Crop rotation lead to higher SOC than when continuous maize was grown, and the application of N fertilizer led to an increase in compared to when no N fertilizer was applied.
Carbon change in managed forests (232 Mha) in Canada is assessed as part of the National Inventory, primarily using the CBM-CFS model (Kurz et al., 2009). Carbon emissions from the dead organic matter and soil pools are lumped together, and showed a small increase from 2000-2007 due to the short-term effect of past disturbances, especially insect infestation; the values decreased from 2008 until 2012 and have returned to long-term levels. Freshwater mineral wetland soils in the Prairie ecoregions are also important carbon reservoirs, and approximately 70% of these were impacted by agricultural activities in 2005 (Bartzen et al., 2010); however there is no regional estimate of associated carbon change.
Permafrost soils are classified as Cryosols in Canada and cover 2.5 million km2; they are estimated to contain 39% of all organic carbon in Canadian soils (Tarnocai and Bockheim, 2011). The greatest driver of change in these soils is climate change. The IPCC 5th Assessment Report (Clais et al., 2013) states that there is high confidence that reductions in permafrost due to warming will cause thawing of some currently frozen carbon, but there is low confidence on the magnitude of CO2 and CH4 emissions to the atmosphere.
14.4.4 Soil Biodiversity
Soil biodiversity refers to the myriad of organisms living in the soil, ranging from the smallest microorganisms (e.g., bacteria, archaea, and fungi) to soil invertebrates. Up until the advent of molecular biology and its use in soil science in the 1990s, the assessment of soil biodiversity was done using morphological methods. Methods to study soil biodiversity are improving constantly with the application of sequencing technologies and complement the morphological assessments.
As a result of our paucity of knowledge, assessing threats to soil biodiversity is very difficult. There is no reference baseline data for these organisms, nor do scientists have the ability to estimate the true numbers of soil organisms, particularly microorganisms. Many organisms have not been described and overall we need a better understanding of the biogeography of soil organisms in North America (Nunez and Dickie, 2014). Advances, however, have been made. For example, Taylor et al.
Status of the World’s Soil Resources Report, Regional Assessments of Soil Changes | Chapters 9 - 16
232

(2014) completed a comprehensive survey of fungi in black spruce (Picea mariana) sites in Alaska and recorded 1002 taxa in this system. The reported a fungus:plant ratio of 17:1.
However, as soil organisms are so intricately tied to aboveground plant species, threats to plant species, such as habitat loss, are also liable to affect soil organisms (Wardle et al., 2004). Evidence of this exists. For example, it has been shown that removal of logging residues from harvested forest sites is one of the major threats to forest fungi and insects (Berch et al., 2011). Similarly, invasive plant species and their mutualistic microbes pose a threat to native mutualist communities (Nunez and Dickie, 2014). Invasive alien species are entering North America with increasing frequency due to the growing volume of trade, the broadening of trading partners, and the increases in travel and tourism that accompany globalization (Environment Canada, 2013).
Regional or national-level programs that monitor soil biodiversity are lacking in North America. In Europe, Gardi et al. (2013) used modeling of data from 20 experts to demonstrate that the main pressures on soil biodiversity were intensive land exploitation (such as agriculture intensification using tillage, crop rotations, and additions of pesticides and herbicides) and changes in land use (such as the reduction in forests that have the highest soil biodiversity and the increase in soil sealing) combined with decreasing amounts of soil organic matter and increasing numbers of invasive species.
These modeling results are increasingly being supported by field studies using emerging identification and community analysis techniques. Crowther et al. (2014) assessed deforestation effects on soil biodiversity at eleven sites in the U.S. and found that forest removal was generally associated with reductions in fungal and bacterial microbial biomass and increases in diversity of taxa. The magnitude of differences due to deforestation varied drastically between sites and was best explained by differences in soil texture: the effects were greatest in coarse-textured soils and least in fine-textured soils. Crowther et al. (2014) suggest that the relationship between soil biodiversity and soil texture offers the potential for mapping regional and national patterns of the susceptibility of total (fungal, bacterial, and archaeal) soil biomass to changes in vegetation (see Figure 4 in Crowther et al., 2014). Studies based on a meta-analysis of crop rotation found that adding one or more crops in rotation increased microbial biomass carbon by 20.7% and microbial biomass nitrogen by 26.1%, indicating the sensitivity of soil microbes to the quantity and biochemistry of crop inputs (McDaniel et al., 2014). Other studies, such as those by Wagg et al. (2014), are explicitly examining the relationship between decreasing biodiversity in the soil community and changes in ecosystem functions, such as carbon sequestration and nitrogen and phosphorus leaching.
In addition, climate change is considered a threat to soil biodiversity. Unfortunately, there is a scarcity of data on this issue. To determine this threat we need to predict soil biodiversity patterns, which is not possible with our current knowledge. However, there are indications that soil biodiversity will be reduced by climate change. Studies in the Canadian Arctic show that extreme ecosystems contain many unique organisms that may become extinct with permafrost melting (Vincent et al., 2009). Wildfire events, which are another threat to soil biodiversity, are also predicted to increase because of climate change (Krawchuk et al., 2009).
At present, no national or regional assessment on loss of biodiversity can be made for North America, but there are signs that such an assessment may be possible in the future. The Global Soil Biodiversity Initiative was launched in 2011 and provides a welcome platform for the coordination of research in this area (GSBI, 2014).
Status of the World’s Soil Resources Report, Regional Assessments of Soil Changes | Chapters 9 - 16
233

14.5 Case Study: Canada As discussed in the Introduction, there are no existing regional maps for threats to soil
functions for North America. In this section the maps produced under the Canadian Agri-Environmental Indicators program (Clearwater et al., 2015) for wind and water erosion, SOC change, and nutrient imbalance (residual soil N and P-source risk classes) are presented so that the linkage between drivers and threats to soil functions can be illustrated. The maps focus on agricultural impacts on soil functions and no comparable products exist for other soil threats.
The major changes to drivers in Canada have been discussed in detail in section 14.3 and show distinct differences across the main ecoregions that experience concentrated human impact in Canada. The main drivers can be summarized as: 1) intensification of agriculture (i.e., reduced pasture area, increased area of maize and soybean production, higher fertilizer inputs) in the Mixed Wood Plains ecoregion in southern Ontario, Quebec, and the agricultural areas in eastern Canada (i.e., in New Brunswick, Nova Scotia, and Prince Edward Island), 2) significant reductions in the area of tillage summerfallow in the Temperate Plains and West-Central Semi-Arid ecoregions, and 3) wide-spread adoption of conservation tillage practices in most cropping systems in Canada.
14.5.1 Water and Wind Erosion
In Canada, the Soil Erosion Risk Indicator was used to assess the risk of soil erosion from the combined effects of wind, water, and tillage on cultivated agricultural lands as part of the Agri-Environmental Indicators program (Figure 14.6, 14.7). This indicator and its component indicators for wind, water, and tillage erosion reflect the characteristics of the climate, soil, and topography and correspond to changes in farming practices over the 30-year period from 1981 to 2011. Wind and water erosion are the primary focus of this summary. For details on calculation of the indicators, see Li et al. (2008), McConkey et al. (2008), and Huang and Lobb (2013).
The erosion indicator calculation estimates the rate of soil loss. These values are reported in five classes. Areas in the very low risk class are considered capable of sustaining long-term crop production and maintaining agri-environmental health under current conditions. The other four classes represent the risk of unsustainable conditions that call for soil conservation practices to support crop production over the long term and to reduce risk to soil quality.
The risk of soil erosion on Canadian cropland has steadily declined between 1981 and 2011. The majority of this change occurred between 1991 and 2006. In 2011, 61% of cropland area was in the very low risk class overall. This is a considerable improvement over 1981 when only 29% was in this risk class. This decrease in water and wind erosion risk was most pronounced in the Temperate Prairie and West-Central Semi-Arid ecoregions in Alberta and Saskatchewan (Figure 14.7, 14.8). Much of the improvement in erosion risk is from reductions due to the reduction in tillage summerfallow. A second driver is the increased adoption of direct-seeding and conservation tillage, which is largely responsible for the decrease in tillage intensity and soil erosion.
Of the cropping systems across Canada, the risk of soil erosion by water is greatest under potato production in central and eastern Canada. In these areas there is intensive tillage and little opportunity to reduce the intensity through conservation tillage practices (Figure 14.7). The cropping
Status of the World’s Soil Resources Report, Regional Assessments of Soil Changes | Chapters 9 - 16
234

system with the next greatest risk of erosion is the production of maize and soybeans
Figure 14.7: Risk of water erosion in Canada 2011 (from 4th Agri-Environmental Indicators report (Clearwater et al., 2015)).
Status of the World’s Soil Resources Report, Regional Assessments of Soil Changes | Chapters 9 - 16
235

Figure 14.8: Risk of wind erosion in Canada 2011 (from 4th Agri-Environmental Indicators report (Clearwater et al., 2015)).
under conventional tillage; however, there is a significant opportunity to reduce this erosion risk with conservation tillage. Of all soil landscapes across Canada, the risk of soil erosion by water is greatest on those with maximum slopes of 10% or more, especially those located in central and eastern Canada where the risk of water erosion is inherently high due to climate (Figure 14.7).
14.5.2 Soil Organic Carbon Change
The SOC change indicator used in the national Agri-Environmental Indicators program assesses how organic C levels are changing over time in Canadian agricultural soils. The indicator is based on the method used for the Canadian National Inventory Report (Environment Canada, 2014). The indicator uses the Century model (NREL, 2007) to predict the rate of change of organic C content in Canada’s agricultural soils, due to the effects of land management change since 1951. These include changes in tillage, summerfallow frequency, and change between annual crops and perennial hay or pasture. It includes land-use changes such as clearing forests for agriculture or breaking native grass for cropland, but does not include the loss of C from the above-ground forest biomass.
Status of the World’s Soil Resources Report, Regional Assessments of Soil Changes | Chapters 9 - 16
236

Figure 14.9: Soil organic carbon change in Canada 2011 (from 4th Agri-Environmental Indicators report (Clearwater et al., 2015)).
No changes in SOC were assumed if there were no indicated changes in land use or land management. The SOC change indicator does not consider soil erosion.
The SOC change indicator results are presented (Figure 14.9) as the percentage of total cropland that falls into each of five SOC change classes expressed in kilograms per hectare per year (kg ha-1 yr-1). Negative values represent a loss of SOC from the soil and positive values represent a gain of SOC.
For the Boreal Plains ecoregions from Ontario eastward, there was an overall loss of SOC from 1981 to 2011 due to the reduction in the area of hayland and pasture and the corresponding increase in the area of annual crops (Figure 14.9). This shift in land use reflects a reduction in the demand for feed associated with the declining cattle populations in those provinces. The losses in Ontario and Quebec have been offset to a limited degree as a result of the adoption of conservation tillage but conservation tillage has not been implemented to the same extent in provinces in eastern Canada due to their cooler and wetter climatic conditions.
Status of the World’s Soil Resources Report, Regional Assessments of Soil Changes | Chapters 9 - 16
237

The two agricultural ecoregions in the Prairie Provinces have seen major increases in SOC over time due to reductions in tillage intensity and summerfallow. These changes are responsible for the net gain in SOC in Canada discussed in section 3 of this report.
14.5.4 Nutrient Imbalance
The assessment of nutrient imbalance in the Agri-Environmental Indicators program focuses on N and P, and assesses both the N and P status of soils and the risk to water quality associated with the soil stores. The risk to water quality involves coupling hydrological and climate data with the land surface information for each region. This section focuses on the N and P status of soils.
The residual soil nitrogen (RSN) indicator used in the National Agri-Environmental Indicators program provides an estimate of the amount of inorganic N that is left in the soil at the end of the growing season which may be susceptible to loss (Drury et al., 2007, 2010). The RSN indicator is estimated as the yearly difference between the total N input to agricultural soils and the output in harvested crops and gaseous losses including ammonia, nitrous oxide and dinitrogen. The major categories of N inputs into soil include fertilizer addition; manure application, biological nitrogen fixation by leguminous crops and free-living bacteria, and atmospheric wet and dry deposition. Nitrogen outputs include N removal in the harvested crop and gaseous N emissions via ammonia volatilization (NH3), nitrification (N2O) and denitrification (N2O, N2).
The RSN on Canadian agricultural land has steadily increased from a low of 9.4 kg N ha-1 in 1981 to a maximum of 25.3 kg N ha-1 in 2001 (a year where many regions experienced drought conditions and were unable to use the applied N) and is at 23.6 kg N ha-1 in 2011, the latest census year. On a national basis, N inputs have almost doubled over the 30 years from 44.4 to 80.8 kg N ha-1 whereas N outputs have only increased by 63% from 35 kg N ha-1 in 1981 to 57.2 kg N ha-1 in 2011.
The RSN map (Figure 14.10) for Canadian farmland in 2011 generally shows that there are high or very high residual N contents in farmland in many areas across Canada. Considerable change has occurred since 1981; for example, the Temperate Prairies in Manitoba was primarily in the very low and low risk classes in 1981 whereas the great majority of the province is in a very high risk class in 2011 (Figure 4.4). The Mixed Wood Plains in central and eastern Canada are predominately in the very high risk group; this is again a considerable increase since 1981.
Changes to management practices are required especially in the more humid regions in the Canada (especially Ontario, Quebec and eastern Canada) to reduce N losses from soils, to increase fertilizer use efficiency and to better synchronize N application with crop N demand. Further, the use of cover crops especially in years with reduced yields may help to reduce N losses from soil.
The IROWC-P Indicator was developed to assess the status and trends over time for the risk of surface water contamination by P from Canadian agricultural land and is reported for agricultural watersheds (van Bochove et al. 2010). The initial stage in calculating IROWC-P involves the estimation of the annual amount of dissolved P that may potentially be released from agricultural soils (P source). P source is estimated as a function of cumulative P additions and removals (P-balance) over a 35-year period up to 2011 and the resulting degree of soil P saturation.
Status of the World’s Soil Resources Report, Regional Assessments of Soil Changes | Chapters 9 - 16
238

There has generally been an increasing trend in the P-source levels in the surface of agricultural soils in Canada since 1976 as intensified agricultural practices have resulted in the application of
Figure 14.10: Residual soil N in Canada 2011 (from 4th Agri-Environmental Indicators report (Clearwater et al., 2015)).
P in excess of crop uptake (also called positive annual P balance) and have therefore increased soil P saturation. In 2011, very high concentrations of P (more than 4 mg of P per kg, or >4 mg P kg-1) at risk for release by storm events were located in regions where the agricultural production has been historically intensive and where soils have reached high P saturation values. High risk of water- contamination by P occurs around Abbotsford, British Columbia in the Marine West Coast Forest ecoregions and in the Temperate Prairies around Lethbridge, Alberta and portions of southern Saskatchewan and Manitoba (Figure 14.11). Intensive livestock operations near Abbotsford and Lethbridge are major local sources of high P loadings. The Mixed Wood Shield ecoregion of central Ontario, and Mixed Wood Plains ecoregion in Quebec, New Brunswick, and Prince Edward Island are also dominated by very high or high P source risk.
Implications of Soil Threats for Soil Functions
Status of the World’s Soil Resources Report, Regional Assessments of Soil Changes | Chapters 9 - 16
239
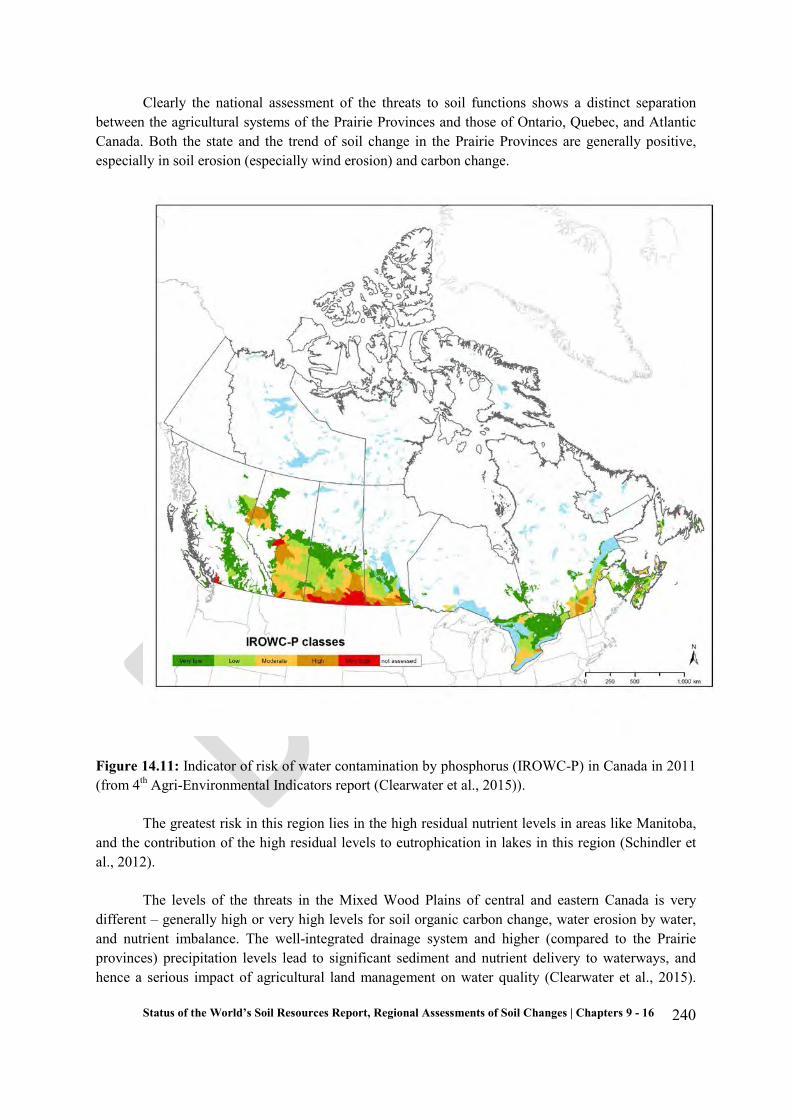
Clearly the national assessment of the threats to soil functions shows a distinct separation between the agricultural systems of the Prairie Provinces and those of Ontario, Quebec, and Atlantic Canada. Both the state and the trend of soil change in the Prairie Provinces are generally positive, especially in soil erosion (especially wind erosion) and carbon change.
Figure 14.11: Indicator of risk of water contamination by phosphorus (IROWC-P) in Canada in 2011 (from 4th Agri-Environmental Indicators report (Clearwater et al., 2015)).
The greatest risk in this region lies in the high residual nutrient levels in areas like Manitoba, and the contribution of the high residual levels to eutrophication in lakes in this region (Schindler et al., 2012).
The levels of the threats in the Mixed Wood Plains of central and eastern Canada is very different – generally high or very high levels for soil organic carbon change, water erosion by water, and nutrient imbalance. The well-integrated drainage system and higher (compared to the Prairie provinces) precipitation levels lead to significant sediment and nutrient delivery to waterways, and hence a serious impact of agricultural land management on water quality (Clearwater et al., 2015).
Status of the World’s Soil Resources Report, Regional Assessments of Soil Changes | Chapters 9 - 16
240

The combined effects of soil organic carbon loss and water erosion presumably also reduce services and products delivered by the soil, but these have been poorly documented in this region.
14.6 Conclusions and Recommendations Overall there has been significant progress made in reducing threats to soil functions in North
America. Threats from acidification and contamination have been reduced due to the imposition of a stronger regulatory framework, whereas the greatest change in cropping practices, reduced tillage, has largely come about through adoption by individual producers supported by government and private sector extension agents.
Major areas of concern remain however. Erosion rates are still above what are believed to be tolerable levels in the Temperate Prairies ecoregion of the U.S. and throughout the Mixed Wood Plains ecoregion of Canada and the U.S. Transport of soil-derived N and P to waterways is a major problem, and excess application of N continues throughout much of the cropland in the U. S. and in central and eastern Canada.
Although a wide variety of best management practices for optimum nutrient application and erosion control have been developed and promoted, the problems of erosion and nutrient imbalance persist.
Salinization, contamination, and acidification affect smaller areas in North America, and in the case of the latter two threats the current regulatory framework limits the expansion of the affected area. Waterlogging is little studied in North America, and we recommend that future reports include assessments of loss of wetlands as an important metric for sustainable management in this and other regions.
The loss of agricultural land to soil sealing is not perceived as a major issue in North America, and the paucity of data on this threat needs to be addressed for a more informed assessment to be made.
Changes in carbon stocks in North America have been extensively modeled as part of national reporting programs on greenhouse gas emissions, but only in a few landscapes are the models adequately supported by field observations of SOC change. The greatest uncertainty surrounding SOC change lies in the response of carbon in permafrost soils to climate change in northern Canada and Alaska and improved monitoring of this response is essential.
Like the SOC models, the agri-environmental indicators approach used in the Canadian case study allows estimation of the change in threats to soil function over time, but several criticisms can be made of the approach. First, there is a lack of ongoing monitoring of important soil physical, chemical, and biological properties at relevant scales through time and hence it is difficult to assess the performance of the models that underlie the indicators. Second, the interaction between indicators (for example, between erosion and carbon) is not considered, and this can bias the assessment of soil change. Third, it is difficult to assess the variability associated with modeled results and therefore to evaluate overall the confidence that can be placed in the results. Overall there is a need to revise the models in light of new scientific advances and to develop and refine scientifically credible programs to assess model performance.
The greatest uncertainty overall in our knowledge about the threats to soil functions lies in our limited understanding of the changes in soil biodiversity in the past and present and the implications of these changes for sustainable soil management.
Status of the World’s Soil Resources Report, Regional Assessments of Soil Changes | Chapters 9 - 16
241

Acknowledgements
Jenny Sutherland of NRCS in Lincoln, Nebraska very capably edited the material on the soil threats. Tim Martin of Agriculture and Agri-Food Canada provided access to the updated Canadian agri-environmental indicators material used in this chapter. The chapter was reviewed by D. Burton, F. Walley, C. Rice, E. Gregorich, C. van Kessel, T. Moore, and F. Larney and their suggestions for revisions are gratefully acknowledged.
Table 14.1 Summary of Soil Threats Status, trends and uncertainties in North America References
AAFC. 2013. Environmental Sustainability of Canadian Agriculture: Agri-Environmental Indicator Report Series – Report No. 3. Agriculture and Agri-Food Canada (available at: http://www.agr.gc.ca/eng/?id=1295901472640).
Very poor Poor Fair Good Very good In condition In trend
Soil erosion Reduced tillage and improved residue management have lowered erosion rates in regions such as the Great Plains in Canada but water erosion rates continue to be too high in the northern Mid-West of the U.S. and agricultural areas of central and Atlantic Canada. ↗ ● ●
Nutrient imbalance Excess application of fertilizers in many regions causes significant degradation of surface water quality and increased emissions of nitrous oxide to the atmosphere. Contamination of surface water is strongly linked to high erosion rates, and occurs in the same regions (northern mid-west U.S., Mississippi River Basin, and agricultural regions of central Canada).
↙ ◒ ◒
Organic carbon change The majority of cropland in the U.S. and Canada has shown improvements in SOC stores due to the wide-spread adoption of conservation agriculture (i.e., reduced tillage and improved reside management. There is a lack of field validation sites to support the national-level modeling results. Loss of SOC from northern and arctic soils due to climate change is a major concern.
↗ ◒ ◒
Loss of soil biodiversity The extent of loss of soil biodiversity due to human impact is largely unknown in North America. The effects of increasing agricultural chemical use, especially pesticides, use on biodiversity is a major public concern. Known level of carbon loss suggests similar loss in biodiversity .
~ ○ ○
Compaction Compaction continues to be a low-level issue, especially in regions with texture-contrast (Luvisol, Alfisol, Ultisol) soils. The regional-scale impact of compaction on plant growth is largely unknown.
− ◒ ◒
Sealing and capping Substantial expansion of housing and infrastructure in areas of high quality farmland continues in both countries but is (incorrectly) not perceived as a concern. Neither country has reliable data on sealing and capping.
↙ ○ ○
Salinization and sodification
Salinization is believed to be increasing in parts of the northern Great Plains in the U.S.A. but the risk of salinization is decreasing in western Canada. ~ ◒ ◒
Contamination Although many legacy contamination sites exist, improved regulatory systems in both countries has limited the creation of new areas of contamination. Large-scale land disturbance due to resource extraction activities continues to be a significant issue. ↗ ● ●
Soil acidification Trans-national environmental legislation has significantly reduced soil acidification in forested areas of eastern and central North America. Localized areas of acidicification in agricultural land managed through lime application. ↗ ● ●
Waterlogging Waterlogging is not believed to be a significant threat in North America. Localized flooding has occurred due to a wider amplitude of precipitation events in the past decade. Loss of wetlands is a more significant threat in North America. − ◒ ◒
Symbol Definition
− Stable~ Variable↙ Deteriorating↗ Improving○ Evidence and consensus is low◒ Limited evidence or limited consensus● Adequate high-quality evidence and high level of consensus
Condition and Trend Confidence
Threat to soil function Summary
Status of the World’s Soil Resources Report, Regional Assessments of Soil Changes | Chapters 9 - 16
242

Adams, M.B., Burger, J.A., Jenkins, A.B. & Zelazny, L.W. 2000. Impact of harvesting and atmospheric pollution on nutrient depletion of eastern US hardwood forests. For. Ecol. Manage., 138: 301–319.
Aherne, J. & Posch, M. 2013. Impacts of nitrogen and sulphur deposition on forest ecosystem services in Canada. Current Opinion in Environmental Sustainability, 5: 108–115.
Alexander, E. B. 1988. Rates of soil formation: Implications for soil-loss tolerance. Soil Sci., 145: 37-45.
Alexander, R.B., Smith, R.A., Schwarz, G.E., Boyer, E.W., Nolan, J.V. & Brakebill, J.W. 2008. Differences in phosphorus and nitrogen delivery to the Gulf of Mexico from the Mississippi River basin. Environmental Science and Technology, 42: 822–830.
Bartzen, B.A., Dufour, K. W., Clark, R. G. & Caswell, F. D. 2010. Trends in agricultural impact and recovery of wetlands in prairie Canada. Ecological Applications 20: 525-538.
Berch, S.M., Morris, D. & Malcolm, J. 2011. Intensive forest biomass harvesting and biodiversity in Canada: A summary of relevant issues. The For. Chron., 87: 478–487.
Brimelow, J., Stewart, R., Hanesiak, J., Kochtubajda, B., Szeto, K. & Bonsal, B. 2014. Characterization and assessment of the devastating natural hazards across the Canadian Prairie Provinces from 2009 to 2011. Nat. Hazards, 73: 761–785.
Brown, J. B., Sprague, L.A. & Dupree, J.A. 2011. Nutrient sources and transport in the Missouri River basin, with emphasis on the effects of irrigation and reservoirs. J.Amer. Water Res.Assoc., 47: 1030-1065.
Carrera-Hernandez, J.J., Mendoza, C.A., Devito, K.J., Petrone, R.M. & Smerdon, B.D. 2011. Effects of aspen harvesting on groundwater recharge and water table dynamics in a subhumid climate. Water Resour. Res., 47: 18.
Canadian Council of Ministers of the Environment. 2013. Progress report on the Canada-wide acid rain strategy for post-2000. Canadian Council of Ministers of the Environment. (available at http://www.ccme.ca/en/resources/air/acid_rain.html).
Chan, W. H., Tang, A. J. S., Chung, D. H. S. & Lusis, M. A. 1986. Concentration and deposition of trace metals in Ontario. Water Air Soil Pollut. 29: 373-389.
Clais, P. Sabine C., Bala, G., Bopp, L., Brovkin, V., Canadell, J., Chhabra, A., DeFries, R., Galloway, G., Helmann, M., Jones, C., Le Quere, C., Myeni, R.B., Piao, S. & Thornton, P. 2013. Carbon and other Biogeochemical Cycles. In Stocker T.F. et al., eds. Climate Change 2013: The Physical Science Basis. Contribution of Working Group I to the Fifth Assessment Report of the Intergovernmental Panel on Climate Change, pp. 465-570. Cambridge, UK and New York, NY, USA, Cambridge University Press.
Clearwater, R. L., Martin, T., Hoppe, T. & S. Kalff. 2015. Environmental sustainability of Canadian agriculture: Agri-environmental indicator report series – Report #4. Ottawa, ON: Agriculture and Agri-Food Canada. (DRAFT)
Commission for Environmental Cooperation. 1997. Ecological regions of North America. Toward a Common Perspective (report and maps available at http://www.cec.org/Page.asp?PageID=122&ContentID=1329).
Status of the World’s Soil Resources Report, Regional Assessments of Soil Changes | Chapters 9 - 16
243

Conservation Technology Information Center. 2014. Crop Residue Management Survey. (available at http://www.conservationinformation.org/CRM/.)
Congreves, K.A., Smith, J.M., Németh, D.D., Hooker, D.C. & Van Eerd L.L. 2014. Soil organic carbon and land use: Processes and potential in Ontario’s long-term agro-ecosystem research sites. Can. J. Soil Sci., 94(3): 317-336.
Cronan, C.S. & Grigal, D.F. 1995. Use of calcium/aluminum ratios as indicators of stress in forest ecosystems. Journal of Environmental Quality, 24: 209–226.
Crowther, T.W., Maynard, D.S., Leff, J.W., Oldfield, E.E., McCulley, R.L., Fierer, N. & Bradford, M.M. 2014. Predicting the responsiveness of soil biodiversity to deforestation: A cross-biome study. Global Change Biology, 20: 2983–2994.
Bridgham, S., Megonigal, J.P., Keller, J.K., Bliss, N.B., & Trettin, C. 2006. The carbon balance of North American wetlands. Wetlands 20: 605-615.
Doyle, P.J., Gutzman, D.W., Bird, G.A., Sheppard, M.I., Sheppard, S.C. & Hrebenyk, D. 2003. An ecological risk assessment of air emissions of trace metals from copper and zinc production facilities. Human Ecol. Risk Assess., 9(2): 607-636.
Driscoll, C.T., Lawerence, G.B., Bulger, A.J., Butler, T.J., Cronan, C.S., Eager, C., Lambert, K.F., Likens, G.E., Stoddard, J.L., & Weathers, K. C. 2001. Acidic deposition in the northeastern United States: Sources and inputs, ecosystem effects, and management strategies. Bioscience 51: 180-198.
Drury, C.F., Yang, J.Y., De Jong, R., Huffman, T., Yang, X.M. & Reid, K. 2010. Residual Soil Nitrogen. In Eilers, W., MacKay, R., Graham, L. and Lefebvre, A., eds. 2010. Environmental Sustainability of Canadian Agriculture: Agr-Environmental Indicator Report Series - Report # 3., pp. 74-80. Agriculture and Agri-Food Canada, Ottawa, Ont.
Drury, C.F., Yang, J.Y., De Jong, R., Yang, X.M., Huffman, E., Kirkwood, V. & Reid, K. 2007. Residual soil nitrogen indicator for Canada. Can. J. Soil Sci., 87: 166-177.
Environment Canada. 2010. Wetlands (available at: https://www.ec.gc.ca/eau-water/default.asp?lang=En&n=27147C37-1).
Environment Canada. 2013. National Inventory Report. 1990-2001. Part 3 (available at http://unfccc.int/national_reports/annex_i_ghg_inventories/national_inventories_submissions/items/7383.php) .
Environment Canada. 2013. Invasive Alien Species Program (available at http://www.ec.gc.ca/nature/default.asp?lang=En&n=B008265C-1#_Toc315269282.).
Environment Canada. 2014. National Inventory Report: Greenhouse Gas Sources and Sinks in Canada 1990-2012. Submission to the United Nations Framework Convention on Climate Change. (available at http://unfccc.int/national_reports/annex_i_ghg_inventories/national_inventories_submissions/items/8108.php).
EPA. 2014a. National Priorities List (NPL) (available at http://www.epa.gov/superfund/sites/npl.).
EPA. 2014b. Overview of Greenhouse Gas Emissions (available at http://epa.gov/climatechange/ghgemissions/gases/n2o.html.).
Status of the World’s Soil Resources Report, Regional Assessments of Soil Changes | Chapters 9 - 16
244

Fang, C., Smith, P., Moncrieff, J.B. & Smith, J.U. 2005. Similar response of labile and resistant SOM pools to changes in temperature. Nature, 433:57–59.
Fanning, D., Rabenhorst, M., Coppock, C., Daniels, W. & Orndorff, Z. 2004. Upland active acid sulfate soils from construction of new Stafford County, Virginia, USA, airport. Aust. J. Soil Res., 42: 527–536.
Fontaine, S., Barot, S., Barre, P., Bdioui, N., Mary, B. & Rumpel, C. 2007. Stability of organic carbon in deep soil layers controlled by fresh carbon supply. Nature, 450: 277–281.
Francis, C.A., Hansen, T.E., Fox, A.A., Hesje, P.J., Nelson, H.E., Lawseth, A.E. & English, A. 2012. Farmland conversion to non-agricultural uses in the US and Canada: Current impacts and concerns for the future. International Journal of Agricultural Sustainability, 10: 8–24.
Gardi, C., Jeffery, S. & Saltelli, A. 2013. An estimate of potential threats levels to soil biodiversity in EU. Glob. Ch. Biol., 19: 1538–1548.
Gillespie, A.J.R. 1999. Rationale for a National Annual Forest Inventory Program. J. Forestry, 97:16-20.
Global Soil Biodiversity Initiative. 2014. (available at http://www.globalsoilbiodiversity.org/)
Gordon, D.L.A. & Janzen, M. 2013. Suburban nation? Estimating the size of Canada’s suburban population. Journal of Architectural and Planning Research, 30: 197–220.
Grant, C. A., Buckley, W. T., Bailey, L. D. & Selles, F. 1998. Cadmium accumulation in crops. Can. J. Plant Sci., 78: 1–17.
Harmel, D., Potter, S., Casebolt, P., Reckhow, K., Green, C. & Haney, R. 2006. Compilation of measured nutrient load data for agricultural land uses in the United States. J. Amer. Water Res. Assoc., 42: 1163- 1178.
Harrison, R.B., P.W. Footen & B.D. Strahm. 2011. Deep soil horizons: Contribution and importance to soil C pools and in assessing whole-ecosystem response to management and global change. Forest Science 57:67-76.
Hawksworth, D.L. 2001. The magnitude of fungal diversity: The 1.5 million species estimate revisited. Mycol. Res., 105: 1422–1432.
Huang, Q. and Lobb, D.A. 2013. Uncertainty analysis for the soil erosion risk indicators. Technical supplement. Ottawa, ON, Canada: Agriculture and Agri-Food Canada.
Hofmann, N., Filoso, G. & Schofield, M. 2005. The loss of dependable agricultural land in Canada. Statistics Canada’s Rural and Small Town Canada Analysis Bulletin, Vol. 6, No. 1. ISBN 0-662-39096-2.
Jandl, R., Rodeghiero, M., Martinez, C., Cotrufo, M.F., Bampa, F., van Wesemael, B., Harrison, R.B., Guerrini, I.A., Richter, D.D., Rustad, L., Lorenz, K., Chabbi, A. & Miglietta, F. 2014. Current status, uncertainty and future needs in soil organic carbon monitoring. Science of the Total Environment 468:376-383.
Jeffery, S., Gardi, C., Jones, A., Montanarella, L., Marmo, L., Miko, L., Ritz, K., Peres, G., Römbke, J. & van der Putten, W.H. (eds.). 2010. European atlas of soil biodiversity. European Commission, Publications Office of the European Union, Luxembourg. 130 pp.
Status of the World’s Soil Resources Report, Regional Assessments of Soil Changes | Chapters 9 - 16
245

Johnson, C.E., Driscoll, C.T., Blum, J.D., Fahey, T.J., & Battles, J.J. 2014. Soil chemical dynamics after calcium silicate addition to a Northern Hardwood forest. Soil Sci. Soc. Am. J. 1458-1468.
Johnson, L. C. 1987. Soil loss tolerance: Fact or myth? J. Soil & Water Conservation, 42: 155 – 160.
Kabzems, R. 2012. Aspen and white spruce productivity is reduced by organic matter removal and soil compaction. The Forestry Chronicle, 88: 306–316.
Khan, S.A., Mulvaney, R.L., Ellsworth, T.R. & Boast, C.W. 2007. The myth of nitrogen fertilization for soil carbon sequestration. J. Environ. Qual. 36:1821–1832
Kittrick, J.A., Fanning, D.S. & Hossner, L.R. 1982. Acid sulfate weathering. Soil Sci. Soc. Am. Special Pub. 10, SSSA, Madison, WI, 234 pp.
Krawchuk, M.A., Moritz, M.A., Parisien, M-A., Van Dorn, J. & Hayhoe, K. 2009. Global pyrogeography: The current and future distribution of wildfire. PLOS One, 4: e5102.
Krzic, M., Bulmer, C.E., Teste, F., Dampier, L. & Rahman, S. 2004. Soil properties influencing compactability of forest soils in British Columbia. Canadian Journal of Soil Science, 84: 219–226.
Kurz, W.A., Dymond, C.C., White, T.M., Stinson, G., Shaw, C.H., Rampley, G.J., Smyth, C., Simpson, B.N., Neilson, E.T., & Trofymow, J.A. 2009. CBM-CFS3: A model of carbon-dynamics in forestry and landuse change implementing IPCC standards. Ecological Modelling 220: 480–504.
Li, S., McConkey, B.G., Black, M.W. & Lobb, D.A. 2008. Soil erosion risk indicators: Technical supplement. Ottawa, ON, Canada: Agriculture and Agri-Food Canada.
Liebig, M.S., Johnson, H.A., Hanson, J.D. & Frank, A.B. 2005. Soil carbon under switchgrass stands and cultivated cropland. Biomass Bioenergy 28:347–354.
Litman, T. 2011. Why and how to reduce the amount of land paved for roads and parking facilities. Environmental Practice, 13: 38–46.
Manassaram, D.M., Backer, L.C. & Moll, D.M. 2006. A review of nitrates in drinking water: Maternal exposure and adverse reproductive developmental outcomes. Environ. Health Persp., 114: 320-327.
Masek, J.G., Cohen, W.B., Leckie, D., Wulder, M.A., Vargas, R., de Jong, B., Healey, S., Law, B., Birdsey, R., Houghton, R.A, Mildrexler, D., Goward, S. & Smith, W.B. 2011. Recent rates of forest harvest and conversion in North America. J. Geophys. Res., 116: G00K03.
Maynard, D.G., Pare, D., Thiffault, E., Lafleur, B., Hogg, K.E. & Kishchuk, B. 2014. How do natural disturbances and human activities affect soils and tree nutrition and growth in the Canadian boreal forest? Environ. Rev., 22: 161–178.
McBride, R.A., Joosse, P.J. & Wall, G. 2000. Indicator: Risk of soil compaction. In T. McRae, C.A.S. Smith, and L.J. Gregorich, eds. Environmental Sustainability of Canadian Agriculture: Report of the Agri Environmental Indicator Project. A Summary, p. 16. Ottawa, Ontario, Agriculture and Agri-Food Canada.
McConkey, B.G., Li, S. & Black, M.W. 2008. Wind Erosion Risk Indicator (WindERI) Methodology in Soil erosion risk indicators: Technical supplement. Ottawa, ON, Canada: Agriculture and Agri- Food Canada.
Status of the World’s Soil Resources Report, Regional Assessments of Soil Changes | Chapters 9 - 16
246

McDaniel, M.D., Tiemann, L.K. & Grandy, A.S. 2014. Does agricultural crop diversity enhance soil microbial biomass and organic matter dynamics? A meta-analysis. Ecological Applications, 24: 560–570.
McLauchlan, K.K., Hobbie, S.E. & Post, W.M. 2006. Conversion from agriculture to grassland builds soil organic matter on decadal timescales. Ecological Applications, 16: 143–153.
Meinz, F.C. & Seip, H.M. 2004. Acid rain in Europe and the United States: An update. Environ. Sci and Policy, 7: 253–265.
Montgomery, D. 2007. Soil erosion and agricultural sustainability. Proceedings of the National Academy of Science, 104: 13268 – 13272.
Montgomery, D. R. 2008. Dirt. Univ. of Calif. Press, Berkeley, Calif.
Myrold, D.D., Zeglin, L.H., & Jansson, J.K. 2013. The potential of metagenomic approaches for understanding soil microbial processes. Soil Sci. Soc. Am. J., 78:3-10.
Natural Resources Canada. 2012. The State of Canada’s Forests: Annual Report 2012. (available at http://cfs.nrcan.gc.ca/pubwarehouse/pdfs/34055.pdf.)
Natural Resources Canada. 2014. Annual harvest of timber relative to the level of harvest deemed to be sustainable. Available at http://www.nrcan.gc.ca/forests/canada/sustainable-forest-management/criteria-indicators/.
National Resource Ecology Laboratory. 2007. Century (available at http://www.nrel.colostate.edu/projects/century/).
Nunez, M.A. & Dickie, I.A. 2014. Invasive belowground mutualists of woody plants. Biol. Invas., 16: 645–661.
Ogle, S.M., Breidt, F.J., Easter, M., Williams, S., Killian, K. & Paustian, K. 2010. Scale and uncertainty in modeled soil organic carbon stock changes for US croplands using a process-based model. Global Change Biology, 16:810-822.
Orndorff, Z.W. & Daniels, W.L. 2004. Evaluation of acid-producing sulfidic materials in Virginia highway corridors. Environ. Geol., 46: 209–216.
Ouimet, R., Arp, P.A., Watmough, S.A., Aherne, J. & DeMerchant, I. 2006. Determination and mapping of critical loads and exceedances for upland forests in eastern Canada. Water, Air and Soil Pollution, 172: 57–66.
Roesch, L.F., Fulthorpe, R.R., Riva, A., Casella, G., Hadwin, A.K.M., Kent, A.D., Daroub, S.H., Camargo, F.A.O., Farmerie, W.G. & Triplett, E.W. 2008. Pyrosequencing enumerates and contrasts soil microbial diversity. ISME J., 1: 283–290.
Schindler, D.W., Hecky, R.E. & McCullough, G.K. 2012. The rapid eutrophication of Lake Winnipeg: Greening under global change. J. Great Lakes Res., 38: 6-13.
Sharpley, A. & Wang, X. 2014. Managing agricultural phosphorus for water quality: Lessons from the ISA and China. J. Environ. Sci., 26: 1770-1782.
Sheppard, S.C. & Sanipelli, B. 2012. Trace elements in feed, manure and manured soils. J. Environ. Qual., 41: 1846-1856.
Sheppard, S.C., Grant, C.A. & Drury, C.F. 2009a. Trace elements in Ontario soils – mobility, concentration profiles, and evidence of non-point-source pollution. Can. J. Soil Sci., 89: 489-499.
Status of the World’s Soil Resources Report, Regional Assessments of Soil Changes | Chapters 9 - 16
247

Sheppard, S.C., Grant, C.A., Sheppard, M.I., de Jong, R. & Long, J. 2009b. Risk indicator for agricultural inputs of trace elements to Canadian soils. J. Environ. Qual., 38: 919-932.
Simoes, R.P., Raper, R.L., Arriaga, F.J., Balkcom, K.S. & Shaw, J.N. 2009. Using conservation systems to alleviate soil compaction in a southeastern United States Ultisol. Soil & Tillage Research, 104: 106–114.
Skousen, J., Simmons, J., McDonald, L. & Ziemkiewicz, P. 2002. Acid-base accounting to predict post-mining drainage quality on surface mines. J. Env. Qual., 31: 2034–2044.
Soil Landscapes of Canada Working Group. 2007. Soil Landscapes of Canada v3.1.1 Agriculture and Agri-Food Canada. (digital map and database at 1:1 million scale) (available at http://sis.agr.gc.ca/cansis/nsdb/slc/index.html).
Soil Survey Staff, 2014. U.S. General Soil Map (STATSGO2. Natural Resources Conservation Service, United States Department of Agriculture (available at http://websoilsurvey.nrcs.usda.gov/. ).
Statistics Canada. 2009. Total and urban land area, 1996, 2001 (modified) and 2006 (available at http://www.statcan.gc.ca/pub/92f0138m/2008001/t/4054949-eng.htm.)
Statistics Canada. 2013. Agricultural water use in Canada (available at http://www.statcan.gc.ca/pub/16-402-x/2011001/t018-eng.htm. )
Statistics Canada. 2015. Census of Agriculture, tillage practices used to prepare land for seeding. (available at http://www5.statcan.gc.ca/cansim/a26?lang=eng&retrLang=eng&id=0040205&pattern=0040200..0040242&tabMode=dataTable&srchLan=-1&p1=1&p2=50).
Sverdrup, H. & Warfvinge, P. 1993. The effects of soil acidification on the growth of trees, grass and herbs as expressed by the (Ca+Mg+K)/Al ratio. Reports in Ecology and Environmental Engineering 2:1993, Department of Chemical Engineering II, Lund University, Lund, Sweden.
Taylor, D.L., Hollingsworth, T.N., McFarland, J.W., Lennon, N.J., Nusbaum, C. & Ruess, R.W. 2014. A first comprehensive census of fungi in soil reveals both hyperdiversity and fine-scale niche partitioning. Ecol. Monographs, 84:3-20.
Tarnocai, C., & Bockheim, J. G. 2011. Cryosolic soils of Canada: Genesis, distribution, and classification. Canadian Journal of Soil Science 91: 749-762.
Transport Canada. 2012. Road transportation. (available at http://www.tc.gc.ca/eng/policy/anre-menu-3042.htm.)
United States Department of Transportation. 2014. Domestic physical system extent—Bureau of Transportation statistics (available at http://www.rita.dot.gov/bts/sites/rita.dot.gov.bts/files/publications/north_american_transportation_in_figures/html/table_11_1.html.).
United States Department of Agriculture. 2011. Resource Conservation Act (RCA) appraisal – Soil and Water Resources Conservation Act. Chapter 3. The State of the Land. Available at http://www.nrcs.usda.gov/wps/portal/nrcs/main/national/technical/nra/rca/.
United States Department of Agriculture. 2013. Summary Report: 2010 National Resources Inventory. Natural Resources Conservation Service, Washington D.C. and Center for Survey Statistics and Methodology, Iowa State University, Ames, Iowa (available at:
http://www.nrcs.usda.gov/Internet/FSE_DOCUMENTS/stelprdb1167354.pdf ). Status of the World’s Soil Resources Report, Regional Assessments of Soil Changes | Chapters 9 - 16
248

United States Department of Agriculture. 2013. Rapid carbon assessment (RaCA) methodology. Sampling and Initial Summary. USDA, May 24, 2013 (available at http://www.nrcs.usda.gov/wps/portal/nrcs/detail/soils/survey/?cid=nrcs142p2054164).
United States Department of Agriculture. 2014. Restoring America’s wetlands: A private lands conservation success story. National Resources Conservation Service. Available at http://www.nrcs.usda.gov/Internet/FSE_DOCUMENTS/stelprdb1045079.pdf.
United States Geological Survey. 2014. Irrigation water use (available at http://water.usgs.gov/edu/wuir.html.)
van Bochove, E., Thériault, G., Denault, J.-T., Dechmi, F., Rousseau, A. N. & Allaire , S. E. 2010. Risk of Water Contamination by Phosphorus (IROWC-P). In W. Eilers, R. MacKay, L. Graham, A. Lefebvre, eds. Environmental Sustainability of Canadian Agriculture, Agri-Environmental Indicator Report Series, Report #3. pp. 87—93. Ottawa, Canada, Agriculture and Agri-Food Canada.
VandenBygaart, A.J., Gregorich, E.G., & Angers, D.A. 2003. Influence of agricultural management on soil organic carbon: A compendium and assessment of Canadian studies. Can. J. Soil Sci., 83: 363-380.
Vincent, W.F., Whyte, L.G., Lovejoy, C., Greer, C.W., Laurion, I., Suttle, C.A., Corbeil, J. & Mueller, D.R. 2009. Arctic microbial ecosystems and impacts of extreme warming during the International Polar Year. Polar Sci., 3: 171–180.
Wagg, C., Bender, S.F., Widmer, F. & van der Heijden, M.G.A. 2014. Soil biodiversity and soil community composition determine ecosystem multifunctionality. Proceedings of the National Academy of Science, 111: 5266–5270.
Waltman, S.W., Olson, C., West, L., Moore, A., & Thompson, J. 2010. Preparing a soil organic carbon inventory for the United States using soil surveys and site measurements. Why carbon stocks at depth are important. IUSS World Congress of Soil Science, August 1–6, 2010.
Wardle, D., Klironomos, J.N., Setala, H., Putten, W.H. & Wall, D. 2004. Ecological linkages between aboveground and belowground biota. Science, 304: 1629–1633.
Watmough, S. A. & Hutchinson, T. C. 2004. The quantification and distribution of pollution Pb at a woodland in rural south central Ontario, Canada. Environ. Pollut,. 128: 419-428.
West, T.O., Brandt, C.C., Wilson, B.S., Hellwinckel, C.M., Tyler, D.D., Marland, G., De La Torre Ugarte, D.G. & Larson, J.A. 2008. Estimating regional changes in soil carbon with high spatial resolution. Soil Science Society of America Journal, 72: 285–294.
Whitfield, C.J., Aherne, J., Watmough, S.A. & McDonald, M. 2010. Estimating the sensitivity of forest soils to acid deposition in the Athabasca Oil Sands Region, Alberta, Canada. Journal of Limnology, 69(supp 1): 201–208.
Wiebe, B.H., Eilers, R.G. & Brierley, J.A. 2006. The presence and extent of moderate to severe soil salinity on the Canadian Prairies. In: Proceedings of the Manitoba Soil Science Society Annual Meetings, Winnipeg, MB, Canada.
Wiebe, B.H., Eilers, R.G., Eilers, W.D. & Brierley, J.A. 2007. Application of a risk indicator for assessing trends in dryland salinization risk on the Canadian Prairies. Can. J. Soil Sci.87: 213-224.
Status of the World’s Soil Resources Report, Regional Assessments of Soil Changes | Chapters 9 - 16
249

Wiebe, B.H., Eilers, W.D. & Brierley, J.A. 2010. Soil salinity. In Eilers, W., R. MacKay, L. Graham, and A. Lefebvre (eds.). Environmental sustainability of Canadian agriculture: Agri-environmental indicator report series – Report #3. pp. 66-71 Ottawa, Ontario, Agriculture and Agri-Food Canada.
Wolkowski, R. & Lowery B. 2008. Soil compaction: Causes, concerns and cures (available at http://www.soils.wisc.edu/extension/pubs/A3367.pdf.).
Xiao, Q., Bartens, J., Wu, C., McPherson, G., Simpson, J. & O’Neil-Dunne, J. 2013. Urban Forest Inventory and Assessment Pilot Project phase two report. City of San Jose, California, USA (available at https://www.sanjoseca.gov/DocumentCenter/View/23211. ).
Status of the World’s Soil Resources Report, Regional Assessments of Soil Changes | Chapters 9 - 16
250

15. Regional Assessment of Soil Change in the Southwest Pacific Regional Coordinator/Lead Author: N.J. McKenzie (ITPS/Australia)
Contributors: J.A. Baldock (Australia), M.R. Balks (New Zealand), M. Camps Arbestain (ITPS/New Zealand), L.M. Condron (New Zealand), Elder-Ratutokarua, M.(Secretariat Pacific Community/Fiji), M.J. Grundy (Australia), A.E. Hewitt (New Zealand), F.M. Kelliher (New Zealand), J.F. Leys (Australia), N.J. McKenzie (ITPS/Australia), R.W. McDowell (New Zealand), R.J. Morrison (Fiji/Australia), N.R. Schoknecht (Australia).
15.1 Introduction The Southwest Pacific region includes the 22 island nations of the Pacific1, New Zealand and
Australia (Figure 15.1). The landscapes of the region are very diverse ranging from a large continental land mass through to tens of thousands of small islands across the enormous expanse of the southwest Pacific Ocean. There are extensive ancient flat lands through to some of the youngest and most tectonically active landscapes on the planet. Temperature and rainfall ranges are large because of the breadth of latitudes and elevations. As a consequence, the soils of the region are also diverse. The strongly weathered soils in humid tropical areas and the vast expanses of old soils across the Australian continent are particularly susceptible to disturbance and this is where some of the more intractable problems of soil management occur today.
Figure 15.1: Major land types and nations in the Southwest Pacific region (to be drafted)
15.2 The major land types in the region The major land types in the region owe their origin to the relative movement of the Earth’s
lithospheric plates, and in particular the interaction between the Australian and Pacific Plate. The breakup of the supercontinent of Gondwana included the separation, around 96 million years ago, of the Australian Plate from the Antarctic Plate. The Australian Plate includes the present day island continent of Australia, Papua New Guinea, a small part of the South Island of New Zealand, and some islands including New Caledonia and Norfolk Island. The Australian Plate is moving northwards at approximately 70 mm/year and colliding with the Eurasian Plate. This has created the mountains of Indonesia and Papua New Guinea, the highest peaks being Puncak Jaya (4,848m) and Mt Wilhelm (4,509m) respectively. The Pacific Plate is moving westwards towards the Australian Plate. Movement along the transform boundary of these plates has created the Southern Alps of New Zealand (Aoraki/Mt Cook 3,724m) and related geological activity has resulted in substantial volcanic activity around the aptly named Pacific Rim of Fire. New Zealand straddles the boundary of the Australian and Pacific Plate. Most of the island nations of the Pacific are volcanic in origin and exist today as either hilly or mountainous features formed by the volcanoes themselves, or as atoll islands.
Ancient landscapes
1 These countries are American Samoa, Cook Islands, Federated States of Micronesia, Fiji, French Polynesia, Guam, Kiribati, Marshall Islands, Nauru, New Caledonia, Niue, Northern Mariana Islands, Palau, Papua New Guinea, Pitcairn Islands, Samoa, Solomon Islands, Tokelau, Tonga, Tuvalu, Vanuatu, and Wallis and Futuna.
Status of the World’s Soil Resources Report, Regional Assessments of Soil Changes | Chapters 9 - 16
251

After the separation from Antarctica, the Australasian landmass moved northwards into warmer latitudes at the same time that the globe was cooling during the Pleistocene. The development of the circumpolar Southern Ocean further moderated the climate of the Australasian landmass. The resulting relative stability meant that biological evolution and soil development occurred on similar timescales and without major phases of interruption. This is in contrast to much of the Northern Hemisphere where repeated glaciations renewed landscapes and ensured that large areas have relatively young soils. This long history of soil development has many implications today for land management in the region.
Low-relief landscapes of Australasia
The western two-thirds of the Australian continent are dominated by ancient landscapes and strongly weathered soils. Some of these soils bear the imprint of previous climates with some unexpected patterns of soil distribution – very acid leached soils (normally associated with humid regions) now occur in deserts and deeply weathered soil profiles (tens of metres deep) occur in Mediterranean climates with limited leaching. Vast areas of sandy soils have formed from the predominantly acid-igneous and sedimentary parent materials. Nutrient status is very poor and micronutrient deficiencies are common. In the south, substantial quantities of salt have accumulated in the low relief landscapes. As a consequence, sodic and saline soils are widespread and human-induced salinity is a major land management problem.
Uplifted and eroded continental margins
The soils and landscapes of the eastern third of Australia are dominated by the influence of the Great Escarpment (Ollier 1982) – a landscape feature that extends for 3000 km from Northern Queensland to Victoria. The Great Escarpment was formed by uplift associated with the passive continental margin to the east. Inland of the Escarpment, the soils and landscapes tend to be older but more clay rich than in the west of the country. The undulating and low relief landscapes also have saline and sodic soils. Large sedimentary basins (e.g. Murray–Darling Basin) have moderately fertile soils although the current climate is highly variable.
The elevated tablelands adjacent to the Great Escarpment have significant areas of basalt and their associated alluvial landscapes have some of Australia’s best soils for agriculture. Likewise, the dissected landscapes to the east and south of the Great Escarpment where most Australians live are much younger. The coastal river systems have fertile alluvial landscapes.
The remnants in New Caledonia, Papua New Guinea and New Zealand
The areas of the Australian Plate in New Caledonia, Papua New Guinea and New Zealand share ecosystems with a common evolutionary origin (e.g. the Antarctic flora including Araucaria and Nothofagus). They typically have high levels of biodiversity although the above-ground systems are much better documented that those in the soil. These remnant areas are on the more tectonically active fringes of the Australian Plate and they have greater relief as a result.
Young active landscapes
New Zealand
Status of the World’s Soil Resources Report, Regional Assessments of Soil Changes | Chapters 9 - 16
252

The tectonically active landscapes of New Zealand can be broadly divided into the axis of high mountain ranges, the basin and range provinces on either side of these ranges, the Taupo Volcanic Zone on the North Island, and the lowlands and sedimentary basins. Only 15 percent of the land area is flat. The climate of country ranges from sub-tropical in the north to sub-Antarctic in the far south. Sixty percent of New Zealand is >300 m above sea-level and there are about 3000 mid-latitude mountain glaciers.
A climate sequence of Luvisols, dystric Cambisols and Podzols cover 69 percent of the country and are derived from sedimentary rocks (greywacke, sandstone, siltstone and mudstone as colluvium, alluvium and loess). Significant soils in the remaining areas include vitric Andosols derived from rhyolytic tephra (North Island) and silandic Andosols, Nitisols and Ferralsols derived from andesitic tephra and basalt (mainly on the North Island).
Papua New Guinea
Papua New Guinea has five major landscape regions (Löffler 1977, 1979). The Southern Plains and Lowlands are up to 400 km wide in the west of the country. Most of this region is less than 30 m above sea level and includes the extensive alluvial plains of the Fly River. There are two mountainous regions that occupy the majority of the country. The Central Ranges run the length of the mainland and have very high relief with many peaks between 3000 m and 4000 m. The Northern Ranges run parallel and they descend to a discontinuous and narrow coastal plain. Between these ranges are the plains, lowlands and wetlands of the Inter-montane Trough, many of which are associated with the Sepik River. The Islands Region is diverse and includes active volcanoes (e.g. New Britain) particularly along the Northern Bismarck Island Arc. Fringing coral reefs and raised coral limestone landforms are common in this tectonically active area.
Island landscapes and atolls
As noted earlier, most of the smaller islands in Melanesia, Micronesia and Polynesia are volcanic in origin. Those with hilly or mountainous features were formed by the volcanoes themselves and they may have fringing coral reefs, elevated coral platforms, or both. The low lying atoll islands have been formed by corals growing on extinct seamounts or volcanoes that have eroded or subsided. Many of the atoll islands are only a few meters above sea level and are therefore vulnerable to sea-level rise.
15.3 Climate The climate of the region is strongly influenced by circulation patterns and processes in the
Pacific Ocean (the Southern Oscillation) that bring La Niña conditions associated with floods and cyclones and El Niño conditions that are associated with droughts. A similar circulation pattern in the Indian Ocean (the Indian Ocean Dipole) influences drought across southern Australia. The Southern Annular Mode of the Southern Ocean affects weather and climate in New Zealand and southern Australia. These large-scale circulation processes interact with the landscape (e.g. through orographic processes and in accord with the scale of the land mass) to exert a strong control on land use and management across the region. Some of the most significant features are as follows.
Status of the World’s Soil Resources Report, Regional Assessments of Soil Changes | Chapters 9 - 16
253

• Australia has a very high year-to-year rainfall variability and major droughts and wet periods occur on a decadal scale – resilient systems of land and water resource management are essential to deal with this level of climate variability.
• Landscapes in the tropics and sub-tropics experience cyclones and very high intensities of rainfall especially in coastal areas – maintenance of surface cover is essential to avoid extremely high rates of soil erosion.
• The wet-dry tropics of northern Australia and some Pacific Islands receive most of their rainfall in three consecutive months and the remainder of the year is severely water-limited. This restricts options for land use unless some form of irrigation is possible. The harsh climate, in conjunction with the ancient and strongly weathered soils, largely accounts for the dramatic difference in land use and population density of Northern Australia when compared to nearby Indonesia and Papua New Guinea.
In some parts of the region, there is a sensitive interplay between rainfall, evaporation and the capacity of soil to store water. Many soils in southern Australia have a limited capacity to store water and this makes them especially vulnerable to small changes in the distribution and amount of rainfall. As a consequence, relatively small changes in rainfall and temperature caused by climate change are having a significant impact on farming systems and water resources (Reisinger et al. 2014). Likewise, sea-level rise caused by global warming (Nurse et al. 2014) creates an immediate and serious threat to thousands of low lying atoll islands in the region.
15.4 Land use 15.4.1 Historical context
The history of human settlement has occurred in several distinct waves over a very long period. In every case the impact on soils has been substantial and in some cases catastrophic. The earliest records indicate that human arrival occurred in Papua New Guinea and Australia at least 45 000 years BP. At this time, sea levels were much lower and a land bridge connected the two countries (and Tasmania) forming the single continent of Sahul. This continent was widely colonized by 35 000 years BP (O’Connell and Allen 2004).
It is difficult to assess the impact on soils caused by the initial colonization of the region, particularly by the Australian Aborigines, because it coincides with a period of rapid climate change towards the end of the Pleistocene. In Australia, major changes in fire, vegetation, and wildlife occurred (Roberts et al. 1990, 1994; Bowler et al. 2003; Turney et al. 2001). The cumulative effect on soils caused by humans and other environmental drivers during this time may rival the later direct impact caused by Europeans, although the latter has been concentrated into a very short period.
The broad area of Near Oceania (including present-day Papua New Guinea, Solomon Islands, Vanuatu, New Caledonia and Fiji) was occupied by peoples that were to remain relatively isolated for more than 25 000 years giving rise to the remarkably diverse cultures and languages of Melanesia – for example, more than 800 languages are still spoken today in Papua New Guinea. It is likely that agriculture was invented in the New Guinea highlands at about the same time (10,000 years BP) as it appeared in other parts of the world, and that agricultural development and plant domestication in New Guinea was independent of what happened elsewhere in the world until about 3500 years BP (Denham et al. 2003).
Status of the World’s Soil Resources Report, Regional Assessments of Soil Changes | Chapters 9 - 16
254

The Polynesian and Micronesian peoples arrived in relatively recent times and their ancestors were primarily from East Asia. The development of sailing approximately 3000 years BP enabled their colonization of the islands in Remote Oceania as far east as Tonga and Samoa where Polynesia culture then developed (Friedlaender et al. 2008).
When the Polynesian Maoris first arrived in New Zealand c. 1200 AD, most of the land was covered by dense forest, which they began to clear by burning to facilitate settlement and hunting (McGlone 1989). Most of the forest clearance occurred between 1350 and 1550 and the impacts on soils and landscapes were greatest in the drier east coast regions of both main islands. By 1840 just prior to large scale European settlement, the forest cover had been reduced from 85 percent (23 million ha) to 53 percent (14.3 million ha) (Condron and Di 2002).
15.4.2 Nineteenth and twentieth centuries
European colonization was widespread across the region during the nineteenth and twentieth century. The impact on soils in many districts, particularly in Australia and New Zealand, was profound and in some areas initially catastrophic. In Australia, the severity of soil degradation, particularly in the 100 years after 1850, was extreme culminating in the dust bowl years in 1930s and 1940s. In New Zealand, the clearing of steep hill country led to widespread erosion and sedimentation in river systems.
Other countries in the region (e.g. Papua New Guinea, Fiji, French Polynesia) went through distinct phases of land use that included subsistence shifting-agriculture being disrupted by European commercial farming (e.g. pastoralism, coconut plantations, cotton, coffee) which often involved widespread clearing of the tropical lowland forests. Sugar cane industries were established in some countries and the logging of the indigenous timber resource was widespread. Many urban areas expanded and in some countries agriculture expanded onto more marginal lands with intensification of land use being widespread.
The legacy of the early and destructive phases of land use is still evident throughout the region. Many landscape processes take decades to stabilize after a change in land use and as a consequence, the full extent of soil change caused by prior land use across the region has yet to be fully expressed. The most significant and potentially irreversible causes of soil change across the region include the following.
Clearing: In Australia, the removal of deep-rooted native vegetation and replacement with annual crops and perennial pastures has in most cases leads to a net loss of organic carbon, nutrients and less efficient use by plants of the available rainfall. This can lead to rising groundwater levels and, in some cases, dryland salinity. The time between initial disturbance and the longer term equilibrium can range from a few decades (e.g. organic carbon in light-textured soils (Sanderman et al. 2010) through to many decades or centuries (e.g. dryland salinity in regional-scale groundwater systems (NLWRA 2001b)). Conversely, in New Zealand, carbon and nitrogen stocks – and in particular on hill country with low stocking rates – increase while C:N ratios decline when converting from native vegetation to pasture (Schipper and Sparling 2011, Sparling et al. 2014).
Mining: Major disruptions to landscapes were caused by mining starting with the gold-rush era (from the 1850s onwards) in Australia and New Zealand. Alluvial landscapes in particular were
Status of the World’s Soil Resources Report, Regional Assessments of Soil Changes | Chapters 9 - 16
255

dug up, turned over, sluiced, and degraded. Enormous quantities of sediments were generated and soils and river systems were damaged irreparably. The environmental controls around mining operations in these two countries have improved in more recent decades but this has not been the case elsewhere in the region.
Mining operations on various Pacific islands have had major environmental and social impacts. Examples include the Ok Tedi (see below) and Porgera mines in Papua New Guinea, extensive strip mining for phosphorus in the small country of Nauru where >90 percent of the original soils have been removed (Morrison and Manner, 2005) and the ill-fated Bougainville Copper mine.
During the last decade, the area of land used for mining and extraction of energy resources (e.g. coal and coal seam gas) has expanded significantly in eastern Australia. This has generated conflicts and difficult policy decisions on land use because some of the most prospective areas for coal and coal seam gas coincide with high-quality agricultural land (Chen and Randall 2013).
Excessive cultivation and compaction: This was widespread during the first half of the 20th century and it is still a problem in some parts of the region. The economic cost of compaction caused primarily by heavy machines and animals is likely to be large but it remains unquantified.
Grazing: Excessive grazing damages soil quickly because removal of cover leads directly to erosion. It can also permanently remove nutrients unless replenished with fertilizer. Large areas across the Australian rangelands have been affected (Bastin 2008). In New Zealand, conversion of forested hill-country to pastures has had a large impact on soil erosion.
Rabbits and other feral animals: Wild grey rabbits were introduced to Australia in 1860 and within a decade they reached plague proportions. Their main effect was to exacerbate over-grazing caused by stock, leading to bare ground and erosion by water and wind. Rabbit plagues continued throughout the first half of the 20th century and were particularly devastating during the 1940s. Numbers were reduced greatly when in 1950 the myxomatosis virus was introduced. The pest gradually increased in following decades but was again reduced when the calici virus was released in the 1990s. Rabbits and other feral animals (e.g. goats and pigs) degrade soils in other parts of the region. They are a significant problem in New Zealand and on sub-Antarctic islands such as Macquarie Island which has been severely eroded in recent decades because of rabbits.
15.4.3 Contemporary land-use dynamics
At the end of the twentieth century, diverse systems of land use operated throughout the Southwest Pacific ranging from traditional systems (e.g. subsistence shifting-agriculture in Papua New Guinea and some of the Pacific Islands) through to technologically advanced systems (e.g. highly mechanized agriculture in Australia and New Zealand). While the general patterns of land use have been relatively stable for several decades, significant changes are continuing and those with the greatest impact on soil resources are summarised in Table 15.1. There are large differences in the degree of economic development in the region (Table 15.2) ranging from some of the world’s poorest to the richest nations. Despite the nation’s economic wealth, 20 percent of Australia is owned and managed by economically disadvantaged Indigenous Australians (SOE 2011). Approximately 5.6 percent of New Zealand is Maori land and it is a major contributor to New Zealand’s economy. About 26% of Maori businesses are in the primary sector (primarily farming, forestry and horticulture. In
Status of the World’s Soil Resources Report, Regional Assessments of Soil Changes | Chapters 9 - 16
256

some countries (e.g. Solomon Islands and Vanuatu) increasing rural populations have led to significantly greater use of productive land in the subsistence shifting cultivation systems with much reduced fallow periods and subsequent declines in soil quality.
Primary industries play a major role in most countries and the development of mineral and energy resources has been a key driver of economic growth (e.g. Australia, Papua New Guinea). New Zealand and Australia are major exporters of agricultural products.
Status of the World’s Soil Resources Report, Regional Assessments of Soil Changes | Chapters 9 - 16
257

Table 15.1: Summary of current primary drivers of land-use and the associated implications for soil resources in the Southwest Pacific region.
Country and land-use driver
Implication for soil resources
Australia Commodity prices Disruption to, or intensification of, current systems of land use and
management
Cessation of land clearing Carbon stocks in areas under native vegetation are protected. Intensification of land use occurs elsewhere
Expansion of mining and energy industries
Loss of productive soils used for agriculture
Agricultural land management Intensification of land use may increase some threats (e.g. acidification, nutrient imbalance) but improved systems of soil management are reducing others (e.g. compaction, carbon loss, contamination)
Population growth and urban expansion
Sealing and capping of land
Drying of southwest Western Australia
Risks to farming systems, forestry and other plantations
Land degradation Decreased viability of current systems of land use (e.g. southern rangelands of Australia)
New Zealand Commodity prices Disruption to, or intensification of, current systems of land use and
management
Intensification of agriculture Intensification of land use may increase some threats (e.g. nutrient imbalance) but improved systems of soil management are reducing others (e.g. compaction, carbon loss, contamination) and other off-site impacts are likely (e.g. eutrophication of waterways, increased emissions of Greenhouse Gases)
Expansion of forestry Reduced risk of erosion and potential changes in carbon stocks
Urban expansion Sealing and capping of land
Papua New Guinea Rapid population growth Reduced rotation length in traditional subsistence systems leading to
fertility decline
Unsustainable logging Erosion, fertility decline, reduced carbon stocks, loss of biodiversity
Mining Immediate site impacts and risks of off-site contamination
Fiji Commodity prices Disruption to established systems of land use and management
(particularly for the sugar industry)
Forest management Risks of erosion, fertility decline, reduced carbon stocks, loss of biodiversity
Urban expansion Sealing and capping of versatile land
Status of the World’s Soil Resources Report, Regional Assessments of Soil Changes | Chapters 9 - 16
258

Solomon Islands Unsustainable logging Erosion, fertility decline, reduced carbon stocks, loss of biodiversity
Low Lying Atoll Islands Local production of fresh food Improved management of limited soil resources
Sea-level rise Salinization, loss of soil resources
Urban expansion Sealing and capping of land
Status of the World’s Soil Resources Report, Regional Assessments of Soil Changes | Chapters 9 - 16
259

Table 15.2: Current population, project population (UNDESA 2013) and Gross Domestic Production per capita (World Bank 2014) for countries of the region.
Country Population 2015
Thousands
Population 2050
Thousands
GDP per capita USD
(2009-2013)
Australia 23 923 33 735 67 468
New Zealand 4 596 5 778 41 556
Melanesia
Fiji 893 918 4572
New Caledonia 263 364 -
Papua New Guinea 7632 13 092 2088
Solomon Islands 584 1010 1954
Vanuatu 264 473 3303
Total Melanesia 9636 15 858
Polynesia
American Samoa 56 62 -
Cook Islands 21 24 -
French Polynesia 283 337 -
Niue 1 1 -
Samoa 193 242 3647
Tokelau 1 1 -
Tonga 106 140 4427
Tuvalu 10 12 3861
Wallis and Futuna Islands 13 13 -
Total Polynesia 684 832
Micronesia
Federate States of Micronesia 104 130 3235
Kiribati 106 156 1651
Marshall Islands 53 67 3325
Nauru 10 11 -
Northern Mariana Islands 55 52 -
Palau 21 28 11 810
Total Micronesia 519 671
Status of the World’s Soil Resources Report, Regional Assessments of Soil Changes | Chapters 9 - 16
260

15.5 Threats to soils in the region 15.5.1 Erosion by wind and water
The rates of soil erosion occurring today in Australia and New Zealand are significantly less than in previous decades. The situation in the rest of the region is less clear. Very fast rates of erosion are occurring in countries with uncontrolled land clearing and logging (e.g. Papua New Guinea and the Solomon Islands). Unsustainable rates of erosion are also likely to be occurring in marginal and hilly lands used for agriculture in some Pacific countries; for example, Fiji (Liedtke (1989).
Soil erosion by wind is a significant problem in Australia and an account of trends and current status is presented below. It is not common elsewhere in region because of the humid climate although drier areas in New Zealand (primarily on the South Island) are prone to wind erosion (Eyles 1983).
Australia
Current rates of soil erosion by water in Australia are much less than the peak periods just after land clearing. In many parts of the country, widespread gully erosion occurred during this time and the hydrological regime of many river systems was changed. In southern Australia, gully and river bank erosion are the dominant sources of sediment supplied to streams. Gully erosion in southern Australia has been largely stabilised, but gullies are still actively forming in northern Queensland and in some agricultural regions of Western Australia (NLWRA 2001a).
Despite the apparent stabilization, current rates of soil erosion by water across much of Australia now exceed soil formation rates by a factor of at least several hundred and, in some areas, several thousand. As a result, the expected half-life of soils (the time for half the soil to be eroded) in some upland areas used for agriculture ranges from less than a century to several hundred years. The latest assessment concluded that soil erosion by water in Australia is still at unsustainable rates, but there are large uncertainties about the time until soil loss will have a critical impact on agricultural productivity (SOE 2011, Bui et al. 2010, 2011). Environmental impacts of excessive sedimentation and nutrient delivery on inland waters, estuaries and coasts are already occurring.
Up to 10 million hectares of land have less than 500 years until the soil’s A-horizon (effectively the more fertile ‘topsoil’) will be lost to erosion. Most of this land is in humid subtropical Queensland. Integrated studies of soil formation and erosion using a variety of techniques will be needed to better understand the extent, severity and significance of the problem. However, it is clear that a concerted program of soil conservation is essential to control this chronic form of land degradation across large areas of Australia. The problem is arguably having its greatest environmental impact on the World Heritage listed Great Barrier Reef. The latest scientific consensus is that the decline of marine water quality associated with terrestrial runoff from the adjacent catchments is a major cause of the current poor state of many of the key marine ecosystems of the Great Barrier Reef. The main source of excess nutrients, fine sediments and pesticides from Great Barrier Reef catchments is diffuse source pollution from agriculture (Brodie et al. 2013).
Status of the World’s Soil Resources Report, Regional Assessments of Soil Changes | Chapters 9 - 16
261

Figure 15.2: Change in the percentage area of all land prepared for crops and pastures under different tillage practices in Australia, 1996-2010 (SOE 2011)
Land-management practices have improved significantly during the past few decades, due to better grazing practices, adoption of conservation tillage, enforcement of forestry codes and soil conservation measures in engineering (e.g. relating to road construction and urban development).
Ground-based monitoring of management practices and land cover along with data on land-management practices (SOE 2011) reveal a pattern of:
• more careful grazing and maintenance of effective land cover at critical times of the year • improved adoption of conservation practices, especially across the cropping lands of southern
Australia • an associated large decline in the amount of tillage in farming systems (Figure 15.2)
New Zealand
Soil loss by erosion is a major problem in many areas of New Zealand due to a combination of factors including soil type, topography and climate, as well as the type and associated intensity of land use (especially pastoral agriculture).
Eyles (1983) provided the first systematic inventory of soil erosion in New Zealand and made the following observations and estimates. Surface erosion occurs mainly on the South Island and in 1983 sheet erosion affected 10 million ha while wind erosion affected 3 million ha (the total area of New Zealand is approximately 27 million ha). Mass movement occurred mainly on the North Island
Status of the World’s Soil Resources Report, Regional Assessments of Soil Changes | Chapters 9 - 16
262

and slip erosion was estimated to affect 7 million ha. Fluvial erosion also occurred mainly in the North Island with rill and gully erosion estimated to affect 2 million ha. It was concluded that a total of 9 million ha of farmed land in New Zealand was at risk of significant erosion, although the level of risk was variable. The large scale afforestation of hill country and steep-land pasture since 1983 (see case study below) will have substantially reduced rates of soil erosion (especially sheet and slip erosion). However, forest harvesting results in significant soil disturbance and this will increase the risk of erosion when the first rotation forest is harvested and the second rotation established.
Dymond (2010) analysed erosion rates in order to refine the national carbon budget because soil erosion in New Zealand involves the large export of sediment and particulate organic carbon (POC) directly to the sea. The North Island of New Zealand was estimated to export 1·9 (−0·5/+1·0) million tonnes of POC per year to the sea, and to sequester 1·25 (−0·3 /+0·6) million tonnes of carbon per year from the atmosphere through regenerating soils. The South Island was estimated to export 2·9 (−0·7/+1·5) million tonnes of POC per year, and to sequester approximately the same amount. Dymond (2010) assumed that exported carbon is buried at sea with an efficiency of 80 percent and this gives New Zealand a net carbon sink of 3·1 (−2·0/+2·5) million tonnes per year (equivalent to about 45 percent of New Zealand’s fossil fuel carbon emissions in 1990). This leads to conveyor-belt transfer of carbon from the atmosphere to soils regenerating from erosion and to the sea floor where carbon is permanently buried. The large magnitude of the net sink is primarily due to tectonically driven uplift and erosion combined with high biological productivity. The degree to which other elevated and humid islands in the Pacific can operate as a net sink has not been determined.
Pacific
The high rainfall and steep lands in many of the larger Pacific Island countries make them vulnerable to soil erosion. Understanding the significance of this erosion requires information on both rates of soil formation and the baseline rates of sediment movement in different landscapes. The latter can be much larger than in temperate regions and relatively fast rates of erosion (i.e. 50 t/ha/yr) have been recorded in heavily forested landscapes in Fiji (Glatthar 1988; Liedtke 1989) and Samoa (Terry et al. 2002, 2006). Tropical cyclones, intense rainstorms, steep slopes and landslides are key factors.
The desire for economic development has led to increasing areas of good-quality soil being used for cash crops such as coffee and cocoa and for cattle production. These factors in conjunction with population pressures are forcing small-scale agriculture onto steeper less suitable lands. Logging, whether managed or illegal, increases the pressure even further. Condron and Di (2002) indicate that rates of soil loss by erosion in these areas is typically between 10 to 90 t ha-1 per year (see also Asquith et al. 1994; Liedtke 1989). Accelerated soil erosion has also been associated with plantations, particularly on marginal sloping land.
Although most atolls are away from the cyclone belt in the Southwest Pacific, a few have been severely eroded by large storms. The impacts are devastating as much of the limited soil resource is washed away, and also what is left becomes highly salinized and of limited productive capacity. This was particularly noted on Funafuti, Tuvalu following cyclone Bebe in 1972 (Maragos et al, 1973).
Sub-Antarctic Islands
Status of the World’s Soil Resources Report, Regional Assessments of Soil Changes | Chapters 9 - 16
263

Several sub-Antarctic islands in the Southwest Pacific region continue to have high rates of soil erosion. Macquarie Island, for example, is an isolated island in the Southern Ocean that provides critical habitat for migratory species. Macquarie Island has been has been severely eroded and approximately AUD $25 million has been spent in recent years on habitat restoration programs, mainly for the eradication of rabbits.
15.5.2 Soil organic carbon change
Most of the region experienced large losses of soil carbon when land was cleared initially for agriculture. The major phases of clearing in each country were noted above and in some countries clearing associated with uncontrolled logging continues today, for example in Papua New Guinea and the Solomon Islands (Moorehead 2011). The initial disruption to soil caused by clearing usually results in a significant loss of nutrients. Organic matter is oxidised, and the removal of surface cover (litter and protective vegetation) makes the soil more prone to erosion. Stores and cycles of nutrients adjust under the new land use, but in most cases the net loss of nutrients and leakage are greater than under natural conditions. Across the region, most studies indicate that soil carbon typically reduces to 20–70 percent of the pre-clearing amount (e.g. Sanderman and Baldock 2010). Opportunities for restoring some of this very large stock of carbon have been a focus of soil research in Australia and New Zealand during the last decade.
Australia
In their review of replicated Australian field trials with time-series data, Sanderman and Baldock (2010) concluded that, although the implementation of more conservative land-management practices will lead to a relative gain in soil carbon, absolute soil carbon stocks may still be on a trajectory of slow decline. There are also inevitable trade-offs between agricultural production (i.e. carbon exports in the form of crops, fibre and livestock) and carbon sequestration (capture and storage) in soils.
SOE (2011) provides a district-by-district assessment of trends in soil carbon for Australia. The assessment concluded the following.
• The time since clearing is a key factor determining current trends. For example, large parts of Queensland are still on a declining trend because widespread clearing for agriculture was still occurring in the 1990s.
• Few regions have increasing soil carbon stores. • Regions with intensifying systems of land use (e.g. northern Tasmania) have decreasing
stores. • Most regions with a projected drying climate have declining trends. • The savannah landscapes of northern Australia have significant potential for increasing soil
carbon stores, but this requires changes in grazing pressures and fire regimes. • Some of the extensive cropping lands in southern Australia with weathered and naturally
infertile soils have not experienced as large a loss of soil carbon since clearing (i.e. generally a 30–70 percent loss and sometimes <30 percent loss) because they had small carbon stores at the time of European occupation and have not changed substantially (although soil biodiversity has undoubtedly changed). Many of these soils have also benefited from the addition of fertiliser and the correction of trace element deficiencies. Status of the World’s Soil Resources Report, Regional Assessments of Soil Changes | Chapters 9 - 16
264

A comprehensive study of soil carbon stocks across a wide range of climates, soils and management systems by Baldock et al. (2013) confirmed that broad patterns of soil carbon variation correlate with first order drivers such as climate and soil type. It also demonstrated that increasing soil stocks in some environments is difficult. For example, results from both trial and commercial grower sites throughout Queensland indicate that no-till systems are not capable of increasing soil organic carbon in either Queensland grain or sugarcane systems. However, no-till may be capable of slowing carbon loss following a period of carbon input from, for example, a pasture ley (Page et al. 2013).
The study also revealed that no individual management practice has the same influence on 0-0.3m soil carbon stocks across all agricultural regions and statistically significant differences in 0-0.3 m soil carbon stocks were often not detected despite strong variations in the management practices assessed (e.g. continuous pasture versus continuous cropping). The results suggest that differences in the way individual landowners implement practices in response to personal preferences or business requirements may contribute significantly to the size of stocks. Poor application of a particular management practice, which on average has the capability to increase soil carbon, may result in a loss of soil carbon. Equally, a very good application of a practice that is found to decrease soil carbon on average may result in increased soil carbon stocks if levels of carbon capture and return to the soil are high enough (Cowie et al. 2013, Page et al. 2013, Cotching et al. 2013, Badgery et al. 2013, Davey and Koen 2013, Wilson and Lonergan 2013). These findings have implications for policies and incentive schemes that reward farmers for storing additional organic carbon. Schemes that rely on compliance to a general management practice may not be effective.
New Zealand
The importance of soil erosion to the soil carbon balance of New Zealand was noted earlier. Significant progress has also been made in estimating the carbon balance of different land uses. Trotter et al. (2004) estimated that New Zealand’s major vegetation types combined to make the total land area a small net carbon source (Table 15.3). A similar conclusion was reported by Tate et al. (2005).
As indicated in Table 15.3, ‘improved’ grassland is New Zealand’s most widespread land use but there are large differences in carbon exchange rates within this land type. For example, detailed measurements by Mudge et al. (2011) over two years demonstrated that a dairy farm with mineral soil was a net C sink (year 1 = 590 ± 560 kg C/ha/y; year 2 = 900 ± 560 kg C/ha/y) while Nieeven et al. (2005) and Campbell et al. (2015), using similar eddy covariance methods, demonstrated other dairy farms with drained peat soil were net C-sources (-1061 ± 500 kg C/ha/y and 2940 C/ha/y respectively).
Status of the World’s Soil Resources Report, Regional Assessments of Soil Changes | Chapters 9 - 16
265
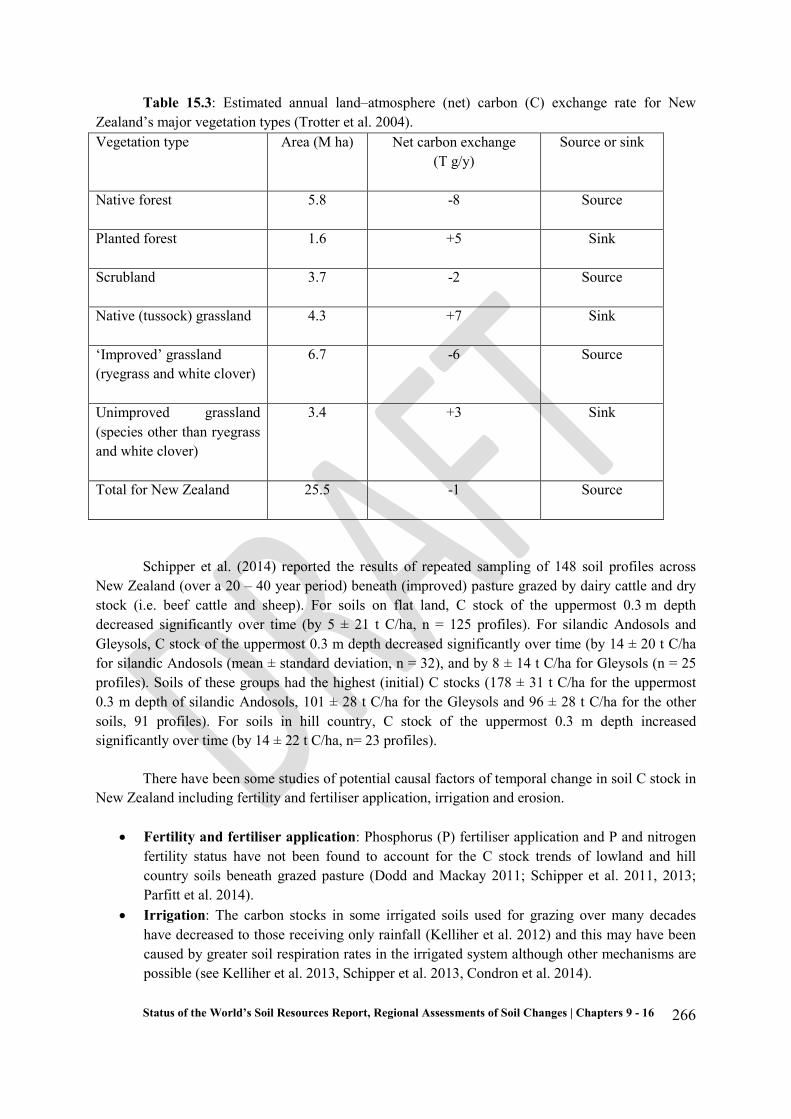
Table 15.3: Estimated annual land–atmosphere (net) carbon (C) exchange rate for New Zealand’s major vegetation types (Trotter et al. 2004). Vegetation type Area (M ha) Net carbon exchange
(T g/y) Source or sink
Native forest 5.8 -8 Source
Planted forest 1.6 +5 Sink
Scrubland 3.7 -2 Source
Native (tussock) grassland 4.3 +7 Sink
‘Improved’ grassland (ryegrass and white clover)
6.7 -6 Source
Unimproved grassland (species other than ryegrass and white clover)
3.4 +3 Sink
Total for New Zealand 25.5 -1 Source
Schipper et al. (2014) reported the results of repeated sampling of 148 soil profiles across New Zealand (over a 20 – 40 year period) beneath (improved) pasture grazed by dairy cattle and dry stock (i.e. beef cattle and sheep). For soils on flat land, C stock of the uppermost 0.3 m depth decreased significantly over time (by 5 ± 21 t C/ha, n = 125 profiles). For silandic Andosols and Gleysols, C stock of the uppermost 0.3 m depth decreased significantly over time (by 14 ± 20 t C/ha for silandic Andosols (mean ± standard deviation, n = 32), and by 8 ± 14 t C/ha for Gleysols (n = 25 profiles). Soils of these groups had the highest (initial) C stocks (178 ± 31 t C/ha for the uppermost 0.3 m depth of silandic Andosols, 101 ± 28 t C/ha for the Gleysols and 96 ± 28 t C/ha for the other soils, 91 profiles). For soils in hill country, C stock of the uppermost 0.3 m depth increased significantly over time (by 14 ± 22 t C/ha, n= 23 profiles).
There have been some studies of potential causal factors of temporal change in soil C stock in New Zealand including fertility and fertiliser application, irrigation and erosion.
• Fertility and fertiliser application: Phosphorus (P) fertiliser application and P and nitrogen fertility status have not been found to account for the C stock trends of lowland and hill country soils beneath grazed pasture (Dodd and Mackay 2011; Schipper et al. 2011, 2013; Parfitt et al. 2014).
• Irrigation: The carbon stocks in some irrigated soils used for grazing over many decades have decreased to those receiving only rainfall (Kelliher et al. 2012) and this may have been caused by greater soil respiration rates in the irrigated system although other mechanisms are possible (see Kelliher et al. 2013, Schipper et al. 2013, Condron et al. 2014).
Status of the World’s Soil Resources Report, Regional Assessments of Soil Changes | Chapters 9 - 16
266

• Erosion: As noted earlier, sheet erosion by water and landslides are important factors affecting carbon stocks in New Zealand. In one catchment, these processes each accounted for a loss of 0.5 t C/ha/y (Page et al. 2004). On lower slopes, such soil may be lost or re-distributed or both. One study showed the C stock in erosion scars increased from 10 to 80 t C/ha within 70 years in the uppermost 0.2 depth of soil (Parfitt et al. 2013). However, the carbon stocks of soils forming on erosion scars are unlikely to return to more than ~80 percent of the pre-landslide amount because the newly developing soils are relatively shallow and drought-prone in summer (Rosser and Ross 2011).
Studies of current C stocks and the potential saturation value for the soils of New Zealand (Beare et al. 2014) suggest there is an opportunity to increase the C stock of pastoral soils by increasing the C input rate including deeper plant roots (e.g. Carter and Gregorich 2010), though organic matter stored deeply in soils is poorly understood (Rumpel and Kögel-Knabner 2011) and determining the contribution of roots to soil C may not be straightforward (e.g. Dodd and Mackay 2011).
Pacific
Only a few studies of soil carbon dynamics have been undertaken in the countries of the Pacific (e.g. Hartemink 1998a), although general statements are regularly made on the decline in soil carbon associated with soil erosion, excessive cultivation and poor soil management. For example, Leslie and Ratukalou (2002) conclude that the small size of farm holdings in Fiji (60 percent are less than 3 ha) force farmers into intensive cultivation (often mono-cropping) for high output, short-term production without (or with only minimal) fallow periods. Furthermore, competition for land is forcing subsistence gardens onto steeper slopes because of the expansion of cash cropping and grazing on the flatter lands.
Excessive soil erosion in many sugar cane areas along with the burning of cane trash is resulting in serious depletion of fertility and soil loss on poorly managed farms. A 30-year study from Fiji on a series of sugarcane farms showed the expected decrease (15-35 percent) in topsoil organic C at the time of land clearing, but a redistribution of C occurred with increases at 30-40 cm depth (below the plough layer) and a very gradual increase in C at depth (80 cm) such that the overall C content of the fields increased on well-managed farms (Morrison and Gawander in press, Morrison et al. 2005).
The expansion of agriculture in Papua New Guinea and uncontrolled logging is most likely causing a reduction in soil carbon stocks but quantitative studies to assess the magnitude of these changes are needed. Even on atolls, land-use change involving replacement of native vegetation by coconuts has led to significant declines in soil carbon, which is critical there because of the key role of organic matter in moisture retention (Morrison and Seru, 1985).
15.5.1 Soil contamination
The Southern Hemisphere does not have the same history of large scale industrialization compared to the Northern Hemisphere. However, soil contamination is a significant problem mainly in relation to impurities in phosphate fertilizers, agricultural chemicals, mining, waste disposal, former industrial sites and nuclear testing. Reviews of the history of soil contamination in the region are provided by Naidu et al. (1996) and more specifically for Australia (Tiller 1992; Barzi et al.
Status of the World’s Soil Resources Report, Regional Assessments of Soil Changes | Chapters 9 - 16
267
1996), New Zealand (Roberts et al. 1996), Papua New Guinea (Singh et al. 1996) and South Pacific Islands (Morrison et al. 1996). Throughout the region there are tens of thousands of contaminated sites (SOE 2011, Ministry of Environment 2010) but the scale of the remediation task is not clear. Australia and New Zealand have a long and effective history of working together to coordinate the management and remediation of soil contamination but the waste management problem facing small islands in the Pacific is a serious and escalating problem.
Fertilizers
Impurities in fertilizers and soil amendments such as lime and gypsum can include cadmium, fluorine, lead and mercury. Cadmium and fluorine have been of most concern in the region and the former can move from soil to the edible portions of plants. In Australia and New Zealand, the historically high concentrations of cadmium in phosphate fertilizers resulted from the use of island sources of high cadmium phosphate-rock for fertilizer manufacture, primarily from Nauru and Christmas Island (Tiller et al., 1994; McLaughlin et al. 1996; Loganathan et al. 2003). A large effort has been devoted to determining the magnitude of the problem and implementing a range of controls measures (Warne et al. 2007; MAF 2011; Cavanagh 2014). In recent years, levels of cadmium in fertilisers have been reduced, and farming systems have been modified to manage the problem and mitigate future risk (e.g. in New Zealand a tiered system for fertilizer management has been established). However, large areas of land that once received heavy applications of superphosphate over decades now have elevated levels of cadmium. A recent analysis by de Vries and McLaughlin (2013) concluded that the present cadmium inputs from fertilizer in Australia are in excess of the long-term critical loads in heavy-textured soils for dryland cereals and that all other systems are at low risk. In New Zealand, a recent survey has shown that only isolated soil samples had Cadmium concentrations that exceeded of the upper-tier threshold value, but the evidence to date indicates that cadmium in New Zealand soils poses no immediate concern.
Agricultural chemicals
Many of the more harmful pesticides and herbicides have been banned or more tightly controlled in Australia and New Zealand. However, some can persist and adversely affect the environment, notably in areas that were, or still are, used for growing potatoes, tomatoes, cotton, bananas and sugar cane. Copper, arsenic and lead are contaminants associated with orchards and market gardens. A widespread problem in both countries has been the thousands of former cattle and sheep-dip sites contaminated with organochlorines such as dichlorodiphenyltrichloroethane (DDT) and other pesticides such as arsenic-based compounds. Urbanisation and the construction of dwellings on or near such sites poses a serious threat to human health. Most of these sites have been investigated and registered. There are far fewer studies on the impact of agricultural chemicals in the smaller island nations of the region.
Mining
The history of mining in the region was outlined above. In Australia, a significant number of current or former mining towns are affected by soil contamination, mostly associated with tailings, mine wastes and pollution from ore processing (e.g. Queenstown in Tasmania, Broken Hill, Captains Flat and Wollongong in New South Wales, Mt Isa in Queensland). At Port Pirie, dispersed heavy metals from smelting (primarily lead, zinc, cadmium and copper) can be detected over thousands of
Status of the World’s Soil Resources Report, Regional Assessments of Soil Changes | Chapters 9 - 16
268

square kilometres although seriously contaminated areas are restricted to tens of square kilometres (Cartwright et al. 1976).
In Papua New Guinea riverine disposal of processing residues, waste rock and overburden into rivers (e.g. Ok Tedi and Porgera) is having a large and long-term environmental impact on soils. Since 1984, the 1000-km long Fly River system has received about 66 Mt/year of mining waste from the Ok Tedi copper-gold porphyry mine and this has caused widespread contamination and altered hydrological regimes (Hettler et al. 1997; Bolton 2009; Campbell 2011). Elevated levels of copper, zinc, cadmium and lead occur in the sediments that have been deposited in the alluvial systems of the Fly River but the longer-term impacts on ecosystems and human health are not clear.
Waste disposal
The management of waste is now tightly regulated and managed in Australia and New Zealand. However, waste management is a major contemporary problem for the small island nations of the Pacific. Morrison and Munro (1999) and Carden (2003) provide an overview of the problem and broader issues of soil management on atoll islands (see case study below).
Industrial sites
Even though they are less industrialised than many countries in the Northern Hemisphere, Australia and New Zealand have a legacy of contaminated former industrial sites. Most are point-scale but in some cases more widespread contamination has occurred.
The legacy of nuclear testing
Morrison et al. (1996) review the legacy of nuclear testing in the Pacific and the following draws heavily on their account. Nuclear testing occurred throughout the 1940s and 1950s in the Marshall Islands resulting in serious contamination and impacts on resident populations. Sites in the Marshall Islands have been monitored for over 40 years and the detailed investigations include impacts on soils. Some areas will be contaminated forever. In undisturbed areas, most of the radioactivity (>80 percent) is in the upper 0.15 m of the soil profile. The terrestrial food chain is still the most significant potential exposure pathway, but in some locations, there may be health problems from the intake of resuspended radioactive soil particles. Access to several islands is still restricted because of contamination.
Nuclear testing occurred in the 1950s and 1960s in Kiritimati (Christmas Island). Radioactivity concentrations in soil were consistent with global fall-out levels for a low rainfall equatorial area, and no site on the island presented a risk to the health of the local population or required any restriction on land use.
Nuclear testing in French Polynesia occurred from the 1960s to the 1990s and it has been a major international environmental issue. Morrison et al. (1996) state that there is no doubt that the atmospheric testing did lead to significant contamination, but the impact of the underground tests is more difficult to assess. A small number of official investigations have been permitted on Mururoa, but these have been limited in extent and some areas have been excluded from investigations. The atoll is under French military control with imported food and restricted use of local resources so the
Status of the World’s Soil Resources Report, Regional Assessments of Soil Changes | Chapters 9 - 16
269

direct impact of contaminants is limited. Morrison et al. (1996) conclude that the impact on surrounding islands which are occupied by Polynesians living a more traditional lifestyle is expected to be small, but in the absence of detailed investigations, this cannot be confirmed.
Nuclear testing in Australia occurred during the 1950s and 1960s at Maralinga and Emu Field in South Australia and on the Montebello Islands near the coast of Western Australia. Rehabilitation of the contaminated Maralinga test area has taken decades with a major effort concluding in 2003 (DEST 2003). Return of the Maralinga test area to its traditional owners was completed in November 2014.
15.5.2 Soil acidification
Soil acidification is an insidious and widespread problem in many parts of the Region. If not corrected, the slow process can continue until the soil is irreparably damaged. The severity and extent of acidification are increasing in many regions, due to inadequate treatment, intensification of land management, or both. Soil acidification is of greatest concern in situations where: agricultural practices increase soil acidity (e.g. use of high-analysis nitrogen fertilisers, large rates of product removal); the soil has a low capacity to buffer the decrease in pH (e.g. infertile, light-textured soils); or the soil already has a low pH.
The main onsite effects of acidification include: loss or changes in soil biota involved in nitrification, accelerated leaching of plant nutrients, and induced nutrient deficiencies or toxicities. There may also be breakdown and subsequent loss of clay materials from the soil, the development of subsoil acidity, and reduced net primary productivity and carbon sequestration.
The potential offsite effects on waterways include mobilisation of heavy metals, acidification, increased siltation and eutrophication. The process of acidification considered in this assessment is distinct from that associated with acid sulfate soils. Such soils occur primarily in coastal settings or with mines rich in sulfides, and naturally contain metal sulfides that severely acidify when oxidised.
Australia
Acidification is known to affect about half of Australia’s agriculturally productive soils. In 2001, the estimated annual value of lost agricultural production due to soil acidity was AUD $1.585 billion, about eight times the estimated cost of soil salinity at that time. More recent studies have confirmed the scale of the problem (e.g. Lockwood et al. 2003, SOE 2011, DAFWA 2013).
Soil acidification is widespread in the extensive farming lands of southern Australia and the rates of lime application are well short of those needed to arrest the problem (see below). Acidification is common in intensive systems of land use (tropical horticulture, sugar cane, dairying). In some regions, acidification is limiting biomass production but the degree of restriction is difficult to estimate. Trends in the tropical savannahs are uncertain. If acidification is occurring, it will be a difficult problem to solve (Noble et al. 1997, 2002). Carbon losses are most likely occurring across regions in poor condition, and unabated soil acidification will be a major constraint on storing carbon in soils in the future.
Status of the World’s Soil Resources Report, Regional Assessments of Soil Changes | Chapters 9 - 16
270
Ultimately, soil acidification restricts options for land management because acid-sensitive crops and pastures cannot be grown. It is relatively straightforward to reverse short-term soil acidification through the application of lime. However, it is much harder to reverse the problem if the acidification has advanced deeper into the soil profile, because incorporating lime at depth is prohibitively expensive. Prevention rather than cure is essential. While rates of lime application appear to be increasing (due to active extension programs), they still fall far short of what is needed to arrest the problem. The case study of southwest Western Australia (see below) provides more details. The rates of lime application are still much lower than what is needed to avoid irreparable damage. In South Australia the average quantity of lime sold annually over the past decade (113 000 tonnes) is only 53 percent of that needed to balance the estimated annual soil acidification rate (SOE 2011).
New Zealand
The acidification of legume-based pastures as a result of nitrate leaching and nutrient transfer/removal is of particular concern in New Zealand (de Klein et al., 1997). In many productive lowland pastures soil acidification is overcome through regular liming. However, amelioration of soil acidity by liming is not considered to be feasible in most hill country areas due to the high cost of aerial application (Bolan and Hedley 2003; Moir and Moot 2010). These soils are not cultivated and this enhances the risk for subsoil acidification. As a result acidification is affecting a significant portion of hill-country soils in New Zealand, which has the potential to significantly affect the capacity of many soils to sustain plant and animal production.
Papua New Guinea, Fiji and other tropical countries
Soil acidification is a problem in areas used for sugar cane in Papua New Guinea (e.g. Hartemink 1998b) and agricultural areas in Fiji (see Nutrient Imbalance). It may also be significant in tropical and subtropical areas that have been cleared but there have been few investigations.
15.5.3 Salinization and sodification
Dryland salinity
Dryland salinity is widespread across many parts of southern and eastern Australia. A large proportion of Australia’s agriculture is undertaken in areas with a rainfall of 450–800 millimetres per year. In their natural condition, these landscapes had minimal deep drainage (generally less than 20 millimetres per year), and natural stores of salt brought in by rain and dust had accumulated in the soil in many regions. The removal of native vegetation changed the hydrological cycle, because trees and shrubs intercept significant quantities of rain (typically 10–20 percent of rainfall fails to reach the soil surface). When vegetation is removed, more water either infiltrates or runs off the surface. If the original vegetation has been replaced by more shallow-rooted species that use less water (e.g. annual crops and pastures), even more water passes through the soil. This may lead to rising groundwater levels and, in some cases, dryland salinity.
Dryland salinity has been one of Australia’s most costly forms of land degradation. The comprehensive assessment by NLWRA (2001b) concluded that – assuming no changes in water imbalance – dryland salinity was expected to increase from 5.7 million hectares to 17 million hectares by 2050. In many regions, the initial and sometimes primary impact of the change in hydrological
Status of the World’s Soil Resources Report, Regional Assessments of Soil Changes | Chapters 9 - 16
271

regime is an increase in the salinity of streams and rivers (SOE 2011). However, in low relief landscapes, large areas can be salinized and this dramatically reduces the options for land use.
Between 2001 and 2009, the Millennium Drought (van Dijk et al. 2013) across southern and eastern Australia appears to have slowed spread of dryland salinity in these regions but the outlook is still problematic. Current projections of climate change are for a drying of southern Australia which should lead to a lessening of the problem. However, the long-term outlook for more recently cleared land in the northern Murray–Darling Basin and central Queensland is unclear. Large areas are yet to reach a new hydrological equilibrium after clearing. However, close surveillance of groundwater systems is essential, particularly in regions that returned to wetter conditions in the last five years. The case study below for southwest Western Australia suggests that the expansion of dryland salinity may be experiencing a temporary lull in many districts. Dryland salinity is not a significant problem in other parts of the Southwest Pacific Region.
Salinity in irrigation areas
Salinity has been a major problem in the irrigation districts of Australia, particularly in the south of the Murray-Darling Basin where most irrigation is concentrated. Salinity developed in the early 1900s soon after the first schemes were completed. The scale of the problem started to be fully recognized in the 1970s and by 2000 it was viewed alongside dryland salinity as the country’s highest priority natural resource problem (Pannell and Roberts 2010). Major investments in infrastructure, large-scale salt interception schemes, institutional reform, substantial improvements in water-use efficiency and the Millennium Drought all contributed to a mitigation of the problem (e.g. MDBA 2010). SOE (2011) were equivocal in their assessment of whether salinity was still a major problem. However, the conclusions above for dryland salinity apply equally to irrigation salinity. New irrigation development is occurring in Tasmania where landscapes have stores of salts in some settings. Irrigation developments in northern Australia and the east coast are being explored at present but salinity risks in these areas tend to be less.
Saltwater intrusion
Saltwater intrusion is a critical issue for the management of freshwater groundwater systems on most of the 1,000 or more inhabited atoll islands in the region. This issue is considered in the case study below. Throughout the region, increasing groundwater extraction (e.g. for irrigation), periods of below-average rainfall, urban development and sea-level rise have increased the risk of saltwater intrusion in coastal districts. In Australia, Werner (1999) and Ivkovic et al (2012) provide an initial assessment of the problem. There is a good awareness of salt water intrusion risks in New Zealand and only a small number of actual salt water intrusion problems have occurred. Most have been into shallow unconfined aquifers and the problems have been short-lived and adequately managed by changes to groundwater abstraction (Callander et al. 2011).
Sodicity
Australia has the largest extent of naturally sodic soils of any continent (FAO 1988) but they are relatively rare in other parts of the region. There is a large scientific literature on the management and amelioration of sodicity in Australia and reviews are provided by Loveday and Bridge (1983), Sumner and Naidu (1998) and Rengasamy (2002, 2006). Sodic soils are difficult to manage because
Status of the World’s Soil Resources Report, Regional Assessments of Soil Changes | Chapters 9 - 16
272

of their poor soil–water and soil–air relations. Swelling and dispersion of sodic aggregates reduces the porosity and permeability of soils and increases soil strength even at low suction (i.e. high water content). Sodic soils have a narrow non-limiting water range (Letey 1985) and they are typically either too wet immediately after rain or too dry within a few days for optimal plant growth. The dispersive clays cause surface crust and seal formation, poor internal drainage, and in some settings, tunnel erosion.
Rengasamy (2002) estimated that more than 60 percent of the 20 million ha of cropping soils in Australia are sodic and that the actual yield of grains on these soils is often less than half of the potential yield. However, sodicity is often associated with other subsoil constraints to root growth including alkalinity, boron toxicity and salinity so remediation is neither easy nor economic in many cases.
There are few studies on the dynamics of sodicity. Apart from irrigation systems where water supplies contain appreciable sodium, there is limited evidence to indicate that sodicity is increasing or decreasing in either severity or extent or both. In irrigation systems with appreciable sodium, salt loads are generally managed effectively. However, land-based disposal of effluent can be constrained by increasing sodicity and salt loads (Toze 2006, Balks et al. 1998, Bond 1998).
Irrigation with waters containing appreciable quantities of potassium is a common occurrence, particularly in waste waters. This monovalent cation has a similar effect as sodium, causing clay dispersion and reduced permeability. Smith et al. (2014) state that the deleterious effect of potassium is estimated to be about one-third of that of sodium.
15.5.4 Loss of soil biodiversity
Soil biology has been an active field of research in the region for many decades (e.g. CSIRO 1983, Pankhurst et al. 1994, Abbott and Murphy 2007). Much of this has had a focus on agriculture and forestry. However, there has also been a concerted effort to understand the evolution, distribution and status of biodiversity. Woodman et al. (2008) provide some preliminary assessments for Australia and outline strategies for developing a longer-term system for assessing soil biodiversity. Several significant assessments are underway in the region using molecular biological techniques. The Biome of Australia Soil Environments (BASE) is collecting samples to create a large-scale genomic database of soil biomes across Australia. Until these are completed, it is difficult to provide a definitive assessment of the loss of biodiversity in the region. However, some general inferences can be drawn.
• Above-ground biodiversity is much better characterized than soil biodiversity and there are several megadiverse districts and countries in the region.
• Areas with high above-ground biodiversity are likely to be similarly diverse below ground if their environments were relatively stable throughout the Pleistocene (e.g. the moist forests of southwest Western Australia, rainforests on the eastern escarpment of Australia, intermediate elevations in Papua New Guinea, southern districts in the South Island of New Zealand). Some ancient landscapes were submerged during this period (e.g. New Caledonia) and this most likely had an impact on soil biodiversity present today.
• A range of pressures and stressors directly affect soil biota and some have already been discussed (e.g. loss of soil carbon, acidification, physical disruption through cultivation or other means, intensification of fire regimes).
Large areas in the region have experienced these pressures and stressors. As a consequence, they are most likely experiencing a loss of soil biodiversity.
Status of the World’s Soil Resources Report, Regional Assessments of Soil Changes | Chapters 9 - 16
273

15.5.5 Water logging
No comprehensive surveys or monitoring of water logging have been undertaken at the district or national level in the region. Water logging is a significant constraint on agricultural production and extensive drainage schemes were installed during the twentieth century, particularly in low lying alluvial areas in New Zealand and eastern Australia. Texture-contrast soils with impermeable B-horizons are widespread in the pasture and cropping lands of southern Australia. Water logging is a major limiting factor of crop production in south-western Victoria (McDonald and Gardner 1987). Raised beds are sometimes used to minimize the impact of water logging and enhance crop production.
15.5.6 Nutrient imbalance
Nutrient imbalances are widespread throughout the more intensively managed landscapes of the region. Some of these have already been outlined in relation to carbon balances and acidification (see below as well). The focus here is on systems of land use where nutrient mining, depletion or accumulation may be occurring.
Nutrient mining refers to situations where there is a large removal of nutrients with minimal additions. In Australia, this has occurred in some extensive, low-input farming systems. For example, Dalal and Mayer (1986) document the decline in soil fertility over 70 years in areas used for dryland cropping in Queensland. This extensive low-input system relied on the natural fertility of its predominantly heavy clay soils (Vertisols) but it now requires fertilizer inputs to offset nutrient exports in harvested products.
Nutrient decline is occurring in other parts of the region although there are few reliable surveys and monitoring systems except in New Zealand. The shortening of rotations in the shifting agricultural systems of Melanesia caused by increased population is most likely causing nutrient decline but minimal evidence is available. Nutrient decline is also likely to be occurring on marginal lands that are degrading due to processes such as acidification and erosion. The magnitude of the nutrient loss has been documented in a few districts, particularly where sediments and nutrients have a major environmental impact.
Nutrient accumulation is a more recent phenomenon in the region and the case study on New Zealand (see below) explores several aspects. In most other Australian farming systems, fertilizer use has increased and most nutrient imbalances are managed because of the economic consequences of over- or under-use. In Australia, the use of nitrogen fertilizers has more than doubled in the last 25 years but application rates are still moderate compared to more intensively managed systems in China, Europe and the USA. Nutrient accumulation has occurred across southern Australia and in a few cases, environmental impacts are significant (e.g. the case of the Great Barrier Reef mentioned earlier and the Peel-Harvey system in Western Australia (e.g. Ruprecht et al. 2013)).
Phosphorus is naturally deficient across large parts of the region. Despite this, in Australia phosphate fertiliser use is relatively inefficient (McLaughlin et al. 1990, Weaver and Wong 2011). Most phosphorus is applied in the higher rainfall areas of southern Australia, and around 40 percent is applied to pastures. Nationally, approximately 20 percent of the phosphorus applied as fertiliser is extracted in food and fibre products for export, and about 5 percent is consumed domestically. The
Status of the World’s Soil Resources Report, Regional Assessments of Soil Changes | Chapters 9 - 16
274

remaining 75 percent of the phosphorus applied in Australian agriculture accumulates in the soil, and some of this is lost to the environment, with detrimental impacts on waterways (Simpson et al. 2011; McLaughlin et al. 2011). The accumulation of phosphorus is greatest in soils across southern Australia (e.g. Weaver and Summers 2013). Apart from the environmental risks caused by this accumulation, the inefficiency has an economic cost that will increase as fertiliser prices rise. In contrast, many grazing systems in northern Australia have pastures and animal production systems that are limited by phosphorus availability (McIvor et al. 2011).
Nutrient imbalance has been a persistent issue in soils used for sugar cane in Fiji. Production began in the 1880s and fertiliser use increased after the Second World War. Up to the 1980s, the use of particular fertilizers resulted in excess inputs of N and less than appropriate inputs of P and K (Morrison et al, 1985, 2005). After significant debate and review, blended fertilisers were introduced in the early 1990s and this has led to a more balanced input of N, P and K. However, topsoil Ca and Mg contents have dropped dramatically and this has been attributed to a continuous removal of Ca and Mg in harvested cane and by erosion. In most years, less than replacement quantities of these elements are being added in fertilisers. Another contributing factor has been a dramatic decrease in liming on sugarcane farms.
15.5.7 Compaction
Until recently, heavy machines such as tractors, harvesters and trucks were driven over most agricultural areas in the region leading to widespread soil compaction (Tullberg 2010). Damage was greatest when the soil was wet. Some of the compaction can be undone through cultivation, although it is common for plough pans to develop just below the depth of cultivation. The distribution of pressure under a heavy vehicle also results in a zone of compaction halfway between the wheels, usually at a depth of around 0.5 metres. This type of compaction is difficult to remove. Heavy animals can also compact wet soil, leading to a decline in pasture production. Most of the damage occurs in the upper part of the soil profile.
In Australia, the extent of soil compaction due to wheel traffic and its agronomic consequences have not been investigated in detail; however, it is thought to be very widespread (Chan et al. 2006; McGarry et al. 1999; Tullberg et al. 2007). A number of studies that have documented the extent and severity of compaction under different systems of land use including irrigated agriculture (McGarry 1990), cotton (Braunack and Johnston 2014), dryland cropping (Bridge and Bell 1994), sugar cane (Braunack et al. 2006), grazing and forestry (Rab 2004). Geeves et al. (1995) surveyed the physical and chemical properties of 78 soils under crops and grazed pastures judged to be representative for southern New South Wales and northern Victoria. They concluded that soil-based constraints exist in surface and subsurface soil horizons and these constraints are in some instances severe. The bulk density of B horizons ranged from 1.25 to 1.95 Mg m-3 with a mean of 1.58 Mg m-3 indicating that root growth will be restricted in many of these clay-rich horizons (Jones 1983).
Encouragingly, there has been a rapid uptake of controlled-traffic farming in Australia and New Zealand during the last 15 years. This confines compaction to the smallest possible area and has the potential to alleviate further damage. Tullberg et al. (2007) provide a detailed account of these systems and their impact on soils. The improved productivity, practicality and economic viability of controlled-traffic systems have led to enthusiastic adoption by farmers in the region. In Western
Status of the World’s Soil Resources Report, Regional Assessments of Soil Changes | Chapters 9 - 16
275

Australia, farm profit has been shown to increase by 50 percent through the adoption of controlled-traffic farming (Kingwell and Fuchsbichler 2011).
In New Zealand, deterioration of soil physical condition is common in grazed pastoral systems due to animal treading. Sparling and Schipper (2004) in their survey on the condition of soils in New Zealand reported moderate compaction on a large proportion of pasture soils and that about half the sites under dairying were below the critical threshold of 10 percent air-filled porosity. Mixed cropping soils also had low macroporosity. Drewry (2006) indicated that physical condition of the top 10-15 cm naturally recovers when animals are partially or completely excluded from pasture and proposed the integration of a recovery cycle when managing grazing systems.
15.5.8 Sealing and capping
Most towns and cities in the region were established during the 19th century and they were nearly all established on, or adjacent to, land highly suited to horticulture and cropping. The encroachment of urban and peri-urban development has seen the capping of this land. For economic reasons, it is highly unlikely that these good-quality soils will ever regain their biological function. The loss of these strategically important soils is occurring throughout the region and is particularly significant in Fiji, some of the small Pacific islands, New Zealand and Australia. Population projections (Table 15.2) indicate that the problem will intensify in coming decades. The rate of sealing and capping is not being monitored at present.
15.6 Case studies 15.6.1 Case study one: Intensification of land use in New Zealand
Significant changes in land use have occurred across New Zealand in recent decades. The impacts of these changes on soil resources are reasonably well-understood because of a substantial commitment to fundamental and applied soil research within the country. This effort is integral to the current and future international success of New Zealand’s agriculture sector.
An important development in the evolution of land use in New Zealand that contributed to intensification was the removal of all agricultural subsidies in the mid-1980s (MacLeod and Moller 2006). New Zealand is unique because it is the only developed country to be largely exposed to international markets. As a consequence, current land management decisions are now driven directly by the response of land managers to market prices for agricultural products.
The removal of subsidies triggered a decline in traditional sheep farming. Sheep numbers dropped from around 69 million in 1980 to 39 million by 2002 and 31 million in 2012. Plantation forests were established on former sheep pastures and forestry expanded from 0.85 million ha in 1980 to 1.8 million ha in 2000, with 95 percent under private ownership. The strong international demand for dairy products caused an increase in the number of dairy farms. Dairy cattle increased from around 3.0 million in 1980 to 5.3 million by 2002 and 6.4 million by 2012. Cattle stocking rates and productivity also increased (MAFF 2002, Statistics New Zealand 2012). Some of the pastures converted to plantation forests in the 1980s and 1990s are now being converted to dairy pastures following the harvesting of mature trees, and even partly grown trees have been removed and replaced by pasture for dairy farming (Sparling et al. 2014). Horticulture has also expanded. The area of horticultural crops has increased by 40 percent in just over 10 years (HortNZ 2014).
Status of the World’s Soil Resources Report, Regional Assessments of Soil Changes | Chapters 9 - 16
276

Most of the intensification of agriculture in New Zealand has occurred on the better class lands. There has also been the expansion of dairy farming onto soils that have previously been less intensively farmed, such as artificially drained Luvisols in the Southland region and irrigated stony Fluvisols and Leptosols of the Canterbury region. There has been a 6-fold increase in N fertilizer use over the past 20 years (c.f. the 2–3 fold increase in Australia) along with substantial increases in most other agricultural inputs.
Soil-based primary production is fundamental to the New Zealand economy and agricultural, horticultural and forest products together account for 60–65 percent of the country’s total export income. Understanding the pressures and changes occurring in the soils of New Zealand, especially under pasture systems, has been a major task for New Zealand soil scientists. The establishment of a coordinated soil monitoring capability (Sparling and Schipper 2002) has been important.
Taylor et al. (2010) provide an example of the insights gained from the monitoring program linked to systems for setting regional targets for various aspects of the soil resource for the Waikato region which covers much of New Zealand’s central North Island. About 58 percent of the region is in pastures, 18 percent is in plantation forestry and <1 percent is used for various types of horticulture. Monitoring started in 1995, initially as part of the national 500 soils project (Hill et al., 2003). Four issues that are causing loss of soil resource were identified and quantified in the Waikato region as follows.
1. About a third of monitoring sites under pasture had macroporosity below the lower target resulting in reduced infiltration of water which leads to runoff to waterways and attendant problems of contamination, flooding and erosion.
2. Arable and horticulture land-use showed a considerable decline in total carbon since 1990 compared with background levels, and 5 percent of sites were below the set target and likely to have reduced productive yield.
3. Dairy, horticulture and arable land uses showed considerable increases in fertility compared with non-intensified sites and appear to contribute to the continual increase in N and P detected in regional waterways.
4. Increases were detected in three categories of elements. First were those linked to fertilisers and lime (primarily P, Ca, Cd, F, and U), second were elements linked to animal remedies (including Zn and Cu) and third were elements linked to pesticide use in horticultural areas (primarily Cd and Cu).
Agricultural intensification in New Zealand has led to a much greater emphasis on understanding and management of nutrient flows and losses, particularly on grazed pastoral farms. This has included a strong focus on practices and technologies that minimise the leakage of nutrients, especially nitrogen (N) and phosphorus (P), from farms to the wider environment. This has seen farm nutrient management planning shift from a relatively small set of procedures designed to optimise fertiliser application rates for pasture and animal production to a comprehensive whole‐farm nutrient management approach that considers a range of issues to ensure both farm productivity and environmental outcomes are achieved (Monaghan et al. 2010).
Agricultural intensification in New Zealand is clearly affecting soil and water quality as measured by a variety of indicators. The effect on soil is being influenced via legislation directed at the off-site impact of land use on water quality and through a collaborative process that enables
Status of the World’s Soil Resources Report, Regional Assessments of Soil Changes | Chapters 9 - 16
277

farmers and regulators to work together so that land can be managed in the most cost-effective way possible. However, irrespective of these efforts there are still problem areas where the off-site impact may be too much to manage and that even under the best management for water quality issues, other issues such as localised contamination of soil (e.g. with Cd) will still be an issue. These are being highlighted and worked through at a regional and national level – with a requirement that regions formally report on soil quality in addition to existing requirements for water and air quality.
15.6.3 Case study two: Soil management challenges in southwest Western Australia
The southwest of Western Australia is dominated by ancient landscapes and widespread sandy soils that are strongly weathered. By world standards, the soils are infertile and have a range of physical and chemical constraints to plant growth. During the last one hundred years, large areas have been cleared for agriculture. The original perennial, deep-rooted vegetation has been replaced with shallower-rooted annual crops and pastures. Despite significant soil constraints, extensive cropping and pasture systems have developed partly due to the existence of regular winter rains. The farming systems generally operate with low-inputs of fertilizer, farm chemicals and soil ameliorants. Despite this, the region generates a large proportion of Australia’s agricultural exports.
The serious soil management challenges of the region are reasonably well understood and it is clear that the pressures of climate change and degradation of soil resources are combining to threaten the viability of many agricultural businesses. This case study focuses on just a few of the soil management challenges. The account is based almost exclusively on the comprehensive report card for sustainable natural resource use for agriculture (DAFWA 2013).
The climate of southwest Western Australia is changing and over recent decades mean temperatures have risen and annual rainfall has declined (Figures 15.3(a) and (b)). The pattern of rainfall is also changing with declines in autumn and winter rainfall and increases in spring and summer rainfall. Predictions indicate that these trends will continue and in the short term, year-to-year climate variability may be more important for agriculture than the longer term trends.
Figure 15.3: (a) Trends in winter rainfall in south-western Australia for the period 1900–2012. The 15-year running average is shown by the black line. (b) Annual mean temperature anomaly time series map for south-western Australia (1910–2012), using a baseline annual temperature (1961–1990) of 16.3 °C. 15-year running average is shown by the black line. Source: Australian Bureau of Meteorology.
Status of the World’s Soil Resources Report, Regional Assessments of Soil Changes | Chapters 9 - 16
278

Soil acidification
Soil acidity in Western Australia is estimated to cost broad-acre agriculture AUD $498 million per year (Herbert 2009) or about nine per cent of the average annual crop. It is one of the few soil constraints (particularly subsurface constraints) that can be treated with appropriate management.
Between 2005 and 2012 a total of 161 000 samples were collected from over 93 000 sites to determine soil pH (determined in calcium chloride solution - pHCa) status and trend. Figure 15.4 shows the proportion of samples below the nominated targets for Western Australia for the surface layer (0–10 cm) of pHCa 5.5 (desired target) and pHCa 5.0 (critical threshold). Soil acidity is widespread and extreme in many areas of the southwest of Western Australia, particularly in sandy soils. Surface soil pH can be increased to above target (pHCa 5.5) over significant areas with the application of one to three tonnes per hectare of good quality lime. This will cost from AUD $50 to $150 per hectare. If soil surface pH can be raised and maintained above the target this will ensure that management of subsurface acidity will be achieved over time.
There is general recognition that lime use needs to increase and the trend is positive (Figure 15.5). However, current agricultural lime sales are still only 40 percent of the estimated annual amount required to reach the recommended targets over the next 10 years (Gazey et al. 2013).
Figure 15.4: percentage of sites sampled (2005–12) with soil pH at 0–10 cm depth below the established target of pHCa 5.5 (left) and the critical pHCa 5.0 (right). Grey indicates native vegetation and reserves (Gazey et al. 2013).
Status of the World’s Soil Resources Report, Regional Assessments of Soil Changes | Chapters 9 - 16
279

Figure 15.5: Agricultural lime sales 2005–12 in the south-west of Western Australia based on data for 85–90 percent of the market.
Other soil management challenges
A range of other serious threats to soil function are prevalent in southwest Western Australia. Dryland salinity has been accelerated and enlarged by widespread clearing and land-use change. The problem affects agricultural land, water resources, natural biodiversity and the built environment. It costs hundreds of millions of dollars annually. Currently, more than one million hectares is severely salt-affected (McFarlane et al. 2004; Furby et al. 2010). Dryland salinity has expanded in most of this region since 1998, especially following episodic rainfall events (George et al. 2008a; Robertson et al. 2010). In areas cleared and developed for agriculture after 1960, most watertables continue to rise, despite a decline in annual rainfall. Dryland salinity is a potential threat to 2.8–4.5 million hectares of productive agricultural land (George et al. 2005). The long-term extent of salinity may take decades to centuries to develop (George et al. 2008b). The areas with the highest dryland salinity risk occur mostly in the highly productive, medium to high rainfall, dryland agricultural areas. Management to contain or adapt to salinity is technically feasible using plant-based and engineering options, though recovery is economically viable in only a few areas (Simons et al. 2013).
Wind erosion is a critical issue for the livestock and grains industries. Maintaining sufficient, stable soil cover throughout the year is the challenge and this is difficult in a variable and generally drying climate. Water erosion hazard, during the growing season, has diminished due to declining winter rains and more sustainable management practices. Water erosion events are mainly caused by intense, localised summer storms, and these are likely to increase with changing climate. Maintaining sufficient soil cover to prevent water erosion is not always possible in grazing systems.
Water repellence is widespread on the sandy soils of the region. The annual average opportunity-cost of lost agricultural production is estimated to be $251 million. Water repellence also increases the risk of wind and water erosion, off-site nutrient transport and possibly soil acidification through increased nitrate leaching. The extent and severity of water repellence appears to be increasing as cropping increases together with early sowing, minimum tillage and reduced break of season rainfall.
Status of the World’s Soil Resources Report, Regional Assessments of Soil Changes | Chapters 9 - 16
280

A warming and generally drying climate associated with lower organic matter inputs could limit future sequestration of organic carbon in soils used for livestock and grains production. Farming systems that increase biomass production and minimise processes such as wind and water erosion are required to maintain and improve soil carbon levels. Soil compaction is suspected to be a major constraint for all agricultural industries in the region but investigations are need to quantify its extent and severity. Finally, the nutrient status of soils has increased in agricultural systems and on average, pasture soils and arable soils contained 1.3 times and 1.6 times respectively as much phosphorus (P) as is required for optimum production.
15.6.2 Case study three: Atoll Islands in the Pacific
The fifth assessment report of the IPCC (AR5) concluded that current and future climate-related drivers of risk for small islands during the 21st century include sea level rise, cyclones, increasing air and sea surface temperatures, and changing rainfall patterns. This confirmed previous IPCC assessments and highlighted the vulnerability of small islands to multiple stressors, both climate and non-climate (Nurse et al. 2014). Limited water and soil resources are additional stressors that contribute to the vulnerability of small islands, and especially atoll islands, in the Southwest Pacific region.
The following is drawn from Morrison’s (1990, 2011) reviews of soils on atoll islands. The atoll islands are in essence reefs of variable thickness that have built up by corals resting on a volcanic base. There is a variety of atoll forms but most commonly they occur as a slightly emerged calcareous reef surrounding a lagoon. Low atolls are usually less than 5 m above sea level. Raised atolls (raised coral platforms) can be higher (e.g. Nauru and Niue). Many atolls have deposits of ash or pumice from nearby volcanic activity
The sandy textured soils on most atoll islands are highly calcareous and very permeable. They usually show minimal profile development. The soils are heavily dependent on organic matter to ensure the retention and availability of water and nutrients. Organic carbon can range from 1 to 20 percent in the surface layers depending on the vegetation and position in the landscape. There is minimal organic carbon deeper in the profile. The calcareous mineralogy and associated alkalinity cause a range of plant nutrition problems (e.g. deficiencies of K and micronutrients). The soils are prone to periods of water stress unless irrigated. In summary, the soils are infertile and poorly suited to intensive agriculture.
Population growth (Table 15.2) and increasing urbanization combined with the demise of traditional agriculture has left many of the small island nations largely dependent on imported processed food. This dependency on processed food is a significant factor contributing to declining health associated with the rise of chronic diseases like hypertension and diabetes. Local production of fresh food is therefore a necessity on atoll islands and Deenik and Yost (2006) provide a case study for the Marshall Islands.
The fertility of soils on atoll islands can be improved through the incorporation of composts and organic mulches. This was a central feature of traditional systems. Mechanised mulching and composting systems are being developed on several islands along with various irrigation systems that aim to improve water-use efficiency. However, various nutritional and soil management issues have
Status of the World’s Soil Resources Report, Regional Assessments of Soil Changes | Chapters 9 - 16
281

to be resolved, particularly in relation to the suitability of different feed stocks and the unusual soil chemistry of some islands.
The management of water is also fundamental because freshwater reserves on most atoll islands are under significant stress due to excessive groundwater extraction, contamination (e.g. from waste dumps) and saltwater intrusion. Finally, the farming systems on low atoll islands are vulnerable to salinization due to either poor quality groundwater associated with saltwater intrusion or infiltration of seawater after storm surges and flooding.
At present, there is very limited soil scientific expertise available to help develop more productive and sustainable agricultural systems on atoll islands. White and Falkland (2009), in reviewing the management of freshwater lenses on small Pacific islands, conclude that they are some of the most vulnerable aquifer systems in the world. This conclusion applies equally to the soil and food production systems on atoll islands.
15.6.4 Case study four: DustWatch – an integrated response to wind erosion in Australia
Wind erosion has environmental impacts at the source where soils are eroded (onsite wind erosion), and much greater economic and human health impacts downwind from the source where air quality is reduced (offsite wind erosion). Wind erosion has been a major problem in Australia and it continues to be significant although incidence and severity have declined since the 1940s. The good technical understanding of wind erosion in Australia has relied heavily on the development of DustWatch – a collaborative effort to monitor wind erosion across the country. This case study summarizes the status of wind erosion in Australia and provides a brief introduction to DustWatch.
Wind erosion trends for Australia
Climate is by far the strongest determinant of wind erosion. Land management can either moderate or accelerate wind erosion rates. Unravelling these two influences has been difficult, but between 2001 and 2009 the Millenium Drought – the worst on record (Van Djik et al. 2013) – provided an opportunity to gauge the effectiveness of improvements in land management that had occurred in recent decades across the country.
Historical accounts indicate that wind erosion was very active during the drought periods of the late 19th and early 20th centuries (e.g. Ratcliffe, 1938). While these anecdotal reports present dramatic images of huge dust storms engulfing rural towns, and sand drifts burying fence lines and blocking rural roads, until recently it had not been unequivocally established whether the ‘dust bowl years' of the 1940s were due to extreme drought, poor land management or both.
McTainsh et al. (2011) have analysed wind erosion activity during the 1940s and 2000s. They used archived meteorological data to calculate the dust storm index (DSI) for both periods (McTainsh 1998, McTainsh et al. 2007). The DSI, which provides a measure of the frequency and intensity of wind erosion activity, is the accepted measure of wind erosion activity in Australia (Bastin 2008, SOE 2011). Overall, mean onsite wind erosion in the 1940s was almost six times higher (mean DSI = 11.4) than in the 2000s (mean DSI = 2.0), and the mean maximum DSI for the 1940s was four times that of the 2000s (SOE 2011).
Status of the World’s Soil Resources Report, Regional Assessments of Soil Changes | Chapters 9 - 16
282

There were also significant differences between districts and the decrease in wind erosion in the 2000s was much more pronounced in the east and centre of the continent. The 1940s erosion rate in central Australia was large, but the decrease in the 2000s was less than elsewhere. There has also been a large decrease in the number of dust storms reaching the coastal cities.
O’Loingsigh et al. (2015) confirmed these findings by using Dust Event Days (DED) and a modified version of a published Dust Storm Index (DSI) to show that wind erosion during the WWII Drought (1937-1945) was up to 4.6 times greater than during the Millennium Drought.
Despite these trends, the Millennium Drought resulted in large dust storms and other wind erosion activity. Two extreme dust storms hit eastern Australian cities on 23rd October 2002 and 23rd September 2009. The ‘Red Dawn’ dust storm on the 22nd and 23rd September 2009 was the largest to pass over the coastal city of Sydney since reliable records began in 1940 (Figure 15.6). Visibility was reduced to 400 m and the maximum hourly PM10 concentration was 15 366 μg/m3 – the highest ever recorded for Sydney and possibly any Australian capital city. The Australian air quality standard of 50 μg/m3 per 24 h was massively exceeded in suburban Sydney (1734 μg/m3) and 150 km to the north in the city of Newcastle (2426 μg/m3).
Status of the World’s Soil Resources Report, Regional Assessments of Soil Changes | Chapters 9 - 16
283

Figure 15.6: MODIS image for 0000 23 September 2009 showing Red Dawn extending from south of Sydney to the Queensland/NSW border and the PM10 concentrations measured using Tapered Element Oscillating Microbalances (TEOM) at the same time at ground stations.
Red Dawn was caused by drought and extreme winds. The source of the red dust was primarily the sand plains of western New South Wales, the sand plains, riverine channels and lakes of the lower Lake Eyre Basin and the Channel Country of Queensland. The estimate of total suspended particulate sediment lost off the Australian coast for the 3000 km long Red Dawn dust storm was 2.54 Mt with a plume height of 2500 m. This is the largest off-continent loss of soil ever reported using measured, as opposed to modelled, dust concentrations for Australia (Leys et al. 2011). This single event resulted in economic costs of between AUD $293–A$313 million with most being associated with household cleaning and associated activities. The dust storm also affected the state of Queensland, but costs there were not included in the study by Tozer and Leys (2013).
Status of the World’s Soil Resources Report, Regional Assessments of Soil Changes | Chapters 9 - 16
284
The DustWatch network
Australia has a long tradition of participatory and collaborative approaches to natural resource management. DustWatch (Leys et al. 2013, DustWatch 2014) fits within this broader tradition and it was established to fill some of the gaps in the measurement networks of wind erosion and to supplement land-management information provided by community participants.
Measuring and monitoring wind erosion is problematic because of the irregular nature of wind erosion in space and time. DustWatch aimed to build on the long record of observations collected by the Australian Bureau of Meteorology (BoM) by strategically adding a community network of observers and instruments to fill identifiable gaps in the BoM network. DustWatchers use the same basic measurement protocols as the BoM. In addition, satellite imagery is used wherever possible to help define source areas and dust paths. Remote sensing alone has not been successful due to the presence of cloud and the low resolution of geostationary satellites and the low temporal resolution of satellites with better spatial resolution. DustWatch has successfully mixed the formal reporting of wind erosion activity from the BoM with informal community networks, instrumented sites and ad hoc satellite data to provide an understanding of wind erosion in Australia. The major outcomes from DustWatch have been:
• better reporting of the extent and severity of wind erosion across Australia at national to regional scales
• greater dialogue between the scientists and the community • increased awareness of the impact of wind erosion on the environment • documentation of local community knowledge on why and where wind erosion is occurring.
DustWatch is important because it has provided new data sources when other formal data sources are declining. This includes valuable land-management information from local landholders. The spatial and temporal data are also provided at the correct scales for testing physical models and remote sensing products. This ultimately has provided the capability for understanding how wind erosion processes are influenced by climate and land management.
15.7 Conclusions The status of soil resources in the Southwest Pacific region is mixed. The region is a globally
significant exporter of agricultural products and nearly all of the 24 countries rely heavily on soils for wealth generation. The threats to soil function in some countries are serious and require immediate action to avoid large scale economic costs and environmental losses. These threats to soil function combined with other pressures caused by increasing population and climate change are especially challenging in southwest Western Australia and on the atoll islands of the Pacific. It is difficult to assess some threats because of the lack of surveys and monitoring networks. The example of soil monitoring from New Zealand demonstrates the practical value in having the capability to track and respond to soil change. The intensification of land use in New Zealand and to a lesser extent Australia provides an indication of the soil management challenges that will dominate in coming years as countries attempt to substantially increase food production within a resource constrained world. Poor land management practices, and especially uncontrolled logging in the low-income countries in the
Status of the World’s Soil Resources Report, Regional Assessments of Soil Changes | Chapters 9 - 16
285

Southwest Pacific are a significant challenge to national prosperity and the overall security of the region.
Table 15.4 Summary of Soil Threats Status, trends and uncertainties in the Southwest Pacific
15.8 References Abbott, L. K., and Murphy, D. V., 2003. Soil biological fertility: a key to sustainable land use in agriculture. Kluwer Academic Publishers, Dordrecht; Boston.
Badgery, W. B., Simmons, A. T., Murphy, B. M., Rawson, A., Andersson, K. O., Lonergan, V. E., and van de Ven, R. ,2013. Relationship between environmental and land-use variables on soil carbon levels at the regional scale in central New South Wales, Australia. Soil Research 51, 645-656.
Baldock, J., Macdonald, L., Sanderman, J., 2013. Foreword to ‘Soil Carbon in Australia’s Agricultural Lands’ Soil Research 51, i.
Very poor
Poor Fair GoodVery good
In condition In trend
Soil acidification A widespread and serious problem that has the potential to cause irreversible damage to soils particularly in southern Australia, tropical landscapes and areas where product removal and leaching are contributing factors. ↙ ◒ ●
Soil erosion Improved land management practices in Australia and New Zealand have reduced erosion rates but the problem is still serious in some districts. Unsustainable rates of soil loss are associated with logging and clearing in several Pacific nations ↗ ◒ ◒
Organic carbon change The conversion of land to agricultural uses has generally caused large losses of organic carbon in soils. Improved land management practices have stabilized the situation but there is limited evidence for increasing soil carbon even under these more conservative management systems. ~ ● ◒
Nutrient imbalance Rapid intensification of agriculture in New Zealand and more recently Australia is causing significant environmental impact, particularly due to the large increase in fertilizer use and ruminant animals. In other districts, nutrient mining and decline is occuring due to insufficient replacment of nutrients removed through harvest or other loss-pathways. ↙ ● ◒
Compaction Limited evidence suggests the problem is constraining plant growth across large areas, particularly in the cropping and pasture lands of Australia and smaller areas in New Zealand. Controlled traffic and other improved management practices may have halted this decline in soil physical fertility.
− ◒ ●Sealing and capping Loss of good quality agricultural land due to urban and industrial expansion is an emerging and
potentially major problem for all countries in the region. ↙ ◒ ●Contamination Most sources of soil contamination are now regulated and controlled although the legacy of
past practices is significant (e.g. Cd in fertilizers). Contamination caused by mining and waste disposal is a significant issue for several Pacific nations. ↗ ● ●
Salinization and sodification
Salinization is a widespread and expensive problem in Australia and some atoll islands. After a temporary respite due to dry years, the problem may continue to expand and the time to equilibration is likely to be in the order of decades. − ● ◒
Loss of soil biodiversity Rates of loss were most likely highest during the expansion of agriculture, particularly over the last 100 years, and this may have slowed. However, information on baselines and trends is lacking in nearly all districts and countries. ~ ○ ○
Waterlogging Waterlogging is a constraint to agricultural production in some wet years but evidence on the extent and severity is lacking. Large areas were drained to address the problem, particularly in New Zealand and parts of coastal Australia. − ◒ ◒
Symbol Definition
− Stable
~ Variable
↙ Deteriorating
↗ Improving
○ Evidence and consensus is low
◒ Limited evidence or limited consensus
● Adequate high-quality evidence and high level of consensus
Condition and Trend Confidence
Threat to soil function Summary
Status of the World’s Soil Resources Report, Regional Assessments of Soil Changes | Chapters 9 - 16
286
Balks, M. R., Bond, W. J., Smith, C. J., 1998. Effects of sodium accumulation on soil physical properties under and effluent-irrigated plantation. Aust. J. Soil Res. 36, 821–830.
Bastin, G., 2008. ACRIS Management Committee. Rangelands 2007: taking the pulse. Canberra: National Land & Water Resources Audit, Canberra.
Beare, M. H., McNeil, S. J, Curtin D, Parfitt, R.L., Jones, H. S., Dodd, M. B., Sharp J., 2014. Estimating the organic carbon stabilisation capacity and saturation deficit of soils: a New Zealand case study. Biogeochemistry 120, 71-87.
Bolan, N. S., Hedley, M. J., 2003. Role of carbon, nitrogen, and sulfur cycles in soil acidification. In: Handbook of Soil Acidity. Ed. Zdenko Rengel. Marcel Dekker, Inc. New York. pp. 29–56.
Bolton, B., 2009. The Fly River, Papua New Guinea: environmental studies in an impacted tropical river system. Developments in Earth and Environmental Sciences. Volume 9, Pages 1-620 (Elsevier, Burlington, MA, USA).
Bond, W. J., 1998. Effluent irrigation—an environmental challenge for soil science. Aust. J. Soil Res. 36, 543–555.
Bowler, J. M., Johnston, H., Olley, J. M., Prescott, J. R., Roberts, R. G., Shawcross, W., Spooner, N. A. ,2003. New ages for human occupation and climatic change at Lake Mungo, Australia. Nature 421, 837–840.
Braunack, M. V., Arvidsson, J., Hakansson, I., 2006. Effect of harvest traffic position on soil conditions and sugarcane (Saccharum officinarum) response to environmental conditions in Queensland, Australia. Soil & Tillage Research 89, 103-121.
Braunack, M. V., Johnston, D. B., 2014. Changes in soil cone resistance due to cotton picker traffic during harvest on Australian cotton soils. Soil & Tillage Research 140, 29-39.
Bridge, B. J., Bell, M. J., 1994. Effect of Cropping on the Physical Fertility of Krasnozems. Australian Journal of Soil Research 32, 1253-1273.
Brodie, J., Waterhouse, J., Schaffelke, B., Kroon, F., Thorburn, P., Rolfe, J., Johnson, J., Fabricius, K., Lewis, S., Devlin, M., Warne, M., McKenzie, L., 2013. 2013 Scientific consensus statement. Land use impacts on Great Barrier Reef water quality and ecosystem condition. State Government of Queensland.
Bui, E., Hancock, G., Chappell, A., Gregory, L. , 2010. Evaluation of tolerable erosion rates and time to critical topsoil loss in Australia. Canberra: CSIRO Sustainable Agriculture Flagship.
Bui, E. N., Hancock, G. J., Wilkinson, S. N., 2011. 'Tolerable' hillslope soil erosion rates in Australia: Linking science and policy. Agriculture Ecosystems & Environment 144, 136-149.
Callander, P., Lough, H., Steffens, C., 2011. New Zealand Guidelines for the Monitoring and Management of Sea. Envirolink Project 420-NRLC50, Christchurch, New Zealand.
Campbell, D.I., Wall, A.A., Nieveen, J.P., Schipper L.A., 2015. Variations in CO2 exchange for dairy farms with year-round rotational grazing on peat soils. Agriculture, Ecosystems and Environment. 202, 68–78.
Campbell, I. C., 2011. Science, governance and environmental impacts of mines in developing countries: lessons from Ok Tedi in Papua New Guinea pp. 583-598. In Water Resources Planning and
Status of the World’s Soil Resources Report, Regional Assessments of Soil Changes | Chapters 9 - 16
287
Management (Eds R. Quentin Grafton & K. Hussey) Cambridge University Press http://dx.doi.org/10.1017/CBO9780511974304.030
Carter, M. R., Gregorich, E. G., 2010. Carbon and nitrogen storage by deep-rooted tall fescue (Lolium arundianaceum) in the surface and subsurface soil of a fine sandy loam in eastern Canada. Agriculture Ecosystems and Environment 136, 125-132.
Cartwright, B., Merry, R. H., Tiller, K. G., 1976. Heavy metal contamination of soils around a lead smelter at Port Pirie, South Australia. Aust. J. Soil Res. 15, 69-81.
Cavanagh, J., 2014. Status of cadmium in New Zealand soils: 2014. Landcare Research, Lincoln.
Chan, K. Y., Oates, A., Swan, A. D., Hayes, R. C., Dear, B. S., and Peoples, M. B., 2006. Agronomic consequences of tractor wheel compaction on a clay soil. Soil & Tillage Research 89, 13-21.
Chen, C., Randall, A., 2013. The economic contest between coal seam gas mining and agriculture on prime farmland: it may be closer than we thought. Journal of Economic and Social Policy 15 <http://epubs.scu.edu.au/jesp/vol15/iss3/5>
Condron L. M., Hopkins D. W., Gregorich, E. G., Black, A., Wakelin, S. A., 2014. Long-term irrigation effects on soil organic matter under temperate grazed pasture. European Journal of Soil Science 65, 741-750.
Condron, L.M., Di, H.J., 2002. Capacity of soils to sustain or extend current crop and animal production: New Zealand and South Pacific Islands Perspective. In: Agricultural Sciences. Ed. Rattan Lal. Encyclopaedia of Life Support Systems, UNESCO. EOLSS Publishers, Oxford, UK.
Cotching, W. E., Oliver, G., Downie, M., Corkrey, R., Doyle, R. B., 2013. Land use and management influences on surface soil organic carbon in Tasmania. Soil Research 51, 615-630.
Cowie, A. L., Lonergan, V. E., Rabbi, S. M. F., Fornasier, F., Macdonald, C., Harden, S., Kawasaki, A., Singh, B. K., 2013. Impact of carbon farming practices on soil carbon in northern New South Wales. Soil Research 51, 707-718.
Craighead, M. D., 2005. The effect of two lime sources on short-term changes in soil pH under Marlborough hill country pasture. Proceedings of the New Zealand Grassland Association 67, 155–162.
CSIRO 1983. ‘Soils: an Australian viewpoint.’ (CSIRO: Melbourne/Academic Press: London).
DAFWA 2013. Report card on sustainable natural resource use in agriculture. Department of Agriculture and Food, Western Australia.
Dalal, R. C., Mayer, R. J. 1986. Long term trends in fertility of soils under continuous cultivation and cereal cropping in southern Queensland. I. Overall changes in soil properties and trends in winter cereal yields. Australian Journal of Soil Research 24, 265-279.
Davy, M. C., Koen, T. B. 2013. Variations in soil organic carbon for two soil types and six land uses in the Murray Catchment, New South Wales, Australia. Soil Research 51, 631-644.
de Klein, C. A. M., Monaghan, R. M., Sinclair, A. G., 1997. Soil acidification: a provisional model for New Zealand pastoral systems. New Zealand Journal of Agricultural Research. 40, 541–557.
Status of the World’s Soil Resources Report, Regional Assessments of Soil Changes | Chapters 9 - 16
288

Denham, T. P., Haberle, S. G., Lentfer, C., Fullagar, R., Field J., Therin, M., Porch, N., Winsborough, B., 2003. Origins of Agriculture at Kuk Swamp in the Highlands of New Guinea. Science 301, 189-193.
DEST 2003. Rehabilitation of former nuclear test sites at Emu and Maralinga (Australia) 2003. Report by the Maralinga Rehabilitation Technical Advisory Committee. Australian Government Department of Education, Science and Training, Canberra.
Dodd, M. B., Mackay, A. D., 2011. Effects of contrasting soil fertility on root mass, root growth, root decomposition and soil carbon under a New Zealand perennial ryegrass/white clover pasture. Plant and Soil 349, 291-302.
Drewry, J. J., 2006. Natural recovery of soil physical properties from treading damage of pastoral soils in New Zealand and Australia: a review. Agriculture, Ecosystems and Environment. 114, 159–169.
DustWatch 2014. See <www.dustwatch.edu.au/>.
Eyles, G. O., 1983. The distribution and severity of present soil erosion in New Zealand. New Zealand Geographer 39, 12-28.
Friedlaender J. S., Friedlaender, F. R., Reed, F. A., Kidd, K. K., Kidd, J. R., et al. ,2008. The Genetic Structure of Pacific Islanders. PLoS Genet 4(1): e19. doi:10.1371/journal.pgen.0040019
Furby, S. L., Caccetta, P. A. & Wallace, J. F., 2010. Salinity monitoring in Western Australia using remotely sensed and other spatial data. J. Environ. Qual. 39:16–25.
Gazey, C., Andrew, J., Griffin, E., 2013. ‘Soil acidity’. In: Report card on sustainable natural resource use in agriculture, Department of Agriculture and Food, Western Australia.
Geeves, G. W., Cresswell, H. P., Murphy, B. W., Gessler, P. E., Chartres, C. J., Little, I. P., and Bowman, G. M., 1995. The physical, chemical and morphological properties of soils in the wheat-belt of southern NSW and northern Victoria. NSW Department of Conservation and Land Management/CSIRO Aust. Division of Soils Occasional Report.
George, R. J., Kingwell, R., Hill-Tonkin, J., Nulsen, R., 2005. Salinity investment framework: Agricultural land and infrastructure. Resource management technical report 270. Department of Agriculture, Western Australia.
George, R. J., Speed, R. J., Simons, J. A., Smith, R. H., Ferdowsian, R., Raper, G. P., Bennett, D. L., 2008. Long-term groundwater trends and their impact on the future extent of dryland salinity in Western Australia in a variable climate, 2nd International Salinity Forum: Salinity, water and society - Global issues, local action. Adelaide, South Australia 31 March – 3 April.
Glatthaar, D., 1988. The sediment load of the Waimanu River. (Southeastern Viti Levu, Fiji). pp. 52-75. In: H. Liedtke and D. Glatthaar: Report about two research projects in the Republic of Fiji, sponsored by the German Research Foundation (Deutsche Forschungsgemeinschaft, Bonn, Federal Republic of Germany. Geographical Institute, Ruhr-University Bochum, Bochum).
Hartemink, A. E., 1998a. Soil chemical and physical properties as indicators of sustainable land management under sugar cane in Papua New Guinea. Geoderma 85, 283-306.
Hartemink, A. E., 1998b. Acidification and pH buffering capacity of alluvial soils under sugarcane. Experimental Agriculture 34, 231-243.
Status of the World’s Soil Resources Report, Regional Assessments of Soil Changes | Chapters 9 - 16
289

Hort N.Z., 2014. Industry statistics. <http://www.hortnz.co.nz/Overview/About-Us/Industry-statistics.htm> viewed November 2014.
Jones, C. A., 1983. Effect of soil texture on critical bulk densities for root growth. Soil Science Society of America Journal 47, 1208-1211.
Kelliher, F. M., Condron, L. M., Cook, F. J., Black, A., 2012. Sixty years of seasonal irrigation affects carbon storage in soils beneath pasture grazed by sheep. Agriculture Ecosystems and Environment 148: 29-36.
Kelliher, F. M., Curtin, D., Condron, L. M. , 2013. Soil carbon stocks in particle-size fractions under seasonally irrigated, grazed pasture. New Zealand Journal of Agricultural Research 56, 239-244.
Kingwell, R., and Fuchsbichler, A. , 2011. The whole-farm benefits of controlled traffic farming: An Australian appraisal. Agricultural Systems 104, 513-521.
Leslie, D. M., Ratukalou, I., 2002. Review of rural land use in Fiji: opportunities for the new millennium. Secretariat of the Pacific Community, Suva.
Letey, J., 1985. Relationship between soil physical properties and crop production. In Advances in soil science, 277-294.
Leys, J., McTainsh, G., Strong, C., Heidenreich, S., Biesaga, K., 2008. DustWatch: using community networks to improve wind erosion monitoring in Australia. Earth Surface Processes and Landforms 33, 1912-1926.
Leys, J. F., Heidenreich, S. K., Strong, C. L., McTainsh, G. H., Quigley, S., 2011. PM10 concentrations and mass transport during "Red Dawn" - Sydney 23 September 2009. Aeolian Research 3, 327-342.
Liedtke, H., 1989. Soil erosion and soil removal in Fiji. Applied Geography and Development 33, 68-92.
Lockwood, P., Wilson, B., Daniel, H., Jones, M., 2003. Soil acidification and natural resource management: directions for the future. University of New England, Armidale, NSW.
Löffler, E., 1977. Geomorphology of Papua New Guinea. CSIRO and Australian National University Press, Canberra.
Löffler, E., 1979. Papua New Guinea. Hutchinson, Australia.
MAF, 2011. Cadmium and New Zealand agriculture and horticulture: a strategy for long term risk management. New Zealand Ministry of Agriculture and Forestry, Wellington.
Maragos, J.E., Baines, G.B.K. and Beveridge, P.J., 1973. Tropical cyclone Bebe creates a new land form in Funafuti atoll. Science, 1981, 1161-1164.
MacLeod, C. J., Moller, H., 2006. Intensification and diversification of New Zealand agriculture since 1960: an evaluation of current indicators of land use change. Agriculture, Ecosystems and Environment 115, 201–218.
McDonald, G. K., Gardner, W. K., 1987. Effect of waterlogging on the grain yield response of wheat to sowing data in south-western Victoria. Australian Journal of Experimental Agriculture 27, 661-670.
Status of the World’s Soil Resources Report, Regional Assessments of Soil Changes | Chapters 9 - 16
290

McFarlane, D. J., George, R. J., Caccetta, P. A., 2004. The extent and potential area of salt-affected land in Western Australia estimated using remote sensing and Digital Terrain Models. In Proc. of Engineering Salinity Solutions, Perth, Western Australia. 9–12 November. Institution of Engineers, Barton, Australian Capital Territory.
McGarry, D., 1990 Soil compaction and cotton growth on a Vertisol. Aust. J. Soil Research 28, 869-877.
McGarry, D., Sharp, G., Bray, S. G., 1999. The Current Status of Soil Degradation in Queensland Cropping Soils. Queensland Department of Natural Resources, DNRQ990092. pp. 16.
McGlone, M. S., 1989. The Polynesian settlement of New Zealand in relation to environmental and biotic changes. New Zealand Journal of Ecology 12, 115-129.
McIvor, J. G., Guppy, C., Probert, M. E. , 2011. Phosphorus requirements of tropical grazing systems: the northern Australian experience. Plant and Soil 349, 55-67.
McLaughlin, M. J., Fillery, I. R., Till, A. R. , 1990. Operation of the phosphorus, sulphur and nitrogen cycles. In: Gifford R. M., Barton M. M., eds. Australia’s renewable resources: sustainability and global change: IGBP-Australia Planning Workshop.
McLaughlin, M. J., McBeath, T. M., Smernik, R., Stacey, S. P., Ajiboye, B., Guppy, C., 2011. The chemical nature of P accumulation in agricultural soils-implications for fertiliser management and design: an Australian perspective. Plant and Soil 349, 69-87.
McTainsh G., 1998. Dust storm index. In: Sustainable agriculture: assessing Australia’s recent performance. A report to the Standing Committee on Agriculture and Resource Management of the National Collaborative Project on Indicators for Sustainable Agriculture. Collingwood: CSIRO Publishing.
McTainsh G., Tews E., Leys J., Bastin G., 2007. Spatial and temporal trends in wind erosion of Australian rangelands during 1960 to 2005 using the dust storm index (DSI). Australian Collaborative Rangeland Information System. Canberra: Australian Government Department of the Environment, Water, Heritage and the Arts.
McTainsh G., Leys J., O’Loingsigh T., Strong C., 2011. Wind erosion and land management in Australia during 1940–1949 and 2000–2009. Report prepared for the Australian Government Department of Sustainability, Environment, Water, Population and Communities on behalf of the State of the Environment 2011 Committee. DSEWPaC, Canberra.
Ministry for the Environment. 2010. Proposed national environmental standard for assessing and managing contaminants in soil: discussion document. New Zealand Ministry for the Environment, Wellington.
Moir, J. L., Moot, D. J., 2010. Soil pH, exchangeable aluminium and lucerne yield responses to lime in a South Island high country soil Proceedings of the New Zealand Grassland Association 72, 191-196.
Monaghan, R. M., Houlbrooke, D. J., Smith, L. C., 2010. The use of low-rate sprinkler application systems for applying farm dairy effluent to land to reduce contaminant transfers. New Zealand Journal of Agricultural Research 53, 389–402
Moorehead, A. (Ed.), 2011. Forests of the Pacific Islands: foundation for a sustainable future. Secretariat of the Pacific Community, Suva.
Status of the World’s Soil Resources Report, Regional Assessments of Soil Changes | Chapters 9 - 16
291
Morrison, R. J., 1990. Pacific atoll soils: chemistry, mineralogy and classification. Atoll Research Bulletin 339, 1-25.
Morrison, R. J., 2011. Soils of low elevation coral structures. In: D. Hopley (Editor), Encyclopedia of Modern Coral Reefs, Springer, New York, pp 1019-1024.
Morrison, R. J., Sivan, P., Krishnamurthi, M., Deo, V., Vula, E., Jogia, D. L., 1985. Report of the Cabinet Committee investigating the fertilizer procurement and distribution practices of the Fiji Sugar Corporation (Report to the Fiji Cabinet, 58p)
Morrison, R. J., Gangaiya, P., Koshy, K., 1996. Contaminated soils in the South Pacific islands. In Contaminants and the Soil Environment in the Australasia-Pacific Region (pp. 659-675). Springer Netherlands.
Morrison R. J., Gawander J. S. (in press). Changes in the properties of Fijian Oxisols over 30 years of sugarcane cultivation. Soil Research.
Morrison, R. J., Gawander, J. S., Ram, A. N., 2005. Changes in the properties of a Fijian Oxisol over 25 years of sugarcane cultivation. In: D. M. Hogarth (Editor) Proceedings International Society of Sugar Cane Technologies XXV Congress, Guatemala, Volume 2, pp. 139-146.
Morrison R. J., Manner, H. I., 2005. The pre-mining pattern of soils on Nauru, Central Pacific. Pacific Science 59, 523−540.
Morrison, R. J., Munro, A. J., 1999. Waste management in the small island developing states of the South Pacific: an overview. Australian Journal of Environmental Management, 6, 232-246.
Morrison, R. J., Seru, V. B. (1985). Soils of Abatao Islet, Tarawa, Kiribati. INR Environmental Studies Report No. 27, University of the South Pacific, 81p.
MDBA (2010) Murray-Darling Basin Authority. Report of the Independent Audit Group for Salinity 2009-10. MDBA, Canberra. http://www.mdba.gov.au/sites/default/files/pubs/Report-of-the-Independent-Auditors-for-Salinity-2009-10.pdf
Mudge, P. L., Wallace, D. F., Rutledge, S., Campbell, D. I., Schipper, L. A., Hosking, C. L. (2011). Carbon balance of an intensively grazed temperate pasture in two climatically contrasting years. Agriculture Ecosystems and Environment 144: 271-280.
Naidu, R., Sumner, M. E., Rengasamy, P. (Eds), 1995. ‘Australian sodic soils. Distribution, properties and management.’ (CSIRO Publishing: Melbourne).
Nieeven, J. P., Campbell D. I., Schipper, L. A., Blair, I. J., 2005. Carbon exchange of grazed pasture on a drained peat soil. Global Change Biology 11: 607-618.
NLWRA, 2001a. Australian agricultural assessment 2001. Volume 1. National Land and Water Resources Audit, Canberra.
NLWRA, 2001b. Australian dryland salinity assessment 2000: extent, impacts, processes, monitoring and management options. National Land and Water Resources Audit, Canberra.
Nurse, L. A., McLean, R.F., Agard, J., Briguglio, L.P., Duvat-Magnan, V., Pelesikoti, N., Tompkins, E., Webb, A., 2014. Small islands. In: Climate Change 2014: Impacts, Adaptation, and Vulnerability. Part B: Regional Aspects. Contribution of Working Group II to the Fifth Assessment Report of the Intergovernmental Panel on Climate Change [Barros, V. R., C. B. Field, D. J. Dokken, M. D. Mastrandrea, K. J. Mach, T. E. Bilir, M. Chatterjee, K. L. Ebi, Y. O. Estrada, R. C. Genova, B.
Status of the World’s Soil Resources Report, Regional Assessments of Soil Changes | Chapters 9 - 16
292

Girma, E. S. Kissel, A. N. Levy, S. MacCracken, P. R. Mastrandrea, L. L.White (eds.)]. Cambridge University Press, Cambridge, United Kingdom and New York, NY, USA, pp. 1613-1654
Noble, A. D., Cannon, M., and Muller, D., 1997. Evidence of accelerated soil acidification under Stylosanthes-dominated pastures. Australian Journal of Soil Research 35, 1309-1322.
Noble, A. D., Middleton, C., Nelson, P. N., and Rogers, L. G., 2002. Risk mapping of soil acidification under Stylosanthes in northern Australian rangelands. Australian Journal of Soil Research 40, 257-267.
O'Connell, J. F., Allen, J., 2004. Dating the colonization of Sahul (Pleistocene Australia–New Guinea): a review of recent research. Journal of Archaeological Science 31, 835-853.
O'Loingsigh, T., McTainsh, G. H., Parsons, K., Strong, C. L., Shinkfield, P., Tapper, N. J., 2015. Using meteorological observer data to compare wind erosion during two great droughts in eastern Australia; the World War II Drought (1937–1946) and the Millennium Drought (2001–2010). Earth Surface Processes and Landforms 40, 123-130.
Ollier, C. D., 1982. The Great Escarpment of eastern Australia: tectonic and geomorphic significance. Journal of the Geological Society of Australia 29, 13–23.
Page, K. L., Dalal, R. C., Pringle, M. J., Bell, M., Dang, Y. P., Radford, B., and Bailey, K., 2013. Organic carbon stocks in cropping soils of Queensland, Australia, as affected by tillage management, climate, and soil characteristics. Soil Research 51, 584-595.
Page, M. J., Trustrum, N. A., Brackley, H., Baisden, W.T., 2004. Erosion-related soil carbon fluxes in a pastoral steepland catchment, New Zealand. Agriculture Ecosystems and Environment 103, 561-579.
Pankhurst, C. E., Doube, B. M., Gupta V. V. S. R., Grace, P. R.,1994. Soil biota: management in sustainable farming systems. CSIRO, East Melbourne.
Parfitt, R. L., Baisden, W. T., Ross, C. W., Rosser, B.J., Schipper, L. A., Barry, B., 2013. Influence of erosion and deposition on carbon and nitrogen accumulation in resampled steepland soils under pasture in New Zealand. Geoderma 192, 154-159.
Parfitt, R. L., Steveson, B. A., Ross, C., Fraser, S., 2014. Change in pH, bicarbonate-extractable-P, carbon and nitrogen in soils under pasture over 7 to 27 years. New Zealand Journal of Agricultural Research 57, 216-227.
Rab, M. A., 2004. Recovery of soil physical properties from compaction and soil profile disturbance caused by logging of native forest in Victorian Central Highlands, Australia. Forest Ecology and Management 191, 329-340.
Ratclife F., 1938. Flying fox and drifting sand: the adventures of a biologist in Australia. New York: RM McBride & Co.
Reisinger, A., Kitching, R. L., Chiew, F., Hughes, L., Newton, P. C. D., Schuster, S. S., Tait, A., Whetton, P., 2014. Australasia. In: Climate Change 2014: Impacts, Adaptation, and Vulnerability. Part B: Regional Aspects. Contribution of Working Group II to the Fifth Assessment Report of the Intergovernmental Panel on Climate Change [Barros, V. R., C. B. Field, D. J. Dokken, M. D. Mastrandrea, K. J. Mach, T. E. Bilir, M. Chatterjee, K. L. Ebi, Y. O. Estrada, R. C. Genova, B. Girma, E. S. Kissel, A. N. Levy, S. MacCracken, P. R. Mastrandrea, L. L.White (eds.)]. Cambridge University Press, Cambridge, United Kingdom and New York, NY, USA, pp. 1371-1438.
Status of the World’s Soil Resources Report, Regional Assessments of Soil Changes | Chapters 9 - 16
293

Roberts, R. G., Flannery, T. F., Ayliffe, L. K., Yoshida, H., Olley, J. M., Prideaux, G. J., Laslett, G. M., Baynes, A., Smith, M. A., Jones, R., Smith, B. L., 2001. New ages for the last Australian megafauna: continent-wide extinction about 46,000 years ago. Science 292, 1888–1892.
Roberts, A. H. C., Cameron, K. C., Bolan, N. S., Ellis, H. K., Hunt, S., 1996. Contaminants and the soil environment in New Zealand. In Contaminants and the soil environment in the Australasia-Pacific Region (pp. 579-628). Springer Netherlands.
Roberts, R. G., Jones, R., Smith, M. A., 1990. Thermoluminscence dating of a 50,000-year-old human occupation site in northern Australia. Nature 345, 153–156.
Roberts, R.G., Jones, R., Spooner, N.A., Head, M.J., Murray, A.S., Smith, M. A., 1994. The human colonisation of Australia: optical dates of 53,000 and 60,000 years bracket human arrival at Deaf Adder Gorge, Northern Territory. Quaternary Science Reviews 13, 575–583.
Robertson, M.J., George, R.J., O’Connor, M. H., Dawes, W., Oliver, Y. M., Raper, G. P., 2010. Temporal and spatial patterns of salinity in a catchment of the central Wheatbelt of Western Australia. Australian Journal of Soil Research 48, 326–36.
Rosser, B. J., Ross, C.W., 2011. Recovery of pasture production and soil properties on soil slips scars in erodible hill siltstone country, Wairarapa, New Zealand. New Zealand Journal of Agricultural Research 54, 23-44.
Rumpel C., Kögel-Knabner I., 2011. Deep soil organic matter – a key but poorly understood component of terrestrial C cycle. Plant and Soil 338, 143-158.
Ruprecht J., Vitale S., Weaver, D., 2013. Nutrient export (phosphorus). In: Report card on sustainable natural resource use in agriculture. Department of Agriculture and Food, Western Australia.
Sanderman J., Farquharson R., Baldock J., 2010. Soil carbon sequestration potential: a review for Australian agriculture. Report prepared for the Australian Government Department of Climate Change and Energy Efficiency. Canberra: Commonwealth Scientific and Industrial Research Organisation, 2010 (www.csiro.au/files/files/pwiv.pdf).
Sanderman, J., and Baldock, J. A., 2010. Accounting for soil carbon sequestration in national inventories: a soil scientist's perspective. Environmental Research Letters 5.
Schipper, L. A. and Sparling, G. P., 2011. Accumulation of soil organic C and change in C:N ratio after establishment of pastures in New Zealand. Biogeochemistry. 104, 49-58.
Schipper L. A., Dodd, M. B., Fisk, L. M., Power, I. L., Parenzee J., Arnold G., 2011. Trends in soil carbon and nutrients of hill-country pastures receiving different phosphorus fertilizer loadings for 20 years. Biogeochemistry 104, 35-48.
Schipper, L. A., Dodd, M. B., Pronger, J., Mudge, P. L., Upsell, M., Moss, R. A., 2013. Decadal changes in soil carbon and nitrogen under a range of irrigation and phosphorus fertilizer treatments. Soil Science Society of America Journal 77, 246-256.
Schipper, L. A, Parfitt, R. L., Fraser, S., Littler, R. A., Baisden, W.T., Ross, C., 2014. Soil order and grazing management effects on changes in soil C and N in New Zealand pastures. Agriculture Ecosystems and Environment 184, 67-75.
Status of the World’s Soil Resources Report, Regional Assessments of Soil Changes | Chapters 9 - 16
294

Simons, J., George, R., Raper, P., 2013. ‘Dryland salinity’. In: Report card on sustainable natural resource use in agriculture. Department of Agriculture and Food, Western Australia.
Simpson, R. J., Oberson, A., Culvenor, R. A., Ryan, M. H., Veneklaas, E. J., Lambers, H., Lynch, J. P., Ryan, P. R., Delhaize, E., Smith, F. A., Smith, S. E., Harvey, P. R., and Richardson, A. E., 2011. Strategies and agronomic interventions to improve the phosphorus-use efficiency of farming systems. Plant and Soil 349, 89-120.
Smith, C. J., Oster, J. D., & Sposito, G., 2014. Potassium and magnesium in irrigation water quality assessment. Agricultural Water Management, in press.
SOE, 2011. Australia state of the environment 2011. Independent report to the Australian Government Minister for Sustainability, Environment, Water, Population and Communities. State of the Environment 2011 Committee, DSEWPaC, Canberra.
Sparling, G. P., Lewis, R., Schipper, L. A., Mudge, P. L., Balks, M. R., 2014. Changes in soil organic C and N contents at three chronosequences after conversion from plantation pine forest to dairy pasture on a New Zealand Pumice soil. Soil Research. 52, 38–45.
Tate, K. R., Wilde, R. H., Giltrap, D. J., Baisden, W. T., Saggar, S., Trustrum, N. A., Scott, N. A., Barton, J. P., 2005. Soil organic carbon stock and flows in New Zealand: System development, measurement and modelling. Canadian Journal of Soil Science 85, 481-489.
Terry, J. P., Garimella, S., Kostaschuk, R. A., 2002. Rates of floodplain accretion in a tropical island river system impacted by cyclones and large floods. Geomorphology 42, 171-182.
Terry, J. P., Kostaschuk, R. A., Garimella, S., 2006. Sediment deposition rate in the Falefa River basin, Upolu Island, Samoa. Journal of Environmental Radioactivity 86, 45-63.
Toze, S., 2006. Reuse of effluent water - benefits and risks. Agricultural Water Management 80, 147-159.
Tozer, P., Leys, J., 2013. Dust storms–what do they really cost? The Rangeland Journal 35, 131-142.
Trotter C. M., Tate K. R., Saggar, S., Scott, N. A., Sutherland, M. A., 2004. A multi-scale analysis of national terrestrial carbon budget and the effects of land-use change. In: Global Environmental Change in the ocean and on land. M Shiyomi et al. (editors). TERRAPUB.
Tullberg, J., 2010. Tillage, traffic and sustainability-A challenge for ISTRO. Soil and Tillage Research 111, 26-32.
Tullberg, J. N., Yule, D. F., and McGarry, D., 2007. Controlled traffic farming - From research to adoption in Australia. Soil and Tillage Research 97, 272-281.
Turney, C. S. M., Bird, M. I., Fifield, L. K., Roberts, R. G., Smith, M., Dortch, C. E., Grün, R., Lawson, E., Ayliffe, L. K., Miller, G. H., Dortch, J., Cresswell, R. G. ,2001. Early human occupation at Devil’s Lair, Southwestern Australia 50,000 years ago. Quaternary Research 55, 3–13
Ivkovic, K.M., Marshall, S. K., Morgan, L. K., Werner, A. D., Carey, H., Cook, S., Sundaram, B., Norman, R., Wallace, L., Caruana, L., Dixon-Jain, P., Simon, D. , 2012. National-scale vulnerability assessment of seawater intrusion: summary report, Waterlines report, National Water Commission, Canberra.
Status of the World’s Soil Resources Report, Regional Assessments of Soil Changes | Chapters 9 - 16
295
UNDESA. 2013. World Population Prospects: The 2012 Revision, Volume I: Comprehensive Tables ST/ESA/SER.A/336. United Nations, Department of Economic and Social Affairs, Population Division (2013).
van Dijk, A. I. J. M., Beck H. E., Crosbie, R. S., de Jeu, R. A. M., Liu, Y. Y., Podger, G. M., Timbal, B., Viney, N. R., 2013. The Millennium Drought in southeast Australia (2001–2009): Natural and human causes and implications for water resources, ecosystems, economy, and society. Water Resources Research 49, 1040–1057.
Warne, M., Rayment, G., Brent, P., Drew, N., Klim, E., McLaughlin, M., Milham, P., Shelley, B., Stevens, D., Sparrow, L., 2007. Final report of the National Cadmium Management Committee (NCMC) (2000-2006). http://www.cadmium-management.org.au/documents/NCMC-Final-Report-web.pdf
Weaver, D. M., and Wong, M. T. F., 2011. Scope to improve phosphorus (P) management and balance efficiency of crop and pasture soils with contrasting P status and buffering indices. Plant and Soil 349, 37-54.
Weaver, D. M., Summers, R. N., 2013. ‘Nutrient status (phosphorus)’. In: Report card on sustainable natural resource use in agriculture, Department of Agriculture and Food, Western Australia.
Wilson, B. R., and Lonergan, V. E., 2013. Land-use and historical management effects on soil organic carbon in grazing systems on the Northern Tablelands of New South Wales. Soil Research 51, 668-679.
World Bank, 2014. GDP per capita (current US$), World Bank national accounts data, and OECD National Accounts data files. World Development Indicators. http://data.worldbank.org/indicator/NY.GDP.PCAP.CD <viewed: 12th November 2014>
Woodman, J.D., Baker, G.H., Evans, T.A., Colloff, M.J. & Andersen, A.N., 2008. Soil biodiversity and ecology: emphasising earthworms, termites and ants as key macro-invertebrates. Final report prepared for the 2008 Collaborative Terrestrial Biodiversity Assessment, National Land & Water Resources Audit, Canberra, 126 pp.
Status of the World’s Soil Resources Report, Regional Assessments of Soil Changes | Chapters 9 - 16
296

16. Regional Assessment Soil Change in Antarctica Contributing author: Megan Balks
16.1 Antarctic soils and environment (state) Antarctica has a total area of 13.9 x10⁶ km2, of which 44 890 km2 (0.32 %) is ice-free (Fox
and Cooper 1994; British Antarctic Survey 2005) with potential for soil development. Ice free areas are mainly confined to the Antarctic Peninsula, a few places around the perimeter of the continent and along the Transantarctic Mountains. The largest ice-free area (approximately 5 000 km2) is the McMurdo Dry Valleys in the Ross Sea Region.
Mean annual temperatures vary from near 0°C in the moister, marine influenced, Antarctic Peninsula to about -20°C in dry, higher altitude inland areas (Campbell and Claridge 1987). Many soils are formed on mixed tills with some directly formed on bedrock. Organic matter is minimal (< 0.1%) in drier, colder inland areas. However, in areas where free moisture occurs, mosses and, on the Antarctic Peninsula - higher plants, may grow and accumulate to form peat soil materials. Ornithogenic materials dominate soils at many coastal locations (e.g. Hofstee et al. 2006). Surface ages in coastal and Antarctic Peninsula regions tend to be predominantly Holocene, exposed by retreat of the Last Glacial Maximum ice. At higher elevations in the McMurdo Dry Valleys surfaces as old as Mid-Miocene (14 Ma) have been reported (Sugden et al. 2006) indicating low erosion rates under a stable polar desert climate. Soil microclimates, driven by strong topographic variability, also influence soil properties (Balks et al. 2013).
A wide variety of soils occur in the ice-free areas (Campbell and Claridge 1987). Gelisols (Soil Survey Staff 2014) or Cryosols (IUSS Working Group WRB 2014) are the predominant soils in Antarctica. Cryosols contain permafrost at depth and are overlain by an active layer that thaws during the summer and is frozen in winter. In moister coastal areas the permafrost is ice-cemented and thus “frozen solid”. However in some inland areas of the Trans-Antarctic Mountains, including the McMurdo Dry Valleys, there is not enough moisture to form ice-cement so soils with temperatures well below 0°C are loose and easily excavated (Bockheim 1978, Campbell and Claridge 1987). The soils range from Gelisols (Cryosols) in the Ross Sea Region, through Gelisols and Entisols in coastal East Antarctica, to a mixture of Gelisols, Entisols, Spodosols and Inceptisols in the warmer northern Antarctic Peninsula Region where permafrost is not ubiquitous (Balks et al. 2013). Due to limited weathering, in the cold climate, many Antarctic soils are dominantly gravelly sands. Where vegetation is absent a protective desert pavement usually forms at the soil surface. The focus for studies on Antarctic soils is not on their potential for food production, but rather on their genesis, diversity, and vulnerability to impacts of human activity.
16.2 Pressures/threats to Antarctic soil environment Most of the human activities in Antarctica, including historic huts, modern research stations,
and tourist visits, are concentrated in the relatively accessible, small, ice-free areas, on the coast, particularly in the Ross Sea region and Antarctic Peninsula (O’Neill et al. in press).
Antarctica was first recorded by three whaling ships in 1820 leading to regular whaling visits and the Ross expedition of 1839-40. The “heroic era” of exploration (1895–1917) included expeditions such as those of Borchgrevink, Scott, Shackleton, Mawson and Amundsen. Since the International Geophysical Year (1957/58) greatly increased human activity has occurred with over 70
Status of the World’s Soil Resources Report, Regional Assessments of Soil Changes | Chapters 9 - 16
297

scientific research bases established, mainly around the Antarctic coast. Ship-based Antarctic tourism has become popular with 46 000 tourists reported in the 2007/08 summer and 27 700 in the 2013/14 season (International Association of Antarctic Tour Operators, 2014).
Legacies of human occupation are scattered at isolated sites across Antarctica, particularly in areas close to the major research stations and semi-permanent field camps (Campbell et al. 1993; Kennicutt et al. 2010; Tin et al. 2009). Impacts have included physical disturbance as a result of construction activities, geotechnical studies, and roading (Campbell et al. 1993, 1994; Harris, 1998; Kennicutt et al. 2010; Kiernan and McConnell, 2001); local pollution from hydrocarbon spills (Aislabie et al. 2004, Kim et al. 2006, Klein et al. 2012), waste disposal (Claridge et al. 1995, Snape et al. 2001; Santos et al. 2005; Sheppard et al. 2000), and introduction of alien species (Frenot et al. 2005; Chown et al. 2012; Cowan et al. 2011), and disturbance to soil biological communities (de Villiers, 2008; Harris, 1998; Naveen, 1996; Tin et al. 2009 and references therein). The amount of contaminated soil and waste has been estimated at 1–10 million m3 (Snape et al. 2001). The presence of persistent organochlorine pollutants in Antarctica has been attributed to long-range atmospheric transport from lower latitudes (Bargagli, 2008).
Antarctic soils are easily disturbed and natural recovery rates are slow due to low temperatures and often a lack of liquid moisture (Campbell et al. 1993, 1998a & b, Kiernan and McConnell, 2001, Waterhouse 2001). Where physical disturbance removes the protective “active layer” the underlying permafrost will melt with resulting land surface subsidence and, in drier regions, accumulation of salt at the soil surface (Campbell et al 1994, Waterhouse 2001). Campbell and Claridge (1975, 1987) recognised that older, more weathered, desert pavements and associated soils were the most vulnerable to physical human disturbance. However disturbances on active surfaces, such as gravel beach deposits, aeolian sand dunes, and areas where melt-water flows recover (visually) relatively quickly (McLeod, 2012; O’Neill et al. 2012a, b; 2013a).
Fuel spills are the most common source of soil contamination and have the potential to cause the greatest environmental harm in and around the continent (Aislabie et al. 2004). Hydrocarbon fuel spills have been shown to persist in the environment for decades, with fuel perching on top of ice-cemented permafrost (Balks et al. 2002). When spilled on Antarctic soils, possible fates of the hydrocarbons include dispersion, evaporation, and biodegradation. Hydrocarbon degrading microbes are present in the Antarctic environment but, within the Ross Sea region, their effectiveness is limited by moisture and nutrient (N and P) availability (Aislabie et al. 2004, 2012). Hydrocarbon spills on Antarctic soils can enrich hydrocarbon-degrading bacteria within the indigenous microbial community (Aislabie et al. 2004, 2012; Delille et al. 2000).
Elevated levels of metal concentrations have been reported at base sites especially in areas used for waste disposal or affected by emissions from incinerators or fuel spills (Claridge et al. 1995; Sheppard et al. 2000; Webster et al. 2003; Santos et al., 2005; Stark et al. 2008; Guerra et al. 2011). Particularly high metal levels have been reported at Hope Bay on the Antarctic Peninsula (Guerra et al. 2011) and at the Thala Valley landfill at Casey Station, East Antarctica (Stark et al. 2008). Elevated levels of methyl lead have been detected in soil from a former fuel storage site at Scott Base (Aislabie et al. 2004).
Surface trampling has been shown to impact on soil nematode abundances in the McMurdo Dry Valleys (Ayres et al., 2008) and on arthropod abundance on the Antarctic Peninsula (Tejedo et al.
Status of the World’s Soil Resources Report, Regional Assessments of Soil Changes | Chapters 9 - 16
298

2005, 2009). Potential for introduction of invasive plant, insect, and microbial biota is gaining attention (Cowan et al. 2011, Chown et al.2012, Greenslade and Convey (2012).
16.3 Response All activities in Antarctica are regulated through the national administrative and legal
structures of the countries active in the region, underpinned by the international legal obligations resulting from the Antarctic Treaty System. The Protocol on Environmental Protection to the Antarctic Treaty (the Madrid Protocol) was signed in 1991 and designates Antarctica as “a natural reserve devoted to peace and science”. The Madrid Protocol mandates the protection of Antarctic wilderness and aesthetic values and requires that before any activity is undertaken the possible environmental impacts are assessed. Since the ratification of the Madrid Protocol in 1991 environmental awareness has increased and the standard of prevention of human impacts undertaken by many of the Antarctic programmes, such as those operating in the McMurdo Dry Valleys, is now more stringent than environmental management standards in most, if not all, other regions of the planet (O’Neill et al 2015 (in press)).
The ice-free areas visited by humans are small, relative to the Antarctic continent as a whole, and impacts occur as isolated pockets amongst largely pristine Antarctic wilderness (O’Neill et al. 2015 in press). The most intense and long-lasting visible impacts occur around the current and former research bases, and are often remnants of activities in the 1950s -1970s prior to the Madrid Protocol (Campbell and Claridge 1987, Webster et al. 2003 Bargagli 2008, Kennicutt et al. 2010, O’Neill, 2013). Since the 1980s when environmental accountability, enhanced environmental management, and environmental awareness, increased the environmental footprint of stations, such as Scott Base and McMurdo Station on Ross Island, have remained static or decreased (Kennicutt et al. 2010). Mechanisms in place for example to prevent spills, remove wastes, phase out incineration, limit soil disturbance, and protect sites of particular cultural or environmental significance are proving effective at preventing further damage to Antarctic soils.
Status of the World’s Soil Resources Report, Regional Assessments of Soil Changes | Chapters 9 - 16
299

16.4 References
Aislabie, J.M., Balks, M.R., Foght, J.M., Waterhouse, E.J. 2004. Hydrocarbon spills on Antarctic soils: effects and management. Environmental Science and Technology 38, 1265–1274.
Aislabie, J.M., Ryburn J, Gutierrez-Zamora, M-L., Rhodes P, Hunter D, Sarmah AK, Barker GM, Farrell RL. 2012. Hexadecane mineralization activity in hydrocarbon-contaminated soils of Ross Sea region Antarctica may require nutrients and inoculation. Soil Biology & Biochemistry 45, 49–60.
Ayres, E., Nkem, J.N., Wall, D.H., Adams, B.J., Barnett, J.E., Broos, E.J, Parsons, A.N., Powers, L.E, Simmons, B.L., Virginia, R.A. 2008. Effects on human trampling on populations of soil fauna in the McMurdo Dry Valleys, Antarctica. Conservation Biology 22, 1544–1551.
Balks, M.R., R.F. Paetzold, J.M. Kimble, J. Aislabie, I.B. Campbell 2002: Effects of hydrocarbon spills on the temperature and moisture regimes of Cryosols in the Ross Sea region, Antarctica. Antarctic Science 14, 319–326.
Balks, M. R., López-Martínez, J., Goryachkin, S.V., Mergelov, N.S., Schaefer, C.E.G.R., Simas, F.N.B., Almond, P.C., Claridge, G.G.C., Mcleod, M., Scarrow, J., 2013. Windows on Antarctic soil-landscape relationships: comparison across selected regions of Antarctica. Geological Society, London, Special Publications 2013, v.381; p397-410. doi: 10.1144/SP381.9
Bargagli, R. 2008 Environmental contamination in Antarctic ecosystems. Science of the Total Environment 400, 212–226. DOI: 10.1016/j.scitotenv.2008.06.062
Bockheim, J.G. 1978. Relative age and origin of soils of the eastern Wright Valley, Antarctica. Soil Science 128, 142–152.
British Antarctic Survey 2005. Antarctic Factsheet Geographical Statistics. British Antarctic Survey, Cambridge, UK. 4p. http://www.antarctica.ac.uk/about_antarctica/ teacher_resources/ resources/factsheets/factsheet_geostats_screen.pdf
Campbell, I.B., Claridge, G.G.C. 1987. Antarctica: soils, weathering processes and environment. Elsevier Science Publishers B.V. New York, 368 pp.
Campbell, I.B., Balks, M.R. Claridge, G.G.C. 1993.A simple visual technique for estimating the impact of fieldwork on the terrestrial environment in ice-free areas of Antarctica. Polar Record 29, 321–328.
Campbell, I.B., Claridge, G.G.C., Balks, M.R. 1994. The effects of human activities on moisture content of soils and underlying permafrost from the McMurdo Sound region, Antarctica. Antarctic Science 6, 307–314.
Campbell, I.B., Claridge, G.G.C., Balks, M.R. 1998a. Short- and long-term impacts of human disturbances on snow-free surfaces in Antarctica. Polar Record 34(188), 15–24.
Status of the World’s Soil Resources Report, Regional Assessments of Soil Changes | Chapters 9 - 16
300

Campbell, I.B., Claridge, G.G.C., Campbell, D.I., Balks, M.R. 1998b. Soil temperature and moisture properties of Cryosols of the Antarctic Cold Desert. Eurasian Soil Science 31, 600–604.
Cowan, D. A., Chown, S. L., Convey, P., Tuffin, M., Hughes, K., Pointing, S., Vincent, W. F. 2011. Non-indigenous microorganisms in the Antarctic: assessing the risks. Trends in Microbiology 19, 540–548.
Chown, S.L., Huiskes, A.H.L., Gremmen, N.J.M., Lee, J.E., Terauds, A., Crosbie, K. et al. 2012. Continent-wide risk assessment for the establishment of nonindigenous species in Antarctica. Proceedings of the National Academy of Sciences. 109, 4938–4943.
Delille, D. 2000. Response of Antarctic soil bacterial assemblages to contamination by diesel fuel and crude oil. Microbial Ecology 40, 159–168.
De Villiers, M. 2008. Review of recent research into the effects of human disturbance on wildlife in the Antarctic and sub-Antarctic region. In: Human disturbance to wildlife in the broader Antarctic region: a review of findings. Working Paper 12 for XXXI Antarctic Treaty Consultative Meeting, Kiev, Ukraine, 2–13 June 2008.
Fox, A.J., Cooper, P.R. 1994. Measured properties of the Antarctic Ice Sheet derived from the SCAR digital database. Polar Record, 30, 201
Frenot, Y. Chown, S.L., Whinam, J., Selkirk, P.M., Convey, P., Skotnicki, M., & Bergstrom D.M. 2005. Biological invasions in the Antarctic: Extent, impacts and implications. Biological Reviews 80, 45–72.
Greenslade, P., Convey, P. 2012. Exotic Collembola on subantarctic islands: Pathways, origins and Biology. Biological Invasions 14, 405–417.
Guerra, M.B.B., Schaefer, C.E.G.R., de Freitas Rosa, P., Simas, F.N.B., Pereira, T.T.C., Pereira-Filho, E.R. 2011. Heavy metal contamination in century-old manmade technosols of Hope Bay, Antarctic Peninsula. Water, Air and Soil Pollution 222, 91–102.
Harris, C.M. 1998. Science and environmental management in the McMurdo Dry Valleys, Antarctica. In: Priscu, J. (eds.), Ecosystem Processes in a Polar Desert: the McMurdo Dry Valleys, Antarctica. Antarctic Research Series 72, American Geophysical Union, Washington.
Hofstee, E.H., Balks, M.R., Petchey, F. & Campbell, D.I. 2006: Soils of Seabee Hook, Cape Hallett, Northern Victoria Land, Antarctica. Antarctic Science 18, 473–486.
International Association of Antarctic Tour Operators (IAATO). 2014. Tourism statistics. http://iaato.org/tourism-statistics.
IUSS Working Group WRB 2014. World Reference Base for soil resources 2014. International soil classification sstem for naming soils and creating legends for soil maps. World Soil Resources Reports No. 106. FAO, Rome.
Status of the World’s Soil Resources Report, Regional Assessments of Soil Changes | Chapters 9 - 16
301

Kennicutt, M.C., Klein, A., Montagna, P., Sweet, S., Wade, T., Palmer, T., Denoux, G., 2010. Temporal and spatial patterns of anthropogenic disturbance at McMurdo Station, Antarctica. Environmental Research Letters 5, 1–10.
Kiernan, K., McConnell, A. 2001. Land surface rehabilitation research in Antarctica. Proceedings of the Linnean Society of New South Wales 123, 101–118.
Kim, M., Kennicutt II, M. C., Y. Qian. 2006. Molecular and stable carbon isotopic characterization of PAH contaminants at McMurdo Station, Antarctica. Marine Pollution Bulletin 52, 1585–1590.
Klein, A.G., Sweet, S.T., Wade, T.L., Sericano, J.L., Kennicutt II M.C. 2012. Spatial patterns of total petroleum hydrocarbons in the terrestrial environment at McMurdo Station, Antarctica. Antarctic Science 24, 450–466.
McLeod, M. 2012. Soil and Permafrost Distribution, Soil Characterisation and Soil Vulnerability to Human Foot Trampling, Wright Valley, Antarctica, Ph.D. Thesis, University of Waikato, New Zealand. 219 pp.
Naveen, R. 1996. Human activity and disturbance: building an Antarctic site inventory. In: Ross, R., Hofman, E. & Quetin, L. (eds), Foundations for ecosystem research in the Western Antarctic Peninsula region. Washington, DC, American Geophysical Union. pp. 389–400.
O’Neill, T.A. 2013. Soil physical impacts and recovery rates following human-induced disturbances in the Ross Sea region of Antarctica. Ph.D. Thesis, University of Waikato, New Zealand. 369pp.
O’Neill, T.A., Balks, M.R. & López-Martínez, J. 2012a. The effectiveness of Environmental Impact Assessments on visitor activity in the Ross Sea Region of Antarctica. In: Lundmark, L., Lemelin, R., Müller, D. (eds.), Issues in Polar Tourism: Communities, Environments, Politics. Berlin-Heildelberg-New York: Springer.
O’Neill, T.A., Balks, M.R, López-Martínez, J., McWhirter J. 2012b. A method for assessing the physical recovery of Antarctic desert pavements following human-induced disturbances: a case study in the Ross Sea region of Antarctica. Journal of Environmental Management 112, 415–428.
O’Neill, T.A., Balks, M.R, López-Martínez, J. 2013a. Soil Surface Recovery from Vehicle and Foot Traffic in the Ross Sea region of Antarctica. Antarctic Science 25, 514–530.
O’Neill, T.A., J. Aislabie, M.R. Balks 2015. Human impacts on Antarctic Soils. In J.G. Bockheim (Ed) Soils of Antarctica. Springer Publishers, Dordrecht (in press).
Santos, I.R., Silva, E.V., Schaefer, C.E., Albuquerque, M.R., Campos, L.S. 2005. Heavy metal contamination in coastal sediments and soils near the Brazilian Antarctic Station, King George Island. Marine Pollution Bulletin 50, 185–194.
Sheppard, D.S., Claridge, G.G.C., Campbell, I.B. 2000.Metal contamination of soils at Scott Base, Antarctica. Applied Geochemistry 15, 513–530.
Status of the World’s Soil Resources Report, Regional Assessments of Soil Changes | Chapters 9 - 16
302

Snape, I. Morris, C.E. & Cole, C.M. 2001.The use of permeable reactive barriers to control contaminant dispersal during site remediation in Antarctica. Cold Regions Science and Technology 32, 157-174.
Snape, I, Ferguson, S, Revill, A. 2003. Constraints on rates of natural attenuation and in situ bioremediation of petroleum spills in Antarctica. In: Nahir M, Biggar K, Cotta G (eds) Assessment and remediation of contaminated sites in Arctic and cold climates (Proceedings). St. Joseph’s Print Group Inc., Edmonton AB, pp 257–261.
Soil Survey Staff, 2014. Keys to Soil Taxonomy, 12th ed. USDA-Natural Resources Conservation Service, Washington, DC.
Stark, S.C., Snape, I., Graham, N.J., Brennan, J.C., Gore, D.B. 2008. Assessment of metal contamination using X-ray fluorescence spectrometry and the toxicity characteristic leaching procedure (TCLP) during remediation of a waste disposal site in Antarctica. Journal of Environmental Monitoring 10, 60–70.
Sugden, D.E., Bentley, M.J., Cofaigh, C.O. 2006. Geological and geomorphological insights into Antarctic ice sheet evolution. Philosophical Transactions of the Royal Society A364 1607–1625. doi:10.1098/rsta.2006.1791
Tejedo, P., Justel, A., Rico, E., Benayas, J., Quesada, A. 2005. Measuring impacts on soils by human activity in an Antarctic Specially Protected Area. Terra Antarctica 12, 57–62.
Tejedo, P., Justel, A., Benayas, J., Rico, E., Convey, P., Quesada, A. 2009. Soil trampling in an Antarctic Specially Protected Area: tools to assess levels of human impact. Antarctic Science 21, 229–236.
Tin, T., Fleming, L., Hughes, K.A., Ainsley, D.G., Convey, P., Moreno, C.A., Pfeiffer, S., Scott, J., Snape, I. 2009. Review: Impacts of local human activities on the Antarctic environment. Antarctic Science 21, 3–33.
Waterhouse, E.J. (ed). Ross Sea Region 2001: a State of the Environment Report for the Ross Sea Region of Antarctica. New Zealand Antarctic Institute, Christchurch, New Zealand.
Webster, J., Webster, K., Nelson, P. & Waterhouse, E. 2003. The behaviour of residual contaminants at a former station site, Antarctica. Environmental Pollution 123, 163–179.
Status of the World’s Soil Resources Report, Regional Assessments of Soil Changes | Chapters 9 - 16
303