Providing rural connectivity infrastructure: ICT diffusion through private sector participation
Upload
khangminh22Category
view
0download
0
ISSN 0975-329X Artha J Soc Sci, 11, 3(2012), 15-43
15
Status and Infrastructure of the Health
Sector in Karnataka
Siddu V H*, Keshava Murthy K D† and R Revankar‡
Abstract
Karnataka is closer to the average of India in case of health status and health facilities, but compared to the states like Kerala, it stands too low. The most striking problem, related to the health infrastructure and health status arises out of the regional imbalance. The study shows that the Gulbarga and Belgaum divisions of Karnataka show a poor status in health infrastructure and health status. Among these, the Gulbarga division (means Hyderabad Karnataka) lies in the lower position. It is well known that Hyderabad Karnataka is underdeveloped in most of the sectors compared to the rest of the regions. Lesser health infrastructure facilities in this region clearly indicate the neglect of the government intervention/ interest to develop basic infrastructure facilities in this region. For better health, health facilities should be improved. For better health facilities, public health expenditure is very important. At present, the Karnataka government is spending very less amount of money on health, which is about 2 per cent of the NSDP. This amount has to be increased. Increasing the public expenditure alone, cannot serve the purpose, unless it is
* Assistant Professor, Centre for Multi-disciplinary Development Research (CMDR), Dharwad; [email protected]
† Lecturer, St Joseph’s College of Arts and Science, Bangalore; [email protected]
‡ Research Assistant, Centre for Multi-disciplinary Development Research (CMDR), Dharwad; [email protected]
ISSN 0975-329X| https://doi.org 10.12724/ajss.22.2

Siddu V H et al. ISSN 0975-329X
16
properly used for delivering quality infrastructure and good service mechanization.
Keywords: Health Sector, Health Infrastructure.
Introduction
The importance of the good health of people cannot be minimized, as it has been considered as one of the most important components of the human capital. Good health is an indication of a strong mind. Due to its vital importance, the economics of health is attracting researchers and policy makers more rapidly in the recent decades. It is well said in the theory of the human capital that people should invest themselves in terms of education, health and skill development programmes. Health is a major segment of the human capital. If the quality of the human capital is not good, then the physical capital and natural resources cannot be utilized properly and the growth can neither be sustained nor be qualitative.
Life expectancy at birth, infant mortality rate, fertility rate, crude birth rate is perhaps the best measures of the human capital. These indicators of health are determined by numerous factors such as per capita income, nutrition, housing, sanitation, safe drinking water, social infrastructure, health and medical care services provided by the Government, geographical climate, employment status, incidence of poverty and so on (Dadibhavi and Bagalkoti, 1994). However, in the developing countries like India, due to poor financial accessibilities, it is very difficult for the people to spend money. Hence, the intervention of the Government is necessary for making strong human capital and sustained economic growth as they are strongly and positively inter-related.
Though India stands on par with the leading countries in terms of population concentration, its health status is far behind the satisfactory level compared to the other developing countries. It is needless to point out that, this is due to the lack of proper budgetary allocation and poor infrastructure facilities. It is disappointing to note that India’s public expenditure as a share of GDP as well as a share of total budget is low compared to many other developing countries.

Status and Infrastructure of Health Sector Artha J Soc Sci, 11, 3(2012)
17
Further, the biggest challenge for the Indian health sector is that it has to not only sustain quality but also reduce the regional disparities in health status and infrastructure, which is also observed in other sectors like economic growth, human development, and standard of living and so on. Notable studies have traced out many interesting realities with respect to the status and infrastructure in the health sector disparities in India.
Karnataka state is not an exception to this kind of disparities. Though studies on regional disparities in health sectors of Karnataka are rare to find, nevertheless some of the scholarly studies done by Panchamukhi and others have brought out the inter-district disparities in the health sector. They held that the disparities have been constantly increasing over a period of time and suggested for the higher public spending on the same. However, it is hard to find a comprehensive study which analyzes the intra-state disparities on health and Government financing in recent days. In the light of the above, in the present study, an attempt has been made to analyze the regional imbalance in the health sector in the state and public expenditure on health in Karnataka.
The study has been divided into five sections. Apart from the introduction, section II discusses the status and infrastructure with respect to health in Karnataka. Further, in section III regional disparity in health infrastructure and status have been discussed and in section IV, public expenditure on health sector is analysed. Section V concludes the present paper with appropriate findings and suggestions.
Health Status and Infrastructure: A Comparison between Karnataka and India:
Before discussing the health status in Karnataka, a quick look at the comparisons of some of the important health indicators of India, with the rest of the regions of the world would give the best picture of India’s health status with the rest of the world. The data related to the indicator, shows that (Table 1), Life expectancy at birth (LEB) in India, is the lowest among the average of all regions, except the

Siddu V H et al. ISSN 0975-329X
18
average of the ‘least developed countries’, ‘low human developed countries’ and ‘Sub-Saharan Africa’. It is disappointing to note that LEB in India is also lower than the average of SAARC (South Asia) countries. Countries with high human development have the LEB of 80 years, whereas it is only 65.4 years in India, which is 1.2 times lower than the other countries in the world. Life expectancy at birth is a commonly used indicator, as it is the proxy for overall health condition/status and availability of the health facilities for the people in a country. Another important indicator presented in the table is the ‘under five mortality’. In this indicator also, the Indian pattern can be observed as it was in LEB. ‘Maternal mortality ratio’ of India is 230, which is 15 times higher than that of the very high human developed countries (15.5). It is pointless to mention that this is due to the lack of health facilities, which has resulted due to the government spending less on this sector. Health expenditure as a share of GDP is 4.2 per cent, which is the lowest among the average of all regions except the SAARC countries. The point to be noted here is that the health expenditure in India is not too high as compared to the average of SAARC courtiers; it is only 0.01 point per cent higher than the SAARC countries. Not surprisingly, the per capita GDP of India is much lesser than that of the developed countries. If the health expenditure as a share of GDP is concerned, it shows lower difference, whereas in per capita terms it shows a higher difference between developed and developing countries like India.
Many decades have rolled out since the independence of our country. India is marching towards development in various sectors. It is observed that even though significant improvements have been made under the health sector, they are not satisfactory. Health has been categorised in the state list by the Indian constitution. For many years / decades, the Central Government has not taken any notable policy / programmes. After recognising the importance of health and the lower status of India’s health sector - the Central Government has started investing a huge amount of money on the health sector, to fulfil the Millennium Development Goals of Health, especially after the reform period.

Status and Infrastructure of Health Sector Artha J Soc Sci, 11, 3(2012)
19
Table 1: Comparison of India, With the Rest of the World as Far as The Health Indicators is
Concerned.
Source: UNDP, Human Development Report 2011
As it is already mentioned in the above analysis, health status and
Source: India Human Development Report 2011
infrastructure facilities are lower in India, when compared to many other countries. In the below mentioned table, selected Health status and infrastructure of Karnataka has been compared with that of India. Karnataka is nearer to the average of India in terms of state income and most of the developmental indicators. Similarly, with regard to the health related indicators also, Karnataka’s position is above the satisfactory level. Except health expenditure by public and private, in all the selected indicators Karnataka’s performance is better than the average of India.
Regions Life
expectancy at birth
Under Five
Mortality
Maternal
mortality ratio
Total expenditure
on health (% of GDP)
India 65.4 66 230 4.2
Very high human
development
80 6.2 15.5 11.2
High human
development
73.1 19 51.1 6.7
Medium human
development
69.7 44.2 134.9 4.5
Low human
development
58.7 117.5 532.2 5.1
Arab states 70.5 48.8 191.8 5.3
East Asia and the
pacific
72.4 26.1 79.4 4.3
Europe and central
Asia
71.3 19.1 29.1 6.3
Latin America and the Caribbean
74.4 22.4 79.9 7.6
South Asia
(SAARC)
65.9 69.3 251.9 4.1
Sub-Saharan
Africa
54.4 129 618.9 6.2
Least developed
countries
59.1 120.1 537.1 5.6
Small island
developing states
69.6 57 .. 7
World 69.8 58.4 175.6 6
Siddu V H et al. ISSN 0975-329X
20
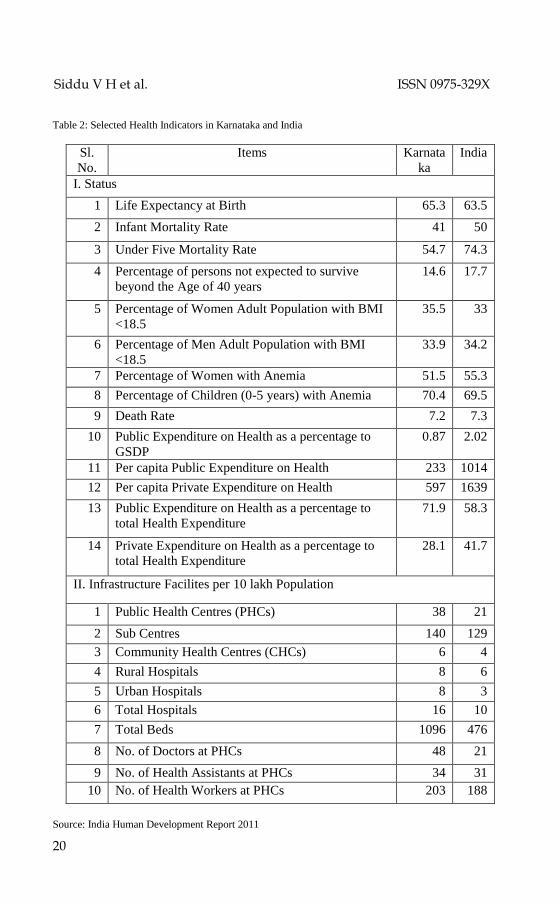
Table 2: Selected Health Indicators in Karnataka and India
Source: India Human Development Report 2011
Sl.
No.
Items Karnata
ka
India
I. Status
1 Life Expectancy at Birth 65.3 63.5
2 Infant Mortality Rate 41 50
3 Under Five Mortality Rate 54.7 74.3
4 Percentage of persons not expected to survive
beyond the Age of 40 years
14.6 17.7
5 Percentage of Women Adult Population with BMI
<18.5
35.5 33
6 Percentage of Men Adult Population with BMI
<18.5
33.9 34.2
7 Percentage of Women with Anemia 51.5 55.3
8 Percentage of Children (0-5 years) with Anemia 70.4 69.5
9 Death Rate 7.2 7.3
10 Public Expenditure on Health as a percentage to
GSDP
0.87 2.02
11 Per capita Public Expenditure on Health 233 1014
12 Per capita Private Expenditure on Health 597 1639
13 Public Expenditure on Health as a percentage to
total Health Expenditure
71.9 58.3
14 Private Expenditure on Health as a percentage to
total Health Expenditure
28.1 41.7
II. Infrastructure Facilites per 10 lakh Population
1 Public Health Centres (PHCs) 38 21
2 Sub Centres 140 129
3 Community Health Centres (CHCs) 6 4
4 Rural Hospitals 8 6
5 Urban Hospitals 8 3
6 Total Hospitals 16 10
7 Total Beds 1096 476
8 No. of Doctors at PHCs 48 21
9 No. of Health Assistants at PHCs 34 31
10 No. of Health Workers at PHCs 203 188
Status and Infrastructure of Health Sector Artha J Soc Sci, 11, 3(2012)
21
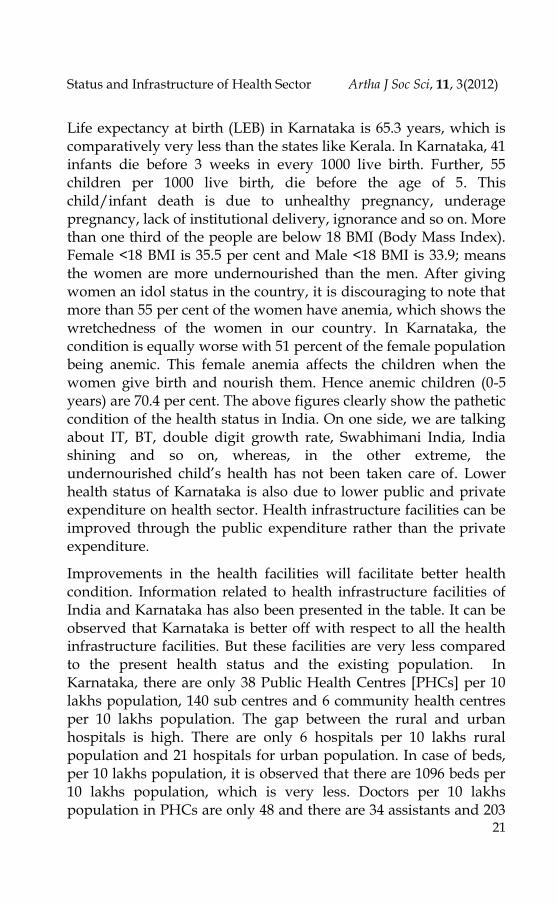
Life expectancy at birth (LEB) in Karnataka is 65.3 years, which is comparatively very less than the states like Kerala. In Karnataka, 41 infants die before 3 weeks in every 1000 live birth. Further, 55 children per 1000 live birth, die before the age of 5. This child/infant death is due to unhealthy pregnancy, underage pregnancy, lack of institutional delivery, ignorance and so on. More than one third of the people are below 18 BMI (Body Mass Index). Female <18 BMI is 35.5 per cent and Male <18 BMI is 33.9; means the women are more undernourished than the men. After giving women an idol status in the country, it is discouraging to note that more than 55 per cent of the women have anemia, which shows the wretchedness of the women in our country. In Karnataka, the condition is equally worse with 51 percent of the female population being anemic. This female anemia affects the children when the women give birth and nourish them. Hence anemic children (0-5 years) are 70.4 per cent. The above figures clearly show the pathetic condition of the health status in India. On one side, we are talking about IT, BT, double digit growth rate, Swabhimani India, India shining and so on, whereas, in the other extreme, the undernourished child’s health has not been taken care of. Lower health status of Karnataka is also due to lower public and private expenditure on health sector. Health infrastructure facilities can be improved through the public expenditure rather than the private expenditure.
Improvements in the health facilities will facilitate better health condition. Information related to health infrastructure facilities of India and Karnataka has also been presented in the table. It can be observed that Karnataka is better off with respect to all the health infrastructure facilities. But these facilities are very less compared to the present health status and the existing population. In Karnataka, there are only 38 Public Health Centres [PHCs] per 10 lakhs population, 140 sub centres and 6 community health centres per 10 lakhs population. The gap between the rural and urban hospitals is high. There are only 6 hospitals per 10 lakhs rural population and 21 hospitals for urban population. In case of beds, per 10 lakhs population, it is observed that there are 1096 beds per 10 lakhs population, which is very less. Doctors per 10 lakhs population in PHCs are only 48 and there are 34 assistants and 203

Siddu V H et al. ISSN 0975-329X
22
health workers for the same amount of population in the state. In our country/state, the number of infrastructure facilities are not only low but also, the services provided in these facilities are also low, which has been empirically proved by many studies. However, the present study analyses the district wise availability of health facilities and health status, and the regional imbalances in the health sector have also been considered as the major objective rather than the quality of services, which can be seen in the following sections.
Regional Imbalances in Health Infrastructure and Health Status:
Regional imbalance is a common phenomenon faced by every country/states in most of the sectors. Health sector is not an exception for this. Before analyzing the inter-district disparities of the health sector in the state, a brief discussion of inter-division disparities gives a clear picture of the distribution of health facilities and health status among the four administrative divisions. Information related to this has been presented in the below mentioned table. It is generally observed that the district hospitals possess the advanced health infrastructures and equipments when compared to the lower divisions and these results in them saving many lives. For example, during the time of severe injuries or epidemic diseases, patients need an emergency treatment in a well equipped hospital. Such facilities cannot be expected in a Primary Health Centre (PHC) or a Community Health Centre (CHC). Hence, these patients should be taken to the district hospitals (or a similar hospital). However, if these hospitals are situated in faraway places, it may be extremely difficult to save their lives. Hence, it is not only the matter of the number of hospitals but at the same time, the distance and the distribution of the hospitals in different regions/places should also be taken care of. Table 3 reveals that in Karnataka, there is only 1.1 district and other hospitals for every 10 lakhs population. Observing the distribution between North and South, it is found that there are 1.3 hospitals in South Karnataka and 1.0 hospital in North Karnataka per 10 lakhs population. Further, it is also found that the table that in both the indicators shows North Karnataka has lesser number of hospitals

Status and Infrastructure of Health Sector Artha J Soc Sci, 11, 3(2012)
23
per 10 lakhs population than the South. Mysore and Belgaum divisions stand first and the last respectively with regard to the health facilities. Looking at them area wise, there are 3.6 hospitals per every 10 thousand Sq. km. area in Karnataka. The number of hospitals in South Karnataka (4.7) is twofold higher than that of North Karnataka (2.5). In this indicator, the Bangalore division stands first with 5.4 hospitals and Gulbarga is at the last position with 2.5 hospitals.
Community Health Centres (CHCs) have comparatively less number of equipments and man power than the district hospitals. They also provide many of the health services and can be most commonly found in the taluk head quarters. Karnataka has 5.3 CHC for every 10 lakhs population. Mysore division has the highest number of CHCs (7.4 per 10 lakhs population) among the divisions and Bangalore stands at the lowest with 3.4 CHCs per 10 lakhs population. South Karnataka has both the higher and lower number of CHC’s divisions, but the number of CHCs per 10 thousand Sq. Km. area is high in South Karnataka only. Totally there are 16.9 CHC’s in the state per 10 thousand Sq. Km. area. Mysore and Belgaum are in the first and last positions respectively.
Primary Health Centres (PHCs) have been introduced with the objective of providing better health facilities to the rural population. However, unlike the district hospitals these centres have not been fully equipped. Nevertheless, they have a crucial role in making the people in the rural community aware of their health and to take care of the minor diseases. At the state level, there are 169 PHCs per 10 lakhs population with the distribution of 184 and 149 PHCs in the South and North Karnataka. Mysore division stands first and Bangalore stands last with regard to the same. Looking at the number of hospitals per 10 thousand Sq. Km. area it is found that there are 539 PHCs in the state. Further, North Karnataka has only 394 PHCs and South Karnataka has 693 PHCs for the same amount of the area, which is 1.8 times higher. The Mysore division has 783 PHCs and the Gulbarga division has 365 PHCs per 10 lakhs Sq. Km. area. PHCs are the major source for the rural health care, hence less number of PHCs in an under

Siddu V H et al. ISSN 0975-329X
24
developed division like Gulbarga demands immediate concern from the Government.
Table 3: Divisionwise Selected Health Infrastructure Facilities in Karnataka, 2010
Note: Figures in the Parenthesis are Ranks; Source: Computed from the data available from Karnataka
at a Glance
Another indicator considered in the study is the number of beds available in the hospitals. Many diseases require a prolonged treatment. Thus, to have better and hygienic bed facilities also have an impact on the health of a patient. Karnataka has 169 beds per 10 lakhs population. In this indicator also, South Karnataka is in a good position than North Karnataka. In South Karnataka, there are 901 beds and in North Karnataka, there are only 775 beds per 10 lakhs population. The Mysore division, with 1196 beds per 10 lakhs population stands in the first position and the Bangalore
Item Belgaum Gulbarga Bangalore Mysore North South Karnataka
Facilities
Per
10
Lak
h
Po
pu
lati
on
District and
other
Hospitals
0.9 1 1.2 1.4 1 1.3 1.1
-4 -3 -2 -1
Community Health
Centres
5.5 6.5 3.4 7.4 5.9 4.8 5.3
-3 -2 -4 -1
PHCs and Sub
Centres
154 142 135 271 149 184 169
-2 -3 -4 -1
Total Beds 764 789 737 1196
775 901 847 -3 -2 -4 -1
Per
10
thou
san
d
sq K
Ms
area
District and other
Hospitals
2.6 2.5 5.4 3.9 2.5 4.7 3.6
-3 -4 -1 -2
Community Health
Centres
14.9 16.6 15.5 21.4 15.6 18.2 16.9
-4 -2 -3 -1
PHCs and
Sub Centres
418 365 614 783 394 693 539
-3 -4 -2 -1
Total Beds 2070 2019 3337 3455
2047 3392 2701 -3 -4 -2 -1
Status
Infant mortality
rate
47.6 47.3 38.4 42.7 47.5 40.4 43.3
-1 -2 -4 -3
Life expectancy
at birth
65.6 66.6 68.6 67.4 66 68.1 67.2
-4 -3 -1 -2

Status and Infrastructure of Health Sector Artha J Soc Sci, 11, 3(2012)
25
division with 737 beds for the same amount of population stands in the last position. In case of beds per 10 thousand Sq. Km. area, there are 2701 beds in the state, and the North region is in the lower position than the South. Mysore and Gulbarga are in the first and last positions respectively.
The objective of the public health expenditure is to enhance the health infrastructure facilities to improve the health condition of the people. Similar to the health infrastructure, health status is also unequally distributed among the districts. Life expectancy at birth (LEB) is an important indicator to measure the health status of the community. In fact UNDP uses this indicator for the construction of the human development index (HDI) for all countries as a proxy of the health status. However, if data on LEB is not available then the Infant Mortality Rate (IMR) is used for the measurement of the health status. LEB is 67.2 years in the Karnataka state. People of South Karnataka live 2 years more than those in North Karnataka. LEB of Bangalore division is 68.6 years, which is more than the divisions, followed by the Mysore division (67.4 years), Gulbarga division (66.6 years) and Belgaum division (65.5 years). On the other hand IMR in Karnataka is 43.3, which means, 43.3 kids die per 1000 infants. North Karnataka (47.5) has higher infant death than the South (40.4). The ranks of division of IMR are adverse to LEB. Belgaum division is in the first position followed by Gulbarga, Mysore and Bangalore divisions. In Tables 4 and 5, district-wise indicators on health infrastructure facilities and health status indicators are presented. Descriptions of these tables are given below.
Health Infrastructure Facilities Per Ten Lakhs Population
Among the districts that have higher number of district hospitals, except Kodagu and Kolar, the remaining districts viz. Gadag, Bellary, Dharwad are from North Karnataka. Except Tumkur, the remaining districts of lower order are from North Karnataka. They are Belgaum, Gulbarga, Raichur and Bagalkot.
Except Uttar Kannada, in the top order, the 4 districts in the Community Health Centres (CHCs) are from South Karnataka.

Siddu V H et al. ISSN 0975-329X
26
They are Kodagu, Hassan, Chitradurga and Chikkamagalur. In case of the lower order, the 4 districts, namely Bangalore rural, Bangalore urban, Davngere and Kodagu except Dharwad are from South Karnataka.
The Top 5 districts viz. Kodagu, Hassan, Chitradurga, Udupi and Chamarajanagar are from South Karnataka, which have a higher number of PHCs. Except Bangalore urban, the remaining 4 districts namely, Dharwad, Raichur, Gulbarga and Bellary are the districts which have a lower number of PHCs, and they are from North Karnataka.
Among the top 5 districts which have a higher number of beds, except Uttar Kannada, the remaining districts namely Kodagu, Davangere, Chikkaballapur and Mysore are from South Karnataka. Among the lower order 5 districts, along with Bangalore rural & urban from the South region, and the remaining three districts namely Bagalkot, Belgaum and Raichur are from the North Karnataka region.
Health Infrastructure Facilities per Ten Thousand Sq. Km. area
More number of district hospitals are placed in Dharwad and Bellary of North Karnataka followed by Davangere, Bangalore rural, Bangalore urban are from the South region. Among the 5 lower order districts, except Belgaum, Gulbarga, the remaining districts viz. Tumkur, Chitradurga and Hassan are from South Karnataka.
In case of CHCs all 5 higher order districts viz. Chikkaballapur, Bangalore rural, Bangalore urban, Hassan and Udupi are from South Karnataka. In the lower order, the 5 districts, except Bijapur and Dharwad, the remaining districts (Kolar, Chamarajanagar and Tumkur) are from South Karnataka.
More number of PHCs are situated in Bangalore rural, Bangalore urban, Chikkaballapur, Dakshina Kannada and Udupi, these all are from South Karnataka. Among the lower order districts except Kolar, the remaining districts viz. Bijapur, Koppal, Gulbarga and Uttar Kannada are from South Karnataka.
Higher number of beds (among top 5 districts) can be observed in the 4 districts of South Karnataka (Bangalore urban, Bangalore
Status and Infrastructure of Health Sector Artha J Soc Sci, 11, 3(2012)
27
rural, Chikkaballapur and Mysore), 1 district (Dharwad) in North Karnataka. Except Chamarajanagar of South Karnataka, the remaining districts namely Bagalkot, Bijapur, Gulbarga and Koppal are from North Karnataka.
Health Status
Excluding Belgaum, the remaining districts viz. Udupi, Dakshina Kannada, Shimoga, Bangalore urban are from South Karnataka in case of the top 5 districts in LEB. All the lower order 5 districts (Bagalkot, Dharwad, Haveri, Bijapur and Gadag) are from North Karnataka.
With regard to the IMR, the top five districts viz. Dharwad, Haveri, Bijapur, Gadag and Gulbarga are from North Karnataka. In the lower order, except, Belgaum, the remaining districts (Udupi, Dakshina Kannada, Shimoga, Bangalore urban and Bangalore rural) are from South Karnataka.
The analysis clearly shows that with respect to all the health infrastructure facilities, North Karnataka districts have remained lower, which has resulted in their poor health status. Different health indicators show different status of health condition. Hence considering all the indicators and constructing the index is a widely used method to analyse the overall condition/status of the health sector. Among the indicators, the Principle Composite Index (PCI) Weighted Indexing (WI), Relativity Index (RI) methods and many others have been used by the analysts. In the present study, the relativity index method and weighted index method have been used to construct the indices. They are presented below,
HII =𝑋𝑑
𝑋𝑠 Where , ‘d’ stands for district, ‘s’ state, ‘X’ variable
HSI = 𝐴𝑐𝑡𝑢𝑎𝑙 𝑉𝑎𝑙𝑢𝑒 −𝑀𝑖𝑛𝑖𝑚𝑢𝑚 𝑉𝑎𝑙𝑢𝑒
𝑀𝑎𝑥𝑖𝑚𝑢𝑚 𝑉𝑎𝑙𝑢𝑒 −𝑀𝑖𝑛𝑖𝑚𝑢𝑚 𝑉𝑎𝑙𝑢𝑒

Siddu V H et al. ISSN 0975-329X
28
Table 4: Districtwise Selected Health Infrastructure Facilities in Karnataka, 2010
Actual Rank Actual Rank Actual Rank Actual Rank Actual Rank Actual Rank Actual Rank Actual Rank
Bagalkot 0.5 25 6.3 11 143 23 586 28 2 24 18 14 411 23 1680 27
Belgaum 0.2 29 5 21 144 22 602 27 1 28 18 15 511 17 2144 17
Bellary 2.4 4 5.1 20 135 25 1065 9 7 5 15 18 407 24 3202 10
Bidar 0.6 23 5.9 14 168 19 724 21 2 21 18 13 523 16 2258 14
Bijapur 0.9 19 5.5 19 160 21 678 23 2 20 11 26 333 25 1407 28
Dharwad 2.2 5 1.6 28 114 28 1030 10 9 3 7 29 499 18 4496 5
Gadag 2.8 3 5.6 17 196 15 805 16 6 6 13 23 449 20 1842 24
Gulbarga 0.3 28 8 7 135 26 765 18 1 29 18 12 311 27 1763 26
Haveri 0.6 21 7 9 227 11 716 22 2 18 23 7 738 10 2331 13
Koppal 1.4 10 7.9 8 165 20 644 24 2 16 13 21 271 28 1059 29
Raichur 0.5 26 4.7 24 129 27 637 25 2 22 16 17 448 21 2205 16
Uttara
Kannada 1.4 11 9 3 138 24 1350 3 2 19 13 24 193 29 1885 22
Bangalore 1.3 13 0.6 29 27 29 518 29 55 1 27 5 1178 3 22685 1
Bangalore
Rural 1 16 3 27 241 8 621 26 11 2 32 2 2543 1 6549 3
Chamarajan
agar 1 17 5.9 15 297 5 1019 12 2 23 11 27 533 15 1829 25
Chikkaballa
pura 0.8 20 5.6 18 191 16 756 19 8 4 53 1 1813 2 7160 2
Chikmagalu
r 1.8 6 8.8 5 372 2 1299 4 3 15 14 20 587 12 2052 20
Chitradurga 0.6 22 9 4 216 13 941 14 1 26 18 16 428 22 1862 23
Dakshina
Kannada 1.4 9 4.8 23 239 9 964 13 6 8 21 9 1028 4 4148 6
Davanagere 1.5 8 4.6 25 202 14 1077 7 5 11 15 19 655 11 3483 9
Hassan 0.6 24 11.8 2 307 4 1572 2 1 25 31 3 800 9 4097 7
Kodagu 3.6 1 14.4 1 397 1 2176 1 5 12 20 11 536 14 2942 11
Kolar 3.2 2 3.9 26 170 18 1112 6 6 9 7 28 319 26 2082 19
Mandya 1.1 15 6.1 13 267 7 1067 8 4 13 22 8 974 6 3890 8
Mysore 1.3 12 5.7 16 190 17 1186 5 6 7 27 6 908 7 5668 4
Ramanagara 0.9 18 6.5 10 272 6 738 20 3 14 20 10 827 8 2248 15
Shimoga 1.1 14 6.3 12 226 12 1029 11 2 17 13 22 468 19 2135 18
Tumkur 0.4 27 4.8 22 228 10 776 17 1 27 12 25 577 13 1965 21
Udupi 1.7 7 8.5 6 310 3 861 15 6 10 28 4 1014 5 2818 12
North 1 5.9 149 775 2.5 15.6 395 2048
South 1.3 4.8 184 902 4.7 18.2 693 3393
Karnataka 1.1 5.3 169 847 4 17 540 2701
North 76 32 20 29 91 27 33 41
South 63 50 34 37 171 50 62 109
Karnataka 67 3 80 349 10 9 489 3972
Per 10 Lakh Population Per 10 thousand sq KM Area
District and
other
Hospitals
Community
Health Centres
PHCs and Sub
CentresTotal Beds
District and
other
Hospitals
Community
Health Centres
CV
PHCs and
Sub CentresTotal Beds
No
rth
So
uth
All
Reg
ion
Name
source: Karnataka at a Glance

Status and Infrastructure of Health Sector Artha J Soc Sci, 11, 3(2012)
29
Maximum and minimum Values
Using the method mentioned above, the HII and HSI have been calculated and presented in the below mentioned table. The averages of HII and HSI show that North Karnataka stands lower than the average of the state and that of South Karnataka. The value of HII is 1.14 in South Karnataka whereas it is only 0.86 in North Karnataka. On the other side, the value of HSI in South is 1.02 and in North Karnataka it is 0.96. It is observed that there is a huge gap in HII between the Southern and the Northern districts, while in HSI, it is low.
Regional disparity is measured through coefficient of variation, which has been presented in the table. CV is high in HII (9%) than HSI (47%). Regional imbalances within the regions (North or South) show that South Karnataka has higher district disparities than the North Karnataka. Regional disparity is measured through coefficient of variation, which has been presented in the table. CV is high in HII (9%) than HSI (47%). Regional imbalances within the regions (North or South) show that South Karnataka has higher district disparities than the North Karnataka.
Based on the Ranks of HII and HIS, the following three conclusions can be drawn: one, Bangalore Urban tops in HII and Dakshina Kannada district tops in HSI. Both these districts are from South Karnataka; two, Dharwad and Bagalkot stand last in positions, respectively with regard to the HII and HSI respectively. All the top 5 districts in HII are from South Karnataka viz. Bangalore Urban, Bangalore rural, Chikkaballapur, Kodagu and Udupi, whereas, all the bottom 5 districts are from North Karnataka viz. Bagalkot, Belgaum, Bijapur, Gulbarga and Raichur; and three, among the top 5 districts in HSI, except Belgaum, the remaining districts viz. Dakshina Kannada, Udupi, Shimoga and Bangalore urban are from South Karnataka.

Siddu V H et al. ISSN 0975-329X
30
Table 5: Districtwise Selected Health Status in Karnataka, 2010;
Source: Karnataka at a Glance
Region District
HII HSI Value Rank Value Rank
No
rth
Bagalkot 0.76 25 0.89 25
Belgaum 0.71 29 1.13 3
Bellary 1.24 11 1.02 10
Bidar 0.86 22 0.9 23
Bijapur 0.74 27 0.89 28
Dharwad 1.22 12 0.87 29
Gadag 1.22 13 0.89 24
Gulbarga 0.74 28 0.89 27
Haveri 1.03 17 0.89 26
Koppal 0.85 23 0.91 22
Raichur 0.75 26 0.95 17
Uttara Kannada 0.96 20 0.94 18
So
uth
Bangalore 3.68 1 1.12 5
Bangalore Rural 1.95 2 1.08 7
Chamarajanagar 0.96 19 0.96 14
Chikkaballapura 1.88 4 1.09 6
Chikmagalur 1.3 10 0.92 20
Chitradurga 0.94 21 1 12
Dakshina
Kannada 1.39 8 1.14 1
Davanagere 1.18 14 1.03 9
Hassan 1.45 7 0.96 15
Kodagu 1.93 3 0.92 19
Kolar 1.18 15 0.95 16
Mandya 1.33 9 0.92 21
Mysore 1.49 6 0.98 13
Ramanagara 1.1 16 1.05 8
Shimoga 0.98 18 1.12 4
Tumkur 0.79 24 1.02 11
Udupi 1.51 5 1.13 2
All
North 0.86 0.92
South 1.14 1.02
Karnataka 1 1
CV
North 22.3 8
South 45.2 7.6
Karnataka 47.2 9
Status and Infrastructure of Health Sector Artha J Soc Sci, 11, 3(2012)
31
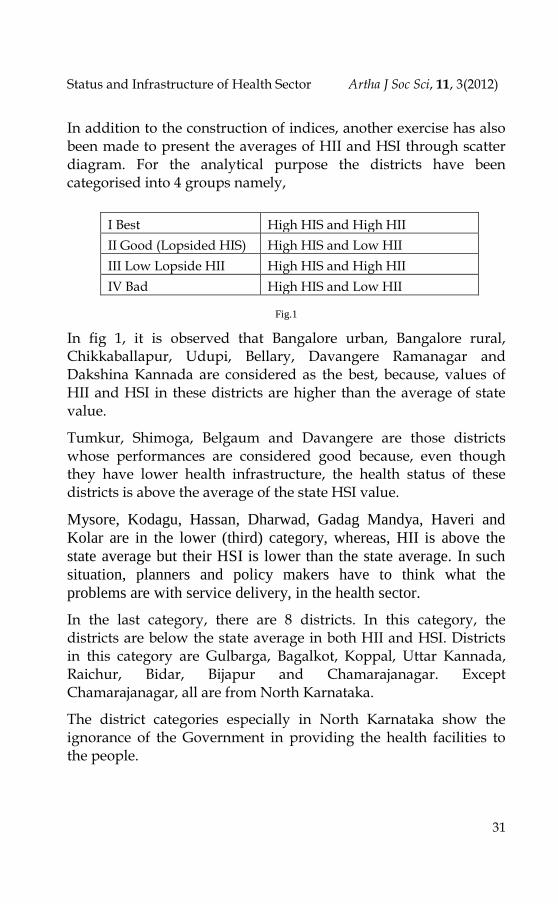
In addition to the construction of indices, another exercise has also been made to present the averages of HII and HSI through scatter diagram. For the analytical purpose the districts have been categorised into 4 groups namely,
Fig.1
In fig 1, it is observed that Bangalore urban, Bangalore rural, Chikkaballapur, Udupi, Bellary, Davangere Ramanagar and Dakshina Kannada are considered as the best, because, values of HII and HSI in these districts are higher than the average of state value.
Tumkur, Shimoga, Belgaum and Davangere are those districts whose performances are considered good because, even though they have lower health infrastructure, the health status of these districts is above the average of the state HSI value.
Mysore, Kodagu, Hassan, Dharwad, Gadag Mandya, Haveri and
Kolar are in the lower (third) category, whereas, HII is above the
state average but their HSI is lower than the state average. In such
situation, planners and policy makers have to think what the
problems are with service delivery, in the health sector.
In the last category, there are 8 districts. In this category, the districts are below the state average in both HII and HSI. Districts in this category are Gulbarga, Bagalkot, Koppal, Uttar Kannada, Raichur, Bidar, Bijapur and Chamarajanagar. Except Chamarajanagar, all are from North Karnataka.
The district categories especially in North Karnataka show the ignorance of the Government in providing the health facilities to the people.
I Best High HIS and High HII
II Good (Lopsided HIS) High HIS and Low HII
III Low Lopside HII High HIS and High HII
IV Bad High HIS and Low HII

Siddu V H et al. ISSN 0975-329X
32
Table 6: Districtwise Health Infrastructure (HII) and Health Status (HSI) Indices of Karnataka, 2010
Source: Karnataka at a Glance
Region District
HII HSI
Value Rank Value Rank
No
rth
Bagalkot 0.76 25 0.89 25
Belgaum 0.71 29 1.13 3
Bellary 1.24 11 1.02 10
Bidar 0.86 22 0.9 23
Bijapur 0.74 27 0.89 28
Dharwad 1.22 12 0.87 29
Gadag 1.22 13 0.89 24
Gulbarga 0.74 28 0.89 27
Haveri 1.03 17 0.89 26
Koppal 0.85 23 0.91 22
Raichur 0.75 26 0.95 17
Uttara Kannada 0.96 20 0.94 18
So
uth
Bangalore 3.68 1 1.12 5
Bangalore Rural 1.95 2 1.08 7
Chamarajanagar 0.96 19 0.96 14
Chikkaballapura 1.88 4 1.09 6
Chikmagalur 1.3 10 0.92 20
Chitradurga 0.94 21 1 12
Dakshina
Kannada 1.39 8 1.14 1
Davanagere 1.18 14 1.03 9
Hassan 1.45 7 0.96 15
Kodagu 1.93 3 0.92 19
Kolar 1.18 15 0.95 16
Mandya 1.33 9 0.92 21
Mysore 1.49 6 0.98 13
Ramanagara 1.1 16 1.05 8
Shimoga 0.98 18 1.12 4
Tumkur 0.79 24 1.02 11
Udupi 1.51 5 1.13 2
All
North 0.86
0.92
South 1.14
1.02
Karnataka 1
1
CV
North 22.3
8
South 45.2
7.6
Karnataka 47.2
9

Status and Infrastructure of Health Sector Artha J Soc Sci, 11, 3(2012)
33
Role of Government
In India, due to poor financial conditions, it is difficult to expect the people to spend a lot from their pockets on health. People with sound financial background can spend good amount of money on health. But the poor cannot spend much on health. Most of the poor people in India are from the village and they are daily wage labourers. Their employment is seasonal and due to disguised unemployment, they are underpaid. Hence most of their income is spent on food, clothes and other basic amenities. And many a times, they face acute scarcity for these things. Therefore, the Government expenditure is not only necessary but also indispensable or sine qua non. The Karnataka state Government has been implementing various policy/programmes to improve the health condition of the people. It has been allocating a huge amount of money through budget over a period of time. Information related to health expenditure in Karnataka has been presented in Table. 7 It shows total health expenditure and per capita health expenditure at current and constant prices (2004-05 prices), along with this, health expenditure as a share of total budgetary expenditure and as a share of NSDP (Net State Domestic Product).
HII Fig. 1: Categorisation of the Districts above and below Average of HII and HSI of the State
Source: Computed from the data available from Karnataka at a Glance

Siddu V H et al. ISSN 0975-329X
34
Health expenditure of the state during 1990-91 at current prices is Rs 38,729 lakhs, which, increased to Rs 598058 lakhs, it means that there is a 15 times increase in the 20 years of time period, which is 12 times in per capita term. This impressive picture gets offset when we see these data in per capita real (2004-05 prices) prices. In per capita real term, health expenditure has increased only 3.6 times, i.e. per capita health expenditure at constant prices has increased from Rs. 215 in 1990-91 to Rs. 777 in 2009-10.
Observing the present health condition of Karnataka, this expenditure is significantly lower. On the other hand, health expenditure as a share of total expenditure is also lower. In the reference period, the health expenditure as a share of total expenditure is between 6 per cent and 11 per cent. In 1990-91 it was 7.8 per cent, which increased to 10.7 percent. In the following years, it started decreasing and reached 6.1 per cent during 2004-05, which is the lowest among the 20 years of the selected time period.
Further, in the latter years, it started increasing and reached 10.5 per cent in 2009-10. Health Expenditure as a share of NSDP is presented in the above mentioned table. It is also observed from the table that the health expenditure as a share of NSDP was 1.5 per cent, which increased to 1.9 per cent in 1990-00. (But it has not been maintained and decreased to 1.3 per cent in 2004-05). Further, it has shown an increasing trend and reached to 2 per cent.
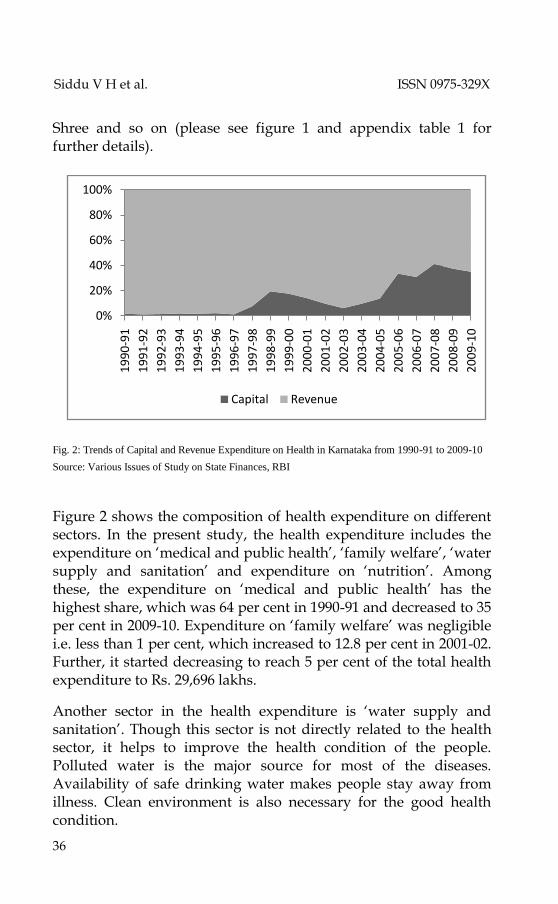
Government expenditure has been categorised in capital and revenue accounts. It is a known fact that both the capital and revenue expenditure are important for the development of the sector. Capital expenditure plays a very important role because revenue expenditure is mostly devoted on the salary of the staff and the maintenance expenses, whereas, the capital expenditure is spent on creation of new assets like building equipments and so on. The Composition of capital and revenue health expenditure of the Karnataka state has been presented in Figure 2.

Status and Infrastructure of Health Sector Artha J Soc Sci, 11, 3(2012)
35
Table 7: Health Expenditure in Karnataka from 1990-91 to 2009-10
Source: Various Issues of -Study on State Finances, RBI
It is observed that the revenue expenditure is very high compared to that of capital expenditure, which is a very common phenomenon because, in the health sector, creation of assets is important in general and maintenance in particular. It is also seen that the State’s capital expenditure was very less i.e. Rs. 657 lakhss during 1990-91 (1.7 per cent) as against Rs. 37415 lakhss of revenue expenditure (98.3 per cent) during 1998-99.
This composition was 19.5 per cent and 79.5 per cent for capital and revenue respectively, further, capital expenditure decreased to 6.1 per cent during 2002-03, again started increasing in the later years and reached to, 35 per cent in 2009-10. It is observed that the capital expenditure in the recent years has increased significantly due to the implementation of various health programmes like National Rural Health Mission (NRHM), Health For All, Vajapayee Arogya
Year Current Prices Constant Prices As share
of NSDP
As share of
Total Expns Actual Per Capita Actual Per capita
1990-91 38729 87 96241 215 1.5 7.8
1991-92 46484 102 100066 220 1.4 7.4
1992-93 50062 109 101100 219 1.4 7.1
1993-94 55578 118 103674 220 1.3 6.9
1994-95 69793 145 117651 245 1.4 7.9
1995-96 80914 165 123619 252 1.4 7.8
1996-97 87668 176 125984 253 1.3 7.3
1997-98 118544 235 162259 321 1.6 9.4
1998-99 158574 310 202673 396 1.7 10.7
1999-00 187354 362 233317 450 1.9 10.5
2000-01 174872 333 205992 392 1.7 8.9
2001-02 171827 326 200763 381 1.6 7.8
2002-03 152100 285 174872 328 1.3 6.3
2003-04 172591 320 187535 347 1.4 6.4
2004-05 192637 352 192637 352 1.3 6.1
2005-06 289755 530 272777 499 1.7 8.2
2006-07 301532 544 267677 483 1.5 7.3
2007-08 456758 817 383830 686 1.9 10
2008-09 541233 959 422471 749 2 10.6
2009-10 598058 1050 442130 777 2 10.5
Growth
Rate 14.36 12.94 7.97 6.63 1.45
Siddu V H et al. ISSN 0975-329X
36
Shree and so on (please see figure 1 and appendix table 1 for further details).
Fig. 2: Trends of Capital and Revenue Expenditure on Health in Karnataka from 1990-91 to 2009-10
Source: Various Issues of Study on State Finances, RBI
Figure 2 shows the composition of health expenditure on different sectors. In the present study, the health expenditure includes the expenditure on ‘medical and public health’, ‘family welfare’, ‘water supply and sanitation’ and expenditure on ‘nutrition’. Among these, the expenditure on ‘medical and public health’ has the highest share, which was 64 per cent in 1990-91 and decreased to 35 per cent in 2009-10. Expenditure on ‘family welfare’ was negligible i.e. less than 1 per cent, which increased to 12.8 per cent in 2001-02. Further, it started decreasing to reach 5 per cent of the total health expenditure to Rs. 29,696 lakhs.
Another sector in the health expenditure is ‘water supply and sanitation’. Though this sector is not directly related to the health sector, it helps to improve the health condition of the people. Polluted water is the major source for most of the diseases. Availability of safe drinking water makes people stay away from illness. Clean environment is also necessary for the good health condition.
0%
20%
40%
60%
80%
100%
19
90
-91
19
91
-92
19
92
-93
19
93
-94
19
94
-95
19
95
-96
19
96
-97
19
97
-98
19
98
-99
19
99
-00
20
00
-01
20
01
-02
20
02
-03
20
03
-04
20
04
-05
20
05
-06
20
06
-07
20
07
-08
20
08
-09
20
09
-10
Capital Revenue

Status and Infrastructure of Health Sector Artha J Soc Sci, 11, 3(2012)
37
Fig. 3: Trends of Composition of Health Expenditure in Karnataka from 1990-91 to 2009-10
Source: Various Issues of Study on State Finances, RBI
Hence, spending on sanitation is also an important thing. In 1990-91, the expenditure on water supply and sanitation was Rs. 6,086 lakhs which was increased to Rs. 1,44,488 lakhs in 2009-10. The Share of this sector is between 16 and 30 per cent during the 20 years of the study period. In the year 1990-91, the share of spending on this sector was 10 per cent, which increased to 30 per cent in 2002-03 and started decreasing to reach 24 per cent in 2009-10. Further, nutrition should also be given importance, in the health sectors as it plays an important role in the development of the health condition of the community. A well nourished body would be protected from all diseases. The Expenditure on this sector was Rs. 7,684 lakhs in 1990-91, which was increased to Rs. 2,16,232 lakhs in 2009-10. The share of spending on this sector to the total health expenditure was 20 per cent in 1990-91, which was decreased to 6 per cent in 1993-94. The trend of spending on this sector started to increase afterwards and reached 35 per cent in 2009-10. Rapid spending on this sector has to be admired (please see figure 3 and appendix table 2).
0
20
40
60
801
99
0-9
1
19
91
-92
19
92
-93
19
93
-94
19
94
-95
19
95
-96
19
96
-97
19
97
-98
19
98
-99
19
99
-00
20
00
-01
20
01
-02
20
02
-03
20
03
-04
20
04
-05
20
05
-06
20
06
-07
20
07
-08
20
08
-09
20
09
-10
% o
f e
xpe
nd
itu
re
Years
Medical and Public HealthFamily Welfare

Siddu V H et al. ISSN 0975-329X
38
Conclusions
Health is an important basic need. Healthy people are the real wealth of the nation. With regard to the health infrastructure and health status, though India has made significant improvements, it is comparatively lagging behind many developed and developing countries. Karnataka is closer to the average of India, in most of the health status and health facilities, but compared to the states like Kerala, it stands too low. The most striking problem related to the health infrastructure and health status arises out of the regional imbalance. This study shows that Gulbarga and Belgaum divisions of Karnataka show a poor status in health infrastructure and health status. Among these, the Gulbarga division (means Hyderabad Karnataka) lies in the lower position. It is well know that Hyderabad Karnataka is under developed in most of the sectors compared to the rest of the regions. Lower health infrastructure facilities in this region clearly indicate the negligence of the Government intervention/interest to develop basic infrastructure facilities in this region. For better health, health facilities should be improved. For better health facilities, public health expenditure is very important. At present, the Karnataka Government is spending very less amount of money on health that is 2 per cent of the NSDP, which has to be increased. Of this expenditure, the capital expenditure is increasing over the period of time very rapidly which is to be admired. In Karnataka, to improve the health facilities many programmes are being implemented, among them NRHM is important, which has to be implemented more meaningfully. The increasing of public expenditure alone cannot serve the purpose, unless it is properly used for delivering quality infrastructure and good service mechanisation.
References
Dadibhavi, R. V., & Bagalkoti, S. T. (1994). Inter-state disparities in health status in India. Yojana , 41(1)
Government of India, (2011). India human development report Government of Karnataka, (2005). Karnataka human development report UNDP, (2011). Human development report Government of Karnataka. Various issues of Karnataka at a glance

Status and Infrastructure of Health Sector Artha J Soc Sci, 11, 3(2012)
39
Appendix Table 1: Districtwise Health Number of Different Health Infrastructure Facilities,
Population and Area Sq. KMs, 2010.
Source: Karnataka at a Glance
District District
and other
Hospitals
Community
Health
Centres
PHCs
and Sub
Centres
Total
Beds
Population Area (Sq.
Kms.)
Bagalkot 1 12 271 1108 1890826 6594
Belgaum 1 24 686 2876 4778439 13415
Bellary 6 13 343 2696 2532383 8419
Bidar 1 10 285 1230 1700018 5448
Bijapur 2 12 349 1474 2175102 10475
Dharwad 4 3 211 1902 1846993 4230
Gadag 3 6 209 858 1065235 4657
Gulbarga 1 30 505 2860 3737877 16224
Haveri 1 11 358 1131 1580506 4851
Koppal 2 11 229 896 1391292 8458
Raichur 1 9 249 1226 1924773 5559
Uttara Kannada 2 13 199 1940 1436847 10291
Bangalore 12 6 258 4968 9588910 2190
Bangalore Rural 1 3 238 613 987257 936
Chamarajanagar 1 6 303 1040 1020962 5685
Chikkaballapura 1 7 240 948 1254377 1324
Chikmagalur 2 10 423 1478 1137753 7201
Chitradurga 1 15 359 1562 1660378 8388
Dakshina Kannada 3 10 498 2009 2083625 4843
Davanagere 3 9 394 2096 1946905 6018
Hassan 1 21 545 2792 1776221 6814
Kodagu 2 8 220 1207 554762 4102
Kolar 5 6 262 1712 1540231 8223
Mandya 2 11 483 1930 1808680 4961
Mysore 4 17 569 3553 2994744 6269
Ramanagara 1 7 294 799 1082739 3555
Shimoga 2 11 396 1807 1755512 8465
Tumkur 1 13 612 2082 2681449 10598
Udupi 2 10 365 1014 1177908 3598
North 25 154 3894 20197 26060291 98621
South 44 170 6459 31610 35052413 93170
Karnataka 69 324 10353 51807 61130704 191791

Siddu V H et al. ISSN 0975-329X
40
Appendix Table 2: Districtwise Normalised Indicators on Health Infrastructure Facilities, 2010
Source: Karnataka at a Glance, 2011

Status and Infrastructure of Health Sector Artha J Soc Sci, 11, 3(2012)
41
Appendix Table 3: Districtwise Normalised Indicators on Health
Year
Actual Composition
Capital Revenue Total Capital Revenue Total
1990-91 657 37415 38072 1.7 98.3 100
1991-92 528 45428 45956 1.1 98.9 100
1992-93 712 48638 49350 1.4 98.6 100
1993-94 1025 53528 54553 1.9 98.1 100
1994-95 1111 67571 68682 1.6 98.4 100
1995-96 1692 77530 79222 2.1 97.9 100
1996-97 1039 85590 86629 1.2 98.8 100
1997-98 8369 101806 110175 7.6 92.4 100
1998-99 25833 106908 132741 19.5 80.5 100
1999-00 28090 131174 159264 17.6 82.4 100
2000-01 21618 131636 153254 14.1 85.9 100
2001-02 15221 141385 156606 9.7 90.3 100
2002-03 8798 134504 143302 6.1 93.9 100
2003-04 15200 142191 157391 9.7 90.3 100
2004-05 23258 146121 169379 13.7 86.3 100
2005-06 72778 144199 216977 33.5 66.5 100
2006-07 71139 159254 230393 30.9 69.1 100
2007-08 133333 190092 323425 41.2 58.8 100
2008-09
(RE) 147564 246105 393669 37.5 62.5 100
2009-10
(BE) 155161 287736 442897 35 65 100
Growth
Rate 37 10 12

Siddu V H et al. ISSN 0975-329X
42
Appendix Table 4: Capital and Revenue Expenditure on Health in Karnataka from 1990-91 to 2009-10
Source: Various Issues of Study of State finances, RBI

Status and Infrastructure of Health Sector Artha J Soc Sci, 11, 3(2012)
43
Appendix Table 5: Composition of Health Expenditure of Karnataka from 1990-91 to 2009-10
Source: Various Issues of Study of State finances, RBI
Copyright © 2022 FDOKUMEN