Statistical analysis of textural data from complex pyroclastic sequences: implications for...
19
Abstract The Agnano-Monte Spina eruption (4.1 ka) generated pyroclastic deposits with complex internal stratigraphy that reflects variations in eruptive style. To obtain constraints on the fragmentation processes, we analysed grain-size and scanning electron microscopy (SEM) data by means of multivariate statistical tech- niques of the cluster and factor analysis types. The re- sults allow the identification of end-member deposits re- lated to either pure magmatic activity, or pure phreato- magmatic activity. In addition, some deposits show evi- dence of the contemporaneous operation of both end- member fragmentation modes. The presence of the two contrasting fragmentation processes during the various phases of explosive activity is tentatively interpreted to be a function in inhomogeneities in gas exsolution pro- cesses within the magma column that feeds the eruption. Keywords Agnano-Monte Spina Tephra · Fragmenta- tion processes · Phlegraean Fields · Pyroclastic sequenc- es · Scanning electron microscopy Introduction Pyroclastic deposits represent the end result of three pro- cesses: fragmentation, transportation and deposition. Lithological features of pyroclastic deposits (grain size, structures and thickness) mostly relate to depositional mechanisms, and in many cases give insufficient infor- mation for the interpretation of fragmentation and trans- portation processes. Nevertheless, it is clear that in some complex pyroclastic sequences, lithological variations reflect contrasting eruptive dynamics. Data on deposit features and lateral facies transitions (e.g. Sohn and Chough 1989) can constrain hypotheses regarding the transportation dynamics, at least where very good expo- sure and preservation occur throughout the dispersal ar- ea. In such instances, macroscale and mesoscale features of the deposits in the field can also be used to infer the fragmentation processes. For example, tuff rings and tuff cones may consist of pyroclasts generated by phreato- magmatic and magmatic explosions occurring either contemporaneously or in rapid alternation (Houghton and Schmincke 1989; Dellino and La Volpe 1995). Pyro- clastic deposits from some plinian eruptions also show evidence for different fragmentation mechanisms alter- nating during the event (Cioni et al. 1992). Any hypotheses regarding fragmentation processes need to be carefully tested by means of textural analysis of juvenile clasts, especially fine ash, and thus require microscopic investigation. In the case of complex pyro- clastic sequences, it is crucial to address the role of frag- mentation mechanisms for each layer of the deposit. Al- though time consuming, such detailed microscopic in- vestigations are necessary in order to precisely constrain the various fragmentation processes that operated during the eruption. In this paper, we address the fragmentation processes responsible for the complex pyroclastic sequence gener- ated by the Agnano-Monte Spina eruption at Phlegraean Fields (Italy). This eruption represents the scenario ex- pected of any future volcanic activity; therefore, detailed knowledge of the eruptive dynamics is crucial in hazard assessment of the Phlegraean area. Using the stratigraph- ic framework developed by de Vita et al. (1999), we have tested hypotheses on fragmentation mechanisms that emerged from the field study. Grain-size analysis and scanning electron microscopy (SEM) data have proven to be particularly important because fine ash rep- Editorial responsibility: J. McPhie P. Dellino ( ✉ ) · L.L. Volpe Dipartimento Geomineralogico, Università di Bari, Via E. Orabona, 4-70125 Bari, Italy e-mail: [email protected] Tel.: +39-80-5442603, Fax: +39-80-5442591 R. Isaia · G. Orsi Osservatorio Vesuviano, Via Diocleziano, Napoli, Italy Bull Volcanol (2001) 63:443–461 DOI 10.1007/s004450100163 RESEARCH ARTICLE P. Dellino · R. Isaia · L. La Volpe · G. Orsi Statistical analysis of textural data from complex pyroclastic sequences: implications for fragmentation processes of the Agnano-Monte Spina Tephra (4.1 ka), Phlegraean Fields, southern Italy Received: 8 January 2000 / Accepted: 11 June 2001 / Published online: 17 August 2001 © Springer-Verlag 2001
-
Upload
independent -
Category
Documents
-
view
3 -
download
0
Transcript of Statistical analysis of textural data from complex pyroclastic sequences: implications for...

Abstract The Agnano-Monte Spina eruption (4.1 ka)generated pyroclastic deposits with complex internalstratigraphy that reflects variations in eruptive style. Toobtain constraints on the fragmentation processes, weanalysed grain-size and scanning electron microscopy(SEM) data by means of multivariate statistical tech-niques of the cluster and factor analysis types. The re-sults allow the identification of end-member deposits re-lated to either pure magmatic activity, or pure phreato-magmatic activity. In addition, some deposits show evi-dence of the contemporaneous operation of both end-member fragmentation modes. The presence of the twocontrasting fragmentation processes during the variousphases of explosive activity is tentatively interpreted tobe a function in inhomogeneities in gas exsolution pro-cesses within the magma column that feeds the eruption.
Keywords Agnano-Monte Spina Tephra · Fragmenta-tion processes · Phlegraean Fields · Pyroclastic sequenc-es · Scanning electron microscopy
Introduction
Pyroclastic deposits represent the end result of three pro-cesses: fragmentation, transportation and deposition.Lithological features of pyroclastic deposits (grain size,structures and thickness) mostly relate to depositionalmechanisms, and in many cases give insufficient infor-mation for the interpretation of fragmentation and trans-
portation processes. Nevertheless, it is clear that in somecomplex pyroclastic sequences, lithological variationsreflect contrasting eruptive dynamics. Data on depositfeatures and lateral facies transitions (e.g. Sohn andChough 1989) can constrain hypotheses regarding thetransportation dynamics, at least where very good expo-sure and preservation occur throughout the dispersal ar-ea. In such instances, macroscale and mesoscale featuresof the deposits in the field can also be used to infer thefragmentation processes. For example, tuff rings and tuffcones may consist of pyroclasts generated by phreato-magmatic and magmatic explosions occurring eithercontemporaneously or in rapid alternation (Houghtonand Schmincke 1989; Dellino and La Volpe 1995). Pyro-clastic deposits from some plinian eruptions also showevidence for different fragmentation mechanisms alter-nating during the event (Cioni et al. 1992).
Any hypotheses regarding fragmentation processesneed to be carefully tested by means of textural analysisof juvenile clasts, especially fine ash, and thus requiremicroscopic investigation. In the case of complex pyro-clastic sequences, it is crucial to address the role of frag-mentation mechanisms for each layer of the deposit. Al-though time consuming, such detailed microscopic in-vestigations are necessary in order to precisely constrainthe various fragmentation processes that operated duringthe eruption.
In this paper, we address the fragmentation processesresponsible for the complex pyroclastic sequence gener-ated by the Agnano-Monte Spina eruption at PhlegraeanFields (Italy). This eruption represents the scenario ex-pected of any future volcanic activity; therefore, detailedknowledge of the eruptive dynamics is crucial in hazardassessment of the Phlegraean area. Using the stratigraph-ic framework developed by de Vita et al. (1999), wehave tested hypotheses on fragmentation mechanismsthat emerged from the field study. Grain-size analysisand scanning electron microscopy (SEM) data haveproven to be particularly important because fine ash rep-
Editorial responsibility: J. McPhie
P. Dellino (✉ ) · L.L. VolpeDipartimento Geomineralogico, Università di Bari, Via E. Orabona, 4-70125 Bari, Italye-mail: [email protected].: +39-80-5442603, Fax: +39-80-5442591
R. Isaia · G. OrsiOsservatorio Vesuviano, Via Diocleziano, Napoli, Italy
Bull Volcanol (2001) 63:443–461DOI 10.1007/s004450100163
R E S E A R C H A RT I C L E
P. Dellino · R. Isaia · L. La Volpe · G. Orsi
Statistical analysis of textural data from complex pyroclastic sequences: implications for fragmentation processes of the Agnano-Monte Spina Tephra (4.1 ka), Phlegraean Fields, southern Italy
Received: 8 January 2000 / Accepted: 11 June 2001 / Published online: 17 August 2001© Springer-Verlag 2001

resents a large fraction of deposit volume. The use ofmultivariate statistics has helped to refine aspects of thefragmentation processes that were not fully constrainedby field data.
Geological setting and previous knowledge of the Agnano-Monte Spina deposits
The Campi Flegrei caldera (CFc) is the result of two ma-jor collapses at 37 and 12 ka B.P. (Fig. 1, Orsi et al.1996). The older collapse relates to the eruption of theCampanian Ignimbrite (~150 km3 of magma; Fisher etal. 1993; Rosi et al. 1996; Civetta et al. 1997). Theyounger collapse accompanied the Neapolitan YellowTuff eruption (~50 km3 of magma; Orsi et al. 1992,1995; Wohletz et al. 1995). The younger caldera hasbeen the site of intense volcanism (Di Vito et al. 1999).There have been 61 eruptions subsequently, grouped intothree epochs of activity (12–9.5, 8.6–8.2, 4.8–3.8 ka B.P.)each separated by a quiescent period. Eruptions havebeen mostly explosive; only four were effusive. The lasteruption occurred in 1538 A.D. and formed the MonteNuovo cone (Di Vito et al. 1987). The explosive erup-tions have been mostly small events spreading productsover areas up to 100 km2. The two large eruptions, withdispersal areas of about 1,000 km2, are Pomici Principali
(10.3 ka; Lirer et al. 1987; Di Vito et al. 1999) and Ag-nano-Monte Spina (4.1 ka; de Vita et al. 1999). They oc-curred during the first and third epoch of activity, respec-tively. The volcanic system of the CFc is still active, astestified by the intense fumarolic activity and by the twobradyseismic events that occurred between 1969 and1972, and 1982 and 1984 (Orsi et al. 1999). These twoevents generated a net ground uplift of 3.5 m at Pozzuoli, in the central part of the Neapolitan YellowTuff caldera. The presence of about 300,000 people inthe central part of the caldera makes the volcanic riskvery high.
The Agnano-Monte Spina Tephra (AMST) was firstdefined by Rosi et al. (1983) and later described by DiGirolamo et al. (1984), Rosi and Santacroce (1984), Rosiand Sbrana (1987). De Vita et al. (1999) presented a de-tailed reconstruction of the stratigraphy, areal distribu-tion, and chemostratigraphy of the AMST, and redefinedthe age of the eruption using 14C (AMS) and 40Ar/39Armethods (4,100±50 years B.P.). The thickness of AMST
444
Fig. 1 a Map of the Phlegraean Fields area showing location ofstratigraphic sections measured in this study (large dots) and thosemeasured by de Vita et al. (1999). The star marks the inferred ventarea of the eruption. b Composite graphic log (not to scale) of theAMST showing the characteristic structures and textures of mem-bers and sub-members (modified from de Vita et al. 1999)

varies from a maximum of about 70 m in the Agnanoplain (Fig. 1a), which is the inferred vent area of theeruption, to a few centimetres over a distance of about50 km (de Vita et al. 1999).
De Vita et al. (1999) subdivided the sequence into sixmembers, named A through to F (Fig. 1b), and sub-members. The reconstruction of the eruption, as present-ed by de Vita et al. (1999), is briefly summarized below.
Member A consists of two sub-members, A1 and A2.Sub-member A1 is a basal ash bed overlain by a coarserpumice lapilli fallout deposit. The eruption began withphreatomagmatic explosions that produced a highly ex-panded ash cloud (basal part of A1). The upper falloutbed of A1 was deposited from a relatively low eruptioncolumn (about 5 km) produced by a magmatic explosion.Sub-member A2 is a sequence of ash to lapilli surge andfallout beds generated by eruption column collapse andphreatomagmatic explosions.
Member B is also composed of two sub-members. B1is a basal pumice lapilli fallout bed dispersed up to about45 km eastward from the vent area. It was depositedfrom an unsteady column, which reached a maximumheight of about 23 km, and was generated by magmaticexplosions. Partial collapses of the column generated thebasal pyroclastic surge deposits of B2. The eruption ratesubsequently waned and produced welded scoriae depos-its, pyroclastic flow deposits and a lag breccia, all dis-tributed within the lowland of the Agnano plain. Thisphase is inferred to record the initiation of volcano-tec-tonic collapse.
The following explosions were phreatomagmatic andgenerated the surge deposits of the upper part of B2.This phase was followed by a pause in the eruption.Heavy rains caused erosion along steep slopes and ashsuspended in the atmosphere was deposited to formmember C. Member C is a fine-ash bed with abundantaccretionary lapilli. It is present in the whole AMST ex-posure area, except for the proximal zone.
Fracturing of the roof rocks of the magma reservoir,which was related to re-activation of faults within theAgnano area, caused lowering of the lithostatic pressurewith consequent volatile exsolution and magma migra-tion toward the surface. Interaction of the rising magmawith the geothermal system caused resumption of theeruption, recorded by the pyroclastic surge beds at thebase of member D (D0). The following event involvedmagmatic explosions and the formation of a Plinianeruption column that reached a maximum height of27 km. This explosive phase generated a fallout deposit(D1) dispersed toward the north-east up to a distance of45 km from the vent. The main episode of volcano-tec-tonic collapse took place during this phase. D2 is madeup of discontinuous pumice lapilli and fine-ash bedsprobably generated by intermittent magma/water interac-tion and/or collapse of the eruption column that formedD1.
Member E is made up of pyroclastic surge depositswith minor fallout beds mainly dispersed northward.Submember E1 represents a phreatomagmatic phase and
was deposited from base surges. During the latest stagesof volcano-tectonic collapse, the vent migrated towardthe north-western part of the collapsed area. E2 was gen-erated by fallout from a short-lived eruption columnprobably driven by magmatic explosions. E3 is the prod-uct of a series of phreatomagmatic explosions that gener-ated surges and minor fallout deposits. The final phase ofthe eruption was also phreatomagmatic, producing ashdeposits (member F). This member probably includesash deposited from suspension in the atmosphere, fa-voured by rainfall, at the end of the eruption.
Lithofacies characteristics and interpretation
We have selected two stratigraphic sections that showthe most complete sequence of AMST. Only the pyro-clastic flow deposits of sub-member B2 are missing fromthe sections studied. The two sections, Ms 159 and Ms151 (Fig. 1), are located inside the CFc at about 4 kmfrom the inferred vent area (Agnano plain) and representmedial to proximal AMST. Section Ms 151 is close tothe main dispersal axis of fallout deposits whereas sec-tion Ms 159 is a little outside the main dispersal axis offallout deposits.
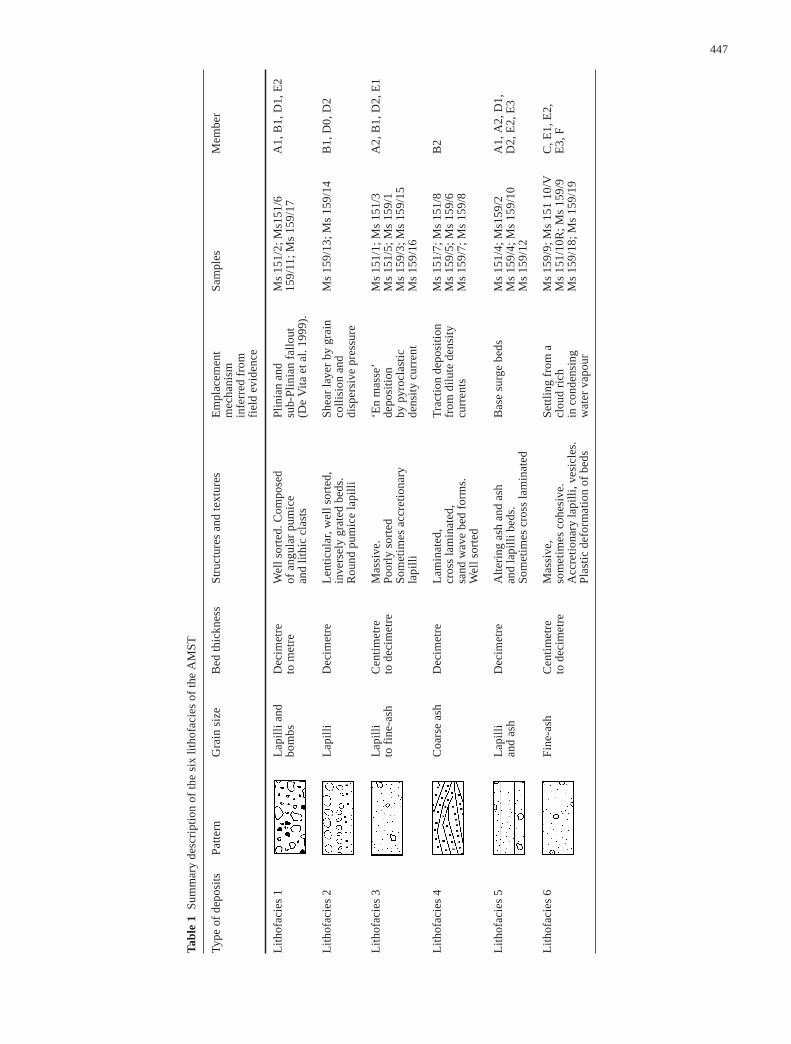
The AMST is composed of well-stratified depositswith highly variable lithological characteristics (Fig. 2).We have recognized six main lithofacies (Table 1), basedon deposit structures and grain size. The transportationand deposition dynamics of the various lithofacies can beinferred using the grain-size information (Fig. 3) togeth-er with structures and textures of the deposits.
Mode of emplacement for the lithofacies inferred fromfield evidence
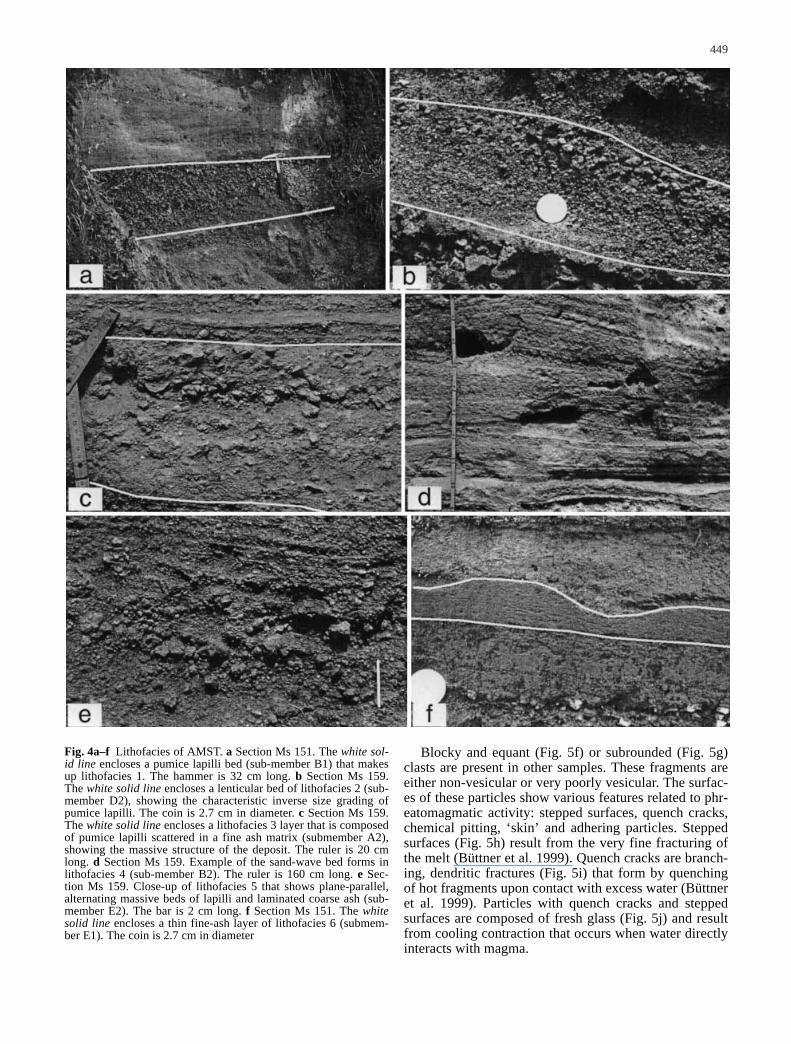
Lithofacies 1 (Fig. 4a) consists of decimetre- to metre-thick structureless layers made up of highly vesicular(vesicularity always >60%), sub-angular, pumice lapilliand scattered lithic fragments. Sub-member D1 is pecu-liar among lithofacies 1 deposits in being very rich inhydrothermally altered lithic fragments. Hydrothermallyaltered lithic fragments are also present in sub-memberB1. Sub-members A1 and E2 include small amounts oflithic clasts composed of fresh lava. This lithofacies cor-responds to the plinian and sub-plinian fallout depositsof de Vita et al. (1999). Layers are thicker and coarser insection Ms 151 (Fig. 2) because it is closer to the maindispersal axis. Samples from the thicker layers plot onthe fallout field whereas samples from the thinner layersplot in the pyroclastic flow field (Fig. 3). This anomalyprobably relates to fine ash percolating down from theoverlying ash beds through the open spaces betweencoarse pumice fragments. This process has caused artifi-cially poor sorting and shifting of data points to thepyroclastic flow field.
Lithofacies 2 (Fig. 4b) consists of decimetre-thick,well-sorted, lenticular layers made up of inversely grad-
445

ed, rounded and sub-rounded, pumice lapilli. Vesicular-ity of the pumice lapilli is higher than 60%. This lithofa-cies mostly occurs in sub-member D2. Bed forms clearlysuggest a lateral shear component during emplacement.Rounding and reverse grading of pumice fragmentscould reflect grain collision and dispersive pressure dur-ing transport. Possible mechanisms include remobiliza-tion of pumice fallout deposits along steep and unstableslopes, or syn-depositional shear exerted by an overrid-ing current on the just-deposited coarser material. Remo-bilization does not seem likely because lithofacies 2 doesnot lie at the base of a steep slope. However, Plinian fall-
out was operative during the formation of member D,and we cannot therefore rule out a fallout component forlithofacies 2. This ambiguity is also reflected in thegrain-size data (Fig. 3): a sample from the topmost (andcoarsest) part of one layer plots in the fallout field,whereas a sample representing a complete reverselygraded layer plots in the pyroclastic flow field.
Lithofacies 3 (Fig. 4c) consists of centimetre-to-deci-metre thick, plane-parallel, internally massive layers offine ash, with scattered subangular pumice lapilli andrare accretionary lapilli. Vesicularity of pumice lapilli istypically higher than 60%. Lithic fragments are fresh la-
446
Fig. 2 Graphic logs of theAMST at a section Ms 159 andb section Ms 151, which arethe subjects of this study.Members and submembers areindicated on the left side of thecolumns. Sample location is in-dicated on the right side of thecolumns and the key shows thelithofacies identified in the suc-cession
447
Tab
le1
Sum
mar
y de
scri
ptio
n of
the
six
lith
ofac
ies
of th
e A
MS
T
Type
of
depo
sits
Pat
tern
Gra
in s
ize
Bed
thic
knes
sS
truc
ture
s an
d te
xtur
esE
mpl
acem
ent
Sam
ples
Mem
ber
mec
hani
smin
ferr
ed f
rom
fiel
d ev
iden
ce
Lit
hofa
cies
1L
apil
li a
nd
Dec
imet
re
Wel
l sor
ted.
Com
pose
d P
lini
an a
nd
Ms
151/
2; M
s151
/6A
1, B
1, D
1, E
2bo
mbs
to m
etre
of a
ngul
ar p
umic
esu
b-P
lini
an f
allo
ut15
9/11
; Ms
159/
17an
d li
thic
cla
sts
(De
Vit
a et
al.
1999
).
Lit
hofa
cies
2L
apil
liD
ecim
etre
Len
ticu
lar,
wel
l sor
ted,
She
ar la
yer
by g
rain
M
s 15
9/13
; Ms
159/
14B
1, D
0, D
2in
vers
ely
grat
ed b
eds.
coll
isio
n an
d R
ound
pum
ice
lapi
lli
disp
ersi
ve p
ress
ure
Lit
hofa
cies
3L
apil
liC
enti
met
reM
assi
ve.
‘En
mas
se’
Ms
151/
1;M
s 15
1/3
A2,
B1,
D2,
E1
to f
ine-
ash
to d
ecim
etre
Poo
rly
sort
edde
posi
tion
Ms
151/
5; M
s 15
9/1
Som
etim
es a
ccre
tion
ary
by p
yroc
last
ic
Ms
159/
3; M
s 15
9/15
lapi
lli
dens
ity
curr
ent
Ms
159/
16
Lit
hofa
cies
4C
oars
e as
hD
ecim
etre
Lam
inat
ed,
Tra
ctio
n de
posi
tion
M
s 15
1/7;
Ms
151/
8B
2cr
oss
lam
inat
ed,
from
dil
ute
dens
ity
Ms
159/
5; M
s 15
9/6
sand
wav
e be
d fo
rms.
curr
ents
Ms
159/
7; M
s 15
9/8
Wel
l sor
ted
Lit
hofa
cies
5L
apil
li
Dec
imet
reA
lter
ing
ash
and
ash
Bas
e su
rge
beds
Ms
151/
4; M
s159
/2A
1, A
2, D
1,an
d as
han
d la
pill
i bed
s.
Ms
159/
4; M
s 15
9/10
D2,
E2,
E3
Som
etim
es c
ross
lam
inat
edM
s 15
9/12
Lit
hofa
cies
6F
ine-
ash
Cen
tim
etre
M
assi
ve,
Set
tlin
g fr
om a
M
s 15
9/9;
Ms
151
10/V
C, E
1, E
2,to
dec
imet
reso
met
imes
coh
esiv
e.
clou
d ri
ch
Ms
151/
10R
; Ms
159/
9E
3, F
Acc
reti
onar
y la
pill
i, ve
sicl
es.
in c
onde
nsin
g M
s 15
9/18
; Ms
159/
19P
last
ic d
efor
mat
ion
of b
eds
wat
er v
apou
r

va. These layers occur in members A, D and E. Samplesfrom this lithofacies plot in the pyroclastic flow field(Fig. 3). Massive, poorly sorted beds can be depositedfrom both pyroclastic flows (highly concentrated cur-rents) and surges (dilute, turbulent currents; Chough andSohn 1990).
Lithofacies 4 (Fig. 4d) consists of decimetre-thick,well-sorted, internally laminated beds of coarse to medi-um ash. This lithofacies occurs in sub-member B2. Thebeds show cross lamination and sand-wave structures.Samples from this lithofacies plot in the field of surgedeposits (Fig. 3). Lack of oversized clasts and presenceof a small decrease in grain size from base to top of thelaminated bed sets suggest deposition from the bed loadof a quasi-steady, dilute, turbulent current during pro-gressive deceleration (Dellino and La Volpe 2000).
Lithofacies 5 (Fig. 4e) comprises decimetre-thick,plane-parallel successions of thin beds (a few centime-tres each) of coarse ash to lapilli alternating with thinbeds of ash, in some cases showing crude internal lami-nation. This lithofacies mainly occurs in members A andE, and contains fresh lava clasts. Samples from thislithofacies generally plot in the surge field (Fig. 3).Thus, we tentatively interpret these beds as depositsfrom pyroclastic surges.
Lithofacies 6 (Fig. 4f) occurs in members C, E and Fand consists of centimetre- to decimetre-thick cohesivefine-ash layers that generally tend to mantle the topogra-phy. In places they include vesicles and accretionary la-pilli. Such features are commonly found in phreatomag-matic deposits (Lorenz 1974). These layers generallyplot in the surge field (Fig. 3) although the lack of trac-tion structures and the presence of mantling geometry al-low the possibility of deposition by means of settling ofcohesive fine particles from a steam-rich ash cloud.
In summary, the lithofacies investigation suggests thatthe Agnano-Monte Spina eruption involved fallout
events and pyroclastic density currents. The presence ofhighly vesiculated pumice lapilli in some deposits(namely lithofacies 1 and 2) suggests, on one hand, thatexsolution of magmatic gas played a significant role infragmentation during the eruption. On the other hand, theoccurrence in other deposits (lithofacies 6) of conspicu-ous amounts of fine ash and accretionary lapilli suggeststhe importance of phreatomagmatic processes and theformation of surge deposits (lithofacies 4), at least dur-ing some phases of the eruption. For other deposits(lithofacies 3, 4 and 5), which show variable proportionsof highly vesiculated pumice lapilli and fine ash, thefragmentation processes were probably more complex.In order to further constrain fragmentation processes,SEM and grain-size distribution analyses were carriedout on samples representative of the various lithofacies.
SEM investigation
The study of ash particles using SEM may elucidate thefragmentation processes operating during explosiveeruptions (e.g. Wohletz 1983; Heiken and Wohletz 1985;Marshall 1987). The occurrence of clasts with a re-en-trant contour, defined by the walls of ruptured bubbles(shards), and/or of clasts with high vesicularity (manyvesicles surrounded by thin glass walls), are diagnosticof explosive magmatic fragmentation processes. The oc-currence of blocky and equant clasts (fragments withequilateral sides crossing at right angles) and/or of clastsshowing pitting and hydration surfaces (features that re-sult from contact between fluids and hot glass particles)are considered indicative of phreatomagmatic fragmenta-tion mechanisms.
We have investigated the 3 and 4 phi size because thatfraction is the most suitable for comparison with theavailable literature. We have also carried out chemicalanalyses of glass surfaces by means of the energy disper-sive system (EDS), which complements the SEM data.These analyses give qualitative data on the chemicalcomposition of clast surfaces, and allow identification ofdifferences in composition. The results of these analyseswere particularly useful for understanding whether thesurface features occur on fresh or altered glass. Glassylithic fragments were also easily distinguished either be-cause they show the effects of strong hydrothermal alter-ation, or because they differ in composition from the al-kali-trachytic products that characterize the AMST.
The samples contain ash particles that show variableshapes and textures. Highly vesicular clasts (Fig. 5a),with vesicles separated by thin glass walls, are present insome samples. Vesicles range in shape from tubular(Fig. 5b) to contorted (Fig. 5c) or spherical (Fig. 5d).These clasts have angular forms, and some show con-cave–convex contours that are the walls of large brokenvesicles. The abundance of such particles suggests thatgas exsolution was significant during fragmentation.These clasts do not show any features related to chemi-cal alteration and are composed of fresh glass (Fig. 5e).
448
Fig. 3 Median diameter (Mdphi) versus sorting (sigma phi) dia-gram of the analysed samples of AMST. Pyroclastic flow (solidline), surge (dotted line) and Plinian fallout (dashed line) fields areadapted from Walker (1983)
449
Fig. 4a–f Lithofacies of AMST. a Section Ms 151. The white sol-id line encloses a pumice lapilli bed (sub-member B1) that makesup lithofacies 1. The hammer is 32 cm long. b Section Ms 159.The white solid line encloses a lenticular bed of lithofacies 2 (sub-member D2), showing the characteristic inverse size grading ofpumice lapilli. The coin is 2.7 cm in diameter. c Section Ms 159.The white solid line encloses a lithofacies 3 layer that is composedof pumice lapilli scattered in a fine ash matrix (submember A2),showing the massive structure of the deposit. The ruler is 20 cmlong. d Section Ms 159. Example of the sand-wave bed forms inlithofacies 4 (sub-member B2). The ruler is 160 cm long. e Sec-tion Ms 159. Close-up of lithofacies 5 that shows plane-parallel,alternating massive beds of lapilli and laminated coarse ash (sub-member E2). The bar is 2 cm long. f Section Ms 151. The whitesolid line encloses a thin fine-ash layer of lithofacies 6 (submem-ber E1). The coin is 2.7 cm in diameter
Blocky and equant (Fig. 5f) or subrounded (Fig. 5g)clasts are present in other samples. These fragments areeither non-vesicular or very poorly vesicular. The surfac-es of these particles show various features related to phr-eatomagmatic activity: stepped surfaces, quench cracks,chemical pitting, ‘skin’ and adhering particles. Steppedsurfaces (Fig. 5h) result from the very fine fracturing ofthe melt (Büttner et al. 1999). Quench cracks are branch-ing, dendritic fractures (Fig. 5i) that form by quenchingof hot fragments upon contact with excess water (Büttneret al. 1999). Particles with quench cracks and steppedsurfaces are composed of fresh glass (Fig. 5j) and resultfrom cooling contraction that occurs when water directlyinteracts with magma.

450
Fig. 5a–n Selection of SEM photographs of fine-ash clasts. a Ahighly vesicular, elongate fragment. b An elongate clast with tube-vesicles. c An angular clast with irregularly shaped vesicles. d Anangular clast with spherical vesicles. e EDS spectrum, representa-tive of fresh glass, determined on an angular highly vesicular frag-ment. f Clast with blocky shape. g Clast with sub-rounded shape.h A fragment showing stepped surfaces. i A blocky fragment withquench cracks. j EDS spectrum recorded on a particle showing
stepped surfaces and quench cracks. The composition is similar tothat of fresh glass (Fig. 5e). k Glass particle showing chemical pit-ting. l Glass particle showing a micrometre-thick ‘skin’. m EDSspectrum recorded on a particle with ‘skin’. It shows a significantdepletion in alkaline elements and enrichment of magnesium andiron compared with fresh glass (Fig. 5e). n A glass fragmentshowing adhering particles

Chemical pitting of particle surfaces is evident fromthe occurrence of scattered spherical holes, which aretypically a few micrometres in diameter (Fig. 5k). Thechemical composition of pitted surfaces is slightly differ-ent from that of fresh glass, being depleted in the highlymobile alkaline elements and enriched in magnesium andiron. Chemical pitting probably results from the interac-tion of glass with corrosive fluids. ‘Skin’ is a few-micro-metres-thick film that envelopes glass fragments (Fig. 5l)and is significantly depleted in alkaline elements and en-riched of magnesium and iron (Fig. 5m). ‘Skin’ probablyrepresents the end product of the alteration that generateschemical pitting. Some particles, in fact, show a completerange of variation between the two features.
Adhering particles are micrometre to sub-micrometreglass particles stuck to the surfaces of larger glass frag-ments by electrostatic forces (Fig. 5n). Adhering parti-cles and the larger glass fragments both have the compo-sition of fresh glass.
Classification
The occurrence of the previously described shapes andtextures is variable among the analysed samples and
such variability can help constrain the fragmentationprocesses that were inferred from the field study. To as-sess the significance of clast texture variability, we haveclassified a significant number of particles (more than50) from each sample. We have used five morphologicalparameters that, in the literature, are considered diagnos-tic of particular fragmentation processes (cf., Dellino andLa Volpe 1996). The morphological parameters are parti-cle shape, particle outline, glass surface structure, vesicleabundance and vesicle shape (Table 2). Each parameteris assigned a value between 1 and 5. Lower values referto features that are considered typical of phreatomagmat-ic fragmentation. Higher values relate to features that areconsidered typical of magmatic fragmentation.
For example, value 1 for particle shape refers toblocky and equant particles, which are commonly attrib-uted to phreatomagmatic fragmentation (Heiken 1974;Heiken and Wohletz 1985; Marshall 1987). Value 5 re-fers to the irregular form of shards generated by volatile-driven fragmentation. The angular and elongated formsthat occur in both phreatomagmatic and magmatic de-posits are assigned intermediate values.
Value 1 of particle outline refers to the linear outlinestypical of the edges of particles in phreatomagmatic de-posits. Value 5 describes the concave–convex outlines
451
Fig. 5k–n Legend see page 450

representing the remnants of disintegrated vesicle walls,generally related to magmatic particles. Intermediate val-ues relate to outlines with variable degrees of irregularity.
Magmatic volatile-driven explosions are expectedwhen the volume concentration of vesicles in the meltexceeds ~60% (Sparks 1978; Houghton and Wilson1989). Therefore, value 1 of vesicle abundance relates toparticles with no vesicles, value 2 to particles with verylow vesicularity (vesicles separated by glass walls wider
than vesicle diameter), value 3 to particles with low ve-sicularity (vesicles separated by glass walls with thesame width as vesicle diameter), value 4 to particles withhigh vesicularity (vesicles separated by glass walls thin-ner than vesicle diameter) and value 5 to particles withvery high vesicularity (vesicles separated by glass wallsthinner than 5 µm).
Magmatic volatile-driven explosions involve vesiclegrowth, a process that is limited in part by interference
452
Fig. 6a–e Diagrams showingthe mean values of the morpho-logical parameters for represen-tative samples. a Particleshape; b particle outline; c glass surface structures; d vesicle abundance; e vesicleshape
Table 2 Morphological parameters used to classify fine-ash particles
Particle shape Particle outline Glass surface structure Vesicle abundance Vesicle shape
Value 1 Blocky and equant Linear Quenching cracks No vesicles No vesiclesValue 2 Angular Slightly irregular Chemical pitting Very low SphericalValue 3 Elongate Very irregular Adhering particles Low OvoidValue 4 Curve-elongate Some re-entrants Linear cracks High TubularValue 5 Irregular Concave–convex No surface features Very high Contorted

between neighbouring vesicles. A particle with deformedirregular vesicles, arising from interference with neigh-bours, should therefore be more ‘magmatic’ than a parti-cle with spherical vesicles. For vesicle shape, value 1 re-lates to an absence of vesicles, value 2 to spherical vesi-cles and so on, up to value 5, which relates to contortedvesicles that are expected when interference is strong.
The glass surface structure takes into considerationfeatures that record various degrees of magma/water in-teraction. Value 1 relates to quench cracks and steppedsurfaces that form upon direct contact of water and mag-ma. Value 2 relates to chemical pitting and ‘skin’ that re-sult from surficial alteration after fragmentation. Value 3relates to adhering particles that suggest the presence ofliquid water during deposition. Value 4 relates to linearcracks that form either from quenching or from ruptureof bubbles. Finally, a lack of surface features is assignedvalue 5, and is typical of magmatic volatile-driven activ-ity.
Mean values of the five parameters calculated foreach sample show some variability (Fig. 6). This vari-ability could be indicating either a phreatomagmaticcharacter (lowest mean values) or a magmatic character(highest mean values). In particular, the mean values ofparticle shape, vesicle abundance and vesicle shape havea broad range of variability among the samples. Lithofa-cies 1 sample Ms 151/6 consistently shows much highervalues than lithofacies 6 samples Ms 151/10V and Ms151/10R. Thus, as suggested by field evidence, a mag-matic origin can be inferred for the former, and a phr-eatomagmatic origin for the latter. However, these threeparameters show no clear differences among other sam-ples and the two remaining parameters, by showing alimited variability, do not discriminate samples from dif-ferent fragmentation processes. Although morphologicalparameters, such as glass surface features or particle out-line, are conventionally considered highly diagnostic,they are not sufficiently precise to constrain fragmenta-tion processes in complex deposits such as the AMST.
To check whether combinations of the five morpho-logical parameters support interpretations of fragmenta-tion processes inferred from field observation, we per-formed a multivariate statistical analysis of the clusteranalysis type. The mean values of the morphological pa-rameters represent the variables, and the ‘Euclidean dis-tance; represents the association algorithm (Davis 1986).
The Euclidean distance between samples i and j is:
where Xik is the kth variable measured on sample i andXjk is the kth variable measured on sample j; m is thenumber of variables.
The dendrogram (Fig. 7) shows the results. Clusteringbegins with the formation of groups made up of two sam-ples having the minimum Euclidean distance. Associationproceeds with the addition of other samples, and largergroups form at higher levels of the hierarchy. The hierar-
chical order of groups results from the ‘linkage method’used to define the way in which values of single samplesare weighted within a group (Davis 1986). Figure 7 is theclustering configuration obtained using the average ‘link-age method’. Other ‘linkage methods’ (median and near-est-neighbours) generated similar configurations, con-firming that clustering is stable and significant.
Samples and groups of samples close to each other onthe dendrogram have similar morphological characteris-tics, whereas those that are distant have contrasting fea-tures. In order to test the significance of this analysis andconsistency with field data, we have checked the posi-tion, on the cluster diagram, of samples extracted fromcorrelated layers. Samples Ms 151/1 and Ms 159/1 comefrom correlated layers of sub-member A1, and occupynearby positions on the dendrogram (Fig. 7). The same istrue for samples Ms 151/9 and Ms 159/9, which comefrom correlated layers of member C. The implication isthat cluster analysis results are both consistent with fielddata and reliable in addressing the variability of clastmorphological parameters among samples. Otherwise,samples from correlated layers should have plotted atrandom on the dendrogram. Therefore, we are confidentthat cluster analysis complements field data and contrib-utes to understanding fragmentation dynamics.
Interpretation of cluster analysis in terms of fragmentation mechanisms
Two end-member groups are identified in the cluster dia-gram (Fig. 7). The end member at the top of the dendro-gram is composed of two samples collected from centi-metre-thick layers of lithofacies 6 (samples Ms 151/10R
453
Fig. 7 Dendrogram showing the result of cluster analysis carriedout on the morphological parameters. In parenthesis, the lithofa-cies and the member or submember are specified

and Ms 151/10V). These cohesive fine-ash layers showfeatures typical of ‘wet’ phreatomagmatic deposits, anddefine the phreatomagmatic end-member of the AMST.Almost all the particles (Fig. 8a) have blocky shapes anda low abundance of vesicles. Many particles also showquenching cracks and stepped surfaces. Most of the par-ticles shows chemical pitting and ‘skin’ that relate tochemical alteration of the glass surface. The few vesicu-lated particles in these samples show chemical pitting in-side vesicles (Fig. 8b).
Ash particles from other fine layers of the same strati-graphic section (Ms 151/9) show also pitting and ‘skin’,
but in a smaller amount. We suggest that glass alterationwas promoted by the syn-eruptive–syn-depositional con-ditions and that post-depositional hydrothermal process-es, if any, may have enhanced alteration but did not pro-duce homogeneous alteration of all the layers.
The end-member at the bottom of the dendrogram(Fig. 7) is made up of two samples, Ms 151/6 and Ms151/1, from lithofacies 1 and 3 respectively. This groupis the magmatic end-member of the AMST. Almost allof the clasts (Fig. 8c) in these samples are angular or ir-regular in shape, highly vesicular and lack quenchcracks, stepped surfaces, pitting, ‘skin’ and adheringparticles.
Samples between the two end-members suggest thecontemporaneous presence of magmatic and phreato-magmatic processes during some phases of the eruption.Samples in the lower part of the dendrogram mostly con-tain highly vesiculated particles with angular shapes.Samples in the upper part of the dendrogram mostly con-tain blocky and equant particles, some showing chemicalalteration features.
454
Fig. 8 a SEM photograph showing a general view of sample Ms151/10R from the phreatomagmatic end member of Fig. 7. Mostof the particles are blocky shape and have low vesicularity. b SEMphotograph of a clast from the phreatomagmatic end-member thatshows chemical pitting inside vesicles. c SEM photograph show-ing a general view of sample Ms 151/6 from the magmatic end-member of Fig. 7. Most of the particles have angular or irregularshapes and high vesicularity. d A fragment that shows adheringparticles inside vesicles

Samples showing both phreatomagmatic and magmat-ic features include the reversely graded lenses of lithofa-cies 2 (Ms 159/14), massive beds of lithofacies 3 (Ms159/3) and laminated bed sets of lithofacies 4 (Ms151/8). In these cases, particles generated by magma/wa-ter interaction were mixed with those generated by mag-matic activity.
Samples Ms151/9 and Ms159/9 from lithofacies 6 inmember C contain abundant accretionary lapilli. Most ofthe fine particles are angular and highly vesicular, typicalof magmatic fragmentation. Some fragments show ad-hering particles filling vesicles (Fig. 8d) but there is noother evidence for magma–water interaction. The mag-matic fragments probably had only limited contact withliquid water in the eruptive cloud, which allowed forma-tion of accretionary lapilli. Member C marks the begin-ning of a brief pause in the eruption, during which con-densation and/or rain showers flushed fine particles fromthe atmosphere. The nature of the fine particles indicatesthat the fine-ash layers rich in accretionary lapilli in theAMST cannot be unequivocally attributed to phreato-magmatic fragmentation, even though that conclusion isstrongly implied by field observations.
Only the thinnest layers (<5 cm) of lithofacies 6 con-tain exclusively phreatomagmatic particles. These layersconsist of cohesive ash, vesicles and accretionary lapilli,and amount only to very small volumes (e.g. Ms151/10R and Ms 151/10V). Therefore, we suggest thatduring the Agnano-Monte Spina eruption, purely phre-atomagmatic activity was a phenomenon that involvedonly a small amount of magma in each explosion, sug-gesting further that magma–water interaction was a ‘lo-cal’ process, perhaps limited by the conduit geometry.
Analysis of grain-size distributions by means of multivariate techniques
Grain-size analyses of the AMST were carried out usingtwo methods: by means of dry, hand sieving, for the frac-tion coarser than 3 phi, and using a Coulter Counter TAIIfor the fraction finer than 3 phi. Data collected by thetwo methods were combined via interpolation of percen-tiles and recalculated at half-phi intervals. Median diam-eter and sorting values were then calculated (Fig. 3).Component analyses were also performed and the rela-tive densities of juvenile particles, lithic clasts and crys-tals were calculated. Density data were used to deter-mine pumice lapilli vesicularity. The grain-size distribu-tions of AMST samples are shown in the form of fre-quency histograms (Fig. 9).
Lithofacies 1 shows a skewed distribution with themodal class being lapilli. Samples from section Ms 151are well sorted, whereas sorting of samples from thethinner layers of section Ms 159 is poor, reflecting thepresence of fine ash that has percolated down from theoverlying fine ash. Lithofacies 2 is coarse grained, withlapilli dominating the distribution of sample Ms 159/13from the top part of a layer. A sample of the complete
layer, Ms 159/14, shows the presence of a significantamount of fine ash. In lithofacies 3, both lapilli and fine-ash fractions are present. Lithofacies 4 ranges from la-pilli to coarse ash, and distributions are broadly unimo-dal. Lithofacies 5 ranges from fine ash to lapilli, with thetwo components present in various proportions amongsamples. Lithofacies 6 shows the dominance of fine ash,with only minor coarse ash and lapilli.
The histograms reveal that many samples have apolymodal grain-size distribution and consist of a mix-ture of particle populations. However, the number andcharacteristics of the most important populations or sub-populations present are not apparent from simple visualinspection.
Median diameter and sorting are generally used tocharacterize the granulometry of pyroclastic deposits(Walker 1971). They actually represent a graphical ap-proximation of the central tendency (mean) and disper-sion (standard deviation) of the distribution, and givesignificant and complete granulometric information onlyfor grain-size distributions that have a log-normal ten-dency. They cannot describe the granulometry of poly-modal distributions and give no information on multiplepopulations.
Two principal techniques have been recently used toidentify significant populations. One allows the charac-terization of the sub-populations present in a single sam-ple (Sheridan et al. 1987; Wohletz et al. 1989). The otherallows the identification of the principal populationswithin a collection of samples (Lirer and Vinci 1992;Dellino and La Volpe 1995).
The first method starts with the construction of a syn-thetic curve that represents the sum of sub-populations.The goodness of fit of the synthetic curve to the actualgrain-size distribution is calculated, and the weight per-cent of each of the sub-populations is determined. Thistechnique is effective when the parameters of each sub-population, namely mean and standard deviation (or oth-er parameters of central tendency and dispersion), areknown in advance. Otherwise there is no unique solutionand the number of sub-populations and their parameterscannot be effectively constrained.
The second method relies on the application of multi-variate statistical techniques, generally of the principalcomponent and factor analysis types. The grain-sizeclasses represent the variables in multi-dimensionalspace defined by the grain-size data for a collection ofsamples. By this method, the principal grain-size popula-tions that represent the general granulometry of samplesare extracted. The drawback of this technique is that itdoes not apply to single samples, but the advantage isthat no previous knowledge of either the number of pop-ulations or of their parameters is necessary.
To identify the principal populations that representthe general granulometry of the AMST, we have usedmultivariate statistical techniques of the factor analysistype.
455

456
Fig. 9 Grain-size histograms of AMST samples. The histograms are labelled according to sample number, lithofacies and member or submember

Use of factor analysis to identify grain-size populations
A comprehensive review of factor analysis is given byDavis (1986) and an application to the grain-size distri-butions of pyroclastic deposits is found in Dellino andLa Volpe (1995). A brief description of the method fol-lows.
Factor analysis is a statistical technique that allowsthe representation of a multivariate system in terms of‘factors’. Factors are determined by means of eigenvec-tors and eigenvalues of the data correlation matrix. Eachfactor is a linear combination of the variables. The firstfactor is the most ‘powerful’ (has the highest eigenval-ue), and successive factors have decreasing ‘power’(lower eigenvalues). If a few factors are sufficient to ‘ex-plain’ a significant part of the variance, it is possible toreduce a complex system to one that is easier to inter-pret. Each factor is calculated by the relation[Ar]=[V][L], where [Ar] is the factor loading matrix, [V]is the eigenvector matrix and [L] is the eigenvalue ma-trix. Each factor is composed of a set of data ([Ar]) thatcontains as many values as the original variables. Thesevalues, ranging from +1 to –1, are known as factor load-ings. The higher the absolute loading, the more signifi-cant is the contribution of the associated variable to thefactor.
If we choose grain-size classes as variables, the anal-ysis of the factor loading distribution defines the grain-size populations that compose the factors. Adjacentclasses that have positive loadings group to form a popu-lation, distinct from another population that instead iscomposed of grain-size classes that have negative load-ings. Each factor can contain one or more populations,and the populations associated with the first factor aremore ‘important’ than those associated with successivefactors.
In the case of AMST, to reduce the redundancy of thesystem, grain-size classes were recalculated at one phiinterval, and the logarithm of data was used to overcomeclosure of the data set. Results show that two factors re-present more than 80% of the variance of the original da-ta set. The factor loading distribution (Fig. 10a) for thefirst factor (explaining about 60% of the variance) hastwo grain-size populations. The first, with positive val-ues, is centred on lapilli; the second, with negative val-ues, is centred on fine ash. In the second distribution(Fig. 10b), explaining about 20% of the variance, a thirdpopulation emerges; it is characterized by negative val-ues centred on coarse ash. The grain-size data of theAMST can, therefore, be explained in terms of threeprincipal grain-size populations: lapilli, fine ash andcoarse ash.
Interpretation of grain-size populations
The physical and volcanological meaning of grain-sizepopulations, if any, is not directly obtained by factoranalysis. Multivariate statistics are useful only for re-
vealing the ‘underlying structure’ of a complex systemthat is not apparent solely from visual inspection of theoriginal data set and this analysis does not constrain theactual physical processes. The utility of factor analysis isthat single samples can be plotted on a factor diagram bymeans of factor scores ([Fr]). This operation is carriedout using the relation: [X] [Sr]=[Fr], where [X] is thematrix of the original standardized grain-size data, [Fr]is the matrix of the co-ordinates of the samples in thefactor diagram, and [Sr]=[Ar]([Ar]′ [Ar])–1
.We have used a factor diagram (Fig. 11) to clarify the
physical and volcanological significance of grain-sizepopulations with the help of the hypotheses emergingfrom field study and SEM investigation of the AMST.Samples plotting on extreme positions of the factor dia-
457
Fig. 10a, b Diagrams showing the factor loadings of the two fac-tors extracted from the multivariate analysis of grain-size data. a Factor loading distribution of factor F1; b factor loading distri-bution of factor F2

gram define the most contrasting granulometry; there-fore, their investigation could reveal underlying process-es. We note that because samples come from two sec-tions located at about 4 km from the inferred vent area,grain size and grain-size distributions have been influ-enced by the transportation mechanisms and do not sim-ply relate to different fragmentation dynamics.
Lithofacies six samples Ms 151/10R and Ms 151/10Vplot on the top left of the factor diagram (Fig. 11). Theyhave the most negative values of factor 1 and positivevalues of factor 2. In the loadings of factor 1 (Fig. 10a),the population of fine ash is associated with negativevalues, whereas in the loadings of factor 2 (Fig. 10b), nograin-size populations are significantly associated withpositive values. We thus expect the two samples to con-tain a substantial amount of fine ash. The grain-size his-tograms for these samples (Fig. 9) in fact show that theyare composed exclusively of fine ash. They are unimodaland represent a true end-member of factor 1.
Three samples (Ms 151/6, Ms 159/11, Ms 159/13)plot on the right side of the factor diagram; they have,therefore, the most positive values of factor 1. We expectthe lapilli population, defined by positive values in thefactor loadings of factor 1, to be significant. The grain-
size histograms (Fig. 9) show that these samples aremade almost exclusively of lapilli. Distributions are uni-modal, skewed, and samples represent another end-mem-ber of factor 1.
Samples plotting at the bottom of the factor diagramhave negative values of factor 2. In the loadings of thisfactor (Fig. 10b) the only population present, coarse ash,has negative values, and we expect these samples (Ms159/7, Ms 159/10) to have a conspicuous amount ofcoarse ash. The grain-size histograms (Fig. 9) in factconfirm the presence of a high amount of coarse ash and,furthermore, that the size distributions are mostly unimo-dal. The mode is centred on coarse ash, the coarse tail ismade of lapilli and the fine tail is fine ash. These sam-ples represent the third population.
Thus, samples that occupy extreme positions in thefactor diagram are indeed unimodal and represent thethree principal grain-size populations identified by factoranalysis.
Samples representing the fine-ash population comefrom lithofacies 6 in sub-member E1. This lithofacieswas interpreted to result from settling of fine ash fromash clouds rich in water vapour. This mechanism washighly effective in sorting grain size. SEM study showsthat these samples have characteristics usually attributedto phreatomagmatic fragmentation mechanisms. In thefactor diagram, samples exclusively indicating a fine-ashpopulation can, therefore, be considered representativeof the phreatomagmatic end-member.
458
Fig. 11 Diagram showing the position of samples in the factorsco-ordinates. In the insets, histograms of some samples are shown.Samples occupying ‘extreme’ positions represent end-members interms of grain-size populations

Other samples that contain a conspicuous amount offine ash mixed with limited amounts of other populationscannot be considered as purely phreatomagmatic. Thisapplies both to lithofacies 6 samples Ms 151/9 and Ms159/9, and to lithofacies 3 samples Ms 151/1 and 159/1.These four samples plot nearby in the factor diagram asthey did in the cluster diagram (Fig. 7). They consist ofparticles with features usually attributed to magmaticfragmentation and, therefore, represent fine-ash depositsmostly of magmatic origin.
This result confirms that field observations alone can-not adequately constrain fragmentation mechanisms forfine-ash deposits from complex eruptions. In addition,the position of these fine-ash samples in the factor dia-gram is distinct from the phreatomagmatic end-member,underscoring differences in eruptive mechanisms.
The three samples representative of the lapilli popula-tion (Ms 151/6, Ms 159/13, Ms 159/11) come from litho-facies 1 and 2. The very small amount of fine ash presentin the samples represents the fine tail of the grain-sizedistribution. Pumice lapilli from these lithofacies arehighly vesiculated, with vesicularity in excess of 60%.This value is typical of magmatic volatile-driven explo-sions (Sparks 1978; Houghton and Wilson 1989). Thus,samples that in the factor diagram exclusively indicate alapilli population can be taken to represent the magmaticend-member.
We hypothesize that the two populations of factorone, fine ash and lapilli, are indeed influenced by the dif-ferent fragmentation mechanisms. Samples Ms 151/5and Ms 159/4 plot in a central position and are polymod-al, probably reflecting complex fragmentation mecha-nisms.
Factor two showed the third population, coarse ash, insamples Ms 159/7 and Ms 159/10 from lithofacies 4 and5. SEM study of Ms 159/10 shows the presence of parti-cles related to both magmatic and phreatomagmatic ac-tivity. The population present in factor 2, in contrast withthose of factor 1, does not relate indeed to a specificfragmentation process. In our opinion, this population re-flects transportation and deposition. In particular, bothlithofacies are characterized by bed forms with tractionalfeatures and we infer that traction has effectively sortedthe original population. If this interpretation is valid, weexpect that samples with positive values of factor 2, notshowing the coarse-ash population, involved transporta-tion mechanisms other than traction. In fact, this is thecase for sample Ms 151/5 from lithofacies 3, character-ized by massive beds that show no evidence for tractiontransport. Factor 2 for this sample is positive (about 0.6,Fig. 11).
Conclusive remarks
We offer a word of caution on the interpretation of datamanipulated by multivariate statistical techniques. Sim-plifying a complex natural system by means of suchmethods results in an ‘average’ behaviour that probably
does not perfectly fit every particular case nor, in termsof a pyroclastic sequence, each single layer. These statis-tical techniques are useful, especially in the case of com-plex eruptive sequences, and complement detailed fieldobservations but cannot replace them.
From the combined interpretation of field, SEM andgrain-size analyses of the AMST, it is clear that the vari-ous lithofacies result from diverse fragmentation pro-cesses. In addition, a specific lithofacies is not uniquelyassociated with a specific fragmentation mechanism. On-ly some layers of lithofacies 1 and 6, representing themagmatic and phreatomagmatic end-members, relate to‘simple’ fragmentation mechanisms. Other layers thatbelong to lithofacies 2, 3, 4, 5, and even some of lithofa-cies 6, result from complex fragmentation mechanismsthat relate to magmatic and phreatomagmatic processes‘mixed’ in various proportions.
The use of multivariate statistics has helped to corrob-orate hypotheses on fragmentation processes thatemerged from the field study and, in some cases, to re-solve uncertainties about fragmentation mechanisms. Inparticular, this integrated approach proved to be very ef-fective in the interpretation of fine-ash layers that couldhave been produced by either magmatic or phreatomag-matic processes. This is the case, for example, for litho-facies 6 in member C that, being characterized by abun-dant fine-ash and the presence of accretionary lapilli,were attributed to phreatmagmatic processes by de Vitaet al. (1999). Clarification of the fragmentation mecha-nisms for these fine-ash deposits has been possible onlyby combining detailed field observation with multivari-ate statistical analysis of SEM and grain-size data. SEMand grain-size study have proven in fact that these layersare mostly composed of ash grains showing a magmaticorigin.
We would like to suggest that, in complex pyroclasticsequences where fine beds represent a conspicuous partof the eruptive products, such as the AMST, particularcare is needed in describing the structural and texturalfeatures of deposits and field data should be comple-mented with microscopic and grain-size investigationsfor precise reconstruction of eruptive processes.
The results of this study suggest that for the AMSTchanges between phreatomagmatic and magmatic pro-cesses occurred repeatedly throughout the eruption, andsometimes the two processes were contemporaneouslyoperative.
We cannot account for the presence of both magmaticand phreatomagmatic processes using the model pro-posed for other eruptions (e.g. Barberi et al. 1988) thatinvokes magma/water interaction to enhance the frag-mentation of clasts that were primarily fragmented bymagmatic processes. In fact, in the case of AMST, parti-cles of the magmatic end-member are characterized by avery high vesicularity, and the deposits of the phreato-magmatic end-member are composed of particles with avery low vesicularity. Thus, during phreatomagmatic ex-plosions, exsolution of magmatic gas was not significant.Furthermore, analogue experiments (Zimanowski et al.
459

1991) demonstrate that the presence of a substantialamount of exsolving gas (more than 15% in volume)tends to mechanically decouple the two liquids (magmaand water) and explosive magma/water interaction is un-likely.
As a matter of speculation, we could imagine that in-side a magma column, where inhomogeneities of gas ex-solution processes are probable, it is possible that explo-sive magma/water interaction takes place in a limitedportion of the melt that is devoid of substantial gas exso-lution (Dellino and La Volpe 1995). Even if magma/wa-ter interaction occurs in a limited portion of the conduit,the resulting explosion should be energetic enough togenerate a powerful decompression in a larger part of theconduit and to eventually trigger explosive magmaticprocesses. Rapid magma decompression is, in fact, agood means for initiating magmatic explosions, as dem-onstrated by recent experimental studies (Alidibirov andDingwell 1996, 2000).
The combination of further studies on eruptive se-quences of other volcanoes with analogue experimentson the fragmentation mechanisms operating during ex-plosive volcanic activity should clarify whether the hy-potheses on the relationship between magmatic and phreatomagmatic processes for the AMST have generalvalidity for complex explosive eruptions.
Acknowledgements The paper greatly benefited from the thor-ough revision of Jocelyn McPhie and Thor Thordarson. This re-search was granted by CNR-GNV program no. 98.00685.62.
References
Alidibirov M, Dingwell DB (1996) Magma fragmentation by rap-id decompression. Nature 380:146–149
Alidibirov M, Dingwell DB (2000) Three fragmentation mecha-nisms for highly viscous magma under rapid decompression. JVolcanol Geotherm Res 100:413–421
Barberi F, Navarro J, Rosi M, Santacroce R, Sbrana A (1988) Ex-plosive interaction of magma with ground water: insights fromxenoliths and geothermal drillings. Rend Soc It Mineral Petrol43:901–926
Büttner R, Dellino P, Zimanowski B (1999) Identifying modes ofmagma/water interaction from the surface features of ash par-ticles. Nature 401:688–690
Chough SK, Sohn YK (1990) Depositional mechanics and se-quences of base surges, Songaksan tuff ring, Cheju Island, Ko-rea. Sedimentology 37:1115–1135
Cioni R, Sbrana A, Vecci R (1992) Morphologic features of juve-nile pyroclasts from magmatic and phreatomagmatic depositsof Vesuvius. J Volcanol Geotherm Res 51:61–67
Civetta L, Pappalardo L, Fisher RV, Heiken G, Ort M (1997) Geo-chemical zoning, mingling, eruptive dynamics and deposition-al processes. The Campanian Ignimbrite, Campi Flegrei calde-ra, Italy. J Volcanol Geotherm Res 75:183–219
Davis J C (1986) Statistics and data analysis in geology, 2nd edn.Wiley, New York
Dellino P, La Volpe L (1995) Fragmentation versus transportationmechanisms in the pyroclastic sequence of Monte Pilato –Rocche Rosse (Lipari, Italy). J Volcanol Geotherm Res 64:211–232
Dellino P, La Volpe L (1996) Cluster analysis on ash particlesmorphology features to discriminate fragmentation dynamicsin explosive eruptions. Acta Vulcanol 8(1):31–39
Dellino P, La Volpe L (2000) Structures and grain size distributionin surge deposits as a tool for modelling the dynamics of dilutepyroclastic density currents at La Fossa di Vulcano (AeolianIslands, Italy). J Volcanol Geotherm Res 96:57–78
de Vita S, Orsi G, Civetta L, Carandente A, D’Antonio M, Deino A,Di Cesare T, Di Vito M, Fisher RV, Isaia R, Marotta E, Necco A, Ort M, Pappalardo L, Piochi M, Southon J (1999) TheAgnano-Monte Spina eruption (4.1 years ka) in the restless CampiFlegrei caldera (Italy). J Volcanol Geotherm Res 91:269–301
Di Girolamo P, Ghiara M R, Lirer L, Munno R, Rolandi G, Stanzione A (1984) Vulcanologia e petrologia dei CampiFlegrei. Boll Soc Geol It 103:349–413
Di Vito MA, Lirer L, Mastrolorenzo G, Rolandi G (1987) TheMonte Nuovo eruption (Campi Flegrei, Italy). Bull Volcanol49:608–615
Di Vito MA, Isaia R, Orsi G, Southon J, D’Antonio M, de Vita S,Pappalardo L, Piochi M (1999) Volcanism and deformationsince 12,000 years at the Campi Flegrei caldera (Italy). J Volc-anol Geotherm Res 91:221–246
Fisher RV, Orsi G, Ort M, Heiken G (1993) Mobility of a large-volume pyroclastic flow emplacement of the Campanian Ig-nimbrite, Italy. J Volcanol Geotherm Res 56:205–220
Heiken G (1974) An atlas of volcanic ash. Smithsonian ContribEarth Sci 12:1–101
Heiken G, Wohletz KH (1985). Volcanic ash. University of Cali-fornia Press, Berkeley
Houghton BF, Schmincke HU (1989) Rothenberg scoria cone,East Eifel: a complex strombolian and phreatomagmatic vol-cano. Bull Volcanol 52:28–48
Houghton BF, Wilson CJN (1989) A vesicularity index for pyro-clastic deposits. Bull Volcanol 51:451–462
Lirer L, Vinci A (1992) Grain-size distribution of pyroclastic de-posits. Sedimentology 38:1075–1083
Lirer L, Mastrolorenzo G, Rolandi G (1987) Un evento plinianonell’attività recente dei Campi Flegrei. Boll Soc Geol It106:461–473
Lorenz V (1974) Vesiculated tuffs and associated features. Sedi-mentology 48:265–274
Marshall JR (1987) Clastic particles. Van Nostrand ReinholdCompany, New York
Orsi G, D’Antonio M, de Vita S, Gallo G (1992) The NeapolitanYellow Tuff, a large-magnitude trachytic phreatoplinian erup-tion: eruptive dynamics, magma withdrawal and caldera col-lapse. J Volcanol Geotherm Res 53:275–287
Orsi G, de Vita S, Di Vito M (1996) The restless, resurgent CampiFlegrei Nested Caldera (Italy): constraints on its evolution andconfiguration. J Volcanol Geotherm Res 74:179–214
Orsi G, Civetta L, D’Antonio M, Di Girolamo P, Piochi M (1995)Step-filling and development of a three-layers magma cham-ber: the Neapolitan Yellow Tuff case history. J Volcanol Geo-therm Res 67:291–312
Orsi G, Petrazzuoli SM, Wohletz K (1999) Mechanical andthermo-fluid behaviour during unrest at the Campi Flegrei cal-dera (Italy). J Volcanol Geotherm Res 91:453–470
Rosi M, Santacroce R (1984) Volcanic hazard assessment in thePhlegraean Fields: a contribution based on stratigraphic andhistorical data. Bull Volcanol 47(2):359–370
Rosi M, Sbrana A (1987) The Phlegraean Fields. CNR, Quad de‘La ricerca Scientifica’ 114:1–175
Rosi M, Sbrana A, Principe C (1983) The Phlegraean Fields:structural evolution, volcanic history and eruptive mechanism.J Volcanol Geotherm Res 17:273–288
Rosi M, Vezzoli L, Aleotti P, De Censi M (1996) Interaction be-tween caldera collapse and eruptive dynamics during the Cam-panian Ignimbrite eruption, Phlegraean Fields, Italy. BullVolcanol 57:541–554
Sheridan MF, Wohletz KH, Dehn J (1987) Discrimination ofgrain-size subpopulations in pyroclastic deposits. Geology 15:367–370
Sohn YK, Chough SK (1989) Depositional processes of the Suwolbong tuff ring, Cheju Island (Korea). Sedimentology 36:837–855
460

Sparks RSJ (1978) The dynamics of bubble formation and growthin magmas: a review and analysis. J Volcanol Geotherm Res3:1–37
Walker GPL (1971) Grainsize characteristics of pyroclastic depos-its. J Geol 79:696–714
Walker GPL (1983) Ignimbrite types and ignimbrite problems. JVolcanol Geotherm Res 17:65–88
Wohletz KH (1983) Mechanisms of hydrovolcanic pyroclast for-mation: grain-size, scanning electron microscopy, and experi-mental studies. J Volcanol Geotherm Res 17:31–63
Wohletz KH, Sheridan MF, Brown WK (1989) Particle size distri-bution and the Sequential Fragmentation/Transport Theory ap-plied to volcanic ash. J Geophys Res 94:15703–15721
Wohletz K, Orsi G, de Vita S (1995) Eruptive mechanisms of theNeapolitan Yellow Tuff interpreted from stratigraphic, chemi-cal and granulometric data. J Volcanol Geotherm Res 67:263–290
Zimanowski B, Frohlic G, Lorenz V (1991) Quantitative experi-ments on phreatomagmatic explosions. J Volcanol GeothermRes 48:341–358
461