State of operational risk management survey 2014
51
State of operational risk management survey 2014 Sponsored by Operational Risk & Regulation surveyed 229 operational risk professionals at banks, asset managers, brokerages and other institutions around the world. Surveys were conducted confidentially through a web interface. Not all respondents replied to all questions. The 2014 State of Operational Risk Management survey was carried out with support from Protiviti.
-
Upload
khangminh22 -
Category
Documents
-
view
0 -
download
0
Transcript of State of operational risk management survey 2014
State of operational risk management survey 2014
Sponsored by Operational Risk & Regulation surveyed 229 operational risk professionals at banks, asset managers, brokerages and other institutions around the world. Surveys were conducted confidentially through a web interface. Not all respondents replied to all questions.The 2014 State of Operational Risk Management survey was carried
out with support from Protiviti.
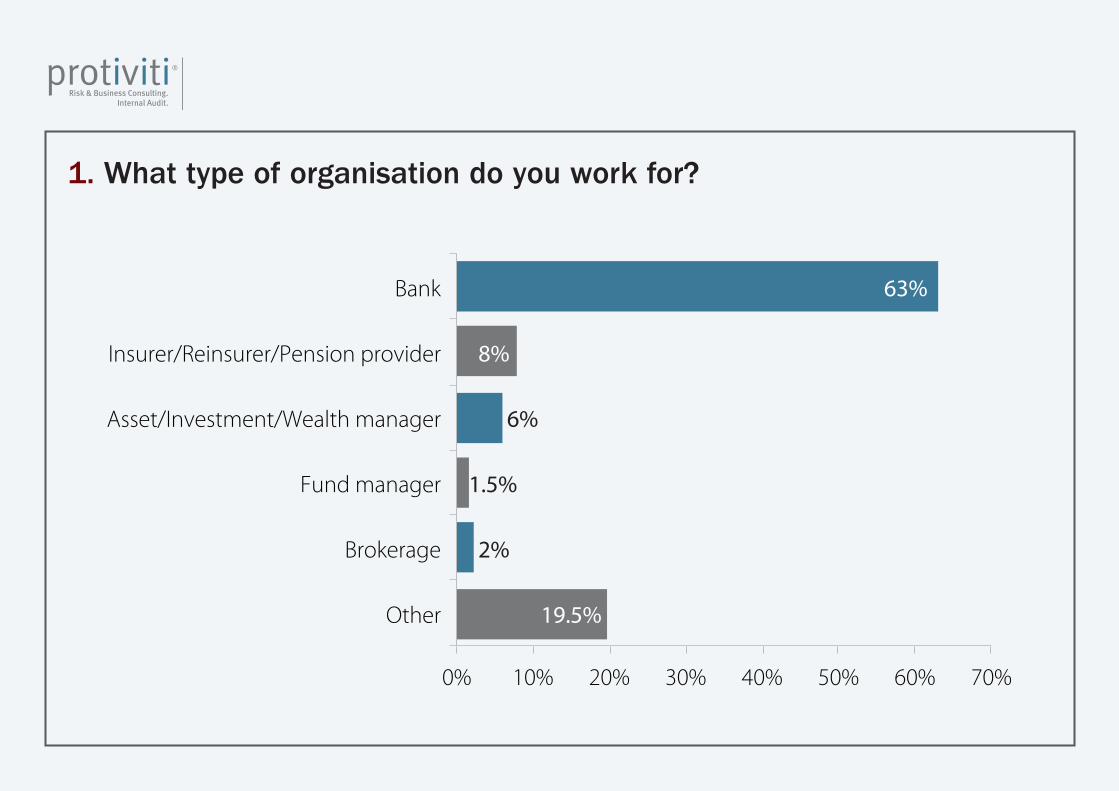
63%
8%
6%
1.5%
2%
19.5%
0% 10% 20% 30% 40% 50% 60% 70%
Bank
Insurer/Reinsurer/Pension provider
Asset/Investment/Wealth manager
Fund manager
Brokerage
Other
1. What type of organisation do you work for?
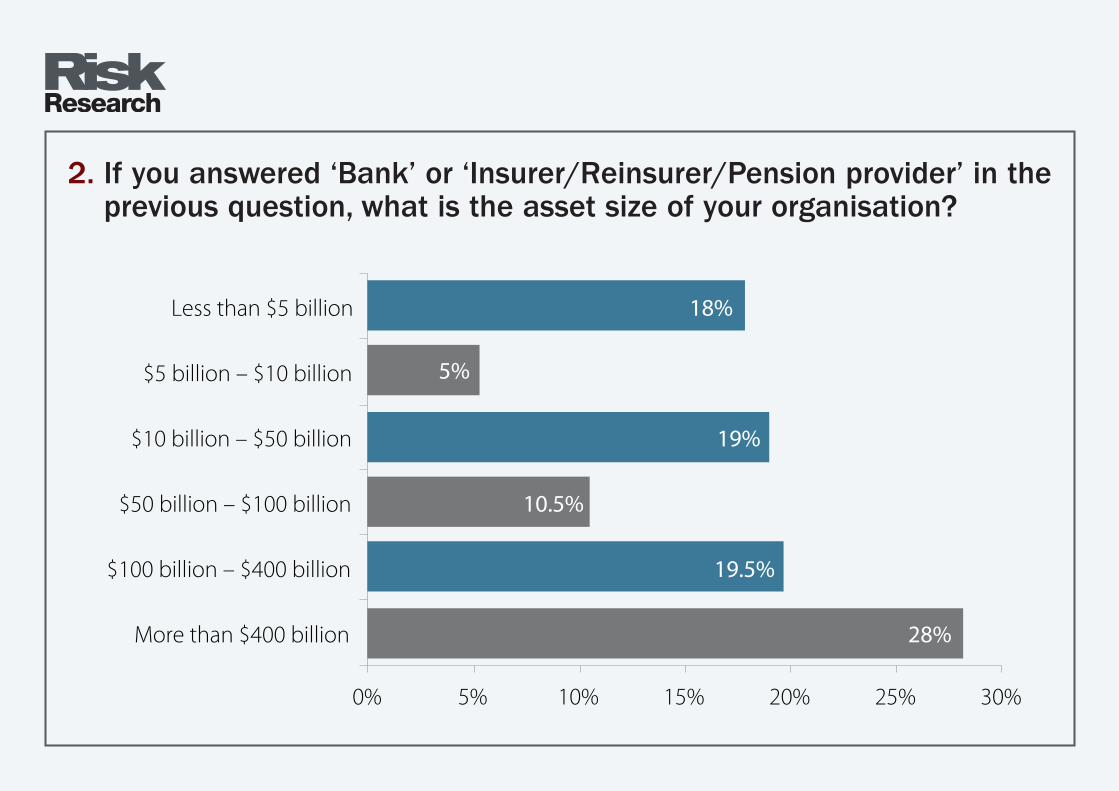
18%
5%
19%
10.5%
19.5%
28%
0% 5% 10% 15% 20% 25% 30%
Less than $5 billion
$5 billion – $10 billion
$10 billion – $50 billion
$50 billion – $100 billion
$100 billion – $400 billion
More than $400 billion
2. If you answered ‘Bank’ or ‘Insurer/Reinsurer/Pension provider’ in the previous question, what is the asset size of your organisation?
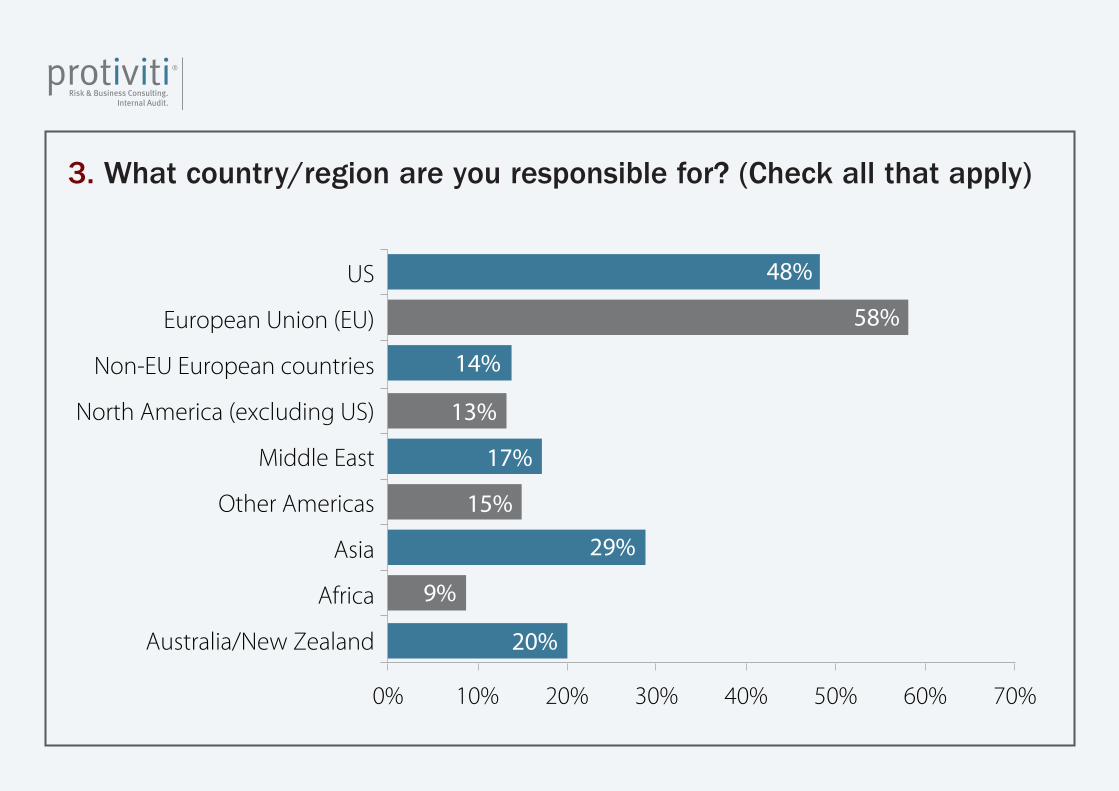
48%
58%
14%
13%
17%
15%
29%
9%
20%
0% 10% 20% 30% 40% 50% 60% 70%
US
European Union (EU)
Non-EU European countries
North America (excluding US)
Middle East
Other Americas
Asia
Africa
Australia/New Zealand
3. What country/region are you responsible for? (Check all that apply)
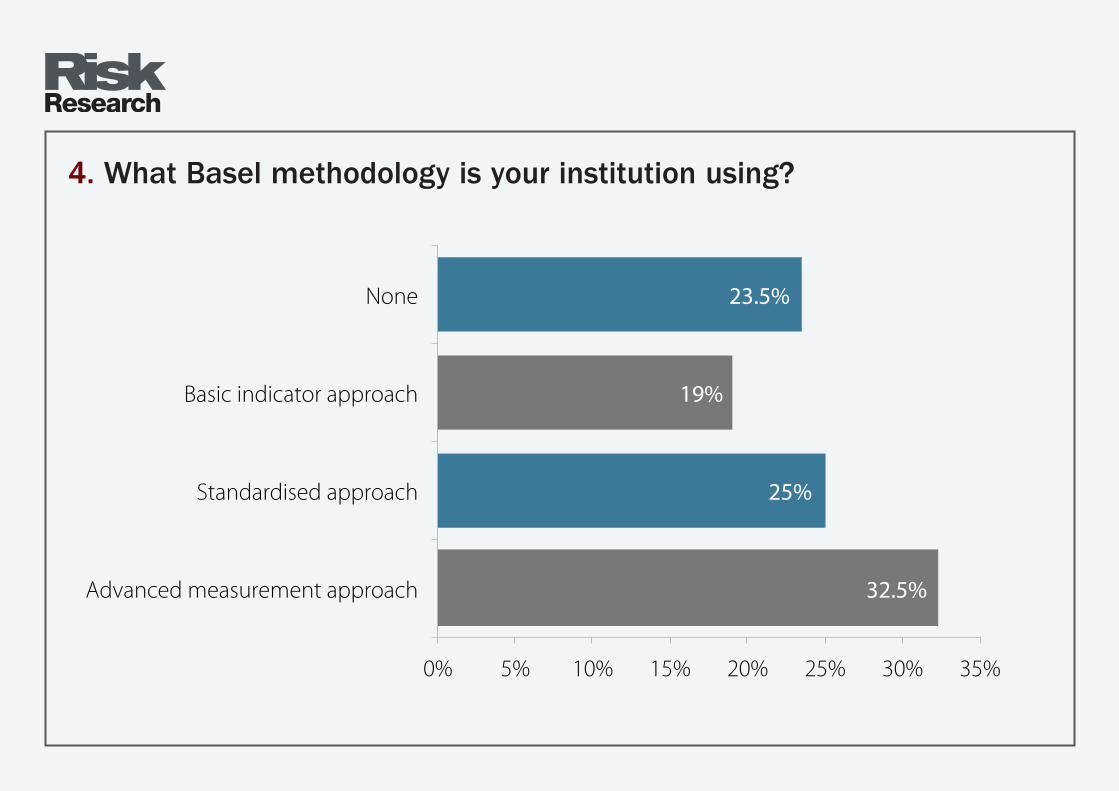
23.5%
19%
25%
32.5%
0% 5% 10% 15% 20% 25% 30% 35%
None
Basic indicator approach
Standardised approach
Advanced measurement approach
4. What Basel methodology is your institution using?
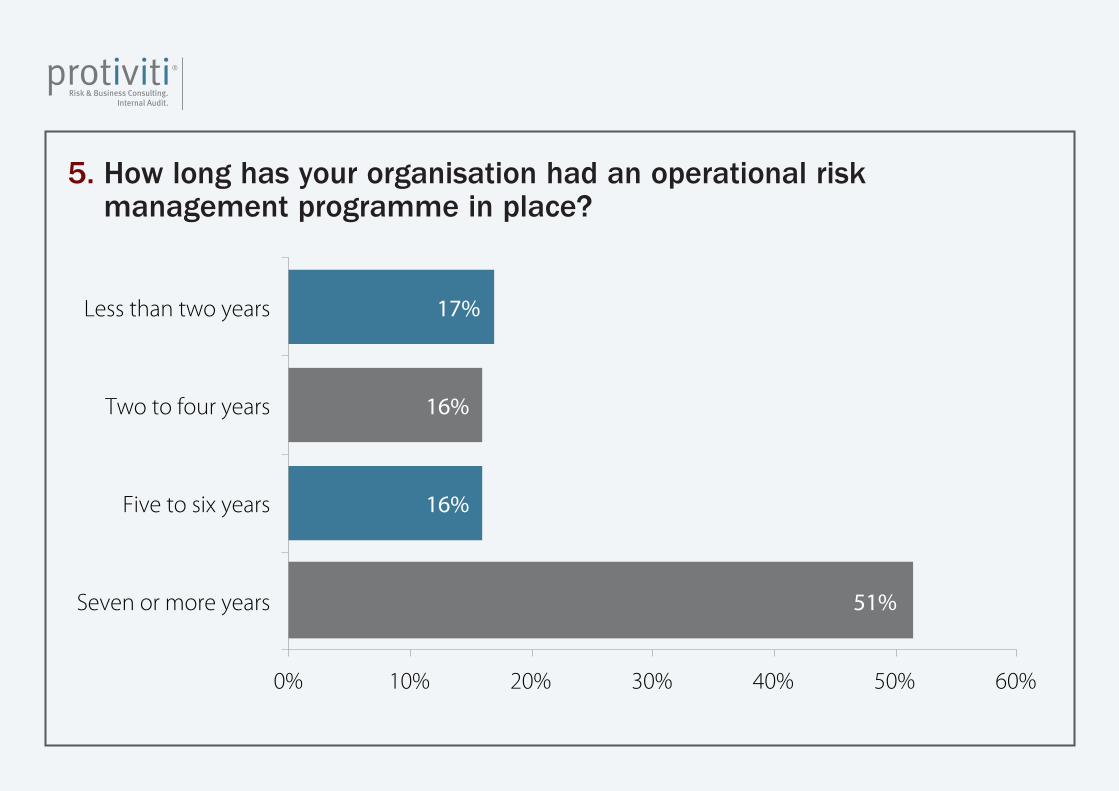
17%
16%
16%
51%
0% 10% 20% 30% 40% 50% 60%
Less than two years
Two to four years
Five to six years
Seven or more years
5. How long has your organisation had an operational risk management programme in place?
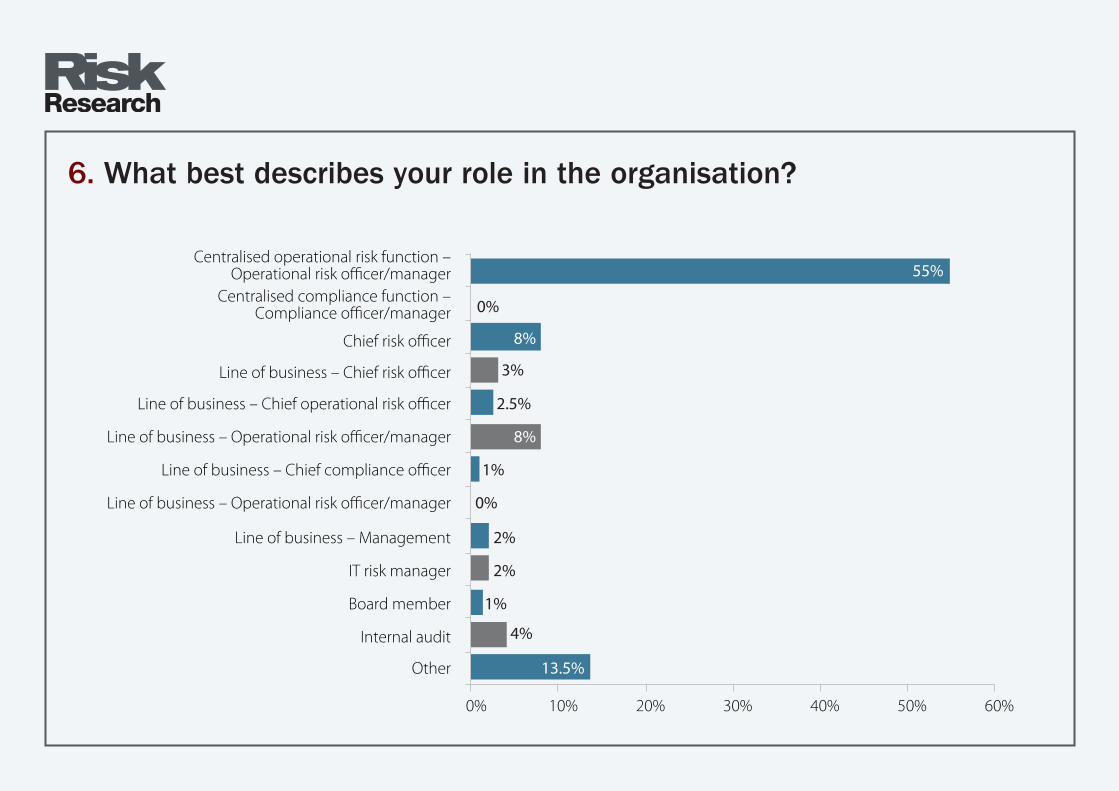
55%
0%
8%
8%
3%
2.5%
1%
0%
2%
2%
1%
4%
13.5%
0% 10% 20% 30% 40% 50% 60%
Centralised operational risk function –Operational risk officer/manager
Centralised compliance function –Compliance officer/manager
Chief risk officer
Line of business – Chief risk officer
Line of business – Chief operational risk officer
Line of business – Operational risk officer/manager
Line of business – Chief compliance officer
Line of business – Operational risk officer/manager
Line of business – Management
IT risk manager
Board member
Internal audit
Other
6. What best describes your role in the organisation?
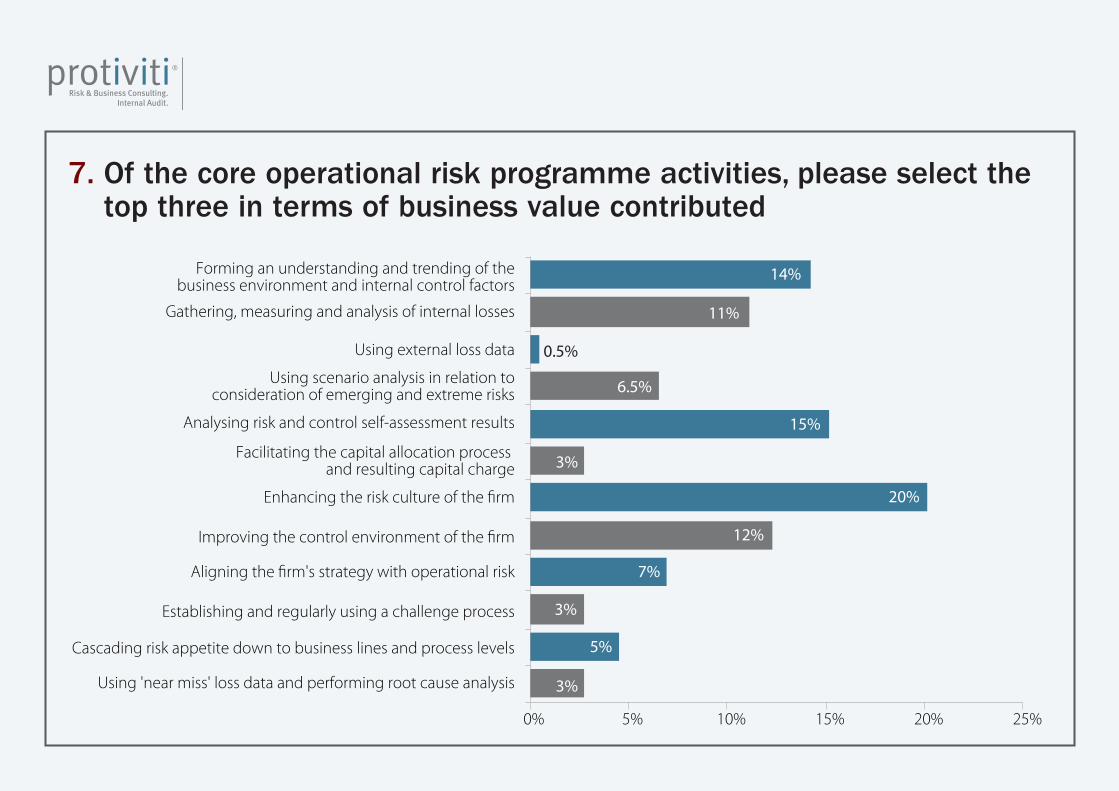
14%
11%
0.5%
6.5%
15%
3%
20%
12%
7%
3%
5%
3%
0% 5% 10% 15% 20% 25%
Forming an understanding and trending of thebusiness environment and internal control factors
Gathering, measuring and analysis of internal losses
Using external loss data
Using scenario analysis in relation toconsideration of emerging and extreme risks
Analysing risk and control self-assessment results
Facilitating the capital allocation process and resulting capital charge
Enhancing the risk culture of the firm
Improving the control environment of the firm
Aligning the firm's strategy with operational risk
Establishing and regularly using a challenge process
Cascading risk appetite down to business lines and process levels
Using 'near miss' loss data and performing root cause analysis
7. Of the core operational risk programme activities, please select the top three in terms of business value contributed
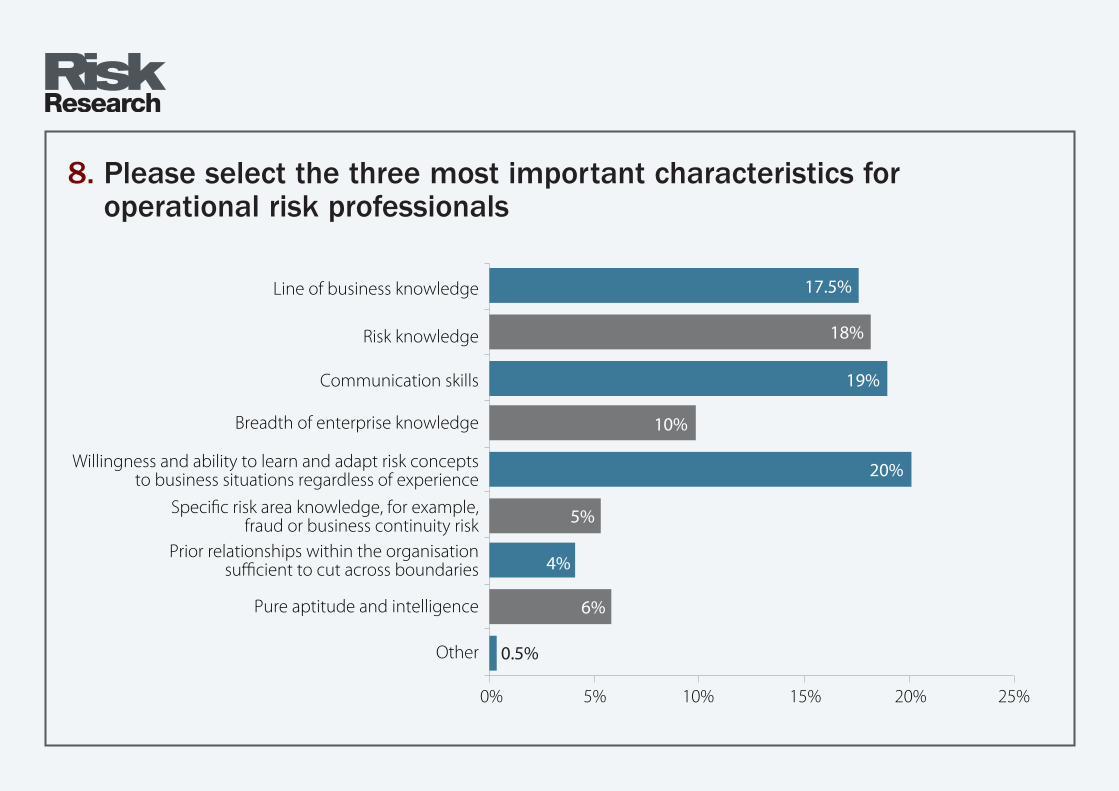
17.5%
18%
19%
10%
20%
5%
4%
6%
0.5%
0% 5% 10% 15% 20% 25%
Line of business knowledge
Risk knowledge
Communication skills
Breadth of enterprise knowledge
Willingness and ability to learn and adapt risk conceptsto business situations regardless of experience
Specific risk area knowledge, for example,fraud or business continuity risk
Prior relationships within the organisationsufficient to cut across boundaries
Pure aptitude and intelligence
Other
8. Please select the three most important characteristics for operational risk professionals

91 64
72 77
40 49
88 83
94 55
45 71
55 60
72 16
20 40
66 78
0% 10% 20% 30% 40% 50% 60% 70% 80% 90% 100%
Internal loss dataExternal data
Scenario analysisBusiness environment and internal control factors
Financial crimesVendor management
Risk and control self-assessmentsKey risk indicator tracking and analysis
Legal riskReputational risk
Human resources riskNew product approvals
Information technology riskInformation security
Business continuity planningCompensation
Geographic expansionCompliance
FraudRisk event management
9. Which components are included in the scope of the operational risk management function during the normal course of business? (Check all that apply)
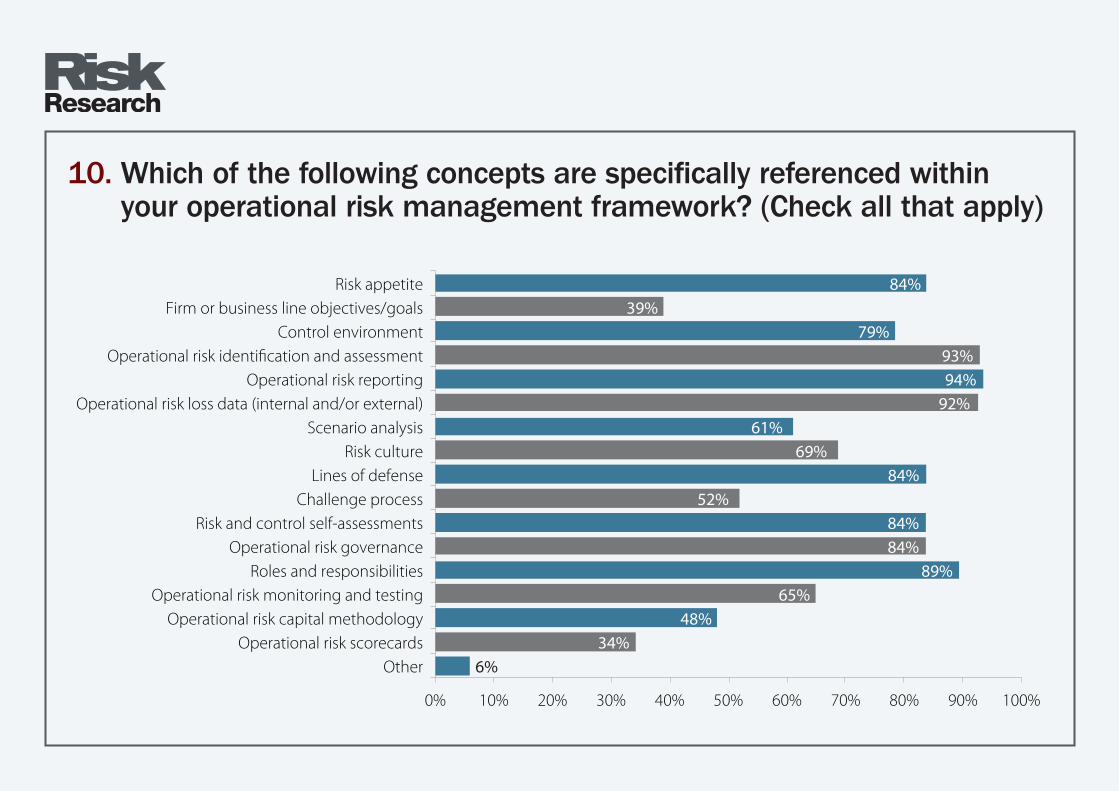
84%39%
79%93%94%
92%61%
69%84%
52%84%84%
89%65%
48%34%
6%
0% 10% 20% 30% 40% 50% 60% 70% 80% 90% 100%
Risk appetiteFirm or business line objectives/goals
Control environmentOperational risk identification and assessment
Operational risk reportingOperational risk loss data (internal and/or external)
Scenario analysisRisk culture
Lines of defenseChallenge process
Risk and control self-assessmentsOperational risk governance
Roles and responsibilitiesOperational risk monitoring and testing
Operational risk capital methodologyOperational risk scorecards
Other
10. Which of the following concepts are specifically referenced within your operational risk management framework? (Check all that apply)
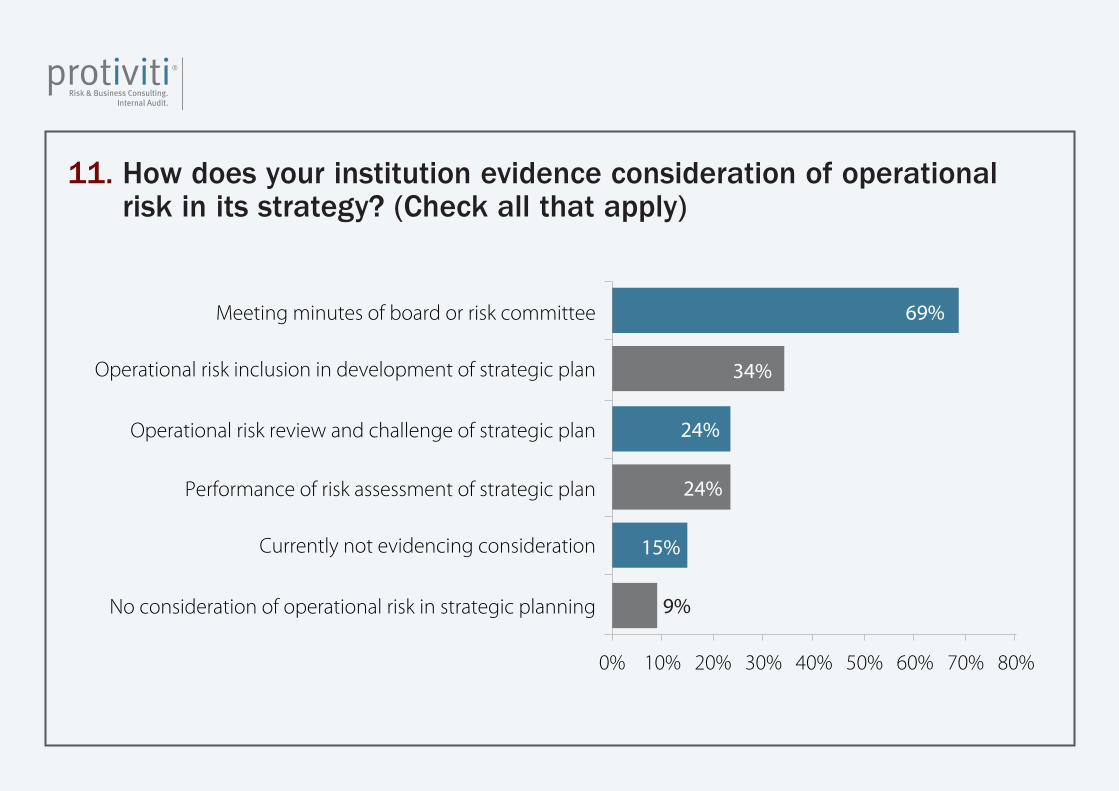
69%
34%
24%
24%
15%
9%
0% 10% 20% 30% 40% 50% 60% 70% 80%
Meeting minutes of board or risk committee
Operational risk inclusion in development of strategic plan
Operational risk review and challenge of strategic plan
Performance of risk assessment of strategic plan
Currently not evidencing consideration
No consideration of operational risk in strategic planning
11. How does your institution evidence consideration of operational risk in its strategy? (Check all that apply)
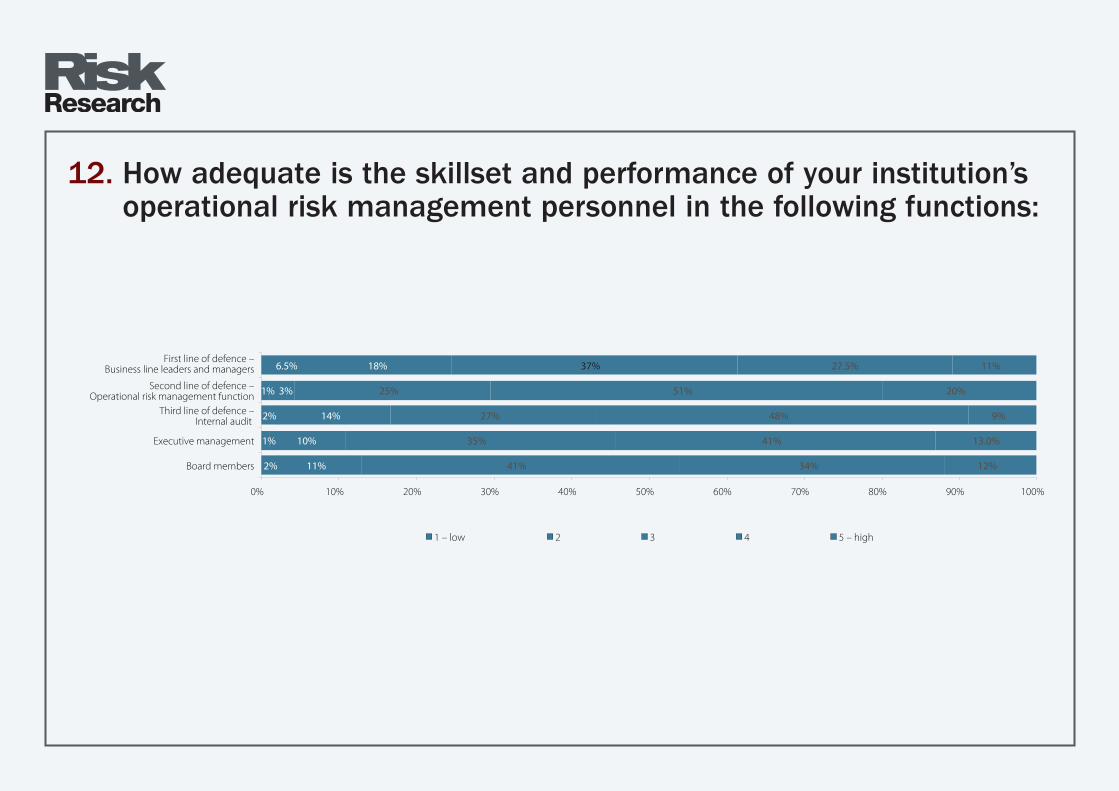
6.5%
1%
2%
1%
2%
18%
3%
14%
10%
11%
37%
25%
27%
35%
41%
27.5%
51%
48%
41%
34%
11%
20%
9%
13.0%
12%
0% 10% 20% 30% 40% 50% 60% 70% 80% 90% 100%
First line of defence –Business line leaders and managers
Second line of defence –Operational risk management function
Third line of defence –Internal audit
Executive management
Board members
1 – low 2 3 4 5 – high
12. How adequate is the skillset and performance of your institution’s operational risk management personnel in the following functions:
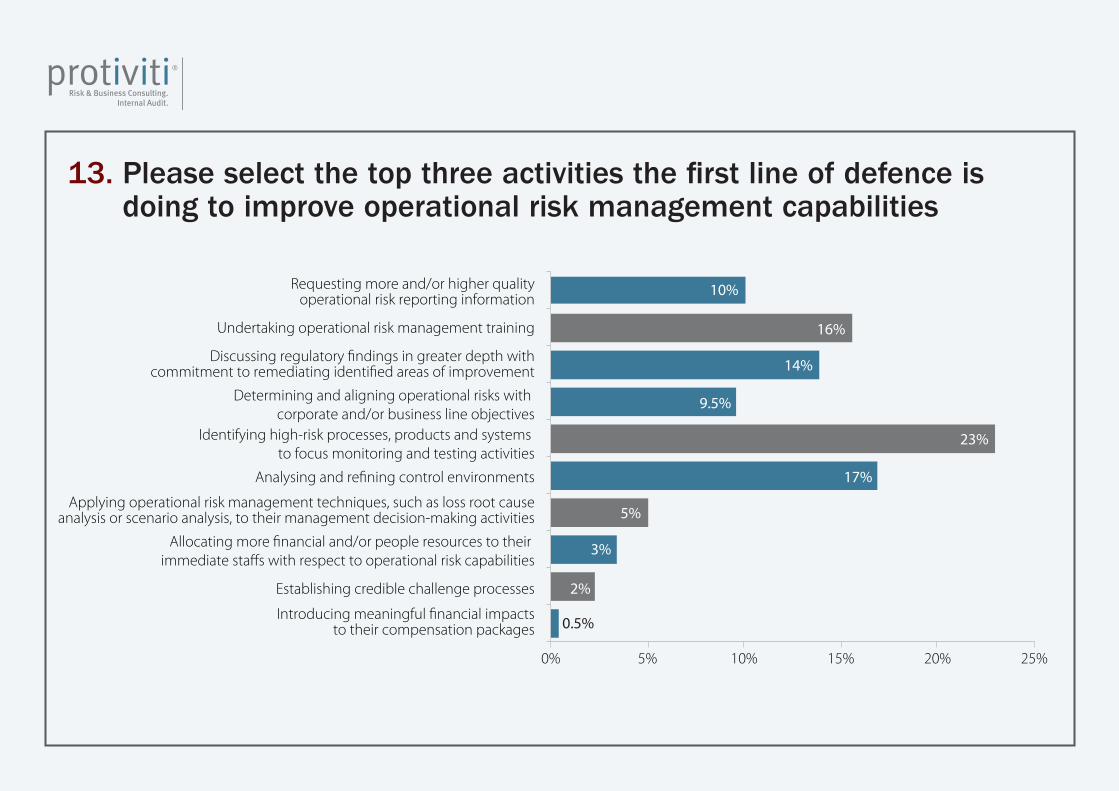
10%
16%
14%
9.5%
23%
17%
5%
3%
2%
0.5%
0% 5% 10% 15% 20% 25%
Requesting more and/or higher qualityoperational risk reporting information
Undertaking operational risk management training
Discussing regulatory findings in greater depth withcommitment to remediating identified areas of improvement
Determining and aligning operational risks with corporate and/or business line objectives
Identifying high-risk processes, products and systems to focus monitoring and testing activities
Analysing and refining control environments
Applying operational risk management techniques, such as loss root causeanalysis or scenario analysis, to their management decision-making activities
Allocating more financial and/or people resources to their immediate staffs with respect to operational risk capabilities
Establishing credible challenge processes
Introducing meaningful financial impactsto their compensation packages
13. Please select the top three activities the first line of defence is doing to improve operational risk management capabilities

14%
3%
37%
35%
11%
0% 5% 10% 15% 20% 25% 30% 35% 40%
Yes, has authority and has stopped one or morebusiness decisions in the last 12 months
Yes, has authority and in allinstances the decision is final
Yes, however the line of business has the ability toaccept the risk and continue their course of business
No, but operational risk offers opinions on businessdecisions for line of business consideration
No, operational risk does not haveinvolvement in line of business decisions
14. Does operational risk management have the ability to independently stop business decisions?
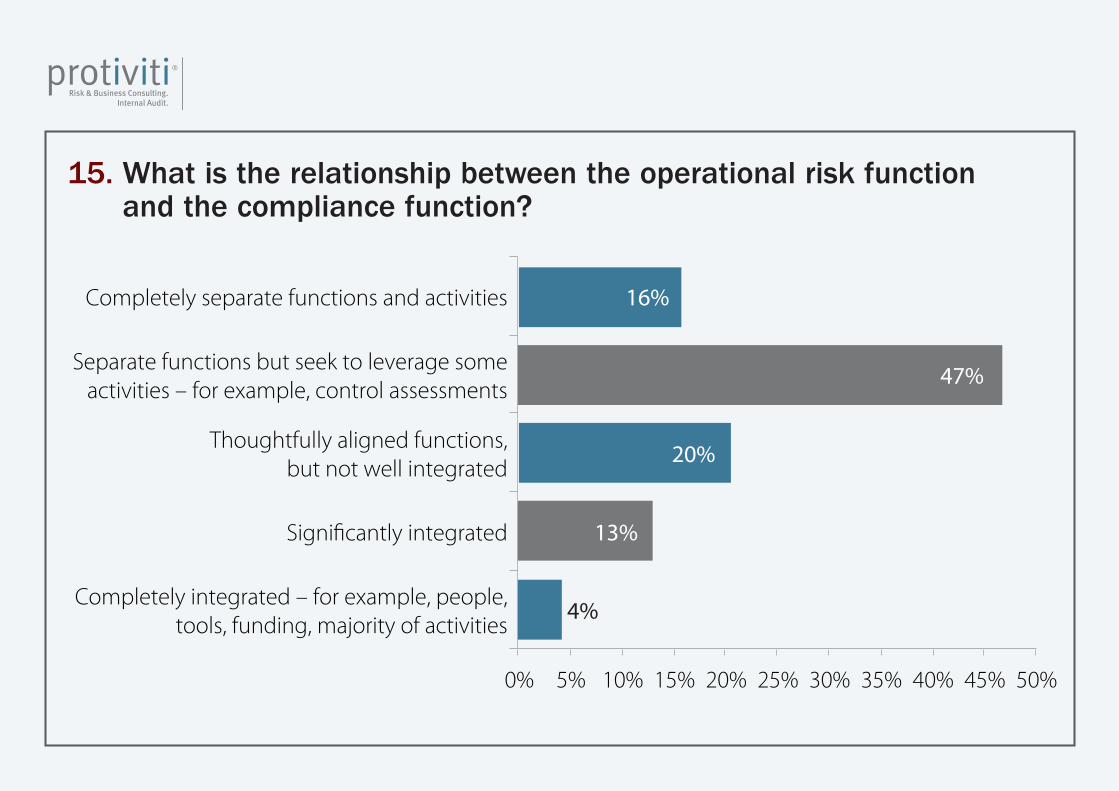
16%
47%
20%
13%
4%
0% 5% 10% 15% 20% 25% 30% 35% 40% 45% 50%
Completely separate functions and activities
Separate functions but seek to leverage someactivities – for example, control assessments
Thoughtfully aligned functions,but not well integrated
Significantly integrated
Completely integrated – for example, people,tools, funding, majority of activities
15. What is the relationship between the operational risk function and the compliance function?
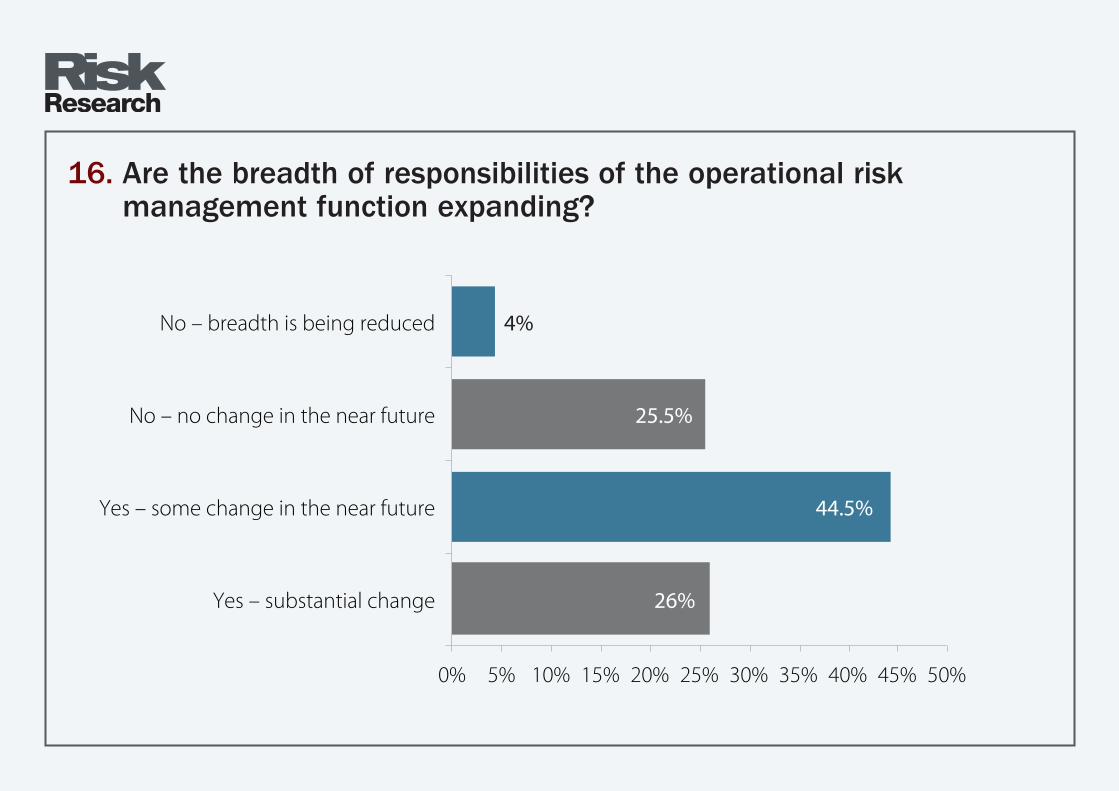
4%
25.5%
44.5%
26%
0% 5% 10% 15% 20% 25% 30% 35% 40% 45% 50%
No – breadth is being reduced
No – no change in the near future
Yes – some change in the near future
Yes – substantial change
16. Are the breadth of responsibilities of the operational risk management function expanding?
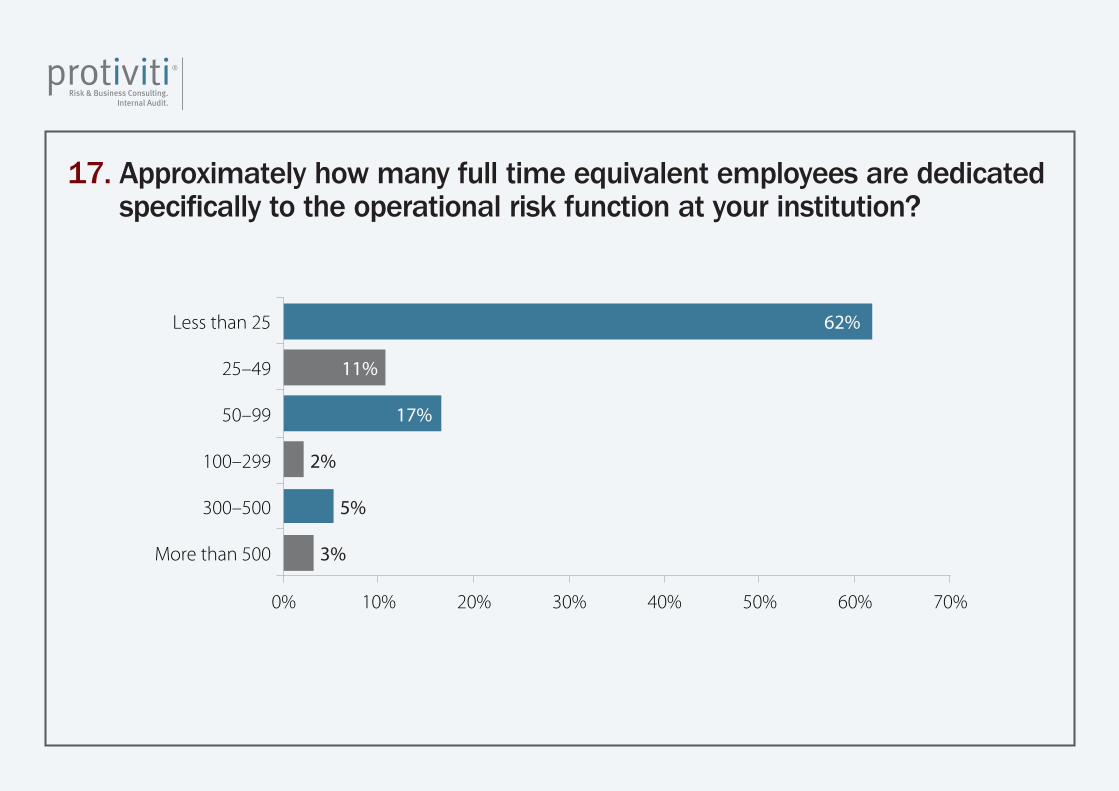
62%
11%
17%
2%
5%
3%
0% 10% 20% 30% 40% 50% 60% 70%
Less than 25
25–49
50–99
100–299
300–500
More than 500
17. Approximately how many full time equivalent employees are dedicated specifically to the operational risk function at your institution?
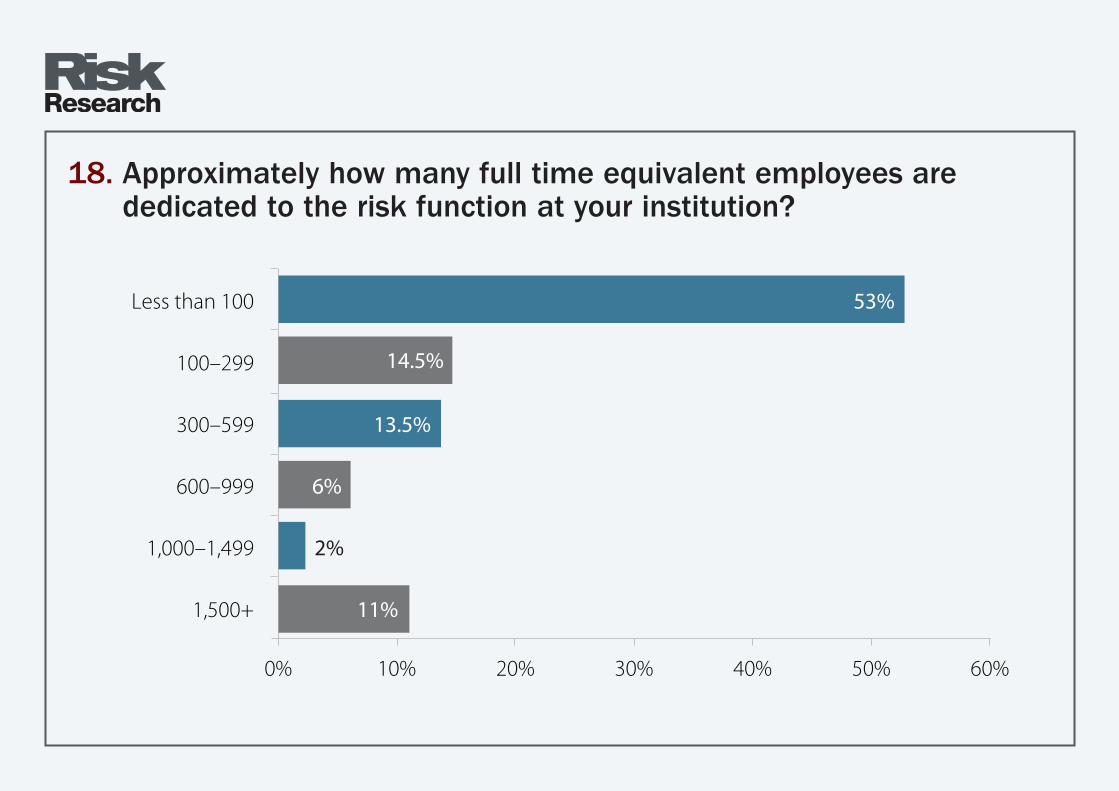
53%
14.5%
13.5%
6%
2%
11%
0% 10% 20% 30% 40% 50% 60%
Less than 100
100–299
300–599
600–999
1,000–1,499
1,500+
18. Approximately how many full time equivalent employees are dedicated to the risk function at your institution?
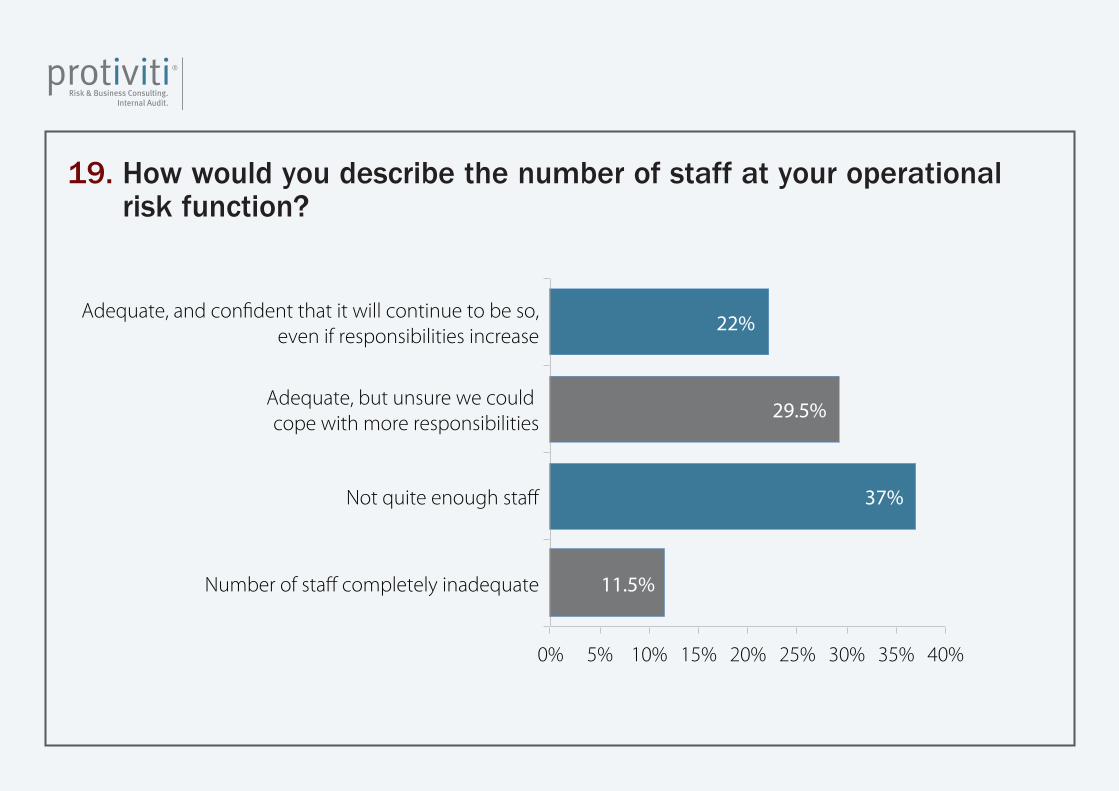
22%
29.5%
37%
11.5%
0% 5% 10% 15% 20% 25% 30% 35% 40%
Adequate, and confident that it will continue to be so,even if responsibilities increase
Adequate, but unsure we could cope with more responsibilities
Not quite enough staff
Number of staff completely inadequate
19. How would you describe the number of staff at your operational risk function?
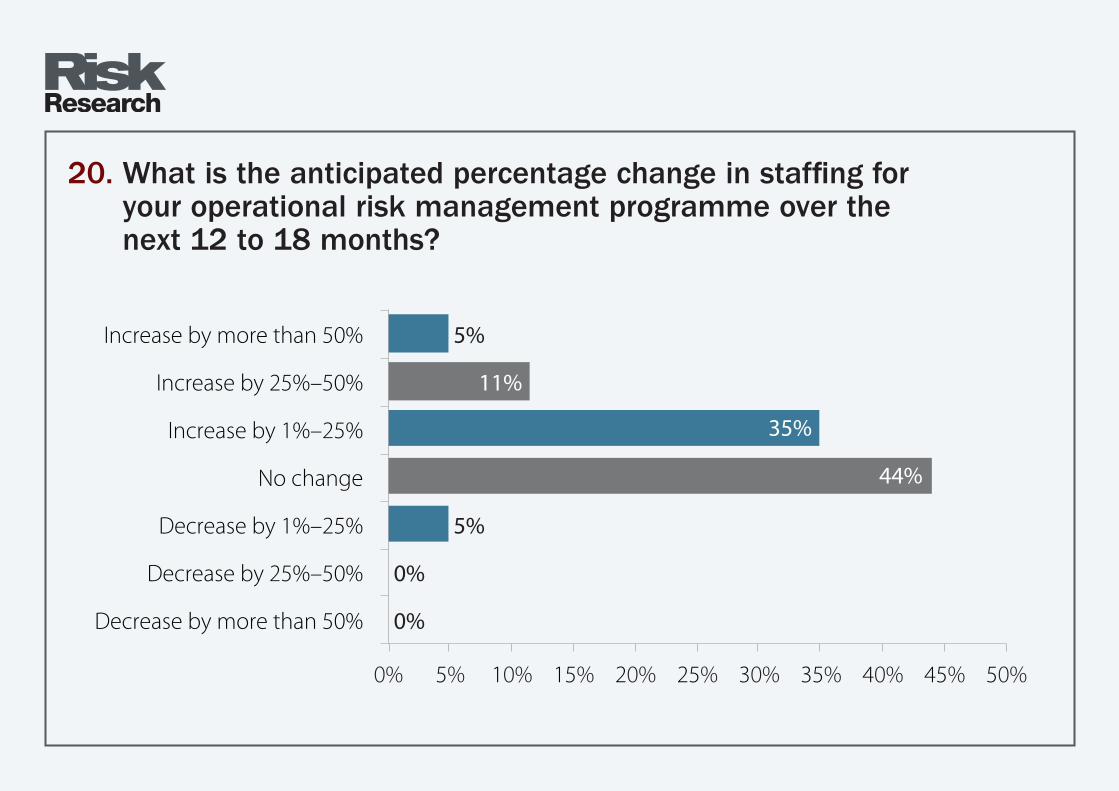
5%
11%
35%
44%
5%
0%
0%
0% 5% 10% 15% 20% 25% 30% 35% 40% 45% 50%
Increase by more than 50%
Increase by 25%–50%
Increase by 1%–25%
No change
Decrease by 1%–25%
Decrease by 25%–50%
Decrease by more than 50%
20. What is the anticipated percentage change in staffing for your operational risk management programme over the next 12 to 18 months?
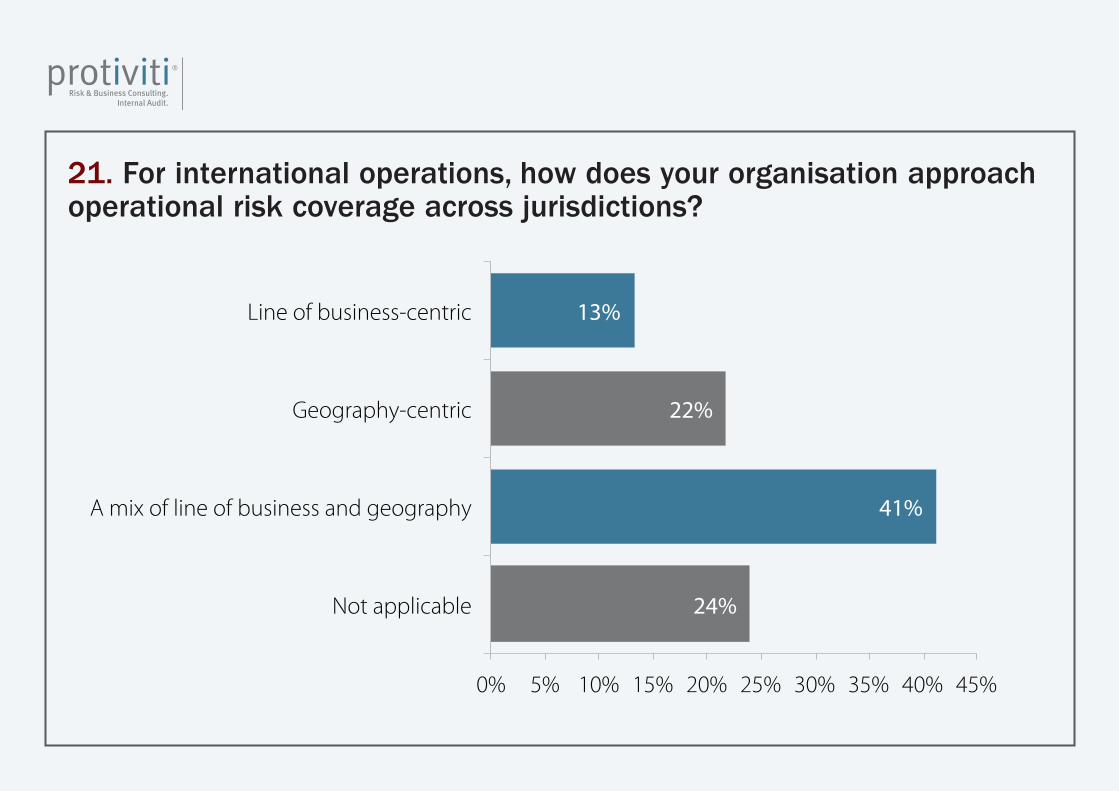
13%
22%
41%
24%
0% 5% 10% 15% 20% 25% 30% 35% 40% 45%
Line of business-centric
Geography-centric
A mix of line of business and geography
Not applicable
21. For international operations, how does your organisation approach operational risk coverage across jurisdictions?
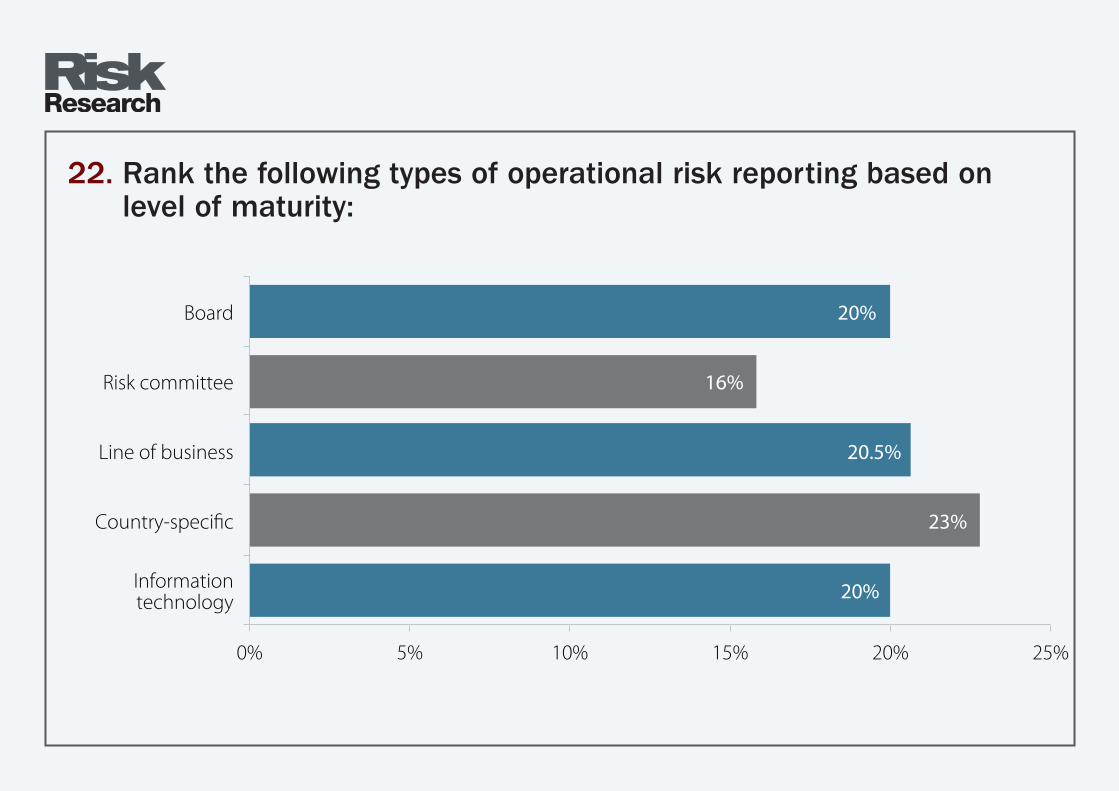
20%
16%
20.5%
23%
20%
0% 5% 10% 15% 20% 25%
Board
Risk committee
Line of business
Country-specific
Informationtechnology
22. Rank the following types of operational risk reporting based on level of maturity:
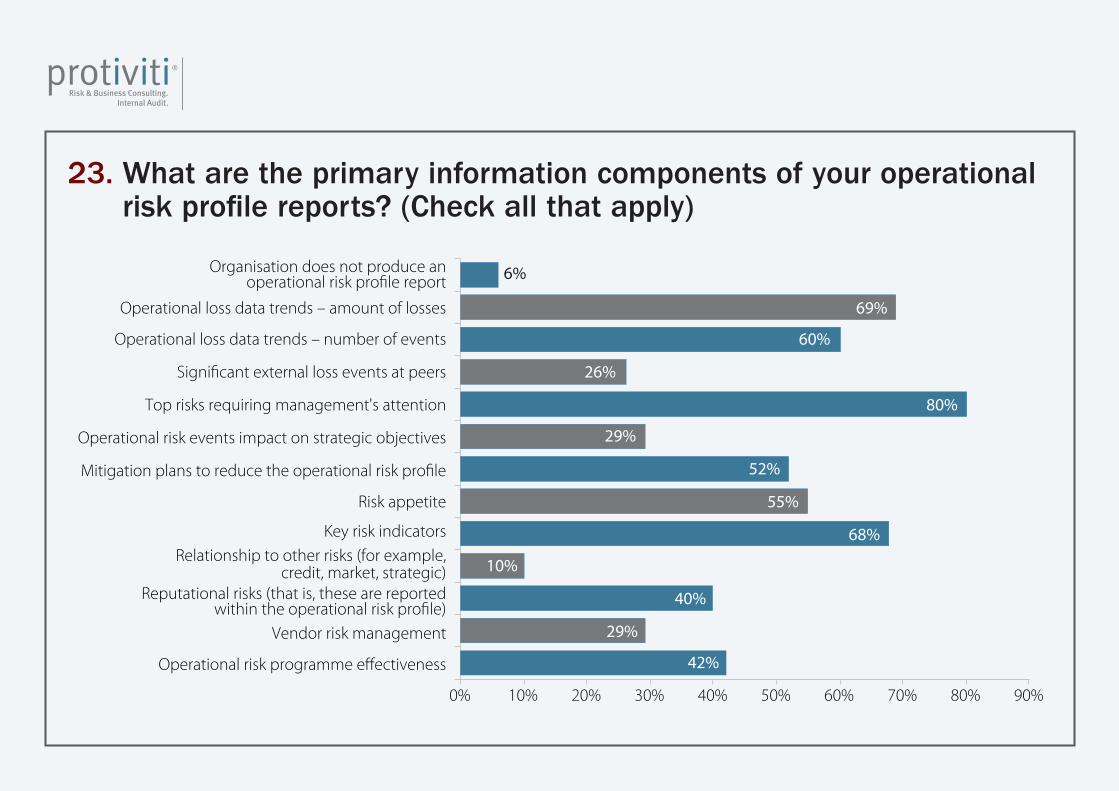
6%
69%
60%
26%
80%
29%
52%
55%
68%
10%
40%
29%
42%
0% 10% 20% 30% 40% 50% 60% 70% 80% 90%
Organisation does not produce anoperational risk profile report
Operational loss data trends – amount of losses
Operational loss data trends – number of events
Significant external loss events at peers
Top risks requiring management's attention
Operational risk events impact on strategic objectives
Mitigation plans to reduce the operational risk profile
Risk appetite
Key risk indicatorsRelationship to other risks (for example,
credit, market, strategic)Reputational risks (that is, these are reported
within the operational risk profile)Vendor risk management
Operational risk programme effectiveness
23. What are the primary information components of your operational risk profile reports? (Check all that apply)
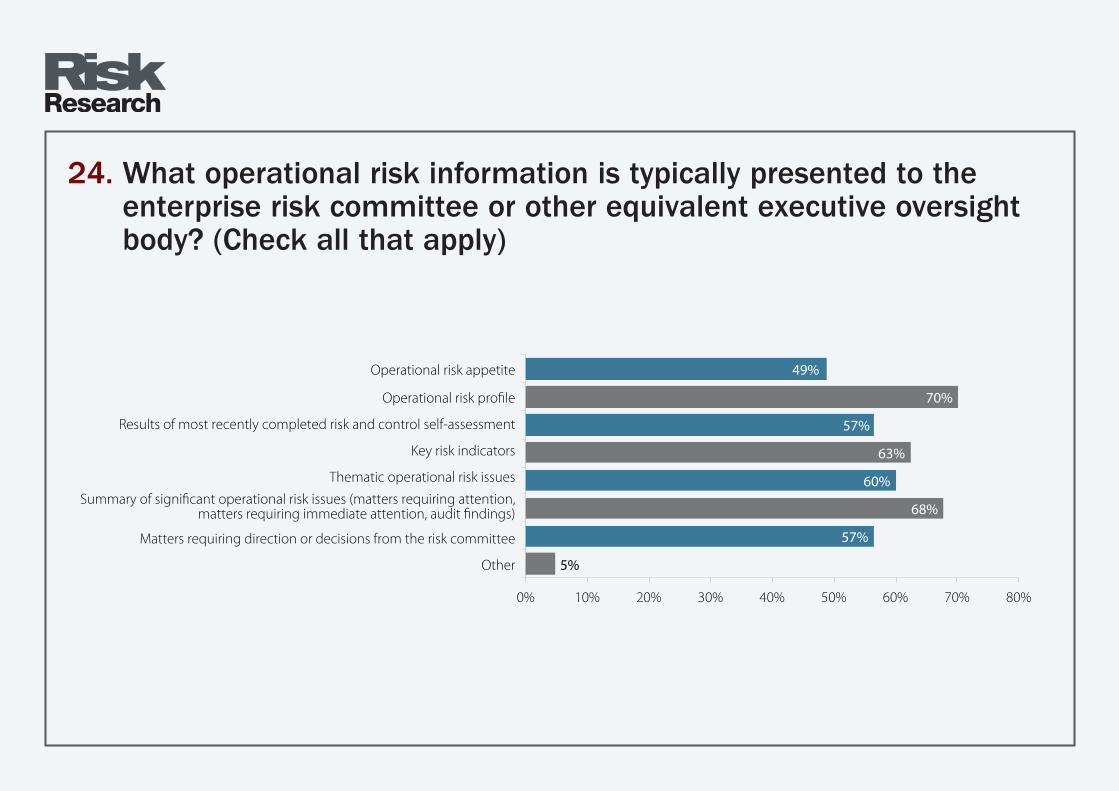
49%
70%
57%
63%
60%
68%
57%
5%
0% 10% 20% 30% 40% 50% 60% 70% 80%
Operational risk appetite
Operational risk profile
Results of most recently completed risk and control self-assessment
Key risk indicators
Thematic operational risk issues
Summary of significant operational risk issues (matters requiring attention,matters requiring immediate attention, audit findings)
Matters requiring direction or decisions from the risk committee
Other
24. What operational risk information is typically presented to the enterprise risk committee or other equivalent executive oversight body? (Check all that apply)
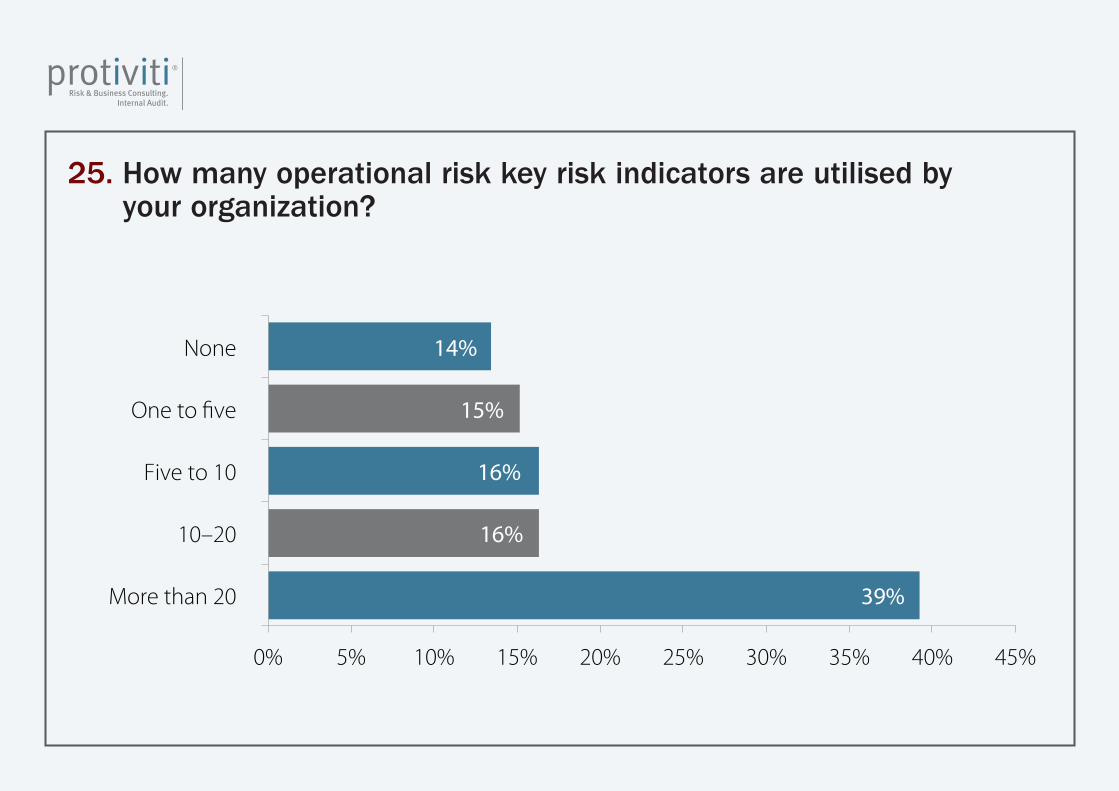
14%
15%
16%
16%
39%
0% 5% 10% 15% 20% 25% 30% 35% 40% 45%
None
One to five
Five to 10
10–20
More than 20
25. How many operational risk key risk indicators are utilised by your organization?
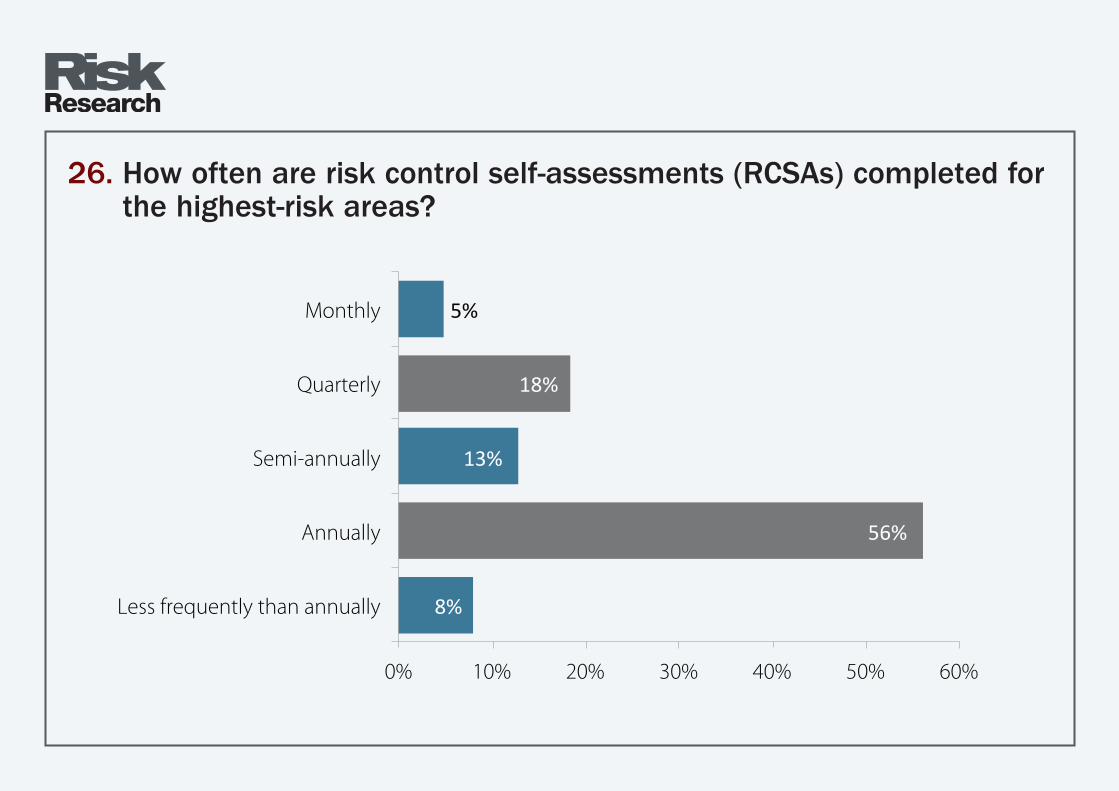
5%
18%
13%
56%
8%
0% 10% 20% 30% 40% 50% 60%
Monthly
Quarterly
Semi-annually
Annually
Less frequently than annually
26. How often are risk control self-assessments (RCSAs) completed for the highest-risk areas?
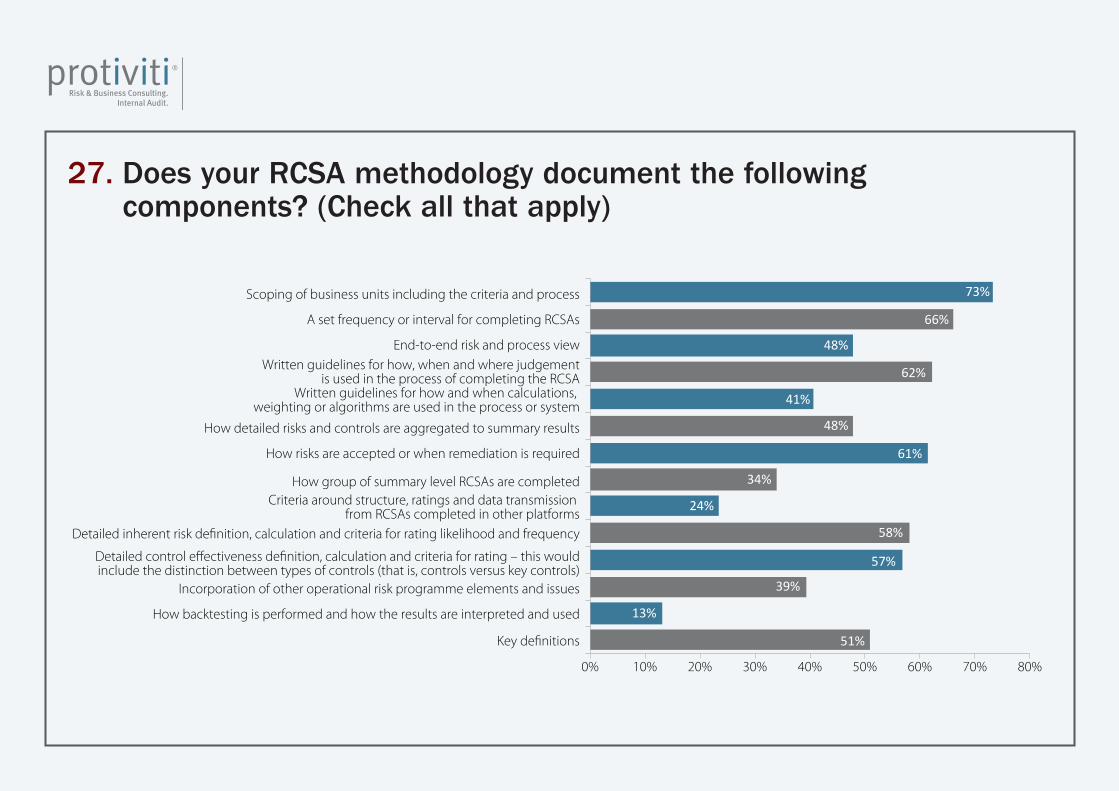
73%
66%
48%
62%
41%
48%
61%
34%
24%
58%
57%
39%
13%
51%
0% 10% 20% 30% 40% 50% 60% 70% 80%
Scoping of business units including the criteria and process
A set frequency or interval for completing RCSAs
End-to-end risk and process viewWritten guidelines for how, when and where judgement
is used in the process of completing the RCSAWritten guidelines for how and when calculations,
weighting or algorithms are used in the process or system
How detailed risks and controls are aggregated to summary results
How risks are accepted or when remediation is required
How group of summary level RCSAs are completedCriteria around structure, ratings and data transmission
from RCSAs completed in other platformsDetailed inherent risk definition, calculation and criteria for rating likelihood and frequency
Detailed control effectiveness definition, calculation and criteria for rating – this wouldinclude the distinction between types of controls (that is, controls versus key controls)
Incorporation of other operational risk programme elements and issues
How backtesting is performed and how the results are interpreted and used
Key definitions
27. Does your RCSA methodology document the following components? (Check all that apply)
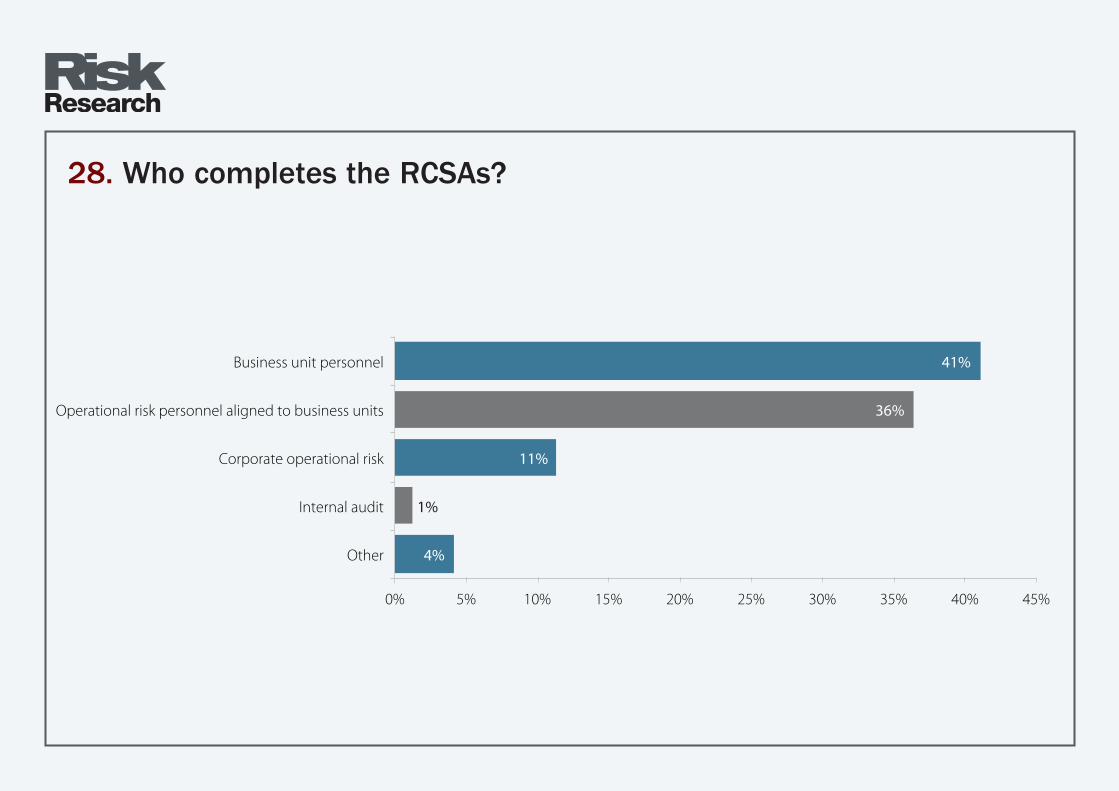
41%
36%
11%
1%
4%
0% 5% 10% 15% 20% 25% 30% 35% 40% 45%
Business unit personnel
Operational risk personnel aligned to business units
Corporate operational risk
Internal audit
Other
28. Who completes the RCSAs?
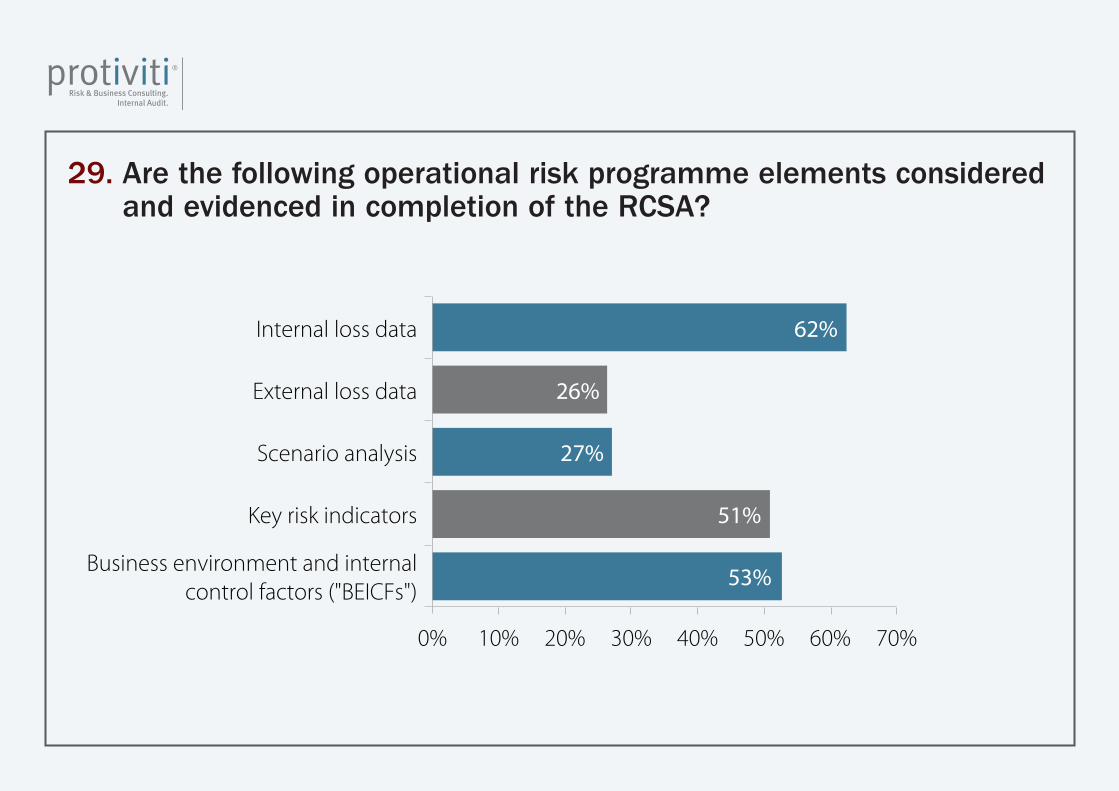
62%
26%
27%
51%
53%
0% 10% 20% 30% 40% 50% 60% 70%
Internal loss data
External loss data
Scenario analysis
Key risk indicators
Business environment and internalcontrol factors ("BEICFs")
29. Are the following operational risk programme elements considered and evidenced in completion of the RCSA?
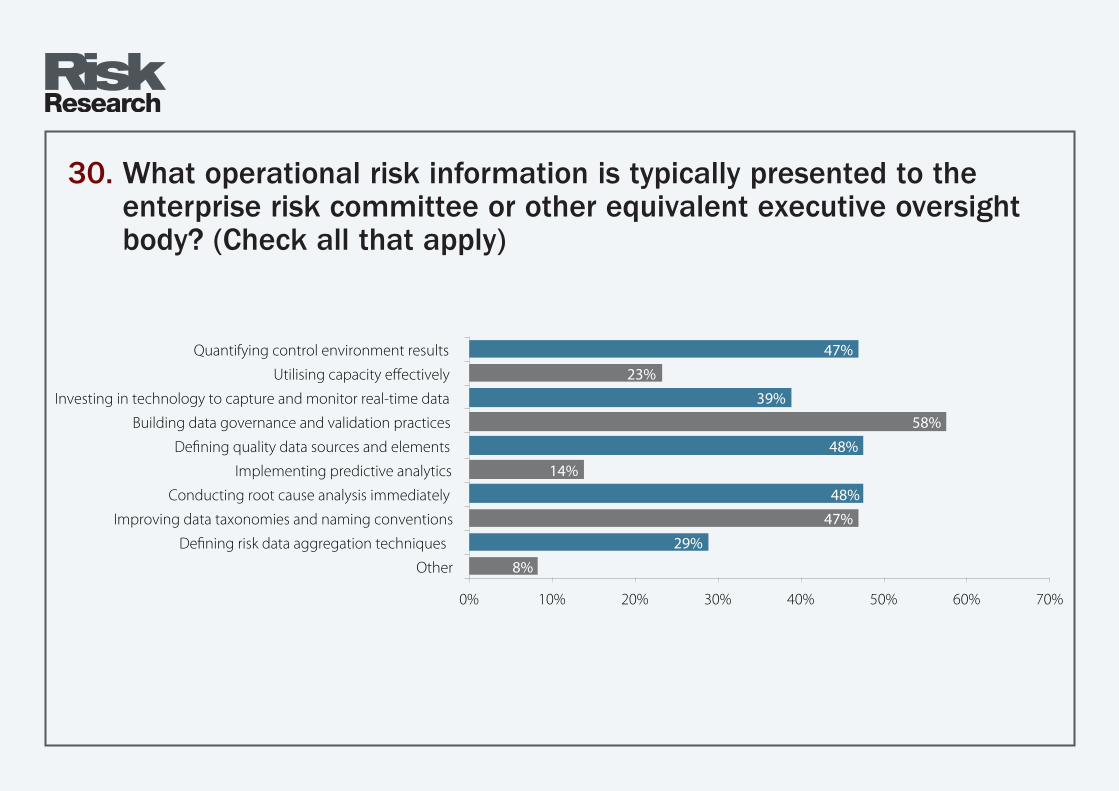
47%
23%
39%
58%
48%
14%
48%
47%
29%
8%
0% 10% 20% 30% 40% 50% 60% 70%
Quantifying control environment results
Utilising capacity effectively
Investing in technology to capture and monitor real-time data
Building data governance and validation practices
Defining quality data sources and elements
Implementing predictive analytics
Conducting root cause analysis immediately
Improving data taxonomies and naming conventions
Defining risk data aggregation techniques
Other
30. What operational risk information is typically presented to the enterprise risk committee or other equivalent executive oversight body? (Check all that apply)

53%
61%
35%
29%
24%
55%
75%
0% 10% 20% 30% 40% 50% 60% 70% 80%
Root cause data capture
Root cause data analysis
Horizontal reviews of losses and issues
Team or workshop approachto discussing root causes
Clear definitions of root causes and associated data elements
Reporting of root causes and themesto operational risk committees
Mitigation plans and activities
31. What critical success factors has your organisation implemented related to root cause analysis? (Check all that apply)
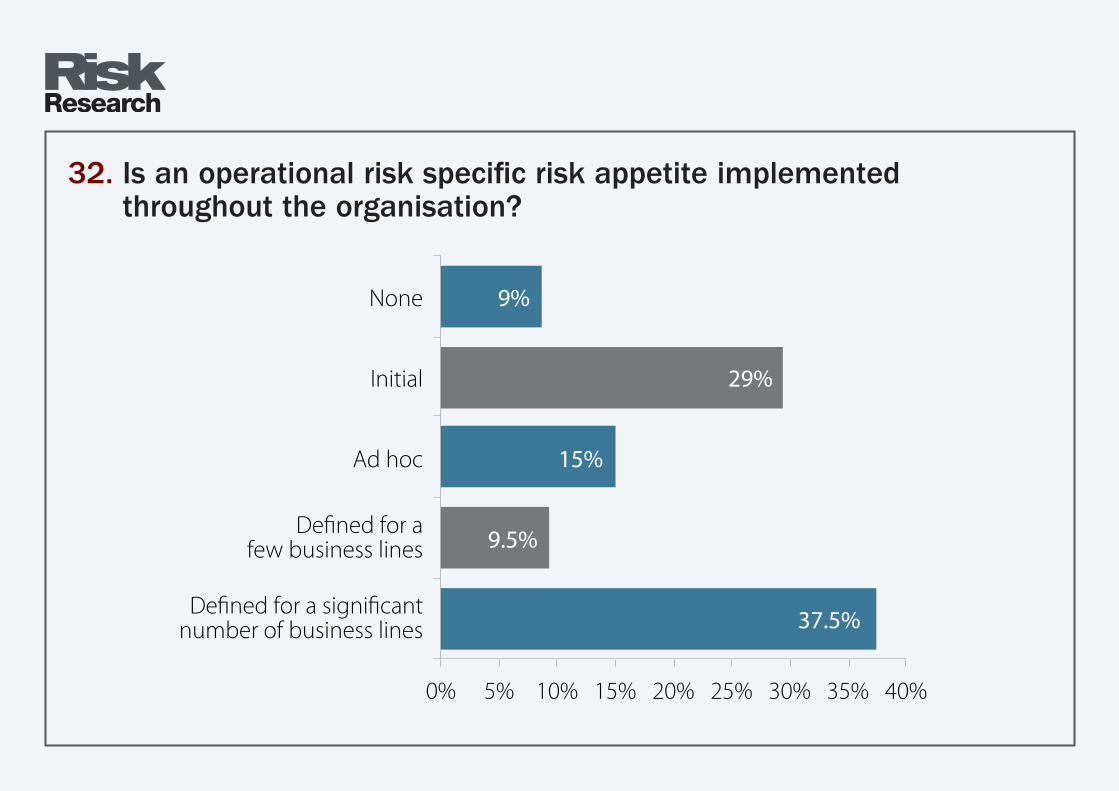
9%
29%
15%
9.5%
37.5%
0% 5% 10% 15% 20% 25% 30% 35% 40%
None
Initial
Ad hoc
Defined for afew business lines
Defined for a significantnumber of business lines
32. Is an operational risk specific risk appetite implemented throughout the organisation?
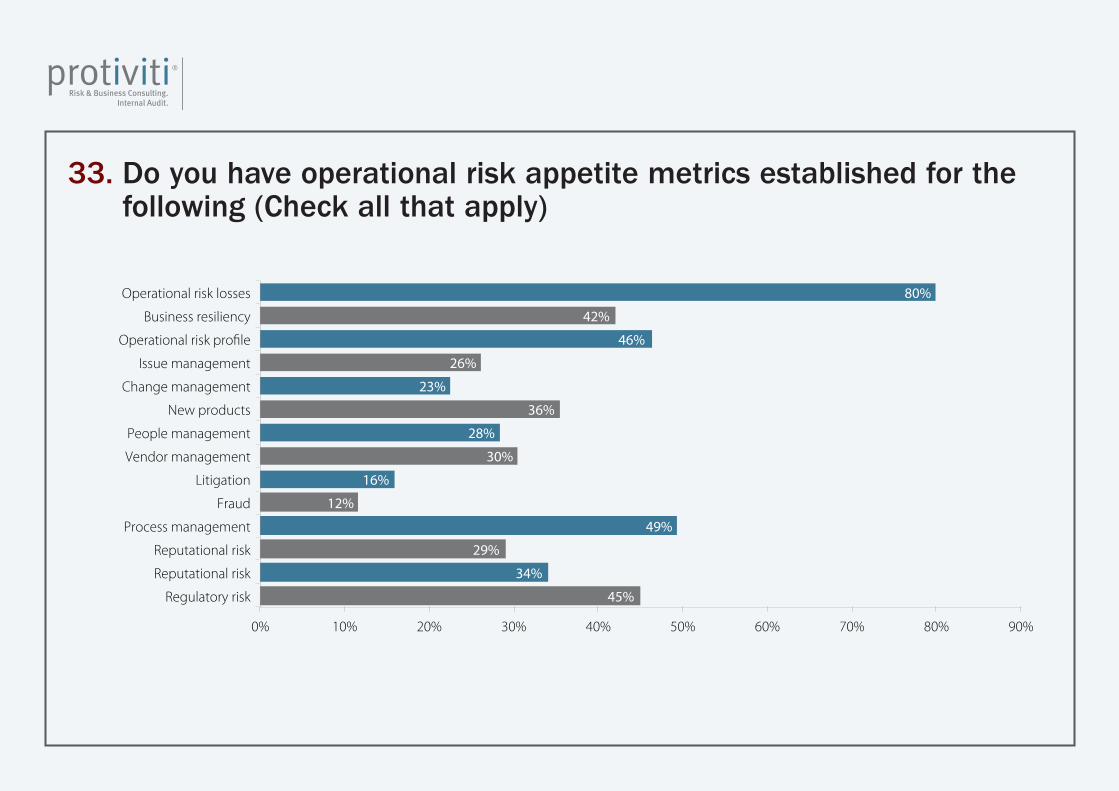
80%
42%
46%
26%
23%
36%
28%
30%
16%
12%
49%
29%
34%
45%
0% 10% 20% 30% 40% 50% 60% 70% 80% 90%
Operational risk losses
Business resiliency
Operational risk profile
Issue management
Change management
New products
People management
Vendor management
Litigation
Fraud
Process management
Reputational risk
Reputational risk
Regulatory risk
33. Do you have operational risk appetite metrics established for the following (Check all that apply)

32%
25%
8.5%
20%
14.5%
0% 5% 10% 15% 20% 25% 30% 35%
1–3
4–7
7–10
More than 10
Not applicable
34. How many operational risk appetite metrics do you use?
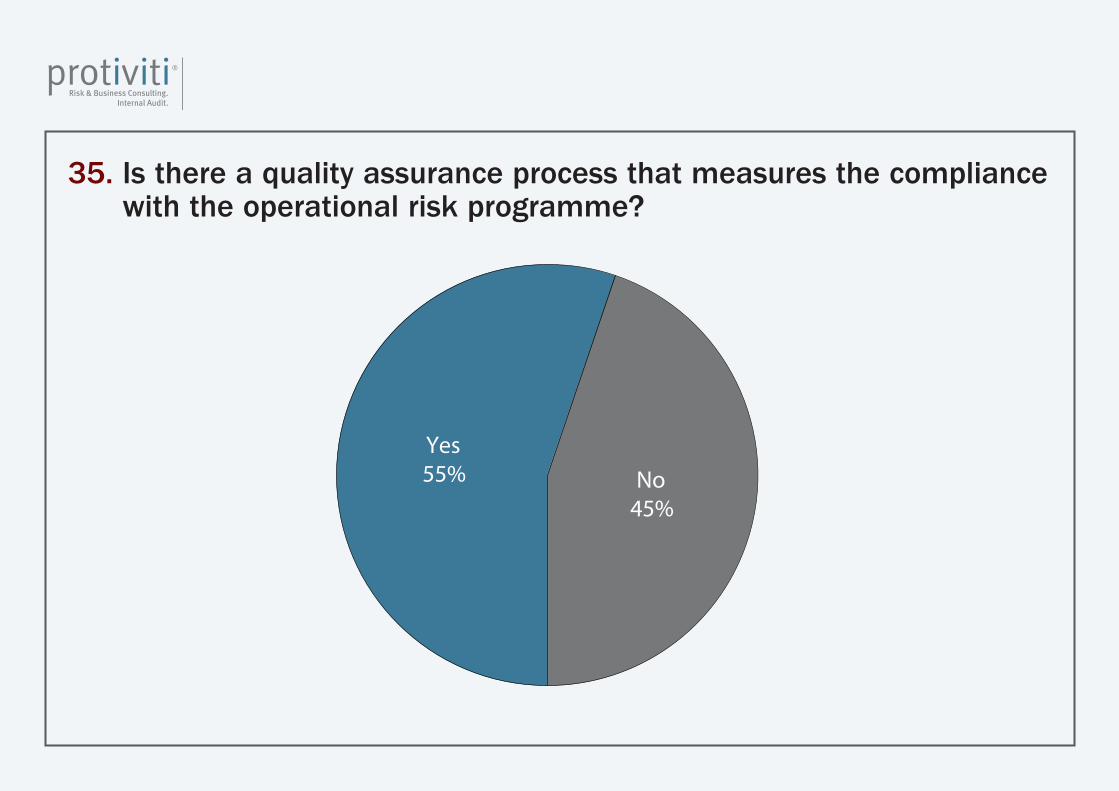
Yes55% No
45%
35. Is there a quality assurance process that measures the compliance with the operational risk programme?
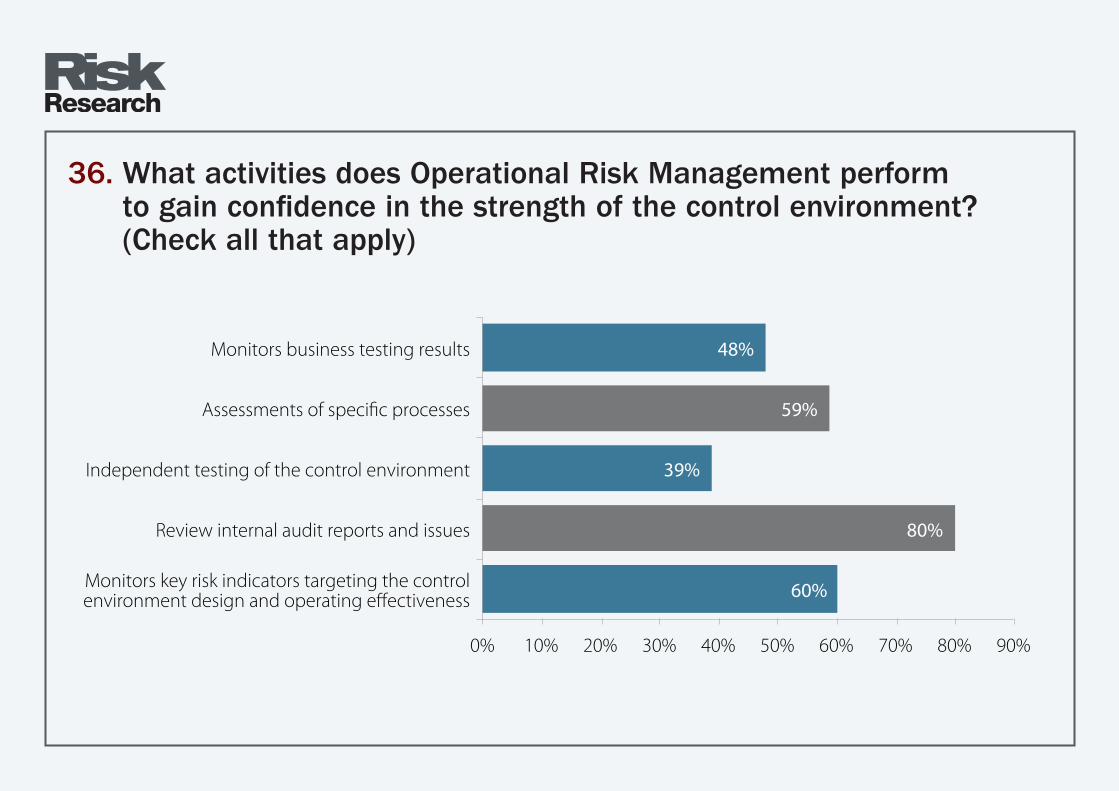
48%
59%
39%
80%
60%
0% 10% 20% 30% 40% 50% 60% 70% 80% 90%
Monitors business testing results
Assessments of specific processes
Independent testing of the control environment
Review internal audit reports and issues
Monitors key risk indicators targeting the controlenvironment design and operating effectiveness
36. What activities does Operational Risk Management perform to gain confidence in the strength of the control environment? (Check all that apply)
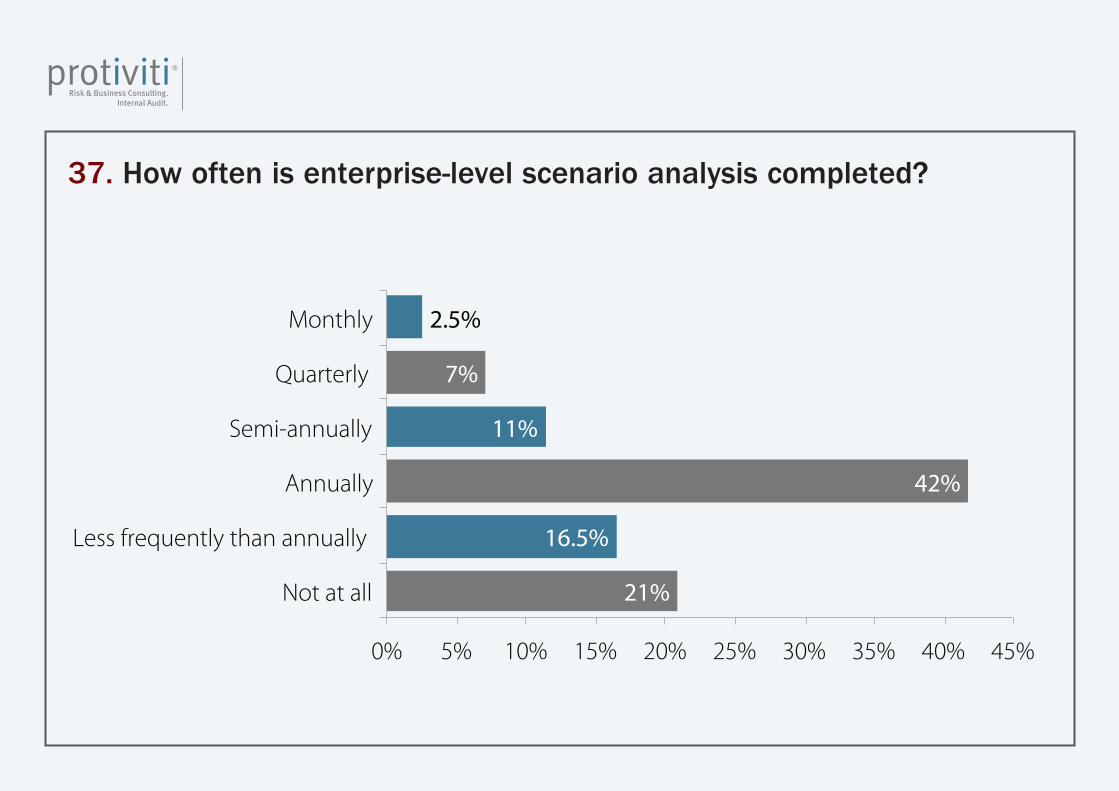
2.5%
7%
11%
42%
16.5%
21%
0% 5% 10% 15% 20% 25% 30% 35% 40% 45%
Monthly
Quarterly
Semi-annually
Annually
Less frequently than annually
Not at all
37. How often is enterprise-level scenario analysis completed?
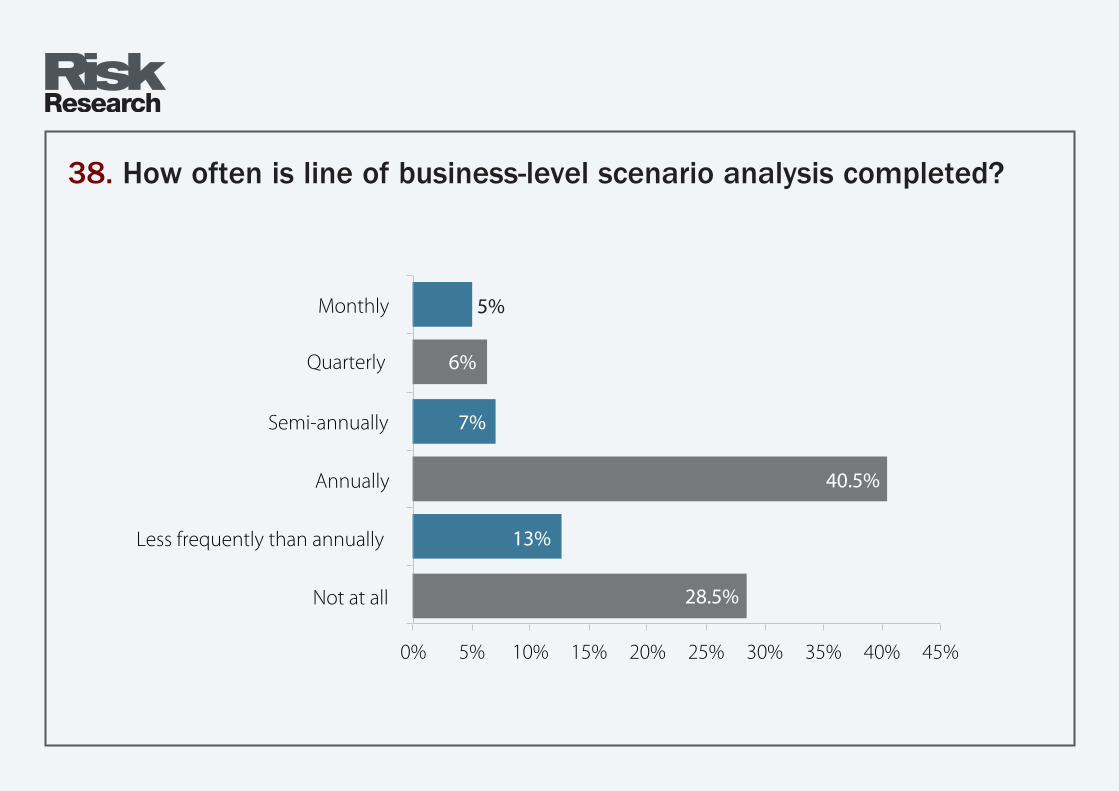
Monthly
Quarterly
Semi-annually
Annually
Less frequently than annually
Not at all
5%
6%
7%
40.5%
13%
28.5%
0% 5% 10% 15% 20% 25% 30% 35% 40% 45%
38. How often is line of business-level scenario analysis completed?
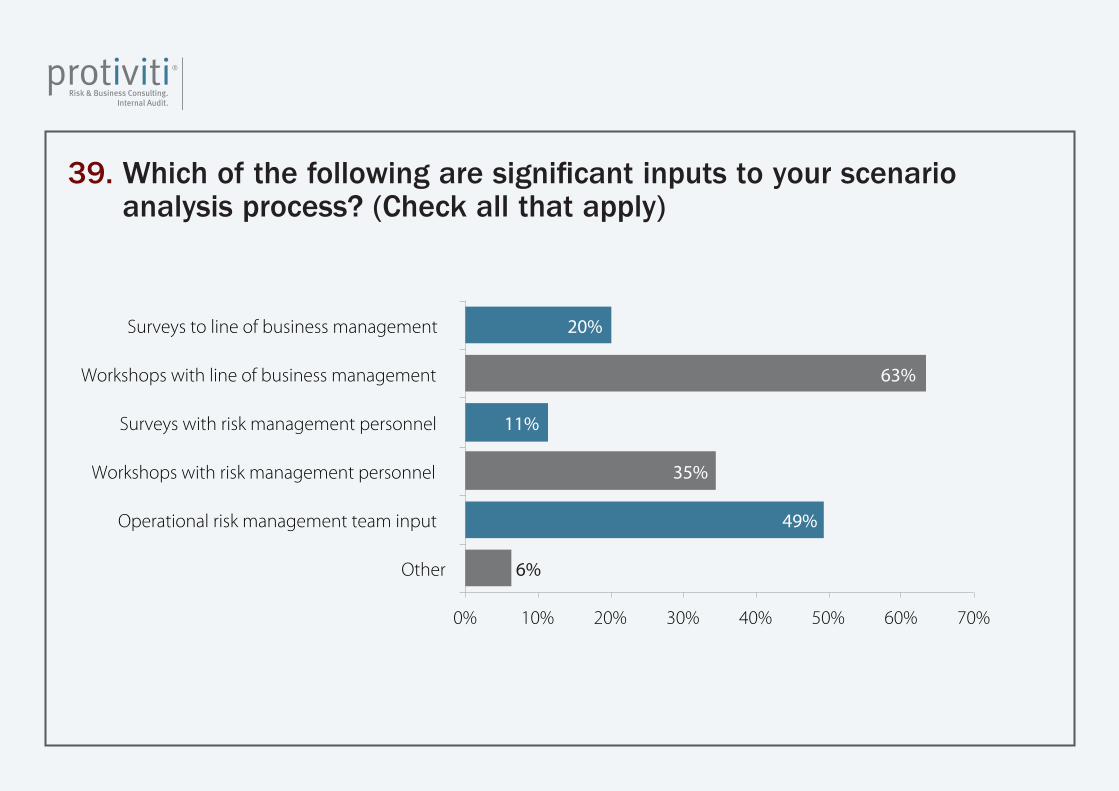
20%
63%
11%
35%
49%
6%
0% 10% 20% 30% 40% 50% 60% 70%
Surveys to line of business management
Workshops with line of business management
Surveys with risk management personnel
Workshops with risk management personnel
Operational risk management team input
Other
39. Which of the following are significant inputs to your scenario analysis process? (Check all that apply)
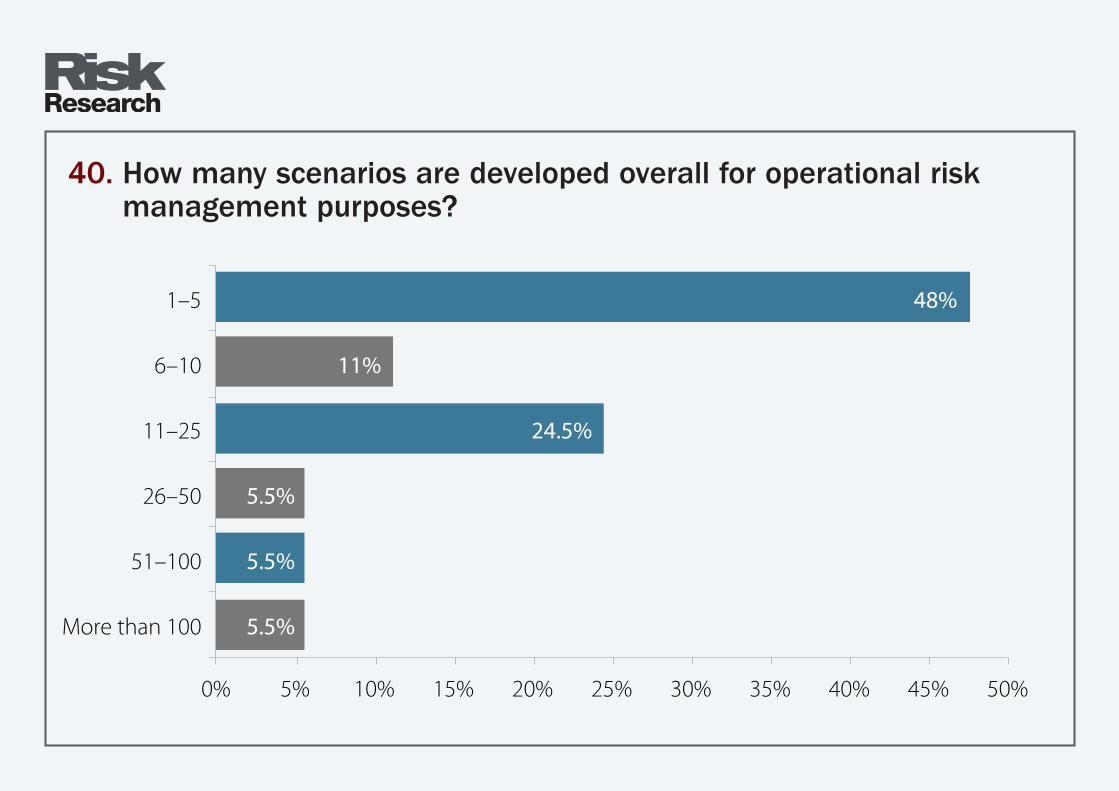
48%
11%
24.5%
5.5%
5.5%
5.5%
0% 5% 10% 15% 20% 25% 30% 35% 40% 45% 50%
1–5
6–10
11–25
26–50
51–100
More than 100
40. How many scenarios are developed overall for operational risk management purposes?
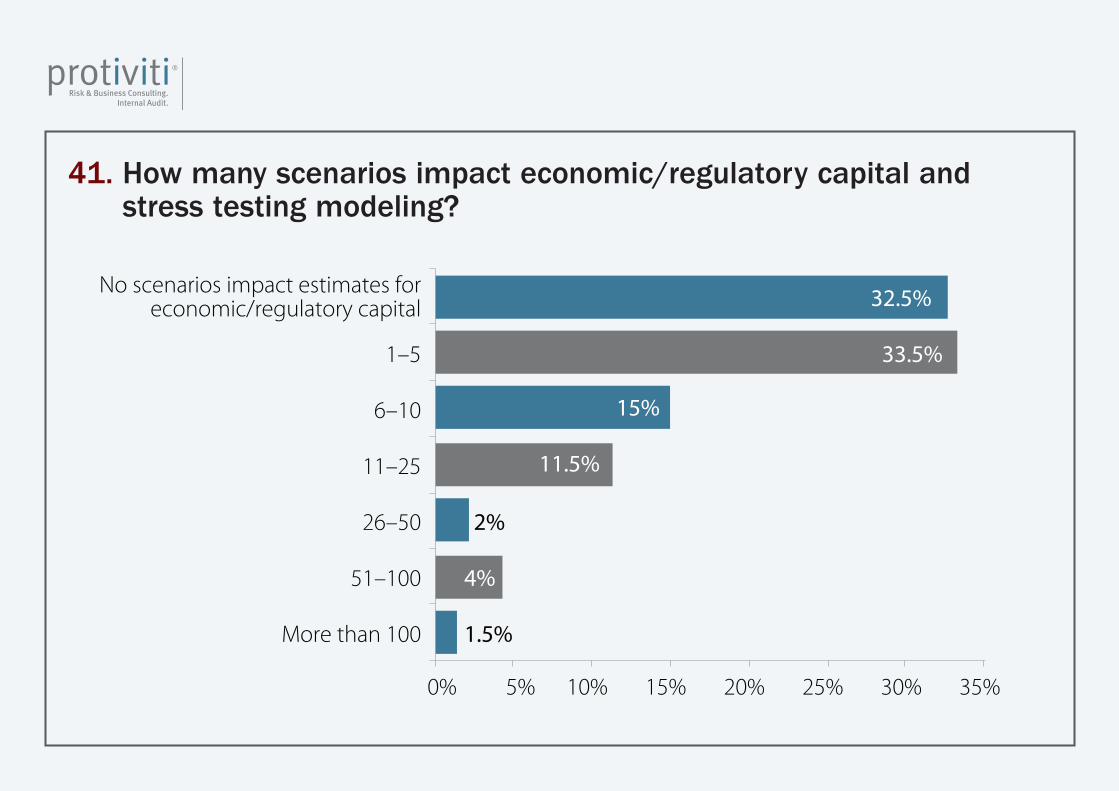
32.5%
33.5%
15%
11.5%
2%
4%
1.5%
0% 5% 10% 15% 20% 25% 30% 35%
No scenarios impact estimates foreconomic/regulatory capital
1–5
6–10
11–25
26–50
51–100
More than 100
41. How many scenarios impact economic/regulatory capital and stress testing modeling?
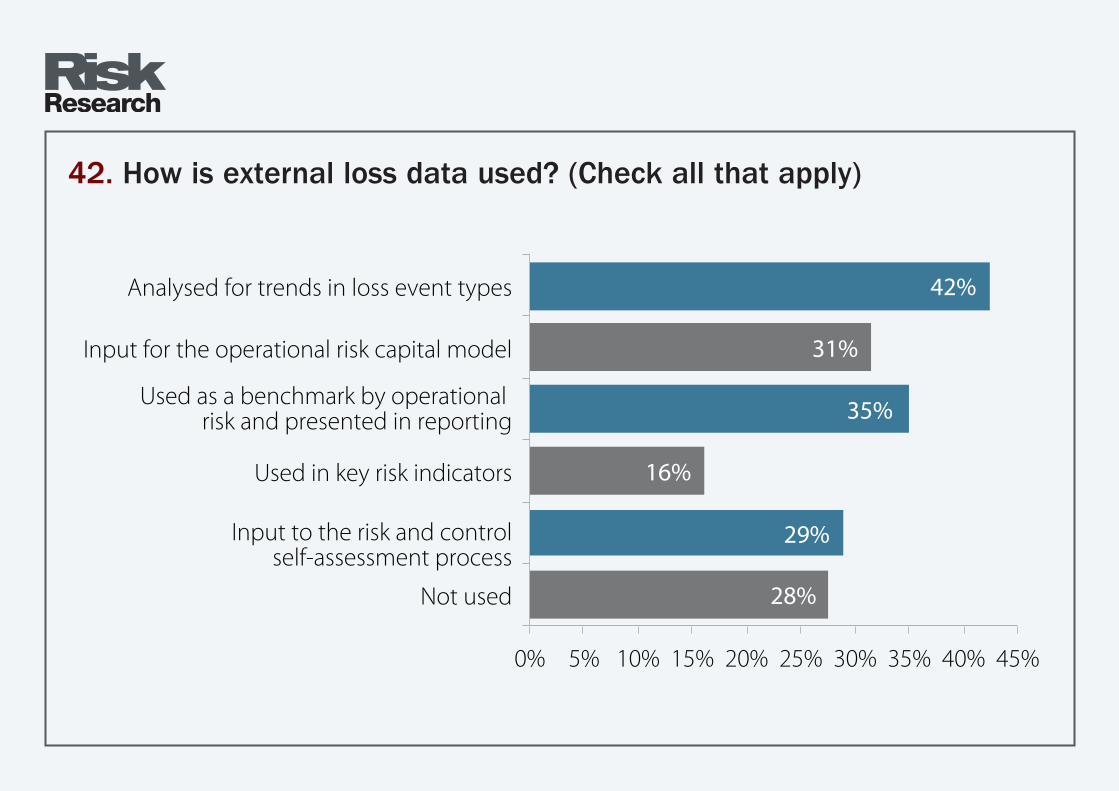
42%
31%
35%
16%
29%
28%
0% 5% 10% 15% 20% 25% 30% 35% 40% 45%
Analysed for trends in loss event types
Input for the operational risk capital model
Used as a benchmark by operational risk and presented in reporting
Used in key risk indicators
Input to the risk and controlself-assessment process
Not used
42. How is external loss data used? (Check all that apply)
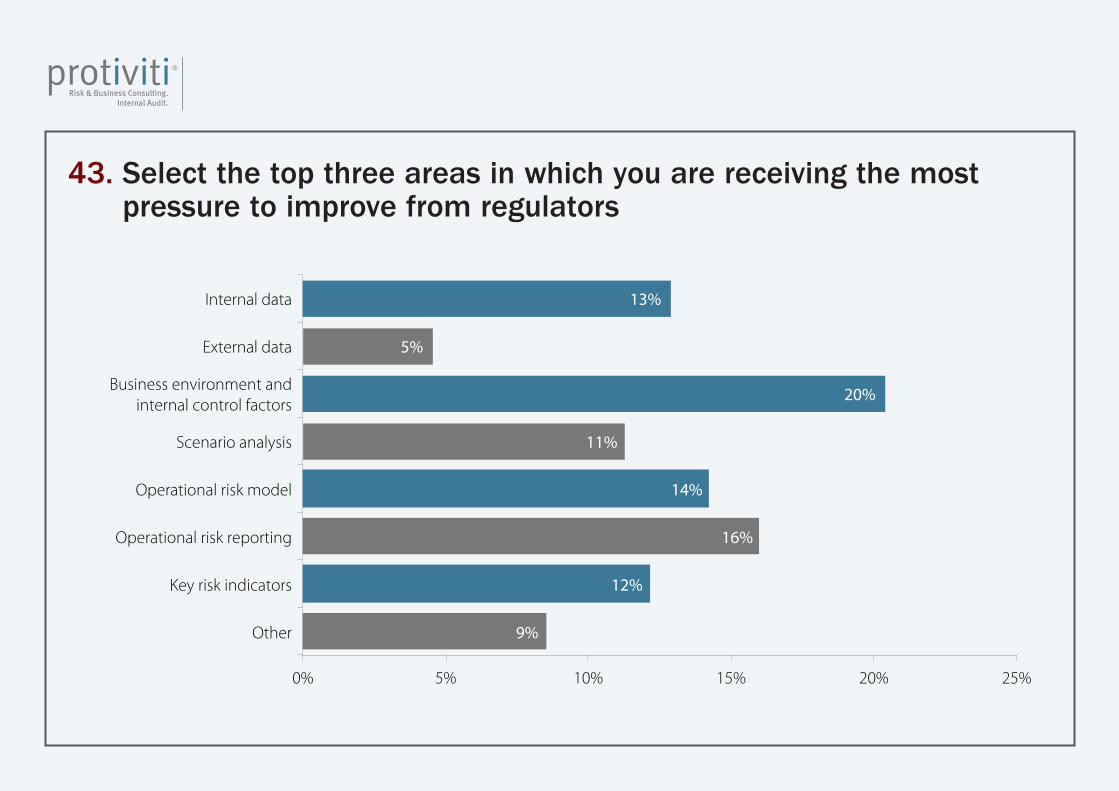
13%
5%
20%
11%
14%
16%
12%
9%
0% 5% 10% 15% 20% 25%
Internal data
External data
Business environment andinternal control factors
Scenario analysis
Operational risk model
Operational risk reporting
Key risk indicators
Other
43. Select the top three areas in which you are receiving the most pressure to improve from regulators
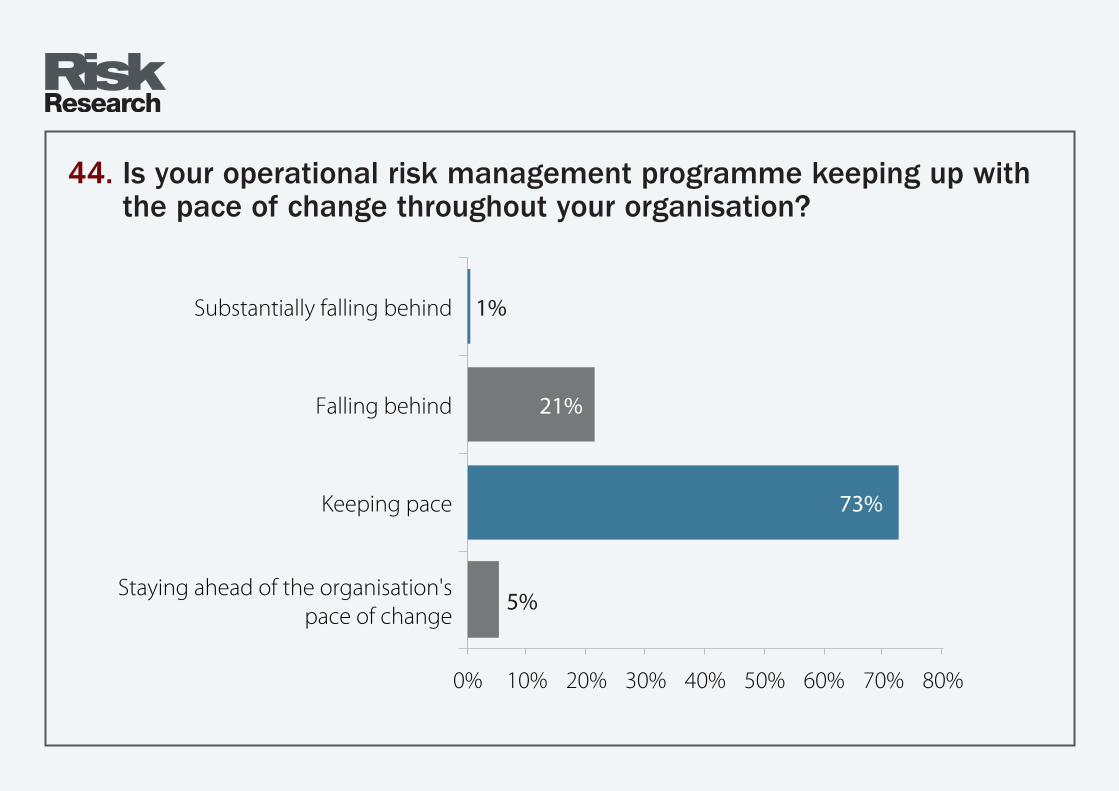
1%
21%
73%
5%
0% 10% 20% 30% 40% 50% 60% 70% 80%
Substantially falling behind
Falling behind
Keeping pace
Staying ahead of the organisation'space of change
44. Is your operational risk management programme keeping up with the pace of change throughout your organisation?
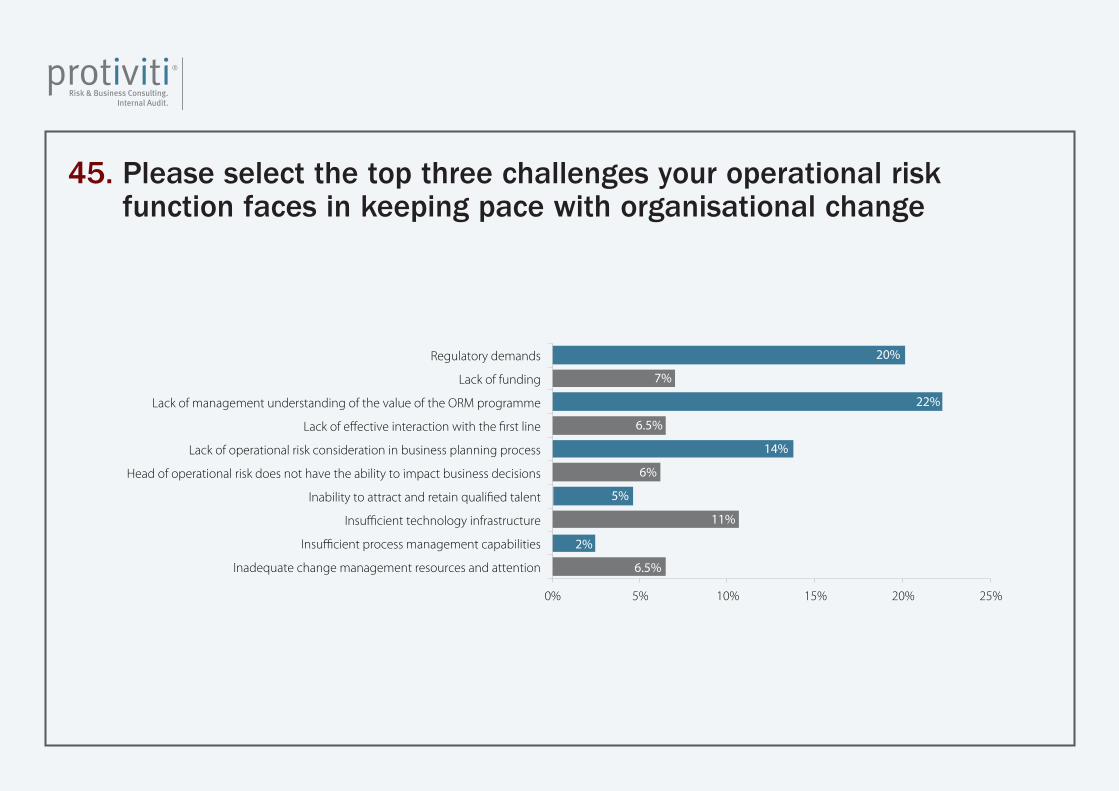
20%
7%
22%
6.5%
14%
6%
5%
11%
2%
6.5%
0% 5% 10% 15% 20% 25%
Regulatory demands
Lack of funding
Lack of management understanding of the value of the ORM programme
Lack of effective interaction with the first line
Lack of operational risk consideration in business planning process
Head of operational risk does not have the ability to impact business decisions
Inability to attract and retain qualified talent
Insufficient technology infrastructure
Insufficient process management capabilities
Inadequate change management resources and attention
45. Please select the top three challenges your operational risk function faces in keeping pace with organisational change
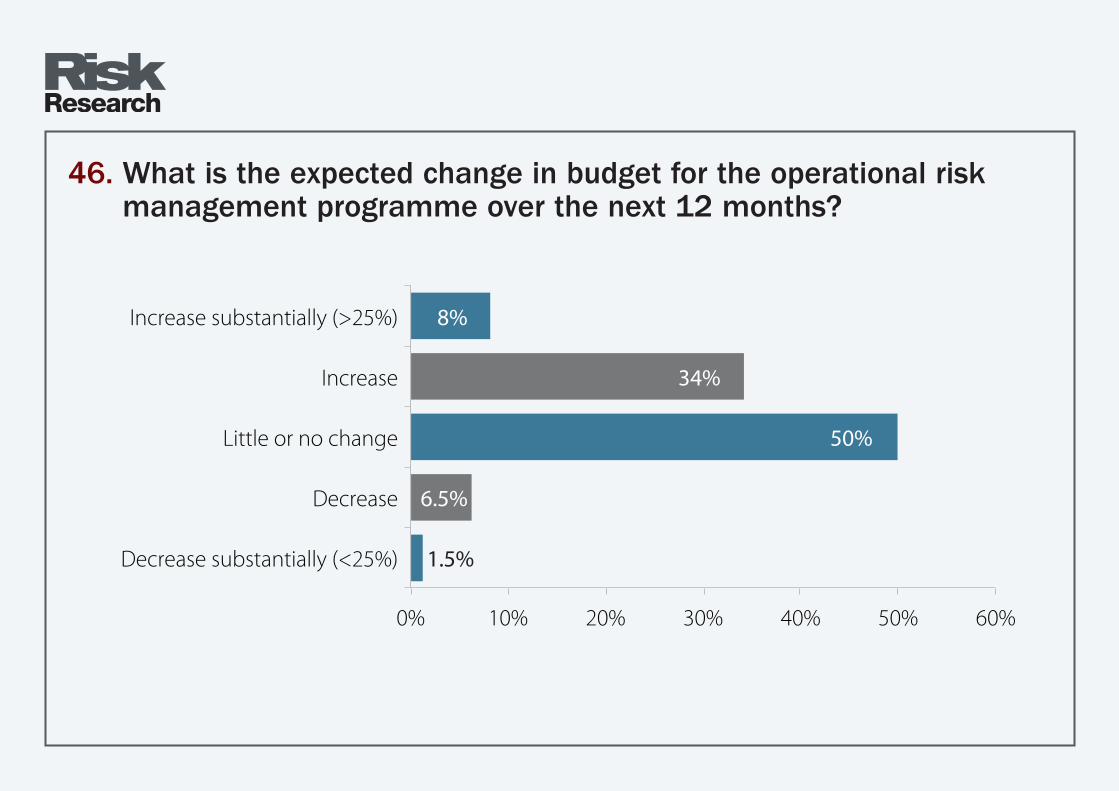
8%
34%
50%
6.5%
1.5%
0% 10% 20% 30% 40% 50% 60%
Increase substantially (>25%)
Increase
Little or no change
Decrease
Decrease substantially (<25%)
46. What is the expected change in budget for the operational risk management programme over the next 12 months?
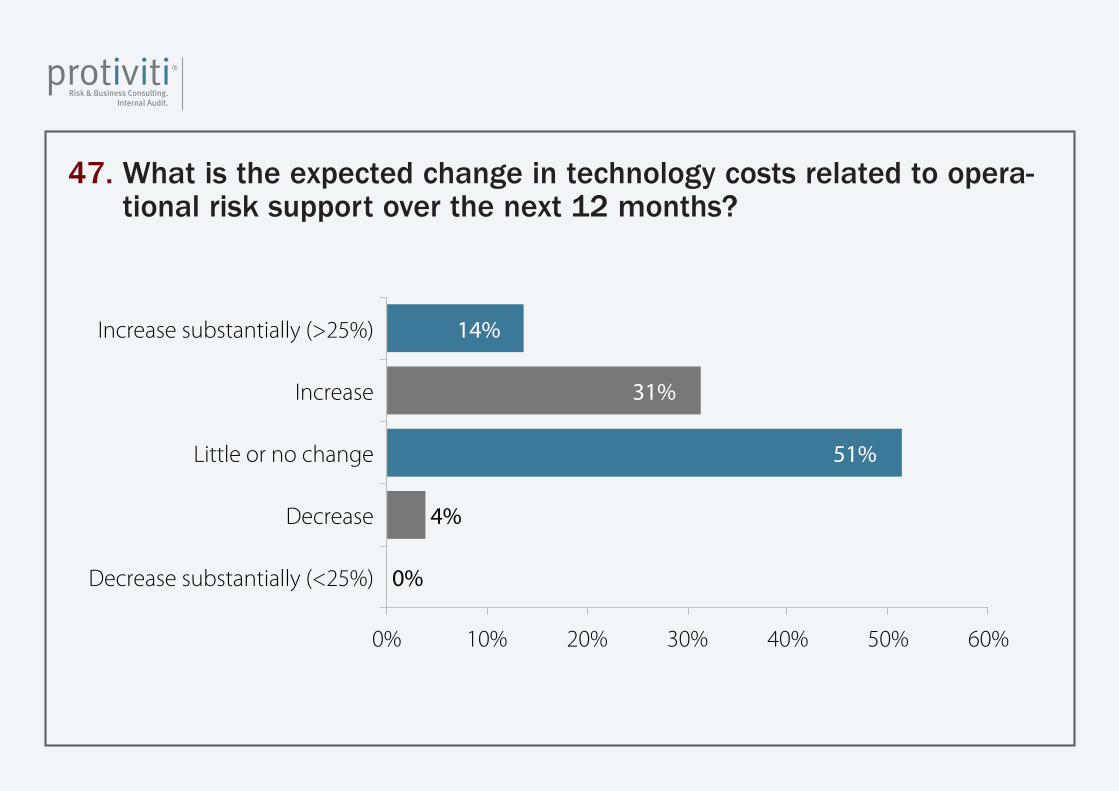
14%
31%
51%
4%
0%
0% 10% 20% 30% 40% 50% 60%
Increase substantially (>25%)
Increase
Little or no change
Decrease
Decrease substantially (<25%)
47. What is the expected change in technology costs related to opera-tional risk support over the next 12 months?
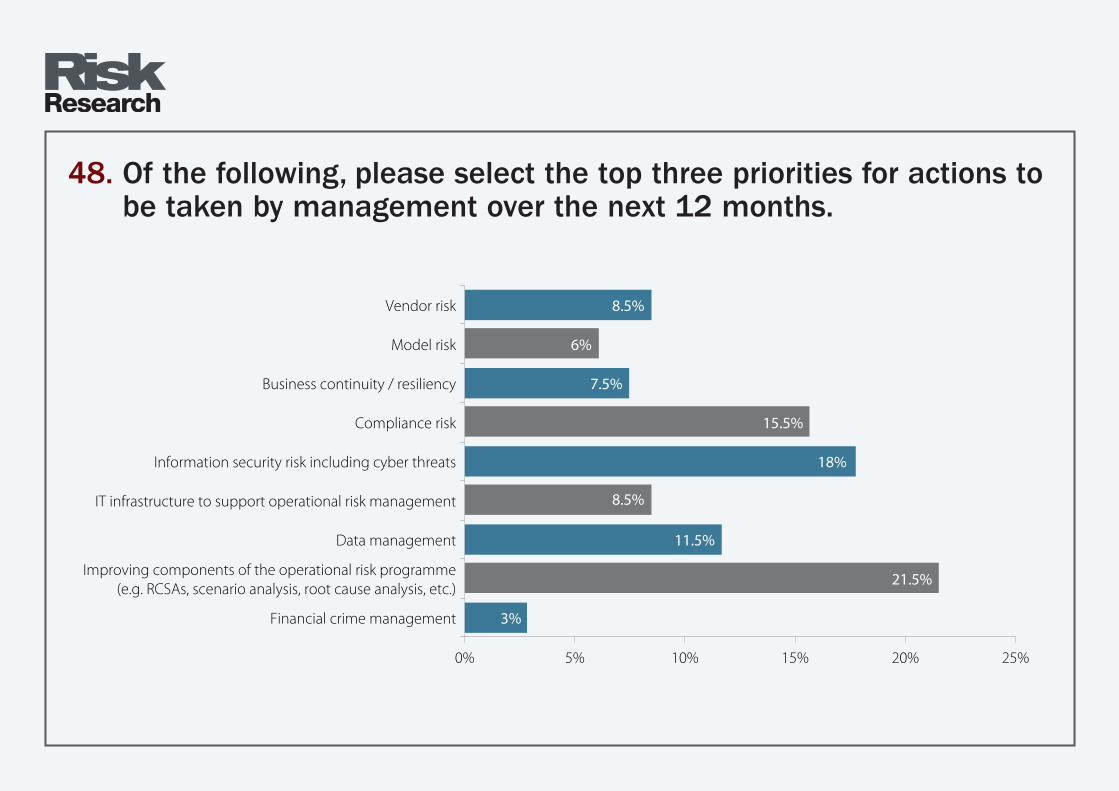
8.5%
6%
7.5%
15.5%
18%
8.5%
11.5%
21.5%
3%
0% 5% 10% 15% 20% 25%
Vendor risk
Model risk
Business continuity / resiliency
Compliance risk
Information security risk including cyber threats
IT infrastructure to support operational risk management
Data management
Improving components of the operational risk programme(e.g. RCSAs, scenario analysis, root cause analysis, etc.)
Financial crime management
48. Of the following, please select the top three priorities for actions to be taken by management over the next 12 months.
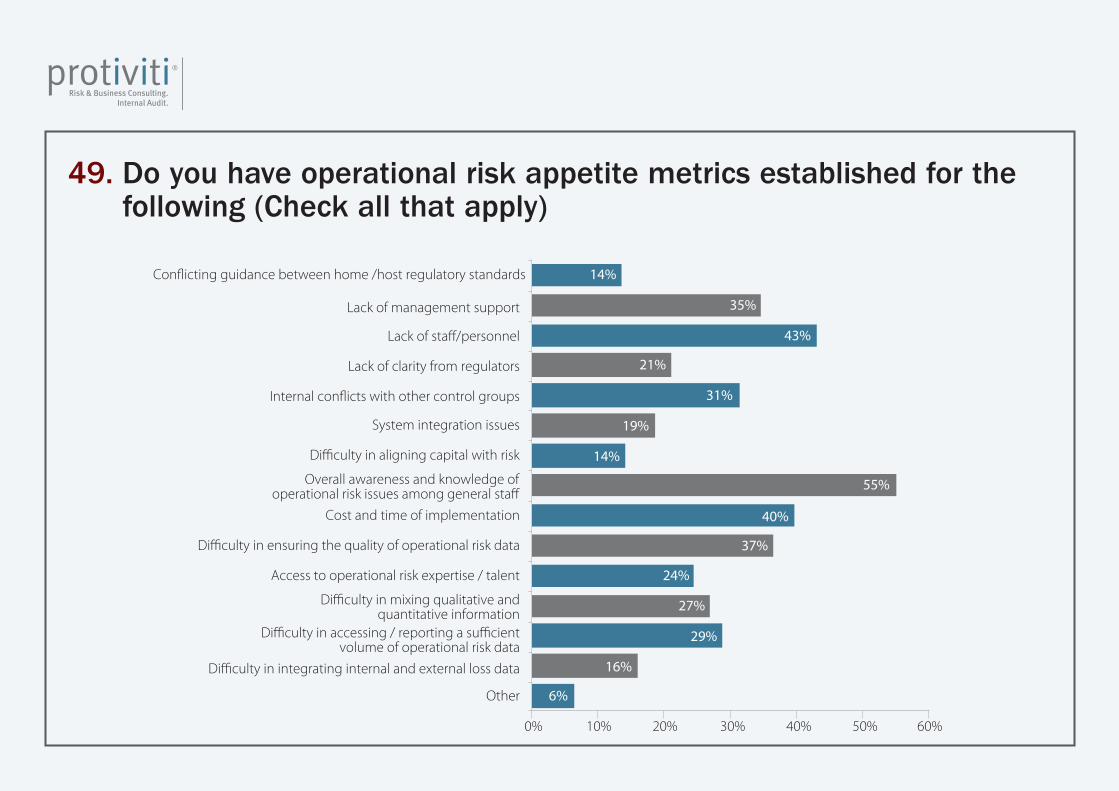
14%
35%
43%
21%
31%
19%
14%
55%
40%
37%
24%
27%
29%
16%
6%
0% 10% 20% 30% 40% 50% 60%
Conflicting guidance between home /host regulatory standards
Lack of management support
Lack of staff/personnel
Lack of clarity from regulators
Internal conflicts with other control groups
System integration issues
Difficulty in aligning capital with risk
Overall awareness and knowledge ofoperational risk issues among general staff
Cost and time of implementation
Difficulty in ensuring the quality of operational risk data
Access to operational risk expertise / talent
Difficulty in mixing qualitative andquantitative information
Difficulty in accessing / reporting a sufficientvolume of operational risk data
Difficulty in integrating internal and external loss data
Other
49. Do you have operational risk appetite metrics established for the following (Check all that apply)
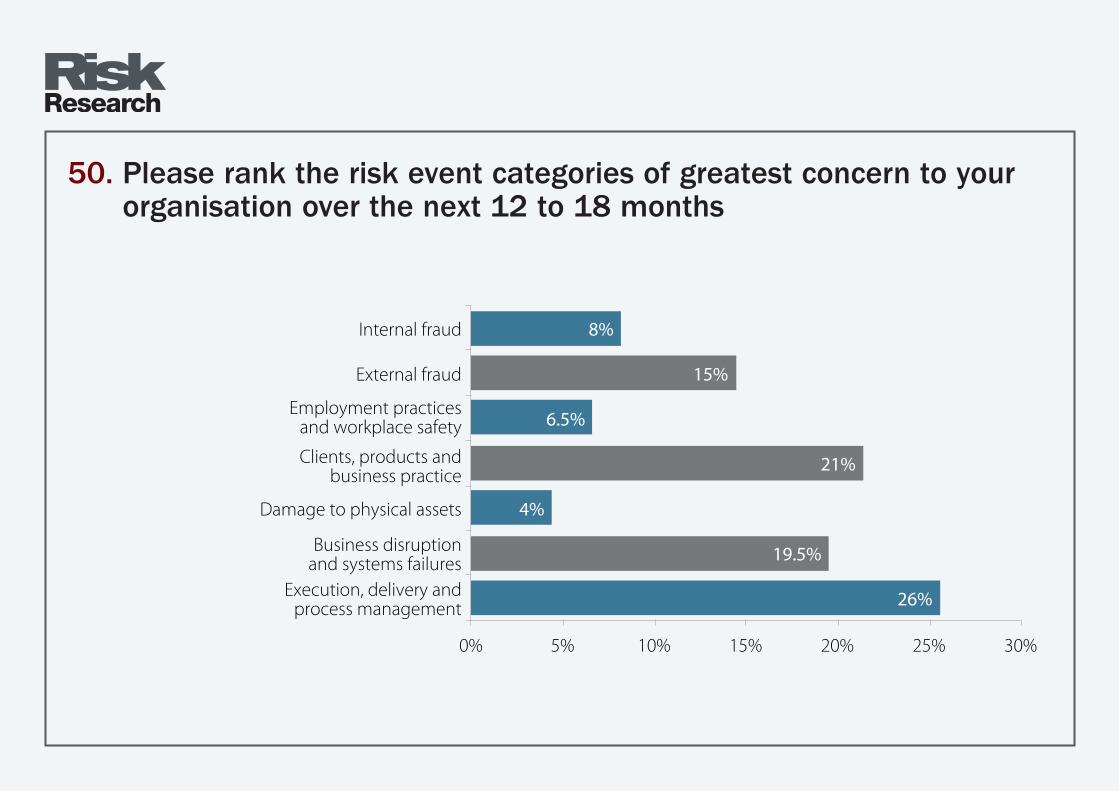
8%
15%
6.5%
21%
4%
19.5%
26%
0% 5% 10% 15% 20% 25% 30%
Internal fraud
External fraud
Employment practicesand workplace safety
Clients, products andbusiness practice
Damage to physical assets
Business disruptionand systems failures
Execution, delivery andprocess management
50. Please rank the risk event categories of greatest concern to your organisation over the next 12 to 18 months