STATE OF MINNESOTA DEPARTMENT OF ... - Becker County
192
STATE OF MINNESOTA DEPARTMENT OF PUBLIC SAFETY 2013 BUREAU OF CRIMINAL APPREHENSION MINNESOTA CRIMINAL JUSTICE INFORMATION SERVICES UNIFORM CRIME REPORT
-
Upload
khangminh22 -
Category
Documents
-
view
2 -
download
0
Transcript of STATE OF MINNESOTA DEPARTMENT OF ... - Becker County

STATE OF MINNESOTA DEPARTMENT OF PUBLIC
SAFETY
2013
BUREAU OF CRIMINAL APPREHENSION MINNESOTA CRIMINAL JUSTICE INFORMATION SERVICES
UNIFORM CRIME REPORT


State of Minnesota Minnesota Crime Information - 2013
Ramona L. Dohman Commissioner
Minnesota Department of Public Safety
Wade Setter Superintendent
Bureau of Criminal Apprehension
Dana Gotz Executive Director
Minnesota Justice Information Services
Kathryn A. Surridge Editor-UCR Progrma Manager
Minnesota Justice Information Services
Kim Lacek Cover Design
Prepared by:
Minnesota Department of Public Safety Bureau of Criminal Apprehension
Minnesota Justice Information Services 1430 Maryland Avenue East St. Paul, Minnesota 55106
Visit our website at https://dps.mn.gov Crime Book location: https://dps.mn.gov/divisions/bca/bca-divisions/mnjis/Pages/uniform-crime-reports.aspx
i
PREFACE
In 1935, the Bureau of Criminal Apprehension was given the responsibility to collect activity information from the law enforcement agencies throughout the State of Minnesota. Biennially, reports were completed and forwarded to the concerned parties as required by State Statute. In 1972, the publications began to be printed annually. This report measures the amount of criminal activity within the State as collected and prepared from data submitted by individual law enforcement agencies. The criminal activity consists of measurements involving offenses, clearances, and arrests. Along with the collection of crime statistics, other statutory requirements are included in this publication. Among those requirements are sections that provide information on the number of law enforcement officers killed or assaulted; firearms discharges by police officers; missing children reports; police pursuits, and bias offenses.
Limited information is also available on law enforcement personnel. Comparisons with previous years’ statistics will be presented for trend changes that might be of use to the evaluator. Individual comparisons on specific measurements will be left to the evaluator for use as required by the individual's need. The Minnesota Uniform Crime Report – 2013 publication is compiled from crime statistics that were provided by Minnesota’s police and sheriffs. Notations are provided on Table 46, Offenses, Clearances, Percent Cleared and Crime Rate by Agency-2013, and agencies not submitting 12 months worth of data. Any comparisons with previous years should be viewed with caution. The Minnesota Department of Public Safety, Bureau of Criminal Apprehension wishes to express its thanks to the cooperating law enforcement agencies whose assistance provide the success of this publication.
NOTICE
The data presented in this report are those submitted by law enforcement agencies in Minnesota. Each agency is responsible for the accuracy, completeness and timeliness of the data the agency chooses to submit. Agency policy on what to submit for certain types of incidents may vary and those variances are reflected in the data and statistics presented. The submitted data are used to create the statistics presented in this report.
ii

TABLE OF CONTENTS Page
LAW ENFORCEMENT AGENCIES CONTRIBUTING ...................................................................................................... 1 CRIME INFORMATION....................................................................................................................................................... 2 Background (MN State Statutes 299C.05, 299C.06, 299C.12) .................................................................................................. 2 Goals and Objectives ............................................................................................................................................................... 2 Reporting Procedures .............................................................................................................................................................. 3 Crime Factors ......................................................................................................................................................................... 4 Flow Chart of the CJRS/UCR in Minnesota .............................................................................................................................. 6 A Description of Uniform Crime Reporting Offenses and Their Classifications .......................................................................... 7 MINNESOTA OFFENSE INFORMATION ........................................................................................................................ 10 Minnesota Crime Index Information....................................................................................................................................... 10 2013 Statewide Overview ...................................................................................................................................................... 10 Crimes of Violence ............................................................................................................................................................ 13 Criminal Homicide - Murder ............................................................................................................................................. 14 Forcible Rapes - Including Attempts ................................................................................................................................... 24 Robbery ........................................................................................................................................................................... 25 Aggravated Assault ........................................................................................................................................................... 27 Crimes Against Property ................................................................................................................................................... 28 Burglary ........................................................................................................................................................................... 29 Larceny ............................................................................................................................................................................ 32 Motor Vehicle Theft ......................................................................................................................................................... 35 Arson................................................................................................................................................................................ 37 2013 Crime Index for Population Groups - Sheriff's Departments ............................................................................................ 38 2013 Crime Index for Population Groups - Municipal Police Departments ............................................................................... 39 Minnesota Property Crime Value Information-2013 ............................................................................................................... 40 Additional Statewide Offense Information .............................................................................................................................. 43 MINNESOTA ARREST INFORMATION .......................................................................................................................... 57 General Arrest Information .................................................................................................................................................... 57 2013 Arrests by Agency ........................................................................................................................................................ 63 Narcotic Arrest Information ................................................................................................................................................... 74 URBAN-RURAL AND REGIONAL INFORMATION ....................................................................................................... 83 Comparison of Urban-Rural Offenses/Arrests for 2013 ........................................................................................................... 83 Crime Offenses and Arrests for State Judicial Districts ............................................................................................................ 91 MINNESOTA LAW ENFORCEMENT EMPLOYEE INFORMATION ............................................................................ 95
LAW ENFORCEMENT OFFICERS KILLED OR ASSAULTED .................................................................................... 107
LAW ENFORCEMENT OFFICERS FIREARMS DISCHARGES (MN State Statute 626.553) ....................................... 113
POLICE PURSUITS (MN State Statute 626.5532) ............................................................................................................. 118
BIAS MOTIVATED CRIMES (MN State Statute 626.5531) .............................................................................................. 128
MINNESOTA MISSING PERSONS REPORT (MN State Statute 299C.52) .................................................................... 136
COUNTY AND MUNICIPAL LAW ENFORCEMENT AGENCY OFFENSE INFORMATION .................................... 139
APPENDIX A: GLOSSARY............................................................................................................................................... 183
Also available on-line at https://dps.mn.gov Crime Book https://dps.mn.gov/divisions/bca/bca-divisions/mnjis/Pages/uniform-crime-reports.aspx
iii
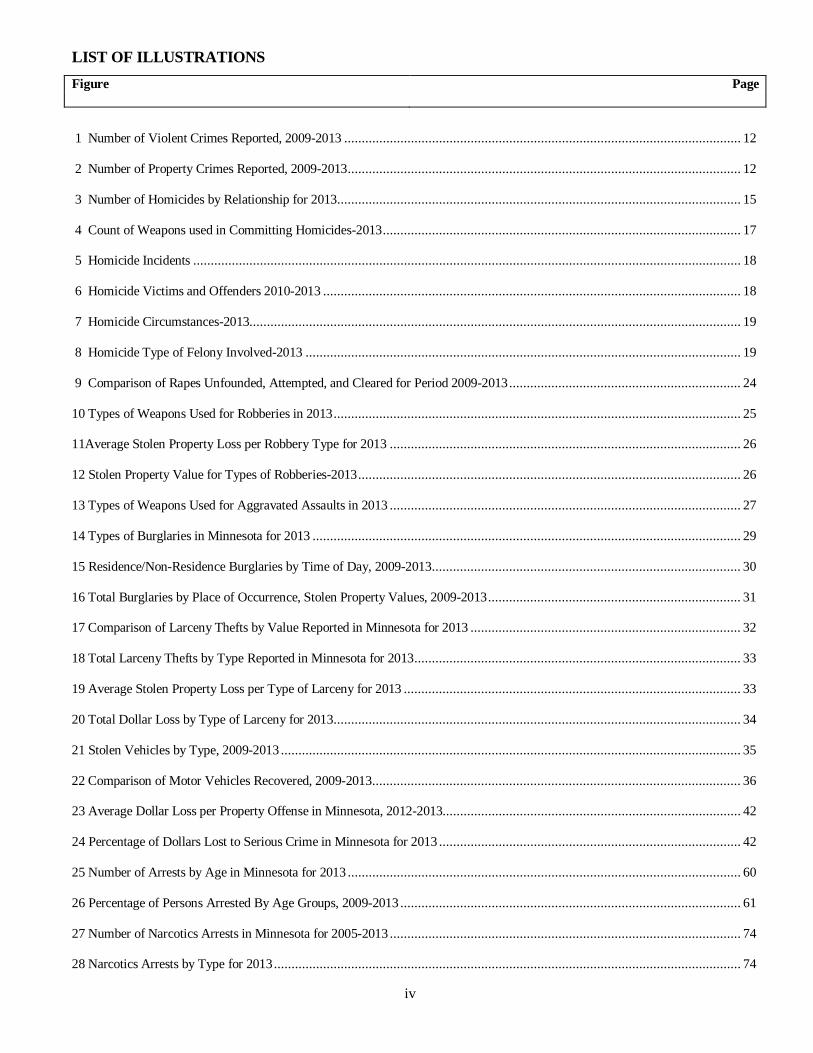
LIST OF ILLUSTRATIONS Figure Page
1 Number of Violent Crimes Reported, 2009-2013 ................................................................................................................. 12
2 Number of Property Crimes Reported, 2009-2013 ................................................................................................................ 12
3 Number of Homicides by Relationship for 2013 ................................................................................................................... 15
4 Count of Weapons used in Committing Homicides-2013 ...................................................................................................... 17
5 Homicide Incidents ............................................................................................................................................................ 18
6 Homicide Victims and Offenders 2010-2013 ....................................................................................................................... 18
7 Homicide Circumstances-2013............................................................................................................................................ 19
8 Homicide Type of Felony Involved-2013 ............................................................................................................................ 19
9 Comparison of Rapes Unfounded, Attempted, and Cleared for Period 2009-2013 .................................................................. 24
10 Types of Weapons Used for Robberies in 2013 .................................................................................................................... 25
11Average Stolen Property Loss per Robbery Type for 2013 .................................................................................................... 26
12 Stolen Property Value for Types of Robberies-2013 ............................................................................................................. 26
13 Types of Weapons Used for Aggravated Assaults in 2013 .................................................................................................... 27
14 Types of Burglaries in Minnesota for 2013 .......................................................................................................................... 29
15 Residence/Non-Residence Burglaries by Time of Day, 2009-2013 ........................................................................................ 30
16 Total Burglaries by Place of Occurrence, Stolen Property Values, 2009-2013 ........................................................................ 31
17 Comparison of Larceny Thefts by Value Reported in Minnesota for 2013 ............................................................................. 32
18 Total Larceny Thefts by Type Reported in Minnesota for 2013 ............................................................................................. 33
19 Average Stolen Property Loss per Type of Larceny for 2013 ................................................................................................ 33
20 Total Dollar Loss by Type of Larceny for 2013 .................................................................................................................... 34
21 Stolen Vehicles by Type, 2009-2013 ................................................................................................................................... 35
22 Comparison of Motor Vehicles Recovered, 2009-2013 ......................................................................................................... 36
23 Average Dollar Loss per Property Offense in Minnesota, 2012-2013..................................................................................... 42
24 Percentage of Dollars Lost to Serious Crime in Minnesota for 2013 ...................................................................................... 42
25 Number of Arrests by Age in Minnesota for 2013 ................................................................................................................ 60
26 Percentage of Persons Arrested By Age Groups, 2009-2013 ................................................................................................. 61
27 Number of Narcotics Arrests in Minnesota for 2005-2013 .................................................................................................... 74
28 Narcotics Arrests by Type for 2013 ..................................................................................................................................... 74
iv

29 State of Minnesota Judicial Districts .................................................................................................................................... 92
30 Law Enforcement Officers Killed or Assaulted By type of Weapon-2013 ............................................................................ 111
31 Law Enforcement Officers Killed or Assaulted By type of Activity-2013 ............................................................................ 111
32 Law Enforcement Officers Killed or Assaulted By Type of Assignment-2013 ..................................................................... 112
33 Law Enforcement Officers Killed or Assaulted By Time of Incident-2013........................................................................... 112
34 Firearms Discharge Line of Duty Incident Injuries Results of Shots Fired – 2013 ................................................................ 114
35 Firearms Discharge Shots Fired By Agency Activity and Weapon Type–2013 .................................................................... 115
36 Firearms Discharge Shots Fired by Level of Incident-2013 ................................................................................................. 115
37 Initiating Agency-Reason for Pursuit Initiation-2013 .......................................................................................................... 120
38 Assisting Agency-Reason for Pursuit Initiation–2013 ......................................................................................................... 120
39 Reason for Pursuit Termination – 2013 .............................................................................................................................. 121
40 Number of Pursuits by Time of Day - 2013........................................................................................................................ 122
41 Number of Pursuits by Duration – 2013 ............................................................................................................................. 122
v
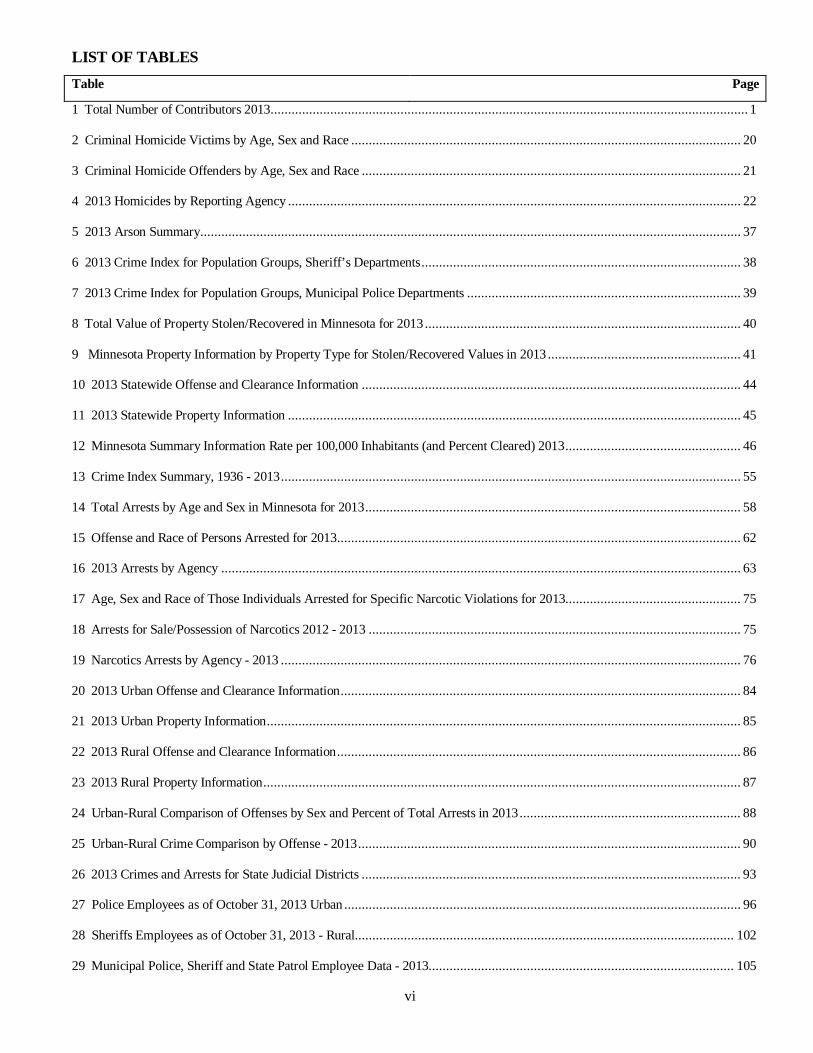
LIST OF TABLES
Table Page
1 Total Number of Contributors 2013 ........................................................................................................................................ 1
2 Criminal Homicide Victims by Age, Sex and Race ............................................................................................................... 20
3 Criminal Homicide Offenders by Age, Sex and Race ............................................................................................................ 21
4 2013 Homicides by Reporting Agency ................................................................................................................................. 22
5 2013 Arson Summary .......................................................................................................................................................... 37
6 2013 Crime Index for Population Groups, Sheriff’s Departments ........................................................................................... 38
7 2013 Crime Index for Population Groups, Municipal Police Departments .............................................................................. 39
8 Total Value of Property Stolen/Recovered in Minnesota for 2013 .......................................................................................... 40
9 Minnesota Property Information by Property Type for Stolen/Recovered Values in 2013 ....................................................... 41
10 2013 Statewide Offense and Clearance Information ............................................................................................................ 44
11 2013 Statewide Property Information ................................................................................................................................. 45
12 Minnesota Summary Information Rate per 100,000 Inhabitants (and Percent Cleared) 2013 .................................................. 46
13 Crime Index Summary, 1936 - 2013 ................................................................................................................................... 55
14 Total Arrests by Age and Sex in Minnesota for 2013 ........................................................................................................... 58
15 Offense and Race of Persons Arrested for 2013 ................................................................................................................... 62
16 2013 Arrests by Agency .................................................................................................................................................... 63
17 Age, Sex and Race of Those Individuals Arrested for Specific Narcotic Violations for 2013.................................................. 75
18 Arrests for Sale/Possession of Narcotics 2012 - 2013 .......................................................................................................... 75
19 Narcotics Arrests by Agency - 2013 ................................................................................................................................... 76
20 2013 Urban Offense and Clearance Information .................................................................................................................. 84
21 2013 Urban Property Information ....................................................................................................................................... 85
22 2013 Rural Offense and Clearance Information ................................................................................................................... 86
23 2013 Rural Property Information ........................................................................................................................................ 87
24 Urban-Rural Comparison of Offenses by Sex and Percent of Total Arrests in 2013 ............................................................... 88
25 Urban-Rural Crime Comparison by Offense - 2013 ............................................................................................................. 90
26 2013 Crimes and Arrests for State Judicial Districts ............................................................................................................ 93
27 Police Employees as of October 31, 2013 Urban ................................................................................................................. 96
28 Sheriffs Employees as of October 31, 2013 - Rural............................................................................................................ 102
29 Municipal Police, Sheriff and State Patrol Employee Data - 2013....................................................................................... 105
vi

30 Rate of Police Employees (Sworn and Civilian) Per 1,000 Inhabitants - 2013 ...................................................................... 105
31 State Patrol Employees - 2013 .......................................................................................................................................... 106
32 Law Enforcement Officers Killed or Assaulted Summary - 2013 ........................................................................................ 108
33 Law Enforcement Officers Killed or Assaulted – 2013 by Agency ...................................................................................... 109
34 Minnesota Firearms Discharge Summary Report by Agency Activity and Shots Fired-2013 ................................................. 114
35 Minnesota Firearms Discharge Summary Report by Time of Occurrence and Agency-2013 ................................................. 116
36 Firearms Discharges by Agency - 2013 ............................................................................................................................. 117
37 Pursuit Report Summary - 2013 ........................................................................................................................................ 119
38 Pursuit Report Summary by Agency – 2013 ...................................................................................................................... 123
39 Bias Offense Summary - 2011 -2013 Discrimination Motivation type per victim ................................................................. 129
40 Bias Offense Summary – 2011-2013 UCR Offense Committed in Bias Incidents................................................................. 130
41 Bias Offense Summary – 2011-2013 Bias Situation occurring in Bias Incidents................................................................... 130
42 Bias Offense Summary-2011-2013 Places of Occurrence by Incident .................................................................................. 131
43.1 Bias Offense Victim Information 2011-2013 .................................................................................................................. 132
43.2 Bias Offense Offender Information 2011-2013 ................................................................................................................ 133
44 Bias Incidents by Agency and Motivation Type-2013......................................................................................................... 134
45 Missing Persons Report 2013 ............................................................................................................................................ 139
46 Offenses, Clearances, Percent Cleared and Crime Rate per 100,000 by Agency, 2013 ......................................................... 140
vii
1
LAW ENFORCEMENT AGENCIES CONTRIBUTING
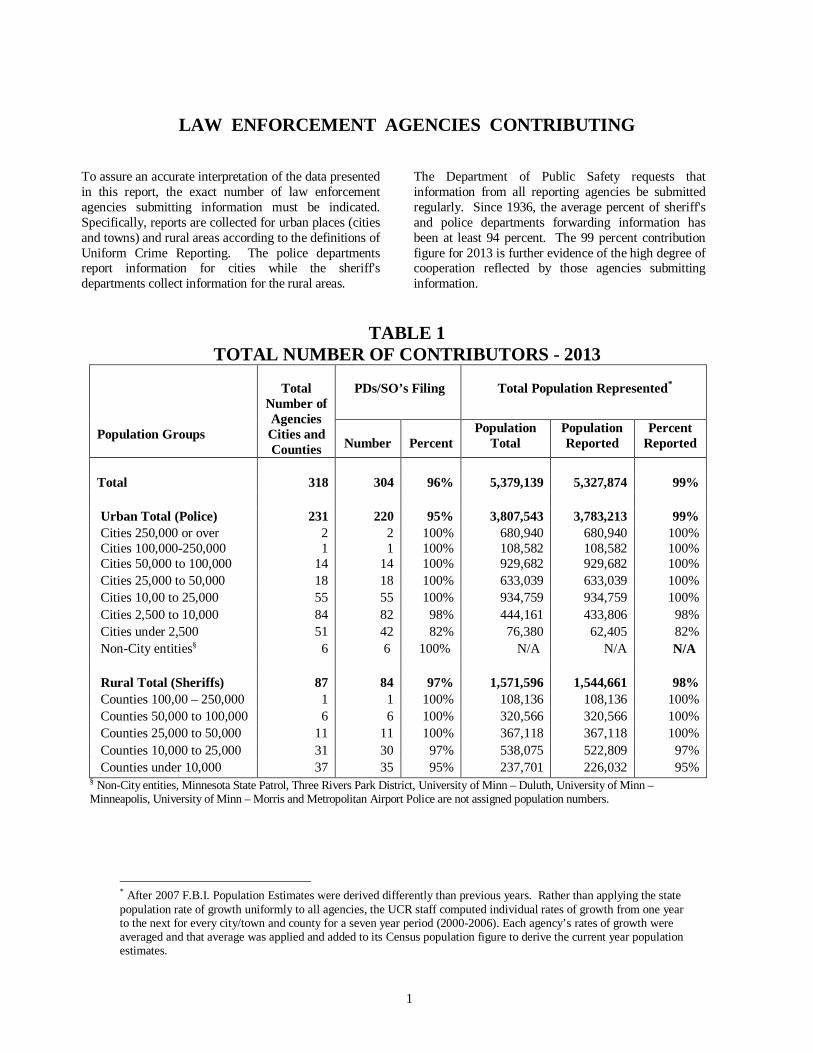
To assure an accurate interpretation of the data presented in this report, the exact number of law enforcement agencies submitting information must be indicated. Specifically, reports are collected for urban places (cities and towns) and rural areas according to the definitions of Uniform Crime Reporting. The police departments report information for cities while the sheriff's departments collect information for the rural areas.
The Department of Public Safety requests that information from all reporting agencies be submitted regularly. Since 1936, the average percent of sheriff's and police departments forwarding information has been at least 94 percent. The 99 percent contribution figure for 2013 is further evidence of the high degree of cooperation reflected by those agencies submitting information.
TABLE 1 TOTAL NUMBER OF CONTRIBUTORS - 2013
Population Groups
Total
Number of Agencies Cities and Counties
PDs/SO’s Filing
Total Population Represented*
Number
Percent
Population Total
Population Reported
Percent Reported
Total 318 304 96% 5,379,139 5,327,874 99%
Urban Total (Police) 231 220 95% 3,807,543 3,783,213 99% Cities 250,000 or over Cities 100,000-250,000
2 1
2 1
100% 100%
680,940 108,582
680,940 108,582
100% 100%
Cities 50,000 to 100,000 14 14 100% 929,682 929,682 100% Cities 25,000 to 50,000 18 18 100% 633,039 633,039 100% Cities 10,00 to 25,000 55 55 100% 934,759 934,759 100% Cities 2,500 to 10,000 84 82 98% 444,161 433,806 98% Cities under 2,500 51 42 82% 76,380 62,405 82% Non-City entities§ 6 6 100% N/A N/A N/A
Rural Total (Sheriffs) 87 84 97% 1,571,596 1,544,661 98% Counties 100,00 – 250,000 1 1 100% 108,136 108,136 100% Counties 50,000 to 100,000 6 6 100% 320,566 320,566 100% Counties 25,000 to 50,000 11 11 100% 367,118 367,118 100% Counties 10,000 to 25,000 31 30 97% 538,075 522,809 97% Counties under 10,000 37 35 95% 237,701 226,032 95%
§ Non-City entities, Minnesota State Patrol, Three Rivers Park District, University of Minn – Duluth, University of Minn – Minneapolis, University of Minn – Morris and Metropolitan Airport Police are not assigned population numbers.
* After 2007 F.B.I. Population Estimates were derived differently than previous years. Rather than applying the state population rate of growth uniformly to all agencies, the UCR staff computed individual rates of growth from one year to the next for every city/town and county for a seven year period (2000-2006). Each agency’s rates of growth were averaged and that average was applied and added to its Census population figure to derive the current year population estimates.

2
CRIME INFORMATION
BACKGROUND The State of Minnesota, since 1936, has participated in the FBI's Uniform Crime Reporting Program. The statistics that have been generated each year are not only of vital concern to national figures, but are equally important to the State as a whole. In 1972, Minnesota began collecting crime related data as part of a computerized statewide Criminal Justice Reporting System program. The benefits derived from such an automated program are indicated in a modernistic approach to the collection of Uniform Crime Reports. The responsibility and authority for collecting and disseminating the UCR information was mandated to the Bureau of Criminal Apprehension through applicable State Statutes. The State Statutes are as follows: MINNESOTA STATE STATUTES,CHAPTER 299C 299C.05 DIVISION OF CRIMINAL STATISTICS. There is hereby established within the bureau a division of criminal statistics, and the superintendent, within the limits of membership herein prescribed, shall appoint a qualified statistician and one assistant to be in charge thereof. It shall be the duty of this division to collect, and preserve as a record of the bureau, information concerning the number and nature of offenses known to have been committed in the state, of the legal steps taken in connection therewith from the inception of the complaint to the final discharge of the defendant and such other information as may be useful in the study of crime and administration of justice. The information so collected and preserved shall include such data as may be requested by the United States Department of Justice, at Washington, under its national system of crime reporting. To the extent possible, the superintendent must utilize a nationally recognized system or standard approved by the Federal Bureau of Investigation to collect and preserve crime data. 299C.06 DIVISION POWERS AND DUTIES; LOCAL OFFICERS TO COOPERATE. It shall be the duty of all sheriff's, chiefs of police, city marshals, constables, prison wardens, superintendents of insane hospitals, reformatories and correctional schools, probation and parole officers, school attendance officers, coroners, county attorneys, court clerks, the liquor control commissioner, the commissioner of highways, and the state fire marshal to furnish to the division statistics and information regarding the number of crimes reported and discovered, arrests made, complaints, information and indictments filed and the disposition
made of same, pleas, convictions, acquittals, probation granted or denied, conditional release information, receipts, transfers, and discharges to and from prisons, reformatories, correctional schools and other institutions, paroles granted and revoked, commutation of sentences and pardons granted and rescinded, and all other data useful in determining the cause and amount of crime in this state and to form a basis for the study of crime, police methods, court procedure, and penal problems. Such statistics and information shall be furnished upon the request of the division and upon such forms as may be prescribed and furnished by it. Unless otherwise required or permitted by the superintendent of the Bureau of Criminal Apprehension, an agency or person furnishing information under this section must utilize a nationally recognized system or standard approved by the Federal Bureau of Investigation for reporting statistics and information. The division shall have the power to inspect and prescribe the form and substance of the records kept by those officials from which the information is so furnished. 299C.12 RECORDS KEPT BY PEACE OFFICERS; REPORTS. Every peace officer shall keep or cause to be kept a permanent written record, in such form as the superintendent may prescribe, of all felonies reported to or discovered by him within his jurisdiction and of all warrants of arrest for felonies and search warrants issued to him in relation to the commission of felonies, and shall make or cause to be made to the sheriff of the county and the bureau, reports of all such crimes, upon such forms as the superintendent may prescribe, including a statement of the facts and a description of the offender, so far as known, the offender's method of operation, the action taken by the officer, and such other information as the superintendent may require. GOALS AND OBJECTIVES The primary goal of the UCR program in Minnesota is to provide statistical information on the volume and affect of crime. To better assist concerned individuals and agencies to solve the state crime problem, a more encompassing approach involving all aspects of criminal activity was needed. With this in mind, and examining the recommendations of the President's Commission on Law Enforcement and the Administration of Justice, the UCR program became one aspect of the computerized State Criminal Justice Reporting System.

3
The major objectives of Minnesota's UCR Program include: 1. Statistics on crime in Minnesota to be used by the
Governor, Legislature, Crime Control Planning Board, and other concerned individuals within the State.
2. Statistics on crime for administrative and
operational use by law enforcement administrators. 3. Statistics on specific criminal offenses to be used in
the FBI's national crime reports. 4. Statistics involving the age, sex and race of
offenders to determine the proper focus for crime prevention and enforcement.
5. Statistics on crime for researchers to assist in the
formation of the causes of crime within a biological, sociological and/or psychological framework.
6. Statistics on crime to measure the workload and
effectiveness of the 'current' state criminal justice system.
7. Statistics on crime for personnel employed by the
criminal justice system to help assist them in improving the efficiency and performance of criminal justice agencies.
REPORTING PROCEDURES Through Minnesota's crime reporting statutes, participating Minnesota Law Enforcement Agencies are required to submit information as determined by the Department of Public Safety. The required information is tallied from the individual agency's internal record of complaints, investigations, miscellaneous reports and arrests. To help achieve a uniformity of reporting throughout the State, a copy of the FBI's Uniform Crime Reporting Handbook is offered to each agency. In conjunction with the manuals, numerous training sessions in record and report writing and filing are offered to each agency by field representatives of the Department of Public Safety. Individual contact with agencies experiencing difficulty in any phase of the Criminal Justice Reporting System is also offered by the field representatives. Verification for authenticity of reports that are submitted are handled by staff at the Department of Public Safety or by a special "edit" program written into the computerized Criminal Justice Reporting System. Inconsistencies of report information and minor errors are corrected by telephone or terminal
contact. Major errors in UCR reporting methods are handled exclusively by field representatives. The Department of Public Safety, along with the FBI, has established their specific program to measure criminal data activity for both state and federal purposes. The result is a tabulation of the number and type of offenses committed, cases cleared or solved, and the persons arrested. A criminal act may involve several crimes, several persons, and several victims; but all that is necessary for such an act to be reported and recorded by the state and federal programs is one violation. If a given criminal act involves more than one offense, only the more serious offense is counted. "Clearance by arrest" indicates that at least one person was arrested. It does not preclude the fact others may have also been involved in the offense. Any additional arrests are purely supplemental and are used for each department's record purposes only and not reported under the program. Another part of criminal data collection involves juvenile offenses and arrests. When reviewing such data it should be remembered that many times juvenile offenses are handled informally within the different agencies and therefore go unreported. In cases where an offense involves both adults and juveniles, and subsequent arrests are made of both, the crime reporting program will indicate this offense to be cleared by the arrest of the adult. Juvenile arrests are used for clearance purposes only in those instances where juveniles alone are involved. Clearing an offense by the arrest of a person(s) is but one means of indicating such activity. Another involves the clearing of a reported offense by use of the term "exceptionally cleared". An exceptional clearance exists when some element beyond law enforcement action prevents formal charges against the offender. Such a situation might arise if: 1. The offender commits suicide. 2. A double murder occurs (two persons kill each
other). 3. The offender dies after making a confession
(dying declaration). 4. The offender is killed by a law enforcement
officer. 5. The offender confesses to committing the crime
while already in custody for another crime or serving a sentence.

4
6. The offender is prosecuted in another city for a
different crime by federal, state, or local authorities, or for the same offense, and the other jurisdiction refuses to release the offender.
7. Another jurisdiction refuses to extradite the
offender. 8. The victim of a crime refuses to cooperate in the
prosecution. 9. The offender is prosecuted for a less serious charge
than the one for which he was arrested. 10. The offender is a juvenile who is handled by a
verbal or written notice to the parents in instances involving minor offenses.
The count of offenses is taken from the record of complaints received by law enforcement agencies from victims, witnesses, other sources or discovered by them during their own operation. Complaints determined by subsequent investigation to be unfounded are eliminated from the court. The resulting number of "offenses actually known to law enforcement agencies" for each crime offense category is reported without regard to whether anyone is arrested, stolen property is recovered, local prosecutive policy, or any other consideration. Reported offenses are recorded by the municipality and county in which they occur, rather than to the agency which may investigate, arrest, or otherwise in some manner dispose of the case. Municipal law enforcement agencies report those crimes which occur in the counties outside the city. Law enforcement agencies also report on a periodic basis, supplemental offense information such as the value of property stolen and recovered as well as circumstances surrounding homicides. Additional reports of persons arrested are submitted. These reports provide information concerning the age, sex and race of persons arrested by each individual law enforcement agency. Reports of persons arrested are separated as to adults and juveniles. Crime data and information submitted by municipal and county law enforcement agencies is collected on a daily and semi-daily basis under the Minnesota Criminal Justice Reporting System program. Once received, it is processed and disseminated for use in state and national reports as well as by the participating agencies themselves (see CJRS-UCR flow chart). "Crime rate" is a term often used in evaluating criminal statistics. The crime rate represents or equates the number of index crimes per 100,000 in population.
Basically, it refers to the comparison of the number of offenses with the number of potential offenses and the number of persons exposed to the risk of the offense. It does not include other variables which might affect the amount of crime within a given area. CRIME FACTORS When the current method of crime reporting is considered, several limitations in its accuracy may be immediately recognizable. Law enforcement agencies are not totally to blame because of their capability to only report that which is known to them. In may instances, the very citizens who are themselves "victims" of a crime fail to inform the law enforcement agency of their occurrence. There is a general tendency among the public to not report minor crimes that are, in their eyes, of little consequence. The public may also feel that the law enforcement agency is of little help to them. They may also feel the threat of blackmail or retaliation for participating in a sex, gambling, or narcotic offense. The public may also feel the threat of embarrassment for being involved in a crime regarded against the norms of society. Given these factors, much crime is never included in the total state evaluation of the crime problem. Another element of concern is the actual number of law enforcement agencies reporting crime information. Lack of crime information by delinquent agencies can potentially reduce the accuracy of the crime picture as developed from reported information. The term "selective reporting" also has a bearing on the crime reported by participating agencies. Selective reporting reflects only the crimes for which an agency considers important or necessary to be reported through the system. The information that is utilized from such reporting is slanted and misleading. It does not give an accurate account of the crime problem and it further discredits the time spent in reporting the "selected" activity. Such reporting is immediately recognizable from the output reports and its improper use affects all the information submitted by the contributing law enforcement agencies. Extraneous conditions beyond the realm of law enforcement also affect the measurement and analysis of crime. These conditions, or CRIME FACTORS, include but are not necessarily limited to: A. Legislative changes as to what constitutes a
criminal offense.

5
B. Density and size of the community population and the metropolitan area of which it is part.
C. Composition of the population with reference
particularly to age, sex, and race. D. Economic status and mores of the population. E. Relative stability of population including commut-
ers, seasonal and other transient types. F. Climate, including seasonal weather conditions. G. Educational, recreational, and religious character-
istics. H. Effective strength of the police force. I. Standards governing appointments to the police
force. J. Policies of each of the law enforcement agencies. K. Policies of the prosecuting officials and the courts.
L. Attitude of the public toward law enforcement problems.
M. The administrative and investigative efficiency of
the local law enforcement agency, including the degree of adherence to crime reporting standards.
Information provided in the Minnesota Crime Information 2013, is as accurate as currently available in the State. Crime and arrest statistics should be interpreted with caution when comparing different law enforcement jurisdictions. Reported crimes relate to events, while arrests relate to persons. For any one criminal act there may be multiple crimes, multiple offenders, and multiple victims. Given the above considerations the total crime picture is indeed influenced by many variables. Opponents of the Uniform Crime Reporting System are often vocal in pointing out the inadequacy of this system. Proponents respond by indicating that at the present time there is no other suitable method of collecting criminal statistics. If a better system is developed, tested, and offered as a replacement, law enforcement will not hesitate to implement it.

6
Flow ChartLaw Enforcement Uniform Crime Reporting in Minnesota
[Minnesota Statutes 299C.05, 299C.06, and 299C.12]
Publish AnnualCrime in Minnesota
Publish Annual FBI UCR Crime Reports
Create State Reports
MN L.E. Agency Direct Contributors
MN L.E. Agency Non-direct
Contributors
State Criminal Justice Reporting Systems
Process Federal Crime
Statistics
Crime in the United States
Law Enforcement Officers Killed or
Assaulted
Hate Crimes Statistics
Uniform Crime Report
Process Minnesota
Crime Statistics
Return “A” Offenses and Clearances
Supplement to Return “A” Property
Information
Age, Sex & Race of Offenders
Arrested
LEOKALaw Enforcement Officers Killed or
Assaulted
Arson
Bias/HateCrimes
UCR Reportsfor FBI
Pursuits Firearms Discharge
Supplemental Homicide
Minnesota Department of Public SafetyBureau of Criminal Apprehension
Federal Bureau of Investigation

7
A DESCRIPTION OF UNIFORM CRIME REPORTING OFFENSES AND THEIR
CLASSIFICATION The Department of Public Safety/Bureau of Criminal Apprehension, using the reporting techniques recommended by the FBI, records criminal data submitted by the many law enforcement agencies in the State. The criminal data collected contains information regarding Part I Offenses called to the attention of Minnesota Law Enforcement agencies. Part I Offenses reflect information on eight "serious" crime classifications, and it is generally referred to as the "Crime Index" measurement. Part II Offenses are represented by twenty "less serious" crime classifications. The eight crimes represented in the Part I Offenses include murder, rape, aggravated assault, robbery, burglary, larceny, motor vehicle theft, and arson. These crimes were chosen because of their uniformity of definition, total volumes, and likelihood of being reported. The crimes of murder, rape, aggravated assault, and robbery are also known as "violent crimes." The crimes of burglary, larceny, motor vehicle theft and arson are labeled as "property crimes." The law enforcement agency may become aware of these crimes in several ways; reports of its own officers, citizens complaints, notification from the prosecuting attorney and from information supplied by court officials. PART I OFFENSES (Serious Crime) Criminal Homicide - The killing of another person. a) Murder - Any unlawful killing of a human
being in which the element of malice aforethought was present in the murder.
b) Manslaughter - Any unlawful killing of a
human being without the element of malice aforethought is counted as manslaughter.
c) Death by Negligence - Any death that occurs
because of the negligence of some person other than the victim and that is not in the commission of an unlawful act. These are deaths which police investigation established as primarily caused by gross negligence.
Rape (does not include Statutory Rape).
a) Rape by Force - The carnal knowledge of a female forcibly and against her will, but excluding statutory rape and other sex offenses.
b) Assault to Rape-Attempts - All assaults and
attempts to rape. Robbery - A robbery is defined as the felonious and forcible taking of property of another against his will by violence or by putting him in fear. This includes all attempts. a) Armed Robbery-Any Weapon - When any
object is so employed as to constitute force or the threat of force, it will be considered a weapon. This would include firearms, knives, clubs, brass knuckles, blackjacks, broken bottles, acid, explosives, etc. Cases involving possible pretended weapons or cases involving weapons not seen by the victim but which the robber claims to have with him should be counted in this category.
b) Strong Arm-No Weapons - This includes
muggings and similar offenses where no weapon is used by strong-arm tactics are employed to deprive the victim of his property. This definition is limited to hands, arms, fists, feet, etc. Include all attempts.
Aggravated Assault - An Aggravated Assault is an attempt or offer with unlawful force or violence to do physical injury to another. As a general rule all assaults will be classified and scored in this category. Exclude assaults with intent to rob or rape. Excludes simple assault, assault and battery, fighting, etc. These will be scored in the appropriate category. a) Gun - Includes all assaults or attempted
assaults involving the use of any type of firearm. This includes revolvers, automatic pistols, shotguns, zip guns, pellet guns, etc.
b) Knife or Cutting Instrument - Includes all
assaults or attempted assaults involving the use of cutting or stabbing objects such as knives or razors, hatchets, axes, cleavers, scissors, glass, broken bottles, daggers, ice picks, etc.
c) Other Dangerous Weapons - Includes all
assaults or attempted assaults when an object other than a gun, knife or cutting instrument

8
is used. This includes clubs, bricks, jack handles, bottles, explosives, acid, lye, poisons, scalding water, and cases of attempted drowning and burning, etc.
d) Hands, Fists, Feet, etc. Aggravated - Includes
all assaults with hands, fists, feet, etc., which could result in an aggravated assault conviction. In order to be classified as aggravated, the victim must suffer great bodily harm.
Burglary - Breaking and Entering - Includes any unlawful entry or attempted forcible entry of any structure to commit a felony or larceny. As a general rule, score as one offense, any unlawful entry or attempted forcible entry of any dwelling, attached structure, public building, shop, factory, storehouse, apartment, house, trailer, warehouse, mill, farm, ship, railroad car, etc. For UCR purposes, breaking and entering with larceny is classified and scored only as breaking and entering. This does not include breaking and entering of motor vehicles. These are scored in the larceny category. a) Forcible Entry - Includes all offenses where
force of any kind is used to unlawfully enter a locked structure such as any of those listed above with intent to steal or commit a felony. This includes entry by use of a master key, celluloid, or other device that leaves no outward mark but is used to open a lock. Concealment inside a building followed by breaking out of the structure should also be scored here.
b) Unlawful Entry-No Force - Includes any
unlawful entry when you fail to discover any evidence of forcible entry.
c) Attempted Forcible Entry - Included in this
category only when your investigation determines that a forcible entry has been attempted.
Larceny-Theft (does not include Motor Vehicle Theft) - This category includes the unlawful taking of the property of another with intent to deprive him of ownership. This involves all larcenies and thefts resulting from pocket picking, purse snatching, shoplifting, larceny from auto, larceny of auto parts and accessories, bicycle theft, larceny from buildings, and larceny from any coin operated machines. Any theft that is not a robbery or any theft that does not result from a breaking and entering shall be scored here. Excludes embezzlements, unlawful conversions,
larceny by bailee, frauds or bad checks. Enter all attempted larcenies. Note: when the true or known value of stolen property is not available, estimates based on accepted police methods of property evaluation should be used for the purposes of Uniform Crime Reporting. Motor Vehicle Theft - This category includes larceny or attempted larceny of motor vehicles. Includes all thefts and attempted thefts of motor vehicles. This includes all vehicles which can be registered as a motor vehicle in this state. Excludes incidents in which the alleged offender had lawful access to the vehicle as in a family situation or the unauthorized use by others having lawful access to the vehicle such as chauffeur, employee, etc. Arson - Includes all arrests for violation of state law and municipal ordinances relating to arson and attempted arson. This generally includes any willful or malicious burning of a dwelling, church, college, jail, meeting house, public building, ship or other vessel, motor vehicle, aircraft, contents of building, personal property of another, goods or chattels, crops, trees, fences, gates, grain, vegetable products, lumber, woods, marshes, meadows, etc. A death resulting from arson will be classified as murder and personal injuries resulting would be classified as assaults. PART II OFFENSES (Less Serious Crime)
Other Assaults - This classification consists of all assaults and attempted assaults which are simple or minor in nature. Forgery and Counterfeiting - In this case, place all offenses dealing with the making, altering, uttering or possession with intent to defraud, anything false in a semblance of that which is true. Include altering or forging of public or other records, making, altering, forging or counterfeiting coins, plates, banknotes, checks, etc. Possessing or uttering forged or counterfeited instruments, signing the name of another or a fictitious person with intent to defraud and all attempts to commit any of the above acts. Fraud - This is defined as fraudulent conversion and obtaining money by false pretense. Include bad checks, confidence games, etc., except forgeries and counterfeiting. Embezzlement - This is the misappropriation or misapplication of money or property entrusted to one's care, custody, or control.

9
Stolen Property-Buying, Receiving, Possessing - This includes all offenses of buying, receiving, possessing, or concealing stolen property as well as all attempts to commit any of these offenses. Vandalism-Destruction of Property - This includes all willful or malicious destruction, injury, disfigurement or defacement of any public or private property, real or personal, without the consent of the owner or person having custody or control by cutting, tearing, breaking, marking, painting, drawing, covering with filth or any other such means as may be specified by law. Weapons - This classification includes violation of weapon laws such as the manufacture, sale, or possession of deadly weapons or silencers, carrying deadly weapons, aliens possessing deadly weapons, and all attempts to commit any of the above offenses.
Prostitution and Commercialized Vice - Include in this class the sex offenses of a commercialized nature such as prostitution, keeping a bawdy house, disorderly house, or house of ill repute, pandering, procuring, transporting or detaining women for immoral purposes, etc., and all attempts to commit any of the above.
Sex Offenses - This includes all sex offenses other than forcible rape, prostitution, and commercialized vice. This encompasses offenses against chastity, common decency, morals, and the like such as adultery and fornication, buggery, incest, indecent exposure, sodomy, carnal abuse (no force), and all attempts to commit any of the above. Narcotic Drug Laws - This includes all arrests for the violation of state and local ordinances, specifically those relating to the unlawful possession, sale, use, growing, manufacturing, and making of narcotic drugs.
Gambling - Includes all charges relating to promoting, permitting, or engaging in gambling.
Offenses Against Family and Children - Includes all charges of non-support, neglect, or abuse of family and children by such acts as desertion, abandonment, or non-support, neglect or abuse of a child, or nonpayment of alimony.
Driving Under the Influence - This classification is limited to driving or operating any vehicle while under the influence of liquor or narcotic drugs.
Liquor Laws - With the exception of drunkenness and driving under the influence, all state or local liquor law violations are placed in this class. Excludes federal violations, includes manufacturing, selling, transporting and furnishing as in maintaining unlawful drinking places. Bootlegging, operating a still, furnishing liquor to a minor and the using of a vehicle for illegal transportation of liquor are included. Drunkenness - No longer reported under the UCR program in Minnesota. This offense was repealed in Minnesota on July 1, 1971 (MSS 340.96; C 90, S2). Disorderly Conduct-Disturbing the Peace -This includes all disorderly persons arrested who cannot be classified under Offenses of Criminal Homicide, Forcible Rape, Drunkenness, or Vagrancy. Vagrancy - This classification indicates arrests for failure of an individual to give a good account of himself, begging, loitering, etc. All Other Offenses - Include in this class every other state or local offense not included, except traffic. This encompasses abduction and compelling to marry, abortion (death resulting from criminal abortion, according to statutes, is a criminal homicide), bastardy and concealing death of a bastard, bigamy and polygamy, blackmail and extortion, bribery, contempt of court, discrimination and unfair competition, kidnapping, offenses contributing to juvenile delinquency, perjury, possession, repair, manufacturing, etc., of burglary tools, possession or sale of obscene literature and unlawful use, possession, etc., of explosives, etc. Suspicion - This category is used for unknown incidents when the actual offense has not been determined. Curfew and Loitering Law Violation (Juvenile) - This area shows offenses relating to local curfew or loitering ordinances, where such laws exist. It is limited to juveniles taken into protective custody who have run away from the reporting jurisdiction. Runaways (Juveniles) - This classification is limited to juveniles taken into protective custody under provisions of State Statutes.

10
MINNESOTA OFFENSE INFORMATION MINNESOTA CRIME INDEX INFORMATION
Statewide Overview
Crime Index (Serious Crimes) The eight major criminal offenses are referred to as the crime index and they are used to evaluate the changes and trends in amounts of crime over designated periods of time. Following is a summary of the crime index for 2013. The crime index in Minnesota totaled • 143,566 offenses during 2013, which was a
decrease of 3.2 percent from the 148,330 offenses occurring in 2012.
• The crime rate* represented 2,652 per
100,000 in population for 2013, while in 2012 the crime rate was registered at 2,775 per 100,000 population, a 4.4 percent decrease.
• Of the total crime index offenses reported in
2013, 28 percent were cleared by arrest or exceptionally cleared. In 2012, 28 percent of the total offenses were cleared by arrest or exceptionally cleared.
• Larceny was the largest category of serious
crime reported for Minnesota in 2013 with a total of 99,794 offenses reported. Larceny was also the largest category of serious crime reported for the state in 2012 with 102,154 total offenses reported.
Violent Crimes Violent crime in Minnesota accounted for nine percent of all crime index offenses reported in 2013. There were 12,469 murders, forcible rapes, robberies, and aggravated assaults for the year. Compared with the 12,323 total violent crimes reported for 2012, the 2013 figure represents a 1.2 percent increase in violent crime for the state. The number of violent crimes for the state per 100,000 population for 2013 was 232, while in 2012 there were 231 per 100,000 population. • Murder - Offenses involving murder totaled
111 in 2013 in Minnesota compared to 92 in 2012, an increase of 21 percent.
* Minnesota crime rates per 100,000 are based on a 5,379,139 state population estimate from the F.B.I. for 2013.
• Rape - Minnesota registered 1,971 rapes in 2013 and 2,060 in 2012, a decrease of 4.0 percent.
• Robbery - There were 3,661 robberies in
Minnesota in 2013 compared to 3,450 offenses in 2012, an increase of 6.1 percent.
• Aggravated Assault - Offenses involving
aggravated assault numbered 6,726 in 2013 compared to 6,721 aggravated assaults in 2012, an increase of .07 percent.
Property Crimes Property crime in Minnesota in 2013 amounted to 91 percent of the crime index offenses for that year. There were a total of 131,097 burglaries, larcenies, motor vehicle thefts, and arsons actually reported in 2013. Compared with the 136,007 offenses reported in 2012, the 2013 figure represents a 3.6 percent decrease in property crime for the state. The number of property crimes for the state per 100,000 population for 2013 was 2,437 and in 2012 it was 2,544. • Burglary - There were 22,500 burglaries in
Minnesota in 2013 compared to 24,829 offenses in 2012, a decrease of 9.4 percent.
• Theft/Larceny - Offenses involving larcenies
in 2013 totaled 99,794 compared to 102,154 offenses in 2012, a decrease of 2.3 percent.
• Motor Vehicle Theft - In 2013 there were
7,873 offenses of motor vehicle theft in Minnesota, compared to the 8,251 offenses reported in 2012, a decrease of 4.6 percent.
• Arson - In 2013 there were 930 offenses of
arson in Minnesota, compared to the 773 offenses reported in 2012, an increase of 17 percent.

11
TOTAL ARRESTS* Law Enforcement agencies within Minnesota's 5,379,139 reporting population area accounted for 160,797 total arrests in 2013.
*Total arrests represent all arrests for adults and juveniles in either a Part I (serious) or Part II (less serious) criminal offense. An arrest in the Uniform Crime Reporting sense refers to a form of detention by depriving an individual of his personal liberties by a form of legal authority.
• ADULT ARRESTS - Arrests for adults in
2013 totaled 134,017 and in 2012 arrests equaled 138,476.
• JUVENILE ARRESTS - The total number
of juveniles arrested in 2013 for criminal offenses totaled 26,780 and in 2012 there were 32,756 juveniles arrested.

12
Figure 1 Number of Violent Crimes Reported
2009 – 2013
Figure 2
Number of Property Crimes Reported 2009-2013
69
90
73
92
111
2,22
9
2,23
0
2,08
0
2,06
0
1,97
1
3,60
7
3,36
3
3,35
9
3,45
0
3,66
1
7,13
1
6,97
8
6,36
4
6,72
1
6,72
6
0
1,000
2,000
3,000
4,000
5,000
6,000
7,000
8,000
2009 2010 2011 2012 2013
Murder
Rape
Robbery
Aggravated Assault
25,1
65
23,9
47
25,1
53
24,8
29
22,5
00
103,
695
101,
616
100,
636
102,
154
99,7
94
8,37
9
8,39
8
7,92
7
8,25
1
7,87
3
809
675
657
773
930
0
20,000
40,000
60,000
80,000
100,000
120,000
2009 2010 2011 2012 2013
Burglary
Larceny
Motor Vehicle Theft
Arson
13
14
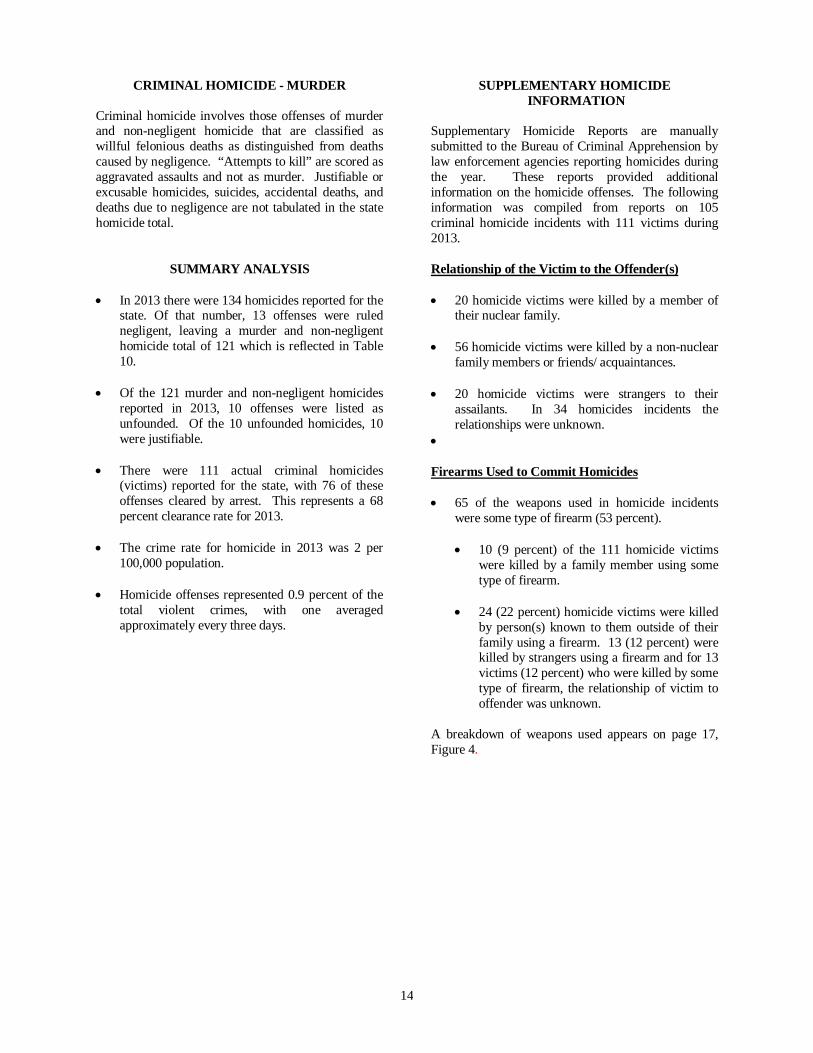
CRIMINAL HOMICIDE - MURDER Criminal homicide involves those offenses of murder and non-negligent homicide that are classified as willful felonious deaths as distinguished from deaths caused by negligence. “Attempts to kill” are scored as aggravated assaults and not as murder. Justifiable or excusable homicides, suicides, accidental deaths, and deaths due to negligence are not tabulated in the state homicide total. SUMMARY ANALYSIS • In 2013 there were 134 homicides reported for the
state. Of that number, 13 offenses were ruled negligent, leaving a murder and non-negligent homicide total of 121 which is reflected in Table 10.
• Of the 121 murder and non-negligent homicides
reported in 2013, 10 offenses were listed as unfounded. Of the 10 unfounded homicides, 10 were justifiable.
• There were 111 actual criminal homicides
(victims) reported for the state, with 76 of these offenses cleared by arrest. This represents a 68 percent clearance rate for 2013.
• The crime rate for homicide in 2013 was 2 per
100,000 population. • Homicide offenses represented 0.9 percent of the
total violent crimes, with one averaged approximately every three days.
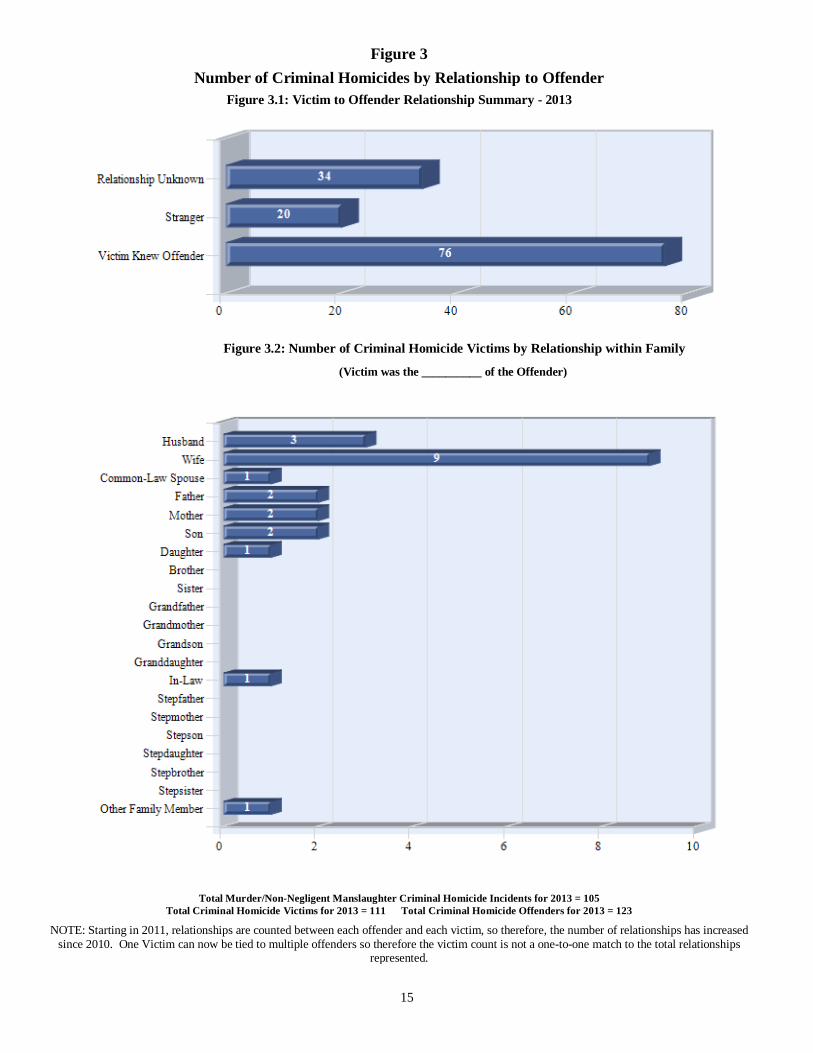
SUPPLEMENTARY HOMICIDE INFORMATION Supplementary Homicide Reports are manually submitted to the Bureau of Criminal Apprehension by law enforcement agencies reporting homicides during the year. These reports provided additional information on the homicide offenses. The following information was compiled from reports on 105 criminal homicide incidents with 111 victims during 2013. Relationship of the Victim to the Offender(s) • 20 homicide victims were killed by a member of
their nuclear family. • 56 homicide victims were killed by a non-nuclear
family members or friends/ acquaintances. • 20 homicide victims were strangers to their
assailants. In 34 homicides incidents the relationships were unknown.
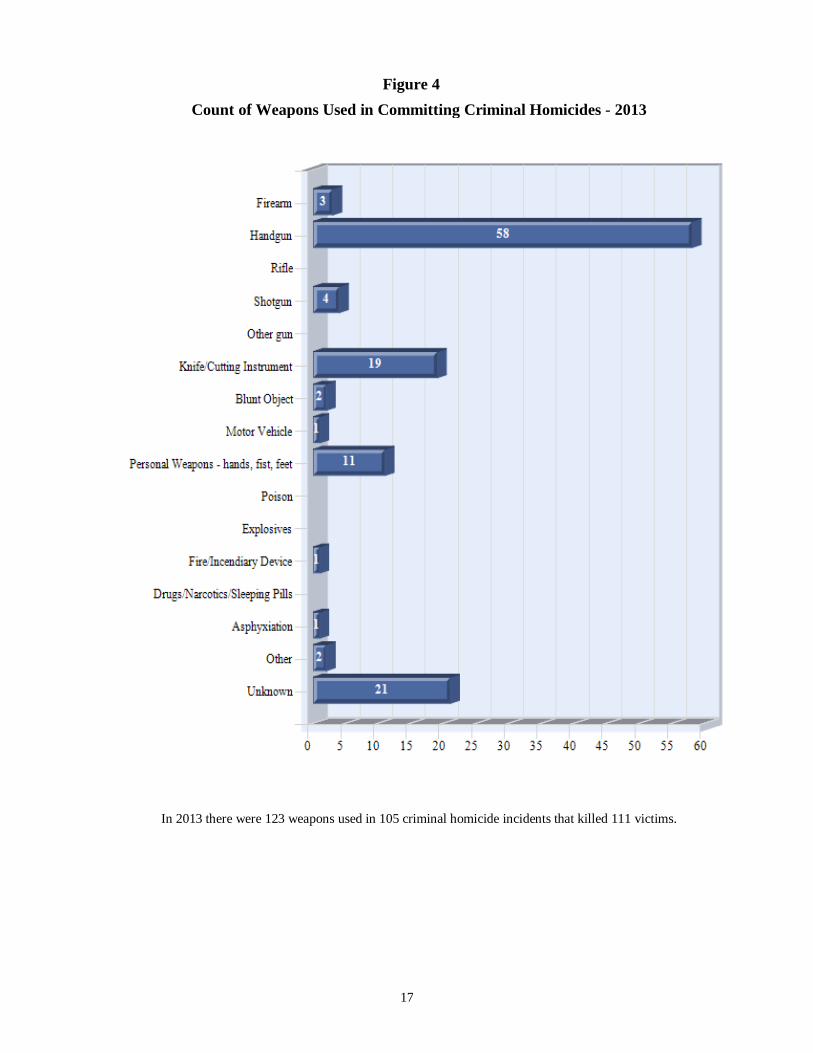
• Firearms Used to Commit Homicides • 65 of the weapons used in homicide incidents
were some type of firearm (53 percent). • 10 (9 percent) of the 111 homicide victims
were killed by a family member using some type of firearm.
• 24 (22 percent) homicide victims were killed
by person(s) known to them outside of their family using a firearm. 13 (12 percent) were killed by strangers using a firearm and for 13 victims (12 percent) who were killed by some type of firearm, the relationship of victim to offender was unknown.
A breakdown of weapons used appears on page 17, Figure 4.
15
Figure 3
Number of Criminal Homicides by Relationship to Offender
Figure 3.1: Victim to Offender Relationship Summary - 2013
Figure 3.2: Number of Criminal Homicide Victims by Relationship within Family
(Victim was the __________ of the Offender)
Total Murder/Non-Negligent Manslaughter Criminal Homicide Incidents for 2013 = 105 Total Criminal Homicide Victims for 2013 = 111 Total Criminal Homicide Offenders for 2013 = 123
NOTE: Starting in 2011, relationships are counted between each offender and each victim, so therefore, the number of relationships has increased since 2010. One Victim can now be tied to multiple offenders so therefore the victim count is not a one-to-one match to the total relationships
represented.

16
Figure H3.3: Relationship Outside Family, but Known
(Victim was an/the __________ of the Offender)
Figure H3.4: Victim was Stranger or Relationship was Unknown
Total Murder/Non-Negligent Manslaughter Criminal Homicide Incidents for 2013 = 105 Total Criminal Homicide Victims for 2013 = 111 Total Criminal Homicide Offenders for 2013 = 123
NOTE: Starting in 2011, relationships are counted between each offender and each victim, so therefore, the number of relationships has increase since 2010. One Victim can now be tied to multiple offenders so therefore the victim count is not a one-to-one match to the total relationships
represented.
17
Figure 4
Count of Weapons Used in Committing Criminal Homicides - 2013
In 2013 there were 123 weapons used in 105 criminal homicide incidents that killed 111 victims.

18
Figure 5
Criminal Homicide Incidents - 2013
Total Criminal Homicide Incidents: 105
Total Criminal Homicide Victims: 111
Figure 6
Criminal Homicide Victims and Offenders 2010 - 2013

19
FIGURE 7
Criminal Homicide Circumstances for 2013
Number of criminal homicide incidents: 105
Note: Up to two circumstances may be selected for each incident
FIGURE 8
Type of Felony Involved - 2013

20
TABLE 2
CRIMINAL HOMICIDE VICTIMS BY AGE, SEX, AND RACE - 2013
Summary:
• The highest number of criminal homicide victims for a single age group was 20-24 with 21 victims (18.9%).
• The second highest number of criminal homicide victims for a single age group was 25-29 with 17 victims (15.3%).
• 81 criminal homicide victims were male (74%) compared to 68 (74%) in 2012.
• 53 criminal homicide victims were White (48%) followed by 43 Black or African American (39%).
CRIMINAL HOMICIDES GENDER RACE
Age Victim Count
% of Total Victims Male Female Unknown White
Black or African
American
American Indian or
Alaska Native Asian**
Native Hawaiian or Other Pacific
Islander** Unknown Unborn* 1 0.9% 0 0 1 1 0 0 0 0 0 0-9 7 6.3% 5 2 0 5 1 1 0 0 0 10-14 0 0.0% 0 0 0 0 0 0 0 0 0 15-19 6 5.4% 5 1 0 2 3 0 1 0 0 20-24 21 18.9% 18 3 0 6 12 1 1 0 1 25-29 17 15.3% 12 5 0 6 7 0 4 0 0 30-34 15 13.5% 13 2 0 6 8 0 1 0 0 35-39 6 5.4% 3 3 0 3 2 1 0 0 0 40-44 6 5.4% 5 1 0 3 1 2 0 0 0 45-49 10 9.0% 5 5 0 4 5 0 1 0 0 50-54 5 4.5% 5 0 0 2 2 0 1 0 0 55-59 7 6.3% 4 3 0 6 1 0 0 0 0 60-64 2 1.8% 1 1 0 2 0 0 0 0 0 Over 64 8 7.2% 5 3 0 7 1 0 0 0 0
TOTAL 111 99.9% 81 29 1 53 43 5 9 0 1
* The 'Unborn' age category is considered a homicide by the State of Minnesota, but not by the FBI. Minnesota began collecting this category on new forms in 2011.
** In 2010 the FBI approved the separation of a single category ''Asian or Pacific Islander'' into two categories, ''Asian'' and ''Native Hawaiian or Other Pacific Islander''. The State of Minnesota began collecting these new categories in 2011. Not all agencies have separated these two new reporting categories; so therefore, the actual count of individuals within the ''Native Hawaiian or Other Pacific Islander'' category may still be being reported under the ''Asian'' category.

21
TABLE 3
CRIMINAL HOMICIDE OFFENDERS BY AGE, SEX, AND RACE - 2013
Summary:
• 33 (26.8%) of the criminal homicide offenders were Unknown
• 22 (17.9%) of the criminal homicide offenders were between 20-24 years of age.
• The next highest age group was 25-29 with 18 offenders (14.6%).
• 89 criminal homicide offenders were male (86%) compared to 72 (77%) in 2012.
• 48 criminal homicide offenders were Black or African American (39%) followed by 36 White (29%).
CRIMINAL HOMICIDES GENDER RACE
Age Number of Offenders % of Total Male Female Unknown White
Black or African
American
American Indian or
Alaska Native Asian*
Native Hawaiian or Other Pacific
Islander* Unknown Under 10 0 0.0% 0 0 0 0 0 0 0 0 0 10-14 0 0.0% 0 0 0 0 0 0 0 0 0 15-19 12 9.8% 11 1 0 5 4 2 1 0 0 20-24 22 17.9% 19 3 0 6 14 1 1 0 0 25-29 18 14.6% 14 4 0 7 9 0 2 0 0 30-34 11 8.9% 9 2 0 4 4 0 3 0 0 35-39 4 3.3% 3 1 0 3 0 0 0 0 1 40-44 6 4.9% 5 1 0 2 3 0 1 0 0 45-49 4 3.3% 4 0 0 2 1 1 0 0 0 50-54 9 7.3% 7 2 0 4 3 2 0 0 0 55-59 1 0.8% 1 0 0 1 0 0 0 0 0 60-64 1 0.8% 1 0 0 0 1 0 0 0 0 Over 64 2 1.6% 2 0 0 1 1 0 0 0 0 Unknown 33 26.8% 13 0 20 1 8 0 1 0 23 TOTAL 123 100.0% 89 14 20 36 48 6 9 0 24
* In 2010 the FBI approved the separation of a single category ''Asian or Pacific Islander'' into two categories, ''Asian'' and ''Native Hawaiian or Other Pacific Islander''. The State of Minnesota began collecting these new categories in 2011. Not all agencies have separated these two reporting categories; so therefore, the actual count of individuals within the ''Native Hawaiian or Other Pacific Islander'' may still be being reported under the ''Asian'' category.

22
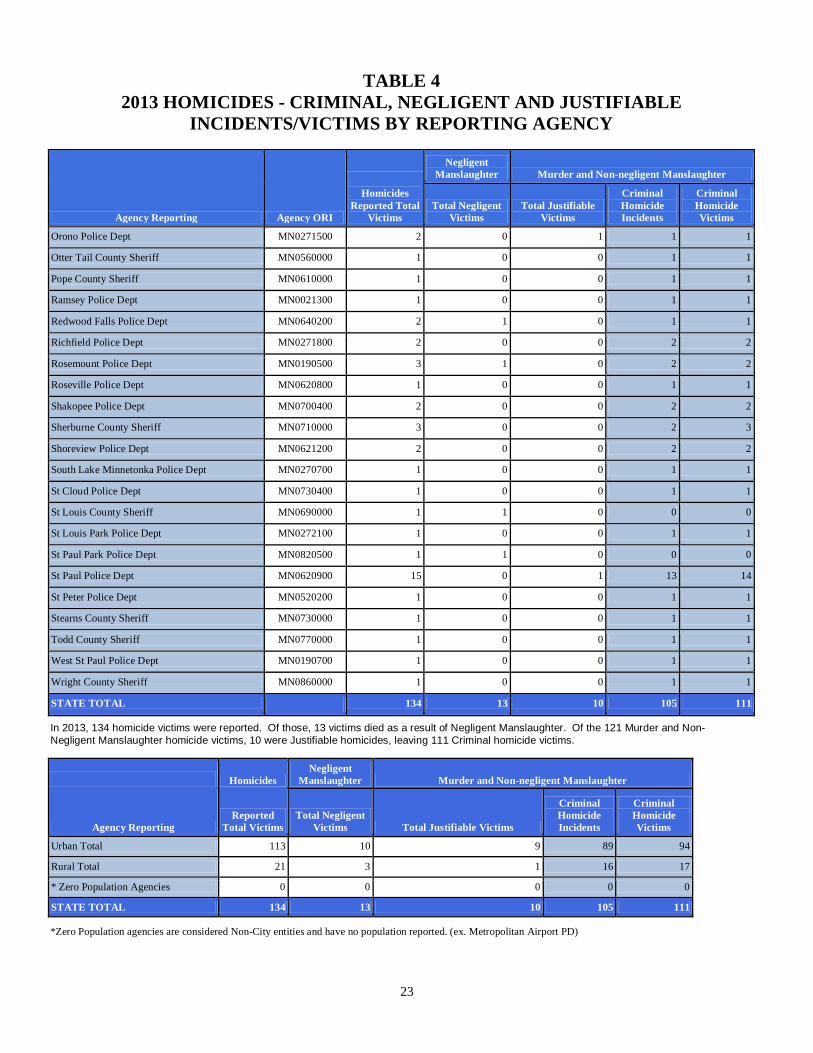
TABLE 4
2013 HOMICIDES - CRIMINAL, NEGLIGENT AND JUSTIFIABLE INCIDENTS/VICTIMS BY REPORTING AGENCY
Negligent
Manslaughter Murder and Non-negligent Manslaughter
Agency Reporting Agency ORI
Homicides Reported Total
Victims Total Negligent
Victims Total Justifiable
Victims
Criminal Homicide Incidents
Criminal Homicide Victims
Alexandria Police Dept MN0210100 1 0 0 1 1 Anoka County Sheriff MN0020000 2 1 0 1 1 Apple Valley Police Dept MN0191000 2 0 0 1 2 Austin Police Dept MN0500100 1 0 0 1 1 Becker County Sheriff MN0030000 2 0 0 2 2 Beltrami County Sheriff MN0040000 1 0 0 1 1 Bloomington Police Dept MN0270100 2 1 0 1 1 Brooklyn Center Police Dept MN0270200 3 0 1 2 2 Brooklyn Park Police Dept MN0270300 3 0 0 3 3 Burnsville Police Dept MN0190100 3 0 0 3 3 Carver County Sheriff MN0100000 1 1 0 0 0 Champlin Police Dept MN0272900 1 1 0 0 0 Clearwater County Sheriff MN0150000 1 0 0 1 1 Crow Wing County Sheriff MN0180000 1 0 1 0 0 Detroit Lakes Police Dept MN0030100 1 0 0 1 1 Duluth Police Dept MN0690600 3 0 1 2 2 Eagan Police Dept MN0190800 2 2 0 0 0 Eden Prairie Police Dept MN0272600 1 0 0 1 1 Faribault Police Dept MN0660100 1 0 0 1 1 Granite Falls Police Dept MN0870200 2 0 0 1 2 Hubbard County Sheriff MN0290000 1 0 0 1 1 Itasca County Sheriff MN0310000 1 0 0 1 1 Kandiyohi County Sheriff MN0340000 1 0 0 1 1 Mankato Dept of Public Safety MN0070100 1 0 0 1 1 Maple Grove Police Dept MN0272700 1 1 0 0 0 Maplewood Police Dept MN0620400 1 0 0 1 1 Minneapolis Police Dept MN0271100 40 0 4 34 36 Montevideo Police Dept MN0120200 1 0 0 1 1 Moorhead Police Dept MN0140400 2 1 0 1 1 Morrison County Sheriff MN0490000 1 0 0 1 1 Mounds View Police Dept MN0620500 1 0 0 1 1 New Hope Police Dept MN0271400 1 0 0 1 1 Newport Police Dept MN0820400 1 1 0 0 0 North Mankato Police Dept MN0520100 1 0 1 0 0 Oakdale Police Dept MN0820800 1 0 0 1 1
23
TABLE 4 2013 HOMICIDES - CRIMINAL, NEGLIGENT AND JUSTIFIABLE
INCIDENTS/VICTIMS BY REPORTING AGENCY
Agency Reporting Agency ORI
Homicides
Reported Total Victims
Negligent Manslaughter Murder and Non-negligent Manslaughter
Total Negligent Victims
Total Justifiable Victims
Criminal Homicide Incidents
Criminal Homicide Victims
Orono Police Dept MN0271500 2 0 1 1 1 Otter Tail County Sheriff MN0560000 1 0 0 1 1 Pope County Sheriff MN0610000 1 0 0 1 1 Ramsey Police Dept MN0021300 1 0 0 1 1 Redwood Falls Police Dept MN0640200 2 1 0 1 1 Richfield Police Dept MN0271800 2 0 0 2 2 Rosemount Police Dept MN0190500 3 1 0 2 2 Roseville Police Dept MN0620800 1 0 0 1 1 Shakopee Police Dept MN0700400 2 0 0 2 2 Sherburne County Sheriff MN0710000 3 0 0 2 3 Shoreview Police Dept MN0621200 2 0 0 2 2 South Lake Minnetonka Police Dept MN0270700 1 0 0 1 1 St Cloud Police Dept MN0730400 1 0 0 1 1 St Louis County Sheriff MN0690000 1 1 0 0 0 St Louis Park Police Dept MN0272100 1 0 0 1 1 St Paul Park Police Dept MN0820500 1 1 0 0 0 St Paul Police Dept MN0620900 15 0 1 13 14 St Peter Police Dept MN0520200 1 0 0 1 1 Stearns County Sheriff MN0730000 1 0 0 1 1 Todd County Sheriff MN0770000 1 0 0 1 1 West St Paul Police Dept MN0190700 1 0 0 1 1 Wright County Sheriff MN0860000 1 0 0 1 1 STATE TOTAL 134 13 10 105 111
In 2013, 134 homicide victims were reported. Of those, 13 victims died as a result of Negligent Manslaughter. Of the 121 Murder and Non-Negligent Manslaughter homicide victims, 10 were Justifiable homicides, leaving 111 Criminal homicide victims.
Homicides Negligent
Manslaughter Murder and Non-negligent Manslaughter
Agency Reporting Reported
Total Victims Total Negligent
Victims Total Justifiable Victims
Criminal Homicide Incidents
Criminal Homicide Victims
Urban Total 113 10 9 89 94 Rural Total 21 3 1 16 17 * Zero Population Agencies 0 0 0 0 0 STATE TOTAL 134 13 10 105 111
*Zero Population agencies are considered Non-City entities and have no population reported. (ex. Metropolitan Airport PD)

24
FORCIBLE RAPES - INCLUDING ATTEMPTS Forcible rape is the carnal knowledge of a female using force and committed against her will. Uniform Crime Reporting needs require rape to be divided into two categories: (1) Rape by force, and (2) Attempted rape. Statutory rape and other sex offenses are excluded from this category. Though UCR only collects information about female victims, Minnesota includes male victims as well. All figures presented will include both male and female victims. SUMMARY ANALYSIS • For the 2,091 rapes reported in 2013, 120 were
listed as unfounded.
• Of the 1,971 reported actual rapes that occurred in Minnesota in 2013; 1,819 were by force while 152 were recorded as attempted rapes.
• Of the total rapes occurring in 2013, 806 or 41
percent were cleared by arrest. Of this total, 79 were cleared with the arrest of a juvenile.*
• The crime rate for rape in 2013 represented 37 per
100,000 population. • The total number of rapes in 2013 represented 16
percent of the total violent crimes with 5 averaged per day.
*Cases where an adult and a juvenile are arrested for a case are not counted as cleared by the arrest of a juvenile.
6 7 8 7 6 5 6 6 8 8
46 44 45
40 41
0
5
10
15
20
25
30
35
40
45
50
2009 2010 2011 2012 2013
Perc
ent
Year
Figure 9 Comparison of Percentage of Rapes Unfounded,
Attempted and Cleared for Period 2009-2013
Unfounded
Attempted
Cleared
25
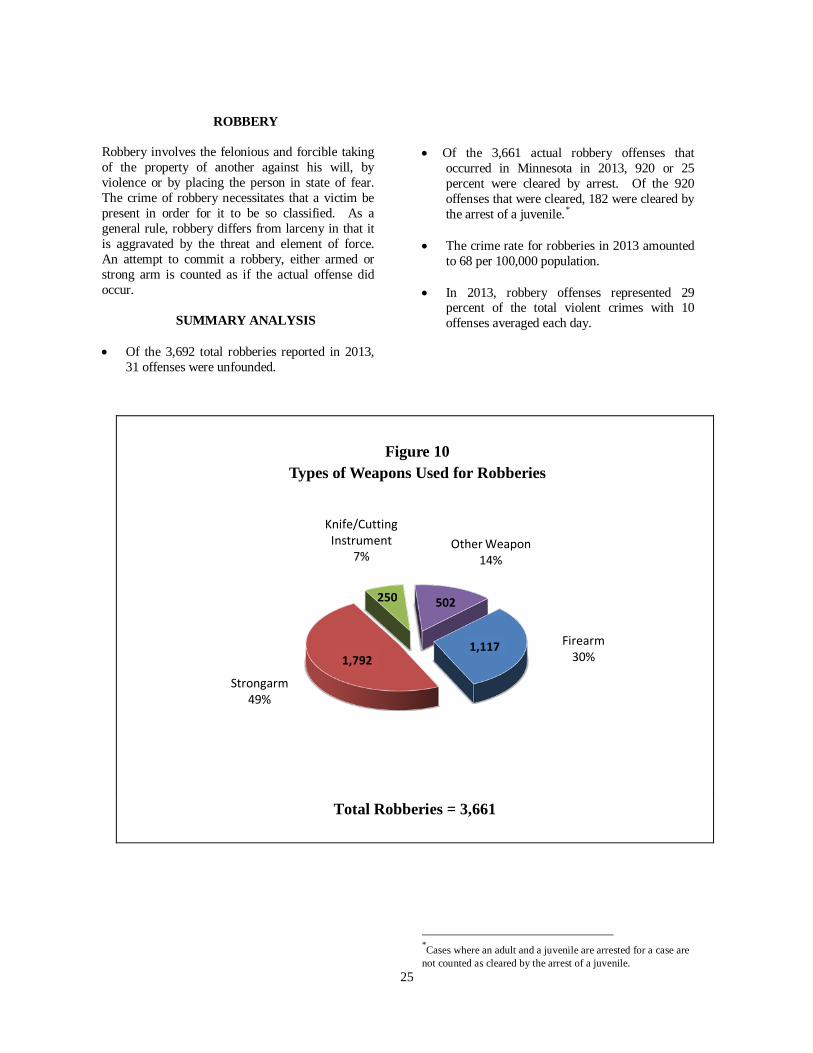
ROBBERY Robbery involves the felonious and forcible taking of the property of another against his will, by violence or by placing the person in state of fear. The crime of robbery necessitates that a victim be present in order for it to be so classified. As a general rule, robbery differs from larceny in that it is aggravated by the threat and element of force. An attempt to commit a robbery, either armed or strong arm is counted as if the actual offense did occur. SUMMARY ANALYSIS • Of the 3,692 total robberies reported in 2013,
31 offenses were unfounded.
• Of the 3,661 actual robbery offenses that
occurred in Minnesota in 2013, 920 or 25 percent were cleared by arrest. Of the 920 offenses that were cleared, 182 were cleared by the arrest of a juvenile.*
• The crime rate for robberies in 2013 amounted
to 68 per 100,000 population. • In 2013, robbery offenses represented 29
percent of the total violent crimes with 10 offenses averaged each day.
*Cases where an adult and a juvenile are arrested for a case are not counted as cleared by the arrest of a juvenile.
Total Robberies = 3,661
Firearm 30%
Strongarm 49%
Knife/Cutting Instrument
7% Other Weapon
14%
Figure 10 Types of Weapons Used for Robberies
250 502
1,117 1,792

26
Figure 11
Average Stolen Property Loss Per Robbery Type For 2013
Figure 12
Stolen Property Value for Types of Robberies – 2013 Total Value = $1,824,702
$817,164
$121,927
$17,857 $26,512
$163,523
$57,309
$620,410
$0
$100,000
$200,000
$300,000
$400,000
$500,000
$600,000
$700,000
$800,000
$900,000
Highway Commercial House
Gas/Service Station
Convenience Store
Residence Bank Miscellaneous
Stol
en V
alue
in D
olla
rs
777
388
384
349
693
1,333
960
0 200 400 600 800 1,000 1,200 1,400
Miscellaneous
Gas/Service Station
Convenience Store
Highway
Residence
Bank
Commercial House
Value in Dollars

27
AGGRAVATED ASSAULT The definition of assault involves an attempt or offer with unlawful force or violence to do physical injury to another. An aggravated assault may be committed with a gun, knife or cutting instrument, other dangerous weapons such as clubs, or through the use hands, fists or feet. Assault with intent to commit murder is also listed as aggravated assault. All assaults, where no weapon is used, which result in minor injuries are classified as non-aggravated assaults or simple assaults and are not counted in the crime index total.
SUMMARY ANALYSIS • Of the 6,823 total aggravated assault offenses
reported in 2013, 97 were reported as unfounded. • For the total 6,726 actual aggravated assaults
occurring in Minnesota in 2013, 4,262 or 63 percent were cleared by arrest. Of the 4,262 assaults cleared by arrest, 458 were cleared with the arrest of a juvenile.*
• The crime rate for assaults in 2013 was 125 per
100,000 population. • In 2013, aggravated assault offenses accounted for
54 percent of the total violent crimes with 18 averaged per day.
*Cases where an adult and a juvenile are arrested for a case are not counted as cleared by the arrest of a juvenile.
Other Weapon 26%
Gun 19%
Knife/Cutting Instrument
19%
Hands,Etc 36%
2,434
1,245 1,273
1,774
Figure 13 Types of Weapons Used for Aggravated Assaults in 2013
Total Aggravated Assaults = 6,726

28
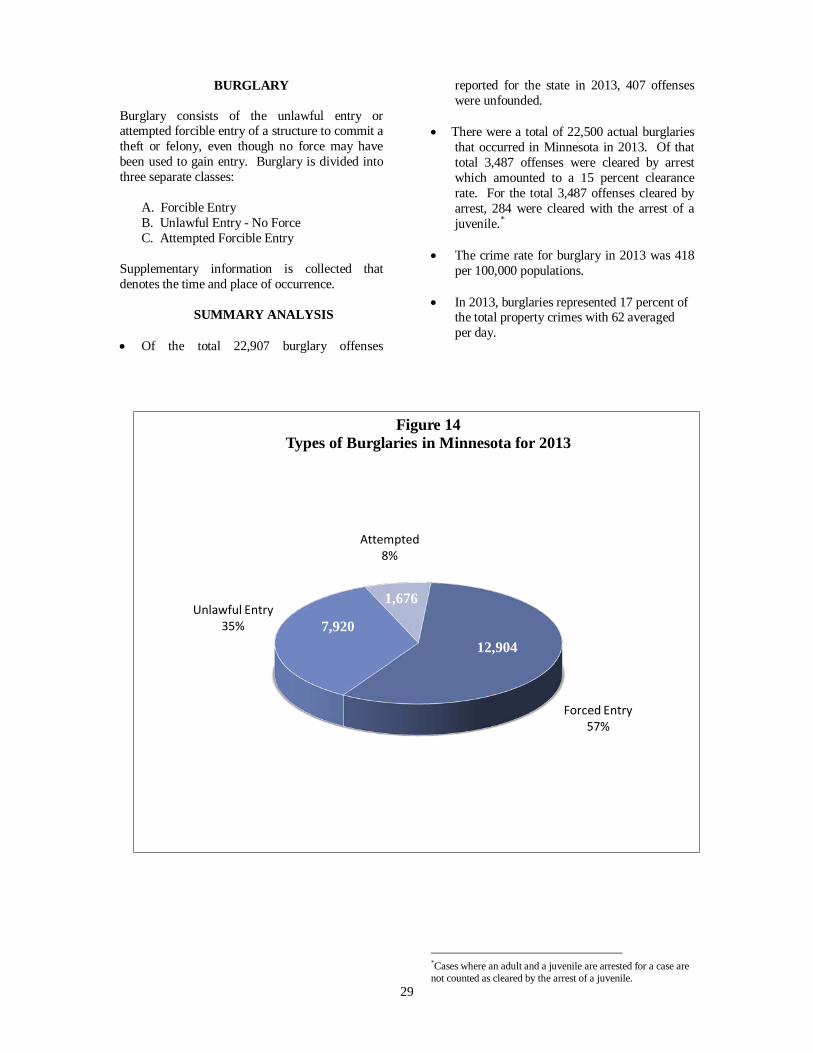
29
BURGLARY Burglary consists of the unlawful entry or attempted forcible entry of a structure to commit a theft or felony, even though no force may have been used to gain entry. Burglary is divided into three separate classes: A. Forcible Entry B. Unlawful Entry - No Force C. Attempted Forcible Entry Supplementary information is collected that denotes the time and place of occurrence. SUMMARY ANALYSIS • Of the total 22,907 burglary offenses
reported for the state in 2013, 407 offenses were unfounded.
• There were a total of 22,500 actual burglaries
that occurred in Minnesota in 2013. Of that total 3,487 offenses were cleared by arrest which amounted to a 15 percent clearance rate. For the total 3,487 offenses cleared by arrest, 284 were cleared with the arrest of a juvenile.*
• The crime rate for burglary in 2013 was 418
per 100,000 populations. • In 2013, burglaries represented 17 percent of
the total property crimes with 62 averaged per day.
*Cases where an adult and a juvenile are arrested for a case are not counted as cleared by the arrest of a juvenile.
Forced Entry 57%
Unlawful Entry 35%
Attempted 8%
Figure 14 Types of Burglaries in Minnesota for 2013
12,904 7,920
1,676

30
Figure 15 Residence/Non-Residence Burglaries
By Time of Day, 2009-2013
971
933
920
814
840
3,91
1
3,10
6
3,11
0
2,90
5
2,51
6
3,80
6
3,48
7 3,91
7
3,91
3
3,68
0
0
500
1000
1500
2000
2500
3000
3500
4000
4500
2009 2010 2011 2012 2013
Non-Residential Burglaries by Day/Night Non-Residence-Day
Non-Residence-Night
Non-Residence-Unknown
6,05
5
6,20
6
6,37
0
6,33
1
5,90
7
5,58
1
5,45
9 5,78
1
5,90
0
5,06
3
4,84
1
4,75
6 5,05
5
4,94
8
4,49
4
0
1,000
2,000
3,000
4,000
5,000
6,000
7,000
2009 2010 2011 2012 2013
Residential Burglaries by Day/Night Residence - Day
Residence - Night
Residence - Unknown

31
Figure 16 Total Burglaries by Place of Occurrence
And Stolen Property Values 2009-2013
16,477 16,421 17,206 17,179
15,464
8,688 7,526 7,947 7,650 7,036
0
2,000
4,000
6,000
8,000
10,000
12,000
14,000
16,000
18,000
20,000
2009 2010 2011 2012 2013
Num
ber o
f Bur
glar
ies
Burglaries by Location 2009 - 2013 Residence
Non-Residence
20 20
23 22
19
10 10 11
10 10
0
5
10
15
20
25
2009 2010 2011 2012 2013
Dol
lars
in M
illio
ns
Burglary Losses by Location 2009 - 20113 Residence
Non-Residence
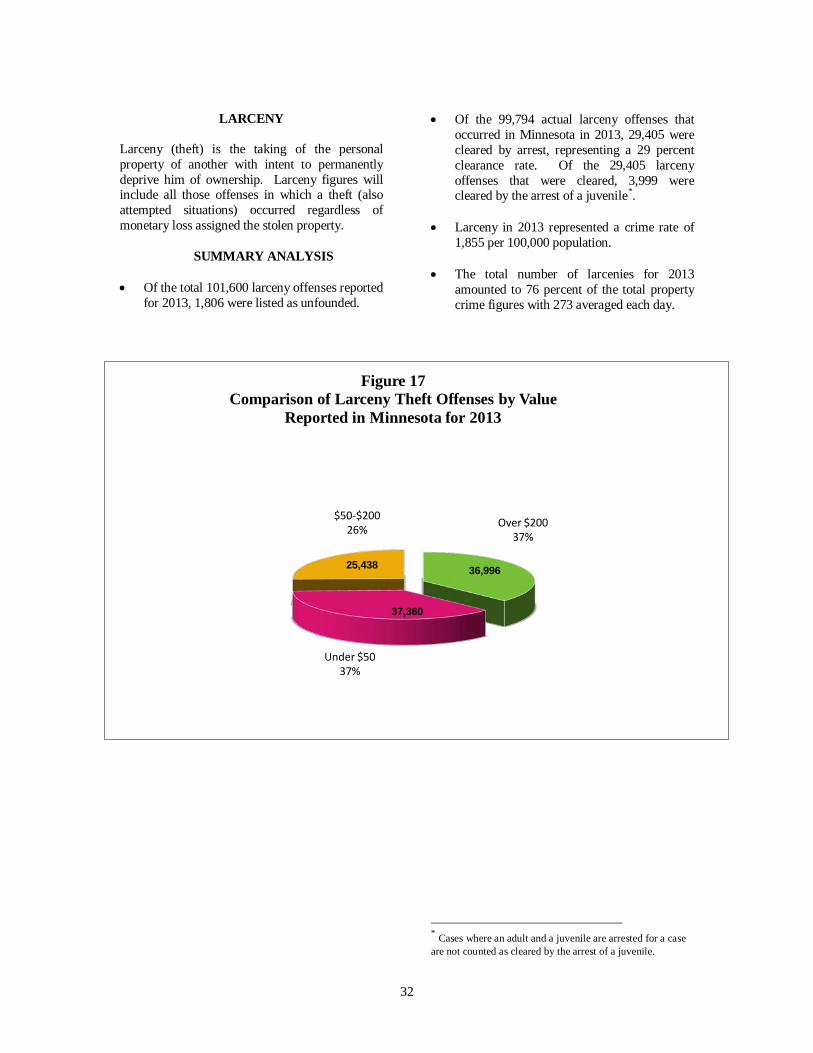
32
LARCENY
Larceny (theft) is the taking of the personal property of another with intent to permanently deprive him of ownership. Larceny figures will include all those offenses in which a theft (also attempted situations) occurred regardless of monetary loss assigned the stolen property. SUMMARY ANALYSIS • Of the total 101,600 larceny offenses reported
for 2013, 1,806 were listed as unfounded.
• Of the 99,794 actual larceny offenses that
occurred in Minnesota in 2013, 29,405 were cleared by arrest, representing a 29 percent clearance rate. Of the 29,405 larceny offenses that were cleared, 3,999 were cleared by the arrest of a juvenile*.
• Larceny in 2013 represented a crime rate of
1,855 per 100,000 population. • The total number of larcenies for 2013
amounted to 76 percent of the total property crime figures with 273 averaged each day.
* Cases where an adult and a juvenile are arrested for a case are not counted as cleared by the arrest of a juvenile.
Over $200 37%
Under $50 37%
$50-$200 26%
Figure 17 Comparison of Larceny Theft Offenses by Value
Reported in Minnesota for 2013
36,996 25,438
37,360

33
Figure 18 Total Larceny Thefts by Type
Reported in Minnesota for 2013
*Includes Purse Snatching, Pocket Picking, Cargo Thefts, Coin Operated Machines & Livestock.
Figure 19
Average Stolen Property Loss per Type Reported in Minnesota for 2013
*Includes Purse Snatching, Pocket Picking, Cargo Thefts, Coin Operated Machines & Livestock.
20,197
10,501
19,625
2,598 2,897 901
43,075
0
5,000
10,000
15,000
20,000
25,000
30,000
35,000
40,000
45,000
50,000
From Autos From Buildings Shoplifting Auto Parts/ Access.
Bicycles Purse Snatching,
Etc.*
All Other
Num
ber o
f Lar
ceny
The
fts
$659
$830
$203
$330 $318 $302
$819
$0
$100
$200
$300
$400
$500
$600
$700
$800
$900
From Autos From Buildings Shoplifting Auto Parts/Access.
Bicycles Purse Snatching, Etc.*
All Other
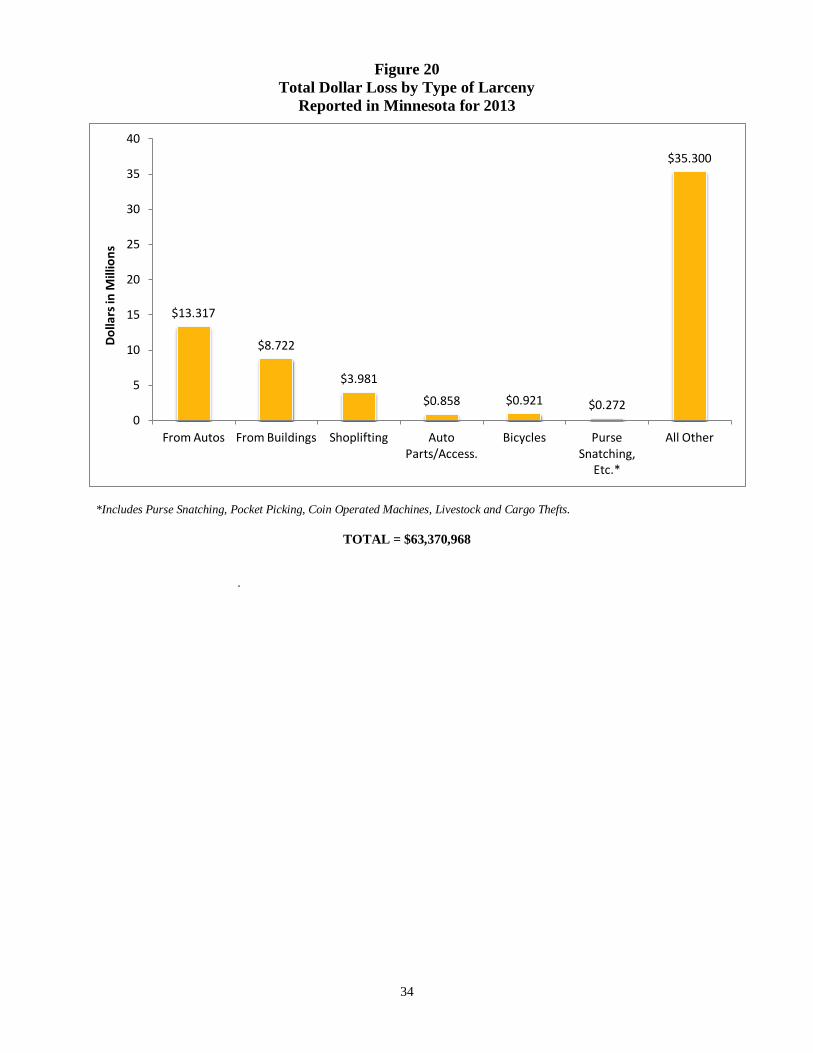
34
Figure 20 Total Dollar Loss by Type of Larceny
Reported in Minnesota for 2013
*Includes Purse Snatching, Pocket Picking, Coin Operated Machines, Livestock and Cargo Thefts.
TOTAL = $63,370,968
.
$13.317
$8.722
$3.981
$0.858 $0.921 $0.272
$35.300
0
5
10
15
20
25
30
35
40
From Autos From Buildings Shoplifting Auto Parts/Access.
Bicycles Purse Snatching,
Etc.*
All Other
Dol
lars
in M
illio
ns

35
MOTOR VEHICLE THEFT Motor Vehicle Theft is the larceny or attempted larceny of a motor vehicle. This includes all vehicles that can be registered as such. "Joyriding" thefts are included under this category. SUMMARY ANALYSIS • Of the 8,252 motor vehicle thefts reported in
2013, 379 offenses were unfounded. • In Minnesota during 2013, there were 7,873 actual
thefts reported to have occurred. Of that total, 1,482 were cleared by arrest, indicating a clearance rate of 19 percent. Out of the total offenses cleared by arrest, 143 were cleared with the arrest of a juvenile*.
Motor vehicle thefts in 2013 represented a crime rate of 146 per 100,000 population.
• In 2013, motor vehicle thefts represented 6
percent of the total property crimes and averaged 22 per day.
• There were 3,598 locally stolen vehicles
recovered. In addition, 278 vehicles that were stolen in other jurisdictions were recovered locally.
• Of the 7,873 vehicles reported stolen, 6,212 were
automobiles, 635 were trucks/buses and 1,026 were vehicles such as snowmobiles, motorcycles, motorscooters, etc.
8,37
9
8,39
8
7,92
7
8,25
1
7,87
3
6,63
3
6,63
5
6,23
9
6,41
9
6,21
2
661
671
653
655
635 1,
085
1,09
2
1,03
5
1,17
7
1,02
6
0
1,000
2,000
3,000
4,000
5,000
6,000
7,000
8,000
9,000
2009 2010 2011 2012 2013
Num
ber o
f Veh
icle
s St
olen
Figure 21 Stolen Vehicles by Type 2009 - 2013
All Vehicles
Autos
Trucks/Buses
Other Vehicles
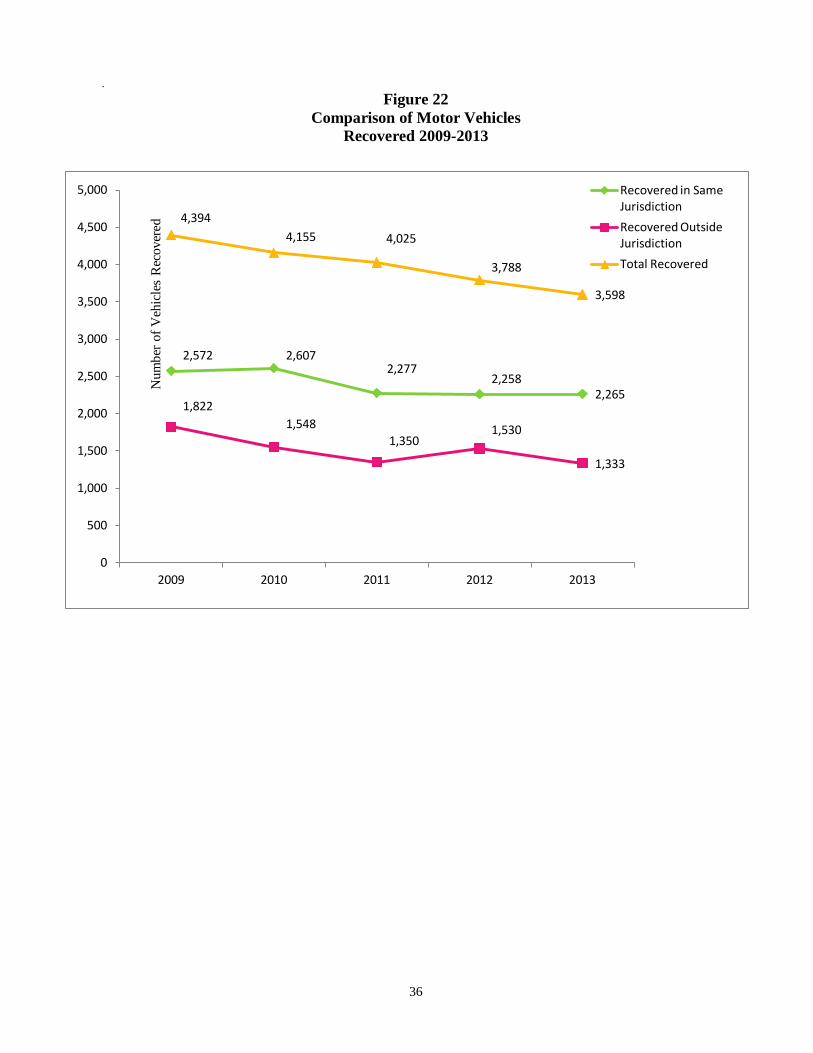
36
. Figure 22
Comparison of Motor Vehicles Recovered 2009-2013
2,572 2,607 2,277
2,258 2,265
1,822 1,548
1,350 1,530
1,333
4,394 4,155 4,025
3,788
3,598
0
500
1,000
1,500
2,000
2,500
3,000
3,500
4,000
4,500
5,000
2009 2010 2011 2012 2013
Recovered in Same Jurisdiction
Recovered Outside Jurisdiction
Total Recovered
Num
ber o
f Veh
icle
s R
ecov
ered

37
ARSON Arson is defined as any willful or malicious burning or attempt to burn, with or without intent to defraud, a dwelling house, public building, motor vehicle or aircraft, personal property of another, etc. Fires of suspicious or unknown origins are excluded. This crime category is distinctive from other offenses in that all crimes of arson are to be reported, even if they occur in conjunction with another crime. During 2012, 830 offenses were recorded on the Uniform Crime Reports. SUMMARY ANALYSIS • Of the total 938 arson offenses reported, 8 were
listed as unfounded. • Of the 930 arson offenses known as having
occurred in Minnesota in 2013, 213 or
23 percent were cleared by arrest. Of the 213 arsons cleared by arrest, 33 were cleared by the arrest of a juvenile.*
• The crime rate for arson in 2013 was 17 per
100,000 population, with 2.5 offenses averaged per day.
• Of the arson offenses, 486 (52 percent) were
structural fires, 206 (22 percent) were arsons of mobile property (motor vehicles, airplanes, boats, etc.) and 238 offenses were for arson of other property such as crops, timber, fences, signs, etc. (26 percent).
• Of the 486 structures burned, 78 (16 percent) of
the structures were uninhabited. • The estimated dollar value lost to arson in 2013
totaled $6,640,317 with structural fires accounting for 85 percent of the loss ($5,623,087).
*Cases where an adult and a juvenile are arrested for a case are not counted as cleared by the arrest of a juvenile.
Property Offenses Actual Total Clearances Uninhabited Estimated Classification Known Unfounded Offenses Clearances Under 18* Structures Property
Value Structural: Single Occupancy 143 1 142 38 7 24 $2,464,899 Other Residential 96 1 95 30 3 7 $2,646,826 Storage 72 0 72 17 2 6 $315,108 Industrial/Manufacturing 3 0 3 2 0 0 $1 Other Commercial 13 0 13 2 1 2 $3 Community/Public 56 0 56 12 8 4 $120,825 All Other Structures 106 1 105 30 6 35 $75,425 Total Structural 489 3 486 131 27 78 $5,623,087
Mobile: Motor Vehicles 194 3 191 19 1 1 $976,702 Other Mobile Property 15 0 15 2 0 0 $26,581 Total Mobile 209 3 206 21 1 1 $1,003,283
All Other/Unknown Property 240 2 238 61 5 2 $13,947
GRAND TOTAL 938 8 930 213 33 81 $6,640,317
TABLE 5 2013 ARSON SUMMARY
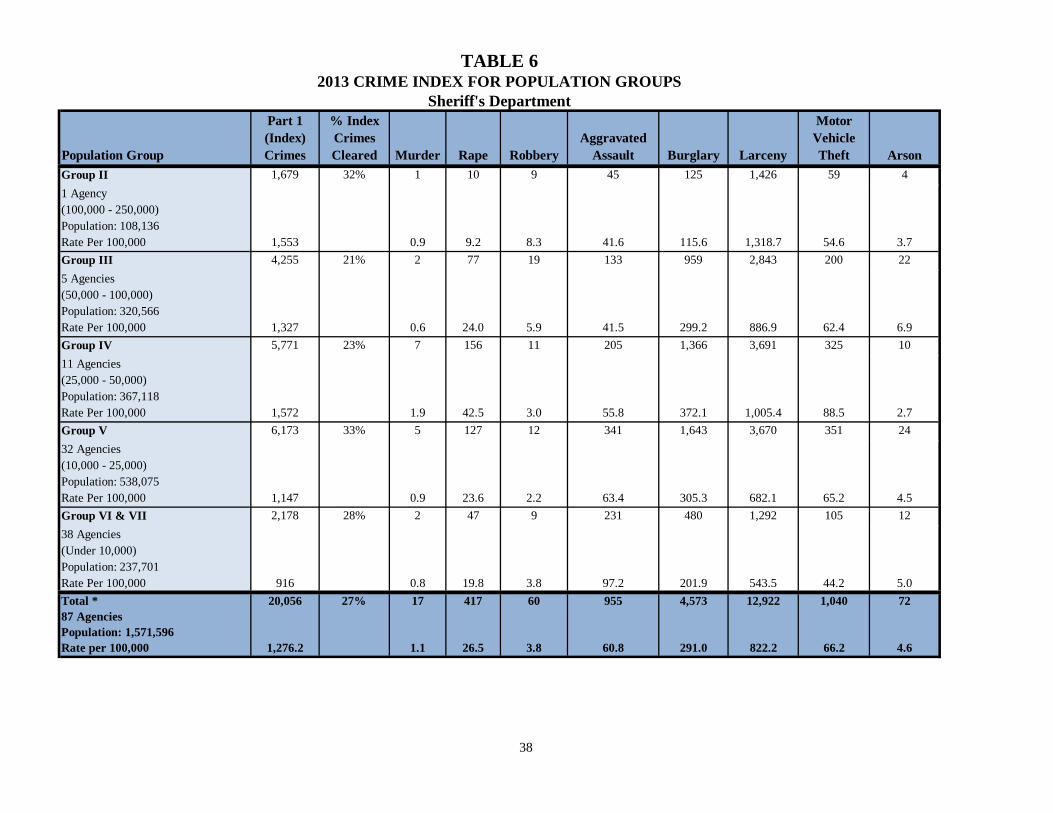
38
Population Group
Part 1 (Index) Crimes
% Index Crimes Cleared Murder Rape Robbery
Aggravated Assault Burglary Larceny
Motor Vehicle Theft Arson
Group II 1,679 32% 1 10 9 45 125 1,426 59 41 Agency(100,000 - 250,000)Population: 108,136Rate Per 100,000 1,553 0.9 9.2 8.3 41.6 115.6 1,318.7 54.6 3.7Group III 4,255 21% 2 77 19 133 959 2,843 200 225 Agencies(50,000 - 100,000)Population: 320,566Rate Per 100,000 1,327 0.6 24.0 5.9 41.5 299.2 886.9 62.4 6.9Group IV 5,771 23% 7 156 11 205 1,366 3,691 325 1011 Agencies(25,000 - 50,000)Population: 367,118Rate Per 100,000 1,572 1.9 42.5 3.0 55.8 372.1 1,005.4 88.5 2.7Group V 6,173 33% 5 127 12 341 1,643 3,670 351 2432 Agencies(10,000 - 25,000)Population: 538,075Rate Per 100,000 1,147 0.9 23.6 2.2 63.4 305.3 682.1 65.2 4.5Group VI & VII 2,178 28% 2 47 9 231 480 1,292 105 1238 Agencies(Under 10,000)Population: 237,701Rate Per 100,000 916 0.8 19.8 3.8 97.2 201.9 543.5 44.2 5.0Total *87 AgenciesPopulation: 1,571,596Rate per 100,000
20,056
1,276.2
27% 17
1.1
417
26.5
60
3.8
955
60.8
4,573
291.0
12,922
822.2
1,040
66.2
72
4.6
TABLE 62013 CRIME INDEX FOR POPULATION GROUPS
Sheriff's Department
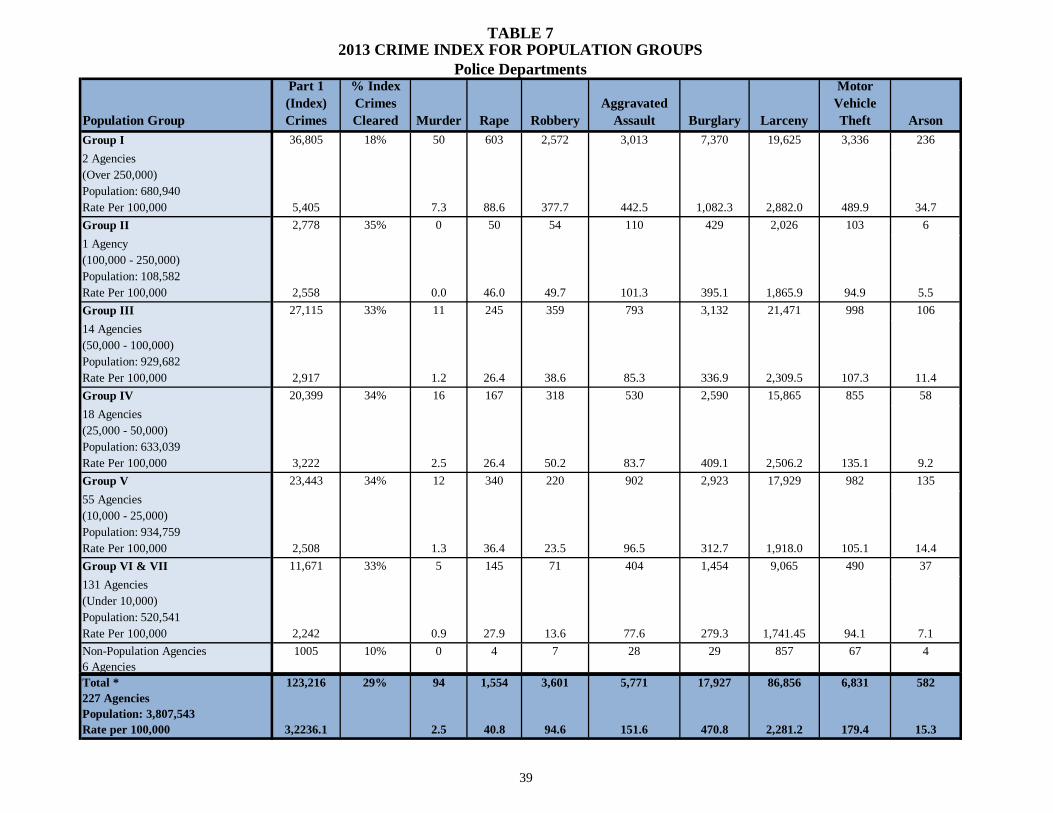
39
Population Group
Part 1 (Index) Crimes
% Index Crimes Cleared Murder Rape Robbery
Aggravated Assault Burglary Larceny
Motor Vehicle Theft Arson
Group I 36,805 18% 50 603 2,572 3,013 7,370 19,625 3,336 2362 Agencies(Over 250,000)Population: 680,940Rate Per 100,000 5,405 7.3 88.6 377.7 442.5 1,082.3 2,882.0 489.9 34.7Group II 2,778 35% 0 50 54 110 429 2,026 103 61 Agency(100,000 - 250,000)Population: 108,582Rate Per 100,000 2,558 0.0 46.0 49.7 101.3 395.1 1,865.9 94.9 5.5Group III 27,115 33% 11 245 359 793 3,132 21,471 998 10614 Agencies(50,000 - 100,000)Population: 929,682Rate Per 100,000 2,917 1.2 26.4 38.6 85.3 336.9 2,309.5 107.3 11.4Group IV 20,399 34% 16 167 318 530 2,590 15,865 855 5818 Agencies(25,000 - 50,000)Population: 633,039Rate Per 100,000 3,222 2.5 26.4 50.2 83.7 409.1 2,506.2 135.1 9.2Group V 23,443 34% 12 340 220 902 2,923 17,929 982 13555 Agencies(10,000 - 25,000)Population: 934,759Rate Per 100,000 2,508 1.3 36.4 23.5 96.5 312.7 1,918.0 105.1 14.4Group VI & VII 11,671 33% 5 145 71 404 1,454 9,065 490 37131 Agencies(Under 10,000)Population: 520,541Rate Per 100,000 2,242 0.9 27.9 13.6 77.6 279.3 1,741.45 94.1 7.1Non-Population Agencies6 Agencies
1005 10% 0 4 7 28 29 857 67 4
Total *227 AgenciesPopulation: 3,807,543Rate per 100,000
123,216
3,2236.1
29% 94
2.5
1,554
40.8
3,601
94.6
5,771
151.6
17,927
470.8
86,856
2,281.2
6,831
179.4
582
15.3
TABLE 72013 CRIME INDEX FOR POPULATION GROUPS
Police Departments

40
MINNESOTA PROPERTY CRIME VALUE INFORMATION - 2013
Information on property stolen and recovered in Minnesota for the offenses of criminal homicide, rape, robbery, burglary, larceny and motor vehicle theft is reflected in the following tables and figures. Table 8 indicates that the property type category of Locally Stolen Autos had the highest stolen value of property taken in the state in 2013. The livestock items category showed the lowest amount of stolen value for property taken during that year. The highest recovered value reported was in the
Locally Stolen Autos category while the lowest recovered value reported was household items. Table 9 indicates a more specific itemization of property stolen/recovered and the associated monetary values. Figure 22 shows the average dollar loss to property offenses in Minnesota for the past year. Figure 23 reflects what proportion of an average dollar was lost to the robbery, burglary, larceny and motor vehicle theft offenses during 2013.
TABLE 8
TOTAL VALUE OF PROPERTY STOLEN/RECOVERED IN MINNESOTA - 2013
Property Type Stolen Value Recovered Value Currency/Notes $12,211,522 $301,135
Jewelry/Metals $12,533,304 $480,171
Clothing/Furs $1,904,712 $580,641
Locally Stolen Autos $26,760,248 $14,115,845
Office Equipment $5,501,301 $416,001
TV/Radio/Stereo $6,473,685 $576,076
Firearms $994,582 $147,459
Household Items $1,345,525 $64,809
Consumer Items $2,185,293 $417,128
Livestock $227,166 $20,652
Miscellaneous $47,577,184 $3,662,608
TOTAL $117,714,522 $20,782,525 Stolen Values are based on the “fair market value” at the time of the theft. Recovered Values are determined by “fair market value” at the time of the recovery less any damage or depreciation.
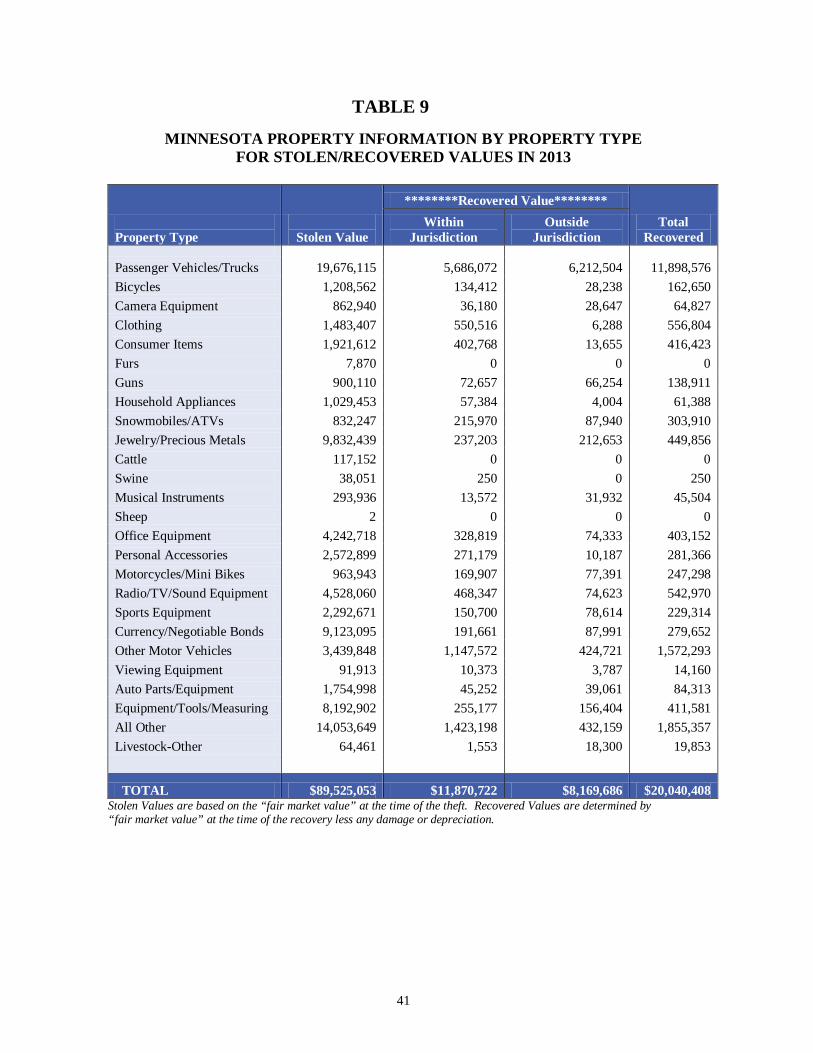
41
TABLE 9
MINNESOTA PROPERTY INFORMATION BY PROPERTY TYPE FOR STOLEN/RECOVERED VALUES IN 2013
Property Type
Stolen Value
********Recovered Value******** Total
Recovered Within
Jurisdiction Outside
Jurisdiction Passenger Vehicles/Trucks 19,676,115 5,686,072 6,212,504 11,898,576 Bicycles 1,208,562 134,412 28,238 162,650 Camera Equipment 862,940 36,180 28,647 64,827 Clothing 1,483,407 550,516 6,288 556,804 Consumer Items 1,921,612 402,768 13,655 416,423 Furs 7,870 0 0 0 Guns 900,110 72,657 66,254 138,911 Household Appliances 1,029,453 57,384 4,004 61,388 Snowmobiles/ATVs 832,247 215,970 87,940 303,910 Jewelry/Precious Metals 9,832,439 237,203 212,653 449,856 Cattle 117,152 0 0 0 Swine 38,051 250 0 250 Musical Instruments 293,936 13,572 31,932 45,504 Sheep 2 0 0 0 Office Equipment 4,242,718 328,819 74,333 403,152 Personal Accessories 2,572,899 271,179 10,187 281,366 Motorcycles/Mini Bikes 963,943 169,907 77,391 247,298 Radio/TV/Sound Equipment 4,528,060 468,347 74,623 542,970 Sports Equipment 2,292,671 150,700 78,614 229,314 Currency/Negotiable Bonds 9,123,095 191,661 87,991 279,652 Other Motor Vehicles 3,439,848 1,147,572 424,721 1,572,293 Viewing Equipment 91,913 10,373 3,787 14,160 Auto Parts/Equipment 1,754,998 45,252 39,061 84,313 Equipment/Tools/Measuring 8,192,902 255,177 156,404 411,581 All Other 14,053,649 1,423,198 432,159 1,855,357 Livestock-Other 64,461 1,553 18,300 19,853
TOTAL $89,525,053 $11,870,722 $8,169,686 $20,040,408 Stolen Values are based on the “fair market value” at the time of the theft. Recovered Values are determined by “fair market value” at the time of the recovery less any damage or depreciation.

42
Figure 23 Average Dollar Loss per Property Offense
In Minnesota for 2012 – 2013
Figure 24 Percentage of Dollars Lost to Serious Crime
In Minnesota for 2013
$906
$686
$1,331
$431
$2,779
$867
$635
$1,388
$498
$2,907
$0
$500
$1,000
$1,500
$2,000
$2,500
$3,000
$3,500
Total Property Larceny Burglary Robbery Motor Vehicle Theft
2012
2013
19%
54%
25%
2%
0% 10% 20% 30% 40% 50% 60%
Motor Vehicle Theft
Larceny
Burglary
Robbery
43
ADDITIONAL STATEWIDE OFFENSE INFORMATION
In addition to the aforementioned crime index information and property crime values, there are additional sources of offense information included as a part of Minnesota Offense Information. Table 10 contains statewide summary information for total Part I and Part II offenses for 2013. The first column lists offenses according to crime category, as described in the Crime Information section of this publication. The remaining columns give the number of offenses, unfounded offenses, the crime rate, offenses cleared by arrest, and offenses cleared by arrest of a juvenile. Table 11 encompasses 2013 statewide data relating to property loss. The first portion of the table
refers to the various property types and the corresponding stolen and/or recovered value. The rest of the table lists the Part I offenses broken down into sub-categories and the value of the property stolen or recovered for each offense. Table 12 provides summary information including the crime rate, population, crime index and percent cleared for urban-rural, the various State Judicial Districts, and the reporting agencies in Minnesota for 2013. Table 13 depicts summary Minnesota Crime Index Information for the years 1936-2013 and also includes state population and crime rate.

TABLE 102013 STATEWIDE OFFENSE AND CLEARANCE INFORMATION
44
Offenses Total Cleared ClearedOffense Known or Unfounded Actual Crime By By Arrest Percent
Reported Number Offenses Rate Arrest Under 18 ClearedPart 1 CrimesMurder/Non-Negligent Man. 121 10 111 2 76 3 68%Rape Total 2,091 120 1,971 37 806 79 41%Forcible 1,936 117 1,819 34 765 74 42%Attempted 155 3 152 3 41 5 27%Robbery Total 3,692 31 3,661 68 920 182 25%Firearm 1,125 8 1,117 21 255 36 23%Knife/Cutting 253 3 250 5 83 13 33%Other Weapon 510 8 502 9 189 28 38%Strong Arm 1,804 12 1,792 33 393 105 22%Aggravated Assault Total 6,823 97 6,726 125 4,262 458 63%Gun 1,265 20 1,245 23 651 75 52%Knife 1,289 16 1,273 24 797 104 63%Other Weapon 1,804 30 1,774 33 1,200 140 68%Hands, Feet, Etc. 2,465 31 2,434 45 1,614 139 66%Burglary Total 22,907 407 22,500 418 3,487 284 15%Forced Entry 13,084 180 12,904 240 2,224 147 17%Unlawful Entry - No Force 8,098 178 7,920 147 1,083 116 14%Attempted Forcible Entry 1,725 49 1,676 31 180 21 11%Larceny Total 101,600 1,806 99,794 1,855 29,405 3,999 29%Auto Theft Total 8,252 379 7,873 146 1,482 143 19%Autos 6,537 325 6,212 115 1,176 128 19%Trucks/Buses 649 14 635 12 90 5 14%Other Vehicles 1,066 40 1,026 19 216 10 21%Arson 938 8 930 17 213 33 23%
Part 1 Total w/o Arson 145,486 2,850 142,636 2,652 40,438 5,148 28%Part 1 Total with Arson 146,424 2,858 143,566 2,669 40,651 5,181 28%
Part 2 CrimesOther Assaults* 30,009 841 29,168 542 18,582 2,426 64%Forgery/Counterfeiting 4,045 84 3,961 74 1,344 17 34%Fraud 18,806 544 18,262 339 5,003 78 27%Embezzlement 68 3 65 1 35 4 54%Stolen Property 1,546 18 1,528 28 1,196 134 78%Vandalism 32,947 292 32,655 607 6,479 636 20%Weapons 2,742 78 2,664 50 1,702 278 64%Prostitution 851 4 847 16 572 2 68%Other Sex Offenses 4,379 323 4,056 75 1,875 167 46%Narcotics 19,885 95 19,790 368 16,438 1,982 83%Gambling 30 - 30 1 17 3 57%Family/Children 6,476 657 5,819 108 1,888 11 32%D.U.I. 21,770 40 21,730 404 21,197 158 98%Liquor Laws 8,323 25 8,298 154 7,822 1,067 94%Disorderly Conduct 28,229 574 27,655 514 17,098 1,473 62%Vagrancy 442 - 442 8 279 7 63%Other (Except Traffic) 41,043 879 40,164 747 30,586 3,367 76%
Part 2 Total 221,591 4,457 217,134 4,037 132,113 11,810 61%Grand Total 368,015 7,315 360,700 6,706 172,764 16,991 48%
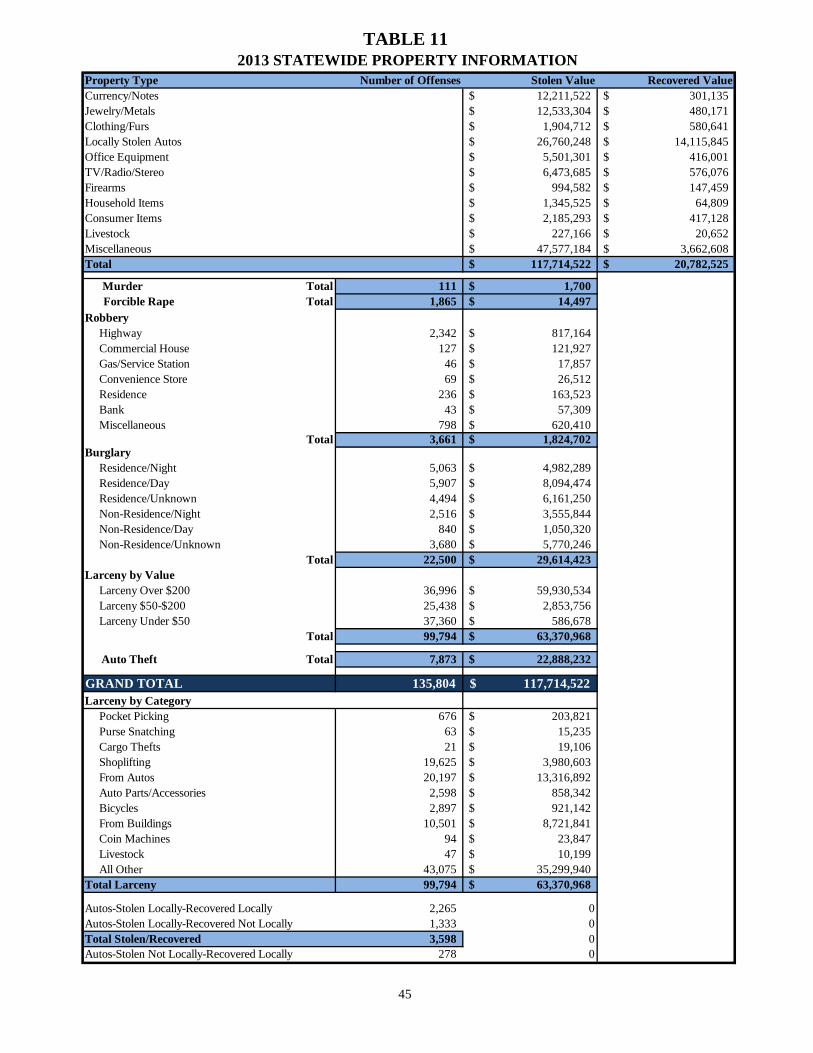
TABLE 11 2013 STATEWIDE PROPERTY INFORMATION
45
Property Type Number of Offenses Stolen Value Recovered ValueCurrency/Notes 12,211,522$ 301,135$ Jewelry/Metals 12,533,304$ 480,171$ Clothing/Furs 1,904,712$ 580,641$ Locally Stolen Autos 26,760,248$ 14,115,845$ Office Equipment 5,501,301$ 416,001$ TV/Radio/Stereo 6,473,685$ 576,076$ Firearms 994,582$ 147,459$ Household Items 1,345,525$ 64,809$ Consumer Items 2,185,293$ 417,128$ Livestock 227,166$ 20,652$ Miscellaneous 47,577,184$ 3,662,608$ Total 117,714,522$ 20,782,525$
Murder Total 111 1,700$ Forcible Rape Total 1,865 14,497$
Robbery Highway 2,342 817,164$ Commercial House 127 121,927$ Gas/Service Station 46 17,857$ Convenience Store 69 26,512$ Residence 236 163,523$ Bank 43 57,309$ Miscellaneous 798 620,410$
Total 3,661 1,824,702$ Burglary Residence/Night 5,063 4,982,289$ Residence/Day 5,907 8,094,474$ Residence/Unknown 4,494 6,161,250$ Non-Residence/Night 2,516 3,555,844$ Non-Residence/Day 840 1,050,320$ Non-Residence/Unknown 3,680 5,770,246$
Total 22,500 29,614,423$ Larceny by Value Larceny Over $200 36,996 59,930,534$ Larceny $50-$200 25,438 2,853,756$ Larceny Under $50 37,360 586,678$
Total 99,794 63,370,968$
Auto Theft Total 7,873 22,888,232$
GRAND TOTAL 135,804 117,714,522$ Larceny by Category Pocket Picking 676 203,821$ Purse Snatching 63 15,235$ Cargo Thefts 21 19,106$ Shoplifting 19,625 3,980,603$ From Autos 20,197 13,316,892$ Auto Parts/Accessories 2,598 858,342$ Bicycles 2,897 921,142$ From Buildings 10,501 8,721,841$ Coin Machines 94 23,847$ Livestock 47 10,199$ All Other 43,075 35,299,940$ Total Larceny 99,794 63,370,968$
Autos-Stolen Locally-Recovered Locally 2,265 0Autos-Stolen Locally-Recovered Not Locally 1,333 0Total Stolen/Recovered 3,598 0Autos-Stolen Not Locally-Recovered Locally 278 0
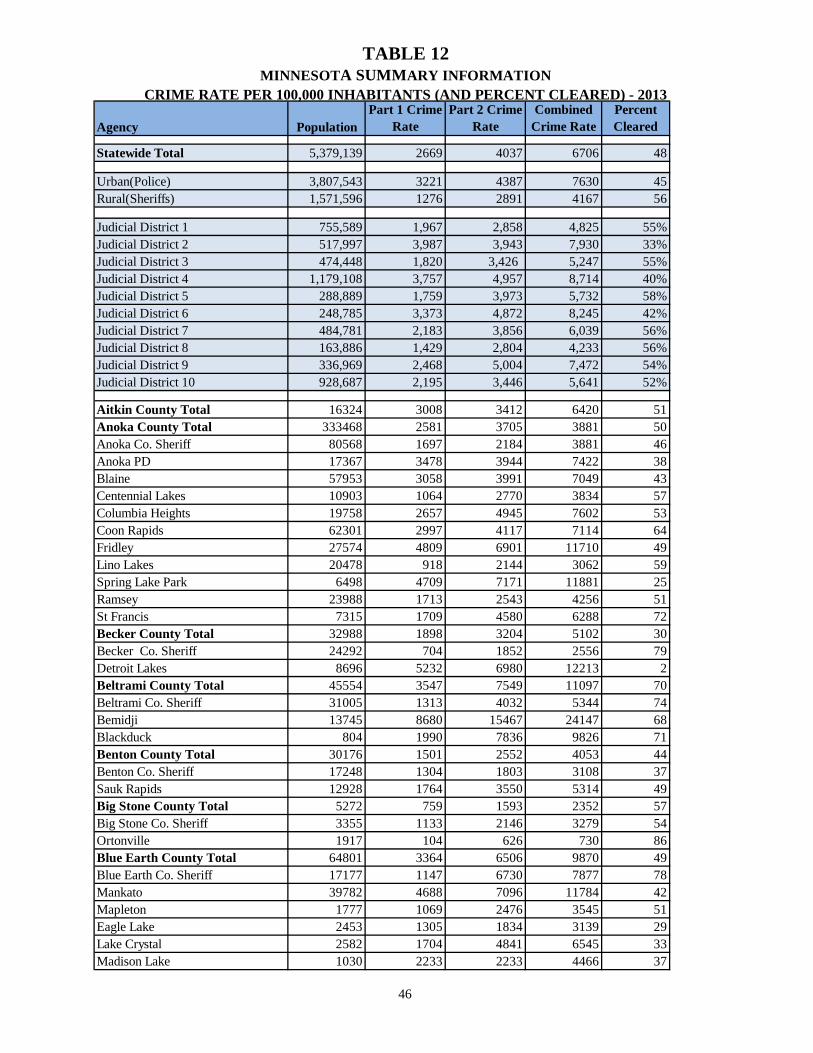
TABLE 12MINNESOTA SUMMARY INFORMATION
CRIME RATE PER 100,000 INHABITANTS (AND PERCENT CLEARED) - 2013
46
Agency PopulationPart 1 Crime
RatePart 2 Crime
RateCombined
Crime RatePercent Cleared
Statewide Total 5,379,139 2669 4037 6706 48
Urban(Police) 3,807,543 3221 4387 7630 45Rural(Sheriffs) 1,571,596 1276 2891 4167 56
Judicial District 1 755,589 1,967 2,858 4,825 55%Judicial District 2 517,997 3,987 3,943 7,930 33%Judicial District 3 474,448 1,820 3,426 5,247 55%Judicial District 4 1,179,108 3,757 4,957 8,714 40%Judicial District 5 288,889 1,759 3,973 5,732 58%Judicial District 6 248,785 3,373 4,872 8,245 42%Judicial District 7 484,781 2,183 3,856 6,039 56%Judicial District 8 163,886 1,429 2,804 4,233 56%Judicial District 9 336,969 2,468 5,004 7,472 54%Judicial District 10 928,687 2,195 3,446 5,641 52%
Aitkin County Total 16324 3008 3412 6420 51Anoka County Total 333468 2581 3705 3881 50Anoka Co. Sheriff 80568 1697 2184 3881 46Anoka PD 17367 3478 3944 7422 38Blaine 57953 3058 3991 7049 43Centennial Lakes 10903 1064 2770 3834 57Columbia Heights 19758 2657 4945 7602 53Coon Rapids 62301 2997 4117 7114 64Fridley 27574 4809 6901 11710 49Lino Lakes 20478 918 2144 3062 59Spring Lake Park 6498 4709 7171 11881 25Ramsey 23988 1713 2543 4256 51St Francis 7315 1709 4580 6288 72Becker County Total 32988 1898 3204 5102 30Becker Co. Sheriff 24292 704 1852 2556 79Detroit Lakes 8696 5232 6980 12213 2Beltrami County Total 45554 3547 7549 11097 70Beltrami Co. Sheriff 31005 1313 4032 5344 74Bemidji 13745 8680 15467 24147 68Blackduck 804 1990 7836 9826 71Benton County Total 30176 1501 2552 4053 44Benton Co. Sheriff 17248 1304 1803 3108 37Sauk Rapids 12928 1764 3550 5314 49Big Stone County Total 5272 759 1593 2352 57Big Stone Co. Sheriff 3355 1133 2146 3279 54Ortonville 1917 104 626 730 86Blue Earth County Total 64801 3364 6506 9870 49Blue Earth Co. Sheriff 17177 1147 6730 7877 78Mankato 39782 4688 7096 11784 42Mapleton 1777 1069 2476 3545 51Eagle Lake 2453 1305 1834 3139 29Lake Crystal 2582 1704 4841 6545 33Madison Lake 1030 2233 2233 4466 37

TABLE 12MINNESOTA SUMMARY INFORMATION
CRIME RATE PER 100,000 INHABITANTS (AND PERCENT CLEARED) - 2013
47
Agency PopulationPart 1 Crime
RatePart 2 Crime
RateCombined
Crime RatePercent Cleared
Brown County Total 25899 815 2730 3545 69Brown Co. Sheriff 6621 91 574 665 59New Ulm 13526 1479 4650 6129 67Sleepy Eye 3600 139 1111 1250 100Springfield** 2152 0 0 0 0Carlton County Total 35682 2559 3912 6471 42Carlton Co. Sheriff 20685 1334 2823 4158 29Cloquet 12226 4196 5611 9807 55Moose Lake 2771 4475 4547 9022 23Carver County Total 93232 1139 2056 3195 61Carver Co. Sheriff 68888 1112 2024 3136 58Chaska 24344 1216 2148 3364 67Cass County Total 28572 4462 9415 13877 24Chippewa County Total 11549 1524 1602 3126 58Chippewa Co. Sheriff 6184 550 517 1067 20Montevideo 5365 2647 2852 5499 66Chisago County Total 54262 1502 2584 4086 43Chisago Co. Sheriff 26746 879 2150 3028 45North Branch 10196 3492 3031 6522 33Wyoming 7847 981 1988 2969 57Lakes Area PD 9473 1552 3821 5373 46Clay County Total 60187 1941 4071 6011 50Clay Co. Sheriff 17266 521 1981 2502 59Dilworth 4108 4552 6353 10906 72Moorhead 38813 2296 4759 7054 45Clearwater County Total 8830 1416 4519 5934 67Cook County Total 5251 3104 5123 8227 27Cottonwood County Total 11761 1131 4430 5561 68Cottonwood Co. Sheriff 4968 946 2073 3019 49Mountain Lake 2117 472 2787 3259 100Windom 4676 1625 7678 9303 70Crow Wing County Total 63166 2856 4023 6879 49Crow Wing Co. Sheriff 39331 1396 1437 2832 40Brainerd 13734 5985 11628 17613 45Crosby 2410 954 1992 2946 66Baxter 7691 5331 4304 9635 71Dakota County Total 403420 2310 2767 5077 57Dakota Co. Sheriff 18346 1205 3728 4933 85Burnsville 61218 3216 2860 6077 27Farmington 21403 986 1766 2752 47Hastings 22502 2413 2866 5280 46Mendota Heights 11240 2625 2144 4769 45Rosemount 22206 1139 2567 3706 55South St Paul 20465 3181 3763 6944 100West St Paul 19834 5289 3610 8899 76Eagan 65180 2037 2416 4454 51Inver Grove Hgts 34394 2463 2899 5361 98Apple Valley 49827 2436 3524 5961 52
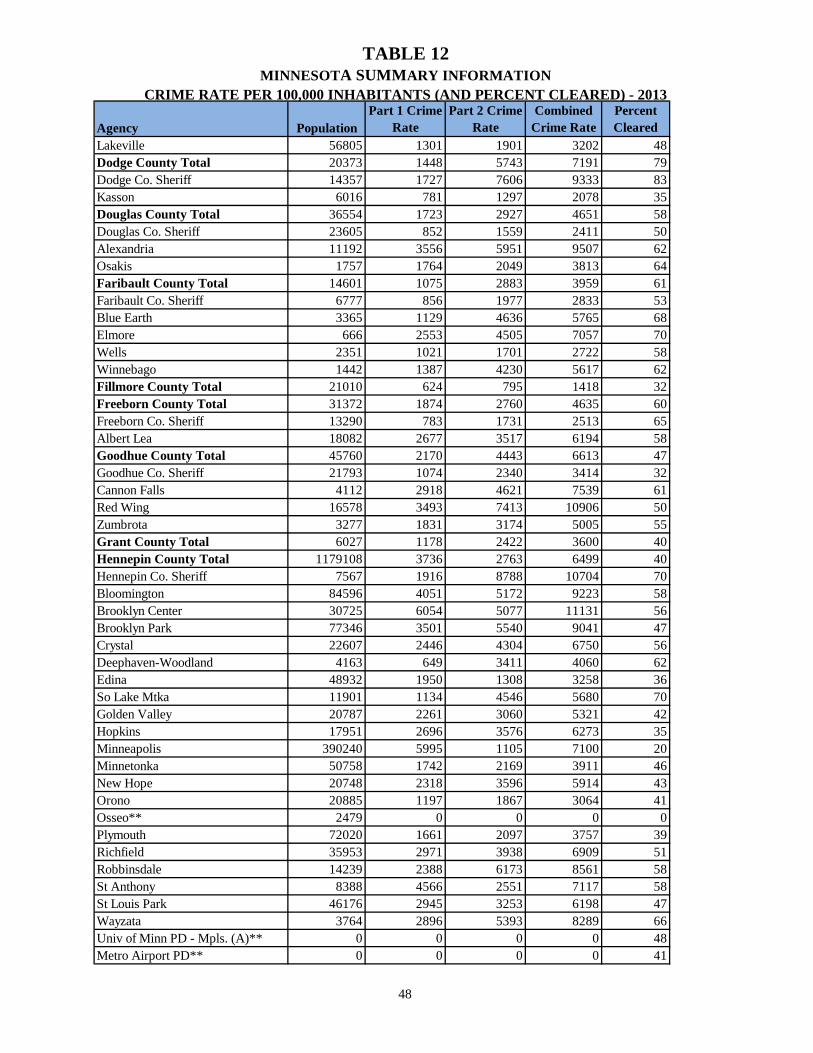
TABLE 12MINNESOTA SUMMARY INFORMATION
CRIME RATE PER 100,000 INHABITANTS (AND PERCENT CLEARED) - 2013
48
Agency PopulationPart 1 Crime
RatePart 2 Crime
RateCombined
Crime RatePercent Cleared
Lakeville 56805 1301 1901 3202 48Dodge County Total 20373 1448 5743 7191 79Dodge Co. Sheriff 14357 1727 7606 9333 83Kasson 6016 781 1297 2078 35Douglas County Total 36554 1723 2927 4651 58Douglas Co. Sheriff 23605 852 1559 2411 50Alexandria 11192 3556 5951 9507 62Osakis 1757 1764 2049 3813 64Faribault County Total 14601 1075 2883 3959 61Faribault Co. Sheriff 6777 856 1977 2833 53Blue Earth 3365 1129 4636 5765 68Elmore 666 2553 4505 7057 70Wells 2351 1021 1701 2722 58Winnebago 1442 1387 4230 5617 62Fillmore County Total 21010 624 795 1418 32Freeborn County Total 31372 1874 2760 4635 60Freeborn Co. Sheriff 13290 783 1731 2513 65Albert Lea 18082 2677 3517 6194 58Goodhue County Total 45760 2170 4443 6613 47Goodhue Co. Sheriff 21793 1074 2340 3414 32Cannon Falls 4112 2918 4621 7539 61Red Wing 16578 3493 7413 10906 50Zumbrota 3277 1831 3174 5005 55Grant County Total 6027 1178 2422 3600 40Hennepin County Total 1179108 3736 2763 6499 40Hennepin Co. Sheriff 7567 1916 8788 10704 70Bloomington 84596 4051 5172 9223 58Brooklyn Center 30725 6054 5077 11131 56Brooklyn Park 77346 3501 5540 9041 47Crystal 22607 2446 4304 6750 56Deephaven-Woodland 4163 649 3411 4060 62Edina 48932 1950 1308 3258 36So Lake Mtka 11901 1134 4546 5680 70Golden Valley 20787 2261 3060 5321 42Hopkins 17951 2696 3576 6273 35Minneapolis 390240 5995 1105 7100 20Minnetonka 50758 1742 2169 3911 46New Hope 20748 2318 3596 5914 43Orono 20885 1197 1867 3064 41Osseo** 2479 0 0 0 0Plymouth 72020 1661 2097 3757 39Richfield 35953 2971 3938 6909 51Robbinsdale 14239 2388 6173 8561 58St Anthony 8388 4566 2551 7117 58St Louis Park 46176 2945 3253 6198 47Wayzata 3764 2896 5393 8289 66Univ of Minn PD - Mpls. (A)** 0 0 0 0 48Metro Airport PD** 0 0 0 0 41

TABLE 12MINNESOTA SUMMARY INFORMATION
CRIME RATE PER 100,000 INHABITANTS (AND PERCENT CLEARED) - 2013
49
Agency PopulationPart 1 Crime
RatePart 2 Crime
RateCombined
Crime RatePercent Cleared
Eden Prairie 62052 1508 1844 3352 49Maple Grove 62840 1782 2879 4661 57Minnetrista 8846 667 2374 3041 73Champlin 23568 1693 2160 3853 33Medina 4995 1842 3524 5365 73Corcoran** 5491 0 0 0 0Dayton 4766 1616 1301 2916 46Rogers PD 8945 2683 4092 6775 48West Hennepin 5380 799 3383 4182 76Three Rivers Park (A)** 0 0 0 0 58Houston County Total 19037 562 4612 5174 68Houston Co. Sheriff 8417 796 6653 7449 79Caledonia 2868 314 8473 8787 50Houston PD 979 1532 5516 7048 51La Crescent** 4864 0 0 0 0Spring Grove** 1330 0 0 0 0Hokah 579 2763 3627 6390 38Hubbard County Total 20433 2315 5907 8222 67Hubbard Co. Sheriff 16723 1447 5119 6566 66Park Rapids 3710 6226 9461 15687 70Isanti County Total 38529 1851 2979 4830 59Isanti Co. Sheriff 24917 1164 2047 3211 62Cambridge 8262 3837 6124 9961 54Isanti PD 5350 1981 2467 4449 68Itasca County Total 45323 2204 4600 6804 72Itasca Co. Sheriff 34391 1247 3004 4251 64Grand Rapids 10932 5214 9623 14837 78Jackson County Total 10267 945 1422 2367 49Jackson Co. Sheriff 8574 886 1365 2251 50Jackson PD** 3302 0 0 0 0Lakefield 1693 1240 1713 2953 46Kanabec County Total 16273 1930 4019 5949 98Kanabec Co. Sheriff 16273 1930 4019 5949 98Kandiyohi County Total 42443 2055 3306 5360 53Kandiyohi Co. Sheriff 22735 1086 2234 3321 52Willmar 19708 3171 4541 7713 54Kittson County Total 4544 594 2773 3367 51Kittson Co. Sheriff 3565 757 3534 4292 51Hallock** 979 0 0 0 0KoochichingCounty Total 13298 2384 5429 7813 22Koochiching Co. Sheriff 6881 1250 4011 5261 24International Falls 6417 3600 6950 10550 21Lac Qui Parle County Total 7239 748 1229 1975 62Lac Qui Parle Co. Sheriff 5703 684 1017 1701 55Dawson 1536 977 2018 2995 76Madison** 1527 0 0 0 0Lake County Total 10893 955 1781 2736 42Lake Co. Sheriff 5246 438 1296 1735 42

TABLE 12MINNESOTA SUMMARY INFORMATION
CRIME RATE PER 100,000 INHABITANTS (AND PERCENT CLEARED) - 2013
50
Agency PopulationPart 1 Crime
RatePart 2 Crime
RateCombined
Crime RatePercent Cleared
Silver Bay 1893 211 1743 1955 41Two Harbors 3754 2051 2477 4529 42Lake of the Woods County Total 4033 446 1636 2083 75Le Sueur County Total 24786 1105 1682 2788 61Le Sueur Co. Sheriff 17741 688 614 1302 60Le Sueur PD 4076 1595 5888 7483 77Montgomery 2969 2930 2290 5221 30Lincoln County Total 5857 478 2442 2920 26Lyon County Total 26057 1727 3158 4885 66Lyon Co. Sheriff 10089 367 1289 1655 72Marshall 13788 2995 5026 8021 65Tracy** 2180 0 0 0 0McLeod County Total 36666 1936 4811 6747 56McLeod Co. Sheriff 11162 1066 8744 9810 72Glencoe 5634 1722 3142 4863 52Hutchinson 14183 2954 3011 5965 40Brownton 762 919 2362 3281 40Lester Prairie 1732 1732 3753 5485 52Silver Lake 836 1435 2990 4426 51Winsted 2357 1103 3224 4328 50Mahnomen County Total 5491 1767 3770 5536 24Marshall County Total** 9542 0 0 0 0Martin County Total 20822 1647 4207 5854 57Martin Co. Sheriff 10165 403 974 1377 59Fairmont 10657 2834 7291 10125 56Meeker County Total 23414 1380 3007 4386 47Meeker Co. Sheriff 16656 1339 2882 4221 47Litchfield 6758 1480 3315 4794 48Mille Lacs County Total 26196 3466 11391 14857 78Mille Lacs Co. Sheriff 18537 3706 15013 18719 81Milaca 2953 1795 1524 3319 54Princeton 4706 3570 3315 6885 53Morrison County Total 33442 1340 2329 3669 60Morrison Co. Sheriff 25039 970 1625 2596 57Little Falls 8403 2440 4427 6867 64Mower County Total 39601 2492 8853 11346 70Mower Co. Sheriff 14608 1164 5340 6503 71Austin 24993 3269 10907 14176 69Murray County Total 8685 679 1693 2372 100Murray Co. Sheriff 6540 627 1606 2232 99Slayton 2145 839 1958 2797 100Nicollet County Total 33020 1920 5542 7462 63Nicollet Co. Sheriff 8202 988 10059 11046 74North Mankato 13523 2174 3890 6064 58St Peter 11295 2293 4241 6534 55Nobles County Total 21534 1063 2015 3079 68Nobles Co. Sheriff 8676 507 968 1475 66Worthington 12858 1439 2722 4161 69

TABLE 12MINNESOTA SUMMARY INFORMATION
CRIME RATE PER 100,000 INHABITANTS (AND PERCENT CLEARED) - 2013
51
Agency PopulationPart 1 Crime
RatePart 2 Crime
RateCombined
Crime RatePercent Cleared
Norman County Total 6913 29 0 29 50Olmsted County Total 146704 2138 2547 4684 47Olmsted Co. Sheriff 38122 939 1747 2686 48Rochester 108582 2558 2827 5386 47Ottertail County Total 58553 1699 3962 5662 65Ottertail Co. Sheriff 44344 1069 2397 3466 55Fergus Falls 13209 3944 9516 13461 74Pennington County Total 14162 1582 2966 4547 64Pennington Co. Sheriff 5446 973 1873 2846 66Thief River Falls 8716 1962 3648 5610 63Pine County Total 29794 4662 3447 8109 46Pipestone County Total 9562 931 2092 3022 32Polk County Total 31658 1914 5702 7616 66Polk Co. Sheriff 15136 1513 3799 5312 56Crookston 7907 1214 4768 5982 74East Grand Forks 8615 3262 9901 13163 70Pope County Total 10964 1231 2207 3439 40Pope Co. Sheriff 8407 940 1737 2676 48Glenwood 2557 2190 3754 5944 28Ramsey County Total 516127 3955 1864 5820 30Ramsey Co. Sheriff 423 7801 40189 47991 83Arden Hills 9704 1587 1515 3102 37Falcon Heights 5416 2105 1809 3914 51Lauderdale 2423 1610 2187 3797 63Maplewood 38719 6126 3567 9693 38Mounds View 12384 3052 4772 7825 42New Brighton 21854 2594 2096 4690 32North St Paul 11675 2193 1824 4017 38Roseville 34276 4473 3113 7585 38St Paul 290700 4531 971 5502 21White Bear Lake 24241 2875 6167 9043 47White Bear Lake Township 11115 1368 1116 2483 41Little Canada 9956 2802 3104 5906 42Shoreview 25513 1231 1391 2622 38Vadnais Heights 12533 2497 2465 4963 50North Oaks 4552 901 681 1582 26Red Lake County Total 4131 460 2566 3026 75Redwood County Total 16074 1132 2569 3702 58Redwood Co. Sheriff 10814 314 1054 1369 50Redwood Falls 5260 2814 5684 8498 61Renville County Total 15599 1231 2801 4032 61Renville Co. Sheriff 13134 914 2025 2939 61Olivia 2465 2921 6937 9858 62RiceCounty Total 65986 2122 2787 4909 38Rice Co. Sheriff 22173 1051 1560 2611 32Faribault PD 23600 3720 4322 8042 34Northfield 20213 1430 2340 3770 49Rock County Total 9676 1592 3286 4878 77

TABLE 12MINNESOTA SUMMARY INFORMATION
CRIME RATE PER 100,000 INHABITANTS (AND PERCENT CLEARED) - 2013
52
Agency PopulationPart 1 Crime
RatePart 2 Crime
RateCombined
Crime RatePercent Cleared
Roseau County Total 15640 1419 3139 4559 27Roseau Co. Sheriff 11224 918 2388 3305 25Roseau PD 2635 2353 3909 6262 23Warroad 1781 3200 6738 9938 34St Louis County Total 196959 3604 5134 8738 43St Louis Co. Sheriff 58829 1523 2954 4477 39Babbitt 1484 3706 4582 8288 38Chisholm 5008 2796 1298 4093 31Duluth 86830 5351 6970 12321 41Ely 3482 1781 4078 5859 46Eveleth 3742 3928 8792 12720 54Gilbert 1810 110 55 166 33Hibbing 16469 61 200 261 84Hoyt Lakes 2031 49 0 49 0Proctor 3078 4094 5166 9259 35Virginia 8769 6409 10765 17174 54Floodwood 531 6215 11676 17891 28Hermantown 9476 3978 3071 7049 37Univ. of Minn - Duluth (A)** 0 0 0 0 75Scott County Total 136459 1825 3153 4978 50Scott Co. Sheriff 27454 127 896 1024 60Belle Plaine 6836 1287 3408 4696 67Jordan 5619 1175 2865 4040 56New Prague 7448 1625 5827 7452 64Shakopee 38057 2833 2980 5812 48Savage 27635 2305 4046 6351 47Prior Lake 23410 1986 4173 6160 47Sherburne County Total 82962 1238 2981 4219 61Sherburne Co. Sheriff 44796 837 2480 3317 67Big Lake 10222 1223 2240 3463 36Elk River 23335 2066 4153 6218 60Becker PD 4609 976 3558 4535 70Sibley County Total** 15266 0 0 0 0Stearns County Total 167937 2909 3575 6484 51Stearns Co. Sheriff 50396 758 1806 2564 45Cold Spring 5508 490 2651 3141 69Melrose 3637 715 1210 1925 50Paynesville 2459 1993 3538 5531 34St Cloud 66593 4681 5356 10037 51Sauk Centre 4367 2542 4717 7259 56Waite Park 6790 11163 7084 18247 69Belgrade** 748 0 0 0 0Kimball** 771 0 0 0 0St Joseph 6600 636 1455 2091 62Sartell 16056 1981 2286 4266 35Albany 2601 1230 2076 3306 34Avon 1411 1701 3189 4890 48Steele County Total 36768 2268 3264 5532 50

TABLE 12MINNESOTA SUMMARY INFORMATION
CRIME RATE PER 100,000 INHABITANTS (AND PERCENT CLEARED) - 2013
53
Agency PopulationPart 1 Crime
RatePart 2 Crime
RateCombined
Crime RatePercent Cleared
Steele Co. Sheriff 9027 1285 3157 4442 50Owatonna 25734 2782 3509 6291 49Blooming Prairie 2007 100 598 698 71Stevens County Total 9747 1436 4637 6074 76Stevens Co. Sheriff 4448 652 2833 3485 75Morris 5299 2076 5586 7662 75Univ. of Minn - Morris PD (A)** 0 0 0 0 97Swift County Total 9702 1680 2845 4525 53Swift Co. Sheriff 5087 491 1651 2143 72Appleton 1401 2926 5996 8922 48Benson 3214 3018 3360 6378 46Todd County Total 25719 1446 3935 5381 64Todd Co. Sheriff 19253 1080 3449 4529 60Long Prairie 3473 1987 4895 6882 59Staples 2993 3174 5947 9121 81Traverse County Total** 3546 0 0 0 0TraverseCo. Sheriff** 2127 0 0 0 0Wheaton** 1419 0 0 0 0Wabasha County Total 22492 1116 2516 3632 44Wabasha Co. Sheriff 11533 598 1977 2575 28Lake City 5080 2559 2854 5413 51Plainview 3350 299 1403 1701 25Wabasha PD 2529 1661 5773 7434 65Wadena County Total 13029 721 1888 2610 63Wadena Co. Sheriff 8943 749 1722 2471 55Wadena PD 4086 661 2252 2912 77Waseca County Total 19397 1619 3882 5501 56Waseca Co. Sheriff 6353 1385 5682 7068 55Janesville 2286 744 2450 3193 64New Richland 1220 164 1557 1721 43Waseca PD 9538 2170 3324 5494 56Washington County Total 242415 2245 4059 6304 47Washington Co. Sheriff 61885 1361 3927 5287 49Bayport 3518 540 4292 4832 82Forest Lake 18738 2055 4077 6132 51Newport 3503 3540 9106 12646 70St Paul Park 5384 2767 8488 11256 68Stillwater 18582 1819 4693 6512 46Cottage Grove 35277 2015 3773 5788 48Oakdale 27921 4395 4566 8961 27Woodbury 63190 2227 2951 5178 51Oak Park Heights 4417 5434 8490 13923 47Watonwan County Total 11273 1198 2510 3708 65Watonwan Co. Sheriff 6636 663 1371 2034 67St James 4637 1962 4141 6103 64Wilkin County Total 6634 1266 5366 6632 74Wilkin 3217 777 2549 3326 76Breckenridge 3417 1727 8019 9745 73

TABLE 12MINNESOTA SUMMARY INFORMATION
CRIME RATE PER 100,000 INHABITANTS (AND PERCENT CLEARED) - 2013
54
Agency PopulationPart 1 Crime
RatePart 2 Crime
RateCombined
Crime RatePercent Cleared
Winona County Total 51708 1145 3044 4189 64Winona Co. Sheriff 14543 646 2757 3404 65St Charles 3752 506 1013 1519 47Winona PD 27731 1536 3498 5034 64Goodview 4055 1258 3773 5031 67Lewiston 1627 123 738 860 71Wright County Total 127193 1619 2440 4058 57Wright Co. Sheriff 108136 1551 2341 3892 59Buffalo 15765 2271 3432 5703 47Annandale 3292 729 911 1640 94Yellow Medicine County Total 11222 891 1978 2869 61Yellow Medicine Co. Sheriff 5421 683 2158 2841 62Canby 1785 952 504 1457 35Granite Falls 2882 1423 3123 4545 68Clarkfield 858 350 233 583 40Echo 276 725 1449 2174 17*Estimated 2012 population, F.B.I. Crime statistics include all Larceny offenses regardless of value. ** No data submitted(A) Population not calculated.

TABLE 13MINNESOTA CRIME INDEX SUMMARY
1936-2013
55
Crime Motor CrimeIndex Aggravated Vehicle Rate per
Year Population Total Murder Rape Robbery Assault Burglary Larceny Theft Arson 100,000
1936 2,563,953 16,753 38 101 788 274 4,778 7,203 3,571 654.61937 2,723,798 17,065 35 73 661 180 4,000 8,843 3,273 666.01938 2,746,633 19,312 33 127 648 175 4,203 10,984 3,142 702.21939 2,769,468 20,139 54 156 649 207 4,665 11,582 2,826 728.2
1940 2,792,300 19,514 35 208 416 210 4,967 11,473 2,205 701.01941 2,792,300 18,939 46 237 313 191 4,497 11,445 2,210 680.21942 2,792,300 16,444 36 163 271 187 3,665 10,387 1,735 591.21943 2,615,554 13,886 38 174 194 126 3,112 8,595 1,647 521.81944 2,564,052 13,096 33 138 174 142 3,052 7,986 1,571 498.81945 2,556,050 14,903 30 124 284 150 3,333 8,703 2,279 567.81946 2,574,628 17,074 36 152 337 195 3,866 10,228 2,260 649.71947 2,663,891 17,088 25 158 420 191 3,861 10,189 2,244 631.11948 2,716,567 19,216 39 177 469 172 4,514 12,030 1,815 700.41949 2,693,651 19,166 23 148 495 158 4,399 11,946 1,997 700.8
1950 2,665,321 19,416 30 199 448 130 4,491 12,245 1,873 719.21951 2,869,686 20,931 30 148 418 103 4,708 13,291 2,233 714.81952 2,822,386 23,290 23 171 496 152 5,514 14,582 2,352 800.61953 2,872,211 26,074 34 222 618 206 6,472 15,698 2,824 895.71954 3,138,872 28,582 23 182 764 235 7,532 17,277 2,569 993.51955 3,190,641 27,517 28 185 580 197 7,164 16,622 2,741 938.61956 3,248,196 34,539 31 181 648 162 8,098 21,972 3,447 1181.61957 3,307,232 34,271 43 210 635 171 8,224 21,667 3,321 1168.61958 3,369,066 39,012 30 127 703 229 9,504 24,827 3,592 1184.81959 3,419,316 39,135 38 78 644 257 9,185 25,021 3,912 1163.8
1960 3,413,964 47,200 40 76 945 329 11,732 29,515 4,563 1400.41961 3,458,000 49,348 36 96 932 381 12,489 30,721 4,693 1443.81962 3,493,000 52,640 34 124 1,030 475 12,479 33,523 4,975 1574.51963 3,407,000 58,196 46 86 1,176 596 13,238 37,916 5,138 1697.31964 3,529,000 69,773 51 144 1,295 1,165 18,634 42,171 6,313 2077.01965 3,565,000 70,665 56 169 1,433 1,400 18,730 41,756 7,121 2073.61966 3,585,000 79,612 77 252 1,758 1,577 20,815 46,367 8,766 2301.51967 3,625,000 92,589 65 298 2,410 1,986 25,251 52,154 10,425 2654.01968 3,647,000 107,840 80 389 2,965 1,697 29,225 60,746 12,738 3001.01969 3,647,000 114,182 76 419 3,024 1,765 29,060 65,605 14,233 3178.4
1970 3,739,327 124,005 75 365 3,422 1,963 30,766 74,243 13,171 3319.61971 3,780,797 135,920 89 466 2,987 2,435 33,827 82,881 13,235 3596.41972 3,799,660 130,527 94 570 3,290 2,851 36,063 74,529 13,130 3440.01973 3,892,140 137,617 97 577 3,454 2,785 39,581 78,026 13,097 3576.41974 3,865,004 152,193 113 687 4,071 3,221 43,322 86,248 14,531 3921.71975 3,892,819 168,537 124 724 4,068 3,186 46,218 99,295 14,922 4328.01976 3,907,310 170,319 94 724 3,178 3,470 44,137 105,018 13,698 4358.51977 3,952,492 166,612 102 770 3,404 3,402 44,748 100,604 13,582 4213.21978 3,959,729 164,593 81 795 3,407 3,298 43,477 100,624 12,911 4157.41979 4,003,327 177,929 98 870 3,752 4,245 45,053 110,571 13,340 4444.9

TABLE 13MINNESOTA CRIME INDEX SUMMARY
1936-2013
56
Crime Motor CrimeIndex Aggravated Vehicle Rate per
Year Population Total Murder Rape Robbery Assault Burglary Larceny Theft Arson 100,000
1980 4,057,669 195,992 104 942 4,022 4,169 50,507 122,728 12,008 1,512 4803.21981 4,077,148 194,933 83 1,055 4,268 3,938 52,231 121,652 10,305 1,401 4781.11982 4,086,180 185,319 95 938 4,190 3,844 48,899 116,425 9,819 1,109 4535.21983 4,130,589 168,265 66 932 3,299 3,625 44,585 106,106 8,674 978 4073.61984 4,142,071 160,864 74 1,049 2,962 4,719 41,221 101,166 8,594 1,079 3883.61985 4,161,580 174,909 85 1,243 3,603 5,832 42,727 109,299 11,008 1,112 4202.91986 4,193,000 185,719 100 1,348 4,303 6,270 42,484 117,769 12,168 1,277 4429.21987 4,214,000 198,084 110 1,445 4,351 6,244 45,563 126,255 12,850 1,266 4701.01988 4,246,000 187,000 123 1,333 4,079 6,952 39,154 119,520 14,603 1,236 4404.01989 4,306,000 191,989 108 1,357 4,129 6,946 39,021 122,640 16,536 1,252 4458.6
1990 4,353,000 199,345 123 1,640 4,091 6,863 39,272 130,618 15,489 1,249 4579.41991 4,375,099 203,107 122 1,791 4,356 7,840 38,419 132,777 16,302 1,500 4642.31992 4,432,000 207,047 141 2,900 4,897 7,790 39,754 134,233 15,863 1,469 4671.01993 4,480,000 199,691 145 2,713 5,085 7,923 37,951 128,964 15,408 1,502 4457.31994 4,567,000 199,362 148 2,762 5,370 8,124 36,111 130,839 14,321 1,687 4365.41995 4,567,000 206,710 183 2,571 5,689 7,876 36,305 136,881 15,625 1,580 4526.21996 4,610,000 210,246 168 2,353 5,387 7,931 35,667 139,131 17,983 1,626 4560.51997 4,658,000 207,970 128 2,441 5,373 7,875 35,228 137,685 17,843 1,397 4464.71998 4,686,000 192,924 120 2,365* 4,370 8,000* 32,505 128,757 15,373 1,434 4117.01999 4,725,000 171,376 129 2,238 3,902 6,983 27,455 116,356 13,142 1,171 3627.0
2000 4,776,000 173,498 138 2,241 3,737 7,819 26,178 118,661 13,529 1,195 3632.72001 4,919,479 176,317 111 2,201 3,740 6,968 25,028 122,254 14,838 1,177 3584.12002 4,972,294 177,543 115 2,258 3,929 7,076 27,898 121,342 13,771 1,154 3570.62003 5,019,720 172,666 121 2,387 3,921 7,198 27,647 116,430 13,654 1,308 3439.82004 5,059,375 169,575 110 2,373 4,049 7,396 27,754 113,433 13,410 1,050 3351.72005 5,100,958 173,960 125 2,442 4,714 8,255 29,564 113,307 14,249 1,304 3410.32006 5,132,799 172,793 120 2,562 5,390 8,655 29,496 112,516 12,961 1,093 3366.42007 5,167,101 168,271 111 2,341 4,695 8,081 28,790 111,216 12,179 858 3256.62008 5,197,621 164,956 109 2,292 4,148 7,536 26,063 110,372 9,948 908 3104.82009 5,220,393 151,084 69 2,229 3,607 7,131 25,165 103,695 8,379 809 2894.0
2010 5,226,214 150,847 90 2,230 3,363 6,978 23,947 101,616 8,398 675 2797.02011 5,303,925 146,249 73 2,080 3,359 6,364 25,123 100,636 7,927 657 2757.42012 5,344,861 148,330 92 2,060 3,450 6,721 24,829 102,154 8,251 773 2775.12013 5,379,139 143,566 111 1,971 3,661 6,726 22,500 99,794 7,873 930 2668.9
57
MINNESOTA ARREST INFORMATION
GENERAL ARREST INFORMATION Arrest information for Minnesota in 2013 is presented with a state total concerning age, sex, and race factors. Data has also been tabulated for the specific kinds of narcotic arrests and the individuals involved. The total number of arrests involving criminal offenses in the state in 2013 was 160,797 with 116,494 males and 44,303 females arrested. There are also significant factors to consider when arrest data is evaluated: • There can be multiple persons arrested for the
same offense. • An arrest of one or more persons can be reported
for an offense that occurred during a previous reporting period.
As a result of the above factors, arrests in most cases will outnumber offenses.
In reporting the arrests of a juvenile, the FBI's instructions state that: "The UCR Program considers a juvenile to be an
individual under 18 years of age regardless of the state definition. An agency must score a juvenile arrest when the cirrcumstances are such that if the individual were an adult, an arrest would have been counted." *
Juveniles (persons under 18 years) constitute 17% (26,780) of all arrests during 2013 and account for 21% (7,067) of the Part I arrests: 7 percent of Murder, 16 percent of Rape, 29 percent of Robbery, 12 percent of Aggravated Assault, 17 percent of the Burglary, 22 percent of the Larceny, 18 percent of the Vehicle Theft, and 41 percent of the Arson arrests.
* Uniform Crime Reporting Handbook, U.S. Dept. of Justice, F.B.I., Washington, DC, 2004, pg. 101.

TABLE 14TOTAL ARRESTS BY AGE AND SEX IN MINNESOTA FOR 2013
58
Under Total 65 & GRAND Offense 10 10-12 13-14 15 16 17 Under 18 18 19 20 21 22 23 24 25-29 30-34 35-39 40-44 45-49 50-54 55-59 60-64 Over TOTAL
Murder/Non- M 0 0 0 0 1 5 6 1 5 3 4 5 1 5 15 10 5 3 2 4 0 2 0 71Negligent F 0 0 0 0 0 0 0 2 0 1 0 0 0 2 5 2 0 1 0 2 0 0 0 15Manslaughter T 0 0 0 0 1 5 6 3 5 4 4 5 1 7 20 12 5 4 2 6 0 2 0 86Negligent M 0 0 0 0 0 0 0 0 0 0 0 0 0 0 0 2 1 0 0 0 0 0 0 3Manslaughter F 0 0 0 0 0 0 0 0 0 0 0 0 0 0 0 0 1 0 1 0 0 0 0 2
T 0 0 0 0 0 0 0 0 0 0 0 0 0 0 0 2 2 0 1 0 0 0 0 5Rape M 1 12 12 15 22 27 89 43 35 26 29 23 17 15 59 66 46 39 25 16 9 5 4 546
F 0 0 0 1 0 1 2 1 1 2 1 1 0 0 0 3 2 2 2 0 0 0 0 17T 1 12 12 16 22 28 91 44 36 28 30 24 17 15 59 69 48 41 27 16 9 5 4 563
Robbery M 0 11 51 60 88 100 310 97 89 69 51 57 55 39 122 50 34 27 28 14 2 0 1 1045F 0 1 7 12 6 10 36 16 13 6 12 8 10 2 21 8 8 3 3 2 0 1 0 149T 0 12 58 72 94 110 346 113 102 75 63 65 65 41 143 58 42 30 31 16 2 1 1 1194
Aggravated M 1 41 83 48 83 73 329 91 97 98 119 116 114 117 557 431 252 270 166 162 82 28 20 3049Assault F 1 9 28 26 21 24 109 16 22 21 34 31 33 36 130 90 68 59 41 41 13 1 5 750
T 2 50 111 74 104 97 438 107 119 119 153 147 147 153 687 521 320 329 207 203 95 29 25 3799Burglary M 0 23 65 108 116 93 405 166 164 126 129 114 83 80 358 236 171 114 99 59 19 3 5 2331
F 1 5 14 7 3 10 40 16 13 10 18 16 10 20 63 44 21 24 18 6 4 1 1 325T 1 28 79 115 119 103 445 182 177 136 147 130 93 100 421 280 192 138 117 65 23 4 6 2656
Larceny M 6 274 797 678 708 718 3181 755 654 633 557 504 467 408 1751 1250 842 867 695 621 322 126 101 13734F 5 160 538 466 582 586 2337 532 471 466 412 397 439 374 1606 1240 849 718 602 439 204 111 98 11295T 11 434 1335 1144 1290 1304 5518 1287 1125 1099 969 901 906 782 3357 2490 1691 1585 1297 1060 526 237 199 25029
Motor Vehicle M 1 5 24 33 45 37 145 44 62 38 41 43 39 23 154 88 49 47 28 22 6 1 0 830Theft F 0 1 7 10 10 8 36 10 5 10 7 5 4 5 41 26 11 13 9 3 1 0 0 186
T 1 6 31 43 55 45 181 54 67 48 48 48 43 28 195 114 60 60 37 25 7 1 0 1016 Arson M 3 10 15 5 3 2 38 4 0 0 4 1 2 1 8 8 3 6 2 1 2 1 0 81
F 0 0 1 0 1 2 4 0 1 1 1 0 2 1 3 4 1 2 0 0 1 0 0 21T 3 10 16 5 4 4 42 4 1 1 5 1 4 2 11 12 4 8 2 1 3 1 0 102
Part 1 Total M 12 376 1047 947 1066 1055 4503 1201 1106 993 934 863 778 688 3024 2141 1403 1373 1045 899 442 166 131 21690F 7 176 595 522 623 641 2564 593 526 517 485 458 498 440 1869 1417 961 822 676 493 223 114 104 12760T 19 552 1642 1469 1689 1696 7067 1794 1632 1510 1419 1321 1276 1128 4893 3558 2364 2195 1721 1392 665 280 235 34450
Other Assault M 14 238 520 288 343 311 1714 235 310 331 410 388 441 415 1728 1568 1109 956 719 622 302 137 103 11488F 5 105 296 183 165 142 896 110 108 89 148 117 100 104 494 398 302 215 192 135 49 20 20 3497T 19 343 816 471 508 453 2610 345 418 420 558 505 541 519 2222 1966 1411 1171 911 757 351 157 123 14985
Fogery/ M 1 0 6 2 8 3 20 24 25 23 31 27 24 25 121 89 56 44 38 26 13 5 3 594Counterfeiting F 0 0 0 1 2 3 6 22 22 13 27 18 21 20 95 57 45 21 22 8 3 0 1 401
T 1 0 6 3 10 6 26 46 47 36 58 45 45 45 216 146 101 65 60 34 16 5 4 995 Fraud M 1 4 29 11 22 35 102 41 42 41 54 66 65 49 208 178 119 114 94 75 39 14 15 1316
F 0 1 5 5 12 11 34 21 34 23 36 39 23 26 141 152 90 83 62 49 18 7 7 845T 1 5 34 16 34 46 136 62 76 64 90 105 88 75 349 330 209 197 156 124 57 21 22 2161
Embezzlement M 0 0 0 0 2 1 3 0 1 2 0 0 0 0 0 3 1 1 0 1 0 0 0 12F 0 0 0 0 1 0 1 0 0 1 0 0 0 0 2 1 2 3 3 0 0 0 0 13T 0 0 0 0 3 1 4 0 1 3 0 0 0 0 2 4 3 4 3 1 0 0 0 25
Stolen Property M 0 20 61 66 74 66 287 97 61 64 70 62 69 54 239 171 85 77 74 53 18 2 1 1484F 0 9 12 18 16 9 64 27 18 20 24 21 20 17 82 40 30 27 19 5 1 1 0 416T 0 29 73 84 90 75 351 124 79 84 94 83 89 71 321 211 115 104 93 58 19 3 1 1900
Vandalism M 10 88 264 157 179 163 861 120 129 107 132 102 141 107 347 228 126 87 82 56 22 10 9 2666F 0 19 37 44 23 33 156 33 26 22 23 26 15 20 81 48 28 36 20 15 8 3 2 562T 10 107 301 201 202 196 1017 153 155 129 155 128 156 127 428 276 154 123 102 71 30 13 11 3228
Weapons M 8 32 103 83 77 76 379 93 78 78 70 67 71 53 240 183 95 59 43 42 23 14 7 1595F 0 6 13 16 3 4 42 8 11 4 5 7 1 6 25 10 10 6 5 2 2 0 0 144T 8 38 116 99 80 80 421 101 89 82 75 74 72 59 265 193 105 65 48 44 25 14 7 1739

TABLE 14TOTAL ARRESTS BY AGE AND SEX IN MINNESOTA FOR 2013
59
Under Total 65 & GRAND Offense 10 10-12 13-14 15 16 17 Under 18 18 19 20 21 22 23 24 25-29 30-34 35-39 40-44 45-49 50-54 55-59 60-64 Over TOTAL
Prostitution M 1 0 0 0 0 2 3 4 12 6 6 8 10 19 61 62 64 59 48 46 28 14 10 460F 0 0 0 0 2 1 3 11 7 19 14 10 18 9 50 41 28 27 11 10 1 1 1 261T 1 0 0 0 2 3 6 15 19 25 20 18 28 28 111 103 92 86 59 56 29 15 11 721
Other Sex M 0 27 60 21 26 21 155 33 41 29 25 37 39 37 161 140 99 107 84 85 26 30 27 1155Offenses F 1 1 1 3 2 1 9 1 2 1 0 2 2 2 7 9 5 5 6 0 2 0 0 53
T 1 28 61 24 28 22 164 34 43 30 25 39 41 39 168 149 104 112 90 85 28 30 27 1208Narcotics M 4 45 272 408 593 855 2177 1162 1135 1025 856 722 658 581 2397 1643 977 687 511 398 189 62 43 15223
F 0 13 78 106 146 198 541 256 229 223 198 194 179 161 655 552 270 197 156 112 36 5 3 3967T 4 58 350 514 739 1053 2718 1418 1364 1248 1054 916 837 742 3052 2195 1247 884 667 510 225 67 46 19190
Gambling M 0 0 1 0 1 0 2 2 1 5 1 3 1 2 4 1 1 0 2 0 0 1 0 26F 0 0 0 0 0 0 0 1 0 0 1 1 0 0 0 1 1 1 0 1 0 0 0 7T 0 0 1 0 1 0 2 3 1 5 2 4 1 2 4 2 2 1 2 1 0 1 0 33
Family/Children M 0 0 1 1 1 2 5 10 8 18 17 11 19 18 87 67 58 54 36 31 14 3 4 460F 0 0 1 2 1 2 6 8 5 10 9 7 9 11 50 43 23 19 11 7 6 1 3 228T 0 0 2 3 2 4 11 18 13 28 26 18 28 29 137 110 81 73 47 38 20 4 7 688
DUI M 1 0 2 2 36 99 140 245 366 449 681 721 775 747 3002 2203 1490 1291 1073 1033 656 375 275 15522F 0 0 0 2 18 45 65 95 118 176 259 301 271 275 1121 826 561 505 473 392 239 114 73 5864T 1 0 2 4 54 144 205 340 484 625 940 1022 1046 1022 4123 3029 2051 1796 1546 1425 895 489 348 21386
Liquor Laws M 8 4 127 215 465 769 1588 1502 1979 1658 131 102 92 82 324 278 261 331 431 425 305 117 59 9665F 7 5 117 211 387 484 1211 879 931 656 39 40 23 34 129 110 91 96 104 71 40 17 10 4481T 15 9 244 426 852 1253 2799 2381 2910 2314 170 142 115 116 453 388 352 427 535 496 345 134 69 14146
Disorderly M 7 144 521 366 376 346 1760 223 206 201 390 367 350 299 1119 818 563 489 455 404 248 91 76 8059F 0 75 276 177 182 148 858 93 89 65 135 122 90 101 360 254 212 145 141 91 43 16 18 2833T 7 219 797 543 558 494 2618 316 295 266 525 489 440 400 1479 1072 775 634 596 495 291 107 94 10892
Vagrancy M 0 0 6 7 6 3 22 4 4 1 3 1 3 6 21 20 20 25 45 67 30 5 4 281F 0 0 0 0 1 0 1 0 1 0 0 0 0 1 4 2 4 11 6 9 0 2 1 42T 0 0 6 7 7 3 23 4 5 1 3 1 3 7 25 22 24 36 51 76 30 7 5 323
Other M 10 81 490 561 663 712 2517 615 803 811 961 933 1017 839 3736 2926 1952 1701 1575 1244 723 304 181 22838(except Traffic) F 2 30 172 174 228 223 829 153 233 260 314 264 281 275 1040 884 628 521 398 307 122 75 49 6633
T 12 111 662 735 891 935 3346 768 1036 1071 1275 1197 1298 1114 4776 3810 2580 2222 1973 1551 845 379 230 29471Part 2 Total M 65 683 2463 2188 2872 3464 11735 4410 5201 4849 3838 3617 3775 3333 13795 10578 7076 6082 5310 4608 2636 1184 817 92844
F 15 264 1008 942 1189 1304 4722 1718 1834 1582 1232 1169 1053 1062 4336 3428 2330 1918 1629 1214 570 262 188 30247T 80 947 3471 3130 4061 4768 16457 6128 7035 6431 5070 4786 4828 4395 18131 14006 9406 8000 6939 5822 3206 1446 1005 123091
Curfew/ M 12 99 369 307 320 396 1503 0 0 0 0 0 0 0 0 0 0 0 0 0 0 0 0 1503Loitering F 1 36 160 150 148 152 647 0 0 0 0 0 0 0 0 0 0 0 0 0 0 0 0 647(Juv.) T 13 135 529 457 468 548 2150 0 0 0 0 0 0 0 0 0 0 0 0 0 0 0 0 2150 Runaways M 0 24 130 112 115 76 457 0 0 0 0 0 0 0 0 0 0 0 0 0 0 0 0 457(Juv.) F 0 26 166 152 170 135 649 0 0 0 0 0 0 0 0 0 0 0 0 0 0 0 0 649
T 0 50 296 264 285 211 1106 0 0 0 0 0 0 0 0 0 0 0 0 0 0 0 0 1106Grand Total M 89 1182 4009 3554 4373 4991 18198 5611 6307 5842 4772 4480 4553 4021 16819 12719 8479 7455 6355 5507 3078 1350 948 116494
F 23 502 1929 1766 2130 2232 8582 2311 2360 2099 1717 1627 1551 1502 6205 4845 3291 2740 2305 1707 793 376 292 44303T 112 1684 5938 5320 6503 7223 26780 7922 8667 7941 6489 6107 6104 5523 23024 17564 11770 10195 8660 7214 3871 1726 1240 160797
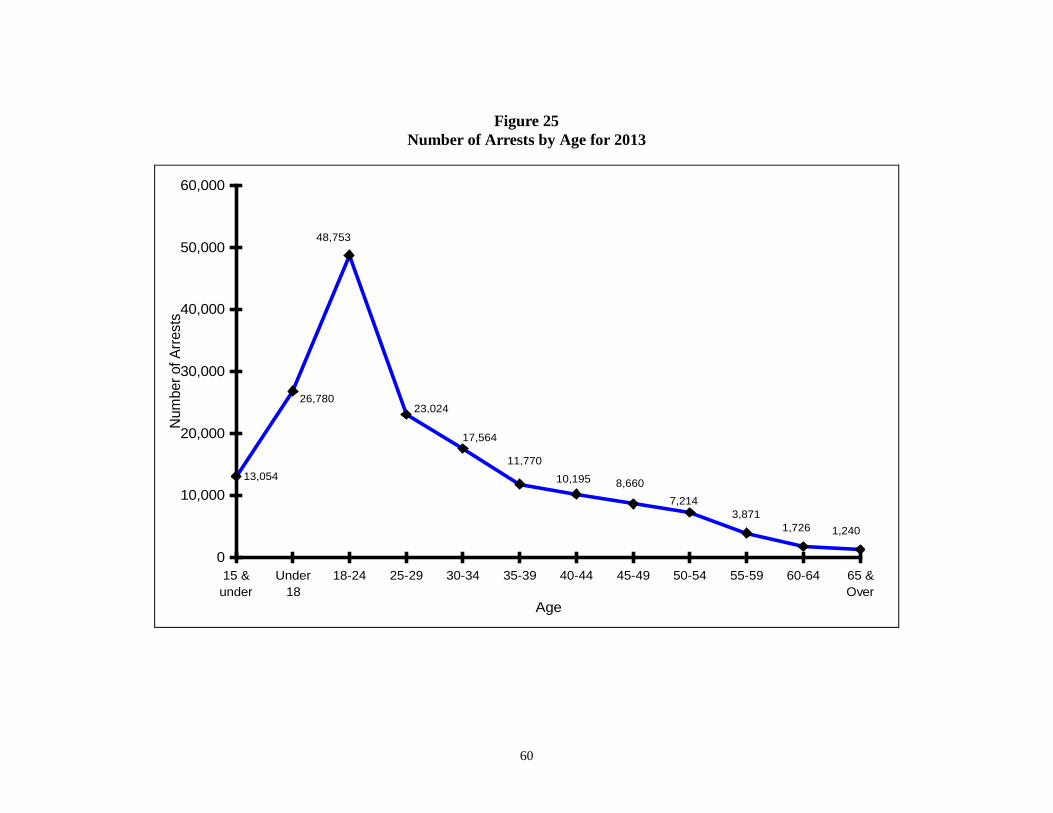
60
Figure 25 Number of Arrests by Age for 2013
0
10,000
20,000
30,000
40,000
50,000
60,000
15 &under
Under18
18-24 25-29 30-34 35-39 40-44 45-49 50-54 55-59 60-64 65 &Over
Age
Num
ber o
f Arre
sts
13,054
26,780
48,753
23,024
17,564
11,770
10,195 8,6607,214
3,8711,2401,726

61
Figure 26 Percentage of Persons Arrested
by Age Group 2009 - 2013
6%
30%
20%
12%
8%7%
6%
30%
20%
12%
8%7%
6%
27%
20%
13%
9%
6%6%
25%
20%
13%
10%
7%
5%
22%
20%
14%
11%
7%
0%
5%
10%
15%
20%
25%
30%
35%
Age 10-14 15-19 20-24 25-29 30-34 35-39
2009
2010
2011
2012
2013

TABLE 15OFFENSE AND RACE OF PERSONS ARRESTED FOR 2013
62
Juv & AdultAfrican Indian/ African Indian/ Grand Not
Offenses White American Alaskan Asian White American Alaskan Asian Total Hispanic HispanicMurder/Non-Negligent 5 1 - - 34 33 5 8 86 7 79 Negligent Manslaughter - - - - 1 4 - - 5 - 5 Rape 65 20 5 1 303 140 13 16 563 60 503 Robbery 55 279 9 3 213 576 39 20 1,194 94 1,100 Aggravated Assault 214 191 20 13 1,721 1,323 200 117 3,799 372 3,427 Burglary 263 158 12 12 1,508 557 100 46 2,656 149 2,507 Larceny 2,798 2,361 163 196 12,313 5,492 1,216 490 25,029 2,363 22,666 Motor Vehicle Theft 96 67 10 8 461 207 56 111 1,016 78 938 Arson 29 10 3 - 44 11 4 1 102 7 95 Part 1 Total 3,525 3,087 222 233 16,598 8,343 1,633 809 34,450 3,130 31,320
- Other Assault 1,337 1,093 134 46 7,889 3,457 700 329 14,985 1,344 13,641 Forgery/Counterfeiting 8 17 1 - 624 282 34 29 995 87 908 Fraud 63 69 3 1 1,366 540 49 70 2,161 159 2,002 Embezzlement 4 - - - 17 2 1 1 25 1 24 Stolen Property 141 187 15 8 1,011 436 61 41 1,900 162 1,738 Vandalism 698 251 45 23 1,459 579 136 37 3,228 270 2,958 Weapons 155 229 16 21 636 599 42 41 1,739 103 1,636 Prostitution 1 5 - - 368 271 44 32 721 74 647 Other Sex Offenses 121 35 4 4 705 265 44 30 1,208 108 1,100 Narcotics 2,132 439 73 74 11,925 3,570 515 462 19,190 1,379 17,811 Gambling - 2 - - 10 21 - - 33 - 33 Family/Children 6 4 - 1 356 250 29 42 688 39 649 D.U.I.* 187 9 3 6 18,637 1,660 303 581 21,386 1,111 20,275 Liquor Laws 2,299 277 147 76 8,555 1,951 672 169 14,146 772 13,374 Disorderly 1,337 1,154 50 77 5,285 2,325 539 125 10,892 991 9,901 Vagrancy 3 20 - - 96 174 26 4 323 17 306 Other (ExceptTraffic) 1,899 1,122 229 96 14,882 8,240 2,255 748 29,471 2,463 27,008 Part 2 Total 10,391 4,913 720 433 73,821 24,622 5,450 2,741 123,091 9,080 114,011
- Curfew/Loitering 742 1,178 168 62 - - - - 2,150 278 1,872 Runaways* 589 432 36 49 - - - - 1,106 166 940
- Grand Total 15,247 9,610 1,146 777 90,419 32,965 7,083 3,550 160,797 12,654 148,143 * St Paul D.U.I.'s and runaways not included 2013
ETHNICITY JUVENILE ADULT

TABLE 16ARRESTS BY AGENCY - 2013
* "Other" arrests include juvenile status offensesof Runaways and Curfew/Loitering.** No data reported.
63
GRAND TOTAL TOTAL TOTAL Juvenile Juvenile Juvenile Juvenile Adult Adult AdultTOTAL PART 1 PART 2 OTHER* Part 1 Part 2 Other* Total Part 1 Part 2 Total
Statewide Total 160,797 34,450 123,091 3,256 7,067 16,457 3,256 26,780 27,383 106,634 134,017
Aitkin County Total 369 72 297 - 8 4 0 12 64 293 357 Anoka County Total 8,367 2,196 6,169 2 406 1071 2 1,479 1790 5098 6,888 Anoka Co. Sheriff 1,114 183 931 - 35 201 0 236 148 730 878 Anoka PD 534 91 443 - 18 33 0 51 73 410 483 Blaine 1,590 567 1,023 - 116 184 0 300 451 839 1,290 Centennial Lakes 280 21 259 - 3 37 0 40 18 222 240 Columbia Heights 889 131 758 - 31 87 0 118 100 671 771 Coon Rapids 1,636 559 1,077 - 115 238 0 353 444 839 1,283 Fridley 1,089 447 642 - 47 98 0 145 400 544 944 Lino Lakes 422 68 352 2 16 61 2 79 52 291 343 Spring Lake Park 224 27 197 - 5 57 0 62 22 140 162 Ramsey 360 71 289 - 8 32 0 40 63 257 320 St Francis 229 31 198 - 12 43 0 55 19 155 174 Becker County Total** - - - - 0 0 0 - 0 0 - Becker Co. Sheriff ** - - - - 0 0 0 - 0 0 - Detroit Lakes** - - - - 0 0 0 - 0 0 - Beltrami County Total 2,362 499 1,860 3 87 199 3 289 412 1661 2,073 Beltrami Co. Sheriff 704 68 634 2 9 44 2 55 59 590 649 Bemidji 1,631 427 1,203 1 75 150 1 226 352 1053 1,405 Blackduck 27 4 23 - 3 5 0 8 1 18 19 Benton County Total 355 94 260 1 11 42 1 54 83 218 301 Benton Co. Sheriff 191 45 145 1 5 16 1 22 40 129 169 Sauk Rapids 164 49 115 - 6 26 0 32 43 89 132 Big Stone County Total 21 2 19 - 0 1 0 1 2 18 20 Big Stone Co. Sheriff 21 2 19 - 0 1 0 1 2 18 20 Ortonville** - - - - 0 0 0 - 0 0 - Blue Earth County Total 3,868 620 3,247 1 153 269 1 423 467 2978 3,445 Blue Earth Co. Sheriff 1,180 42 1,138 - 7 56 0 63 35 1082 1,117 Mankato 2,549 555 1,993 1 140 185 1 326 415 1808 2,223 Mapleton 38 5 33 - 2 10 0 12 3 23 26
Eagle Lake 24 5 19 - 0 5 0 5 5 14 19 Lake Crystal 59 10 49 - 4 12 0 16 6 37 43 Madison Lake 18 3 15 - 0 1 0 1 3 14 17 Brown County Total 370 45 325 - 13 47 0 60 32 278 310
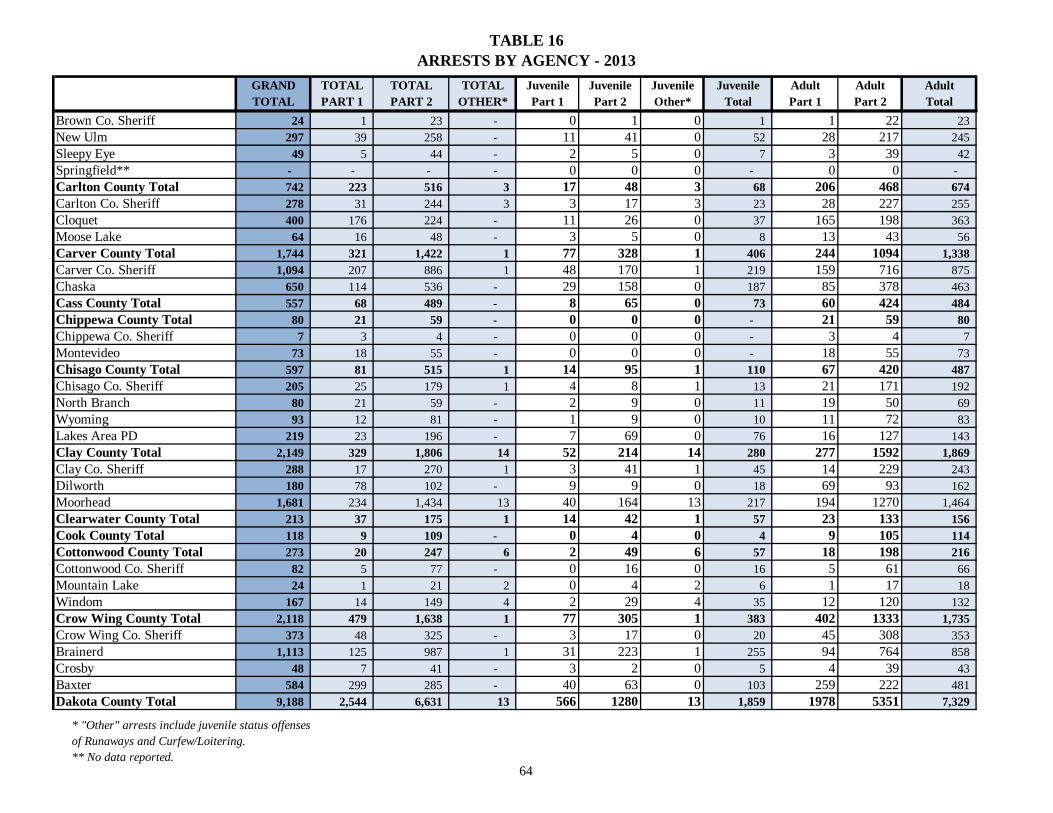
TABLE 16ARRESTS BY AGENCY - 2013
* "Other" arrests include juvenile status offensesof Runaways and Curfew/Loitering.** No data reported.
64
GRAND TOTAL TOTAL TOTAL Juvenile Juvenile Juvenile Juvenile Adult Adult AdultTOTAL PART 1 PART 2 OTHER* Part 1 Part 2 Other* Total Part 1 Part 2 Total
Brown Co. Sheriff 24 1 23 - 0 1 0 1 1 22 23 New Ulm 297 39 258 - 11 41 0 52 28 217 245 Sleepy Eye 49 5 44 - 2 5 0 7 3 39 42 Springfield** - - - - 0 0 0 - 0 0 - Carlton County Total 742 223 516 3 17 48 3 68 206 468 674 Carlton Co. Sheriff 278 31 244 3 3 17 3 23 28 227 255 Cloquet 400 176 224 - 11 26 0 37 165 198 363 Moose Lake 64 16 48 - 3 5 0 8 13 43 56 Carver County Total 1,744 321 1,422 1 77 328 1 406 244 1094 1,338 Carver Co. Sheriff 1,094 207 886 1 48 170 1 219 159 716 875 Chaska 650 114 536 - 29 158 0 187 85 378 463 Cass County Total 557 68 489 - 8 65 0 73 60 424 484 Chippewa County Total 80 21 59 - 0 0 0 - 21 59 80 Chippewa Co. Sheriff 7 3 4 - 0 0 0 - 3 4 7 Montevideo 73 18 55 - 0 0 0 - 18 55 73 Chisago County Total 597 81 515 1 14 95 1 110 67 420 487 Chisago Co. Sheriff 205 25 179 1 4 8 1 13 21 171 192 North Branch 80 21 59 - 2 9 0 11 19 50 69 Wyoming 93 12 81 - 1 9 0 10 11 72 83 Lakes Area PD 219 23 196 - 7 69 0 76 16 127 143 Clay County Total 2,149 329 1,806 14 52 214 14 280 277 1592 1,869 Clay Co. Sheriff 288 17 270 1 3 41 1 45 14 229 243 Dilworth 180 78 102 - 9 9 0 18 69 93 162 Moorhead 1,681 234 1,434 13 40 164 13 217 194 1270 1,464 Clearwater County Total 213 37 175 1 14 42 1 57 23 133 156 Cook County Total 118 9 109 - 0 4 0 4 9 105 114 Cottonwood County Total 273 20 247 6 2 49 6 57 18 198 216 Cottonwood Co. Sheriff 82 5 77 - 0 16 0 16 5 61 66 Mountain Lake 24 1 21 2 0 4 2 6 1 17 18 Windom 167 14 149 4 2 29 4 35 12 120 132 Crow Wing County Total 2,118 479 1,638 1 77 305 1 383 402 1333 1,735 Crow Wing Co. Sheriff 373 48 325 - 3 17 0 20 45 308 353 Brainerd 1,113 125 987 1 31 223 1 255 94 764 858 Crosby 48 7 41 - 3 2 0 5 4 39 43 Baxter 584 299 285 - 40 63 0 103 259 222 481 Dakota County Total 9,188 2,544 6,631 13 566 1280 13 1,859 1978 5351 7,329

TABLE 16ARRESTS BY AGENCY - 2013
* "Other" arrests include juvenile status offensesof Runaways and Curfew/Loitering.** No data reported.
65
GRAND TOTAL TOTAL TOTAL Juvenile Juvenile Juvenile Juvenile Adult Adult AdultTOTAL PART 1 PART 2 OTHER* Part 1 Part 2 Other* Total Part 1 Part 2 Total
Dakota Co. Sheriff 501 42 458 1 18 126 1 145 24 332 356 Burnsville 1,378 592 786 - 133 99 0 232 459 687 1,146 Farmington 261 28 233 - 6 57 0 63 22 176 198 Hastings 604 178 426 - 36 74 0 110 142 352 494 Mendota Heights 175 33 142 - 2 36 0 38 31 106 137 Rosemount 434 40 391 3 14 100 3 117 26 291 317 South St Paul 576 113 456 7 31 107 7 145 82 349 431 West St Paul 870 445 425 - 69 34 0 103 376 391 767 Eagan 1,452 324 1,128 - 66 169 0 235 258 959 1,217 Inver Grove Heights 739 166 571 2 35 110 2 147 131 461 592 Apple Valley 1,270 347 923 - 102 231 0 333 245 692 937 Lakeville 928 236 692 - 54 137 0 191 182 555 737 Dodge County Total 402 19 383 - 4 26 0 30 15 357 372 Dodge Co. Sheriff 359 15 344 - 3 12 0 15 12 332 344 Kasson 43 4 39 - 1 14 0 15 3 25 28 Douglas County Total 909 175 726 8 33 91 8 132 142 635 777 Douglas Co. Sheriff 290 23 263 4 5 18 4 27 18 245 263 Alexandria 581 145 432 4 28 72 4 104 117 360 477 Osakis 38 7 31 - 0 1 0 1 7 30 37 Faribault County Total 327 43 282 2 16 45 2 63 27 237 264 Faribault Co. Sheriff 76 8 68 - 4 11 0 15 4 57 61 Blue Earth 133 14 119 - 2 12 0 14 12 107 119 Elmore 40 10 30 - 3 15 0 18 7 15 22 Wells 30 5 25 - 2 0 0 2 3 25 28 Winnebago 48 6 40 2 5 7 2 14 1 33 34 Fillmore County Total 80 17 63 - 1 3 0 4 16 60 76 Freeborn County Total 1,116 223 831 62 47 146 62 255 176 685 861 Freeborn Co. Sheriff 273 23 235 15 2 24 15 41 21 211 232 Albert Lea 843 200 596 47 45 122 47 214 155 474 629 Goodhue County Total 1,341 197 1,144 - 37 223 0 260 160 921 1,081 Goodhue Co. Sheriff 302 29 273 - 3 43 0 46 26 230 256 Cannon Falls 159 29 130 - 7 30 0 37 22 100 122 Red Wing 799 129 670 - 27 138 0 165 102 532 634 Zumbrota 81 10 71 - 0 12 0 12 10 59 69 Grant County Total 81 10 71 - 1 13 0 14 9 58 67 Hennepin County Total 45,725 10,012 33,387 2,326 2214 3948 2326 8,488 7798 29439 37,237

TABLE 16ARRESTS BY AGENCY - 2013
* "Other" arrests include juvenile status offensesof Runaways and Curfew/Loitering.** No data reported.
66
GRAND TOTAL TOTAL TOTAL Juvenile Juvenile Juvenile Juvenile Adult Adult AdultTOTAL PART 1 PART 2 OTHER* Part 1 Part 2 Other* Total Part 1 Part 2 Total
Hennepin Co. Sheriff 676 64 612 - 26 13 0 39 38 599 637 Bloomington 5,493 2,028 3,395 70 574 568 70 1,212 1454 2827 4,281 Brooklyn Center 2,160 1,073 1,068 19 184 266 19 469 889 802 1,691 Brooklyn Park 2,892 816 1,803 273 257 297 273 827 559 1506 2,065 Crystal 805 137 666 2 28 74 2 104 109 592 701 Deephaven-Woodland 112 3 109 - 0 18 0 18 3 91 94 Edina 693 220 465 8 81 54 8 143 139 411 550 South Lake Minnetonka 347 17 330 - 2 25 0 27 15 305 320 Golden Valley 399 81 318 - 14 22 0 36 67 296 363 Hopkins 444 61 383 - 10 59 0 69 51 324 375 Minneapolis 20,929 3,417 15,754 1,758 621 1262 1758 3,641 2796 14492 17,288 Minnetonka 1,100 271 801 28 81 197 28 306 190 604 794 New Hope 523 63 443 17 33 122 17 172 30 321 351 Orono 221 26 195 - 0 9 0 9 26 186 212 Osseo** - - - - 0 0 0 - 0 0 - Plymouth 949 149 800 - 27 183 0 210 122 617 739 Richfield 1,217 224 939 54 43 165 54 262 181 774 955 Robbinsdale 663 48 614 1 8 16 1 25 40 598 638 St Anthony 366 180 186 - 15 24 0 39 165 162 327 St Louis Park 1,149 299 850 - 68 96 0 164 231 754 985 Wayzata** - - - - 0 0 0 - 0 0 - Univ of Minn PD - Mpls. 639 32 607 - 1 25 0 26 31 582 613 Metro Airport PD 242 23 219 - 0 0 0 - 23 219 242 Eden Prairie 1,091 293 759 39 35 86 39 160 258 673 931 Maple Grove 1,404 308 1,062 34 72 247 34 353 236 815 1,051 Minnetrista 122 16 106 - 2 28 0 30 14 78 92 Champlin 356 97 236 23 26 36 23 85 71 200 271 Medina 188 12 176 - 2 14 0 16 10 162 172 Corcoran** - - - - 0 0 0 - 0 0 - Dayton 4 1 3 - 0 0 0 - 1 3 4 Rogers 125 31 94 - 2 0 0 2 29 94 123 West Hennepin 130 11 119 - 1 11 0 12 10 108 118 Three Rivers Park 223 7 216 - 1 31 0 32 6 185 191 Houston County Total 592 25 567 - 3 48 0 51 22 519 541 Houston Co. Sheriff 457 14 443 - 2 30 0 32 12 413 425 Caledonia 97 4 93 - 0 14 0 14 4 79 83
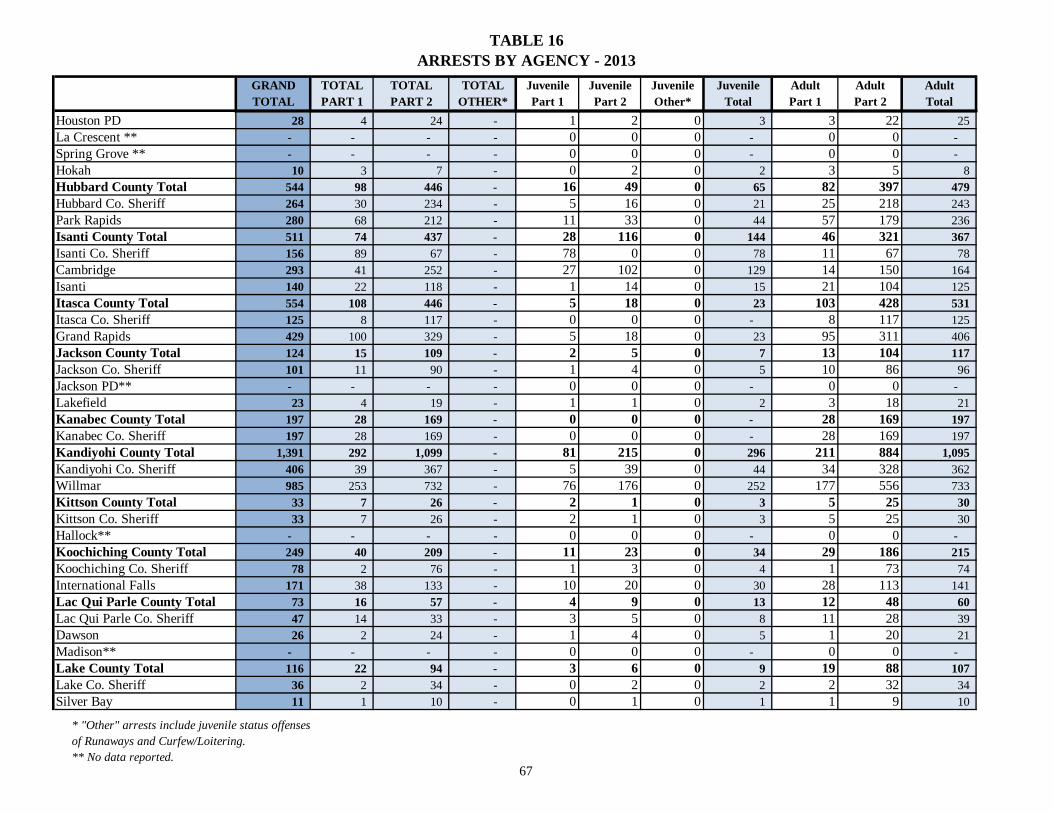
TABLE 16ARRESTS BY AGENCY - 2013
* "Other" arrests include juvenile status offensesof Runaways and Curfew/Loitering.** No data reported.
67
GRAND TOTAL TOTAL TOTAL Juvenile Juvenile Juvenile Juvenile Adult Adult AdultTOTAL PART 1 PART 2 OTHER* Part 1 Part 2 Other* Total Part 1 Part 2 Total
Houston PD 28 4 24 - 1 2 0 3 3 22 25 La Crescent ** - - - - 0 0 0 - 0 0 - Spring Grove ** - - - - 0 0 0 - 0 0 - Hokah 10 3 7 - 0 2 0 2 3 5 8 Hubbard County Total 544 98 446 - 16 49 0 65 82 397 479 Hubbard Co. Sheriff 264 30 234 - 5 16 0 21 25 218 243 Park Rapids 280 68 212 - 11 33 0 44 57 179 236 Isanti County Total 511 74 437 - 28 116 0 144 46 321 367 Isanti Co. Sheriff 156 89 67 - 78 0 0 78 11 67 78 Cambridge 293 41 252 - 27 102 0 129 14 150 164 Isanti 140 22 118 - 1 14 0 15 21 104 125 Itasca County Total 554 108 446 - 5 18 0 23 103 428 531 Itasca Co. Sheriff 125 8 117 - 0 0 0 - 8 117 125 Grand Rapids 429 100 329 - 5 18 0 23 95 311 406 Jackson County Total 124 15 109 - 2 5 0 7 13 104 117 Jackson Co. Sheriff 101 11 90 - 1 4 0 5 10 86 96 Jackson PD** - - - - 0 0 0 - 0 0 - Lakefield 23 4 19 - 1 1 0 2 3 18 21 Kanabec County Total 197 28 169 - 0 0 0 - 28 169 197 Kanabec Co. Sheriff 197 28 169 - 0 0 0 - 28 169 197 Kandiyohi County Total 1,391 292 1,099 - 81 215 0 296 211 884 1,095 Kandiyohi Co. Sheriff 406 39 367 - 5 39 0 44 34 328 362 Willmar 985 253 732 - 76 176 0 252 177 556 733 Kittson County Total 33 7 26 - 2 1 0 3 5 25 30 Kittson Co. Sheriff 33 7 26 - 2 1 0 3 5 25 30 Hallock** - - - - 0 0 0 - 0 0 - Koochiching County Total 249 40 209 - 11 23 0 34 29 186 215 Koochiching Co. Sheriff 78 2 76 - 1 3 0 4 1 73 74 International Falls 171 38 133 - 10 20 0 30 28 113 141 Lac Qui Parle County Total 73 16 57 - 4 9 0 13 12 48 60 Lac Qui Parle Co. Sheriff 47 14 33 - 3 5 0 8 11 28 39 Dawson 26 2 24 - 1 4 0 5 1 20 21 Madison** - - - - 0 0 0 - 0 0 - Lake County Total 116 22 94 - 3 6 0 9 19 88 107 Lake Co. Sheriff 36 2 34 - 0 2 0 2 2 32 34 Silver Bay 11 1 10 - 0 1 0 1 1 9 10

TABLE 16ARRESTS BY AGENCY - 2013
* "Other" arrests include juvenile status offensesof Runaways and Curfew/Loitering.** No data reported.
68
GRAND TOTAL TOTAL TOTAL Juvenile Juvenile Juvenile Juvenile Adult Adult AdultTOTAL PART 1 PART 2 OTHER* Part 1 Part 2 Other* Total Part 1 Part 2 Total
Two Harbors 69 19 50 - 3 3 0 6 16 47 63 Lake of Woods County Total 60 4 56 - 0 1 0 1 4 55 59 Le Sueur County Total 378 62 316 - 13 40 0 53 49 276 325 Le Sueur Co. Sheriff 158 33 125 - 4 14 0 18 29 111 140 Le Sueur PD 183 18 165 - 2 21 0 23 16 144 160 Montgomery 37 11 26 - 7 5 0 12 4 21 25 Lincoln County Total** - - - - 0 0 0 - 0 0 - Lyon County Total 982 190 783 9 45 104 9 158 145 679 824 Lyon Co. Sheriff 129 9 120 - 0 9 0 9 9 111 120 Marshall 853 181 663 9 45 95 9 149 136 568 704 Tracy ** - - - - 0 0 0 - 0 0 - McLeod County Total 736 115 621 - 20 74 0 94 95 547 642 McLeod Co. Sheriff 252 11 241 - 0 27 0 27 11 214 225 Glencoe 90 9 81 - 1 13 0 14 8 68 76 Hutchinson 273 88 185 - 19 14 0 33 69 171 240 Brownton 7 - 7 - 0 0 0 - 0 7 7 Lester Prairie 44 4 40 - 0 13 0 13 4 27 31 Silver Lake 21 1 20 - 0 2 0 2 1 18 19 Winsted 49 2 47 - 0 5 0 5 2 42 44 Mahnomen County Total** - - - - 0 0 0 - 0 0 - Marshall County Total** - - - - 0 0 0 - 0 0 - Martin County Total 468 58 408 2 4 46 2 52 54 362 416 Martin Co. Sheriff 71 7 63 1 1 10 1 12 6 53 59 Fairmont 397 51 345 1 3 36 1 40 48 309 357 Meeker County Total 305 50 255 - 14 33 0 47 36 222 258 Meeker Co. Sheriff 196 32 164 - 9 18 0 27 23 146 169 Litchfield 109 18 91 - 5 15 0 20 13 76 89 Mille Lacs County Total 1,988 142 1,845 1 35 195 1 231 107 1650 1,757 Mille Lacs Co. Sheriff 1,806 87 1,718 1 14 162 1 177 73 1556 1,629 Milaca 5 - 5 - 0 0 0 - 0 5 5 Princeton 177 55 122 - 21 33 0 54 34 89 123 Morrison County Total 202 28 174 - 0 5 0 5 28 169 197 Morrison Co. Sheriff 11 1 10 - 0 0 0 - 1 10 11 Little Falls 191 27 164 - 0 5 0 5 27 159 186 Mower County Total 2,190 249 1,892 49 61 299 49 409 188 1593 1,781

TABLE 16ARRESTS BY AGENCY - 2013
* "Other" arrests include juvenile status offensesof Runaways and Curfew/Loitering.** No data reported.
69
GRAND TOTAL TOTAL TOTAL Juvenile Juvenile Juvenile Juvenile Adult Adult AdultTOTAL PART 1 PART 2 OTHER* Part 1 Part 2 Other* Total Part 1 Part 2 Total
Mower Co. Sheriff 496 33 461 2 2 32 2 36 31 429 460 Austin 1,694 216 1,431 47 59 267 47 373 157 1164 1,321 Murray County Total** - - - - 0 0 0 - 0 0 - Murray Co. Sheriff** - - - - 0 0 0 - 0 0 - Slayton** - - - - 0 0 0 - 0 0 - Nicollet County Total 989 74 911 4 18 67 4 89 56 844 900 Nicollet Co. Sheriff 517 13 503 1 1 15 1 17 12 488 500 North Mankato 129 31 96 2 11 12 2 25 20 84 104 St Peter 343 30 312 1 6 40 1 47 24 272 296 Nobles County Total 499 89 410 - 25 35 0 60 64 375 439 Nobles Co. Sheriff 83 8 75 - 0 4 0 4 8 71 79 Worthington 416 81 335 - 25 31 0 56 56 304 360 Norman County Total 3 - 3 - 0 0 0 - 0 3 3 Olmsted County Total 3,436 1,142 2,294 - 232 319 0 551 910 1975 2,885 Olmsted Co. Sheriff 532 78 454 - 11 41 0 52 67 413 480 Rochester 2,904 1,064 1,840 - 221 278 0 499 843 1562 2,405 Ottertail County Total 1,332 240 1,092 - 43 142 0 185 197 950 1,147 Ottertail Co. Sheriff 606 89 517 - 10 46 0 56 79 471 550 Fergus Falls 726 151 575 - 33 96 0 129 118 479 597 Pennington County Total 367 83 284 - 12 56 0 68 71 228 299 Pennington Co. Sheriff 94 13 81 - 0 9 0 9 13 72 85 Thief River Falls 273 70 203 - 12 47 0 59 58 156 214 Pine County Total 1,208 350 856 2 41 96 2 139 309 760 1,069 Pipestone County Total 131 14 117 - 0 21 0 21 14 96 110 Polk County Total 1,105 112 981 12 20 133 12 165 92 848 940 Polk Co. Sheriff 252 38 212 2 5 34 2 41 33 178 211 Crookston 425 33 388 4 6 54 4 64 27 334 361 East Grand Forks 428 41 381 6 9 45 6 60 32 336 368 Pope County Total 169 31 138 - 10 19 0 29 21 119 140 Pope Co. Sheriff 129 23 106 - 10 16 0 26 13 90 103 Glenwood 40 8 32 - 0 3 0 3 8 29 37 Ramsey County Total 17,345 4,757 12,108 480 1078 1878 480 3,436 3679 10230 13,909 Ramsey Co. Sheriff 131 10 121 - 1 2 0 3 9 119 128 Arden Hills 74 19 55 - 3 3 0 6 16 52 68 Falcon Heights 101 13 88 - 0 0 0 - 13 88 101 Lauderdale 56 7 49 - 1 2 0 3 6 47 53

TABLE 16ARRESTS BY AGENCY - 2013
* "Other" arrests include juvenile status offensesof Runaways and Curfew/Loitering.** No data reported.
70
GRAND TOTAL TOTAL TOTAL Juvenile Juvenile Juvenile Juvenile Adult Adult AdultTOTAL PART 1 PART 2 OTHER* Part 1 Part 2 Other* Total Part 1 Part 2 Total
Maplewood 1,736 939 796 1 327 101 1 429 612 695 1,307 Mounds View 331 46 285 - 4 32 0 36 42 253 295 New Brighton 355 65 290 - 14 51 0 65 51 239 290 North St Paul 180 43 137 - 14 37 0 51 29 100 129 Roseville 1,189 530 659 - 173 68 0 241 357 591 948 St Paul 11,760 2,813 8,468 479 509 1360 479 2,348 2304 7108 9,412 White Bear Lake 773 89 684 - 14 133 0 147 75 551 626 Little Canada 174 28 146 - 8 26 0 34 20 120 140 Shoreview 175 30 145 - 3 29 0 32 27 116 143 Vadnais Heights 215 86 129 - 4 13 0 17 82 116 198 North Oaks 12 3 9 - 0 0 0 - 3 9 12 White Bear Township 83 36 47 - 3 21 0 24 33 26 59 Red Lake County Total 86 12 74 - 8 6 0 14 4 68 72 Redwood County Total 279 60 219 - 4 37 0 41 56 182 238 Redwood Co. Sheriff 77 12 65 - 1 3 0 4 11 62 73 Redwood Falls 202 48 154 - 3 34 0 37 45 120 165 Renville County Total 235 23 212 - 0 24 0 24 23 188 211 Renville Co. Sheriff 189 14 175 - 0 21 0 21 14 154 168 Olivia 46 9 37 - 0 3 0 3 9 34 43 Rice County Total 1,218 308 909 1 64 200 1 265 244 709 953 Rice Co. Sheriff 218 28 190 - 1 27 0 28 27 163 190 Faribault PD 680 218 461 1 57 133 1 191 161 328 489 Northfield 320 62 258 - 6 40 0 46 56 218 274 Rock County Total 81 12 69 - 0 2 0 2 12 67 79 Roseau County Total 151 11 140 - 1 2 0 3 10 138 148 Roseau Co. Sheriff 87 5 82 - 1 0 0 1 4 82 86 Roseau PD 15 3 12 - 0 1 0 1 3 11 14 Warroad 49 3 46 - 0 1 0 1 3 45 48 St Louis County Total 7,980 1,881 6,095 4 262 650 4 916 1619 5445 7,064 St Louis Co. Sheriff 1,089 199 890 - 16 95 0 111 183 795 978 Babbitt 44 9 35 - 3 4 0 7 6 31 37 Chisholm 83 14 69 - 6 13 0 19 8 56 64 Duluth 4,948 1,243 3,705 - 191 430 0 621 1052 3275 4,327 Ely 105 15 90 - 0 18 0 18 15 72 87 Eveleth 184 29 155 - 2 12 0 14 27 143 170 Gilbert 1 - 1 - 0 0 0 - 0 1 1

TABLE 16ARRESTS BY AGENCY - 2013
* "Other" arrests include juvenile status offensesof Runaways and Curfew/Loitering.** No data reported.
71
GRAND TOTAL TOTAL TOTAL Juvenile Juvenile Juvenile Juvenile Adult Adult AdultTOTAL PART 1 PART 2 OTHER* Part 1 Part 2 Other* Total Part 1 Part 2 Total
Hibbing 26 4 22 - 0 0 0 - 4 22 26 Hoyt Lakes** - - - - 0 0 0 - 0 0 - Proctor 88 13 75 - 2 7 0 9 11 68 79 Virginia 860 210 646 4 29 60 4 93 181 586 767 Floodwood 28 1 27 - 0 2 0 2 1 25 26 Hermantown 258 137 121 - 13 7 0 20 124 114 238 Univ. of Minn. - Duluth 266 7 259 - 0 2 0 2 7 257 264 Scott County Total 3,237 544 2,693 - 116 496 0 612 428 2197 2,625 Scott Co. Sheriff 186 7 179 - 0 12 0 12 7 167 174 Belle Plaine 224 34 190 - 4 57 0 61 30 133 163 Jordan 122 6 116 - 2 30 0 32 4 86 90 New Prague 290 18 272 - 3 70 0 73 15 202 217 Shakopee 1,234 319 915 - 85 190 0 275 234 725 959 Savage 493 81 412 - 17 76 0 93 64 336 400 Prior Lake 688 79 609 - 5 61 0 66 74 548 622 Sherburne County Total 1,747 214 1,491 42 62 287 42 391 152 1204 1,356 Sherburne Co. Sheriff 857 66 760 31 23 151 31 205 43 609 652 Big Lake 146 15 122 9 5 15 9 29 10 107 117 Elk River 627 117 509 1 28 101 1 130 89 408 497 Becker PD 117 16 100 1 6 20 1 27 10 80 90 Sibley County Total** - - - - 0 0 0 - 0 0 - Stearns County Total 6,278 1,660 4,511 107 307 440 107 854 1353 4071 5,424 Stearns Co. Sheriff 731 49 681 1 6 65 1 72 43 616 659 Cold Spring 117 5 111 1 0 10 1 11 5 101 106 Melrose 70 38 29 3 35 0 3 38 3 29 32 Paynesville 52 6 46 - 0 4 0 4 6 42 48 St Cloud 4,020 1,064 2,859 97 185 256 97 538 879 2603 3,482 Sauk Centre 201 37 164 - 4 15 0 19 33 149 182 Waite Park 701 373 327 1 93 48 1 142 280 279 559 Belgrade** - - - - 0 0 0 - 0 0 - Kimball** - - - - 0 0 0 - 0 0 - St Joseph 77 7 70 - 3 2 0 5 4 68 72 Sartell 280 113 160 7 16 32 7 55 97 128 225 Albany 29 3 26 - 0 2 0 2 3 24 27 Avon 35 - 35 - 0 3 0 3 0 32 32 Steele County Total 939 302 637 - 100 127 0 227 202 510 712

TABLE 16ARRESTS BY AGENCY - 2013
* "Other" arrests include juvenile status offensesof Runaways and Curfew/Loitering.** No data reported.
72
GRAND TOTAL TOTAL TOTAL Juvenile Juvenile Juvenile Juvenile Adult Adult AdultTOTAL PART 1 PART 2 OTHER* Part 1 Part 2 Other* Total Part 1 Part 2 Total
Steele Co. Sheriff 129 15 114 - 1 15 0 16 14 99 113 Owatonna 803 286 517 - 99 110 0 209 187 407 594 Blooming Prairie 7 1 6 - 0 2 0 2 1 4 5 Stevens County Total 166 11 155 - 0 5 0 5 11 150 161 Stevens Co. Sheriff 49 3 46 - 0 5 0 5 3 41 44 Morris 116 8 108 - 0 0 0 - 8 108 116 Univ. of Minn. - Morris 1 - 1 - 0 0 0 - 0 1 1 Swift County Total 181 29 152 - 4 11 0 15 25 141 166 Swift Co. Sheriff 41 3 38 - 1 0 0 1 2 38 40 Appleton 59 19 40 - 3 5 0 8 16 35 51 Benson 81 7 74 - 0 6 0 6 7 68 75 Todd County Total 381 34 347 - 3 48 0 51 31 299 330 Todd Co. Sheriff 268 20 248 - 1 39 0 40 19 209 228 Long Prairie 1 - 1 - 0 0 0 - 0 1 1 Staples 112 14 98 - 2 9 0 11 12 89 101 Traverse County Total** - - - - 0 0 0 - 0 0 - Traverse Co. Sheriff ** - - - - 0 0 0 - 0 0 - Wheaton** - - - - 0 0 0 - 0 0 - Wabasha County Total 302 53 249 - 13 18 0 31 40 231 271 Wabasha Co. Sheriff 64 5 59 - 2 1 0 3 3 58 61 Lake City 137 29 108 - 7 10 0 17 22 98 120 Plainview 13 2 11 - 1 0 0 1 1 11 12 Wabasha PD 88 17 71 - 3 7 0 10 14 64 78 Wadena County Total 149 20 129 - 1 14 0 15 19 115 134 Wadena Co. Sheriff 98 10 88 - 0 8 0 8 10 80 90 Wadena PD 51 10 41 - 1 6 0 7 9 35 44 Waseca County Total 402 62 340 - 13 45 0 58 49 295 344 Waseca 61 5 56 - 1 2 0 3 4 54 58 Janesville 21 3 18 - 0 2 0 2 3 16 19 New Richland 4 1 3 - 0 0 0 - 1 3 4 Waseca PD 316 53 263 - 12 41 0 53 41 222 263 Washington County Total 5,483 1,342 4,132 9 234 780 9 1,023 1108 3352 4,460 Washington Co. Sheriff 1,108 79 1,029 - 2 135 0 137 77 894 971 Bayport 107 3 104 - 0 7 0 7 3 97 100 Forest Lake 415 77 338 - 10 37 0 47 67 301 368 Newport 180 29 151 - 2 17 0 19 27 134 161
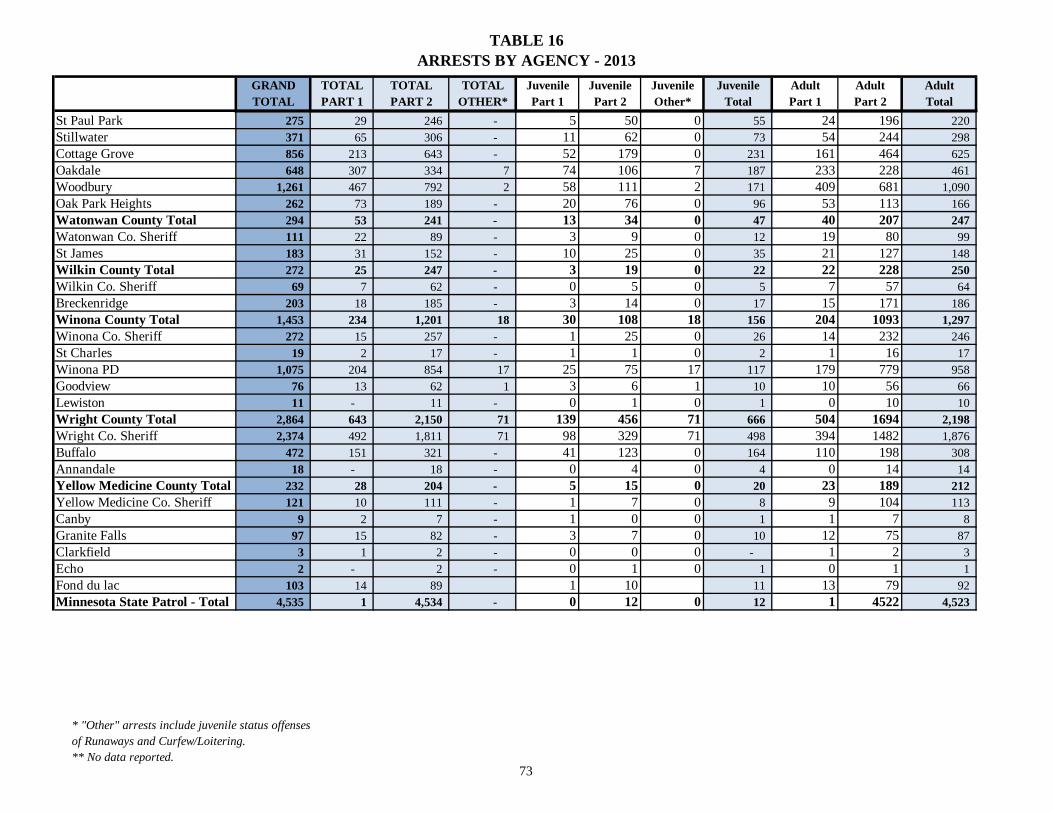
TABLE 16ARRESTS BY AGENCY - 2013
* "Other" arrests include juvenile status offensesof Runaways and Curfew/Loitering.** No data reported.
73
GRAND TOTAL TOTAL TOTAL Juvenile Juvenile Juvenile Juvenile Adult Adult AdultTOTAL PART 1 PART 2 OTHER* Part 1 Part 2 Other* Total Part 1 Part 2 Total
St Paul Park 275 29 246 - 5 50 0 55 24 196 220 Stillwater 371 65 306 - 11 62 0 73 54 244 298 Cottage Grove 856 213 643 - 52 179 0 231 161 464 625 Oakdale 648 307 334 7 74 106 7 187 233 228 461 Woodbury 1,261 467 792 2 58 111 2 171 409 681 1,090 Oak Park Heights 262 73 189 - 20 76 0 96 53 113 166 Watonwan County Total 294 53 241 - 13 34 0 47 40 207 247 Watonwan Co. Sheriff 111 22 89 - 3 9 0 12 19 80 99 St James 183 31 152 - 10 25 0 35 21 127 148 Wilkin County Total 272 25 247 - 3 19 0 22 22 228 250 Wilkin Co. Sheriff 69 7 62 - 0 5 0 5 7 57 64 Breckenridge 203 18 185 - 3 14 0 17 15 171 186 Winona County Total 1,453 234 1,201 18 30 108 18 156 204 1093 1,297 Winona Co. Sheriff 272 15 257 - 1 25 0 26 14 232 246 St Charles 19 2 17 - 1 1 0 2 1 16 17 Winona PD 1,075 204 854 17 25 75 17 117 179 779 958 Goodview 76 13 62 1 3 6 1 10 10 56 66 Lewiston 11 - 11 - 0 1 0 1 0 10 10 Wright County Total 2,864 643 2,150 71 139 456 71 666 504 1694 2,198 Wright Co. Sheriff 2,374 492 1,811 71 98 329 71 498 394 1482 1,876 Buffalo 472 151 321 - 41 123 0 164 110 198 308 Annandale 18 - 18 - 0 4 0 4 0 14 14 Yellow Medicine County Total 232 28 204 - 5 15 0 20 23 189 212 Yellow Medicine Co. Sheriff 121 10 111 - 1 7 0 8 9 104 113 Canby 9 2 7 - 1 0 0 1 1 7 8 Granite Falls 97 15 82 - 3 7 0 10 12 75 87 Clarkfield 3 1 2 - 0 0 0 - 1 2 3 Echo 2 - 2 - 0 1 0 1 0 1 1 Fond du lac 103 14 89 1 10 11 13 79 92 Minnesota State Patrol - Total 4,535 1 4,534 - 0 12 0 12 1 4522 4,523

74
NARCOTIC ARREST INFORMATION
NARCOTIC ARRESTS IN MINNESOTA
Narcotic arrest information for the state in 2013 involved 19,190 arrest incidents, with 15,223 males and 3,967 females arrested. Persons aged 18 comprise the greatest portion of the arrests (1,418) representing seven percent of all narcotics arrests. Persons aged 19 were the next highest with 1,364 arrests. Race information reveals that 73 percent of the narcotics arrests were for persons of the white race.
Figure 27 Number of Narcotics Arrests for 2005-2013
16,000
16,500
17,000
17,500
18,000
18,500
19,000
19,500
20,000
20,500
2005 2006 2007 2008 2009 2010 2011 2012 2013
Num
ber o
f Arre
sts
19,858 19,085
18,609
17,346
17,729
18,631
17,572
19,190
20,015
Figure 28 Narcotic Arrests by Type for 2013
1,277
4,564
1,699
11,650
0 2,000 4,000 6,000 8,000 10,000 12,000
Synthetics
Other DangerousDrugs
Opium/Cocaine
Marijuana

75
TABLE 17
AGE, SEX AND RACE OF THOSE INDIVIDUALS ARRESTED FOR SPECIFIC NARCOTIC VIOLATIONS IN MINNESOTA FOR 2013
AGE TOTAL Opium, Cocaine, Etc.
Marijuana Synthetic Other (Includes Meth)
Under 10 4 0 3 0 1 10 to 12 58 0 55 1 2 13-14 350 7 312 10 21 15 514 5 458 11 40 16 739 6 672 9 52 17 1,053 9 942 19 83 Total Under 18 2,718 27 2,442 50 199 18 1,418 46 1,210 52 110 19 1,364 66 1,088 51 159 20 1,248 65 944 42 197 21 1,054 66 755 47 186 22 916 76 578 56 206 23 837 83 515 49 190 24 742 74 422 51 195 25-29 3,052 339 1,535 242 936 30-34 2,195 239 903 232 821 35-39 1,247 179 437 122 509 40-44 884 145 307 98 334 45-49 667 110 210 89 258 50-54 510 106 169 62 173 55-59 225 51 79 27 68 60-64 67 18 35 4 10 65 and Over 46 9 21 3 13 Total 18 and Over
16,472 1,672 9,208 1,227 4,365
TOTAL 19,190 1,699 11,650 1,277 4,564
SEX RACE Total Percent Juvenile Adult Total 19,190 Total 19,190 100% 2,718 16,472 Female 3,967 White 14,057 73% 2,132 11,925 Male 15,223 African American 4,009 21% 439 3,570 American Indian/Alaskan Native 588 3% 73 515 Asian/Pacific Islander 536 3% 74 462
TABLE 18 ARRESTS FOR SALE/POSSESSION OF NARCOTICS, 2012– 2013
ARRESTED FOR: SALE POSSESSION YEAR 2012 2013 2012 2013
TOTAL 6,918 7,373 11,713 11,817 Opium/Cocaine 211 232 1,564 1,467 Marijuana 4,700 4,851 7,269 6,799 Synthetic 88 142 940 1,135 Other 1,919 2,148 1,940 2,416

TABLE 192013 NARCOTICS ARRESTS BY AGENCY
76
REPORTING AGENCIES Grand Total
Opium,Cocaine, etc. Marijuana Synthetic Other
(Includes Meth) Male Female
Statewide Total 19,190 1,699 11,650 1,277 4,564 15,223 3,967Aitkin County Total 29 1 7 1 20 19 10Anoka County Total 1,389 52 938 41 358 1,104 285Anoka Co. Sheriff 217 8 134 0 75 170 47Anoka PD 59 2 39 2 16 45 14Blaine 332 20 211 22 79 264 68Centennial Lakes 57 0 40 0 17 43 14Columbia Heights 93 1 68 0 24 81 12Coon Rapids 296 13 200 5 78 237 59Fridley 87 4 56 4 23 70 17Lino Lakes 119 2 103 5 9 99 20Spring Lake Park 19 0 15 0 4 12 7Ramsey 48 1 36 2 9 38 10Hilltop 0 0 0 0 0 0 0St. Francis 62 1 36 1 24 45 17Becker County Total 0 0 0 0 0 0 0Becker Co. Sheriff 0 0 0 0 0 0 0Detroit Lakes 0 0 0 0 0 0 0Beltrami County Total 241 4 148 1 88 161 80Beltrami Co. Sheriff 81 1 44 0 36 50 31Bemidji 160 3 104 1 52 111 49Blackduck 0 0 0 0 0 0 0Benton County Total 36 4 18 0 14 33 3Benton Co. Sheriff 26 3 11 0 12 25 1Sauk Rapids 10 1 7 0 2 8 2Big Stone County Total 1 0 1 0 0 1 0Big Stone Co. Sheriff 1 0 1 0 0 1 0Ortonville 0 0 0 0 0 0 0Blue Earth County Total 439 13 291 23 112 354 85Blue Earth Co. Sheriff 64 1 41 0 22 49 15Mankato 360 12 237 23 88 294 66Mapleton 6 0 6 0 0 4 2Eagle Lake 0 0 0 0 0 0 0Lake Crystal 7 0 6 0 1 5 2Madison Lake 2 0 1 0 1 2 0Brown County Total 36 3 23 1 9 28 8Brown Co. Sheriff 1 1 0 0 0 1 0New Ulm 35 2 23 1 9 27 8Sleepy Eye 0 0 0 0 0 0 0Springfield 0 0 0 0 0 0 0Carlton County Total 85 9 30 7 39 66 19Carlton Co. Sheriff 37 3 10 4 20 30 7Cloquet 45 6 19 3 17 33 12Moose Lake 3 0 1 0 2 3 0Carver County Total 326 12 261 12 41 262 64Carver Co. Sheriff 215 10 175 4 26 170 45Chaska 111 2 86 8 15 92 19Cass County Total 29 1 2 2 24 18 11Chippewa County Total 4 0 2 0 2 2 2Chippewa Co. Sheriff 0 0 0 0 0 0 0Montevideo 4 0 2 0 2 2 2Chisago County Total 94 4 43 9 38 74 20Chisago Co. Sheriff 31 2 1 6 22 21 10North Branch 10 1 3 3 3 9 1
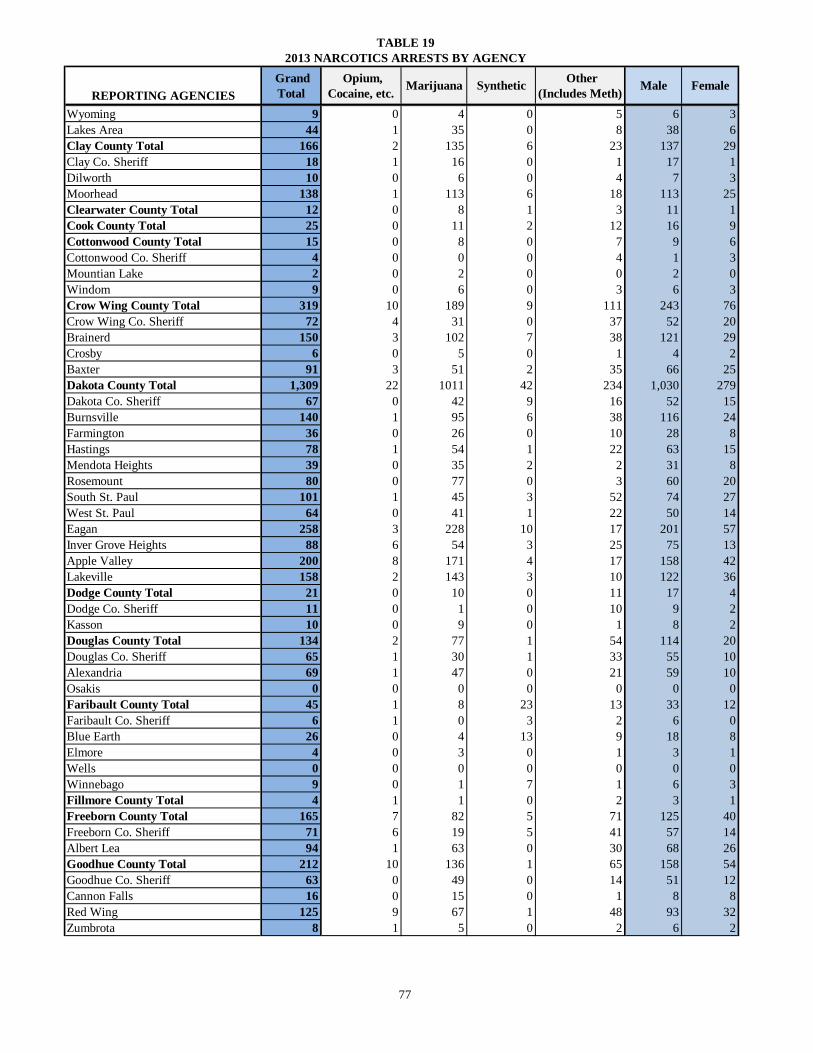
TABLE 192013 NARCOTICS ARRESTS BY AGENCY
77
REPORTING AGENCIES Grand Total
Opium,Cocaine, etc. Marijuana Synthetic Other
(Includes Meth) Male Female
Wyoming 9 0 4 0 5 6 3Lakes Area 44 1 35 0 8 38 6Clay County Total 166 2 135 6 23 137 29Clay Co. Sheriff 18 1 16 0 1 17 1Dilworth 10 0 6 0 4 7 3Moorhead 138 1 113 6 18 113 25Clearwater County Total 12 0 8 1 3 11 1Cook County Total 25 0 11 2 12 16 9Cottonwood County Total 15 0 8 0 7 9 6Cottonwood Co. Sheriff 4 0 0 0 4 1 3Mountian Lake 2 0 2 0 0 2 0Windom 9 0 6 0 3 6 3Crow Wing County Total 319 10 189 9 111 243 76Crow Wing Co. Sheriff 72 4 31 0 37 52 20Brainerd 150 3 102 7 38 121 29Crosby 6 0 5 0 1 4 2Baxter 91 3 51 2 35 66 25Dakota County Total 1,309 22 1011 42 234 1,030 279Dakota Co. Sheriff 67 0 42 9 16 52 15Burnsville 140 1 95 6 38 116 24Farmington 36 0 26 0 10 28 8Hastings 78 1 54 1 22 63 15Mendota Heights 39 0 35 2 2 31 8Rosemount 80 0 77 0 3 60 20South St. Paul 101 1 45 3 52 74 27West St. Paul 64 0 41 1 22 50 14Eagan 258 3 228 10 17 201 57Inver Grove Heights 88 6 54 3 25 75 13Apple Valley 200 8 171 4 17 158 42Lakeville 158 2 143 3 10 122 36Dodge County Total 21 0 10 0 11 17 4Dodge Co. Sheriff 11 0 1 0 10 9 2Kasson 10 0 9 0 1 8 2Douglas County Total 134 2 77 1 54 114 20Douglas Co. Sheriff 65 1 30 1 33 55 10Alexandria 69 1 47 0 21 59 10Osakis 0 0 0 0 0 0 0Faribault County Total 45 1 8 23 13 33 12Faribault Co. Sheriff 6 1 0 3 2 6 0Blue Earth 26 0 4 13 9 18 8Elmore 4 0 3 0 1 3 1Wells 0 0 0 0 0 0 0Winnebago 9 0 1 7 1 6 3Fillmore County Total 4 1 1 0 2 3 1Freeborn County Total 165 7 82 5 71 125 40Freeborn Co. Sheriff 71 6 19 5 41 57 14Albert Lea 94 1 63 0 30 68 26Goodhue County Total 212 10 136 1 65 158 54Goodhue Co. Sheriff 63 0 49 0 14 51 12Cannon Falls 16 0 15 0 1 8 8Red Wing 125 9 67 1 48 93 32Zumbrota 8 1 5 0 2 6 2

TABLE 192013 NARCOTICS ARRESTS BY AGENCY
78
REPORTING AGENCIES Grand Total
Opium,Cocaine, etc. Marijuana Synthetic Other
(Includes Meth) Male Female
Grant County Total 6 0 0 0 6 4 2Hennepin County Total 5,387 951 3200 192 1044 4,441 946Hennepin Co. Sheriff 165 47 61 5 52 131 34Bloomington 641 24 415 22 180 481 160Brooklyn Center 150 15 94 7 34 114 36Brooklyn Park 326 44 176 2 104 255 71Crystal 64 4 40 2 18 51 13Deephaven-Woodland 25 0 24 0 1 22 3Edina 136 70 49 0 17 118 18South Lake Minnetonka 97 4 70 8 15 83 14Golden Valley 65 3 51 4 7 48 17Hopkins 63 3 55 1 4 54 9Minneapolis 2,092 673 882 87 450 1,827 265Minnetonka 232 10 199 13 10 185 47Mound 0 0 0 0 0 0 0New Hope 71 2 52 5 12 56 15Orono 16 3 10 0 3 12 4Osseo 0 0 0 0 0 0 0Plymouth 158 6 134 8 10 121 37Richfield 236 18 182 7 29 187 49Robbinsdale 74 8 50 4 12 66 8St. Anthony 38 2 19 4 13 30 8St. Louis Park 101 1 81 8 11 82 19Wayzata 5 1 4 0 0 4 1Univ. of Minn. Minneapolis PD 73 2 64 0 7 64 9Metro Airport PD 13 1 6 0 6 10 3Eden Prairie 152 0 144 0 8 123 29Maple Grove 175 4 143 4 24 137 38Minnetrista 21 2 17 0 2 15 6Champlin 51 1 45 0 5 39 12Medina 31 2 24 0 5 29 2Corcoran 0 0 0 0 0 0 0Dayton 0 0 0 0 0 0 0Rogers 4 0 1 0 3 3 1West Hennepin 22 0 22 0 0 20 2Three Rivers Park District 90 1 86 1 2 74 16Houston County Total 60 5 18 13 24 54 6Houston Co. Sheriff 42 5 9 12 16 36 6Caledonia 14 0 9 0 5 14 0Houston PD 1 0 0 1 0 1 0La Crescent 0 0 0 0 0 0 0Hokah 3 0 0 0 3 3 0Hubbard County Total 67 3 28 8 28 49 18Hubbard Co. Sheriff 35 3 16 3 13 25 10Park Rapids 32 0 12 5 15 24 8Isanti County Total 87 0 42 3 42 63 24Isanti Co. Sheriff 22 0 1 1 20 14 8Cambridge 43 0 23 2 18 31 12Isanti PD 22 0 18 0 4 18 4Itasca County Total 38 0 3 3 32 24 14Itasca Co. Sheriff 14 0 0 0 14 11 3Grand Rapids 24 0 3 3 18 13 11Jackson County Total 17 0 8 0 9 14 3Jackson Co. Sheriff 13 0 4 0 9 10 3

TABLE 192013 NARCOTICS ARRESTS BY AGENCY
79
REPORTING AGENCIES Grand Total
Opium,Cocaine, etc. Marijuana Synthetic Other
(Includes Meth) Male Female
Jackson PD 0 0 0 0 0 0 0Lakefield 4 0 4 0 0 4 0Kanabec County Total 14 0 0 3 11 12 2Kanabec Co. Sheriff 14 0 0 3 11 12 2Kandiyohi County Total 191 14 120 8 49 144 47Kandiyohi Co. Sheriff 50 2 32 2 14 34 16Willmar 141 12 88 6 35 110 31Kittson County Total 1 0 1 0 0 1 0Koochiching County Total 18 1 11 1 5 15 3Koochiching Co. Sheriff 5 1 3 1 0 4 1International Falls 13 0 8 0 5 11 2Lac qui Parle County Total 0 0 0 0 0 0 0Dawson 0 0 0 0 0 0 0Lake County Total 5 0 4 0 1 4 1Lake Co. Sheriff 2 0 2 0 0 2 0Silver Bay 0 0 0 0 0 0 0Two Harbors 3 0 2 0 1 2 1Lake of the Woods County Total 9 3 4 1 1 9 0Le Sueur County Total 43 2 31 2 8 30 13Le Sueur Co. Sheriff 14 1 6 2 5 13 1Le Sueur PD 26 1 22 0 3 15 11Montgomery 3 0 3 0 0 2 1Lincoln County Total 0 0 0 0 0 0 0Lyon County Total 111 0 62 2 47 88 23Lyon Co. Sheriff 23 0 19 2 2 17 6Marshall 88 0 43 0 45 71 17McLeod County Total 83 0 49 3 31 60 23McLeod Co. Sheriff 34 0 23 1 10 23 11Glencoe 14 0 10 1 3 12 2Hutchinson 16 0 7 0 9 10 6Brownton 0 0 0 0 0 0 0Lester Prairie 9 0 5 1 3 8 1Silver Lake 1 0 0 0 1 1 0Winsted 9 0 4 0 5 6 3Mahnomen County Total 0 0 0 0 0 0 0Marshall County Total 0 0 0 0 0 0 0Martin County Total 73 1 40 3 29 51 22Martin Co. Sheriff 18 0 10 0 8 13 5Fairmont 55 1 30 3 21 38 17Meeker County Total 38 0 14 0 24 28 10Meeker Co. Sheriff 27 0 12 0 15 22 5Litchfield 11 0 2 0 9 6 5Mille Lacs County Total 92 13 42 5 32 66 26Mille Lacs Co. Sheriff 74 13 32 3 26 54 20Milaca 0 0 0 0 0 0 0Princeton 18 0 10 2 6 12 6Morrison County Total 32 5 5 3 19 20 12Morrison Co. Sheriff 3 2 0 0 1 1 2Little Falls 29 3 5 3 18 19 10Mower County Total 193 17 102 8 66 146 47Mower Co. Sheriff 39 0 23 2 14 28 11Austin 154 17 79 6 52 118 36Murray County Total 0 0 0 0 0 0 0Nicollet County Total 60 2 42 1 15 52 8
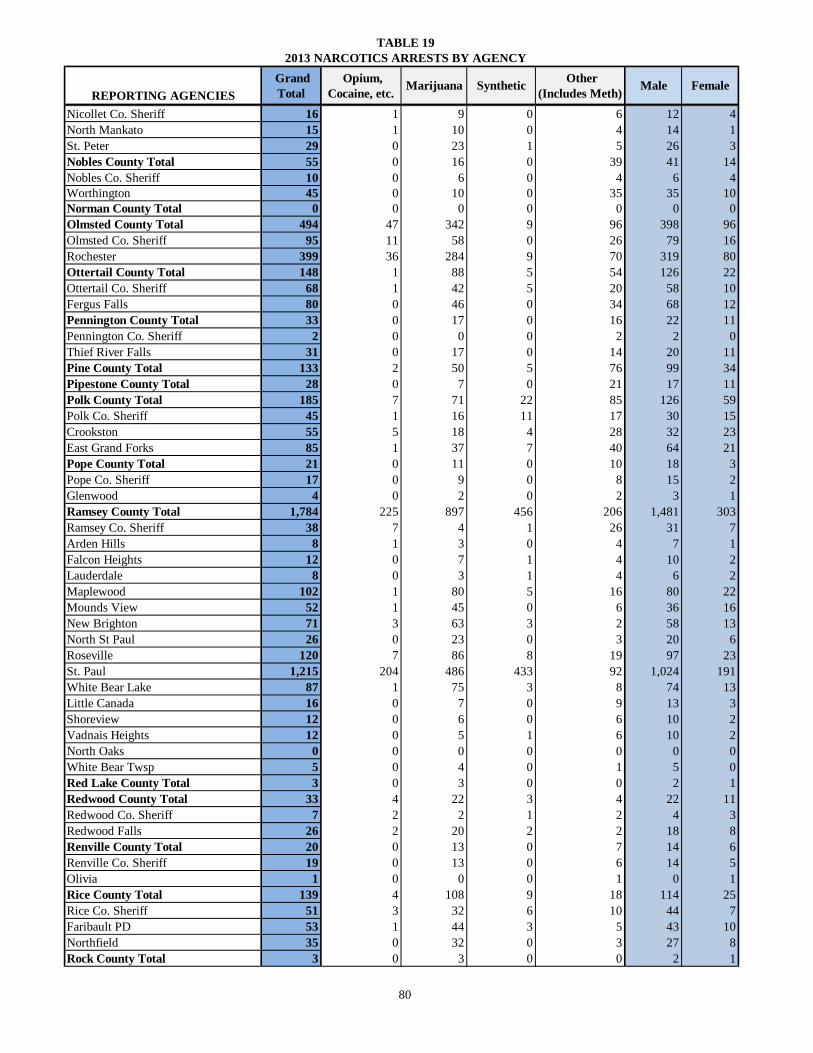
TABLE 192013 NARCOTICS ARRESTS BY AGENCY
80
REPORTING AGENCIES Grand Total
Opium,Cocaine, etc. Marijuana Synthetic Other
(Includes Meth) Male Female
Nicollet Co. Sheriff 16 1 9 0 6 12 4North Mankato 15 1 10 0 4 14 1St. Peter 29 0 23 1 5 26 3Nobles County Total 55 0 16 0 39 41 14Nobles Co. Sheriff 10 0 6 0 4 6 4Worthington 45 0 10 0 35 35 10Norman County Total 0 0 0 0 0 0 0Olmsted County Total 494 47 342 9 96 398 96Olmsted Co. Sheriff 95 11 58 0 26 79 16Rochester 399 36 284 9 70 319 80Ottertail County Total 148 1 88 5 54 126 22Ottertail Co. Sheriff 68 1 42 5 20 58 10Fergus Falls 80 0 46 0 34 68 12Pennington County Total 33 0 17 0 16 22 11Pennington Co. Sheriff 2 0 0 0 2 2 0Thief River Falls 31 0 17 0 14 20 11Pine County Total 133 2 50 5 76 99 34Pipestone County Total 28 0 7 0 21 17 11Polk County Total 185 7 71 22 85 126 59Polk Co. Sheriff 45 1 16 11 17 30 15Crookston 55 5 18 4 28 32 23East Grand Forks 85 1 37 7 40 64 21Pope County Total 21 0 11 0 10 18 3Pope Co. Sheriff 17 0 9 0 8 15 2Glenwood 4 0 2 0 2 3 1Ramsey County Total 1,784 225 897 456 206 1,481 303Ramsey Co. Sheriff 38 7 4 1 26 31 7Arden Hills 8 1 3 0 4 7 1Falcon Heights 12 0 7 1 4 10 2Lauderdale 8 0 3 1 4 6 2Maplewood 102 1 80 5 16 80 22Mounds View 52 1 45 0 6 36 16New Brighton 71 3 63 3 2 58 13North St Paul 26 0 23 0 3 20 6Roseville 120 7 86 8 19 97 23St. Paul 1,215 204 486 433 92 1,024 191White Bear Lake 87 1 75 3 8 74 13Little Canada 16 0 7 0 9 13 3Shoreview 12 0 6 0 6 10 2Vadnais Heights 12 0 5 1 6 10 2North Oaks 0 0 0 0 0 0 0White Bear Twsp 5 0 4 0 1 5 0Red Lake County Total 3 0 3 0 0 2 1Redwood County Total 33 4 22 3 4 22 11Redwood Co. Sheriff 7 2 2 1 2 4 3Redwood Falls 26 2 20 2 2 18 8Renville County Total 20 0 13 0 7 14 6Renville Co. Sheriff 19 0 13 0 6 14 5Olivia 1 0 0 0 1 0 1Rice County Total 139 4 108 9 18 114 25Rice Co. Sheriff 51 3 32 6 10 44 7Faribault PD 53 1 44 3 5 43 10Northfield 35 0 32 0 3 27 8Rock County Total 3 0 3 0 0 2 1

TABLE 192013 NARCOTICS ARRESTS BY AGENCY
81
REPORTING AGENCIES Grand Total
Opium,Cocaine, etc. Marijuana Synthetic Other
(Includes Meth) Male Female
Luverne 0 0 0 0 0 0 0Roseau County Total 2 0 1 0 1 2 0Roseau Co. Sheriff 2 0 1 0 1 2 0Roseau PD 0 0 0 0 0 0 0Warroad 0 0 0 0 0 0 0St. Louis County Total 884 64 419 208 193 678 206St. Louis Co. Sheriff 192 17 65 24 86 133 59Babbitt 2 0 2 0 0 1 1Chisholm 15 0 7 8 0 12 3Duluth 532 44 247 167 74 424 108Ely 15 0 12 0 3 13 2Eveleth 19 1 10 1 7 13 6Gilbert 0 0 0 0 0 0 0Hibbing 2 0 0 1 1 0 2Proctor 8 1 5 1 1 7 1Virginia 34 1 13 5 15 22 12Floodwood 4 0 4 0 0 4 0Hermantown 18 0 13 1 4 15 3Univ.of Minn. Duluth PD 43 0 41 0 2 34 9Scott County Total 601 36 402 17 146 471 130Scott Co. Sheriff 58 2 36 2 18 47 11Belle Plaine 28 4 17 0 7 25 3Jordan 37 0 23 0 14 32 5New Prague 42 0 30 0 12 32 10Shakopee 181 10 133 10 28 135 46Savage 94 6 80 4 4 79 15Prior Lake 161 14 83 1 63 121 40Sherburne County Total 257 4 204 10 39 205 52Sherburne Co. Sheriff 181 3 134 10 34 146 35Big Lake 7 0 7 0 0 6 1Elk River 60 1 58 0 1 46 14Becker PD 9 0 5 0 4 7 2Sibley County Total 0 0 0 0 0 0 0Stearns County Total 688 68 451 25 144 531 157Stearns Co. Sheriff 80 1 55 2 22 56 24Cold Spring 45 2 37 1 5 36 9Melrose 3 0 2 0 1 2 1Paynesville 10 0 10 0 0 7 3St. Cloud 435 65 254 17 99 342 93Sauk Centre 47 0 43 0 4 35 12Waite Park 34 0 22 5 7 25 9Kimball 0 0 0 0 0 0 0St. Joseph 0 0 0 0 0 0 0Sartell 21 0 17 0 4 17 4Albany 5 0 4 0 1 4 1Avon 8 0 7 0 1 7 1Steele County Total 122 8 92 10 12 95 27Steele Co. Sheriff 18 0 15 1 2 14 4Owatonna 103 8 77 9 9 80 23Blooming Prairie 1 0 0 0 1 1 0Stevens County Total 18 0 12 0 6 12 6Stevens Co. Sheriff 8 0 4 0 4 5 3Morris 10 0 8 0 2 7 3Univ. of Minn. Morris PD 0 0 0 0 0 0 0

TABLE 192013 NARCOTICS ARRESTS BY AGENCY
82
REPORTING AGENCIES Grand Total
Opium,Cocaine, etc. Marijuana Synthetic Other
(Includes Meth) Male Female
Swift County Total 25 1 6 0 18 20 5Swift Co. Sheriff 6 1 1 0 4 5 1Appleton 2 0 1 0 1 2 0Benson 17 0 4 0 13 13 4Todd County Total 79 0 46 2 31 61 18Todd Co. Sheriff 66 0 35 2 29 52 14Staples 13 0 11 0 2 9 4Traverse County Total 0 0 0 0 0 0 0Wheaton PD 0 0 0 0 0 0 0Wabasha County Total 71 2 47 1 21 54 17Wabasha Co. Sheriff 14 0 4 0 10 8 6Lake City 43 0 34 1 8 34 9Plainview 1 0 0 0 1 1 0Wabasha PD 13 2 9 0 2 11 2Wadena County Total 6 0 0 0 6 5 1Wadena Co. Sheriff 2 0 0 0 2 2 0Wadena PD 4 0 0 0 4 3 1Waseca County Total 63 1 39 0 23 46 17Waseca Co. Sheriff 7 0 3 0 4 6 1Janesville 1 0 1 0 0 1 0New Richland 0 0 0 0 0 0 0Waseca PD 55 1 35 0 19 39 16Washington County Total 793 15 572 8 198 605 188Washington Co. Sheriff 248 2 195 1 50 183 65Bayport 27 1 19 0 7 21 6Forest Lake 37 4 17 2 14 27 10Newport 22 0 16 1 5 15 7St. Paul Park 21 1 15 0 5 19 2Stillwater 33 1 27 0 5 24 9Cottage Grove 165 0 123 2 40 129 36Oakdale 33 1 29 0 3 27 6Woodbury 164 2 98 0 64 127 37Oak Park Heights 43 3 33 2 5 33 10Watonwan County Total 16 1 11 0 4 12 4Watonwan Co. Sheriff 5 1 4 0 0 3 2St. James 11 0 7 0 4 9 2Wilkin County Total 35 0 34 0 1 26 9Wilkin Co. Sheriff 7 0 7 0 0 5 2Breckenridge 28 0 27 0 1 21 7Winona County Total 196 20 74 11 91 145 51Winona Co. Sheriff 60 3 26 2 29 38 22St. Charles PD 1 0 1 0 0 1 0Winona PD 130 17 44 9 60 101 29Goodview 4 0 2 0 2 4 0Lewiston 1 0 1 0 0 1 0Wright County Total 448 11 316 29 92 344 104Wright Co. Sheriff 387 11 268 28 80 294 93Buffalo 60 0 48 1 11 49 11Annandale 1 0 0 0 1 1 0Yellow Medicine County Total 13 0 2 0 11 7 6Yellow Medicine Sheriff 10 0 1 0 9 4 6Canby 2 0 0 0 2 2 0Granite Falls 1 0 1 0 0 1 0MN State Patrol - Total 0 0 0 0 0 0 0

83
URBAN-RURAL AND REGIONAL INFORMATION
COMPARISON OF URBAN-RURAL CRIME OFFENSES/ARRESTS FOR 2013
Urban-rural crime comparison by offense offers information to agencies in evaluating the difference in crime occurring by geographical locations. The information that is available must be interpreted with caution as it gives a general indication of urban-rural crime only and does not represent data that can be applied to any one specific agency. Variations in crime are caused by a multitude of crime factors, which have been listed previously in this report. The information that is presented in this section lists the numbers of specific criminal offenses that have been reported to the appropriate urban or rural law
enforcement authority. Because of jurisdictional reasons, Capitol Security and State Patrol figures are excluded from this section of the report. Of additional value is the ratio of urban to rural crime offenses for 2013. The ratio is nothing more than the amount of one particular criminal offense for the urban area as compared with the amount of one particular offense for the rural area. A ratio of 7:1 aggravated assaults indicates that for every seven offenses of aggravated assault in an urban area, the rural area experienced one aggravated assault.
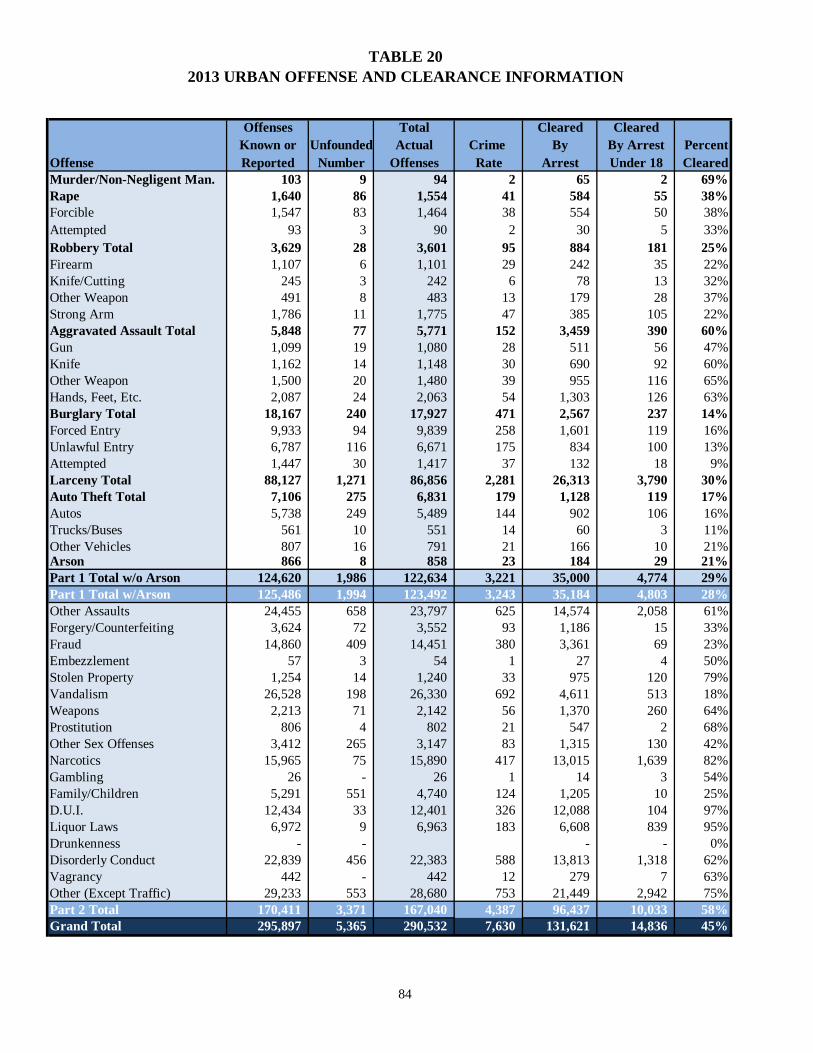
TABLE 202013 URBAN OFFENSE AND CLEARANCE INFORMATION
84
Offenses Total Cleared ClearedKnown or Unfounded Actual Crime By By Arrest Percent
Offense Reported Number Offenses Rate Arrest Under 18 ClearedMurder/Non-Negligent Man. 103 9 94 2 65 2 69%Rape 1,640 86 1,554 41 584 55 38%Forcible 1,547 83 1,464 38 554 50 38%Attempted 93 3 90 2 30 5 33%Robbery Total 3,629 28 3,601 95 884 181 25%Firearm 1,107 6 1,101 29 242 35 22%Knife/Cutting 245 3 242 6 78 13 32%Other Weapon 491 8 483 13 179 28 37%Strong Arm 1,786 11 1,775 47 385 105 22%Aggravated Assault Total 5,848 77 5,771 152 3,459 390 60%Gun 1,099 19 1,080 28 511 56 47%Knife 1,162 14 1,148 30 690 92 60%Other Weapon 1,500 20 1,480 39 955 116 65%Hands, Feet, Etc. 2,087 24 2,063 54 1,303 126 63%Burglary Total 18,167 240 17,927 471 2,567 237 14%Forced Entry 9,933 94 9,839 258 1,601 119 16%Unlawful Entry 6,787 116 6,671 175 834 100 13%Attempted 1,447 30 1,417 37 132 18 9%Larceny Total 88,127 1,271 86,856 2,281 26,313 3,790 30%Auto Theft Total 7,106 275 6,831 179 1,128 119 17%Autos 5,738 249 5,489 144 902 106 16%Trucks/Buses 561 10 551 14 60 3 11%Other Vehicles 807 16 791 21 166 10 21%Arson 866 8 858 23 184 29 21%Part 1 Total w/o Arson 124,620 1,986 122,634 3,221 35,000 4,774 29%Part 1 Total w/Arson 125,486 1,994 123,492 3,243 35,184 4,803 28%Other Assaults 24,455 658 23,797 625 14,574 2,058 61%Forgery/Counterfeiting 3,624 72 3,552 93 1,186 15 33%Fraud 14,860 409 14,451 380 3,361 69 23%Embezzlement 57 3 54 1 27 4 50%Stolen Property 1,254 14 1,240 33 975 120 79%Vandalism 26,528 198 26,330 692 4,611 513 18%Weapons 2,213 71 2,142 56 1,370 260 64%Prostitution 806 4 802 21 547 2 68%Other Sex Offenses 3,412 265 3,147 83 1,315 130 42%Narcotics 15,965 75 15,890 417 13,015 1,639 82%Gambling 26 - 26 1 14 3 54%Family/Children 5,291 551 4,740 124 1,205 10 25%D.U.I. 12,434 33 12,401 326 12,088 104 97%Liquor Laws 6,972 9 6,963 183 6,608 839 95%Drunkenness - - - - 0%Disorderly Conduct 22,839 456 22,383 588 13,813 1,318 62%Vagrancy 442 - 442 12 279 7 63%Other (Except Traffic) 29,233 553 28,680 753 21,449 2,942 75%Part 2 Total 170,411 3,371 167,040 4,387 96,437 10,033 58%Grand Total 295,897 5,365 290,532 7,630 131,621 14,836 45%

TABLE 212013 URBAN PROPERTY INFORMATION
85
Property Type Number of Offenses Stolen Value Recovered ValueCurrency/Notes 9,797,881$ 250,287$ Jewelry/Metals 10,870,211$ 414,487$ Clothing/Furs 1,778,758$ 570,629$ Locally Stolen Autos 21,055,264$ 10,670,411$ Office Equipment 5,117,252$ 382,838$ TV/Radio/Stereo 5,813,713$ 517,046$ Firearms 623,022$ 106,206$ Household Items 978,077$ 47,582$ Consumer Items 1,792,733$ 375,887$ Livestock 34,395$ 7,201$ Miscellaneous 38,438,113$ 2,732,426$ Total 96,299,419$ 16,075,000$
Murder Total 94 1,695$ Rape Total 1,486 14,373$ Robbery Highway 2,332 813,196$ Commercial House 119 91,820$ Gas/Service Station 40 13,806$ Convenience Store 66 24,755$ Residence 228 158,043$ Bank 39 50,673$ Miscellaneous 777 614,839$
Total 3,601 1,767,132$ Burglary Residence/Night 4,656 4,411,272$ Residence/Day 5,115 7,215,233$ Residence/Unknown 2,943 4,006,163$ Non-Residence/Night 2,157 2,795,920$ Non-Residence/Day 680 857,631$ Non-Residence/Unknown 2,376 3,815,876$
Total 17,927 23,102,095$ Larceny by Value Larceny Over $200 32,619 49,296,453$ Larceny $50-$200 22,945 2,583,002$ Larceny Under $50 31,292 532,552$
Total 86,856 52,412,007$
Auto Theft Total 6,831 19,002,117$
GRAND TOTAL 116,795 96,299,419$
Larceny by Category Pocket Picking 674 203,599$ Purse Snatching 61 14,935$ Cargo Thefts 13 10,702$ Shoplifting 18,770 3,817,255$ From Autos 18,379 12,409,600$ Auto Parts/Accessories 2,367 755,758$ Bicycles 2,759 882,423$ From Buildings 8,963 7,206,927$ Coin Machines 82 19,327$ Livestock 38 3,201$ All Other 34,750 27,088,280$
Total 86,856 52,412,007$
Autos-Stolen Locally-Recovered Locally 1,936Autos-Stolen Locally-Recovered Not Locally 1,168Total Stolen/Recovered 3,104 Autos-Stolen Not Locally-Recovered Locally 278

TABLE 222013 RURAL OFFENSE AND CLEARANCE INFORMATION
86
Offenses Total Cleared ClearedKnown or Unfounded Actual Crime By By Arrest Percent
Offense Reported Number Offenses Rate Arrest Under 18 ClearedMurder/Non-Negligent Man. 18 1 17 1 11 1 65%Rape 451 34 417 27 222 24 53%Forcible 389 34 355 23 211 24 59%Attempted 62 - 62 4 11 - 18%Robbery Total 63 3 60 4 36 1 60%Firearm 18 2 16 1 13 1 81%Knife/Cutting 8 - 8 1 5 - 63%Other Weapon 19 - 19 1 10 - 53%Strong Arm 18 1 17 1 8 - 47%Aggravated Assault Total 975 20 955 61 803 68 84%Gun 166 1 165 10 140 19 85%Knife 127 2 125 8 107 12 86%Other Weapon 304 10 294 19 245 24 83%Hands, Feet, Etc. 378 7 371 24 311 13 84%Burglary Total 4,740 167 4,573 291 920 47 20%Forced Entry 3,151 86 3,065 195 623 28 20%Unlawful Entry 1,311 62 1,249 79 249 16 20%Attempted 278 19 259 16 48 3 19%Larceny Total 13,455 533 12,922 822 3,083 209 24%Auto Theft Total 1,144 104 1,040 66 353 24 34%Autos 797 76 721 46 273 22 38%Trucks/Buses 88 4 84 5 30 2 36%Other Vehicles 259 24 235 15 50 - 21%Arson 72 - 72 5 29 4 40%Part 1 Total w/o Arson 20,846 862 19,984 1,272 5,428 374 27%Part 1 Total w/Arson 20,918 862 20,056 1,276 5,457 378 27%Other Assaults 5,547 183 5,364 341 4,003 368 75%Forgery/Counterfeiting 419 12 407 26 158 2 39%Fraud 3,946 135 3,811 242 1,642 9 43%Embezzlement 11 - 11 1 8 - 73%Stolen Property 292 4 288 18 221 14 77%Vandalism 6,407 94 6,313 402 1,862 123 29%Weapons 529 7 522 33 332 18 64%Prostitution 45 - 45 3 25 - 56%Other Sex Offenses 967 58 909 58 560 37 62%Narcotics 3,919 20 3,899 248 3,422 343 88%Gambling 4 - 4 0 3 - 75%Family/Children 1,185 106 1,079 69 683 1 63%D.U.I. 4,749 7 4,742 302 4,588 46 97%Liquor Laws 1,351 16 1,335 85 1,214 228 91%Disorderly Conduct 5,384 118 5,266 335 3,282 155 62%Vagrancy 0 0 0 0 0 0 0%Other (Except Traffic) 11,761 326 11,435 728 9,089 425 79%Part 2 Total 46,516 1,086 45,430 2,891 31,092 1,769 68%Grand Total 67,434 1,948 65,486 4,167 36,549 2,147 56%
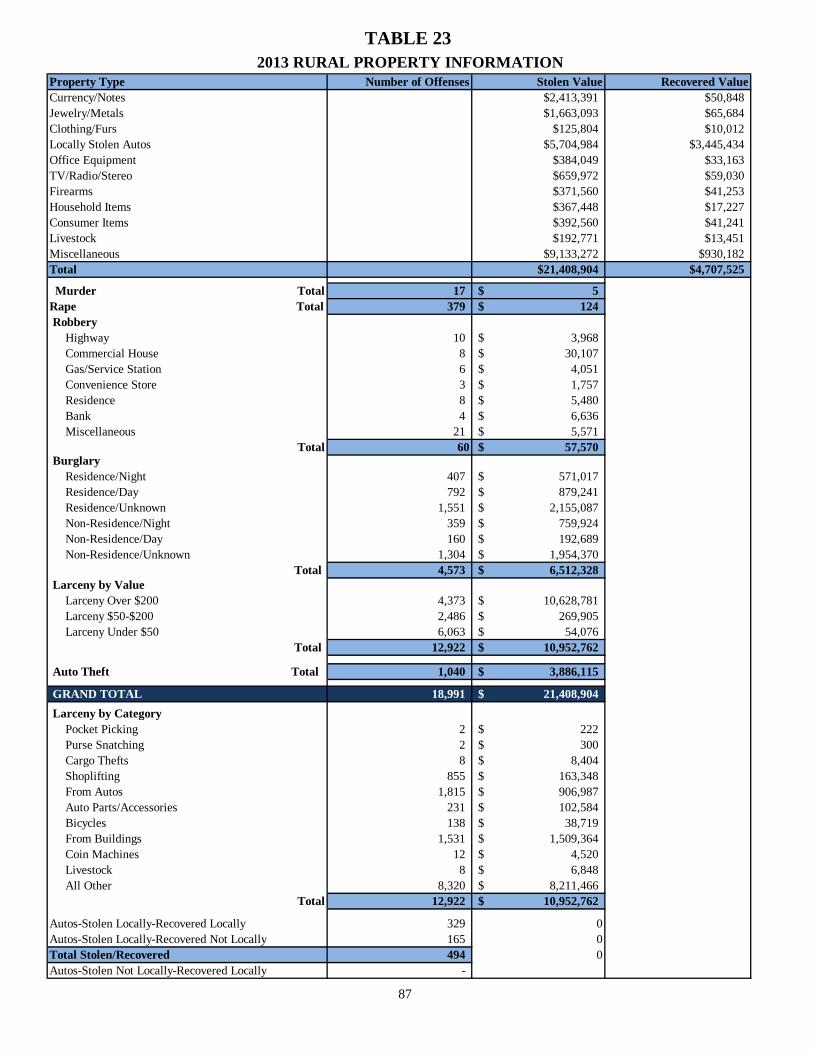
TABLE 23 2013 RURAL PROPERTY INFORMATION
87
Property Type Number of Offenses Stolen Value Recovered ValueCurrency/Notes $2,413,391 $50,848Jewelry/Metals $1,663,093 $65,684Clothing/Furs $125,804 $10,012Locally Stolen Autos $5,704,984 $3,445,434Office Equipment $384,049 $33,163TV/Radio/Stereo $659,972 $59,030Firearms $371,560 $41,253Household Items $367,448 $17,227Consumer Items $392,560 $41,241Livestock $192,771 $13,451Miscellaneous $9,133,272 $930,182Total $21,408,904 $4,707,525
Murder Total 17 5$ Rape Total 379 124$ Robbery Highway 10 3,968$ Commercial House 8 30,107$ Gas/Service Station 6 4,051$ Convenience Store 3 1,757$ Residence 8 5,480$ Bank 4 6,636$ Miscellaneous 21 5,571$
Total 60 57,570$ Burglary Residence/Night 407 571,017$ Residence/Day 792 879,241$ Residence/Unknown 1,551 2,155,087$ Non-Residence/Night 359 759,924$ Non-Residence/Day 160 192,689$ Non-Residence/Unknown 1,304 1,954,370$
Total 4,573 6,512,328$ Larceny by Value Larceny Over $200 4,373 10,628,781$ Larceny $50-$200 2,486 269,905$ Larceny Under $50 6,063 54,076$
Total 12,922 10,952,762$
Auto Theft Total 1,040 3,886,115$
GRAND TOTAL 18,991 21,408,904$ Larceny by Category Pocket Picking 2 222$ Purse Snatching 2 300$ Cargo Thefts 8 8,404$ Shoplifting 855 163,348$ From Autos 1,815 906,987$ Auto Parts/Accessories 231 102,584$ Bicycles 138 38,719$ From Buildings 1,531 1,509,364$ Coin Machines 12 4,520$ Livestock 8 6,848$ All Other 8,320 8,211,466$
Total 12,922 10,952,762$
Autos-Stolen Locally-Recovered Locally 329 0Autos-Stolen Locally-Recovered Not Locally 165 0Total Stolen/Recovered 494 0Autos-Stolen Not Locally-Recovered Locally -

TABLE 24URBAN-RURAL* COMPARISON OF OFFENSES BY SEX
AND PERCENT OF TOTAL ARRESTS IN 2013
T = TotalM = MaleF = Female*State Patrol figures are excluded. 88
Percent PercentOffense Sex Urban of Total Rural of Total Total
Murder/Non-Negligent M 60 85% 11 15% 71 Manslaughter F 14 93% 1 7% 15
T 74 86% 12 14% 86 Negligent Manslaughter M 3 100% - 0% 3
F 2 100% - 0% 2 T 5 100% - 0% 5
Rape M 418 77% 128 23% 546 F 13 76% 4 24% 17 T 431 77% 132 23% 563
Robbery M 1,008 96% 37 4% 1,045 F 140 94% 9 6% 149 T 1,148 96% 46 4% 1,194
Aggravated Assault M 2,539 83% 510 17% 3,049 F 651 87% 99 13% 750 T 3,190 84% 609 16% 3,799
Burglary M 1,768 76% 563 24% 2,331 F 222 68% 103 32% 325 T 1,990 75% 666 25% 2,656
Larceny M 12,723 93% 1,011 7% 13,734 F 10,798 96% 497 4% 11,295 T 23,521 94% 1,508 6% 25,029
Motor Vehicle Theft M 654 79% 175 21% 829 F 154 83% 32 17% 186 T 808 80% 207 20% 1,015
Arson M 60 74% 21 26% 81 F 16 76% 5 24% 21 T 76 75% 26 25% 102
PART 1 - TOTAL* M 19,233 89% 2,456 11% 21,689 F 12,010 94% 750 6% 12,760 T 31,243 91% 3,206 9% 34,449
Other Assaults M 9,412 82% 2,076 18% 11,488 F 2,906 83% 591 17% 3,497 T 12,318 82% 2,667 18% 14,985
Forgery/Counterfeiting M 523 88% 71 12% 594 F 358 89% 43 11% 401 T 881 89% 114 11% 995
Fraud M 1,130 86% 186 14% 1,316 F 686 81% 159 19% 845 T 1,816 84% 345 16% 2,161
Embezzlement M 10 83% 2 17% 12 F 12 92% 1 8% 13 T 22 88% 3 12% 25
Stolen Property M 1,251 84% 233 16% 1,484 F 358 86% 58 14% 416 T 1,609 85% 291 15% 1,900
Vandalism M 2,252 84% 414 16% 2,666 F 494 88% 68 12% 562 T 2,746 85% 482 15% 3,228
Weapons M 1,370 86% 225 14% 1,595 F 128 89% 16 11% 144 T 1,498 86% 241 14% 1,739

TABLE 24URBAN-RURAL* COMPARISON OF OFFENSES BY SEX
AND PERCENT OF TOTAL ARRESTS IN 2013
T = TotalM = MaleF = Female*State Patrol figures are excluded. 89
Percent PercentOffense Sex Urban of Total Rural of Total Total
Prostitution M 442 96% 18 4% 460 F 249 95% 12 5% 261 T 691 96% 30 4% 721
Other Sex Offenses M 880 76% 275 24% 1,155 F 40 75% 13 25% 53 T 920 76% 288 24% 1,208
Narcotics M 12,453 82% 2,766 18% 15,219 F 3,088 78% 879 22% 3,967 T 15,541 81% 3,645 19% 19,186
Gambling M 25 96% 1 4% 26 F 5 15% 2 6% 7 T 30 91% 3 9% 33
Family/Children M 413 90% 47 10% 460 F 187 82% 41 18% 228 T 600 87% 88 13% 688
Driving Under the Influence M 8,895 73% 3,354 27% 12,249 F 3,591 77% 1,061 23% 4,652 T 12,486 74% 4,415 26% 16,901
Liquor Laws M 8,031 83% 1,634 17% 9,665 F 3,584 80% 897 20% 4,481 T 11,615 82% 2,531 18% 14,146
Disorderly Conduct M 7,119 88% 940 12% 8,059 F 2,503 88% 330 12% 2,833 T 9,622 88% 1,270 12% 10,892
Vagrancy M 281 100% - 0% 281 F 42 100% - 0% 42 T 323 100% - 0% 323
Other (Except Traffic) M 17,596 77% 5,209 23% 22,805 F 5,082 77% 1,539 23% 6,621 T 22,678 77% 6,748 23% 29,426
PART 2 - TOTAL* M 72,083 81% 17,451 19% 89,534 F 23,313 80% 5,710 20% 29,023 T 95,396 80% 23,161 20% 118,557
Curfew/Loitering M 1,496 100% 7 0% 1,503 F 645 100% 2 0% 647 T 2,141 100% 9 0% 2,150
Runaways M 401 88% 56 12% 457 F 572 88% 77 12% 649 T 973 88% 133 12% 1,106
GRAND TOTAL* M 93,213 82% 19,970 18% 113,183 F 36,540 85% 6,539 15% 43,079 T 129,753 83% 26,509 17% 156,262

TABLE 25URBAN-RURAL CRIME COMPARISON BY OFFENSE - 2013
90
Offenses Urban Total Rural Total Ratio U:R
Murder/Non-Negligent Manslaughter 94 17 6:1
Rape 1,554 417 4:1
Robbery 3,601 60 60:1
Aggravated Assault 5,771 955 6:1
Burglary 17,927 4,573 4:1
Larceny 86,856 12,922 7:1
Motor Vehicle Theft 6,831 1,040 7:1
Arson 858 72 12:1
Part I Total 123,492 20,056 6:1
Other Assaults 23,797 5,364 4:1
Forgery/Counterfeiting 3,552 407 9:1
Fraud 14,451 3,811 4:1
Embezzlement 54 11 5:1
Stolen Property 1,240 288 4:1
Vandalism 26,330 6,313 4:1
Weapons 2,142 522 4:1
Prostitution 802 45 18:1
Other Sex Offenses 3,147 909 3:1
Narcotics 15,890 3,899 4:1
Gambling 26 4 7:1
Offenses Against Family/Children 4,740 1,079 4:1
Driving Under the Influence 12,401 4,742 3:1
Liquor Laws 6,963 1,335 5:1
Disorderly Conduct 22,383 5,266 4:1
Vagrancy 442 0 442:1
All Other (Except Traffic) 28,680 11,435 3:1
Part 2 Total 167,040 45,430 4:1
Grand Total 290,532 65,486 4:1
*State Patrol and Capitol Security figures are excluded.

91
CRIME OFFENSES AND ARRESTS FOR STATE JUDICIAL DISTRICTS
The judicial district breakdown of crimes and arrests within Minnesota provides another measurement of the volume of crime based on specific areas. The judicial districts evaluated are based upon the ten judicial districts in the state. Judicial District 4, which is the most densely populated geographical section for the entire state, recorded the highest number of reported Part I offenses (44,301) and Part II offenses (58,444) of all districts. Thirty one percent of the state's Part I offenses occurred in this district, while 27 percent of the Part II offenses were registered from this area. Approximately 41 percent of the state's violent crimes were recorded from this district and 30 percent of property crime was represented by this region. The largest portion of arrests for Part I and Part II offense were also registered from Judicial District 4.
There were 10,012 arrests for Part I violations compared to 33,387 arrests for Part II offenses. Judicial District 8 recorded the smallest amount of Part I offenses with 2,342. Judicial District 5 registered the second lowest amount of Part I offenses with 5,082. Judicial District 8, with 4,596 offenses, recorded the lowest number of Part II offenses. Judicial District 8 reported the least amount of violent crime (156) and also the least amount of property offenses (1,334) in the state for 2013. The district registering the highest clearance rate for Part I offenses in 2013 was Judicial District 1 with 39 percent and second was Judicial District 7 with 35 percent. The district with the highest Part II clearance rate was Judicial District 5 with 70 percent and second was Judicial District 8 showing a 69 percent clearance rate.
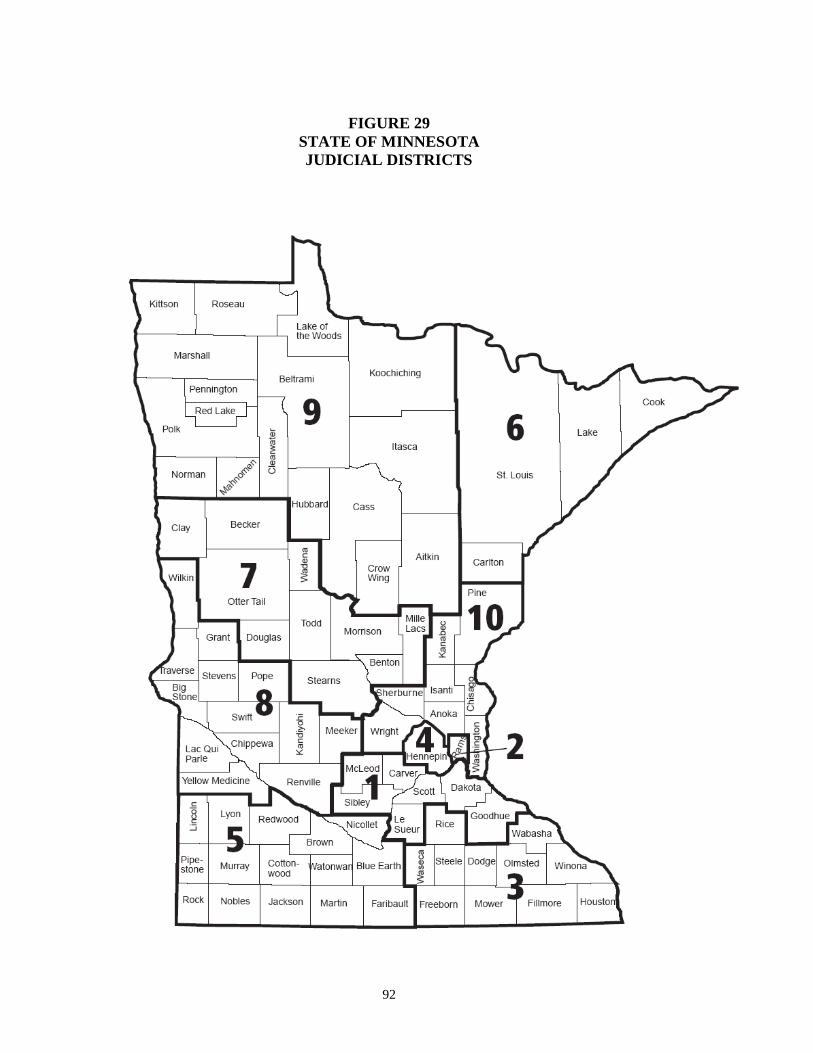
92
FIGURE 29
STATE OF MINNESOTA JUDICIAL DISTRICTS

TABLE 262013 CRIMES AND ARRESTS FOR STATE JUDICIAL DISTRICTS*
93
Judicial District 1 2 3 4 5 6 7 8 9 10Percent of Total State Population 14% 10% 9% 22% 5% 5% 9% 3% 6% 17%
Part I Actual Offenses Reported 14,859 20,651 8,637 44,301 5,082 8,392 10,584 2,342 8,318 20,382
Number of Part I Offenses Cleared 5,862 4,198 2,848 10,786 1,576 2,195 3,719 742 2,615 6,100
Percent Cleared - Part I Offenses 39% 20% 33% 24% 31% 26% 35% 32% 31% 30%
Number of Violent Crimes 876 2,495 674 5,126 429 556 657 156 517 983
Violent Crime Rate(per 100,000 Inhabitants) 116 482 142 435 148 223 136 95 153 106
Number of Property Crimes 13,983 18,156 7,963 39,175 4,653 7,836 9,927 2,186 7,801 19,399
Property Crime Rate(per 100,000 Inhabitants) 1,851 3,505 1,678 3,322 1,611 3,150 2,048 1,334 2,315 2,089
Part 2 Actual Offenses Reported+ 21,597 20,426 16,255 58,444 11,478 12,121 18,691 4,596 16,861 32,001
Number of Part 2 Offenses Cleared 14,356 9,280 10,879 30,764 7,989 6,463 12,766 3,172 10,964 20,896
Percent Cleared Part - 2 Offenses 66% 45% 67% 53% 70% 53% 68% 69% 65% 65%
Number of Part 1 Arrests 3,783 4,757 2,634 10,012 1,293 2,149 2,722 538 1,633 4,928
Number of Part 2 Arrests 12,827 12,108 9,366 33,387 7,368 6,903 10,890 2,668 7,121 15,919
* State Patrol and Capitol Security figures are excluded.

94
STATE OF MINNESOTA JUDICIAL DISTRICTS
JUDICIAL DISTRICT #1 Carver Dakota Goodhue LeSueur McLeod Scott Sibley JUDICIAL DISTRICT #2 Ramsey JUDICIAL DISTRICT #3 Dodge Fillmore Freeborn Houston Mower Olmsted Rice Steele Wabasha Waseca Winona JUDICIAL DISTRICT #4 Hennepin JUDICIAL DISTRICT #5 Blue Earth Brown Cottonwood Faribault Jackson Lincoln Lyon Martin Murray Nicollet Nobles Pipestone Redwood Rock Watonwan
JUDICIAL DISTRICT #6 Carlton Cook Lake St. Louis JUDICIAL DISTRICT #7 Becker Benton Clay Douglas Mille Lacs Morrison Otter Tail Stearns Todd Wadena JUDICIAL DISTRICT #8 Big Stone Chippewa Grant Kandiyohi Lac Qui Parle Meeker Pope Renville Stevens Swift Traverse Wilkin Yellow Medicine
JUDICIAL DISTRICT #9 Aitkin Beltrami Cass Clearwater Crow Wing Hubbard Itasca Kittson Koochiching Lake of the Woods Mahnomen Marshall Norman Pennington Polk Red Lake Roseau JUDICIAL DISTRICT #10 Anoka Chisago Isanti Kanabec Pine Sherburne Washington Wright

95
MINNESOTA LAW ENFORCEMENT EMPLOYEE INFORMATION
Minnesota State Law Enforcement agencies reported a total of 13,394 sworn and civilian employees for 2013. Of that amount, 8,762 were sworn personnel and 4,632 were civilian employees. The average number of full time law enforcement personnel in 2013 (including sworn and civilian) amounted to 2.3 employees per each 1,000 residents of the state. The average number of sworn personnel (excluding civilian) amounted to 1.6 employees per 1,000 population. The contributing law enforcement agencies averaged one full-time civilian employee to 1.9 full-time sworn personnel. These figures represent the averages as derived from the submitted data and are not the recommended ratios for Minnesota law enforcement agencies. The average ratio of law enforcement personnel for any given community may, and does, vary according to a number of community and policing factors. In 2013, the reporting sheriff's departments indicated 2,644 sworn personnel employed and 3,305 civilian personnel which amounted to a total of 5,949 employees. This was a 0.8 percent increase in staffing from previous year 2012 with a total of 5,903.
The police departments reported to have 5,437 sworn personnel in 2013, compared with 1,056 civilian employees. The total number of municipal employees equaled 6,493 personnel. Police departments experienced a 0.03 percent increase in personnel, with a 2012 total count of 6,491. The State Patrol figures indicate 522 sworn personnel and 187 civilian employees for a total of 709 for 2013. The State Patrol experienced a 20 percent decrease in personnel from the previous year count of 888. Other zero population non-city agencies (Airport Police, Universities, etc.) reported 159 sworn personnel and 84 civilian employees for a total of 243. Of the total number of sworn personnel in 2013 (8,762), there were 7,715 males and 1,047 females. Considering the total number of civilian personnel for the same year (4,632), there were 1,989 males compared with 2,643 females. The total number of law enforcement employees for 2013 was 13,394

TABLE 27
POLICE EMPLOYEES AS OF OCTOBER 31, 2013 - URBAN
(Rate per 1,000 Inhabitants)
96
Agency Population GRAND TOTAL
Sworn Male
Sworn Female
TOTAL SWORN
Civil Male
Civil Female
TOTAL CIVIL
GROUP I (250,000 & over) Rate per 1,000 2.54 1.76 0.34 2.10 0.15 0.29 0.44
Minneapolis Police Dept 390,240 977 716 128 844 47 86 133 St Paul Police Dept 290,700 752 483 104 587 52 113 165
GROUP I TOTAL (Agency Total Count = 2) 680,940 1,729 1,199 232 1,431 99 199 298
GROUP II (100,000 - 250,000) Rate per 1,000 1.74 1.11 0.12 1.22 0.19 0.32 0.52
Rochester Police Dept 108,582 189 120 13 133 21 35 56 GROUP II TOTAL (Agency Total Count = 1) 108,582 189 120 13 133 21 35 56
GROUP III (50,000 - 100,000) Rate per 1,000 1.44 1.02 0.17 1.19 0.06 0.19 0.25
Blaine Police Dept 57,953 76 54 5 59 5 12 17 Bloomington Police Dept 84,596 140 100 11 111 8 21 29 Brooklyn Park Police Dept 77,346 132 89 15 104 6 22 28 Burnsville Police Dept 61,218 88 57 17 74 5 9 14 Coon Rapids Police Dept 62,301 70 54 8 62 0 8 8 Duluth Police Dept 86,830 178 131 22 153 5 20 25 Eagan Police Dept 65,180 80 60 9 69 3 8 11 Eden Prairie Police Dept 62,052 92 58 10 68 4 20 24 Lakeville Police Dept 56,805 59 44 7 51 7 1 8 Maple Grove Police Dept 62,840 77 57 8 65 2 10 12 Minnetonka Police Dept 50,758 72 47 8 55 3 14 17 Plymouth Police Dept 72,020 78 60 9 69 3 6 9 St Cloud Police Dept 66,593 121 83 17 100 5 16 21 Woodbury Public Safety 63,190 78 53 15 68 0 10 10
GROUP III TOTAL (Agency Total Count = 14) 929,682 1,341 947 161 1,108 56 177 233
GROUP IV (25,000 - 50,000) Rate per 1,000 1.44 1.02 0.17 1.19 0.04 0.22 0.25
Apple Valley Police Dept 49,827 52 38 5 43 0 9 9 Brooklyn Center Police Dept 30,725 60 40 8 48 2 10 12 Cottage Grove Police Dept 35,277 45 32 7 39 0 6 6 Edina Police Dept 48,932 73 45 5 50 5 18 23 Fridley Police Dept 27,574 43 34 4 38 0 5 5 Inver Grove Heights Police Dept 34,394 39 29 5 34 0 5 5 Mankato Dept of Public Safety 39,782 60 40 10 50 1 9 10 Maplewood Police Dept 38,719 52 42 5 47 1 4 5

TABLE 27
POLICE EMPLOYEES AS OF OCTOBER 31, 2013 - URBAN
(Rate per 1,000 Inhabitants)
97
Moorhead Police Dept 38,813 67 48 5 53 3 11 14 Oakdale Police Dept 27,921 39 21 8 29 4 6 10 Owatonna Police Dept 25,734 38 32 3 35 0 3 3 Richfield Police Dept 35,953 52 37 5 42 0 10 10 Roseville Police Dept 34,276 55 40 7 47 2 6 8 Savage Police Dept 27,635 39 28 4 32 1 6 7 Shakopee Police Dept 38,057 55 36 10 46 1 8 9 St Louis Park Police Dept 46,176 65 43 8 51 1 13 14 Winona Police Dept 27,731 40 32 4 36 1 3 4
GROUP IV TOTAL (Agency Total Count = 17) 607,526 874 617 103 720 22 132 154
GROUP V (10,000 - 25,000) Rate per 1,000 1.57 1.17 0.16 1.33 0.05 0.19 0.24
Albert Lea Police Dept 18,082 35 23 2 25 0 10 10 Alexandria Police Dept 11,192 25 19 2 21 1 3 4 Anoka Police Dept 17,367 33 25 2 27 1 5 6 Austin Police Dept 24,993 34 29 2 31 2 1 3 Bemidji Police Dept 13,745 34 29 3 32 0 2 2 Big Lake Police Dept 10,222 13 10 1 11 0 2 2 Brainerd Police Dept 13,734 29 22 1 23 0 6 6 Buffalo Police Dept 15,765 20 13 4 17 0 3 3 Centennial Lakes Police Dept 10,903 18 15 1 16 0 2 2 Champlin Police Dept 23,568 29 21 3 24 1 4 5 Chaska Police Dept 24,344 27 20 4 24 0 3 3 Cloquet Police Dept 12,226 21 19 0 19 0 2 2 Columbia Heights Police Dept 20,513 32 25 2 27 2 3 5 Crystal Police Dept 22,607 34 23 6 29 1 4 5 Elk River Police Dept 23,335 40 30 1 31 1 8 9 Fairmont Police Dept 10,657 18 15 0 15 1 2 3 Faribault Police Dept 23,600 36 25 6 31 0 5 5 Farmington Police Dept 21,403 29 23 2 25 2 2 4 Fergus Falls Police Dept 13,209 28 22 1 23 0 5 5 Forest Lake Police Dept 18,738 29 22 4 26 0 3 3 Golden Valley Police Dept 20,787 40 24 6 30 6 4 10 Grand Rapids Police Dept 10,932 22 17 2 19 0 3 3 Hastings Police Dept 22,502 32 26 3 29 0 3 3 Hibbing Police Dept 16,469 30 23 3 26 0 4 4 Hopkins Police Dept 17,951 36 21 6 27 4 5 9 Hutchinson Police Dept 14,183 29 17 3 20 1 8 9 Lino Lakes Police Dept 20,478 26 20 4 24 0 2 2 Marshall Police Dept 13,788 26 18 2 20 2 4 6 Mendota Heights Police Dept 11,240 18 15 2 17 0 1 1 Mounds View Police Dept 12,384 21 18 1 19 0 2 2
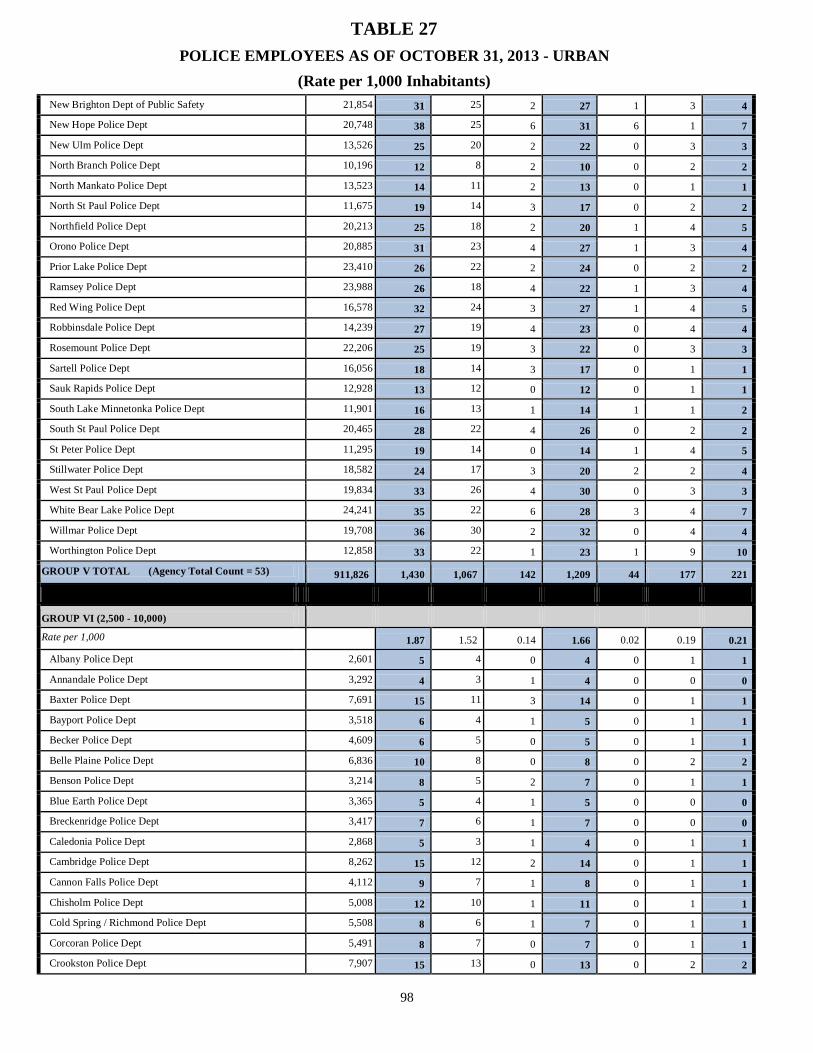
TABLE 27
POLICE EMPLOYEES AS OF OCTOBER 31, 2013 - URBAN
(Rate per 1,000 Inhabitants)
98
New Brighton Dept of Public Safety 21,854 31 25 2 27 1 3 4 New Hope Police Dept 20,748 38 25 6 31 6 1 7 New Ulm Police Dept 13,526 25 20 2 22 0 3 3 North Branch Police Dept 10,196 12 8 2 10 0 2 2 North Mankato Police Dept 13,523 14 11 2 13 0 1 1 North St Paul Police Dept 11,675 19 14 3 17 0 2 2 Northfield Police Dept 20,213 25 18 2 20 1 4 5 Orono Police Dept 20,885 31 23 4 27 1 3 4 Prior Lake Police Dept 23,410 26 22 2 24 0 2 2 Ramsey Police Dept 23,988 26 18 4 22 1 3 4 Red Wing Police Dept 16,578 32 24 3 27 1 4 5 Robbinsdale Police Dept 14,239 27 19 4 23 0 4 4 Rosemount Police Dept 22,206 25 19 3 22 0 3 3 Sartell Police Dept 16,056 18 14 3 17 0 1 1 Sauk Rapids Police Dept 12,928 13 12 0 12 0 1 1 South Lake Minnetonka Police Dept 11,901 16 13 1 14 1 1 2 South St Paul Police Dept 20,465 28 22 4 26 0 2 2 St Peter Police Dept 11,295 19 14 0 14 1 4 5 Stillwater Police Dept 18,582 24 17 3 20 2 2 4 West St Paul Police Dept 19,834 33 26 4 30 0 3 3 White Bear Lake Police Dept 24,241 35 22 6 28 3 4 7 Willmar Police Dept 19,708 36 30 2 32 0 4 4 Worthington Police Dept 12,858 33 22 1 23 1 9 10
GROUP V TOTAL (Agency Total Count = 53) 911,826 1,430 1,067 142 1,209 44 177 221
GROUP VI (2,500 - 10,000) Rate per 1,000 1.87 1.52 0.14 1.66 0.02 0.19 0.21
Albany Police Dept 2,601 5 4 0 4 0 1 1 Annandale Police Dept 3,292 4 3 1 4 0 0 0 Baxter Police Dept 7,691 15 11 3 14 0 1 1 Bayport Police Dept 3,518 6 4 1 5 0 1 1 Becker Police Dept 4,609 6 5 0 5 0 1 1 Belle Plaine Police Dept 6,836 10 8 0 8 0 2 2 Benson Police Dept 3,214 8 5 2 7 0 1 1 Blue Earth Police Dept 3,365 5 4 1 5 0 0 0 Breckenridge Police Dept 3,417 7 6 1 7 0 0 0 Caledonia Police Dept 2,868 5 3 1 4 0 1 1 Cambridge Police Dept 8,262 15 12 2 14 0 1 1 Cannon Falls Police Dept 4,112 9 7 1 8 0 1 1 Chisholm Police Dept 5,008 12 10 1 11 0 1 1 Cold Spring / Richmond Police Dept 5,508 8 6 1 7 0 1 1 Corcoran Police Dept 5,491 8 7 0 7 0 1 1 Crookston Police Dept 7,907 15 13 0 13 0 2 2

TABLE 27
POLICE EMPLOYEES AS OF OCTOBER 31, 2013 - URBAN
(Rate per 1,000 Inhabitants)
99
Dayton Police Dept 4,766 6 5 0 5 0 1 1 Deephaven Police Dept 4,163 8 7 0 7 0 1 1 Detroit Lakes Police Dept 8,696 16 14 0 14 0 2 2 Dilworth Police Dept 4,108 6 5 0 5 0 1 1 East Grand Forks Police Dept 8,615 23 18 2 20 1 2 3 Ely Police Dept 3,482 8 7 0 7 0 1 1 Eveleth Police Dept 3,742 11 10 0 10 0 1 1 Glencoe Police Dept 5,634 9 7 1 8 0 1 1 Glenwood Police Dept 2,557 3 3 0 3 0 0 0 Goodview Police Dept 4,055 4 3 1 4 0 0 0 Granite Falls Police Dept 2,882 4 4 0 4 0 0 0 Hermantown Police Dept 9,476 18 12 3 15 0 3 3 International Falls Police Dept 6,417 12 11 0 11 1 0 1 Isanti Police Dept 5,350 9 7 1 8 0 1 1 Jordan Police Dept 5,619 10 8 0 8 0 2 2 Kasson Police Dept 6,016 8 8 0 8 0 0 0 La Crescent Police Dept 4,864 8 6 1 7 0 1 1 Lake City Police Dept 5,080 12 10 0 10 1 1 2 Lake Crystal Police Dept 2,582 3 3 0 3 0 0 0 Lakes Area Police Dept 9,473 14 10 2 12 0 2 2 Le Sueur Police Dept 4,076 8 7 0 7 0 1 1 Litchfield Police Dept 6,758 10 9 0 9 0 1 1 Little Falls Police Dept 8,403 15 13 0 13 0 2 2 Long Prairie Police Dept 3,473 5 5 0 5 0 0 0 Medina Police Dept 4,995 11 9 1 10 0 1 1 Melrose Police Dept 3,637 5 4 0 4 0 1 1 Milaca Police Dept 2,953 12 10 1 11 0 1 1 Minnetrista Police Dept 8,846 12 10 0 10 1 1 2 Montevideo Police Dept 5,365 11 10 0 10 0 1 1 Montgomery Police Dept 2,969 5 4 0 4 0 1 1 Moose Lake Police Dept 2,771 4 4 0 4 0 0 0 Morris Police Dept 5,299 10 7 1 8 0 2 2 New Prague Police Dept 7,448 11 9 0 9 0 2 2 Newport Police Dept 3,503 7 7 0 7 0 0 0 Oak Park Heights Police Dept 4,417 11 9 1 10 0 1 1 Park Rapids Police Dept 3,710 11 9 1 10 0 1 1 Plainview Police Dept 3,350 5 5 0 5 0 0 0 Princeton Police Dept 4,706 13 9 2 11 0 2 2 Proctor Police Dept 3,078 7 6 0 6 1 0 1 Redwood Falls Police Dept 5,260 12 9 1 10 0 2 2 Rogers Police Dept 8,945 19 14 2 16 1 2 3 Roseau Police Dept 2,635 6 5 0 5 0 1 1 Sauk Centre Police Dept 4,367 7 6 0 6 0 1 1 Sleepy Eye Police Dept 3,600 6 5 1 6 0 0 0
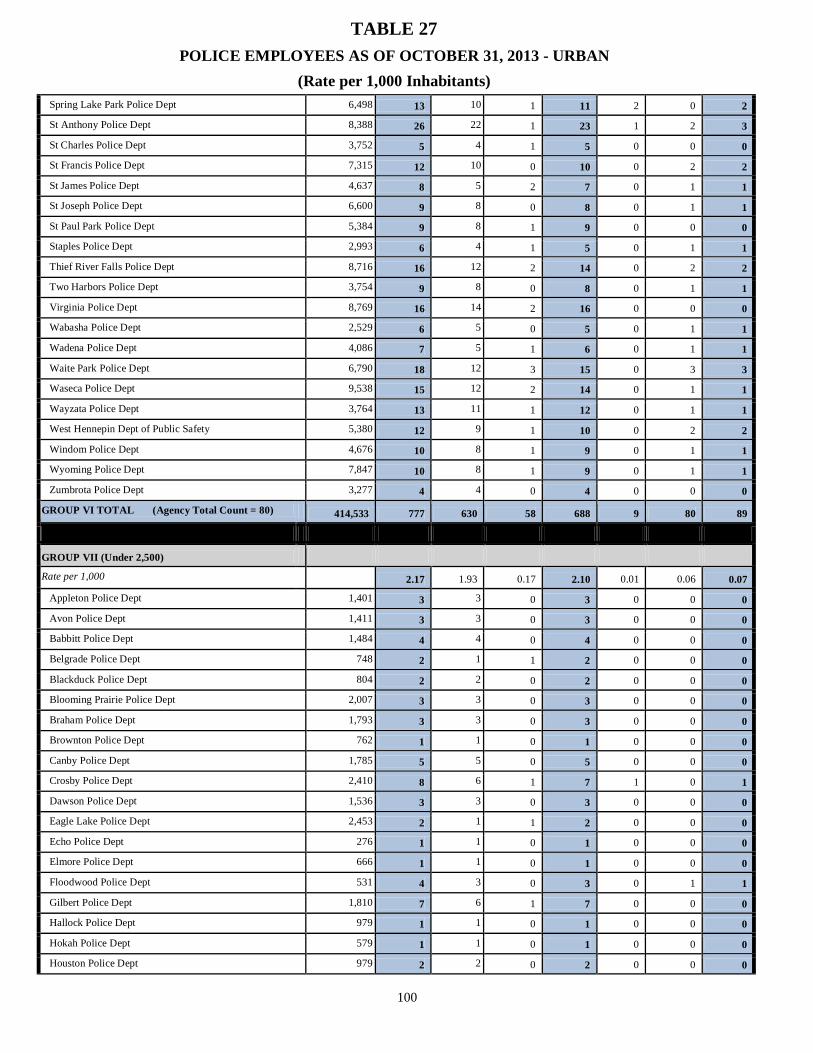
TABLE 27
POLICE EMPLOYEES AS OF OCTOBER 31, 2013 - URBAN
(Rate per 1,000 Inhabitants)
100
Spring Lake Park Police Dept 6,498 13 10 1 11 2 0 2 St Anthony Police Dept 8,388 26 22 1 23 1 2 3 St Charles Police Dept 3,752 5 4 1 5 0 0 0 St Francis Police Dept 7,315 12 10 0 10 0 2 2 St James Police Dept 4,637 8 5 2 7 0 1 1 St Joseph Police Dept 6,600 9 8 0 8 0 1 1 St Paul Park Police Dept 5,384 9 8 1 9 0 0 0 Staples Police Dept 2,993 6 4 1 5 0 1 1 Thief River Falls Police Dept 8,716 16 12 2 14 0 2 2 Two Harbors Police Dept 3,754 9 8 0 8 0 1 1 Virginia Police Dept 8,769 16 14 2 16 0 0 0 Wabasha Police Dept 2,529 6 5 0 5 0 1 1 Wadena Police Dept 4,086 7 5 1 6 0 1 1 Waite Park Police Dept 6,790 18 12 3 15 0 3 3 Waseca Police Dept 9,538 15 12 2 14 0 1 1 Wayzata Police Dept 3,764 13 11 1 12 0 1 1 West Hennepin Dept of Public Safety 5,380 12 9 1 10 0 2 2 Windom Police Dept 4,676 10 8 1 9 0 1 1 Wyoming Police Dept 7,847 10 8 1 9 0 1 1 Zumbrota Police Dept 3,277 4 4 0 4 0 0 0
GROUP VI TOTAL (Agency Total Count = 80) 414,533 777 630 58 688 9 80 89
GROUP VII (Under 2,500) Rate per 1,000 2.17 1.93 0.17 2.10 0.01 0.06 0.07
Appleton Police Dept 1,401 3 3 0 3 0 0 0 Avon Police Dept 1,411 3 3 0 3 0 0 0 Babbitt Police Dept 1,484 4 4 0 4 0 0 0 Belgrade Police Dept 748 2 1 1 2 0 0 0 Blackduck Police Dept 804 2 2 0 2 0 0 0 Blooming Prairie Police Dept 2,007 3 3 0 3 0 0 0 Braham Police Dept 1,793 3 3 0 3 0 0 0 Brownton Police Dept 762 1 1 0 1 0 0 0 Canby Police Dept 1,785 5 5 0 5 0 0 0 Crosby Police Dept 2,410 8 6 1 7 1 0 1 Dawson Police Dept 1,536 3 3 0 3 0 0 0 Eagle Lake Police Dept 2,453 2 1 1 2 0 0 0 Echo Police Dept 276 1 1 0 1 0 0 0 Elmore Police Dept 666 1 1 0 1 0 0 0 Floodwood Police Dept 531 4 3 0 3 0 1 1 Gilbert Police Dept 1,810 7 6 1 7 0 0 0 Hallock Police Dept 979 1 1 0 1 0 0 0 Hokah Police Dept 579 1 1 0 1 0 0 0 Houston Police Dept 979 2 2 0 2 0 0 0

TABLE 27
POLICE EMPLOYEES AS OF OCTOBER 31, 2013 - URBAN
(Rate per 1,000 Inhabitants)
101
Hoyt Lakes Police Dept 2,031 5 5 0 5 0 0 0 Janesville Police Dept 2,286 2 2 0 2 0 0 0 Kimball Police Dept 771 4 3 1 4 0 0 0 Lakefield Police Dept 1,693 3 3 0 3 0 0 0 Lester Prairie Police Dept 1,732 3 3 0 3 0 0 0 Lewiston Police Dept 1,627 2 2 0 2 0 0 0 Mapleton Police Dept 1,777 3 3 0 3 0 0 0 Mountain Lake Police Dept 2,117 4 3 1 4 0 0 0 New Richland Police Dept 1,220 1 1 0 1 0 0 0 Olivia Police Dept 2,465 5 4 1 5 0 0 0 Ortonville Police Dept 1,917 3 3 0 3 0 0 0 Osakis Police Dept 1,757 3 3 0 3 0 0 0 Osseo Police Dept 2,479 6 5 0 5 0 1 1 Paynesville Police Dept 2,459 4 3 1 4 0 0 0 Silver Bay Police Dept 1,893 4 4 0 4 0 0 0 Silver Lake Police Dept 836 2 2 0 2 0 0 0 Slayton Police Dept 2,145 4 4 0 4 0 0 0 Spring Grove Police Dept 1,330 2 2 0 2 0 0 0 Springfield Police Dept 2,152 4 4 0 4 0 0 0 Tracy Police Dept 2,180 5 3 1 4 0 1 1 Upper Sioux Community Police Dept 0 7 7 0 7 0 0 0 Warroad Police Dept 1,781 6 5 0 5 0 1 1 Wells Police Dept 2,351 4 4 0 4 0 0 0 Wheaton Police Dept 1,419 4 2 2 4 0 0 0 Winnebago Public Safety 1,442 3 2 1 3 0 0 0 Winsted Police Dept 2,357 4 4 0 4 0 0 0
GROUP VII TOTAL (Agency Total Count = 45) 70,631 153 136 12 148 1 4 5
GROUP Non Cities 0 Population University of Minnesota - Duluth 0 12 9 1 10 0 2 2 Metropolitan Airport Police Dept 0 130 63 12 75 27 28 55 University of Minnesota - Minneapolis 0 63 40 10 50 9 4 13 University of Minnesota - Morris 0 5 2 1 3 1 1 2 Three Rivers Park District 0 33 18 3 21 7 5 12
NON CITIES TOTAL (Agency Total Count = 5) 0 243 132 27 159 44 40 84 Rate per 1,000 1.81 1.30 0.20 1.50 0.08 0.23 0.31
URBAN-POLIC E DEPARTMENT GRAND TOTAL 3,723,720 6,736 4,848 748 5,596 296 844 1,140
(Agency Grand Total Count = 217 )

TABLE 28
SHERIFFS OFFICE EMPLOYEES AS OF OCTOBER 31, 2013 - RURAL
(Rate per 1,000 Inhabitants)
102
Agency Population GRAND TOTAL
Sworn Male
Sworn Female
TOTAL SWORN
Civil Male
Civil Female
TOTAL CIVIL
GROUP I (250,000 & over) Rate per 1,000 0 0 0 0 0 0 0
0 0 0 0 0 0 0 0 GROUP I TOTAL (Agency Total Count = 0) 0 0 0 0 0 0 0 0
GROUP II (100,000 - 250,000) Rate per 1,000 2.14 1.12 0.15 1.27 0.40 0.47 0.87
Wright County Sheriff 108,136 231 121 16 137 43 51 94 GROUP II TOTAL (Agency Total Count = 1) 108,136 231 121 16 137 43 51 94
GROUP III (50,000 - 100,000) Rate per 1,000 3.56 1.50 0.17 1.67 0.93 0.96 1.89
Anoka County Sheriff 80,568 248 117 11 128 58 62 120 Carver County Sheriff 68,888 144 70 4 74 32 38 70 Ramsey County Sheriff 81,252 389 187 27 214 109 66 175 St Louis County Sheriff 58,829 238 92 6 98 61 79 140 Stearns County Sheriff 50,396 181 55 9 64 53 64 117 Washington County Sheriff 61,885 230 80 13 93 62 75 137
GROUP III TOTAL (Agency Total Count = 6) 401,818 1,430 601 70 671 375 384 759
GROUP IV (25,000 - 50,000) Rate per 1,000 3.08 1.12 0.10 1.21 0.97 0.90 1.86
Beltrami County Sheriff 31,005 63 27 2 29 16 18 34 Cass County Sheriff 28,572 67 37 1 38 14 15 29 Chisago County Sheriff 26,746 77 38 2 40 16 21 37 Crow Wing County Sheriff 39,331 123 37 2 39 44 40 84 Itasca County Sheriff 34,391 71 34 2 36 22 13 35 Morrison County Sheriff 25,039 48 16 1 17 12 19 31 Olmsted County Sheriff 38,122 157 57 7 64 59 34 93 Otter Tail County Sheriff 44,344 76 32 0 32 20 24 44 Pine County Sheriff 29,794 78 29 4 33 23 22 45 Scott County Sheriff 27,454 121 37 3 40 42 39 81 Sherburne County Sheriff 44,796 256 69 12 81 89 86 175
GROUP IV TOTAL (Agency Total Count = 11) 369,594 1,137 413 36 449 357 331 688
GROUP V (10,000 - 25,000) Rate per 1,000 3.17 1.23 0.09 1.32 0.86 0.98 1.84
Aitkin County Sheriff 16,324 49 15 3 18 15 16 31

TABLE 28
SHERIFFS OFFICE EMPLOYEES AS OF OCTOBER 31, 2013 - RURAL
(Rate per 1,000 Inhabitants)
103
Becker County Sheriff 24,292 54 18 1 19 19 16 35 Benton County Sheriff 17,248 70 22 2 24 17 29 46 Blue Earth County Sheriff 18,207 84 23 2 25 25 34 59 Carlton County Sheriff 20,685 45 24 3 27 6 12 18 Clay County Sheriff 17,266 67 29 3 32 18 17 35 Dakota County Sheriff 18,346 150 61 12 73 40 37 77 Dodge County Sheriff 14,357 33 22 0 22 5 6 11 Douglas County Sheriff 23,605 75 25 2 27 25 23 48 Fillmore County Sheriff 21,010 32 19 0 19 9 4 13 Freeborn County Sheriff 13,290 65 21 1 22 25 18 43 Goodhue County Sheriff 21,793 99 38 1 39 28 32 60 Hubbard County Sheriff 16,723 43 16 0 16 13 14 27 Isanti County Sheriff 23,124 55 19 1 20 16 19 35 Kanabec County Sheriff 16,273 46 17 1 18 14 14 28 Kandiyohi County Sheriff 22,735 100 30 3 33 34 33 67 Le Sueur County Sheriff 17,741 31 17 0 17 4 10 14 Lyon County Sheriff 10,089 50 15 1 16 16 18 34 Martin County Sheriff 10,165 28 10 2 12 6 10 16 McLeod County Sheriff 11,162 57 20 3 23 9 25 34 Meeker County Sheriff 16,656 44 19 1 20 9 15 24 Mille Lacs County Sheriff 18,537 72 27 1 28 25 19 44 Mower County Sheriff 14,608 69 20 2 22 21 26 47 Polk County Sheriff 15,136 23 18 1 19 0 4 4 Redwood County Sheriff 10,814 23 12 0 12 5 6 11 Renville County Sheriff 13,134 29 12 1 13 6 10 16 Rice County Sheriff 22,173 51 23 2 25 14 12 26 Roseau County Sheriff 11,224 19 8 0 8 3 8 11 Sibley County Sheriff 15,266 21 11 0 11 4 6 10 Todd County Sheriff 19,253 29 14 0 14 8 7 15 Wabasha County Sheriff 11,533 29 17 0 17 6 6 12 Winona County Sheriff 14,543 59 19 1 20 18 21 39
GROUP V TOTAL (Agency Total Count = 32) 537,312 1,701 661 50 711 463 527 990
GROUP VI (2,500 - 10,000) Rate per 1,000 6.08 2.53 0.30 2.83 1.52 1.72 3.24
Big Stone County Sheriff 3,355 8 5 0 5 1 2 3 Brown County Sheriff 6,621 35 7 2 9 13 13 26 Chippewa County Sheriff 6,184 18 7 1 8 8 2 10 Clearwater County Sheriff 8,830 22 9 0 9 5 8 13 Cook County Sheriff 5,251 20 11 2 13 3 4 7 Cottonwood County Sheriff 4,968 20 9 0 9 8 3 11 Faribault County Sheriff 6,777 25 9 1 10 8 7 15 Grant County Sheriff 6,027 11 6 0 6 1 4 5

TABLE 28
SHERIFFS OFFICE EMPLOYEES AS OF OCTOBER 31, 2013 - RURAL
(Rate per 1,000 Inhabitants)
104
Hennepin County Sheriff 7,567 750 282 55 337 200 213 413 Houston County Sheriff 8,417 27 13 0 13 10 4 14 Jackson County Sheriff 8,574 27 13 1 14 4 9 13 Kittson County Sheriff 3,565 10 5 0 5 2 3 5 Koochiching County Sheriff 6,881 18 10 0 10 4 4 8 Lac Qui Parle County Sheriff 5,703 7 7 0 7 0 0 0 Lake County Sheriff 5,246 29 16 1 17 5 7 12 Lake of the Woods County Sheriff 4,033 11 5 0 5 1 5 6 Lincoln County Sheriff 5,857 12 6 0 6 1 5 6 Mahnomen County Sheriff 5,491 19 11 1 12 1 6 7 Marshall County Sheriff 9,542 23 13 0 13 6 4 10 Murray County Sheriff 6,540 15 9 0 9 2 4 6 Nicollet County Sheriff 8,202 46 18 0 18 12 16 28 Nobles County Sheriff 8,676 34 10 2 12 12 10 22 Norman County Sheriff 6,913 8 5 0 5 1 2 3 Pennington County Sheriff 5,446 27 6 1 7 13 7 20 Pipestone County Sheriff 9,562 21 11 0 11 5 5 10 Pope County Sheriff 8,407 17 8 0 8 2 7 9 Red Lake County Sheriff 4,131 10 6 0 6 3 1 4 Rock County Sheriff 9,676 15 9 1 10 2 3 5 Steele County Sheriff 9,027 24 17 2 19 0 5 5 Stevens County Sheriff 4,448 14 6 0 6 2 6 8 Swift County Sheriff 5,087 16 9 0 9 1 6 7 Traverse County Sheriff 2,127 12 5 0 5 2 5 7 Wadena County Sheriff 8,943 21 8 1 9 3 9 12 Waseca County Sheriff 6,353 27 11 0 11 10 6 16 Watonwan County Sheriff 6,636 14 7 0 7 1 6 7 Wilkin County Sheriff 3,217 16 5 1 6 5 5 10 Yellow Medicine County Sheriff 6,279 21 10 0 10 6 5 11
GROUP VI TOTAL (Agency Total Count = 37) 238,559 1,450 604 72 676 363 411 774 Rate per 1,000 3.59 1.45 0.15 1.60 0.97 1.03 2.00 RURAL-SHERIFFS DEPARTMENT GRAND TOTAL
1,655,419 5,949 2,400 244 2,644 1,601 1,704 3,305
(Agency Grand Total Count = 87 )

TABLE 29
POLICE, SHERIFF AND STATE PATROL EMPLOYEE DATA - 2013
Population *
Number Civilian
Number Sworn
Sworn Rate per 1,000
Total Employees
Total Rate Per 1,000
POLICE DEPARTMENTS - Urban
Group I - 250,000 or over 680,940 298 1,431 2.1 1,729 2.5 Group II - 100,000 - 250,000 108,582 56 133 1.2 189 1.7 Group III - 50,000 - 100,000 929,682 233 1,108 1.2 1,341 1.4 Group IV - 25,000 - 50,000 607,526 154 720 1.2 874 1.4 Group V - 10,000 - 25,000 911,826 221 1,209 1.3 1,430 1.6 Group VI - 2,500 - 10,000 414,533 89 688 1.7 777 1.9 Group VII - Under 2,500 70,631 5 148 2.1 153 2.2 POLICE TOTALS 3,723,720 1,056 5,437 1.5 6,493 1.7
SHERIFFS OFFICES - Rural
Group I - 250,000 or over 0 0 0 0 0 0 Group II - 100,000 - 250,000 108,136 94 137 1.3 231 2.1 Group III - 50,000 - 100,000 401,818 759 671 1.7 1,430 3.6 Group IV - 25,000 - 50,000 369,594 688 449 1.2 1,137 3.1 Group V - 10,000 - 25,000 537,312 990 711 1.3 1,701 3.2 Group VI - Under 10,000 238,559 774 676 2.8 1,450 6.1 SHERIFFS TOTALS 1,655,419 3,305 2,644 1.6 5,949 3.6
NON-CITIES 0 POPULATION TOTALS - 84 159 - 243 -
STATE PATROL TOTALS - 187 522 - 709 -
STATE TOTALS 5,379,139 4,632 8,762 1.6 13,394 2.3
TABLE 30
RATE OF LAW ENFORCEMENT EMPLOYEES (SWORN AND CIVILIAN)
PER 1,000 INHABITANTS - 2013
POLICE (Urban) Total Sworn Civil
Group I - 250,000 or over 2.5 2.1 0.4
Group II - 100,000 - 250,000 1.7 1.2 0.5
Group III - 50,000 - 100,000 1.4 1.2 0.3
Group IV - 25,000 - 50,000 1.4 1.2 0.3
Group V - 10,000 - 25,000 1.6 1.3 0.2
Group VI - 2,500 - 10,000 1.9 1.7 0.2
Group VII - Under 2,500 2.2 2.1 0.1 TOTAL 1.7 1.5 0.3
* Estimated 2012 population, F.B.I. 105
SHERIFFS (Rural) Total Sworn Civil
Group I - 250,000 or over None that apply
Group II - 100,000 - 250,000 2.1
1.3 0.9
Group III - 50,000 - 100,000 3.6
1.7 1.9
Group IV - 25,000 - 50,000 3.1
1.2 1.9
Group V - 10,000 - 25,000 3.2
1.3 1.8
Group VI - Under 10,000 6.1
2.8 3.2
TOTAL 3.6 1.6 2.0

106
TABLE 31
STATE PATROL EMPLOYEES AS OF OCTOBER 31, 2013
Agency Name GRAND TOTAL
Sworn Male
Sworn Female
TOTAL SWORN Civil Male Civil Female
TOTAL CIVIL
Brainerd 38 33 3 36 0 2 2 Capitol Security 60 11 2 13 39 8 47 Central Office 134 39 5 44 42 48 90 Detroit Lakes 36 34 1 35 0 1 1 Duluth 36 32 2 34 0 2 2 Golden Valley 86 67 14 81 1 4 5 Mankato 29 22 5 27 0 2 2 Marshall 30 26 3 29 0 1 1 Oakdale 78 65 8 73 0 5 5 Rochester 72 46 3 49 9 14 23 St Cloud 57 45 8 53 1 3 4 Thief River Falls 29 26 1 27 0 2 2 Virginia 24 21 0 21 0 3 3 STATE PATROL GRAND TOTAL 709 467 55 522 92 95 187

107
LAW ENFORCEMENT OFFICERS KILLED OR ASSAULTED
Vital information other than Uniform Crime Reporting is also collected that evaluates the number of law enforcement personnel who have been assaulted and/or killed. The data from those county (sheriff) and municipal (police) agencies reporting is collected and tabulated annually. In 2012 Minnesota began the reporting of the assault or killing of law enforcement K-9 police dogs. There were a total of 346 law enforcement officer assault incidents reported in Minnesota for 2013 with 396 officers assaulted. Of that total, 316 of the assaults involved hands, fists, or feet; 8 were attributed to a firearm; 68 involved some other dangerous weapon, and 4 were committed with a knife or cutting instrument. There were 192 assaults in which there was no personal injury to the law enforcement officer, while 204 officers received some form of personal injury. The type of activities most responsible for the assault situations were: “Responding to "Disturbance Calls" with 138 officers assaulted and “Attempting Other Arrests” with 71 officers assaulted in the reported incidents.
Ninty two assaults (23%) occurred between 10:00 p.m. and 2:00 a.m. The time span between 4:00 p.m. and 4:00 a.m., accounts for most assault confrontations with 244 or (62%). The type of assignment most frequently registered with assaults during the year 2013 was a one officer vehicle - assisted (159 incidents) followed by two officer vehicle (111 incidents). There were no law enforcement officer fatalities in 2013. There were no K-9 police dog injuries or fatalities in 2013.

TABLE 32
LAW ENFORCEMENT OFFICERS KILLED OR ASSAULTED SUMMARY - 2013
Total Type of Weapon Type of Assignment Officers
Number of Officers
Assaulted
Knife/Other
Cutting Hands, Fists,
Other Dangerous
Two-Officer
One-Officer Vehicle
Detective/Other Plain Clothes
Other Assignment
Officer Assaults
Type of Activity or Killed Firearm Instrument Feet Weapon Vehicle Alone Assist Alone Assist Alone Assist Cleared* Responding to disturbance calls (family quarrels, person with firearms, etc...) 138 5 0 118 15 33 21 74 0 2 2 6 136
Burglaries in progress or pursuing burglary suspects 15 2 0 10 3 4 2 6 0 2 1 0 15 Robberies in progress or pursuing robbery suspects 2 0 0 2 0 1 0 1 0 0 0 0 2 Attempting other arrests 71 0 1 59 11 28 10 21 0 2 3 7 70 Civil disorder (riot, mass disobedience, etc...) 4 0 0 3 1 2 0 0 0 0 0 2 4 Handling, transporting, custody of prisoners 44 0 1 36 7 11 1 12 1 0 4 15 42 Investigating suspicious persons or circumstances 36 1 1 27 7 13 5 13 1 1 2 1 35 Ambush, no warning 2 0 0 2 0 0 0 0 0 2 0 0 2 Handling persons with mental disabilities 21 0 0 15 6 4 2 9 2 1 2 1 19 Traffic pursuits and stops 27 0 1 17 9 7 8 11 0 1 0 0 24 All Other 36 0 0 27 9 8 8 12 1 1 5 1 33
Total 396 8 4 316 68 111 57 159 5 12 19 33 382
* Clearance indicates that at least one person was arrested. It does not preclude the fact that others may have also been involved in the offense.
Type of Weapon Utilized
Total Assaults
Knife/Other Cutting
Hands, Fists,
Other Dangerous
Type of Injury Reported Firearm Instrument Feet Weapon Killed in Line of Duty by Felonious Act 0 0 0 0 0 Killed in Line of Duty by Accident or Negligence 0 0 0 0 0 Sustained Personal Injury 204 3 3 179 19 Without Personal Injury 192 5 1 137 49 Total 396 8 4 316 68
Time of Assault By Incident 12:00
2:00 2:00 4:00
4:00 6:00
6:00 8:00
8:00 10:00
10:00 12:00
12:00 2:00
2:00 4:00
4:00 6:00
6:00 8:00
8:00 10:00
10:00 12:00
AM 47 37 14 11 17 22 PM 15 23 45 33 37 45
Total # LEOKA Incidents: 346 *Total LEOKA Incidents Cleared: 332 % Officer Assault Incidents Cleared: 96%
108

109
TABLE 33
LAW ENFORCEMENT OFFICERS KILLED OR ASSAULTED - 2013
By Agency
Injury Type
Agency Name Assaulted No
Injury
Assaulted Sustained
Injury
Total Reported Assaults
Killed by Felonious
Act Killed by Accident
Total Reported
Killed
Agency Total Assaulted /
Killed Albert Lea Police Dept 2 2 2 Baxter Police Dept 3 3 3 Beltrami County Sheriff 5 5 5 Bemidji Police Dept 3 3 6 6 Benson Police Dept 1 1 1 Blaine Police Dept 1 1 1 Bloomington Police Dept 6 9 15 15 Brainerd Police Dept 4 6 10 10 Brooklyn Park Police Dept 3 3 3 Burnsville Police Dept 10 3 13 13 Cannon Falls Police Dept 1 1 1 Columbia Heights Police Dept 3 1 4 4 Crookston Police Dept 3 3 3 Crow Wing County Sheriff 3 3 3 Eagan Police Dept 3 1 4 4 Eden Prairie Police Dept 2 2 2 Eveleth Police Dept 2 2 2 Fairmont Police Dept 1 1 1 Faribault Police Dept 4 8 12 12 Fergus Falls Police Dept 6 2 8 8 Freeborn County Sheriff 1 2 3 3 Fridley Police Dept 3 2 5 5 Granite Falls Police Dept 1 1 1 Hastings Police Dept 1 1 2 2 Hennepin County Sheriff 2 16 18 18 Hopkins Police Dept 1 1 1 Inver Grove Heights Police Dept 1 1 1 Jordan Police Dept 2 2 2 Lake City Police Dept 3 3 3 Lake County Sheriff 2 2 2 Lake of the Woods County Sheriff 1 1 1 Lakes Area Police Dept 3 3 3 Maple Grove Police Dept 2 2 2 Maplewood Police Dept 4 1 5 5 Metropolitan Airport Police Dept 3 1 4 4 Mille Lac Tribal PD 5 5 5

110
TABLE 33
LAW ENFORCEMENT OFFICERS KILLED OR ASSAULTED - 2013 By Agency
Agency Name
Injury Type
Total Reported
Killed
Agency Total Assaulted /
Killed Assaulted No
Injury
Assaulted Sustained
Injury
Total Reported Assaults
Killed by Felonious
Act Killed by Accident
Minneapolis Police Dept 58 60 118 118
Nobles County Sheriff 1 1 1 North Mankato Police Dept 3 1 4 4
Northfield Police Dept 1 4 5 5
Otter Tail County Sheriff 3 3 3
Park Rapids Police Dept 4 4 4 Polk County Sheriff 1 1 1
Prior Lake Police Dept 1 1 1
Proctor Police Dept 1 1 1
Red Wing Police Dept 3 3 3 Renville County Sheriff 1 1 1
Richfield Police Dept 1 4 5 5
Rochester Police Dept 3 3 6 6
Rosemount Police Dept 1 1 1 Sartell Police Dept 2 2 4 4
Shakopee Police Dept 1 3 4 4
South Lake Minnetonka Police Dept 1 1 1
St Francis Police Dept 1 1 1 St Paul Police Dept 30 20 50 50
Swift County Sheriff 2 2 2
Todd County Sheriff 1 1 1
Two Harbors Police Dept 1 1 1 University of MN Police Dept - Minneapolis 1 5 6 6
Virginia Police Dept 5 5 5
Wabasha County Sheriff 1 1 1
Waseca Police Dept 1 1 1 Willmar Police Dept 2 5 7 7
Wyoming Police Dept 1 1 1
STATE TOTALS 192 204 396 0 0 0 396 URBAN TOTALS (PD) 168 171 339 0 0 0 339 RURAL TOTALS (SO) 15 27 42 0 0 0 42 ZERO POPULATION TOTALS 9 6 15 0 0 0 15

111
Figure 30
Law Enforcement Officers Killed or Assaulted - 2013 By Type of Weapon
Figure 31
Law Enforcement Officers Killed or Assaulted - 2013
By Type of Activity
Total LEOKA Incidents = 346 Total Officer Assaults = 396 Total Officers Killed = 0

112
Figure 32
Law Enforcement Officers Killed or Assaulted - 2013 By Type of Assignment
Figure 33
Law Enforcement Officers Killed or Assaulted - 2013
By Time of Incident
Total LEOKA Incidents = 346 Total Officer Assaults = 396 Total Officers Killed = 0

113
LAW ENFORCEMENT OFFICERS FIREARMS DISCHARGES
Pursuant to Minnesota State Statute 626.553, Subdivision 2, information is collected concerning firearm discharges by law enforcement officers in Minnesota. 1978 was the first full year that this information was available. In 2013 the number of individuals shot and killed from police fire was 9. This total is up one from last year. Of the incidents reported, there were 169 shots fired during 29 incidents. There was one incident where multiple agencies fired shots. There are six general areas of information collected: the Type of Activity the officer was engaged in at the time of the discharge; Type of Weapon Used; Purpose of the Discharge; Results of the Discharge; Time of Day; and the Level of the Incident which precipitated the discharge. The highest number of discharges by Type of Activity occurred while “Attempting other Arrest” with 46 shots fired.
One hundred thirteen (67%) of the shots fired were with a handgun, 56 (33%) with a rifle or shotgun and no shots with another firearm. Of the 29 firearms discharge incidents, 21 individuals were fired at while 9 were either accidental discharges or law enforcement officers were not firing at an individual. Of the 21 individuals’ fire at, 9 were killed and 6 were wounded. Information on the size of the community served by the departments was also tabulated. 69 shots (40%) were fired in communities under 50,000 population, and 100 (60%) in communities over 50,000 population. Of the 169 shots fired, 160 were in felony situations and 2 in gross misdemeanor situations. Three shots that were fired in the ‘Other” category were the result of accidental discharges.
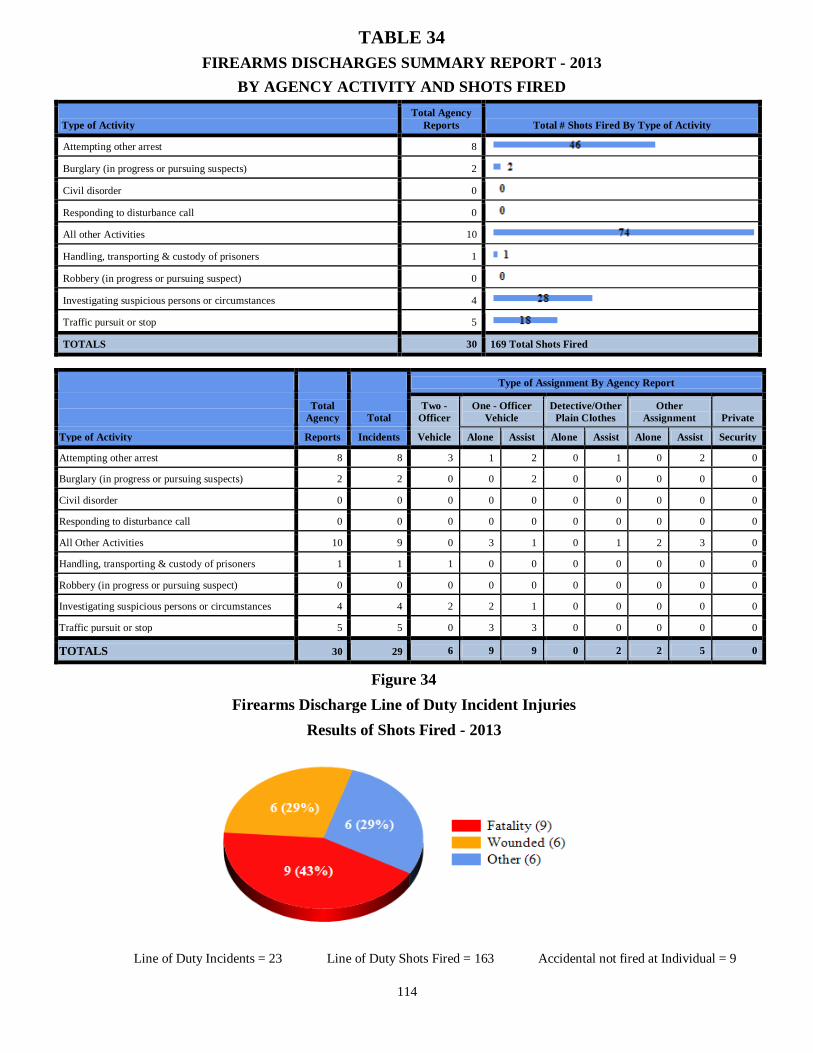
114
TABLE 34
FIREARMS DISCHARGES SUMMARY REPORT - 2013
BY AGENCY ACTIVITY AND SHOTS FIRED
Type of Activity Total Agency
Reports Total # Shots Fired By Type of Activity Attempting other arrest 8 Burglary (in progress or pursuing suspects) 2 Civil disorder 0 Responding to disturbance call 0 All other Activities 10 Handling, transporting & custody of prisoners 1 Robbery (in progress or pursuing suspect) 0 Investigating suspicious persons or circumstances 4 Traffic pursuit or stop 5 TOTALS 30 169 Total Shots Fired
Type of Assignment By Agency Report
Total
Agency Total Two -
Officer One - Officer
Vehicle Detective/Other
Plain Clothes Other
Assignment Private Type of Activity Reports Incidents Vehicle Alone Assist Alone Assist Alone Assist Security Attempting other arrest 8 8 3 1 2 0 1 0 2 0 Burglary (in progress or pursuing suspects) 2 2 0 0 2 0 0 0 0 0 Civil disorder 0 0 0 0 0 0 0 0 0 0 Responding to disturbance call 0 0 0 0 0 0 0 0 0 0 All Other Activities 10 9 0 3 1 0 1 2 3 0 Handling, transporting & custody of prisoners 1 1 1 0 0 0 0 0 0 0 Robbery (in progress or pursuing suspect) 0 0 0 0 0 0 0 0 0 0 Investigating suspicious persons or circumstances 4 4 2 2 1 0 0 0 0 0 Traffic pursuit or stop 5 5 0 3 3 0 0 0 0 0
TOTALS 30 29 6 9 9 0 2 2 5 0
Figure 34
Firearms Discharge Line of Duty Incident Injuries
Results of Shots Fired - 2013
Line of Duty Incidents = 23
Line of Duty Shots Fired = 163
Accidental not fired at Individual = 9
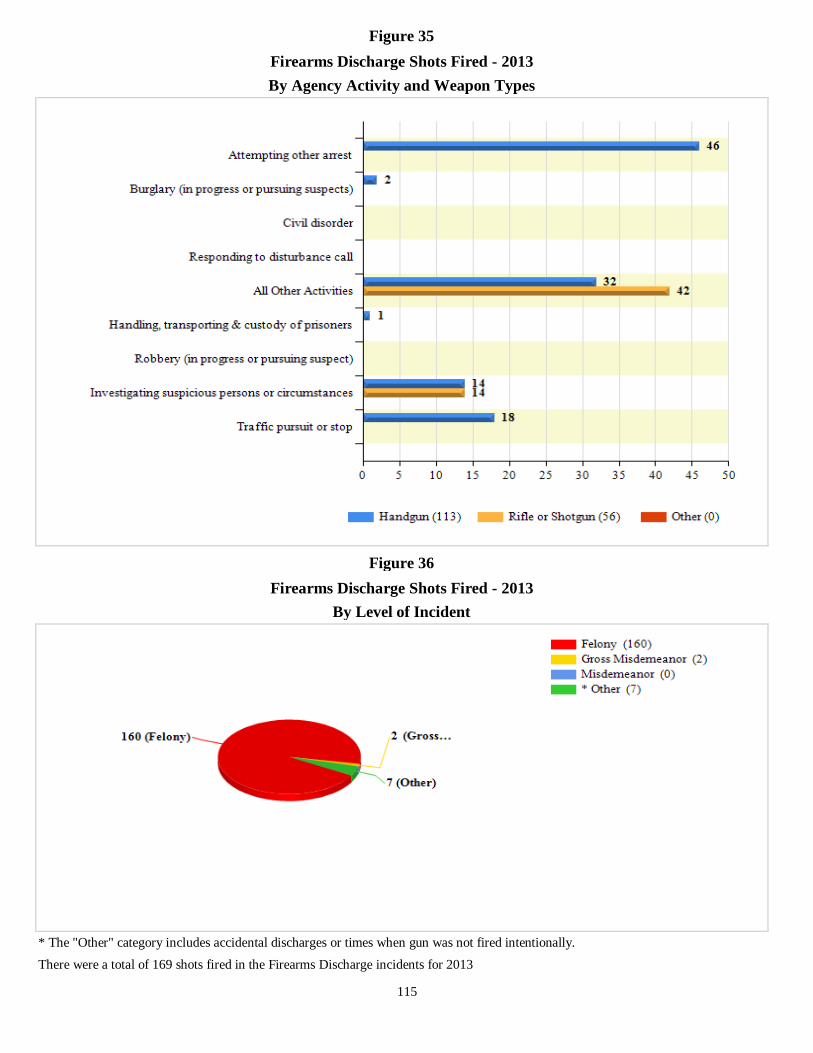
115
Figure 35
Firearms Discharge Shots Fired - 2013
By Agency Activity and Weapon Types
Figure 36
Firearms Discharge Shots Fired - 2013
By Level of Incident
* The "Other" category includes accidental discharges or times when gun was not fired intentionally.
There were a total of 169 shots fired in the Firearms Discharge incidents for 2013

116
TABLE 35
FIREARMS DISCHARGES SUMMARY REPORT - 2013
TIME OF OCCURENCE BY INCIDENT/SHOTS FIRED AND BY AGENCY POPULATION CLASSIFICATION
Time of Occurrence - Incidents
12:00 2:00
2:00 4:00
4:00 6:00
6:00 8:00
8:00 10:00
10:00 12:00 Totals
AM 2 4 1 1 1 0 9
PM 1 4 3 3 7 2 20
TOTALS 3 8 4 4 8 2 29
Time of Occurrence - # Shots Fired
12:00 2:00
2:00 4:00
4:00 6:00
6:00 8:00
8:00 10:00
10:00 12:00 Totals
AM 2 12 29 1 1 0 45
PM 5 42 30 10 35 2 124
TOTALS 7 54 59 11 36 2 169
Population Classification of Agency Involved
Number of Agency's
Reporting Total # Shots
Fired
Less than 2,500 2 2
2,500 - 4,999 1 1
5,000 - 9,999 0 0
10,000 - 24,999 8 18
25,000 - 49,999 8 48
50,000 - 99,999 2 16
100,000 and over 2 84
Zero Population Reporting Agencies 0 0
Private Security Firms 0 0
TOTALS 23 169
In 2013 there were 23 different agencies involved in 29 Firearm Discharge incidents
1 incident(s) involved multiple agencies discharging a firearm.
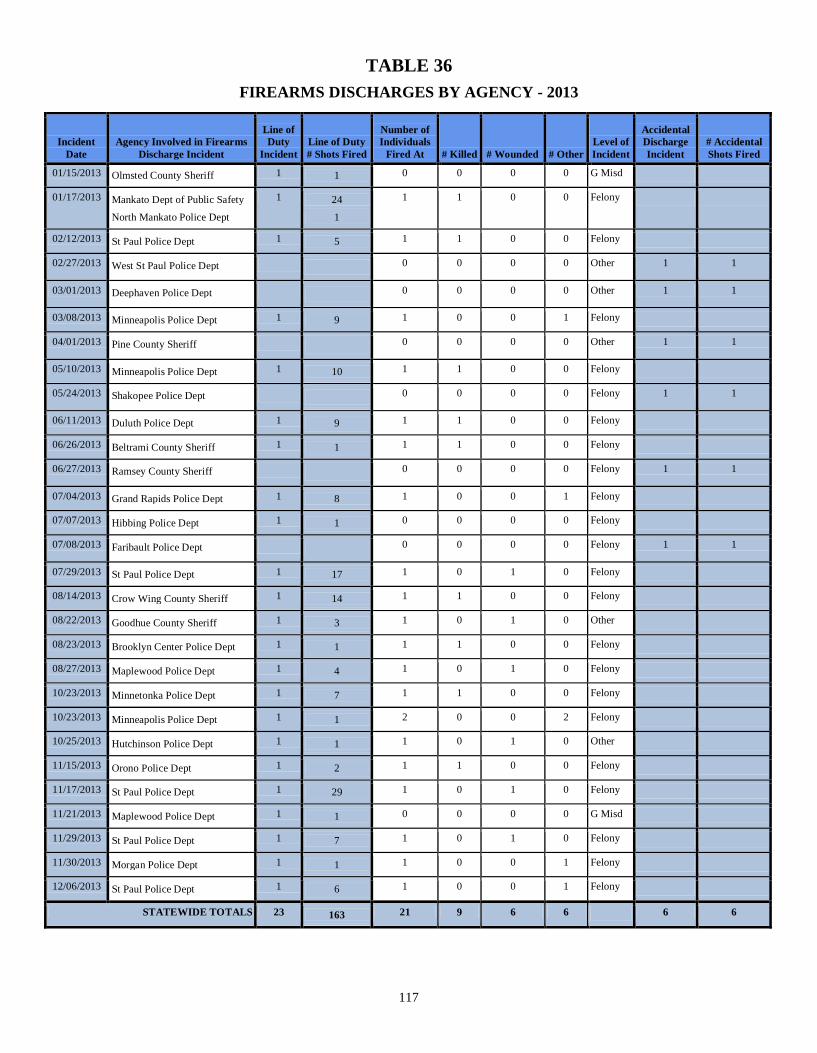
TABLE 36
FIREARMS DISCHARGES BY AGENCY - 2013
117
Incident Date
Agency Involved in Firearms Discharge Incident
Line of Duty
Incident Line of Duty # Shots Fired
Number of Individuals
Fired At # Killed # Wounded # Other Level of Incident
Accidental Discharge Incident
# Accidental Shots Fired
01/15/2013 Olmsted County Sheriff
1 1
0 0 0 0 G Misd
01/17/2013 Mankato Dept of Public Safety North Mankato Police Dept
1 24 1
1 1 0 0 Felony
02/12/2013 St Paul Police Dept
1 5
1 1 0 0 Felony
02/27/2013 West St Paul Police Dept
0 0 0 0 Other 1 1
03/01/2013 Deephaven Police Dept
0 0 0 0 Other 1 1
03/08/2013 Minneapolis Police Dept
1 9
1 0 0 1 Felony
04/01/2013 Pine County Sheriff
0 0 0 0 Other 1 1
05/10/2013 Minneapolis Police Dept
1 10
1 1 0 0 Felony
05/24/2013 Shakopee Police Dept
0 0 0 0 Felony 1 1
06/11/2013 Duluth Police Dept
1 9
1 1 0 0 Felony
06/26/2013 Beltrami County Sheriff
1 1
1 1 0 0 Felony
06/27/2013 Ramsey County Sheriff
0 0 0 0 Felony 1 1
07/04/2013 Grand Rapids Police Dept
1 8
1 0 0 1 Felony 07/07/2013 Hibbing Police Dept
1 1
0 0 0 0 Felony
07/08/2013 Faribault Police Dept
0 0 0 0 Felony 1 1
07/29/2013 St Paul Police Dept
1 17
1 0 1 0 Felony 08/14/2013 Crow Wing County Sheriff
1 14
1 1 0 0 Felony
08/22/2013 Goodhue County Sheriff
1 3
1 0 1 0 Other
08/23/2013 Brooklyn Center Police Dept
1 1
1 1 0 0 Felony
08/27/2013 Maplewood Police Dept
1 4
1 0 1 0 Felony
10/23/2013 Minnetonka Police Dept
1 7
1 1 0 0 Felony
10/23/2013 Minneapolis Police Dept
1 1
2 0 0 2 Felony 10/25/2013 Hutchinson Police Dept
1 1
1 0 1 0 Other
11/15/2013 Orono Police Dept
1 2
1 1 0 0 Felony
11/17/2013 St Paul Police Dept
1 29
1 0 1 0 Felony
11/21/2013 Maplewood Police Dept
1 1
0 0 0 0 G Misd
11/29/2013 St Paul Police Dept
1 7
1 0 1 0 Felony
11/30/2013 Morgan Police Dept
1 1
1 0 0 1 Felony 12/06/2013 St Paul Police Dept
1 6
1 0 0 1 Felony
STATEWIDE TOTALS 23 163
21 9 6 6 6 6
POLICE PURSUITS
118
BACKGROUND: In 1988, the Legislature passed a law that required all pursuits by peace officers to be reported to the Department of Public Safety. 1989 was the first full year this data was collected. The state statute is as follows: 626.5532 PURSUIT OF FLEEING SUSPECTS BY PEACE OFFICERS. Subdivision 1. Reports. If a peace officer pursues a fleeing suspect, the officer's department head must file a notice of the incident with the commissioner of public safety within 30 days following the pursuit. A pursuit must be reported under this section if it is a pursuit by a peace officer of a motor vehicle being operated in violation of section 609.487. The notice must contain information concerning the reason for and circumstances surrounding the pursuit, including the alleged offense, the length of the pursuit in distance and time, the outcome of the pursuit, any charges filed against the suspect as a result of the pursuit, injuries and property damage resulting from the pursuit, and other information deemed relevant by the commissioner.
SUMMARY • Of the 889 reported pursuit incidents,
707 (80%) resulted in the apprehension of the vehicle. In 103 (12%) of the pursuits the decision to terminate was made by the officer or by supervisory discretion. In 79 (9%) pursuits the officer lost sight of the vehicle.
• Traffic pursuits (Other than DUI) were the largest reason for initiating a pursuit, 465 (52%) followed by 92 pursuits (10%) initiated for stolen vehicles.
• Three hundred five (34%) of the pursuits
resulted in property damage to the violator’s vehicle. One hundred thirty eight squad cars sustained damage, while damage to property or other vehicles occurred 151 (17%) of the time. Five hundred forty seven (62%) of the pursuit incidents reported no property damage.
• Six hundred fifty six (74%) of all pursuits occurred between the hours of 4:00 p.m. and 4:00 a.m. with the most pursuits (160) occurring in a two hour period from midnight to 2:00 a.m. The fewest pursuits (17) occurred between 6:00 a.m. and 8:00 a.m.
• There was one pursuit fatality recorded
in 2013. One violator driver lost their life.
• Of the 1183 individuals reported
involved in pursuits in 2013, 127 received injuries or possible injuries. 53 of the violators were injured with another 50 receiving possible injuries. Of the 275 passengers in the violator drivers’ car, 9 received injuries.
• Of the reported 1,889 law enforcement
officers involved in the pursuits, 2 (0.1%) received incapacitating injuries, 12 (0.6%) received non incapacitating injuries, while 1,765 (93%) received no injury. For 110 (6%) of the officers the injury status was unknown. This officer count includes both initiating and assisting agency law enforcement officers involved in the pursuit.
• Reports indicate 9 unrelated parties,
either pedestrians or individuals in unrelated vehicles, were involved in the pursuits. Three received incapacitating injuries and 2 received non incapacitating injuries.
• In at least 611 (69%) of the pursuits the
driver was charged. In 191 pursuits the charge is unknown. Ninety seven of the violator drivers were not charged.
Table 37 shows the total pursuits for the calendar year 2013.

119
TABLE 37
PURSUIT REPORT SUMMARY - 2013
Total Pursuit Incidents = 889
Initial Reason for Pursuit Number % Traffic (Other than DUI) 465 52.3% Warrant 45 5.1% Stolen Vehicle 92 10.3% DUI 70 7.9% Felony Offense (Other than Fleeing) 68 7.6% Other 149 16.8%
TOTAL 889 100.0%
Property Damage Number % Yes 342 38.5% No 547 61.5%
TOTAL 889 100.0%
Damage To * Number Squad 138 Violator Vehicle 305 Damage to Property or Other Vehicles 151
TOTAL 594
* More than one type can occur per incident
Reason for Termination of Chase Number % Officer Discretion 48 5.4% Officer Lost Sight of Violator 79 8.9% Supervisory Direction to Terminate 55 6.2% PIT Maneuver 61 6.8% Violator Stopped Voluntarily 222 24.9% Unintentional Crash Collision 134 15.0% Roadblock 1 0.1% Violator Fled on Foot 157 17.6% Vehicle Became Disabled 32 3.6% Boxed In 25 2.8% Tire Deflating Device 28 3.1% Other 49 5.5%
TOTAL 891 100.0%
Time Chase Started
12:00 2:00
2:00 4:00
4:00 6:00
6:00 8:00
8:00 10:00
10:00 12:00 Totals
% AM PM
AM 160 113 33 17 27 49 399 44.9% PM 53 54 69 73 99 142 490 55.1%
TOTALS 213 167 102 90 126 191 889 100.0%
Injury Type Total Violators
Individuals Involved or Affected by Pursuit Total Fatality
Incapacitating Injury
Non Incapacitating
Injury Possible Injury
No Injury Unknown Charged
Not Charged Unknown
Violator Driver 899 ** 1 10 42 50 678 118 611 97 191
Violator's Passengers 275 0 2 7 10 243 13
Party in Unrelated Vehicle 9 0 3 2 0 4 0
Unrelated Pedestrian 0 0 0 0 0 0 0
SUB-TOTALS 1183 1 15 51 60 925 131
Officer/Deputy/Trooper 1889 0 2 12 9 1756 110
TOTALS 3072 1 17 63 69 2681 241
** 9 pursuit(s) were multiple vehicle pursuits.
Violators by Age and Gender
Age Male Female Unknown Total Violators % Of Total 17 and under 41 4 0 45 5.1% 18-64 645 73 1 719 80.8% 65 and older 5 0 0 5 0.6% Unknown 49 7 65 121 13.6% TOTAL 740 84 66 890 100.0%
% of TOTAL 83.1% 9.4% 7.4%

120
Figure 37
Initiating Agency Reason for Pursuit Initiation - 2013
Figure 38
Assisting Agency Reason for Pursuit Initiation - 2013
Total Pursuit Incidents = 889
Total Vehicles Pursued = 899

121
Figure 39
Reason for Pursuit Termination - 2013
Total Pursuit Incidents = 889
Total Vehicles Pursued = 899
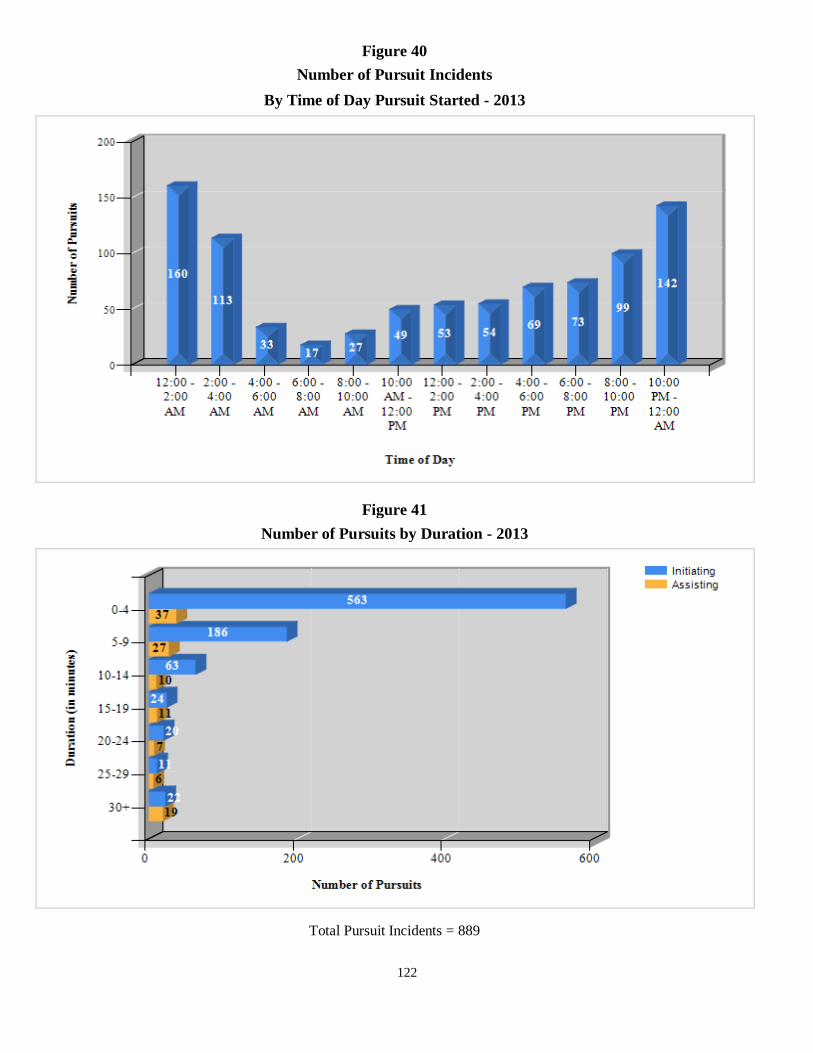
122
Figure 40
Number of Pursuit Incidents
By Time of Day Pursuit Started - 2013
Figure 41
Number of Pursuits by Duration - 2013
Total Pursuit Incidents = 889

123
TABLE 38
PURSUIT REPORT SUMMARY BY AGENCY - 2013
Agency Name # Initiated # Assisted
Total Agency Involved Pursuits
# Vehicles Pursued
Avg. Time (Minutes)Involved
in Pursuit Avg. Miles Covered
Aitkin County Sheriff 1 0 1 1 7.0 1.0 Albert Lea Police Dept 4 0 4 4 2.3 1.0 Alexandria Police Dept 3 0 3 3 9.3 9.3 Annandale Police Dept 0 1 1 1 4.0 12.0 Anoka County Sheriff 6 0 6 6 4.0 4.3 Anoka Police Dept 4 0 4 4 5.5 5.3 Apple Valley Police Dept 13 1 14 14 3.4 2.2 Arden Hills Police Dept 2 0 2 2 3.5 2.5 Austin Police Dept 7 0 7 7 7.7 5.7 Baxter Police Dept 2 0 2 2 27.0 26.5 Bayport Police Dept 1 0 1 1 2.0 2.0 Becker County Sheriff 1 3 4 4 15.5 16.0 Becker Police Dept 1 0 1 1 9.0 10.0 Belle Plaine Police Dept 0 1 1 1 3.0 2.0 Beltrami County Sheriff 7 1 8 8 8.8 12.3 Bemidji Police Dept 8 1 9 9 7.7 7.1 Benson Police Dept 2 0 2 2 3.0 1.5 Benton County Sheriff 2 2 4 4 9.5 6.8 Big Lake Police Dept 2 0 2 2 6.0 3.5 Blaine Police Dept 8 2 10 10 2.9 2.4 Bloomington Police Dept 7 1 8 8 4.6 3.8 Blue Earth Police Dept 1 0 1 1 1.0 2.0 Brainerd Police Dept 3 0 3 3 2.7 1.3 Brooklyn Center Police Dept 9 1 10 10 4.1 2.9 Brooklyn Park Police Dept 7 0 7 7 7.7 2.1 Burnsville Police Dept 0 1 1 1 18.0 31.0 Cannon Falls Police Dept 1 0 1 1 2.0 1.0 Carlton County Sheriff 3 2 5 5 9.4 8.2 Carver County Sheriff 1 1 2 2 1.5 1.0 Cass County Sheriff 2 1 3 3 16.7 8.3 Champlin Police Dept 2 1 3 3 12.0 5.3 Chisago County Sheriff 4 0 4 5 8.3 3.3 Clay County Sheriff 7 2 9 9 12.2 10.4 Cold Spring / Richmond Police Dept 1 0 1 1 2.0 1.0 Coon Rapids Police Dept 3 0 3 3 4.0 3.3 Cottage Grove Police Dept 1 0 1 1 6.0 4.0 Cottonwood County Sheriff 2 0 2 2 9.5 13.5 Crookston Police Dept 1 0 1 1 8.0 3.0 Crow Wing County Sheriff 5 2 7 7 8.9 9.0 Dakota County Sheriff 6 5 11 11 4.0 3.2 Dayton Police Dept 0 1 1 1 27.0 15.0 Detroit Lakes Police Dept 1 0 1 1 15.0 23.0
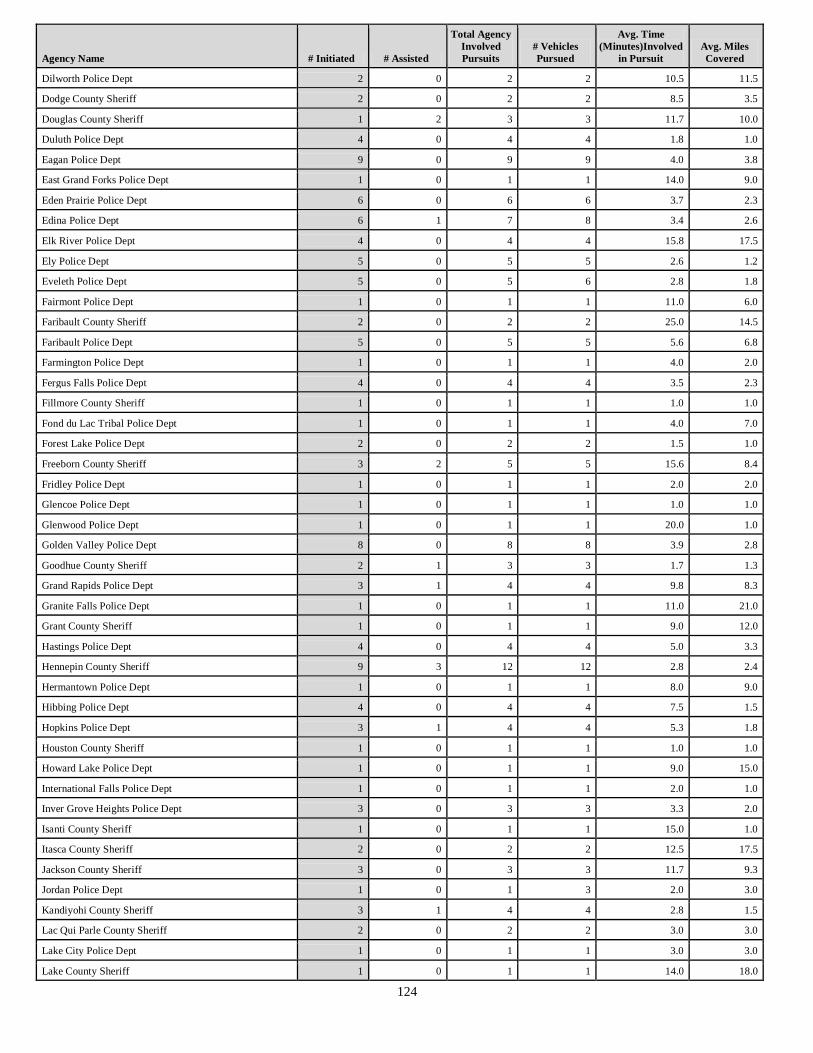
124
Agency Name # Initiated # Assisted
Total Agency Involved Pursuits
# Vehicles Pursued
Avg. Time (Minutes)Involved
in Pursuit Avg. Miles Covered
Dilworth Police Dept 2 0 2 2 10.5 11.5 Dodge County Sheriff 2 0 2 2 8.5 3.5 Douglas County Sheriff 1 2 3 3 11.7 10.0 Duluth Police Dept 4 0 4 4 1.8 1.0 Eagan Police Dept 9 0 9 9 4.0 3.8 East Grand Forks Police Dept 1 0 1 1 14.0 9.0 Eden Prairie Police Dept 6 0 6 6 3.7 2.3 Edina Police Dept 6 1 7 8 3.4 2.6 Elk River Police Dept 4 0 4 4 15.8 17.5 Ely Police Dept 5 0 5 5 2.6 1.2 Eveleth Police Dept 5 0 5 6 2.8 1.8 Fairmont Police Dept 1 0 1 1 11.0 6.0 Faribault County Sheriff 2 0 2 2 25.0 14.5 Faribault Police Dept 5 0 5 5 5.6 6.8 Farmington Police Dept 1 0 1 1 4.0 2.0 Fergus Falls Police Dept 4 0 4 4 3.5 2.3 Fillmore County Sheriff 1 0 1 1 1.0 1.0 Fond du Lac Tribal Police Dept 1 0 1 1 4.0 7.0 Forest Lake Police Dept 2 0 2 2 1.5 1.0 Freeborn County Sheriff 3 2 5 5 15.6 8.4 Fridley Police Dept 1 0 1 1 2.0 2.0 Glencoe Police Dept 1 0 1 1 1.0 1.0 Glenwood Police Dept 1 0 1 1 20.0 1.0 Golden Valley Police Dept 8 0 8 8 3.9 2.8 Goodhue County Sheriff 2 1 3 3 1.7 1.3 Grand Rapids Police Dept 3 1 4 4 9.8 8.3 Granite Falls Police Dept 1 0 1 1 11.0 21.0 Grant County Sheriff 1 0 1 1 9.0 12.0 Hastings Police Dept 4 0 4 4 5.0 3.3 Hennepin County Sheriff 9 3 12 12 2.8 2.4 Hermantown Police Dept 1 0 1 1 8.0 9.0 Hibbing Police Dept 4 0 4 4 7.5 1.5 Hopkins Police Dept 3 1 4 4 5.3 1.8 Houston County Sheriff 1 0 1 1 1.0 1.0 Howard Lake Police Dept 1 0 1 1 9.0 15.0 International Falls Police Dept 1 0 1 1 2.0 1.0 Inver Grove Heights Police Dept 3 0 3 3 3.3 2.0 Isanti County Sheriff 1 0 1 1 15.0 1.0 Itasca County Sheriff 2 0 2 2 12.5 17.5 Jackson County Sheriff 3 0 3 3 11.7 9.3 Jordan Police Dept 1 0 1 3 2.0 3.0 Kandiyohi County Sheriff 3 1 4 4 2.8 1.5 Lac Qui Parle County Sheriff 2 0 2 2 3.0 3.0 Lake City Police Dept 1 0 1 1 3.0 3.0 Lake County Sheriff 1 0 1 1 14.0 18.0

125
Agency Name # Initiated # Assisted
Total Agency Involved Pursuits
# Vehicles Pursued
Avg. Time (Minutes)Involved
in Pursuit Avg. Miles Covered
Lake of the Woods County Sheriff 2 0 2 3 15.5 20.0 Lakeville Police Dept 5 0 5 5 5.4 3.6 Lamberton Police Dept 1 0 1 1 19.0 19.0 Le Sueur County Sheriff 2 0 2 2 18.5 7.5 Leech Lake Band of Ojibwe DPS 4 0 4 4 6.5 5.5 Lino Lakes Police Dept 2 0 2 2 5.5 3.0 Litchfield Police Dept 1 0 1 1 3.0 2.0 Little Canada Police Dept 2 0 2 2 2.0 2.0 Mahnomen County Sheriff 1 0 1 1 12.0 1.0 Mankato Dept of Public Safety 9 0 9 9 2.2 1.7 Maple Grove Police Dept 2 0 2 2 19.5 16.0 Maplewood Police Dept 17 1 18 19 3.9 4.7 Marshall Police Dept 2 0 2 2 10.0 5.5 Martin County Sheriff 2 0 2 2 9.0 3.5 McLeod County Sheriff 2 0 2 2 2.5 2.5 Medina Police Dept 2 0 2 2 27.0 3.5 Meeker County Sheriff 6 0 6 6 4.2 4.8 Mendota Heights Police Dept 1 0 1 1 6.0 2.0 Metropolitan Airport Police Dept 1 2 3 3 2.3 1.7 Mille Lac Tribal PD 4 0 4 4 19.8 20.0 Mille Lacs County Sheriff 0 3 3 3 17.0 21.0 Minneapolis Police Dept 109 0 109 109 3.9 2.0 Minnetonka Police Dept 4 1 5 5 3.0 3.0 MN Dept of Natural Resources - Enforcement Division 3 0 3 3 6.3 6.0 MN State Patrol District 2000 - Central Office 2 1 3 3 27.3 3.7 MN State Patrol District 2100 - Rochester 11 1 12 12 8.3 7.8 MN State Patrol District 2200 - Mankato 4 0 4 4 201.8 3.5 MN State Patrol District 2300 - Marshall 4 0 4 4 8.3 9.0 MN State Patrol District 2400 - Oakdale 16 6 22 22 14.3 5.7 MN State Patrol District 2500 - Golden Valley 21 4 25 25 30.8 4.8 MN State Patrol District 2600 - St Cloud 10 3 13 13 10.5 11.1 MN State Patrol District 2700 - Duluth 15 2 17 17 5.2 4.9 MN State Patrol District 2800 - Brainerd 4 1 5 5 12.6 15.4 MN State Patrol District 2900 - Detroit Lakes 4 4 8 8 8.3 6.4 MN State Patrol District 3100 - Virginia 6 1 7 7 6.7 4.9 MN State Patrol District 3200 - Thief River Falls 7 1 8 8 8.9 7.3 Montevideo Police Dept 1 0 1 1 20.0 30.0 Montgomery Police Dept 1 0 1 1 3.0 1.0 Moorhead Police Dept 7 0 7 8 4.9 4.3 Morris Police Dept 0 1 1 1 9.0 19.0 Morrison County Sheriff 2 0 2 2 5.5 2.5 Mounds View Police Dept 1 0 1 1 1.0 1.0 Mower County Sheriff 2 2 4 4 32.8 19.0 Murray County Sheriff 1 0 1 1 16.0 7.0 New Brighton Dept of Public Safety 0 1 1 1 6.0 1.0

126
Agency Name # Initiated # Assisted
Total Agency Involved Pursuits
# Vehicles Pursued
Avg. Time (Minutes)Involved
in Pursuit Avg. Miles Covered
New Hope Police Dept 1 0 1 1 1.0 1.0 New Ulm Police Dept 1 0 1 1 10.0 8.0 North Branch Police Dept 1 0 1 1 1.0 1.0 North Mankato Police Dept 1 1 2 2 4.0 3.0 Northfield Police Dept 1 0 1 1 3.0 2.0 Oakdale Police Dept 2 0 2 2 1.0 1.0 Olivia Police Dept 1 0 1 1 3.0 3.0 Orono Police Dept 1 0 1 1 1.0 1.0 Otter Tail County Sheriff 1 0 1 1 3.0 5.0 Owatonna Police Dept 1 1 2 2 5.5 3.0 Park Rapids Police Dept 1 0 1 1 3.0 1.0 Pennington County Sheriff 3 0 3 3 17.3 17.0 Pequot Lakes Police Dept 0 1 1 1 283.0 2.0 Perham Police Dept 1 0 1 1 5.0 5.0 Pine County Sheriff 3 0 3 3 6.7 7.7 Pipestone County Sheriff 1 0 1 1 7.0 4.0 Plymouth Police Dept 3 1 4 4 8.3 3.8 Polk County Sheriff 3 0 3 3 3.3 3.7 Preston Police Dept 1 0 1 1 21.0 19.0 Prior Lake Police Dept 3 0 3 3 27.3 1.0 Proctor Police Dept 0 3 3 3 30.7 4.3 Ramsey County Sheriff 3 2 5 5 19.6 7.4 Ramsey Police Dept 2 0 2 2 3.0 2.5 Randall Police Dept 1 0 1 1 31.0 50.0 Red Wing Police Dept 8 0 8 8 5.8 4.3 Redwood Falls Police Dept 1 1 2 2 6.5 1.5 Renville County Sheriff 3 0 3 3 8.7 6.0 Rice County Sheriff 3 0 3 3 29.3 5.7 Richfield Police Dept 5 0 5 5 3.4 2.8 Robbinsdale Police Dept 5 0 5 5 1.6 0.8 Rochester Police Dept 15 1 16 16 2.3 1.9 Rock County Sheriff 3 1 4 4 14.3 16.3 Rogers Police Dept 1 2 3 3 8.3 4.3 Roseau County Sheriff 3 0 3 3 2.3 1.0 Rosemount Police Dept 4 0 4 4 2.0 1.8 Roseville Police Dept 11 2 13 13 4.8 5.6 Rushford Police Dept 2 0 2 2 365.5 2.0 Sartell Police Dept 2 0 2 2 2.0 2.5 Sauk Centre Police Dept 3 0 3 3 7.7 7.7 Savage Police Dept 1 0 1 1 2.0 1.0 Shakopee Police Dept 1 0 1 1 14.0 14.0 Sherburne County Sheriff 12 0 12 12 3.3 2.8 Shoreview Police Dept 2 0 2 2 6.0 3.5 Sleepy Eye Police Dept 1 0 1 1 1.0 1.0 South Lake Minnetonka Police Dept 2 2 4 4 9.3 3.0

127
Agency Name # Initiated # Assisted
Total Agency Involved Pursuits
# Vehicles Pursued
Avg. Time (Minutes)Involved
in Pursuit Avg. Miles Covered
South St Paul Police Dept 4 1 5 5 1.6 1.4 Spring Lake Park Police Dept 2 0 2 2 3.0 6.5 St Anthony Police Dept 4 0 4 4 7.5 6.8 St Charles Police Dept 1 0 1 1 6.0 6.0 St Cloud Police Dept 13 1 14 14 3.4 2.4 St Francis Police Dept 1 0 1 1 10.0 5.0 St James Police Dept 1 0 1 1 17.0 1.0 St Louis County Sheriff 5 0 5 5 7.4 9.0 St Louis Park Police Dept 1 0 1 2 5.0 3.0 St Paul Police Dept 75 1 76 76 2.9 1.9 St Peter Police Dept 2 2 4 4 8.5 11.5 Staples Police Dept 2 0 2 2 18.5 19.0 Stearns County Sheriff 2 0 2 2 4.5 3.0 Steele County Sheriff 1 0 1 1 6.0 7.0 Stevens County Sheriff 3 0 3 3 4.7 8.3 Stillwater Police Dept 1 0 1 1 3.0 2.0 Swift County Sheriff 2 0 2 2 26.5 13.5 Todd County Sheriff 3 1 4 4 21.0 19.8 University of MN Police Dept - Minneapolis 1 0 1 1 9.0 2.0 Vadnais Heights Police Dept 1 0 1 1 5.0 1.0 Virginia Police Dept 3 0 3 3 44.3 4.3 Wabasha County Sheriff 1 1 2 2 8.0 6.0 Wabasha Police Dept 0 1 1 1 70.0 1.0 Wadena Police Dept 4 0 4 4 4.0 1.3 Waite Park Police Dept 5 4 9 9 6.0 3.6 Warroad Police Dept 2 0 2 2 5.0 3.0 Waseca County Sheriff 2 3 5 5 30.4 6.2 Washington County Sheriff 9 2 11 11 6.0 3.0 Waterville Police Dept 2 1 3 3 13.3 13.7 Wayzata Police Dept 1 0 1 1 1.0 1.0 West St Paul Police Dept 5 0 5 5 4.6 2.2 White Bear Lake Police Dept 1 0 1 1 3.0 2.0 White Earth Tribal Police Dept 1 0 1 2 1.0 2.0 Wilkin County Sheriff 1 1 2 2 37.5 18.0 Willmar Police Dept 1 0 1 1 2.0 1.0 Windom Police Dept 3 0 3 3 1.3 1.0 Winnebago Public Safety 1 1 2 2 165.5 17.5 Winona County Sheriff 2 0 2 2 8.5 14.0 Winona Police Dept 7 0 7 7 2.0 1.1 Woodbury Public Safety 1 0 1 1 2.0 2.0 Worthington Police Dept 4 0 4 4 2.8 1.8 Wright County Sheriff 14 0 14 14 2.4 2.1 Wyoming Police Dept 2 1 3 3 7.7 4.7 Zumbrota Police Dept 0 1 1 1 8.0 16.0 STATE TOTAL 889 117 1006 1016 9.6 4.9

128
BIAS MOTIVATED CRIMES
BACKGROUND: In 1988, the Legislature passed a law which requires peace officers to report any incidents which were motivated by bias. 1989 was the first full year this information was collected. The state statute reads as follows: 626.5531 REPORTING OF CRIMES MOTIVATED BY BIAS. Subdivision 1. Reports required. A peace officer must report to the head of the officer's department every violation of chapter 609 or a local criminal ordinance if the officer has reason to believe, or if the victim alleges, that the offender was motivated to commit the act by the victim's race, religion, national origin, sex, age and disability, or characteristics identified as sexual orientation. The superintendent of the Bureau of Criminal Apprehension shall adopt a reporting form to be used by law enforcement agencies in making the reports required under this section. The reports must include for each incident all of the following: (1) the date of the offense; (2) the location of the offense; (3) whether the target of the incident is a person, private property, or public property; (4) the crime committed; (5) the type of bias and information about the offender and victim that is relevant to that bias; (6) any organized group involved in the incident; (7) the disposition of the case; (8) whether the determination that the offense was motivated by bias was based on the officer’s reasonable belief or on the victim’s allegation; and (9) any additional information the super- intendent deems necessary for the acquisition of accurate and relevant data. Subd. 2. Use of information collected. The head of a local law enforcement agency or state law enforcement department that employs peace officers licensed under section 626.843 must file a monthly report describing crimes reported under this section with the Department of Public Safety, Bureau of Criminal Apprehension. The commissioner of public safety must summarize and analyze the
information received and file an annual report with the the legislature. The commissioner may include information in the annual report concerning any additional criminal activity motivated by bias that is not covered by this section.
SUMMARY • There was a 7% decrease in bias incidents
reported for January-December 2013, (154) compared to the same time period in 2012 (166).
• 25 of the offenses were based on the officer’s
belief that a bias crime occurred, 54 the victim’s belief that a bias offense occurred and in 75 of the offenses both the officer and victims believed a bias offense occurred.
• Of the total 154 bias incidents and 163 offenses
reported, the largest type of bias offense reported was racial with 93 (57%) followed by 33 (20%) for sexual orientation and 21 (13%) for religion.
• Forty eight (29%) of the offenses occurred at a
residence followed by thirty (18%) on a highway/road/alley/street/sidewalk and eleven (7%) at a church, synagogue or temple and 10 (6%) at a school.
• 34% of all offenses were assaults (13%
aggravated and 21% simple), 25% destruction, damage and vandalism and 20% intimidation.
• The number of victims decreased 9% from
175 in 2012 to 159 victims in 2013. • Of the 159 reported victims of bias in 2013, 101
were males, 53 females and 5 unknown. Seventy (44%) of the victims were African American, and seventy (44%) were White.
• 26% of all victims were between the ages of 21-
30, followed by 20% between the ages of 31-40. The number of offenders decreased 5% from 212 in 2012 to 201 in 2013. • Of the 201 reported bias offenders in 2013, 126
were males, 32 females and 43 unknown. Seventy six (38%) of the offenders were White, fifty four (26%) African American, while fifty (25%) were unknown.
• The age group with the highest number of
offenders was 11- 20 year olds with 21% (42).

129
TABLE 39
BIAS OFFENSE SUMMARY 2011 - 2013
Discrimination Motivation Type Per Victim
Year Reported
Type of Bias Motivation 2011* 2012 2013
Anti-Sexual Orientation Male Homosexual (Gay) 28 22 22 Female Homosexual (Lesbian) 8 6 2 Homosexual (Gay and Lesbian) 1 12 8 Male Heterosexual 0 2 0 Female Heterosexual 0 1 0 Bisexual/Transgender 0 0 1
Anti-Sexual Orientation Motivation TOTAL - all victims 37 43 33 Anti-Age 01-64 Years Old 0 1 0 Over 65 Years Old 0 0 1
Anti-Age Motivation TOTAL - all victims 0 1 1 Anti-Disability Physical Disability 0 0 1 Mental Disability 1 0 1
Anti-Disability Motivation TOTAL - all victims 1 0 2 Anti-Gender/Sex Male 0 0 0 Female 2 0 1
Anti-Gender/Sex Motivation TOTAL - all victims 2 0 1 Anti-Gender Identity * Transgender 0 0 1 Gender Non-Conforming 0 0 0
Anti-Gender Identity Motivation TOTAL - all victims 0 0 1
TOTAL BIAS OFFENSE VICTIM COUNT 170 175 163
Year Reported
Type of Bias Motivation 2011* 2012 2013
Anti-Race White 13 10 25 Black or African American 63 64 60 American Indian or Alaska Native 2 3 4 Asian ** 7 5 3 Native Hawaiian or Other Pacific Islander ** 0 0 1
Anti-Race Motivation TOTAL - all victims 85 82 93 Anti-Religion Catholic 1 3 2 Hindu 0 0 0 Islamic/Muslim 6 5 5 Jewish 17 20 9 Protestant 0 1 1 Fundamentalist 0 0 0 Other Religion 0 1 4 Multi-Religious Group 0 1 0 Atheism/Agnostic 0 0 0
Anti-Religion Motivation TOTAL - all victims 24 31 21 Anti-Ethnicity/National Origin Hispanic or Latino 6 9 2 Other Ethnicity/National Origin 15 9 9
Anti-Ethnicity/National Origin Motivation TOTAL - all victims 21 18 11
* Beginning 2011, Anti-Gender Identity was added and other types of bias were expanded. ** Race code of Asian/Pacific Islander has been divided into two distinct race categories.

130
TABLE 40
BIAS OFFENSE SUMMARY 2011 - 2013
UCR OFFENSE COMMITTED IN BIAS INCIDENTS
Year Reported
UCR Offense Code 2011 * 2012 2013 Murder 0 0 0 Rape 1 0 2 Robbery 5 4 6 Aggravated Assault 15 16 21 Burglary 1 1 2 Larceny Theft 0 4 2 Motor Vehicle Theft 0 0 0 Arson 0 3 0 Simple Assault 34 31 35 Intimidation 49 33 33 Destruction/Damage/Vandalism 45 57 41 Other Offenses 20 26 21
TOTAL INCIDENTS 170 175 163
* Beginning in 2011 up to three UCR Offense Codes could be reported per incident. In prior years, only one offense was reported per incident. The total UCR Offenses may be higher than the number of bias incidents reported.
TABLE 41
BIAS OFFENSE SUMMARY 2011 - 2013
BIAS SITUATION OCCURRING IN BIAS INCIDENTS
Year Reported
Bias Situations 2011 * 2012 2013 Burning/Fires 0 4 2 Bodily Harm 39 37 48 Hanging In Effigy 0 0 0 Disturbing Public Meeting/Gathering 0 3 2 Bombing 0 0 1 Graffiti/Swastika 34 46 32 Spitting 1 1 3 Verbal Abuse (Person to Person) 63 60 63 Telephone 3 7 5 Letter 5 8 7 * Email/Text Message 3 5 6 * Social Networking Site Posting 2 3 2
TOTAL INCIDENTS 150 174 171
Bias Situation is not required for each incident reported, so the total incidents in the table above may not match the total incidents reported in the given years * In 2011, new bias situations were added and multiple situations could be selected for each bias incident. The total bias situations reported will not match the total bias incidents reported.

*In 2011 additional location codes (
in bold
) were added as places of bias occurrences.
TABLE 42
BIAS OFFENSE SUMMARY 2011 - 2013
PLACES OF OCCURRENCE BY INCIDENT
Year Reported
Places of Occurrence 2011 * 2012 2013 Hotel/Motel/Short Term Res. 1 Industrial Site 1
Jail/Prison 1 1
Lake/Waterway 1 Liquor Store Military Installation Other 5 5 3 Park/Play Area 7 9 9 Parking Lot/Garage 6 7 7 Private Club Rental Storage Facility Residence/Home 48 56 48 Rest Area Restaurant 4 5
Rural Area/County Rd Service/Gas Station 1 1 School-College/University 1 2 3 School-Elem./Secondary 13 17 7 Shelter - Mission/Homeless 1 1
Shopping Mall 1 2 Specialty Store (TV,Fur,etc.) 2 Tribal Lands Vacant Lot Vehicle 9 13 4
Year Reported
Places of Occurrence 2011 * 2012 2013 Abandoned/Condemned Structure 1 1 2 Air/Bus/Train Terminal 4 3 3 Amusement Park Arena/Stadium/Fairgrounds/Coliseum ATM Separate from Bank Auto Dealership New/Used Bank/Savings and Loan 1 Bar/Night Club 1 7 7 Camp/Campground 1
Cemetery Church/Synagogue/Temple 3 8 11 Commercial Office Building 3 2 3 Community Center Construction Site Convenience Store 2 1 Daycare Facility Department/Discount Store 2 1 1 Dock/Wharf/Freight/Terminal Drug Store/Dr Office/Hospital Farm Facility Field/Woods Gambling Fac./Casino/Race Track Government/Public Bldg 2 6
Grocery/Supermarket 3 1 Highway/Road/Alley/Street/Sidewalk 34 23 30
TOTAL INCIDENTS 148 167 154
131
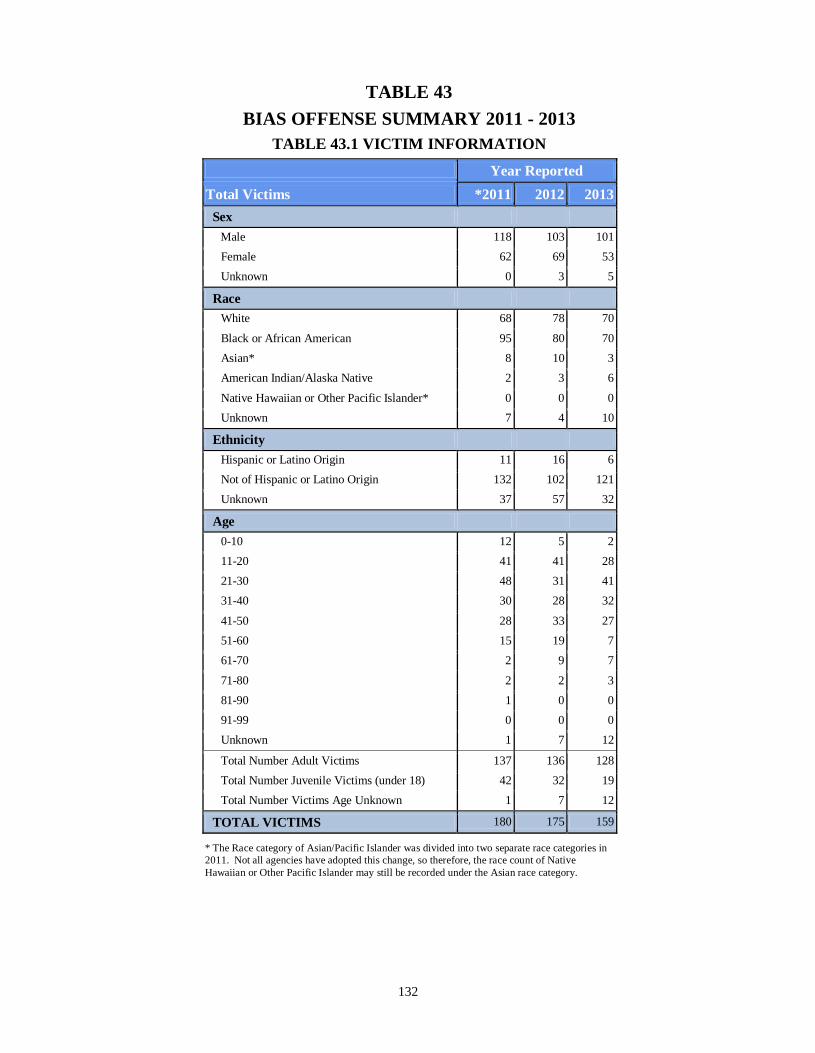
132
TABLE 43
BIAS OFFENSE SUMMARY 2011 - 2013
TABLE 43.1 VICTIM INFORMATION
Year Reported
Total Victims *2011 2012 2013
Sex Male 118 103 101 Female 62 69 53 Unknown 0 3 5
Race White 68 78 70 Black or African American 95 80 70 Asian* 8 10 3 American Indian/Alaska Native 2 3 6 Native Hawaiian or Other Pacific Islander* 0 0 0 Unknown 7 4 10
Ethnicity Hispanic or Latino Origin 11 16 6 Not of Hispanic or Latino Origin 132 102 121 Unknown 37 57 32
Age 0-10 12 5 2 11-20 41 41 28 21-30 48 31 41 31-40 30 28 32 41-50 28 33 27 51-60 15 19 7 61-70 2 9 7 71-80 2 2 3 81-90 1 0 0 91-99 0 0 0 Unknown 1 7 12 Total Number Adult Victims 137 136 128 Total Number Juvenile Victims (under 18) 42 32 19 Total Number Victims Age Unknown 1 7 12
TOTAL VICTIMS 180 175 159
* The Race category of Asian/Pacific Islander was divided into two separate race categories in 2011. Not all agencies have adopted this change, so therefore, the race count of Native Hawaiian or Other Pacific Islander may still be recorded under the Asian race category.

133
TABLE 43.2 OFFENDER INFORMATION
Year Reported
Total Offenders *2011 2012 2013
Sex Male 111 127 126 Female 26 26 32 Unknown 52 59 43
Race White 70 84 76 Black or African American 53 55 54 Asian* 6 1 11 American Indian/Alaska Native 3 5 10 Native Hawaiian or Other Pacific Islander* 0 0 0 Unknown 57 67 50
Ethnicity Hispanic or Latino Origin 10 5 6 Not of Hispanic or Latino Origin 110 114 119 Unknown 69 93 76
Age 0-10 1 2 0 11-20 64 63 42 21-30 22 29 37 31-40 17 13 20 41-50 16 18 19 51-60 5 6 10 61-70 2 2 3 71-80 0 0 1 81-90 0 0 0 91-99 1 0 0 Unknown 61 79 69 Total Number Adult Offenders 80 94 121 Total Number Juvenile Offenders (under 18) 48 39 11 Total Number of Offenders Age Unknown 61 79 69 TOTAL OFFENDERS 189 212 201
* The Race category of Asian/Pacific Islander was divided into two separate race categories in 2011. Not all agencies have adopted this change, so therefore, the race count of Native Hawaiian or Other Pacific Islander may still be recorded under the Asian race category.

* Beginning 2011, new categories were added for Type of Bias (Bias Motivation Code).
§ Beginning in 2011, up to three bias offenses could be entered per bias incident instead of only one bias offense per incident in previous years.
TABLE 44
BIAS INCIDENTS BY AGENCY - 2013
Number of Offenses by Motivation Type
Agency Total
Incidents
§ Total Offenses Reports
Anti-Race
Anti-Religion
Anti-Ethnicity/ National Origin
* Anti - Sexual
Orientation Anti-Age
Anti-Disability
Anti-Gender/
Sex
* Anti - Gender Identity
Blaine Police Dept 4 4 4 Columbia Heights Police Dept 2 2 1 1 Lino Lakes Police Dept 1 1 1 Spring Lake Park Police Dept 1 1 1 Bemidji Police Dept 1 1 1 Mankato Dept of Public Safety 6 7 2 2 3 Chaska Police Dept 1 1 1 Moorhead Police Dept 2 2 1 1 Crosby Police Dept 1 1 1 Mendota Heights Police Dept 1 1 1 West St Paul Police Dept 1 2 2 Eagan Police Dept 3 5 2 1 1 1 Inver Grove Heights Police Dept 1 1 1 Hennepin County Sheriff 1 1 1 Brooklyn Park Police Dept 3 4 4 Minneapolis Police Dept 39 39 20 4 3 11 1 Plymouth Police Dept 7 8 4 2 2 St Anthony Police Dept 1 1 1 St Louis Park Police Dept 8 9 3 6 Eden Prairie Police Dept 1 1 1 Maple Grove Police Dept 3 3 3 Marshall Police Dept 2 2 1 1 Mahnomen County Sheriff 1 1 1 Mille Lacs County Sheriff 1 1 1 Isle Police Dept 1 1 1 Rochester Police Dept 4 4 2 2 Roseville Police Dept 3 4 3 1 St Paul Police Dept 32 32 25 4 1 1 1 Shoreview Police Dept 1 1 1 Rice County Sheriff 1 1 1 Faribault Police Dept 1 1 1 Chisholm Police Dept 1 1 1 Duluth Police Dept 1 1 1
134

* Beginning 2011, new categories were added for Type of Bias (Bias Motivation Code).
§ Beginning in 2011, up to three bias offenses could be entered per bias incident instead of only one bias offense per incident in previous years.
TABLE 44
BIAS INCIDENTS BY AGENCY - 2013
Number of Offenses by Motivation Type
Agency Total
Incidents
§ Total Offenses Reports
Anti-Race
Anti-Religion
Anti-Ethnicity/ National Origin
* Anti - Sexual
Orientation Anti-Age
Anti-Disability
Anti-Gender/
Sex
* Anti - Gender Identity
Shakopee Police Dept 1 1 1 Savage Police Dept 1 1 1 Elk River Police Dept 1 1 1 St Cloud Police Dept 8 9 7 2 Waite Park Police Dept 1 1 1 University of MN Police Dept - Morris
1 1 1
Wadena Police Dept 1 1 1 Woodbury Public Safety 1 1 1 MN Dept of Natural Resources - Enforcement Division
2 2 2
STATE TOTAL 154 163 93 21 11 33 1 2 1 1
135
136
M MINNESOTA MISSING CHILDREN AND ENDANGERED PERSONS REPORT
BACKGROUND:
In 1984, the Minnesota Legislature enacted what is known as the "Minnesota Missing Children's Act". This Act provides for the commissioner of Public Safety to maintain a missing children program. The law was updated in 2009 to include endangered missing adults. This program requires the Commissioner to: provide the necessary computer systems to allow for the maintaining of data on missing children and endangered persons in the Federal Bureau of Investigation's National Crime Information Center; provide a system for broadcasting information on missing children and endangered persons regionally, statewide, multi- state and nationwide; and to annually compile statistical information related to missing children and endangered persons. The statute is as follows: 299C.52 MINNESOTA MISSING CHILDREN AND ENDANGERED PERSONS PROGRAM.
Subdivision 1. Definitions. As used in sections 299C.52 to 299C.56, the following terms have the meanings given them:
(a) "Child" means any person under the age
of 18 years or any person certified or known to be mentally incompetent.
(b) “Endangered” means that a law
enforcement official has received sufficient evidence that the missing person is at risk of physical injury or death.
(c) "Missing" means the status of a person
after a law enforcement agency that has received a report of a missing person has conducted a preliminary investigation and determined that the person cannot be located.
(d) "NCIC" means National Crime
Information Center.
Subdivision 2. Establishment. The commissioner of public safety shall
maintain a Minnesota missing children and en- dangered persons program within the department to enable documented information about missing Minnesota children and endangered persons to be entered into the NCIC computer.
Subdivision 3. Computer equipment and
programs. The commissioner shall provide the necessary
computer hardware and computer programs to enter, modify, and cancel information on missing children and endangered persons in the NCIC computer. These programs must provide for search and retrieval of information using the following identifiers: physical description, name and date of birth, name and social security number, name and driver's license number, vehicle license number, and vehicle identification number. The commissioner shall also provide a system for regional, statewide, multi-state, and nationwide broadcasts of information on missing children and endangered persons. These broadcasts shall be made by local law enforcement agencies where possible or, in the case of statewide or nationwide broadcasts, by the Bureau of Criminal Apprehension upon request of the local law enforcement agency.
Subdivision 4. Authority to enter or retrieve information.
Only law enforcement agencies may enter missing children and endangered persons information into the NCIC computer or retrieve information from the NCIC computer.
Subdivision 5. Statistical data. The commissioner shall annually compile and
make available statistical information on the number of missing children and endangered persons entered into the NCIC computer and, if available, information on the number located.
Subdivision 6. Rules. The commissioner may adopt rules in
conformance with sections 299C.52 to 299C.565 to provide for the orderly collection and entry of missing children and endangered persons information and requests for retrieval of missing children and endangered persons' information.
Subdivision 7. Cooperation with other agencies. The commissioner shall cooperate with other
states and the NCIC in the exchange of information on missing persons.
137
299C.53 MISSING PERSONS REPORT; DUTIES OF COMMISSIONER AND LAW ENFORCEMENT AGENCIES.
Subdivision 1. Investigation and entry of information. A law enforcement agency shall accept without delay any report of a missing person. Upon receiving a report of a person believed to be missing, a law enforcement agency shall conduct a preliminary investigation to determine whether the person is missing, and if missing, whether the person is endangered. If the person is initially determined to be missing and endangered, the agency shall immediately consult the Bureau of Criminal Apprehension during the preliminary investigation, in recognition of the fact that the first two hours are critical. If the person is determined to be missing and endangered, the agency shall immediately enter identifying and descriptive information about the person into the NCIC computer. Law enforcement agencies having direct access to the NCIC computer shall enter and retrieve the data directly and shall cooperate in the entry and retrieval of data on behalf of law enforcement agencies which do not have direct access to the systems.
Subdivision 2. Location of missing person. As
soon as is practically possible after a missing person is located, the law enforcement agency which located or returned the missing person shall notify the law enforcement agency having jurisdiction over the investigation, and that agency shall cancel the entry from the NCIC computer.
Subdivision 3. Missing and endangered persons. If the Bureau of Criminal Apprehension receives a report from a law enforcement agency indicating that a person is missing and endangered, the superintendent may assist the law enforcement agency in conducting the preliminary investigation, offer resources, and assist the agency in
helping implement the investigation policy with particular attention to the need for immediate action. The law enforcement agency shall promptly notify all appropriate law enforcement agencies in the state and, if deemed appropriate, law enforcement agencies in adjacent states or jurisdictions of any information that may aid in the prompt location and safe return of a missing or endangered person. Subdivision 4. Federal requirements. In
addition to the provisions of sections 299C.51 to 299C.565, the law enforcement agency and the Bureau of Criminal Apprehension shall comply with requirements provided in federal law on reporting and investigating missing children cases. For purposes of this subdivision, the definition of “child,” “children,” or “minor” shall be determined in accordance with the applicable federal law. GOALS AND OBJECTIVES: The primary goal o f the “Minnesota Mi ss i n g Children and Endangered Persons Program" is to assist in the locating of those children and endangered persons reported missing in the shortest possible time thus insuring their safe return by: requiring investigative action by law enforcement agencies; by requiring the entry of data on the missing child or endangered person; and by requiring an annual compilation of statistical information for evaluation of the missing children and endangered person problem in Minnesota. The following table reflects the information directly from the Federal Bureau of Investigation’s, National Crime Information Center’s file for Minnesota. As of December 31, 2013 there were 476 active missing person records in the FBI/NCIC system for Minnesota.
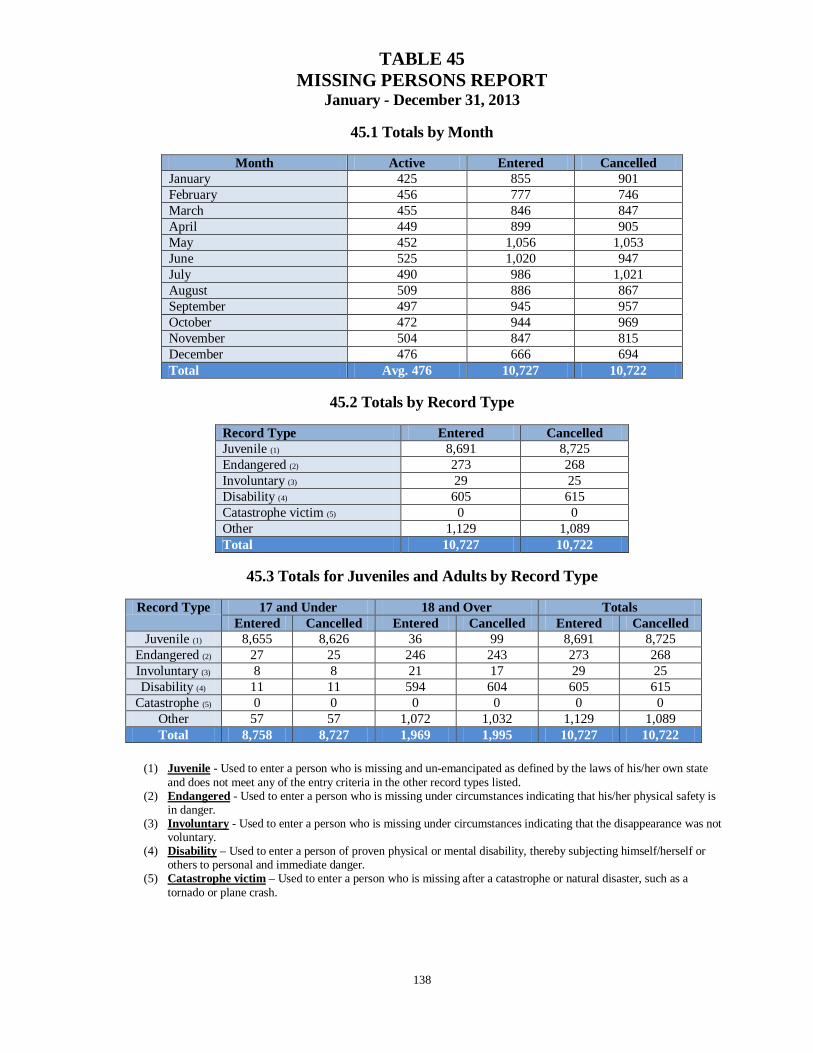
138
TABLE 45 MISSING PERSONS REPORT
January - December 31, 2013
45.1 Totals by Month
Month Active Entered Cancelled January 425 855 901 February 456 777 746 March 455 846 847 April 449 899 905 May 452 1,056 1,053 June 525 1,020 947 July 490 986 1,021 August 509 886 867 September 497 945 957 October 472 944 969 November 504 847 815 December 476 666 694 Total Avg. 476 10,727 10,722
45.2 Totals by Record Type
Record Type Entered Cancelled Juvenile (1) 8,691 8,725 Endangered (2) 273 268 Involuntary (3) 29 25 Disability (4) 605 615 Catastrophe victim (5) 0 0 Other 1,129 1,089 Total 10,727 10,722
45.3 Totals for Juveniles and Adults by Record Type
Record Type 17 and Under 18 and Over Totals
Entered Cancelled Entered Cancelled Entered Cancelled Juvenile (1) 8,655 8,626 36 99 8,691 8,725
Endangered (2) 27 25 246 243 273 268 Involuntary (3) 8 8 21 17 29 25 Disability (4) 11 11 594 604 605 615
Catastrophe (5) 0 0 0 0 0 0 Other 57 57 1,072 1,032 1,129 1,089 Total 8,758 8,727 1,969 1,995 10,727 10,722
(1) Juvenile - Used to enter a person who is missing and un-emancipated as defined by the laws of his/her own state
and does not meet any of the entry criteria in the other record types listed. (2) Endangered - Used to enter a person who is missing under circumstances indicating that his/her physical safety is
in danger. (3) Involuntary - Used to enter a person who is missing under circumstances indicating that the disappearance was not
voluntary. (4) Disability – Used to enter a person of proven physical or mental disability, thereby subjecting himself/herself or
others to personal and immediate danger. (5) Catastrophe victim – Used to enter a person who is missing after a catastrophe or natural disaster, such as a
tornado or plane crash.

139
2013
COUNTY AND MUNICIPAL LAW ENFORCEMENT AGENCY INFORMATION
County and Municipal Law Enforcement Offense Information contained in this section is arranged by total county figures, sheriff office figures and municipal police department figures. Legislation passed in October, 1978, reclassified the offense of Arson to a Part 1 Crime. The arson figures reflected in 2013 have been tabulated and
recorded in the Part 1 Crime area. This fact should be taken into consideration whenever comparing Part 1 and Part 2 totals for 1980-2013 with previous years. The information contained within this section will reflect agencies not reporting specific offenses.

TABLE 46Offenses, Clearances, Percent Cleared and Crime Rate by Agency - 2013
0 = Number of Offenses C = Offenses Cleared % = Percentage Cleared R = Crime Rate per 100,000 * - Agency did not report all 12 months 2013 140
Aggra- Motor Forgery/ Embe- Other Disor- OtherGrand Total Rob- vated Burg- Larc- Vehicle Total Other Counter- zzle- Stolen Vand- Weap- Prosti- Sex Narc- Gamb- Family/ Liquor derly Offen-
County/City Part 1 Murder Rape bery Assault lary eny Theft Arson Part 2 Assaults feiting Fraud ment Property alism ons tution Offen. otics ling Children D.U.I. Laws Cond. sesAITKIN O 1048 491 0 17 1 21 167 260 24 1 557 75 2 56 0 4 132 3 0 16 25 0 23 87 10 26 98SHERIFF C 537 151 0 8 0 19 27 83 13 1 386 55 0 24 0 2 39 2 0 12 25 0 18 87 9 22 91MN0010000 % 51 31 0 47 0 90 16 32 54 100 69 73 0 43 0 50 30 67 0 75 100 0 78 100 90 85 93POP. 16,324Crime Rate R 6420 3008 0 104 6 129 1023 1593 147 6 3412 459 12 343 0 25 809 18 0 98 153 0 141 533 61 159 600
ANOKA O 20962 8607 2 128 88 232 1038 6726 365 28 12355 1427 324 889 2 219 2142 114 66 199 1300 0 65 927 221 3130 1330COUNTY TOTAL C 10556 2663 1 52 33 170 169 2136 94 8 7893 1126 106 151 1 186 461 93 60 99 1214 0 26 916 209 2165 1080POP. 333,468 % 50 31 50 41 38 73 16 32 26 29 64 79 33 17 50 85 22 82 91 50 93 0 40 99 95 69 81
Crime Rate R 6286 2581 1 38 26 69 311 2017 109 8 3705 428 97 267 1 66 642 34 20 60 390 0 19 278 66 939 399
ANOKA O 3127 1367 1 30 4 27 249 978 70 8 1760 250 25 138 1 30 377 23 6 21 199 0 3 146 32 320 189SHERIFF C 1428 264 0 8 1 20 24 191 20 0 1164 221 5 10 1 21 83 16 4 8 186 0 1 142 29 286 151MN0020000 % 46 19 0 27 25 74 10 20 29 0 66 88 20 7 100 70 22 70 67 38 93 0 33 97 91 89 80POP. 80,568Crime Rate R 3881 1697 1 37 5 34 309 1214 87 10 2184 310 31 171 1 37 468 28 7 26 247 0 3 181 40 397 235
ANOKA PD O 1289 604 0 15 9 13 55 487 23 2 685 129 19 41 0 19 133 7 0 14 55 0 5 52 7 84 120PD C 484 81 0 2 4 8 12 54 1 0 403 90 8 2 0 14 22 4 0 4 53 0 0 51 6 61 88MN0020100 % 38 13 0 13 44 62 22 11 4 0 59 70 42 5 0 74 17 57 0 29 96 0 0 98 86 73 73POP. 17,367Crime Rate R 7422 3478 0 86 52 75 317 2804 132 12 3944 743 109 236 0 109 766 40 0 80 317 0 29 299 40 484 691
BLAINE O 4085 1772 0 10 12 27 148 1508 61 6 2313 262 70 257 1 26 389 12 5 33 330 0 25 145 49 528 181PD C 1760 640 0 9 6 25 26 549 23 2 1120 200 36 57 0 20 41 11 4 21 303 0 7 145 45 108 122MN0020200 % 43 36 0 90 50 93 18 36 38 33 48 76 51 22 0 77 11 92 80 64 92 0 28 100 92 20 67POP. 57,953Crime Rate R 7048 3057 0 17 20 46 255 2602 105 10 3991 452 120 443 1 44 671 20 8 56 569 0 43 250 84 911 312
CENTENNIAL LAKES O 418 116 0 0 3 7 7 87 11 1 302 35 1 2 0 0 52 6 0 6 46 0 4 62 15 32 41PD C 240 22 0 0 1 7 0 10 3 1 218 28 1 1 0 0 7 6 0 6 46 0 4 62 14 8 35MN0020300 % 57 19 0 0 33 100 0 11 27 100 72 80 100 50 0 0 13 100 0 100 100 0 100 100 93 25 85POP. 10,903Crime Rate R 3833 1063 0 0 27 64 64 797 100 9 2769 321 9 18 0 0 476 55 0 55 421 0 36 568 137 293 376
COLUMBIA HEIGHTS O 1502 525 0 2 13 24 100 358 27 1 977 161 48 50 0 4 149 8 4 22 87 0 3 52 37 79 273PD C 795 121 0 1 6 17 9 82 6 0 674 139 6 4 0 2 23 4 1 5 81 0 2 51 36 57 263MN0020400 % 53 23 0 50 46 71 9 23 22 0 69 86 13 8 0 50 15 50 25 23 93 0 67 98 97 72 96POP. 19,758Crime Rate R 7601 2657 0 10 65 121 506 1811 136 5 4944 814 242 253 0 20 754 40 20 111 440 0 15 263 187 399 1381
COON RAPIDS O 4432 1867 0 31 15 48 183 1530 53 7 2565 205 54 42 0 25 441 22 24 52 277 0 10 177 32 940 264PD C 2857 849 0 16 7 39 48 723 13 3 2008 168 21 18 0 23 188 22 24 24 259 0 6 173 31 828 223MN0020500 % 64 45 0 52 47 81 26 47 25 43 78 82 39 43 0 92 43 100 100 46 94 0 60 98 97 88 84POP. 62,301Crime Rate R 7113 2996 0 49 24 77 293 2455 85 11 4117 329 86 67 0 40 707 35 38 83 444 0 16 284 51 1508 423
FRIDLEY O 3229 1326 0 14 18 45 157 1018 72 2 1903 132 51 170 0 96 281 16 26 17 82 0 12 98 9 806 107PD C 1569 428 0 6 4 25 25 356 10 2 1141 78 11 24 0 93 37 13 26 8 72 0 3 98 8 599 71MN0020600 % 49 32 0 43 22 56 16 35 14 100 60 59 22 14 0 97 13 81 100 47 88 0 25 100 89 74 66POP. 25,574Crime Rate R 11710 4808 0 50 65 163 569 3691 261 7 6901 478 184 616 0 348 1019 58 94 61 297 0 43 355 32 2923 388
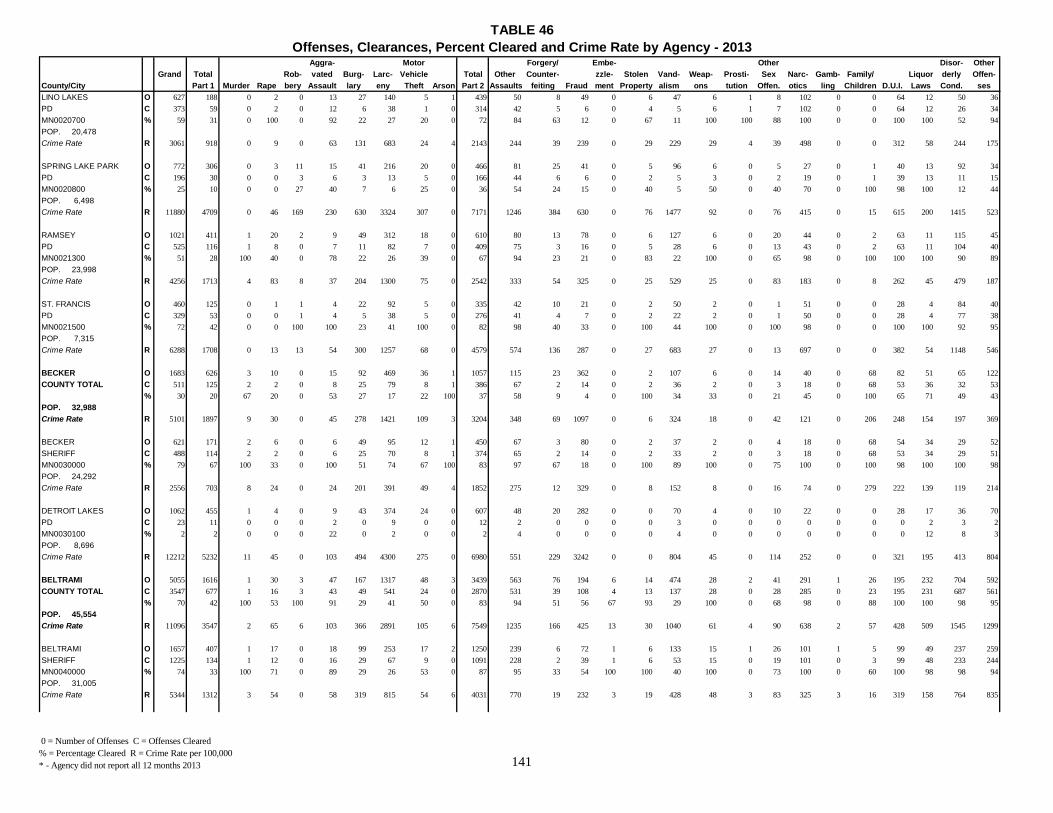
TABLE 46Offenses, Clearances, Percent Cleared and Crime Rate by Agency - 2013
0 = Number of Offenses C = Offenses Cleared % = Percentage Cleared R = Crime Rate per 100,000 * - Agency did not report all 12 months 2013 141
Aggra- Motor Forgery/ Embe- Other Disor- OtherGrand Total Rob- vated Burg- Larc- Vehicle Total Other Counter- zzle- Stolen Vand- Weap- Prosti- Sex Narc- Gamb- Family/ Liquor derly Offen-
County/City Part 1 Murder Rape bery Assault lary eny Theft Arson Part 2 Assaults feiting Fraud ment Property alism ons tution Offen. otics ling Children D.U.I. Laws Cond. sesLINO LAKES O 627 188 0 2 0 13 27 140 5 1 439 50 8 49 0 6 47 6 1 8 102 0 0 64 12 50 36PD C 373 59 0 2 0 12 6 38 1 0 314 42 5 6 0 4 5 6 1 7 102 0 0 64 12 26 34MN0020700 % 59 31 0 100 0 92 22 27 20 0 72 84 63 12 0 67 11 100 100 88 100 0 0 100 100 52 94POP. 20,478Crime Rate R 3061 918 0 9 0 63 131 683 24 4 2143 244 39 239 0 29 229 29 4 39 498 0 0 312 58 244 175
SPRING LAKE PARK O 772 306 0 3 11 15 41 216 20 0 466 81 25 41 0 5 96 6 0 5 27 0 1 40 13 92 34PD C 196 30 0 0 3 6 3 13 5 0 166 44 6 6 0 2 5 3 0 2 19 0 1 39 13 11 15MN0020800 % 25 10 0 0 27 40 7 6 25 0 36 54 24 15 0 40 5 50 0 40 70 0 100 98 100 12 44POP. 6,498Crime Rate R 11880 4709 0 46 169 230 630 3324 307 0 7171 1246 384 630 0 76 1477 92 0 76 415 0 15 615 200 1415 523
RAMSEY O 1021 411 1 20 2 9 49 312 18 0 610 80 13 78 0 6 127 6 0 20 44 0 2 63 11 115 45PD C 525 116 1 8 0 7 11 82 7 0 409 75 3 16 0 5 28 6 0 13 43 0 2 63 11 104 40MN0021300 % 51 28 100 40 0 78 22 26 39 0 67 94 23 21 0 83 22 100 0 65 98 0 100 100 100 90 89POP. 23,998Crime Rate R 4256 1713 4 83 8 37 204 1300 75 0 2542 333 54 325 0 25 529 25 0 83 183 0 8 262 45 479 187
ST. FRANCIS O 460 125 0 1 1 4 22 92 5 0 335 42 10 21 0 2 50 2 0 1 51 0 0 28 4 84 40PD C 329 53 0 0 1 4 5 38 5 0 276 41 4 7 0 2 22 2 0 1 50 0 0 28 4 77 38MN0021500 % 72 42 0 0 100 100 23 41 100 0 82 98 40 33 0 100 44 100 0 100 98 0 0 100 100 92 95POP. 7,315Crime Rate R 6288 1708 0 13 13 54 300 1257 68 0 4579 574 136 287 0 27 683 27 0 13 697 0 0 382 54 1148 546
BECKER O 1683 626 3 10 0 15 92 469 36 1 1057 115 23 362 0 2 107 6 0 14 40 0 68 82 51 65 122COUNTY TOTAL C 511 125 2 2 0 8 25 79 8 1 386 67 2 14 0 2 36 2 0 3 18 0 68 53 36 32 53
% 30 20 67 20 0 53 27 17 22 100 37 58 9 4 0 100 34 33 0 21 45 0 100 65 71 49 43POP. 32,988Crime Rate R 5101 1897 9 30 0 45 278 1421 109 3 3204 348 69 1097 0 6 324 18 0 42 121 0 206 248 154 197 369
BECKER O 621 171 2 6 0 6 49 95 12 1 450 67 3 80 0 2 37 2 0 4 18 0 68 54 34 29 52SHERIFF C 488 114 2 2 0 6 25 70 8 1 374 65 2 14 0 2 33 2 0 3 18 0 68 53 34 29 51MN0030000 % 79 67 100 33 0 100 51 74 67 100 83 97 67 18 0 100 89 100 0 75 100 0 100 98 100 100 98POP. 24,292Crime Rate R 2556 703 8 24 0 24 201 391 49 4 1852 275 12 329 0 8 152 8 0 16 74 0 279 222 139 119 214
DETROIT LAKES O 1062 455 1 4 0 9 43 374 24 0 607 48 20 282 0 0 70 4 0 10 22 0 0 28 17 36 70PD C 23 11 0 0 0 2 0 9 0 0 12 2 0 0 0 0 3 0 0 0 0 0 0 0 2 3 2MN0030100 % 2 2 0 0 0 22 0 2 0 0 2 4 0 0 0 0 4 0 0 0 0 0 0 0 12 8 3POP. 8,696Crime Rate R 12212 5232 11 45 0 103 494 4300 275 0 6980 551 229 3242 0 0 804 45 0 114 252 0 0 321 195 413 804
BELTRAMI O 5055 1616 1 30 3 47 167 1317 48 3 3439 563 76 194 6 14 474 28 2 41 291 1 26 195 232 704 592COUNTY TOTAL C 3547 677 1 16 3 43 49 541 24 0 2870 531 39 108 4 13 137 28 0 28 285 0 23 195 231 687 561
% 70 42 100 53 100 91 29 41 50 0 83 94 51 56 67 93 29 100 0 68 98 0 88 100 100 98 95POP. 45,554Crime Rate R 11096 3547 2 65 6 103 366 2891 105 6 7549 1235 166 425 13 30 1040 61 4 90 638 2 57 428 509 1545 1299
BELTRAMI O 1657 407 1 17 0 18 99 253 17 2 1250 239 6 72 1 6 133 15 1 26 101 1 5 99 49 237 259SHERIFF C 1225 134 1 12 0 16 29 67 9 0 1091 228 2 39 1 6 53 15 0 19 101 0 3 99 48 233 244MN0040000 % 74 33 100 71 0 89 29 26 53 0 87 95 33 54 100 100 40 100 0 73 100 0 60 100 98 98 94POP. 31,005Crime Rate R 5344 1312 3 54 0 58 319 815 54 6 4031 770 19 232 3 19 428 48 3 83 325 3 16 319 158 764 835
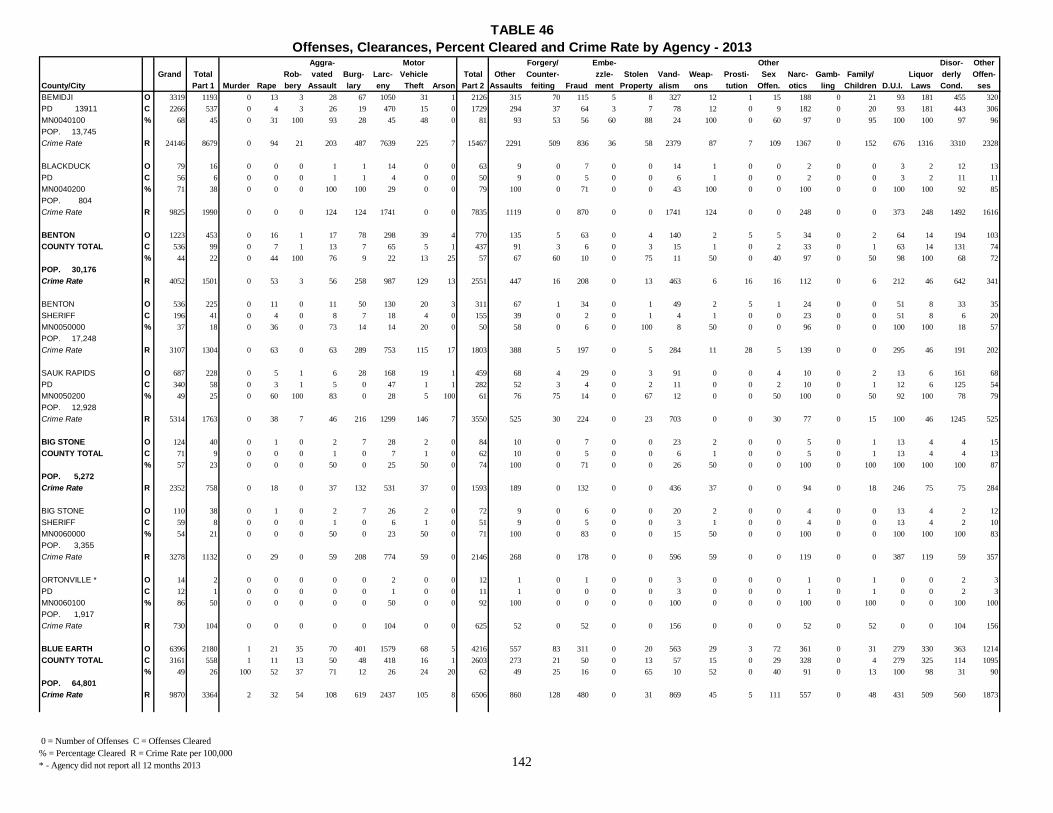
TABLE 46Offenses, Clearances, Percent Cleared and Crime Rate by Agency - 2013
0 = Number of Offenses C = Offenses Cleared % = Percentage Cleared R = Crime Rate per 100,000 * - Agency did not report all 12 months 2013 142
Aggra- Motor Forgery/ Embe- Other Disor- OtherGrand Total Rob- vated Burg- Larc- Vehicle Total Other Counter- zzle- Stolen Vand- Weap- Prosti- Sex Narc- Gamb- Family/ Liquor derly Offen-
County/City Part 1 Murder Rape bery Assault lary eny Theft Arson Part 2 Assaults feiting Fraud ment Property alism ons tution Offen. otics ling Children D.U.I. Laws Cond. sesBEMIDJI O 3319 1193 0 13 3 28 67 1050 31 1 2126 315 70 115 5 8 327 12 1 15 188 0 21 93 181 455 320PD 13911 C 2266 537 0 4 3 26 19 470 15 0 1729 294 37 64 3 7 78 12 0 9 182 0 20 93 181 443 306MN0040100 % 68 45 0 31 100 93 28 45 48 0 81 93 53 56 60 88 24 100 0 60 97 0 95 100 100 97 96POP. 13,745Crime Rate R 24146 8679 0 94 21 203 487 7639 225 7 15467 2291 509 836 36 58 2379 87 7 109 1367 0 152 676 1316 3310 2328
BLACKDUCK O 79 16 0 0 0 1 1 14 0 0 63 9 0 7 0 0 14 1 0 0 2 0 0 3 2 12 13PD C 56 6 0 0 0 1 1 4 0 0 50 9 0 5 0 0 6 1 0 0 2 0 0 3 2 11 11MN0040200 % 71 38 0 0 0 100 100 29 0 0 79 100 0 71 0 0 43 100 0 0 100 0 0 100 100 92 85POP. 804Crime Rate R 9825 1990 0 0 0 124 124 1741 0 0 7835 1119 0 870 0 0 1741 124 0 0 248 0 0 373 248 1492 1616
BENTON O 1223 453 0 16 1 17 78 298 39 4 770 135 5 63 0 4 140 2 5 5 34 0 2 64 14 194 103COUNTY TOTAL C 536 99 0 7 1 13 7 65 5 1 437 91 3 6 0 3 15 1 0 2 33 0 1 63 14 131 74
% 44 22 0 44 100 76 9 22 13 25 57 67 60 10 0 75 11 50 0 40 97 0 50 98 100 68 72POP. 30,176Crime Rate R 4052 1501 0 53 3 56 258 987 129 13 2551 447 16 208 0 13 463 6 16 16 112 0 6 212 46 642 341
BENTON O 536 225 0 11 0 11 50 130 20 3 311 67 1 34 0 1 49 2 5 1 24 0 0 51 8 33 35SHERIFF C 196 41 0 4 0 8 7 18 4 0 155 39 0 2 0 1 4 1 0 0 23 0 0 51 8 6 20MN0050000 % 37 18 0 36 0 73 14 14 20 0 50 58 0 6 0 100 8 50 0 0 96 0 0 100 100 18 57POP. 17,248Crime Rate R 3107 1304 0 63 0 63 289 753 115 17 1803 388 5 197 0 5 284 11 28 5 139 0 0 295 46 191 202
SAUK RAPIDS O 687 228 0 5 1 6 28 168 19 1 459 68 4 29 0 3 91 0 0 4 10 0 2 13 6 161 68PD C 340 58 0 3 1 5 0 47 1 1 282 52 3 4 0 2 11 0 0 2 10 0 1 12 6 125 54MN0050200 % 49 25 0 60 100 83 0 28 5 100 61 76 75 14 0 67 12 0 0 50 100 0 50 92 100 78 79POP. 12,928Crime Rate R 5314 1763 0 38 7 46 216 1299 146 7 3550 525 30 224 0 23 703 0 0 30 77 0 15 100 46 1245 525
BIG STONE O 124 40 0 1 0 2 7 28 2 0 84 10 0 7 0 0 23 2 0 0 5 0 1 13 4 4 15COUNTY TOTAL C 71 9 0 0 0 1 0 7 1 0 62 10 0 5 0 0 6 1 0 0 5 0 1 13 4 4 13
% 57 23 0 0 0 50 0 25 50 0 74 100 0 71 0 0 26 50 0 0 100 0 100 100 100 100 87POP. 5,272Crime Rate R 2352 758 0 18 0 37 132 531 37 0 1593 189 0 132 0 0 436 37 0 0 94 0 18 246 75 75 284
BIG STONE O 110 38 0 1 0 2 7 26 2 0 72 9 0 6 0 0 20 2 0 0 4 0 0 13 4 2 12SHERIFF C 59 8 0 0 0 1 0 6 1 0 51 9 0 5 0 0 3 1 0 0 4 0 0 13 4 2 10MN0060000 % 54 21 0 0 0 50 0 23 50 0 71 100 0 83 0 0 15 50 0 0 100 0 0 100 100 100 83POP. 3,355Crime Rate R 3278 1132 0 29 0 59 208 774 59 0 2146 268 0 178 0 0 596 59 0 0 119 0 0 387 119 59 357
ORTONVILLE * O 14 2 0 0 0 0 0 2 0 0 12 1 0 1 0 0 3 0 0 0 1 0 1 0 0 2 3PD C 12 1 0 0 0 0 0 1 0 0 11 1 0 0 0 0 3 0 0 0 1 0 1 0 0 2 3MN0060100 % 86 50 0 0 0 0 0 50 0 0 92 100 0 0 0 0 100 0 0 0 100 0 100 0 0 100 100POP. 1,917Crime Rate R 730 104 0 0 0 0 0 104 0 0 625 52 0 52 0 0 156 0 0 0 52 0 52 0 0 104 156
BLUE EARTH O 6396 2180 1 21 35 70 401 1579 68 5 4216 557 83 311 0 20 563 29 3 72 361 0 31 279 330 363 1214COUNTY TOTAL C 3161 558 1 11 13 50 48 418 16 1 2603 273 21 50 0 13 57 15 0 29 328 0 4 279 325 114 1095
% 49 26 100 52 37 71 12 26 24 20 62 49 25 16 0 65 10 52 0 40 91 0 13 100 98 31 90POP. 64,801Crime Rate R 9870 3364 2 32 54 108 619 2437 105 8 6506 860 128 480 0 31 869 45 5 111 557 0 48 431 509 560 1873

TABLE 46Offenses, Clearances, Percent Cleared and Crime Rate by Agency - 2013
0 = Number of Offenses C = Offenses Cleared % = Percentage Cleared R = Crime Rate per 100,000 * - Agency did not report all 12 months 2013 143
Aggra- Motor Forgery/ Embe- Other Disor- OtherGrand Total Rob- vated Burg- Larc- Vehicle Total Other Counter- zzle- Stolen Vand- Weap- Prosti- Sex Narc- Gamb- Family/ Liquor derly Offen-
County/City Part 1 Murder Rape bery Assault lary eny Theft Arson Part 2 Assaults feiting Fraud ment Property alism ons tution Offen. otics ling Children D.U.I. Laws Cond. sesBLUE EARTH O 1353 197 0 2 2 9 57 113 14 0 1156 37 5 30 0 9 32 2 0 6 45 0 2 88 25 15 860SHERIFF C 1050 27 0 2 2 7 8 6 2 0 1023 23 2 1 0 4 2 0 0 4 43 0 2 88 24 5 825MN0070000 % 78 14 0 100 100 78 14 5 14 0 88 62 40 3 0 44 6 0 0 67 96 0 100 100 96 33 96POP. 17,177Crime Rate R 7877 1147 0 12 12 52 332 658 82 0 6730 215 29 175 0 52 186 12 0 35 262 0 12 512 146 87 5007
MANKATO O 4688 1865 1 18 31 57 312 1395 46 5 2823 467 62 256 0 11 498 26 3 59 299 0 29 174 297 325 317PD C 1984 512 1 9 11 39 35 405 11 1 1472 220 19 46 0 9 53 14 0 22 272 0 2 174 294 99 248MN0070100 % 42 27 100 50 35 68 11 29 24 20 52 47 31 18 0 82 11 54 0 37 91 0 7 100 99 30 78POP. 39,782Crime Rate R 11784 4688 2 45 77 143 784 3506 115 12 7096 1173 155 643 0 27 1251 65 7 148 751 0 72 437 746 816 796
MAPLETON O 63 19 0 0 0 0 4 14 1 0 44 8 2 3 0 0 4 0 0 1 9 0 0 1 1 3 12PD C 32 4 0 0 0 0 2 1 1 0 28 6 0 2 0 0 0 0 0 1 6 0 0 1 1 2 9MN0070200 % 51 21 0 0 0 0 50 7 100 0 64 75 0 67 0 0 0 0 0 100 67 0 0 100 100 67 75POP. 1,777Crime Rate R 3545 1069 0 0 0 0 225 787 56 0 2476 450 112 168 0 0 225 0 0 56 506 0 0 56 56 168 675
EAGLE LAKE O 77 32 0 0 2 2 7 20 1 0 45 13 1 11 0 0 3 0 0 1 0 0 0 4 1 6 5PD C 22 4 0 0 0 2 1 1 0 0 18 8 0 0 0 0 0 0 0 0 0 0 0 4 1 2 3MN0070400 % 29 13 0 0 0 100 14 5 0 0 40 62 0 0 0 0 0 0 0 0 0 0 0 100 100 33 60POP. 2,453Crime Rate R 3139 1304 0 0 81 81 285 815 40 0 1834 529 40 448 0 0 122 0 0 40 0 0 0 163 40 244 203
LAKE CRYSTAL O 169 44 0 1 0 1 17 21 4 0 125 25 12 11 0 0 22 0 0 5 7 0 0 9 5 13 16PD C 56 8 0 0 0 1 1 4 2 0 48 13 0 1 0 0 1 0 0 2 6 0 0 9 4 5 7MN0070500 % 33 18 0 0 0 100 6 19 50 0 38 52 0 9 0 0 5 0 0 40 86 0 0 100 80 38 44POP. 2,582Crime Rate R 6545 1704 0 38 0 38 658 813 154 0 4841 968 464 426 0 0 852 0 0 193 271 0 0 348 193 503 619
MADISON LAKE O 46 23 0 0 0 1 4 16 2 0 23 7 1 0 0 0 4 1 0 0 1 0 0 3 1 1 4PD C 17 3 0 0 0 1 1 1 0 0 14 3 0 0 0 0 1 1 0 0 1 0 0 3 1 1 3MN0071000 % 37 13 0 0 0 100 25 6 0 0 61 43 0 0 0 0 25 100 0 0 100 0 0 100 100 100 75POP. 1,030
R 4466 2233 0 0 0 97 388 1553 194 0 2233 680 97 0 0 0 388 97 0 0 97 0 0 291 97 97 388
BROWN O 918 211 0 5 0 13 41 139 13 0 707 98 10 30 0 3 96 10 0 13 37 0 5 87 24 101 193COUNTY TOTAL C 630 58 0 5 0 12 6 32 3 0 572 98 5 7 0 3 18 10 0 10 37 0 4 81 24 94 181
% 69 27 0 100 0 92 15 23 23 0 81 100 50 23 0 100 19 100 0 77 100 0 80 93 100 93 94POP. 25,899Crime Rate R 3544 814 0 19 0 50 158 536 50 0 2729 378 38 115 0 11 370 38 0 50 142 0 19 335 92 389 745
BROWN O 44 6 0 0 0 0 0 6 0 0 38 5 0 1 0 0 3 1 0 5 0 0 0 17 0 0 6SHERIFF C 26 0 0 0 0 0 0 0 0 0 26 5 0 0 0 0 1 1 0 3 0 0 0 11 0 0 5MN0080000 % 59 0 0 0 0 0 0 0 0 0 68 100 0 0 0 0 33 100 0 60 0 0 0 65 0 0 83POP. 6,621Crime Rate R 664 90 0 0 0 0 0 90 0 0 573 75 0 15 0 0 45 15 0 75 0 0 0 256 0 0 90
NEW ULM O 829 200 0 4 0 11 41 131 13 0 629 79 10 27 0 2 91 7 0 8 37 0 5 64 23 96 180PD C 559 53 0 4 0 10 6 30 3 0 506 79 5 5 0 2 15 7 0 7 37 0 4 64 23 89 169MN0080100 % 67 27 0 100 0 91 15 23 23 0 80 100 50 19 0 100 16 100 0 88 100 0 80 100 100 93 94POP. 13,526Crime Rate R 6128 1478 0 29 0 81 303 968 96 0 4650 584 73 199 0 14 672 51 0 59 273 0 36 473 170 709 1330
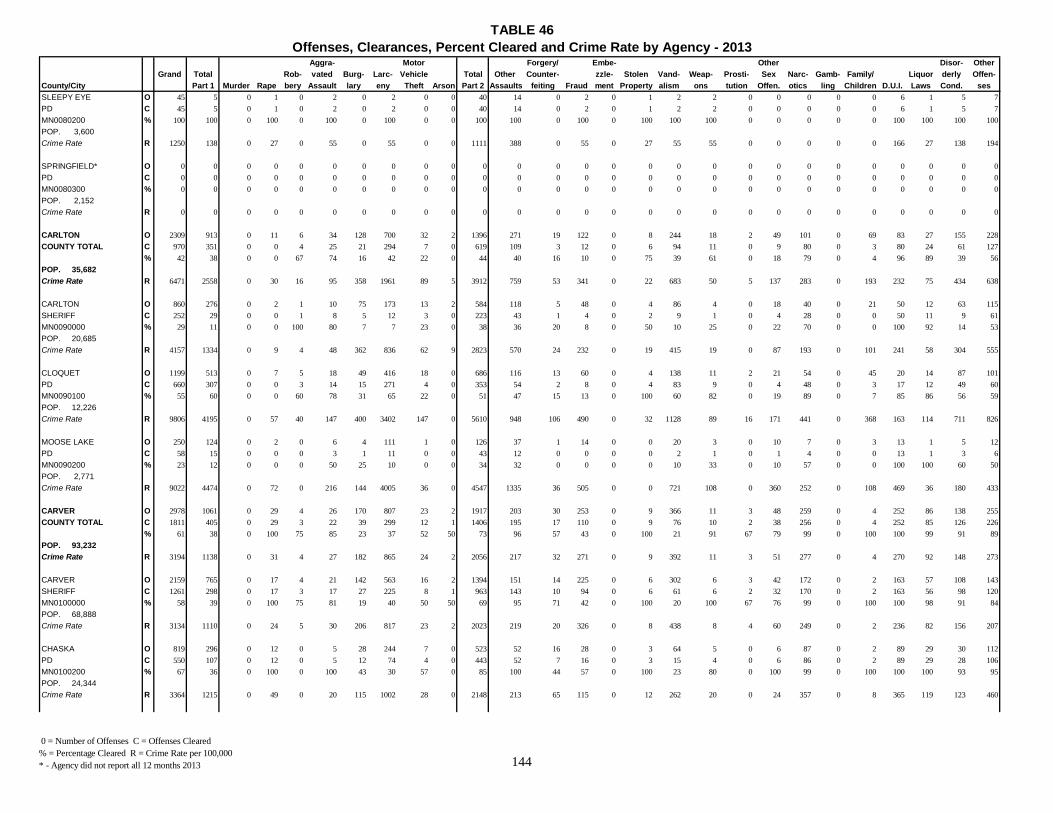
TABLE 46Offenses, Clearances, Percent Cleared and Crime Rate by Agency - 2013
0 = Number of Offenses C = Offenses Cleared % = Percentage Cleared R = Crime Rate per 100,000 * - Agency did not report all 12 months 2013 144
Aggra- Motor Forgery/ Embe- Other Disor- OtherGrand Total Rob- vated Burg- Larc- Vehicle Total Other Counter- zzle- Stolen Vand- Weap- Prosti- Sex Narc- Gamb- Family/ Liquor derly Offen-
County/City Part 1 Murder Rape bery Assault lary eny Theft Arson Part 2 Assaults feiting Fraud ment Property alism ons tution Offen. otics ling Children D.U.I. Laws Cond. sesSLEEPY EYE O 45 5 0 1 0 2 0 2 0 0 40 14 0 2 0 1 2 2 0 0 0 0 0 6 1 5 7PD C 45 5 0 1 0 2 0 2 0 0 40 14 0 2 0 1 2 2 0 0 0 0 0 6 1 5 7MN0080200 % 100 100 0 100 0 100 0 100 0 0 100 100 0 100 0 100 100 100 0 0 0 0 0 100 100 100 100POP. 3,600Crime Rate R 1250 138 0 27 0 55 0 55 0 0 1111 388 0 55 0 27 55 55 0 0 0 0 0 166 27 138 194
SPRINGFIELD* O 0 0 0 0 0 0 0 0 0 0 0 0 0 0 0 0 0 0 0 0 0 0 0 0 0 0 0PD C 0 0 0 0 0 0 0 0 0 0 0 0 0 0 0 0 0 0 0 0 0 0 0 0 0 0 0MN0080300 % 0 0 0 0 0 0 0 0 0 0 0 0 0 0 0 0 0 0 0 0 0 0 0 0 0 0 0POP. 2,152Crime Rate R 0 0 0 0 0 0 0 0 0 0 0 0 0 0 0 0 0 0 0 0 0 0 0 0 0 0 0
CARLTON O 2309 913 0 11 6 34 128 700 32 2 1396 271 19 122 0 8 244 18 2 49 101 0 69 83 27 155 228COUNTY TOTAL C 970 351 0 0 4 25 21 294 7 0 619 109 3 12 0 6 94 11 0 9 80 0 3 80 24 61 127
% 42 38 0 0 67 74 16 42 22 0 44 40 16 10 0 75 39 61 0 18 79 0 4 96 89 39 56POP. 35,682Crime Rate R 6471 2558 0 30 16 95 358 1961 89 5 3912 759 53 341 0 22 683 50 5 137 283 0 193 232 75 434 638
CARLTON O 860 276 0 2 1 10 75 173 13 2 584 118 5 48 0 4 86 4 0 18 40 0 21 50 12 63 115SHERIFF C 252 29 0 0 1 8 5 12 3 0 223 43 1 4 0 2 9 1 0 4 28 0 0 50 11 9 61MN0090000 % 29 11 0 0 100 80 7 7 23 0 38 36 20 8 0 50 10 25 0 22 70 0 0 100 92 14 53POP. 20,685Crime Rate R 4157 1334 0 9 4 48 362 836 62 9 2823 570 24 232 0 19 415 19 0 87 193 0 101 241 58 304 555
CLOQUET O 1199 513 0 7 5 18 49 416 18 0 686 116 13 60 0 4 138 11 2 21 54 0 45 20 14 87 101PD C 660 307 0 0 3 14 15 271 4 0 353 54 2 8 0 4 83 9 0 4 48 0 3 17 12 49 60MN0090100 % 55 60 0 0 60 78 31 65 22 0 51 47 15 13 0 100 60 82 0 19 89 0 7 85 86 56 59POP. 12,226Crime Rate R 9806 4195 0 57 40 147 400 3402 147 0 5610 948 106 490 0 32 1128 89 16 171 441 0 368 163 114 711 826
MOOSE LAKE O 250 124 0 2 0 6 4 111 1 0 126 37 1 14 0 0 20 3 0 10 7 0 3 13 1 5 12PD C 58 15 0 0 0 3 1 11 0 0 43 12 0 0 0 0 2 1 0 1 4 0 0 13 1 3 6MN0090200 % 23 12 0 0 0 50 25 10 0 0 34 32 0 0 0 0 10 33 0 10 57 0 0 100 100 60 50POP. 2,771Crime Rate R 9022 4474 0 72 0 216 144 4005 36 0 4547 1335 36 505 0 0 721 108 0 360 252 0 108 469 36 180 433
CARVER O 2978 1061 0 29 4 26 170 807 23 2 1917 203 30 253 0 9 366 11 3 48 259 0 4 252 86 138 255COUNTY TOTAL C 1811 405 0 29 3 22 39 299 12 1 1406 195 17 110 0 9 76 10 2 38 256 0 4 252 85 126 226
% 61 38 0 100 75 85 23 37 52 50 73 96 57 43 0 100 21 91 67 79 99 0 100 100 99 91 89POP. 93,232Crime Rate R 3194 1138 0 31 4 27 182 865 24 2 2056 217 32 271 0 9 392 11 3 51 277 0 4 270 92 148 273
CARVER O 2159 765 0 17 4 21 142 563 16 2 1394 151 14 225 0 6 302 6 3 42 172 0 2 163 57 108 143SHERIFF C 1261 298 0 17 3 17 27 225 8 1 963 143 10 94 0 6 61 6 2 32 170 0 2 163 56 98 120MN0100000 % 58 39 0 100 75 81 19 40 50 50 69 95 71 42 0 100 20 100 67 76 99 0 100 100 98 91 84POP. 68,888Crime Rate R 3134 1110 0 24 5 30 206 817 23 2 2023 219 20 326 0 8 438 8 4 60 249 0 2 236 82 156 207
CHASKA O 819 296 0 12 0 5 28 244 7 0 523 52 16 28 0 3 64 5 0 6 87 0 2 89 29 30 112PD C 550 107 0 12 0 5 12 74 4 0 443 52 7 16 0 3 15 4 0 6 86 0 2 89 29 28 106MN0100200 % 67 36 0 100 0 100 43 30 57 0 85 100 44 57 0 100 23 80 0 100 99 0 100 100 100 93 95POP. 24,344Crime Rate R 3364 1215 0 49 0 20 115 1002 28 0 2148 213 65 115 0 12 262 20 0 24 357 0 8 365 119 123 460

TABLE 46Offenses, Clearances, Percent Cleared and Crime Rate by Agency - 2013
0 = Number of Offenses C = Offenses Cleared % = Percentage Cleared R = Crime Rate per 100,000 * - Agency did not report all 12 months 2013 145
Aggra- Motor Forgery/ Embe- Other Disor- OtherGrand Total Rob- vated Burg- Larc- Vehicle Total Other Counter- zzle- Stolen Vand- Weap- Prosti- Sex Narc- Gamb- Family/ Liquor derly Offen-
County/City Part 1 Murder Rape bery Assault lary eny Theft Arson Part 2 Assaults feiting Fraud ment Property alism ons tution Offen. otics ling Children D.U.I. Laws Cond. sesCASS O 3965 1275 0 50 3 23 237 883 78 1 2690 313 3 215 0 12 256 18 0 8 113 0 120 153 79 997 403SHERIFF C 941 241 0 5 1 21 16 179 19 0 700 68 0 60 0 7 22 8 0 4 55 0 2 132 57 112 173MN0110000 % 24 19 0 10 33 91 7 20 24 0 26 22 0 28 0 58 9 44 0 50 49 0 2 86 72 11 43POP. 28,572Crime Rate R 13877 4462 0 174 10 80 829 3090 272 3 9414 1095 10 752 0 41 895 62 0 27 395 0 419 535 276 3489 1410
CHIPPEWA O 361 176 1 3 0 10 30 126 6 0 185 34 11 23 0 2 52 2 0 5 12 0 1 14 6 4 19COUNTY TOTAL C 208 74 0 1 0 9 13 47 4 0 134 28 9 15 0 2 25 1 0 1 11 0 1 13 6 4 18
% 58 42 0 33 0 90 43 37 67 0 72 82 82 65 0 100 48 50 0 20 92 0 100 93 100 100 95POP. 11,549Crime Rate R 3125 1523 8 25 0 86 259 1091 51 0 1601 294 95 199 0 17 450 17 0 43 103 0 8 121 51 34 164
CHIPPEWA O 66 34 0 1 0 3 3 26 1 0 32 4 0 6 0 0 13 0 0 1 3 0 0 4 0 0 1SHERIFF C 13 5 0 0 0 3 1 1 0 0 8 0 0 0 0 0 1 0 0 0 2 0 0 4 0 0 1MN0120000 % 20 15 0 0 0 100 33 4 0 0 25 0 0 0 0 0 8 0 0 0 67 0 0 100 0 0 100POP. 6,184Crime Rate R 1067 549 0 16 0 48 48 420 16 0 517 64 0 97 0 0 210 0 0 16 48 0 0 64 0 0 16
MONTEVIDEO O 295 142 1 2 0 7 27 100 5 0 153 30 11 17 0 2 39 2 0 4 9 0 1 10 6 4 18PD C 195 69 0 1 0 6 12 46 4 0 126 28 9 15 0 2 24 1 0 1 9 0 1 9 6 4 17MN0120200 % 66 49 0 50 0 86 44 46 80 0 82 93 82 88 0 100 62 50 0 25 100 0 100 90 100 100 94POP. 5,365Crime Rate R 5498 2646 18 37 0 130 503 1863 93 0 2851 559 205 316 0 37 726 37 0 74 167 0 18 186 111 74 335
CHISAGO O 2217 815 0 4 5 38 115 597 52 4 1402 148 27 97 1 15 143 17 1 42 181 0 45 182 86 177 240COUNTY TOTAL C 947 202 0 0 4 24 15 148 11 0 745 83 4 15 0 5 24 8 0 7 126 0 7 167 53 100 146
% 43 25 0 0 80 63 13 25 21 0 53 56 15 15 0 33 17 47 0 17 70 0 16 92 62 56 61POP. 54,262Crime Rate R 4085 1501 0 7 9 70 211 1100 95 7 2583 272 49 178 1 27 263 31 1 77 333 0 82 335 158 326 442
CHISAGO O 810 235 0 0 3 17 39 150 26 0 575 44 5 31 0 9 34 7 0 20 100 0 15 98 57 44 111SHERIFF C 362 69 0 0 2 12 8 41 6 0 293 23 0 4 0 4 12 2 0 4 54 0 3 85 30 16 56MN0130000 % 45 29 0 0 67 71 21 27 23 0 51 52 0 13 0 44 35 29 0 20 54 0 20 87 53 36 50POP. 26,746Crime Rate R 3028 878 0 0 11 63 145 560 97 0 2149 164 18 115 0 33 127 26 0 74 373 0 56 366 213 164 415
NORTH BRANCH O 665 356 0 1 1 11 47 282 10 4 309 44 11 20 0 4 47 6 0 16 16 0 24 15 10 70 26PD C 220 73 0 0 1 6 2 63 1 0 147 27 2 1 0 0 6 5 0 1 14 0 1 13 7 52 18MN0130500 % 33 21 0 0 100 55 4 22 10 0 48 61 18 5 0 0 13 83 0 6 88 0 4 87 70 74 69POP. 10,196Crime Rate R 6522 3491 0 9 9 107 460 2765 98 39 3030 431 107 196 0 39 460 58 0 156 156 0 235 147 98 686 255
WYOMING O 233 77 0 0 0 3 11 58 5 0 156 9 5 23 1 1 6 4 1 2 27 0 4 41 8 6 18PD C 133 23 0 0 0 2 2 18 1 0 110 7 2 4 0 0 2 1 0 1 22 0 2 41 7 5 16MN0130800 % 57 30 0 0 0 67 18 31 20 0 71 78 40 17 0 0 33 25 0 50 81 0 50 100 88 83 89POP. 7,847Crime Rate R 2969 981 0 0 0 38 140 739 63 0 1988 114 63 293 12 12 76 50 12 25 344 0 50 522 101 76 229
LAKES AREA O 509 147 0 3 1 7 18 107 11 0 362 51 6 23 0 1 56 0 0 4 38 0 2 28 11 57 85PD C 232 37 0 0 1 4 3 26 3 0 195 26 0 6 0 1 4 0 0 1 36 0 1 28 9 27 56MN0130900 % 46 25 0 0 100 57 17 24 27 0 54 51 0 26 0 100 7 0 0 25 95 0 50 100 82 47 66POP. 9,473Crime Rate R 5373 1551 0 31 10 73 190 1129 116 0 3821 538 63 242 0 10 591 0 0 42 401 0 21 295 116 601 897

TABLE 46Offenses, Clearances, Percent Cleared and Crime Rate by Agency - 2013
0 = Number of Offenses C = Offenses Cleared % = Percentage Cleared R = Crime Rate per 100,000 * - Agency did not report all 12 months 2013 146
Aggra- Motor Forgery/ Embe- Other Disor- OtherGrand Total Rob- vated Burg- Larc- Vehicle Total Other Counter- zzle- Stolen Vand- Weap- Prosti- Sex Narc- Gamb- Family/ Liquor derly Offen-
County/City Part 1 Murder Rape bery Assault lary eny Theft Arson Part 2 Assaults feiting Fraud ment Property alism ons tution Offen. otics ling Children D.U.I. Laws Cond. sesCLAY O 3618 1168 1 7 6 38 194 863 53 6 2450 345 47 189 0 4 318 13 0 45 163 0 59 339 142 371 415COUNTY TOTAL C 1809 369 0 2 2 21 18 316 9 1 1440 193 9 41 0 2 56 8 0 5 148 0 9 331 135 193 310
% 50 32 0 29 33 55 9 37 17 17 59 56 19 22 0 50 18 62 0 11 91 0 15 98 95 52 75POP. 60,187Crime Rate R 6011 1940 1 11 9 63 322 1433 88 9 4070 573 78 314 0 6 528 21 0 74 270 0 98 563 235 616 689
CLAY O 432 90 0 3 0 8 23 52 4 0 342 35 4 64 0 0 30 2 0 2 16 0 12 93 23 17 44SHERIFF C 254 20 0 2 0 4 3 9 2 0 234 27 3 31 0 0 3 1 0 0 16 0 4 91 23 7 28MN0140000 % 59 22 0 67 0 50 13 17 50 0 68 77 75 48 0 0 10 50 0 0 100 0 33 98 100 41 64POP. 17,266Crime Rate R 2502 521 0 17 0 46 133 301 23 0 1980 202 23 370 0 0 173 11 0 11 92 0 69 538 133 98 254
DILWORTH O 448 187 0 1 0 2 13 166 5 0 261 40 8 21 0 1 53 1 0 2 13 0 5 21 2 54 40PD C 324 129 0 0 0 2 4 119 4 0 195 30 5 8 0 0 33 0 0 2 12 0 2 21 2 49 31MN0140200 % 72 69 0 0 0 100 31 72 80 0 75 75 63 38 0 0 62 0 0 100 92 0 40 100 100 91 78POP. 4,108Crime Rate R 10905 4552 0 24 0 48 316 4040 121 0 6353 973 194 511 0 24 1290 24 0 48 316 0 121 511 48 1314 973
MOORHEAD O 2738 891 1 3 6 28 158 645 44 6 1847 270 35 104 0 3 235 10 0 41 134 0 42 225 117 300 331PD C 1231 220 0 0 2 15 11 188 3 1 1011 136 1 2 0 2 20 7 0 3 120 0 3 219 110 137 251MN0140400 % 45 25 0 0 33 54 7 29 7 17 55 50 3 2 0 67 9 70 0 7 90 0 7 97 94 46 76POP. 38,813Crime Rate R 7054 2295 2 7 15 72 407 1661 113 15 4758 695 90 267 0 7 605 25 0 105 345 0 108 579 301 772 852
CLEARWATER O 524 125 1 6 0 18 36 59 5 0 399 71 3 32 0 2 64 1 0 6 15 0 70 27 5 28 75SHERIFF C 353 39 1 2 0 13 5 15 3 0 314 64 1 29 0 1 13 1 0 3 15 0 60 27 5 26 69MN0150000 % 67 31 100 33 0 72 14 25 60 0 79 90 33 91 0 50 20 100 0 50 100 0 86 100 100 93 92POP. 8,830Crime Rate R 5934 1415 11 67 0 203 407 668 56 0 4518 804 33 362 0 22 724 11 0 67 169 0 792 305 56 317 849
COOK O 432 163 0 0 0 4 9 148 2 0 269 27 7 17 0 0 32 7 0 10 34 0 5 41 13 21 55SHERIFF C 116 13 0 0 0 4 1 7 1 0 103 6 2 0 0 0 1 1 0 2 23 0 1 30 9 2 26MN0160000 % 27 8 0 0 0 100 11 5 50 0 38 22 29 0 0 0 3 14 0 20 68 0 20 73 69 10 47POP. 5,251Crime Rate R 8227 3104 0 0 0 76 171 2818 38 0 5122 514 133 323 0 0 609 133 0 190 647 0 95 780 247 399 1047
COTTONWOOD O 654 133 0 4 1 8 25 86 9 0 521 56 7 39 0 1 63 5 2 12 13 1 2 40 12 179 89COUNTY TOTAL C 446 43 0 1 1 7 9 23 2 0 403 52 5 20 0 1 16 4 1 8 13 0 1 39 12 164 67
% 68 32 0 25 100 88 36 27 22 0 77 93 71 51 0 100 25 80 50 67 100 0 50 98 100 92 75POP. 11,761Crime Rate R 5560 1130 0 34 8 68 212 731 76 0 4429 476 59 331 0 8 535 42 17 102 110 8 17 340 102 1521 756
COTTONWOOD O 150 47 0 2 0 3 10 30 2 0 103 15 1 6 0 0 15 1 0 4 3 0 0 10 4 16 28SHERIFF C 74 12 0 1 0 3 2 5 1 0 62 12 1 3 0 0 2 1 0 3 3 0 0 9 4 9 15MN0170000 % 49 26 0 50 0 100 20 17 50 0 60 80 100 50 0 0 13 100 0 75 100 0 0 90 100 56 54POP. 4,968Crime Rate R 3019 946 0 40 0 60 201 603 40 0 2073 301 20 120 0 0 301 20 0 80 60 0 0 201 80 322 563
MOUNTAIN LAKE O 69 10 0 0 1 2 3 4 0 0 59 16 0 3 0 0 2 0 0 0 2 0 1 1 2 29 3PD C 69 10 0 0 1 2 3 4 0 0 59 16 0 3 0 0 2 0 0 0 2 0 1 1 2 29 3MN0170100 % 100 100 0 0 100 100 100 100 0 0 100 100 0 100 0 0 100 0 0 0 100 0 100 100 100 100 100POP. 2,117Crime Rate R 3259 472 0 0 47 94 141 188 0 0 2786 755 0 141 0 0 94 0 0 0 94 0 47 47 94 1369 141

TABLE 46Offenses, Clearances, Percent Cleared and Crime Rate by Agency - 2013
0 = Number of Offenses C = Offenses Cleared % = Percentage Cleared R = Crime Rate per 100,000 * - Agency did not report all 12 months 2013 147
Aggra- Motor Forgery/ Embe- Other Disor- OtherGrand Total Rob- vated Burg- Larc- Vehicle Total Other Counter- zzle- Stolen Vand- Weap- Prosti- Sex Narc- Gamb- Family/ Liquor derly Offen-
County/City Part 1 Murder Rape bery Assault lary eny Theft Arson Part 2 Assaults feiting Fraud ment Property alism ons tution Offen. otics ling Children D.U.I. Laws Cond. sesWINDOM O 435 76 0 2 0 3 12 52 7 0 359 25 6 30 0 1 46 4 2 8 8 1 1 29 6 134 58PD C 303 21 0 0 0 2 4 14 1 0 282 24 4 14 0 1 12 3 1 5 8 0 0 29 6 126 49MN0170200 % 70 28 0 0 0 67 33 27 14 0 79 96 67 47 0 100 26 75 50 63 100 0 0 100 100 94 84POP. 4,676Crime Rate R 9302 1625 0 42 0 64 256 1112 149 0 7677 534 128 641 0 21 983 85 42 171 171 21 21 620 128 2865 1240
CROW WING O 4345 1804 0 23 6 63 357 1283 55 17 2541 423 27 153 0 29 455 18 1 67 282 0 16 200 70 318 482COUNTY TOTAL C 2121 544 0 6 3 49 42 431 12 1 1577 249 6 56 0 16 97 15 0 25 258 0 5 200 67 222 361
% 49 30 0 26 50 78 12 34 22 6 62 59 22 37 0 55 21 83 0 37 91 0 31 100 96 70 75POP. 63,166Crime Rate R 6878 2855 0 36 9 99 565 2031 87 26 4022 669 42 242 0 45 720 28 1 106 446 0 25 316 110 503 763
CROW WING O 1114 549 0 6 1 19 233 261 29 0 565 90 3 13 0 15 129 7 0 15 65 0 3 55 16 32 122SHERIFF C 451 80 0 2 1 16 22 32 7 0 371 60 2 5 0 10 42 5 0 3 57 0 1 55 16 28 87MN0180000 % 40 15 0 33 100 84 9 12 24 0 66 67 67 38 0 67 33 71 0 20 88 0 33 100 100 88 71POP. 39,331Crime Rate R 2832 1395 0 15 2 48 592 663 73 0 1436 228 7 33 0 38 327 17 0 38 165 0 7 139 40 81 310
BRAINERD O 2419 822 0 16 5 34 105 622 23 17 1597 293 16 79 0 13 259 8 1 48 143 0 12 90 42 261 332PD C 1098 182 0 3 2 24 17 132 3 1 916 152 2 14 0 5 39 7 0 18 128 0 3 90 39 172 247MN0180100 % 45 22 0 19 40 71 16 21 13 6 57 52 13 18 0 38 15 88 0 38 90 0 25 100 93 66 74POP. 13,734Crime Rate R 17613 5985 0 116 36 247 764 4528 167 123 11628 2133 116 575 0 94 1885 58 7 349 1041 0 87 655 305 1900 2417
CROSBY O 71 23 0 1 0 2 6 12 2 0 48 12 0 0 0 0 8 0 0 0 5 0 0 11 0 5 7PD C 47 7 0 1 0 1 2 2 1 0 40 11 0 0 0 0 2 0 0 0 5 0 0 11 0 5 6MN0180200 % 66 30 0 100 0 50 33 17 50 0 83 92 0 0 0 0 25 0 0 0 100 0 0 100 0 100 86POP. 2,410Crime Rate R 2946 954 0 41 0 82 248 497 82 0 1991 497 0 0 0 0 331 0 0 0 207 0 0 456 0 207 290
BAXTER O 741 410 0 0 0 8 13 388 1 0 331 28 8 61 0 1 59 3 0 4 69 0 1 44 12 20 21PD C 525 275 0 0 0 8 1 265 1 0 250 26 2 37 0 1 14 3 0 4 68 0 1 44 12 17 21MN0180500 % 71 67 0 0 0 100 8 68 100 0 76 93 25 61 0 100 24 100 0 100 99 0 100 100 100 85 100POP. 7,691Crime Rate R 9634 5330 0 0 0 104 169 5044 13 0 4303 364 104 793 0 13 767 39 0 52 897 0 13 572 156 260 273
DAKOTA O 20482 9319 8 68 108 374 1063 7280 355 63 11163 1362 300 1554 2 99 2041 115 16 298 1341 2 91 1352 256 1172 1162COUNTY TOTAL C 11743 4306 4 52 59 323 389 3228 201 50 7437 1086 174 562 2 81 694 80 11 163 1212 1 72 1283 249 821 946
% 57 46 44 76 55 86 37 44 57 79 67 80 58 36 100 82 34 70 69 55 90 50 79 95 97 70 81POP. 403,420Crime Rate R 5077 2310 2 16 26 92 263 1804 87 15 2767 337 74 385 0 24 505 28 3 73 332 0 22 335 63 290 288
DAKOTA O 905 221 0 3 1 37 60 114 6 0 684 70 5 143 0 10 72 1 1 10 79 0 7 150 9 42 85SHERIFF C 768 181 0 2 1 34 49 92 3 0 587 64 3 101 0 10 54 1 1 7 76 0 7 150 9 35 69MN0190000 % 85 82 0 67 100 92 82 81 50 0 86 91 60 71 0 100 75 100 100 70 96 0 100 100 100 83 81POP. 18,346Crime Rate R 4932 1204 0 16 5 201 327 621 32 0 3728 381 27 779 0 54 392 5 5 54 430 0 38 817 49 228 463
BURNSVILLE O 3720 1969 3 4 27 61 216 1576 80 2 1751 210 26 302 0 22 358 29 5 63 145 1 3 150 34 210 193PD C 1000 470 1 3 8 33 14 407 4 0 530 97 6 22 0 11 18 12 3 8 85 0 3 93 30 34 108MN0190100 % 27 24 33 75 30 54 6 26 5 0 30 46 23 7 0 50 5 41 60 13 59 0 100 62 88 16 56POP. 61,218Crime Rate R 6076 3216 4 6 44 99 352 2574 130 3 2860 343 42 493 0 35 584 47 8 102 236 1 4 245 55 343 315

TABLE 46Offenses, Clearances, Percent Cleared and Crime Rate by Agency - 2013
0 = Number of Offenses C = Offenses Cleared % = Percentage Cleared R = Crime Rate per 100,000 * - Agency did not report all 12 months 2013 148
Aggra- Motor Forgery/ Embe- Other Disor- OtherGrand Total Rob- vated Burg- Larc- Vehicle Total Other Counter- zzle- Stolen Vand- Weap- Prosti- Sex Narc- Gamb- Family/ Liquor derly Offen-
County/City Part 1 Murder Rape bery Assault lary eny Theft Arson Part 2 Assaults feiting Fraud ment Property alism ons tution Offen. otics ling Children D.U.I. Laws Cond. sesFARMINGTON O 589 211 0 0 2 14 33 154 5 3 378 53 4 49 0 2 61 2 0 8 52 0 7 62 13 28 37PD C 279 34 0 0 1 11 5 17 0 0 245 39 0 6 0 2 8 2 0 4 47 0 5 62 13 24 33MN0190200 % 47 16 0 0 50 79 15 11 0 0 65 74 0 12 0 100 13 100 0 50 90 0 71 100 100 86 89POP. 21,403Crime Rate R 2751 985 0 0 9 65 154 719 23 14 1766 247 18 228 0 9 285 9 0 37 242 0 32 289 60 130 172
HASTINGS O 1188 543 0 10 5 17 57 428 22 4 645 98 19 78 0 7 142 2 0 25 67 0 4 81 12 32 78PD C 550 161 0 5 1 14 6 127 6 2 389 81 6 5 0 7 34 2 0 12 59 0 3 78 11 29 62MN0190300 % 46 30 0 50 20 82 11 30 27 50 60 83 32 6 0 100 24 100 0 48 88 0 75 96 92 91 79POP. 22,502Crime Rate R 5279 2413 0 44 22 75 253 1902 97 17 2866 435 84 346 0 31 631 8 0 111 297 0 17 359 53 142 346
MENDOTA HEIGHTS O 536 295 0 1 2 6 33 249 3 1 241 24 6 40 0 2 34 3 2 4 47 0 0 35 11 13 20PD C 241 69 0 1 1 4 5 56 1 1 172 19 4 13 0 2 5 3 2 3 47 0 0 35 9 12 18MN0190400 % 45 23 0 100 50 67 15 22 33 100 71 79 67 33 0 100 15 100 100 75 100 0 0 100 82 92 90POP. 11,240Crime Rate R 4768 2624 0 8 17 53 293 2215 26 8 2144 213 53 355 0 17 302 26 17 35 418 0 0 311 97 115 177
ROSEMOUNT O 822 252 2 2 0 5 38 199 6 0 570 65 1 75 0 3 125 9 1 12 78 0 0 94 13 43 51PD C 452 72 0 2 0 4 7 56 3 0 380 56 0 28 0 3 20 7 1 4 74 0 0 92 13 40 42MN0190500 % 55 28 0 100 0 80 18 28 50 0 67 86 0 37 0 100 16 78 100 33 95 0 0 98 100 93 82POP. 22,206Crime Rate R 3702 1135 9 9 0 22 171 896 27 0 2566 292 4 337 0 13 562 40 4 54 351 0 0 423 58 193 229
SOUTH ST. PAUL O 1421 651 0 15 9 64 88 378 56 41 770 90 37 119 0 4 192 9 1 25 104 1 17 41 20 29 81PD C 1414 649 0 14 9 64 88 377 56 41 765 90 37 118 0 4 191 9 1 24 102 1 17 41 20 29 81MN0190600 % 100 100 0 93 100 100 100 100 100 100 99 100 100 99 0 100 99 100 100 96 98 100 100 100 100 100 100POP. 20,465Crime Rate R 6943 3181 0 73 43 312 430 1847 273 200 3762 439 180 581 0 19 938 43 4 122 508 4 83 200 97 141 395
WEST ST. PAUL O 1765 1049 1 11 16 56 63 856 43 3 716 71 75 104 0 10 132 2 0 19 74 0 6 81 20 41 81PD C 1342 783 1 8 11 53 41 635 33 1 559 57 51 58 0 9 87 1 0 16 69 0 5 77 20 40 69MN0190700 % 76 75 100 73 69 95 65 74 77 33 78 80 68 56 0 90 66 50 0 84 93 0 83 95 100 98 85POP. 19,834Crime Rate R 8898 5288 5 55 80 282 317 4315 216 15 3609 357 378 524 0 50 665 10 0 95 373 0 30 408 100 206 408
EAGAN O 2903 1328 0 2 14 21 163 1087 37 4 1575 249 48 139 1 12 266 11 4 46 249 0 20 176 43 133 178PD C 1471 378 0 2 6 16 31 305 17 1 1093 217 23 29 1 10 46 9 2 24 240 0 16 175 43 99 159MN0190800 % 51 28 0 100 43 76 19 28 46 25 69 87 48 21 100 83 17 82 50 52 96 0 80 99 100 74 89POP. 65,180Crime Rate R 4453 2037 0 3 21 32 250 1667 56 6 2416 382 73 213 1 18 408 16 6 70 382 0 30 270 65 204 273
INVER GROVE HEIGHTS O 1844 847 0 8 9 66 96 614 51 3 997 89 24 122 0 18 173 9 2 9 94 0 15 184 17 124 117PD C 1816 835 0 7 9 66 95 604 51 3 981 88 24 119 0 17 170 9 1 7 94 0 15 184 17 120 116MN0190900 % 98 99 0 88 100 100 99 98 100 100 98 99 100 98 0 94 98 100 50 78 100 0 100 100 100 97 99POP. 34,394Crime Rate R 5361 2462 0 23 26 191 279 1785 148 8 2898 258 69 354 0 52 502 26 5 26 273 0 43 534 49 360 340
APPLE VALLEY O 2970 1214 2 11 18 18 106 1031 26 2 1756 235 36 181 1 5 269 28 0 49 190 0 2 120 39 432 169PD C 1541 418 2 7 10 16 22 341 19 1 1123 181 14 35 1 3 41 16 0 34 180 0 1 120 39 323 135MN0191000 % 52 34 100 64 56 89 21 33 73 50 64 77 39 19 100 60 15 57 0 69 95 0 50 100 100 75 80POP. 49,827Crime Rate R 5960 2436 4 22 36 36 212 2069 52 4 3524 471 72 363 2 10 539 56 0 98 381 0 4 240 78 866 339
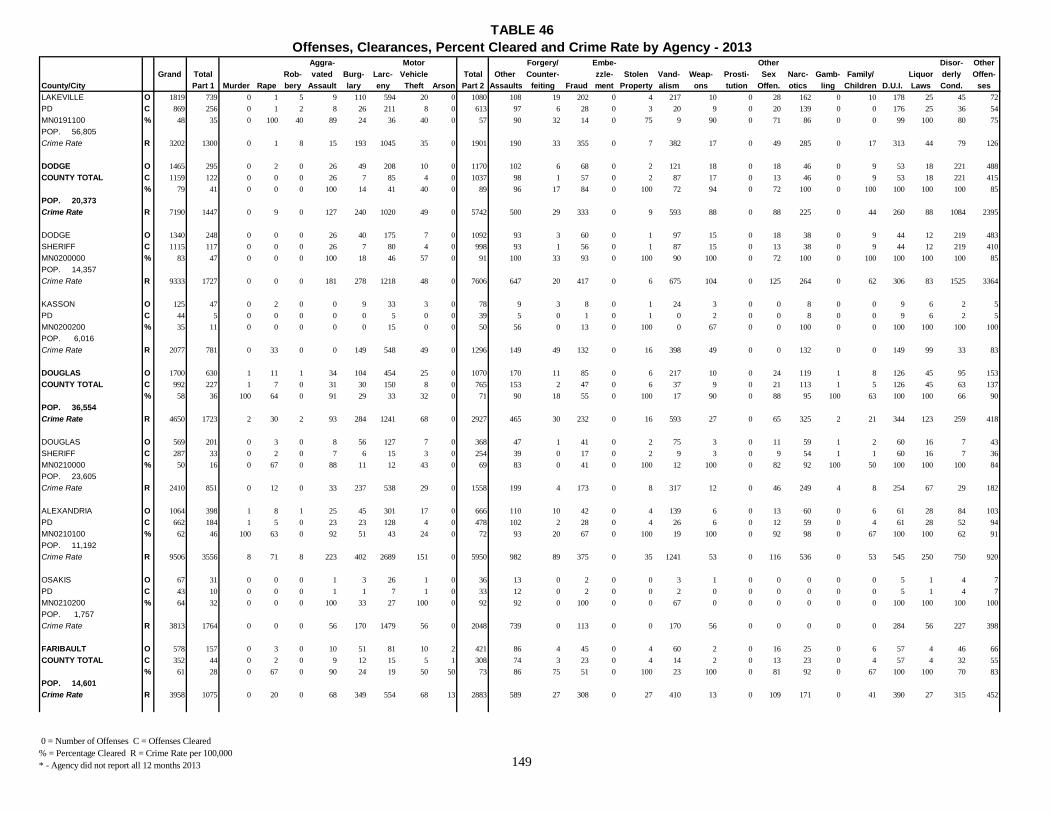
TABLE 46Offenses, Clearances, Percent Cleared and Crime Rate by Agency - 2013
0 = Number of Offenses C = Offenses Cleared % = Percentage Cleared R = Crime Rate per 100,000 * - Agency did not report all 12 months 2013 149
Aggra- Motor Forgery/ Embe- Other Disor- OtherGrand Total Rob- vated Burg- Larc- Vehicle Total Other Counter- zzle- Stolen Vand- Weap- Prosti- Sex Narc- Gamb- Family/ Liquor derly Offen-
County/City Part 1 Murder Rape bery Assault lary eny Theft Arson Part 2 Assaults feiting Fraud ment Property alism ons tution Offen. otics ling Children D.U.I. Laws Cond. sesLAKEVILLE O 1819 739 0 1 5 9 110 594 20 0 1080 108 19 202 0 4 217 10 0 28 162 0 10 178 25 45 72PD C 869 256 0 1 2 8 26 211 8 0 613 97 6 28 0 3 20 9 0 20 139 0 0 176 25 36 54MN0191100 % 48 35 0 100 40 89 24 36 40 0 57 90 32 14 0 75 9 90 0 71 86 0 0 99 100 80 75POP. 56,805Crime Rate R 3202 1300 0 1 8 15 193 1045 35 0 1901 190 33 355 0 7 382 17 0 49 285 0 17 313 44 79 126
DODGE O 1465 295 0 2 0 26 49 208 10 0 1170 102 6 68 0 2 121 18 0 18 46 0 9 53 18 221 488COUNTY TOTAL C 1159 122 0 0 0 26 7 85 4 0 1037 98 1 57 0 2 87 17 0 13 46 0 9 53 18 221 415
% 79 41 0 0 0 100 14 41 40 0 89 96 17 84 0 100 72 94 0 72 100 0 100 100 100 100 85POP. 20,373Crime Rate R 7190 1447 0 9 0 127 240 1020 49 0 5742 500 29 333 0 9 593 88 0 88 225 0 44 260 88 1084 2395
DODGE O 1340 248 0 0 0 26 40 175 7 0 1092 93 3 60 0 1 97 15 0 18 38 0 9 44 12 219 483SHERIFF C 1115 117 0 0 0 26 7 80 4 0 998 93 1 56 0 1 87 15 0 13 38 0 9 44 12 219 410MN0200000 % 83 47 0 0 0 100 18 46 57 0 91 100 33 93 0 100 90 100 0 72 100 0 100 100 100 100 85POP. 14,357Crime Rate R 9333 1727 0 0 0 181 278 1218 48 0 7606 647 20 417 0 6 675 104 0 125 264 0 62 306 83 1525 3364
KASSON O 125 47 0 2 0 0 9 33 3 0 78 9 3 8 0 1 24 3 0 0 8 0 0 9 6 2 5PD C 44 5 0 0 0 0 0 5 0 0 39 5 0 1 0 1 0 2 0 0 8 0 0 9 6 2 5MN0200200 % 35 11 0 0 0 0 0 15 0 0 50 56 0 13 0 100 0 67 0 0 100 0 0 100 100 100 100POP. 6,016Crime Rate R 2077 781 0 33 0 0 149 548 49 0 1296 149 49 132 0 16 398 49 0 0 132 0 0 149 99 33 83
DOUGLAS O 1700 630 1 11 1 34 104 454 25 0 1070 170 11 85 0 6 217 10 0 24 119 1 8 126 45 95 153COUNTY TOTAL C 992 227 1 7 0 31 30 150 8 0 765 153 2 47 0 6 37 9 0 21 113 1 5 126 45 63 137
% 58 36 100 64 0 91 29 33 32 0 71 90 18 55 0 100 17 90 0 88 95 100 63 100 100 66 90POP. 36,554Crime Rate R 4650 1723 2 30 2 93 284 1241 68 0 2927 465 30 232 0 16 593 27 0 65 325 2 21 344 123 259 418
DOUGLAS O 569 201 0 3 0 8 56 127 7 0 368 47 1 41 0 2 75 3 0 11 59 1 2 60 16 7 43SHERIFF C 287 33 0 2 0 7 6 15 3 0 254 39 0 17 0 2 9 3 0 9 54 1 1 60 16 7 36MN0210000 % 50 16 0 67 0 88 11 12 43 0 69 83 0 41 0 100 12 100 0 82 92 100 50 100 100 100 84POP. 23,605Crime Rate R 2410 851 0 12 0 33 237 538 29 0 1558 199 4 173 0 8 317 12 0 46 249 4 8 254 67 29 182
ALEXANDRIA O 1064 398 1 8 1 25 45 301 17 0 666 110 10 42 0 4 139 6 0 13 60 0 6 61 28 84 103PD C 662 184 1 5 0 23 23 128 4 0 478 102 2 28 0 4 26 6 0 12 59 0 4 61 28 52 94MN0210100 % 62 46 100 63 0 92 51 43 24 0 72 93 20 67 0 100 19 100 0 92 98 0 67 100 100 62 91POP. 11,192Crime Rate R 9506 3556 8 71 8 223 402 2689 151 0 5950 982 89 375 0 35 1241 53 0 116 536 0 53 545 250 750 920
OSAKIS O 67 31 0 0 0 1 3 26 1 0 36 13 0 2 0 0 3 1 0 0 0 0 0 5 1 4 7PD C 43 10 0 0 0 1 1 7 1 0 33 12 0 2 0 0 2 0 0 0 0 0 0 5 1 4 7MN0210200 % 64 32 0 0 0 100 33 27 100 0 92 92 0 100 0 0 67 0 0 0 0 0 0 100 100 100 100POP. 1,757Crime Rate R 3813 1764 0 0 0 56 170 1479 56 0 2048 739 0 113 0 0 170 56 0 0 0 0 0 284 56 227 398
FARIBAULT O 578 157 0 3 0 10 51 81 10 2 421 86 4 45 0 4 60 2 0 16 25 0 6 57 4 46 66COUNTY TOTAL C 352 44 0 2 0 9 12 15 5 1 308 74 3 23 0 4 14 2 0 13 23 0 4 57 4 32 55
% 61 28 0 67 0 90 24 19 50 50 73 86 75 51 0 100 23 100 0 81 92 0 67 100 100 70 83POP. 14,601Crime Rate R 3958 1075 0 20 0 68 349 554 68 13 2883 589 27 308 0 27 410 13 0 109 171 0 41 390 27 315 452

TABLE 46Offenses, Clearances, Percent Cleared and Crime Rate by Agency - 2013
0 = Number of Offenses C = Offenses Cleared % = Percentage Cleared R = Crime Rate per 100,000 * - Agency did not report all 12 months 2013 150
Aggra- Motor Forgery/ Embe- Other Disor- OtherGrand Total Rob- vated Burg- Larc- Vehicle Total Other Counter- zzle- Stolen Vand- Weap- Prosti- Sex Narc- Gamb- Family/ Liquor derly Offen-
County/City Part 1 Murder Rape bery Assault lary eny Theft Arson Part 2 Assaults feiting Fraud ment Property alism ons tution Offen. otics ling Children D.U.I. Laws Cond. sesFARIBAULT O 192 58 0 0 0 2 25 25 5 1 134 25 2 24 0 1 16 0 0 7 5 0 4 16 0 13 21SHERIFF C 101 10 0 0 0 1 1 4 3 1 91 18 1 12 0 1 3 0 0 6 5 0 3 16 0 8 18MN0220000 % 53 17 0 0 0 50 4 16 60 100 68 72 50 50 0 100 19 0 0 86 100 0 75 100 0 62 86POP. 6,777Crime Rate R 2833 855 0 0 0 29 368 368 73 14 1977 368 29 354 0 14 236 0 0 103 73 0 59 236 0 191 309
BLUE EARTH O 194 38 0 0 0 1 7 26 3 1 156 26 0 13 0 1 27 1 0 0 14 0 0 30 4 11 29PD C 131 14 0 0 0 1 3 8 2 0 117 24 0 8 0 1 6 1 0 0 12 0 0 30 4 10 21MN0220100 % 68 37 0 0 0 100 43 31 67 0 75 92 0 62 0 100 22 100 0 0 86 0 0 100 100 91 72POP. 3,365Crime Rate R 5765 1129 0 0 0 29 208 772 89 29 4635 772 0 386 0 29 802 29 0 0 416 0 0 891 118 326 861
ELMORE O 47 17 0 3 0 5 7 2 0 0 30 9 1 2 0 1 4 0 0 1 1 0 0 0 0 9 2PD C 33 9 0 2 0 5 2 0 0 0 24 8 1 1 0 1 2 0 0 1 1 0 0 0 0 7 2MN0220200 % 70 53 0 67 0 100 29 0 0 0 80 89 100 50 0 100 50 0 0 100 100 0 0 0 0 78 100POP. 666Crime Rate R 7057 2552 0 450 0 750 1051 300 0 0 4504 1351 150 300 0 150 600 0 0 150 150 0 0 0 0 1351 300
WELLS O 64 24 0 0 0 0 7 17 0 0 40 11 0 2 0 0 7 1 0 4 0 0 0 8 0 3 4PD C 37 6 0 0 0 0 4 2 0 0 31 10 0 1 0 0 3 1 0 4 0 0 0 8 0 0 4MN0220400 % 58 25 0 0 0 0 57 12 0 0 78 91 0 50 0 0 43 100 0 100 0 0 0 100 0 0 100POP. 2,351Crime Rate R 2722 1020 0 0 0 0 297 723 0 0 1701 467 0 85 0 0 297 42 0 170 0 0 0 340 0 127 170
WINNEBAGO O 81 20 0 0 0 2 5 11 2 0 61 15 1 4 0 1 6 0 0 4 5 0 2 3 0 10 10PD C 50 5 0 0 0 2 2 1 0 0 45 14 1 1 0 1 0 0 0 2 5 0 1 3 0 7 10MN0220500 % 62 25 0 0 0 100 40 9 0 0 74 93 100 25 0 100 0 0 0 50 100 0 50 100 0 70 100POP. 1,442Crime Rate R 5617 1386 0 0 0 138 346 762 138 0 4230 1040 69 277 0 69 416 0 0 277 346 0 138 208 0 693 693
FILLMORE O 298 131 0 1 0 13 64 51 2 0 167 35 4 10 0 0 27 1 3 4 5 0 1 37 2 7 31SHERIFF C 95 17 0 0 0 3 10 4 0 0 78 12 1 4 0 0 0 1 1 2 4 0 0 35 2 3 13MN0230000 % 32 13 0 0 0 23 16 8 0 0 47 34 25 40 0 0 0 100 33 50 80 0 0 95 100 43 42POP. 21,010Crime Rate R 1418 623 0 4 0 61 304 242 9 0 794 166 19 47 0 0 128 4 14 19 23 0 4 176 9 33 147
FREEBORN O 1454 588 0 4 0 40 72 444 25 3 866 116 18 46 0 12 191 8 0 15 137 1 2 81 36 69 134COUNTY TOTAL C 870 199 0 4 0 39 18 132 6 0 671 114 12 28 0 12 26 8 0 15 137 0 2 81 36 69 131
% 60 34 0 100 0 98 25 30 24 0 77 98 67 61 0 100 14 100 0 100 100 0 100 100 100 100 98POP. 31,372Crime Rate R 4634 1874 0 12 0 127 229 1415 79 9 2760 369 57 146 0 38 608 25 0 47 436 3 6 258 114 219 427
FREEBORN O 334 104 0 1 0 8 20 63 11 1 230 20 4 12 0 7 35 3 0 1 59 0 2 33 10 14 30SHERIFF C 218 25 0 1 0 8 7 6 3 0 193 20 4 11 0 7 2 3 0 1 59 0 2 33 10 14 27MN0240000 % 65 24 0 100 0 100 35 10 27 0 84 100 100 92 0 100 6 100 0 100 100 0 100 100 100 100 90POP. 13,290Crime Rate R 2513 782 0 7 0 60 150 474 82 7 1730 150 30 90 0 52 263 22 0 7 443 0 15 248 75 105 225
ALBERT LEA O 1120 484 0 3 0 32 52 381 14 2 636 96 14 34 0 5 156 5 0 14 78 1 0 48 26 55 104PD C 652 174 0 3 0 31 11 126 3 0 478 94 8 17 0 5 24 5 0 14 78 0 0 48 26 55 104MN0240100 % 58 36 0 100 0 97 21 33 21 0 75 98 57 50 0 100 15 100 0 100 100 0 0 100 100 100 100POP. 18,082Crime Rate R 6194 2676 0 16 0 176 287 2107 77 11 3517 530 77 188 0 27 862 27 0 77 431 5 0 265 143 304 575

TABLE 46Offenses, Clearances, Percent Cleared and Crime Rate by Agency - 2013
0 = Number of Offenses C = Offenses Cleared % = Percentage Cleared R = Crime Rate per 100,000 * - Agency did not report all 12 months 2013 151
Aggra- Motor Forgery/ Embe- Other Disor- OtherGrand Total Rob- vated Burg- Larc- Vehicle Total Other Counter- zzle- Stolen Vand- Weap- Prosti- Sex Narc- Gamb- Family/ Liquor derly Offen-
County/City Part 1 Murder Rape bery Assault lary eny Theft Arson Part 2 Assaults feiting Fraud ment Property alism ons tution Offen. otics ling Children D.U.I. Laws Cond. sesGOODHUE O 3026 993 0 19 4 27 145 735 58 5 2033 453 33 182 0 8 311 15 1 38 184 0 10 188 62 224 324COUNTY TOTAL C 1418 251 0 5 1 19 24 187 14 1 1167 290 3 48 0 7 42 11 0 19 179 0 7 188 58 102 213
% 47 25 0 26 25 70 17 25 24 20 57 64 9 26 0 88 14 73 0 50 97 0 70 100 94 46 66POP. 47,760Crime Rate R 6612 2170 0 41 8 59 316 1606 126 10 4442 989 72 397 0 17 679 32 2 83 402 0 21 410 135 489 708
GOODHUE O 744 234 0 4 0 5 53 150 22 0 510 83 3 53 0 3 92 3 0 8 55 0 2 53 23 52 80SHERIFF C 238 26 0 1 0 3 5 12 5 0 212 27 0 2 0 3 6 2 0 4 51 0 2 53 22 10 30MN0250000 % 32 11 0 25 0 60 9 8 23 0 42 33 0 4 0 100 7 67 0 50 93 0 100 100 96 19 38POP. 21,793Crime Rate R 3413 1073 0 18 0 22 243 688 100 0 2340 380 13 243 0 13 422 13 0 36 252 0 9 243 105 238 367
CANNON FALLS O 310 120 0 1 2 2 15 96 4 0 190 35 2 21 0 0 40 1 0 6 12 0 1 18 9 14 31PD C 189 49 0 1 0 2 7 37 2 0 140 32 1 13 0 0 9 1 0 5 12 0 1 18 9 14 25MN0250100 % 61 41 0 100 0 100 47 39 50 0 74 91 50 62 0 0 23 100 0 83 100 0 100 100 100 100 81POP. 4,112Crime Rate R 7538 2918 0 24 48 48 364 2334 97 0 4620 851 48 510 0 0 972 24 0 145 291 0 24 437 218 340 753
RED WING O 1808 579 0 14 2 19 68 447 24 5 1229 316 26 85 0 4 165 9 1 24 109 0 7 101 29 154 199PD C 900 164 0 3 1 13 12 127 7 1 736 214 2 14 0 3 24 6 0 10 108 0 4 101 26 75 149MN0250300 % 50 28 0 21 50 68 18 28 29 20 60 68 8 16 0 75 15 67 0 42 99 0 57 100 90 49 75POP. 16,578Crime Rate R 10906 3492 0 84 12 114 410 2696 144 30 7413 1906 156 512 0 24 995 54 6 144 657 0 42 609 174 928 1200
ZUMBROTA O 164 60 0 0 0 1 9 42 8 0 104 19 2 23 0 1 14 2 0 0 8 0 0 16 1 4 14PD C 91 12 0 0 0 1 0 11 0 0 79 17 0 19 0 1 3 2 0 0 8 0 0 16 1 3 9MN0250800 % 55 20 0 0 0 100 0 26 0 0 76 89 0 83 0 100 21 100 0 0 100 0 0 100 100 75 64POP. 3,277Crime Rate R 5004 1830 0 0 0 30 274 1281 244 0 3173 579 61 701 0 30 427 61 0 0 244 0 0 488 30 122 427
GRANT O 217 71 0 0 0 5 23 41 2 0 146 12 3 2 0 0 26 2 0 1 4 0 1 16 5 44 30SHERIFF C 86 12 0 0 0 5 4 3 0 0 74 9 2 0 0 0 1 2 0 1 4 0 0 16 4 17 18MN0260000 % 40 17 0 0 0 100 17 7 0 0 51 75 67 0 0 0 4 100 0 100 100 0 0 100 80 39 60POP. 6,027Crime Rate R 3600 1178 0 0 0 82 381 680 33 0 2422 199 49 33 0 0 431 33 0 16 66 0 16 265 82 730 497
HENNEPIN O 102697 44253 49 562 2245 2270 6933 29475 2446 273 58444 8475 1294 4111 30 410 8289 945 354 919 5794 3 1854 4408 2765 6907 11886COUNTY TOTAL C 41544 10780 28 211 500 1276 918 7526 285 36 30764 4403 415 611 16 321 1041 593 304 406 4270 2 123 4318 2572 2624 8745
% 40 24 57 38 22 56 13 26 12 13 53 52 32 15 53 78 13 63 86 44 74 67 7 98 93 38 74POP. 1,179,108Crime Rate R 8719 3753 4 47 190 192 587 2499 207 23 4957 719 110 349 3 35 703 80 30 78 491 0 157 374 234 586 1008
HENNEPIN O 810 145 0 6 3 27 4 100 3 2 665 93 9 9 1 5 24 28 1 60 114 0 8 171 2 30 110SHERIFF C 567 60 0 0 1 25 3 27 3 1 507 41 1 2 1 5 5 28 0 51 111 0 3 171 2 12 74MN0270000 % 70 41 0 0 33 93 75 27 100 50 76 44 11 22 100 100 21 100 0 85 97 0 38 100 100 40 67POP. 7,567Crime Rate R 10704 1916 0 79 39 356 52 1321 39 26 8788 1229 118 118 13 66 317 370 13 792 1506 0 105 2259 26 396 1453
BLOOMINGTON O 7802 3427 1 17 49 61 193 2990 100 16 4375 435 101 401 1 48 390 47 14 94 488 0 328 410 72 329 1217PD C 4489 1690 1 9 28 51 40 1546 15 0 2799 270 23 84 1 45 53 24 10 51 464 0 11 410 72 259 1022MN0270100 % 58 49 100 53 57 84 21 52 15 0 64 62 23 21 100 94 14 51 71 54 95 0 3 100 100 79 84POP. 84,596Crime Rate R 9222 4051 1 20 57 72 228 3534 118 18 5171 514 119 474 1 56 461 55 16 111 576 0 387 484 85 388 1438

TABLE 46Offenses, Clearances, Percent Cleared and Crime Rate by Agency - 2013
0 = Number of Offenses C = Offenses Cleared % = Percentage Cleared R = Crime Rate per 100,000 * - Agency did not report all 12 months 2013 152
Aggra- Motor Forgery/ Embe- Other Disor- OtherGrand Total Rob- vated Burg- Larc- Vehicle Total Other Counter- zzle- Stolen Vand- Weap- Prosti- Sex Narc- Gamb- Family/ Liquor derly Offen-
County/City Part 1 Murder Rape bery Assault lary eny Theft Arson Part 2 Assaults feiting Fraud ment Property alism ons tution Offen. otics ling Children D.U.I. Laws Cond. sesBROOKLYN CENTER O 3420 1860 2 14 67 49 207 1440 73 8 1560 183 68 140 0 29 282 32 16 54 166 0 21 175 14 176 204PD C 1908 955 2 3 23 35 23 857 10 2 953 138 13 15 0 21 26 21 15 28 140 0 3 175 14 164 180MN0270200 % 56 51 100 21 34 71 11 60 14 25 61 75 19 11 0 72 9 66 94 52 84 0 14 100 100 93 88POP. 30,725Crime Rate R 11131 6053 6 45 218 159 673 4686 237 26 5077 595 221 455 0 94 917 104 52 175 540 0 68 569 45 572 663
BROOKLYN PARK O 6993 2708 3 33 86 126 421 1875 160 4 4285 1259 82 285 1 21 614 78 4 33 349 0 13 143 32 333 1038PD C 3296 839 1 12 34 91 46 632 23 0 2457 771 16 21 0 17 66 50 3 12 303 0 6 136 28 145 883MN0270300 % 47 31 33 36 40 72 11 34 14 0 57 61 20 7 0 81 11 64 75 36 87 0 46 95 88 44 85POP. 77,346Crime Rate R 9041 3501 3 42 111 162 544 2424 206 5 5540 1627 106 368 1 27 793 100 5 42 451 0 16 184 41 430 1342
CRYSTAL O 1526 553 0 5 17 8 61 424 35 3 973 174 24 95 0 10 124 7 0 24 85 1 5 255 15 57 97PD C 862 141 0 2 5 6 3 118 5 2 721 149 11 23 0 10 25 6 0 14 78 0 4 255 15 44 87MN0270400 % 56 25 0 40 29 75 5 28 14 67 74 86 46 24 0 100 20 86 0 58 92 0 80 100 100 77 90POP. 22,607Crime Rate R 6750 2446 0 22 75 35 269 1875 154 13 4303 769 106 420 0 44 548 30 0 106 375 4 22 1127 66 252 429
DEEPHAVEN-WOODLAND O 169 27 0 0 0 2 3 22 0 0 142 5 0 25 0 0 26 1 0 0 25 0 0 38 8 4 10PD C 104 6 0 0 0 2 3 1 0 0 98 5 0 1 0 0 8 1 0 0 25 0 0 38 8 2 10MN0270500 % 62 22 0 0 0 100 100 5 0 0 69 100 0 4 0 0 31 100 0 0 100 0 0 100 100 50 100POP. 4,163Crime Rate R 4059 648 0 0 0 48 72 528 0 0 3411 120 0 600 0 0 624 24 0 0 600 0 0 912 192 96 240
EDINA O 1594 954 0 7 5 4 80 835 22 1 640 51 16 46 0 16 123 2 0 13 125 0 2 132 26 15 73PD C 580 182 0 2 2 3 3 170 2 0 398 35 4 9 0 13 6 1 0 1 117 0 0 130 23 11 48MN0270600 % 36 19 0 29 40 75 4 20 9 0 62 69 25 20 0 81 5 50 0 8 94 0 0 98 88 73 66POP. 48,932Crime Rate R 3257 1949 0 14 10 8 163 1706 44 2 1307 104 32 94 0 32 251 4 0 26 255 0 4 269 53 30 149
SOUTH LAKE O 677 136 1 9 0 6 20 92 8 0 541 49 8 46 0 0 46 4 0 1 87 0 32 136 19 54 59MINNETONKA PD C 474 43 0 9 0 4 3 23 4 0 431 42 3 13 0 0 21 3 0 1 84 0 21 136 19 43 45MN0270700 % 70 32 0 100 0 67 15 25 50 0 80 86 38 28 0 0 46 75 0 100 97 0 66 100 100 80 76POP. 11,901Crime Rate R 5689 1143 8 75 0 50 168 773 67 0 4545 411 67 386 0 0 386 33 0 8 731 0 268 1142 159 453 495
GOLDEN VALLEY O 1106 470 0 4 5 7 59 378 14 3 636 89 35 69 1 5 82 8 1 15 77 0 1 115 6 44 88PD C 464 100 0 0 2 5 8 83 1 1 364 65 5 7 0 3 7 7 0 5 71 0 1 115 5 17 56MN0270800 % 42 21 0 0 40 71 14 22 7 33 57 73 14 10 0 60 9 88 0 33 92 0 100 100 83 39 64POP. 20,787Crime Rate R 5320 2261 0 19 24 33 283 1818 67 14 3059 428 168 331 4 24 394 38 4 72 370 0 4 553 28 211 423
HOPKINS O 1126 484 0 5 11 18 71 342 37 0 642 103 25 58 0 4 165 4 2 9 59 0 5 65 34 21 88PD C 393 55 0 2 2 13 8 27 3 0 338 79 5 4 0 4 10 4 2 4 54 0 1 65 33 12 61MN0270900 % 35 11 0 40 18 72 11 8 8 0 53 77 20 7 0 100 6 100 100 44 92 0 20 100 97 57 69POP. 17,951Crime Rate R 6272 2696 0 27 61 100 395 1905 206 0 3576 573 139 323 0 22 919 22 11 50 328 0 27 362 189 116 490
MINNEAPOLIS O 53694 23520 36 385 1856 1761 4601 13182 1575 124 30174 4312 574 1532 3 167 4105 591 218 367 2449 2 1368 665 2037 4600 7184PD C 16802 4151 17 132 353 874 604 2042 123 6 12651 1425 218 94 1 108 482 325 183 92 1282 2 31 594 1881 1135 4798MN0271100 % 31 18 47 34 19 50 13 15 8 5 42 33 38 6 33 65 12 55 84 25 52 100 2 89 92 25 67POP. 390,240Crime Rate R 13759 6027 9 98 475 451 1179 3377 403 32 7732 1104 147 393 1 43 1052 151 56 94 628 1 351 170 522 1179 1841

TABLE 46Offenses, Clearances, Percent Cleared and Crime Rate by Agency - 2013
0 = Number of Offenses C = Offenses Cleared % = Percentage Cleared R = Crime Rate per 100,000 * - Agency did not report all 12 months 2013 153
Aggra- Motor Forgery/ Embe- Other Disor- OtherGrand Total Rob- vated Burg- Larc- Vehicle Total Other Counter- zzle- Stolen Vand- Weap- Prosti- Sex Narc- Gamb- Family/ Liquor derly Offen-
County/City Part 1 Murder Rape bery Assault lary eny Theft Arson Part 2 Assaults feiting Fraud ment Property alism ons tution Offen. otics ling Children D.U.I. Laws Cond. sesMINNETONKA O 1985 884 0 2 4 7 118 718 27 8 1101 110 32 185 0 25 131 4 3 19 206 0 2 146 34 95 109PD C 918 246 0 1 1 6 20 214 3 1 672 88 6 20 0 22 16 4 3 6 199 0 2 146 33 60 67MN0271200 % 46 28 0 50 25 86 17 30 11 13 61 80 19 11 0 88 12 100 100 32 97 0 100 100 97 63 61POP. 50,758Crime Rate R 3910 1741 0 3 7 13 232 1414 53 15 2169 216 63 364 0 49 258 7 5 37 405 0 3 287 66 187 214
NEW HOPE O 1227 481 1 4 9 10 55 374 25 3 746 170 20 63 1 1 130 13 0 16 75 0 1 84 16 80 76PD C 522 69 1 2 2 7 10 42 4 1 453 128 5 9 0 1 21 9 0 5 70 0 0 84 16 45 60MN0271400 % 43 14 100 50 22 70 18 11 16 33 61 75 25 14 0 100 16 69 0 31 93 0 0 100 100 56 79POP. 20,748Crime Rate R 5913 2318 4 19 43 48 265 1802 120 14 3595 819 96 303 4 4 626 62 0 77 361 0 4 404 77 385 366
ORONO O 640 250 1 0 0 3 44 197 5 0 390 48 6 11 0 2 65 2 0 13 71 0 1 84 26 27 34PD C 261 58 1 0 0 2 15 38 2 0 203 42 3 3 0 2 11 0 0 7 12 0 1 83 2 15 22MN0271500 % 41 23 100 0 0 67 34 19 40 0 52 88 50 27 0 100 17 0 0 54 17 0 100 99 8 56 65POP. 20,885Crime Rate R 3064 1197 5 0 0 14 211 943 24 0 1867 230 29 53 0 10 311 10 0 62 340 0 5 402 124 129 163
OSSEO* O 0 0 0 0 0 0 0 0 0 0 0 0 0 0 0 0 0 0 0 0 0 0 0 0 0 0 0PD C 0 0 0 0 0 0 0 0 0 0 0 0 0 0 0 0 0 0 0 0 0 0 0 0 0 0 0MN0271600 % 0 0 0 0 0 0 0 0 0 0 0 0 0 0 0 0 0 0 0 0 0 0 0 0 0 0 0POP. 2,479Crime Rate R 0 0 0 0 0 0 0 0 0 0 0 0 0 0 0 0 0 0 0 0 0 0 0 0 0 0 0
PLYMOUTH O 2706 1196 0 21 5 23 186 903 52 6 1510 238 47 191 0 11 226 9 34 23 172 0 12 102 47 249 149PD C 1064 235 0 7 0 19 21 181 6 1 829 183 11 21 0 8 22 7 31 12 157 0 6 102 45 104 120MN0271700 % 39 20 0 33 0 83 11 20 12 17 55 77 23 11 0 73 10 78 91 52 91 0 50 100 96 42 81POP. 72,020Crime Rate R 3757 1660 0 29 6 31 258 1253 72 8 2096 330 65 265 0 15 313 12 47 31 238 0 16 141 65 345 206
RICHFIELD O 2484 1068 2 9 49 28 165 763 47 5 1416 206 46 120 3 17 243 23 20 34 240 0 4 158 31 131 140PD C 1266 281 2 4 14 24 19 204 12 2 985 175 15 21 1 15 28 19 19 26 234 0 4 158 31 115 124MN0271800 % 51 26 100 44 29 86 12 27 26 40 70 85 33 18 33 88 12 83 95 76 98 0 100 100 100 88 89POP. 35,953Crime Rate R 6909 2970 5 25 136 77 458 2122 130 13 3938 572 127 333 8 47 675 63 55 94 667 0 11 439 86 364 389
ROBBINSDALE O 1219 340 0 1 16 16 71 210 26 0 879 116 18 47 0 5 111 10 1 15 108 0 8 165 6 37 232PD C 712 68 0 0 5 14 12 26 11 0 644 79 7 3 0 5 13 9 1 3 106 0 3 165 6 26 218MN0271900 % 58 20 0 0 31 88 17 12 42 0 73 68 39 6 0 100 12 90 100 20 98 0 38 100 100 70 94POP. 14,239Crime Rate R 8560 2387 0 7 112 112 498 1474 182 0 6173 814 126 330 0 35 779 70 7 105 758 0 56 1158 42 259 1629
ST. ANTHONY O 597 383 0 2 5 2 51 306 16 1 214 23 11 9 0 2 39 2 0 3 31 0 0 28 6 17 43PD C 346 180 0 2 4 1 3 163 6 1 166 20 5 3 0 2 7 2 0 3 31 0 0 28 6 17 42MN0272000 % 58 47 0 100 80 50 6 53 38 100 78 87 45 33 0 100 18 100 0 100 100 0 0 100 100 100 98POP. 8,388Crime Rate R 7117 4566 0 23 59 23 608 3648 190 11 2551 274 131 107 0 23 464 23 0 35 369 0 0 333 71 202 512
ST. LOUIS PARK O 2862 1360 1 5 25 37 188 1037 63 4 1502 255 33 211 2 11 395 11 2 33 99 0 10 241 23 43 133PD C 1342 370 1 4 8 33 22 286 14 2 972 227 15 114 0 10 43 11 2 22 95 0 8 241 23 39 122MN0272100 % 47 27 100 80 32 89 12 28 22 50 65 89 45 54 0 91 11 100 100 67 96 0 80 100 100 91 92POP. 46,176Crime Rate R 6198 2945 2 10 54 80 407 2245 136 8 3252 552 71 456 4 23 855 23 4 71 214 0 21 521 49 93 288
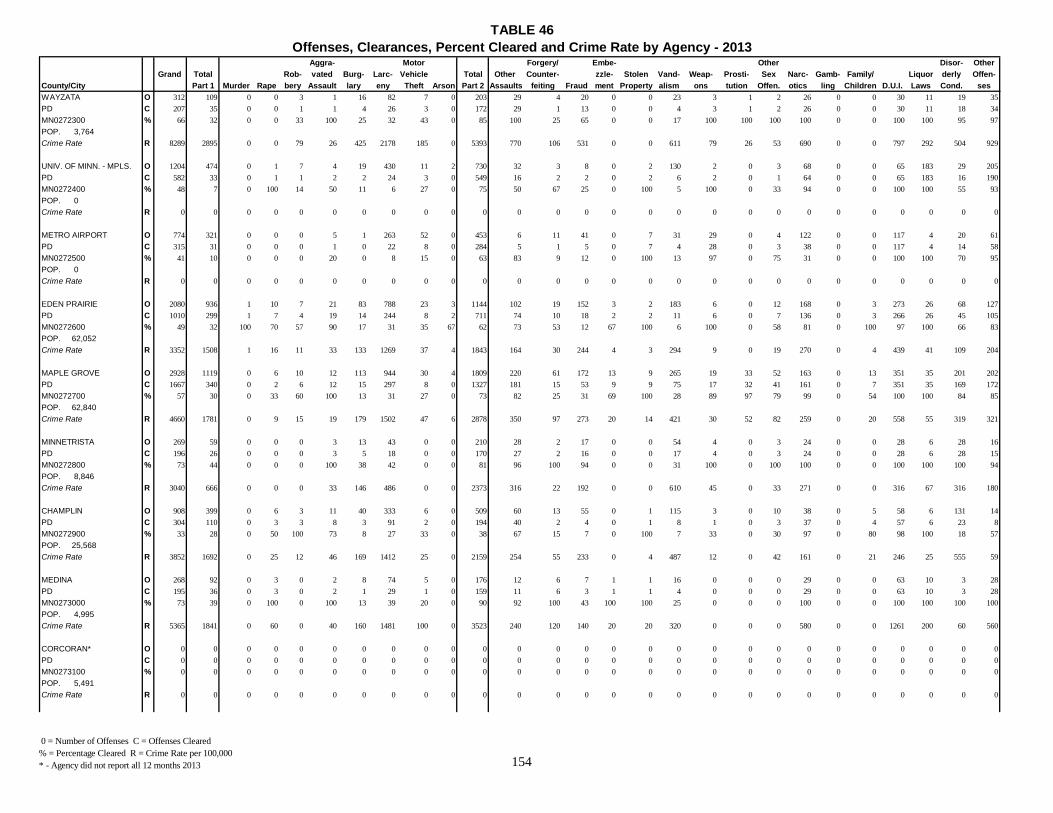
TABLE 46Offenses, Clearances, Percent Cleared and Crime Rate by Agency - 2013
0 = Number of Offenses C = Offenses Cleared % = Percentage Cleared R = Crime Rate per 100,000 * - Agency did not report all 12 months 2013 154
Aggra- Motor Forgery/ Embe- Other Disor- OtherGrand Total Rob- vated Burg- Larc- Vehicle Total Other Counter- zzle- Stolen Vand- Weap- Prosti- Sex Narc- Gamb- Family/ Liquor derly Offen-
County/City Part 1 Murder Rape bery Assault lary eny Theft Arson Part 2 Assaults feiting Fraud ment Property alism ons tution Offen. otics ling Children D.U.I. Laws Cond. sesWAYZATA O 312 109 0 0 3 1 16 82 7 0 203 29 4 20 0 0 23 3 1 2 26 0 0 30 11 19 35PD C 207 35 0 0 1 1 4 26 3 0 172 29 1 13 0 0 4 3 1 2 26 0 0 30 11 18 34MN0272300 % 66 32 0 0 33 100 25 32 43 0 85 100 25 65 0 0 17 100 100 100 100 0 0 100 100 95 97POP. 3,764Crime Rate R 8289 2895 0 0 79 26 425 2178 185 0 5393 770 106 531 0 0 611 79 26 53 690 0 0 797 292 504 929
UNIV. OF MINN. - MPLS. O 1204 474 0 1 7 4 19 430 11 2 730 32 3 8 0 2 130 2 0 3 68 0 0 65 183 29 205PD C 582 33 0 1 1 2 2 24 3 0 549 16 2 2 0 2 6 2 0 1 64 0 0 65 183 16 190MN0272400 % 48 7 0 100 14 50 11 6 27 0 75 50 67 25 0 100 5 100 0 33 94 0 0 100 100 55 93POP. 0Crime Rate R 0 0 0 0 0 0 0 0 0 0 0 0 0 0 0 0 0 0 0 0 0 0 0 0 0 0 0
METRO AIRPORT O 774 321 0 0 0 5 1 263 52 0 453 6 11 41 0 7 31 29 0 4 122 0 0 117 4 20 61PD C 315 31 0 0 0 1 0 22 8 0 284 5 1 5 0 7 4 28 0 3 38 0 0 117 4 14 58MN0272500 % 41 10 0 0 0 20 0 8 15 0 63 83 9 12 0 100 13 97 0 75 31 0 0 100 100 70 95POP. 0Crime Rate R 0 0 0 0 0 0 0 0 0 0 0 0 0 0 0 0 0 0 0 0 0 0 0 0 0 0 0
EDEN PRAIRIE O 2080 936 1 10 7 21 83 788 23 3 1144 102 19 152 3 2 183 6 0 12 168 0 3 273 26 68 127PD C 1010 299 1 7 4 19 14 244 8 2 711 74 10 18 2 2 11 6 0 7 136 0 3 266 26 45 105MN0272600 % 49 32 100 70 57 90 17 31 35 67 62 73 53 12 67 100 6 100 0 58 81 0 100 97 100 66 83POP. 62,052Crime Rate R 3352 1508 1 16 11 33 133 1269 37 4 1843 164 30 244 4 3 294 9 0 19 270 0 4 439 41 109 204
MAPLE GROVE O 2928 1119 0 6 10 12 113 944 30 4 1809 220 61 172 13 9 265 19 33 52 163 0 13 351 35 201 202PD C 1667 340 0 2 6 12 15 297 8 0 1327 181 15 53 9 9 75 17 32 41 161 0 7 351 35 169 172MN0272700 % 57 30 0 33 60 100 13 31 27 0 73 82 25 31 69 100 28 89 97 79 99 0 54 100 100 84 85POP. 62,840Crime Rate R 4660 1781 0 9 15 19 179 1502 47 6 2878 350 97 273 20 14 421 30 52 82 259 0 20 558 55 319 321
MINNETRISTA O 269 59 0 0 0 3 13 43 0 0 210 28 2 17 0 0 54 4 0 3 24 0 0 28 6 28 16PD C 196 26 0 0 0 3 5 18 0 0 170 27 2 16 0 0 17 4 0 3 24 0 0 28 6 28 15MN0272800 % 73 44 0 0 0 100 38 42 0 0 81 96 100 94 0 0 31 100 0 100 100 0 0 100 100 100 94POP. 8,846Crime Rate R 3040 666 0 0 0 33 146 486 0 0 2373 316 22 192 0 0 610 45 0 33 271 0 0 316 67 316 180
CHAMPLIN O 908 399 0 6 3 11 40 333 6 0 509 60 13 55 0 1 115 3 0 10 38 0 5 58 6 131 14PD C 304 110 0 3 3 8 3 91 2 0 194 40 2 4 0 1 8 1 0 3 37 0 4 57 6 23 8MN0272900 % 33 28 0 50 100 73 8 27 33 0 38 67 15 7 0 100 7 33 0 30 97 0 80 98 100 18 57POP. 25,568Crime Rate R 3852 1692 0 25 12 46 169 1412 25 0 2159 254 55 233 0 4 487 12 0 42 161 0 21 246 25 555 59
MEDINA O 268 92 0 3 0 2 8 74 5 0 176 12 6 7 1 1 16 0 0 0 29 0 0 63 10 3 28PD C 195 36 0 3 0 2 1 29 1 0 159 11 6 3 1 1 4 0 0 0 29 0 0 63 10 3 28MN0273000 % 73 39 0 100 0 100 13 39 20 0 90 92 100 43 100 100 25 0 0 0 100 0 0 100 100 100 100POP. 4,995Crime Rate R 5365 1841 0 60 0 40 160 1481 100 0 3523 240 120 140 20 20 320 0 0 0 580 0 0 1261 200 60 560
CORCORAN* O 0 0 0 0 0 0 0 0 0 0 0 0 0 0 0 0 0 0 0 0 0 0 0 0 0 0 0PD C 0 0 0 0 0 0 0 0 0 0 0 0 0 0 0 0 0 0 0 0 0 0 0 0 0 0 0MN0273100 % 0 0 0 0 0 0 0 0 0 0 0 0 0 0 0 0 0 0 0 0 0 0 0 0 0 0 0POP. 5,491Crime Rate R 0 0 0 0 0 0 0 0 0 0 0 0 0 0 0 0 0 0 0 0 0 0 0 0 0 0 0

TABLE 46Offenses, Clearances, Percent Cleared and Crime Rate by Agency - 2013
0 = Number of Offenses C = Offenses Cleared % = Percentage Cleared R = Crime Rate per 100,000 * - Agency did not report all 12 months 2013 155
Aggra- Motor Forgery/ Embe- Other Disor- OtherGrand Total Rob- vated Burg- Larc- Vehicle Total Other Counter- zzle- Stolen Vand- Weap- Prosti- Sex Narc- Gamb- Family/ Liquor derly Offen-
County/City Part 1 Murder Rape bery Assault lary eny Theft Arson Part 2 Assaults feiting Fraud ment Property alism ons tution Offen. otics ling Children D.U.I. Laws Cond. sesDAYTON O 139 77 0 1 0 0 16 50 10 0 62 14 7 6 0 1 14 0 0 0 5 0 0 6 1 8 0PD C 64 23 0 1 0 0 4 16 2 0 41 11 3 1 0 1 8 0 0 0 4 0 0 5 1 7 0MN0273200 % 46 30 0 100 0 0 25 32 20 0 66 79 43 17 0 100 57 0 0 0 80 0 0 83 100 88 0POP. 4,766Crime Rate R 2916 1615 0 20 0 0 335 1049 209 0 1300 293 146 125 0 20 293 0 0 0 104 0 0 125 20 167 0
ROGERS PD O 606 240 0 4 3 9 19 192 13 0 366 34 11 83 0 6 36 2 2 7 33 0 10 46 8 46 42PD C 289 80 0 2 1 6 2 67 2 0 209 28 5 23 0 5 5 0 0 3 27 0 2 46 7 25 33MN0273400 % 48 33 0 50 33 67 11 35 15 0 57 82 45 28 0 83 14 0 0 43 82 0 20 100 88 54 79POP. 8,945
R 6774 2683 0 44 33 100 212 2146 145 0 4091 380 122 927 0 67 402 22 22 78 368 0 111 514 89 514 469
WEST HENNEPIN O 225 43 0 1 0 5 7 29 1 0 182 19 2 7 0 2 54 1 1 0 19 0 1 48 7 8 13PD C 171 16 0 1 0 5 2 7 1 0 155 19 2 6 0 2 28 1 1 0 19 0 1 48 7 8 13MN0273700 % 76 37 0 100 0 100 29 24 100 0 85 100 100 86 0 100 52 100 100 0 100 0 100 100 100 100 100POP. 5,380Crime Rate R 4182 799 0 18 0 92 130 539 18 0 3382 353 37 130 0 37 1003 18 18 0 353 0 18 892 130 148 241
THREE RIVER PARK O 272 63 0 1 0 2 0 59 0 1 209 0 0 0 0 0 47 0 1 0 73 0 1 10 14 4 59DISTRICT PD C 159 7 0 0 0 2 0 5 0 0 152 0 0 0 0 0 1 0 1 0 72 0 1 10 14 3 50MN0274000 % 58 11 0 0 0 100 0 8 0 0 73 0 0 0 0 0 2 0 100 0 99 0 100 100 100 75 85POP. 0Crime Rate R 0 0 0 0 0 0 0 0 0 0 0 0 0 0 0 0 0 0 0 0 0 0 0 0 0 0 0
HOUSTON O 985 107 0 3 0 17 34 49 4 0 878 45 2 164 1 0 51 5 0 8 53 0 1 45 38 73 392COUNTY TOTAL C 670 41 0 2 0 13 6 18 2 0 629 37 1 28 1 0 15 5 0 3 52 0 1 45 38 66 337
% 68 38 0 67 0 76 18 37 50 0 72 82 50 17 100 0 29 100 0 38 98 0 100 100 100 90 86POP. 19,037Crime Rate R 5174 562 0 15 0 89 178 257 21 0 4612 236 10 861 5 0 267 26 0 42 278 0 5 236 199 383 2059
HOUSTON O 627 67 0 2 0 7 25 31 2 0 560 20 1 37 1 0 34 4 0 2 35 0 0 17 12 33 364SHERIFF C 496 25 0 2 0 6 5 10 2 0 471 19 1 25 1 0 10 4 0 2 35 0 0 17 12 29 316MN0280000 % 79 37 0 100 0 86 20 32 100 0 84 95 100 68 100 0 29 100 0 100 100 0 0 100 100 88 87POP. 8,417Crime Rate R 7449 796 0 23 0 83 297 368 23 0 6653 237 11 439 11 0 403 47 0 23 415 0 0 201 142 392 4324
CALEDONIA O 252 9 0 1 0 6 1 0 1 0 243 15 1 108 0 0 7 0 0 3 16 0 0 27 14 31 21PD C 125 5 0 0 0 5 0 0 0 0 120 12 0 0 0 0 5 0 0 1 15 0 0 27 14 29 17MN0280100 % 50 56 0 0 0 83 0 0 0 0 49 80 0 0 0 0 71 0 0 33 94 0 0 100 100 94 81POP. 2,868Crime Rate R 8786 313 0 34 0 209 34 0 34 0 8472 523 34 3765 0 0 244 0 0 104 557 0 0 941 488 1080 732
HOUSTON PD O 69 15 0 0 0 4 4 6 1 0 54 7 0 16 0 0 4 0 0 1 1 0 1 0 12 6 6PD C 35 6 0 0 0 2 0 4 0 0 29 5 0 1 0 0 0 0 0 0 1 0 1 0 12 5 4MN0280200 % 51 40 0 0 0 50 0 67 0 0 54 71 0 6 0 0 0 0 0 0 100 0 100 0 100 83 67POP. 979Crime Rate R 7048 1532 0 0 0 408 408 612 102 0 5515 715 0 1634 0 0 408 0 0 102 102 0 102 0 1225 612 612
LA CRESCENT* O 0 0 0 0 0 0 0 0 0 0 0 0 0 0 0 0 0 0 0 0 0 0 0 0 0 0 0PD C 0 0 0 0 0 0 0 0 0 0 0 0 0 0 0 0 0 0 0 0 0 0 0 0 0 0 0MN0280300 % 0 0 0 0 0 0 0 0 0 0 0 0 0 0 0 0 0 0 0 0 0 0 0 0 0 0 0POP. 4,864Crime Rate R 0 0 0 0 0 0 0 0 0 0 0 0 0 0 0 0 0 0 0 0 0 0 0 0 0 0 0

TABLE 46Offenses, Clearances, Percent Cleared and Crime Rate by Agency - 2013
0 = Number of Offenses C = Offenses Cleared % = Percentage Cleared R = Crime Rate per 100,000 * - Agency did not report all 12 months 2013 156
Aggra- Motor Forgery/ Embe- Other Disor- OtherGrand Total Rob- vated Burg- Larc- Vehicle Total Other Counter- zzle- Stolen Vand- Weap- Prosti- Sex Narc- Gamb- Family/ Liquor derly Offen-
County/City Part 1 Murder Rape bery Assault lary eny Theft Arson Part 2 Assaults feiting Fraud ment Property alism ons tution Offen. otics ling Children D.U.I. Laws Cond. sesSPRING GROVE* O 0 0 0 0 0 0 0 0 0 0 0 0 0 0 0 0 0 0 0 0 0 0 0 0 0 0 0PD C 0 0 0 0 0 0 0 0 0 0 0 0 0 0 0 0 0 0 0 0 0 0 0 0 0 0 0MN0280400 % 0 0 0 0 0 0 0 0 0 0 0 0 0 0 0 0 0 0 0 0 0 0 0 0 0 0 0POP. 1,330Crime Rate R 0 0 0 0 0 0 0 0 0 0 0 0 0 0 0 0 0 0 0 0 0 0 0 0 0 0 0
HOKAH O 37 16 0 0 0 0 4 12 0 0 21 3 0 3 0 0 6 1 0 2 1 0 0 1 0 3 1PD C 14 5 0 0 0 0 1 4 0 0 9 1 0 2 0 0 0 1 0 0 1 0 0 1 0 3 0MN0280500 % 38 31 0 0 0 0 25 33 0 0 43 33 0 67 0 0 0 100 0 0 100 0 0 100 0 100 0POP. 579Crime Rate R 6390 2763 0 0 0 0 690 2072 0 0 3626 518 0 518 0 0 1036 172 0 345 172 0 0 172 0 518 172
HUBBARD O 1680 473 1 8 5 14 108 316 20 1 1207 175 10 155 0 3 195 43 0 42 70 0 22 71 25 149 247COUNTY TOTAL C 1130 155 1 5 2 14 15 113 5 0 975 155 8 123 0 2 94 29 0 33 65 0 15 71 22 136 222
% 67 33 100 63 40 100 14 36 25 0 81 89 80 79 0 67 48 67 0 79 93 0 68 100 88 91 90POP. 20,433Crime Rate R 8221 2314 4 39 24 68 528 1546 97 4 5907 856 48 758 0 14 954 210 0 205 342 0 107 347 122 729 1208
HUBBARD O 1098 242 1 6 0 8 77 144 6 0 856 110 5 132 0 3 154 40 0 34 38 0 20 41 20 106 153SHERIFF C 721 59 1 3 0 8 10 35 2 0 662 92 5 111 0 2 74 26 0 27 33 0 13 41 17 93 128MN0290000 % 66 24 100 50 0 100 13 24 33 0 77 84 100 84 0 67 48 65 0 79 87 0 65 100 85 88 84POP. 16,723Crime Rate R 6565 1447 5 35 0 47 460 861 35 0 5118 657 29 789 0 17 920 239 0 203 227 0 119 245 119 633 914
PARK RAPIDS O 582 231 0 2 5 6 31 172 14 1 351 65 5 23 0 0 41 3 0 8 32 0 2 30 5 43 94PD C 409 96 0 2 2 6 5 78 3 0 313 63 3 12 0 0 20 3 0 6 32 0 2 30 5 43 94MN0290100 % 70 42 0 100 40 100 16 45 21 0 89 97 60 52 0 0 49 100 0 75 100 0 100 100 100 100 100POP. 3,710Crime Rate R 15687 6226 0 53 134 161 835 4636 377 26 9460 1752 134 619 0 0 1105 80 0 215 862 0 53 808 134 1159 2533
ISANTI O 1861 713 0 6 1 29 108 524 43 2 1148 157 32 99 0 8 216 1 0 24 97 0 7 75 20 172 240COUNTY TOTAL C 1100 205 0 4 0 26 19 146 9 1 895 139 2 32 0 8 140 1 0 15 93 0 3 73 17 163 209
% 59 29 0 67 0 90 18 28 21 50 78 89 6 32 0 100 65 100 0 63 96 0 43 97 85 95 87POP. 38,529Crime Rate R 4830 1851 0 16 3 75 280 1360 112 5 2979 407 83 257 0 21 561 3 0 62 252 0 18 195 52 446 623
ISANTI O 800 290 0 3 0 11 70 182 23 1 510 78 3 48 0 1 144 0 0 18 30 0 6 18 2 82 80SHERIFF C 493 67 0 2 0 9 12 40 4 0 426 70 2 16 0 1 125 0 0 11 28 0 2 16 2 79 74MN0300000 % 62 23 0 67 0 82 17 22 17 0 84 90 67 33 0 100 87 0 0 61 93 0 33 89 100 96 93POP. 24,917Crime Rate R 3211 1164 0 12 0 44 281 730 92 4 2047 313 12 193 0 4 578 0 0 72 120 0 24 72 8 329 321
CAMBRIDGE O 823 317 0 1 1 12 28 258 16 1 506 51 27 34 0 7 62 1 0 3 53 0 1 43 11 72 141PD C 446 94 0 0 0 11 4 76 2 1 352 41 0 9 0 7 5 1 0 1 51 0 1 43 9 66 118MN0300100 % 54 30 0 0 0 92 14 29 13 100 70 80 0 26 0 100 8 100 0 33 96 0 100 100 82 92 84POP. 8,262Crime Rate R 9961 3836 0 12 12 145 338 3122 193 12 6124 617 326 411 0 84 750 12 0 36 641 0 12 520 133 871 1706
ISANTI PD O 238 106 0 2 0 6 10 84 4 0 132 28 2 17 0 0 10 0 0 3 14 0 0 14 7 18 19PD C 161 44 0 2 0 6 3 30 3 0 117 28 0 7 0 0 10 0 0 3 14 0 0 14 6 18 17MN0300300 % 68 42 0 100 0 100 30 36 75 0 89 100 0 41 0 0 100 0 0 100 100 0 0 100 86 100 89POP. 5,350Crime Rate R 4449 1981 0 37 0 112 187 1570 75 0 2467 523 37 318 0 0 187 0 0 56 262 0 0 262 131 336 355

TABLE 46Offenses, Clearances, Percent Cleared and Crime Rate by Agency - 2013
0 = Number of Offenses C = Offenses Cleared % = Percentage Cleared R = Crime Rate per 100,000 * - Agency did not report all 12 months 2013 157
Aggra- Motor Forgery/ Embe- Other Disor- OtherGrand Total Rob- vated Burg- Larc- Vehicle Total Other Counter- zzle- Stolen Vand- Weap- Prosti- Sex Narc- Gamb- Family/ Liquor derly Offen-
County/City Part 1 Murder Rape bery Assault lary eny Theft Arson Part 2 Assaults feiting Fraud ment Property alism ons tution Offen. otics ling Children D.U.I. Laws Cond. sesITASCA O 3084 999 1 41 3 30 123 774 24 3 2085 307 12 203 1 6 217 10 0 27 92 0 22 186 39 403 560COUNTY TOTAL C 2206 433 1 24 2 26 30 332 16 2 1773 271 4 115 1 5 156 8 0 20 81 0 19 185 39 360 509
% 72 43 100 59 67 87 24 43 67 67 85 88 33 57 100 83 72 80 0 74 88 0 86 99 100 89 91POP. 45,323Crime Rate R 6804 2204 2 90 6 66 271 1707 52 6 4600 677 26 447 2 13 478 22 0 59 202 0 48 410 86 889 1235
ITASCA O 1462 429 1 26 1 14 85 295 6 1 1033 154 4 131 0 2 124 7 0 15 40 0 6 76 17 195 262SHERIFF C 936 104 1 14 1 11 17 57 3 0 832 134 3 78 0 1 90 5 0 9 35 0 5 75 17 158 222MN0310000 % 64 24 100 54 100 79 20 19 50 0 81 87 75 60 0 50 73 71 0 60 88 0 83 99 100 81 85POP. 34,391Crime Rate R 4251 1247 2 75 2 40 247 857 17 2 3003 447 11 380 0 5 360 20 0 43 116 0 17 220 49 567 761
GRAND RAPIDS O 1622 570 0 15 2 16 38 479 18 2 1052 153 8 72 1 4 93 3 0 12 52 0 16 110 22 208 298PD C 1270 329 0 10 1 15 13 275 13 2 941 137 1 37 1 4 66 3 0 11 46 0 14 110 22 202 287MN0310300 % 78 58 0 67 50 94 34 57 72 100 89 90 13 51 100 100 71 100 0 92 88 0 88 100 100 97 96POP. 10,932Crime Rate R 14837 5214 0 137 18 146 347 4381 164 18 9623 1399 73 658 9 36 850 27 0 109 475 0 146 1006 201 1902 2725
JACKSON O 243 97 0 2 0 7 11 76 1 0 146 16 0 3 0 0 36 0 0 0 16 0 0 45 10 5 15COUNTY TOTAL C 120 16 0 1 0 7 2 6 0 0 104 15 0 3 0 0 2 0 0 0 15 0 0 45 10 3 11
% 49 16 0 50 0 100 18 8 0 0 71 94 0 100 0 0 6 0 0 0 94 0 0 100 100 60 73POP. 10,267Crime Rate R 2367 945 0 19 0 68 107 740 10 0 1422 156 0 29 0 0 351 0 0 0 156 0 0 439 97 49 146
JACKSON O 193 76 0 1 0 5 6 63 1 0 117 14 0 0 0 0 31 0 0 0 11 0 0 43 6 2 10SHERIFF C 97 12 0 1 0 5 1 5 0 0 85 13 0 0 0 0 1 0 0 0 11 0 0 43 6 2 9MN0320000 % 50 16 0 100 0 100 17 8 0 0 73 93 0 0 0 0 3 0 0 0 100 0 0 100 100 100 90POP. 8,574Crime Rate R 2250 886 0 11 0 58 69 734 11 0 1364 163 0 0 0 0 361 0 0 0 128 0 0 501 69 23 116
LAKEFIELD* O 50 21 0 1 0 2 5 13 0 0 29 2 0 3 0 0 5 0 0 0 5 0 0 2 4 3 5PD C 23 4 0 0 0 2 1 1 0 0 19 2 0 3 0 0 1 0 0 0 4 0 0 2 4 1 2MN0320200 % 46 19 0 0 0 100 20 8 0 0 66 100 0 100 0 0 20 0 0 0 80 0 0 100 100 33 40POP. 1,693Crime Rate R 2953 1240 0 59 0 118 295 767 0 0 1712 118 0 177 0 0 295 0 0 0 295 0 0 118 236 177 295
KANABEC O 968 314 0 10 1 21 84 178 20 0 654 182 6 42 3 12 55 5 0 21 58 0 16 61 8 50 135SHERIFF C 946 304 0 9 1 21 81 172 20 0 642 181 5 41 3 11 54 5 0 20 58 0 16 61 8 49 130MN0330000 % 98 97 0 90 100 100 96 97 100 0 98 99 83 98 100 92 98 100 0 95 100 0 100 100 100 98 96POP. 16,273Crime Rate R 5948 1929 0 61 6 129 516 1093 122 0 4018 1118 36 258 18 73 337 30 0 129 356 0 98 374 49 307 829
KANDIYOHI O 2275 872 1 13 7 38 101 672 35 5 1403 223 36 94 0 13 323 9 0 34 145 1 8 161 70 63 223COUNTY TOTAL C 1217 277 1 10 1 31 18 208 6 2 940 182 11 27 0 13 51 7 0 20 140 0 7 160 69 58 195
% 53 32 100 77 14 82 18 31 17 40 67 82 31 29 0 100 16 78 0 59 97 0 88 99 99 92 87POP. 42,443Crime Rate R 5360 2054 2 30 16 89 237 1583 82 11 3305 525 84 221 0 30 761 21 0 80 341 2 18 379 164 148 525
KANDIYOHI O 755 247 1 5 0 11 47 171 11 1 508 70 13 41 0 2 88 5 0 13 43 0 4 91 24 23 91SHERIFF C 395 40 1 3 0 10 7 16 3 0 355 57 1 11 0 2 20 3 0 7 42 0 3 91 24 20 74MN0340000 % 52 16 100 60 0 91 15 9 27 0 70 81 8 27 0 100 23 60 0 54 98 0 75 100 100 87 81POP. 22,735Crime Rate R 3320 1086 4 21 0 48 206 752 48 4 2234 307 57 180 0 8 387 21 0 57 189 0 17 400 105 101 400

TABLE 46Offenses, Clearances, Percent Cleared and Crime Rate by Agency - 2013
0 = Number of Offenses C = Offenses Cleared % = Percentage Cleared R = Crime Rate per 100,000 * - Agency did not report all 12 months 2013 158
Aggra- Motor Forgery/ Embe- Other Disor- OtherGrand Total Rob- vated Burg- Larc- Vehicle Total Other Counter- zzle- Stolen Vand- Weap- Prosti- Sex Narc- Gamb- Family/ Liquor derly Offen-
County/City Part 1 Murder Rape bery Assault lary eny Theft Arson Part 2 Assaults feiting Fraud ment Property alism ons tution Offen. otics ling Children D.U.I. Laws Cond. sesWILLMAR O 1520 625 0 8 7 27 54 501 24 4 895 153 23 53 0 11 235 4 0 21 102 1 4 70 46 40 132PD C 822 237 0 7 1 21 11 192 3 2 585 125 10 16 0 11 31 4 0 13 98 0 4 69 45 38 121MN0340100 % 54 38 0 88 14 78 20 38 13 50 65 82 43 30 0 100 13 100 0 62 96 0 100 99 98 95 92POP. 19,708Crime Rate R 7712 3171 0 40 35 137 274 2542 121 20 4541 776 116 268 0 55 1192 20 0 106 517 5 20 355 233 202 669
KITTSON O 153 27 0 0 0 1 4 20 2 0 126 5 0 102 0 0 3 0 0 0 1 0 0 8 4 1 2COUNTY TOTAL C 78 6 0 0 0 1 1 3 1 0 72 5 0 51 0 0 0 0 0 0 1 0 0 8 4 1 2
% 51 22 0 0 0 100 25 15 50 0 57 100 0 50 0 0 0 0 0 0 100 0 0 100 100 100 100POP. 4,544Crime Rate R 3367 594 0 0 0 22 88 440 44 0 2772 110 0 2244 0 0 66 0 0 0 22 0 0 176 88 22 44
KITTSON O 153 27 0 0 0 1 4 20 2 0 126 5 0 102 0 0 3 0 0 0 1 0 0 8 4 1 2SHERIFF C 78 6 0 0 0 1 1 3 1 0 72 5 0 51 0 0 0 0 0 0 1 0 0 8 4 1 2MN0350000 % 51 22 0 0 0 100 25 15 50 0 57 100 0 50 0 0 0 0 0 0 100 0 0 100 100 100 100POP. 3,565Crime Rate R 4291 757 0 0 0 28 112 561 56 0 3534 140 0 2861 0 0 84 0 0 0 28 0 0 224 112 28 56
HALLOCK* O 0 0 0 0 0 0 0 0 0 0 0 0 0 0 0 0 0 0 0 0 0 0 0 0 0 0 0PD C 0 0 0 0 0 0 0 0 0 0 0 0 0 0 0 0 0 0 0 0 0 0 0 0 0 0 0MN0350100 % 0 0 0 0 0 0 0 0 0 0 0 0 0 0 0 0 0 0 0 0 0 0 0 0 0 0 0POP. 979Crime Rate R 0 0 0 0 0 0 0 0 0 0 0 0 0 0 0 0 0 0 0 0 0 0 0 0 0 0 0
KOOCHICHING O 1039 317 0 6 1 11 64 218 14 3 722 101 8 41 0 3 135 4 1 8 31 0 25 67 35 145 118COUNTY TOTAL C 229 29 0 1 0 5 2 20 1 0 200 20 1 0 0 3 2 3 1 0 23 0 0 65 33 18 31
% 22 9 0 17 0 45 3 9 7 0 28 20 13 0 0 100 1 75 100 0 74 0 0 97 94 12 26POP. 13,298Crime Rate R 7813 2383 0 45 7 82 481 1639 105 22 5429 759 60 308 0 22 1015 30 7 60 233 0 187 503 263 1090 887
KOOCHICHING O 362 86 0 1 0 1 21 58 5 0 276 37 2 18 0 1 36 2 0 5 9 0 5 35 13 56 57SHERIFF C 86 2 0 0 0 0 1 1 0 0 84 10 0 0 0 1 0 1 0 0 7 0 0 33 12 3 17MN0360000 % 24 2 0 0 0 0 5 2 0 0 30 27 0 0 0 100 0 50 0 0 78 0 0 94 92 5 30POP. 6,881Crime Rate R 5260 1249 0 14 0 14 305 842 72 0 4011 537 29 261 0 14 523 29 0 72 130 0 72 508 188 813 828
INTERNATIONAL FALLS* O 677 231 0 5 1 10 43 160 9 3 446 64 6 23 0 2 99 2 1 3 22 0 20 32 22 89 61PD C 143 27 0 1 0 5 1 19 1 0 116 10 1 0 0 2 2 2 1 0 16 0 0 32 21 15 14MN0360100 % 21 12 0 20 0 50 2 12 11 0 26 16 17 0 0 100 2 100 100 0 73 0 0 100 95 17 23POP. 6,417Crime Rate R 10550 3599 0 77 15 155 670 2493 140 46 6950 997 93 358 0 31 1542 31 15 46 342 0 311 498 342 1386 950
LAC QUI PARLE O 143 54 0 0 0 5 11 37 1 0 89 12 1 4 0 0 23 2 0 6 2 0 1 20 3 7 8COUNTY TOTAL C 88 23 0 0 0 4 3 15 1 0 65 8 0 2 0 0 9 2 0 6 0 0 1 20 3 7 7
% 62 43 0 0 0 80 27 41 100 0 73 67 0 50 0 0 39 100 0 100 0 0 100 100 100 100 88POP. 7,239Crime Rate R 1975 748 0 0 0 69 152 511 14 0 1229 166 14 55 0 0 318 28 0 83 28 0 14 276 41 97 111
LAC QUI PARLE O 97 39 0 0 0 4 9 25 1 0 58 9 1 2 0 0 20 1 0 2 0 0 1 12 3 2 5SHERIFF C 53 14 0 0 0 3 3 7 1 0 39 5 0 1 0 0 7 1 0 2 0 0 1 12 3 2 5MN0370000 % 55 36 0 0 0 75 33 28 100 0 67 56 0 50 0 0 35 100 0 100 0 0 100 100 100 100 100POP. 5,703Crime Rate R 1700 683 0 0 0 70 157 438 17 0 1017 157 17 35 0 0 350 17 0 35 0 0 17 210 52 35 87
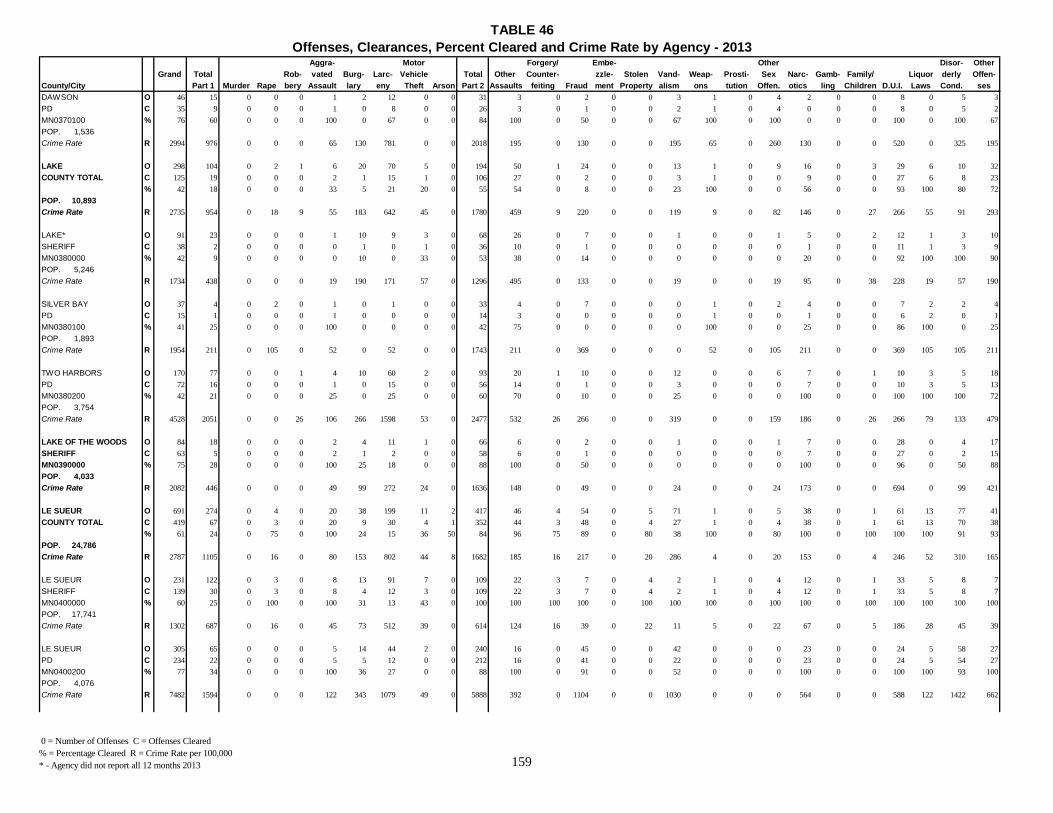
TABLE 46Offenses, Clearances, Percent Cleared and Crime Rate by Agency - 2013
0 = Number of Offenses C = Offenses Cleared % = Percentage Cleared R = Crime Rate per 100,000 * - Agency did not report all 12 months 2013 159
Aggra- Motor Forgery/ Embe- Other Disor- OtherGrand Total Rob- vated Burg- Larc- Vehicle Total Other Counter- zzle- Stolen Vand- Weap- Prosti- Sex Narc- Gamb- Family/ Liquor derly Offen-
County/City Part 1 Murder Rape bery Assault lary eny Theft Arson Part 2 Assaults feiting Fraud ment Property alism ons tution Offen. otics ling Children D.U.I. Laws Cond. sesDAWSON O 46 15 0 0 0 1 2 12 0 0 31 3 0 2 0 0 3 1 0 4 2 0 0 8 0 5 3PD C 35 9 0 0 0 1 0 8 0 0 26 3 0 1 0 0 2 1 0 4 0 0 0 8 0 5 2MN0370100 % 76 60 0 0 0 100 0 67 0 0 84 100 0 50 0 0 67 100 0 100 0 0 0 100 0 100 67POP. 1,536Crime Rate R 2994 976 0 0 0 65 130 781 0 0 2018 195 0 130 0 0 195 65 0 260 130 0 0 520 0 325 195
LAKE O 298 104 0 2 1 6 20 70 5 0 194 50 1 24 0 0 13 1 0 9 16 0 3 29 6 10 32COUNTY TOTAL C 125 19 0 0 0 2 1 15 1 0 106 27 0 2 0 0 3 1 0 0 9 0 0 27 6 8 23
% 42 18 0 0 0 33 5 21 20 0 55 54 0 8 0 0 23 100 0 0 56 0 0 93 100 80 72POP. 10,893Crime Rate R 2735 954 0 18 9 55 183 642 45 0 1780 459 9 220 0 0 119 9 0 82 146 0 27 266 55 91 293
LAKE* O 91 23 0 0 0 1 10 9 3 0 68 26 0 7 0 0 1 0 0 1 5 0 2 12 1 3 10SHERIFF C 38 2 0 0 0 0 1 0 1 0 36 10 0 1 0 0 0 0 0 0 1 0 0 11 1 3 9MN0380000 % 42 9 0 0 0 0 10 0 33 0 53 38 0 14 0 0 0 0 0 0 20 0 0 92 100 100 90POP. 5,246Crime Rate R 1734 438 0 0 0 19 190 171 57 0 1296 495 0 133 0 0 19 0 0 19 95 0 38 228 19 57 190
SILVER BAY O 37 4 0 2 0 1 0 1 0 0 33 4 0 7 0 0 0 1 0 2 4 0 0 7 2 2 4PD C 15 1 0 0 0 1 0 0 0 0 14 3 0 0 0 0 0 1 0 0 1 0 0 6 2 0 1MN0380100 % 41 25 0 0 0 100 0 0 0 0 42 75 0 0 0 0 0 100 0 0 25 0 0 86 100 0 25POP. 1,893Crime Rate R 1954 211 0 105 0 52 0 52 0 0 1743 211 0 369 0 0 0 52 0 105 211 0 0 369 105 105 211
TWO HARBORS O 170 77 0 0 1 4 10 60 2 0 93 20 1 10 0 0 12 0 0 6 7 0 1 10 3 5 18PD C 72 16 0 0 0 1 0 15 0 0 56 14 0 1 0 0 3 0 0 0 7 0 0 10 3 5 13MN0380200 % 42 21 0 0 0 25 0 25 0 0 60 70 0 10 0 0 25 0 0 0 100 0 0 100 100 100 72POP. 3,754Crime Rate R 4528 2051 0 0 26 106 266 1598 53 0 2477 532 26 266 0 0 319 0 0 159 186 0 26 266 79 133 479
LAKE OF THE WOODS O 84 18 0 0 0 2 4 11 1 0 66 6 0 2 0 0 1 0 0 1 7 0 0 28 0 4 17SHERIFF C 63 5 0 0 0 2 1 2 0 0 58 6 0 1 0 0 0 0 0 0 7 0 0 27 0 2 15MN0390000 % 75 28 0 0 0 100 25 18 0 0 88 100 0 50 0 0 0 0 0 0 100 0 0 96 0 50 88POP. 4,033Crime Rate R 2082 446 0 0 0 49 99 272 24 0 1636 148 0 49 0 0 24 0 0 24 173 0 0 694 0 99 421
LE SUEUR O 691 274 0 4 0 20 38 199 11 2 417 46 4 54 0 5 71 1 0 5 38 0 1 61 13 77 41COUNTY TOTAL C 419 67 0 3 0 20 9 30 4 1 352 44 3 48 0 4 27 1 0 4 38 0 1 61 13 70 38
% 61 24 0 75 0 100 24 15 36 50 84 96 75 89 0 80 38 100 0 80 100 0 100 100 100 91 93POP. 24,786Crime Rate R 2787 1105 0 16 0 80 153 802 44 8 1682 185 16 217 0 20 286 4 0 20 153 0 4 246 52 310 165
LE SUEUR O 231 122 0 3 0 8 13 91 7 0 109 22 3 7 0 4 2 1 0 4 12 0 1 33 5 8 7SHERIFF C 139 30 0 3 0 8 4 12 3 0 109 22 3 7 0 4 2 1 0 4 12 0 1 33 5 8 7MN0400000 % 60 25 0 100 0 100 31 13 43 0 100 100 100 100 0 100 100 100 0 100 100 0 100 100 100 100 100POP. 17,741Crime Rate R 1302 687 0 16 0 45 73 512 39 0 614 124 16 39 0 22 11 5 0 22 67 0 5 186 28 45 39
LE SUEUR O 305 65 0 0 0 5 14 44 2 0 240 16 0 45 0 0 42 0 0 0 23 0 0 24 5 58 27PD C 234 22 0 0 0 5 5 12 0 0 212 16 0 41 0 0 22 0 0 0 23 0 0 24 5 54 27MN0400200 % 77 34 0 0 0 100 36 27 0 0 88 100 0 91 0 0 52 0 0 0 100 0 0 100 100 93 100POP. 4,076Crime Rate R 7482 1594 0 0 0 122 343 1079 49 0 5888 392 0 1104 0 0 1030 0 0 0 564 0 0 588 122 1422 662

TABLE 46Offenses, Clearances, Percent Cleared and Crime Rate by Agency - 2013
0 = Number of Offenses C = Offenses Cleared % = Percentage Cleared R = Crime Rate per 100,000 * - Agency did not report all 12 months 2013 160
Aggra- Motor Forgery/ Embe- Other Disor- OtherGrand Total Rob- vated Burg- Larc- Vehicle Total Other Counter- zzle- Stolen Vand- Weap- Prosti- Sex Narc- Gamb- Family/ Liquor derly Offen-
County/City Part 1 Murder Rape bery Assault lary eny Theft Arson Part 2 Assaults feiting Fraud ment Property alism ons tution Offen. otics ling Children D.U.I. Laws Cond. sesMONTGOMERY O 155 87 0 1 0 7 11 64 2 2 68 8 1 2 0 1 27 0 0 1 3 0 0 4 3 11 7PD C 46 15 0 0 0 7 0 6 1 1 31 6 0 0 0 0 3 0 0 0 3 0 0 4 3 8 4MN0400300 % 30 17 0 0 0 100 0 9 50 50 46 75 0 0 0 0 11 0 0 0 100 0 0 100 100 73 57POP. 2,969Crime Rate R 5220 2930 0 33 0 235 370 2155 67 67 2290 269 33 67 0 33 909 0 0 33 101 0 0 134 101 370 235
LINCOLN O 171 28 0 0 0 10 2 16 0 0 143 4 0 0 0 0 52 0 0 0 1 0 30 21 9 26 0SHERIFF C 45 0 0 0 0 0 0 0 0 0 45 0 0 0 0 0 2 0 0 0 0 0 0 13 9 21 0MN0410000 % 26 0 0 0 0 0 0 0 0 0 31 0 0 0 0 0 4 0 0 0 0 0 0 62 100 81 0POP. 5,857Crime Rate R 2919 478 0 0 0 170 34 273 0 0 2441 68 0 0 0 0 887 0 0 0 17 0 512 358 153 443 0
LYON O 1273 450 0 5 1 20 81 322 18 3 823 127 21 48 0 7 116 5 1 13 88 0 8 127 54 63 145COUNTY TOTAL C 839 181 0 3 1 18 14 133 12 0 658 117 9 23 0 6 22 5 0 9 87 0 7 127 54 56 136
% 66 40 0 60 100 90 17 41 67 0 80 92 43 48 0 86 19 100 0 69 99 0 88 100 100 89 94POP. 26,057Crime Rate R 4885 1726 0 19 3 76 310 1235 69 11 3158 487 80 184 0 26 445 19 3 49 337 0 30 487 207 241 556
LYON O 167 37 0 0 1 3 14 16 3 0 130 13 2 7 0 0 21 1 0 2 17 0 0 39 9 1 18SHERIFF C 120 9 0 0 1 3 2 1 2 0 111 13 2 5 0 0 5 1 0 2 17 0 0 39 9 1 17MN0420000 % 72 24 0 0 100 100 14 6 67 0 85 100 100 71 0 0 24 100 0 100 100 0 0 100 100 100 94POP. 10,089Crime Rate R 1655 366 0 0 9 29 138 158 29 0 1288 128 19 69 0 0 208 9 0 19 168 0 0 386 89 9 178
MARSHALL O 1106 413 0 5 0 17 67 306 15 3 693 114 19 41 0 7 95 4 1 11 71 0 8 88 45 62 127PD C 719 172 0 3 0 15 12 132 10 0 547 104 7 18 0 6 17 4 0 7 70 0 7 88 45 55 119MN0420100 % 65 42 0 60 0 88 18 43 67 0 79 91 37 44 0 86 18 100 0 64 99 0 88 100 100 89 94POP. 13,788Crime Rate R 8021 2995 0 36 0 123 485 2219 108 21 5026 826 137 297 0 50 689 29 7 79 514 0 58 638 326 449 921
TRACY* O 0 0 0 0 0 0 0 0 0 0 0 0 0 0 0 0 0 0 0 0 0 0 0 0 0 0 0PD C 0 0 0 0 0 0 0 0 0 0 0 0 0 0 0 0 0 0 0 0 0 0 0 0 0 0 0MN0420200 % 0 0 0 0 0 0 0 0 0 0 0 0 0 0 0 0 0 0 0 0 0 0 0 0 0 0 0POP. 2,180Crime Rate R 0 0 0 0 0 0 0 0 0 0 0 0 0 0 0 0 0 0 0 0 0 0 0 0 0 0 0
MCLEOD O 2474 710 0 15 0 36 103 537 19 0 1764 136 18 117 0 1 304 6 1 17 98 0 37 123 62 60 784COUNTY TOTAL C 1396 197 0 10 0 29 17 132 9 0 1199 107 5 59 0 0 27 4 0 12 90 0 33 123 60 48 631
% 56 28 0 67 0 81 17 25 47 0 68 79 28 50 0 0 9 67 0 71 92 0 89 100 97 80 80POP. 36,666Crime Rate R 6747 1936 0 40 0 98 280 1464 51 0 4810 370 49 319 0 2 829 16 2 46 267 0 100 335 169 163 2138
MCLEOD O 1095 119 0 2 0 8 39 63 7 0 976 25 0 38 0 0 90 4 0 10 31 0 1 31 39 7 700SHERIFF C 786 36 0 2 0 7 7 17 3 0 750 23 0 29 0 0 12 3 0 9 28 0 1 31 39 5 570MN0430000 % 72 30 0 100 0 88 18 27 43 0 77 92 0 76 0 0 13 75 0 90 90 0 100 100 100 71 81POP. 11,162Crime Rate R 9810 1066 0 17 0 71 349 564 62 0 8743 223 0 340 0 0 806 35 0 89 277 0 8 277 349 62 6271
GLENCOE O 274 97 0 1 0 0 19 76 1 0 177 27 1 14 0 0 40 0 0 2 13 0 33 12 4 15 16PD C 142 13 0 0 0 0 2 10 1 0 129 24 1 8 0 0 8 0 0 1 13 0 31 12 4 14 13MN0430100 % 52 13 0 0 0 0 11 13 100 0 73 89 100 57 0 0 20 0 0 50 100 0 94 100 100 93 81POP. 5,634Crime Rate R 4863 1721 0 17 0 0 337 1348 17 0 3141 479 17 248 0 0 709 0 0 35 230 0 585 212 70 266 283
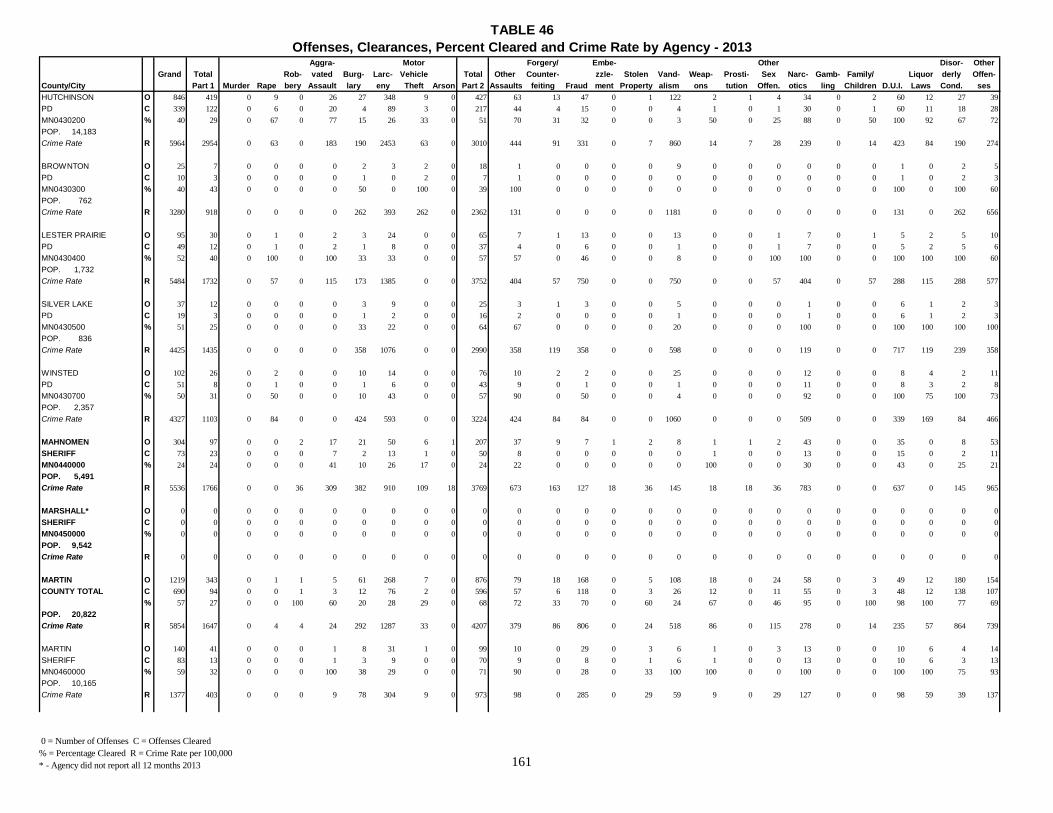
TABLE 46Offenses, Clearances, Percent Cleared and Crime Rate by Agency - 2013
0 = Number of Offenses C = Offenses Cleared % = Percentage Cleared R = Crime Rate per 100,000 * - Agency did not report all 12 months 2013 161
Aggra- Motor Forgery/ Embe- Other Disor- OtherGrand Total Rob- vated Burg- Larc- Vehicle Total Other Counter- zzle- Stolen Vand- Weap- Prosti- Sex Narc- Gamb- Family/ Liquor derly Offen-
County/City Part 1 Murder Rape bery Assault lary eny Theft Arson Part 2 Assaults feiting Fraud ment Property alism ons tution Offen. otics ling Children D.U.I. Laws Cond. sesHUTCHINSON O 846 419 0 9 0 26 27 348 9 0 427 63 13 47 0 1 122 2 1 4 34 0 2 60 12 27 39PD C 339 122 0 6 0 20 4 89 3 0 217 44 4 15 0 0 4 1 0 1 30 0 1 60 11 18 28MN0430200 % 40 29 0 67 0 77 15 26 33 0 51 70 31 32 0 0 3 50 0 25 88 0 50 100 92 67 72POP. 14,183Crime Rate R 5964 2954 0 63 0 183 190 2453 63 0 3010 444 91 331 0 7 860 14 7 28 239 0 14 423 84 190 274
BROWNTON O 25 7 0 0 0 0 2 3 2 0 18 1 0 0 0 0 9 0 0 0 0 0 0 1 0 2 5PD C 10 3 0 0 0 0 1 0 2 0 7 1 0 0 0 0 0 0 0 0 0 0 0 1 0 2 3MN0430300 % 40 43 0 0 0 0 50 0 100 0 39 100 0 0 0 0 0 0 0 0 0 0 0 100 0 100 60POP. 762Crime Rate R 3280 918 0 0 0 0 262 393 262 0 2362 131 0 0 0 0 1181 0 0 0 0 0 0 131 0 262 656
LESTER PRAIRIE O 95 30 0 1 0 2 3 24 0 0 65 7 1 13 0 0 13 0 0 1 7 0 1 5 2 5 10PD C 49 12 0 1 0 2 1 8 0 0 37 4 0 6 0 0 1 0 0 1 7 0 0 5 2 5 6MN0430400 % 52 40 0 100 0 100 33 33 0 0 57 57 0 46 0 0 8 0 0 100 100 0 0 100 100 100 60POP. 1,732Crime Rate R 5484 1732 0 57 0 115 173 1385 0 0 3752 404 57 750 0 0 750 0 0 57 404 0 57 288 115 288 577
SILVER LAKE O 37 12 0 0 0 0 3 9 0 0 25 3 1 3 0 0 5 0 0 0 1 0 0 6 1 2 3PD C 19 3 0 0 0 0 1 2 0 0 16 2 0 0 0 0 1 0 0 0 1 0 0 6 1 2 3MN0430500 % 51 25 0 0 0 0 33 22 0 0 64 67 0 0 0 0 20 0 0 0 100 0 0 100 100 100 100POP. 836Crime Rate R 4425 1435 0 0 0 0 358 1076 0 0 2990 358 119 358 0 0 598 0 0 0 119 0 0 717 119 239 358
WINSTED O 102 26 0 2 0 0 10 14 0 0 76 10 2 2 0 0 25 0 0 0 12 0 0 8 4 2 11PD C 51 8 0 1 0 0 1 6 0 0 43 9 0 1 0 0 1 0 0 0 11 0 0 8 3 2 8MN0430700 % 50 31 0 50 0 0 10 43 0 0 57 90 0 50 0 0 4 0 0 0 92 0 0 100 75 100 73POP. 2,357Crime Rate R 4327 1103 0 84 0 0 424 593 0 0 3224 424 84 84 0 0 1060 0 0 0 509 0 0 339 169 84 466
MAHNOMEN O 304 97 0 0 2 17 21 50 6 1 207 37 9 7 1 2 8 1 1 2 43 0 0 35 0 8 53SHERIFF C 73 23 0 0 0 7 2 13 1 0 50 8 0 0 0 0 0 1 0 0 13 0 0 15 0 2 11MN0440000 % 24 24 0 0 0 41 10 26 17 0 24 22 0 0 0 0 0 100 0 0 30 0 0 43 0 25 21POP. 5,491Crime Rate R 5536 1766 0 0 36 309 382 910 109 18 3769 673 163 127 18 36 145 18 18 36 783 0 0 637 0 145 965
MARSHALL* O 0 0 0 0 0 0 0 0 0 0 0 0 0 0 0 0 0 0 0 0 0 0 0 0 0 0 0SHERIFF C 0 0 0 0 0 0 0 0 0 0 0 0 0 0 0 0 0 0 0 0 0 0 0 0 0 0 0MN0450000 % 0 0 0 0 0 0 0 0 0 0 0 0 0 0 0 0 0 0 0 0 0 0 0 0 0 0 0POP. 9,542Crime Rate R 0 0 0 0 0 0 0 0 0 0 0 0 0 0 0 0 0 0 0 0 0 0 0 0 0 0 0
MARTIN O 1219 343 0 1 1 5 61 268 7 0 876 79 18 168 0 5 108 18 0 24 58 0 3 49 12 180 154COUNTY TOTAL C 690 94 0 0 1 3 12 76 2 0 596 57 6 118 0 3 26 12 0 11 55 0 3 48 12 138 107
% 57 27 0 0 100 60 20 28 29 0 68 72 33 70 0 60 24 67 0 46 95 0 100 98 100 77 69POP. 20,822Crime Rate R 5854 1647 0 4 4 24 292 1287 33 0 4207 379 86 806 0 24 518 86 0 115 278 0 14 235 57 864 739
MARTIN O 140 41 0 0 0 1 8 31 1 0 99 10 0 29 0 3 6 1 0 3 13 0 0 10 6 4 14SHERIFF C 83 13 0 0 0 1 3 9 0 0 70 9 0 8 0 1 6 1 0 0 13 0 0 10 6 3 13MN0460000 % 59 32 0 0 0 100 38 29 0 0 71 90 0 28 0 33 100 100 0 0 100 0 0 100 100 75 93POP. 10,165Crime Rate R 1377 403 0 0 0 9 78 304 9 0 973 98 0 285 0 29 59 9 0 29 127 0 0 98 59 39 137
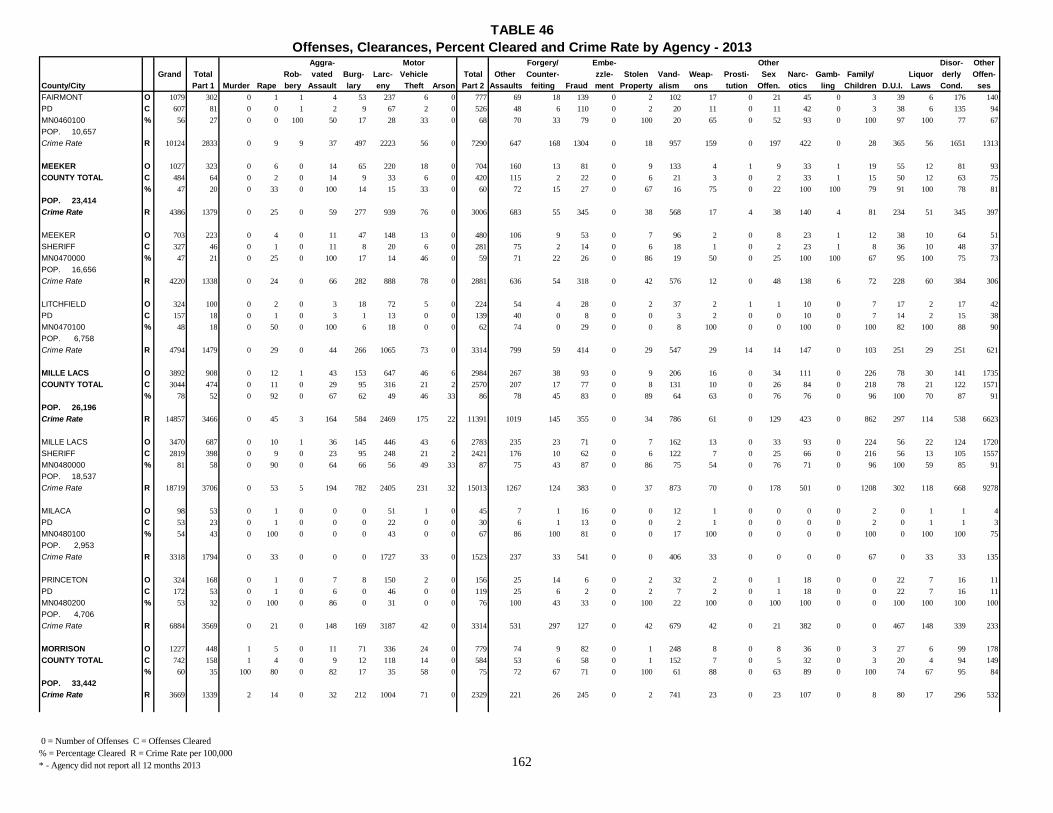
TABLE 46Offenses, Clearances, Percent Cleared and Crime Rate by Agency - 2013
0 = Number of Offenses C = Offenses Cleared % = Percentage Cleared R = Crime Rate per 100,000 * - Agency did not report all 12 months 2013 162
Aggra- Motor Forgery/ Embe- Other Disor- OtherGrand Total Rob- vated Burg- Larc- Vehicle Total Other Counter- zzle- Stolen Vand- Weap- Prosti- Sex Narc- Gamb- Family/ Liquor derly Offen-
County/City Part 1 Murder Rape bery Assault lary eny Theft Arson Part 2 Assaults feiting Fraud ment Property alism ons tution Offen. otics ling Children D.U.I. Laws Cond. sesFAIRMONT O 1079 302 0 1 1 4 53 237 6 0 777 69 18 139 0 2 102 17 0 21 45 0 3 39 6 176 140PD C 607 81 0 0 1 2 9 67 2 0 526 48 6 110 0 2 20 11 0 11 42 0 3 38 6 135 94MN0460100 % 56 27 0 0 100 50 17 28 33 0 68 70 33 79 0 100 20 65 0 52 93 0 100 97 100 77 67POP. 10,657Crime Rate R 10124 2833 0 9 9 37 497 2223 56 0 7290 647 168 1304 0 18 957 159 0 197 422 0 28 365 56 1651 1313
MEEKER O 1027 323 0 6 0 14 65 220 18 0 704 160 13 81 0 9 133 4 1 9 33 1 19 55 12 81 93COUNTY TOTAL C 484 64 0 2 0 14 9 33 6 0 420 115 2 22 0 6 21 3 0 2 33 1 15 50 12 63 75
% 47 20 0 33 0 100 14 15 33 0 60 72 15 27 0 67 16 75 0 22 100 100 79 91 100 78 81POP. 23,414Crime Rate R 4386 1379 0 25 0 59 277 939 76 0 3006 683 55 345 0 38 568 17 4 38 140 4 81 234 51 345 397
MEEKER O 703 223 0 4 0 11 47 148 13 0 480 106 9 53 0 7 96 2 0 8 23 1 12 38 10 64 51SHERIFF C 327 46 0 1 0 11 8 20 6 0 281 75 2 14 0 6 18 1 0 2 23 1 8 36 10 48 37MN0470000 % 47 21 0 25 0 100 17 14 46 0 59 71 22 26 0 86 19 50 0 25 100 100 67 95 100 75 73POP. 16,656Crime Rate R 4220 1338 0 24 0 66 282 888 78 0 2881 636 54 318 0 42 576 12 0 48 138 6 72 228 60 384 306
LITCHFIELD O 324 100 0 2 0 3 18 72 5 0 224 54 4 28 0 2 37 2 1 1 10 0 7 17 2 17 42PD C 157 18 0 1 0 3 1 13 0 0 139 40 0 8 0 0 3 2 0 0 10 0 7 14 2 15 38MN0470100 % 48 18 0 50 0 100 6 18 0 0 62 74 0 29 0 0 8 100 0 0 100 0 100 82 100 88 90POP. 6,758Crime Rate R 4794 1479 0 29 0 44 266 1065 73 0 3314 799 59 414 0 29 547 29 14 14 147 0 103 251 29 251 621
MILLE LACS O 3892 908 0 12 1 43 153 647 46 6 2984 267 38 93 0 9 206 16 0 34 111 0 226 78 30 141 1735COUNTY TOTAL C 3044 474 0 11 0 29 95 316 21 2 2570 207 17 77 0 8 131 10 0 26 84 0 218 78 21 122 1571
% 78 52 0 92 0 67 62 49 46 33 86 78 45 83 0 89 64 63 0 76 76 0 96 100 70 87 91POP. 26,196Crime Rate R 14857 3466 0 45 3 164 584 2469 175 22 11391 1019 145 355 0 34 786 61 0 129 423 0 862 297 114 538 6623
MILLE LACS O 3470 687 0 10 1 36 145 446 43 6 2783 235 23 71 0 7 162 13 0 33 93 0 224 56 22 124 1720SHERIFF C 2819 398 0 9 0 23 95 248 21 2 2421 176 10 62 0 6 122 7 0 25 66 0 216 56 13 105 1557MN0480000 % 81 58 0 90 0 64 66 56 49 33 87 75 43 87 0 86 75 54 0 76 71 0 96 100 59 85 91POP. 18,537Crime Rate R 18719 3706 0 53 5 194 782 2405 231 32 15013 1267 124 383 0 37 873 70 0 178 501 0 1208 302 118 668 9278
MILACA O 98 53 0 1 0 0 0 51 1 0 45 7 1 16 0 0 12 1 0 0 0 0 2 0 1 1 4PD C 53 23 0 1 0 0 0 22 0 0 30 6 1 13 0 0 2 1 0 0 0 0 2 0 1 1 3MN0480100 % 54 43 0 100 0 0 0 43 0 0 67 86 100 81 0 0 17 100 0 0 0 0 100 0 100 100 75POP. 2,953Crime Rate R 3318 1794 0 33 0 0 0 1727 33 0 1523 237 33 541 0 0 406 33 0 0 0 0 67 0 33 33 135
PRINCETON O 324 168 0 1 0 7 8 150 2 0 156 25 14 6 0 2 32 2 0 1 18 0 0 22 7 16 11PD C 172 53 0 1 0 6 0 46 0 0 119 25 6 2 0 2 7 2 0 1 18 0 0 22 7 16 11MN0480200 % 53 32 0 100 0 86 0 31 0 0 76 100 43 33 0 100 22 100 0 100 100 0 0 100 100 100 100POP. 4,706Crime Rate R 6884 3569 0 21 0 148 169 3187 42 0 3314 531 297 127 0 42 679 42 0 21 382 0 0 467 148 339 233
MORRISON O 1227 448 1 5 0 11 71 336 24 0 779 74 9 82 0 1 248 8 0 8 36 0 3 27 6 99 178COUNTY TOTAL C 742 158 1 4 0 9 12 118 14 0 584 53 6 58 0 1 152 7 0 5 32 0 3 20 4 94 149
% 60 35 100 80 0 82 17 35 58 0 75 72 67 71 0 100 61 88 0 63 89 0 100 74 67 95 84POP. 33,442Crime Rate R 3669 1339 2 14 0 32 212 1004 71 0 2329 221 26 245 0 2 741 23 0 23 107 0 8 80 17 296 532

TABLE 46Offenses, Clearances, Percent Cleared and Crime Rate by Agency - 2013
0 = Number of Offenses C = Offenses Cleared % = Percentage Cleared R = Crime Rate per 100,000 * - Agency did not report all 12 months 2013 163
Aggra- Motor Forgery/ Embe- Other Disor- OtherGrand Total Rob- vated Burg- Larc- Vehicle Total Other Counter- zzle- Stolen Vand- Weap- Prosti- Sex Narc- Gamb- Family/ Liquor derly Offen-
County/City Part 1 Murder Rape bery Assault lary eny Theft Arson Part 2 Assaults feiting Fraud ment Property alism ons tution Offen. otics ling Children D.U.I. Laws Cond. sesMORRISON O 650 243 1 4 0 2 52 166 18 0 407 23 6 66 0 0 123 7 0 4 5 0 3 8 0 79 83SHERIFF C 371 79 1 3 0 1 5 59 10 0 292 20 4 50 0 0 52 7 0 3 2 0 3 2 0 77 72MN0490000 % 57 33 100 75 0 50 10 36 56 0 72 87 67 76 0 0 42 100 0 75 40 0 100 25 0 97 87POP. 25,039Crime Rate R 2595 970 3 15 0 7 207 662 71 0 1625 91 23 263 0 0 491 27 0 15 19 0 11 31 0 315 331
LITTLE FALLS O 577 205 0 1 0 9 19 170 6 0 372 51 3 16 0 1 125 1 0 4 31 0 0 19 6 20 95PD C 371 79 0 1 0 8 7 59 4 0 292 33 2 8 0 1 100 0 0 2 30 0 0 18 4 17 77MN0490100 % 64 39 0 100 0 89 37 35 67 0 78 65 67 50 0 100 80 0 0 50 97 0 0 95 67 85 81POP. 8,403Crime Rate R 6866 2439 0 11 0 107 226 2023 71 0 4426 606 35 190 0 11 1487 11 0 47 368 0 0 226 71 238 1130
MOWER O 4493 987 1 20 9 56 207 637 56 1 3506 355 47 154 0 7 494 13 0 72 176 0 59 206 75 808 1040COUNTY TOTAL C 3128 377 0 11 4 40 53 252 17 0 2751 260 18 53 0 6 281 11 0 31 149 0 20 205 74 701 942
% 70 38 0 55 44 71 26 40 30 0 78 73 38 34 0 86 57 85 0 43 85 0 34 100 99 87 91POP. 39,601Crime Rate R 11345 2492 2 50 22 141 522 1608 141 2 8853 896 118 388 0 17 1247 32 0 181 444 0 148 520 189 2040 2626
MOWER O 950 170 0 8 2 14 69 67 10 0 780 54 8 28 0 4 83 1 0 15 43 0 12 45 10 114 363SHERIFF C 674 44 0 4 1 10 17 11 1 0 630 44 5 10 0 3 44 1 0 8 33 0 3 44 10 91 334MN0500000 % 71 26 0 50 50 71 25 16 10 0 81 81 63 36 0 75 53 100 0 53 77 0 25 98 100 80 92POP. 14,608Crime Rate R 6503 1163 0 54 13 95 472 458 68 0 5339 369 54 191 0 27 568 6 0 102 294 0 82 308 68 780 2484
AUSTIN O 3543 817 1 12 7 42 138 570 46 1 2726 301 39 126 0 3 411 12 0 57 133 0 47 161 65 694 677PD C 2454 333 0 7 3 30 36 241 16 0 2121 216 13 43 0 3 237 10 0 23 116 0 17 161 64 610 608MN0500100 % 69 41 0 58 43 71 26 42 35 0 78 72 33 34 0 100 58 83 0 40 87 0 36 100 98 88 90POP. 24,993Crime Rate R 14175 3268 4 48 28 168 552 2280 184 4 10907 1204 156 504 0 12 1644 48 0 228 532 0 188 644 260 2776 2708
MURRAY O 206 59 0 1 0 2 12 42 2 0 147 13 8 21 0 1 13 1 0 1 46 0 8 6 4 17 8COUNTY TOTAL C 205 58 0 1 0 2 12 41 2 0 147 13 8 21 0 1 13 1 0 1 46 0 8 6 4 17 8
% 100 98 0 100 0 100 100 98 100 0 100 100 100 100 0 100 100 100 0 100 100 0 100 100 100 100 100POP. 8,685Crime Rate R 2371 679 0 11 0 23 138 483 23 0 1692 149 92 241 0 11 149 11 0 11 529 0 92 69 46 195 92
MURRAY O 146 41 0 1 0 1 7 30 2 0 105 9 5 11 0 1 5 1 0 0 44 0 7 5 2 9 6SHERIFF C 145 40 0 1 0 1 7 29 2 0 105 9 5 11 0 1 5 1 0 0 44 0 7 5 2 9 6MN0510000 % 99 98 0 100 0 100 100 97 100 0 100 100 100 100 0 100 100 100 0 0 100 0 100 100 100 100 100POP. 6,540Crime Rate R 2232 626 0 15 0 15 107 458 30 0 1605 137 76 168 0 15 76 15 0 0 672 0 107 76 30 137 91
SLAYTON O 60 18 0 0 0 1 5 12 0 0 42 4 3 10 0 0 8 0 0 1 2 0 1 1 2 8 2PD C 60 18 0 0 0 1 5 12 0 0 42 4 3 10 0 0 8 0 0 1 2 0 1 1 2 8 2MN0510200 % 100 100 0 0 0 100 100 100 0 0 100 100 100 100 0 0 100 0 0 100 100 0 100 100 100 100 100POP. 2,145Crime Rate R 2797 839 0 0 0 46 233 559 0 0 1958 186 139 466 0 0 372 0 0 46 93 0 46 46 93 372 93
NICOLLET O 2464 634 1 16 4 31 129 416 35 2 1830 149 18 98 0 7 224 19 0 42 85 0 57 81 77 185 788COUNTY TOTAL C 1553 192 1 8 2 21 35 112 13 0 1361 117 4 33 0 6 88 10 0 31 76 0 52 73 73 157 641
% 63 30 100 50 50 68 27 27 37 0 74 79 22 34 0 86 39 53 0 74 89 0 91 90 95 85 81POP. 33,020Crime Rate R 7462 1920 3 48 12 93 390 1259 105 6 5542 451 54 296 0 21 678 57 0 127 257 0 172 245 233 560 2386

TABLE 46Offenses, Clearances, Percent Cleared and Crime Rate by Agency - 2013
0 = Number of Offenses C = Offenses Cleared % = Percentage Cleared R = Crime Rate per 100,000 * - Agency did not report all 12 months 2013 164
Aggra- Motor Forgery/ Embe- Other Disor- OtherGrand Total Rob- vated Burg- Larc- Vehicle Total Other Counter- zzle- Stolen Vand- Weap- Prosti- Sex Narc- Gamb- Family/ Liquor derly Offen-
County/City Part 1 Murder Rape bery Assault lary eny Theft Arson Part 2 Assaults feiting Fraud ment Property alism ons tution Offen. otics ling Children D.U.I. Laws Cond. sesNICOLLET O 906 81 0 7 0 1 28 37 8 0 825 11 1 17 0 5 33 7 0 3 15 0 0 12 2 20 699SHERIFF C 670 22 0 5 0 1 5 8 3 0 648 11 0 0 0 4 10 6 0 2 13 0 0 12 2 18 570MN0520000 % 74 27 0 71 0 100 18 22 38 0 79 100 0 0 0 80 30 86 0 67 87 0 0 100 100 90 82POP. 8,202Crime Rate R 11046 987 0 85 0 12 341 451 97 0 10058 134 12 207 0 60 402 85 0 36 182 0 0 146 24 243 8522
NORTH MANKATO O 820 294 0 4 2 16 65 188 17 2 526 78 2 44 0 2 98 10 0 28 30 0 56 23 12 90 53PD C 479 88 0 1 1 13 23 45 5 0 391 61 1 21 0 2 49 4 0 22 27 0 52 22 11 78 41MN0520100 % 58 30 0 25 50 81 35 24 29 0 74 78 50 48 0 100 50 40 0 79 90 0 93 96 92 87 77POP. 13,523Crime Rate R 6063 2174 0 29 14 118 480 1390 125 14 3889 576 14 325 0 14 724 73 0 207 221 0 414 170 88 665 391
ST. PETER O 738 259 1 5 2 14 36 191 10 0 479 60 15 37 0 0 93 2 0 11 40 0 1 46 63 75 36PD C 404 82 1 2 1 7 7 59 5 0 322 45 3 12 0 0 29 0 0 7 36 0 0 39 60 61 30MN0520200 % 55 32 100 40 50 50 19 31 50 0 67 75 20 32 0 0 31 0 0 64 90 0 0 85 95 81 83POP. 11,295Crime Rate R 6533 2293 8 44 17 123 318 1691 88 0 4240 531 132 327 0 0 823 17 0 97 354 0 8 407 557 664 318
NOBLES O 663 229 0 7 2 24 41 144 9 2 434 58 9 29 0 5 73 2 0 1 37 0 1 136 4 36 43COUNTY TOTAL C 452 108 0 5 0 23 6 69 4 1 344 54 7 16 0 5 6 2 0 0 37 0 1 136 4 35 41
% 68 47 0 71 0 96 15 48 44 50 79 93 78 55 0 100 8 100 0 0 100 0 100 100 100 97 95POP. 21,534Crime Rate R 3078 1063 0 32 9 111 190 668 41 9 2015 269 41 134 0 23 338 9 0 4 171 0 4 631 18 167 199
NOBLES O 128 44 0 3 0 5 11 21 3 1 84 9 1 2 0 1 12 0 0 0 10 0 0 35 0 2 12SHERIFF C 85 16 0 2 0 5 2 5 2 0 69 9 1 0 0 1 2 0 0 0 10 0 0 35 0 1 10MN0530000 % 66 36 0 67 0 100 18 24 67 0 82 100 100 0 0 100 17 0 0 0 100 0 0 100 0 50 83POP. 8,676Crime Rate R 1475 507 0 34 0 57 126 242 34 11 968 103 11 23 0 11 138 0 0 0 115 0 0 403 0 23 138
WORTHINGTON O 535 185 0 4 2 19 30 123 6 1 350 49 8 27 0 4 61 2 0 1 27 0 1 101 4 34 31PD C 367 92 0 3 0 18 4 64 2 1 275 45 6 16 0 4 4 2 0 0 27 0 1 101 4 34 31MN0530100 % 69 50 0 75 0 95 13 52 33 100 79 92 75 59 0 100 7 100 0 0 100 0 100 100 100 100 100POP. 12,858Crime Rate R 4160 1438 0 31 15 147 233 956 46 7 2722 381 62 209 0 31 474 15 0 7 209 0 7 785 31 264 241
NORMAN* O 2 2 0 0 0 0 1 1 0 0 0 0 0 0 0 0 0 0 0 0 0 0 0 0 0 0 0SHERIFF C 1 1 0 0 0 0 0 1 0 0 0 0 0 0 0 0 0 0 0 0 0 0 0 0 0 0 0MN0540000 % 50 50 0 0 0 0 0 100 0 0 0 0 0 0 0 0 0 0 0 0 0 0 0 0 0 0 0POP. 6,913Crime Rate R 28 28 0 0 0 0 14 14 0 0 0 0 0 0 0 0 0 0 0 0 0 0 0 0 0 0 0
OLMSTED O 6872 3136 0 58 56 124 564 2209 117 8 3736 627 80 318 0 32 602 35 24 110 430 0 86 350 70 284 688COUNTY TOTAL C 3242 1036 0 25 25 86 71 793 34 2 2206 429 19 52 0 20 87 22 20 43 394 0 9 335 58 198 520
% 47 33 0 43 45 69 13 36 29 25 59 68 24 16 0 63 14 63 83 39 92 0 10 96 83 70 76POP. 146,704Crime Rate R 4684 2137 0 39 38 84 384 1505 79 5 2546 427 54 216 0 21 410 23 16 74 293 0 58 238 47 193 468
OLMSTED O 1024 358 0 8 2 14 135 183 14 2 666 79 8 56 0 8 98 7 1 27 88 0 9 105 13 30 137SHERIFF C 490 73 0 5 1 13 19 32 2 1 417 60 2 6 0 3 11 6 0 15 78 0 3 100 11 19 103MN0550000 % 48 20 0 63 50 93 14 17 14 50 63 76 25 11 0 38 11 86 0 56 89 0 33 95 85 63 75POP. 38,122Crime Rate R 2686 939 0 20 5 36 354 480 36 5 1747 207 20 146 0 20 257 18 2 70 230 0 23 275 34 78 359

TABLE 46Offenses, Clearances, Percent Cleared and Crime Rate by Agency - 2013
0 = Number of Offenses C = Offenses Cleared % = Percentage Cleared R = Crime Rate per 100,000 * - Agency did not report all 12 months 2013 165
Aggra- Motor Forgery/ Embe- Other Disor- OtherGrand Total Rob- vated Burg- Larc- Vehicle Total Other Counter- zzle- Stolen Vand- Weap- Prosti- Sex Narc- Gamb- Family/ Liquor derly Offen-
County/City Part 1 Murder Rape bery Assault lary eny Theft Arson Part 2 Assaults feiting Fraud ment Property alism ons tution Offen. otics ling Children D.U.I. Laws Cond. sesROCHESTER O 5848 2778 0 50 54 110 429 2026 103 6 3070 548 72 262 0 24 504 28 23 83 342 0 77 245 57 254 551PD C 2752 963 0 20 24 73 52 761 32 1 1789 369 17 46 0 17 76 16 20 28 316 0 6 235 47 179 417MN0550100 % 47 35 0 40 44 66 12 38 31 17 58 67 24 18 0 71 15 57 87 34 92 0 8 96 82 70 76POP. 108,582Crime Rate R 5385 2558 0 46 49 101 395 1865 94 5 2827 504 66 241 0 22 464 25 21 76 314 0 70 225 52 233 507
OTTERTAIL O 3315 995 1 11 3 55 275 614 36 0 2320 310 30 174 1 3 317 15 4 39 183 0 330 212 57 324 321COUNTY TOTAL C 2150 373 1 9 1 52 67 224 19 0 1777 288 17 115 1 3 81 13 2 28 158 0 293 208 57 259 254
% 65 37 100 82 33 95 24 36 53 0 77 93 57 66 100 100 26 87 50 72 86 0 89 98 100 80 79POP. 58,553Crime Rate R 5661 1699 1 18 5 93 469 1048 61 0 3962 529 51 297 1 5 541 25 6 66 312 0 563 362 97 553 548
OTTERTAIL O 1537 474 1 11 0 21 173 244 24 0 1063 114 6 61 1 2 137 7 2 22 71 0 142 155 34 131 178SHERIFF C 843 139 1 9 0 21 39 57 12 0 704 99 1 18 1 2 17 6 1 13 57 0 110 154 34 73 118MN0560000 % 55 29 100 82 0 100 23 23 50 0 66 87 17 30 100 100 12 86 50 59 80 0 77 99 100 56 66POP. 44,344Crime Rate R 3466 1068 2 24 0 47 390 550 54 0 2397 257 13 137 2 4 308 15 4 49 160 0 320 349 76 295 401
FERGUS FALLS O 1778 521 0 0 3 34 102 370 12 0 1257 196 24 113 0 1 180 8 2 17 112 0 188 57 23 193 143PD C 1307 234 0 0 1 31 28 167 7 0 1073 189 16 97 0 1 64 7 1 15 101 0 183 54 23 186 136MN0560100 % 74 45 0 0 33 91 27 45 58 0 85 96 67 86 0 100 36 88 50 88 90 0 97 95 100 96 95POP. 13,209Crime Rate R 13460 3944 0 0 22 257 772 2801 90 0 9516 1483 181 855 0 7 1362 60 15 128 847 0 1423 431 174 1461 1082
PENNINGTON* O 644 224 0 7 0 7 29 165 14 2 420 56 13 62 0 3 79 3 0 10 26 0 3 46 9 47 63COUNTY TOTAL C 412 92 0 2 0 7 12 63 7 1 320 49 6 46 0 2 28 3 0 9 25 0 3 46 9 41 53
% 64 41 0 29 0 100 41 38 50 50 76 88 46 74 0 67 35 100 0 90 96 0 100 100 100 87 84POP. 14,162Crime Rate R 4547 1581 0 49 0 49 204 1165 98 14 2965 395 91 437 0 21 557 21 0 70 183 0 21 324 63 331 444
PENNINGTON O 155 53 0 0 0 3 14 29 6 1 102 11 3 43 0 0 16 0 0 4 2 0 0 3 1 5 14SHERIFF C 103 17 0 0 0 3 4 8 2 0 86 9 2 42 0 0 7 0 0 4 2 0 0 3 1 5 11MN0570000 % 66 32 0 0 0 100 29 28 33 0 84 82 67 98 0 0 44 0 0 100 100 0 0 100 100 100 79POP. 5,446Crime Rate R 2846 973 0 0 0 55 257 532 110 18 1872 201 55 789 0 0 293 0 0 73 36 0 0 55 18 91 257
THIEF RIVER FALLS O 489 171 0 7 0 4 15 136 8 1 318 45 10 19 0 3 63 3 0 6 24 0 3 43 8 42 49PD C 309 75 0 2 0 4 8 55 5 1 234 40 4 4 0 2 21 3 0 5 23 0 3 43 8 36 42MN0570100 % 63 44 0 29 0 100 53 40 63 100 74 89 40 21 0 67 33 100 0 83 96 0 100 100 100 86 86POP. 8,716Crime Rate R 5610 1961 0 80 0 45 172 1560 91 11 3648 516 114 217 0 34 722 34 0 68 275 0 34 493 91 481 562
PINE O 2416 1389 0 23 1 58 242 978 87 0 1027 280 24 33 0 17 105 12 1 41 127 0 8 78 29 69 203SHERIFF C 1113 314 0 17 0 53 44 176 24 0 799 226 15 14 0 14 43 9 0 26 120 0 7 77 29 53 166MN0580000 % 46 23 0 74 0 91 18 18 28 0 78 81 63 42 0 82 41 75 0 63 94 0 88 99 100 77 82POP. 29,794Crime Rate R 8109 4662 0 77 3 194 812 3282 292 0 3447 939 80 110 0 57 352 40 3 137 426 0 26 261 97 231 681
PIPESTONE O 289 89 0 0 0 2 14 72 1 0 200 46 0 4 0 1 80 0 0 1 17 0 0 23 13 1 14SHERIFF C 93 11 0 0 0 2 1 8 0 0 82 24 0 0 0 1 0 0 0 0 16 0 0 23 13 0 5MN0590000 % 32 12 0 0 0 100 7 11 0 0 41 52 0 0 0 100 0 0 0 0 94 0 0 100 100 0 36POP. 9,562Crime Rate R 3022 930 0 0 0 20 146 752 10 0 2091 481 0 41 0 10 836 0 0 10 177 0 0 240 135 10 146
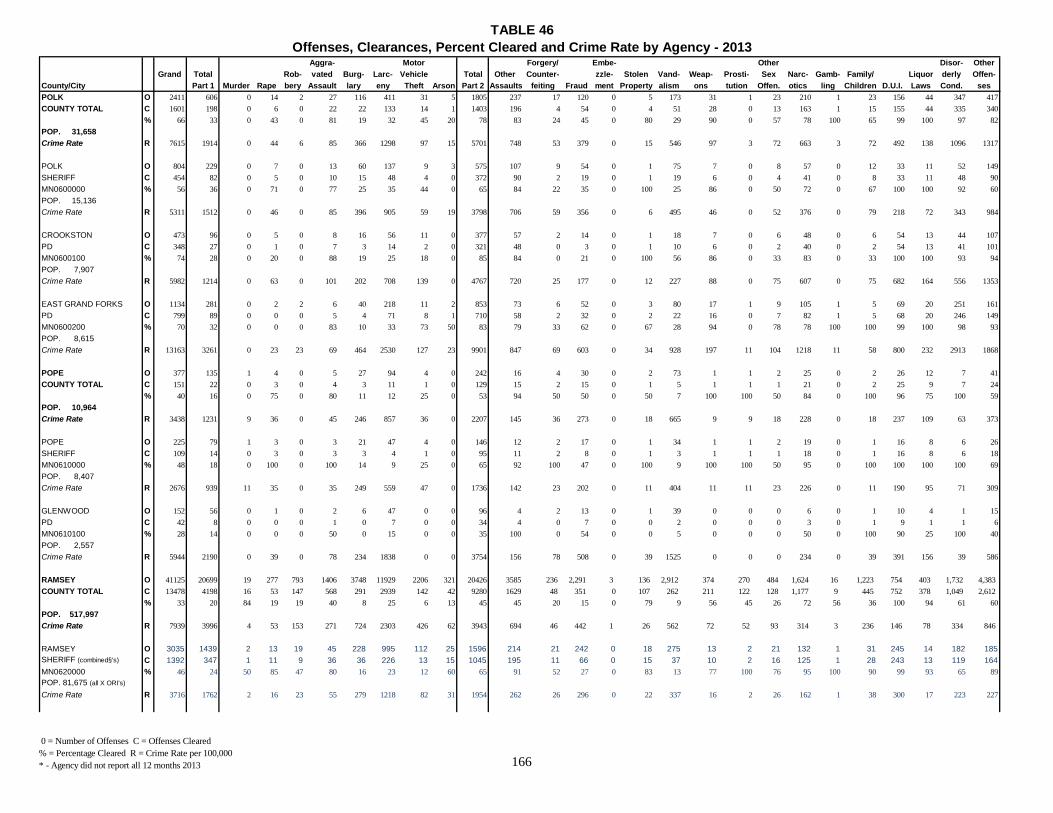
TABLE 46Offenses, Clearances, Percent Cleared and Crime Rate by Agency - 2013
0 = Number of Offenses C = Offenses Cleared % = Percentage Cleared R = Crime Rate per 100,000 * - Agency did not report all 12 months 2013 166
Aggra- Motor Forgery/ Embe- Other Disor- OtherGrand Total Rob- vated Burg- Larc- Vehicle Total Other Counter- zzle- Stolen Vand- Weap- Prosti- Sex Narc- Gamb- Family/ Liquor derly Offen-
County/City Part 1 Murder Rape bery Assault lary eny Theft Arson Part 2 Assaults feiting Fraud ment Property alism ons tution Offen. otics ling Children D.U.I. Laws Cond. sesPOLK O 2411 606 0 14 2 27 116 411 31 5 1805 237 17 120 0 5 173 31 1 23 210 1 23 156 44 347 417COUNTY TOTAL C 1601 198 0 6 0 22 22 133 14 1 1403 196 4 54 0 4 51 28 0 13 163 1 15 155 44 335 340
% 66 33 0 43 0 81 19 32 45 20 78 83 24 45 0 80 29 90 0 57 78 100 65 99 100 97 82POP. 31,658Crime Rate R 7615 1914 0 44 6 85 366 1298 97 15 5701 748 53 379 0 15 546 97 3 72 663 3 72 492 138 1096 1317
POLK O 804 229 0 7 0 13 60 137 9 3 575 107 9 54 0 1 75 7 0 8 57 0 12 33 11 52 149SHERIFF C 454 82 0 5 0 10 15 48 4 0 372 90 2 19 0 1 19 6 0 4 41 0 8 33 11 48 90MN0600000 % 56 36 0 71 0 77 25 35 44 0 65 84 22 35 0 100 25 86 0 50 72 0 67 100 100 92 60POP. 15,136Crime Rate R 5311 1512 0 46 0 85 396 905 59 19 3798 706 59 356 0 6 495 46 0 52 376 0 79 218 72 343 984
CROOKSTON O 473 96 0 5 0 8 16 56 11 0 377 57 2 14 0 1 18 7 0 6 48 0 6 54 13 44 107PD C 348 27 0 1 0 7 3 14 2 0 321 48 0 3 0 1 10 6 0 2 40 0 2 54 13 41 101MN0600100 % 74 28 0 20 0 88 19 25 18 0 85 84 0 21 0 100 56 86 0 33 83 0 33 100 100 93 94POP. 7,907Crime Rate R 5982 1214 0 63 0 101 202 708 139 0 4767 720 25 177 0 12 227 88 0 75 607 0 75 682 164 556 1353
EAST GRAND FORKS O 1134 281 0 2 2 6 40 218 11 2 853 73 6 52 0 3 80 17 1 9 105 1 5 69 20 251 161PD C 799 89 0 0 0 5 4 71 8 1 710 58 2 32 0 2 22 16 0 7 82 1 5 68 20 246 149MN0600200 % 70 32 0 0 0 83 10 33 73 50 83 79 33 62 0 67 28 94 0 78 78 100 100 99 100 98 93POP. 8,615Crime Rate R 13163 3261 0 23 23 69 464 2530 127 23 9901 847 69 603 0 34 928 197 11 104 1218 11 58 800 232 2913 1868
POPE O 377 135 1 4 0 5 27 94 4 0 242 16 4 30 0 2 73 1 1 2 25 0 2 26 12 7 41COUNTY TOTAL C 151 22 0 3 0 4 3 11 1 0 129 15 2 15 0 1 5 1 1 1 21 0 2 25 9 7 24
% 40 16 0 75 0 80 11 12 25 0 53 94 50 50 0 50 7 100 100 50 84 0 100 96 75 100 59POP. 10,964Crime Rate R 3438 1231 9 36 0 45 246 857 36 0 2207 145 36 273 0 18 665 9 9 18 228 0 18 237 109 63 373
POPE O 225 79 1 3 0 3 21 47 4 0 146 12 2 17 0 1 34 1 1 2 19 0 1 16 8 6 26SHERIFF C 109 14 0 3 0 3 3 4 1 0 95 11 2 8 0 1 3 1 1 1 18 0 1 16 8 6 18MN0610000 % 48 18 0 100 0 100 14 9 25 0 65 92 100 47 0 100 9 100 100 50 95 0 100 100 100 100 69POP. 8,407Crime Rate R 2676 939 11 35 0 35 249 559 47 0 1736 142 23 202 0 11 404 11 11 23 226 0 11 190 95 71 309
GLENWOOD O 152 56 0 1 0 2 6 47 0 0 96 4 2 13 0 1 39 0 0 0 6 0 1 10 4 1 15PD C 42 8 0 0 0 1 0 7 0 0 34 4 0 7 0 0 2 0 0 0 3 0 1 9 1 1 6MN0610100 % 28 14 0 0 0 50 0 15 0 0 35 100 0 54 0 0 5 0 0 0 50 0 100 90 25 100 40POP. 2,557Crime Rate R 5944 2190 0 39 0 78 234 1838 0 0 3754 156 78 508 0 39 1525 0 0 0 234 0 39 391 156 39 586
RAMSEY O 41125 20699 19 277 793 1406 3748 11929 2206 321 20426 3585 236 2,291 3 136 2,912 374 270 484 1,624 16 1,223 754 403 1,732 4,383 COUNTY TOTAL C 13478 4198 16 53 147 568 291 2939 142 42 9280 1629 48 351 0 107 262 211 122 128 1,177 9 445 752 378 1,049 2,612
% 33 20 84 19 19 40 8 25 6 13 45 45 20 15 0 79 9 56 45 26 72 56 36 100 94 61 60POP. 517,997Crime Rate R 7939 3996 4 53 153 271 724 2303 426 62 3943 694 46 442 1 26 562 72 52 93 314 3 236 146 78 334 846
RAMSEY O 3035 1439 2 13 19 45 228 995 112 25 1596 214 21 242 0 18 275 13 2 21 132 1 31 245 14 182 185SHERIFF (combined§'s) C 1392 347 1 11 9 36 36 226 13 15 1045 195 11 66 0 15 37 10 2 16 125 1 28 243 13 119 164MN0620000 % 46 24 50 85 47 80 16 23 12 60 65 91 52 27 0 83 13 77 100 76 95 100 90 99 93 65 89POP. 81,675 (all X ORI's)
Crime Rate R 3716 1762 2 16 23 55 279 1218 82 31 1954 262 26 296 0 22 337 16 2 26 162 1 38 300 17 223 227
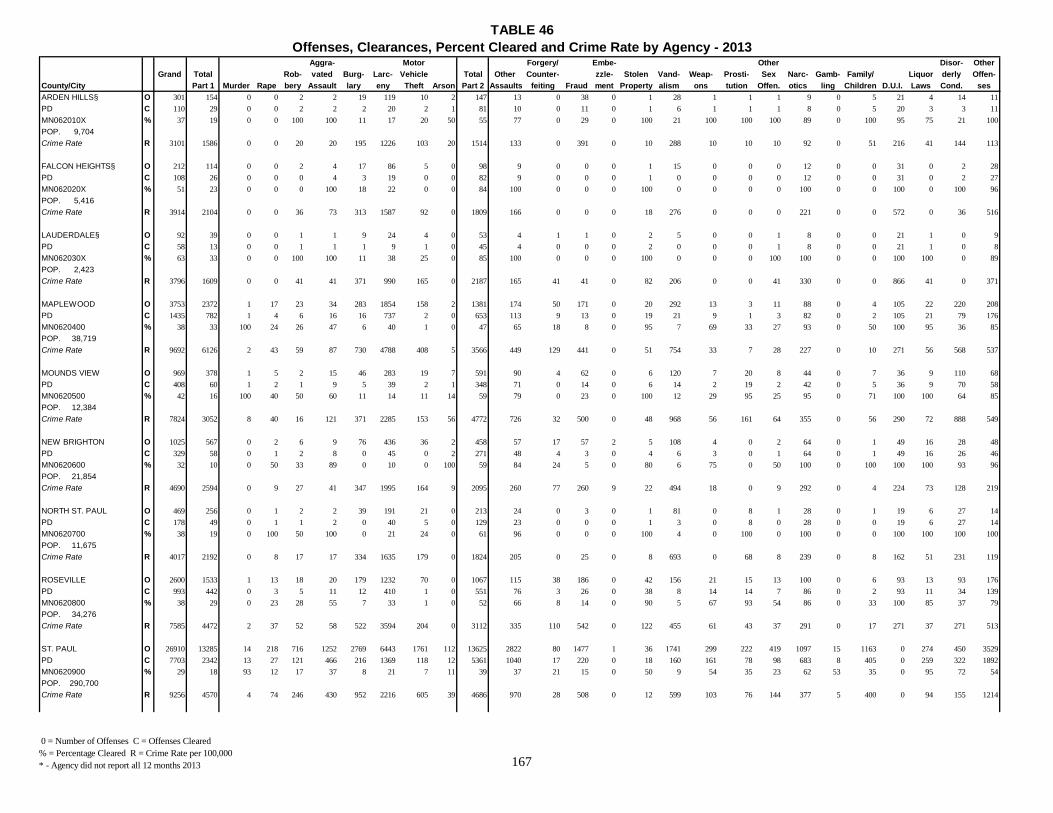
TABLE 46Offenses, Clearances, Percent Cleared and Crime Rate by Agency - 2013
0 = Number of Offenses C = Offenses Cleared % = Percentage Cleared R = Crime Rate per 100,000 * - Agency did not report all 12 months 2013 167
Aggra- Motor Forgery/ Embe- Other Disor- OtherGrand Total Rob- vated Burg- Larc- Vehicle Total Other Counter- zzle- Stolen Vand- Weap- Prosti- Sex Narc- Gamb- Family/ Liquor derly Offen-
County/City Part 1 Murder Rape bery Assault lary eny Theft Arson Part 2 Assaults feiting Fraud ment Property alism ons tution Offen. otics ling Children D.U.I. Laws Cond. sesARDEN HILLS§ O 301 154 0 0 2 2 19 119 10 2 147 13 0 38 0 1 28 1 1 1 9 0 5 21 4 14 11PD C 110 29 0 0 2 2 2 20 2 1 81 10 0 11 0 1 6 1 1 1 8 0 5 20 3 3 11MN062010X % 37 19 0 0 100 100 11 17 20 50 55 77 0 29 0 100 21 100 100 100 89 0 100 95 75 21 100POP. 9,704Crime Rate R 3101 1586 0 0 20 20 195 1226 103 20 1514 133 0 391 0 10 288 10 10 10 92 0 51 216 41 144 113
FALCON HEIGHTS§ O 212 114 0 0 2 4 17 86 5 0 98 9 0 0 0 1 15 0 0 0 12 0 0 31 0 2 28PD C 108 26 0 0 0 4 3 19 0 0 82 9 0 0 0 1 0 0 0 0 12 0 0 31 0 2 27MN062020X % 51 23 0 0 0 100 18 22 0 0 84 100 0 0 0 100 0 0 0 0 100 0 0 100 0 100 96POP. 5,416Crime Rate R 3914 2104 0 0 36 73 313 1587 92 0 1809 166 0 0 0 18 276 0 0 0 221 0 0 572 0 36 516
LAUDERDALE§ O 92 39 0 0 1 1 9 24 4 0 53 4 1 1 0 2 5 0 0 1 8 0 0 21 1 0 9PD C 58 13 0 0 1 1 1 9 1 0 45 4 0 0 0 2 0 0 0 1 8 0 0 21 1 0 8MN062030X % 63 33 0 0 100 100 11 38 25 0 85 100 0 0 0 100 0 0 0 100 100 0 0 100 100 0 89POP. 2,423Crime Rate R 3796 1609 0 0 41 41 371 990 165 0 2187 165 41 41 0 82 206 0 0 41 330 0 0 866 41 0 371
MAPLEWOOD O 3753 2372 1 17 23 34 283 1854 158 2 1381 174 50 171 0 20 292 13 3 11 88 0 4 105 22 220 208PD C 1435 782 1 4 6 16 16 737 2 0 653 113 9 13 0 19 21 9 1 3 82 0 2 105 21 79 176MN0620400 % 38 33 100 24 26 47 6 40 1 0 47 65 18 8 0 95 7 69 33 27 93 0 50 100 95 36 85POP. 38,719Crime Rate R 9692 6126 2 43 59 87 730 4788 408 5 3566 449 129 441 0 51 754 33 7 28 227 0 10 271 56 568 537
MOUNDS VIEW O 969 378 1 5 2 15 46 283 19 7 591 90 4 62 0 6 120 7 20 8 44 0 7 36 9 110 68PD C 408 60 1 2 1 9 5 39 2 1 348 71 0 14 0 6 14 2 19 2 42 0 5 36 9 70 58MN0620500 % 42 16 100 40 50 60 11 14 11 14 59 79 0 23 0 100 12 29 95 25 95 0 71 100 100 64 85POP. 12,384Crime Rate R 7824 3052 8 40 16 121 371 2285 153 56 4772 726 32 500 0 48 968 56 161 64 355 0 56 290 72 888 549
NEW BRIGHTON O 1025 567 0 2 6 9 76 436 36 2 458 57 17 57 2 5 108 4 0 2 64 0 1 49 16 28 48PD C 329 58 0 1 2 8 0 45 0 2 271 48 4 3 0 4 6 3 0 1 64 0 1 49 16 26 46MN0620600 % 32 10 0 50 33 89 0 10 0 100 59 84 24 5 0 80 6 75 0 50 100 0 100 100 100 93 96POP. 21,854Crime Rate R 4690 2594 0 9 27 41 347 1995 164 9 2095 260 77 260 9 22 494 18 0 9 292 0 4 224 73 128 219
NORTH ST. PAUL O 469 256 0 1 2 2 39 191 21 0 213 24 0 3 0 1 81 0 8 1 28 0 1 19 6 27 14PD C 178 49 0 1 1 2 0 40 5 0 129 23 0 0 0 1 3 0 8 0 28 0 0 19 6 27 14MN0620700 % 38 19 0 100 50 100 0 21 24 0 61 96 0 0 0 100 4 0 100 0 100 0 0 100 100 100 100POP. 11,675Crime Rate R 4017 2192 0 8 17 17 334 1635 179 0 1824 205 0 25 0 8 693 0 68 8 239 0 8 162 51 231 119
ROSEVILLE O 2600 1533 1 13 18 20 179 1232 70 0 1067 115 38 186 0 42 156 21 15 13 100 0 6 93 13 93 176PD C 993 442 0 3 5 11 12 410 1 0 551 76 3 26 0 38 8 14 14 7 86 0 2 93 11 34 139MN0620800 % 38 29 0 23 28 55 7 33 1 0 52 66 8 14 0 90 5 67 93 54 86 0 33 100 85 37 79POP. 34,276Crime Rate R 7585 4472 2 37 52 58 522 3594 204 0 3112 335 110 542 0 122 455 61 43 37 291 0 17 271 37 271 513
ST. PAUL O 26910 13285 14 218 716 1252 2769 6443 1761 112 13625 2822 80 1477 1 36 1741 299 222 419 1097 15 1163 0 274 450 3529PD C 7703 2342 13 27 121 466 216 1369 118 12 5361 1040 17 220 0 18 160 161 78 98 683 8 405 0 259 322 1892MN0620900 % 29 18 93 12 17 37 8 21 7 11 39 37 21 15 0 50 9 54 35 23 62 53 35 0 95 72 54POP. 290,700Crime Rate R 9256 4570 4 74 246 430 952 2216 605 39 4686 970 28 508 0 12 599 103 76 144 377 5 400 0 94 155 1214

TABLE 46Offenses, Clearances, Percent Cleared and Crime Rate by Agency - 2013
0 = Number of Offenses C = Offenses Cleared % = Percentage Cleared R = Crime Rate per 100,000 * - Agency did not report all 12 months 2013 168
Aggra- Motor Forgery/ Embe- Other Disor- OtherGrand Total Rob- vated Burg- Larc- Vehicle Total Other Counter- zzle- Stolen Vand- Weap- Prosti- Sex Narc- Gamb- Family/ Liquor derly Offen-
County/City Part 1 Murder Rape bery Assault lary eny Theft Arson Part 2 Assaults feiting Fraud ment Property alism ons tution Offen. otics ling Children D.U.I. Laws Cond. sesWHITE BEAR LAKE O 2192 697 0 8 7 29 128 495 29 1 1495 89 26 93 0 8 139 17 0 9 71 0 10 207 49 622 155PD C 1028 106 0 4 2 20 6 73 1 0 922 63 4 9 0 6 13 12 0 1 67 0 2 207 43 372 123MN0621000 % 47 15 0 50 29 69 5 15 3 0 62 71 15 10 0 75 9 71 0 11 94 0 20 100 88 60 79POP. 24,241Crime Rate R 9042 2875 0 33 28 119 528 2041 119 4 6167 367 107 383 0 33 573 70 0 37 292 0 41 853 202 2565 639
LITTLE CANADA§ O 588 279 0 4 5 14 66 143 37 10 309 52 1 42 0 5 64 3 0 4 16 0 6 43 3 43 27PD C 246 53 0 4 1 9 19 12 2 6 193 49 1 5 0 5 11 3 0 3 16 0 5 43 3 27 22MN062110X % 42 19 0 100 20 64 29 8 5 60 62 94 100 12 0 100 17 100 0 75 100 0 83 100 100 63 81POP. 9,956Crime Rate R 5905 2802 0 40 50 140 662 1436 371 100 3103 522 10 421 0 50 642 30 0 40 160 0 60 431 30 431 271
SHOREVIEW§ O 669 314 2 1 0 9 47 231 16 8 355 52 4 79 0 6 66 3 0 5 18 0 8 29 0 50 35PD C 257 49 1 1 0 8 4 28 2 5 208 49 2 21 0 5 8 2 0 3 15 0 8 29 0 35 31MN062120X % 38 16 50 100 0 89 9 12 13 63 59 94 50 27 0 83 12 67 0 60 83 0 100 100 0 70 89POP. 25,513Crime Rate R 2622 1230 7 3 0 35 184 905 62 31 1391 203 15 309 0 23 258 11 0 19 70 0 31 113 0 195 137
VADNAIS HEIGHTS§ O 622 313 0 5 5 7 28 234 32 2 309 49 8 55 0 2 48 3 0 3 17 0 6 40 2 43 33PD C 313 114 0 3 3 5 1 95 5 2 199 43 4 21 0 1 5 1 0 2 17 0 5 40 2 30 28MN062130X % 50 36 0 60 60 71 4 41 16 100 64 88 50 38 0 50 10 33 0 67 100 0 83 100 100 70 85POP. 12,533Crime Rate R 4962 2497 0 39 39 55 223 1867 255 15 2465 390 63 438 0 15 382 23 0 23 135 0 47 319 15 343 263
NORTH OAKS§ O 72 41 0 0 0 1 11 24 4 1 31 3 1 9 0 0 6 0 0 1 0 0 0 4 0 3 4PD C 19 4 0 0 0 1 1 1 1 0 15 2 0 2 0 0 0 0 0 1 0 0 0 4 0 2 4MN062150X % 26 10 0 0 0 100 9 4 25 0 48 67 0 22 0 0 0 0 0 100 0 0 0 100 0 67 100POP. 4,552Crime Rate R 1581 900 0 0 0 21 241 527 87 21 681 65 21 197 0 0 131 0 0 21 0 0 0 87 0 65 87
WHITE BEAR TWSP§ O 276 152 0 1 2 0 26 118 4 1 124 25 1 14 0 0 32 1 0 2 5 0 2 11 2 16 13PD C 113 44 0 1 1 0 5 37 0 0 69 22 0 2 0 0 3 1 0 1 5 0 2 10 2 11 10MN062170X % 41 29 0 100 50 0 19 31 0 0 56 88 0 14 0 0 9 100 0 50 100 0 100 91 100 69 77POP. 11,115Crime Rate R 2483 1368 0 9 18 0 234 1062 36 9 1116 225 9 126 0 0 288 9 0 18 45 0 18 99 18 144 117
RED LAKE O 125 19 0 0 0 2 8 8 1 0 106 20 1 17 0 0 6 2 0 0 4 0 1 14 3 27 11SHERIFF C 94 12 0 0 0 1 7 3 1 0 82 16 1 17 0 0 4 2 0 0 3 0 1 14 2 14 8MN0630000 % 75 63 0 0 0 50 88 38 100 0 77 80 100 100 0 0 67 100 0 0 75 0 100 100 67 52 73POP. 4,131Crime Rate R 3025 459 0 0 0 48 193 193 24 0 2565 484 24 411 0 0 145 48 0 0 96 0 24 338 72 653 266
REDWOOD O 594 181 1 6 1 16 21 126 6 4 413 49 11 21 0 3 56 7 0 12 40 1 4 33 15 89 72COUNTY TOTAL C 344 64 2 4 1 12 6 37 1 2 280 38 6 9 0 3 6 6 0 7 32 1 1 29 12 79 51
% 58 36 100 67 100 75 29 29 17 50 68 78 55 43 0 100 11 86 0 58 80 100 25 88 80 89 71POP. 16,074Crime Rate R 3695 1126 6 37 6 99 130 783 37 24 2569 304 68 130 0 18 348 43 0 74 248 6 24 205 93 553 447
REDWOOD O 148 34 0 0 0 5 10 16 2 1 114 17 1 7 0 1 11 2 0 3 11 0 2 13 3 12 31SHERIFF C 74 10 0 0 0 3 2 4 0 1 64 12 0 1 0 1 2 1 0 1 7 0 1 13 1 6 18MN0640000 % 50 29 0 0 0 60 20 25 0 100 56 71 0 14 0 100 18 50 0 33 64 0 50 100 33 50 58POP. 10,814Crime Rate R 1368 314 0 0 0 46 92 147 18 9 1054 157 9 64 0 9 101 18 0 27 101 0 18 120 27 110 286

TABLE 46Offenses, Clearances, Percent Cleared and Crime Rate by Agency - 2013
0 = Number of Offenses C = Offenses Cleared % = Percentage Cleared R = Crime Rate per 100,000 * - Agency did not report all 12 months 2013 169
Aggra- Motor Forgery/ Embe- Other Disor- OtherGrand Total Rob- vated Burg- Larc- Vehicle Total Other Counter- zzle- Stolen Vand- Weap- Prosti- Sex Narc- Gamb- Family/ Liquor derly Offen-
County/City Part 1 Murder Rape bery Assault lary eny Theft Arson Part 2 Assaults feiting Fraud ment Property alism ons tution Offen. otics ling Children D.U.I. Laws Cond. sesREDWOOD FALLS O 446 147 1 6 1 11 11 110 4 3 299 32 10 14 0 2 45 5 0 9 29 1 2 20 12 77 41PD C 270 54 1 4 1 9 4 33 1 1 216 26 6 8 0 2 4 5 0 6 25 1 0 16 11 73 33MN0640200 % 61 37 100 67 100 82 36 30 25 33 72 81 60 57 0 100 9 100 0 67 86 100 0 80 92 95 80POP. 5,260Crime Rate R 8479 2795 19 114 19 209 209 2091 76 57 5684 608 190 266 0 38 855 95 0 171 551 19 38 380 228 1463 779
RENVILLE O 629 192 0 1 0 3 50 127 10 1 437 87 3 33 0 2 69 0 0 23 33 0 1 55 13 68 50COUNTY TOTAL C 386 58 0 1 0 2 19 33 3 0 328 79 2 14 0 2 19 0 0 17 19 0 1 55 13 60 47
% 61 30 0 100 0 67 38 26 30 0 75 91 67 42 0 100 28 0 0 74 58 0 100 100 100 88 94POP. 15,599Crime Rate R 4032 1230 0 6 0 19 320 814 64 6 2801 557 19 211 0 12 442 0 0 147 211 0 6 352 83 435 320
RENVILLE O 386 120 0 1 0 1 38 71 9 0 266 40 0 18 0 2 44 0 0 19 32 0 1 49 13 15 33SHERIFF C 235 35 0 1 0 1 14 16 3 0 200 34 0 9 0 2 12 0 0 15 18 0 1 49 13 14 33MN0650000 % 61 29 0 100 0 100 37 23 33 0 75 85 0 50 0 100 27 0 0 79 56 0 100 100 100 93 100POP. 13,134Crime Rate R 2938 913 0 7 0 7 289 540 68 0 2025 304 0 137 0 15 335 0 0 144 243 0 7 373 98 114 251
OLIVIA O 243 72 0 0 0 2 12 56 1 1 171 47 3 15 0 0 25 0 0 4 1 0 0 6 0 53 17PD C 151 23 0 0 0 1 5 17 0 0 128 45 2 5 0 0 7 0 0 2 1 0 0 6 0 46 14MN0650300 % 62 32 0 0 0 50 42 30 0 0 75 96 67 33 0 0 28 0 0 50 100 0 0 100 0 87 82POP. 2,465Crime Rate R 9858 2920 0 0 0 81 486 2271 40 40 6937 1906 121 608 0 0 1014 0 0 162 40 0 0 243 0 2150 689
RICE O 3239 1400 1 27 12 78 245 981 49 7 1839 381 52 183 1 17 458 7 0 52 134 0 41 136 79 80 218COUNTY TOTAL C 1215 357 1 12 3 53 33 239 16 0 858 208 11 30 0 10 52 4 0 26 120 0 12 123 78 45 139
% 38 26 100 44 25 68 13 24 33 0 47 55 21 16 0 59 11 57 0 50 90 0 29 90 99 56 64POP. 65,986Crime Rate R 4908 2121 1 40 18 118 371 1486 74 10 2786 577 78 277 1 25 694 10 0 78 203 0 62 206 119 121 330
RICE O 579 233 0 4 0 6 86 125 12 0 346 46 0 46 0 3 58 1 0 6 45 0 5 61 11 7 57SHERIFF C 187 28 0 2 0 5 9 9 3 0 159 19 0 2 0 2 5 0 0 2 38 0 0 52 11 2 26MN0660000 % 32 12 0 50 0 83 10 7 25 0 46 41 0 4 0 67 9 0 0 33 84 0 0 85 100 29 46POP. 22,173Crime Rate R 2611 1050 0 18 0 27 387 563 54 0 1560 207 0 207 0 13 261 4 0 27 202 0 22 275 49 31 257
FARIBAULT PD O 1898 878 1 17 10 62 118 631 34 5 1020 244 40 87 1 11 290 2 0 30 55 0 30 39 23 42 126PD C 653 247 1 8 1 42 13 172 10 0 406 116 6 13 0 6 30 1 0 13 51 0 6 36 23 20 85MN0660100 % 34 28 100 47 10 68 11 27 29 0 40 48 15 15 0 55 10 50 0 43 93 0 20 92 100 48 67POP. 23,600Crime Rate R 8042 3720 4 72 42 262 500 2673 144 21 4322 1033 169 368 4 46 1228 8 0 127 233 0 127 165 97 177 533
NORTHFIELD O 762 289 0 6 2 10 41 225 3 2 473 91 12 50 0 3 110 4 0 16 34 0 6 36 45 31 35PD C 375 82 0 2 2 6 11 58 3 0 293 73 5 15 0 2 17 3 0 11 31 0 6 35 44 23 28MN0660200 % 49 28 0 33 100 60 27 26 100 0 62 80 42 30 0 67 15 75 0 69 91 0 100 97 98 74 80POP. 20,213Crime Rate R 3769 1429 0 29 9 49 202 1113 14 9 2340 450 59 247 0 14 544 19 0 79 168 0 29 178 222 153 173
ROCK O 472 154 0 0 1 72 19 57 5 0 318 4 1 57 0 0 94 0 0 0 3 0 0 53 8 97 1SHERIFF C 364 107 0 0 0 71 4 28 4 0 257 4 0 40 0 0 53 0 0 0 3 0 0 53 8 95 1MN0670000 % 77 69 0 0 0 99 21 49 80 0 81 100 0 70 0 0 56 0 0 0 100 0 0 100 100 98 100POP. 9,676Crime Rate R 4878 1591 0 0 10 744 196 589 51 0 3286 41 10 589 0 0 971 0 0 0 31 0 0 547 82 1002 10

TABLE 46Offenses, Clearances, Percent Cleared and Crime Rate by Agency - 2013
0 = Number of Offenses C = Offenses Cleared % = Percentage Cleared R = Crime Rate per 100,000 * - Agency did not report all 12 months 2013 170
Aggra- Motor Forgery/ Embe- Other Disor- OtherGrand Total Rob- vated Burg- Larc- Vehicle Total Other Counter- zzle- Stolen Vand- Weap- Prosti- Sex Narc- Gamb- Family/ Liquor derly Offen-
County/City Part 1 Murder Rape bery Assault lary eny Theft Arson Part 2 Assaults feiting Fraud ment Property alism ons tution Offen. otics ling Children D.U.I. Laws Cond. sesROSEAU O 713 222 0 1 1 0 20 187 13 0 491 62 0 17 0 2 68 5 0 12 38 0 3 73 32 32 147COUNTY TOTAL C 193 9 0 0 1 0 4 3 1 0 184 12 0 0 0 0 0 1 0 3 9 0 0 73 1 9 76
% 27 4 0 0 100 0 20 2 8 0 37 19 0 0 0 0 0 20 0 25 24 0 0 100 3 28 52POP. 15,640Crime Rate R 4558 1419 0 6 6 0 127 1195 83 0 3139 396 0 108 0 12 434 31 0 76 242 0 19 466 204 204 939
ROSEAU O 371 103 0 1 1 0 13 81 7 0 268 26 0 17 0 1 45 4 0 8 19 0 2 47 19 10 70SHERIFF C 94 6 0 0 1 0 3 2 0 0 88 4 0 0 0 0 0 0 0 2 4 0 0 47 1 1 29MN0680000 % 25 6 0 0 100 0 23 2 0 0 33 15 0 0 0 0 0 0 0 25 21 0 0 100 5 10 41POP. 11,224Crime Rate R 3305 917 0 8 8 0 115 721 62 0 2387 231 0 151 0 8 400 35 0 71 169 0 17 418 169 89 623
ROSEAU O 165 62 0 0 0 0 5 52 5 0 103 18 0 0 0 0 5 0 0 3 9 0 1 7 4 8 48PD C 38 2 0 0 0 0 1 0 1 0 36 2 0 0 0 0 0 0 0 1 2 0 0 7 0 1 23MN0680100 % 23 3 0 0 0 0 20 0 20 0 35 11 0 0 0 0 0 0 0 33 22 0 0 100 0 13 48POP. 2,635Crime Rate R 6261 2352 0 0 0 0 189 1973 189 0 3908 683 0 0 0 0 189 0 0 113 341 0 37 265 151 303 1821
WARROAD O 177 57 0 0 0 0 2 54 1 0 120 18 0 0 0 1 18 1 0 1 10 0 0 19 9 14 29PD C 61 1 0 0 0 0 0 1 0 0 60 6 0 0 0 0 0 1 0 0 3 0 0 19 0 7 24MN0680200 % 34 2 0 0 0 0 0 2 0 0 50 33 0 0 0 0 0 100 0 0 30 0 0 100 0 50 83POP. 1,781Crime Rate R 9938 3200 0 0 0 0 112 3032 56 0 6737 1010 0 0 0 56 1010 56 0 56 561 0 0 1066 505 786 1628
ST. LOUIS O 17209 7097 2 83 84 322 1154 5150 273 29 10112 1395 124 698 0 70 1646 96 39 253 1134 0 623 640 773 1198 1423COUNTY TOTAL C 7331 1793 2 21 29 240 125 1312 54 10 5538 821 21 77 0 39 182 50 12 55 830 0 30 632 764 893 1132
% 43 25 67 25 35 75 11 25 20 34 55 59 17 11 0 56 11 52 31 22 73 0 5 99 99 75 80POP. 196,959Crime Rate R 8737 3594 1 42 42 163 585 2614 138 14 5134 708 62 354 0 35 835 48 19 128 575 0 316 324 392 608 722
ST. LOUIS O 2634 896 0 14 6 52 309 444 66 5 1738 225 28 180 0 11 230 18 3 54 231 0 69 179 57 206 247SHERIFF C 1024 181 0 5 5 43 35 78 12 3 843 137 4 14 0 7 27 7 0 16 175 0 7 174 53 74 148MN0690000 % 39 20 0 36 83 83 11 18 18 60 49 61 14 8 0 64 12 39 0 30 76 0 10 97 93 36 60POP. 58,829Crime Rate R 4477 1523 0 24 10 88 525 755 112 8 2954 382 48 306 0 19 391 31 5 92 393 0 117 304 97 350 420
BABBITT O 123 55 0 1 0 1 5 48 0 0 68 7 0 2 0 2 8 1 0 0 3 0 0 11 5 11 18PD C 47 8 0 0 0 0 3 5 0 0 39 2 0 1 0 1 1 0 0 0 3 0 0 11 5 6 9MN0690200 % 38 15 0 0 0 0 60 10 0 0 57 29 0 50 0 50 13 0 0 0 100 0 0 100 100 55 50POP. 1,484Crime Rate R 8288 3706 0 67 0 67 336 3234 0 0 4582 471 0 134 0 134 539 67 0 0 202 0 0 741 336 741 1212
CHISHOLM O 205 140 0 0 1 1 12 124 2 0 65 8 0 1 0 1 8 1 0 0 11 0 0 14 6 9 6PD C 64 9 0 0 0 1 0 8 0 0 55 8 0 0 0 0 1 1 0 0 10 0 0 14 6 9 6MN0690500 % 31 6 0 0 0 100 0 6 0 0 85 100 0 0 0 0 13 100 0 0 91 0 0 100 100 100 100POP. 5,008Crime Rate R 4093 2795 0 0 19 19 239 2476 39 0 1297 159 0 19 0 19 159 19 0 0 219 0 0 279 119 179 119
DULUTH O 10698 4646 2 52 72 216 643 3484 156 21 6052 884 63 373 0 48 1065 55 33 166 742 0 440 240 513 583 847PD C 4419 1179 2 11 23 158 61 895 24 5 3240 505 9 33 0 24 118 25 10 27 507 0 2 238 511 518 713MN0690600 % 41 25 100 21 32 73 9 26 15 24 54 57 14 9 0 50 11 45 30 16 68 0 0 99 100 89 84POP. 86,830Crime Rate R 12320 5350 2 59 82 248 740 4012 179 24 6969 1018 72 429 0 55 1226 63 38 191 854 0 506 276 590 671 975

TABLE 46Offenses, Clearances, Percent Cleared and Crime Rate by Agency - 2013
0 = Number of Offenses C = Offenses Cleared % = Percentage Cleared R = Crime Rate per 100,000 * - Agency did not report all 12 months 2013 171
Aggra- Motor Forgery/ Embe- Other Disor- OtherGrand Total Rob- vated Burg- Larc- Vehicle Total Other Counter- zzle- Stolen Vand- Weap- Prosti- Sex Narc- Gamb- Family/ Liquor derly Offen-
County/City Part 1 Murder Rape bery Assault lary eny Theft Arson Part 2 Assaults feiting Fraud ment Property alism ons tution Offen. otics ling Children D.U.I. Laws Cond. sesELY O 204 62 0 3 0 4 3 50 2 0 142 16 1 5 0 0 27 0 0 3 15 0 5 20 11 16 23PD C 94 13 0 0 0 4 0 9 0 0 81 4 0 0 0 0 1 0 0 0 15 0 0 19 10 12 20MN0690700 % 46 21 0 0 0 100 0 18 0 0 57 25 0 0 0 0 4 0 0 0 100 0 0 95 91 75 87POP. 3,482Crime Rate R 5858 1780 0 86 0 114 86 1435 57 0 4078 459 28 143 0 0 775 0 0 86 430 0 143 574 315 459 660
EVELETH O 476 147 0 2 0 9 28 94 13 1 329 38 2 21 0 1 55 5 1 7 22 0 20 22 14 68 53PD C 257 34 0 1 0 5 3 17 8 0 223 26 2 11 0 1 5 4 0 2 19 0 17 22 14 56 44MN0690800 % 54 23 0 50 0 56 11 18 62 0 68 68 100 52 0 100 9 80 0 29 86 0 85 100 100 82 83POP. 3,742Crime Rate R 12720 3928 0 53 0 240 748 2512 347 26 8792 1015 53 561 0 26 1469 133 26 187 587 0 534 587 374 1817 1416
GILBERT* O 3 2 0 0 0 0 1 1 0 0 1 1 0 0 0 0 0 0 0 0 0 0 0 0 0 0 0PD C 1 0 0 0 0 0 0 0 0 0 1 1 0 0 0 0 0 0 0 0 0 0 0 0 0 0 0MN0690900 % 33 0 0 0 0 0 0 0 0 0 100 100 0 0 0 0 0 0 0 0 0 0 0 0 0 0 0POP. 1,810Crime Rate R 165 110 0 0 0 0 55 55 0 0 55 55 0 0 0 0 0 0 0 0 0 0 0 0 0 0 0
HIBBING* O 43 10 0 0 0 4 1 5 0 0 33 9 0 1 0 0 0 0 0 0 3 0 0 10 0 4 6PD C 36 4 0 0 0 4 0 0 0 0 32 8 0 1 0 0 0 0 0 0 3 0 0 10 0 4 6MN0691000 % 84 40 0 0 0 100 0 0 0 0 97 89 0 100 0 0 0 0 0 0 100 0 0 100 0 100 100POP. 16,469Crime Rate R 261 60 0 0 0 24 6 30 0 0 200 54 0 6 0 0 0 0 0 0 18 0 0 60 0 24 36
HOYT LAKES * O 1 1 0 1 0 0 0 0 0 0 0 0 0 0 0 0 0 0 0 0 0 0 0 0 0 0 0PD C 0 0 0 0 0 0 0 0 0 0 0 0 0 0 0 0 0 0 0 0 0 0 0 0 0 0 0MN0691100 % 0 0 0 0 0 0 0 0 0 0 0 0 0 0 0 0 0 0 0 0 0 0 0 0 0 0 0POP. 2,031Crime Rate R 49 49 0 49 0 0 0 0 0 0 0 0 0 0 0 0 0 0 0 0 0 0 0 0 0 0 0
PROCTOR O 285 126 0 2 1 3 17 100 3 0 159 32 4 11 0 1 39 1 0 3 11 0 0 28 0 11 18PD C 100 21 0 0 0 2 2 17 0 0 79 16 1 2 0 1 2 1 0 0 8 0 0 28 0 5 15MN0691300 % 35 17 0 0 0 67 12 17 0 0 50 50 25 18 0 100 5 100 0 0 73 0 0 100 0 45 83POP. 3,078Crime Rate R 9259 4093 0 64 32 97 552 3248 97 0 5165 1039 129 357 0 32 1267 32 0 97 357 0 0 909 0 357 584
VIRGINIA O 1506 562 0 5 4 28 78 429 17 1 944 140 17 37 0 3 128 10 1 13 41 0 75 51 32 235 161PD C 816 201 0 3 1 20 10 160 6 1 615 96 5 10 0 3 23 10 1 7 37 0 2 51 31 196 143MN0691400 % 54 36 0 60 25 71 13 37 35 100 65 69 29 27 0 100 18 100 100 54 90 0 3 100 97 83 89POP. 8,769Crime Rate R 17174 6408 0 57 45 319 889 4892 193 11 10765 1596 193 421 0 34 1459 114 11 148 467 0 855 581 364 2679 1836
FLOODWOOD* O 95 33 0 0 0 1 0 32 0 0 62 7 2 5 0 1 4 1 0 1 4 0 8 8 5 10 6PD C 27 1 0 0 0 0 0 1 0 0 26 4 0 1 0 0 0 0 0 0 4 0 0 8 4 4 1MN0691500 % 28 3 0 0 0 0 0 3 0 0 42 57 0 20 0 0 0 0 0 0 100 0 0 100 80 40 17POP. 531Crime Rate R 17890 6214 0 0 0 188 0 6026 0 0 11676 1318 376 941 0 188 753 188 0 188 753 0 1506 1506 941 1883 1129
HERMANTOWN O 668 377 0 2 0 2 56 302 14 1 291 26 5 58 0 2 65 3 1 3 15 0 6 33 4 38 32PD C 245 135 0 1 0 2 11 116 4 1 110 13 0 4 0 2 3 2 1 3 15 0 2 33 4 6 22MN0691700 % 37 36 0 50 0 100 20 38 29 100 38 50 0 7 0 100 5 67 100 100 100 0 33 100 100 16 69POP. 9,476Crime Rate R 7049 3978 0 21 0 21 590 3186 147 10 3070 274 52 612 0 21 685 31 10 31 158 0 63 348 42 401 337

TABLE 46Offenses, Clearances, Percent Cleared and Crime Rate by Agency - 2013
0 = Number of Offenses C = Offenses Cleared % = Percentage Cleared R = Crime Rate per 100,000 * - Agency did not report all 12 months 2013 172
Aggra- Motor Forgery/ Embe- Other Disor- OtherGrand Total Rob- vated Burg- Larc- Vehicle Total Other Counter- zzle- Stolen Vand- Weap- Prosti- Sex Narc- Gamb- Family/ Liquor derly Offen-
County/City Part 1 Murder Rape bery Assault lary eny Theft Arson Part 2 Assaults feiting Fraud ment Property alism ons tution Offen. otics ling Children D.U.I. Laws Cond. sesUNIV. OF MINN.-DULUTH O 268 40 0 1 0 1 1 37 0 0 228 2 2 4 0 0 17 1 0 3 36 0 0 24 126 7 6PD C 201 7 0 0 0 1 0 6 0 0 194 1 0 0 0 0 1 0 0 0 34 0 0 24 126 3 5MN0691800 % 75 18 0 0 0 100 0 16 0 0 85 50 0 0 0 0 6 0 0 0 94 0 0 100 100 43 83POP. 0Crime Rate R 0 0 0 0 0 0 0 0 0 0 0 0 0 0 0 0 0 0 0 0 0 0 0 0 0 0 0
SCOTT O 6793 2490 2 31 24 75 290 1993 67 8 4303 503 116 345 2 35 676 50 2 71 591 1 46 429 205 401 830COUNTY TOTAL C 3430 635 2 11 12 56 48 483 22 1 2795 385 32 45 1 29 92 38 0 35 535 1 35 422 196 267 682
% 50 26 100 35 50 75 17 24 33 13 65 77 28 13 50 83 14 76 0 49 91 100 76 98 96 67 82POP. 136,459Crime Rate R 4978 1824 1 22 17 54 212 1460 49 5 3153 368 85 252 1 25 495 36 1 52 433 0 33 314 150 293 608
SCOTT O 281 35 0 3 0 4 6 18 3 1 246 41 0 7 0 0 9 0 0 3 63 0 0 66 15 4 38SHERIFF C 168 6 0 0 0 0 3 2 1 0 162 21 0 0 0 0 2 0 0 0 47 0 0 60 9 2 21MN0700000 % 60 17 0 0 0 0 50 11 33 0 66 51 0 0 0 0 22 0 0 0 75 0 0 91 60 50 55POP. 27,454Crime Rate R 1023 127 0 10 0 14 21 65 10 3 896 149 0 25 0 0 32 0 0 10 229 0 0 240 54 14 138
BELLE PLAINE O 321 88 0 2 0 2 4 78 1 1 233 24 5 9 0 1 55 1 0 7 24 0 4 22 10 14 57PD C 214 35 0 2 0 2 1 29 1 0 179 24 1 4 0 1 14 1 0 6 22 0 4 22 10 14 56MN0700100 % 67 40 0 100 0 100 25 37 100 0 77 100 20 44 0 100 25 100 0 86 92 0 100 100 100 100 98POP. 6,836Crime Rate R 4695 1287 0 29 0 29 58 1141 14 14 3408 351 73 131 0 14 804 14 0 102 351 0 58 321 146 204 833
JORDAN* O 227 66 0 3 0 3 5 54 1 0 161 12 4 11 0 0 15 2 0 4 29 0 1 31 3 9 40PD C 128 10 0 0 0 2 2 5 1 0 118 12 1 2 0 0 0 2 0 1 28 0 1 30 3 9 29MN0700200 % 56 15 0 0 0 67 40 9 100 0 73 100 25 18 0 0 0 100 0 25 97 0 100 97 100 100 73POP. 5,619Crime Rate R 4039 1174 0 53 0 53 88 961 17 0 2865 213 71 195 0 0 266 35 0 71 516 0 17 551 53 160 711
NEW PRAGUE O 555 121 0 1 1 5 8 102 4 0 434 43 4 8 0 0 66 4 0 5 40 0 6 48 39 96 75PD C 353 33 0 0 0 4 2 25 2 0 320 33 4 4 0 0 12 3 0 5 40 0 4 48 38 63 66MN0700300 % 64 27 0 0 0 80 25 25 50 0 74 77 100 50 0 0 18 75 0 100 100 0 67 100 97 66 88POP. 7,448Crime Rate R 7451 1624 0 13 13 67 107 1369 53 0 5827 577 53 107 0 0 886 53 0 67 537 0 80 644 523 1288 1006
SHAKOPEE O 2212 1078 2 12 11 28 108 882 34 1 1134 117 53 117 1 23 194 8 0 26 161 1 2 98 75 39 219PD C 1060 297 2 5 8 21 19 234 8 0 763 106 13 17 1 20 36 5 0 14 145 1 0 98 75 33 199MN0700400 % 48 28 100 42 73 75 18 27 24 0 67 91 25 15 100 87 19 63 0 54 90 100 0 100 100 85 91POP. 38,057Crime Rate R 5812 2832 5 31 28 73 283 2317 89 2 2979 307 139 307 2 60 509 21 0 68 423 2 5 257 197 102 575
SAVAGE O 1755 637 0 5 9 21 97 494 9 2 1118 166 28 116 1 4 191 32 2 13 94 0 25 95 20 109 222PD C 827 145 0 3 4 18 12 103 5 0 682 134 8 13 0 4 21 24 0 8 88 0 21 95 20 82 164MN0700600 % 47 23 0 60 44 86 12 21 56 0 61 81 29 11 0 100 11 75 0 62 94 0 84 100 100 75 74POP. 27,635Crime Rate R 6350 2305 0 18 32 75 351 1787 32 7 4045 600 101 419 3 14 691 115 7 47 340 0 90 343 72 394 803
PRIOR LAKE O 1442 465 0 5 3 12 62 365 15 3 977 100 22 77 0 7 146 3 0 13 180 0 8 69 43 130 179PD C 680 109 0 1 0 9 9 85 4 1 571 55 5 5 0 4 7 3 0 1 165 0 5 69 41 64 147MN0700900 % 47 23 0 20 0 75 15 23 27 33 58 55 23 6 0 57 5 100 0 8 92 0 63 100 95 49 82POP. 23,410Crime Rate R 6159 1986 0 21 12 51 264 1559 64 12 4173 427 93 328 0 29 623 12 0 55 768 0 34 294 183 555 764

TABLE 46Offenses, Clearances, Percent Cleared and Crime Rate by Agency - 2013
0 = Number of Offenses C = Offenses Cleared % = Percentage Cleared R = Crime Rate per 100,000 * - Agency did not report all 12 months 2013 173
Aggra- Motor Forgery/ Embe- Other Disor- OtherGrand Total Rob- vated Burg- Larc- Vehicle Total Other Counter- zzle- Stolen Vand- Weap- Prosti- Sex Narc- Gamb- Family/ Liquor derly Offen-
County/City Part 1 Murder Rape bery Assault lary eny Theft Arson Part 2 Assaults feiting Fraud ment Property alism ons tution Offen. otics ling Children D.U.I. Laws Cond. sesSHERBURNE O 3500 1027 3 14 4 38 148 777 40 3 2473 227 56 192 0 12 318 36 0 59 271 0 22 361 112 348 459COUNTY TOTAL C 2145 276 0 10 3 33 23 192 13 2 1869 202 16 63 0 7 134 28 0 39 260 0 13 352 102 285 368
% 61 27 0 71 75 87 16 25 33 67 76 89 29 33 0 58 42 78 0 66 96 0 59 98 91 82 80POP. 82,962Crime Rate R 4218 1237 3 16 4 45 178 936 48 3 2980 273 67 231 0 14 383 43 0 71 326 0 26 435 135 419 553
SHERBURNE O 1486 375 3 8 0 15 65 260 23 1 1111 107 11 100 0 5 151 11 0 33 183 0 7 170 49 127 157SHERIFF C 996 89 0 8 0 14 13 43 10 1 907 105 5 36 0 3 92 11 0 29 178 0 5 170 49 89 135MN0710000 % 67 24 0 100 0 93 20 17 43 100 82 98 45 36 0 60 61 100 0 88 97 0 71 100 100 70 86POP. 44,796Crime Rate R 3317 837 6 17 0 33 145 580 51 2 2480 238 24 223 0 11 337 24 0 73 408 0 15 379 109 283 350
BIG LAKE O 354 125 0 0 2 15 21 83 3 1 229 22 5 20 0 3 26 1 0 13 10 0 6 61 18 14 30PD C 126 24 0 0 1 13 4 6 0 0 102 15 1 1 0 1 1 0 0 0 6 0 1 56 8 3 9MN0710100 % 36 19 0 0 50 87 19 7 0 0 45 68 20 5 0 33 4 0 0 0 60 0 17 92 44 21 30POP. 10,222Crime Rate R 3463 1222 0 0 19 146 205 811 29 9 2240 215 48 195 0 29 254 9 0 127 97 0 58 596 176 136 293
ELK RIVER O 1451 482 0 6 2 3 56 402 13 0 969 86 40 58 0 3 104 23 0 12 68 0 5 101 30 189 250PD C 877 150 0 2 2 1 4 138 3 0 727 72 10 16 0 3 14 16 0 9 66 0 5 101 30 176 209MN0710200 % 60 31 0 33 100 33 7 34 23 0 75 84 25 28 0 100 13 70 0 75 97 0 100 100 100 93 84POP. 23,335Crime Rate R 6218 2065 0 25 8 12 239 1722 55 0 4152 368 171 248 0 12 445 98 0 51 291 0 21 432 128 809 1071
BECKER O 209 45 0 0 0 5 6 32 1 1 164 12 0 14 0 1 37 1 0 1 10 0 4 29 15 18 22PD C 146 13 0 0 0 5 2 5 0 1 133 10 0 10 0 0 27 1 0 1 10 0 2 25 15 17 15MN0710400 % 70 29 0 0 0 100 33 16 0 100 81 83 0 71 0 0 73 100 0 100 100 0 50 86 100 94 68POP. 4,609Crime Rate R 4534 976 0 0 0 108 130 694 21 21 3558 260 0 303 0 21 802 21 0 21 216 0 86 629 325 390 477
SIBLEY * O 0 0 0 0 0 0 0 0 0 0 0 0 0 0 0 0 0 0 0 0 0 0 0 0 0 0 0SHERIFF C 0 0 0 0 0 0 0 0 0 0 0 0 0 0 0 0 0 0 0 0 0 0 0 0 0 0 0MN0720000 % 0 0 0 0 0 0 0 0 0 0 0 0 0 0 0 0 0 0 0 0 0 0 0 0 0 0 0POP. 15,266Crime Rate R 0 0 0 0 0 0 0 0 0 0 0 0 0 0 0 0 0 0 0 0 0 0 0 0 0 0 0
STEARNS O 10889 4886 2 79 54 179 565 3752 228 27 6003 732 189 458 5 84 1130 51 23 112 763 0 39 639 464 424 890COUNTY TOTAL C 5599 1743 1 26 19 136 78 1437 42 4 3856 578 80 128 5 65 203 32 20 50 663 0 16 635 459 324 598
% 51 36 50 33 35 76 14 38 18 15 64 79 42 28 100 77 18 63 87 45 87 0 41 99 99 76 67POP. 167,937Crime Rate R 6483 2909 1 47 32 106 336 2234 135 16 3574 435 112 272 2 50 672 30 13 66 454 0 23 380 276 252 529
STEARNS O 1292 382 1 10 1 11 81 255 22 1 910 94 11 74 0 5 163 10 2 20 98 0 6 168 87 31 141SHERIFF C 580 47 0 4 1 7 14 19 2 0 533 63 4 6 0 4 7 8 1 6 85 0 1 167 87 17 77MN0730000 % 45 12 0 40 100 64 17 7 9 0 59 67 36 8 0 80 4 80 50 30 87 0 17 99 100 55 55POP. 50,396Crime Rate R 2563 757 1 19 1 21 160 505 43 1 1805 186 21 146 0 9 323 19 3 39 194 0 11 333 172 61 279
COLD SPRING O 173 27 0 0 0 1 3 22 1 0 146 11 0 6 0 1 14 2 0 1 60 0 1 27 14 2 7PD C 120 5 0 0 0 1 0 4 0 0 115 10 0 1 0 0 0 2 0 0 53 0 1 27 14 1 6MN0730100 % 69 19 0 0 0 100 0 18 0 0 79 91 0 17 0 0 0 100 0 0 88 0 100 100 100 50 86POP. 5,508Crime Rate R 3140 490 0 0 0 18 54 399 18 0 2650 199 0 108 0 18 254 36 0 18 1089 0 18 490 254 36 127

TABLE 46Offenses, Clearances, Percent Cleared and Crime Rate by Agency - 2013
0 = Number of Offenses C = Offenses Cleared % = Percentage Cleared R = Crime Rate per 100,000 * - Agency did not report all 12 months 2013 174
Aggra- Motor Forgery/ Embe- Other Disor- OtherGrand Total Rob- vated Burg- Larc- Vehicle Total Other Counter- zzle- Stolen Vand- Weap- Prosti- Sex Narc- Gamb- Family/ Liquor derly Offen-
County/City Part 1 Murder Rape bery Assault lary eny Theft Arson Part 2 Assaults feiting Fraud ment Property alism ons tution Offen. otics ling Children D.U.I. Laws Cond. sesMELROSE O 70 26 0 1 1 0 7 15 2 0 44 9 0 2 0 1 11 0 0 0 3 0 0 10 6 0 2PD C 35 3 0 1 0 0 1 0 1 0 32 9 0 0 0 1 1 0 0 0 3 0 0 10 6 0 2MN0730200 % 50 12 0 100 0 0 14 0 50 0 73 100 0 0 0 100 9 0 0 0 100 0 0 100 100 0 100POP. 3,637Crime Rate R 1924 714 0 27 27 0 192 412 54 0 1209 247 0 54 0 27 302 0 0 0 82 0 0 274 164 0 54
PAYNESVILLE O 136 49 0 0 0 3 6 36 4 0 87 9 3 26 0 0 12 0 1 1 9 0 2 7 2 8 7PD C 46 7 0 0 0 3 1 3 0 0 39 5 0 10 0 0 0 0 0 0 9 0 0 7 1 4 3MN0730300 % 34 14 0 0 0 100 17 8 0 0 45 56 0 38 0 0 0 0 0 0 100 0 0 100 50 50 43POP. 2,459Crime Rate R 5530 1992 0 0 0 122 244 1464 162 0 3538 366 122 1057 0 0 488 0 40 40 366 0 81 284 81 325 284
ST. CLOUD O 6684 3117 1 56 46 147 371 2308 163 25 3567 471 118 210 0 63 653 33 10 63 460 0 13 296 258 317 602PD C 3395 1040 1 15 14 110 46 827 24 3 2355 374 45 66 0 48 164 16 9 32 396 0 11 295 257 248 394MN0730400 % 51 33 100 27 30 75 12 36 15 12 66 79 38 31 0 76 25 48 90 51 86 0 85 100 100 78 65POP. 66,593Crime Rate R 10037 4680 1 84 69 220 557 3465 244 37 5356 707 177 315 0 94 980 49 15 94 690 0 19 444 387 476 903
SAUK CENTRE O 317 111 0 0 0 2 13 95 1 0 206 12 5 5 0 3 49 0 0 3 42 0 1 38 13 13 22PD C 176 38 0 0 0 2 2 34 0 0 138 12 3 0 0 3 3 0 0 2 37 0 0 37 13 13 15MN0730500 % 56 34 0 0 0 100 15 36 0 0 67 100 60 0 0 100 6 0 0 67 88 0 0 97 100 100 68POP. 4,367Crime Rate R 7258 2541 0 0 0 45 297 2175 22 0 4717 274 114 114 0 68 1122 0 0 68 961 0 22 870 297 297 503
WAITE PARK O 1239 758 0 6 6 10 44 666 25 1 481 71 39 60 5 5 88 2 10 8 41 0 3 34 10 32 73PD C 858 487 0 5 4 10 11 441 15 1 371 65 26 39 5 5 21 2 10 7 41 0 3 33 9 32 73MN0730600 % 69 64 0 83 67 100 25 66 60 100 77 92 67 65 100 100 24 100 100 88 100 0 100 97 90 100 100POP. 6,790Crime Rate R 18247 11163 0 88 88 147 648 9808 368 14 7083 1045 574 883 73 73 1296 29 147 117 603 0 44 500 147 471 1075
BELGRADE* O 0 0 0 0 0 0 0 0 0 0 0 0 0 0 0 0 0 0 0 0 0 0 0 0 0 0 0PD C 0 0 0 0 0 0 0 0 0 0 0 0 0 0 0 0 0 0 0 0 0 0 0 0 0 0 0MN0730800 % 0 0 0 0 0 0 0 0 0 0 0 0 0 0 0 0 0 0 0 0 0 0 0 0 0 0 0POP. 748Crime Rate R 0 0 0 0 0 0 0 0 0 0 0 0 0 0 0 0 0 0 0 0 0 0 0 0 0 0 0
KIMBALL* O 0 0 0 0 0 0 0 0 0 0 0 0 0 0 0 0 0 0 0 0 0 0 0 0 0 0 0PD C 0 0 0 0 0 0 0 0 0 0 0 0 0 0 0 0 0 0 0 0 0 0 0 0 0 0 0MN0731000 % 0 0 0 0 0 0 0 0 0 0 0 0 0 0 0 0 0 0 0 0 0 0 0 0 0 0 0POP. 771Crime Rate R 0 0 0 0 0 0 0 0 0 0 0 0 0 0 0 0 0 0 0 0 0 0 0 0 0 0 0
ST. JOSEPH* O 138 42 0 2 0 0 1 38 1 0 96 4 2 8 0 0 13 0 0 1 1 0 0 7 56 1 3PD C 85 8 0 0 0 0 0 8 0 0 77 4 0 3 0 0 2 0 0 1 1 0 0 7 56 1 2MN0731100 % 62 19 0 0 0 0 0 21 0 0 80 100 0 38 0 0 15 0 0 100 100 0 0 100 100 100 67POP. 6,600Crime Rate R 2090 636 0 30 0 0 15 575 15 0 1454 60 30 121 0 0 196 0 0 15 15 0 0 106 848 15 45
SARTELL O 685 318 0 2 0 2 27 280 7 0 367 46 9 60 0 2 100 3 0 12 32 0 13 31 13 18 28PD C 242 103 0 0 0 2 2 99 0 0 139 32 2 2 0 1 5 3 0 2 22 0 0 31 11 6 22MN0731200 % 35 32 0 0 0 100 7 35 0 0 38 70 22 3 0 50 5 100 0 17 69 0 0 100 85 33 79POP. 16,056Crime Rate R 4266 1980 0 12 0 12 168 1743 43 0 2285 286 56 373 0 12 622 18 0 74 199 0 80 193 80 112 174

TABLE 46Offenses, Clearances, Percent Cleared and Crime Rate by Agency - 2013
0 = Number of Offenses C = Offenses Cleared % = Percentage Cleared R = Crime Rate per 100,000 * - Agency did not report all 12 months 2013 175
Aggra- Motor Forgery/ Embe- Other Disor- OtherGrand Total Rob- vated Burg- Larc- Vehicle Total Other Counter- zzle- Stolen Vand- Weap- Prosti- Sex Narc- Gamb- Family/ Liquor derly Offen-
County/City Part 1 Murder Rape bery Assault lary eny Theft Arson Part 2 Assaults feiting Fraud ment Property alism ons tution Offen. otics ling Children D.U.I. Laws Cond. sesALBANY O 86 32 0 2 0 2 2 25 1 0 54 3 2 4 0 2 19 0 0 1 8 0 0 12 1 1 1PD C 29 3 0 1 0 0 0 2 0 0 26 2 0 0 0 2 0 0 0 0 7 0 0 12 1 1 1MN0731400 % 34 9 0 50 0 0 0 8 0 0 48 67 0 0 0 100 0 0 0 0 88 0 0 100 100 100 100POP. 2,601Crime Rate R 3306 1230 0 76 0 76 76 961 38 0 2076 115 76 153 0 76 730 0 0 38 307 0 0 461 38 38 38
AVON O 69 24 0 0 0 1 10 12 1 0 45 2 0 3 0 2 8 1 0 2 9 0 0 9 4 1 4PD C 33 2 0 0 0 1 1 0 0 0 31 2 0 1 0 1 0 1 0 0 9 0 0 9 4 1 3MN0731600 % 48 8 0 0 0 100 10 0 0 0 69 100 0 33 0 50 0 100 0 0 100 0 0 100 100 100 75POP. 1,411Crime Rate R 4890 1700 0 0 0 70 708 850 70 0 3189 141 0 212 0 141 566 70 0 141 637 0 0 637 283 70 283
STEELE O 2034 834 0 8 7 29 149 606 35 0 1200 206 45 98 1 9 219 10 0 58 124 0 19 151 38 51 171COUNTY TOTAL C 1007 301 0 6 1 20 31 228 15 0 706 145 20 24 0 6 55 9 0 30 103 0 6 111 32 46 119
% 50 36 0 75 14 69 21 38 43 0 59 70 44 24 0 67 25 90 0 52 83 0 32 74 84 90 70POP. 36,768Crime Rate R 5531 2268 0 21 19 78 405 1648 95 0 3263 560 122 266 2 24 595 27 0 157 337 0 51 410 103 138 465
STEELE O 401 116 0 3 1 4 35 67 6 0 285 58 5 24 1 3 36 3 0 11 19 0 5 48 8 8 56SHERIFF C 199 22 0 3 0 4 7 7 1 0 177 35 2 8 0 1 8 3 0 8 16 0 2 38 7 8 41MN0740000 % 50 19 0 100 0 100 20 10 17 0 62 60 40 33 0 33 22 100 0 73 84 0 40 79 88 100 73POP. 9,027Crime Rate R 4442 1285 0 33 11 44 387 742 66 0 3157 642 55 265 11 33 398 33 0 121 210 0 55 531 88 88 620
OWATONNA O 1619 716 0 5 6 25 114 538 28 0 903 143 40 72 0 6 183 7 0 46 104 0 14 100 30 43 115PD C 798 277 0 3 1 16 24 220 13 0 521 106 18 15 0 5 47 6 0 21 86 0 4 72 25 38 78MN0740100 % 49 39 0 60 17 64 21 41 46 0 58 74 45 21 0 83 26 86 0 46 83 0 29 72 83 88 68POP. 25,734Crime Rate R 6291 2782 0 19 23 97 442 2090 108 0 3508 555 155 279 0 23 711 27 0 178 404 0 54 388 116 167 446
BLOOMING PRAIRIE* O 14 2 0 0 0 0 0 1 1 0 12 5 0 2 0 0 0 0 0 1 1 0 0 3 0 0 0PD C 10 2 0 0 0 0 0 1 1 0 8 4 0 1 0 0 0 0 0 1 1 0 0 1 0 0 0MN0740200 % 71 100 0 0 0 0 0 100 100 0 67 80 0 50 0 0 0 0 0 100 100 0 0 33 0 0 0POP. 2,007Crime Rate R 697 99 0 0 0 0 0 49 49 0 597 249 0 99 0 0 0 0 0 49 49 0 0 149 0 0 0
STEVENS O 592 140 0 4 1 7 19 98 11 0 452 36 5 33 0 0 100 4 0 12 29 0 7 27 49 66 84COUNTY TOTAL C 449 87 0 4 1 6 6 59 11 0 362 31 3 25 0 0 41 4 0 10 28 0 5 27 49 61 78
% 76 62 0 100 100 86 32 60 100 0 80 86 60 76 0 0 41 100 0 83 97 0 71 100 100 92 93POP. 9,747Crime Rate R 6073 1436 0 41 10 71 194 1005 112 0 4637 369 51 338 0 0 1025 41 0 123 297 0 71 277 502 677 861
STEVENS O 155 29 0 0 0 3 10 12 4 0 126 6 0 14 0 0 24 0 0 4 7 0 4 11 10 20 26SHERIFF C 116 11 0 0 0 3 0 4 4 0 105 5 0 12 0 0 15 0 0 2 7 0 3 11 10 16 24MN0750000 % 75 38 0 0 0 100 0 33 100 0 83 83 0 86 0 0 63 0 0 50 100 0 75 100 100 80 92POP. 4,448Crime Rate R 3484 651 0 0 0 67 224 269 89 0 2832 134 0 314 0 0 539 0 0 89 157 0 89 247 224 449 584
MORRIS O 406 110 0 4 1 4 9 85 7 0 296 30 5 19 0 0 76 4 0 8 12 0 3 15 23 45 56PD C 303 75 0 4 1 3 6 54 7 0 228 26 3 13 0 0 26 4 0 8 12 0 2 15 23 44 52MN0750100 % 75 68 0 100 100 75 67 64 100 0 77 87 60 68 0 0 34 100 0 100 100 0 67 100 100 98 93POP. 5,299Crime Rate R 7661 2075 0 75 18 75 169 1604 132 0 5585 566 94 358 0 0 1434 75 0 150 226 0 56 283 434 849 1056
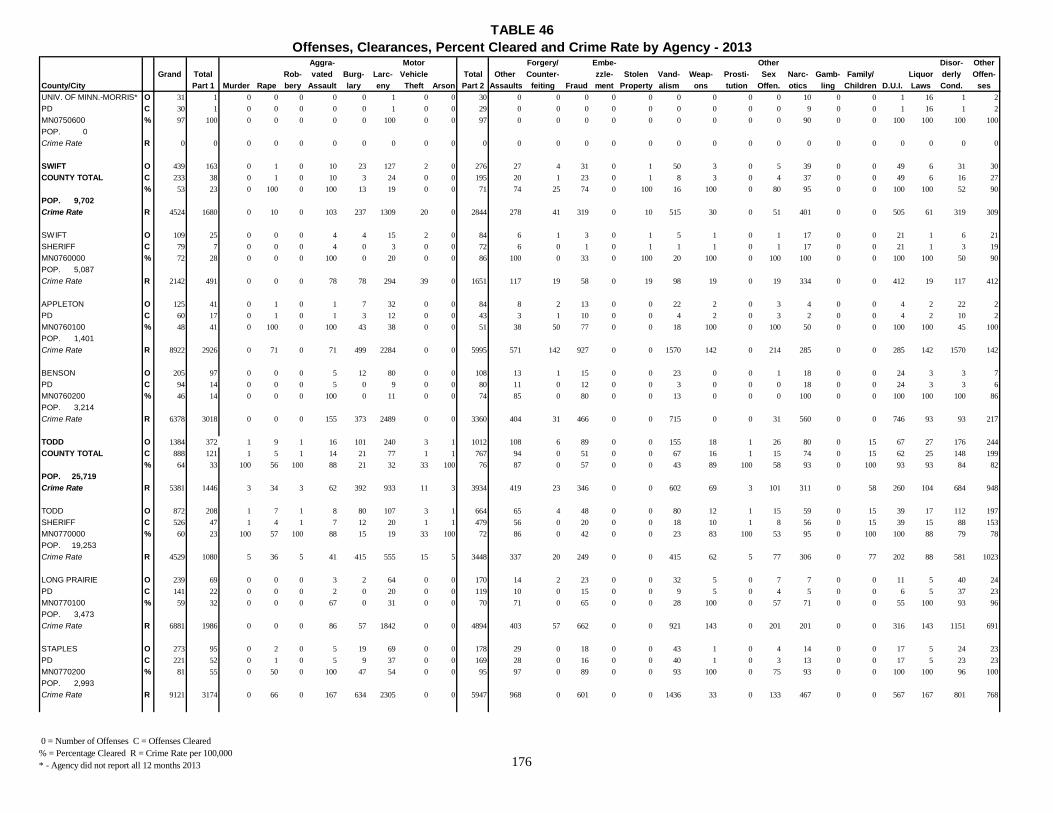
TABLE 46Offenses, Clearances, Percent Cleared and Crime Rate by Agency - 2013
0 = Number of Offenses C = Offenses Cleared % = Percentage Cleared R = Crime Rate per 100,000 * - Agency did not report all 12 months 2013 176
Aggra- Motor Forgery/ Embe- Other Disor- OtherGrand Total Rob- vated Burg- Larc- Vehicle Total Other Counter- zzle- Stolen Vand- Weap- Prosti- Sex Narc- Gamb- Family/ Liquor derly Offen-
County/City Part 1 Murder Rape bery Assault lary eny Theft Arson Part 2 Assaults feiting Fraud ment Property alism ons tution Offen. otics ling Children D.U.I. Laws Cond. sesUNIV. OF MINN.-MORRIS* O 31 1 0 0 0 0 0 1 0 0 30 0 0 0 0 0 0 0 0 0 10 0 0 1 16 1 2PD C 30 1 0 0 0 0 0 1 0 0 29 0 0 0 0 0 0 0 0 0 9 0 0 1 16 1 2MN0750600 % 97 100 0 0 0 0 0 100 0 0 97 0 0 0 0 0 0 0 0 0 90 0 0 100 100 100 100POP. 0Crime Rate R 0 0 0 0 0 0 0 0 0 0 0 0 0 0 0 0 0 0 0 0 0 0 0 0 0 0 0
SWIFT O 439 163 0 1 0 10 23 127 2 0 276 27 4 31 0 1 50 3 0 5 39 0 0 49 6 31 30COUNTY TOTAL C 233 38 0 1 0 10 3 24 0 0 195 20 1 23 0 1 8 3 0 4 37 0 0 49 6 16 27
% 53 23 0 100 0 100 13 19 0 0 71 74 25 74 0 100 16 100 0 80 95 0 0 100 100 52 90POP. 9,702Crime Rate R 4524 1680 0 10 0 103 237 1309 20 0 2844 278 41 319 0 10 515 30 0 51 401 0 0 505 61 319 309
SWIFT O 109 25 0 0 0 4 4 15 2 0 84 6 1 3 0 1 5 1 0 1 17 0 0 21 1 6 21SHERIFF C 79 7 0 0 0 4 0 3 0 0 72 6 0 1 0 1 1 1 0 1 17 0 0 21 1 3 19MN0760000 % 72 28 0 0 0 100 0 20 0 0 86 100 0 33 0 100 20 100 0 100 100 0 0 100 100 50 90POP. 5,087Crime Rate R 2142 491 0 0 0 78 78 294 39 0 1651 117 19 58 0 19 98 19 0 19 334 0 0 412 19 117 412
APPLETON O 125 41 0 1 0 1 7 32 0 0 84 8 2 13 0 0 22 2 0 3 4 0 0 4 2 22 2PD C 60 17 0 1 0 1 3 12 0 0 43 3 1 10 0 0 4 2 0 3 2 0 0 4 2 10 2MN0760100 % 48 41 0 100 0 100 43 38 0 0 51 38 50 77 0 0 18 100 0 100 50 0 0 100 100 45 100POP. 1,401Crime Rate R 8922 2926 0 71 0 71 499 2284 0 0 5995 571 142 927 0 0 1570 142 0 214 285 0 0 285 142 1570 142
BENSON O 205 97 0 0 0 5 12 80 0 0 108 13 1 15 0 0 23 0 0 1 18 0 0 24 3 3 7PD C 94 14 0 0 0 5 0 9 0 0 80 11 0 12 0 0 3 0 0 0 18 0 0 24 3 3 6MN0760200 % 46 14 0 0 0 100 0 11 0 0 74 85 0 80 0 0 13 0 0 0 100 0 0 100 100 100 86POP. 3,214Crime Rate R 6378 3018 0 0 0 155 373 2489 0 0 3360 404 31 466 0 0 715 0 0 31 560 0 0 746 93 93 217
TODD O 1384 372 1 9 1 16 101 240 3 1 1012 108 6 89 0 0 155 18 1 26 80 0 15 67 27 176 244COUNTY TOTAL C 888 121 1 5 1 14 21 77 1 1 767 94 0 51 0 0 67 16 1 15 74 0 15 62 25 148 199
% 64 33 100 56 100 88 21 32 33 100 76 87 0 57 0 0 43 89 100 58 93 0 100 93 93 84 82POP. 25,719Crime Rate R 5381 1446 3 34 3 62 392 933 11 3 3934 419 23 346 0 0 602 69 3 101 311 0 58 260 104 684 948
TODD O 872 208 1 7 1 8 80 107 3 1 664 65 4 48 0 0 80 12 1 15 59 0 15 39 17 112 197SHERIFF C 526 47 1 4 1 7 12 20 1 1 479 56 0 20 0 0 18 10 1 8 56 0 15 39 15 88 153MN0770000 % 60 23 100 57 100 88 15 19 33 100 72 86 0 42 0 0 23 83 100 53 95 0 100 100 88 79 78POP. 19,253Crime Rate R 4529 1080 5 36 5 41 415 555 15 5 3448 337 20 249 0 0 415 62 5 77 306 0 77 202 88 581 1023
LONG PRAIRIE O 239 69 0 0 0 3 2 64 0 0 170 14 2 23 0 0 32 5 0 7 7 0 0 11 5 40 24PD C 141 22 0 0 0 2 0 20 0 0 119 10 0 15 0 0 9 5 0 4 5 0 0 6 5 37 23MN0770100 % 59 32 0 0 0 67 0 31 0 0 70 71 0 65 0 0 28 100 0 57 71 0 0 55 100 93 96POP. 3,473Crime Rate R 6881 1986 0 0 0 86 57 1842 0 0 4894 403 57 662 0 0 921 143 0 201 201 0 0 316 143 1151 691
STAPLES O 273 95 0 2 0 5 19 69 0 0 178 29 0 18 0 0 43 1 0 4 14 0 0 17 5 24 23PD C 221 52 0 1 0 5 9 37 0 0 169 28 0 16 0 0 40 1 0 3 13 0 0 17 5 23 23MN0770200 % 81 55 0 50 0 100 47 54 0 0 95 97 0 89 0 0 93 100 0 75 93 0 0 100 100 96 100POP. 2,993Crime Rate R 9121 3174 0 66 0 167 634 2305 0 0 5947 968 0 601 0 0 1436 33 0 133 467 0 0 567 167 801 768

TABLE 46Offenses, Clearances, Percent Cleared and Crime Rate by Agency - 2013
0 = Number of Offenses C = Offenses Cleared % = Percentage Cleared R = Crime Rate per 100,000 * - Agency did not report all 12 months 2013 177
Aggra- Motor Forgery/ Embe- Other Disor- OtherGrand Total Rob- vated Burg- Larc- Vehicle Total Other Counter- zzle- Stolen Vand- Weap- Prosti- Sex Narc- Gamb- Family/ Liquor derly Offen-
County/City Part 1 Murder Rape bery Assault lary eny Theft Arson Part 2 Assaults feiting Fraud ment Property alism ons tution Offen. otics ling Children D.U.I. Laws Cond. sesTRAVERSE* O 0 0 0 0 0 0 0 0 0 0 0 0 0 0 0 0 0 0 0 0 0 0 0 0 0 0 0COUNTY TOTAL C 0 0 0 0 0 0 0 0 0 0 0 0 0 0 0 0 0 0 0 0 0 0 0 0 0 0 0
% 0 0 0 0 0 0 0 0 0 0 0 0 0 0 0 0 0 0 0 0 0 0 0 0 0 0 0POP. 3,546Crime Rate R 0 0 0 0 0 0 0 0 0 0 0 0 0 0 0 0 0 0 0 0 0 0 0 0 0 0 0
TRAVERSE* O 0 0 0 0 0 0 0 0 0 0 0 0 0 0 0 0 0 0 0 0 0 0 0 0 0 0 0SHERIFF C 0 0 0 0 0 0 0 0 0 0 0 0 0 0 0 0 0 0 0 0 0 0 0 0 0 0 0MN0780000 % 0 0 0 0 0 0 0 0 0 0 0 0 0 0 0 0 0 0 0 0 0 0 0 0 0 0 0POP. 2,127Crime Rate R 0 0 0 0 0 0 0 0 0 0 0 0 0 0 0 0 0 0 0 0 0 0 0 0 0 0 0
WHEATON* O 0 0 0 0 0 0 0 0 0 0 0 0 0 0 0 0 0 0 0 0 0 0 0 0 0 0 0PD C 0 0 0 0 0 0 0 0 0 0 0 0 0 0 0 0 0 0 0 0 0 0 0 0 0 0 0MN0780200 % 0 0 0 0 0 0 0 0 0 0 0 0 0 0 0 0 0 0 0 0 0 0 0 0 0 0 0POP. 1,419Crime Rate R 0 0 0 0 0 0 0 0 0 0 0 0 0 0 0 0 0 0 0 0 0 0 0 0 0 0 0
WABASHA O 817 251 0 4 0 18 41 171 16 1 566 55 4 84 1 3 99 3 0 8 83 0 2 92 21 45 66COUNTY TOTAL C 360 63 0 2 0 14 7 34 6 0 297 42 4 44 0 2 4 2 0 4 68 0 0 74 13 10 30
% 44 25 0 50 0 78 17 20 38 0 52 76 100 52 0 67 4 67 0 50 82 0 0 80 62 22 45POP. 22,492Crime Rate R 3632 1115 0 17 0 80 182 760 71 4 2516 244 17 373 4 13 440 13 0 35 369 0 8 409 93 200 293
WABASHA O 297 69 0 0 0 7 6 48 8 0 228 19 0 4 0 2 41 1 0 3 29 0 0 36 15 34 44SHERIFF C 84 5 0 0 0 5 0 0 0 0 79 11 0 0 0 1 0 0 0 1 17 0 0 26 8 2 13MN0790000 % 28 7 0 0 0 71 0 0 0 0 35 58 0 0 0 50 0 0 0 33 59 0 0 72 53 6 30POP. 11,533Crime Rate R 2575 598 0 0 0 60 52 416 69 0 1976 164 0 34 0 17 355 8 0 26 251 0 0 312 130 294 381
LAKE CITY O 275 130 0 2 0 4 25 91 7 1 145 10 2 9 0 1 33 0 0 3 41 0 0 28 3 4 11PD C 140 38 0 2 0 2 3 26 5 0 102 9 2 4 0 1 1 0 0 1 40 0 0 28 3 3 10MN0790100 % 51 29 0 100 0 50 12 29 71 0 70 90 100 44 0 100 3 0 0 33 98 0 0 100 100 75 91POP. 5,080Crime Rate R 5413 2559 0 39 0 78 492 1791 137 19 2854 196 39 177 0 19 649 0 0 59 807 0 0 551 59 78 216
PLAINVIEW* O 57 10 0 2 0 2 1 5 0 0 47 7 0 14 0 0 1 1 0 0 3 0 2 10 2 2 5PD C 14 2 0 0 0 2 0 0 0 0 12 4 0 1 0 0 0 1 0 0 1 0 0 2 1 0 2MN0790200 % 25 20 0 0 0 100 0 0 0 0 26 57 0 7 0 0 0 100 0 0 33 0 0 20 50 0 40POP. 3,350Crime Rate R 1701 298 0 59 0 59 29 149 0 0 1402 208 0 417 0 0 29 29 0 0 89 0 59 298 59 59 149
WABASHA O 188 42 0 0 0 5 9 27 1 0 146 19 2 57 1 0 24 1 0 2 10 0 0 18 1 5 6PD C 122 18 0 0 0 5 4 8 1 0 104 18 2 39 0 0 3 1 0 2 10 0 0 18 1 5 5MN0790300 % 65 43 0 0 0 100 44 30 100 0 71 95 100 68 0 0 13 100 0 100 100 0 0 100 100 100 83POP. 2,529Crime Rate R 7433 1660 0 0 0 197 355 1067 39 0 5773 751 79 2253 39 0 948 39 0 79 395 0 0 711 39 197 237
WADENA O 340 94 0 5 0 7 17 57 7 1 246 55 5 14 0 0 8 2 0 20 9 0 4 28 10 41 50COUNTY TOTAL C 214 30 0 2 0 7 0 16 4 1 184 47 4 6 0 0 3 2 0 11 9 0 0 28 9 29 36
% 63 32 0 40 0 100 0 28 57 100 75 85 80 43 0 0 38 100 0 55 100 0 0 100 90 71 72POP. 13,029Crime Rate R 2609 721 0 38 0 53 130 437 53 7 1888 422 38 107 0 0 61 15 0 153 69 0 30 214 76 314 383

TABLE 46Offenses, Clearances, Percent Cleared and Crime Rate by Agency - 2013
0 = Number of Offenses C = Offenses Cleared % = Percentage Cleared R = Crime Rate per 100,000 * - Agency did not report all 12 months 2013 178
Aggra- Motor Forgery/ Embe- Other Disor- OtherGrand Total Rob- vated Burg- Larc- Vehicle Total Other Counter- zzle- Stolen Vand- Weap- Prosti- Sex Narc- Gamb- Family/ Liquor derly Offen-
County/City Part 1 Murder Rape bery Assault lary eny Theft Arson Part 2 Assaults feiting Fraud ment Property alism ons tution Offen. otics ling Children D.U.I. Laws Cond. sesWADENA O 221 67 0 3 0 5 17 35 6 1 154 48 0 6 0 0 6 0 0 14 3 0 1 19 6 11 40SHERIFF C 122 14 0 0 0 5 0 5 3 1 108 40 0 0 0 0 3 0 0 6 3 0 0 19 5 5 27MN0800000 % 55 21 0 0 0 100 0 14 50 100 70 83 0 0 0 0 50 0 0 43 100 0 0 100 83 45 68POP. 8,943Crime Rate R 2471 749 0 33 0 55 190 391 67 11 1722 536 0 67 0 0 67 0 0 156 33 0 11 212 67 123 447
WADENA* O 119 27 0 2 0 2 0 22 1 0 92 7 5 8 0 0 2 2 0 6 6 0 3 9 4 30 10PD C 92 16 0 2 0 2 0 11 1 0 76 7 4 6 0 0 0 2 0 5 6 0 0 9 4 24 9MN0800100 % 77 59 0 100 0 100 0 50 100 0 83 100 80 75 0 0 0 100 0 83 100 0 0 100 100 80 90POP. 4,086Crime Rate R 2912 660 0 48 0 48 0 538 24 0 2251 171 122 195 0 0 48 48 0 146 146 0 73 220 97 734 244
WASECA O 1067 314 0 4 0 4 63 230 13 0 753 68 8 31 0 4 154 9 0 9 63 0 13 50 16 132 196COUNTY TOTAL C 597 100 0 1 0 4 12 76 7 0 497 55 2 12 0 2 37 2 0 7 62 0 12 49 15 98 144
% 56 32 0 25 0 100 19 33 54 0 66 81 25 39 0 50 24 22 0 78 98 0 92 98 94 74 73POP. 19,397Crime Rate R 5500 1618 0 20 0 20 324 1185 67 0 3882 350 41 159 0 20 793 46 0 46 324 0 67 257 82 680 1010
WASECA O 449 88 0 1 0 1 28 53 5 0 361 20 0 27 0 0 65 7 0 3 12 0 10 22 2 46 147SHERIFF C 249 21 0 1 0 1 4 13 2 0 228 20 0 9 0 0 14 2 0 3 12 0 10 22 2 27 107MN0810000 % 55 24 0 100 0 100 14 25 40 0 63 100 0 33 0 0 22 29 0 100 100 0 100 100 100 59 73POP. 6,353Crime Rate R 7067 1385 0 15 0 15 440 834 78 0 5682 314 0 424 0 0 1023 110 0 47 188 0 157 346 31 724 2313
JANESVILLE O 73 17 0 0 0 0 4 12 1 0 56 7 0 0 0 0 9 1 0 0 1 0 0 6 3 27 2PD C 47 7 0 0 0 0 2 4 1 0 40 7 0 0 0 0 0 0 0 0 1 0 0 6 3 21 2MN0810100 % 64 41 0 0 0 0 50 33 100 0 71 100 0 0 0 0 0 0 0 0 100 0 0 100 100 78 100POP. 2,286Crime Rate R 3193 743 0 0 0 0 174 524 43 0 2449 306 0 0 0 0 393 43 0 0 43 0 0 262 131 1181 87
NEW RICHLAND O 21 2 0 0 0 1 1 0 0 0 19 5 0 1 0 1 8 0 0 0 0 0 0 0 2 1 1PD C 9 2 0 0 0 1 1 0 0 0 7 4 0 1 0 0 0 0 0 0 0 0 0 0 1 1 0MN0810200 % 43 100 0 0 0 100 100 0 0 0 37 80 0 100 0 0 0 0 0 0 0 0 0 0 50 100 0POP. 1,220Crime Rate R 1721 163 0 0 0 81 81 0 0 0 1557 409 0 81 0 81 655 0 0 0 0 0 0 0 163 81 81
WASECA O 524 207 0 3 0 2 30 165 7 0 317 36 8 3 0 3 72 1 0 6 50 0 3 22 9 58 46PD C 292 70 0 0 0 2 5 59 4 0 222 24 2 2 0 2 23 0 0 4 49 0 2 21 9 49 35MN0810300 % 56 34 0 0 0 100 17 36 57 0 70 67 25 67 0 67 32 0 0 67 98 0 67 95 100 84 76POP. 9,538Crime Rate R 5493 2170 0 31 0 20 314 1729 73 0 3323 377 83 31 0 31 754 10 0 62 524 0 31 230 94 608 482
WASHINGTON O 15279 5440 1 44 44 99 746 4292 199 15 9839 911 130 1251 3 58 1609 246 13 118 776 0 57 737 279 2413 1238COUNTY TOTAL C 7236 1432 1 15 21 77 105 1150 58 5 5804 690 26 359 0 53 208 99 11 71 754 0 16 730 271 1637 879
% 47 26 100 34 48 78 14 27 29 33 59 76 20 29 0 91 13 40 85 60 97 0 28 99 97 68 71POP. 242,415Crime Rate R 6303 2244 0 18 18 40 307 1770 82 6 4058 375 53 516 1 23 663 101 5 48 320 0 23 304 115 995 510
WASHINGTON O 3272 842 0 6 4 22 178 603 26 3 2430 238 12 192 0 7 355 126 10 31 252 0 4 178 64 509 452SHERIFF C 1609 122 0 3 2 21 26 60 8 2 1487 204 2 18 0 7 52 37 10 24 249 0 1 177 63 338 305MN0820000 % 49 14 0 50 50 95 15 10 31 67 61 86 17 9 0 100 15 29 100 77 99 0 25 99 98 66 67POP. 61,885Crime Rate R 5287 1360 0 9 6 35 287 974 42 4 3926 384 19 310 0 11 573 203 16 50 407 0 6 287 103 822 730

TABLE 46Offenses, Clearances, Percent Cleared and Crime Rate by Agency - 2013
0 = Number of Offenses C = Offenses Cleared % = Percentage Cleared R = Crime Rate per 100,000 * - Agency did not report all 12 months 2013 179
Aggra- Motor Forgery/ Embe- Other Disor- OtherGrand Total Rob- vated Burg- Larc- Vehicle Total Other Counter- zzle- Stolen Vand- Weap- Prosti- Sex Narc- Gamb- Family/ Liquor derly Offen-
County/City Part 1 Murder Rape bery Assault lary eny Theft Arson Part 2 Assaults feiting Fraud ment Property alism ons tution Offen. otics ling Children D.U.I. Laws Cond. sesBAYPORT O 170 19 0 0 0 0 1 18 0 0 151 5 5 6 0 0 15 1 0 1 23 0 0 45 6 34 10PD C 140 5 0 0 0 0 0 5 0 0 135 5 0 2 0 0 11 1 0 0 23 0 0 45 6 32 10MN0820100 % 82 26 0 0 0 0 0 28 0 0 89 100 0 33 0 0 73 100 0 0 100 0 0 100 100 94 100POP. 3,518Crime Rate R 4832 540 0 0 0 0 28 511 0 0 4292 142 142 170 0 0 426 28 0 28 653 0 0 1279 170 966 284
FOREST LAKE O 1149 385 0 9 5 5 67 269 30 0 764 86 10 126 0 9 136 1 0 11 77 0 2 91 45 53 117PD C 589 101 0 4 2 5 12 67 11 0 488 73 4 21 0 7 14 1 0 4 77 0 2 91 44 53 97MN0820200 % 51 26 0 44 40 100 18 25 37 0 64 85 40 17 0 78 10 100 0 36 100 0 100 100 98 100 83POP. 18,738Crime Rate R 6131 2054 0 48 26 26 357 1435 160 0 4077 458 53 672 0 48 725 5 0 58 410 0 10 485 240 282 624
NEWPORT O 442 123 0 0 3 2 20 93 5 0 319 32 4 11 0 1 30 6 0 4 22 0 3 41 7 109 49PD C 308 34 0 0 1 2 10 18 3 0 274 28 1 1 0 1 10 6 0 4 22 0 2 41 7 106 45MN0820400 % 70 28 100 0 33 100 50 19 60 0 86 88 25 9 0 100 33 100 0 100 100 0 67 100 100 97 92POP. 3,503Crime Rate R 12618 3511 0 0 85 57 570 2654 142 0 9106 913 114 314 0 28 856 171 0 114 628 0 85 1170 199 3111 1398
ST. PAUL PARK O 605 148 0 0 2 12 27 95 11 1 457 59 3 13 0 4 80 18 0 5 22 0 3 29 18 137 66PD C 409 48 0 0 0 10 10 21 6 1 361 55 0 4 0 4 24 17 0 4 21 0 3 26 16 132 55MN0820500 % 68 33 100 0 0 83 37 22 55 100 79 93 0 31 0 100 30 94 0 80 95 0 100 90 89 96 83POP. 5,384Crime Rate R 11237 2749 0 0 37 222 501 1764 204 18 8488 1095 55 241 0 74 1485 334 0 92 408 0 55 538 334 2544 1225
STILLWATER O 1210 338 0 6 4 6 45 262 13 2 872 66 8 294 1 4 170 2 0 7 28 0 0 34 27 126 105PD C 561 57 0 2 4 6 2 42 1 0 504 44 1 240 0 4 11 2 0 5 28 0 0 34 27 60 48MN0820600 % 46 17 0 33 100 100 4 16 8 0 58 67 13 82 0 100 6 100 0 71 100 0 0 100 100 48 46POP. 18,582Crime Rate R 6511 1818 0 32 21 32 242 1409 69 10 4692 355 43 1582 5 21 914 10 0 37 150 0 0 182 145 678 565
COTTAGE GROVE O 2042 711 0 5 11 9 82 578 23 3 1331 105 23 120 0 5 203 66 1 28 133 0 5 100 30 396 116PD C 990 220 0 4 6 6 11 181 12 0 770 85 3 11 0 5 19 22 1 11 131 0 1 100 30 261 90MN0820700 % 48 31 0 80 55 67 13 31 52 0 58 81 13 9 0 100 9 33 100 39 98 0 20 100 100 66 78POP. 35,277Crime Rate R 5788 2015 0 14 31 25 232 1638 65 8 3772 297 65 340 0 14 575 187 2 79 377 0 14 283 85 1122 328
OAKDALE O 2502 1227 1 18 8 28 136 980 50 6 1275 189 25 253 2 7 302 13 0 12 42 0 32 54 26 195 123PD C 669 337 1 2 3 15 6 300 8 2 332 82 1 20 0 4 18 3 0 3 34 0 2 53 22 35 55MN0820800 % 27 27 100 11 38 54 4 31 16 33 26 43 4 8 0 57 6 23 0 25 81 0 6 98 85 18 45POP. 27,921Crime Rate R 8960 4394 3 64 28 100 487 3509 179 21 4566 676 89 906 7 25 1081 46 0 42 150 0 114 193 93 698 440
WOODBURY O 3272 1407 0 0 7 14 184 1166 36 0 1865 98 31 201 0 18 263 11 2 17 136 0 7 141 45 734 161PD C 1673 441 0 0 3 11 28 390 9 0 1232 89 13 33 0 18 46 9 0 14 130 0 5 141 45 542 147MN0821100 % 51 31 0 0 43 79 15 33 25 0 66 91 42 16 0 100 17 82 0 82 96 0 71 100 100 74 91POP. 63,190Crime Rate R 5178 2226 0 0 11 22 291 1845 56 0 2951 155 49 318 0 28 416 17 3 26 215 0 11 223 71 1161 254
OAK PARK HEIGHTS O 615 240 0 0 0 1 6 228 5 0 375 33 9 35 0 3 55 2 0 2 41 0 1 24 11 120 39PD C 288 67 0 0 0 1 0 66 0 0 221 25 1 9 0 3 3 1 0 2 39 0 0 22 11 78 27MN0821400 % 47 28 0 0 0 100 0 29 0 0 59 76 11 26 0 100 5 50 0 100 95 0 0 92 100 65 69POP. 4,417Crime Rate R 13923 5433 0 0 0 22 135 5161 113 0 8489 747 203 792 0 67 1245 45 0 45 928 0 22 543 249 2716 882

TABLE 46Offenses, Clearances, Percent Cleared and Crime Rate by Agency - 2013
0 = Number of Offenses C = Offenses Cleared % = Percentage Cleared R = Crime Rate per 100,000 * - Agency did not report all 12 months 2013 180
Aggra- Motor Forgery/ Embe- Other Disor- OtherGrand Total Rob- vated Burg- Larc- Vehicle Total Other Counter- zzle- Stolen Vand- Weap- Prosti- Sex Narc- Gamb- Family/ Liquor derly Offen-
County/City Part 1 Murder Rape bery Assault lary eny Theft Arson Part 2 Assaults feiting Fraud ment Property alism ons tution Offen. otics ling Children D.U.I. Laws Cond. sesWATONWAN O 418 135 0 9 0 9 41 66 10 0 283 41 5 16 0 0 59 1 0 2 15 0 4 26 12 40 62COUNTY TOTAL C 270 41 0 7 0 8 6 17 3 0 229 41 5 6 0 0 15 1 0 2 15 0 4 26 12 40 62
% 65 30 0 78 0 89 15 26 30 0 81 100 100 38 0 0 25 100 0 100 100 0 100 100 100 100 100POP. 11,273Crime Rate R 3707 1197 0 79 0 79 363 585 88 0 2510 363 44 141 0 0 523 8 0 17 133 0 35 230 106 354 549
WATONWAN O 135 44 0 4 0 4 19 12 5 0 91 11 1 3 0 0 20 1 0 1 5 0 3 16 6 4 20SHERIFF C 90 14 0 3 0 4 2 4 1 0 76 11 1 0 0 0 8 1 0 1 5 0 3 16 6 4 20MN0830000 % 67 32 0 75 0 100 11 33 20 0 84 100 100 0 0 0 40 100 0 100 100 0 100 100 100 100 100POP. 6,636Crime Rate R 2034 663 0 60 0 60 286 180 75 0 1371 165 15 45 0 0 301 15 0 15 75 0 45 241 90 60 301
ST. JAMES O 283 91 0 5 0 5 22 54 5 0 192 30 4 13 0 0 39 0 0 1 10 0 1 10 6 36 42PD C 180 27 0 4 0 4 4 13 2 0 153 30 4 6 0 0 7 0 0 1 10 0 1 10 6 36 42MN0830200 % 64 30 0 80 0 80 18 24 40 0 80 100 100 46 0 0 18 0 0 100 100 0 100 100 100 100 100POP. 4,637Crime Rate R 6103 1962 0 107 0 107 474 1164 107 0 4140 646 86 280 0 0 841 0 0 21 215 0 21 215 129 776 905
WILKIN O 440 84 0 1 0 5 19 56 3 0 356 39 0 14 0 1 38 5 0 2 28 0 36 54 12 49 78COUNTY TOTAL C 325 28 0 1 0 5 4 15 3 0 297 37 0 2 0 1 11 5 0 2 28 0 31 54 11 42 73
% 74 33 0 100 0 100 21 27 100 0 83 95 0 14 0 100 29 100 0 100 100 0 86 100 92 86 94POP. 6,634Crime Rate R 6632 1266 0 15 0 75 286 844 45 0 5366 587 0 211 0 15 572 75 0 30 422 0 542 813 180 738 1175
WILKIN O 107 25 0 0 0 1 8 13 3 0 82 11 0 1 0 0 4 1 0 0 4 0 5 21 1 15 19SHERIFF C 81 8 0 0 0 1 1 3 3 0 73 10 0 1 0 0 1 1 0 0 4 0 4 21 1 12 18MN0840000 % 76 32 0 0 0 100 13 23 100 0 89 91 0 100 0 0 25 100 0 0 100 0 80 100 100 80 95POP. 3,217Crime Rate R 3326 777 0 0 0 31 248 404 93 0 2548 341 0 31 0 0 124 31 0 0 124 0 155 652 31 466 590
BRECKENRIDGE O 333 59 0 1 0 4 11 43 0 0 274 28 0 13 0 1 34 4 0 2 24 0 31 33 11 34 59PD C 244 20 0 1 0 4 3 12 0 0 224 27 0 1 0 1 10 4 0 2 24 0 27 33 10 30 55MN0840100 % 73 34 0 100 0 100 27 28 0 0 82 96 0 8 0 100 29 100 0 100 100 0 87 100 91 88 93POP. 3,417Crime Rate R 9745 1726 0 29 0 117 321 1258 0 0 8018 819 0 380 0 29 995 117 0 58 702 0 907 965 321 995 1726
WINONA O 2166 592 0 7 5 39 105 391 44 1 1574 192 25 94 0 2 194 21 2 51 141 0 36 212 157 157 290COUNTY TOTAL C 1384 235 0 6 5 29 10 171 13 1 1149 150 15 45 0 1 31 19 1 17 125 0 23 212 157 117 236
% 64 40 0 86 100 74 10 44 30 100 73 78 60 48 0 50 16 90 50 33 89 0 64 100 100 75 81POP. 51,708Crime Rate R 4188 1144 0 13 9 75 203 756 85 1 3044 371 48 181 0 3 375 40 3 98 272 0 69 409 303 303 560
WINONA O 495 94 0 3 0 7 23 45 15 1 401 42 3 20 0 0 35 5 0 22 48 0 19 77 10 43 77SHERIFF C 323 21 0 2 0 3 1 10 4 1 302 33 1 5 0 0 8 5 0 9 41 0 17 77 10 35 61MN0850000 % 65 22 0 67 0 43 4 22 27 100 75 79 33 25 0 0 23 100 0 41 85 0 89 100 100 81 79POP. 14,543Crime Rate R 3403 646 0 20 0 48 158 309 103 6 2757 288 20 137 0 0 240 34 0 151 330 0 130 529 68 295 529
ST. CHARLES* O 57 19 0 1 0 3 3 12 0 0 38 5 0 4 0 0 11 0 0 0 1 0 3 2 1 5 6PD C 27 3 0 1 0 1 0 1 0 0 24 5 0 4 0 0 1 0 0 0 1 0 3 2 1 2 5MN0850100 % 47 16 0 100 0 33 0 8 0 0 63 100 0 100 0 0 9 0 0 0 100 0 100 100 100 40 83POP. 3,752Crime Rate R 1519 506 0 26 0 79 79 319 0 0 1012 133 0 106 0 0 293 0 0 0 26 0 79 53 26 133 159
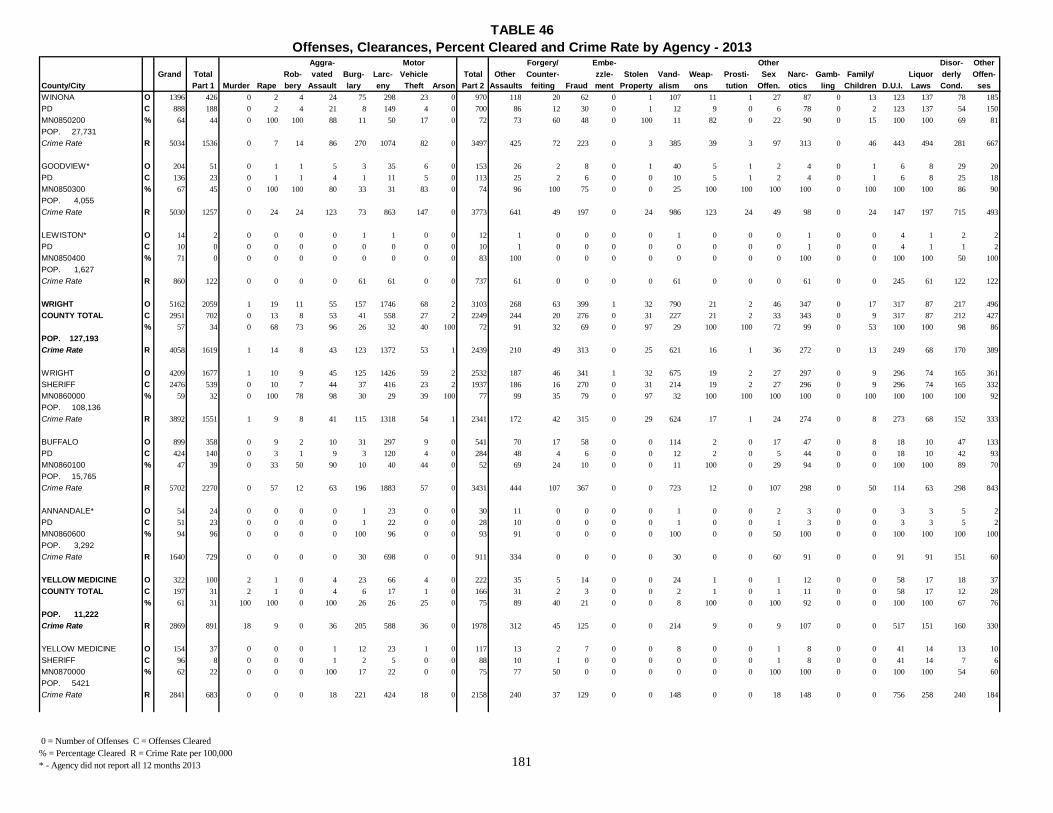
TABLE 46Offenses, Clearances, Percent Cleared and Crime Rate by Agency - 2013
0 = Number of Offenses C = Offenses Cleared % = Percentage Cleared R = Crime Rate per 100,000 * - Agency did not report all 12 months 2013 181
Aggra- Motor Forgery/ Embe- Other Disor- OtherGrand Total Rob- vated Burg- Larc- Vehicle Total Other Counter- zzle- Stolen Vand- Weap- Prosti- Sex Narc- Gamb- Family/ Liquor derly Offen-
County/City Part 1 Murder Rape bery Assault lary eny Theft Arson Part 2 Assaults feiting Fraud ment Property alism ons tution Offen. otics ling Children D.U.I. Laws Cond. sesWINONA O 1396 426 0 2 4 24 75 298 23 0 970 118 20 62 0 1 107 11 1 27 87 0 13 123 137 78 185PD C 888 188 0 2 4 21 8 149 4 0 700 86 12 30 0 1 12 9 0 6 78 0 2 123 137 54 150MN0850200 % 64 44 0 100 100 88 11 50 17 0 72 73 60 48 0 100 11 82 0 22 90 0 15 100 100 69 81POP. 27,731Crime Rate R 5034 1536 0 7 14 86 270 1074 82 0 3497 425 72 223 0 3 385 39 3 97 313 0 46 443 494 281 667
GOODVIEW* O 204 51 0 1 1 5 3 35 6 0 153 26 2 8 0 1 40 5 1 2 4 0 1 6 8 29 20PD C 136 23 0 1 1 4 1 11 5 0 113 25 2 6 0 0 10 5 1 2 4 0 1 6 8 25 18MN0850300 % 67 45 0 100 100 80 33 31 83 0 74 96 100 75 0 0 25 100 100 100 100 0 100 100 100 86 90POP. 4,055Crime Rate R 5030 1257 0 24 24 123 73 863 147 0 3773 641 49 197 0 24 986 123 24 49 98 0 24 147 197 715 493
LEWISTON* O 14 2 0 0 0 0 1 1 0 0 12 1 0 0 0 0 1 0 0 0 1 0 0 4 1 2 2PD C 10 0 0 0 0 0 0 0 0 0 10 1 0 0 0 0 0 0 0 0 1 0 0 4 1 1 2MN0850400 % 71 0 0 0 0 0 0 0 0 0 83 100 0 0 0 0 0 0 0 0 100 0 0 100 100 50 100POP. 1,627Crime Rate R 860 122 0 0 0 0 61 61 0 0 737 61 0 0 0 0 61 0 0 0 61 0 0 245 61 122 122
WRIGHT O 5162 2059 1 19 11 55 157 1746 68 2 3103 268 63 399 1 32 790 21 2 46 347 0 17 317 87 217 496COUNTY TOTAL C 2951 702 0 13 8 53 41 558 27 2 2249 244 20 276 0 31 227 21 2 33 343 0 9 317 87 212 427
% 57 34 0 68 73 96 26 32 40 100 72 91 32 69 0 97 29 100 100 72 99 0 53 100 100 98 86POP. 127,193Crime Rate R 4058 1619 1 14 8 43 123 1372 53 1 2439 210 49 313 0 25 621 16 1 36 272 0 13 249 68 170 389
WRIGHT O 4209 1677 1 10 9 45 125 1426 59 2 2532 187 46 341 1 32 675 19 2 27 297 0 9 296 74 165 361SHERIFF C 2476 539 0 10 7 44 37 416 23 2 1937 186 16 270 0 31 214 19 2 27 296 0 9 296 74 165 332MN0860000 % 59 32 0 100 78 98 30 29 39 100 77 99 35 79 0 97 32 100 100 100 100 0 100 100 100 100 92POP. 108,136Crime Rate R 3892 1551 1 9 8 41 115 1318 54 1 2341 172 42 315 0 29 624 17 1 24 274 0 8 273 68 152 333
BUFFALO O 899 358 0 9 2 10 31 297 9 0 541 70 17 58 0 0 114 2 0 17 47 0 8 18 10 47 133PD C 424 140 0 3 1 9 3 120 4 0 284 48 4 6 0 0 12 2 0 5 44 0 0 18 10 42 93MN0860100 % 47 39 0 33 50 90 10 40 44 0 52 69 24 10 0 0 11 100 0 29 94 0 0 100 100 89 70POP. 15,765Crime Rate R 5702 2270 0 57 12 63 196 1883 57 0 3431 444 107 367 0 0 723 12 0 107 298 0 50 114 63 298 843
ANNANDALE* O 54 24 0 0 0 0 1 23 0 0 30 11 0 0 0 0 1 0 0 2 3 0 0 3 3 5 2PD C 51 23 0 0 0 0 1 22 0 0 28 10 0 0 0 0 1 0 0 1 3 0 0 3 3 5 2MN0860600 % 94 96 0 0 0 0 100 96 0 0 93 91 0 0 0 0 100 0 0 50 100 0 0 100 100 100 100POP. 3,292Crime Rate R 1640 729 0 0 0 0 30 698 0 0 911 334 0 0 0 0 30 0 0 60 91 0 0 91 91 151 60
YELLOW MEDICINE O 322 100 2 1 0 4 23 66 4 0 222 35 5 14 0 0 24 1 0 1 12 0 0 58 17 18 37COUNTY TOTAL C 197 31 2 1 0 4 6 17 1 0 166 31 2 3 0 0 2 1 0 1 11 0 0 58 17 12 28
% 61 31 100 100 0 100 26 26 25 0 75 89 40 21 0 0 8 100 0 100 92 0 0 100 100 67 76POP. 11,222Crime Rate R 2869 891 18 9 0 36 205 588 36 0 1978 312 45 125 0 0 214 9 0 9 107 0 0 517 151 160 330
YELLOW MEDICINE O 154 37 0 0 0 1 12 23 1 0 117 13 2 7 0 0 8 0 0 1 8 0 0 41 14 13 10SHERIFF C 96 8 0 0 0 1 2 5 0 0 88 10 1 0 0 0 0 0 0 1 8 0 0 41 14 7 6MN0870000 % 62 22 0 0 0 100 17 22 0 0 75 77 50 0 0 0 0 0 0 100 100 0 0 100 100 54 60POP. 5421 Crime Rate R 2841 683 0 0 0 18 221 424 18 0 2158 240 37 129 0 0 148 0 0 18 148 0 0 756 258 240 184

TABLE 46Offenses, Clearances, Percent Cleared and Crime Rate by Agency - 2013
0 = Number of Offenses C = Offenses Cleared % = Percentage Cleared R = Crime Rate per 100,000 * - Agency did not report all 12 months 2013 182
Aggra- Motor Forgery/ Embe- Other Disor- OtherGrand Total Rob- vated Burg- Larc- Vehicle Total Other Counter- zzle- Stolen Vand- Weap- Prosti- Sex Narc- Gamb- Family/ Liquor derly Offen-
County/City Part 1 Murder Rape bery Assault lary eny Theft Arson Part 2 Assaults feiting Fraud ment Property alism ons tution Offen. otics ling Children D.U.I. Laws Cond. sesCANBY O 26 17 0 0 0 0 4 13 0 0 9 0 0 0 0 0 1 0 0 0 3 0 0 2 0 2 1PD C 9 2 0 0 0 0 2 0 0 0 7 0 0 0 0 0 0 0 0 0 2 0 0 2 0 2 1MN0870100 % 35 12 0 0 0 0 50 0 0 0 78 0 0 0 0 0 0 0 0 0 67 0 0 100 0 100 100POP. 1,785Crime Rate R 1456 952 0 0 0 0 224 728 0 0 504 0 0 0 0 0 56 0 0 0 168 0 0 112 0 112 56
GRANITE FALLS O 131 41 2 1 0 2 5 28 3 0 90 20 3 6 0 0 13 1 0 0 1 0 0 15 2 3 26PD C 89 20 2 1 0 2 2 12 1 0 69 20 1 3 0 0 2 1 0 0 1 0 0 15 2 3 21MN0870200 % 68 49 100 100 0 100 40 43 33 0 77 100 33 50 0 0 15 100 0 0 100 0 0 100 100 100 81POP. 2,882Crime Rate R 4545 1422 69 34 0 69 173 971 104 0 3122 693 104 208 0 0 451 34 0 0 34 0 0 520 69 104 902
CLARKFIELD* O 5 3 0 0 0 1 0 2 0 0 2 2 0 0 0 0 0 0 0 0 0 0 0 0 0 0 0PD C 2 1 0 0 0 1 0 0 0 0 1 1 0 0 0 0 0 0 0 0 0 0 0 0 0 0 0MN0870300 % 40 33 0 0 0 100 0 0 0 0 50 50 0 0 0 0 0 0 0 0 0 0 0 0 0 0 0POP. 858Crime Rate R 583 350 0 0 0 117 0 233 0 0 233 233 0 0 0 0 0 0 0 0 0 0 0 0 0 0 0
ECHO* O 6 2 0 0 0 0 2 0 0 0 4 0 0 1 0 0 2 0 0 0 0 0 0 0 1 0 0PD C 1 0 0 0 0 0 0 0 0 0 1 0 0 0 0 0 0 0 0 0 0 0 0 0 1 0 0MN0870400 % 17 0 0 0 0 0 0 0 0 0 25 0 0 0 0 0 0 0 0 0 0 0 0 0 100 0 0POP. 276Crime Rate R 2174 725 0 0 0 0 275 0 0 0 1449 0 0 362 0 0 275 0 0 0 0 0 0 0 362 0 0
MINNESOTA O 4682 18 0 0 0 0 0 16 2 0 4664 7 2 0 0 0 12 0 0 0 1 0 0 4587 0 6 49STATE PATROL C 4594 10 0 0 0 0 0 9 1 0 4584 5 0 0 0 0 6 0 0 0 1 0 0 4521 0 3 48
% 98 56 0 0 0 0 0 56 50 0 98 71 0 0 0 0 50 0 0 0 100 0 0 99 0 50 98POP. 0Crime Rate R 0 0 0 0 0 0 0 0 0 0 0 0 0 0 0 0 0 0 0 0 0 0 0 0 0 0 0
CAPITOL SECURITY O 44 17 0 0 0 0 0 16 1 0 27 7 2 0 0 0 12 0 0 0 0 0 0 0 0 6 0PD C 23 9 0 0 0 0 0 9 0 0 14 5 0 0 0 0 6 0 0 0 0 0 0 0 0 3 0MNMHP1300 % 52 53 0 0 0 0 0 56 0 0 52 71 0 0 0 0 50 0 0 0 0 0 0 0 0 50 0POP. 0Crime Rate R 0 0 0 0 0 0 0 0 0 0 0 0 0 0 0 0 0 0 0 0 0 0 0 0 0 0 0
FOND DU LAC O 256 106 0 1 0 7 8 85 4 1 150 37 0 1 0 1 11 1 0 1 31 0 3 13 5 15 31PD C 116 19 0 0 0 4 0 14 0 1 97 16 0 1 0 0 5 0 0 1 30 0 1 13 4 8 18MNDI07000 % 45 18 0 0 0 57 0 16 0 100 65 43 0 100 0 0 45 0 0 100 97 0 33 100 80 53 58POP. 0Crime Rate R 0 0 0 0 0 0 0 0 0 0 0 0 0 0 0 0 0 0 0 0 0 0 0 0 0 0 0

183
GLOSSARY OF TERMS APPENDIX A
ADULT - For Minnesota Uniform Crime Report purposes, a person 18 years of age or above. ARREST RATE - The number of arrests reported for Part I and Part II offenses for each unit of population, generally per 100,000. Arrest rates are computed in the same manner as crime rates. CLEARED BY ARREST - For crime reporting purposes, an offense is cleared by arrest or solved when at least one person is: (1) arrested, or (2) charged with the commission of the offense. COUNTY - Subdivisions of state, each with its own government which includes a sheriff's department. CRIME FACTORS - Conditions which affect the amount and type of crime that occurs in a geographical area. CRIME INDEX - The total number of eight major offenses used to measure the extent, fluctuation and distribution of a crime in a given geographical area. Crime classifications used in the index are: Murder, Forcible Rape, Robbery, Aggravated Assault, Burglary, Larceny, Motor Vehicle Theft, and Arson. Each of these offenses is referred to as an "Index Offense". CRIME RATE - The number of index offenses reported for each unit of population, generally per 100,000 persons. Crime rates are computed for communities with varying populations by dividing the number of Index Crimes by the population and multiplying the answer by 100,000. (Example: 500 Index Offenses divided by 10,000 population X 100,000 = 5,000 Crime Rate). EXCEPTIONAL CLEARANCE - A crime solution or clearance recorded when some element beyond law enforcement control precludes the placing of formal charges against an offender. JUVENILE - For Minnesota Uniform Crime Report purposes, a person under the age of 18.
MUNICIPALITY - City of town that has its own government, including police department. PART I OFFENSES - The first of two main categories of crime classes composing a universal crime classification system established for crime reporting purposes. Part I offenses are by their nature more serious and occur most frequently. The monthly tabulation of Part I offenses provides a count of "offenses known". PART II OFFENSES - The second of two main categories of crime classes composing a universal crime classification system established for crime reporting purposes. Part II offenses are generally less serious in nature. Monthly tabulations of Part II offenses are included in Minnesota's crime information report. POPULATION FIGURES - 2007 F.B.I. Population Estimates used for the 2008 report were derived differently than previous years. Rather than applying the state population rate of growth uniformly to all agencies within the state, the UCR staff computed individual rates of growth from one year to the next for every city/town and county for a seven year period (2000-2006). Each agency’s rates of growth were averaged and that average was applied and added to its’ 2006 Census population figure to derive the 2007 population estimates. PROPERTY CRIME - Consists of the Index Offenses of Burglary, Larceny, Motor Vehicle Theft and Arson. RURAL AREA - Geographical area covered by a Sheriffs Department outside of city limits. URBAN – Geographical area covered by local police departments within the city limits. VIOLENT CRIME - Consists of the Index Offenses of Murder, Forcible Rape, Robbery and Aggravated Assault.