State of Computer Science Education
104
2019 State of Computer Science Education Equity and Diversity Advocacy Coalition
-
Upload
khangminh22 -
Category
Documents
-
view
2 -
download
0
Transcript of State of Computer Science Education

About the Code.org Advocacy Coalition
Bringing together more than 70 industry, non-profit, and advocacy organizations, the Code.org Advocacy Coalition is growing the movement to make computer science a fundamental part of K–12 education.
About the CSTA
The Computer Science Teachers Association (CSTA) is a membership organization that supports and promotes the teaching of computer science. CSTA provides opportunities for K–12 teachers and their students to better understand computer science and to more successfully prepare themselves to teach and learn.
2019 State of Computer Science Education
Equity and Diversity
About the ECEP Alliance
The Expanding Computing Education Pathways (ECEP) Alliance is an NSF-funded Broadening Participation in Computing Alliance (NSF-CNS-1822011). As an alliance of 22 states and Puerto Rico, ECEP seeks to increase the number and diversity of students in computing and computing-intensive degrees through advocacy and policy reform.
Advocacy Coalition
Advocacy Coalition

About the Code.org Advocacy Coalition
Bringing together more than 70 industry, non-profit,
and advocacy organizations, the Code.org Advocacy
Coalition is growing the movement to make computer
science a fundamental part of K–12 education.
About the CSTA
The Computer Science Teachers Association (CSTA)
is a membership organization that supports and
promotes the teaching of computer science. CSTA
provides opportunities for K–12 teachers and their
students to better understand computer science and
to more successfully prepare themselves to teach
and learn.
CC BY-NC-SA 4.0. This work is licensed under the Creative Commons Attribution-NonCommercial-ShareAlike 4.0 International License. To view a copy of this license, visit https://creativecommons.org/licenses/by-nc-sa/4.0/
Authorization to reproduce this report in whole or in part is granted.
Suggested Citation: 2019 State of Computer Science Education. (2019). Retrieved from https://advocacy.code.org/
Advocacy Coalition
About the Expanding ComputingEducation Pathways Alliance
The Expanding Computing Education Pathways
(ECEP) Alliance is an NSF-funded Broadening
Participation in Computing Alliance (NSF-CNS-1822011).
ECEP seeks to increase the number and diversity of
students in computing and computing-intensive
degrees by promoting state-level computer science
education reform. Working with the collective impact
model, ECEP supports an alliance of 22 states and
Puerto Rico to identify and develop effective
educational interventions, and expand state-level
infrastructure to drive educational policy change.

And to all the members of the Code.org Advocacy Coalition:
Afterschool AllianceAlliance for California Computing
Education for Students and SchoolsAmerican Association for University
WomenAnita Borg InstituteArizona Technology CouncilAssociation for Computing MachineryBattelleBootUPCalifornia STEM NetworkCEASOM Regional PartnershipCharles County Public SchoolsChicago Suburban CSTACodeVAColorado SucceedsColorado Technology AssociationCommon Sense MediaCompTIAComputing Research AssociationConnecticut Technology CouncilContra Costa County Office of EducationCS4ILCS4RICS4TXCSTA
CSTA New JerseyCSTA New MexicoCyber Innovation CenterDistrict of Columbia Public SchoolsEducational Service District 105Elementary Institute of ScienceExcelinEdExpanding Computing Education
PathwaysFacebook DiversityGoogleHawaii Kids CANIdaho STEM Action CenterIEEEIllinois Technology AssociationKC Tech CouncilLEGO EducationMaryland Center for Computing
EducationMassCANMicrosoftMissouri Mathematics and Science
CoalitionNashville Technology CouncilNational Math and Science InitiativeNational Center for Computer
Science Education
National Center for Women & Information Technology
New Mexico Technology CouncilNextechNH High Tech CouncilNOLA CODEOrlando Science CenterPhiladelphia Alliance for Capital and
TechnologiesRural Technology FundSASScience Foundation ArizonaStand for ChildrenSTEMxTeach for AmericaTechNetTechnology Association of Louisville
KentuckyTechnology Association of OregonThe College BoardUnited Data TechnologiesUtah STEM Action CenterUtah Tech CouncilWashington STEMWest Virginia University Center for
Excellence in STEM Education
Pantone 285c
Pantone 1655c
Thank You for Helping to Build a Movement
The Code.org Advocacy Coalition, Computer Science Teachers Association, and the Expanding Computing Education Pathways Alliance wish to thank the hundreds of thousands of teachers, community members, researchers, local champions and stakeholders, nonprofits, universities, corporations, and government institutions who have supported the movement to expand access to K–12 computer science. This movement draws its strength from a broad base of support, and is grateful to each and every individual and organization who has contributed to the vision that every student in every school deserves the opportunity to learn computer science.

2 Table of Contents
Executive Summary . . . . . . . . . . . . . . . . . . . . . . . . . . . 3
Introduction . . . . . . . . . . . . . . . . . . . . . . . . . . . . . . . . . . 7
Nine Policies to Make Computer Science Fundamental . . . . . . . . . . . . . . . . . . . . . . . . 9
Equity and Diversity . . . . . . . . . . . . . . . . . . . . . . . . . 10
Clarity . . . . . . . . . . . . . . . . . . . . . . . . . . . . . . . . . . . . . . 10
Capacity . . . . . . . . . . . . . . . . . . . . . . . . . . . . . . . . . . . . 11
Leadership . . . . . . . . . . . . . . . . . . . . . . . . . . . . . . . . . .12
Sustainability . . . . . . . . . . . . . . . . . . . . . . . . . . . . . . . .12
The Relationship Between Policy and Gender and Racial Diversity . . . . . . . . . . . . . . . . . . . .15
Methodology . . . . . . . . . . . . . . . . . . . . . . . . . . . . . . . 16
National and State Trends . . . . . . . . . . . . . . . . . . . 18
Relationship Between Policy and Student Representation . . . . . . . . . . . . . . . . . . . . . .21
Conclusion and Recommendations. . . . . . . . . . . 23
Policy Trends and National Momentum . . . . . . . . 25
Policy Trends . . . . . . . . . . . . . . . . . . . . . . . . . . . . . . . 26
National Momentum . . . . . . . . . . . . . . . . . . . . . . . . 34
The State of Computer Science Policy . . . . . . . . 37
State Plan for K–12 Computer Science Education . . . . . . . . . . . . . . . . . . . . . . . . . . 38
K–12 Computer Science Standards . . . . . . . . . . .40
State-Level Funding for K–12 Computer Science Professional Learning . . . . . . . . . . . . . . . 42
State Computer Science Teacher Certification . . . . . . . . . . . . . . . . . . . . . . . .44
State-Approved Preservice Teacher Preparation at Institutions of Higher Education . . . . . . . . . . . . . . . . . . . . . . . . .46
State-Level Computer Science Supervisor . . . . 48
A Requirement for All High Schools to Offer Computer Science . . . . . . . . . . . . . . . . . .50
Computer Science Can Satisfy a Core High School Graduation Requirement . . . . . . . . 52
Computer Science Can Satisfy a Core Admission Requirement at Institutions of Higher Education . . . . . . . . . . . . . . . . . . . . . . . . . 54
State Summaries . . . . . . . . . . . . . . . . . . . . . . . . . . . . . 57
Data Sources . . . . . . . . . . . . . . . . . . . . . . . . . . . . . . . 57
Active CSTA Chapters by State . . . . . . . . . . . . . . 58
K–12 Computer Science Access Report . . . . . . . . 85
Data Sources . . . . . . . . . . . . . . . . . . . . . . . . . . . . . . . 87
Defining a Computer Science Course . . . . . . . . 87
Changes for this Year’s Report . . . . . . . . . . . . . . . 88
Inferring Between Years . . . . . . . . . . . . . . . . . . . . . 89
State-by-State Data . . . . . . . . . . . . . . . . . . . . . . . . . 89
Community, Race/Ethnicity, and Socioeconomic Status and Access to Computer Science . . . . . . . . . . . . . . . . . . . . . . . . . . 92
Policies and Access to Computer Science . . . . 93
Policy and Implementation . . . . . . . . . . . . . . . . . . 96
Table of Contents

Executive Summary 3
Executive SummaryThe internet, smartphones, social media, apps, and online shopping are just a few of the modern innovations that have been developed through computer science. As our dependence on technology shapes our lives daily, it should come as no surprise that computing jobs are the number one source of new wages in the U.S.1 and that 9 out of 10 parents want their children to learn computer science.2 1 Code.org. (2016). Computing occupations are now the #1 source of new wages. Retrieved from bit.ly/numberonenewwages2 Google Inc. & Gallup Inc. (2016). Trends in the state of computer science in U.S. K–12 schools. Retrieved from goo.gl/j291E0

Executive Summary4
Nine Policies to Make Computer Science Fundamental
Only 45% of our nation’s high schools teach
computer science and courses still lack girls and
underrepresented minority students. Furthermore,
students receiving free and reduced lunch and
students from rural areas are less likely to attend a
school that provides opportunities to learn this
critical subject.
State education leaders have been working to
make computer science a fundamental part of
K–12 education for all students by adopting nine
specific policy ideas. Since the 2018 State of
Computer Science Education3 report was published,
33 states passed 57 new laws and regulations
promoting computer science. States that adopt more
of the policies promoted by the Code.org Advocacy
Coalition have higher rates of teaching computer
science; policy adoption leads to more opportunities.
Percent of High Schools Teaching Computer Science
Across 39 states, 45% of high schools teach
computer science.
Yes
No
Only
45% of high schools teach
computer science.
3 2018 State of Computer Science Education (2018) Retrieved from code.org/files/2018_state_of_cs.pdf. For 2017, see State of the States Landscape Report (2017). Retrieved from code.org/files/State_of_the_states.pdf
Policy Principles
Clarity
Capacity
Leadership
Sustainability
Equity and Diversity*
*Equity and Diversity is incorporated in each of the nine policies.
Create a state plan for K–12 computer science
1
Implement clear certification pathways for computer science teachers
4
Require that all secondary schools offer computer
science with appropriate implementation timelines
7
Define computer science and establish rigorous
K–12 computer science standards
2
Create programs at institutions of higher
education to offer computer science to preservice teachers
5
Allow computer science to satisfy a core graduation
requirement
8
Allocate funding for rigorous computer science
teacher professional learning and
course support
3
Establish dedicated computer science positions
in State and Local Education Agencies
6
Allow computer science to satisfy an admission
requirement at institutions of higher education
9

Executive Summary 5
When the Code.org Advocacy Coalition began its
work in 2013, just 14 states plus D.C. had at least one
of these nine policies in place; last year there were
44 states. All 50 states have now adopted—or are in
the process of adopting—one or more of the nine
policies. The 2019 State of Computer Science
Education report describes these policy trends,
summarizes the progress of each state in meeting
the nine policies, provides data on computer
science implementation rates, and includes a special
focus on the relationship between policy and the
participation rates of girls and underrepresented
minority students.
At the heart of the national movement is the goal
of increasing the participation of historically
underrepresented groups. The principle of equity
and diversity is an integral part of each of these nine
policies; for example, some states prioritize funding
for districts who make focused efforts to engage
underrepresented groups, and other states call for
annual report of student demographics in computer
science courses that schools are required to offer.
An analysis shows that as states adopt these policies,
not only are more computer science courses taught
across those states, there is also an increase in the
representation of female students taking Advanced
Placement® (AP) computer science exams.
Closing the participation gaps in computer science
will take years, but there are clear signs that states
are on the right path. Greater representation is
already seen in states that have adopted policies
that increase access to high school computer
science courses, prepare more teachers to begin
offering courses, and define standards for computer
science. States can do even more by continuing to
adopt policies that specifically focus on equity and
diversity in computer science, such as increasing
learning opportunities in elementary and middle
schools. Research has shown that girls that have
early exposure to computer science show the same
level of interest, motivation, and confidence as boys4
and are more likely to take computer science
courses in high school.5
4 Master, A., Cheryan, S., Moscatelli, A., & Meltzoff, A. N. (2017). Programming experience promotes higher STEM motivation among first-grade girls. Journal of Experimental Child Psychology, 160, 92–106. http://doi.org/10.1016/j.jecp.2017.03.013
5 Google Inc. (2014). Women who choose computer science—What really matters. Retrieved from https://edu.google.com/pdfs/women-who-choose-what-really.pdf
Number and Percent of AP CS Exams Taken By Female Students Nationwide
Number of Policies and Female Students’ AP CS Representation
92 4 6 80%
10%
15%
20%
25%
30%
35%
Per
cen
t o
f A
P C
S E
xam
s
Number of Policies
1 3 5 7
Number of Policies and Female Students’ AP CS RepresentationNumber and Percent of AP CS Exams
Taken By Female Students Nationwide
2014 2015 2016 2017
Year2018
0
5
10
15
20
25
30
35
40
16.7%21.9%
23.2%
26.4%
28.0%
Num
ber
of
Exa
ms
(in
tho
usan
ds)

Executive Summary6
Overall, there continues to be a strong connection
between the adoption of the nine policies and the
percentage of high schools teaching computer
science in a state.
Arkansas, Idaho, Indiana, Maryland, and Nevada
have already adopted all nine policies, and several
additional states are not far behind. These five
states—and others—continue to refine already-
adopted policies, such as expanding how students
can apply computer science course credit towards
high school graduation requirements, recognizing
high-quality teaching with stipends and awards,
and creating new pathways to teacher certification.
Broadening participation in computer science is
the ultimate goal and careful implementation of
each policy is as important as the initial adoption
of the policy. Computer science continues to be a
significant opportunity to address equity, workforce,
and education issues on a bipartisan basis. As we
look forward to 2020, it is imperative to continue the
bipartisan support and momentum we have seen
for a subject that is critical to the success of all of
our students.
Trend in Policy Adoption and Access to Computer Science
States that have adopted more of the
nine policies have a greater percentage of
high schools teaching computer science.
Per
cen
t o
f H
igh
Sch
oo
ls T
each
ing
CS
Number of Policies
2 4 6 8 90%
20%
40%
60%
80%
100%
1 3 5 7
Trend in Policy Adoption and Access to Computer ScienceStates that have adopted more of the nine policies have a greater percentage of high schools teaching computer science.

7Introduction | 7
IntroductionPublished annually in September, this report updates each state’s status toward adopting the nine policies recommended by the Code.org Advocacy Coalition. This year’s report is co-authored by Code.org, the Computer Science Teachers Association (CSTA), and the Expanding Computing Education Pathways (ECEP) Alliance.

Introduction8
The 2019 State of Computer Science Education
report describes the policy trends and national
momentum over the past 12 months and contains:
• an analysis of national and state trends in AP
computer science participation by gender and
race, including the relationship with policies;
• a policy summary for each of the nine policies
displaying a map of the states that have enacted
the policy, including highlighted states and
related resources;
• state-specific summaries including updates on
each state’s progress toward meeting the nine
policies and data on university graduates, school
offerings, and participation; and
• updated data collected for the K–12 Computer
Science Access Report about high schools that
teach computer science from 39 states.

Introduction 9
These nine recommendations are intended build and
sustain a comprehensive state policy framework to
broaden the teaching and learning of computer
Nine Policies to Make Computer Science Fundamental
Policy Principles
Clarity Capacity Leadership Sustainability Equity and Diversity*
*Equity and Diversity is incorporated in each of the nine policies.
science. They support a vision built on five principles:
Equity and Diversity, Clarity, Capacity, Leadership, and Sustainability.
Create a state plan for K–12 computer science
1
Implement clear certification pathways for computer science teachers
4
Require that all secondary schools offer computer
science with appropriate implementation timelines
7
Define computer science and establish rigorous
K–12 computer science standards
2
Create programs at institutions of higher
education to offer computer science to preservice teachers
5
Allow computer science to satisfy a core graduation
requirement
8
Allocate funding for rigorous computer science
teacher professional learning and
course support
3
Establish dedicated computer science positions
in State and Local Education Agencies
6
Allow computer science to satisfy an admission
requirement at institutions of higher education
9

Introduction10
Equity and DiversityAll nine policies should promote access to and
equity within rigorous and engaging computer
science courses.
Prioritizing equity and diversity requires
policymakers to focus attention on underserved
populations and under-resourced schools. Data
clearly shows that underrepresented minority
students and rural students are less likely to have
access to high-quality computer science content.
If unaddressed, we will continue to exclude entire
populations from this fast-growing field and miss
out on the innovations and contributions that
diversity promotes.
ClarityA lack of clarity around what computer science
is and how to achieve goals around expanding
computer science education have hampered
implementation and delayed policy adoption in
states. Clarity of goals, including a state plan and an
agreed-upon definition of computer science and
learning expectations, are critical components of
implementation.
State Plan for K–12 Computer Science Education
In most states, computer science is a new subject.
In order to make computer science a fundamental
part of the education system, states will need to
create roadmaps to address a number of policy and
implementation issues. The plan should articulate
the goals for computer science, strategies for
accomplishing the goals, and timelines for carrying
out the strategies. Equitable access to K–12 computer
science must be at the foundation of a state’s plan.
K–12 Computer Science Standards
High-quality standards create foundational
expectations for all students, rather than just those
interested in advanced study, and prepare students
for success in a variety of postsecondary, college,
and career options. States should develop discrete
standards for computer science education guided by
the concepts, practices, and recommendations in the
K–12 Computer Science Framework. The CSTA K–12
Computer Science Standards are an example of
standards that have been informed by the K–12
Computer Science Framework.

Introduction 11
CapacitySchools’ capacity for offering computer science
courses is directly related to the availability of
teachers prepared to teach the subject. Capacity
for offering computer science in schools often
constitutes having an adequate number of teachers
prepared to teach computer science. Building
capacity to offer computer science requires
state funding, clear certification pathways, and
preservice teacher preparation at institutions of
higher education.
State-Level Funding for K–12 Computer Science Professional Learning
There is not enough school district funding for
professional learning for teachers. States should
provide resources to prepare inservice teachers
from diverse backgrounds to teach K–12 computer
science. Funding priority should be given to
districts that demonstrate an effort to engage
underrepresented groups. This will increase school
capacity to offer computer science by preparing
inservice teachers to begin teaching the subject.
State Computer Science Teacher Certification
The expansion of K–12 computer science
education offerings is hampered by the lack of
certified computer science teachers, which
disproportionately affects underrepresented
minority students. Creating clear, navigable, and
rewarding professional learning paths tied to
computer science content knowledge can help to
increase the number of computer science teachers
and increase equitable access to the subject.
Teacher Leadership in Advocacy Efforts
Over the past two years, the New Jersey CSTA chapters (CSTANJ.org), with support from Code.org and state
universities, successfully advocated for computer science policy that has helped the state make huge leaps
forward. During the 2018–2019 legislative session, two computer science bills that CSTANJ helped draft were
signed into law: one requiring computer science to be taught in all high schools, and another creating a computer
science teaching endorsement. Governor Murphy announced the state’s CSforAll initiative which has included
$2 million for computer science education in each of the last two budgets and the creation of a Computer Science
Advisory Board which is tasked with developing a State K–12 Computer Science Action Plan. The NJ Department
of Education formed a committee to revise the current computer science standards. Additionally, a fourth CSTA
chapter will soon join CSTANJ in supporting teachers across the state as they implement CSforAll.
These accomplishments were only possible because of the foundation laid by CSTANJ members over the
past few years. The computer science advocacy movement in NJ began in 2012–2013 when the first two CSTA
chapters were formed. From these chapters, we formed a CSTANJ steering committee which created a common
vision that all students in NJ should have the opportunity to study computer science. We also developed four
lofty goals to help achieve that vision. We communicated that vision with the CSTANJ members and any other
stakeholders who would listen, including legislators, the NJ Department of Education, and Governor Murphy’s
team. It is hard for us to believe, but seven years later, the state has not just met, but exceeded the lofty goals
established by CSTANJ members.
— Daryl Detrick
CSTANJ Advocacy Representative

Introduction12
State-Approved Preservice Teacher Preparation at Institutions of Higher Education
The computer science teacher shortage should be
addressed by exposing more preservice teachers to
computer science during their required coursework
and by creating specific pathways for computer
science teachers. Preservice mathematics, science,
or broader technology teachers could become
computer science teachers in many states if they
were exposed to relatively minimal computer science
coursework within teacher preparation programs.
To address equity, states should fund partnership
opportunities between local school districts and
schools of education to create direct pathways for
teachers into high-need school districts.
LeadershipImplementation of policy reforms is bolstered by
leadership at the state level to oversee
statewide initiatives.
State-Level Computer Science Supervisor
In order to ensure rapid scaling of quality
computer science, states must support and share
best practices with school districts. Creating a
statewide computer science leadership position
within the state education agency signals to schools
that computer science is an important core offering
needed at all levels of education. This position would
implement and monitor the process of increasing
the diversity of students taking computer science
through equitable access.
SustainabilityMaking computer science a fundamental part of
the K–12 education system requires sustainability
of computer science initiatives. Key policies that
promote and maintain momentum for computer
science include requirements to offer computer
science and allowing computer science to satisfy
high school graduation and higher education
admissions requirements.
A Requirement for All High Schools to Offer Computer Science
Most high schools do not offer computer science
courses because states or local school districts have
not prioritized this discipline. Underrepresented
minority students are less likely to attend a school
that offers computer science. Given the important
role computer science plays in our economy and the
world around us, ensuring that all students have
access to computer science in K–12 is critical. This
should start early by embedding computer science
in the K–5 curriculum, which could inspire students
to elect to take computer science courses in middle
and high school. At the high school level, states
should adopt policies that require schools to offer at
least one computer science course that is based on
rigorous standards and accessible to all students.
Computer Science Can Satisfy a Core High School Graduation Requirement
Currently, the majority of states have clear, publicly
accessible policies allowing rigorous computer
science courses to satisfy existing core high school
graduation requirements. But a few states still do
not include computer science as a core course for
graduation. Computer science should be recognized
as a distinct computer science credit that can
satisfy a graduation requirement in a core subject
such as mathematics or science or, increasingly, in
computer science. States that count computer
science towards a core graduation requirement
see 19% more enrollment in their AP Computer

Introduction 13
Science courses6 and increased participation from
underrepresented minority students.7
Computer Science Can Satisfy a Core Admission Requirement at Institutions of Higher Education
Admission policies for most colleges and universities
do not allow rigorous computer science courses to
meet the mathematics or science entrance require-
ments, which discourages students from taking such
courses in secondary education—even if they count
towards a high school graduation requirement.
Aligning these policies would incentivize students to
explore computer science earlier, which is an
important step to increasing diversity in the field.
Based on five key principles, these nine policy
ideas are intended as a menu of choices for states to
ensure that computer science is a central part of
K–12 education. Not all states will be in a position to
adopt every policy and many will require years of
careful implementation. States should consider local
context, including relevant k-12 data when deciding
which policies to pursue and adopt. Some of these
policy ideas may require resources such as funding
or time. States should adopt the policies for which
they are best positioned and work to ensure that
computer science is at the core of their education
systems. Read more about these policies at
bit.ly/makecsfundamental.
6 https://medium.com/@codeorg/does-making-cs-count-make-a-difference-7ab5ca6b84077 http://blog.code.org/post/121123281798/md

Introduction14
Community Agreement on the Nine Policy Ideas
In spring 2019, SageFox Consulting (project evaluators) surveyed members of the Expanding Computing
Education Pathways (ECEP) Alliance. State leaders were invited to reflect on the nine policy areas in an effort to
understand the accuracy and value of the definitions to individual states and the ECEP Alliance as a whole.
Overall, the 21 state teams that responded found the definitions to be accurate.
“The rubrics for the nine policy ideas have been very helpful because they force us to really think about and discuss what we’ve done (or not done) and not just check boxes!” — Rosabel Deloge
New Hampshire ECEP Team
The agreement on policy areas may be a reflection of
the national movement and investment in computer
science education over the last decade. For example,
the K–12 Computer Science Framework was developed
collaboratively by stakeholders from states, districts,
and the computer science education community and
quickly gained political support across the nation.
Many states adopted (or adapted) standards based on
the framework, such as the CSTA Standards, and
now 34 states have K–12 computer science standards,
up from 6 in 2017.
Establishing policies is an important step in making
computer science education fundamental to the K–12 education system. Policies must be designed and
implemented with broadening participation in computing and equity at the forefront. ECEP works with state
teams to use a five-stage model of change to help design and implement policy. Teams find leaders to champion
the effort; understand the current landscape including the gaps and opportunities; organize stakeholders
(ecepalliance.org/resources/stakeholders-involved-bpc) including those from other national organizations such
as Code.org, CSTA, and the CSforALL Consortium; seek sustainable funding; and create state-level infrastructure
with data to monitor change and ensure equitable implementation.
“I’ve always been reluctant to be involved in governmental policy work. The complexities of it seemed rather daunting. The ECEP team and their resources have made this more understandable, and this year I made a statement at a bill hearing in my state for the first time. Baby steps, but it’s at least something!” — Lauren Bricker
Washington ECEP Team
Find your leader(s) &
change agents
Understand the CS education landscape &
identify the key issues/policies
Gather & organize your
allies to establish goals & develop strategic plan
Get initial funding to support change
Build/ utilize data
infrastructure to provide
evidence to inform strategic
BPC efforts BPC
Broadening Participation in Computing (BPC)
Model of Change

15Introduction | 15
The Relationship Between Policy and Gender and Racial DiversityThe principle of equity and diversity is at the core of the nine policy ideas promoted by the Code.org Advocacy Coalition and states continue to find ways to weave these principles into their policies.

The Relationship Between Policy and Gender and Racial Diversity16
In the past year, several states have adopted policies that include a specific focus on equity. For example:
• Several states’ standards include equity-related concepts from the K–12 Computer Science Framework
and some states, like California, include equity guidance in the introduction to their standards.
• Arizona funds professional learning that prioritizes rural schools and schools with a majority of the
student population eligible for free and reduced-price lunches. Grant applicants in Missouri must
address how they will include and support students from historically underrepresented groups.
• Georgia requires all high schools to offer computer science and requires annual reporting on the
number and demographics of students in computer science courses. Several states require all
elementary, middle, and high schools to teach computer science, ensuring that all students have the
opportunity to learn the subject—subsequently reducing the effect of negative stereotypes students
develop about “who” belongs in computer science.8
This section reports on the participation of female
and underrepresented minority (URM) students in
Advanced Placement computer science (AP CS)
over the past five years, nationally and by state. To
explore the relationship between policy adoption
and participation rates, we examine the nine policies
together and we dive into three of the nine policies
in greater detail: K–12 standards, funding profes-
sional learning, and requiring all high schools to
teach computer science.
MethodologyThis section analyzes the College Board’s AP computer science exam data over the last five years, up to
2018—the most recent year available. The exam numbers reported include both AP Computer Science
A (2014 to 2018) and AP Computer Science Principles (2017 and 2018). Race/ethnicity categories from
the College Board that we define as URM are Hispanic or Latino, American Indian or Alaska Native, Black
or African American, and Native Hawaiian or Other Pacific Islander (the College Board updated these
categories in 2016; for 2014 and 2015 data, Native Hawaiian or Other Pacific Islander demographic
information is not available).
Because each state defines computer science differently, and many do not track demographic and
enrollment data, AP exam data provides the most consistent measurement across states and allows for an
accurate comparison over time. The long-term goal of the K–12 Computer Science Access Report is to
collect demographic data from all computer science courses across every state (see this year’s data in the
K–12 Computer Science Access Report section of this report). To achieve this goal, it is important that states
build internal capacity to track and disseminate data, specifically on course demographics and enrollment.
States that adopt more policies around computer science education see better representation of female students in AP computer science, yet there is more work to do to achieve parity.
8 Master, A., & Meltzoff, A. N. (2017). Building bridges between psychological science and education: Cultural stereotypes, STEM, and equity. Prospects-UNESCO, 46, 215-234.

The Relationship Between Policy and Gender and Racial Diversity 17
It is important to note that it takes many years
for policies to influence participation rates in
classrooms. Many policies changes around
computer science education have taken place in
the past three or four years, with full implementation
of some policies still a few years away. Individual
state participation data from the spring 2019 AP
computer science exams will be available late fall
2019. This additional year of data will help to further
examine the relationship between policy adoption
and student participation rates.
Relationships and trends reported in this section are
statistically significant correlations; none of the
analyses attempt to infer causation.
See bit.ly/stateofcsapdata for all of the data used in
this section.
Texas Data
Reporting and reviewing participation among
underrepresented groups is key to improving
diversity in computer science courses. According
to the Texas Advanced Computing Center at
The University of Texas at Austin:
• 57,826 students enrolled in high school
computer science courses in the 2017–2018
school year, an 11% increase compared to the
prior year.
• The following demographic groups increased
participation in the 2017–2018 school year:
– Economically disadvantaged students (+12%)
– Female students (+9%)
– Underrepresented minority students (+13%)
• Additionally, the number of certified computer
science teachers increased 300% since the
2014–2015 school year.
The Relationship Between Policy and Gender and Racial Diversity18
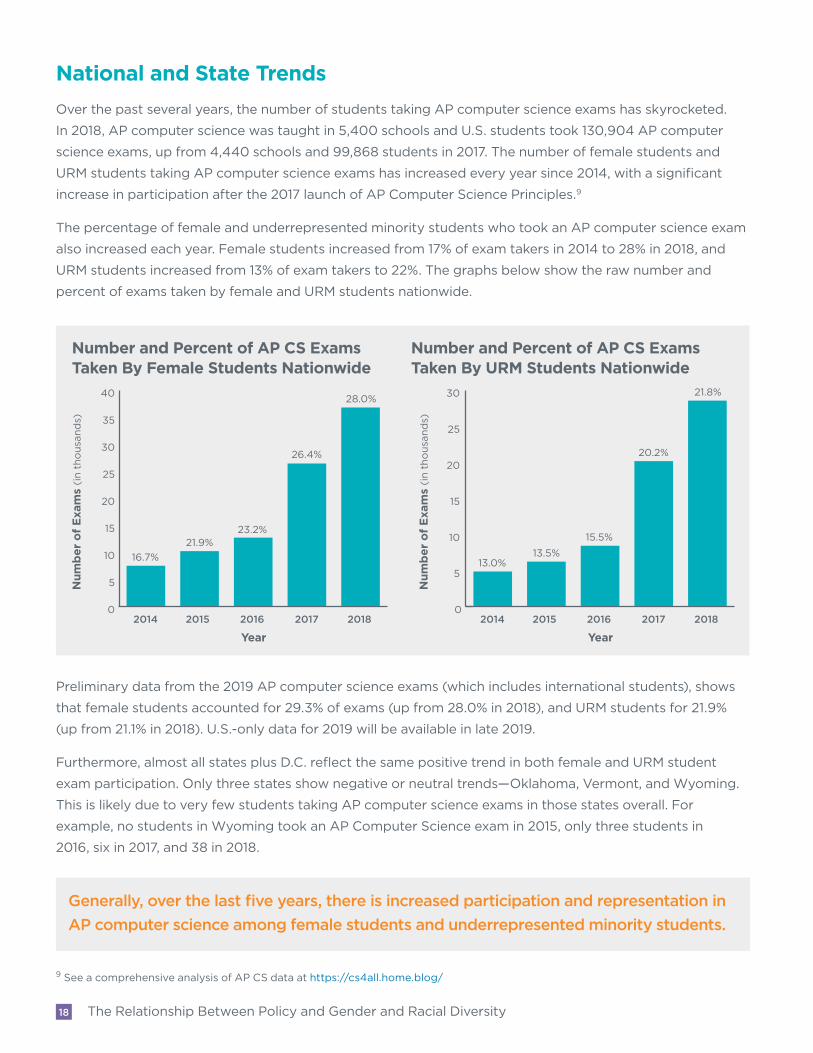
National and State TrendsOver the past several years, the number of students taking AP computer science exams has skyrocketed.
In 2018, AP computer science was taught in 5,400 schools and U.S. students took 130,904 AP computer
science exams, up from 4,440 schools and 99,868 students in 2017. The number of female students and
URM students taking AP computer science exams has increased every year since 2014, with a significant
increase in participation after the 2017 launch of AP Computer Science Principles.9
The percentage of female and underrepresented minority students who took an AP computer science exam
also increased each year. Female students increased from 17% of exam takers in 2014 to 28% in 2018, and
URM students increased from 13% of exam takers to 22%. The graphs below show the raw number and
percent of exams taken by female and URM students nationwide.
Preliminary data from the 2019 AP computer science exams (which includes international students), shows
that female students accounted for 29.3% of exams (up from 28.0% in 2018), and URM students for 21.9%
(up from 21.1% in 2018). U.S.-only data for 2019 will be available in late 2019.
Furthermore, almost all states plus D.C. reflect the same positive trend in both female and URM student
exam participation. Only three states show negative or neutral trends—Oklahoma, Vermont, and Wyoming.
This is likely due to very few students taking AP computer science exams in those states overall. For
example, no students in Wyoming took an AP Computer Science exam in 2015, only three students in
2016, six in 2017, and 38 in 2018.
9 See a comprehensive analysis of AP CS data at https://cs4all.home.blog/
Generally, over the last five years, there is increased participation and representation in AP computer science among female students and underrepresented minority students.
Number and Percent of AP CS Exams Taken By Female Students Nationwide
Number and Percent of AP CS Exams Taken By URM Students Nationwide
Number and Percent of AP CS Exams Taken By Female Students Nationwide
2014 2015 2016 2017
Year2018
0
5
10
15
20
25
30
35
40
16.7%21.9%
23.2%
26.4%
28.0%
Num
ber
of
Exa
ms
(in
tho
usan
ds)
Number and Percent of AP CS Exams Taken By URM Students Nationwide
2014 2015 2016 2017
Num
ber
of
Exa
ms
(in
tho
usan
ds)
Year2018
0
5
10
15
20
25
30
13.0%13.5%
15.5%
20.2%
21.8%

The Relationship Between Policy and Gender and Racial Diversity 19
AP CS Exams Taken by Female Students By State
2014 2018 *No AP CS exams were taken in Wyoming in 2014.
0%
5%
10%
15%
20%
25%
30%
35%
KSINILIDIAHIGAFLDEDCCTCOCAAZARALAK
Perc
ent
of A
P C
S E
xam
s
State
AP CS Exams Taken by Female Students By State
0%
5%
10%
15%
20%
25%
30%
35%
NVNMNJNHNENDNCMTMSMOMNMIMEMDMALAKY
Perc
ent
of A
P C
S E
xam
s
State
AP CS Exams Taken by Female Students By State
0%
5%
10%
15%
20%
25%
30%
35%
WY*WVWIWAVTVAUTTXTNSDSCRIPAOROKOHNY
Perc
ent
of A
P C
S E
xam
s
State
AP CS Exams Taken by Female Students By State

The Relationship Between Policy and Gender and Racial Diversity20
AP CS Exams Taken by URM Students By State
2014 2018 *No AP CS exams were taken in Wyoming in 2014.
0%
10%
20%
30%
40%
50%
60%
KSINILIDIAHIGAFLDEDCCTCOCAAZARALAK
Perc
ent
of A
P C
S E
xam
s
State
AP CS Exams Taken by URM Students By State
0%
10%
20%
30%
40%
50%
60%
NVNMNJNHNENDNCMTMSMOMNMIMEMDMALAKY
Perc
ent
of A
P C
S E
xam
s
State
AP CS Exams Taken by URM Students By State
0%
10%
20%
30%
40%
50%
60%
WY*WVWIWAVTVAUTTXTNSDSCRIPAOROKOHNY
Perc
ent
of A
P C
S E
xam
s
State
AP CS Exams Taken by URM Students By State

The Relationship Between Policy and Gender and Racial Diversity 21
Relationship Between Policy and Student Representation
Number of Policies and URM Students’ AP CS Representation
2018
Number of Policies and Female Students’ AP CS Representation
92 4 6 80%
10%
15%
20%
25%
30%
35%
Per
cen
t o
f A
P C
S E
xam
s
Number of Policies
1 3 5 7
Number of Policies and Female Students’ AP CS Representation
The nine policies promoted by the Code.org
Advocacy Coalition were designed to complement
one another and work together to change the
education system to increase and broaden
participation in computer science. The complexity
of the K–12 education system and state policy in
general means that it is impossible to isolate the
effect of a single policy. However, when taken
together, the nine policies correlate with a higher
number and a greater percentage of female
students taking AP computer science. Results
from a multiple linear regression showed a
significant positive relationship between the
number of policies per state and the percentage of
exams taken by female students (p < 0.01, r2 = 0.134).
The percentage of exams taken by URM students
was compared to the percentage of URM students
in each corresponding state’s school population.
The number of policies a state has adopted shows
no correlation, positive or negative, with the
representation of URM students taking AP computer
science exams relative to the state demographics.
Per
cen
t R
epre
sen
tati
on
Number of Policies
1 6 8 90%
20%
40%
60%
80%
100%
2 3 5 74
Number of Policies and URM Students’ AP CS Representation

The Relationship Between Policy and Gender and Racial Diversity22
Not all policies are expected to have the same effect on student participation in computer science. The
Code.org Advocacy Coalition has prioritized three policies: K–12 computer science standards, funding for
professional learning, and requiring all high schools to teach computer science. The 12 states that have
adopted all three of these policies are highlighted in the graphs below.
Female Student Participation in AP CS in States With Standards, Funding, and All HS Teach
2014 2015 2016 2017 2018
URM Student Participation in AP CS in States With Standards, Funding, and All HS Teach
2014 2015 2016 2017 2018
0%
5%
10%
15%
20%
25%
30%
35%
WAVASCNVNJMDINIDHIFLARAL
Perc
ent
of A
P C
S E
xam
s
State
Percent of High Schools Teaching Computer Science by Community Type
0%
10%
20%
30%
40%
50%
WAVASCNVNJMDINIDHIFLARAL
Perc
ent
of A
P C
S E
xam
s
State
URM Student Participation in AP CS in States With Standards, Funding, and All HS Teach

The Relationship Between Policy and Gender and Racial Diversity 23
AP CS Participation in Arkansas Before and After Policy Adoption
In one state, it is possible to compare the participation of students in AP computer science before and
after all three policies were in place. Arkansas adopted standards, provided funding, and required all high schools
to offer computer science prior to
the 2016–2017 school year.
The graphs compare the
representation of female students
and URM students two years
prior to the enactment of the
policies in 2016 to subsequent
years (although the other two
policies were in place summer
2015, Arkansas did not adopt
K–12 standards until 2016).
Overall, in addition to increased
numbers of students taking
AP computer science, the
representation of female and
URM students also increased.
Conclusion and Recommendations
The growth of female and URM student participation and representation in AP computer science is
promising. The policies advanced by state policymakers and advocates over the past few years are
correlated with greater participation and better representation by female students. Yet even the states that
have made the greatest strides are a long way from gender or racial parity. Advocates for computer science
education must ensure that policy initiatives are centered on principles of equity and diversity and states
must revisit policies often to ensure that they lead to equitable and diverse outcomes.
In order to increase diversity in computer science, every policy initiative should consider the implications for female and underrepresented minority students.
Female Student Participation in AP CS
URM Student Participation in AP CSFemale Student Participation in AP CS
Perc
ent
Year
0%
5%
10%
15%
20%
25%
30%
35%
2015 2016 2017 2018
URM Student Participation in AP CS
Perc
ent
Year
0%
5%
10%
15%
20%
25%
30%
35%
2015 2016 2017 2018
The Relationship Between Policy and Gender and Racial Diversity24
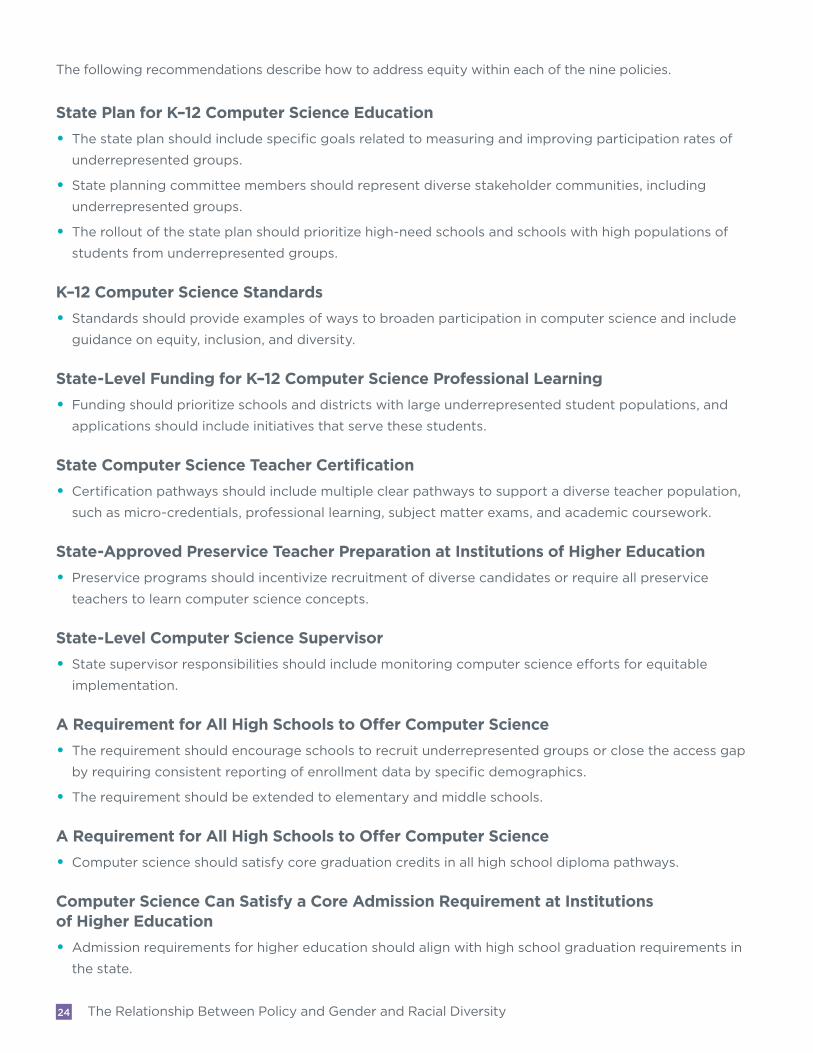
The following recommendations describe how to address equity within each of the nine policies.
State Plan for K–12 Computer Science Education
• The state plan should include specific goals related to measuring and improving participation rates of
underrepresented groups.
• State planning committee members should represent diverse stakeholder communities, including
underrepresented groups.
• The rollout of the state plan should prioritize high-need schools and schools with high populations of
students from underrepresented groups.
K–12 Computer Science Standards
• Standards should provide examples of ways to broaden participation in computer science and include
guidance on equity, inclusion, and diversity.
State-Level Funding for K–12 Computer Science Professional Learning
• Funding should prioritize schools and districts with large underrepresented student populations, and
applications should include initiatives that serve these students.
State Computer Science Teacher Certification
• Certification pathways should include multiple clear pathways to support a diverse teacher population,
such as micro-credentials, professional learning, subject matter exams, and academic coursework.
State-Approved Preservice Teacher Preparation at Institutions of Higher Education
• Preservice programs should incentivize recruitment of diverse candidates or require all preservice
teachers to learn computer science concepts.
State-Level Computer Science Supervisor
• State supervisor responsibilities should include monitoring computer science efforts for equitable
implementation.
A Requirement for All High Schools to Offer Computer Science
• The requirement should encourage schools to recruit underrepresented groups or close the access gap
by requiring consistent reporting of enrollment data by specific demographics.
• The requirement should be extended to elementary and middle schools.
A Requirement for All High Schools to Offer Computer Science
• Computer science should satisfy core graduation credits in all high school diploma pathways.
Computer Science Can Satisfy a Core Admission Requirement at Institutions of Higher Education
• Admission requirements for higher education should align with high school graduation requirements in
the state.

25Policy Trends and National Momentum | 25
Policy Trends and National MomentumSince the 2018 State of Computer Science Education report, 33 states have adopted a total of 57 policies to support computer science education. This chapter discusses trends related to the nine state policies and describes momentum by state governors and the federal government. For more information about state legislation to promote computer science, refer to bit.ly/modelcslegislation.

Policy Trends and National Momentum26
Policy Trends
Sweeping Changes Through Action on Multiple Policies
Fourteen states have enacted two or more policies
since September 2018, including Alabama,
Connecticut, Indiana, and Missouri.
• Alabama. HB 216 (2019) set a timeline by
which every middle and high school would be
required to offer at least one computer science
course and elementary schools would offer
instruction in the basics of computer science and
computational thinking. The bill also established
a task force to develop a state plan, called for
the development of certification pathways for
teachers, and explicitly aligned high school
graduation and higher education admission
requirements.
• Connecticut. SB 957 (2019) added computer
science to the program of instruction in public
schools (expanding upon the previous inclusion
of computer programming), required all teacher
The Connecticut ECEP Team
Building on years of coordinated efforts, 2019
brought a wave of policy movement for the state
of Connecticut. The Department of Education
solicited stakeholder involvement to develop a
shared definition of computer science to drive
future state conversations. A subsequent state
landscape report highlighted the gaps and
opportunities in K–12 computer science, and the
CT CSTA chapter hosted a statewide computer
science summit partially funded by an ECEP
grant. These efforts were led by a core team of
dedicated volunteers who, equipped with data
from the landscape report, met with local and
state government representatives and testified in
support of SB 957, moving computer science
forward in the state.
— Laura Stefon
Chief of Staff and Legislative Liaison
Connecticut State Department of Education
preparation programs to include instruction in
computer science, called for the development of
an alternate route to certification for computer
science teachers, and required the development
of a computer science endorsement.
In the last 12 months, 33 states have adopted a total of 57 policies to support computer science education.

Policy Trends and National Momentum 27
• Indiana. A concerted effort by state leaders led
to the development of a state plan, changes in
certification, the alignment of existing K–8
computer science standards to high school
standards to create a comprehensive K–12
progression, and an appropriation of $3 million
per year for FY 2020 and FY 2021.
CSforIN
Indiana’s momentum can be attributed to the
hard work of a broad team, including leaders
from the Indiana Department of Education,
Indiana University Bloomington, Purdue
University, Nextech, Project Lead the Way,
Indiana’s CSTA chapter, and the Code.org
Advocacy Coalition. This large team collaborated
together under the CSforIN movement with
Governor Holcomb’s office and key industry
partners (e.g., Salesforce, Infosys) to strategically
implement K–12 computer science education
throughout the state of Indiana. Early initiatives
of CSforIN have included 1) development of the
IN computer science education landscape report,
2) organizing multiple summits of stakeholders,
3) holding a series of strategic meetings to launch
and support CSforIN, 4) hiring a program
manager for CSforIN to manage a website and
communications, and 5) identifying areas in
which to focus broadening participation efforts.
— Anne Leftwich and Maureen Biggers
ECEP State Leaders
Indiana University Bloomington
• Missouri. As part of a special legislative session
called by the governor, Missouri passed HB 3 in
October 2018 calling for the development of K–12
standards and a computer science teacher
endorsement. The bill also allowed for computer
science to count towards a mathematics, sci-
ence, or practical arts graduation requirement
and created a Computer Science Education Fund
for the purpose of professional development. In
2019, HB 2 allocated $450,000 to the fund.
State Plans Developed by a Variety of Stakeholders
Since the last report, the number of states with
statewide plans has increased from 6 to 13.
Whether led by the state education agency such as
in Georgia, a state education center such as the
Idaho STEM Action Center, or a governor-appointed
task force such as in Alabama (currently under
development), these state plans involve multiple
stakeholders and typically address the areas
described in the State Planning Toolkit: diversity,
professional learning, certification, standards,
outreach, and funding. The toolkit includes
resources, considerations and recommendations,
and a table for listing goals and strategies.
Learn more about the State Planning Toolkit at
bit.ly/statetoolkit.

Policy Trends and National Momentum28
Developing K–12 Computer Science Standards Informed by Nationally Recognized Resources
Since the last report, the number of states that have
K–12 computer science standards has increased
from 22 to 34, with an additional 5 states actively
developing standards. Like last year, standards
development continues to see the largest growth
of the nine policies.
Most states have developed their own state-specific
K–12 computer science standards informed by
the K–12 Computer Science Framework and the CSTA
K–12 Standards. State-specific adaptations include
emphasizing aspects of the standards to reflect
the local economic priorities or implementation
scenarios. Joining Maryland and Virginia’s emphases
on cybersecurity, North Dakota adopted the nation’s
first Computer Science and Cybersecurity Standards,
embedding cybersecurity knowledge and skills
across all grades and strands in the standards.
Of the 12 states that have adopted standards since
the last report, the majority use a mix of grade-level
standards and grade bands, such as K, 1, 2, 3, 4, 5
at the elementary school level and grade bands at
the middle and high school levels. A few states,
primarily those that adopted the grade-banded
CSTA K–12 Standards, use grade bands such as
K–2, 3–5, 6–8, and 9–12.
Equitably Funding K–12 Computer Science Professional Learning
Since the last report, the number of states funding
K–12 computer science professional learning has
increased from 19 to 26.
Between fiscal years 2016 to 2021, states have
allocated a total of over $123M towards computer
science professional development. One trend for FY
2020, as demonstrated by Florida’s investment of
$10M and Mississippi’s investment of $300K, is an
emphasis on funding professional development not
only to build teachers’ capacity to teach courses,
but also for the purpose of earning a formal com-
puter science teacher certification.
Rather than a one-time investment, most states
fund computer science over multiple years. For
example, Pennsylvania recently followed up their
initial investment in PAsmart with an expansion of
the program in FY 2020. Alabama, Indiana, and
Utah have significantly increased their funding from
FY 2019 to FY 2020.

Policy Trends and National Momentum 29
As in previous years, states continue to prioritize
the equitable distribution of funding. For example,
Arizona amended their computer science
professional development program to prioritize
rural schools and schools with at least 60% of the
students eligible for free and reduced-price lunches.
Entities interested in receiving a grant from
Missouri’s Computer Science Education fund
must address how they will “reach and support
historically underrepresented students in computer
science” (HB 3, special session 2018).
States are also using funding to incentivize and
reward teachers. A portion of Florida’s state funding
will be used to provide annual bonuses for teachers
certified in computer science. In Alabama, computer
science may be added to the list of eligible areas
identified in the state’s Math and Science Teacher
Education Loan Repayment Program, subject to
appropriations from the legislature. Arkansas gives
stipends to teachers who add the computer science
endorsement onto their license, enroll at least ten
students in a computer science course (for high
school teachers), and/or attend professional
development and become a K–8 Computer Science
Lead Teacher at their school (for K–8 teachers). An
enrollment contest in the 2018–2019 school year
provided monetary awards and recognition to
Arkansas schools with the largest computer science
course enrollment. The state also announced a new
Computer Science Educator of the Year Award in
2019, recognizing and providing stipends to five
finalists and one awardee.
Increasing the Number of Pathways to Certification
Since the last report, the number of states with a
teacher certification in computer science has
increased from 33 (plus D.C.) to 37 (plus D.C.).
Although this change only reflects four states
that did not previously have a computer science
teacher certification, several states with existing
certifications have made modifications or increased
the number of pathways to certification. Rhode
Island, Arizona, and Virginia have amended state
certification rules to allow micro-credentials
(job-embedded and competency-based
assessments of teachers’ knowledge and skills) to
count towards certification requirements as an

Policy Trends and National Momentum30
10 Title II National Teacher Preparation Data for academic year 2016–2017, retrieved from title2.ed.gov
alternative to subject-matter exams or academic
coursework. Arizona also allows coursework or
training from accredited institutions and other
programs approved by the local education agency
to count towards certification requirements.
These trends are consistent with Code.org’s
recommendations for teacher pathways. Learn
more at bit.ly/csteacherpathway. Learn more
about micro-credentials at advocacy.code.org/
micro-credentials.pdf.
Requiring All Preservice Teachers to Learn Computer Science
Since the last report, the number of states support-
ing preservice teacher preparation in computer
science has increased from 13 to 19.
States can support preservice teacher preparation in
several different ways. Many of the 19 states approve
programs that prepare undergraduates to teach
computer science and list the programs on the state
department website. For example, Pennsylvania
recently published guidelines for the approval of
preservice education programs in computer science.
A few states have taken a different approach,
adding computer science to the knowledge and
skills that all preservice teachers must learn,
regardless of certification or area of concentration:
Nevada requires all teacher candidates in the
Nevada System of Higher Education to receive
appropriate education and training in computer
science, and Connecticut requires all teacher
preparation programs to include instruction in
computer science that is grade-level and subject-
area appropriate. Arkansas added computer science
knowledge and skills to the standards of teaching
for all elementary school teachers, providing further
support for the state’s initiative to integrate
computer science into elementary education.
Preservice computer science education has a
long way to go. In 2017, only 100 computer science
teachers graduated from preservice teacher
preparation programs; by comparison, 10,639
teachers were prepared in mathematics and 11,661
teachers were prepared in science the same year.10

Policy Trends and National Momentum 31
Dedicating Multiple State-Level Computer Science Positions
Since the last report, the number of states with
computer science supervisors has increased from
14 to 21.
The creation of positions dedicated to computer
science continues to reflect states’ commitments
to implementing policy initiatives. For example,
the Oklahoma State Department of Education
previously employed a Mathematics and Computer
Science Coordinator. This position has now been
split into a dedicated Computer Science position
and a Mathematics position which will continue to
support the integration of computer science into
mathematics. In addition, states are now creating
multiple positions focused on different areas of
computer science education. Maryland has
state-level positions that include an Executive
Director and Director of Research at the Maryland
Center for Computing Education, and a Career
Programs Specialist and a K–12 Computer
Science Education Specialist at the Maryland State
Department of Education. The latter position is
responsible for improving coordination across the
institutions working on computer science initiatives.
The number of local or regional positions dedicated
to computer science continues to increase, following
a trend established last year with the development
of local computer science education supervisors
across a state. For example, Arkansas has expanded
the number of computer science specialists at
Education Service Cooperatives.
State computer science supervisors do not yet
have a national association or formal gatherings
like other subject supervisors. However, these
supervisors followed up on their first gathering in
2018 by meeting for a second national workshop
in June 2019.
Requiring All Schools to Teach Computer Science, Including Elementary, Middle, and High Schools
Since the last report, the number of states requiring
all high schools to offer computer science has
increased from 15 to 19.
“Nevada has adopted all nine model state policies for expanding computer science education, which means the real work has just begun. Our state, through government, industry and education partnerships, is positioned to broaden computer science education to all of our communities. Implementation of these policies is the critical component to ensuring that all of our students are college, career, and community ready for this digital age.”
—Jhone Ebert Nevada Superintendent of Public Instruction

Policy Trends and National Momentum32
Following last year’s trend, states continue to require
elementary and middle schools, in addition to all
high schools, to offer computer science. This year,
Connecticut joined New Hampshire and Wyoming
in adding computer science to the state’s list of
subjects required to be taught by all public schools.
Similarly, all schools in Virginia are required to teach
computer science by virtue of the addition of com-
puter science to the state’s Standards of Learning.
This year, more states are taking an incremental
approach to requiring all high schools to offer
computer science. For example, Georgia is phasing
in the requirement over a period of six years with
three benchmarks: at least one high school per
district must teach it in the 2022–2023 school year,
50 percent of high schools in each district in 2023–
2024, and finally all high schools in 2024–2025. All
elementary and middle schools in Georgia must
offer instruction in exploratory computer science
beginning in the 2022–2023 school year.
The target school year for full implementation is
coming up for many states that were early adopters
of this policy. An appropriate timeline, funding, and
coordinated teacher professional learning are all
necessary to support schools and districts as
they implement these requirements. District
planning workshops, such as the CSforALL SCRIPT
workshops (csforall.org/script), have been held
across the nation to support school districts in
visioning, self-assessment, and goal-setting to
implement K–12 computer science. Data on the
percentage of high schools teaching computer
science in each state can be found in the K–12
Computer Science Access section of this report.

Policy Trends and National Momentum 33
Expanding How Computer Science Can Satisfy Existing Graduation Requirements and Implementing Graduation Requirements in Computer Science
Since the last report, the number of states
allowing computer science to satisfy a core high
school graduation requirement has increased from
38 (plus D.C.) to 47 (plus D.C.).
In addition to new states adopting this policy,
many states with existing policies have reduced
restrictions. For example, Washington passed
legislation in 2018 (SB 6136) removing the
restrictions on when computer science could be
counted as a mathematics credit. Previously, a
student had to be concurrently enrolled in or
have successfully completed Algebra II, effectively
limiting the policy to students who took Algebra I
in middle school. Similarly, Florida had previously
restricted the policy to students who earned an
industry certification. After the passage of HB 7101
in 2019, students in Florida only have to pass a
computer science course for that course to count
towards a mathematics or science credit.
This policy change is bolstered by the evidence of a
corresponding increase in diversity and enrollment
in computer science courses. The year following a
policy change to allow computer science to satisfy a
core graduation requirement, the average number of
AP computer science exams per school increases by
10%, exams taken by female students increases by
24%, and exams taken by underrepresented minority
students increases by 26%. And computer science
participation is 19% higher in states that allow it to
count, 48% higher among female students, and 64%
higher among underrepresented minority students.11
The 2018 report noted that Nevada and South
Carolina were the only two states to have
computer science graduation requirements; both
states had revised existing graduation requirements
in technology to focus on computer science.
Nevada and South Carolina continue to fund
and coordinate statewide professional learning to
retrain general technology or computer literacy
teachers in computer science. The first year of
full implementation in South Carolina is the
2019–2020 school year; schools will no longer be
able to receive waivers from the state and each
graduating student must have taken an approved
computer science course. In the 2018–2019 school
year, 69% of high schools in South Carolina taught
computer science, up from 43% in the 2017–2018
school year. The 26% increase was the largest
improvement of any state.
Aligning High School Graduation and Higher Education Admission Policies
Since the last report, the number of states allowing
computer science to count as a core admission
requirement for higher education, rather than an
elective, has increased from 17 to 18.
Alabama is the latest state to enact this policy
by aligning high school graduation requirements
with higher education admissions requirements.
In many states, computer science may count
towards a core high school graduation requirement
such as mathematics or science, but not towards
higher education admission for the same subject.
This misalignment detracts from the purpose of
allowing computer science to count as a core high
school graduation credit because many student
schedules are directed by higher education
admission requirements.
11 https://medium.com/@codeorg/does-making-cs-count-make-a-difference-7ab5ca6b8407

Policy Trends and National Momentum34
Only the Beginning: Idaho Adopts All Nine Policies
Idaho has been a national leader in expanding
computer science education and in 2018 became
the second state to adopt all nine policies thanks to
a partnership of key stakeholders, including the
Idaho STEM Action Center, Former Governor Otter,
and Idaho Digital Learning Academy. In addition to
this strong start, Idaho continues to expand access
to high-quality computer science courses in every
school; securing ongoing funding to support
educators and students will be their next challenge.
National Momentum
Governors’ Partnership for K–12 Computer Science
The Governors’ Partnership for K–12 Computer
Science is a group of bipartisan state leaders
committed to advancing policy and funding to
expand access to, and increase equity in, K–12
computer science education. As part of the
partnership, governors commit to working towards
ensuring all high schools offer computer science,
funding professional learning opportunities for
teachers, and developing a set of high-quality
academic K–12 computer science standards.
The Governors’ Partnership for K–12 Computer
Science has 17 members, including 9 Republicans
and 8 Democrats. Since the last report, Governor
Murphy (D-NJ), Governor Parson (R-MO), and
Governor Herbert (R-UT) have joined the
partnership. Governors who are members of the
partnership are noted in their respective state’s
summary in this report. More information about the
partnership can be found at governorsforcs.org.
Federal Policy
There has been significant policy movement at
the federal level in the past year, at both the
U.S. Department of Education and Congress.
The U.S. Department of Education (ED) has made
meaningful moves to support funding for K–12
computer science, building on years of work and
momentum by the computer science community,
goals set by the Obama Administration for focused
K–12 computer science funding, and the Trump
Administration's pledge for $200 million for STEM
and computer science.
In 2018, ED offered competitive grants to help the
education community fund their work, and these
opportunities gave an advantage to applicants who
addressed computer science in their proposals. In
2019, changes to the Carl D. Perkins Career and
Technical Education Act expanded opportunities as
well; the Perkins Innovation and Modernization Grant
Program offered funds to improve and modernize
career and technical education programs (including
computer science) to better prepare high school
students for success in the workforce.
In February 2019, ED made a major move to support
expanding access to computer science when they
called for the Education Innovation and Research
program to exclusively prioritize funding for
computer science. This marked the first time
computer science had an exclusive funding priority
in any major grant program at ED. These grants can
“Providing all Rhode Island students with computer science education is essential for our economic development and ensures that our students have the skills necessary to compete for high wage, high demand careers.”
— Governor Gina Raimondo (D-RI) Member of the Governors’ Partnership for
K–12 Computer Science

Policy Trends and National Momentum 35
jumpstart opportunities for schools to expand
computer science offerings and level the playing
field for students across the country.
“Computer science literacy is important for individuals to thrive in this digital age. Providing our young people with opportunities to develop these skills will better prepare them for 21st century jobs.”
—Congressman Chuck Fleischmann (R-TN)
On top of the support at ED over the last year,
members of Congress continued to advocate for
computer science education. From the Computer
Science for All Act to the bipartisan Building Blocks
of STEM Act and Preparing Teachers for K–12
Computer Science Education Act, the House and
Senate introduced many bills in the 116th Congress
that would expand opportunities to teach, learn, and
invest in computer science education. There was
also an effort to win investments in computer
science from the Department of Defense via the
JROTC Cyber Training Act, which would enhance
the preparation of the approximately 500,000
students in the Junior Reserve Officers’ Training
Corps for careers in computer science and
cyber-security. Although these ideas—and others—
may be difficult to pass due to competing priorities
in Congress, the Computer Science Education
Coalition continues to press lawmakers for
$250 million in targeted funding for computer
science education.
Despite this progress, the work is far from over.
The computer science education community will
continue to pursue changes to federal policies to
increase access for all students. At the top of the
community's priorities is addressing diversity in
STEM fields and subjects, changes to education
laws that would support the growth of the computer
science teaching workforce, and support for
research on the teaching, learning, and assessment
of computer science education.
“When it comes to being prepared for the 21st-century economy, our young people, especially girls and young people of color, need Congress to invest in their futures. We must invest in our young people NOW, before it’s too late. I am proud to lead my colleagues in introducing the Computer Science for All Act to help ensure that all students learn the computer science skills necessary for the tech jobs of today and tomorrow.”
—Congresswoman Barbara Lee (D-CA)

Policy Trends and National Momentum36

The State of Computer Science Policy This section presents the most reliable data currently available on the nine model state policies developed by the Code.org Advocacy Coalition (advocacy.code.org) for expanding computer science education. For more information regarding the policies, please refer to Nine Policy Ideas to Make Computer Science Fundamental to K–12 Education (bit.ly/makecsfundamental).
Each policy summary includes:
• a list of states that have met the policy and the total number of states,
• a map designating the status of states in enacting a policy,
• a rubric describing the criteria necessary to meet the policy,
• a highlight describing one or more state actions related to the policy, and
• one or two related resources to assist a state in developing the policy.
Although a “No” indicates that a state has not met all of the criteria in a rubric, in some cases, a state may have
met some of the criteria. Where possible, states that are in progress of meeting a policy are noted as such.
For the most up-to-date policy status and additional information, please refer to advocacy.code.org and
bit.ly/9policies.

The State of Computer Science Policy38
State Plan for K–12 Computer Science Education1
Yes In Progress No
13States
2017 2018 2019
6States
2States

The State of Computer Science Policy 39
RubricA state is considered to have a plan for K–12
computer science education if the plan meets all
four of the following criteria:
• developed by a state education agency,
• specific to computer science education,
• includes a timeline, goals, and strategies for
achieving the goals, and
• the plan is publicly accessible.
StatesThe following states have state plans (states in bold
have adopted the policy since the 2018 report):
• Arkansas
• California
• Georgia
• Hawaii
• Idaho
• Indiana
• Maryland
• Nevada
• New Hampshire
• North Carolina
• Rhode Island
• Utah
• Wyoming
HighlightsThe California Computer Science Strategic
Implementation Plan was adopted in May 2019
by the California State Board of Education. The
stated goal is for all schools to offer rigorous and
relevant computer science education equitably and
sustainably throughout grades K–12 and that all
teachers are adequately prepared to teach computer
science aligned with the state’s standards. The plan’s
sections are: Equity and Access, Supporting Educa-
tors to Teach Computer Science, and Expanding
Computer Science Course Offerings. Each section
includes a description of activities, immediate actions
and those pending funding, and guidance for schools,
districts, county offices of education, community and
business partners, and other entities to consider as
they work to improve computer science education.
Following the recommendations in the plan,
California appropriated $1 million over four years
for a state computer science coordinator and $37.1
million to the Educator Workforce Investment Grant
Program, which includes, among other priorities,
grants for computer science professional learning.
Related Resources
State Computer Science Planning Toolkit
This toolkit helps state and local education
agencies establish plans to address the key policy
and implementation issues reflected in this report.
bit.ly/statetoolkit
State Summit Toolkit
This toolkit, created through a partnership by the
Expanding Computing Education Pathways (ECEP)
Alliance and the National Center for Women &
Information Technology (NCWIT), helps organizers of
state advocacy efforts plan state computer science
summits, meetings, and strategic planning sessions.
ncwit.org/organize

The State of Computer Science Policy40
K–12 Computer Science Standards2
Yes In Progress No
34States
2017 2018 2019
22States
6States

The State of Computer Science Policy 41
RubricA state is considered to have K–12 computer
science standards if the standards meet both of the
following criteria:
• form a coherent progression that aligns
elementary, middle, and high school
expectations, and
• are publicly accessible on the state’s website.
StatesThe following states have K–12 computer science
standards (states in bold have adopted the policy
since the 2018 report):
• Alabama
• Alaska
• Arizona
• Arkansas
• California
• Connecticut
• Delaware
• Florida
• Hawaii
• Idaho
• Indiana
• Iowa
• Kansas
• Kentucky
• Maryland
• Massachusetts
• Michigan
HighlightsIn December 2018, the Ohio State Board of
Education approved K–12 computer science
standards based on the K–12 Computer Science
Framework and 2017 CSTA K–12 Standards. The Ohio
standards consist of expectations for individual
grades K, 1, 2, 3, 4, 5, 6, 7, 8, and for the 9–12 grade
band. The 9–12 standards include foundational
and advanced level expectations. Ohio’s Computer
Science Model Curriculum provides in-depth
guidance for implementing the state standards.
It describes learning progressions and elaborates on
the key concepts and practices associated with each
standard. The model curriculum is not a complete
curriculum nor is it mandatory; it is intended to help
educators in planning and developing their local
curricula. The Department of Education is now
working with teams of Ohio computer science
educators to develop instructional examples, tools,
and resources that align to the state standards.
Once released, the supports will be regularly
reviewed and updated.
Related Resources
K–12 Computer Science Framework
The Framework provides high-level guidance
describing the essential computer science concepts
and practices for all students.
k12cs.org
2017 CSTA K–12 Computer Science Standards
The CSTA Standards delineate a core set of
learning objectives designed to provide the
foundation for a complete computer science
curriculum. The K–12 Computer Science Framework
was a primary input for the CSTA Standards.
csteachers.org/standards
• Mississippi
• Missouri
• Nevada
• New Hampshire
• New Jersey
• New Mexico
• North Dakota
• Ohio
• Oklahoma
• Pennsylvania
• Rhode Island
• South Carolina
• Utah
• Virginia
• Washington
• West Virginia
• Wisconsin

The State of Computer Science Policy42
State-Level Funding for K–12 Computer Science Professional Learning3
* The state includes computer science among a variety of authorized funding priorities rather than dedicating a specific amount to computer science.
Yes No Other*
26States
2017 2018 2019
19States
9States

The State of Computer Science Policy 43
RubricA state is considered to have dedicated state-level
funding to K–12 computer science professional
learning if the funding meets all three of the
following criteria:
• the funds are allocated via the approved state
budget or state legislation,
• a description of the funds is publicly accessible,
and
StatesThe following states have dedicated funding to K–12
computer science professional learning (states in
bold have adopted the policy since the 2018 report):
• Alabama
• Arizona
• Arkansas
• Colorado
• Florida
• Georgia
• Hawaii
• Idaho
• Indiana
• Iowa
• Maryland
• Massachusetts
• Mississippi
HighlightsFlorida allocated $10 million for FY 2020 to train,
recruit, and retain computer science teachers.
In addition to funding professional development, it
will be used to prepare teachers for computer
science certification and to provide bonuses for
teachers certified in computer science. Pennsylvania
allocated $20M for STEM and computer science
education in FY 2019. The department created two
programs: Advancing Grants for the expansion of
existing large-scale programs, and Targeted Grants
for schools or districts with little to no computer
science. The Targeted Grant applications were
designed to be easily completed, making them
accessible to schools without a grant writer, and
recipients received targeted support. Arkansas
has continued to allocate $2.5 million for computer
science initiatives every year since FY 2016.
Together, these are some of the largest single
and multi-year investments in computer science
in the country.
Revisiting the priorities for grant programs ensures
the equitable distribution of funding. HB 2303
(2019) in Arizona amended the computer science
professional development program to prioritize
rural schools and schools with at least 60% of the
students eligible for free and reduced-price lunches.
SB 313 (2019) in Nevada includes a funding provision
targeting counties with less than 100,000 residents
to provide incentives for teachers earning a degree
or other credential in computer science.
Related Resources
Models for Funding Professional Learning
This document describes key elements of legislative
initiatives to fund computer science and provides
detailed guidance for state authorities implementing
grant programs.
bit.ly/modelsforfundingcs
• Missouri
• Nevada
• New Jersey
• New Mexico
• New York
• North Carolina
• Ohio
• Pennsylvania
• Rhode Island
• South Carolina
• Utah
• Virginia
• Washington

The State of Computer Science Policy44
4 State Computer Science Teacher Certification
Yes No
2017 2018 2019
38States
33States
27States

The State of Computer Science Policy 45
RubricA state is considered to have computer science
teacher certification if the certification (or endorse-
ment, licensure, or authorization) meets both of the
following criteria:
• explicitly names “computer science” or has a
related name (e.g., computer programming), and
• enables a teacher to teach computer science
courses.
StatesThe following states have computer science
certification (states in bold have adopted the
policy since the 2018 report):
• Alabama
• Arizona
• Arkansas
• California
• Connecticut
• District of Columbia
• Florida
• Georgia
• Hawaii
• Idaho
• Illinois
• Indiana
• Iowa
• Kentucky
• Louisiana
• Maryland
• Massachusetts
• Mississippi
• Missouri
HighlightsIn May 2019, the Arizona State Board of Education
approved new preK–8 and 6–12 endorsements that
require nine and twelve semester hours respectively,
and cover topics such as inclusive pedagogy.
The previous endorsement spanned preK to grade
12 and required 30 semester hours in computer
science, proving a burden to many teachers. The
requirements can be met through an accredited
institution or now through a program approved by
the local education agency. The new endorsements
allow fifteen clock hours of professional learning, or
an analogous micro-credential, to substitute for one
semester hour of college coursework.
Arkansas has a unique approach to certification. Any
teacher with a grade-appropriate license can obtain
an approval code to teach computer science through
a variety of qualifications, including a combination of
years teaching computer science and completion of
approved professional development. The approval
code is a temporary measure that helps schools
meet short-term needs by providing teachers with
options for demonstrating their competency, as well
as monitoring teachers in order to help them meet
traditional certification requirements later.
Related Resources
Teacher Pathways Recommendations
This document provides recommendations and
examples for computer science teacher preparation
and certification.
bit.ly/csteacherpathway
Micro-credentials in Computer Science
This paper describes micro-credentials, illustrates a
model for how they might be used for certification,
gives examples of state initiatives, and provides
recommendations.
advocacy.code.org/micro-credentials.pdf
• Montana
• Nevada
• New Hampshire
• New Jersey
• New York
• North Carolina
• North Dakota
• Ohio
• Oklahoma
• South Carolina
• Tennessee
• Texas
• Utah
• Vermont
• Virginia
• Washington
• West Virginia
• Wisconsin
• Wyoming
Since 2018, Michigan phased out the computer science endorsement requirements and now authorizes all teachers to teach computer science.
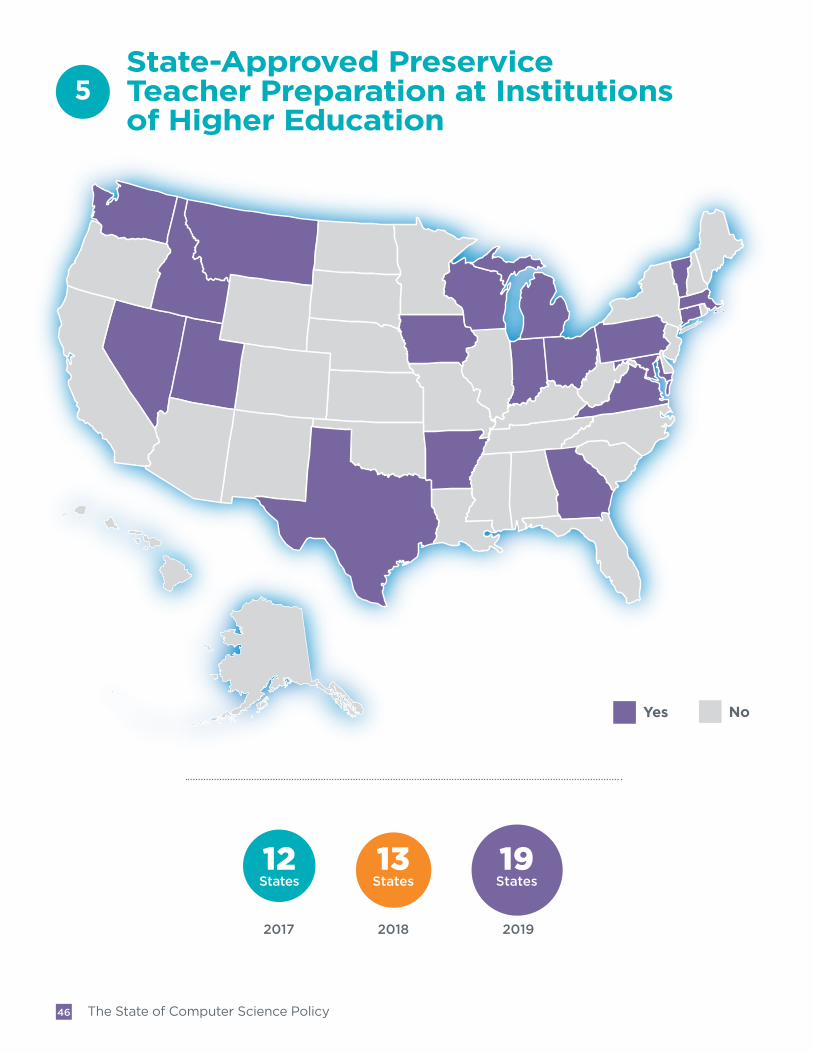
The State of Computer Science Policy46
5State-Approved Preservice Teacher Preparation at Institutions of Higher Education
Yes No
19States
2017 2018 2019
13States
12States

The State of Computer Science Policy 47
RubricA state is considered to have approved preservice
teacher preparation in computer science at
institutions of higher education if any of the
following criteria are met:
• the state requires all preservice teachers (from
any subject) be exposed to computer science
content and/or pedagogy within a teacher’s
preparation program,
• the state provides scholarships for preservice
teachers to take computer science,
• the state provides funds to teacher preparation
institutions to establish preservice computer
science education programs, and/or
• the state approves programs at institutions
of higher education that prepare preservice
teachers to teach computer science and lists
those programs publicly.
Note that each of the above criteria involves a state-
led effort; individual programs led by universities are
not sufficient to meet this state policy.
StatesThe following states have state-approved
preservice teacher preparation at institutions of
higher education (states in bold have adopted the
policy since the 2018 report):
• Arkansas
• Connecticut
• Georgia
• Idaho
• Indiana
• Iowa
• Maryland
• Massachusetts
• Michigan
• Montana
HighlightsWith the passage of SB 313 (2019), Nevada now
requires all teacher candidates in the Nevada
System of Higher Education to receive appropriate
education and training in computer science. The
bill also allows the Board of Regents to apply for
funds from the Account for Computer Education
and Technology to develop the curriculum and
standards for computer science teaching. Similarly,
SB 957 (2019) in Connecticut requires all teacher
preparation programs to include instruction
in computer science that is grade-level and
subject-area appropriate.
By requiring that preservice teachers across all
subject areas and grade levels receive exposure
to computer science, states like Nevada and
Connecticut ensure that teachers have the
knowledge and skills to integrate computer
science into their classroom practice.
Related Resources
Priming the Computer Science Teacher Pump
This report offers a set of recommendations
that schools of education, together with other
departments and school districts, can take to
develop computer science education within their
teacher education programs.
computingteacher.org• Nevada
• Ohio
• Pennsylvania
• Texas
• Utah
• Vermont
• Virginia
• Washington
• Wisconsin

The State of Computer Science Policy48
6 State-Level Computer Science Supervisor
21States
2017 2018 2019
8States
14States
Yes In Progress No

The State of Computer Science Policy 49
RubricA state is considered to have a state-level computer
science supervisor if the position meets all three of
the following criteria:
• located in a state agency,
• with a title reflecting a focus on K–12 computer
science, and
• is clearly able to develop state policy and/or
regulations and create programs around
computer science.
StatesThe following states have a state-level computer
science supervisor (states in bold have adopted
the policy since the 2018 report):
• Arkansas
• Colorado
• Connecticut
• Florida
• Georgia
• Hawaii
• Idaho
• Indiana
• Iowa
• Maryland
• Massachusetts
HighlightsMaryland has multiple state-level positions
dedicated to computer science. The Maryland
Center for Computing Education (MCCE) based at
the University System of Maryland employs an
executive director and director of research. The
responsibilities of the MCCE include implementation
of the state plan, management of state grant funds,
and development of preservice programs. The
Maryland State Department of Education employs
two computer science specialists: a career programs
specialist with oversight of STEM and computer
science pathways, and a specialist responsible for
computer science resources and courses for
students not participating in career and technical
education pathways. The latter position collaborates
with the MCCE, provides technical assistance to
educators, collects data on computer science
programs, pursues funding opportunities, and
collaborates with other content specialists to
integrate computer science across other
content areas.
Multiple state-level positions dedicated to computer
science allow for a focused and coordinated effort
across state entities that are responsible for different
aspects of a state’s computer science initiative.
Related Resources
Model Computer Science State Supervisor Job Description
This resource provides a sample job description with
responsibilities and qualifications based on existing
state positions.
bit.ly/csjobdescription
• Nevada
• New Hampshire
• North Carolina
• Ohio
• Oklahoma
• Pennsylvania
• Utah
• Virginia
• Washington
• Wyoming

The State of Computer Science Policy50
7 A Requirement for All High Schools to Offer Computer Science
Yes No
19States
2017 2018 2019
15States
4States
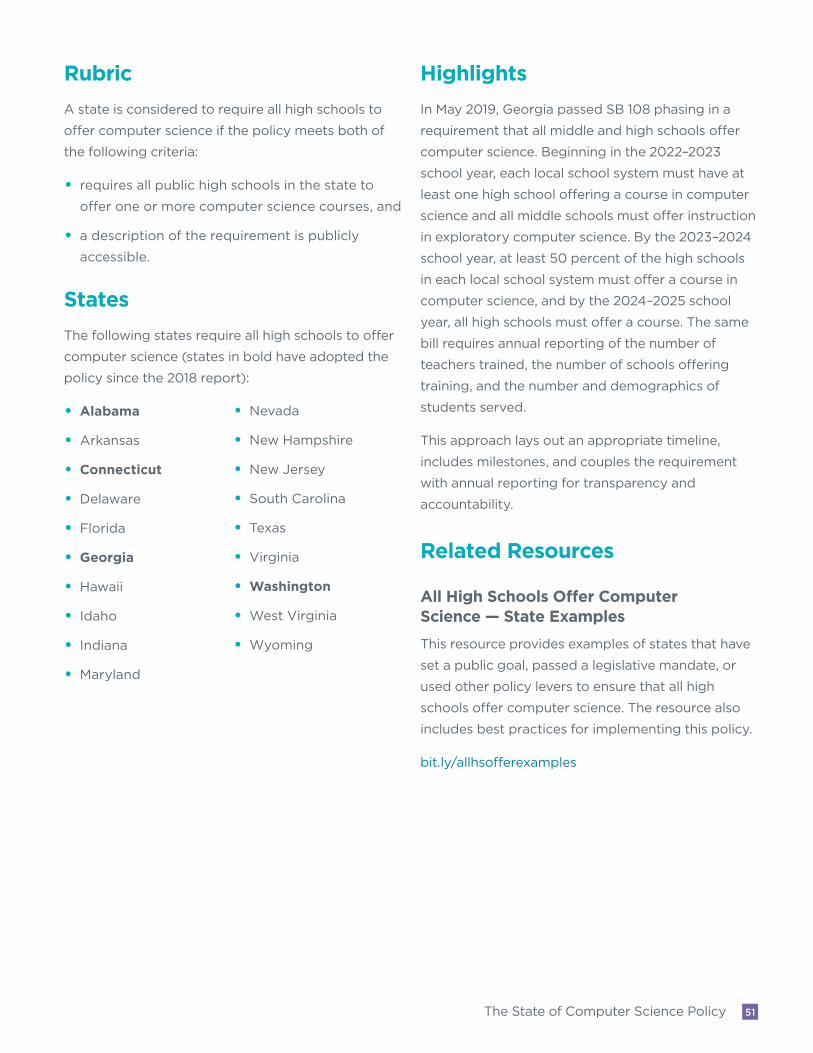
The State of Computer Science Policy 51
RubricA state is considered to require all high schools to
offer computer science if the policy meets both of
the following criteria:
• requires all public high schools in the state to
offer one or more computer science courses, and
• a description of the requirement is publicly
accessible.
StatesThe following states require all high schools to offer
computer science (states in bold have adopted the
policy since the 2018 report):
• Alabama
• Arkansas
• Connecticut
• Delaware
• Florida
• Georgia
• Hawaii
• Idaho
• Indiana
• Maryland
HighlightsIn May 2019, Georgia passed SB 108 phasing in a
requirement that all middle and high schools offer
computer science. Beginning in the 2022–2023
school year, each local school system must have at
least one high school offering a course in computer
science and all middle schools must offer instruction
in exploratory computer science. By the 2023–2024
school year, at least 50 percent of the high schools
in each local school system must offer a course in
computer science, and by the 2024–2025 school
year, all high schools must offer a course. The same
bill requires annual reporting of the number of
teachers trained, the number of schools offering
training, and the number and demographics of
students served.
This approach lays out an appropriate timeline,
includes milestones, and couples the requirement
with annual reporting for transparency and
accountability.
Related Resources
All High Schools Offer Computer Science — State Examples
This resource provides examples of states that have
set a public goal, passed a legislative mandate, or
used other policy levers to ensure that all high
schools offer computer science. The resource also
includes best practices for implementing this policy.
bit.ly/allhsofferexamples
• Nevada
• New Hampshire
• New Jersey
• South Carolina
• Texas
• Virginia
• Washington
• West Virginia
• Wyoming

The State of Computer Science Policy52
8 Computer Science Can Satisfy a Core High School Graduation Requirement
Statewide District Decision* No
28States
39States
47States
2017 2018 2019

The State of Computer Science Policy 53
RubricA state is considered to allow computer science to
count towards a core graduation requirement if the
policy meets both criteria:
• allows computer science to satisfy a core
graduation requirement (not an elective) for
a subject such as mathematics, science,
technology, or language other than English, and
• a description of the policy is publicly accessible.
StatesThe following states allow computer science to
satisfy a core graduation requirement (states in bold
have adopted the policy since the 2018 report):
• Alabama
• Alaska*
• Arizona*
• Arkansas
• California*
• Colorado*
• Delaware
• District of Columbia
• Florida
• Georgia
• Hawaii
• Idaho
• Illinois
• Indiana
• Iowa*
• Kentucky*
• Louisiana
• Maryland
• Massachusetts
• Michigan
• Minnesota
• Mississippi
• Missouri
• Montana*
HighlightsMissouri passed legislation (HB 3, special session
2018) allowing students to fulfill one unit of any
mathematics, science, or practical arts unit required
for graduation with a district-approved computer
science course. The state developed the policy
alongside new K–12 computer science standards
and teacher certification requirements, and posted
a guidance document that defines computer
science, explains course code reporting, and outlines
teaching qualifications for the course to count.
Washington and Florida are examples of states that
have reduced restrictions within existing policies.
Washington removed a restriction that required
certain courses to be taken before computer science
could be counted as a mathematics credit. Florida
no longer requires students to earn an industry
certification in order for a course to count towards
a mathematics or science credit.
Related Resources
Outcomes of K–12 Computer Science Policy in States
This resource presents outcomes associated with
policy adoption, with a focus on allowing computer
science to count towards core graduation
requirements.
bit.ly/cspolicyoutcomes
Computer Science Flex Credit
This issue brief describes how computer science
should be considered a credit on transcripts and
allowed to “flex” to satisfy a core graduation
requirement.
bit.ly/csflexcredit
• Nebraska*
• Nevada
• New Hampshire*
• New Jersey
• New Mexico
• New York*
• North Carolina
• North Dakota
• Ohio
• Oklahoma
• Oregon*
• Pennsylvania
• Rhode Island
• South Carolina
• South Dakota
• Tennessee
• Texas
• Utah
• Vermont*
• Virginia
• Washington
• West Virginia
• Wisconsin
• Wyoming
* The state has passed policy that is permissive and encouraging, but it is not a requirement for schools to allow computer science to satisfy a core graduation requirement.
No

The State of Computer Science Policy54
9Computer Science Can Satisfy a Core Admission Requirement at Institutions of Higher Education
Yes No
13States
17States
18States
2017 2018 2019

The State of Computer Science Policy 55
RubricA state is considered to allow computer science to
count towards a core admission requirement if the
policy meets both criteria:
• allows computer science to satisfy one of the
core credits for entry (not an elective), and
• a description of the policy is publicly accessible.
StatesThe following states allow computer science to
satisfy a core admission requirement at institutions
of higher education (states in bold have adopted the
policy since the 2018 report):
• Alabama
• Arkansas
• California
• Colorado
• Georgia
• Idaho
• Illinois
• Indiana
• Kentucky
HighlightsBeginning in fall 2022, students applying to
Mississippi State Institutions of Higher Learning
must have one credit in computer science or
technology. This higher education requirement
is aligned to the state’s computer science or
technology requirement for high school graduation.
In many states, computer science may count
towards a specific core graduation requirement
(e.g., math or science), but not count towards the
same subject requirement when applying for
admission to an institution of higher education.
This misalignment leads to a situation in which
students may take computer science to graduate
from state high schools, but may not use the same
credit when applying to state institutions of higher
education. By aligning high school graduation
requirements and higher education admission
requirements, states ensure clear articulation of
computer science credits.
Related Resources
University of California Data Confirms Computer Science is Foundational
Computer science can satisfy a core university
graduation requirement in 95% of B.S. degrees
across the UC system, confirming that computer
science is a foundational subject for all students.
Universities that allow computer science to count
towards their own degree requirements should also
allow it to count towards admission requirements, as
these policies influence high school graduation
requirements and course-taking patterns.
bit.ly/ucdataconfirmscs
• Louisiana
• Maryland
• Massachusetts
• Mississippi
• Nevada
• South Carolina
• Texas
• Washington
• Wyoming


57
Each state summary also notes membership in the
Expanding Computing Education Pathways (ECEP)
Alliance, a National Science Foundation-funded
broadening participation in computing alliance.
Refer to ecepalliance.org for more information about
connecting with a state team and to learn more
about how your state can increase the number
and diversity of K–16 students in computing and
computing-related degrees.
Data SourcesThe data included in the state summaries
represents the most current information that is
publicly accessible. New data from the AP program
and university graduates is expected in fall 2019.
Refer to advocacy.code.org for up-to-date state
policy information and data.
The number of bachelor’s degrees in computer
science earned in a given state and the percentage
female comes from the National Center for Education
Statistics (NCES) IPEDS Completions Survey.
The data includes only bachelor’s degrees from
public or nonprofit private institutions.
The percentage of schools in the state teaching at
least one computer science course is included for
those states with complete data sets in the Access
Report. See the K–12 Computer Science Access
Report section of this report for full methodology.
The data about AP computer science exam
participation by female and underrepresented
minority students (Black, Hispanic/Latino, Native
American/Alaska Native, and Native Hawaiian/Other
Pacific Islander students) comes from the College
Board National and State Summary Reports
(research.collegeboard.org/programs/ap/data).
The number of high schools offering the exam
comes from data provided to Code.org directly
from the College Board. AP data is included because
it provides a national, standardized data set on
participation and diversity in computer science
courses. AP numbers reported here aggregate both
AP Computer Science A and AP Computer Science
Principles courses.
State SummariesThis section provides information for each state in the nation, including:
• the state’s status toward meeting each of the nine policies (bolded policies are changes since the 2018 report),
• policy updates in the state, and • data on university graduates, school offerings, and participation.

State Summaries58
Active Computer Science Teachers Association (CSTA) chapters are listed below. These CSTA chapters
develop local computer science teacher communities for professional learning. Refer to csteachers.org/
chapters to join or start a new chapter.
Active CSTA Chapters by State
Alabama• CSTA Alabama
Alaska• CSTA Top of the
World
Arkansas• CSTA Arkansas
Arizona• CSTA Arizona
California• CSTA California
Central Valley
• CSTA Golden Gate
• CSTA Inland Empire
• CSTA Orange County
• CSTA Sacramento
• CSTA San Diego
• CSTA San Mateo County
• CSTA Silicon Valley
• CSTA Southern California
Colorado• CSTA Colorado
Connecticut• CSTA Connecticut
Delaware• CSTA Delaware
Florida• CSTA Florida
• CSTA Miami
Georgia• CSTA Georgia
Hawaii• CSTA Hawaii
Idaho• CSTA Idaho
Illinois• CSTA Chicago
• CSTA Chicago Suburban
Iowa• CSTA Iowa
Indiana• CSTA Hoosier
Heartland
• CSTA Hoosier Heritage
Kentucky• CSTA Kentuckiana
• CSTA Northern Kentucky
Louisiana• CSTA Louisiana
Maine• CSTA Maine
Maryland• CSTA Maryland
Massachusetts• CSTA Greater Boston
• CSTA Western Mass
Michigan• CSTA Michigan
Minnesota• CSTA Minnesota
Mississippi• CSTA Central
Mississippi
Missouri• CSTA Southwest
Missouri
• CSTA St. Louis
Nebraska• CSTA Metro Omaha
• CSTA Nebraska Huskers
Nevada• CSTA Nevada Silver
State
New Hampshire• CSTA New Hampshire
New Jersey• CSTA Central NJ
• CSTA Northern NJ
• CSTA Southern NJ
New Mexico• CSTA New Mexico
New York• CSTA Hudson Valley
• CSTA Long Island
• CSTA Lower Hudson Valley
• CSTA New York Capital District
• CSTA NYC
• CSTA Staten Island
• CSTA Western New York
North Carolina• CSTA Triangle East
Ohio• CSTA Ohio
Oklahoma• CSTA Oklahoma
Oregon• CSTA Oregon
Pennsylvania• CSTA Philly
• CSTA Pittsburgh
Rhode Island• CSTA Rhode Island
South Carolina• CSTA South Carolina
Texas• CSTA Alamo
• CSTA Central Texas
• CSTA Dallas Fort Worth
• CSTA Greater Houston
• CSTA Paso Del Norte
Utah• CSTA Utah
Virginia• CSTA Central Virginia
• CSTA Northern Virginia
Washington• CSTA Central
Washington
• CSTA Puget Sound
• CSTA Spokane
West Virginia• CSTA West Virginia
Wisconsin• CSTA Wisconsin
Dairyland
Wyoming• CSTA WY

State Summaries 59
1 2 3
7 8 9
4 5 6
State Plan Standards Funding
In Progress Yes Yes
Certification PreserviceTeacher Prep
StateSupervisor
Yes No In Progress
Require HSto O�er
Core GradCredit
Higher EdAdmission
ES, MS, HS Math &Science Yes
Refer to advocacy.code.org for additional up-to-date information.
Updates• The recommendations made by the Governor's Advisory Council for
Computer Science Education will serve as the basis for the state plan required by Act 389 (2019).
• For FY 2020 (SB 199), the state appropriated $2.771M: $614K for middle school computer science, $300K for computer science educator training, $1M for CS4AL, and $857K to train K–12 teachers in computer science.
• Act 389 updated certification pathways including a course-specific permit earned through professional learning; created a state Computer Science Specialist position; and required all schools to o�er computer science by the 2020–2021 school year. The bill also allowed computer science to satisfy high school mathematics or science graduation requirements and admission requirements at institutions of higher education.
• Governor Kay Ivey is a member of the Governors’ Partnership for K–12 Computer Science.
• Alabama is a member of the ECEP Alliance.
Data • In the 2017–2018 school year, 38% of high schools taught at least one
computer science course.• 104 schools (30% of schools with AP programs) o�ered an audited AP
computer science course in 2017–2018, which is 18 more schools than the previous year.
• 642 female students (32%) took an AP CS exam in 2018, compared to 463 (30%) in 2017.
• 383 underrepresented minority students (19%) took an AP CS exam in 2018, compared to 243 (16%) in 2017.
• 614 bachelor’s degrees in computer science were earned in 2017; 20% were female.
Alabama
1 2 3
7 8 9
4 5 6
State Plan Standards Funding
No Yes No
Certification PreserviceTeacher Prep
StateSupervisor
No No No
Require HSto O�er
Core GradCredit
Higher EdAdmission
NoDistrict
Decision No
Refer to advocacy.code.org for additional up-to-date information.
Updates• The state adopted K–12 computer science standards in June 2019.
• The state passed a permissive and encouraging policy to allow computer science to count as a mathematics, science, or local CTE/technology credit for graduation, but it is a district decision.
Data • In the 2018–2019 school year, 19% of high schools taught at least one
computer science course.
• 8 schools (9% of schools with AP programs) o�ered an audited AP computer science course in 2017–2018, which is 2 more schools than the previous year.
• 29 female students (25%) took an AP CS exam in 2018, compared to 17 (25%) in 2017.
• 18 underrepresented minority students (16%) took an AP CS exam in 2018, compared to 5 (7%) in 2017.
• 33 bachelor’s degrees in computer science were earned in 2017; none were female.
Alaska

State Summaries60
1 2 3
7 8 9
4 5 6
State Plan Standards Funding
No Yes Yes
Certification PreserviceTeacher Prep
StateSupervisor
Yes No No
Require HSto O�er
Core GradCredit
Higher EdAdmission
No No
Refer to advocacy.code.org for additional up-to-date information.
DistrictDecision
Updates• The state adopted K–12 computer science standards in October 2018.
• HB 2303 (2019) amended the computer science professional development program to prioritize rural schools and schools with at least 60% of the students eligible for free and reduced-price lunches. The FY 2020 budget included $1M in continued funding for the program.
• HB 2303 (2019) strongly encouraged the State Board of Education, Arizona Board of Regents, and universities to develop guidelines on computer science courses to meet high school graduation and university admission requirements.
• Governor Doug Ducey is a member of the Governors’ Partnership for K–12 Computer Science.
Data • 65 schools (19% of schools with AP programs) o�ered an audited
AP computer science course in 2017–2018, which is 13 more schools than the previous year.
• 267 female students (24%) took an AP CS exam in 2018, compared to 163 (22%) in 2017.
• 284 underrepresented minority students (26%) took an AP CS exam in 2018, compared to 153 (21%) in 2017.
• 814 bachelor’s degrees in computer science were earned in 2017; 16% were female.
Arizona
1 2 3
7 8 9
4 5 6
State Plan Standards Funding
Yes Yes Yes
Certification PreserviceTeacher Prep
StateSupervisor
Yes Yes Yes
Require HSto O�er
Core GradCredit
Higher EdAdmission
ES, MS, HS Math &Science Yes
Refer to advocacy.code.org for additional up-to-date information.
Updates• Arkansas appropriated $2.5 million for the Computer Science Initiative
for FY 2020 (SB 136).
• All preservice elementary educators receive instruction in computer science education.
• Governor Asa Hutchinson is the co-chair of the Governors’ Partnership for K–12 Computer Science.
• Arkansas is a member of the ECEP Alliance.
Data • In the 2018–2019 school year, 78% of high schools taught at least one
computer science course, compared to 64% in 2017–2018.
• 59 schools (19% of schools with AP programs) o�ered an audited AP computer science course in 2017–2018, which is 9 more schools than the previous year.
• 390 female students (31%) took an AP CS exam in 2018, compared to 230 (26%) in 2017.
• 277 underrepresented minority students (22%) took an AP CS exam in 2018, compared to 221 (25%) in 2017.
• 350 bachelor’s degrees in computer science were earned in 2017; 15% were female.
Arkansas

State Summaries 61
1 2 3
7 8 9
4 5 6
State Plan Standards Funding
Yes Yes Other
Certification PreserviceTeacher Prep
StateSupervisor
Yes No In Progress
Require HSto O�er
Core GradCredit
Higher EdAdmission
NoDistrict
Decision Yes
Refer to advocacy.code.org for additional up-to-date information.
Updates• The State Board of Education adopted the Computer Science
Strategic Implementation Plan in May 2019.
• Although the state has not created a dedicated funding source for computer science, SB 75 (2019) appropriated $22.1M to the Educator Workforce Investment Grant Program to support professional learning in several areas including computer science.
• SB 75 (2019) created the Computer Science Coordinator position.
• California is a member of the ECEP Alliance.
Data • In the 2017–2018 school year, 47% of high schools taught at least one
computer science course, compared to 45% in 2016–2017.
• 685 schools (28% of schools with AP programs) o�ered an audited AP computer science course in 2017–2018, which is 105 more schools than the previous year.
• 7,437 female students (30%) took an AP CS exam in 2018, compared to 5,464 (29%) in 2017.
• 6,542 underrepresented minority students (27%) took an AP CS exam in 2018, compared to 4,565 (24%) in 2017.
• 6,236 bachelor’s degrees in computer science were earned in 2017; 18% were female.
California
1 2 3
7 8 9
4 5 6
State Plan Standards Funding
No No Yes
Certification PreserviceTeacher Prep
StateSupervisor
No No Yes
Require HSto O�er
Core GradCredit
Higher EdAdmission
No Yes
Refer to advocacy.code.org for additional up-to-date information.
DistrictDecision
Updates• SB 207 (2019) allocated $1,048,600 for Computer Science Education
Grants for Teachers (FY 2020), and HB 19-1277 dedicated $250K per year for FY 2021, 2022, and 2023 to the Computer Science Education Grant Program.
Data • 129 schools (35% of schools with AP programs) o�ered an audited
AP computer science course in 2017–2018, which is 33 more schools than the previous year.
• 466 female students (24%) took an AP CS exam in 2018, compared to 273 (19%) in 2017.
• 359 underrepresented minority students (19%) took an AP CS exam in 2018, compared to 259 (18%) in 2017.
• 1,021 bachelor’s degrees in computer science were earned in 2017; 17% were female.
Colorado

State Summaries62
1 2 3
7 8 9
4 5 6
State Plan Standards Funding
In Progress Yes No
Certification PreserviceTeacher Prep
StateSupervisor
Yes Yes Yes
Require HSto O�er
Core GradCredit
Higher EdAdmission
ES, MS, HS No No
Refer to advocacy.code.org for additional up-to-date information.
Updates• SB 957 (2019) required the State Department of Education to develop
an alternate route to certification for computer science teachers and the State Board to create an endorsement and approve an assessment for certification.
• SB 957 required teacher preparation programs to include, as part of the curriculum for all preservice candidates, instruction in computer science that is grade-level and subject-area appropriate.
• SB 957 added computer science (including computer programming) to the list of subjects that public schools must teach.
• Connecticut is a member of the ECEP Alliance.
Data • 116 schools (43% of schools with AP programs) o�ered an audited
AP computer science course in 2017–2018, which is 20 more schools than the previous year.
• 672 female students (28%) took an AP CS exam in 2018, compared to 504 (27%) in 2017.
• 361 underrepresented minority students (15%) took an AP CS exam in 2018, compared to 232 (12%) in 2017.
• 533 bachelor’s degrees in computer science were earned in 2017; 18% were female.
Connecticut
1 2 3
7 8 9
4 5 6
State Plan Standards Funding
No Yes No
Certification PreserviceTeacher Prep
StateSupervisor
No No No
Require HSto O�er
Core GradCredit
Higher EdAdmission
HS Math No
Refer to advocacy.code.org for additional up-to-date information.
Data • In the 2018–2019 school year, 65% of high schools taught at least
one computer science course.
• 23 schools (35% of schools with AP programs) o�ered an audited AP computer science course in 2017–2018, which is 9 more schools than the previous year.
• 87 female students (22%) took an AP CS exam in 2018, compared to 66 (23%) in 2017.
• 64 underrepresented minority students (16%) took an AP CS exam in 2018, compared to 30 (10%) in 2017.
• 194 bachelor’s degrees in computer science were earned in 2017; 22% were female.
Delaware

State Summaries 63
1 2 3
7 8 9
4 5 6
State Plan Standards Funding
No Yes Yes
Certification PreserviceTeacher Prep
StateSupervisor
Yes No Yes
Require HSto O�er
Core GradCredit
Higher EdAdmission
HS, MS No
Refer to advocacy.code.org for additional up-to-date information.
Math &Science
Updates• SB 2500 (2019) allocated $10M for computer science teacher
certification and professional development and SB 7070 (2019) established recruitment awards for newly hired teachers who are content experts in specified subjects including computer science.
• HB 7071 (2019) amended the existing graduation policy to allow computer science to satisfy a math or science graduation requirement without requiring an industry certification.
Data • In the 2018–2019 school year, 30% of high schools taught at least
one computer science course, compared to 23% in 2017–2018.
• 315 schools (28% of schools with AP programs) o�ered an audited AP computer science course in 2017–2018, which is 74 more schools than the previous year.
• 2,974 female students (28%) took an AP CS exam in 2018, compared to 1,817 (25%) in 2017.
• 4,424 underrepresented minority students (42%) took an AP CS exam in 2018, compared to 2,823 (39%) in 2017.
• 2,986 bachelor’s degrees in computer science were earned in 2017; 18% were female.
Florida
1 2 3
7 8 9
4 5 6
State Plan Standards Funding
No No No
Certification PreserviceTeacher Prep
StateSupervisor
Yes No No
Require HSto O�er
Core GradCredit
Higher EdAdmission
No Math No
Refer to advocacy.code.org for additional up-to-date information.
Data • In the 2018–2019 school year, 20% of high schools taught at least
one computer science course.
• 17 schools (30% of schools with AP programs) o�ered an auditedAP computer science course in 2017–2018, which is 2 more schools than the previous year.
• 124 female students (34%) took an AP CS exam in 2018, compared to 73 (31%) in 2017.
• 189 underrepresented minority students (52%) took an AP CS exam in 2018, compared to 96 (41%) in 2017.
• 202 bachelor’s degrees in computer science were earned in 2017; 28% were female.
District of Columbia

State Summaries64
1 2 3
7 8 9
4 5 6
State Plan Standards Funding
Yes In Progress Yes
Certification PreserviceTeacher Prep
StateSupervisor
Yes Yes Yes
Require HSto O�er
Core GradCredit
Higher EdAdmission
HS Yes
Refer to advocacy.code.org for additional up-to-date information.
Math &Science
Updates• The Department of Education developed a state plan for expanding
computer science. • The state adopted K–8 computer science standards in March 2019.• SB 108 (2019) established a computer science professional development
grant program which received $750K in the FY 2020 budget.• The state approves programs at institutions of higher education that
prepare preservice teachers to teach computer science and lists those programs publicly.
• SB 108 also required all high schools to o�er computer science beginning in the 2024–2025 school year.
• Georgia is a member of the ECEP Alliance.
Data • In the 2018–2019 school year, 52% of high schools taught at least one
computer science course, compared to 50% in 2017–2018.• 177 schools (28% of schools with AP programs) o�ered an audited
AP computer science course in 2017–2018, which is 23 more schools than the previous year.
• 1,316 female students (27%) took an AP CS exam in 2018, compared to 923 (24%) in 2017.
• 1,015 underrepresented minority students (20%) took an AP CS exam in 2018, compared to 710 (18%) in 2017.
• 2,279 bachelor’s degrees in computer science were earned in 2017; 19% were female.
Georgia
1 2 3
7 8 9
4 5 6
State Plan Standards Funding
Yes Yes Yes
Certification PreserviceTeacher Prep
StateSupervisor
Yes No Yes
Require HSto O�er
Core GradCredit
Higher EdAdmission
HS Math No
Refer to advocacy.code.org for additional up-to-date information.
Updates• In 2019, the state budget increased the weighted per-pupil funding to
schools by $3M, directing that schools use the funds to implement, among other subjects, computer science curriculum.
• The state developed certification pathways for K–6, 6–12, and K–12 in computer science in 2018.
• Act 51 (2018) required all high schools to o�er at least one computer science course by the 2021–2022 school year.
• AP computer science can count as the fourth mathematics credit required for the Honors or STEM diploma.
• Governor David Ige is a member of the Governors’ Partnership for K–12 Computer Science.
• Hawaii is a member of the ECEP Alliance.
Data • In the 2017–2018 school year, 47% of high schools taught at least one
computer science course.• 24 schools (29% of schools with AP programs) o�ered an audited
AP computer science course in 2017–2018, which is 8 more schools than the previous year.
• 132 female students (29%) took an AP CS exam in 2018, compared to 92 (32%) in 2017.
• 67 underrepresented minority students (15%) took an AP CS exam in 2018, compared to 56 (19%) in 2017.
• 134 bachelor’s degrees in computer science were earned in 2017; 13% were female.
Hawaii

State Summaries 65
1 2 3
7 8 9
4 5 6
State Plan Standards Funding
No No No
Certification PreserviceTeacher Prep
StateSupervisor
Yes No No
Require HSto O�er
Core GradCredit
Higher EdAdmission
No Math Yes
Refer to advocacy.code.org for additional up-to-date information.
Data • In the 2018–2019 school year, 37% of high schools taught at least
one computer science course.
• 187 schools (27% of schools with AP programs) o�ered an auditedAP computer science course in 2017–2018, which is 30 more schools than the previous year.
• 1,580 female students (25%) took an AP CS exam in 2018, compared to 1,115 (23%) in 2017.
• 1,126 underrepresented minority students (18%) took an AP CS exam in 2018, compared to 848 (17%) in 2017.
• 2,232 bachelor’s degrees in computer science were earned in 2017; 16% were female.
Illinois
1 2 3
7 8 9
4 5 6
State Plan Standards Funding
Yes Yes Yes
Certification PreserviceTeacher Prep
StateSupervisor
Yes Yes Yes
Require HSto O�er
Core GradCredit
Higher EdAdmission
HS Yes
Refer to advocacy.code.org for additional up-to-date information.
Math &Science
Updates• The Idaho STEM Action Center, Idaho Digital Learning Academy, and
stakeholders across the state created the Idaho Computing Technology K–12 Computer Science State Plan for computer science education implementation.
• H0215 (2019) allocated $1M for FY 2020 for the expansion of computer science throughout the state.
Data • 15 schools (13% of schools with AP programs) o�ered an audited
AP computer science course in 2017–2018, which is 4 fewer than the previous year.
• 59 female students (21%) took an AP CS exam in 2018, compared to 92 (29%) in 2017.
• 28 underrepresented minority students (10%) took an AP CS exam in 2018, compared to 39 (12%) in 2017.
• 435 bachelor’s degrees in computer science were earned in 2017; 16% were female.
Idaho

State Summaries66
1 2 3
7 8 9
4 5 6
State Plan Standards Funding
Yes Yes Yes
Certification PreserviceTeacher Prep
StateSupervisor
Yes Yes Yes
Require HSto O�er
Core GradCredit
Higher EdAdmission
ES, MS, HSMath &Science Yes
Refer to advocacy.code.org for additional up-to-date information.
Updates• The Department of Education and a group of stakeholders created a
state plan for computer science education.• The state published a comprehensive set of K–12 computer science
standards in fall 2018.• In 2018, the Department of Education contracted with a provider to o�er
computer science professional development in FY 2019 as required by SB 172. HB 1001 (2019) allocated $3M per year for computer science professional development for FY 2020 and 2021.
• The state added computer science to the list of courses that can satisfy a science requirement for graduation.
• Governor Eric Holcomb is a member of the Governors’ Partnership for K–12 Computer Science.
• Indiana is a member of the ECEP Alliance.
Data • In the 2018–2019 school year, 62% of high schools taught at least one
computer science course, compared to 51% in 2017–2018.• 93 schools (21% of schools with AP programs) o�ered an audited
AP computer science course in 2017–2018, which is 16 more schools than the previous year.
• 384 female students (22%) took an AP CS exam in 2018, compared to 268 (20%) in 2017.
• 201 underrepresented minority students (12%) took an AP CS exam in 2018, compared to 152 (11%) in 2017.
• 1,886 bachelor’s degrees in computer science were earned in 2017; 21% were female.
Indiana
1 2 3
7 8 9
4 5 6
State Plan Standards Funding
No Yes Yes
Certification PreserviceTeacher Prep
StateSupervisor
Yes Yes Yes
Require HSto O�er
Core GradCredit
Higher EdAdmission
NoDistrict
Decision No
Refer to advocacy.code.org for additional up-to-date information.
Updates• The state approves programs at institutions of higher education that
prepare preservice teachers to teach computer science and lists those programs publicly.
• The Department of Education created a position for a Computer Science Education Program Consultant.
• The state passed a permissive and encouraging policy to allow computer science to count as a mathematics credit for graduation, but it is a district decision.
• Governor Kim Reynolds is a member of the Governors’ Partnership for K–12 Computer Science.
Data • In the 2018–2019 school year, 58% of high schools taught at least one
computer science course, compared to 49% in 2017–2018.
• 41 schools (19% of schools with AP programs) o�ered an auditedAP computer science course in 2017–2018, which is 10 more schools than the previous year.
• 76 female students (19%) took an AP CS exam in 2018, compared to 58 (17%) in 2017.
• 41 underrepresented minority students (10%) took an AP CS exam in 2018, compared to 30 (9%) in 2017.
• 459 bachelor’s degrees in computer science were earned in 2017; 14% were female.
Iowa

State Summaries 67
1 2 3
7 8 9
4 5 6
State Plan Standards Funding
In Progress Yes No
Certification PreserviceTeacher Prep
StateSupervisor
Yes No In Progress
Require HSto O�er
Core GradCredit
Higher EdAdmission
No Yes
Refer to advocacy.code.org for additional up-to-date information.
DistrictDecision
Updates• The development of a state plan for computer science is in progress.
• The state is in the process of developing a state leadership position for computer science.
• The state adopted K–12 computer science standards in February 2019.
Data • In the 2017–2018 school year, 39% of high schools taught at least one
computer science course.
• 98 schools (37% of schools with AP programs) o�ered an audited AP computer science course in 2017–2018, which is 37 more schools than the previous year.
• 375 female students (28%) took an AP CS exam in 2018, compared to 260 (28%) in 2017.
• 98 underrepresented minority students (7%) took an AP CS exam in 2018, compared to 82 (9%) in 2017.
• 524 bachelor’s degrees in computer science were earned in 2017; 19% were female.
Kentucky
1 2 3
7 8 9
4 5 6
State Plan Standards Funding
In Progress Yes No
Certification PreserviceTeacher Prep
StateSupervisor
No No No
Require HSto O�er
Core GradCredit
Higher EdAdmission
No No No
Refer to advocacy.code.org for additional up-to-date information.
Updates• The Department of Education convened a Computer Science Task Force
to develop a state plan and make recommendations to the State Board of Education in 2019.
• The state adopted preK–12 computer science standards in April 2019.
Data • In the 2017–2018 school year, 26% of high schools taught at least
one computer science course.
• 24 schools (17% of schools with AP programs) o�ered an auditedAP computer science course in 2017–2018, which is 11 more schools than the previous year.
• 16 female students (11%) took an AP CS exam in 2018, compared to 9 (16%) in 2017.
• 13 underrepresented minority students (9%) took an AP CS exam in 2018, compared to 2 (3%) in 2017.
• 435 bachelor’s degrees in computer science were earned in 2017; 10% were female.
Kansas

State Summaries68
1 2 3
7 8 9
4 5 6
State Plan Standards Funding
No No No
Certification PreserviceTeacher Prep
StateSupervisor
Yes No No
Require HSto O�er
Core GradCredit
Higher EdAdmission
No Math Yes
Refer to advocacy.code.org for additional up-to-date information.
Data • In the 2018–2019 school year, 23% of high schools taught at least one
computer science course, compared to 15% in 2017–2018.
• 43 schools (15% of schools with AP programs) o�ered an auditedAP computer science course in 2017–2018, which is 6 more schools than the previous year.
• 151 female students (28%) took an AP CS exam in 2018, compared to 118 (31%) in 2017.
• 143 underrepresented minority students (27%) took an AP CS exam in 2018, compared to 126 (33%) in 2017.
• 455 bachelor’s degrees in computer science were earned in 2017; 24% were female.
Louisiana
1 2 3
7 8 9
4 5 6
State Plan Standards Funding
In Progress No No
Certification PreserviceTeacher Prep
StateSupervisor
No No No
Require HSto O�er
Core GradCredit
Higher EdAdmission
No No No
Refer to advocacy.code.org for additional up-to-date information.
Updates• The state department of education has two full-time positions who
provide support, technical assistance, and guidance for computer science initiatives.
• In 2019, the legislature passed a resolution (LD 1382) that directed the Department of Education to study and develop a state plan for computer science instruction; that plan is now under development.
Data • 30 schools (22% of schools with AP programs) o�ered an audited
AP computer science course in 2017–2018, which is 7 more schools than the previous year.
• 79 female students (23%) took an AP CS exam in 2018, compared to 49 (20%) in 2017.
• 12 underrepresented minority students (3%) took an AP CS exam in 2018, compared to 13 (5%) in 2017.
• 119 bachelor’s degrees in computer science were earned in 2017; 16% were female.
Maine

State Summaries 69
1 2 3
7 8 9
4 5 6
State Plan Standards Funding
In Progress Yes Yes
Certification PreserviceTeacher Prep
StateSupervisor
Yes Yes Yes
Require HSto O�er
Core GradCredit
Higher EdAdmission
No Yes
Refer to advocacy.code.org for additional up-to-date information.
Math &Science
Updates• The state is currently developing a plan for computer science education.
• The state approves programs at institutions of higher education that prepare preservice teachers to teach computer science and lists those programs publicly.
• The state allocated $1M in the FY 2020 budget for the implementation of a state plan to establish and promote digital literacy and computer science education.
• Massachusetts is a member of the ECEP Alliance.
Data • In the 2017–2018 school year, 67% of high schools taught at least one
computer science course, compared to 58% in 2016–2017.
• 196 schools (43% of schools with AP programs) o�ered an auditedAP computer science course in 2017–2018, which is 28 more schools than the previous year.
• 1,119 female students (27%) took an AP CS exam in 2018, compared to 822 (24%) in 2017.
• 603 underrepresented minority students (14%) took an AP CS exam in 2018, compared to 552 (16%) in 2017.
• 2,641 bachelor’s degrees in computer science were earned in 2017; 25% were female.
Massachusetts
1 2 3
7 8 9
4 5 6
State Plan Standards Funding
Yes Yes Yes
Certification PreserviceTeacher Prep
StateSupervisor
Yes Yes Yes
Require HSto O�er
Core GradCredit
Higher EdAdmission
HS Yes
Refer to advocacy.code.org for additional up-to-date information.
Math &Technology
Updates• The Maryland Center for Computing Education published a state
implementation plan for computer science in August 2019.
• The State Board approved K–12 computer science standards in September 2018.
• The state allocated $1M for the computer science education initiative for FY 2020.
• Governor Larry Hogan is a member of the Governors’ Partnership for K–12 Computer Science.
• Maryland is a member of the ECEP Alliance.
Data • In the 2018–2019 school year, 62% of high schools taught at least one
computer science course.
• 170 schools (47% of schools with AP programs) o�ered an auditedAP computer science course in 2017–2018, which is 20 more schools than the previous year.
• 1,833 female students (33%) took an AP CS exam in 2018, compared to 1,356 (31%) in 2017.
• 1,134 underrepresented minority students (20%) took an AP CS exam in 2018, compared to 926 (21%) in 2017.
• 3,422 bachelor’s degrees in computer science were earned in 2017; 22% were female.
Maryland

State Summaries70
1 2 3
7 8 9
4 5 6
State Plan Standards Funding
No Yes Other
Certification PreserviceTeacher Prep
StateSupervisor
No Yes No
Require HSto O�er
Core GradCredit
Higher EdAdmission
No No
Refer to advocacy.code.org for additional up-to-date information.
Math &Science
Updates• The state adopted K–12 computer science standards in May 2019.
Data • 153 schools (23% of schools with AP programs) o�ered an audited
AP computer science course in 2017–2018, which is 68 more schools than the previous year.
• 762 female students (26%) took an AP CS exam in 2018, compared to 401 (24%) in 2017.
• 192 underrepresented minority students (7%) took an AP CS exam in 2018, compared to 87 (5%) in 2017.
• 2,103 bachelor’s degrees in computer science were earned in 2017; 17% were female.
Michigan
1 2 3
7 8 9
4 5 6
State Plan Standards Funding
No No No
Certification PreserviceTeacher Prep
StateSupervisor
No No In Progress
Require HSto O�er
Core GradCredit
Higher EdAdmission
No No
Refer to advocacy.code.org for additional up-to-date information.
Math
Updates• Minnesota is a member of the ECEP Alliance.
Data • 65 schools (21% of schools with AP programs) o�ered an audited
AP computer science course in 2017–2018, which is 6 more schools than the previous year.
• 304 female students (21%) took an AP CS exam in 2018, compared to 242 (20%) in 2017.
• 128 underrepresented minority students (9%) took an AP CS exam in 2018, compared to 87 (7%) in 2017.
• 1,236 bachelor’s degrees in computer science were earned in 2017; 17% were female.
Minnesota

State Summaries 71
1 2 3
7 8 9
4 5 6
State Plan Standards Funding
No Yes Yes
Certification PreserviceTeacher Prep
StateSupervisor
Yes No No
Require HSto O�er
Core GradCredit
Higher EdAdmission
NoMath, Science,& Practical Arts No
Refer to advocacy.code.org for additional up-to-date information.
Updates• The state adopted K–12 computer science standards in May 2019.• HB 3 (2018 special session) created a Computer Science Education Fund,
and HB 2 (2019) allocated $450K to the fund for FY 2020. • The Department of Elementary and Secondary Education created a
certification in computer science and developed guidance on teaching qualifications, allowing teachers who complete approved professional development to teach computer science.
• A computer science course can count towards a mathematics, science, or practical arts graduation credit.
• Governor Michael Parson is a member of the Governors’ Partnership for K–12 Computer Science.
Data • In the 2018–2019 school year, 38% of high schools taught at least one
computer science course, compared to 32% in 2017–2018.• 80 schools (25% of schools with AP programs) o�ered an audited
AP computer science course in 2017–2018, which is 11 more schools than the previous year.
• 171 female students (21%) took an AP CS exam in 2018, compared to 129 (20%) in 2017.
• 73 underrepresented minority students (9%) took an AP CS exam in 2018, compared to 64 (10%) in 2017.
• 1,378 bachelor’s degrees in computer science were earned in 2017; 18% were female.
Missouri
1 2 3
7 8 9
4 5 6
State Plan Standards Funding
No Yes Yes
Certification PreserviceTeacher Prep
StateSupervisor
Yes No No
Require HSto O�er
Core GradCredit
Higher EdAdmission
No Yes
Refer to advocacy.code.org for additional up-to-date information.
ComputerScience
Updates• HB 1643 (2019) allocated $300K for the development of computer
science courses and professional development.
• Mississippi is a member of the ECEP Alliance.
Data • In the 2018–2019 school year, 47% of high schools taught at least
one computer science course, compared to 28% in 2017–2018.
• 20 schools (10% of schools with AP programs) o�ered an auditedAP computer science course in 2017–2018, which is 7 more schools than the previous year.
• 65 female students (34%) took an AP CS exam in 2018, compared to 24 (23%) in 2017.
• 40 underrepresented minority students (21%) took an AP CS exam in 2018, compared to 23 (22%) in 2017.
• 207 bachelor’s degrees in computer science were earned in 2017; 16% were female.
Mississippi

State Summaries72
1 2 3
7 8 9
4 5 6
State Plan Standards Funding
No In Progress No
Certification PreserviceTeacher Prep
StateSupervisor
Yes Yes No
Require HSto O�er
Core GradCredit
Higher EdAdmission
NoDistrict
Decision No
Refer to advocacy.code.org for additional up-to-date information.
Updates• The state began development of K–12 computer science standards in
July 2018.
• The state passed a permissive and encouraging policy to allow computer science to count as a science, mathematics, elective, or CTE graduation requirement. Alternatively, a district may increase the local requirements in math, science, or career and technical education and allow a computer science course to fulfill one of the required credits, or require all students to complete a computer science credit.
• Governor Steve Bullock is a member of the Governors’ Partnership for K–12 Computer Science.
Data • In the 2018–2019 school year, 45% of high schools taught at least one
computer science course, compared to 40% in 2017–2018.
• 6 schools (6% of schools with AP programs) o�ered an audited AP computer science course in 2017–2018, which is 4 more schools than the previous year.
• 7 female students (18%) took an AP CS exam in 2018, compared to 2 (15%) in 2017.
• 1 underrepresented minority student (3%) took an AP CS exam in 2018, compared to 2 (15%) in 2017.
• 99 bachelor’s degrees in computer science were earned in 2017; 11% were female.
Montana
1 2 3
7 8 9
4 5 6
State Plan Standards Funding
In Progress No No
Certification PreserviceTeacher Prep
StateSupervisor
No No No
Require HSto O�er
Core GradCredit
Higher EdAdmission
No NoDistrict
Decision
Refer to advocacy.code.org for additional up-to-date information.
Updates• The state plan under development by the Department of Education is
slated for adoption in Fall 2019.
• In 2018, Nebraska created a pathway for middle and high school computer science teachers under a Business, Marketing, and Information Technology Endorsement and an Information Technology Supplemental Endorsement.
• The Commissioner of Education sent a letter to school district superintendents in December 2018 clarifying that computer science can count towards the 80 core curriculum hours required for graduation (under CTE).
Data • In the 2017–2018 school year, 40% of high schools taught at least one
computer science course.
• 29 schools (32% of schools with AP programs) o�ered an audited AP computer science course in 2017–2018, which is 10 more schools than the previous year.
• 33 female students (14%) took an AP CS exam in 2018, compared to 15 (10%) in 2017.
• 23 underrepresented minority students (10%) took an AP CS exam in 2018, compared to 12 (8%) in 2017.
• 539 bachelor’s degrees in computer science were earned in 2017; 17% were female.
Nebraska

State Summaries 73
1 2 3
7 8 9
4 5 6
State Plan Standards Funding
Yes Yes No
Certification PreserviceTeacher Prep
StateSupervisor
Yes No Yes
Require HSto O�er
Core GradCredit
Higher EdAdmission
ES, MS, HS No
Refer to advocacy.code.org for additional up-to-date information.
DistrictDecision
Updates• The state updated certification pathways and computer science educator
standards, providing teachers with five pathways to certification. One of the pathways requires teachers to pass a national exam; another allows teachers with a computer science teaching assignment prior to June 30, 2019 to apply for the certification; and a third allows teachers to submit to the department evidence of skills, knowledge, and competencies, such as coursework, professional experience, letters of recommendation, professional development, or other artifacts.
• New Hampshire is a member of the ECEP Alliance.
Data • In the 2018–2019 school year, 49% of high schools taught at least one
computer science course.
• 28 schools (24% of schools with AP programs) o�ered an auditedAP computer science course in 2017–2018, which is 8 more schools than the previous year.
• 111 female students (27%) took an AP CS exam in 2018, compared to 42 (18%) in 2017.
• 12 underrepresented minority students (3%) took an AP CS exam in 2018, compared to 8 (3%) in 2017.
• 586 bachelor’s degrees in computer science were earned in 2017; 19% were female.
New Hampshire
1 2 3
7 8 9
4 5 6
State Plan Standards Funding
Yes Yes Yes
Certification PreserviceTeacher Prep
StateSupervisor
Yes Yes Yes
Require HSto O�er
Core GradCredit
Higher EdAdmission
ES, HS Yes
Refer to advocacy.code.org for additional up-to-date information.
Math, Science,& Computer Ed
and Tech
Updates• The Department of Education created the Computer Science
Strategic Plan.• SB 313 (2019) allocated $933K and $700K for computer science
education in FY 2020 and 2021, respectively.• The state created two endorsement pathways in 2018 and SB 313 (2019)
authorized teachers receiving one of the endorsements to request reimbursement.
• SB 313 (2019) required all preservice educators to be trained in computer science and computer literacy. The bill also allowed the Board of Regents to apply for a grant to develop curriculum and standards for preservice educators.
• Nevada is a member of the ECEP Alliance.
Data • In the 2018–2019 school year, 57% of high schools taught at least one
computer science course.• 31 schools (25% of schools with AP programs) o�ered an audited
AP computer science course in 2017–2018, which is 4 more schools than the previous year.
• 292 female students (33%) took an AP CS exam in 2018, compared to 126 (26%) in 2017.
• 325 underrepresented minority students (37%) took an AP CS exam in 2018, compared to 147 (30%) in 2017.
• 163 bachelor’s degrees in computer science were earned in 2017; 25% were female.
Nevada

State Summaries74
1 2 3
7 8 9
4 5 6
State Plan Standards Funding
No Yes Yes
Certification PreserviceTeacher Prep
StateSupervisor
Yes No No
Require HSto O�er
Core GradCredit
Higher EdAdmission
HS No
Refer to advocacy.code.org for additional up-to-date information.
Math &Science
Updates• The Secondary School Computer Science Education Initiative was
renewed with $2M appropriated for FY 2020 (SB 2500).
• Governor Phil Murphy is a member of the Governors’ Partnership for K–12 Computer Science.
Data • In the 2018–2019 school year, 59% of high schools taught at least one
computer science course.
• 253 schools (44% of schools with AP programs) o�ered an audited AP computer science course in 2017–2018, which is 34 more schools than the previous year.
• 1,856 female students (28%) took an AP CS exam in 2018, compared to 1,374 (26%) in 2017.
• 1,000 underrepresented minority students (15%) took an AP CS exam in 2018, compared to 766 (15%) in 2017.
• 1,642 bachelor’s degrees in computer science were earned in 2017; 17% were female.
New Jersey
1 2 3
7 8 9
4 5 6
State Plan Standards Funding
No Yes Yes
Certification PreserviceTeacher Prep
StateSupervisor
No No No
Require HSto O�er
Core GradCredit
Higher EdAdmission
No No
Refer to advocacy.code.org for additional up-to-date information.
Math &Science
Updates• The state adopted K–12 Computer Science Standards in December 2018.
• The legislature allocated $200K per year for FY 2019 and 2020 (HB 548) to develop and implement teacher professional development.
Data • In the 2018–2019 school year, 23% of high schools taught at least one
computer science course.
• 21 schools (16% of schools with AP programs) o�ered an audited AP computer science course in 2017–2018, which is 3 more schools than the previous year.
• 44 female students (22%) took an AP CS exam in 2018, compared to 49 (29%) in 2017.
• 97 underrepresented minority students (48%) took an AP CS exam in 2018, compared to 69 (41%) in 2017.
• 169 bachelor’s degrees in computer science were earned in 2017; 19% were female.
New Mexico

State Summaries 75
1 2 3
7 8 9
4 5 6
State Plan Standards Funding
Yes In Progress Yes
Certification PreserviceTeacher Prep
StateSupervisor
Yes No Yes
Require HSto O�er
Core GradCredit
Higher EdAdmission
No Math No
Refer to advocacy.code.org for additional up-to-date information.
Updates• The state is developing K–12 computer science standards as required by
HB 155 (2017).
• The Department of Public Instruction created a Computer Science Director position.
• Governor Roy Cooper is a member of the Governors’ Partnership for K–12 Computer Science.
• North Carolina is a member of the ECEP Alliance.
Data • In the 2017–2018 school year, 45% of high schools taught at least one
computer science course.
• 117 schools (18% of schools with AP programs) o�ered an audited AP computer science course in 2017–2018, which is 22 more schools than the previous year.
• 882 female students (27%) took an AP CS exam in 2018, compared to 587 (24%) in 2017.
• 471 underrepresented minority students (15%) took an AP CS exam in 2018, compared to 349 (14%) in 2017.
• 1,561 bachelor’s degrees in computer science were earned in 2017; 20% were female.
North Carolina
1 2 3
7 8 9
4 5 6
State Plan Standards Funding
No In Progress Yes
Certification PreserviceTeacher Prep
StateSupervisor
Yes No No
Require HSto O�er
Core GradCredit
Higher EdAdmission
No No
Refer to advocacy.code.org for additional up-to-date information.
DistrictDecision
Updates• The state is developing K–12 computer science standards as required by
A 9506 (2018).
• The legislature allocated $6M in FY 2020 for the Smart Start program to expand computer science education
Data • In the 2017–2018 school year, 44% of high schools taught at least one
computer science course, compared to 38% in 2016–2017.
• 407 schools (35% of schools with AP programs) o�ered an audited AP computer science course in 2017–2018, which is 68 more schools than the previous year.
• 3,601 female students (35%) took an AP CS exam in 2018, compared to 2,578 (32%) in 2017.
• 2,664 underrepresented minority students (26%) took an AP CS exam in 2018, compared to 1,846 (23%) in 2017.
• 5,232 bachelor’s degrees in computer science were earned in 2017; 21% were female.
New York

State Summaries76
1 2 3
7 8 9
4 5 6
State Plan Standards Funding
No Yes No
Certification PreserviceTeacher Prep
StateSupervisor
Yes No No
Require HSto O�er
Core GradCredit
Higher EdAdmission
No Math No
Refer to advocacy.code.org for additional up-to-date information.
Updates• The state adopted K–12 computer science and cybersecurity standards
in February 2019, becoming the first state to create K–12 cybersecurity standards.
• SB 2171 (2019) gave the Department of Public Instruction the ability to credential computer and cyber science teachers.
• Governor Doug Burgum is a member of the Governors’ Partnership for K–12 Computer Science.
Data • In the 2018–2019 school year, 41% of high schools taught at least one
computer science course, compared to 23% in 2017–2018.
• 12 schools (22% of schools with AP programs) o�ered an audited AP computer science course in 2017–2018, which is 2 more schools than the previous year.
• 6 female students (9%) took an AP CS exam in 2018, compared to 11 (11%) in 2017.
• 4 underrepresented minority students (6%) took an AP CS exam in 2018, compared to 6 (6%) in 2017.
• 162 bachelor’s degrees in computer science were earned in 2017; 10% were female.
North Dakota
1 2 3
7 8 9
4 5 6
State Plan Standards Funding
No Yes Yes
Certification PreserviceTeacher Prep
StateSupervisor
Yes Yes Yes
Require HSto O�er
Core GradCredit
Higher EdAdmission
No NoMath, Science,
& ForeignLanguage
Refer to advocacy.code.org for additional up-to-date information.
Updates• The State Board of Education adopted K–12 computer science standards
and a model curriculum in December 2018.• HB 166 (2019) appropriated $1.5M for FY 2020 for teachers to take
coursework and content exams to become credentialed to teach computer science.
• The state temporarily revised teacher certification requirements, allowing licensed 7–12 teachers who completed approved professional development to teach computer science until 2021.
• The Department of Education created a Computer Science Education Program Specialist position.
• The state added computer science to the list of courses students can count towards the foreign language or elective credits required for graduation.
• Ohio is a member of the ECEP Alliance.
Data • 141 schools (19% of schools with AP programs) o�ered an audited
AP computer science course in 2017–2018, which is 10 more schools than the previous year.
• 621 female students (23%) took an AP CS exam in 2018, compared to 521 (24%) in 2017.
• 308 underrepresented minority students (11%) took an AP CS exam in 2018, compared to 171 (8%) in 2017.
• 1,462 bachelor’s degrees in computer science were earned in 2017; 15% were female.
Ohio

State Summaries 77
1 2 3
7 8 9
4 5 6
State Plan Standards Funding
No No No
Certification PreserviceTeacher Prep
StateSupervisor
No No No
Require HSto O�er
Core GradCredit
Higher EdAdmission
No No
Refer to advocacy.code.org for additional up-to-date information.
DistrictDecision
Updates• Oregon is a member of the ECEP Alliance.
Data • In the 2017–2018 school year, 37% of high schools taught at least one
computer science course, compared to 31% in 2016–2017.
• 32 schools (14% of schools with AP programs) o�ered an audited AP computer science course in 2017–2018, which is 7 more schools than the previous year.
• 184 female students (24%) took an AP CS exam in 2018, compared to 86 (20%) in 2017.
• 66 underrepresented minority students (9%) took an AP CS exam in 2018, compared to 34 (8%) in 2017.
• 834 bachelor’s degrees in computer science were earned in 2017; 19% were female.
Oregon
1 2 3
7 8 9
4 5 6
State Plan Standards Funding
No Yes No
Certification PreserviceTeacher Prep
StateSupervisor
Yes No Yes
Require HSto O�er
Core GradCredit
Higher EdAdmission
No No
Refer to advocacy.code.org for additional up-to-date information.
Math & Tech/World Lang.
Updates• Although the state does not require all schools to o�er computer
science, SB 593 (2019) directed the State Department of Education to develop a rubric for computer science programs in elementary, middle, and high schools to serve as a guide to schools for implementing quality computer science programs. The bill also authorized the department to create a grant program for computer science professional learning and recommended $1M subject to authorization, although no funds were appropriated for the program.
• The Department of Education created a Director of Education Technology and Computer Science Education position.
Data • In the 2017–2018 school year, 29% of high schools taught at least one
computer science course.
• 56 schools (19% of schools with AP programs) o�ered an auditedAP computer science course in 2017–2018, which is 27 more schools than the previous year.
• 109 female students (21%) took an AP CS exam in 2018, compared to 80 (22%) in 2017.
• 99 underrepresented minority students (19%) took an AP CS exam in 2018, compared to 64 (18%) in 2017.
• 510 bachelor’s degrees in computer science were earned in 2017; 15% were female.
Oklahoma

State Summaries78
1 2 3
7 8 9
4 5 6
State Plan Standards Funding
No Yes Yes
Certification PreserviceTeacher Prep
StateSupervisor
No Yes Yes
Require HSto O�er
Core GradCredit
Higher EdAdmission
No No
Refer to advocacy.code.org for additional up-to-date information.
Math &Science
Updates• The state funded PAsmart for a second year in FY 2020 with dedicated
funding for expanding STEM and computer science education, including teacher professional development.
• The Department of Education developed specific program guidelines for state approval of professional educator programs in computer science.
• The Department of Education has a position focused on computer science.
• Governor Tom Wolf is a member of the Governors’ Partnership for K–12 Computer Science.
Data • In the 2018–2019 school year, 56% of high schools taught at least one
computer science course.
• 240 schools (30% of schools with AP programs) o�ered an audited AP computer science course in 2017–2018, which is 34 more schools than the previous year.
• 925 female students (23%) took an AP CS exam in 2018, compared to 666 (22%) in 2017.
• 309 underrepresented minority students (8%) took an AP CS exam in 2018, compared to 232 (8%) in 2017.
• 3,769 bachelor’s degrees in computer science were earned in 2017; 22% were female.
Pennsylvania
1 2 3
7 8 9
4 5 6
State Plan Standards Funding
Yes Yes Yes
Certification PreserviceTeacher Prep
StateSupervisor
No No No
Require HSto O�er
Core GradCredit
Higher EdAdmission
No No
Refer to advocacy.code.org for additional up-to-date information.
Math &Science
Updates• The FY 2020 budget allocated $210K for computer science professional
development.
• Governor Gina Raimondo is a member of the Governors’ Partnership for K–12 Computer Science.
• Rhode Island is a member of the ECEP Alliance.
Data • In the 2017–2018 school year, 86% of high schools taught at least one
computer science course, compared to 85% in 2016–2017.
• 32 schools (44% of schools with AP programs) o�ered an audited AP computer science course in 2017–2018, which is 3 more schools than the previous year.
• 147 female students (28%) took an AP CS exam in 2018, compared to 77 (23%) in 2017.
• 80 underrepresented minority students (15%) took an AP CS exam in 2018, compared to 32 (9%) in 2017.
• 442 bachelor’s degrees in computer science were earned in 2017; 25% were female.
Rhode Island

State Summaries 79
1 2 3
7 8 9
4 5 6
State Plan Standards Funding
No No No
Certification PreserviceTeacher Prep
StateSupervisor
No No No
Require HSto O�er
Core GradCredit
Higher EdAdmission
No Science No
Refer to advocacy.code.org for additional up-to-date information.
Updates• The State Board of Education approved changes to the diploma
requirements in 2018, allowing students who earn a regular diploma to substitute a state-approved advanced computer science course for a science requirement.
Data • 2 schools (3% of schools with AP programs) o�ered an audited
AP computer science course in 2017–2018, which is 2 fewer than the previous year.
• 4 female students (21%) took an AP CS exam in 2018, compared to 3 (9%) in 2017.
• 3 underrepresented minority students (16%) took an AP CS exam in 2018, compared to 1 (3%) in 2017.
• 213 bachelor’s degrees in computer science were earned in 2017; 15% were female.
South Dakota
1 2 3
7 8 9
4 5 6
State Plan Standards Funding
In Progress Yes Yes
Certification PreserviceTeacher Prep
StateSupervisor
Yes No No
Require HSto O�er
Core GradCredit
Higher EdAdmission
HS Yes
Refer to advocacy.code.org for additional up-to-date information.
ComputerScience
Updates• The Department of Education has a state plan for high school
computer science and is expanding the plan to span K–12.
• The FY 2020 budget allocated $500K to teacher professional development.
• South Carolina is a member of the ECEP Alliance.
Data • In the 2018–2019 school year, 69% of high schools taught at least
one computer science course, compared to 43% in 2017–2018.
• 55 schools (19% of schools with AP programs) o�ered an audited AP computer science course in 2017–2018, which is 7 more schools than the previous year.
• 301 female students (29%) took an AP CS exam in 2018, compared to 214 (28%) in 2017.
• 250 underrepresented minority students (24%) took an AP CS exam in 2018, compared to 130 (17%) in 2017.
• 689 bachelor’s degrees in computer science were earned in 2017; 18% were female.
South Carolina

State Summaries80
1 2 3
7 8 9
4 5 6
State Plan Standards Funding
In Progress No No
Certification PreserviceTeacher Prep
StateSupervisor
Yes No No
Require HSto O�er
Core GradCredit
Higher EdAdmission
No Math No
Refer to advocacy.code.org for additional up-to-date information.
Updates• HB 1339/SB 1151 (2019) required the development of a state plan by
May 2020.
Data • 63 schools (16% of schools with AP programs) o�ered an audited
AP computer science course in 2017–2018, which is 13 more schools than the previous year.
• 389 female students (31%) took an AP CS exam in 2018, compared to 274 (29%) in 2017.
• 271 underrepresented minority students (21%) took an AP CS exam in 2018, compared to 188 (20%) in 2017.
• 734 bachelor’s degrees in computer science were earned in 2017; 17% were female.
Tennessee
1 2 3
7 8 9
4 5 6
State Plan Standards Funding
In Progress No Other
Certification PreserviceTeacher Prep
StateSupervisor
Yes Yes No
Require HSto O�er
Core GradCredit
Higher EdAdmission
HS Yes
Refer to advocacy.code.org for additional up-to-date information.
Math, Science,& ForeignLanguage
Updates• HB 2984 (2019) required the development of a strategic advisory
committee to present a report by September 2020 and directed the State Board to review and modify the K–8 Technology Applications TEKS (Texas Essential Knowledge and Skills) to include coding and computational thinking by the end of 2020.
• Although funding is not directly allocated to computer science professional learning, HB 3 and HB 963 (2019) consolidated all computer science (or Technology Applications) courses into Career and Technical Education and allowed schools to receive weighted funding for students enrolled in computer science courses.
• Texas is a member of the ECEP Alliance.
Data • 462 schools (25% of schools with AP programs) o�ered an audited
AP computer science course in 2017–2018, which is 63 more schools than the previous year.
• 3,044 female students (27%) took an AP CS exam in 2018, compared to 2,378 (27%) in 2017.
• 3,532 underrepresented minority students (31%) took an AP CS exam in 2018, compared to 2,722 (30%) in 2017.
• 3,563 bachelor’s degrees in computer science were earned in 2017; 19% were female.
Texas

State Summaries 81
1 2 3
7 8 9
4 5 6
State Plan Standards Funding
No No No
Certification PreserviceTeacher Prep
StateSupervisor
Yes Yes No
Require HSto O�er
Core GradCredit
Higher EdAdmission
NoDistrict
Decision No
Refer to advocacy.code.org for additional up-to-date information.
Updates• The state passed a permissive and encouraging policy to allow
computer science to count towards a core graduation requirement, but it is a district decision.
Data • In the 2018–2019 school year, 27% of high schools taught at least one
computer science course.
• 11 schools (16% of schools with AP programs) o�ered an audited AP computer science course in 2017–2018, which is one fewer than the previous year.
• 16 female students (12%) took an AP CS exam in 2018, compared to 25 (20%) in 2017.
• 4 underrepresented minority students (3%) took an AP CS exam in 2018, compared to 4 (3%) in 2017.
• 266 bachelor’s degrees in computer science were earned in 2017; 16% were female.
Vermont
1 2 3
7 8 9
4 5 6
State Plan Standards Funding
Yes Yes Yes
Certification PreserviceTeacher Prep
StateSupervisor
Yes Yes Yes
Require HSto O�er
Core GradCredit
Higher EdAdmission
No No
Refer to advocacy.code.org for additional up-to-date information.
Math &Science
Updates• The Utah Computer Science Education Master Plan was adopted in
July 2019.• The State Board of Education adopted a framework for K–12 computer
science standards in 2018 and is slated to approve K–5 grade-level standards in October 2019. The State Board of Education will begin development of 6–12 grade-level standards in September 2019.
• HB 227 (2019) allocated $3.15M for the Computer Science for Utah Grant Program per year for FY 2020 and 2021. This funding established a full-time Computer Science State Specialist.
• The Community Foundation of Utah and the Silicon Slopes community created a fund to invest in initiatives outlined in the state plan.
• Governor Gary Herbert is a member of the Governors’ Partnership for K–12 Computer Science.
• Utah is a member of the ECEP Alliance.
Data • In the 2018–2019 school year, 66% of high schools taught at least one
computer science course, compared to 58% in 2017–2018.• 32 schools (16% of schools with AP programs) o�ered an audited
AP computer science course in 2017–2018, which is one fewer than the previous year.
• 87 female students (23%) took an AP CS exam in 2018, compared to 68 (17%) in 2017.
• 70 underrepresented minority students (19%) took an AP CS exam in 2018, compared to 36 (9%) in 2017.
• 1080 bachelor’s degrees in computer science were earned in 2017; 13% were female.
Utah

State Summaries82
1 2 3
7 8 9
4 5 6
State Plan Standards Funding
No Yes Yes
Certification PreserviceTeacher Prep
StateSupervisor
Yes Yes Yes
Require HSto O�er
Core GradCredit
Higher EdAdmission
ES, MS, HS No
Refer to advocacy.code.org for additional up-to-date information.
Math, Science,& CTE
Updates• The state allocated $550K per year for FY 2019 and 2020 for
K–12 computer science professional development.
• HB 2217/SB 1419 (2019) established a micro-credential program in science, technology, engineering, and mathematics (STEM) endorsement areas, including computer science.
• Governor Ralph Northam is a member of the Governors’ Partnership for K–12 Computer Science.
• Virginia is a member of the ECEP Alliance.
Data • In the 2017–2018 school year, 66% of high schools taught at least one
computer science course, compared to 63% in 2016–2017.
• 158 schools (34% of schools with AP programs) o�ered an audited AP computer science course in 2017–2018, which is 24 more schools than the previous year.
• 1,341 female students (27%) took an AP CS exam in 2018, compared to 1,121 (26%) in 2017.
• 720 underrepresented minority students (14%) took an AP CS exam in 2018, compared to 600 (14%) in 2017.
• 1,865 bachelor’s degrees in computer science were earned in 2017; 19% were female.
Virginia
1 2 3
7 8 9
4 5 6
State Plan Standards Funding
No Yes Yes
Certification PreserviceTeacher Prep
StateSupervisor
Yes Yes Yes
Require HSto O�er
Core GradCredit
Higher EdAdmission
HS Yes
Refer to advocacy.code.org for additional up-to-date information.
Math &Science
Updates• The 2019–2021 budget (HB 1109) appropriated $1M per year over
the biennium for the computer science education grant program. The program required a one-to-one private match.
• SB 5088 (2019) required that each school district that operates a high school must provide access to an elective computer science course by the 2022–2023 school year.
• HB 1577 (2019) required each school district to report the number of computer science course o�erings and demographics of the students who are enrolled in the courses, starting in June 2020.
• Governor Jay Inslee is the co-chair of the Governors’ Partnership for K–12 Computer Science.
• Washington is a member of the ECEP Alliance.
Data • 155 schools (36% of schools with AP programs) o�ered an audited
AP computer science course in 2017–2018, which is 20 more schools than the previous year.
• 817 female students (27%) took an AP CS exam in 2018, compared to 749 (28%) in 2017.
• 313 underrepresented minority students (10%) took an AP CS exam in 2018, compared to 259 (10%) in 2017.
• 1,700 bachelor’s degrees in computer science were earned in 2017; 24% were female.
Washington

State Summaries 83
1 2 3
7 8 9
4 5 6
State Plan Standards Funding
No Yes No
Certification PreserviceTeacher Prep
StateSupervisor
Yes Yes No
Require HSto O�er
Core GradCredit
Higher EdAdmission
No Math No
Refer to advocacy.code.org for additional up-to-date information.
Updates• State statute requires each school board to provide an instructional
program designed to give students knowledge in computer science, including problem solving, computer applications, and the social impact of computers.
Data • In the 2018–2019 school year, 42% of high schools taught at least one
computer science course, compared to 34% in 2017–2018.
• 87 schools (17% of schools with AP programs) o�ered an audited AP computer science course in 2017–2018, which is 19 more schools than the previous year.
• 294 female students (20%) took an AP CS exam in 2018, compared to 172 (17%) in 2017.
• 107 underrepresented minority students (7%) took an AP CS exam in 2018, compared to 55 (5%) in 2017.
• 1,190 bachelor’s degrees in computer science were earned in 2017; 17% were female.
Wisconsin
1 2 3
7 8 9
4 5 6
State Plan Standards Funding
In Progress Yes No
Certification PreserviceTeacher Prep
StateSupervisor
Yes No No
Require HSto O�er
Core GradCredit
Higher EdAdmission
ES, MS, HS No
Refer to advocacy.code.org for additional up-to-date information.
Math &Science
Updates• SB 267 (2019) required the State Board to adopt a policy detailing the
appropriate level of computer science instruction that shall be available to students at each programmatic level prior to the 2020–2021 school year. The bill also required the Department of Education to develop and o�er professional development opportunities for teachers. The Department of Education is developing a state plan to meet these requirements.
• The state developed course-specific teacher certifications in 2019, each of which requires a minimum of 60 hours of professional development: the Permanent Authorization for Introduction to Computer Science and the Permanent Authorization for Computer Science Discoveries.
Data • In the 2018–2019 school year, 46% of high schools taught at least one
computer science course.• 25 schools (20% of schools with AP programs) o�ered an audited
AP computer science course in 2017–2018, which is 10 more schools than the previous year.
• 78 female students (31%) took an AP CS exam in 2018, compared to 88 (36%) in 2017.
• 9 underrepresented minority students (4%) took an AP CS exam in 2018, compared to 10 (4%) in 2017.
• 202 bachelor’s degrees in computer science were earned in 2017; 15% were female.
West Virginia

State Summaries84
1 2 3
7 8 9
4 5 6
State Plan Standards Funding
Yes In Progress Other
Certification PreserviceTeacher Prep
StateSupervisor
Yes No Yes
Require HSto O�er
Core GradCredit
Higher EdAdmission
ES, MS, HS Yes
Refer to advocacy.code.org for additional up-to-date information.
Math &Science
Updates• The state began development of K–12 computer science standards in July
2018 and is slated to adopt them later in 2019.
• The Department of Education hired a Math and Computer Science Consultant to lead the computer science e�orts.
• SF 29 (2018) required each school to include computer science and computational thinking by the 2022–2023 school year.
Data • In the 2018–2019 school year, 60% of high schools taught at least one
computer science course.
• 8 schools (19% of schools with AP programs) o�ered an audited AP computer science course in 2017–2018, which is 3 more schools than the previous year.
• 10 female students (26%) took an AP CS exam in 2018, compared to 5 (24%) in 2017.
• 3 underrepresented minority students (8%) took an AP CS exam in 2018, compared to 0 in 2017.
• 42 bachelor’s degrees in computer science were earned in 2017; 7% were female.
Wyoming

85
K–12 Computer Science Access ReportThe K–12 Computer Science Access Report, launched in September 2017, is a collaborative partnership between the Computer Science Teachers Association and Code.org to identify, on a school-by-school basis, where computer science courses are taught. This report provides a point-in-time view of computer science implementation in the U.S. So far, the initiative has collected data on 55% of all public K–12 schools and 83% of all public high schools. This is an increase of 13% across K–12 schools and 16% of public high schools reported last year. Based on this limited data, at least 33,376 public schools in the U.S. teach computer science (there are 100,729 public schools in the nation). Refer to code.org/yourschool for an interactive map of the most up-to-date data.

K–12 Computer Science Access Report86
The current data set includes elementary, middle, and high schools from every state with the most data
coming from public high schools (including public charter schools and any schools that offer at least one
high school grade). In order to provide an accurate portrayal of implementation, this chapter only reflects
public high schools and only states where data has been collected from all public high schools. Last year,
the report included data from 24 states; this year, it includes 39 states. These 39 states represent 65% of the
total number of public high schools in the nation.
Based on complete data sets from 18,091 public high schools in these 39 states, 45% of public high schools
teach computer science. From the 13 states with complete data sets for both the 2017–2018 and 2018–2019
school years, the percentage of public high schools teaching computer science has increased from 37% to
46%, or from 2,224 public high schools to 2,789 public high schools.
The first part of this chapter describes the methodology for data collection, including data sources, and
the methodology for determining which courses are computer science courses. The second part is
composed of graphs showing the percentage of high schools in a state teaching computer science, the
types of communities in which computer science is offered, student diversity and access, and income levels
and access. The next part of this chapter describes the relationship between policy and implementation.
The last part highlights five states that have successfully made gains in computer science access.
There are 39 states included in this report. New states added to the report this year are highlighted.
Alabama*
Alaska
Arkansas
California
Delaware
District of Columbia
Florida
Georgia
Hawaii
Illinois
Indiana
Iowa
Kansas*
Kentucky*
Louisiana
Maryland
Massachusetts
Mississippi
Missouri
Montana
Nebraska
Nevada
New Hampshire
New Jersey
New Mexico
New York
North Carolina*
North Dakota
Oklahoma*
Oregon
Pennsylvania
Rhode Island
South Carolina
Utah
Vermont
Virginia
West Virginia
Wisconsin
Wyoming
*States without new data; previous years’ data set is reported

K–12 Computer Science Access Report 87
Data Sources
Data Source Description
National Center for Education Statistics (NCES)
Database of schools in the country with demographic information including enrollment in Free and Reduced Lunch programs, student demographics, and grades offered. The most recently available 2017–2018 NCES list of schools is used for the overall number of schools.
School Courses for the Exchange of Data (SCED)
SCED is a common classification system for middle and high school courses. Some states use SCED for a course classification system.
State departments of education
School names, school IDs, course codes, course enrollment, and course descriptions
National organizations (e.g., the College Board, the International Baccalaureate)
School names, school IDs, course names, and course descriptions
District/school course catalogs Direct contact with school employees and school course catalogs for course names and descriptions
Survey responses Completed surveys about course offerings on Code.org and Hourofcode.com from teachers, administrators, and parents
Data from state education agencies was collected through direct collaboration or via requests submitted
through an online portal. State data included school codes, course codes, course descriptions, and course
enrollment. Data was collected throughout the school year, starting in fall 2018. States with complete data
sets are defined as those where all public high schools report their course offerings to the state department
of education, or where data was collected for every public high school via another method (see table above
for more detail).
School codes were cross-referenced with data from the National Center for Education Statistics (NCES) to
determine each school’s community type, underrepresented minority (URM) enrollment, and the percentage
of students receiving free and reduced lunch (FRL). The NCES uses four main categories for community type
(City, Suburban, Town, Rural) which can be reduced to two categories based on the U.S. Census Bureau
urban-rural classification: Urban (City, Suburban, and Town) and Rural. Race/ethnicity categories from the
NCES that we define as URM are Hispanic, American Indian/Alaska Native, Black or African American, and
Native Hawaiian or Other Pacific Islander. State departments of education and organizations interested in
providing statewide implementation data should contact [email protected].
Defining a Computer Science CourseThe following definition of computer science was developed by the Computer Science Teachers Association
(Tucker, 2003) and later reaffirmed in the K–12 Computer Science Framework:
Computer science is the study of computers and algorithms, including their principles, their hardware and
software designs, their implementation, and their impact on society.
Learning computer science means learning how to create new technologies, rather than simply using them.
Although many schools offer their students some exposure to computer science in a limited capacity such
as an Hour of Code, this report focuses on schools that teach a foundational computer science course.

K–12 Computer Science Access Report88
These are schools where students learn computer science during the school day (not in after school clubs)
and spend a minimum amount of time per semester applying learned concepts through programming (at
least 20 hours of programming for grades 9–12 high schools and at least 10 hours of programming for
K–8 elementary and middle schools). Although computer science is broader than programming, some
direct programming experience is integral to learning the fundamental concepts and is used as a defining
characteristic to differentiate foundational computer science courses from non-computer science courses.
Changes for this Year’s ReportIn last year’s report, the list of schools used in the denominator of all calculations was the set of all schools
available in either one or both of the NCES annual school databases published for the 2013–2014 and 2014–
2015 school years. This resulted in a slightly inflated number for the total number of schools in a state. This
year’s report includes only the most current list of schools published by the NCES, which is based on the
2017–2018 school year. This resulted in a decrease of 4% in the total number of schools for the 2017–2018
school year, which results in slightly different numbers from those reported in last year’s report.
This year, the SCED and state-level course catalogs were reexamined, and courses were added (or deleted)
based on course description. This resulted in the addition of three SCED courses and over 200 courses
across the states. These 200 courses were either new courses in the state catalog, new state course
descriptions that fit our definition, or courses aligned with the three additional SCED course codes.

K–12 Computer Science Access Report 89
Inferring Between YearsEach year, unless new data is provided, it is inferred that if a school taught computer science in the previous
year, the school is still teaching computer science. This ensures any data obtained from a school course
catalog or survey (and not reported from the state department of education or a national organization) is
carried forward to the new year.
State-by-State Data
Percent of Public High Schools Teaching Computer Science
A state is included in this map if data has been collected from all of the state’s public high schools.
66%
45% 41%
42%
58%
38%39%
62%
44%
78%
66%
23%
47% 38% 52%
30%
69%29%
37%
47%
67%
86%
57%
60%
23%
40%
37%
27%49%
56%
46%
59%
65%62%
26%
45%
19%
47%
0–24% 25–49%
50–74% 75–100%

K–12 Computer Science Access Report90
Public High Schools Teaching Computer Science (CS): Overall, By Community, By Underrepresented Minority, By Free and Reduced Lunch
A state is included in this table if data has been collected from almost all of the state’s public high schools.
Overall Implementation
Last Reported Year By Community Type
By Percent Underrepresented
Minorities
By Percent Free and Reduced Lunch
State % teaching CS Year Urban Rural Under 50% URM
Over 50% URM
Under 50% FRL
Over 50% FRL
Alaska 19% 2018 26% 18% 27% 13% 23% 15%Alabama 38% 2017 43% 36% 49% 45% 63% 40%Arkansas 78% 2018 72% 81% 88% 70% 89% 82%California 47% 2017 48% 27% 53% 40% 58% 39%District of Columbia 20% 2018 21% N/A 0% 20% 20% 21%Delaware 65% 2018 63% 79% 68% 72% 74% 0%Florida 30% 2018 35% 22% 36% 33% 32% 40%Georgia 52% 2018 64% 43% 60% 48% 81% 45%Hawaii 47% 2017 56% 40% 56% 39% 54% 44%Iowa 58% 2018 72% 55% 58% 78% 61% 48%Illinois 37% 2018 54% 23% 38% 49% 46% 37%Indiana 62% 2018 68% 59% 67% 65% 70% 59%Kansas 26% 2017 48% 21% 26% 36% 30% 21%Kentucky 39% 2017 44% 39% 42% 37% 55% 36%Louisiana 23% 2018 33% 18% 25% 24% 38% 19%Massachusetts 67% 2017 69% 66% 76% 48% 81% 49%Maryland 62% 2018 60% 75% 76% 51% 74% 44%Missouri 38% 2018 48% 34% 41% 46% 51% 34%Mississippi 47% 2018 58% 45% 58% 33% 55% 45%Montana 45% 2018 70% 44% 48% 26% 50% 34%North Carolina 45% 2017 48% 46% 50% 41% 58% 36%North Dakota 41% 2018 53% 40% 43% 38% 45% 25%Nebraska 40% 2017 64% 37% 44% 50% 44% 43%New Hampshire 49% 2018 38% 60% 49% N/A 50% 40%New Jersey 59% 2018 61% 60% 72% 44% 68% 47%New Mexico 23% 2018 27% 20% 30% 22% 31% 20%Nevada 57% 2018 63% 52% 60% 57% 57% 69%New York 44% 2017 43% 47% 57% 30% 57% 33%Oklahoma 29% 2017 52% 26% 30% 33% 34% 28%Oregon 37% 2017 51% 27% 37% 35% 48% 33%Pennsylvania 56% 2018 59% 52% 67% 39% 69% 46%Rhode Island 86% 2017 87% 88% 92% 81% 97% 79%South Carolina 69% 2018 74% 66% 82% 64% 82% 69%Utah 66% 2018 70% 56% 68% 52% 72% 51%Virginia 66% 2017 72% 59% 73% 58% 74% 56%Vermont 27% 2018 50% 25% 31% N/A 25% 30%Wisconsin 42% 2018 46% 40% 47% 21% 51% 31%West Virginia 46% 2018 41% 31% 39% N/A 59% 22%Wyoming 60% 2018 78% 63% 75% 40% 78% 53%

K–12 Computer Science Access Report 91
2017–2018 2018–2019
Growth in Implementation Rate
Only states reporting all public high school data for two consecutive school years are included.
*State lags one year behind in reporting. The comparison is between the 2016–2017 and 2017–2018 school years.
Percent of High Schools Teaching Computer Science
Across 39 states, 45% of public high schools
teach computer science.
Yes
No
Only
45% of high schools teach
computer science.
0%
20%
40%
60%
80%
100%
WIVA*UTSCRIOR*NDNY*MTMOMSMA*LAIAINGAFLCA*AR
Perc
ent
of H
igh
Scho
ols
Teac
hing
CS
State
Growth in Implementation RateOnly states reporting all public high school data for two consecutive school years are included.

K–12 Computer Science Access Report92
Community, Race/Ethnicity, and Socioeconomic Status and Access to Computer ScienceSchools in rural communities, schools with higher percentages of underrepresented minority students,
and schools with higher percentages of students receiving free and reduced lunch are less likely to teach
computer science.
Percent of High Schools Teaching Computer Science by Community Type
Percent of High Schools Teaching Computer Science by Community TypeStudents in rural communities have less access to computer science.
City Suburban Town Rural0%
10%
20%
30%
40%
50%
60% 58%
41%44%
40%
Perc
ent
of H
igh
Scho
ols
Teac
hing
CS
Community Type
Underrepresented Minority Students and Access to Computer Science
Underrepresented Minority Students and Access to Computer Science (CS)
0%
10%
20%
30%
40%
50%
60%53%
50%
44%
35%
0–25% 50%–75%25%–50% 75%–100%
Perc
ent
of H
igh
Scho
ols
Teac
hing
CS
Percent of URM Students in the School Population
Income Level and Access to Computer Science
Income Level and Access to Computer Science
Schools with higher percentages of students receiving free and reduced lunch are less likely to teach computer science.
62%
54%
44%
33%
0–25% 50%–75%25%–50% 75%–100%
Perc
ent
of H
igh
Scho
ols
Teac
hing
CS
Percent of Students in the School Eligiblefor Free and Reduced Lunch
0%
10%
20%
30%
40%
50%
60%
70%
80%

K–12 Computer Science Access Report 93
Policies and Access to Computer ScienceIndividually, many of the nine policies show a positive relationship with the percentage of high schools
teaching computer science. In addition, the total number of policies that a state has adopted has a positive
relationship with the percentage of high schools teaching computer science. Results from a multiple linear
regression showed a significant positive relationship between the number of policies adopted and the
teaching rate of computer science in a state (p < 0.0001, r2 = 0.39).
K–12 Standards and Access to Computer Science
State Plan and Access to Computer Science
Policy Adoption and Access to Computer Science
States that adopt more policies around computer science education see a higher number of schools teaching computer science.
Per
cen
t o
f H
igh
Sch
oo
ls T
each
ing
CS
Number of Policies
2 4 6 8 90%
20%
40%
60%
80%
100%
1 3 5 7
Trend in Policy Adoption and Access to Computer ScienceStates that have adopted more of the nine policies have a greater percentage of high schools teaching computer science.
State Plan and Access to Computer Science
0%
10%
20%
30%
40%
50%
60%53%
42%
Perc
ent
of H
igh
Scho
ols
Teac
hing
CS
State Plan
Yes No
K-12 Standards and Access to Computer Science
Yes No0%
10%
20%
30%
40%
50%
60%
47%
41%
Perc
ent
of H
igh
Scho
ols
Teac
hing
CS
K-12 Computer Science Standards

K–12 Computer Science Access Report94
Funding and Access to Computer Science
Funding and Access to Computer ScienceStates that have provided funding for teacher professional learning in computer science have 1.5x more high schools that teach computer science.
0%
10%
20%
30%
40%
50%
60%
49%
41%
Perc
ent
of H
igh
Scho
ols
Teac
hing
CS
Funding for Professional Learning
Yes No
Certification and Access to Computer Science
Certification and Access to Computer Science
0%
10%
20%
30%
40%
50%
60%
46%
40%
Perc
ent
of H
igh
Scho
ols
Teac
hing
CS
Certification
Yes No
Preservice Teacher Preparation Programs and Access to Computer Science
State Supervisor and Access to Computer Science
Preservice Teacher Preparation Programs and Access to Computer ScienceStates that have approved preservice teacher preparation programs have a greater percentage of schools o�ering computer science.
Perc
ent
of H
igh
Scho
ols
Teac
hing
CS
Preservice Teacher Preparation Programs
Yes No0%
10%
20%
30%
40%
50%
60% 58%
41%
State Supervisor and Access to Computer Science
Yes No0%
51%
42%
Perc
ent
of H
igh
Scho
ols
Teac
hing
CS
State Computer Science Supervisor
10%
20%
30%
40%
50%
60%

K–12 Computer Science Access Report 95
Requiring Schools to Offer Computer Science and Access to Computer Science
Computer Science Satisfying a Core Graduation Requirement and Access to Computer Science
Computer Science Satisfying a Core Graduation Requirement and Access to Computer Science
Perc
ent
of H
igh
Scho
ols
Teac
hing
CS
Computer Science Satisfies a Core Graduation Requirement
Yes No0%
46%
26%
10%
20%
30%
40%
50%
60%
Computer Science Satisfying a Higher Ed Admissions Requirement and Access to Computer Science
Computer Science Satisfying a Higher Ed Admissions Requirement and Access to Computer Science
Perc
ent
of H
igh
Scho
ols
Teac
hing
CS
Computer Science Satisfies a Higher Ed Admissions Requirement
Yes No0%
49%43%
10%
20%
30%
40%
50%
60%
Requiring Schools to Teach Computer Science and Access to Computer ScienceStates that require high schools to teach computer science have a greater percentage of schoolsteaching computer science.
Requires all High Schoolsto O�er Computer Science
Yes No0%
51%
43%
10%
20%
30%
40%
50%
60%
Perc
ent
of H
igh
Scho
ols
Teac
hing
CS

K–12 Computer Science Access Report96
Policy and ImplementationHigh percentages and growth in the number of schools teaching computer science are often driven by a
combination of policy and implementation. Rhode Island and Arkansas continue to show the greatest
percentages of high schools teaching computer science. South Carolina, Mississippi, and North Dakota
show the highest rates of growth from last year.
Rhode Island
The percentage of high schools in Rhode Island that teach computer science increased from 78% in
the 2017-2018 school year to 86% in the 2018-2019 school year. Strong leadership, policy decisions, and
statewide coordination continue to contribute to the highest percentage of public high schools teaching
computer science in this data set. The Computer Science for Rhode Island (CS4RI, cs4ri.org) initiative,
launched in 2016 by the Office of Governor Gina Raimondo, has been key to this effort. Driven by a diverse
team of stakeholders from government, the department of education, nonprofit partners, higher education,
and industry, CS4RI strategically focuses on teacher professional development, district support, and
K–12 student pathways to broaden participation and advance computer science education in Rhode Island.
For more information on what types of stakeholders to include in state efforts, ECEP has collected a list
of common stakeholders to consider (ecepalliance.org/resources/stakeholders-involved-bpc).
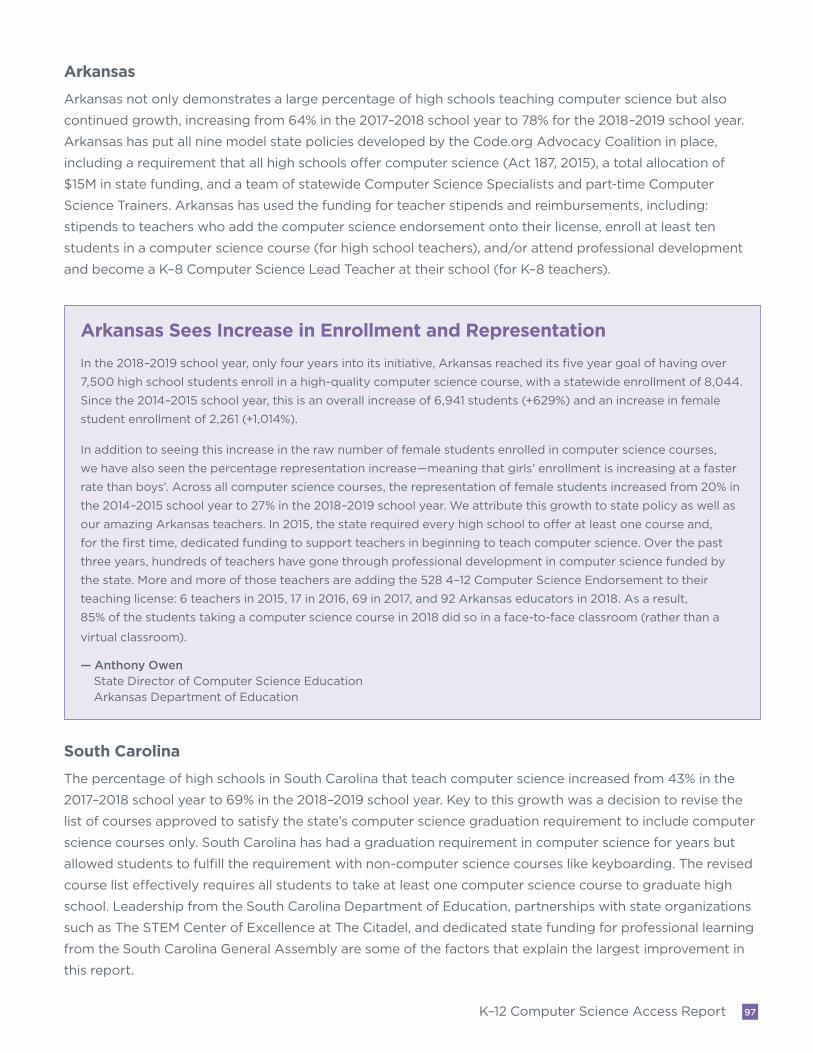
K–12 Computer Science Access Report 97
Arkansas
Arkansas not only demonstrates a large percentage of high schools teaching computer science but also
continued growth, increasing from 64% in the 2017–2018 school year to 78% for the 2018–2019 school year.
Arkansas has put all nine model state policies developed by the Code.org Advocacy Coalition in place,
including a requirement that all high schools offer computer science (Act 187, 2015), a total allocation of
$15M in state funding, and a team of statewide Computer Science Specialists and part-time Computer
Science Trainers. Arkansas has used the funding for teacher stipends and reimbursements, including:
stipends to teachers who add the computer science endorsement onto their license, enroll at least ten
students in a computer science course (for high school teachers), and/or attend professional development
and become a K–8 Computer Science Lead Teacher at their school (for K–8 teachers).
South Carolina
The percentage of high schools in South Carolina that teach computer science increased from 43% in the
2017–2018 school year to 69% in the 2018–2019 school year. Key to this growth was a decision to revise the
list of courses approved to satisfy the state’s computer science graduation requirement to include computer
science courses only. South Carolina has had a graduation requirement in computer science for years but
allowed students to fulfill the requirement with non-computer science courses like keyboarding. The revised
course list effectively requires all students to take at least one computer science course to graduate high
school. Leadership from the South Carolina Department of Education, partnerships with state organizations
such as The STEM Center of Excellence at The Citadel, and dedicated state funding for professional learning
from the South Carolina General Assembly are some of the factors that explain the largest improvement in
this report.
Arkansas Sees Increase in Enrollment and Representation
In the 2018–2019 school year, only four years into its initiative, Arkansas reached its five year goal of having over
7,500 high school students enroll in a high-quality computer science course, with a statewide enrollment of 8,044.
Since the 2014–2015 school year, this is an overall increase of 6,941 students (+629%) and an increase in female
student enrollment of 2,261 (+1,014%).
In addition to seeing this increase in the raw number of female students enrolled in computer science courses,
we have also seen the percentage representation increase—meaning that girls’ enrollment is increasing at a faster
rate than boys’. Across all computer science courses, the representation of female students increased from 20% in
the 2014–2015 school year to 27% in the 2018–2019 school year. We attribute this growth to state policy as well as
our amazing Arkansas teachers. In 2015, the state required every high school to offer at least one course and,
for the first time, dedicated funding to support teachers in beginning to teach computer science. Over the past
three years, hundreds of teachers have gone through professional development in computer science funded by
the state. More and more of those teachers are adding the 528 4–12 Computer Science Endorsement to their
teaching license: 6 teachers in 2015, 17 in 2016, 69 in 2017, and 92 Arkansas educators in 2018. As a result,
85% of the students taking a computer science course in 2018 did so in a face-to-face classroom (rather than a
virtual classroom).
— Anthony Owen State Director of Computer Science Education Arkansas Department of Education

K–12 Computer Science Access Report98
“Our role is to align public education with the skills needed in tomorrow’s job market, and right now there’s a great demand for computer science and cybersecurity skills in North Dakota. The 18% increase in engagement is proof that students really want to learn these skills when they have the opportunity and resources.”
— Kirsten Baesler State Superintendent
North Dakota Department of Public Instruction
Mississippi
The percentage of high schools in Mississippi that teach computer science increased from 28% in the
2017–2018 school year to 47% in the 2018–2019 school year. A number of policy and implementation
decisions working together can explain this growth, including the decision to amend the state high school
diploma requirements to require one credit in computer science or technology, effective for students
entering high school in the 2018–2019 school year. Although students can satisfy the requirement with a
technology course, most of the courses on the approved course list are computer science. Admissions
requirements to state institutions of higher education were also amended to align to the high school
requirement. Since 2016, the Research and Curriculum Unit (RCU) at Mississippi State University, in
partnership with the Mississippi Department of Education, has provided professional development for over
1,000 teachers. RCU is increasing awareness in rural areas by hosting Hour of Code events and summer
camps in rural districts. With an appropriation of $300K for FY 2020 to the Mississippi State University
Center for Cyber Education for computer science program development and teacher professional
development, the state continues to set an environment in which more schools will teach computer science.
North Dakota
The percentage of high schools in North Dakota that
teach computer science increased from 23% in the
2017–2018 school year to 41% in the 2018–2019
school year. Strong leadership from Superintendent
Baesler of the North Dakota Department of Public
Instruction and Governor Burgum has been a key
factor in this growth. In March 2019, North Dakota
adopted the nation’s first Computer Science and
Cybersecurity Standards, embedding cybersecurity
knowledge and skills across all grades and strands in
the standards. Later that month, the Governor
signed SB 2171 (2019), giving the Department of
Public Instruction the ability to credential computer
science teachers.

K–12 Computer Science Access Report 99
Conclusion
In each of these states, we see the relationship between state policy decisions and the number of schools
teaching computer science. We also see the effect of strong leadership (three of the five states are
members of the Governors’ Partnership for K–12 Computer Science) and collaboration between the
governors’ offices and the state education agency to support implementation by local education agencies.
Other states in the published data set have recently made significant policy decisions to increase the
number of schools teaching computer science. California, Michigan, and Wyoming have added computer
science as a priority for professional development funding and Texas has added specific computer science
courses to per-student formula funding. Alaska adopted their first computer science standards and
communicated to districts that computer science can count towards graduation requirements for
mathematics, science, technology, or career and technical education. West Virginia and Kansas are in
the process of developing state plans to expand computer science across their respective states. The
Pennsylvania Training and Technical Assistance Network has a team dedicated to supporting computer
science professional development statewide. Policy and implementation efforts like these create a positive
outlook not only for the number of schools teaching computer science, but also for student enrollment
and diversity in 2020 and beyond.

For up-to-date policy data and advocacy resources, visit advocacy.code.org
For the latest K–12 computer science
access data, visit code.org/yourschool
For more information on joining the CSTA or CSTA chapters, visit csteachers.org
For more information about
ECEP state teams, visit ecepalliance.org

About the Code.org Advocacy Coalition
Bringing together more than 70 industry, non-profit,
and advocacy organizations, the Code.org Advocacy
Coalition is growing the movement to make computer
science a fundamental part of K–12 education.
About the CSTA
The Computer Science Teachers Association (CSTA)
is a membership organization that supports and
promotes the teaching of computer science. CSTA
provides opportunities for K–12 teachers and their
students to better understand computer science and
to more successfully prepare themselves to teach
and learn.
CC BY-NC-SA 4.0. This work is licensed under the Creative Commons Attribution-NonCommercial-ShareAlike 4.0 International License. To view a copy of this license, visit https://creativecommons.org/licenses/by-nc-sa/4.0/
Authorization to reproduce this report in whole or in part is granted.
Suggested Citation: 2019 State of Computer Science Education. (2019). Retrieved from https://advocacy.code.org/
Advocacy Coalition
About the Expanding ComputingEducation Pathways Alliance
The Expanding Computing Education Pathways
(ECEP) Alliance is an NSF-funded Broadening
Participation in Computing Alliance (NSF-CNS-1822011).
ECEP seeks to increase the number and diversity of
students in computing and computing-intensive
degrees by promoting state-level computer science
education reform. Working with the collective impact
model, ECEP supports an alliance of 22 states and
Puerto Rico to identify and develop effective
educational interventions, and expand state-level
infrastructure to drive educational policy change.

About the Code.org Advocacy Coalition
Bringing together more than 70 industry, non-profit, and advocacy organizations, the Code.org Advocacy Coalition is growing the movement to make computer science a fundamental part of K–12 education.
About the CSTA
The Computer Science Teachers Association (CSTA) is a membership organization that supports and promotes the teaching of computer science. CSTA provides opportunities for K–12 teachers and their students to better understand computer science and to more successfully prepare themselves to teach and learn.
2019 State of Computer Science Education
Equity and Diversity
About the ECEP Alliance
The Expanding Computing Education Pathways (ECEP) Alliance is an NSF-funded Broadening Participation in Computing Alliance (NSF-CNS-1822011). As an alliance of 22 states and Puerto Rico, ECEP seeks to increase the number and diversity of students in computing and computing-intensive degrees through advocacy and policy reform.
Advocacy Coalition
Advocacy Coalition