Standoff distance and bow shock phenomena in the Cold Spray process
12
Standoff distance and bow shock phenomena in the Cold Spray process J. Pattison ⁎ , S. Celotto, A. Khan, W. O'Neill Innovative Manufacturing Research Centre, Institute for Manufacturing, Department of Engineering, University of Cambridge, UK Received 28 February 2007; accepted in revised form 26 June 2007 Available online 27 September 2007 Abstract Cold Spray involves the deposition of metallic powder particles using a supersonic gas jet. When the nozzle standoff distance is small, a bow shock is formed at the impingement zone between the supersonic jet and the substrate. It has long been thought that this bow shock is detrimental to process performance as it can reduce particle impact velocities. By using computational fluid dynamics, Particle Image Velocimetry and Schlieren imaging it was possible to show that the bow shock has a negative influence on deposition efficiency as a result of a reduction in particle velocity. Furthermore, the existence of the bow shock was shown to be dependent on the length of the nozzle's supersonic potential core. Experiments were carried out with aluminium, copper and titanium powders using a custom-made helium nozzle, operating at 2.0 MPa and 20 °C, and a commercial nitrogen nozzle operating at 3.0 MPa and 300 °C. In all cases, it was found that there is a direct relationship between standoff distance and deposition efficiency. At standoff distances less than 60 mm, the bow shock reduced deposition efficiencies by as much as 40%. © 2007 Elsevier B.V. All rights reserved. Keywords: Aluminium; Cold Spraying; Copper; Flow Visualisation; Shockwaves; Titanium 1. Introduction The nozzle-substrate standoff distance (SoD) is one of the most important parameters in the Cold Spray process, yet its effects are only partially understood. Computational fluid dynamic (CFD) models have shown that, at short SoDs, the impact velocity of small particles is reduced as a consequence of the bow shock formed at the impingement zone; however, experimentally measured deposition efficiencies (DE), which are intrinsically linked to particle velocity, have often contra- dicted this phenomenon. This research aims to clarify the effects of SoD and the bow shock on particle velocity and DE. In Cold Spray, metallic powder particles are accelerated to high velocities (600–1000 m/s) in a supersonic gas jet and directed towards a substrate. If the particle impact velocity is above a material-dependent critical value, then massive plastic deformation occurs in both the incident particles and underlying material [1]. This process disrupts thin surface films such as oxides and exposes fresh, active material; which, when brought into intimate, conformal contact under high localised pressures, undergoes adiabatic shear instabilities to form strong atomic bonds [2]. The continual bombardment and deposition of these high-speed particles leads to material build-up and eventually coating formation [3]. Coatings can be produced at low temperatures without the detrimental effects of high-tempera- ture processing such as material oxidation, large residual stresses, poor mechanical properties, unwanted phase transfor- mations and part distortion [4]. While nozzle SoD has been the subject of much research in the Cold Spray community there is no general consensus on its effects. As SoD is increased, the free gas jet shows a continual reduction in velocity away from the nozzle as a result of shockwaves, viscous effects and ambient mixing [5–7]; thus, the gas velocity at impingement decreases. However, the entrained particle velocity can either rise or fall outside of the nozzle depending on the gas flow conditions and the gas– particle relative velocity, Eq. (1). F d ¼ C d A p q g ðV g V p Þ 2 2 ð1Þ Available online at www.sciencedirect.com Surface & Coatings Technology 202 (2008) 1443 – 1454 www.elsevier.com/locate/surfcoat ⁎ Corresponding author. Unit 26A Cambridge Science Park, Cambridge, CB4 0FP, UK. Tel.: +44 1223 741847; fax: +44 1223 741852. E-mail address: [email protected] (J. Pattison). 0257-8972/$ - see front matter © 2007 Elsevier B.V. All rights reserved. doi:10.1016/j.surfcoat.2007.06.065
-
Upload
independent -
Category
Documents
-
view
2 -
download
0
Transcript of Standoff distance and bow shock phenomena in the Cold Spray process

Available online at www.sciencedirect.com
202 (2008) 1443–1454www.elsevier.com/locate/surfcoat
Surface & Coatings Technology
Standoff distance and bow shock phenomena in the Cold Spray process
J. Pattison ⁎, S. Celotto, A. Khan, W. O'Neill
Innovative Manufacturing Research Centre, Institute for Manufacturing, Department of Engineering, University of Cambridge, UK
Received 28 February 2007; accepted in revised form 26 June 2007Available online 27 September 2007
Abstract
Cold Spray involves the deposition of metallic powder particles using a supersonic gas jet. When the nozzle standoff distance is small, a bowshock is formed at the impingement zone between the supersonic jet and the substrate. It has long been thought that this bow shock is detrimentalto process performance as it can reduce particle impact velocities. By using computational fluid dynamics, Particle Image Velocimetry andSchlieren imaging it was possible to show that the bow shock has a negative influence on deposition efficiency as a result of a reduction in particlevelocity. Furthermore, the existence of the bow shock was shown to be dependent on the length of the nozzle's supersonic potential core.Experiments were carried out with aluminium, copper and titanium powders using a custom-made helium nozzle, operating at 2.0 MPa and 20 °C,and a commercial nitrogen nozzle operating at 3.0 MPa and 300 °C. In all cases, it was found that there is a direct relationship between standoffdistance and deposition efficiency. At standoff distances less than 60 mm, the bow shock reduced deposition efficiencies by as much as 40%.© 2007 Elsevier B.V. All rights reserved.
Keywords: Aluminium; Cold Spraying; Copper; Flow Visualisation; Shockwaves; Titanium
1. Introduction
The nozzle-substrate standoff distance (SoD) is one of themost important parameters in the Cold Spray process, yet itseffects are only partially understood. Computational fluiddynamic (CFD) models have shown that, at short SoDs, theimpact velocity of small particles is reduced as a consequence ofthe bow shock formed at the impingement zone; however,experimentally measured deposition efficiencies (DE), whichare intrinsically linked to particle velocity, have often contra-dicted this phenomenon. This research aims to clarify the effectsof SoD and the bow shock on particle velocity and DE.
In Cold Spray, metallic powder particles are accelerated tohigh velocities (600–1000 m/s) in a supersonic gas jet anddirected towards a substrate. If the particle impact velocity isabove a material-dependent critical value, then massive plasticdeformation occurs in both the incident particles and underlying
⁎ Corresponding author. Unit 26A Cambridge Science Park, Cambridge, CB40FP, UK. Tel.: +44 1223 741847; fax: +44 1223 741852.
E-mail address: [email protected] (J. Pattison).
0257-8972/$ - see front matter © 2007 Elsevier B.V. All rights reserved.doi:10.1016/j.surfcoat.2007.06.065
material [1]. This process disrupts thin surface films such asoxides and exposes fresh, active material; which, when broughtinto intimate, conformal contact under high localised pressures,undergoes adiabatic shear instabilities to form strong atomicbonds [2]. The continual bombardment and deposition of thesehigh-speed particles leads to material build-up and eventuallycoating formation [3]. Coatings can be produced at lowtemperatures without the detrimental effects of high-tempera-ture processing such as material oxidation, large residualstresses, poor mechanical properties, unwanted phase transfor-mations and part distortion [4].
While nozzle SoD has been the subject of much research inthe Cold Spray community there is no general consensus on itseffects. As SoD is increased, the free gas jet shows a continualreduction in velocity away from the nozzle as a result ofshockwaves, viscous effects and ambient mixing [5–7]; thus,the gas velocity at impingement decreases. However, theentrained particle velocity can either rise or fall outside of thenozzle depending on the gas flow conditions and the gas–particle relative velocity, Eq. (1).
Fd ¼CdApqgðVg � VpÞ2
2ð1Þ

Fig. 1. Schematic diagram of the supersonic impingement zone at the substrate.
1444 J. Pattison et al. / Surface & Coatings Technology 202 (2008) 1443–1454
Here Fd is the drag force, Cd is the drag coefficient, Ap isthe particle frontal area, ρg is the gas density, (Vg−Vp) is thegas–particle relative velocity. Dykhuizen and Smith [8]showed analytically that this relative velocity determinesparticle acceleration, which can continue outside of thenozzle. Gilmore et al. [9] sprayed a copper powder withhelium and found that the particle velocity increased from600 to 650 m/s outside of the nozzle. Particle velocities onlybegan to decrease when the SoD was increased beyond50 mm. Stoltenhoff et al. [10] confirmed this observationusing CFD; as SoD increased, the negative influence of theslowing nitrogen jet became too strong and the entrainedcopper particles began to decelerate. Conversely, Karthikeyanet al. [11] sprayed a titanium powder with helium and foundthat experimentally measured DEs decreased with increasingSoD. This was presumed the result of a gradual reduction inparticle velocity outside of the nozzle. In contrast, Jodoin[12] used CFD to show that impact velocity of copperparticles sprayed with air increased with increasing SoD –most notably for the smaller-sized particles (b5 μm) – due tothe weakening strength of the shockwave at the substrate.Although his model predicted that a SoD of 50 mm wouldyield the highest particle velocities and hence DEs, this wasnot confirmed experimentally. In fact, his DEs actuallydecreased as the SoD increased. Hence, although particlevelocity may increase outside of the nozzle, the presence ofthe shockwave at the substrate – or bow shock – can theore-tically reduce it.
Alkhimov et al. [13] found that when spraying with air andhelium, the thickness of the compressed layer – formed betweenthe bow shock and substrate – depended weakly on SoD; thesmaller the SoD the thicker the compressed layer. Furthermore,calculations showed that aluminium and copper particles lessthan 5 μm in diameter could be decelerated in the compressedlayer; however, this was not proven experimentally. In aseparate but complimentary study, they supposed that thethicker the compressed layer, the greater the particle deceler-ation within it [14]. Gilmore et al. [9] and Dykhuizen et al. [15]also predicted that the smallest particles (b5–15 μm) could bedecelerated and even deflected away from the substrate by thebow shock; in both cases however, no experimental data wasobtained to validate the theory. Given that DE is dependent onparticle velocity, it may be inferred from these studies that DEincreases with SoD.
It is clear then, that according to the theory at least, particleimpact velocity and hence DE are dependent on SoD. Howeverthere are two competing mechanisms that affect particlevelocity outside of the nozzle: particle acceleration/decelerationdue to the free gas jet and particle deceleration due to thepresence of the bow shock. Which of these mechanisms isdominant seems yet to be decided. This paper aims to clarifythese matters. Information is provided on the bow shock itself,how it was modelled and predictions of its effects. In addition,the experimental equipment used to conduct spraying andmeasure particle velocity and the bow shock are discussed.Finally, results are presented pertaining to the effects of SoD onparticle velocity, the bow shock and DE.
2. The Bow Shock
Shockwaves occur as a result of the adjustment of a supersonicflow to downstream conditions or perturbations. In Cold Spray,the downstream flow perturbation is the substrate. Fig. 1 shows aschematic diagram of the impingement zone between thesupersonic gas jet and the substrate. As gas molecules in theprimary jet flow impact with the substrate there is a generalchange in molecular energy and momentum, which is transmittedto other regions of the flow by infinitesimal pressure wavestravelling at the speed of sound [16]. Since these pressure wavescannot travel upstream and forewarn the flow to the presence ofthe substrate, they coalesce a short distance ahead of it, forming anormal shockwave. The subsonic flow downstream of theshockwave is receptive to the propagated sound waves and soadjusts to the presence of the substrate. This adjustment takes theform of an outward radial deflection of the primary jet flow.However, for any given free-stream Mach number there exists amaximum flow deflection angle through which an oblique shockcan form [5]. Since the substrate is normal to the primary jet flow,the deflection angle is greater than the maximum deflection angleand hence the shockwave is curved and detached— this is knownas the bow shock [17].
The bow shock itself has no discernible effect on theentrained particles since its thickness is of the order of the meanfree path of the gas involved [18]. It is not until the downstreamflow conditions are considered that the true shock-particlebehaviour can be identified. The bow shock encloses a region ofrecirculating, high-density, low-velocity fluid that is charac-terised by strong gradients and abrupt changes in the local flowproperties [17]. It is this stagnation bubble than can affect thevelocity and trajectory of the entrained particles.
2.1. Modelling
During the current research, the commercially-available CFDpackage Fluent was used to model the effects of the bow shock onthe entrained particles. This flow solver operates on a finite-volume-based principle, whereby each flow domain is decom-posed into a user-specified computational grid. In this case, a two-dimensional, axi-symmetric methodology was employed toconstruct the nozzle-substrate flow domain. The internal nozzlegeometries were constructed with a 10-mm converging inlet

1445J. Pattison et al. / Surface & Coatings Technology 202 (2008) 1443–1454
diameter, a 2-mm throat diameter and a diverging profile matchingthe design specifications detailed in Section 3. Pressure-basedboundary conditions were applied to the inlet and outlet of eachnozzle flow domain, while a no-slip condition was enforced at thenozzle walls. The domain was treated as a steady-state,compressible flow problem using an ideal gas. A quadrilateralgrid meshing scheme was applied to the flow domain, containingapproximately 200,000 cells. This approach was chosen as itreduced the overall computation time, while the accuracy wassufficient to ensure valid flow-field data [19]. A density-gradientgrid adaptation technique was applied to help resolve the flowfeatures. The Navier–Stokes, energy and scalar equations weresolved in coupled fashion and linearised implicitly, while thenumerical discretisation was carried out using a second-orderscheme. To account for turbulence, the Reynolds-averagedNavier–Stokes equation with a realisable κ–ε turbulence modelwas used. This realisable model solves the round-jet anomaly thatis associated with the use of other κ–ε turbulence models whenused to simulate axi-symmetric jets [20]; however, care has to betaken when assessing its results. In order to account for the changein gas viscosity with temperature, Sutherland's formula was used[21]. The velocity and trajectory of the discrete phase (i.e. theparticles) in the two-phase model was computed using a drag forcebalance written in a Lagrangian reference frame [22].
Fig. 2 shows a CFD image of the impingement zone at a SoDof 10 mm. In this instance, helium was used at 2.0 MPa and20 °C. It can be seen that the bow shock exists a short distancefrom the substrate. Across this shockwave, the magnitude of thevelocity vectors is seen to reduce, while the gas density increasesalmost instantaneously. This type of image was compared to theequivalent image taken using Schlieren imaging. In addition, theeffect of the bow shock on particle velocity was recorded.
3. Experimental equipment and procedures
Spraying was conducted using the Cold Gas DynamicManufacturing (CGDM) system [23], shown schematically in
Fig. 2. CFD image of the impingement zone at a standoff distance of 10 mm; here heliright, contours of density.
Fig. 3. This system is capable of spraying both helium andnitrogen at 3.5 MPa and 400 °C. A unique feature of this systemis that it utilises helium recycling, which can operate atefficiencies in excess of 80%. During this study, two differentaxi-symmetric nozzles were used: the first was a custom-madelinear helium nozzle, 100 mm long, with a design pressure of2.0 MPa and a throat diameter of 2 mm; while the second was acommercial bell-shaped nitrogen nozzle, approximately 65 mmlong, with a design pressure of 3.0 MPa and a throat diameter of2.7 mm. Note that the helium nozzle was operated at 20 °C andthe nitrogen nozzle at 300 °C. Experiments were carried out toestablish the effects of SoD on particle velocity, the bow shockand DE.
In order to measure in-flight particle velocities, ParticleImage Velocimetry (PIV) was employed. PIV is a whole-flow-field technique that permits the direct measurement of particlevelocities over the cross-section of a flow [24]. In this instance,the output from a dual-head, Nd:YAG laser – frequencydoubled to 532 nm, with a 60-mJ maximum pulse energy and a5-ns minimum pulse length – was converted into a light sheetand used to illuminate the flow-field. A 1280×1024 pixel,digital CCD camera – capable of recording 12-bit images at arate of 4 Hz – was positioned normal to the light sheet and usedto capture images. By ensuring that a laser pulse occurred ineach image frame it was possible to correlate particledisplacements, and, knowing the laser pulse separation, inferparticle velocities. Although the maximum laser pulse frequen-cy for each laser was only 15 Hz, by timing the pulse of the firstlaser to be offset from the pulse generated by the second, pulseseparations of the order of several hundred nanoseconds werepossible. Using this equipment, it was possible to measureparticle velocities in the range 0–1500 m/s.
Following digital image capture, the high-resolution flow-field images were transferred to a local PC and bespokesoftware used to extract the data. This software used an initialcross-correlation algorithm to obtain a first approximation ofthe particle displacements. Here each image was broken down
um was used at 2.0 MPa and 20 °C. On the left, gas velocity vectors, while on the

Fig. 3. Schematic diagram of the CGDM system used to conduct spraying.
1446 J. Pattison et al. / Surface & Coatings Technology 202 (2008) 1443–1454
into interrogation areas (IA) measuring 32×32 pixels with a50% IA overlap to improve displacement correlation; theaverage particle displacement was calculated in each IA. Anadaptive cross-correlation algorithm was then applied toincrease the accuracy of the data and provide greater
Fig. 4. PIV images of the helium nozzle, operating under its design conditions, whenin (b) an average scalar velocity map.
resolution. This was achieved by reducing the size of the IAto 16×16 pixels. Velocity vectors were calculated from thisdata and screened on the basis of velocity and direction. Bad ormissing vectors due to poor seeding were interpolated fromsurrounding vectors. At this stage, the output from the
spraying the aluminium powder. In (a) an instantaneous velocity vector field and

Fig. 5. Schematic diagram of the Schlieren system used to visualise the bow shock.
1447J. Pattison et al. / Surface & Coatings Technology 202 (2008) 1443–1454
processing scheme comprised a collection of instantaneousvelocity vector fields that showed a snapshot of the particlestream exiting the nozzle. By averaging over 400 images, aclear picture of the overall particle stream was obtained. Fig. 4shows a PIV image of an instantaneous velocity vector field, aswell as an average scalar velocity map, for the helium nozzleoperating under its design conditions with the aluminiumpowder described below.
To facilitate bow shock measurements, Schlieren imagingwas used. Schlieren imaging is a flow visualisation techniquethat translates invisible phase differences exhibited byrefracted light beams into amplitude variations visible to thehuman eye [25]. Since the impingement zone contains regionsof strong density, and hence refractive index gradients, it waspossible to use Schlieren imaging to inspect the bow shock atthe impingement zone. The Schlieren apparatus used duringthis study was a double-pass coincident system that providedthe sensitivity necessary for the visualisation of low-densityhelium (Fig. 5).
In this arrangement, a xenon discharge lamp was used asthe light source and a digital CCD camera used to recordimages. A condensing lens was used to focus the light sourcethrough a pinhole towards the test region. Light passes throughthe test region and is reflected back through it by a concavemirror before being diverted to the CCD array using a beamsplitter. A knife edge is positioned at the focal length of the
Fig. 6. SEM images showing (a) the −53+10 μm aluminium powder, (b) the −3
mirror to block unwanted components of the refracted light;thus dark regions appear in the Schlieren image correspondingto areas of strong density gradients. Images of the bow shockwere captured for each nozzle at different SoDs and analysedusing photo-editing software.
DE measurements were made by comparing the amount ofpowder deposited to the total amount of powder sprayed. Theamount of powder deposited was measured simply byweighing the substrate before and after spraying, while thetotal amount of powder sprayed was measured using a loadcell fitted beneath the powder feeder. DEs were calculated foreach nozzle at SoDs in the range 10–240 mm. During theseexperiments, three commercial-purity powders were sprayed:the first was a −53+10 μm spherical aluminium powderwith an average particle size of 22.32 μm, the second was a−38+11 μm spherical copper powder with an average particlesize of 17.6 μm, and the third was a −50+10 μm titaniumsponge powder with an average particle size of 21.7 μm. Fig. 6shows images of the three powders taken using a ScanningElectron Microscope (SEM).
4. Results and discussion
This research program was split into three sections: thefirst involved the use of PIV to measure in-flight particlevelocity, the second involved the use of Schlieren imaging to
8+11 μm copper powder and (c) the −50+10 μm titanium sponge powder.
1448 J. Pattison et al. / Surface & Coatings Technology 202 (2008) 1443–1454
visualise the bow shock, while the third involved conductingspray trials to measure DE. In each case the effects of SoDwere observed.
4.1. In-flight particle velocity
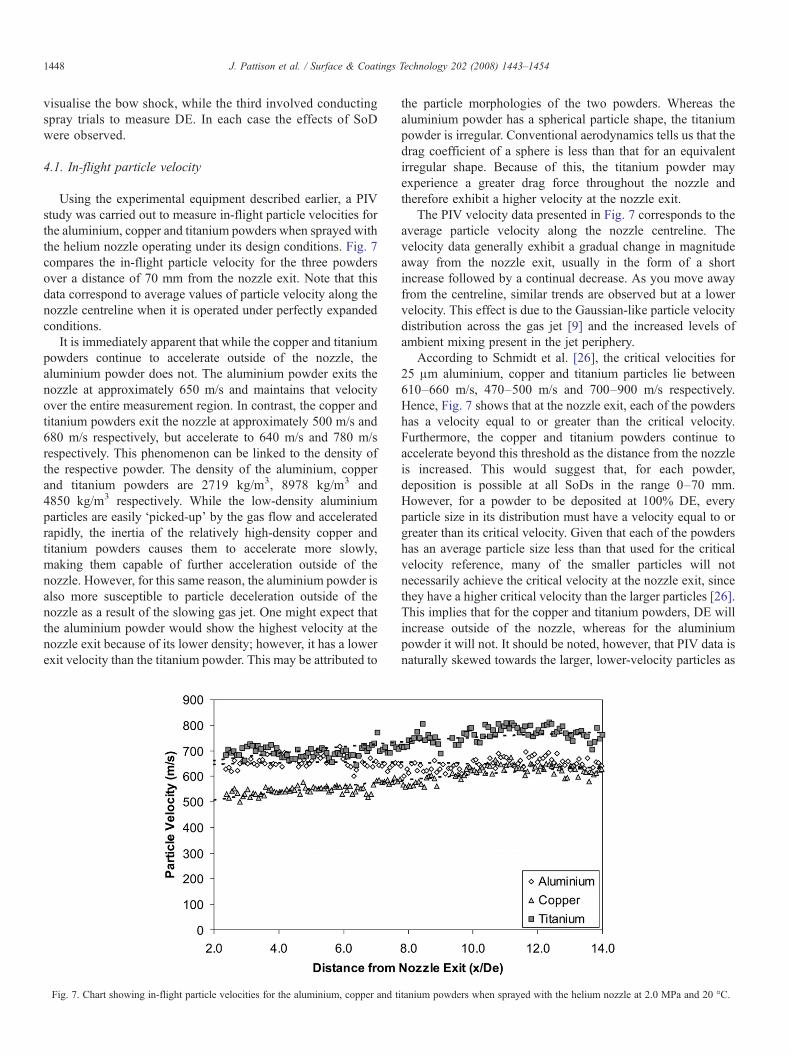
Using the experimental equipment described earlier, a PIVstudy was carried out to measure in-flight particle velocities forthe aluminium, copper and titanium powders when sprayed withthe helium nozzle operating under its design conditions. Fig. 7compares the in-flight particle velocity for the three powdersover a distance of 70 mm from the nozzle exit. Note that thisdata correspond to average values of particle velocity along thenozzle centreline when it is operated under perfectly expandedconditions.
It is immediately apparent that while the copper and titaniumpowders continue to accelerate outside of the nozzle, thealuminium powder does not. The aluminium powder exits thenozzle at approximately 650 m/s and maintains that velocityover the entire measurement region. In contrast, the copper andtitanium powders exit the nozzle at approximately 500 m/s and680 m/s respectively, but accelerate to 640 m/s and 780 m/srespectively. This phenomenon can be linked to the density ofthe respective powder. The density of the aluminium, copperand titanium powders are 2719 kg/m3, 8978 kg/m3 and4850 kg/m3 respectively. While the low-density aluminiumparticles are easily ‘picked-up’ by the gas flow and acceleratedrapidly, the inertia of the relatively high-density copper andtitanium powders causes them to accelerate more slowly,making them capable of further acceleration outside of thenozzle. However, for this same reason, the aluminium powder isalso more susceptible to particle deceleration outside of thenozzle as a result of the slowing gas jet. One might expect thatthe aluminium powder would show the highest velocity at thenozzle exit because of its lower density; however, it has a lowerexit velocity than the titanium powder. This may be attributed to
Fig. 7. Chart showing in-flight particle velocities for the aluminium, copper and t
the particle morphologies of the two powders. Whereas thealuminium powder has a spherical particle shape, the titaniumpowder is irregular. Conventional aerodynamics tells us that thedrag coefficient of a sphere is less than that for an equivalentirregular shape. Because of this, the titanium powder mayexperience a greater drag force throughout the nozzle andtherefore exhibit a higher velocity at the nozzle exit.
The PIV velocity data presented in Fig. 7 corresponds to theaverage particle velocity along the nozzle centreline. Thevelocity data generally exhibit a gradual change in magnitudeaway from the nozzle exit, usually in the form of a shortincrease followed by a continual decrease. As you move awayfrom the centreline, similar trends are observed but at a lowervelocity. This effect is due to the Gaussian-like particle velocitydistribution across the gas jet [9] and the increased levels ofambient mixing present in the jet periphery.
According to Schmidt et al. [26], the critical velocities for25 μm aluminium, copper and titanium particles lie between610–660 m/s, 470–500 m/s and 700–900 m/s respectively.Hence, Fig. 7 shows that at the nozzle exit, each of the powdershas a velocity equal to or greater than the critical velocity.Furthermore, the copper and titanium powders continue toaccelerate beyond this threshold as the distance from the nozzleis increased. This would suggest that, for each powder,deposition is possible at all SoDs in the range 0–70 mm.However, for a powder to be deposited at 100% DE, everyparticle size in its distribution must have a velocity equal to orgreater than its critical velocity. Given that each of the powdershas an average particle size less than that used for the criticalvelocity reference, many of the smaller particles will notnecessarily achieve the critical velocity at the nozzle exit, sincethey have a higher critical velocity than the larger particles [26].This implies that for the copper and titanium powders, DE willincrease outside of the nozzle, whereas for the aluminiumpowder it will not. It should be noted, however, that PIV data isnaturally skewed towards the larger, lower-velocity particles as
itanium powders when sprayed with the helium nozzle at 2.0 MPa and 20 °C.

Fig. 8. CFD data, showing contours of density, for the bow shock at different standoff distances when using the helium nozzle at 2.0 MPa and 20 °C.
1449J. Pattison et al. / Surface & Coatings Technology 202 (2008) 1443–1454
they reflect more light and are therefore imaged more readilythan their smaller counterparts [19]. Thus the average velocityfigures shown here are nominal values while the actual valuesmay be higher. This being the case, then the amount by whichDE increases outside of the nozzle would reduce. Despite this,the velocity profiles serve to illustrate the trends involved.
4.2. The bow shock
Following the PIV study, Schlieren imaging was used tovisualise the bow shock and measure its size and shape as thenozzle SoD was increased. This experiment was carried outwith both the helium nozzle and the commercial nitrogennozzle. Note that each nozzle was operated at room temperatureand no powder was sprayed. Fig. 8 shows CFD images of thebow shock when using the helium nozzle at SoDs of 10, 20, 30and 40 mm.
It can be seen from the CFD images that the size of the bowshock decreases – both in terms of its height and width – as the
Fig. 9. Schematic representation of a n
SoD increases. This may be linked to the length of thesupersonic portion of the jet, otherwise known as its supersonicpotential core. As the distance from the nozzle increases,viscous effects at the jet periphery cause the gas velocity todecrease and eventually turn subsonic. Since the gas velocity ishighest at the centre of the jet, it is here that the gas velocityremains supersonic the longest. Thus the supersonic potentialcore appears as a cone emanating from the nozzle exit (Fig. 9).As the SoD is increased, the area of this cone that interacts withthe substrate decreases, and hence the size of the bow shock isreduced. Given that the bow shock can only arise when the gasvelocity at the substrate is supersonic, the bow shock willdisappear when the SoD increases beyond the length of thenozzle's supersonic potential core.
The CFD images in Fig. 8 show that a bow shock is presentup to a SoD of 40 mm, suggesting that the gas flow remainssupersonic until that point. However, Schlieren images taken ofthe bow shock at a SoD of 40 mm – again using the heliumnozzle at 2.0 MPa and 20 °C – failed to show the presence of a
ozzle's supersonic potential core.

Fig. 10. Schlieren images of the bow shock at different standoff distances when using the commercial nitrogen nozzle at 3.0 MPa and 20 °C.
1450 J. Pattison et al. / Surface & Coatings Technology 202 (2008) 1443–1454
bow shock. Note that these Schlieren images were too faint tobe reproduced successfully here.
Under these conditions, the CFD model over-predicted thelength of the nozzle's supersonic potential core and hence thepresence of the bow shock at the larger SoDs. These dis-crepancies were attributed to several factors. Firstly, the CFDimages represent steady-state conditions whereas the Schlie-
Fig. 11. Chart showing the effect of standoff distance on the height and width of the
ren images do not; the actual jet flow may suffer from high-frequency, dynamic instabilities – or jet flapping – that isrepeatedly stated as the source of ambient mixing [6,7]. Thisturbulence effect can result in rapid jet breakdown, andultimately, lower gas velocities at the substrate. Furthermore,although the Schlieren images were taken of the heliumnozzle discharging into a sealed chamber, the atmosphere
bow shock when using the helium nozzle and the commercial nitrogen nozzle.

1451J. Pattison et al. / Surface & Coatings Technology 202 (2008) 1443–1454
inside may not have been 100% helium; thus the CFD model,which represented a pure helium environment, may haveunder-estimated the degree of ambient mixing due to thepresence of higher-density gas species. And finally, while theCFD model is 2D axi-symmetric, the bow shock itself is 3D;hence the 2D representation may inadequately resolve thevelocity decay in the 3D jet. It should also be noted that, atthe largest SoDs, the bow shock may be imperceptible to theSchlieren apparatus.
For comparison purposes, Schlieren imaging was used tovisualise the bow shock when using the commercial nitrogennozzle. Although the critical dimensions of this nozzle wereknown, the exact geometry of its internal profile was not;therefore, in this case, no CFD modelling was performed.Fig. 10 shows the Schlieren images at SoDs of 10, 20, 30,40, 50 and 60 mm. Note that the quality of image obtainedwhen spraying with nitrogen is higher than with helium as aconsequence of the greater pressure gradients and gas densi-ties involved.
While performing Schlieren imaging using the heliumnozzle, both the free-stream shockwaves and the bow shockwere barely visible; however, the images taken using the
Fig. 12. CFD data showing the effect of the bow shock on the drag force and velocit5 μm and 18 μm copper particles – sprayed with helium at 2.0 MPa and 20 °C – a
nitrogen nozzle clearly show oblique shockwaves emanatingfrom the nozzle exit and a well-defined bow shock at thesubstrate. The shock-cell length (i.e. the wavelength of theshock structure) is approximately 10 mm, and since the SoDincrement is also 10 mm, the shock pattern at the substrate ineach image is almost identical. The oblique shockwaves interactwith the normal shockwave at the substrate to form the bowshock. Again it can be seen that as the SoD increases the size ofthe bow shock decreases; at a SoD of 60 mm, it has disappearedcompletely. The measurements taken for the height and width ofthe bow shock, for both nozzles, can be found in Fig. 11.
The chart shows that, as the SoD increases, the height andwidth of the bow shock both decrease, irrespective of nozzletype. This again adds weight to the hypothesis that the size ofthe bow shock is intrinsically linked to the nozzle's supersonicpotential core. The nitrogen nozzle produces a bow shock thathas a maximum height of 1.37 mm, while the same figure forthe helium nozzle is 1.07 mm; a difference of 22%. This may beattributed to the higher pressure and design Mach number of thenitrogen nozzle. Similarly, the maximum width of the bowshock produced by the nitrogen nozzle is 6.32 mm, while for thehelium nozzle it is only 4.15 mm; a difference of 35%. Again
y experienced by 5 μm and 22 μm aluminium and titanium particles, as well ast a standoff distance of 10 mm.

1452 J. Pattison et al. / Surface & Coatings Technology 202 (2008) 1443–1454
this discrepancy can be explained by the exit dimensions of thetwo nozzles. Whereas the helium nozzle has an exit diameter of4.3 mm, the nitrogen nozzle has an exit diameter of 8.1 mm.Interestingly, while the width of the bow shock for the heliumnozzle is 97% of its exit diameter, the equivalent figure for thenitrogen nozzle is 78%. This would suggest that the nitrogennozzle has a narrower supersonic potential core as a result ofbeing over-expanded.
Overall, the results from the Schlieren study suggest thateither the length of the supersonic potential core produced bythe nitrogen nozzle is longer than that of the helium nozzle, orthat the sensitivity of the Schlieren system is not sufficient toidentify the faint helium bow shock at the larger SoDs.However, what can be said of both nozzles is that supersonic gasflow conditions exist outside of the nozzle, but the length of thesupersonic potential core precludes the bow shock from existingat SoDs greater than 50 mm.
4.3. Deposition efficiency
It is convenient to define the strength of the bow shock as thedifference between the Mach number immediately upstream ofthe shockwave and that downstream of it. Given that the free-stream Mach number decreases as the distance from the nozzleincreases, while the Mach number immediately downstream ofthe shock remains almost constant, the strength of the bowshock is greatest at the smallest SoDs. Therefore it is anticipatedthat, at the smallest SoDs, the greater the change in drag force,the greater the particle deceleration and the lower the DE.
Fig. 12 shows CFD data for the change in drag force andvelocity experienced by 5 μm and 22 μm aluminium andtitanium particles, as well as 5 μm and 18 μm copper particles,as they pass through the bow shock at a SoD of 10 mm. Herehelium was used at 2.0 MPa and 20 °C. It should be noted thata positive drag force acts to accelerate the particle while anegative drag force decelerates it (Eq. (1)). As the particles
Fig. 13. Chart showing the effect of standoff distance on deposition efficiency whe2.0 MPa and 20 °C and the commercial nitrogen nozzle at 3.0 MPa and 300 °C.
approach the substrate, the drag force is slightly positive andalmost constant; the particles show a maximum velocityincrease of 1.25% from the nozzle exit to the bow shock. Thebow shock occurs at a distance of 1.49 mm from the substrate.As the particles cross the bow shock, the drag force suddenlybecomes negative and increases in magnitude over a distanceof approximately 0.2 mm. This increase in drag force isbetween 10 and 20 times its original magnitude. The particlesthen pass through the high-pressure, high-density stagnationbubble to the substrate, where the drag force again increasesby between 1 and 5 times. Overall the drag force may increaseby as much as 70 times its original value as it passes throughthe bow shock to the substrate. Obviously this increasedepends on the mass of the incident particle, with small,lightweight particles being affected to a greater extent. Athigher SoDs the drag force becomes negative and increases inmagnitude as a consequence of the slowing gas jet; thus theparticle velocity decreases continually, but at a much slowerrate than across the bow shock.
It is proposed that the presence of the bow shock has anadverse effect on deposition performance due to the rapid changesin flow properties that occur across it and the stagnation bubble.Incident particles are exposed to massive changes in drag forcethat acts to slow them down; and, if their velocity falls below thecritical velocity, DEwill be reduced. Therefore, the bow shock notonly filters out the small-sized particles that do not have sufficientmomentum to maintain their velocity to the substrate, but alsolarger particles with velocities only slightly above the criticalvelocity. Thus, employing a short SoD can be of detriment todeposition performance. In order to confirm this hypothesis, astudy was carried out to measure the DE at different SoDs whenspraying the aluminium, copper and titanium powders using boththe helium nozzle and the commercial nitrogen nozzle operatingunder their design conditions (Fig. 13). Note that the powder feedrate and nozzle traverse rate were carefully controlled such thatthey did not affect DE.
n spraying aluminium, copper and titanium powders with the helium nozzle at
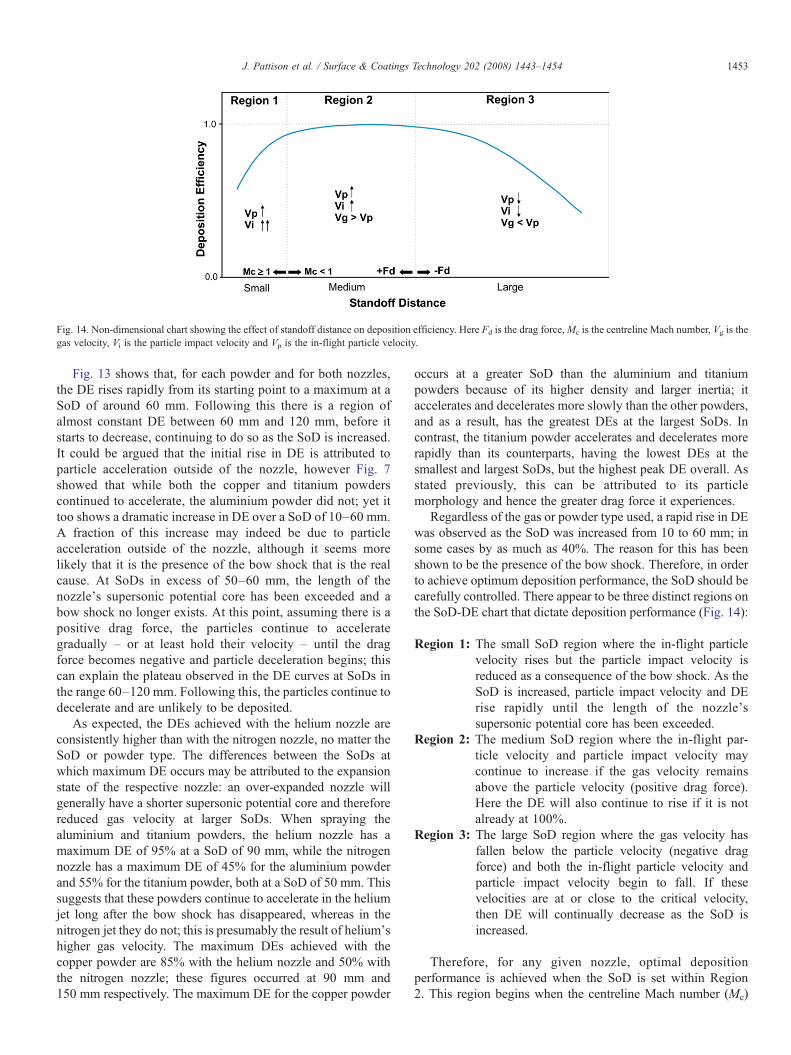
Fig. 14. Non-dimensional chart showing the effect of standoff distance on deposition efficiency. Here Fd is the drag force,Mc is the centreline Mach number, Vg is thegas velocity, Vi is the particle impact velocity and Vp is the in-flight particle velocity.
1453J. Pattison et al. / Surface & Coatings Technology 202 (2008) 1443–1454
Fig. 13 shows that, for each powder and for both nozzles,the DE rises rapidly from its starting point to a maximum at aSoD of around 60 mm. Following this there is a region ofalmost constant DE between 60 mm and 120 mm, before itstarts to decrease, continuing to do so as the SoD is increased.It could be argued that the initial rise in DE is attributed toparticle acceleration outside of the nozzle, however Fig. 7showed that while both the copper and titanium powderscontinued to accelerate, the aluminium powder did not; yet ittoo shows a dramatic increase in DE over a SoD of 10–60 mm.A fraction of this increase may indeed be due to particleacceleration outside of the nozzle, although it seems morelikely that it is the presence of the bow shock that is the realcause. At SoDs in excess of 50–60 mm, the length of thenozzle's supersonic potential core has been exceeded and abow shock no longer exists. At this point, assuming there is apositive drag force, the particles continue to accelerategradually – or at least hold their velocity – until the dragforce becomes negative and particle deceleration begins; thiscan explain the plateau observed in the DE curves at SoDs inthe range 60–120 mm. Following this, the particles continue todecelerate and are unlikely to be deposited.
As expected, the DEs achieved with the helium nozzle areconsistently higher than with the nitrogen nozzle, no matter theSoD or powder type. The differences between the SoDs atwhich maximum DE occurs may be attributed to the expansionstate of the respective nozzle: an over-expanded nozzle willgenerally have a shorter supersonic potential core and thereforereduced gas velocity at larger SoDs. When spraying thealuminium and titanium powders, the helium nozzle has amaximum DE of 95% at a SoD of 90 mm, while the nitrogennozzle has a maximum DE of 45% for the aluminium powderand 55% for the titanium powder, both at a SoD of 50 mm. Thissuggests that these powders continue to accelerate in the heliumjet long after the bow shock has disappeared, whereas in thenitrogen jet they do not; this is presumably the result of helium'shigher gas velocity. The maximum DEs achieved with thecopper powder are 85% with the helium nozzle and 50% withthe nitrogen nozzle; these figures occurred at 90 mm and150 mm respectively. The maximum DE for the copper powder
occurs at a greater SoD than the aluminium and titaniumpowders because of its higher density and larger inertia; itaccelerates and decelerates more slowly than the other powders,and as a result, has the greatest DEs at the largest SoDs. Incontrast, the titanium powder accelerates and decelerates morerapidly than its counterparts, having the lowest DEs at thesmallest and largest SoDs, but the highest peak DE overall. Asstated previously, this can be attributed to its particlemorphology and hence the greater drag force it experiences.
Regardless of the gas or powder type used, a rapid rise in DEwas observed as the SoD was increased from 10 to 60 mm; insome cases by as much as 40%. The reason for this has beenshown to be the presence of the bow shock. Therefore, in orderto achieve optimum deposition performance, the SoD should becarefully controlled. There appear to be three distinct regions onthe SoD-DE chart that dictate deposition performance (Fig. 14):
Region 1: The small SoD region where the in-flight particlevelocity rises but the particle impact velocity isreduced as a consequence of the bow shock. As theSoD is increased, particle impact velocity and DErise rapidly until the length of the nozzle'ssupersonic potential core has been exceeded.
Region 2: The medium SoD region where the in-flight par-ticle velocity and particle impact velocity maycontinue to increase if the gas velocity remainsabove the particle velocity (positive drag force).Here the DE will also continue to rise if it is notalready at 100%.
Region 3: The large SoD region where the gas velocity hasfallen below the particle velocity (negative dragforce) and both the in-flight particle velocity andparticle impact velocity begin to fall. If thesevelocities are at or close to the critical velocity,then DE will continually decrease as the SoD isincreased.
Therefore, for any given nozzle, optimal depositionperformance is achieved when the SoD is set within Region2. This region begins when the centreline Mach number (Mc)

1454 J. Pattison et al. / Surface & Coatings Technology 202 (2008) 1443–1454
falls below unity and ends when the drag force (Fd) becomesnegative. In this case, that corresponded to a SoD range of 60–120 mm.
5. Conclusions
The bow shock formed at the impingement zone plays acritical role in the Cold Spray process; not only does it reducethe velocity of the gas, but also that of the entrained particles.Therefore at small standoff distances, when the strength of thebow shock is high, deposition performance is reduced. While atlarge standoff distances, when the bow shock has disappeared,deposition can continue unhindered. Deposition efficiency wasshown to be strongly dependent on standoff distance as a resultof the bow shock and the gas–particle relative velocity outsideof the nozzle. Three distinct standoff regions were identifiedthat affect deposition performance: (1) the small standoffregion, where the presence of the bow shock adversely affectsdeposition performance, and is limited by the length of thenozzle's supersonic potential core; (2) the medium standoffregion, where the bow shock has disappeared and, if the gasvelocity remains above the particle velocity (positive dragforce), the deposition efficiency continues to increase; and (3)the large standoff region, where the gas velocity has fallenbelow the particle velocity (negative drag force), and theparticles begin to decelerate. For optimal deposition perfor-mance, the standoff distance should be set within Region 2.
While making particle velocity measurements, it was foundthat the irregular titanium powder was accelerated anddecelerated more rapidly than the spherical aluminium andcopper powders. It was proposed that this occurred as a result ofthe greater drag force experienced by the titanium powder,however, more work is needed to understand and quantify thisphenomenon.
Acknowledgements
This research was carried out within the framework of aproject sponsored by the Engineering & Physical SciencesResearch Council (EPSRC) UK.
References
[1] A.P. Alkhimov, V.F. Kosarev, A.N. Papyrin, Dokl. Akad. Nauk SSSR 315(1990) 1062.
[2] H. Assadi, et al., Acta Mater. 51 (15) (2003) 4379.[3] T.H. Van Steenkiste, Key Eng. Mater. 197 (2001) 59.[4] C. Amon, et al., Solid Freeform Fabrication Symposium, The University of
Texas at Austin, 1993.[5] J.D. Anderson, Modern Compressible Flow: with historical perspective,
3rd ed., McGraw-Hill, New York, 2003.[6] A.N. Papyrin, et al., ITSC, ASM International, 2001.[7] V. Shukla, G.S. Elliott, B.H. Kear, J. Therm. Spray Technol. 9 (3) (2000)
394.[8] R.C. Dykhuizen, J.R. Smith, J. Therm. Spray Technol. 7 (2) (1998) 205.[9] D.L. Gilmore, et al., J. Therm. Spray Technol. 8 (4) (1999) 576.[10] T. Stoltenhoff, H. Kreye, H.J. Richter, J. Therm. Spray Technol. 11 (4)
(2002) 542.[11] J. Karthikeyan, et al., ITSC, ASM International, 2000.[12] B. Jodoin, ITSC, ASM International, 2001.[13] A.P. Alkhimov, et al., J. Appl. Mech. Tech. Phys. 38 (2) (1997) 324.[14] A.P. Alkhimov, V.F. Kosarev, S.V. Klinkov, J. Therm. Spray Technol. 10
(2) (2000) 375.[15] R.C. Dykhuizen, R.A. Neiser, ITSC, ASM International, 2003.[16] M.J. Zucrow, J.D. Hoffman, Gas Dynamics, vol. I, John Wiley & Sons,
New York, 1976.[17] C. Donaldson, R.S. Snedeker, J. Fluid Mech. 45 (1971) 281.[18] R.A. Granger, Fluid Mechanics, Holt, Rinehart and Winston, New York,
1985.[19] Pattison, J., Ph.D Thesis: Cold Gas Dynamic Manufacturing, in Institute
for Manufactruing, Department of Engineering. 2006, University ofCambridge: Cambridge UK.
[20] Fluent 6.2 User Guide, 1999.[21] F.M. White, Viscous Fluid Flow, 2nd ed., McGraw-Hill, New York, 1991.[22] S.A. Morsi, A.J. Alexander, J. Fluid Mech. 55 (2) (1972) 193.[23] J. Pattison, et al., Int. J. Mach. Tools Manuf. 47 (3–4) (2007) 627.[24] M. Raffel, C. Willert, J. Kompenhans, Particle Image Velocimetry: a
practical guide, Springer-Verlag, Berlin, 1998.[25] G.S. Settles, Schlieren and Shadowgraph techniques: visualising phenom-
ena in transparent media, Springer-Verlag, Berlin, 2001.[26] T. Schmidt, et al., Acta Mater. 54 (2006) 729.