Standard Operating Procedure Teledyne Model 640 - US ...
44
May 10 th , 2019 1 Standard Operating Procedure Teledyne Model 640 Real-Time Continuous PM Monitor
-
Upload
khangminh22 -
Category
Documents
-
view
0 -
download
0
Transcript of Standard Operating Procedure Teledyne Model 640 - US ...

May 10th, 2019
1
Standard Operating Procedure Teledyne Model 640
Real-Time Continuous PM Monitor

May 10th, 2019
2
ACKNOWLEDGMENTS
An SOP for the Teledyne API (T-API) T640x was originally drafted through work order 3-13 on contract EP-G15D-00340 to Sonoma Technology, Inc. (STI). The T640x SOP included substantial input taken from the T-API Model T640x PM Mass Monitor User Manual. User experiences were included by testing a T640x instrument temporarily located at STI’s facility in Petaluma, CA, and EPA’s testing of two T640x instruments in Research Triangle Park, NC. T-API staff provided multiple reviews of the early drafts of the SOP. With a draft T640x SOP in hand, EPA staff solicited input from T640 and T640x users across the country. Input and review of the T640x SOP was received from over a dozen monitoring agencies on a conference call in October of 2017. Additionally, written input was received from Kathy Jones of the Chattanooga Hamilton County Air Pollution Control Bureau and from Mickey Turner of the Clark County Department of Air Quality. EPA colleagues from Regional offices and ORD also provided written input. Comments and edits were received from Adam Zachary of EPA Region 4, Dorothy Crawford of EPA Region 6, and Robert Vanderpool of EPA-ORD. The input from staff at STI, T-API, early adopters of the T640 and T640x in monitoring agencies across the country, and EPA Regional offices staff are all greatly appreciated. The T640x SOP was modified under work order 4-15 to produce this document – the SOP for the T640 instrument. While this SOP may be subject to further revisions as we learn more about how to optimize the operation of this method, it should be far enough along to be of substantial value to agencies that need an SOP to collect data with their T640 monitors. Additional edits, comments, or recommendations on this SOP may be sent to Tim Hanley of the U.S. EPA’s Office of Air Quality Planning and Standards in RTP, NC (email: [email protected]).

May 10th, 2019
3
Table of Contents 1.0 SUMMARY OF METHOD ........................................................................................5
1.1 PRINCIPLES OF OPERATION ...................................................................................... 5 1.2 METHOD REQUIREMENTS ......................................................................................... 5
2.0 DEFINITIONS .............................................................................................................6
3.0 HEALTH AND SAFETY WARNINGS.....................................................................7
4.0 INTERFERENCES......................................................................................................8
5.0 EQUIPMENT AND SUPPLIES .................................................................................8
5.1 INSTALLATION EQUIPMENT AND SUPPLIES ........................................................ 8 5.2 ROUTINE EQUIPMENT AND SUPPLIES.................................................................... 8
6.0 PROCEDURES ............................................................................................................9
6.1 OPERATION ................................................................................................................... 9 6.2 MAINTENANCE AND SERVICE ................................................................................. 9
6.2.1 Maintenance Schedule ........................................................................................... 9
6.3 MAINTENANCE PROCEDURES ............................................................................... 11 6.3.1 Cleaning the T640 Inlet ....................................................................................... 11 6.3.2 Changing the Disposable Filter Units (DFUs) .................................................... 12 6.3.3 Checking Pump Performance .............................................................................. 14 6.3.4 Checking the Flow .............................................................................................. 14 6.3.5 Cleaning the Optical Chamber and the RH/T Sensor .......................................... 14 6.3.6 Inspecting the Sample Tubes ............................................................................... 18
6.4 INSTRUMENT VERIFICATIONS ............................................................................... 18 6.4.1 Zero Test ............................................................................................................. 19 6.4.2 Alternative Procedure for Walk-in Shelters. ....................................................... 21 6.4.3 Pressure Verification ........................................................................................... 22 6.4.4 Ambient Temperature Verification ..................................................................... 23 6.4.5 Sample Flow (5.0 lpm) Verification. ................................................................... 24 6.4.6 PMT Verification – (Performed Quarterly) ......................................................... 25
6.5 INSTRUMENT CALIBRATIONS ................................................................................ 26 6.5.1 Pressure Calibration ............................................................................................ 27 6.5.2 Sample Flow (5.00 lpm) Calibration ................................................................... 27 6.5.3 PMT Calibration .................................................................................................. 29
6.6 TROUBLESHOOTING AND SERVICE ...................................................................... 31 6.6.1 Fault Diagnosis .................................................................................................... 31 6.6.2 Flow Problems ..................................................................................................... 32
7.0 DATA MANAGEMENT AND RECORDS MANAGEMENT PARAMETERS.32
7.1 DATA MANAGEMENT ............................................................................................... 32 7.2 RECORDS MANAGEMENT ....................................................................................... 34

May 10th, 2019
4
8.0 QUALITY CONTROL/QUALITY ASSURANCE ................................................34
9.0 INSTALLATION INSTRUCTIONS .......................................................................34
9.1 Indoor/Outdoor Installation ............................................................................................ 34 9.2 Aerosol Sample Conditioner (ASC) Connections and Installation ................................ 35 9.3 Temperature Probe Connection ...................................................................................... 37 9.4 Power Connection .......................................................................................................... 39 9.5 Communications Interface Connections ........................................................................ 39 9.6 Shelter Installation with Roof Penetration ..................................................................... 39 9.7 Outdoor Enclosure Installation ...................................................................................... 41 9.8 Pneumatics ..................................................................................................................... 42 9.9 Instrument Start-up......................................................................................................... 42
10.0 MONTHLY QC AND MAINTENANCE SHEET ................................................44

May 10th, 2019
5
1.0 SUMMARY OF METHOD
The Teledyne API Model T640 is a real-time, continuous particulate matter (PM) mass monitor that uses scattered light spectrometry for measurement; specifically, it employs broadband spectroscopy using 90° white-light scattering with a polychromatic light-emitting diode (LED). The model T640 is an approved Federal Equivalent Method (FEM) for PM2.5 [EQPM-0516-236]. The T640 also measures PM10 and PM10-2.5, but only the PM2.5 fraction meets FEM requirements. There is one pump in the T640 which operates at a flow rate of 5.0 lpm.
1.1 PRINCIPLES OF OPERATION
The Model T640 PM Mass Monitor is an optical aerosol spectrometer that converts optical measurements to mass measurements by determining sampled particle size via scattered light at the single particle level according to Lorenz-Mie Theory. In brief, the sampling head draws a representative sample of ambient aerosol at a flow rate of 5 lpm. The aspirated particles are then dried (i.e., brought below 35% RH) with the Aerosol Sample Conditioner (ASC) and moved into the optical particle sensor where scattered light intensity is measured to determine particle size diameter. The particles move separately into the T-aperture through an optically differentiated measurement volume that is homogeneously illuminated with polychromatic light. The polychromatic light source, an LED, combined with a 90° scattered light detection, achieves a precise and unambiguous calibration curve in the Mie range, resulting in a large size resolution. Each particle generates a scattered light impulse that is detected at an 85° to 95° angle where amplitude (height) and signal length are measured; the amplitude of the scattered light impulse is directly related to the particle size diameter. The T-aperture and simultaneous signal length measurements eliminate border zone error, which is characterized by the partial illumination of particles at the border of the measurement range.
1.2 METHOD REQUIREMENTS
The method requirements for the T640 were published in the Federal Register in Volume 81, page 45285 on July 13, 2016 as part of the Federal Equivalent Method (FEM) Designation. These requirements were published as: ‘‘Teledyne Advanced Pollution Instrumentation Model T640 PM mass monitor,’’ continuous ambient particulate monitor operated at a volumetric flow rate of 5.0 Lpm, equipped with a TAPI 5-Lpm sample inlet (P/N: 081050000), TAPI aerosol sample conditioner (P/N:081040000), configured for operation with firmware version 1.0.2.126 or later, and operated in accordance with the Teledyne Model T640 Operations Manual. This designation applies to PM2.5 measurements only. Additional requirements of operating the method may not be explicitly included as part of the method designation; however, they would apply for consistency with standard monitoring

May 10th, 2019
6
practices and use of the data for comparison to the NAAQS. For example, the sample volume for the method is reported at actual conditions (local conditions or LC) for PM2.5. Requirements such as this should be referenced in a monitoring organization’s Quality Assurance Project Plan (QAPP). Other requirements not explicitly stated as part of the method designation, included in the T640 operations manual, applicable sections of the CFR, or identified in an agency’s QAPP, do not apply.
2.0 DEFINITIONS
PM2.5 is particulate matter with an aerodynamic diameter less than or equal to a nominal 2.5 µm. PM10 is particulate matter with an aerodynamic diameter less than or equal to a nominal 10 µm. PM10-2.5 is coarse particulate matter with aerodynamic diameter in the nominal range of 2.5 to 10 µm. Most technical terms in this SOP are defined as they are introduced. A few important definitions are provided in Table 2-1. The terms monitor and instrument are used interchangeably in this document.
Table 2-1. Terms and definitions.
Term Definition
Accuracy The degree of agreement between an observed value and an accepted reference value; includes a combination of random error (precision) and systematic error (bias) components due to sampling and analytical operations.
Actual conditions The actual ambient temperature and pressure of a gas at the time its volume (or volumetric flow rate) is measured.
Bias The systematic or persistent distortion of a measurement process that causes errors in one direction.
Calibration The act of adjusting an instrument after comparison with a standard.
Chain-of-custody Unbroken trail of accountability that verifies the physical security of environmental samples and documented information.
Coefficient of variation A standardized measure of dispersion of a probability distribution or frequency distribution. Defined as the ratio of the standard deviation to the mean.
Downtube
The vertically oriented tube that connects the PM2.5 sampler inlet to sampler components inside the sampler case. To check the sample flow rate, the sampler inlet is removed from the downtube and a flow rate standard is connected in its place.

May 10th, 2019
7
Term Definition
Flow adapter
A tight-fitting connecting device, with an isolating valve, that is inserted in place of the PM2.5 sampler inlet on the upper end of a sampler’s downtube and used to connect a flow rate calibration or audit device to check the sample flow rate. In some cases, the device may also be used for leak checks. Sometimes referred to as the flow shut-off valve.
Flow calibration device
A National Institute of Standards and Technology (NIST)-traceable flow determining apparatus (also called a flow rate standard) that is attached to the flow adapter device and used to assist in measuring and setting the volumetric flow rate of air into the sampler.
Impactor An inertial particle-size separator. A PM2.5 reference method sampler uses a specially shaped inlet followed by an impactor that allows only PM of well-defined size ranges to penetrate to the filter collection portion of the collector.
Leak check A test to determine if any post-air flow is passing the expected flow path of the PM2.5 sampler.
Off Scan When the data stream from the monitor is disabled from logging to the data system. This is typically done during periods of maintenance, verifications, or calibrations.
Orifice flow rate check device
One type of flow rate calibration or check device (transfer standard), based on an established relationship between flow rate and pressure drop across the orifice plate. An orifice’s operating characteristics are determined in the laboratory using a flow rate standard such as a soap film flowmeter. Orifice devices generally require temperature and pressure corrections. Modern orifice flow rate check devices generally make the needed temperature and pressure corrections for the user. The orifice flow rate check device most commonly used on PM2.5 samplers may also be called a venturi.
Precision A measure of mutual agreement among individual measurements of the same property, usually under prescribed similar conditions, expressed generally in terms of standard deviation.
Verification The act of checking or verifying an instrument against a standard; involves no adjustment of the instrument.
3.0 HEALTH AND SAFETY WARNINGS
To avoid damage to the monitor, ensure that the AC power voltage matches the voltage indicated on the monitor’s model/specifications label located on the rear panel before plugging the T640 into line power. High voltages are present inside the instrument. Ensure that the power cord being used is capable of carrying the power rating of the instrument (see rear panel label). Note:
• Ensure that the power connection has a functioning ground connection. • Do not defeat the ground wire on power plug. • Turn off instrument power before disconnecting or connecting electrical subassemblies.

May 10th, 2019
8
• Do not operate the instrument with its cover off. Some repair and troubleshooting operations need to be carried out with the monitor open and running. Use common sense when operating inside a running monitor. Exercise caution to avoid electrical shocks and electrostatic or mechanical damage to the monitor. Do not drop tools into the monitor or leave tools in the monitor after your procedures. Do not short or touch electric connections with metallic tools while operating inside the monitor. For monitors installed in small shelters, beware of external elements (i.e., weather conditions) when performing maintenance which exposes the monitor to ambient conditions.
4.0 INTERFERENCES
There are no known interferences to the collection of PM2.5 using this method; however, surface roughness and other variables do affect sizing algorithms in all light scattering instruments. Since the PM concentration output is based on a calculation using the last 10 minutes of data, the operator should wait a minimum of 10 minutes after reassembly of the instrument before turning the data system to “On Scan.”
5.0 EQUIPMENT AND SUPPLIES
5.1 INSTALLATION EQUIPMENT AND SUPPLIES
Installation requires hand tools (flat blade screw driver and adjustable wrench) and silicone sealant. Most shelters have the necessary roof perforation needed. If not, it may be necessary to work with the shelter manufacturer on the appropriate method for making the perforation. Most of the routine equipment and supplies listed below will be needed for the initial installation to ensure the instrument is operating properly.
5.2 ROUTINE EQUIPMENT AND SUPPLIES
The following equipment, supplies, and expendables are required for sensor checks, adjustments, and operation:
1. HEPA filters (x2) configured with adapter to connect to downtube for zero testing. 2. Auditing device (NIST-traceable pressure and temperature standard and flow standard)
used for pressure, temperature, and flow verifications and calibrations. The auditing device is required to have certification within the last 12 months.
3. SpanDust™ used for photomultiplier tube (PMT) verification and adjustment as needed. 4. O-ring grease packets or tube of vacuum grease. 5. Canned air for electronic use (e.g., DustOff, BlowOff electronics dusters). 6. Lint-free washable microfiber rags or lint-free disposable wipes. 7. Distilled water in a spray bottle.

May 10th, 2019
9
8. Mild detergent. 9. Swagelok® Cap for ¼” tubing. 10. Allen wrench. 11. Philips screwdriver. 12. Cleaning brushes. 13. Cotton tipped applicators. 14. Pull rope assembly (used for pulling cleaning rags or tube brush through the inlet tube). 15. Disposable Filter Units (DFUs). 16. USB flash memory drive (for firmware updates [when necessary] and manual data
downloads).
6.0 PROCEDURES
6.1 OPERATION
Upon startup, sampling begins. Allow a minimum of 20-minute warming period for reliable readings. This should provide sufficient time for the LED temperature to stabilize (~10 minutes) and then another 10 minutes for the smoothing algorithm to incorporate the data at a stable LED temperature. Track LED temperature from the dashboard to ensure stability of the instrument.
6.2 MAINTENANCE AND SERVICE
6.2.1 Maintenance Schedule
As a part of routine system management, preventive maintenance includes inspections, cleaning, verifications, and calibrations. Table 6-1 provides a list of actions and their frequencies. Section 5.2 of the user manual describes procedures.

May 10th, 2019
10
Table 6-1. T640 Maintenance and QC Check Schedule.
Maintenance or Check Action Tolerance Frequency
Check Pump Performance PWM1 value < 80% PID1 value < 85%
Monthly
Check for leaks with zero filter Acceptance criteria is 0.0 – 0.3 µg/m3 Action level is 0.1 to 0.3 µg/m3 (for each PM metric)
Monthly
Clean Inlet NA Quarterly
Check/Adjust PMT with SpanDustTM (measured peak, limit value displayed on bottle +/- 0.5)
Stated value on SpanDustTM bottle +/- 0.5 (e.g., 11.3 with a tolerance of 10.8 to 11.8)
Quarterly. Avoid over performing this procedure. If problems persist, wait 10 minutes and retry.
Ambient Pressure +/- 10 mm Hg Monthly
Ambient Temperature +/- 2°C Monthly
Flow rate verification for sample flow: 5.0 lpm
+/- 5% of standard compared to current reading on T640; (e.g., 4.75 – 5.25 lpm if T640 reads 5.00).
Monthly
Inspect and clean optical chamber and relative humidity/temperature (RH/T) sensors
NA Every six months or as needed, e.g., high dust load
Change Disposable Filter Unit (DFU) for 5-lpm sample flow NA
Annually or when Pump PWM value approaches 80%.
Inspect inner and outer sample tubes NA Monthly or as needed
1 Pulse width modulation (PWM); proportional, integral, differential (PID) loop

May 10th, 2019
11
6.3 MAINTENANCE PROCEDURES
This section provides cleaning and maintenance information for the inlets and filters. Always allow at least 10 minutes of operation after a procedure to ensure reliable operation.
6.3.1 Cleaning the T640 Inlet
To clean the T640 inlet (Figure 1), ensure data are “Off Scan.”
1. Power off the pumps from the Setup >Vars >Pump Control menu. Pump choices are auto, off, and cleaning cycle. Press ‘edit’ and then ‘off’ to turn off the pumps.
2. Remove the sampling inlet from the downtube.
3. Place the flow audit adapter or HEPA filter on the downtube to minimize opportunity of dust entering the monitor.
4. Disassemble the sampling inlet (unscrew the two screws at base of inlet and base plate).
5. Carefully and thoroughly remove any dust deposits from inside the inlet.
6. Remove any insects or other debris from the filtering screen.
7. Clean all the components using water and a mild detergent, if necessary.
8. Dry all components thoroughly with a clean cloth and blow canned air through the nozzles.
9. Check and, if needed replace, the O-rings located on the outside and the inside of the base plate, and grease them with vacuum grease.
10. Reassemble the sampling inlet, sliding the baseplate back into the base of the inlet body, making sure to line up with the screw holes. The screws should be reinstalled using hand-tight pressure.
11. Reconnect the sampling line.
12. Power up the pumps from the Setup >Vars >Pump Control menu. Press ‘edit’ and then ‘auto’ to turn the pumps back on. Allow 10 minutes for the system to return to reliable operation. Ensure the data acquisition system is reengaged.
This procedure should be repeated per the schedule listed in Table 6-1.

May 10th, 2019
12
Figure 1. T640 Inlet (standard) and ASC Assembly.
6.3.2 Changing the Disposable Filter Units (DFUs)
There is one DFU on the T640 – an internal filter for the 5.0 lpm pump (Figure 2). For this procedure, ensure data are “Off Scan.” Internal Pump Filter:
1. Power off the internal pump from the control menu: Setup >Vars >Pump >Edit >Off >Done.
2. Remove the screws at the sides of front panel, if installed.
3. Pull open the instrument’s front panel, using the front panel finger grips (Figure 3).
4. Write “New” and today’s date on the filter with a sharpie (recommended).
Figure 2. Disposable Filter Unit (DFU) labeled as new.

May 10th, 2019
13
Figure 3. Opening the front panel.
5. Noting its orientation, remove the old DFU by detaching from the pneumatic quick-connect fittings, and replace with a new DFU matching the orientation (Figure 4).
Figure 4. Internal DFU.
6. Power on the internal pump from the control menu: Setup >Vars >Pump >Edit >Auto >Done.
7. Review the internal pump flow rate reading in Dashboard or Home Screen to ensure the 5.0 lpm flow is reading as expected: >Main Menu >Home >Dashboard.

May 10th, 2019
14
6.3.3 Checking Pump Performance
The internal 5 lpm pump must maintain proper flow for measurement accuracy. Check the PWM performance level in the Dashboard (if this parameter is not found in the Dashboard, configure the Dashboard to add it; see Section 3.2.9 of the T640 User Manual). The Pump PWM should be running between 35% and 80%.
It is strongly recommended to pay attention to the sample flow and PWM reading. This is recorded monthly on the Monthly QC and Maintenance Sheet (see section 10 of this SOP). If any issues are found with flow verification or calibration, refer back to the Pump PWM reading when the instrument was known to be performing within acceptable flow and PWM tolerances. If a new DFU filter is placed in the instrument and the Pump PWM does not return to near where it was reading when the filter was previously new then troubleshoot by inspecting all sample lines looking for SpanDust or anything else that may be affecting the flow. See Table 6-2 for additional troubleshooting guidance.
6.3.4 Checking the Flow
Check the Sample Flow levels in the Dashboard (if it’s not found in the Dashboard, add it through the Dashboard configuration page; see Section 3.2.9 of the T640 User Manual). If out of range (5.00 lpm, +/- 0.25 lpm for sample flow rate, so 4.75 lpm to 5.25 lpm), refer to Table 6-2 for troubleshooting guidance.
6.3.5 Cleaning the Optical Chamber and the RH/T Sensor
Cleaning the optical chamber and sample lines connecting to the chamber should be performed at least every 6 months and more frequently if issues are suspected; however, it can be a somewhat tedious procedure, especially for installations in small shelters located outside. Before starting, carefully consider and plan for an appropriate amount of time to perform this procedure, including disassembly and reassembly, as well as all associated verifications and calibrations. For outdoor shelters, additionally consider if any precipitation or extreme weather is forecasted. As much as four hours may be needed to fully complete the procedure for outside installations and two hours for indoor ones when using a slip coupler. Also, we highly recommend taking a few photos with a smart phone or similar device prior to disconnecting any of the sample lines inside the monitor. For this procedure, ensure data are “Off Scan.”
1. Power down the monitor and unplug.
2. Power down the bypass pump.
3. Disconnect the ASC power line from the back of the instrument.
4. Adjust the slip coupler and move the monitor to the side so that there is enough room for the ASC to be removed (see procedure 6.4.2).

May 10th, 2019
15
5. Remove and clean both the extension tube and the upper inlet tube that sit directly above the ASC (Figure 21).
6. Remove the ASC by carefully lifting it up from monitor chassis.
7. Remove and clean the Aluminum Adapter (Figure 19) that fits over the black inlet nozzle. Check the O-ring that sits on the adapter for cracks or breaks; clean and/or replace as necessary.
8. Remove and clean the Black Inlet Nozzle (Figure 18) sample tube that fits on top of the optical cell.
9. Unscrew the monitor lid (it may have 4 screws, 2 on each side) and lift the lid off of the monitor chassis.
10. It is recommended to take photos of the sample line connections with a smart phone or similar device.
11. Remove all pertinent connections from the ASC support, which include the ASC support’s black electrical connector from the circuit board, tubing from the outlet of the DFU, and tubing from the outlet of the pulsation dampener.
12. Remove the ASC support, which straddles the sensors. Four screws secure that support to the floor of the instrument, two on each footing (Figure 5). Note: it is possible to clean the optics without removing the ASC support; however, removing the ASC support will allow more room to access the tubing lines and optical chamber.
Figure 5. Maintenance: Optical Chamber and RH/T Sensor Access.

May 10th, 2019
16
13. Locate the optical cell, the cup at the bottom of optics chamber and its tubing, and the Relative Humidity and Temperature (RH/T) sensor (Figure 6).
Figure 6. Maintenance: Location of Optics Chamber and RH/T Sensor.
14. Remove the optical cell from the optics chamber, and remove the cup, including its tubing, from the optics chamber bottom; detach the RH/T sensor tubing from the DFU filter (Figure 7). It is very important that all components are disassembled before blowing air into the chamber.

May 10th, 2019
17
Figure 7. Maintenance: Optical Chamber Disassembly.
15. Clean the optics chamber’s interior surfaces, ensuring to include windows, with a lint-free cloth (Figure 8).
Figure 8. Maintenance: Optics Chamber Windows.
16. Use canned air made specifically for dusting electronics to blow any dust or other debris from the optics chamber, from the cup, from the bottom of the optics chamber, and from

May 10th, 2019
18
the tubing (Figure 9).
Figure 9. Maintenance: Final Dusting.
17. When cleaning has been completed, reassemble the optics chamber components; reinsert the cup to the bottom of optics chamber; reconnect the tubing from the cup in bottom of the chamber to the RH/T sensor and from the RH/T sensor to the DFU filter, reinstall the ASC support, re-connect all power and flow lines, and move the monitor back in line so that the slip coupler can be reconnected.
18. Close the instrument and power back both the bypass pump and monitor.
19. Review dashboard to ensure all flows are operating as expected.
20. Perform a Zero Test (Section 6.4.1 of this SOP).
21. Perform a PMT sensor check with the SpanDust™ (Section 6.4.6 of this SOP).
6.3.6 Inspecting the Sample Tubes
Look inside the sample tubes for debris or dust on the walls. If needed, push a rag or a paper towel through the tubes; then use canned air made specifically for electronics to blow through the line for final cleaning. However, do not completely block a sample tube still under vacuum, as the sample flows should never be blocked while the unit is still operating.
6.4 INSTRUMENT VERIFICATIONS
There are five basic verification checks listed below. All verifications should be conducted first before any calibrations, and then calibrations can be conducted (see Section 6.5) where necessary. Verifications are conducted before calibrations as this is necessary to document the “as found” conditions of the instrument. Three of the verifications can be calibrated, if necessary. There is no adjustment for either the zero test or ambient temperature and as such failure of one or both of these checks results in the need to troubleshoot rather than adjust a setting. The Zero Test, Pressure sensor, Ambient Temperature sensor, and Flow sensor verifications are all performed monthly. The PMT verification using SpanDust™ is performed quarterly. All five checks should always be performed in the specific order shown below:

May 10th, 2019
19
1. Zero Test;
2. Pressure sensor verification;
3. Ambient Temperature sensor verification;
4. Flow sensor verification;
5. PMT verification using SpanDust™.
Once all verifications are completed, calibrations may be conducted (see Section 6.5), where necessary, for pressure, flow, and the PMT. For the Pressure Cal and the Flow Cal menu, note that the “Measured” parameter provides the value measured by the T640, and the “Actual” parameter is the value that is to be input from the reading measured by the external auditing device.
6.4.1 Zero Test
The internal components of the T640 are not meant to be under strict vacuum as what would normally be done in a leak test. So, to avoid damage to internal components, it is recommended that the inlet never be capped (air tight) while the instrument pumps are running. The Zero Test is a way to check for leaks that do not involve pulling a vacuum on the system. Note: no adjustment is made if the zero test is not acceptable; rather troubleshoot the instrument until resolved. For this procedure, ensure data are “Off Scan.” There are two options to perform a zero test. In the first (and recommended) zero test instructions the calibration software is initiated to bypass the boxcar 10-minute smoothing of data. This allows an almost immediate response of the PM channels to their expected reporting of 0.0 µg/m3 for each PM metric. In the second set of instructions a manual zero test can be run without initiating the calibration software. However, this approach to a zero test requires waiting at least 10-minutes so that each channel of data can be smoothed according to the corresponding setting from the boxcar (i.e., 10 minutes). Only one type of zero test is to be performed. Each set of procedures are explained below: Zero Test with near immediate response:
1. Remove the inlet and fit a HEPA filter to the sample port. Ensure the tubing is not kinked.
2. From the main screen on the T640 panel display, select:
- “Calibration”;
- “Leak Check”; and
- “Start”.
3. Observe the front panel display on the monitor until the PM values (PM10 and PM2.5 channels) are presented and steady; record to “Monthly QC and Maintenance Sheet”.

May 10th, 2019
20
4. If each PM value reaches 0.0, accept the zero test and move to step 7. If data are in the range of 0.1 to 0.3, accept the data and troubleshoot. If after ten or more minutes the data are still at 0.4 or greater, identify the data as suspect on the “Monthly QC and Maintenance Sheet” and troubleshoot. If the PM values are not reading zero, then it’s likely to be one of two issues:
- There may be a leak in the system above the optical sensor (i.e., from the optical sensor nozzle up to where the HEPA filter was fitted). Troubleshoot by checking each connection between monitor and HEPA filter and ensuring there is a good seal or:
- It is possible the HEPA filter being used is either bad or leaking. It is recommended to have a second filter handy to check.
5. If after following these steps each PM channel does not reach (0.0), repeat steps above including resealing the HEPA filter to the sampler port and cleaning the downtube with a lint free cloth and use of a dowel.
6. Record any updated results to the “Monthly QC and Maintenance Sheet.”
7. Once each PM channel reaches zero (0.0) for each PM metric, press “Stop” and then the
home button.
8. Disconnect the HEPA filter.
9. Disassemble the zero apparatus.
Manual Zero Test:
1. Remove the inlet and fit a HEPA filter to the sample port. Ensure the tubing is not kinked.
2. Observe the PM values on the front panel display. Press either “Home” or the key.
3. After approximately 10 minutes, the PM values should be at zero (0.0) for each PM metric. If data reaches 0.0, accept the zero test and move to step 5. If data are in the range of 0.1 to 0.3, accept the data and troubleshoot. If after ten minutes or more the data are still at 0.4 or greater, identify the data as suspect on the Monthly QC and Maintenance Sheet and troubleshoot. If the PM values are not reading zero, then it’s likely to be one of two issues:
- There may be a leak in the system above the optical sensor (i.e., from the optical sensor nozzle up to where the HEPA filter was fitted). Troubleshoot by checking each connection between monitor and HEPA filter and ensuring there is a good seal, or
- It is possible the HEPA filter being used is either bad or leaking. It is recommended to have a second filter handy to check.

May 10th, 2019
21
4. If after ten minutes from any adjustment, values don’t reach zero (0.0), troubleshoot and repeat steps above.
5. Once PM values reach zero (0.0) for each PM metric, disconnect the HEPA filter.
6. Record to “Monthly QC and Maintenance Sheet.”
6.4.2 Alternative Procedure for Walk-in Shelters.
For walk-in shelter installations, a single operator will be challenged to review data on the front panel of the monitor while performing QC verifications and calibrations on a roof. Two operators could be used; however, in most cases this is not practical. To allow verifications and calibrations for walk-in shelter applications, Teledyne has a slip coupler which can be utilized to allow audit devices and SpanDustTM to be used from inside the shelter. The procedure for use of the slip coupler does not apply to zero tests as the HEPA filter should be installed on the downtube where the standard T640 inlet is normally connected to the downtube on the roof. Also, the procedure for verifying ambient temperature needs to be conducted on the roof so that the routine ambient temperature probe can be checked. For all other verifications and calibrations, where necessary, the following applies to using a slip coupler. For this procedure, ensure data are “Off Scan.”
1. Holding the downtube above the slip coupler with one hand, lift the slip coupler with your other hand from its current position to a height just high enough so that the slip coupler is no longer touching the aluminum downtube below (Figure 10). The downtube above the slip coupler should be held in a consistent vertical position so that the seal between the downtube and roof flange is maintained.
Figure 10. Slip coupler in normal position and lifted vertically.
2. Carefully move the T640 monitor chassis and ASC away from the downtube so that there is enough clearance for the audit device to be attached. This requires moving the base of the monitor (Figure 11).

May 10th, 2019
22
Figure 11. Slip coupler moved to the side to allow monitor use with audit devices.
3. Detach the ambient temperature probe on the back of the monitor and temporarily attach the short cable temperature probe so that the temperature inside the shelter is being used for calculations of flow.
4. Perform remaining verifications and where applicable, calibrations. A verification of the short temperature probe is also recommended.
5. With all verifications and calibrations complete, detach short cable temperature probe and re-attach the ambient temperature probe from the roof.
6. Align the T640 monitor chassis so that the ASC is directly below the slip coupler. 7. Holding the downtube above the slip coupler with one hand, reengage the slip coupler
back to its original position with your other hand. The downtube above the slip coupler should be held in a consistent vertical position so that the seal between the downtube and roof flange is maintained.
8. Visually inspect downtube to ensure it is plumb. Use a level if available.
6.4.3 Pressure Verification
The pressure measurement of the T640 is for the ambient pressure in which the instrument is operated. No direct pneumatic connection to the instrument needs to be made to perform this check and data are not affected. To change pressure units to mm Hg, go to Setup >Vars >Pressure Units >mmHg.
1. With the Pressure Standard operating and measuring the ambient pressure in the same room as the T640 monitor, navigate to the Pressure Cal menu: >Calibration >Pressure Cal. Alternatively, pressure can be obtained through the dashboard on the main screen.
2. Compare the “Measured Pressure” in this screen to the Audit Pressure Standard (Figure 12).
3. If the two values differ by more than +/- 10 mm Hg, note on “Monthly QC and Maintenance Sheet” and continue with the remaining verifications.

May 10th, 2019
23
Figure 12. Pressure calibration screen.
6.4.4 Ambient Temperature Verification
The ambient temperature probe can be verified; however, there is no available way to calibrate this sensor. Temperature probes that do not meet the expected tolerance of +-2°C from a temperature standard should be inspected and cleaned. Cleaning of the gill screen may also help to ensure air can pass freely to the probe. A spare temperature probe should be available in case the verification continues to fail the acceptable tolerance. The following procedure applies to a temperature verification: Temperature verifications can be conducted either with the instrument in normal operation or with the unit operating, but “Off Scan”
1. Obtain the ambient temperature reading from the front panel of the T640 monitor. Alternatively, ambient temperature can be obtained through the dashboard on the main screen.
2. Hold the temperature probe of the audit device in close proximity to the gill screen which houses the ambient temperature probe of the T640. If there is direct sunlight, ensure the audit probe is held behind the gill screen relative to the sun so that the gill screen casts a shadow on the audit device temperature probe.
3. Wait at least one minute for the audit device temperature to stabilize. 4. Record the audit device ambient temperature and T640 ambient temperature to the
“Monthly QC and Maintenance sheet.” 5. Compare the audit temperature to the T640’s displayed ambient temperature. If the
difference between the two temperatures exceeds +/-2°C, troubleshoot and repeat. 6. If the verification cannot meet the required +/- 2°C tolerance, replace the temperature
probe and repeat the verification test.

May 10th, 2019
24
6.4.5 Sample Flow (5.0 lpm) Verification.
Flow rate verifications for sample flow rate (5.0 lpm) can be conducted with the instrument operating normally so long as the data are “Off Scan.” Although this section is for verifications, the information available in the flow rate calibration screen may also be useful for verifications. The flow calibration screens can be accessed at: >Calibration >Sample Flow Cal. Flow rate calibration procedures are detailed in Section 6.5.2. Verification of Sample Flow (5.0 lpm). For this procedure, ensure data are “Off Scan.”
1. Set up your NIST-traceable flow standard transfer device with the appropriate inlet for the flow to be calibrated. Ensure the audit device is appropriately sized for 5.0 lpm flow.
2. Remove the inlet from the Upper Inlet Tube.
3. Connect the Flow Standard to the top of the Upper Inlet Tube. Ensure the tubing connecting the inlet to the Flow Standard is not kinked.
4. With the T640 running, go to the Calibration >Sample Flow Cal menu. Alternatively, you can view sample flow from the dashboard.
5. Wait at least one minute for the flow to re-stabilize.
6. Compare the “Measured Flow” in this screen to the Flow Standard (Figure 13) and determine if these values differ by more than 5%, (e.g., outside of 4.75 – 5.25 lpm for sample flow, if the sampler reads 5.00).
7. Record the measured flow rate difference on the “Monthly QC and Maintenance Sheet.” If the sample flow rate meets the required tolerance, then you are done with the sample flow verification. If the sample flow rate is outside of the acceptable tolerance, perform a sample flow calibration as detailed in Section 6.5.2.
8. Record the results on the “Monthly QC and Maintenance Sheet.”
Figure 13. Sample Flow calibration screen.

May 10th, 2019
25
6.4.6 PMT Verification – (Performed Quarterly)
The Particle Sensor PMT verification uses SpanDust™, a monodisperse dust with a specific spherical diameter and known refractive index. All T640 instrument PMTs have a very specific response to this span dust which allows for the sensor to be checked and adjusted in the field for drift caused by contamination of the optics. This is not a calibration of the optical sensor based on the mass concentration of dust being used, but simply a mechanism to check and adjust the PMT response to particles with a specific and known refractive index. Note: Although the PMT verification is a very useful check that tells the user if the performance of the monitor spectrometer is as expected, multiple checks of the PMT or individual verifications that lead to too must span dust entering the monitors optics can itself lead to poor performance of the monitor’s spectrometer, flow system, and/or RH sensor. Careful attention needs to be made to ensure a minimum amount of span dust enters the sample tube during a verification and that repeats of verifications are kept to a minimum. For a step by step demonstration of the PMT Adjustment, use the QR code below to view a video by Teledyne API. Also available at: https://www.youtube.com/watch?v=pZYnXwYwtIs. For this procedure, ensure data are “Off Scan.”
1. Navigate to the PMT Adjust screen: >Home >Calibration >PMT Adjust.
2. Press the Start button on this screen to suspend normal data acquisition and to start this adjustment process.
3. Remove the T640 sample inlet.
4. Prepare the SpanDust™ bottle by uncapping the “air intake” tubing on the cap of the bottle.
5. Place the tube from the SpanDust™ bottle into the top of the Upper Inlet Tube for the instrument.
6. Ensure that the silicone tube fits snugly inside the aluminum inlet tube, and do not allow the bottle to hang, as it could dislodge the silicone tube from the inlet tube.
7. Gently tap the SpanDust™ bottle to barely agitate the contents just enough to allow the dust to be pulled into the sensor, and allow 30 seconds for the Peak Channel reading in this screen to respond (Figure 14).
8. Record the maximum Peak Channel, PMT Setting and Peak Channel Counts to the “Monthly QC and Maintenance Sheet.”
9. If the Peak Channel reading meets the acceptable ± 0.5 of SpanDustTM value stated on bottle, then proceed to step 11.
PMT Adjustment
Video • • •

May 10th, 2019
26
10. If the Peak Channel is not acceptable, then retry one more time by pressing the “Stop” button, then the “Start” button on the T640, then proceed to step 7 above. If after two tries the Peak Channel is still not acceptable, then move to the instrument calibration procedures described in Section 6.5
Figure 14. PMT adjust screen.
11. Reattach the sample inlet and press the Stop button to stop the adjustment process and resume normal data acquisition.
12. Wait 10 minutes, review data on the home screen of the T640, and then bring unit back “On Scan” in the data system.
6.5 INSTRUMENT CALIBRATIONS
There are three checks of the monitor that can be calibrated. These calibrations are performed after all verifications (see Section 6.4) are conducted. Calibrations only need to be performed for the checks not meeting their expected performance criteria. The checks that can be calibrated are conducted in the following order, as necessary:
1. Pressure sensor calibration;
2. Flow sensor calibration and re-verification; and
3. PMT calibration using SpanDust™.

May 10th, 2019
27
6.5.1 Pressure Calibration
The pressure measurement of the T640 is for the ambient pressure in which the instrument is operated. No direct pneumatic connection to the instrument needs to be made to perform this calibration and data are not affected. For this procedure, ensure data are “Off Scan.”
1. With the Pressure Standard operating and measuring the ambient pressure in the same room as the T640 monitor, navigate to the Pressure Cal menu: >Calibration >Pressure Cal.
2. Compare the “Measured Pressure” in this screen to the Audit Pressure Standard (Figure 15).
3. If the two values differ by more than +/- 10 mm Hg, then press the value button in the “Actual Pressure” field, enter the value measured by the Pressure Standard and press “enter.” Then press the “Calibrate” button on the screen.
4. Record the test results on the “Monthly QC and Maintenance Sheet.”
The Measured Pressure value should change to closely match the Actual Pressure within a few seconds.
Figure 15. Pressure calibration screen. IMPORTANT: Perform this calibration prior to any flow calibration.
6.5.2 Sample Flow (5.00 lpm) Calibration
Flow rate calibration is conducted on the sample flow (5 lpm) by going to the sample flow rate calibration menu at: >Calibration >Sample Flow Cal. Once the flow is calibrated, it should be re-

May 10th, 2019
28
verified to make sure it is within a tolerance of +/-2%. The flow calibration should be conducted after all verifications and a pressure calibration have been performed, as necessary. Calibration of Sample Flow (5.0 lpm). For this procedure, ensure data are “Off Scan.”
1. Set up your NIST-traceable flow standard transfer device with the appropriate inlet for the flow to be calibrated. Ensure the audit device is appropriately sized for 5.0 lpm flow.
2. Remove the inlet from the Upper Inlet Tube.
3. Connect the Flow Standard to the top of the Upper Inlet Tube. Ensure the tubing connecting the inlet to the Flow Standard is not kinked.
4. With the T640 running, go to the Calibration >Sample Flow Cal menu.
5. Wait at least one minute for the flow to re-stabilize.
6. Compare the “Measured Flow” in this screen to the Flow Standard (Figure 16) and determine if these values differ by more than 5%, (e.g., outside of 4.75 – 5.25 lpm for sample flow, if sampler reads 5.00).
7. Record the test results on the “Monthly QC and Maintenance Sheet.” If the sample flow meets the required tolerance, proceed to step 13 as you are done with the sample flow. If the sample flow rate is outside of the acceptable tolerance, continue with step 8 to perform a calibration of the sample flow rate.
8. If the Sample flow is off by more than 5%, press the “Start” button (this disables the internal data logging), and then “Actual Flow.”
9. Enter the value measured by the Flow Standard and hit “Enter,” then press the “Calibrate” button on this screen. The Measured Flow rate value should change to closely match the Actual Flow rate within a few seconds.
10. Record the results on the “Monthly QC and Maintenance Sheet.”
11. Continue reading the flow rate standard and ensure standard is within 2% of the measured flow (4.90 – 5.10 lpm). Record the test results on the “Monthly QC and Maintenance Sheet.”
12. Press “Stop” on the sample flow calibration menu to end the sample flow calibration procedure and return to normal operation.

May 10th, 2019
29
Figure 16. Sample Flow calibration screen.
6.5.3 PMT Calibration
Once all verifications and any necessary calibrations to the pressure and flow systems are complete, an adjustment of the Particle Sensor PMT may be performed using SpanDust™. A calibration of the PMT is an adjustment in the field for drift caused by contamination of the optics. Note: Careful attention needs to be made to ensure a minimum amount of SpanDust™ enters the sample tube during an adjustment of the PMT and that repeats of this calibration are kept to a minimum. For a step by step demonstration of the PMT Adjustment, use the QR code below to view a video by Teledyne API. Also available at: https://www.youtube.com/watch?v=pZYnXwYwtIs. For this procedure, ensure data are “Off Scan.”
1. Navigate to the PMT Adjust screen: >Home >Calibration >PMT Adjust.
2. Press the Start button on this screen to suspend normal data acquisition and start this adjustment process.
3. Remove the T640 sample inlet.
4. Prepare the SpanDust™ bottle by uncapping the “air intake” tubing on the cap of the bottle.
5. Place the tube from the SpanDust™ bottle into the top of the Upper Inlet Tube for the instrument.
PMT Adjustment
Video • • •
May 10th, 2019
30
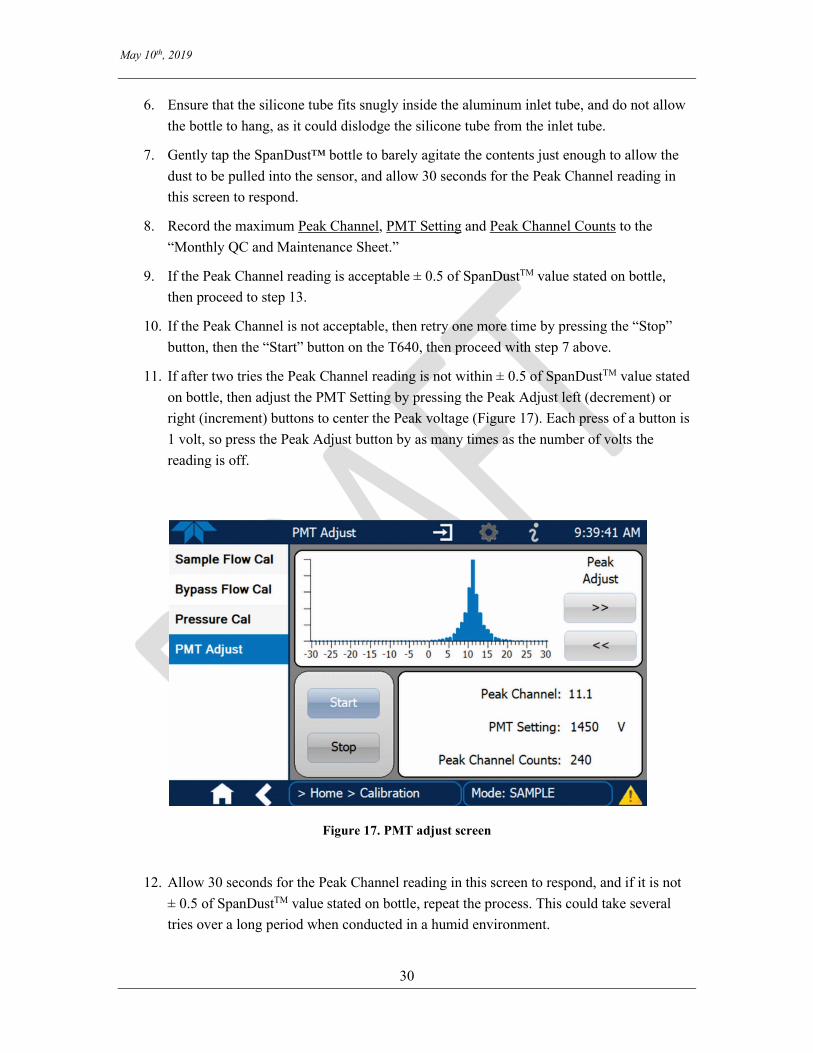
6. Ensure that the silicone tube fits snugly inside the aluminum inlet tube, and do not allow the bottle to hang, as it could dislodge the silicone tube from the inlet tube.
7. Gently tap the SpanDust™ bottle to barely agitate the contents just enough to allow the dust to be pulled into the sensor, and allow 30 seconds for the Peak Channel reading in this screen to respond.
8. Record the maximum Peak Channel, PMT Setting and Peak Channel Counts to the “Monthly QC and Maintenance Sheet.”
9. If the Peak Channel reading is acceptable ± 0.5 of SpanDustTM value stated on bottle, then proceed to step 13.
10. If the Peak Channel is not acceptable, then retry one more time by pressing the “Stop” button, then the “Start” button on the T640, then proceed with step 7 above.
11. If after two tries the Peak Channel reading is not within ± 0.5 of SpanDustTM value stated on bottle, then adjust the PMT Setting by pressing the Peak Adjust left (decrement) or right (increment) buttons to center the Peak voltage (Figure 17). Each press of a button is 1 volt, so press the Peak Adjust button by as many times as the number of volts the reading is off.
Figure 17. PMT adjust screen
12. Allow 30 seconds for the Peak Channel reading in this screen to respond, and if it is not ± 0.5 of SpanDustTM value stated on bottle, repeat the process. This could take several tries over a long period when conducted in a humid environment.

May 10th, 2019
31
13. Once the Peak Channel reading is ± 0.5 of SpanDustTM value stated on bottle, record the test results on the “Monthly QC and Maintenance Sheet.”
14. Reattach the sample inlet and press the Stop button to stop the adjustment process and resume normal data acquisition.
15. Wait 10 minutes, review data on home screen of T640, and then bring unit back “On Scan” in the data system.
6.6 TROUBLESHOOTING AND SERVICE
This section provides guidance for resolving fault conditions and possible flow and calibration problems.
1. To review Alerts, select >Alerts. 2. Document any alerts, including date and time to the “Monthly QC and Maintenance
Sheet.” 3. To clear alerts, select the following: >Alerts >Select >Clear Selected. Then select the
home button. 4. If alerts reappear, then there is something wrong and this need to be diagnosed. See
below.
6.6.1 Fault Diagnosis
The Alerts log may be useful in diagnosing faults. Table 6-2 lists some of the Alerts that are triggered by faults, describes their likely causes, and provides possible solutions.
Table 6-2. Alerts and Recommendations
Message Description Possible Solution(s)
System Reset Warning raised when the system is reset Normal power cycle occurred? If not, check external power source.
Sample Flow High The Sample Flow is greater than 5.25 lpm Check pneumatic fittings. Re-calibrate flow.
Sample Flow Low The Sample Flow is less than 4.75 lpm Check pneumatics. Check for blockages. Re-calibrate flow.
Sample RH High The Sample RH is above the set point
Check if ASC is plugged in. Check control board if ASC control LED is illuminated. Check if water is in the sensor.
Check LED If the LED temperature is equal to the box temperature, the LED may be OFF
Cycle power. Call Teledyne-API Tech Support.

May 10th, 2019
32
Message Description Possible Solution(s)
Check PMT The PMT HV setting is out of range (800 – 2200)
Check Sensor with SpanDust™. Perform an optical chamber cleaning. Call Teledyne-API Tech Support.
Sample Flow Slope OOR
The Sample Flow Calibration Slope is Out Of Range (OOR)
Check pneumatics for leaks. Re-run flow calibration. Call Teledyne-API Tech Support.
Check Int Pump Check the internal pump if the PWM is >80
Check pneumatics for blockages. Check pneumatics for leaks. Check flow calibration. Replace pump.
Sample Temp Warning Sample Temperature Warning (>60)
Check ASC (is it latched ON?) Ensure proper climate and ventilation for instrument.
Box Temp Warning Box Temperature Warning (>60) Ensure proper climate and ventilation for instrument.
AMB Press Slope OOR
Ambient Pressure Calibration Slope is out of range
Check calibration (make sure units match calibration device). Replace pressure sensor. Call Teledyne-API Tech Support.
6.6.2 Flow Problems
If a flow auditing device indicates any problems with the flow rate, check to ensure the following: • all connections are seated tightly and evenly (no gaps); • the inlet is not clogged or blocked; • the pump is running and within expected PWM range (35% - 80%); • internal tubing appears free from SpanDustTM or any other restricting debris; • the DFUs appear reasonably clean and changed within last 12 months; and • ensure flow audit device is operating properly (e.g., is the unit appropriately charged).
After making any adjustments, run a flow rate calibration and recheck the flow rate. If problems persist, contact Teledyne-API Technical Support for assistance.
7.0 DATA MANAGEMENT AND RECORDS MANAGEMENT PARAMETERS
7.1 DATA MANAGEMENT
Data collected by the T640 at the monitoring site will be stored on a data acquisition system (DAS). Data can be remotely polled for upload into a centralized database. Ensure data backups are conducted a regular basis.

May 10th, 2019
33
The in-situ DAS will be a commercially available computer based unit capable of retrieving digital records from the station instruments via an Ethernet connection. It will store 1 minute averages from the instruments. The instrument will store approximately 1 year of data internally and data can be retrieved at any time to fill in any missing data in the database due to transfer issues. Table 7-1 lists the parameter, method, and unit codes for the T640 and T640x data.

May 10th, 2019
34
Table 7-1. Parameter, method, and unit codes.
Parameter Description
Parameter Code
Method Code for T640
at 5.0 lpm
Method Code for T640x
at 16.67 lpm Units Unit Code
PM2.5 88101 236 238 Micrograms/cubic meter (LC) 105
PM10 - LC 85101 236 239 Micrograms/cubic meter (LC) 105
PM10-2.5 LC 86101 236 240 Micrograms/cubic meter (LC) 105
PM10 STP 81102 not available 239 Micrograms/cubic
meter (760 mm Hg, 25°C)
001
7.2 RECORDS MANAGEMENT
Field site visits will be stored in site log books documenting access to the monitoring sites and the key activities performed. Details on routine QC and maintenance are recorded to the “Monthly QC and Maintenance Sheet.”
8.0 QUALITY CONTROL/QUALITY ASSURANCE
The instrument will be operated in accordance with the manufacturer’s recommendation. The maintenance recommendations presented above, including the recommended verifications and adjustments, will be followed. Alerts (diagnostic codes) issued by the instrument will be reviewed and appropriate corrections will be initiated when indicated. The alerts will be retained as part of the instrument data. Daily review of instrument output is made to ensure operability. Data reasonableness will also be assessed to ensure instrument output is consistent with expectations for the instrument location, time of day, typical concentrations, and season.
9.0 INSTALLATION INSTRUCTIONS
9.1 Indoor/Outdoor Installation
This section presents the various connections for setup and preparing the instrument for operation. The T640 can be installed in an indoor or outdoor shelter with roof penetration or in an outdoor enclosure. Section 9.2 provides step-by-step instructions for ASC connections and installation. If the instrument is being installed in a shelter with roof penetration, see Section 9.6 for installation instructions. If the instrument is being installed in an outdoor enclosure installation, see Section 9.7 for installation instructions.

May 10th, 2019
35
Ensure that the rack installation provides proper ventilation clearance (minimum of 1” from the sides and top of instrument and 4” from the back of instrument) and inlet height (2 m above ground level).
9.2 Aerosol Sample Conditioner (ASC) Connections and Installation
The ASC requires an inlet nozzle and an adapter for installation. The black inlet nozzle to the optical sensor is specific to the instrument (not interchangeable to other T640 instruments). Please note, the final assembly differs slightly between the T640x ASC and the T640 option ASC.
1. Insert the black inlet nozzle through the center of the support collar into the top of the optical sensor, seating it tightly so that the nozzle’s upper O-ring flange is flush with the upper surface of the sensor body (Figure 18).
Figure 18. ASC Setup: Inlet Nozzle.
2. Slide the aluminum adapter over the black inlet nozzle, ensuring its base is flush with the top of the optical sensor (Figure 19).

May 10th, 2019
36
Figure 19. ASC Setup: Aluminum Adapter.
3. Attach the water collector to the inlet (Figure 20).
Figure 20. Water Collector Attached to Inlet.
4. Assemble the inlet and the ASC as depicted in Figure 21, ensuring the parts fit snugly with no gaps. Note that if the instrument is to be installed in a shelter with roof penetration, leave the inlet with the water collector off for now.

May 10th, 2019
37
Figure 21. 640 Inlet (standard) and ASC Assembly.
5. Lower the ASC into the support collar, ensuring it fits straight with no gaps. 6. Plug the ASC wiring into the rear panel connector.
9.3 Temperature Probe Connection
1. Plug the ambient temperature probe connector into its respective rear panel electrical port (Figure 22).

May 10th, 2019
38
Figure 22. Ambient Temperature Probe and ASC Connections.
2. Route the probe outside and insert it into solar shield, ensuring the solar shield maintains a vertical orientation (Figure 23).
Figure 23. Ambient Temperature Probe Installed in Solar Shield.

May 10th, 2019
39
9.4 Power Connection
Adhering to the warning messages, insert the power cord between the instrument’s AC power connector and a properly rated power outlet.
9.5 Communications Interface Connections
For network or Internet communication with the instrument, connect an Ethernet cable from the analyzer’s rear panel Ethernet interface connector to an Ethernet port. The address settings default to automatic configuration by Dynamic Host Configuration Protocol (DHCP). Most users will want to configure the instrument with a static IP address; however, you should consult your network administrator to discuss other potential options. For data downloads and firmware updates, use a flash drive inserted into the front panel USB port. See Section 3.2.6 of the User Manual.
9.6 Shelter Installation with Roof Penetration
For rooftop installation instructions recommended by Teledyne API see the video from the QR code below. Alternatively, you can view this video at: https://www.youtube.com/watch?v=8H5NmNgBg1M.
1. Determine the location where the T640 will operate in the shelter.
a. The instrument should be installed in a location where the top of the ASC will be no less than two feet from the top of the ceiling/roof line or,
b. The instrument should be placed at a height within the shelter so that after the ASC and 8’ extension sample line are installed, the inlet (on top of the 8’ extension sample line) is 2-m above the roof and equal height with any other PM instrument inlets.
c. Align all pieces before making any cuts in the roof. d. Ensure the monitor downtube is capped so that no debris
enters the downtube during drilling and installation. 2. Drill a hole in the roof to accommodate the diameter of the 8’ extension sample line
(5/8” OD). 3. Install the provided roof flange over the hole.
a. Make sure to use good quality roof sealant for the base of the roof flange to ensure weather tightness and to prevent any leaks into the shelter.
4. Without locking it down, setup the sample line tripod so that its sample line hole aligns with the hole in the roof.
T640 Rooftop Installation
Video • • •

May 10th, 2019
40
a. The tripod should be setup at such a height to properly support the sample line with the inlet on top.
5. Without the inlet installed on the top of the ASC, line up the instrument so that the opening at the top of the ASC is in-line with the sample line hole/roof flange on the shelter roof.
6. Install the slip coupler on top of the ASC. 7. Slide the 8’ sample line extension down through the tripod and the roof penetration until
it meets the opening of the slip coupler. a. The sample line should be plumb to prevent any strain on the instrument and to
prevent pneumatic leaks. b. The sample line should slide into the top of the slip coupler and bottom out when
in completely. Ensure that the sample line is not pushing down on the connection inside the slip coupler such that the monitor can be moved to the side, as needed, for verifications and audits.
8. Lightly tighten the tripod cord grip and the roof flange cord grip around the sample line to hold it in place.
9. Test the slip coupler and ensure the monitor can be moved. Move the monitor back to its original location and re-connect slip coupler.
10. At the top of the sample line (on the roof), place the provided inlet collar so that its top is 3” from the top of the sample line. This is for proper clearance from the base of the inlet and to prevent any instrument flooding if the inlet were to ever get water inside of it.
11. Lock down the collar once it is determined to be at the proper location 3” from the top of the sample line.
12. Place the inlet on top of the sample line. a. Make sure the inlet is secure (i.e., that the collar holding it is not sliding). b. Proper installation should have the inlet 2-m above the roof.
13. Plug the ASC connector into the proper fitting on the rear panel of the T640. 14. Connect the power cable and ambient temperature sensor at the back of instrument. 15. Before sealing the cord grips, power up the instrument and make sure it is running
properly. 16. Once the T640 instrument is determined to be installed and working properly, tighten up
the roof flange cord grip around the sample line. 17. Apply clear silicone caulk generously around the top end of where the cord grip rubber
grommet meets the sample line to ensure complete sealing from the weather. a. Silicone caulk seals well and can easily be removed and reapplied if the
instrument needs to be removed for servicing. 18. Tighten the tripod cord grip and lock down the feet of the tripod to fully secure the
sample line.

May 10th, 2019
41
9.7 Outdoor Enclosure Installation
1. Install the enclosure in the location where the instrument is to run. 2. Measure the distances and clearances for the location of the T640 monitor and inlet. The
T640 instrument should be installed in the enclosure at a height where the inlet will be at least 2-m above ground (from ground level to the inlet height). Adjust the shelf as needed; however, do not actually locate the monitor on the shelf yet.
3. Slide the ASC up through the port of the doghouse by several inches above where the monitor will sit and tighten the collar over the ASC such that it is held in place, but do not over-tighten. The ASC must be installed from the inside of the enclosure due to the power connector on the ASC.
4. Locate the 640 monitor chassis on the shelf of the enclosure. a. Make sure the black inlet nozzle (Figure 18) and aluminum adapter (Figure 19)
are installed on the optical sensor. 5. Once the T640 is in the enclosure and lined up with the opening on the top of the
enclosure, carefully untighten the collar holding the ASC and slide it down gently until it inserts into opening of the T640.
a. The ASC should go into the T640 level and plumb, and is in completely when it is felt to bottom out onto the top of the optical sensor. This can be checked by lowering the front panel of the T640 and making sure the base of the ASC is touching the top of the optical sensor flush.
6. Plug the ASC connector into the proper fitting on the rear panel of the T640. 7. Connect the power cable and ambient temperature sensor at the back of instrument. 8. Before sealing the collar, power up the instrument and make sure it is running properly 9. Once the T640 instrument is determined to be installed and working properly, tighten up
the collar around the ASC. 10. Apply clear silicone caulk generously around the top end of where the collar rubber
grommet meets the ASC to ensure complete sealing from the weather. a. Silicone caulk seals well and can easily be removed and reapplied if the
instrument needs to be removed for servicing.

May 10th, 2019
42
9.8 Pneumatics
Figure 24. T640 Pneumatics.
9.9 Instrument Start-up
With all hardware and electrical in place, power-up the T640. The monitor will take a few minutes to work through its start-up routine. Ensure the data system is not logging data at this point, except as necessary to ensure data transfer is appropriately bringing in information from the T640. The following activities should be performed after the unit is brought on line: Note: references to the User manual are provided, where applicable.
1. Check the firmware; upgrade firmware to latest version, if necessary. (See Section 3.2.6 of T640 User Manual).
2. Adjust the clock on the T640 to local standard time (LST). (See Section 3.2.12.2 of T640 User Manual).
3. Select parameters to display on front panel home screen. (See Section 3.2.11 of T640 User Manual).

May 10th, 2019
43
a. To select parameters, press the configuration button: b. Users can select whichever parameters are most important to them. Our
provisional recommendation is to include: i. Sample Flow (5.0 lpm)
ii. Ambient Temp iii. Sample RH:
4. Select parameters to include in “dashboard.” See “Monthly QC and Maintenance Sheet” in section 10.0 below for recommended parameters to include. (See Section 3.2.9 of the T640 User Manual to configure dashboard).
5. It is recommended to use units of mm Hg for pressure. To change pressure units to mm Hg, go to Setup >Vars >Pressure Units >mmHg.
6. Select LED temperature and track its stability in a trend chart. Once stable move to next step.
7. Conduct Instrument Verifications and Calibrations (Section 6.4 of this SOP) 8. Inspect the Disposable Filter Units (DFUs) to ensure they appear new. Label as “new”
with today’s date using a sharpie. 9. Close-up instrument front panel and inspect all connections. 10. Wait ten minutes, which allows concentration data to be updated to ambient conditions. 11. Review the concentration data on front panel display and ensure all parameters appear
reasonable compared to current conditions. Compare T640 data to other available data at current site or nearby site, if available.
12. Enable data recording to “On Scan.” 13. Document the instrument’s startup in Field log book.

May 10th, 2019
44
10.0 MONTHLY QC AND MAINTENANCE SHEET
Order of Monthly Checks:
Station: 1. Document any alarms and then clear. 2. Record parameters as found from Dashboard. 3. Take instrument “Off Scan” from data system 4. Perform zero test 5. Perform verifications of:
a. BP b. Ta c. Sample flow (5.0 lpm) d. Span Dust (performed quarterly)
6. Perform, only if needed calibrations of pressure, flow, and PMT. 7. Put instrument back together. 8. Clear any remaining alarms 9. Wait minimum of 10 minutes to ensure PM concentrations are
representative of ambient air. 10. Record “After” parameters from Dashboard in far-right column. 11. Bring instrument back on line to data system.
Operator:
Analyzer S/N:
Date:
Time monitor out of service (LST):
Time monitor back in service (LST):
Any alarms enabled? List alarm/date/time if
applicable
Parameters from Dashboard: As found / After Amb P. (mm Hg) PMT Setting Current PMT hv
Amb T. (°C) Box T. (°C) LED Temp. (°C)
PM2.5 Conc. (µg/m3) ASC Heater Duty Pump PWM (%)
PM10 Conc. (µg/m3) Sample Temp. (°C) Sample Flow (lpm)
Package Version Sample RH (%) Valve PWM (%)
Total Flow (lpm)
Monthly QC Checks:
Audit Device: S/N: Last Cert. Date:
QC Check
Verifications: Calibrations:
Tolerance Audit Actual T640x Audit Actual T640x
Zero Test NA Re-zero if any issues found and corrected: 0.0 on each PM metric
BP +/- 10 mm Hg
Ta +/- 2°C
Sample Flow 5.0 lpm
+/-5% of T640x (e.g., 4.75 – 5.25 lpm)
Additional Checks and Maintenance (longer than monthly): Date Completed
Quarterly
Span DustTM
(+/- 0.5 value on Span
DustTM bottle)
Peak Ch. =
PMT Setting =
Peak Ch. Counts =
Inlet 1. Clean PM Inlet
Every 6 Months 1. Clean Optical Chamber 2. Clean RH Sensor 3. Clean Ta Sensor
Every 12 months or if valve or pump PWM value approaches 80%
1. New internal (5.0 lpm) Disposable Filter Unit (DFU) [inside front panel] 2. New external (11.67 lpm) Disposable Filter Unit (DFU) [at back of
instrument]; It is recommended to change both DFUs on the same day.