
Stable isotopes, ecological integration and environmental change: wolves record atmospheric carbon...
10
Stable isotopes, ecological integration and environmental change: wolves record atmospheric carbon isotope trend better than tree rings Joseph K. Bump 1, * , Kena Fox-Dobbs 2 , Jeffrey L. Bada 3 , Paul L. Koch 2 , Rolf O. Peterson 1 and John A. Vucetich 1 1 School of Forest Resources and Environmental Science, Michigan Technological University, Houghton, MI 49931, USA 2 Earth & Planetary Sciences Department, University of California, Santa Cruz, CA 95064, USA 3 Scripps Institute of Oceanography, La Jolla, San Diego, CA 92093, USA Large-scale patterns of isotope ratios are detectable in the tissues of organisms, but the variability in these patterns often obscures detection of environmental trends. We show that plants and animals at lower trophic levels are relatively poor indicators of the temporal trend in atmospheric carbon isotope ratios (d 13 C) when compared with animals at higher trophic levels. First, we tested how differences in atmospheric d 13 C values were transferred across three trophic levels. Second, we compared contemporary d 13 C trends (1961–2004) in atmospheric CO 2 to d 13 C patterns in a tree species (jack pine, Pinus banksiana), large herbivore (moose, Alces alces) and large carnivore (grey wolf, Canis lupus) from North America. Third, we compared palaeontological (approx. 30 000 to 12 000 14 C years before present) atmospheric CO 2 trends to d 13 C patterns in a tree species (Pinus flexilis, Juniperus sp.), a megaherbivore (bison, Bison antiquus) and a large carnivore (dire wolf, Canis dirus) from the La Brea tar pits (southern California, USA) and Great Basin (western USA). Contrary to previous expectations, we found that the environmental isotope pattern is better represented with increasing trophic level. Our results indicate that museum specimens of large carnivores would best reflect large-scale spatial and temporal patterns of carbon isotopes in the palaeontological record because top predators can act as ecological integrators of environmental change. Keywords: stable isotopes; CO 2 ; d 13 C; ecological integrator; palaeoenvironment; wolf 1. INTRODUCTION There is considerable interest in inferring environmental attributes and climate histories based on stable isotope ratio data derived from animals ( Koch 1998; Kohn & Cerling 2002; Hedges et al. 2004; Leng 2004; Hoppe et al. 2006; West et al. 2006). Such inferences are based on the logic that since producer isotopic values reflect, in part, their growing conditions ( Dawson et al. 2002), then consumer isotopic values in turn reveal information about the producer’s environment. However, few experimental isotopic studies have examined the validity of such inferences and/or established general patterns in the transfer of environmental information across trophic levels. A useful approach to understand the fidelity of environmental records at the producer level inferred from consumer-derived isotope data is to conduct complementary observational and experimental analyses. Although such an approach is frequently used to infer dietary histories from stable isotope records from animal tissues ( Macko et al. 1982; Hobson & Schwarcz 1986; Hilderbrand et al. 1996; Ostrom et al. 1997), similarly derived climate proxies often lack corresponding experi- mental studies. The call for more comparative experi- ments to properly reconstruct dietary, trophic level and body condition based on stable isotope analysis (Gannes et al. 1997) is equally pertinent to reconstructing climate histories and habitat use. In contemporary and palaeontological climate studies, the stable isotope values of carbon (d 13 C) have proved particularly useful. For example, ecosystem changes such as carbon starvation in trees growing under conditions of reduced atmospheric CO 2 concentration have been studied using d 13 C analysis of fossil plant tissues ( Ward et al. 2005). Also, in the context of current climate change issues ( Karl & Trenberth 2003; Kennedy 2004) and research on global carbon cycling ( Falkowski et al. 2000), atmospheric d 13 C chronologies are of interest to research- ers modelling past and future atmospheric CO 2 scenarios (Ciais et al. 1995, 2005; Rayner et al. 1999; Nakicenovic & Swart 2000). Since plants assimilate atmospheric CO 2 directly, it has been argued that shifts in atmospheric d 13 C values would be most accurately recorded in plant tissues ( Dawson et al. 2002; Long et al. 2005). Consumer tissues are thought to more poorly reflect isotopic patterns in atmospheric CO 2 owing to variations in diet, assimilation efficiencies of dietary components, isotope fractionation (a change in isotope ratios between source substrate and products), tissue turnover and differential allocation of nutrients among tissues (Gannes et al. 1997; Long et al. 2005). However, ecological theory suggests that organisms at higher trophic levels act as integrators, linking lower Proc. R. Soc. B (2007) 274, 2471–2480 doi:10.1098/rspb.2007.0700 Published online 7 August 2007 The first two authors contributed equally to this manuscript. * Author for correspondence ([email protected]). Received 23 May 2007 Accepted 9 July 2007 2471 This journal is q 2007 The Royal Society
Transcript of Stable isotopes, ecological integration and environmental change: wolves record atmospheric carbon...
Proc. R. Soc. B (2007) 274, 2471–2480
doi:10.1098/rspb.2007.0700
Stable isotopes, ecological integration andenvironmental change: wolves record atmospheric
carbon isotope trend better than tree ringsJoseph K. Bump1,*, Kena Fox-Dobbs2, Jeffrey L. Bada3, Paul L. Koch2,
Rolf O. Peterson1 and John A. Vucetich1
1School of Forest Resources and Environmental Science, Michigan Technological University, Houghton, MI 49931, USA2Earth & Planetary Sciences Department, University of California, Santa Cruz, CA 95064, USA
3Scripps Institute of Oceanography, La Jolla, San Diego, CA 92093, USA
Published online 7 August 2007
The firs
*Autho
ReceivedAccepted
Large-scale patterns of isotope ratios are detectable in the tissues of organisms, but the variability in these
patterns often obscures detection of environmental trends. We show that plants and animals at lower
trophic levels are relatively poor indicators of the temporal trend in atmospheric carbon isotope ratios
(d13C) when compared with animals at higher trophic levels. First, we tested how differences in
atmospheric d13C values were transferred across three trophic levels. Second, we compared contemporary
d13C trends (1961–2004) in atmospheric CO2 to d13C patterns in a tree species (jack pine, Pinus
banksiana), large herbivore (moose, Alces alces) and large carnivore (grey wolf, Canis lupus) from North
America. Third, we compared palaeontological (approx. 30 000 to 12 000 14C years before present)
atmospheric CO2 trends to d13C patterns in a tree species (Pinus flexilis, Juniperus sp.), a megaherbivore
(bison, Bison antiquus) and a large carnivore (dire wolf, Canis dirus) from the La Brea tar pits (southern
California, USA) and Great Basin (western USA). Contrary to previous expectations, we found that the
environmental isotope pattern is better represented with increasing trophic level. Our results indicate that
museum specimens of large carnivores would best reflect large-scale spatial and temporal patterns of
carbon isotopes in the palaeontological record because top predators can act as ecological integrators of
environmental change.
Keywords: stable isotopes; CO2; d13C; ecological integrator; palaeoenvironment; wolf
1. INTRODUCTIONThere is considerable interest in inferring environmental
attributes and climate histories based on stable isotope
ratio data derived from animals (Koch 1998; Kohn &
Cerling 2002; Hedges et al. 2004; Leng 2004; Hoppe et al.
2006; West et al. 2006). Such inferences are based on the
logic that since producer isotopic values reflect, in part,
their growing conditions (Dawson et al. 2002), then
consumer isotopic values in turn reveal information about
the producer’s environment. However, few experimental
isotopic studies have examined the validity of such
inferences and/or established general patterns in the
transfer of environmental information across trophic levels.
A useful approach to understand the fidelity of
environmental records at the producer level inferred
from consumer-derived isotope data is to conduct
complementary observational and experimental analyses.
Although such an approach is frequently used to infer
dietary histories from stable isotope records from animal
tissues (Macko et al. 1982; Hobson & Schwarcz 1986;
Hilderbrand et al. 1996; Ostrom et al. 1997), similarly
derived climate proxies often lack corresponding experi-
mental studies. The call for more comparative experi-
ments to properly reconstruct dietary, trophic level and
t two authors contributed equally to this manuscript.
r for correspondence ([email protected]).
23 May 20079 July 2007
2471
body condition based on stable isotope analysis (Gannes
et al. 1997) is equally pertinent to reconstructing climate
histories and habitat use.
In contemporary and palaeontological climate studies,
the stable isotope values of carbon (d13C) have proved
particularly useful. For example, ecosystem changes such
as carbon starvation in trees growing under conditions of
reduced atmospheric CO2 concentration have been
studied using d13C analysis of fossil plant tissues (Ward
et al. 2005). Also, in the context of current climate change
issues (Karl & Trenberth 2003; Kennedy 2004) and
research on global carbon cycling (Falkowski et al. 2000),
atmospheric d13C chronologies are of interest to research-
ers modelling past and future atmospheric CO2 scenarios
(Ciais et al. 1995, 2005; Rayner et al. 1999; Nakicenovic &
Swart 2000).
Since plants assimilate atmospheric CO2 directly, it has
been argued that shifts in atmospheric d13C values would
be most accurately recorded in plant tissues (Dawson et al.
2002; Long et al. 2005). Consumer tissues are thought to
more poorly reflect isotopic patterns in atmospheric CO2
owing to variations in diet, assimilation efficiencies of
dietary components, isotope fractionation (a change in
isotope ratios between source substrate and products),
tissue turnover and differential allocation of nutrients
among tissues (Gannes et al. 1997; Long et al. 2005).
However, ecological theory suggests that organisms at
higher trophic levels act as integrators, linking lower
This journal is q 2007 The Royal Society
2472 J. K. Bump et al. d13C patterns across trophic levels
pathways in space and time (de Ruiter et al. 2005).
Primary producer tissue reflects an integration of the
environmental conditions over the time of tissue growth.
Herbivores feed upon numerous primary producers, and
carnivores ingest tissues from multiple herbivores. Hence,
stable isotope values derived from organisms at higher
trophic positions may effectively increase sample size,
thereby reducing variation (i.e. a carnivore represents
multiple herbivores, which in turn represent many
primary producers).
Here, we present the results of one experiment and two
observational studies designed to independently investi-
gate patterns of d13C records across trophic levels. In the
experimental test, we expected the variability in d13C
values to decrease with increasing trophic level based on
the untested idea that effective sample size is greater at
higher trophic levels, and thereby should statistically
provide less variable reflections of environmental factors.
The observational studies explored the ability of con-
temporary species to act as ecological integrators of trends
in atmospheric d13C values and concentrations over
historical and palaeontological time scales. In each
study, we focus on the dominant global atmospheric
variable (d13C value and CO2 concentration) responsible
for temporal variability in plant and animal d13C values
over a given time period. The dietary sources of carbon for
insect and mammalian consumers are predominately
plant-derived carbohydrates (for herbivores) and
protein-rich body tissues (for carnivores; Hedges 2003).
Both insect and mammalian carnivores ingest a range of
prey body tissues; but, as whole-body consumers, we
might expect insect carnivores to use a wider range of
dietary carbon sources. Thus, we do not directly compare
the experimental insect and observational mammalian
consumer datasets, but instead report similar trends in
isotopic variance with relation to trophic level.
2. MATERIAL AND METHODSFirst, we describe our experimental study in which we tested
how differences in atmospheric d13C values were transferred
across a three-trophic level food chain (cabbage plant–
caterpillar–insectivore). We manipulated the atmospheric
d13C values in semi-contained model systems and then
measured the d13C values for the growth chamber air and
the organismal food chain. This experiment tested the
theoretical prediction that the variability in d13C values
would decrease with increasing trophic level because
consumers act as ecological integrators of environmental
d13C conditions. Second, we describe our two analyses of
d13C chronologies from organisms at three trophic levels
(producer–herbivore–carnivore). In the first analysis, we
relate historic to modern organismal chronologies to
corresponding changes in atmospheric d13C values. In the
second analysis, we compare fossil plant and animal d13C
chronologies with late Pleistocene changes in the CO2
concentration of the atmosphere.
(a) Experimental study
Producers were grown in open top chambers (OTCs) in
which atmospheric d13C values were manipulated. Insect
herbivores fed in situ on producers within the OTCs and were
subsequently fed to an insectivore. d13C values were
measured for the OTC environment and for organisms at
Proc. R. Soc. B (2007)
all three trophic levels, thereby permitting the assessment of
how precisely atmospheric d13C values are reflected at each
trophic position.
Cabbage (Brassica oleracea var. capitata) was chosen for
this study owing to its rapid growth rate, small size, ease of
cultivation, seed availability and palatability to common
insect herbivores. Approximately two to three weeks after
greenhouse germination twelve 15 cm pots, each containing
one plant, were placed into each of ten 0.5 m3 OTCs. The
OTC construction followed that of Drake et al. (1989). OTCs
were arranged into five blocks with each block containing
one of two randomly assigned treatments: one relatively13C-enriched (hereafter ‘heavy’) OTC and one 13C-depleted
(hereafter ‘light’) OTC. Heavy and light 13C treatments were
obtained by elevating CO2 above ambient levels in all OTCs
using two isotopically different CO2 sources mixed with
atmospheric air: heavy treatment OTCs (nZ5) received
additional CO2 with a d13C value of K11‰ and light
treatment OTCs (nZ5) received additional CO2 with a d13C
value of K35.5‰. The mean (G1 s.d.) CO2 concentration
within each OTC (528G10 ppm) was monitored automatic-
ally via continuous sampling of chamber air and an infrared
CO2 gas analyser for 3 min at least every 5 hours (Drake et al.
1989). CO2 flow to each OTC was adjusted via manual
rotometer. Cabbages were watered daily and fertilized
once per week (100 ml containing 25 mg of Miracle Grow
15-30-15 fertilizer).
Egg-laying female cabbage butterflies (Pieris rapae) were
net captured locally and held (approx. two weeks) in a net
enclosure (2!2!2 m) with a sufficient food source (Lantana
camara). Eight days after plants were placed in OTCs, 1–2
butterflies were transferred to each OTC and contained by
temporarily screening the chamber top. Egg laying on
multiple plants in each chamber was confirmed visually; if
egg laying did not readily occur (i.e. within approx. 1 hour),
butterflies were released and replaced with one to two new
individuals until egg laying was observed. Caterpillars were
allowed to feed in situ for the duration of the experiment
(approx. eight weeks).
Eggs of spined soldier bugs (Podisus maculiventris) were
obtained from Rincon-Vitova Insectaries, Inc. (Ventura,
CA). Soldier bugs were reared until the fifth instar on the
experimentally raised P. rapae caterpillars at 25 and 208C,
coinciding with a 16 : 8 hours light : dark cycle in an
environmental chamber. Larvae were housed and fed daily
in 100!15 mm plastic Petri dishes containing moistened
filter paper, which was replaced daily. Two Petri dishes, each
containing 2–5 soldier bug larvae, corresponded to each OTC
to ensure adequate survival and archive tissue. Soldier bug
larvae were fed caterpillars (randomly selected from plants) of
the same instar daily.
Air samples for isotopic analysis were collected from each
OTC four times during the experiment: once when plants
were first placed into each chamber and then one, four and
eight weeks subsequently. Air from each chamber was
collected between 22.00 and 24.00 hours in septum-capped
10 ml vials, previously evacuated with argon gas.
Cabbage leaf tissue, caterpillars and soldier bug larvae
corresponding to each growth chamber were randomly
selected for elemental and isotopic analysis once soldier bug
larvae reached the fifth instar. Two caterpillars of the most
recent instar fed to the soldier bugs (i.e. fourth) were
randomly selected from chambers; one for elemental analysis
and the other for isotope analysis. The entire cabbage leaf on
d13C patterns across trophic levels J. K. Bump et al. 2473
which the caterpillars were found was collected for analysis.
Caterpillars tended to feed on newer leaves, hence leaf
samples were of a similar age. Caterpillars were isolated for at
least 24 hours before analysis to evacuate gut contents. All
samples, plant and insect, were double rinsed with distilled
water, air dried and then lyophilized. Leaf tissues were
ground to a fine powder in a mill (model 8000M, SPEC
CertiPrep, Inc., Metuchen, NJ).
Lipids were removed from insect samples because during
biosynthesis lipids can become depleted in 13C (DeNiro &
Epstein 1977) resulting in lower d13C values for lipids versus
proteins and carbohydrates; hence, whole-body d13C can vary
appreciably with lipid levels even if diet is constant. To extract
lipids prior to isotope analysis, insect samples (i.e. caterpillars
and soldier bugs) were soaked in 1 : 1 chloroform : methanol
solution three times, sonicated for 10 min each time and then
rinsed with distilled water and air-dried (Focken & Becker
1998; Sotiropoulos et al. 2004). Once dry, insect samples
were ground to a fine powder using a mortar and pestle.
Isotopic analysis was conducted at the University of
Michigan Biological Station’s Analytical Laboratory on a
ThermoFinnigan Deltaplus Continuous-Flow Stable Isotope
Ratio Mass Spectrometer interfaced with a GasBench II and a
Costech 4010 Elemental Analyzer. Gas sample injection
volume was 100 ml to generate output voltage peaks of
approximately 400 mV at m/eZ44. Five injections were done
per gas sample. Stable isotope values are reported in standard
d notation and are referenced to Vienna PeeDee Belemnite.
Precision based on repeated measures of internal standards
was G0.25‰ for d13C.
Separate elemental analysis was done to assess gross
nutritional quality of producers and herbivores. Ground
cabbage leaf tissues and caterpillar tissues without lipid
extraction were combusted in a Fisons NA1500 Elemental
Analyzer at Michigan Technological University’s Ecosystem
Science Centre to determine total carbon and nitrogen.
Homogeneity of variance tests and t-tests were used to test
for differences in equality of variance across trophic levels, in
isotopic fractionation between atmosphere and plant, with
each trophic step, and in nutritional quality between heavy
and light treatment producers and herbivores. These
comparisons tested the a priori hypotheses that d13C
variability would decrease with increasing trophic level,
hence differences where p!0.05 were considered significant.
(b) Observational study—Isle Royale
We compared trends (1961–2004) in the d13C values of
atmospheric CO2 to d13C values in a species of tree (jack pine,
Pinus banksiana), large herbivore (moose, Alces alces) and
large carnivore (grey wolf, Canis lupus) from North America.
Annual d13C values of atmospheric CO2 for 1962–1975
(nZ8) were obtained from high-precision ice core records
(Francey et al. 1999) and for 1978–2002 (nZ25) from direct
atmospheric measurements (Keeling et al. 2005). Jack pine
d13C data for 1974–1994 were obtained from tree ring
(nZ93) cellulose from Manitoba and Saskatchewan
(Ehleringer et al. 1998). Moose (nZ59) and wolf (nZ47)
bone collagen samples for 1961–2004 were drilled from Isle
Royale (Lake Superior, USA) specimens using a handheld
Dremel microdrill. All available Isle Royale wolf specimens
were sampled; moose specimens were selected indiscrimi-
nately from all samples available (more than 4000) to mimic
field collection. Fifty micrograms of samples were decalcified
in 0.5 N HCl for 1–2 days at 48C and were then rinsed and
Proc. R. Soc. B (2007)
dried. Samples were lipid extracted in five rinses of a 2 : 1
chloroform and methanol solution, with sonication of each
rinse for 0.5 hours. For stable isotope analysis, collagen
samples (1.0 mg) were weighed into precombusted tin
capsules. Stable carbon isotope ratios were measured using
an elemental analyser coupled with a mass spectrometer
(Europa Hydra 20/20) at the University of California Davis
Stable Isotope Facility. The standard deviation for replicates
of a gelatin standard analysed with the collagen samples was
!0.2‰ for carbon.
Since most plants in boreal ecosystems assimilate
atmospheric CO2 through the C3 photosynthetic pathway,
our Isle Royale d13C records are not complicated by changes
in the relative abundances of C3 and C4 plants (Ehleringer &
Monson 1993). We intentionally chose a tree species (i.e. jack
pine) from a mainland location to reduce the confounding
effect of elevation on carbon isotope discrimination (Sparks &
Ehleringer 1997). Consequently, the variation exhibited in
the jack pine chronology used here is likely to be less (i.e.
more conservative) than would be expected for Isle Royale
jack pine, where elevation changes (up to 238 m) exceed
those of the mainland sites (Ehleringer et al. 1998).
Moose do not prefer jack pine as browse species, but this is
of negligible consequence to our analysis because the range
in d13C values of plants that Isle Royale moose consume
(K20 to K30‰; Tischler 2004) encompasses the d13C
values of the mainland jack pine. Isle Royale moose and
wolves are linked through a strong predator–prey interaction;
on average, moose comprise approximately 90% of wolf diet
(Thurber & Peterson 1993) and kills are well used (i.e. soft
tissue, hide, brain and long-bone marrow are all consumed).
Based upon conservative estimates of moose kill rates at Isle
Royale (Vucetich et al. 2002), a likely minimum of 150–200
moose contribute to a wolf’s diet over the course of its lifetime
(approx. 5 years; Vucetich & Peterson 2004).
We highlight that the amount of time represented by
producer and consumer samples varies depending upon
what tissue is analysed. In general, wolf and moose bone
collagen d13C values reflect a longer time span (multiple
years) of resource usage than individual tree ring cellulose
d13C values (one tree ringZ1 year of atmospheric CO2
assimilation). Two-thirds of all Isle Royale wolves die before
the age of 5 years (Vucetich & Peterson 2004) and only 4 of
the 47 wolves sampled in this study were certainly older than
5 years. The mean life expectancy at age 1 year for Isle
Royale moose is 7.3 years (Peterson 1977) and 22 of the 59
moose sampled in this study were young (less than 2 years),
rapidly growing individuals, the remainder were from older
individuals (mean age 12.3 years). To make consumer and
producer tissue records comparable, we smooth the jack
pine tree ring d13C data using a 5-year running average, a
timeframe that is equivalent to the average turnover time of
bone collagen (Hobson & Clark 1992) and wolf life
expectancy. Note that Hobson & Clark’s (1992) analysis of13C turnover in tissues involved the use of growing animals,
and therefore likely underestimates carbon turnover time in
adults. We also explored the effects of 8- to 10- and 12-year
running averages because of the older ages of a portion of the
moose specimens.
(c) Observational study—La Brea and Great Basin
We compared trends (approx. 12 000–30 000 of 14C years
before present (kyr ago BP)) in the concentration of
atmospheric CO2 to d13C values of late Pleistocene Great
–5
–10
–15
–20
–25
–30
–35
–40
2.0
1.5
1.0
0.5
0OTCair
producer herbivore insectivore
trophic level
a
(a)
(b)
a
ab
ab
cbcva
riat
ion
in m
ean
δ13C
(% )
mea
n δ13
C (%
)
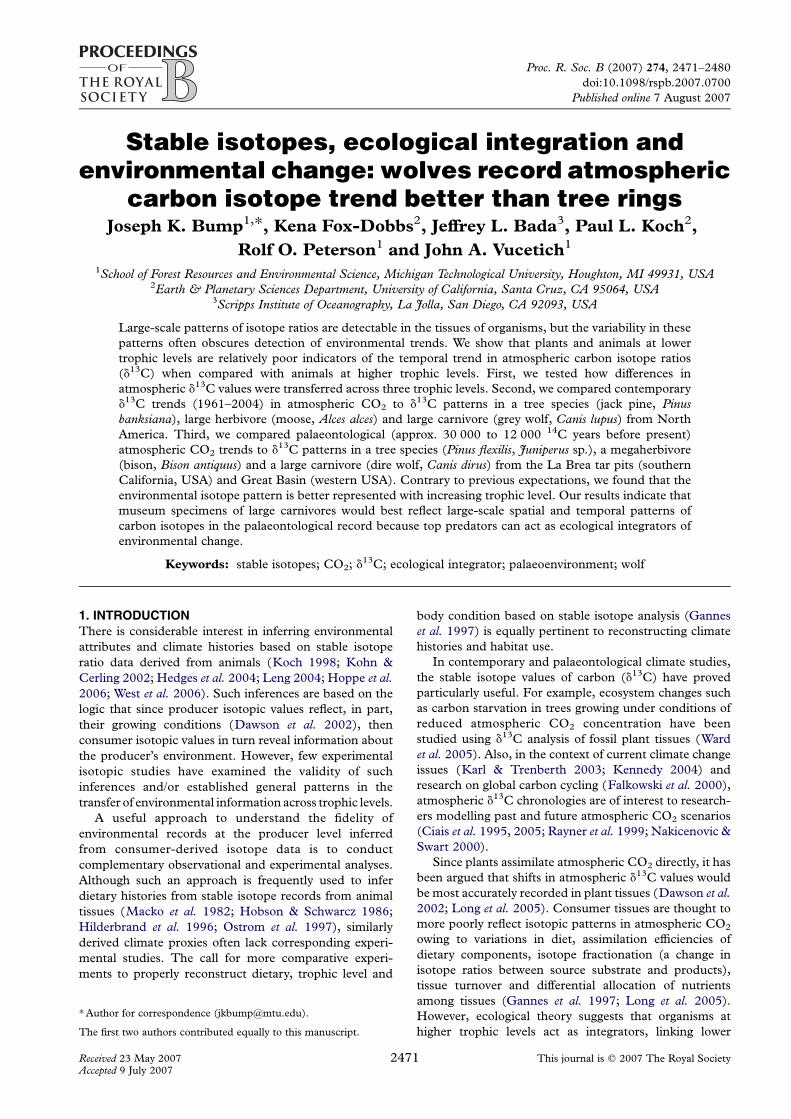
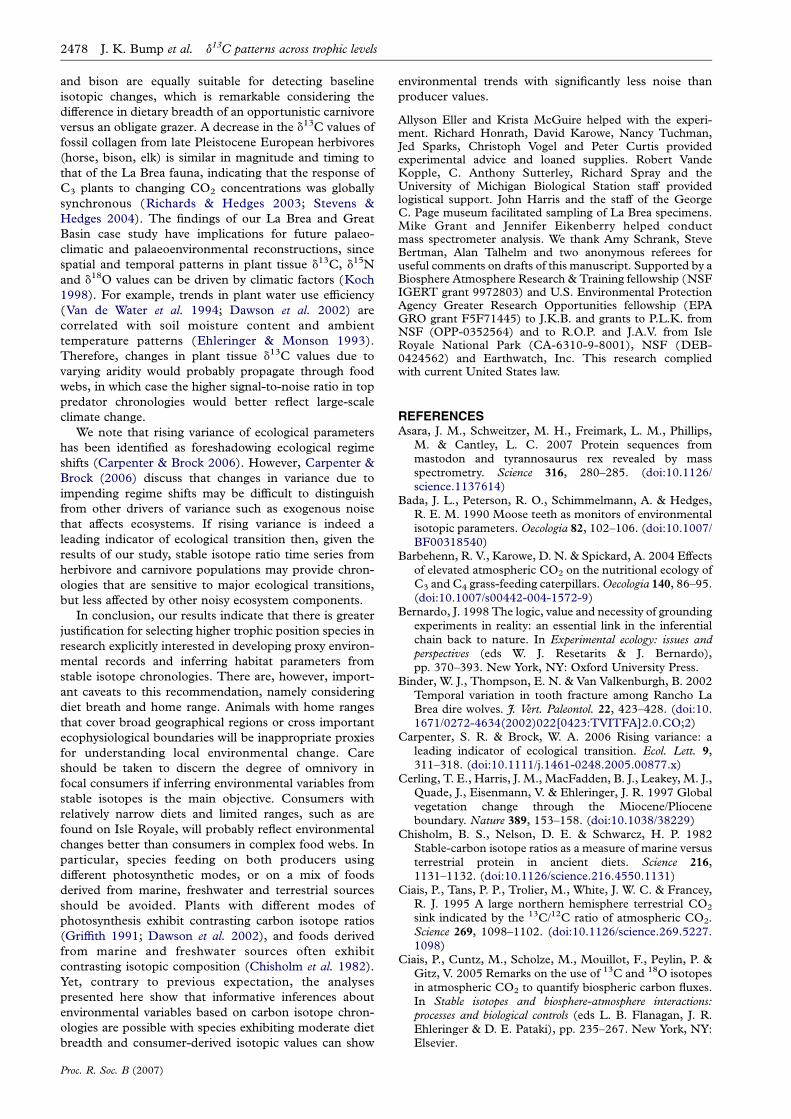
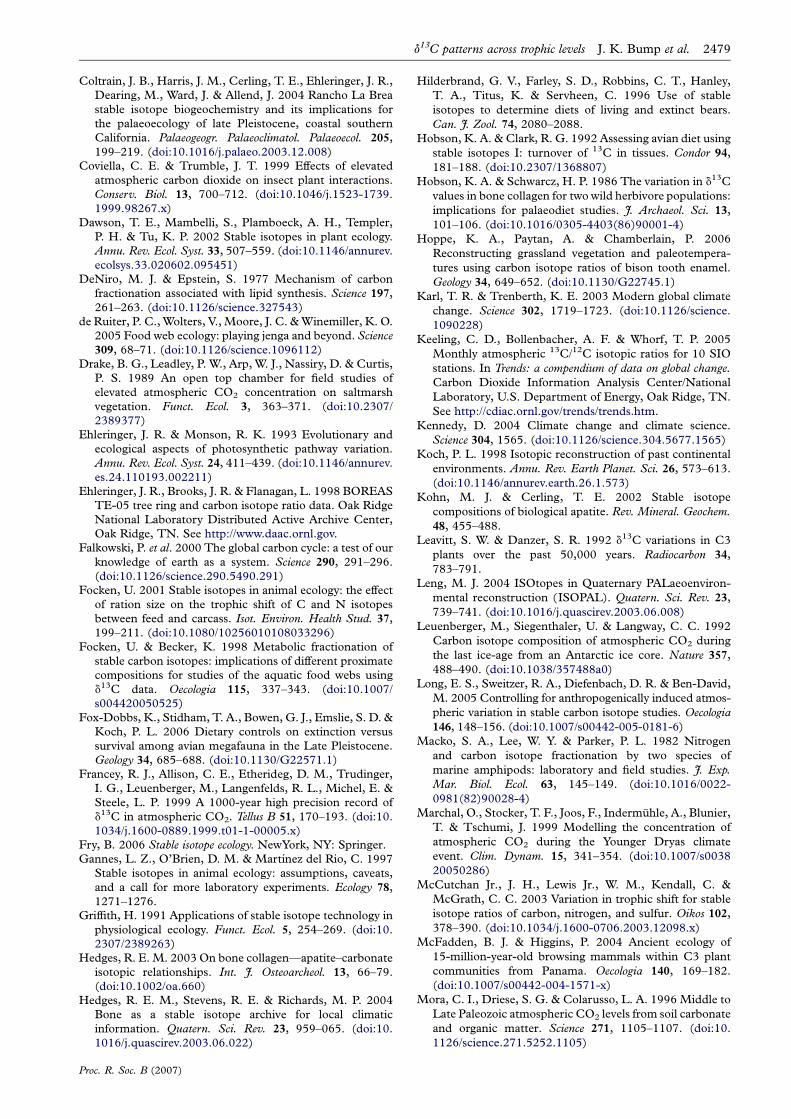
Figure 1. d13C values for experimental growth environmentand across trophic levels; symbols and bar fills correspond torelatively heavy (open) or light (closed ) CO2 treatmentsources. (a) Points (meanG1 s.d.) indicate d13C values forCO2 of open top chamber (OTC) air and tissues at eachtrophic level. Note OTC air treatment difference is reflectedat each trophic level. (b) Bars indicate standard deviations ofmean d13C values measured for CO2 of OTC air and tissuesat each trophic level. Bars labelled with different lower caseletters are significantly different.
2474 J. K. Bump et al. d13C patterns across trophic levels
Basin (Arizona, Utah, Nevada) pack rat midden limber pine
(Pinus flexilis) needle cellulose (nZ31; Van de Water et al.
1994) and La Brea tar pit (southern California) juniper
(Juniperus sp.) wood cellulose (nZ11; Ward et al. 2005), and
La Brea bison (Bison antiquus, nZ31) and dire wolf (Canis
dirus, nZ73) bone collagen (Coltrain et al. 2004). Atmos-
pheric CO2 concentrations for 12–30 kyr ago BP (nZ120)
were obtained from ice core records (Neftel et al. 1988;
Staffelbach et al. 1991; Marchal et al. 1999) and are plotted
with the plant and animal records to graphically demonstrate
the synchrony of atmospheric CO2 changes with plant and
animal d13C chronologies.
We intentionally chose a carnivore inferred to have wide
dietary breadth in order to examine the relationship between
variance in d13C values and trophic level in a complex ancient
food web. While bison likely contributed to dire wolf diet,
they were not the only megafaunal prey available to La Brea
carnivores. Isotopic food web reconstructions for La Brea
mammalian megafauna (Coltrain et al. 2004) show that dire
wolf diet was variable, and potentially included all of the
abundant grazing and browsing herbivore species at the tar
pits (e.g. horse, bison, camel, ground sloth, mastodon). The
cranial morphology and levels of tooth breakage in La Brea
dire wolves also suggest that they were either generalized
predators of large prey or scavengers (Binder et al. 2002).
We compare d13C values of co-occurring La Brea fauna
and juniper trees, but due to the paucity of the juniper dataset
we also include d13C values from an extensive Great Basin
limber pine dataset (Van de Water et al. 1994). The juniper
data are included solely for visual comparison and are not
included in statistical analyses. La Brea bison were grazers
(Coltrain et al. 2004) and likely did not consume juniper or
limber pine. Therefore, our study does not involve directly
interacting plants and animals, but instead focuses on how
organismal d13C records reflect atmospheric changes at the
regional scale.
Juniper and limber pine were directly dated by accelerator
mass spectrometry 14C analysis. Van de Water et al. (1994)
normalized the limber pine d13C values to modern sea level,
but concluded that latitudinal corrections were not necessary.
Bone collagen dates reflect the age of the pit from which they
were collected. Pit ages in kyr ago BP were 61 and 67 (12 kyr
ago BP), 13 (15 kyr ago BP), 3 (15 kyr ago BP), 60 and 91
(26–28 kyr ago BP) and 77 (28–33 kyr ago BP). Thus, for
statistical analyses (limber pine data only) and graphical
presentation, the limber pine and juniper data were binned
according to the age ranges of the La Brea tar pits. Herbivore
d13C data for pits 3, 60, 61, 67 and 91 were from Coltrain
et al. (2004); dire wolf d13C data from pits 3, 60 and 91 were
from Coltrain et al. (2004). Collagen d13C data from the
remaining pits are presented here for the first time.
Fossil bone collagen extraction and preparation for the
new d13C data presented here followed the methods in
Fox-Dobbs et al. (2006). In brief, approximately 120 mg
bone samples were crushed to a coarse powder, continuously
rinsed with solvents (petroleum ether and acetone, 24 hours
each) in a soxhlet extractor to remove tar, and then
decalcified as above. The collagenous residue was gelatinized
in 0.01 M HCl at 578C for 12 hours and then passed across a
1.5 mm glass-fibre filter, with retention and lyophilization of
the filtrate. Carbon isotope analysis was as previously
described for the Isle Royale samples and done at the
University of California Davis Stable Isotope Facility.
Proc. R. Soc. B (2007)
Standard deviations of the mean d13C values were
calculated for 12 and 15 kyr ago BP samples for each trophic
level; means for other time periods were not analysed
statistically due to small sample sizes. Homogeneity of
variance tests (aZ0.05) were used to test differences in
equality of variance between trophic levels by sample age.
3. RESULTS(a) Experimental
The heavy and light CO2 additions resulted in significantly
different OTC air, leaf, caterpillar and soldier bug d13C
values (figure 1). Standard deviations of mean insectivore
d13C values were significantly less variable than herbivore
values for the light treatment (F1,8Z12.7, pZ0.03, nZ5)
and less variable than producers for both treatments
(heavy, F1,8Z18.3, pZ0.016, nZ5; light, F1,8Z28.9,
pZ0.007, nZ5; figure 1).
–21
–22
–23
–24
–22
–23
–24
–25
wolves
R2 = 0.64b1
= –0.035
moose
R2 = 0.33b1
= –0.041
d13C patterns across trophic levels J. K. Bump et al. 2475
Producer and herbivore C : N ranged between
21.6–21.8 (nZ10) and 4.8–5.2 (nZ10), respectively, and
did not differ between treatments (producers, t8Z0.11,
pZ0.91; herbivores, t8Z1.25, pZ0.25). This result
indicates that the gross forage quality for herbivores and
prey for insectivores did not likely differ across treatments.
Isotope discrimination values (mean G1 s.d.) for produ-
cers (heavyZ18.3G2.0‰, nZ5; and light Z18.3G2.6‰,
nZ5) did not differ across treatments (t8Z0.04, pZ0.97),
indicating equivalent gas exchange and photosynthetic
activity between treatments. Trophic shifts (meanG1 s.d.)
for herbivores (heavyZ0.4G1.2‰, nZ5; and lightZ0.4G2.0‰, nZ5) and insectivores (heavyZ0.6G0.8‰, nZ5;
and lightZ0.7G1.3 ‰, nZ5) did not differ across
treatments (t8Z0.02, pZ0.98; and t8Z0.14, pZ0.89,
respectively). These fractionation results associated with
biochemical discrimination against 13C fall within typical
variation ranges for C3 plants (Dawson et al. 2002) and
trophic shifts for animals (McCutchan et al. 2003).
–26–22
–23
–24
–25
–26
–6
–7
–8
–91960 1970 1980 1990 2000 2010
year
trees
R2 = 0.12b1
= –0.021
CO2
R2 = 0.94b1
= –0.032
δ
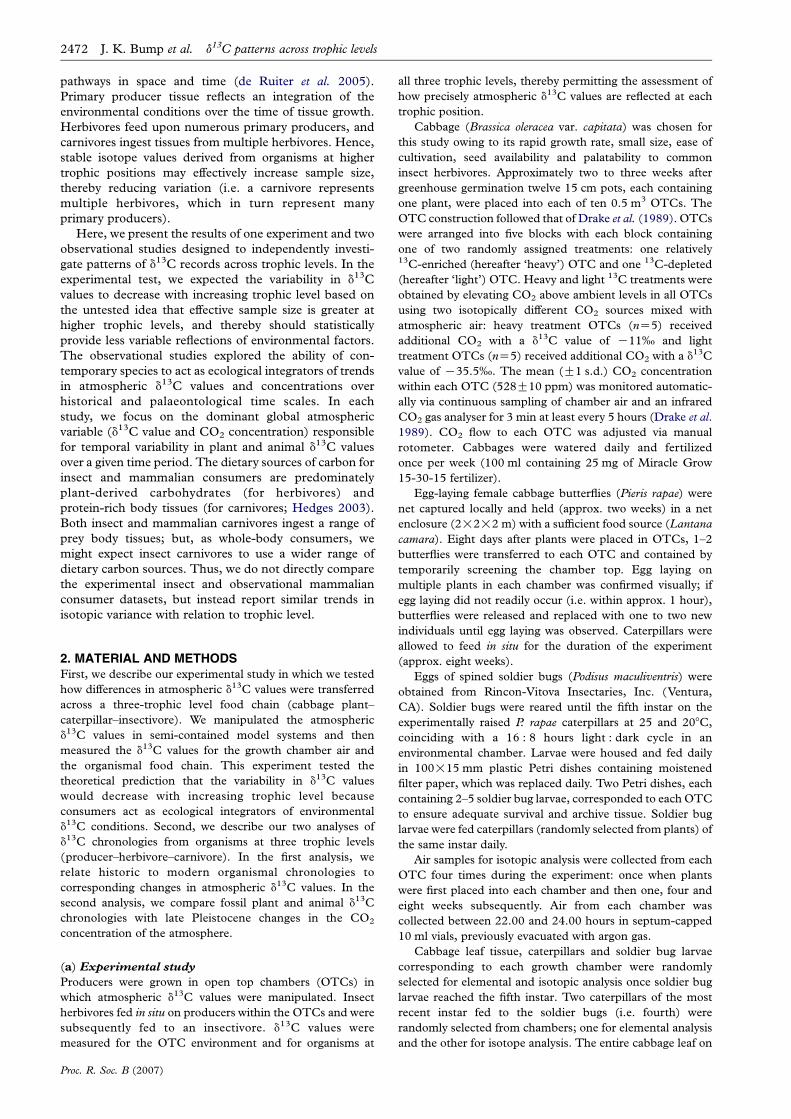
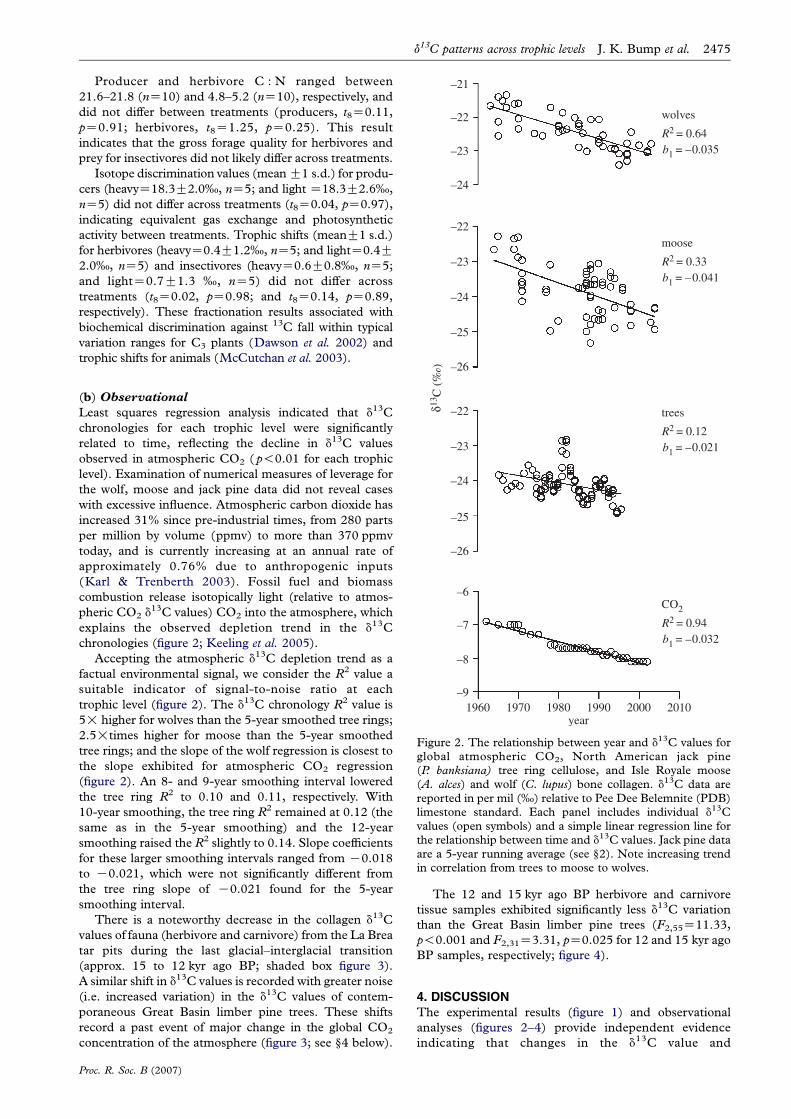
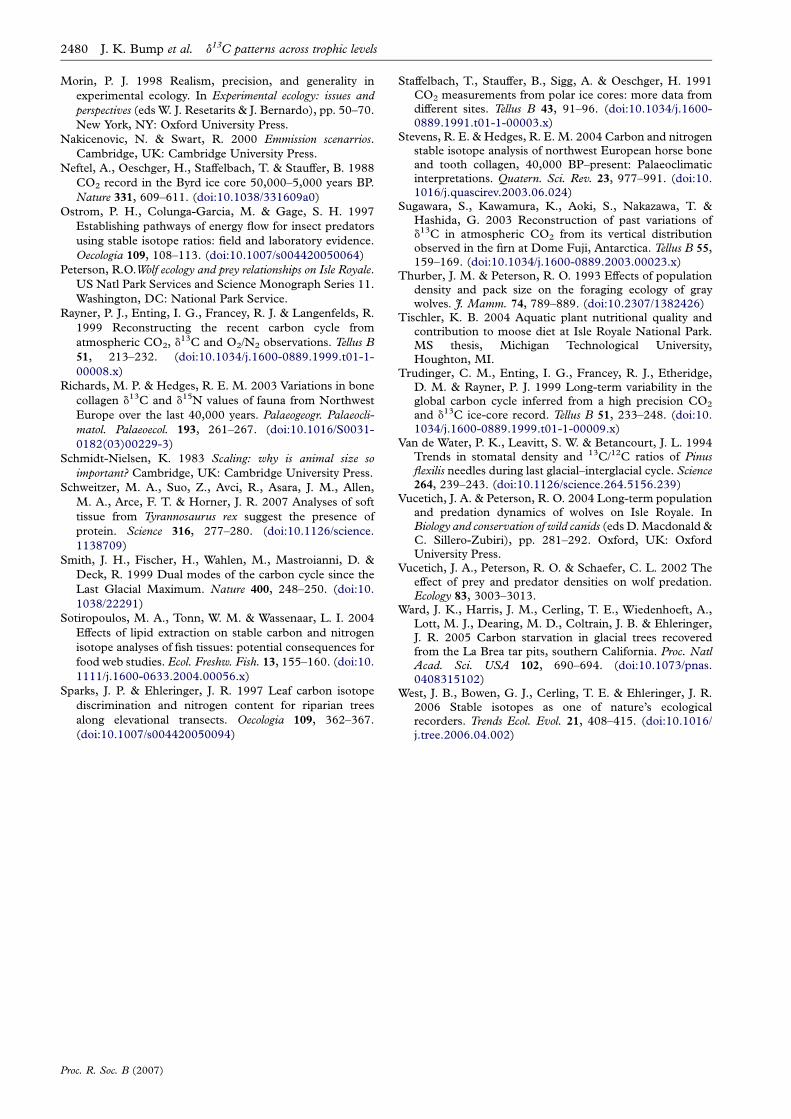
Figure 2. The relationship between year and d13C values forglobal atmospheric CO2, North American jack pine(P. banksiana) tree ring cellulose, and Isle Royale moose(A. alces) and wolf (C. lupus) bone collagen. d13C data arereported in per mil (‰) relative to Pee Dee Belemnite (PDB)limestone standard. Each panel includes individual d13Cvalues (open symbols) and a simple linear regression line forthe relationship between time and d13C values. Jack pine dataare a 5-year running average (see §2). Note increasing trendin correlation from trees to moose to wolves.
(b) Observational
Least squares regression analysis indicated that d13C
chronologies for each trophic level were significantly
related to time, reflecting the decline in d13C values
observed in atmospheric CO2 ( p!0.01 for each trophic
level). Examination of numerical measures of leverage for
the wolf, moose and jack pine data did not reveal cases
with excessive influence. Atmospheric carbon dioxide has
increased 31% since pre-industrial times, from 280 parts
per million by volume (ppmv) to more than 370 ppmv
today, and is currently increasing at an annual rate of
approximately 0.76% due to anthropogenic inputs
(Karl & Trenberth 2003). Fossil fuel and biomass
combustion release isotopically light (relative to atmos-
pheric CO2 d13C values) CO2 into the atmosphere, which
explains the observed depletion trend in the d13C
chronologies (figure 2; Keeling et al. 2005).
Accepting the atmospheric d13C depletion trend as a
factual environmental signal, we consider the R2 value a
suitable indicator of signal-to-noise ratio at each
trophic level (figure 2). The d13C chronology R2 value is
5! higher for wolves than the 5-year smoothed tree rings;
2.5!times higher for moose than the 5-year smoothed
tree rings; and the slope of the wolf regression is closest to
the slope exhibited for atmospheric CO2 regression
(figure 2). An 8- and 9-year smoothing interval lowered
the tree ring R2 to 0.10 and 0.11, respectively. With
10-year smoothing, the tree ring R2 remained at 0.12 (the
same as in the 5-year smoothing) and the 12-year
smoothing raised the R2 slightly to 0.14. Slope coefficients
for these larger smoothing intervals ranged from K0.018
to K0.021, which were not significantly different from
the tree ring slope of K0.021 found for the 5-year
smoothing interval.
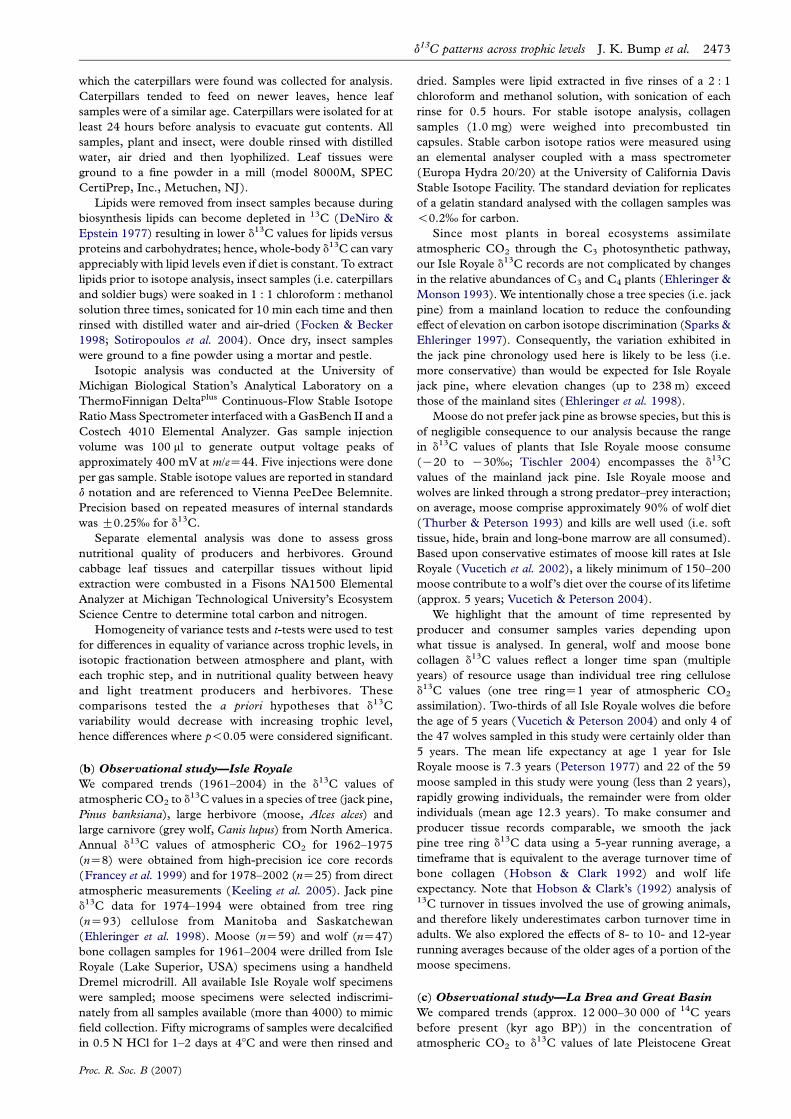
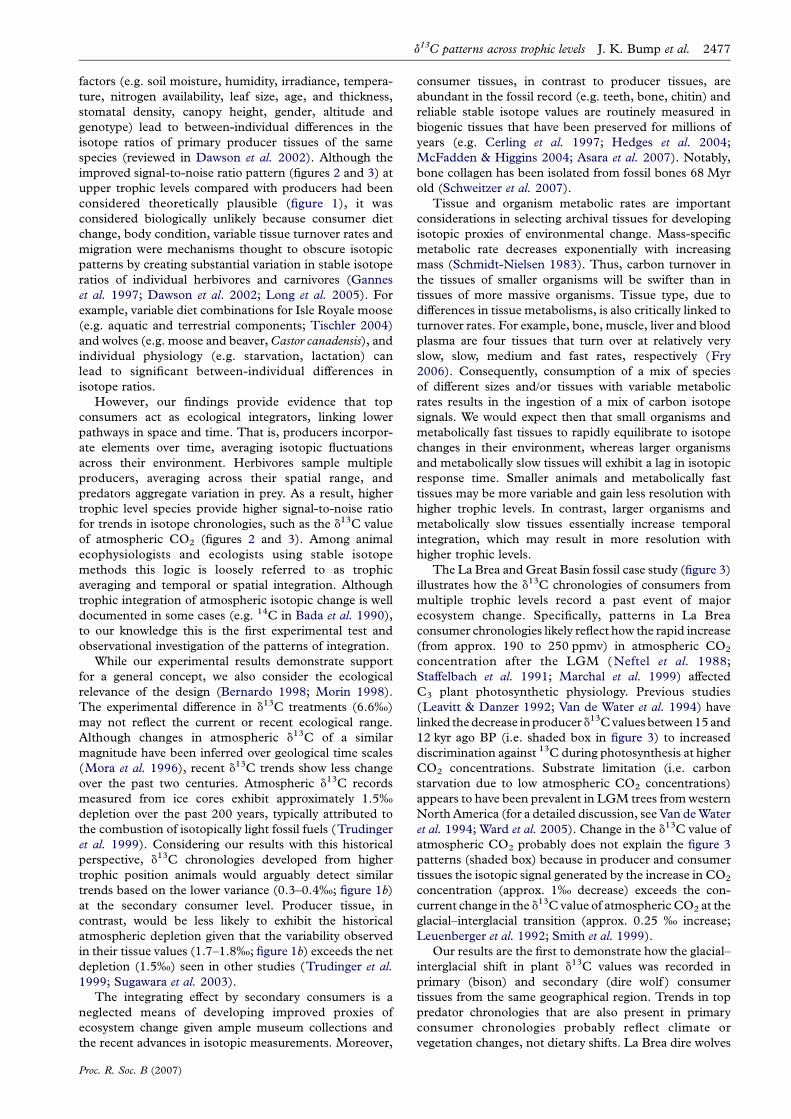
There is a noteworthy decrease in the collagen d13C
values of fauna (herbivore and carnivore) from the La Brea
tar pits during the last glacial–interglacial transition
(approx. 15 to 12 kyr ago BP; shaded box figure 3).
A similar shift in d13C values is recorded with greater noise
(i.e. increased variation) in the d13C values of contem-
poraneous Great Basin limber pine trees. These shifts
record a past event of major change in the global CO2
concentration of the atmosphere (figure 3; see §4 below).
Proc. R. Soc. B (2007)
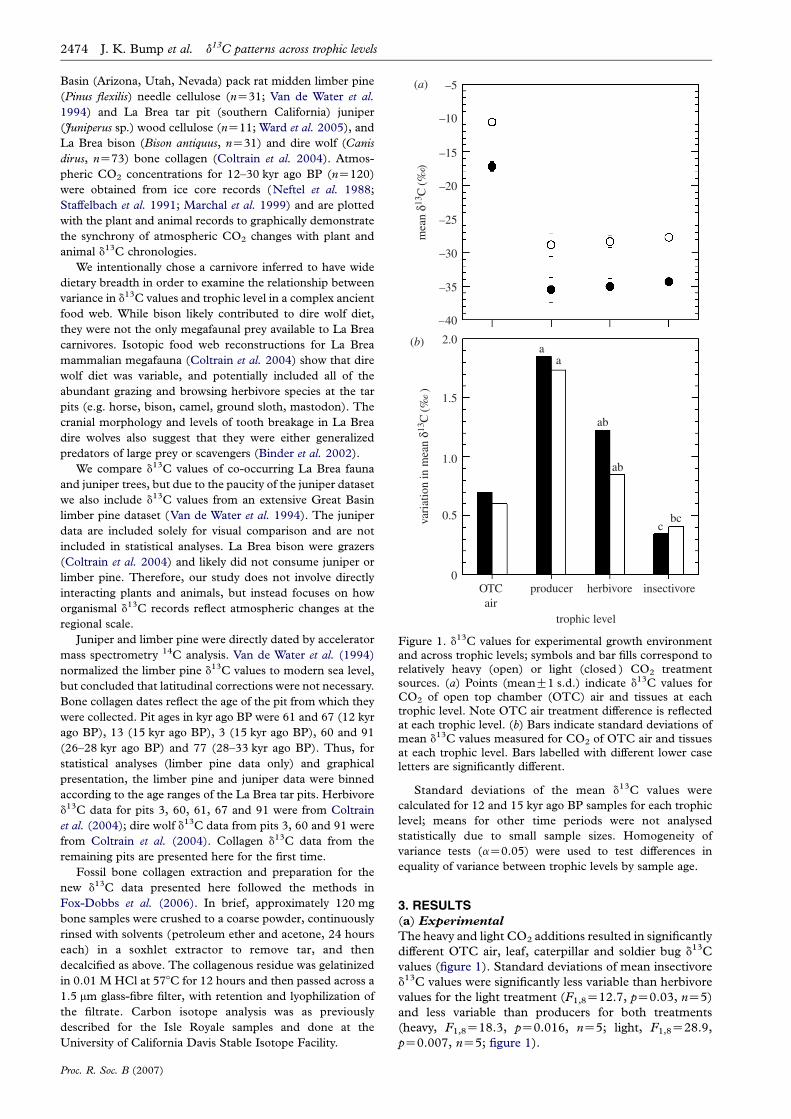
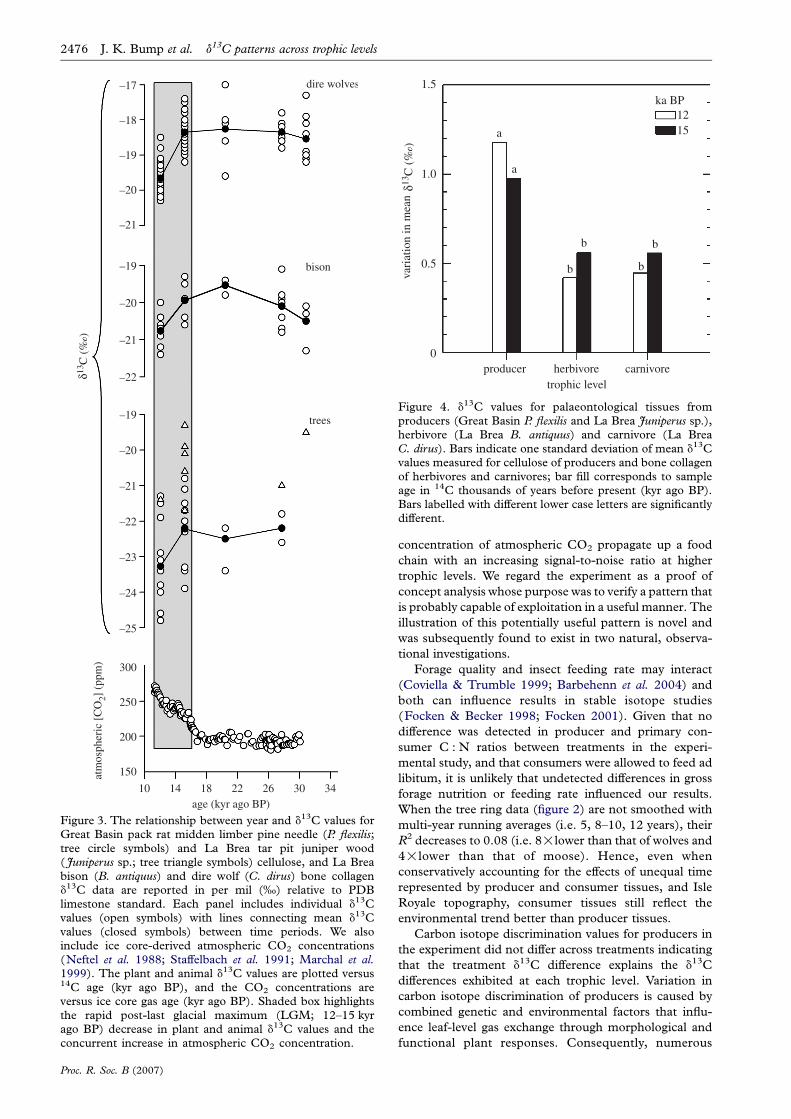
The 12 and 15 kyr ago BP herbivore and carnivore
tissue samples exhibited significantly less d13C variation
than the Great Basin limber pine trees (F2,55Z11.33,
p!0.001 and F2,31Z3.31, pZ0.025 for 12 and 15 kyr ago
BP samples, respectively; figure 4).
4. DISCUSSIONThe experimental results (figure 1) and observational
analyses (figures 2–4) provide independent evidence
indicating that changes in the d13C value and
1.5
1.0
0.5
0producer herbivore carnivore
trophic level
ka BP1215a
a
b
b
b
b
vari
atio
n in
mea
nδ
Figure 4. d13C values for palaeontological tissues fromproducers (Great Basin P. flexilis and La Brea Juniperus sp.),herbivore (La Brea B. antiquus) and carnivore (La BreaC. dirus). Bars indicate one standard deviation of mean d13Cvalues measured for cellulose of producers and bone collagenof herbivores and carnivores; bar fill corresponds to sampleage in 14C thousands of years before present (kyr ago BP).Bars labelled with different lower case letters are significantlydifferent.
–17
–18
–19
–20
–21
–19
–20
–21
–22
–19
–20
–21
–22
–23
–24
–25
300
250
200
150
10 14 18 22 26 30 34age (kyr ago BP)
atm
osph
eric
[C
O2]
(pp
m)
dire wolves
bison
trees
δ
Figure 3. The relationship between year and d13C values forGreat Basin pack rat midden limber pine needle (P. flexilis;tree circle symbols) and La Brea tar pit juniper wood( Juniperus sp.; tree triangle symbols) cellulose, and La Breabison (B. antiquus) and dire wolf (C. dirus) bone collagend13C data are reported in per mil (‰) relative to PDBlimestone standard. Each panel includes individual d13Cvalues (open symbols) with lines connecting mean d13Cvalues (closed symbols) between time periods. We alsoinclude ice core-derived atmospheric CO2 concentrations(Neftel et al. 1988; Staffelbach et al. 1991; Marchal et al.1999). The plant and animal d13C values are plotted versus14C age (kyr ago BP), and the CO2 concentrations areversus ice core gas age (kyr ago BP). Shaded box highlightsthe rapid post-last glacial maximum (LGM; 12–15 kyrago BP) decrease in plant and animal d13C values and theconcurrent increase in atmospheric CO2 concentration.
2476 J. K. Bump et al. d13C patterns across trophic levels
Proc. R. Soc. B (2007)
concentration of atmospheric CO2 propagate up a food
chain with an increasing signal-to-noise ratio at higher
trophic levels. We regard the experiment as a proof of
concept analysis whose purpose was to verify a pattern that
is probably capable of exploitation in a useful manner. The
illustration of this potentially useful pattern is novel and
was subsequently found to exist in two natural, observa-
tional investigations.
Forage quality and insect feeding rate may interact
(Coviella & Trumble 1999; Barbehenn et al. 2004) and
both can influence results in stable isotope studies
(Focken & Becker 1998; Focken 2001). Given that no
difference was detected in producer and primary con-
sumer C : N ratios between treatments in the experi-
mental study, and that consumers were allowed to feed ad
libitum, it is unlikely that undetected differences in gross
forage nutrition or feeding rate influenced our results.
When the tree ring data (figure 2) are not smoothed with
multi-year running averages (i.e. 5, 8–10, 12 years), their
R2 decreases to 0.08 (i.e. 8!lower than that of wolves and
4!lower than that of moose). Hence, even when
conservatively accounting for the effects of unequal time
represented by producer and consumer tissues, and Isle
Royale topography, consumer tissues still reflect the
environmental trend better than producer tissues.
Carbon isotope discrimination values for producers in
the experiment did not differ across treatments indicating
that the treatment d13C difference explains the d13C
differences exhibited at each trophic level. Variation in
carbon isotope discrimination of producers is caused by
combined genetic and environmental factors that influ-
ence leaf-level gas exchange through morphological and
functional plant responses. Consequently, numerous
d13C patterns across trophic levels J. K. Bump et al. 2477
factors (e.g. soil moisture, humidity, irradiance, tempera-
ture, nitrogen availability, leaf size, age, and thickness,
stomatal density, canopy height, gender, altitude and
genotype) lead to between-individual differences in the
isotope ratios of primary producer tissues of the same
species (reviewed in Dawson et al. 2002). Although the
improved signal-to-noise ratio pattern (figures 2 and 3) at
upper trophic levels compared with producers had been
considered theoretically plausible (figure 1), it was
considered biologically unlikely because consumer diet
change, body condition, variable tissue turnover rates and
migration were mechanisms thought to obscure isotopic
patterns by creating substantial variation in stable isotope
ratios of individual herbivores and carnivores (Gannes
et al. 1997; Dawson et al. 2002; Long et al. 2005). For
example, variable diet combinations for Isle Royale moose
(e.g. aquatic and terrestrial components; Tischler 2004)
and wolves (e.g. moose and beaver, Castor canadensis), and
individual physiology (e.g. starvation, lactation) can
lead to significant between-individual differences in
isotope ratios.
However, our findings provide evidence that top
consumers act as ecological integrators, linking lower
pathways in space and time. That is, producers incorpor-
ate elements over time, averaging isotopic fluctuations
across their environment. Herbivores sample multiple
producers, averaging across their spatial range, and
predators aggregate variation in prey. As a result, higher
trophic level species provide higher signal-to-noise ratio
for trends in isotope chronologies, such as the d13C value
of atmospheric CO2 (figures 2 and 3). Among animal
ecophysiologists and ecologists using stable isotope
methods this logic is loosely referred to as trophic
averaging and temporal or spatial integration. Although
trophic integration of atmospheric isotopic change is well
documented in some cases (e.g. 14C in Bada et al. 1990),
to our knowledge this is the first experimental test and
observational investigation of the patterns of integration.
While our experimental results demonstrate support
for a general concept, we also consider the ecological
relevance of the design (Bernardo 1998; Morin 1998).
The experimental difference in d13C treatments (6.6‰)
may not reflect the current or recent ecological range.
Although changes in atmospheric d13C of a similar
magnitude have been inferred over geological time scales
(Mora et al. 1996), recent d13C trends show less change
over the past two centuries. Atmospheric d13C records
measured from ice cores exhibit approximately 1.5‰
depletion over the past 200 years, typically attributed to
the combustion of isotopically light fossil fuels (Trudinger
et al. 1999). Considering our results with this historical
perspective, d13C chronologies developed from higher
trophic position animals would arguably detect similar
trends based on the lower variance (0.3–0.4‰; figure 1b)
at the secondary consumer level. Producer tissue, in
contrast, would be less likely to exhibit the historical
atmospheric depletion given that the variability observed
in their tissue values (1.7–1.8‰; figure 1b) exceeds the net
depletion (1.5‰) seen in other studies (Trudinger et al.
1999; Sugawara et al. 2003).
The integrating effect by secondary consumers is a
neglected means of developing improved proxies of
ecosystem change given ample museum collections and
the recent advances in isotopic measurements. Moreover,
Proc. R. Soc. B (2007)
consumer tissues, in contrast to producer tissues, are
abundant in the fossil record (e.g. teeth, bone, chitin) and
reliable stable isotope values are routinely measured in
biogenic tissues that have been preserved for millions of
years (e.g. Cerling et al. 1997; Hedges et al. 2004;
McFadden & Higgins 2004; Asara et al. 2007). Notably,
bone collagen has been isolated from fossil bones 68 Myr
old (Schweitzer et al. 2007).
Tissue and organism metabolic rates are important
considerations in selecting archival tissues for developing
isotopic proxies of environmental change. Mass-specific
metabolic rate decreases exponentially with increasing
mass (Schmidt-Nielsen 1983). Thus, carbon turnover in
the tissues of smaller organisms will be swifter than in
tissues of more massive organisms. Tissue type, due to
differences in tissue metabolisms, is also critically linked to
turnover rates. For example, bone, muscle, liver and blood
plasma are four tissues that turn over at relatively very
slow, slow, medium and fast rates, respectively (Fry
2006). Consequently, consumption of a mix of species
of different sizes and/or tissues with variable metabolic
rates results in the ingestion of a mix of carbon isotope
signals. We would expect then that small organisms and
metabolically fast tissues to rapidly equilibrate to isotope
changes in their environment, whereas larger organisms
and metabolically slow tissues will exhibit a lag in isotopic
response time. Smaller animals and metabolically fast
tissues may be more variable and gain less resolution with
higher trophic levels. In contrast, larger organisms and
metabolically slow tissues essentially increase temporal
integration, which may result in more resolution with
higher trophic levels.
The La Brea and Great Basin fossil case study (figure 3)
illustrates how the d13C chronologies of consumers from
multiple trophic levels record a past event of major
ecosystem change. Specifically, patterns in La Brea
consumer chronologies likely reflect how the rapid increase
(from approx. 190 to 250 ppmv) in atmospheric CO2
concentration after the LGM (Neftel et al. 1988;
Staffelbach et al. 1991; Marchal et al. 1999) affected
C3 plant photosynthetic physiology. Previous studies
(Leavitt & Danzer 1992; Van de Water et al. 1994) have
linked the decrease in producer d13C values between 15 and
12 kyr ago BP (i.e. shaded box in figure 3) to increased
discrimination against 13C during photosynthesis at higher
CO2 concentrations. Substrate limitation (i.e. carbon
starvation due to low atmospheric CO2 concentrations)
appears to have been prevalent in LGM trees from western
North America (for a detailed discussion, see Van de Water
et al. 1994; Ward et al. 2005). Change in the d13C value of
atmospheric CO2 probably does not explain the figure 3
patterns (shaded box) because in producer and consumer
tissues the isotopic signal generated by the increase in CO2
concentration (approx. 1‰ decrease) exceeds the con-
current change in the d13C value of atmospheric CO2 at the
glacial–interglacial transition (approx. 0.25 ‰ increase;
Leuenberger et al. 1992; Smith et al. 1999).
Our results are the first to demonstrate how the glacial–
interglacial shift in plant d13C values was recorded in
primary (bison) and secondary (dire wolf ) consumer
tissues from the same geographical region. Trends in top
predator chronologies that are also present in primary
consumer chronologies probably reflect climate or
vegetation changes, not dietary shifts. La Brea dire wolves
2478 J. K. Bump et al. d13C patterns across trophic levels
and bison are equally suitable for detecting baseline
isotopic changes, which is remarkable considering the
difference in dietary breadth of an opportunistic carnivore
versus an obligate grazer. A decrease in the d13C values of
fossil collagen from late Pleistocene European herbivores
(horse, bison, elk) is similar in magnitude and timing to
that of the La Brea fauna, indicating that the response of
C3 plants to changing CO2 concentrations was globally
synchronous (Richards & Hedges 2003; Stevens &
Hedges 2004). The findings of our La Brea and Great
Basin case study have implications for future palaeo-
climatic and palaeoenvironmental reconstructions, since
spatial and temporal patterns in plant tissue d13C, d15N
and d18O values can be driven by climatic factors (Koch
1998). For example, trends in plant water use efficiency
(Van de Water et al. 1994; Dawson et al. 2002) are
correlated with soil moisture content and ambient
temperature patterns (Ehleringer & Monson 1993).
Therefore, changes in plant tissue d13C values due to
varying aridity would probably propagate through food
webs, in which case the higher signal-to-noise ratio in top
predator chronologies would better reflect large-scale
climate change.
We note that rising variance of ecological parameters
has been identified as foreshadowing ecological regime
shifts (Carpenter & Brock 2006). However, Carpenter &
Brock (2006) discuss that changes in variance due to
impending regime shifts may be difficult to distinguish
from other drivers of variance such as exogenous noise
that affects ecosystems. If rising variance is indeed a
leading indicator of ecological transition then, given the
results of our study, stable isotope ratio time series from
herbivore and carnivore populations may provide chron-
ologies that are sensitive to major ecological transitions,
but less affected by other noisy ecosystem components.
In conclusion, our results indicate that there is greater
justification for selecting higher trophic position species in
research explicitly interested in developing proxy environ-
mental records and inferring habitat parameters from
stable isotope chronologies. There are, however, import-
ant caveats to this recommendation, namely considering
diet breath and home range. Animals with home ranges
that cover broad geographical regions or cross important
ecophysiological boundaries will be inappropriate proxies
for understanding local environmental change. Care
should be taken to discern the degree of omnivory in
focal consumers if inferring environmental variables from
stable isotopes is the main objective. Consumers with
relatively narrow diets and limited ranges, such as are
found on Isle Royale, will probably reflect environmental
changes better than consumers in complex food webs. In
particular, species feeding on both producers using
different photosynthetic modes, or on a mix of foods
derived from marine, freshwater and terrestrial sources
should be avoided. Plants with different modes of
photosynthesis exhibit contrasting carbon isotope ratios
(Griffith 1991; Dawson et al. 2002), and foods derived
from marine and freshwater sources often exhibit
contrasting isotopic composition (Chisholm et al. 1982).
Yet, contrary to previous expectation, the analyses
presented here show that informative inferences about
environmental variables based on carbon isotope chron-
ologies are possible with species exhibiting moderate diet
breadth and consumer-derived isotopic values can show
Proc. R. Soc. B (2007)
environmental trends with significantly less noise than
producer values.
Allyson Eller and Krista McGuire helped with the experi-ment. Richard Honrath, David Karowe, Nancy Tuchman,Jed Sparks, Christoph Vogel and Peter Curtis providedexperimental advice and loaned supplies. Robert VandeKopple, C. Anthony Sutterley, Richard Spray and theUniversity of Michigan Biological Station staff providedlogistical support. John Harris and the staff of the GeorgeC. Page museum facilitated sampling of La Brea specimens.Mike Grant and Jennifer Eikenberry helped conductmass spectrometer analysis. We thank Amy Schrank, SteveBertman, Alan Talhelm and two anonymous referees foruseful comments on drafts of this manuscript. Supported by aBiosphere Atmosphere Research & Training fellowship (NSFIGERT grant 9972803) and U.S. Environmental ProtectionAgency Greater Research Opportunities fellowship (EPAGRO grant F5F71445) to J.K.B. and grants to P.L.K. fromNSF (OPP-0352564) and to R.O.P. and J.A.V. from IsleRoyale National Park (CA-6310-9-8001), NSF (DEB-0424562) and Earthwatch, Inc. This research compliedwith current United States law.
REFERENCESAsara, J. M., Schweitzer, M. H., Freimark, L. M., Phillips,
M. & Cantley, L. C. 2007 Protein sequences frommastodon and tyrannosaurus rex revealed by massspectrometry. Science 316, 280–285. (doi:10.1126/science.1137614)
Bada, J. L., Peterson, R. O., Schimmelmann, A. & Hedges,R. E. M. 1990 Moose teeth as monitors of environmentalisotopic parameters. Oecologia 82, 102–106. (doi:10.1007/BF00318540)
Barbehenn, R. V., Karowe, D. N. & Spickard, A. 2004 Effectsof elevated atmospheric CO2 on the nutritional ecology ofC3 and C4 grass-feeding caterpillars. Oecologia 140, 86–95.(doi:10.1007/s00442-004-1572-9)
Bernardo, J. 1998 The logic, value and necessity of groundingexperiments in reality: an essential link in the inferentialchain back to nature. In Experimental ecology: issues andperspectives (eds W. J. Resetarits & J. Bernardo),pp. 370–393. New York, NY: Oxford University Press.
Binder, W. J., Thompson, E. N. & Van Valkenburgh, B. 2002Temporal variation in tooth fracture among Rancho LaBrea dire wolves. J. Vert. Paleontol. 22, 423–428. (doi:10.1671/0272-4634(2002)022[0423:TVITFA]2.0.CO;2)
Carpenter, S. R. & Brock, W. A. 2006 Rising variance: aleading indicator of ecological transition. Ecol. Lett. 9,311–318. (doi:10.1111/j.1461-0248.2005.00877.x)
Cerling, T. E., Harris, J. M., MacFadden, B. J., Leakey, M. J.,Quade, J., Eisenmann, V. & Ehleringer, J. R. 1997 Globalvegetation change through the Miocene/Plioceneboundary. Nature 389, 153–158. (doi:10.1038/38229)
Chisholm, B. S., Nelson, D. E. & Schwarcz, H. P. 1982Stable-carbon isotope ratios as a measure of marine versusterrestrial protein in ancient diets. Science 216,1131–1132. (doi:10.1126/science.216.4550.1131)
Ciais, P., Tans, P. P., Trolier, M., White, J. W. C. & Francey,R. J. 1995 A large northern hemisphere terrestrial CO2
sink indicated by the 13C/12C ratio of atmospheric CO2.Science 269, 1098–1102. (doi:10.1126/science.269.5227.1098)
Ciais, P., Cuntz, M., Scholze, M., Mouillot, F., Peylin, P. &Gitz, V. 2005 Remarks on the use of 13C and 18O isotopesin atmospheric CO2 to quantify biospheric carbon fluxes.In Stable isotopes and biosphere-atmosphere interactions:processes and biological controls (eds L. B. Flanagan, J. R.Ehleringer & D. E. Pataki), pp. 235–267. New York, NY:Elsevier.
d13C patterns across trophic levels J. K. Bump et al. 2479
Coltrain, J. B., Harris, J. M., Cerling, T. E., Ehleringer, J. R.,
Dearing, M., Ward, J. & Allend, J. 2004 Rancho La Brea
stable isotope biogeochemistry and its implications for
the palaeoecology of late Pleistocene, coastal southern
California. Palaeogeogr. Palaeoclimatol. Palaeoecol. 205,
199–219. (doi:10.1016/j.palaeo.2003.12.008)
Coviella, C. E. & Trumble, J. T. 1999 Effects of elevated
atmospheric carbon dioxide on insect plant interactions.
Conserv. Biol. 13, 700–712. (doi:10.1046/j.1523-1739.
1999.98267.x)
Dawson, T. E., Mambelli, S., Plamboeck, A. H., Templer,
P. H. & Tu, K. P. 2002 Stable isotopes in plant ecology.
Annu. Rev. Ecol. Syst. 33, 507–559. (doi:10.1146/annurev.
ecolsys.33.020602.095451)
DeNiro, M. J. & Epstein, S. 1977 Mechanism of carbon
fractionation associated with lipid synthesis. Science 197,
261–263. (doi:10.1126/science.327543)
de Ruiter, P. C., Wolters, V., Moore, J. C. & Winemiller, K. O.
2005 Food web ecology: playing jenga and beyond. Science
309, 68–71. (doi:10.1126/science.1096112)
Drake, B. G., Leadley, P. W., Arp, W. J., Nassiry, D. & Curtis,
P. S. 1989 An open top chamber for field studies of
elevated atmospheric CO2 concentration on saltmarsh
vegetation. Funct. Ecol. 3, 363–371. (doi:10.2307/
2389377)
Ehleringer, J. R. & Monson, R. K. 1993 Evolutionary and
ecological aspects of photosynthetic pathway variation.
Annu. Rev. Ecol. Syst. 24, 411–439. (doi:10.1146/annurev.
es.24.110193.002211)
Ehleringer, J. R., Brooks, J. R. & Flanagan, L. 1998 BOREAS
TE-05 tree ring and carbon isotope ratio data. Oak Ridge
National Laboratory Distributed Active Archive Center,
Oak Ridge, TN. See http://www.daac.ornl.gov.
Falkowski, P. et al. 2000 The global carbon cycle: a test of our
knowledge of earth as a system. Science 290, 291–296.
(doi:10.1126/science.290.5490.291)
Focken, U. 2001 Stable isotopes in animal ecology: the effect
of ration size on the trophic shift of C and N isotopes
between feed and carcass. Isot. Environ. Health Stud. 37,
199–211. (doi:10.1080/10256010108033296)
Focken, U. & Becker, K. 1998 Metabolic fractionation of
stable carbon isotopes: implications of different proximate
compositions for studies of the aquatic food webs using
d13C data. Oecologia 115, 337–343. (doi:10.1007/
s004420050525)
Fox-Dobbs, K., Stidham, T. A., Bowen, G. J., Emslie, S. D. &
Koch, P. L. 2006 Dietary controls on extinction versus
survival among avian megafauna in the Late Pleistocene.
Geology 34, 685–688. (doi:10.1130/G22571.1)
Francey, R. J., Allison, C. E., Etherideg, D. M., Trudinger,
I. G., Leuenberger, M., Langenfelds, R. L., Michel, E. &
Steele, L. P. 1999 A 1000-year high precision record of
d13C in atmospheric CO2. Tellus B 51, 170–193. (doi:10.
1034/j.1600-0889.1999.t01-1-00005.x)
Fry, B. 2006 Stable isotope ecology. NewYork, NY: Springer.
Gannes, L. Z., O’Brien, D. M. & Martınez del Rio, C. 1997
Stable isotopes in animal ecology: assumptions, caveats,
and a call for more laboratory experiments. Ecology 78,
1271–1276.
Griffith, H. 1991 Applications of stable isotope technology in
physiological ecology. Funct. Ecol. 5, 254–269. (doi:10.
2307/2389263)
Hedges, R. E. M. 2003 On bone collagen—apatite–carbonate
isotopic relationships. Int. J. Osteoarcheol. 13, 66–79.
(doi:10.1002/oa.660)
Hedges, R. E. M., Stevens, R. E. & Richards, M. P. 2004
Bone as a stable isotope archive for local climatic
information. Quatern. Sci. Rev. 23, 959–065. (doi:10.
1016/j.quascirev.2003.06.022)
Proc. R. Soc. B (2007)
Hilderbrand, G. V., Farley, S. D., Robbins, C. T., Hanley,
T. A., Titus, K. & Servheen, C. 1996 Use of stable
isotopes to determine diets of living and extinct bears.
Can. J. Zool. 74, 2080–2088.
Hobson, K. A. & Clark, R. G. 1992 Assessing avian diet using
stable isotopes I: turnover of 13C in tissues. Condor 94,
181–188. (doi:10.2307/1368807)
Hobson, K. A. & Schwarcz, H. P. 1986 The variation in d13C
values in bone collagen for two wild herbivore populations:
implications for palaeodiet studies. J. Archaeol. Sci. 13,
101–106. (doi:10.1016/0305-4403(86)90001-4)
Hoppe, K. A., Paytan, A. & Chamberlain, P. 2006
Reconstructing grassland vegetation and paleotempera-
tures using carbon isotope ratios of bison tooth enamel.
Geology 34, 649–652. (doi:10.1130/G22745.1)
Karl, T. R. & Trenberth, K. E. 2003 Modern global climate
change. Science 302, 1719–1723. (doi:10.1126/science.
1090228)
Keeling, C. D., Bollenbacher, A. F. & Whorf, T. P. 2005
Monthly atmospheric 13C/12C isotopic ratios for 10 SIO
stations. In Trends: a compendium of data on global change.
Carbon Dioxide Information Analysis Center/National
Laboratory, U.S. Department of Energy, Oak Ridge, TN.
See http://cdiac.ornl.gov/trends/trends.htm.
Kennedy, D. 2004 Climate change and climate science.
Science 304, 1565. (doi:10.1126/science.304.5677.1565)
Koch, P. L. 1998 Isotopic reconstruction of past continental
environments. Annu. Rev. Earth Planet. Sci. 26, 573–613.
(doi:10.1146/annurev.earth.26.1.573)
Kohn, M. J. & Cerling, T. E. 2002 Stable isotope
compositions of biological apatite. Rev. Mineral. Geochem.
48, 455–488.
Leavitt, S. W. & Danzer, S. R. 1992 d13C variations in C3
plants over the past 50,000 years. Radiocarbon 34,
783–791.
Leng, M. J. 2004 ISOtopes in Quaternary PALaeoenviron-
mental reconstruction (ISOPAL). Quatern. Sci. Rev. 23,
739–741. (doi:10.1016/j.quascirev.2003.06.008)
Leuenberger, M., Siegenthaler, U. & Langway, C. C. 1992
Carbon isotope composition of atmospheric CO2 during
the last ice-age from an Antarctic ice core. Nature 357,
488–490. (doi:10.1038/357488a0)
Long, E. S., Sweitzer, R. A., Diefenbach, D. R. & Ben-David,
M. 2005 Controlling for anthropogenically induced atmos-
pheric variation in stable carbon isotope studies. Oecologia
146, 148–156. (doi:10.1007/s00442-005-0181-6)
Macko, S. A., Lee, W. Y. & Parker, P. L. 1982 Nitrogen
and carbon isotope fractionation by two species of
marine amphipods: laboratory and field studies. J. Exp.
Mar. Biol. Ecol. 63, 145–149. (doi:10.1016/0022-
0981(82)90028-4)
Marchal, O., Stocker, T. F., Joos, F., Indermuhle, A., Blunier,
T. & Tschumi, J. 1999 Modelling the concentration of
atmospheric CO2 during the Younger Dryas climate
event. Clim. Dynam. 15, 341–354. (doi:10.1007/s0038
20050286)
McCutchan Jr., J. H., Lewis Jr., W. M., Kendall, C. &
McGrath, C. C. 2003 Variation in trophic shift for stable
isotope ratios of carbon, nitrogen, and sulfur. Oikos 102,
378–390. (doi:10.1034/j.1600-0706.2003.12098.x)
McFadden, B. J. & Higgins, P. 2004 Ancient ecology of
15-million-year-old browsing mammals within C3 plant
communities from Panama. Oecologia 140, 169–182.
(doi:10.1007/s00442-004-1571-x)
Mora, C. I., Driese, S. G. & Colarusso, L. A. 1996 Middle to
Late Paleozoic atmospheric CO2 levels from soil carbonate
and organic matter. Science 271, 1105–1107. (doi:10.
1126/science.271.5252.1105)
2480 J. K. Bump et al. d13C patterns across trophic levels
Morin, P. J. 1998 Realism, precision, and generality in
experimental ecology. In Experimental ecology: issues and
perspectives (eds W. J. Resetarits & J. Bernardo), pp. 50–70.
New York, NY: Oxford University Press.
Nakicenovic, N. & Swart, R. 2000 Emmission scenarrios.
Cambridge, UK: Cambridge University Press.
Neftel, A., Oeschger, H., Staffelbach, T. & Stauffer, B. 1988
CO2 record in the Byrd ice core 50,000–5,000 years BP.
Nature 331, 609–611. (doi:10.1038/331609a0)
Ostrom, P. H., Colunga-Garcia, M. & Gage, S. H. 1997
Establishing pathways of energy flow for insect predators
using stable isotope ratios: field and laboratory evidence.
Oecologia 109, 108–113. (doi:10.1007/s004420050064)
Peterson, R.O.Wolf ecology and prey relationships on Isle Royale.
US Natl Park Services and Science Monograph Series 11.
Washington, DC: National Park Service.
Rayner, P. J., Enting, I. G., Francey, R. J. & Langenfelds, R.
1999 Reconstructing the recent carbon cycle from
atmospheric CO2, d13C and O2/N2 observations. Tellus B
51, 213–232. (doi:10.1034/j.1600-0889.1999.t01-1-
00008.x)
Richards, M. P. & Hedges, R. E. M. 2003 Variations in bone
collagen d13C and d15N values of fauna from Northwest
Europe over the last 40,000 years. Palaeogeogr. Palaeocli-
matol. Palaeoecol. 193, 261–267. (doi:10.1016/S0031-
0182(03)00229-3)
Schmidt-Nielsen, K. 1983 Scaling: why is animal size so
important? Cambridge, UK: Cambridge University Press.
Schweitzer, M. A., Suo, Z., Avci, R., Asara, J. M., Allen,
M. A., Arce, F. T. & Horner, J. R. 2007 Analyses of soft
tissue from Tyrannosaurus rex suggest the presence of
protein. Science 316, 277–280. (doi:10.1126/science.
1138709)
Smith, J. H., Fischer, H., Wahlen, M., Mastroianni, D. &
Deck, R. 1999 Dual modes of the carbon cycle since the
Last Glacial Maximum. Nature 400, 248–250. (doi:10.
1038/22291)
Sotiropoulos, M. A., Tonn, W. M. & Wassenaar, L. I. 2004
Effects of lipid extraction on stable carbon and nitrogen
isotope analyses of fish tissues: potential consequences for
food web studies. Ecol. Freshw. Fish. 13, 155–160. (doi:10.
1111/j.1600-0633.2004.00056.x)
Sparks, J. P. & Ehleringer, J. R. 1997 Leaf carbon isotope
discrimination and nitrogen content for riparian trees
along elevational transects. Oecologia 109, 362–367.
(doi:10.1007/s004420050094)
Proc. R. Soc. B (2007)
Staffelbach, T., Stauffer, B., Sigg, A. & Oeschger, H. 1991CO2 measurements from polar ice cores: more data fromdifferent sites. Tellus B 43, 91–96. (doi:10.1034/j.1600-0889.1991.t01-1-00003.x)
Stevens, R. E. & Hedges, R. E. M. 2004 Carbon and nitrogenstable isotope analysis of northwest European horse boneand tooth collagen, 40,000 BP–present: Palaeoclimaticinterpretations. Quatern. Sci. Rev. 23, 977–991. (doi:10.1016/j.quascirev.2003.06.024)
Sugawara, S., Kawamura, K., Aoki, S., Nakazawa, T. &Hashida, G. 2003 Reconstruction of past variations ofd13C in atmospheric CO2 from its vertical distributionobserved in the firn at Dome Fuji, Antarctica. Tellus B 55,159–169. (doi:10.1034/j.1600-0889.2003.00023.x)
Thurber, J. M. & Peterson, R. O. 1993 Effects of populationdensity and pack size on the foraging ecology of graywolves. J. Mamm. 74, 789–889. (doi:10.2307/1382426)
Tischler, K. B. 2004 Aquatic plant nutritional quality andcontribution to moose diet at Isle Royale National Park.MS thesis, Michigan Technological University,Houghton, MI.
Trudinger, C. M., Enting, I. G., Francey, R. J., Etheridge,D. M. & Rayner, P. J. 1999 Long-term variability in theglobal carbon cycle inferred from a high precision CO2
and d13C ice-core record. Tellus B 51, 233–248. (doi:10.1034/j.1600-0889.1999.t01-1-00009.x)
Van de Water, P. K., Leavitt, S. W. & Betancourt, J. L. 1994Trends in stomatal density and 13C/12C ratios of Pinusflexilis needles during last glacial–interglacial cycle. Science264, 239–243. (doi:10.1126/science.264.5156.239)
Vucetich, J. A. & Peterson, R. O. 2004 Long-term populationand predation dynamics of wolves on Isle Royale. InBiology and conservation of wild canids (eds D. Macdonald &C. Sillero-Zubiri), pp. 281–292. Oxford, UK: OxfordUniversity Press.
Vucetich, J. A., Peterson, R. O. & Schaefer, C. L. 2002 Theeffect of prey and predator densities on wolf predation.Ecology 83, 3003–3013.
Ward, J. K., Harris, J. M., Cerling, T. E., Wiedenhoeft, A.,Lott, M. J., Dearing, M. D., Coltrain, J. B. & Ehleringer,J. R. 2005 Carbon starvation in glacial trees recoveredfrom the La Brea tar pits, southern California. Proc. NatlAcad. Sci. USA 102, 690–694. (doi:10.1073/pnas.0408315102)
West, J. B., Bowen, G. J., Cerling, T. E. & Ehleringer, J. R.2006 Stable isotopes as one of nature’s ecologicalrecorders. Trends Ecol. Evol. 21, 408–415. (doi:10.1016/j.tree.2006.04.002)