St. Joseph! Welcome to St. Joseph! Ladies Society Corner ...
Upload
khangminh22Category
view
0download
0
IMPACTOrder Book
employeesworldwide
$6.38b $576.2m
$12.1b
>22,000
Revenue Net Profit
MAKING AN20,000trees & shrubs planted
+6% +9%
A N N u A l R e P O R t 2 0 1 2
Click on the Bookmark icon on the left panel
for links to specific sections

We’ve been making an impact since we began. We’ve made a difference to the way our customers do business, the way cities work, and the way goods and people move around the globe. Thanks to years of financial prudence, ceaseless innovation and a sound strategy of globalisation and diversification, we continue to make a positive impact – on our customers, on our worldwide workforce, and on the communities in which we operate.
IMPACTMAKING AN
Be a global defence and engineering group.
Bring value to our customers and partners by delivering total integrated quality solutions and support.
VIsIoN & MIssIoN
integrity, Value creation, courage, commitment and compassion
Core VAlues
CoNTeNTs
2 Financial Highlights 4 Letter to Shareholders 10 Board of Directors 15 Corporate Information 16 Senior Management 18 Organisation Chart
20 Corporate Governance 32 Risk Management 36 Group Overview
38 OpeRaTInG & FInanCIaL RevIeW 40 Financial Review 50 Operating Review & Outlook
68 SuSTaInaBILITy
72 Customer excellence 73 productivity 76 Innovation 78 environment, Workplace Safety & Health
82 people excellence 85 Community Relations 86 Investor Relations 88 awards & Commendations
90 FInanCIaL RepORT
242 SHaReHOLDInG STaTISTICS
Making an impact SInGapORe TeCHnOLOGIeS enGIneeRInG LTD Annual Report 2012 1
Click on the Bookmark icon on the left panel
for links to specific sections

reVeNue AT NeW MArK oF $6.38B WITH 9% GroWTH IN NeT ProFIT To $576.2M
ST engineering is pleased to report another year of good results.
group revenue grew 6% year-on-year to reach a new high of $6.38b, whilst profit Before Tax (pBT) and net profit grew by 10% and 9% to $723.1m and $576.2m respectively. Underpinned by the strong revenue and profits, the group registered earnings Before interest, Taxes, depreciation and amortisation (eBiTda) of $795.0m, an improvement of 7% or $52.3m over FY2011.
The higher net profit was mainly due to higher eBiTda generated by all sectors, gain on disposal of properties, as well as contribution from experia events pte. ltd., the organiser for 2012 Singapore airshow, partially offset by
financialhighlights
Net Profit ($m)
$576.2m
+9%
2012
2011
400.0 600.0
Earnings Per Share (Cents)
18.76¢
+9%
2012
2011
15.0 19.0
Return on Equity (%)
30.4%
+0.5% point
2012
2011
28.0 31.0
$437.9m
+8%
EVA ($m)
2012
2011
350.0 450.0
Revenue ($b)
+6%
$6.38b
2012
2011
5.0 6.6
Return on Sales (%)
9.2%
+0.2% point
2012
2011
8.5 9.5
Dividend Per Share (Cents)
+8%
16.80¢
2012
2011
13.0 17.0
Operating Cash Flow ($b)
$1.04b
+78%2012
2011
0 1.2
reVeNue By seCTor
aerospace
electronics
land Systems
Marine
others
2011 2012
$5.99bFY2011:
$6.38bFY2012:
32%15%
25%
25%
25%
24%
16%
32%3%
3%
higher tax expense. The group’s effective tax rate of 19% in FY2012 was 2% higher than FY2011, due to tax applicable to the higher profit from overseas operations.
return on equity remained high at 30.4%, increased by 0.5% point over FY2011, whilst earnings per Share grew by 9.2% to 18.76 cents.
The group continued to generate strong operating cash flow, ending the year with cash and cash equivalent balance of $2.1b, an increase of $0.3b as compared to the year before. in addition, the group continued to deliver positive economic Value added (eVa) with a 8% growth to $437.9m.
$742.7mFY2011:
$795.0mFY2012:
$527.5mFY2011:
$576.2mFY2012:
eBITdA By seCTor NeT ProFIT By seCTor
1%
41%
40%
2%
17%
17%
18%18%
23%
23%
44%
4%
2%
16%
17%
15%16%
21%
21%
44%
2 3Singapore TechnologieS engineering lTd Annual Report 2012Making an impact

despite the continuing economic challenges there. The group however saw sustained growth in asia which accounted for 59% of group revenue, while our exposure to european countries stayed low.
in the face of market volatility and an increase in business risk, we stayed prudent and worked to further strengthen our balance sheet. our cash and cash equivalent balance stood at $2.1b, which included advance payments from customers of $1.7b as at 31 december 2012. This healthy cash position reflects the strong cash generating capacity of our businesses throughout the economic cycle.
our capital expenditure for this year rose to $236m compared to $189m in FY2011. a significant portion of this expenditure was deployed to expand capacity and enhance capability of our business units. This included additional hangars for the aerospace sector at its changi facility and the Seletar aerospace park; a design-and-build integrated manufacturing, technology and office building for our electronics arm; a new production facility for our specialty vehicle business in Bangalore, india; and a new engine Service centre in Singapore, as well as the expansion of our US shipyard for the Marine sector.
For our shareholders, your Board of directors has recommended a final dividend of 13.80 cents per share for FY2012, consisting of an ordinary dividend of 4.0 cents per share, and a special dividend of 9.80 cents per share. Together with the interim dividend of 3.0 cents per share paid to you in September 2012, this brings the total dividend for the full financial year to 16.80 cents per share, an increase
of 8% over FY2011. as a result, you will enjoy a dividend yield of 5.16%, computed using the average closing share price of the last trading day of 2012 and 2011.
Strengthening induStry partnerShipS during the year, we worked to strengthen industry collaboration with international companies and reputed firms. as a route to drive growth initiatives across our businesses, this strategy has served us well, enabling us to participate in changing market dynamics, make entry into new markets and open up new opportunities.
With regard to this, we made a major extension of our leading position in the aerospace sector through an important strategic alliance with airbus, eadS deutschland gmbh and eadS elbe Flugzeugwerke gmbh on the a330 passenger-to-freighter conversion programme. This partnership is important to us in three ways – it forges a new relationship with airbus and eadS, gives us a new freighter conversion capability, and fills a geographical gap in our global airframe Mro footprint.
over at the land Systems sector, ST Kinetics in partnership with a global Fortune 500 scientific, engineering and technology company, Science applications international corporation, has been accepted by the US Marine corps to provide a customised version of our TerreX for the demonstration phase of the Marine personnel carrier programme. This is a recognition that the TerreX has come into its own to be a vehicle of global standing and is competitive on the global stage.
in another example of how we harness collective expertise to tap market opportunities, ST Marine has set up a joint venture with Swedish company Kockums aB to provide higher level in-country capability in the refitting and lifecycle support services for the republic of Singapore navy’s submarine fleet.
our thrust beyond traditional markets reaped results in the past year. Through working with our partners, we made inroads into new markets which have relatively high barriers to entry.
We entered Japan with our partner Morita corporation. ST Kinetics delivered a trial unit of the rescue and Transporter variant of its extremV, an all-terrain tracked vehicle customised for disaster relief and rescue missions, to Japan’s Fire and disaster Management agency.
The electronics sector extended the reach of our rail electronics solutions to the US through a partnership with ge Transportation, to implement the SmarTrip card dispensers for the Washington Metro. closer to home in Malaysia, we won, through a consortium, our first contract from MrT corporation Sdn Bhd to provide Facility Supervisory control & data acquisition Systems, to control and monitor the MrT facilities in the stations and depots.
We will leverage our initial successes to unlock further opportunities in these markets.
18.76 centsEarnings per share
16.80 centsDividend per share
47.2%
Total shareholder return
letter to shareholders
dear ShareholderS2012 was a fruitful year for us at ST engineering (the group). We closed the financial year ended 31 december 2012 (FY2012) achieving a new mark in revenue to hit $6.38b, a 6% year-on-year growth. We also recorded higher profit before tax (pBT), which grew 10% or $67.9m to $723.1m, and higher net profit of $576.2m, a 9% or $48.7m increase compared to the same period last year.
The aerospace, electronics, Marine sectors reported year-on-year growth of between 5% and 15%, with revenues of $2b, $1.6b and $1b respectively. revenue of $1.5b for the land Systems sector was comparable to a year ago. all sectors registered improvement in pBT, with growth of 9%
for the aerospace sector, 11% for the electronics sector, 6% for the land Systems sector and 5% for the Marine sector.
These results were delivered in a period marked by a weak global economy with fears of a eurozone meltdown, slowing growth in asia, sluggish US economy with unemployment continuing to be high, and the leadership transition in china. ST engineering has, once again proven the soundness of our diversified business model. We played to our strengths in the four business areas, and held up well amidst challenges in the respective business sectors.
The group’s order book of $12.1b, compared to $12.3b in FY2011,
continues to show our ability to maintain a strong revenue pipeline. We expect to deliver $4.3b of the order book in 2013.
revenue mix from the sectors to the group stayed largely the same, comprising 32% for aerospace, 25% for electronics, 24% for land Systems and 16% for Marine. however, growth of our commercial business outpaced the defence business, delivering revenue of $4b, which accounted for 63% of group revenue, compared to 59% a year ago. This growth was driven by broader market opportunities and our continuing investments gradually delivering results.geographically, revenue contribution from US businesses remained stable, contributing 27% to group revenue,
From left to right:
peter Seah lim huat (Chairman), Tan pheng hock (President & CEO)
4 5Singapore TechnologieS engineering lTd Annual Report 2012Making an impact
letter to shareholders
peter Seah lim huat tan pheng hockchairman president & ceo
1 March 2013
deepening our expertiSe We provide smart solutions at ST engineering. This involves the build-up of capabilities and technology in fresh ways so as to be more agile and relevant to our customers’ growing demand for sophisticated and innovative solutions.
in this respect, our aerospace sector expanded into rotable asset leasing and trading. it also launched aeria luxury interiors, a new Vip aircraft interior completion brand to tap the growth opportunities in aircraft interior design and engineering. additionally, we expanded the sector’s engine total support value chain, with the completion of our investment in the largest provider of advanced technology engine wash services, ecoServices, llc.in a move to strengthen the sector’s cabin refurbishment business, and enhance our ability to offer one-stop turnkey retrofit services, we acquired Volant aerospace, llc, an industry-leading provider of commercial aircraft interior reconfiguration and modification services.
over at the electronics sector, we developed new products in the satellite communications segment including high bandwidth on the move and a new satellite router that is compliant with strict airborne communications requirements for military purposes.We also embarked on in-depth r&d for smart utilities solutions to meet the needs of growing cities.
apart from the defence space, our land Systems sector was active in developing and introducing new products for commercial use. We progressively launched a new range of upgraded construction equipment such as a multi-axle rigid dump truck, higher horsepower motor graders and excavators in china and india. our plan is to tap the demand for such
equipment to support the increasing urbanisation and infrastructure development taking place in various parts of the world.
The Marine sector has expanded its pascagoula yard in the US, which when developed in the first half of 2013, will add shiprepair capability to its offerings. The US yard will leverage the shiprepair expertise and track record that we have built for over 40 years in Singapore.
new developments that recognised our proven expertise in naval and air solutions by a single country customer included the contract awarded by the Ministry of defence of the Sultanate of oman to ST Marine to build patrol vessels for the royal navy of oman; the other being the contract by royal air Force of oman to ST aerospace to provide full scale maintenance and modernisation solution for three of its c130 hercules aircraft.
in a milestone development that attests to the group’s core strength of providing integrated capabilities and solutions to support our customers, we were recently awarded the contract by the Singapore Ministry of defence for the design and build of eight new vessels. ST Marine will build the eight vessels at its Singapore Benoi Yard, and ST electronics will supply the core combat systems and combat system integration solutions.
Staying agile For greater competitiveneSS as we continue to sharpen our capabilities and deliver greater value to our customers, we are mindful of the need for the group as a whole to stay nimble and agile in order to remain competitive.
in this regard, we have restructured some of our existing operations to improve productivity and cost efficiency.
We also streamlined or closed businesses that were becoming less viable in the long term or are no longer a fit to our changing business profile.
in the past year, our aerospace sector restructured its business unit, ST aerospace Solutions and its Scandinavian operations, following a business review. This move was taken with the broader objectives of improving cost efficiency and work processes. We want to toughen the resilience of our operations against the hard realities of a challenging aviation market.
our land Systems sector exited the commercial car repair business by closing down the operations of STar automotive centre in Singapore and china, as part of the rationalisation of the sector’s business mix.
greater impact through people and governanceWhile we believe our group has what it takes to overcome the vagaries of the business and economic landscape - a diversified business and revenue stream, strong balance sheet, and experienced management team - our success pivots on our one critical game-changing asset, our people.
ST engineering’s sustained competitiveness will be achieved through the way we as an organisation develop and motivate our people. We are committed to ensuring that every one of our 22,000 employees will have the necessary skills enhancements – in both soft and hard skills – to contribute towards ST engineering’s journey to achieve sustainable long-term growth.
The group’s increased global presence demands that our corporate governance and risk management frameworks must be robust in order to keep our businesses and operations
healthy. as we venture into new territories - be it markets, segments or partnerships - our risk and internal control processes continue to support our evaluation of these business opportunities. Through our code of conduct and ethics, we ensure that our employees fully understand and live up to the group’s standards and expectation of their professional behaviour. We believe these practices will enable us to achieve business targets without compromising the integrity and reputation of our brand.
across the group, the businesses remain committed to our social responsibility objectives, and we continue to give back to the communities in which we operate.our giving goes beyond monetary contributions as we reach out and engage the underserved, through employee volunteerism and staff participation programmes.
in appreciation We take this opportunity to thank Mr Seah Moon Ming, who resigned as deputy ceo and president defence Business on 1 March 2013 after being
with the group for close to 20 years. in these roles, he strengthened the relationship with our defence customers and helped identify and develop new capabilities. We want to acknowledge the contribution he made to the group, and also the role he played in shaping the strategy of ST electronics and driving its international expansion during his tenure as president between 1997 and 2009. We wish him well in his new endeavour.
The Board of directors would also like to acknowledge the invaluable contributions of dr Tan Kim Siew, who stepped down on 31 october 2012, after having served on the Board and Board committees for nine years. We thank colonel ong ann Kiat who stepped down on 14 december 2012 as alternate director to lt-gen neo Kian hong.
We welcome Mr chan Yeng Kit as new director and colonel alan goh Kim hua as alternate director. Their guidance and insights will add depth to the collective wisdom of the Board. Mr Kwa chong Seng, who joined the Board on 1 September 2012, will, if re-elected at
a personal note from peter Seah
dear Shareholders,
after having served more than 10 years as chairman of ST engineering, i have informed the Board of my intention to step down as chairman and director on 25 april 2013, following the annual general Meeting on 24 april 2013. it has been an exciting and rewarding journey to guide and grow the company to the global presence it has today.
i thank the Board, Management and staff of ST engineering for the support they have given me during my tenure as chairman. i also want to thank you, our shareholders for your continued support for the group. i am confident that Mr Kwa, with his wide ranging industry, board and management experience will further strengthen the Board’s capabilities and role in guiding the management to execute strategies focusing on creating shareholder value for you.
the agM on 24 april 2013, take over as the Board chairman on 25 april 2013.
We thank our fellow Board of directors for their dedication and good counsel, and our management and employees across the group for their hard work, commitment and contributions.
We also thank our many stakeholders, customers, vendors and partners who have supported us during the year.
Finally, we want to thank you, our shareholders, for your confidence and loyalty in staying with us in ST engineering.
6 7Singapore TechnologieS engineering lTd Annual Report 2012Making an impact

各位尊敬的股东:
2 0 1 2 年 是 新 科 工 程 硕 果 累 累 的 一
年。2012财年(截至2012年12月31日)再创新高,年收入同比增长6%,
为63.8亿元。税前利润,同比增长10%,达至7.231亿元;净利润比去年同期
增长9%,达至5.762亿元。
宇 航 、 电 子 和 海 事 业 务 同 期 增 长 率
在5%至15%之间,收入分别为20亿
元、16亿元和10亿元。陆路业务收入
与去年基本持平,为15亿元。四项业务
的税前利润都有所增长,宇航业务增长
9%,电子业务增长11%,陆路业务增
长6%,海事业务增长5%。
2012年全球经济疲软,欧元区面临瓦解
风险,亚洲经济增长放缓,美国不单经
济疲弱,失业率也居高不下,中国领导
层处于过渡时期。本集团业绩的取得再
次证明了我们多元化业务模式是健康稳
健的。四大业务部门充分发挥优势,在
面临挑战时保持了良好的增长势头。
本集团2012 财年订单总额为121 亿
元,与去年123亿元订单基本持平,
这显示了我们强劲的竞争能力。我们
将在2013年内从121亿元的订单投交
43亿元。
本集团各业务部门的收入组合与过往情
况大致相同:宇航业务占32%,电子业
务占25%,陆路业务占24%,海事业务
占16%。商业业务的增长速度超过了国
防业务,收入为40亿元,占集团总收
入的63%,而去年则占59%。商业业务
的快速发展不仅得益于日趋增多的市场
机会,也是我们的持续投资逐渐获得回
报的结果。以地理位置而言,尽管美国
业务面对严峻的经济挑战,但其收入稳
健,占本集团总收入的27%。本集团在
亚洲的业务持续增长,占集团总收入的
59%,但我们在欧洲市场的占有份额仍
处于较低水平。
虽然市场波动增加了经营风险,但我们
一如既往地谨慎行事,并进一步加强对
资产负债表的管理。截至2012年12月
31日, 我们的现金、现金等价物和短期
投资为21亿元,其中包括了17亿元客
户预付款。这种稳健的现金状况反映了
我们在整个经济周期中较强的现金增值
能力。
致股东的信函
我们2011财年的资本支出为1.89亿
元,今年则上升至2.36亿元。其中大
部分用于扩大产能和提高各业务部门
的能力。这包括宇航业务在樟宜机场
和实里达航空园区增建机库,为电子
业务建造集生产、技术开发和办公为
一体的大楼,在印度班加罗尔为陆路
业务专用车辆部门增设生产设施,海
事 业 务 在 新 加 坡 新 设 一 个 引 擎 服 务
中 心 , 以 及 扩 建 海 事 业 务 在 美 国 的
造船厂。
董事会建议2012财年为股东派发每股
13.80分的末期股息,这包含了每股
4.0分的普通股息和每股9.80分的特
别股息。连同2012年9月派发的每股
3.0分的中期股息,本财年的总股息为
每股16.80分,比2011财年增加了8%。
因此,根据2012年和2011年最后一个
交易日的平均收市价计算,您获得的股
息收益率为5.16%。
加强行业合作伙伴关系
在这一年中,我们致力于进一步加强与
国际大公司和知名企业的合作。事实证
明,这一战略有利于推动本集团业务增
长,从而使我们能够自如应对瞬息万变
的市场,并开拓新市场,迎接新机遇。
在这一战略目标的指导下,我们与空中
客车公司、欧洲宇航防务集团及eadS eFW实现战略性结盟,开展a330客货
机改装项目,进一步巩固了我们在宇航
业的龙头地位。建立这结盟的重要性主
要体现在三方面:使我们与空中客车公
司和欧洲宇航防务集团建立了新关系;
为我们带来了客货机改装这个新能力;
填补了我们在全球机身维修大修业务范
围内的地域空白。
在 陆 路 业 务 方 面 , 新 科 动 力 与 美 国Science applications international corporation, 一家财富世界500强的公司合作,为美国海军陆战队提供定制的TerreX 轮形战斗车,此战斗车将参与海军人员运输项目的展示阶段。这说明TerreX 轮形战斗车已获得国际认可,能在国际舞台上参与竞争。
新科海事与瑞典Kockums aB合作成立了一家合资企业,在新加坡国内为新加坡海军潜艇舰队提供更高级的改装和寿命周期支援服务。这是我们利用集体专
业技术开拓市场的又一例证。
去年,我们也向非传统市场进军,且收
获颇丰。通过与合作伙伴展开合作,我
们已经成功进入了门槛较高的新市场。
我们依托合作伙伴Morita corporation进入日本市场。新科动力为日本总务省
消防厅试定了一架全地形履带运载车,
负责灾害救援和运输,它是extremV的
改装版。
电子业务与通用电气运输系统有限公司
合作,为华盛顿地铁安装SmarTrip售票
处机,从而使我们铁路电子解决方案的
覆盖范围扩大到了美国。在马来西亚,
我们通过一个财团获得了与马国地铁公
司MrT corporation Sdn Bhd 的第一份
合同,为其提供设备监控和数据采集系
统,监控地铁站和仓库设施。
我们将在初步成功的基础上,在这些市
场中开拓更多机会。
深化我们的专业技术
新科工程提供智能解决方案。这包括通
过新途径提高能力、深化技术,以更加
灵活地应对客户对先进和创新的解决方
案日益增长地需求。
我们的宇航业务开启了周转件售后回
租和买卖业务,还推出了aeria豪华机
舱内饰这个新品牌,以应对机舱内部设
计及工程这一日益增长的市场需求。此
外,我们还扩大了宇航业务在发动机全
面支持的价值链,完成了对ecoServices的投资。ecoServices是运用先进技术
提供发动机清洗服务的最大供应商。为
了巩固该业务的客舱翻新业务,提高一
站式翻新服务能力,我们收购了Volant aerospace公司,它是业界领先的商用
飞机内部重新配置和改装服务提供商。
在电子业务方面,我们在卫星通信领域
开发了新产品,包括高带宽移动网络
和一个符合严格的军用机载通信要求的
卫星路由器。为满足日益发展的城市需
求,我们也深入进行智能公用事业程序
解决方案的研发。
除了国防方面,陆路业务也积极开发和
推出商业用途的新产品。我们陆续在中
国和印度推出了一系列更先进的建筑设
备,如多轴刚性翻斗车、更高马力的平
地机和挖掘机。我们计划以市场对此类
设备的巨大需求为契机,支持世界各地
的城市化建设和基础设施的提升。
海事业务已扩建了其在美国的帕斯卡古
拉造船厂,并可在2013年上半年为该厂
提供修船的能力。美国船厂将可充分利
用我们在新加坡所积累的40愈年专业修
船技能和业绩。
我们在海军和空军解决方案方面的专业
技能也获得了单一国家客户的认可。比
如:新科海事获得了阿曼苏丹国防部的
合约,为阿曼皇家海军提供巡逻舰;新
科宇航获得了阿曼皇家空军的合约,为
其三架c130大力士飞机提供全面维护
和现代化解决方案。
我们最近获得了新加坡国防部的合同,
为其设计和建造八艘船舰。这是个具有
里程碑意义的合同,它证明了本集团的
核心竞争力在于提供综合能力和解决方
案以支持我们的客户。新科海事将在新
加坡贲耐船厂建造这八艘船舰,新科电
子将提供核心的作战系统和作战系统综
合解决方案。
灵活应变、保持竞争力
我集团将继续提高自身能力,并为客户
创造更多价值;同时,我们也不忘本
集团作为一个整体应灵活应变,以保持
竞争力。
鉴于此,我们将一些现有业务进行重
组,以提高生产力和成本效益。我们精
简或关闭了一些业务,它们有的可持续
发展性较弱,有的不再适合我们不断变
化的业务空间。
在过去的一年中,宇航业务重新检讨
了自身业务,对子公司 STa Solutions 斯堪纳维亚的业务进行了重组。通过这
一举措,我们可以提高成本效率和工作
流程,以增强业务适应能力,应对航空
市场的严峻挑战。
作为陆路业务组合合理化的举措之一,
陆路业务关闭了新加坡和中国的星时达
汽车专业维护中心,退出了商业汽车维
修业务。
网罗人才、加强管理、扩大影响
本集团业务多元化,收入来源广泛,有
强大的资产负债表和经验丰富的管理团
队。我们相信这些是应对变幻莫测的商
业市场和经济景观所必需的。但我们更
相信集团成功的支点是广大员工,他们
才是决定胜负最重要的资产。
新科工程通过不断激励员工、给予他们
发展空间,以维持自身竞争力。我们确
保22,000名员工的软性和硬性技能都能
得以提高,从而帮助本集团实现长期地
可持续增长。
本集团在全球市场的地位日益显著,这
就需要公司管理和风险管理框架足够
稳健,以确保健康的业务营运。当我们
进军新的领域——无论是开拓新市场、
新的业务领域,还是寻求新的合作伙
伴——我们的风险管理与内部控制会继
续对新商机进行评估。我们通过《行为
和道德守则》确保员工充分了解和遵守
员工专业操守的规定。我们相信这些做
法能使我们在不损害品牌诚信和声誉的
前提下实现业务目标。
整个集团的诸多业务仍然致力于以履行
社会责任为目标,我们将继续回报企
业所在的社区。我们的回报不仅限于
捐款,我们还通过员工志愿者和员工
参与计划深入那些尚未得到充分服务
的社区。
致谢
我 们 要 借 此 机 会 感 谢 佘 文 民 先 生 ,
他为集团服务了近20年, 2013年3月1日
辞 去 了 副 首 席 执 行 官 兼 总 裁 ( 国 防
业 务 ) 的 职 务 。 他 在 任 内 加 强 了 与
国 防 业 务 的 客 户 关 系 , 帮 助 集 团 认
清 新 的 发 展 形 势 , 并 开 发 新 的 业 务
领域。佘先生在1997年至2009年担
任 新 科 电 子 总 裁 期 间 , 为 新 科 电 子
发 展 策 略 的 形 成 和 推 动 其 国 际 扩 张
作 出 了 卓 越 贡 献 。 我 们 衷 心 感 谢 佘
先 生 并 祝 愿 他 在 新 的 工 作 岗 位 取 得
更大成就。
陈金秀博士在董事会和董事委员会任职
了九年,于2012年10月31日离职,董
事会在此感谢陈博士为集团做出的巨大
贡献。王安傑上校作为梁建鸿中将的替
补董事已于2012年12月14日离职,我
们在此对王安傑上校深表谢意。
我们欢迎陈英杰先生成为新任董事,欢
迎吴钦华上校成为新任替补董事。他
们的指导和见解必将为现有董事会的集
体智慧增加新的维度。柯宗盛先生于
2012年9月1日加入董事会。若柯先生
在2013年4月24日的年度股东大会上再
次当选,他将于2013年4月25日接任董
事会主席一职。
我们衷心感谢各位董事的执着敬业和所
提供的宝贵建议,感谢全体管理层人
员和广大员工的辛勤工作、不懈努力和
宝贵贡献。
我们还要感谢在过去一年中给予我们莫
大支持的利益相关者、客户、供应商和
合作伙伴。
最后,我们要感谢各位股东一直以来对
新科工程的信心和忠诚,谢谢您!
佘林发 陈平福
主席 总裁及首席执行官
2013年3月1日
佘林发寄语
各位尊敬的股东:
我在新科工程担任了十年的主席。
不久前,我告知董事会我有意于
2013年4月25日(即2013年4月24日的年度大会第二天)辞去主席和
董事。对我而言,能够领导新科工
程成长为具有国际地位的集团是件
令人兴奋和有意义的经历。
我要感谢新科工程的董事会、管理
层及全体员工在我担任主席期间所
给予的支持。我也要感谢你们——
尊敬的股东们,感谢你们一路以来
地扶持。我深信,柯先生凭借他深
厚广博的行业、董事会和管理经
验,将进一步加强董事会的执行能
力,与管理团队密切合作,为各位
股东创造更多价值。
8 9Singapore TechnologieS engineering lTd Annual Report 2012Making an impact

board of directors
ProFIles oF dIreCTorsThe names of the directors holding office at the date of this report are set out below together with details of their academic and professional qualifications, age, date of first appointment as director, date of last re-election as director, as well as directorships in companies.
Mr KOh Beng Seng
Mr Koh Beng Seng, 62, is the ceo of octagon advisors pte. ltd. he was appointed an independent non-executive director on 15 September 2003 and was last re-elected director on 19 april 2012. Mr Koh was deputy president of United overseas Bank ltd from June 2000 to 31 January 2005. prior to this, Mr Koh was Senior advisor to asia pulp & paper co ltd, and advisor to Bank of china and the international Monetary Fund. Mr Koh has extensive experience in the financial services sector. he was with the Monetary authority of Singapore from 1973 to 1998, where he served as deputy Managing director from 1988 to 1998. Mr Koh is a director of Bank of china (hong Kong) limited^, Boc hong Kong (holdings) limited, Sing-han international Financial Services limited and great eastern holdings limited*. Mr Koh holds a Bachelor of commerce (First class honours) from the former nanyang University, Singapore, and a Master of Business administration from columbia University, USa.
Lieutenant-General NEO Kian hong
lg neo Kian hong, 48, is currently chief of the defence Force (cdF) but will step down as cdF with effect from 27 March 2013. he was appointed a non-executive director on 31 March 2010 and will retire at this coming agM. prior to this, lg neo was the chief of army. he joined the Ministry of defence (MindeF) in 1984 and was awarded the SaF overseas Scholarship in 1985, SaF postgraduate Scholarship (general development) in 1997, the public administration Medal (gold) in 2007 and the Meritorious Service Medal (Military) in 2012. in the course of his military career, he has held various key command and staff positions in MindeF. lg neo is a director of Jurong Town corporation and a board member of dSTa Board. he holds a Bachelor of engineering (honours) (electrical & electronic) from the University of london, UK, as well as a Master of Science (Management of Technology) from the Massachusetts institute of Technology, USa.
Mr ChAN Yeng Kit
Mr chan Yeng Kit, 48, is permanent Secretary (defence development), MindeF. he was appointed a non-executive director on 1 december 2012 and is due for re-election at the 2013 agM under article 104 of the company’s articles of association. Mr chan has held various positions in public Service including permanent Secretary, Ministry of information, communications & the arts from 2008 to 2012; chief executive officer, infocomm development authority of Singapore from 2005 to 2008; and deputy Secretary (policy), Ministry of education from 2002 to 2004. he was awarded the public administration Medal (Silver) in 2000 and public administration Medal (gold) in 2010. Mr chan holds chairmanships in defence Science & Technology agency and dSo national laboratories. he graduated with Bachelor of Science (First class honours) from the University of Tasmania, australia and holds a Master in public administration from the harvard University.
Mr peter Seah lim huat, 66, was appointed non-executive chairman on 15 april 2002 and was last re-elected director on 19 april 2012. he will step down from the Board on 25 april 2013, following the 2013 agM. Mr Seah is a member of the Temasek holdings advisory panel. he was a banker for 33 years before retiring as Vice chairman and ceo of the former overseas Union Bank in 2001. Mr Seah then joined Singapore Technologies pte ltd as president & ceo and held this position until 31 december 2004. he is also chairman of dBS group holdings ltd* and dBS Bank ltd and sits on the Boards of capitaland limited*, Starhub ltd*, STaTS chippac ltd.* and government of Singapore investment corporation pte ltd. his other appointments include being chairman of laSalle college of the arts limited and Singapore health Services pte ltd and a member of the defence Science & Technology agency (dSTa). Mr Seah was awarded the distinguished Service order 2012 and the public Service Star (Bintang Bakti Masyarakat) in 1999 and made a Justice of the peace in 2003. he graduated from the former University of Singapore in 1968 with an honours degree in Business administration.
Mr Peter SEAh Lim huat (Chairman) Mr TAN Pheng hock
Mr Tan pheng hock, 55, is the president & ceo of ST engineering and an executive director. he was appointed director on 1 May 2001 and was last re-elected director on 19 april 2012. Mr Tan is chairman of the Singapore Workforce development agency and nanyang polytechnic Board of governors. he is also deputy chairman of the Singapore Quality award governing council and is on the board of the Singapore economic development Board. he received the public Service Medal in 2011. Mr Tan received recognition as Best chief executive officer (for companies with $1b and above in market capitalisation) in the Singapore corporate awards in 2012. he began his career with ST engineering as an engineer in ST Marine in 1981. over the last three decades, he has held numerous senior appointments in the group including that of executive Vice president of ST Marine, president of ST Kinetics, president and chief operating officer of ST engineering and ST engineering group president. he holds a Bachelor of Science (First class honours) in Marine engineering from the University of Surrey, UK and a Master of Science in Management from Stanford University, USa.
10 11Singapore TechnologieS engineering lTd Annual Report 2012Making an impact

BoArd oF dIreCTors
Dr Stanley LAI Tze Chang
dr Stanley lai Tze chang, 45, is head of the intellectual property & Technology department, allen and gledhill llp. he was appointed an independent non-executive director on 8 october 2009 and is due for re-election at the 2013 agM under article 98 of the company’s articles of association. dr lai was appointed Senior counsel at the opening of the legal Year 2010. dr lai was appointed deputy chairman of ipoS from 1 october 2011. he obtained his law degree from the University of leicester (UK) in 1992 and qualified to practise as a Barrister in england and Wales in 1993. dr lai is a member of lincoln’s inn. he was called to the Singapore bar in 1995. dr lai also holds a Masters in law (llM) and doctorate (ph.d) in law from the University of cambridge, UK.
Mr KhOO Boon hui
Mr Khoo Boon hui, 58, is the Senior deputy Secretary of the Ministry of home affairs. he was appointed an independent non-executive director on 1 September 2010 and was last re-elected director on 20 april 2011. Mr Khoo was appointed commissioner of the Singapore police Force (SpF) in July 1997, and relinquished this post in January 2010 after serving 32 years in SpF. he was also the president of inTerpol from 2008 to 2012. he is currently alternate chairman of home Team academy Board of governors, deputy chairman of Singapore island country club and Singapore Quality award governing council and a Board Member of Singapore health Services pte ltd and Temasek Foundation clg limited. he also sits on the advisory panels of the international centre for Sports Security, the UK-based independent commission on the Future of policing, the cambridge University police executive programme, and the oxford University Journal of policing. Mr Khoo holds a Bachelor of arts (engineering Science & economics) degree from oxford University and a Master in public administration from the Kennedy School of government, harvard University. he attended the advanced Management program at Wharton School of the University of pennsylvania in 2002.
Mr Quek poh huat, 66, is Senior advisor of Singapore power limited. prior to this, he was the group ceo of Singapore power limited until his retirement on 31 december 2011. he was appointed a non-executive director on 15 april 2002 and is due for re-election at the 2013 agM under article 98 of the company’s articles of association. Mr Quek is Singapore’s non-resident ambassador to Sweden. he was awarded the public Service Star in august 1994. Mr Quek obtained a Bachelor of Science in chemical engineering from the University of leeds, UK, and a Master of Science in Management from the naval postgraduate School, USa.
Mr QUEK Poh huat Mr Venkatachalam KRIShNAKUMAR
Mr Venkatachalam Krishnakumar, 63, is chairman of oracle Financial Services Software pte ltd (Singapore). prior to this, he has held senior advisory roles at McKinsey and company, Barclays Bank plc, global retail and commercial Banking and dBS Bank. he was chief operating officer and chief Financial officer for the asia pacific consumer Bank of citigroup when he retired on 28 February 2005 (after a 31-year career with the group). during his career with citigroup, he held several senior appointments in india, Singapore and new York. he was appointed an independent non-executive director on 15 april 2002 and was last re-elected director on 19 april 2012. he is a director of pactera Technology international ltd#, Mediacorp pte. ltd., aspen holdings limited, cypress holdings limited and ciMB Bank Berhad. he holds a Bachelor of engineering and Master of Business administration from the indian institute of Management, india.
Mr Davinder SINGh
Mr davinder Singh, 55, is the ceo of drew & napier llc. he was appointed an independent non-executive director on 1 august 2007 and is due for re-election at the 2013 agM under article 98 of the company’s articles of association. Mr davinder Singh has been in legal practice for close to 30 years. he was in the first batch of Senior counsels appointed in 1997. he is a director of the Singapore exchange limited* and petra Foods limited* and a Member of the Board of Trustees of nUS. Mr davinder Singh holds an llB (honours) from the former University of Singapore.
Mr QUEK Tong Boon
Mr Quek Tong Boon, 57, is chief defence Scientist and chief research & Technology officer in MindeF. he was appointed a non-executive director on 1 March 2008 and was last re-elected director on 20 april 2011. he joined the defence Science organisation of MindeF in 1980 and in the course of his career, has held various key appointments, including that of deputy Secretary (Technology and Transformation) of MindeF and ceo of the dSo national laboratories. Mr Quek’s current chairmanship includes that of the intellectual property office of Singapore (ipoS). he is also an adjunct professor at the department of electrical & computer engineering of the national University of Singapore (nUS). he holds a Bachelor of arts (honours) (engineering) from the University of cambridge, UK, and a Master of Science (electrical engineering) from nUS.
12 13Singapore TechnologieS engineering lTd Annual Report 2012Making an impact
Corporateinformation
Board of Directors
Mr peter Seah lim huat (chairman)Mr Tan pheng hock (president & ceo)Mr Koh Beng Senglieutenant-general neo Kian hongMr chan Yeng KitMr QUeK Tong BoonMr QUeK poh huatMr Venkatachalam KriShnaKUMarMr davinder Singh s/o amar Singhdr Stanley lai Tze changMr Khoo Boon huiMr KWa chong Sengcolonel alan goh Kim hua (alternate director to lieutenant-general neo Kian hong)
Company Secretary
Mrs chUa Su li
Registered Office
51 cuppage road #09-08Singapore 229469Tel: (65) 6722 1818Fax: (65) 6720 2293http://www.stengg.com
Share Registrar
M & c Services private limited112 robinson road #05-01Singapore 068902
Auditors
KpMg llp16 raffles Quay #22-00hong leong BuildingSingapore 048581Mr ThaM Sai choy (partner-in-charge)(date of appointment: 21/04/2010)
Principal Bankers
Bank of america, n.a.9 raffles place#18-00 republic plaza Tower 1Singapore 048619
citibank n.a.8 Marina View#21-01 asia Square Tower 1Singapore 018960
dBS Bank ltd12 Marina Boulevardlevel 45, MBFc Tower 3Singapore 018982
oversea-chinese Banking corporation limited65 chulia Street#10-00 ocBc centreSingapore 049513
Sumitomo Mitsui Banking corporation3 Temasek avenue#06-01 centennial TowerSingapore 039190
BoArd oF dIreCTors
paSt directorShipS in the laSt
three yearS
mr peter Seah lim huatalliance Bank Malaysia BerhadBank of china limitedgic Special investments private limitedglobal crossing limitedSembcorp industries ltdSingapore Technologies Telemedia pte ltd
mr tan pheng hock2006 JV pte. ltd. (in members’ voluntary winding up)neptune orient lines limitedS. rajaratnam School of international StudiesSembcorp Marine ltd
mr Koh Beng SengJapan Wealth Management Securities incFraser and neave limited
lieutenant-general neo Kian hongSingapore Technologies Kinetics ltd
mr QueK poh huatenterprise Business Services (australia) pty ltdpowergas limitedSingapore power limitedSp powerassets limitedSp powergrid limitedSp Services limitedSpi (australia) assets pty ltdSpi Management Services pty ltd
mr venkatachalam KriShnaKumarhiSoft Technology international ltd
mr Khoo Boon huiSingapore Technologies Kinetics ltd
mr KWa chong SengdBS Bank (hong Kong) ltddBS Bank ltddBS group holdings ltdesso china inc.exxonMobil asia pacific pte ltdexxonMobil oil Singapore pte ltdSinopec SenMei (Fujian) petroleum co. ltd.Temasek holdings (private) limited
Colonel Alan GOh Kim hua
* listed on the SgX-ST^ listed on the Stock exchange of hong Kong# listed on the nasdaq Stock Market
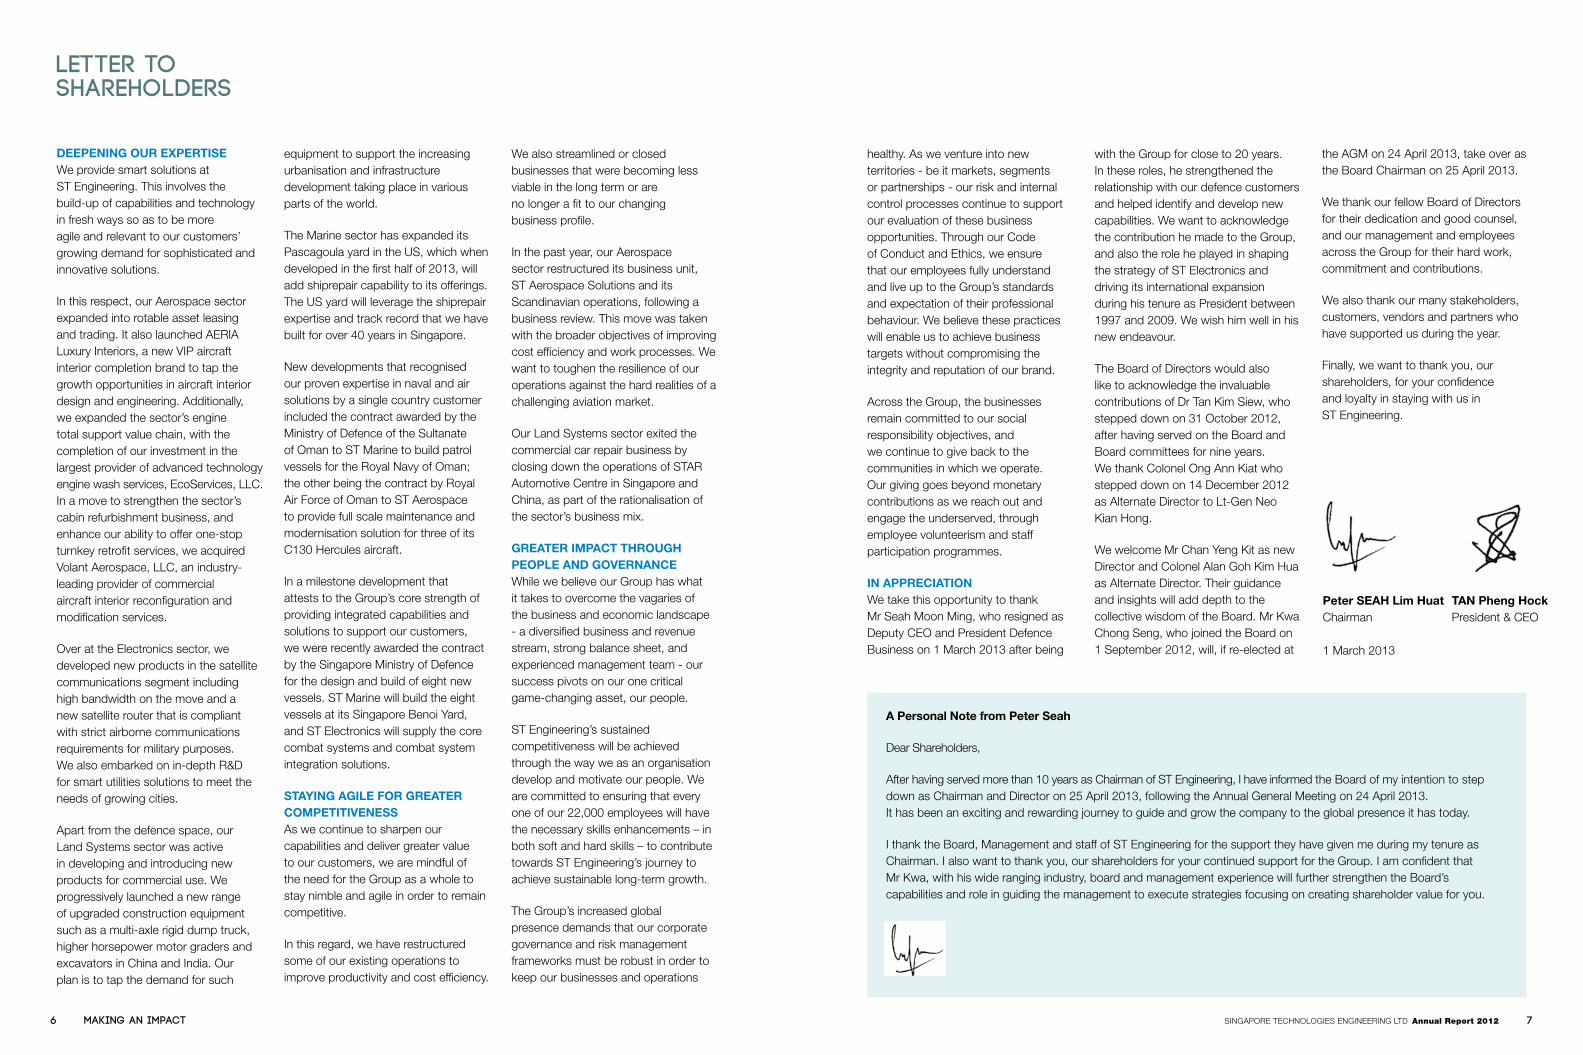
col alan goh Kim hua, 36, is the commanding officer of the Missile corvette Squadron in the republic of Singapore navy (rSn). he was appointed alternate director to lg neo Kian hong on 14 december 2012. col goh joined the Singapore armed Forces (SaF) in 1995 and had held various command and staff positions in MindeF/SaF since 1999, including deputy director, defence policy office and head naval personnel, rSn. he was awarded the SaF overseas Scholarship in 1995 and the SaF overseas postgraduate Scholarship (general development) in 2011. col goh holds a Master of Business administration (Sloan Fellow) from the Massachusetts institute of Technology Sloan School of Management.
Mr Kwa chong Seng, 66, was appointed an independent non-executive director on 1 September 2012 and is due for re-election at the 2013 agM under article 104 of the company’s articles of association. if re-elected, he will succeed Mr peter Seah as chairman of the Board on 25 april 2013. Mr Kwa retired as chairman & Managing director of exxonMobil asia pacific pte ltd in october 2011. a mechanical engineer by training, he joined esso Singapore in 1969 and has held various roles in logistics, Marketing, Supply, Trading and investment planning. Mr Kwa also spent several years in exxon offices in the US and hong Kong. he is currently the chairman of neptune orient lines limited* and several of its key subsidiaries. Mr Kwa is also chairman of Fullerton Fund Management company ltd. and is on the boards of Singapore exchange limited*, Seatown holdings pte ltd and delta Topco limited. he graduated from the former University of Singapore with a Mechanical engineering degree. Mr Kwa was awarded the distinguished engineering alumni award by nUS in 1994 and is a Fellow of the academy of engineering Singapore. in 1999, he was conferred the honorary ningbo citizenship. Mr Kwa was awarded the Singapore public Service Star in 2005 for his outstanding contributions and service to Singapore.
Mr KWA Chong Seng
14 15Singapore TechnologieS engineering lTd Annual Report 2012Making an impact

mr lee Fook Sun, 56, was appointed president of ST electronics in august 2009. prior to his appointment, Mr lee was deputy president (operations), ST electronics since 2005. he joined ST electronics in 2000 as president of defence and international Business. he holds a Bachelor of arts (honours) and a Master of arts (engineering Science) from the University of oxford, UK and attended the Stanford University’s executive programme. Mr lee is a Fellow of the institution of engineers, Singapore.
and president, defence Business, ST Kinetics. as president, Special projects, ST engineering, Mr chang was closely involved in identifying growth opportunities for the group resulting in several acquisitions. he holds a Bachelor of Mechanical engineering (First class honours) from nUS and attended the harvard University’s Management development program. Mr NG Sing Chan
mr ng Sing chan, 52, was appointed president, ST Marine in May 2010. prior to this, Mr ng was deputy president and president, defence Business of ST Marine. he joined ST Marine in 1987 as an engineer. Mr ng left in 1991 and later became the deputy general Manager of pan-United Shipyard pte ltd. he subsequently took on the positions of president of changshu Xinghua changjiang dev co and executive director of pan-United Marine ltd (now known as ddW-paxocean Shipyard pte. ltd.). Mr ng re-joined the group in March 2008 as executive Vice president, Special projects, ST engineering and moved to ST Marine as deputy president in april 2009. Mr ng holds a Master of Business administration (Finance & Banking) from the nanyang Technological University, Singapore and a Masters in engineering from the University of hamburg, germany.
General (Retired) John G COBURN
general (retired) John g coBurn, 70, was appointed chairman and ceo of ST engineering’s US subsidiary, VT Systems, in december 2001. gen (ret) coburn joined the group after an illustrious 39-year career with the US department of defense. prior
Union congress, as recognition for spearheading labour movement initiatives in ST Kinetics. he holds a Bachelor of Science (distinction) in aeronautical engineering and Mechanics from the University of Minnesota, and a Master in Business administration from Stanford University, USa.
Ms Eleana TAN Ai Ching
ms eleana tan ai ching, 50, was appointed chief Financial officer of ST engineering in March 2008. Ms Tan was previously Managing director, Finance, Temasek holdings (private) limited (Temasek). prior to that, she was director Finance at Singapore Technologies pte ltd (STpl) from august 2003 until december 2004, when STpl was restructured, and its assets transferred to Temasek. prior to 2003, Ms Tan had held various key finance positions in the ST engineering group over a period of 13 years and last held the position of group Financial controller of ST engineering. Ms Tan holds a Bachelor of accountancy (honours) from nUS and is a member of the institute of certified public accountants of Singapore.
to taking up this position, he was commanding general of the US army Materiel command, one of the largest commands in the army with 60,000 employees with an annual budget of US$40b and activities in 42 states and 28 foreign countries. gen (ret) coburn holds a Juris doctor from the University of Missouri, USa, a doctor’s degree from eastern Michigan University and many other degrees. he is also a noted author, speaker and a member of the Supreme court of the United States.
Mr SEW Chee Jhuen
mr SeW chee Jhuen, 49, was appointed president of ST Kinetics in September 2006. prior to this, Mr Sew was deputy president (operations) and president defence Business of ST Kinetics. he joined ST aerospace as an aeronautical engineer in 1988, and has held many senior management appointments before becoming deputy president (operations). Mr Sew serves as a Member of the Board of governors of Singapore polytechnic. he was awarded the Medal of commendation in the May day awards 2012 by the national Trades
Mr LEE Fook Sun2
senior
Management
Mr TAN Pheng hock
Mr SEAh Moon Ming1
mr tan pheng hock is president & ceo of ST engineering and a director of the ST engineering Board. (Mr Tan’s profile is on page 10)
mr Seah moon ming, 56, is deputy ceo and president (defence Business) of ST engineering, overseeing the aerospace, electronics, land Systems and Marine sectors. prior to this, he was deputy ceo (electronics & Kinetics) & president (international Business), ST engineering from May 2004 to august 2009 and president, ST electronics, a position he has held from July 1997 to august 2009.
Mr ChANG Cheow Teck
mr chang cheow teck, 52, was appointed president, ST aerospace in May 2010. prior to this, Mr chang was president of ST Marine since 2008. he has been with the group since 1990 and has spent 18 years of his career in the aerospace sector. Mr chang has held several senior management appointments within the group including that of executive Vice president, commercial Business, ST aerospace; president, Vision Technologies Systems, inc.;
Mr Seah was general Manager of ceT Technologies from July 1994 to July 1997. he serves as chairman of the Board of governors of Temasek polytechnic and Singapore cooperation enterprise, Vice chairman of Trek 2000 international ltd*, deputy chairman of international enterprise Singapore and director of dSo national laboratories and alexandra health pte ltd. he is a Fellow of the institution of engineers Singapore and a senior member of ieee. he was awarded the May day Medal of commendation award 2001 by the national Trades Union congress, 2007 international Management action award in Singapore, 2007 Top Ten Financial and intelligent persons award in china, ieS/ieee Joint Medal of excellence 2008 and nUS distinguished engineering alumni award 2011.
Mr Seah holds a Master of Science (distinction) in electrical engineering from the naval postgraduate School, USa.
* listed on the SgX-ST
1 last day of service with the company on 28 February 2013
2 concurrent position of president of defence Business, ST engineering, from 1 March 2013
From left to right:
ng Sing chan, Sew chee Jhuen, John g coburn, Tan pheng hock, eleana Tan, Seah Moon Ming, chang cheow Teck, lee Fook Sun
16 17Singapore TechnologieS engineering lTd Annual Report 2012Making an impact

Augustine SYNSenior Vice President
EUROPE OPERATIONS
John G COBURNChairman & CEO
US OPERATIONS
FONG Saik hayPresident
ADVANCED ENGINEERING CENTRE
PUAh Lian SengGeneral Manager
INTEGRATED SERVICES
Seah moon ming1
Deputy CEO & President, Defence Business
ChANG Cheow TeckPresident
LIM Serh GheeChief Operating Officer & President, Defence Business
AEROSPACE ELECTRONICS
LEE Fook Sun2
President
LAU Thiam BengDeputy President, Operations & President, Defence Business
YONG Thiam ChongDeputy President, International Business
LAND SYSTEMS
SEW Chee JhuenPresident
GAN Boon JinChief Operating Officer& President, Defence Business
MARINE
NG Sing ChanPresident
hAN Yew KwangExecutive Vice President, Shipbuilding
organisation
Chart
Grace KWOKSenior Vice President(Reports to Audit Committee)
INTERNAL AUDIT
Eve ChAN Group Financial Controller
FINANCE
Alice ChUASenior Vice President(Joint reporting to Risk Review Committee)
RISk MANAGEMENT
Patrick ChOYExecutive Vice President
INTERNATIONAL MARkETING
FONG Saik hayChief Technology Officer
TECHNOLOGY
Steven ChEONGSenior Vice President
MERGERS & ACQUISITIONS
TAN Nga KokSenior Vice President/Director
HUMAN RESOURCE
LOW Meng WaiSenior Vice President
LEGAL
TAN hock haiChief Information Officer
INFORMATION TECHNOLOGY
Lina POASenior Vice President
CORPORATE COMMUNICATIONS
Robin ThEVAThASANSenior Vice President
STRATEGIC PLANS
LOW Yee Kah Senior Vice President
DEFENCE BUSINESS
Parmesh SINGhExecutive Vice President
SPECIAL PROJECTS
harnek SINGhVice President/Director
BUSINESS EXCELLENCE
GOh Bak NguanChief Procurement Officer
PROCUREMENT
GAN Boon JinChief System Engineer
SYSTEM ENGINEER
tan pheng hockPresident & CEO
eleana tanChief Financial Officer
Phillip YEO President, Commercial Business
1 last day of service with the company on 28 February 20132 concurrent position of president of defence Business, ST engineering, from 1 March 2013
18 19Singapore TechnologieS engineering lTd Annual Report 2012Making an impact

type of meeting no. of meetings attendance average (%)
Board 6 82%
audit committee 5 80%
Business investment and divestment committee 3 83%
executive resource and compensation committee 3 81%
nominating committee 3 92%
Senior human resource committee 1 67%
risk review committee 4 70%
Budget and Finance committee 2 100%
research, development and Technology committee 3 89%
Tenders committee * *
* decisions were made via circular resolution.Minutes of the Board committee meetings are made available to all Board members.
Board composition and guidance(principle 2)The Board comprises 12 directors and an alternate director. Mr Kwa chong Seng was appointed as an independent and non-executive director on the Board with effect from 1 September 2012. dr Tan Kim Siew resigned from the Board upon stepping down as permanent Secretary (defence development). Mr chan Yeng Kit, who is the incumbent permanent Secretary (defence development) was appointed non-executive director on 1 december 2012. col alan goh Kim hua was appointed alternate director to lg neo Kian hong in place of col ong ann Kiat with effect from 14 december 2012.
The Board consists of members with established track record in defence, business, finance, banking, technology, legal and management skills. each non-executive director brings to the Board an independent perspective based on his training and expertise to make balanced and well considered decisions.
The chairman of the Board is Mr peter Seah, an independent non-executive director. he was appointed to the Board on 15 april 2002 as chairman. Mr peter Seah is a member of the Temasek advisory panel of Temasek holdings (private) limited. The Temasek advisory panel provides a platform for members who are industry leaders to share their wealth of experience. it is not a decision-making body and hence such an appointment does not interfere with Mr Seah’s exercise of independent judgment on the Board. he will step down from the Board on 25 april 2013, following the 2013 agM. Mr Kwa chong Seng will succeed him as chairman if re-elected at the agM on 24 april 2013.
The president & ceo is Mr Tan pheng hock, who is an executive director. Save for Mr Tan pheng hock, the remaining eleven directors are non executive directors.
The Board has seven independent directors. The independence of each director is determined upon appointment and reviewed annually by the nominating committee (nc). The nc has affirmed that the independent directors are Mr peter Seah, Mr Koh Beng Seng, Mr Venkatachalam Krishnakumar, Mr davinder Singh, dr Stanley lai, Mr Khoo Boon hui and Mr Kwa chong Seng.
Mr davinder Singh is the chief executive officer of drew & napier llc (drew & napier). dr Stanley lai is a partner of allen & gledhill llp (allen & gledhill). during the year, the group engaged the services of drew & napier and allen & gledhill. payments made by the group to drew & napier and allen & gledhill respectively exceeded S$200,000 in FY2012.notwithstanding this, the nc regards Mr Singh and dr lai as independent directors for the following reasons:
• BothMrSinghandDrLaiareestablishedlawyersintheirrespective fields and come from leading and reputable law firms. Being legal professionals, they have demonstrated objectivity in their views and, in addition, have contributed valuable advice at board deliberations.
• ThebillingsbyeachofthelawfirmstotheGroupconstitute an insignificant percentage of ST engineering’s expenses. They also contribute a small percentage of the billing firms’ revenues.
The Board has, at all times, exercised independent judgment in decision making, using its collective wisdom and experience to act in the best interests of the company. any director who has an interest that may conflict with a subject under discussion by the Board either recuses himself from the information flow and discussion of the subject matter or declares his interest and abstains from decision-making.
CorPorATe
GoVerNANCeST engineering is committed to maintaining high standards of corporate governance. our framework of corporate governance reflects an institutional mindset of accountability and transparency at all levels of the group as good corporate governance is not only the Board’s responsibility, but that of the entire organisation.
This report sets out ST engineering’s corporate governance processes, practices and activities in 2012 with specific reference to the guidelines of the Singapore corporate governance code 2005 (2005 cgcode)1.
Board matterSBoard’s conduct of its affairs (principle 1)The Board is accountable to shareholders for overseeing the effective management of the business. To this end, the Board relies on the integrity and due diligence of its senior management and its external advisors and auditors. in addition to its statutory responsibilities, the Board reserves the following matters for its decision:
• approvaloftheGroup’soveralllongterm strategic objectives;
• approvalofannualbudgets,majorfunding proposals, investment and divestment proposals in accordance with the approved delegation of authority framework;
• appointmentofthePresident& ceo, Board changes and appointments on Board committees; and
• approvaloftheunauditedquarterly,half yearly and full year audited results prior to their release.
Besides monitoring the performance of the group, the Board also provides guidance on sustainability issues such as environmental and social factors, as part of the overall business strategy.
in the discharge of its functions, the Board is supported by nine Board committees to which it delegates specific areas of responsibilities for review and decision making, and the executive office. The executive office comprises the president & ceo; deputy ceo; and the chief Financial officer (cFo). Board members receive monthly consolidated management reports on the financial performance of each business sector, capital commitments and significant operational highlights.
a formal letter is sent to a director upon his appointment setting out his duties and responsibilities. a new director is also given a briefing by the president & ceo on the strategic direction and performance of the company and its key subsidiaries. The Board is routinely updated on the relevant laws, continuing listing obligations and accounting standards requiring compliance, and their implications for the group, so as to enable each director to properly discharge his duties as Board and Board committee member.
depending on their skillsets and background, directors are sponsored for relevant courses, conferences and seminars in order that they can be better equipped to fulfill their governance role and to comply with directors’ obligations. Where there are statutory and regulatory changes
that affect the obligations of directors, the company will organise briefings by external legal counsel. The new electronic disclosure of interest regime for directors and substantial shareholders of Singapore listed companies which was migrated from the companies act to the Securities and Futures act came into effect on 19 november 2012. directors were briefed on the format of disclosure requirements and reporting timeline to the company.
The Board convenes scheduled meetings on a quarterly basis to coincide with the announcement of the group’s quarterly results. Special Board meetings may be convened as and when necessary to consider urgent corporate actions or specific issues of importance.
To facilitate the Board’s decision-making process, the company’s articles of association provides for directors to participate in Board meetings by teleconference or video conference. The chairman has a second or casting vote. decisions of the Board and Board committees may also be obtained via circulation. The Board monitors the performance of the group through its Board committees.
at the end of every Board meeting, the chairman allocates time for its non-executive directors to discuss any issue concerning the organisation in the absence of Management.
The number of Board and Board committee meetings held during the year is tabulated on the following page.
1 as the new code of corporate governance 2012 (2012 cgcode) takes effect from financial year commencing from 1 november 2012, the 2012 cgcode will apply to ST engineering from the FY2013 annual report.
20 21Singapore TechnologieS engineering lTd Annual Report 2012Making an impact

The composition of the Board committees as at 31 december 2012 is tabulated below:
denoTeS:c – chairmanM – Member# appointed Member on 1 december 2012* appointed Member on 1 September 2012+ appointed alternate director to lg neo Kian hong on 14 december 2012
Board member
Mr peter Seah lim huat c c m c
Mr Tan pheng hock m m m m m
Mr Koh Beng Seng c
lg neo Kian hong m m m
Mr chan Yeng Kit# m m
Mr QUeK Tong Boon c
Mr QUeK poh huat m m
Mr Venkatachalam KriShnaKUMar m m c m
Mr davinder Singh c m
dr Stanley lai Tze chang m m m m
Mr Khoo Boon hui c
Mr KWa chong Seng* m m m m
col alan goh Kim hua+
rol
ling
list o
f any
3 B
oard
dire
ctor
s
Aud
it C
om
mitt
ee(e
stab
lishe
d on
15/
1/19
98)
Tend
ers
Co
mm
ittee
(est
ablis
hed
on 5
/1/1
998)
Ris
k R
evie
w C
om
mitt
ee(e
stab
lishe
d on
7/1
2/19
98)
Sen
ior
Hum
an R
eso
urce
Co
mm
ittee
(est
ablis
hed
on 1
6/1/
1998
)
Res
earc
h, D
evel
op
men
t an
d T
echn
olo
gy
Co
mm
ittee
(est
ablis
hed
on 1
/8/2
003)
Bud
get
and
Fin
ance
Co
mm
ittee
(est
ablis
hed
on 5
/1/1
998)
No
min
atin
g C
om
mitt
ee(e
stab
lishe
d on
4/1
2/20
02)
Exe
cutiv
e R
eso
urce
and
Co
mp
ensa
tion
Co
mm
ittee
(est
ablis
hed
on 6
/12/
1997
)
Bus
ines
s In
vest
men
t an
d D
ives
tmen
t C
om
mitt
ee(e
stab
lishe
d on
8/9
/199
7)
access to information(principle 6)The Management furnishes Board members with monthly management reports, providing updates on key operational activities and financial analysis. The Board also has unrestricted access to the president & ceo, the cFo, management and the company Secretary as well as the
internal and external auditors and the risk management team. The Board may also seek independent professional advice if necessary.
Board papers are sent to directors at least three days prior to meetings in order for directors to be adequately prepared for the meetings.
The Board held a total of six meetings during the year, to consider among other things, the approval of the FY2011 results and release of 1Q2012, 2Q2012 and 3Q2012 results.
chairman and chief executive officer (principle 3) The chairman and president & ceo roles and responsibilities are kept separate in order to maintain effective oversight. no individual or small group of individuals dominates the Board’s decision making process. The president & ceo and senior management regularly consult with individual Board members and seek the advice of members of the Board committees through meetings, telephone calls as well as by electronic mail.
The chairman, Mr peter Seah, is responsible for the proper functioning of the Board and acts independently in the best interests of the company and its shareholders. The chairman facilitates the relationship between the Board, president & ceo and management, engaging them in constructive discussions over various matters, including strategic issues and business planning processes. he ensures that discussions at the Board level are conducted objectively and professionally where all views are heard and key issues are debated in a fair and open manner. The chairman also ensures that adequate time is provided for strategic issues. he represents the views of the Board to the shareholders.
The president & ceo is accountable to the Board for the conduct and performance of the group. he has been delegated authority to make decisions within certain financial limits imposed by the Board. during the year, the president & ceo was supported in his work by the deputy ceo, Mr Seah Moon Ming and the cFo, Ms eleana Tan ai ching in the executive office.
Board membership and evaluation of performance (principles 4 and 5)Supporting the Board are the following Board committees:
• NominatingCommittee
• AuditCommittee
• BusinessInvestmentandDivestmentCommittee
• ExecutiveResourceandCompensationCommittee
• BudgetandFinanceCommittee
• Research,DevelopmentandTechnologyCommittee
• SeniorHumanResourceCommittee
• RiskReviewCommittee
• TendersCommittee
nominating committee (nc)The nc is responsible for reviewing the composition of the Board and identifying and selecting suitable candidates to the Board.
The nc comprises four non executive independent directors. Mr Venkatachalam Krishnakumar is the chairman of the nc. The other members are Mr peter Seah, dr Stanley lai and Mr Kwa chong Seng.
The nc is charged with the responsibility of ensuring that the company’s Board and its subsidiaries comprise individuals who are able to discharge their responsibilities as directors. The nc identifies suitable candidates for appointment to the boards of the group, in particular, candidates who can value add to the management through contribution of their skills, knowledge and experience.
during the year, the nc reviewed and affirmed the independence of the company’s independent directors and the composition and profile of Board members in relation to the needs of the ST engineering Board.
during the year, the nc conducted a collective assessment of the Board to gauge the effectiveness of the Board’s performance, the adequacy of the blend of skillsets and experience of the Board, and the quality and timeliness of board and committee meeting agendas and papers submitted by the Management. The review was internally undertaken with each director being asked to complete a questionnaire. Their feedback was collated and shared with the Board. The review indicated that the Board continues to function effectively.
The nc has also noted the list of other directorships held by our directors taking into consideration their principal commitments. The nc is satisfied that each of the directors is able to devote time to the affairs of the company.
The nc is also responsible for renewal and succession plans to ensure Board continuity. at each agM, one third of the directors with the longest term in office since his last re-election is required to retire. a retiring director may submit himself for re-election. Under this provision, lg neo Kian hong, Mr davinder Singh, Mr Quek poh huat and dr Stanley lai Tze chang will retire. Mr Kwa chong Seng and Mr chan Yeng Kit, who are newly appointed, will hold office until the forthcoming agM of the company. lg neo Kian hong has decided not to seek re-election at the agM. The retiring directors, other than lg neo, being eligible, have offered themselves for re-election.
each of the retiring non-executive directors has confirmed that he does not have any relationship with his fellow directors nor with the company and its substantial shareholders.
The nc recommends that each of the retiring directors other than lg neo, be re-elected at the company’s forthcoming agM.
CorPorATe GoVerNANCe
22 23Singapore TechnologieS engineering lTd Annual Report 2012Making an impact

directorS’ Fee policydirectors’ fees are approved in arrears by shareholders for services rendered the previous year. For services rendered in 2012, a portion of the directors’ compensation will be paid out to certain non-executive directors in the form of restricted share awards pursuant to the ST engineering restricted Share plan 2010 (rSp2010), subject to shareholders’ approval at its agM in april 2013.
These share awards are now directly linked to, and form part of, directors’ compensation which is subject to shareholders’ approval annually. This move provides greater transparency and enables shareholders to have
visibility and a greater say over the total compensation of non executive directors. payment of part of the directors’ compensation in the form of shares aligns the interests of our non executive directors with that of our shareholders.
as these are shares awarded in lieu of directors’ compensation in cash, the shares will be awarded outright as fully paid shares and there will be no vesting period for the shares. The ercc has determined that 30% of a participating non-executive director’s compensation shall be paid in the form of shares. The number of shares to be awarded to a participating non executive director will be governed by the terms of the rSp2010.
The non executive directors’ compensation payable in respect of financial year 2012 is proposed to be $1,166,346, (FY2011: $1,076,346) and comprises both the cash component of $844,446 (FY2011: $774,949) and the shares component of $321,900 (FY2011: $301,397).
The computation of the non executive directors’ compensation is based on the following fee policy which has been adjusted to reflect the increased governance responsibilities of the Board and Board committees and to reflect market-competitive fee levels of similar sized companies:
Fees to directors who hold public sector appointments follow the directorship & consultancy appointments council (dcac)’s guidelines as set out below.
non executive directors who hold public sector appointments follow dcac guidelines and will not be eligible for the shares component of the non executive directors’ compensation. 100% of their compensation in cash is payable to dcac, where applicable.
CorPorATe GoVerNANCe
remuneration matterSprocedures for developing remuneration policies (principle 7)level and mix of remuneration (principle 8)disclosure on remuneration (principle 9)The executive resource and compensation committee (ercc) performs the role of the remuneration committee. The committee comprises Mr peter Seah as chairman, Mr Venkatachalam Krishnakumar, dr Stanley lai and Mr Kwa chong Seng. The members of the ercc have held senior positions in large organisations and are experienced in the area of executive remuneration policies and trends.
all the ercc members are independent non-executive directors.
all decisions at any meeting of the ercc are decided by a majority of votes of the ercc members present and voting (the decision of the ercc shall at all times exclude the vote, approval or recommendation of any member who has a conflict of interest in the subject matter under consideration).
The ercc’s role is to assist the Board to carry out the following key duties and responsibilities:
• reviewandestablishexecutiveremuneration policy
• approvetheremunerationpackageand service terms for senior executives
• settargetsforseniorexecutivesand approve equity-based incentive share awards
• approvenon-executivedirectorremuneration structure
The ercc met three times in 2012. its key activities were centred on the assessment and development of the senior management team, target setting, and the determination of their compensation and incentive awards. in determining the overall remuneration package, the ercc assesses executives’ contributions to the group relative to preset targets, the performance of the group, and the compensation and employment conditions of various industries, including global remuneration benchmarking.
The ercc reviewed and decided on conditional performance share awards under ST engineering’s performance Share plan 2010 and restricted Share plan 2010 to employees subject to certain performance criteria as well as economic Value added-based incentives for senior executives.
The Board has delegated authority to the ercc to determine the remuneration of the president & ceo and the senior management.
remuneration benefits for key executives comprise a fixed component, a variable component, benefits and a share-based component. The fixed component comprises the base salary and compulsory employer contribution to an employee’s cpF. The variable component includes the Monthly performance Bonus (which is 1/12 of the 13th month salary), performance Target Bonus and economic Value added or eVa earned for the year. Key executives in the group have individual eVa banks which are earned according to a formula computed based on the group’s and/or Sectors’
eVa performance. The eVa earned for the year is added to the balance carried forward in each of the executive’s eVa bank. one-third of the total is paid out, while the balance two-third is carried forward to the next year. a negative eVa earned will result in a clawback of eVa earned in previous years.
The benefits provided are comparable with local market practices.
The share-based component comprises the performance share awards and restricted share awards under the respective approved share plans. contingent shares are granted to executives subject to key performance indicators (Kpis) being met over a specified performance period. The group has tabulated a summary compensation table for key executives for the year ended 31 december 2012. This table is found on page 27.
The Senior human resource committee, chaired by Mr peter Seah, comprises lg neo Kian hong, Mr chan Yeng Kit1, Mr Kwa chong Seng and Mr Tan pheng hock. The committee reviewed the talent management and leadership development initiatives to build a leadership pipeline for the group.
By supporting and directing the group’s talent management and leadership initiatives, the committee has helped to enhance the process of identification and development of talents to be groomed for senior positions. The committee has also reviewed the succession plans for key management positions in the group.
1 Mr chan Yeng Kit was appointed to the committee with effect from 1 december 2012 succeeding dr Tan Kim Siew who stepped down.
Basic retainer private Sector ($) 2012
private Sector ($) 2011
director 72,000 72,000
additional/committee Fees
Board chairman 83,000 72,000
audit committee:- chairman 52,000 50,000
- Member 29,000 29,000
executive resource and compensation committee and risk review committee:- chairman 35,000 29,000
- Member 18,000 14,000
other committee:- chairman 29,000 29,000
- Member 14,000 14,000
attendance Fees
per Board Meeting 2,000 2,000
per Board committee Meeting 1,000 1,000
public Sector ($) 2012
public Sector ($) 2011
chairman 45,000 45,000
deputy chairman / chairman executive committee / chairman audit committee 33,750 33,750
Member executive committee / Member audit committee / chairman of other Board committee(s)
22,500 22,500
director/other committee Member 11,250 11,250
24 25Singapore TechnologieS engineering lTd Annual Report 2012Making an impact

Summary compenSation taBle For Key executiveS For the year ended 31 decemBer 2012 (group):
Fees $
Between $3,250,000 and $3,500,000
Seah Moon Ming 25% 52% 4% 19% 100% 21,750
Between $2,500,000 and $2,750,000
Chang Cheow Teck 24% 58% 3% 15% 100% –
Lee Fook Sun 19% 62% 4% 15% 100% 38,400
Ng Sing Chan 14% 67% 3% 16% 100% –
Between $2,250,000 and $2,500,000
Sew Chee Jhuen 19% 59% 4% 18% 100% –
Salary *1
$Variable *2
$Benefits *3
$
Share-based Compensation *4
$
*1 Salary includes base salary and employer CPF for the financial year ended 31 December 2012.*2 Variable includes Monthly Performance Bonus (which is 1/12 of the 13th month salary or former AWS paid over 12 months), Performance Target Bonus paid &
EVA earned* for the financial year ended 31 December 2012.* The EVA earned for the year is added to the balance brought forward in each of the executive’s EVA Bank. 1∕3 of the total is paid out, with the balance 2∕3
carried forward to the next year. A negative EVA earned will result in a claw back of the EVA earned in previous years. Key executives in the Group have had individual EVA Bank since the late 1990s.
*3 Benefits provided for employees are comparable with local market practices. These include medical, dental, insurances, car, transport, etc.*4 Based on the fair values of PSP and RSP Contingent shares granted in 2012, using the Monte Carlo simulation model. Contingent shares granted are subject to
key performance indicators (KPIs) being met over the performance period of 2012 - 2014 for PSP and 2012 - 2013 for RSP. The final number of shares awarded will depend on the extent the KPIs are achieved at the end of the respective performance periods and can range from 0% to 170% of the contingent grants for PSP and 0% to 150% of the contingent grants for RSP. Since 2009, the contingent awards for PSP are also conditional upon the KPIs for RSP that has the same end of performance period being met, i.e. PSP ending 2014 having met its KPIs will only be awarded if RSP ending 2014 also meet its KPIs.
*5 Taxable income from exercise of share options are gains on exercise of the Company’s share options during the year. The amount has not been charged to the income statement.
Taxable Income from exercise
of share options in 2012 *5
$Total
$
CorPorATe GoVerNANCe
Summary compenSation taBle For directorS For the year ended 31 decemBer 2012 (group):
name of director
Executive Director:
TAN Pheng Hock 1,210,200 3,027,011 165,014 1,057,601 (a) N.A. 5,459,826 336,000
Non-Executive Directors:
Peter SEAH Lim Huat – – – – 198,800 85,200 284,000 –
KOH Beng Seng – – – – 98,700 42,300 141,000 –
LG NEO Kian Hong – – – – 22,500 (b) N.A. 22,500 –
CHAN Yeng Kit – – – – 1,875 (b) (c) N.A. 1,875 –
Dr TAN Kim Siew – – – – 18,750 (b) (d) N.A. 18,750 –
QUEK Tong Boon – – – – 28,250 (e) N.A. 28,250 –
QUEK Poh Huat – – – – 134,400 (e) 57,600 192,000 –
Venkatachalam KRISHNAKUMAR – – – – 135,100 57,900 193,000 –
Davinder SINGH s/o Amar Singh – – – – 91,000 39,000 130,000 –
Dr Stanley LAI Tze Chang – – – – 143,500 (e) 61,500 205,000 –
KHOO Boon Hui – – – – 48,534 (e) (f) N.A. 48,534 –
KWA Chong Seng – – – – 33,600 (g) 14,400 48,000 –
COL Alan GOH Kim Hua (Alternate to LG NEO Kian Hong)
– – – – – (h) – – –
COL ONG Ann Kiat (Alternate to LG NEO Kian Hong)
– – – – – (i) – – –
1,210,200 3,027,011 165,014 1,057,601 955,009 357,900 6,772,735 336,000
Salary *1
$Variable *2
$Benefits *3
$Cash-based
$Share-based *6
$
Directors’ Total Fees *5
Total$
Share-based Compensation *4
$
Taxable Incomefrom exercise ofshare options in
2012 *7
$
*1 Salary includes base salary and employer CPF for the financial year ended 31 December 2012.*2 Variable includes Monthly Performance Bonus (which is 1/12 of the 13th month salary or former AWS paid over 12 months), Performance Target Bonus paid &
EVA earned* for the financial year ended 31 December 2012.* The EVA earned for the year is added to the balance brought forward in each of the executive’s EVA Bank. 1∕3 of the total is paid out, with the balance 2∕3
carried forward to the next year. A negative EVA earned will result in a claw back of the EVA earned in previous years. Key executives in the Group have had individual EVA Bank since the late 1990s.
*3 Benefits provided for employees are comparable with local market practices. These include medical, dental, insurances, car, transport, etc.*4 Based on the fair values of PSP and RSP Contingent shares granted in 2012, using Monte Carlo simulation model. Contingent shares granted are subject to key
performance indicators (KPIs) being met over the performance period. The performance period for PSP is 2012 - 2014 and for RSP, it is 2012 - 2013 for Tan Pheng Hock. The final number of shares awarded to Tan Pheng Hock will depend on the extent the KPIs are achieved at the end of the respective performance periods and can range from 0% to 170% of the contingent grants for PSP and 0% to 150% of the contingent grants for RSP. Since 2009, the contingent awards for PSP are also conditional upon the KPIs for RSP that has the same end of performance period being met, i.e. PSP ending 2014 having met its KPIs will only be awarded if RSP ending 2014 also meet its KPIs.
*5 The directors’ cash fees and share awards will only be paid/granted upon approval by the shareholders at the forthcoming AGM of the Company.*6 The awards granted under the ST Engineering Restricted Share Plan 2010 (RSP) to all Directors, except for Tan Pheng Hock, are outright shares with no
performance nor vesting conditions but with a Moratorium on selling. Each NED is required to hold a number of shares in the Company based on the lower of: (a) the total number of shares in the Company awarded to such NED as payment of the shares’ component of the NEDs’ fees for FY2011 and onwards; or (b) the number of shares of equivalent value to the prevailing annual basic retainer fee for a Director of the Company. Any extra shares can be disposed of. NED can dispose of all shares if they so desire after a year has elapsed from the time they left the Board.
*7 Taxable income from exercise of share options are gains on exercise of the Company’s share options during the year. The amount has not been charged to the income statement.
(a) Fees payable to Tan Pheng Hock of $251,750 includes fees for directorships in subsidiaries and are payable to Singapore Technologies Engineering Ltd.(b) Fees for public sector directors are payable to a government agency, the DCAC.(c) Pro-rated. Mr Chan Yeng Kit was appointed as Director on 1 December 2012.(d) Pro-rated. Dr Tan Kim Siew resigned as Director on 1 November 2012.(e) Includes fees for directorship in subsidiary(ies)/associated company.(f) Fees for Mr Khoo Boon Hui are payable to DCAC and Mr Khoo in respect of services rendered for the period from 1 January 2012 to 9 November 2012 and
from 10 November 2012 to 31 December 2012 respectively.(g) Pro-rated. Mr Kwa Chong Seng was appointed as Director on 1 September 2012.(h) COL Alan Goh Kim Hua was appointed as Alternate Director to LG Neo Kian Hong on 14 December 2012.(i) COL Ong Ann Kiat resigned as Alternate Director to LG Neo Kian Hong on 14 December 2012.
number of directors in remuneration Bands 2012 2011
$500,000 and above 1 1
$250,000 to $499,999 1 1
Below $250,000 11 10
Total 13 12
The following information relates to remuneration of directors of Singapore Technologies Engineering Ltd:
26 27Singapore TechnologieS engineering lTd Annual Report 2012Making an impact

need to apply international corporate governance standards wherever it operates. it takes a serious view of all reports of violations received and may commission investigations as appropriate.
The ac comprises Mr Koh Beng Seng as chairman, Mr Venkatachalam Krishnakumar and dr Stanley lai. all the members of the ac are independent directors.
The ac held five meetings during the year. during the year, ac met twice with the external auditors, without management, at the beginning and end of the year.
during the year, the ac reviewed and recommended to the Board the release of the 2011 full year, 1Q2012, 2Q2012 and 3Q2012 financial statements, and considered and approved the 2012 audit plan and the 2012 internal audit (ia) plan. in addition, the ac reviewed the adequacy of internal control procedures including iT security issues, interested person transactions and the issues raised in ia reports.
The ac reviewed the level of non audit services performed by its external auditors. For the full year 2012, $3,510,000 was paid to the external auditors for audit and non audit services of the group, of which $1,139,000 or 32% were for non-audit services. The ac was of the opinion that the non audit services performed by the auditors did not compromise their independence.
The ac is routinely updated on the proposed and impending changes in accounting standards and their implications for the group.
internal control (principle 12)internal audit (principle 13) The ac oversees and appraises the quality of the company’s ia function.
The Board, through the ac and the risk review committee, is responsible for oversight of the risk management responsibilities, internal controls and governance processes delegated to Management.
The ia supports the ac in reviewing the adequacy of the company’s internal control system. Staffed by qualified auditors, ia has unrestricted direct access to the ac. The head of ia’s primary line of reporting is to the chairman of the ac, although she reports administratively to the president & ceo of the company.
ia plans its internal audit schedules in consultation with, but independently of, management. The ia plan is submitted to the ac for approval at the beginning of each year. The ac also meets with ia at least once a year without the presence of management to gather feedback on management’s level of cooperation and other matters that warrant ac’s attention. all ia reports are submitted to the ac for deliberation with copies of these reports extended to the relevant senior management, for prompt corrective actions, as recommended. Furthermore, ia’s summary of findings, recommendations and updates on management actions taken are discussed at the quarterly ac meetings.
during the year, ia worked with Management to align companies to the group’s internal control environment and compliance standards in order to strengthen the self-regulating checks and balances. ia also made periodic visits to overseas subsidiaries to review their operations to ensure compliance with the internal controls framework. an external accounting firm, which is not the external auditors of the company, was engaged to assist ia. in accordance with its plan, surprise audits were conducted in the course
of the year on selected areas including treasury activities. dormant bank accounts were also reviewed against bank mandates, bank statements, balances, etc. There were no material issues highlighted following the surprise audits.
There were no significant control issues highlighted by ia in 2012.
The ia continued with its system of rating a company at the end of an internal audit for the purpose of differentiating the high risk issues which require immediate attention.
Based on the internal controls established and maintained by the group, work performed by the internal and external auditors, and reviews performed by Management and various Board committees, the Board, with the concurrence of the ac, is satisfied that the group’s framework of internal controls and procedures is adequate as at 31 december 2012 to provide reasonable, but not absolute, assurance of achieving its internal control objectives and addressing financial, operational and compliance risks.
The Board is satisfied that problems are identified on a timely basis and follow up actions are taken promptly to minimise unnecessary lapses. The Board, through the board committees, is supported in these areas by the internal audit and risk Management teams of the company. in this regard, the Board also notes that no system can provide absolute assurance against the occurrence of material errors, poor judgment in decision-making, human error, fraud or other irregularities.
CorPorATe GoVerNANCe
accountaBility and auditaccountability(principle 10)The Board is responsible for providing a balanced assessment of the company’s performance, position and prospects. in presenting the annual financial statements and quarterly results announcements to shareholders promptly, it is the aim of the Board to provide the shareholders with a detailed analysis, explanation and assessment of the group’s performance, position, risk review and prospects.
directors are required to issue a negative assurance Statement to accompany the company’s interim financial results announcement. For this purpose, certain internal procedures have been put in place to enable each member of the Board reviewing the interim financial statements to immediately raise any material information known to him which may render the interim financial results to be false or misleading prior to their release to SgX. Should there be any significant adverse issue(s) raised by the audit committee (ac) or Board member which may affect the results in a material way, the scheduled date of the results announcement will be postponed to allow time for investigation or further review.
The appointment of auditors is subject to approval at each agM. in making its recommendations to shareholders on the appointment and re-appointment of auditors, the Board relies on the review and recommendations of the ac. KpMg llp in Singapore audits Singapore incorporated subsidiaries that are not exempt from audit under the Singapore companies act. Subsidiaries incorporated in countries outside Singapore that require an audit in their local jurisdictions are largely audited by other independent member firms of the KpMg network affiliated
with KpMg international cooperative, a Swiss entity. Some of our overseas associates and jointly controlled entities which engage other auditing firms do not constitute a significant number. The names of the auditing firms of our subsidiaries, associates and jointly controlled entities are disclosed at pages 169 and 175 of this annual report.
The company has complied with rules 712, 715 and 716 of the SgX listing Manual in relation to the engagement of its auditors.
directors and key senior executives of the group are prohibited from dealing in ST engineering shares two weeks before the announcement of ST engineering’s first quarter, second quarter, third quarter and full year results up to the date of the announcement of the results. directors are discouraged from trading on short term considerations. additionally, all directors of the group and employees are reminded not to trade in situations where the insider trading laws and rules would prohibit trading.
The directors’ interests in shares of ST engineering and its related companies during the year are found on pages 91 to 102 of this report.
audit committee(principle 11)The ac is supported in its work by the audit committees of the four business sectors. The respective chairmen of the audit committees of the four business sectors are invited to attend the ac meetings of ST engineering so as to have a clear understanding of policies made at the holding company level and to share any feedback or raise any issue that the sectors’ audit committees may have.
The ac has full authority to commission and review findings of internal investigations into matters where it is alerted of any suspected fraud or irregularity or failure of internal controls or infringement of any law likely to have a material impact on the group’s operating results. it can investigate any matter within its terms of reference and with the full cooperation of management.
The ac’s key terms of reference include the following:
• undertakingthestatutoryandregulatory functions of an ac as are prescribed by law from time to time;
• reviewingthereportsoftheexternaland internal auditors to provide a further layer of assurance of the integrity, confidentiality and availability of critical information;
• reviewinginterestedpersontransactions;
• evaluatingtheworkoftheexternalauditors and recommending to the Board their re-appointment and compensation on an annual basis; and
• reviewingthelevelofnon-auditservices.
during the year, the Board revised the Terms of reference of the ac for effective date 1 January 2013 to ensure ac continues to deliver and discharge its responsibilities in compliance with the 2012 cgcode to be implemented in FY2013.
The company has in place a Whistle-Blowing framework, where staff may, in confidence and without fear of retaliation, raise concerns of incidents of possible wrongdoing or breach of applicable laws, regulations or policies to the respective chairmen of the audit committees in the group. as ST engineering has become a global company with a presence in many countries, it is aware of the
28 29Singapore TechnologieS engineering lTd Annual Report 2012Making an impact
Budget and Finance committeechaired by Mr davinder Singh, the Budget and Finance committee members include Mr Quek poh huat, Mr chan Yeng Kit1 and Mr Tan pheng hock. Budgets prepared by the respective subsidiaries are consolidated at the ST engineering level and presented to the Budget and Finance committee for review and recommendation to the Board for approval.
during the year, the Budget and Finance committee held two meetings to review the FY2012 budget assumptions and 5-year forecast and to review the 2013 plan prior to submission to the Board for approval.
Business investment and divestment committee
The Business investment and divestment committee comprises Mr peter Seah as chairman, lg neo Kian hong, Mr Quek poh huat, Mr Kwa chong Seng and Mr Tan pheng hock. The committee is delegated authority by the Board to consider investments and divestments up to certain threshold values and to ensure that investments/divestments are in line with the group’s strategy.
communication With ShareholderS(principles 14 and 15)The company enters into regular and timely communication with shareholders as part of the group’s effort to help shareholders better understand its businesses and to obtain feedback on the views and concerns of shareholders.
ST engineering maintains an updated website which provides the latest announcements to SgX, news releases and highlights of corporate events of each sector and its capabilities.
in 2012, ST engineering’s investor relations team held over 200 face-to-face investor meetings and conference calls, as well as participated in investor conferences in Singapore, and non-deal roadshows in hong Kong and the US.
ST engineering is committed to timely and transparent disclosures to ensure that the investing community receives a balanced and updated view of the group’s performance and businesses.
Board members attended the agM and egM in 2012 where shareholders present were given an opportunity to seek clarification or question the Board on issues pertaining to the resolutions proposed before they were voted on. The external auditors were also present at the agM to assist the directors in answering questions on audit related matters from shareholders.
The company fully supports the code’s principle to encourage active shareholder participation. For transparency in the voting process, ST engineering has, since 2010, adopted the use of electronic poll voting for all the resolutions put to vote at its agM and egM. This is a fair and transparent way of voting based on the principle of one share one vote. ST engineering will continue to use electronic poll voting at the forthcoming agM. More on investor relations can be found on pages 86 to 87.
To keep the market abreast and updated of the group’s developments, presentation materials on financial results, as well as statutory announcements and marketing news releases are made available on the company’s website at www.stengg.com.
risk review committee
The risk review committee (rrc), chaired by Mr Khoo Boon hui, comprises lg neo Kian hong, Mr davinder Singh, Mr Venkatachalam Krishnakumar and Mr Tan pheng hock.
a) risk governance
The rrc assists the Board in its risk governance responsibility. rrc’s role is one of oversight of the responsibility delegated to Management to ensure that there is a system of controls in place for identifying and managing risk in order to safeguard stakeholders’ interests and the company’s assets.
The rrc is supported by the group risk Management Team (grMT), headed by SVp, risk Management, working with the Sector chief risk officers from each of the following business sectors:
(1) aerospace(2) electronics(3) land Systems(4) Marine
The head of grMT reports to the chairman of the risk review committee and ST engineering’s president & ceo. The grMT provides leadership in the implementation of a group-wide enterprise risk Management (erM) framework that allows risks to be identified, assessed, monitored and managed by the business managers.
b) risk aware culture and Training
embedding the right culture throughout the organisation is important for effective risk management. The rrc recognises good culture fosters openness that will enable Management and staff to escalate concerns in a
timely manner without fear, as well as promoting better judgment, which provides greater comfort to the Board and Management.
as part of the risk awareness and communication programme, annual risk management training plans covering various risk topics are developed and implemented by the respective sectors, and the status of the training is updated to the rrc at periodic intervals.
c) risk review process
Under the erM framework, a risk dashboard of the top 15 business risks (comprising the key inherent risks that may impact the business objectives) is developed and maintained by each of the significant business units, rolling up into a summary dashboard for each of the four business sectors – aerospace, electronics, land Systems and Marine. once the top business risks are identified, measures will then be taken to develop and implement risk preventive and mitigation actions (collectively known as “controls”) and risk monitoring processes. The business managers are required to periodically review the effectiveness of the controls implemented, and initiate necessary changes as the risk profile changes.
Quarterly, the presidents and the Sector chief risk officers review, with the rrc, their respective dashboard of top 15 business risks. at the meetings, the presidents and Sector chief risk officers would discuss the risk management action plans and measures to address these top business risks. at the same time, the presidents and Sector chief risk officers would also highlight the following for discussion:
1. emerging trends and issues in each business sector
2. new risk or changes to existing risk profile
3. new risk incident4. major risk exposures5. risk management actions taken on
previously identified risks
The committee met four times during the year with management.
d) risk Management Self assurance process
The risk Management Self assurance is a process whereby the business risk owners, together with the respective control owners, evaluate and assess the operational effectiveness of the controls established to manage the key risks that are reported in Sector risk dashboard.
on the basis of this self assessment, the Sector president makes an annual written representation on the overall state of the risk management system for managing the top business risks, to the rrc.
For more information on the company’s principal inherent risks, and risk management framework, please refer to the “risk Management Section” at page 32 of this annual report for more details.
System of internal control and risk managementThe Board receives, at regular intervals, updates from the Board committees on the key business risks, the material controls to manage these risks, and the internal audit reports on the operational effectiveness of the material controls.
The Board is satisfied with the risk management process in place, and, in its opinion, that the effectiveness and adequacy of the material controls to manage the key risks have been appropriately reviewed through the management self assurance process, as well as the independent assurance provided by the company’s ia Function.
CorPorATe GoVerNANCe
1 Mr chan Yeng Kit was appointed to the committee with effect from 1 december 2012 succeeding dr Tan Kim Siew.
30 31Singapore TechnologieS engineering lTd Annual Report 2012Making an impact

identify fraud risk areas together with other key business risk areas and mitigate these risks through regular review and scrutiny of their operations.
(3) process for reporting wrong doings. an employee in the course of his or her work may come across any of the following:
(a) violations of the code or company policies,
(b) violation of laws, rules or regulations,
(c) any wrongdoing, or issues which he or she believes may not have been managed or dealt with properly.
Under the whistle-blowing policy, a process has been established for employees to raise a report of the above concerns, which can also be done on an anonymous basis. Subject to applicable laws, the identity of the employees who raise any such reports is kept in strict confidence and they are protected from any disciplinary or retaliatory action arising by reason of their having made these reports.
(4) responding to Fraud. a process on how fraud and suspected fraud concerns raised through the established reporting channels should be dealt with has been established. all fraud and suspected fraud cases received will be
risk area inherent risk description
Strategic concentration risk our customers include government agencies and commercial organisations. While it is important for the group to develop close relationships with key customers, we are mindful to avoid over-concentration on any single key customer, and hence recognise the need for diversity of customers.
Strategic competition The group’s businesses are subject to competition from national and multi-national firms in the various markets we operate in, and many contracts are obtained through a competitive bidding process. our ability to compete for contracts depends to a large extent on the effectiveness and innovation of the solutions we offer, as well as our ability to offer better-value-for-money solutions. as we seek to strengthen our commercial business, speed to market becomes ever more critical to success. We conscientiously monitor market conditions and continually seek to innovate our processes and systems to better position the group in both local and overseas markets.
Strategic / legal, regulatory & political
risks inherent in operating in a global market
ST engineering conducts business in a number of countries and, as a result, assumes risks that are associated with operating in a global market. These risks include:(1) changes to government regulations and administrative policies that may result
in restraints on the movement of capital, expropriation of the group’s assets, and new burdensome taxes or tariffs that could be introduced;
(2) political changes that could lead to changes in the business environment in which the group operates;
the group’S principal inherent riSKS
promptly notified to the audit committee chairman. The audit committee has the powers to take prompt actions to inquire into the concerns raised.
(5) monitoring and evaluating effectiveness of controls. The self-assessment process mentioned in (3) above includes a process for business owners to evaluate the design and operating effectiveness of the controls designed to prevent and detect fraud. The internal audit function also carries out regular audits where the operating effectiveness of these anti-fraud controls is independently evaluated.
riskmanagementST Engineering believes that effective risk management is critical to achieving the Group’s strategic objectives and
corporate governance goals.
enterpriSe riSK management (erm) FrameWorKThe ST engineering erM Framework is a discipline which the group uses to identify, assess, control and monitor risks from six key areas:
(1) Strategic(2) operational(3) reputational(4) Financial(5) legal, regulatory & political(6) acts of god & War
The erM framework sets out a consistent definition of risk and risk tolerance limits to ensure that business units have a common understanding when identifying and assessing risks.
To enable erM practices throughout the group, we invested in a software application known as the grc system to capture risks and controls in electronic risk registers. The risk and control owners periodically review and update the registers, regardless of where the businesses are located geographically.
as the group diversifies further across multiple industries, sectors, geographies and jurisdiction, it becomes more important than ever for the senior management team and the Board to have visibility of key business risks. The grc system therefore provides the needed transparency on risks.
St engineering code of conduct
as ST engineering strives for excellence in operational and financial performance, we are equally committed to upholding the highest ethical standards in the ways we conduct our business and deal with our employees, our customers, business partners and other stakeholders, wherever we are located.
The ST engineering code sets out the guiding principles and desired behaviours that embody how our organisation and our people are expected to operate, and embraces the business practices and standards of behaviour that support the commitment to honest and ethical business conduct.
The code covers workplace and business conduct in the following areas:
1. respect for people and non-discrimination2. occupational health & Safety3. Security arrangements 4. Safeguarding of information and assets5. Use of company’s information Technolology6. personal information7. official or classified information8. inside information & public disclosure 9. delivering Quality products and Services10. avoiding conflicts of interest11. Bribery, gifts & hospitality and Kickbacks12. complying with laws and regulations, Trade restrictions and
export controls13. complying with competition (anti-Trust) laws14. caring for the environment15. engaging our community
Fraud riSK management Fraud is used to describe a dishonest activity and comprises such acts as deception, theft, conflict of interest, corruption and bribery. it could be costly and detrimental to the group, both financially and collaterally in the form of a tarnished reputation. hence, we are committed to proactively mitigate the risk of fraud.
The group’s fraud risk management framework comprises the following:
(1) promoting an anti-Fraud culture. The senior management sets the tone and promotes an anti-fraud culture throughout the group, through our set of core Values. all employees are also required to comply with the standards set out in the ST engineering code of conduct, as well as all company policies.
(2) periodic assessment of the risk of Fraud. The group has during the year implemented a self-assessment process for which the business operations proactively
32 33Singapore TechnologieS engineering lTd Annual Report 2012Making an impact

risk area inherent risk description
Strategic / legal, regulatory & political (cont’d)
risks inherent in operating in a global market
(3) economic downturns;(4) political instability and civil disturbances that could disrupt the group’s
business activities.We seek to maintain an even more balanced portfolio by spreading the group’s business operations across several markets. We continue to pursue new emerging markets such as africa, central asia and the gulf States region to further expand and diversify our revenue streams.
Strategic Merger & acquisition (M&a)
one of the avenues through which we seek to grow our businesses is the acquisition of business entities and operating assets or joint ventures. M&a risks include the under-performance or failure of acquired entities. M&a activities, ranging from the identification of targets to conducting due diligence, are supported by a dedicated team of investment professionals and augmented by external professionals for specialised services. The business proposals are guided by a given set of internal investment criteria, evaluated by senior management and endorsed by a Business investment and divestment committee before seeking final approval from the Board of directors.
Financial Foreign exchange The group’s foreign exchange risk arises both from our subsidiaries operating in foreign countries, generating revenue and incurring cost denominated in foreign currencies, and from operations of local subsidiaries which are transacted in foreign currencies. The group’s foreign exchange exposures are primarily from USd and euro, and we enter mainly into forward currency contracts to hedge against foreign exchange risk resulting from anticipated sale and purchase transactions denominated in foreign currencies in accordance with our hedging policy. The group also enters into cross currency swap to hedge the foreign exchange risk of loans denominated in foreign currencies.
Financial credit credit risk, or the risk of counterparties defaulting, is managed through the application of credit approvals, credit limits and monitoring procedures. Where appropriate, we and our subsidiaries obtain collateral from customers or arrange master netting agreements. cash terms, advance payments and letters of credit or bankers’ guarantees are required for customers of lower credit standing.
operational project Management
The main business activity of the group relates to management and execution of projects for defence and commercial customers. risks relating to project management are therefore inherent in the business. These may include issues relating to project costs and schedules, as well as contractual and quality matters. The group has project review and quality assurance systems in place to mitigate such risks. all contracts of material value require review by legal counsel, and significant deviations from pre-approved standard contract terms and conditions are to be highlighted and presented to higher levels of management for review and approval.
risk Management
risk area inherent risk description
operational human capital The recruitment and retention of qualified and experienced personnel is critical to achieving the group’s strategic objectives. We continue to work with local authorities in markets where we operate, and leverage training, retention schemes, scholarships as well as alternative sources for hire to sustain our growth. Talent management programmes also help to create a pool of potential successors for key positions.
operational Subcontractor performance and Key Suppliers
The group is dependent upon the delivery of key materials or components by suppliers and the performance by subcontractors in a timely manner, and in accordance to specifications. The respective sector procurement functions are responsible for establishing and managing end-to-end integrated supplier arrangements within each of their sectors. Supplier milestones and performance are reviewed periodically by the relevant project teams.
legal, regulatory & political
export controls exports of ordnance products, which constitute a portion of the group’s sales, are typically subject to export control regulations. changes in these regulations could have an impact on the group’s sales, while non-compliance could result in financial penalties, suspension of projects or even restrictions on future export business. We continue to place great emphasis on this area and have formal systems in place and designated personnel to ensure export control regulations are complied with.
legal, regulatory & political
compliance with laws & regulations
With operations in several parts of the world, the group is subject to applicable laws and regulations of various jurisdictions. These laws and regulations include anti-corruption laws, export controls, safety and environmental regulations and anti-competition laws. Failure by the group to comply with these laws and regulations may result in criminal liabilities such as fines and penalties, and/or the suspension or debarment of the group from government contracts. The group proactively identifies applicable laws and regulatory obligations, and embeds compliance into the day-to-day business processes.
acts of god & War Business interruption
The group recognises that quick recovery and resumption of business operations after a disruption are critical to minimising financial, operational and reputation impact. accordingly, we have in place a Business continuity Management Framework, which embodies enterprise-wide planning and arrangements of key resources and procedures that enable the group to respond and continue to operate critical business functions across a broad spectrum of interruptions to the business, arising from internal or external events. The group employs the use of force majeure clauses extensively in all contracts to mitigate risk from acts of god. We also have in place a comprehensive insurance programme aimed at mitigating financial losses that might arise from such risks.
34 35Singapore TechnologieS engineering lTd Annual Report 2012Making an impact

Sao Paulo, Brazil
Madrid, Spain
County Meath, Ireland
Johor, Malaysia
Gaborone, Botswana
Dhaka, Bangladesh
Tianjin, China
Jiangsu, China
Xiamen, China
Shenzhen, China
hong Kong
Guizhou, China
Almaty, Kazakhstan
Dubai, UAE Guangzhou, China
Kuala Lumpur, Malaysia
Singapore
Beijing, China
Tokyo, Japan
Wuhan, China
Langley, CanadaKidron, Ohio, USA
Cazaux, France
London, UK
Oxfordshire, UK
Berkshire, UK
Ballarat, Australia
Bangkok, Thailand
Shanghai, China
Bangalore, India
Abu Dhabi, UAE
Independence, Kansas, USA
Washington, North Carolina, USA
Lincolnton, North Carolina, USA
Panama
Taipei, ROC
Montgomery, Pennsylvania, USA
San Antonio, Texas, USA
hope hull, Alabama, USA Mobile, Alabama, USA
Monterrey, Mexico
Cambridge, Massachusetts, USA
Alexandria, Virginia, USA
Pascagoula, Mississippi, USA
herndon, Virginia, USA
Nuevo León, Mexico
Farmington, Connecticut, USA
Burlington, Washington, USA Argenteuil, France
Oslo, Norway
Dresden, Germany
Stockholm, Sweden
Copenhagen, Denmark
ST engineering is an integrated engineering group that provides innovative solutions and services in the aerospace, electronics, land systems and marine sectors.
incorporated in 1997 and headquartered in Singapore, we rank among the largest companies listed on the Singapore exchange, and are one of asia’s leading engineering groups. We have a total workforce of more than 22,000.
our global network of over 100 subsidiaries and associated companies allows us to serve customers in the US, europe, asia and oceania. a leader in each of our core businesses, ST engineering leverages multi-sector capabilities to develop advanced solutions for commercial and defence customers across industries.
our aerospace arm offers a wide spectrum of aircraft maintenance, engineering and training services for both military and commercial aircraft operators. These services include airframe, component and engine maintenance, repair and overhaul, engineering design and development, materials support, asset management and pilot training.
group
overview
Legend
aerospace
electronics
land Systems
Marine
others
ST Engineering’s main facilities and offices
electronics25%
aerospace32%
asia59%
asia69%
commercial63%
others3%
others6%
others1%
Marine16%
europe8%
europe4%
land Systems24%
USa27%
USa26%
defence37%
By BusINess seCTor
revenue $6.38bBy CusToMer TyPe
By loCATIoN oF CusToMers By loCATIoN oF BusINess eNTITy
our electronics arm specialises in the design, development and integration of advanced electronics and communications systems for government, defence, commercial and industrial customers worldwide.
our land systems arm delivers integrated land systems, specialty vehicles and their related through-life support for defence, homeland security and commercial applications.
our marine arm provides customised shipbuilding, repair and conversion services to both naval and commercial vessels, at our yards in Singapore and US. We also provide a host of environmental solutions through our environmental engineering subsidiary.
sINGAPore TeCHNoloGIes eNGINeerING lTd
100% Singapore Technologies Aerospace Ltd
100% Singapore Technologies Electronics Limited
100% Singapore Technologies Kinetics Ltd
100% Singapore Technologies Marine Ltd
100% Singapore Technologies Dynamics Pte Ltd
100% ST Synthesis Pte Ltd
100% ST Engineering Financial I Ltd.
100% ST Engineering Financial II Pte. Ltd.
100% Vision Technologies Systems, Inc.
(For complete group structure, please refer to www.stengg.com)
36 37Singapore TechnologieS engineering lTd Annual Report 2012Making an impact

• VTHackneyopenedanew70,000sqftproductionfacilityinKansas,US
• LeeBoyIndiainaugurateda110,000sqftproductionfacilityinBangalore,India
• NewcollaborationwithSouthAfrica’sParamountGrouptojointlymarketafamilyofprotectedwheeledvehicles
land systems
• Completedanewpurpose-builtGeneralAviationaircrafthangarinSeletarAerospaceParkinDecember2012
• Introduced‘AERIALuxuryInteriors’,anewbrandtodriveforayintonicheVIPaircraftcompletionsandrefurbishmentsmarket
• Addedrotableassetleasingandmanagementserviceoffering
• PartnersAirbus,EADSandEADSEFW,takinga35%stakeinEADSEFWanddevelopingtheA330P2Fconversionprogramme
aerospace
• FormedjointventurewithKockumsABtosupportthesubmarinefleetoftheRepublicofSingaporeNavy
• StrengthenedfootholdinoffshoresupplyvesselsmarketwithadditionalordersfromSwirePacificOffshoreOperations(Pte)LtdandHornbeckOffshoreServices,LLC
• SecuredthelargestnavalexportshipbuildingcontractwiththeRoyalNavyofOmantodesignandbuildfourpatrolvessels
• SecuredanewbuildcontractwithRepublicofSingaporeNavytodesignandbuildeightnavalvessels
marine
• Penetratednewmarkets:
– communicationssystemsforthecontroltowerinNayPyiTawInternationalAirport,Myanmar
– anIntegratedAirTrafficControlTowersimulatorinEcuador
– SmarTripCardDispensersfortheWashingtonMetro,US
– FacilitySupervisoryControl&DataAcquisitionSystemforMalaysia’s51kmSungaiBuloh-KajangMRTLine
• Embarkedonin-depthR&DforSmartUtilitiessolutions
ELECTRONICS
OPERATIONAL &FINANCIAL REVIEW
Engineering the Next Phase of Growth
WearedrivenbytheGroup’sbeliefinconstantlybreakingnewgroundsandscalingnewheights.Indeed,in2012,wecontinuedtomakeanimpactinthecommercialanddefencearenas,developingnewdriversfortheGroup’sfuturegrowth.
38 39SINGAPORETECHNOLOGIESENGINEERINGLTD Annual Report 2012Making an impact

Financial poSition as at 31 december 2012, group’s total assets of $8,031m was $624m or 8% higher than that of 31 december 2011. The higher total assets were mainly due to increases in inventories and work-in-progress, as well as higher cash. during the year, the group transferred rotables of $223m from property, plant and equipment to inventories with aerospace sector’s foray into a new growth area, focusing on rotable assets leasing, trading loan and exchange.
total aSSetS deployment ($m)
9000
8000
7000
6000
5000
4000
3000
2000
1000
020122011
Bank Balances and other liquid Funds, Short-Term investments & Bonds
Trade receivables, deposits & prepayments
inventories & Work-in-progressintangibles & other assetsproperty, plant & equipment & investment property
total aSSetS By geography
increase in capital employed to $8,031m as at end 2012 was mainly attributable to higher shareholders’ funds including non-controlling interests, increases in advance payments from customers, as well as progress billings in excess of work-in-progress, net, partially offset by lower drawdown of bank loans. The group received higher advance payments from customers mainly driven by new orders received in the year.
asia (excluding
china)china
USa
europe
others
2011 2012
financialreview
71%66%8%
7%
18%
17%
3% 2%
6%
2%
capital employed ($m)
9000
8000
7000
6000
5000
4000
3000
2000
1000
020122011
equity
Trade payables and accruals
advance payments from customersBank & other Borrowingsother liabilities
during the year, the group incurred capital expenditure of $236m (2011: $189m). about 81% or $190m of the total capital expenditure was investments in new capacity and capability. additional capital expenditure included purchases of rotable components to support the growth in Maintenance-By-the-hour (MBhTM) programmes, investments in one a320 full flight simulator for the Multi-crew pilot Training programme, a g150 aircraft for the expansion of chartered flight services in Singapore, upgrading of facilities and construction-in-progress of a new dry dock in US and new buildings in Singapore, as well as relocation of Zhenjiang facilities in china.
capital expenditure
By Sector
aerospace
electronics
land Systems
Marine
others
2011 2012
36%39%
20%
19%
30%
10%21%
2%
2%
21%
By geography
asia
europe
USa
others
2011 2012
70%
4%12%
25%13%
6%
1%
69%
treaSury management and itS Financial riSK management The group operates internationally and is exposed to a variety of financial risks, comprising interest rate risk, foreign exchange risk, market risk, credit risk and liquidity risk. The group ascribes great importance to financial risk management and has constantly taken initiatives to review exposure systematically and mitigate the risks it faces.
The treasury framework is made up of treasury polices and guidelines as well as standard operating procedures for both front and back office. The group also adopted treasury best practices which include segregation of front and back office duties, regular rotation of tasks to ensure proper check and balance, as well as familiarise staff with the various tasks in the Treasury function as part of business continuity planning. There are regular periodic reviews to enhance its existing policies and procedures. in addition, ad-hoc audits from the group internal audit function on the Treasury activities are carried out throughout the year.
Foreign exchange managementThe group’s foreign exchange risk arises both from its subsidiaries operating in foreign countries, generating revenue and incurring costs denominated in foreign currencies, and from operations of its local subsidiaries which are transacted in foreign currencies. The group’s foreign exchange exposures are primarily from USd and euro. The group enters mainly into plain vanilla forward contracts to hedge against its foreign exchange risk resulting from anticipated sale and purchase transactions denominated in foreign currencies in accordance with the group’s hedging policy to manage risk. The group does not engage in speculative foreign exchange transactions.
as the foreign exchange environment remains volatile, changes in foreign exchange exposure are monitored closely. Through the monthly and ad-hoc updates (if required) of cash flow projections, hedging strategies are developed to respond to rapid changes of both business dynamics and foreign exchange market. as at year end, the group has outstanding foreign exchange transactions totalling $1.8b, an increase of $1b over FY2011.
liQuidity managementThe group continued to actively manage its cash flow through daily sweeping of working capital.
The group’s total cash and cash equivalent balance rose to $2.1b as at year end as compared to $1.8b as at last year end. The group’s surplus cash are placed with fund managers to invest largely in fixed income instruments in USd and Sgd. as at year end, $358m was invested in fixed income instruments. The yield on the bonds for FY2012 ranged from 1.31% to 6.85% per annum.
40 41Singapore TechnologieS engineering lTd Annual Report 2012Making an impact

financial review
credit FacilitieSin July 2009, the group had established its reg S MTn programme of US$1.2b where it had issued a maiden tranche of 10-year bond of US$500m. as at end 2012, the group has unused MTn facility amounting to US$700m and this will provide the group with greater debt headroom and financial flexibility to tap on the bond market if funding requirement arises.
in FY2012, the group continued to build on its diversified pipeline of bank facilities with various banks of different nationalities by adding on approximately $2b of bank facilities which include trade financing line for performance bonds and bank guarantees, foreign exchange line, as well as loan facility to support the group’s operations in different geographies. as at year end, the group had established $13.1b of bank facilities of which $7.4b or 57% remained unutilised.
By currencyBorrowings were predominantly in USd and euro to support the group’s operations in the US and europe. during the year, as part of its active treasury management, the group entered into cross currency interest rate swaps to swap out some of its existing USd bond liability to Sgd as well as its euro term debts to USd.
By Fixed and Floating rate With the outlook that interest rate will remain flat for a year or more, most loans were refinanced at floating rate. as at year end, 48% of the loans are at floating rate and the group’s effective cost of funds dropped from 3.83% to 3.31% per annum.
intereSt cover ratio The group’s interest cover improved to 14.8 times as at end 2012. The improvement in interest cover was the result of improved profits, as well as lower interest expense of $1.1m.
BanK FaciliteS ($b)
14
12
10
8
6
4
2
0available
2011Utilised 2011
available 2012
utilised 2012
Trade Finance
Foreign exchange
interest rate Swaps & cross currency Swaps
loans
BanK FacilitieS By nationality oF the BanKS
asia
europe
USa
others
2011 2012
3%
5%
54%54%
27%
14%17%
26%
The group serves commercial, defence and government-related customers in over 100 countries and has built up an extensive and active relationship with a network of more than 20 banks of various nationalities. This diversification of the financial institutions has allowed the group to tap on the respective strengths and support of these financial institutions, to pursue the group’s strategic growth and presence globally. This will also enable the group to leverage its multi-sector capabilities to develop advanced solutions for customers across industries globally.
Within 1 yr 2 to 5 yrs >5 yrs
2012
2011
17% 34% 49%
15% 37% 48%
USd eUr rMBSgd
2012
2011
70% 7%23%
75% 20% 5%
Fixed Floating
2012
2011
52% 48%
24%76%
pBT before associates/Jointly controlled entities and interest expense
interest expense interest cover
100
200
300
400
500
600
700
800
0 0
2X
4X
6X
8X
10X
12X
14X
16X
2010 2011 2012
$m
SourceS oF Fundas at end of 2012, the group’s borrowings amounted to $1.3b. compared to the year before, the sources of funding profile remained unchanged, of which, 48% was funded from capital market bonds issuance and the balance 52% was raised through bank borrowings. The group continued to seek diversified and balanced sources of funding for its borrowings to ensure financial flexibility and mitigate its concentration risk.
The group generated a strong operating cash flow of $1,041m in FY2012, and continued to be in a net cash position as at the end of 2012. compared to FY2011, operating cash flow increased by $455m and this was mainly attributable to favourable working capital movements. gross debt/equity ratio improved to 0.6 times as at end 2012.
2012 2011 2010
gross debt/equity ratio 0.6 0.7 0.8
operating cash Flow ($m) 1,041 586 810
Free cash Flow ($m) 868 189 543
net cash ($m) 791 405 442
deBt proFileBy maturityas at end of 2012, more than one year borrowings including the US$500m 10-year bonds made up 83% of total borrowings. during the year, the group refinanced a loan of US$100m for an additional three years and procured a 2-year term loan of US$70m to repay some of its short-term loans.
42 43Singapore TechnologieS engineering lTd Annual Report 2012Making an impact

financial review
taxation in Singapore, the government continues to provide support for businesses and enhance the productivity and innovation credit scheme. Within the group, there are Singapore operating units enjoying concessionary tax rate on offshore leasing activities and development expansion incentive. With these tax incentives, the Singapore operating units have an effective tax rate of 14% (2011: 14%).
in the US, the government has once again extended the research credit (with modification) expired in december 2011 through 2013. our US operations have enjoyed an annual average of US$850,000 research credit in the past three years and it has an effective tax rate of 38.5% (2011: 39.6%).
governments worldwide have continued to step up its enforcement effort towards both direct and indirect taxes with greater focus on indirect taxes. china has its VaT reform in January 2012 and operating units in this tax jurisdiction are regularly updated with the latest development.
SigniFicant accounting policieSThe group’s significant accounting policies are presented in notes to the Financial Statements, note 3 (pages 118 to 138). The group has applied the same accounting policies and methods of computation in the preparation of the financial statements for the current reporting period compared with the audited financial statements as at 31 december 2011, except for the adoption of all the new and revised Singapore Financial reporting Standards, that are mandatory for financial years beginning on or after 1 January 2012 as indicated on page 135.
total Shareholder return With strong cash flow generated from operating activities, the group ended the year with $2.1b of cash and cash equivalent balance. Management will continue to recommend return of excess free cash flow generated by the group and has recommended to shareholders at the forthcoming annual general Meeting a final dividend of 13.80 cents per share. The total dividend per share for FY2012 will amount to 16.80 cents.
ST engineering share price ended the year at $3.82, a 42% increase in the share price compared to a year ago. over the same period, the STi index advanced by 19.7%. With dividend yield at 5.16%, ST engineering shares generated a total positive shareholder return of 47.2% for its shareholders.Since then, the share price has further risen to $4.25 as at end February 2013.
caSh FloWSoperating activitiesin FY2012, net cash generated from operating activities amounted to $1,041m, $455m higher than the $586m in FY2011. This was mainly due to favourable working capital movements from positive variances in advance payments from customers, other payables, accruals and provisions and trade receivables, but these were partially offset by negative variances in advance payments to suppliers and trade payables.
investing activitiesThe group’s net cash used in investing activities of $173m in FY2012 was lower than FY2011 by $224m, mainly due to higher proceeds from sales and maturity of investments and lower purchase of investments.
Financing activities The group’s net cash used in financing activities of $508m in FY2012 was higher than FY2011 by $82m, mainly due to more dividends paid to shareholders and lower drawdown of bank loans.
The group generated $868m of free cash flow in FY2012.
(600) (400) (200) 0 200 400 600 800 1000 1200
$m
Financing activities
investing activities
operating activities
(508)
(426)
(173)
(397)
1,041
586
2012
2011
capital gain dividend Yield
50
0
40
(10)
30
(20)
20
(30)
10
(40)
(50)
41.8%
9.6%
47.2%
(31.6%)
(16.2%)
2008 2009 2010 2011 2012
5.2%
4.7%
4.4%
5.1%
5.2%
(36.8%)
37.1%
5.2%
21.3%
42.0%
44 45Singapore TechnologieS engineering lTd Annual Report 2012Making an impact

financial review
value addedgroup’s total value added for FY2012 of $2,718.2m was higher than that achieved in FY2011 by 9% or $223.7m.
value added Statement2012$m
2011$m
value added from:
revenue earned 6,379.9 5,990.9
Bought in materials and services (3,776.3) (3,594.6)
2,603.6 2,396.3
other income 43.2 32.3
Finance income 48.4 45.1
Finance costs (exclude interest expenses) (17.6) (13.8)
Share of results of associates and jointly controlled entities 40.6 34.6
total value added 2,718.2 2,494.5
distribution of total value added
To employees in wages, salaries and benefits 1,755.8 1,629.6
To government in taxes and levies 155.5 127.6
To providers of capital on:
• Interestpaidonborrowings 49.5 50.6
• Dividendstoshareholders 475.8 444.2
2,436.6 2,252.0
Balance retained in business
depreciation and amortisation 137.1 135.0
retained profits 113.8 93.7
non-controlling interests 8.4 13.1
259.3 241.8
non-production costs 22.3 0.7
total distribution 2,718.2 2,494.5
economic value added The group has generated yet another year of positive eVa. group’s FY2012 eVa attributable to ordinary shareholders of $437.9m was 8% or $32.9m higher than that achieved in FY2011. The increased eVa was driven mainly by improved earnings and lower capital charge resulting from a lower Weighted average cost of capital (Wacc), but these were partially offset by higher capital charge due to higher eVa capital.
eva Statement2012$m
2011$m
net profit before tax 682.5 620.6
adjust for:
Share of results of associates and jointly controlled entities 40.6 34.6
interest expense 57.0 57.4
others 2.6 1.2
adjusted profit before interest and tax 782.7 713.8
cash operating taxes (note 1) (152.4) (101.7)
net operating profit after taxation - (a) 630.3 612.1
average capital employed (note 2) 3,620.5 3,426.3
Wacc (note 3) (%) 5.3 5.9
capital charge - (b) (191.9) (202.2)
eva - [(a) - (b)] 438.4 409.9
non-controlling share of eVa (0.5) (4.9)
eva attributable to ordinary shareholders 437.9 405.0
Unusual items (Ui) (gains)/losses (note 4) (8.1) 2.9
eva attributable to ordinary shareholders (exclude ui) 429.8 407.9
note 1: The reported current tax is adjusted for the statutory tax impact of interest expense.note 2: Monthly average equity plus interest bearing liabilities, timing provision and present value of operating leases.
Major capital components:
$m
Borrowings 1,499.8
equity 1,819.9
others 300.8
3,620.5
note 3: The Wacc is calculated in accordance to ST engineering group eVa policy as follows: i) cost of equity using capital asset pricing Model with market risk premium at 5.0% (2011 @ 5.0%); ii) risk-free rate of 1.66% (2011 @ 2.68%) based on yield-to-maturity of Singapore government 10 years Bonds; iii) Ungeared beta at 0.71 (2011 @ 0.71) based on ST engineering risk categorisation; and iv) cost of debt at 3.84% (2011 @ 4.21%) using actual cost of debt of the borrowings in US, europe, china and Singapore.
note 4: Ui refer to divestment of investment properties, subsidiaries, associates and jointly controlled entities, long term investments and disposal of major property, plant and equipment.
46 47Singapore TechnologieS engineering lTd Annual Report 2012Making an impact

financial review
5-Year Key Financial Data 2012 2011 2010 2009 2008
Income Statement ($m)Revenue 6,380 5,991 5,985 5,548 5,345
Profit
EBITDA 795.0 742.7 718.7 649.2 667.9
EBIT 658.0 607.7 586.7 486.4 509.1
PBT 723.1 655.2 627.5 546.6 540.7
Net Profit 576.2 527.5 491.0 443.9 473.6
Balance Sheet ($m)Property, plant and equipment, and investment property
1,213 1,358 1,303 1,168 1,037
Intangibles and other assets 1,049 1,027 1,059 1,096 1,122
Inventories and work-in-progress 1,922 1,594 1,471 1,364 1,286
Trade receivables, deposits and prepayment 1,777 1,659 1,645 1,508 1,498
Bank balances and other liquid funds, short-term investments and bonds
2,070 1,769 1,790 1,749 1,050
Current liabilities 3,890 3,479 3,551 3,082 3,322
Non-current liabilities 2,128 2,052 1,990 2,127 994
Share capital 782 723 678 612 586
Capital and other reserves (20) 10 (7) 94 100
Retained earnings 1,133 1,033 951 863 894
Non-controlling interests 118 110 105 108 97
Financial IndicatorsEarnings per share (cents) 18.76 17.28 16.21 14.78 15.82
Net assets value per share (cents) 61.51 57.79 53.38 52.09 52.71
Return on sales (%) 9.2 9.0 8.4 8.2 9.1
Return on equity (%) 30.4 29.9 30.3 28.3 30.0
Return on total assets (%) 7.3 7.3 6.9 6.6 8.2
DividendGross dividend per share (cents) 16.80 15.50 14.55 13.28 15.80
Dividend yield (%) 5.16 5.07 4.36 4.72 5.16
Dividend cover 1.11 1.11 1.11 1.11 1.00
Productivity DataAverage staff strength (numbers) 22,560 22,193 21,508 20,079 18,703
Revenue per employee ($) 282,795 269,944 278,244 276,298 285,757
Net profit per employee ($) 25,540 23,771 22,829 22,109 25,324
Employment costs ($m) 1,760.2 1,633.2 1,568.1 1,462.5 1,422.8
Employment costs per $ of revenue ($) 0.28 0.27 0.26 0.26 0.27
Economic Value Added ($m) 437.9 405.0 369.7 304.8 357.9
Economic Value Added spread (%) 12.1 12.0 10.5 9.4 11.8
Economic Value Added per employee ($) 19,411 18,250 17,187 15,181 19,138
Value added ($m) 2,718.2 2,494.5 2,395.6 2,266.6 2,203.7
Value added per employee ($) 120,489 112,398 111,382 112,882 117,824
Value added per $ of employment costs ($) 1.54 1.53 1.53 1.55 1.55
Value added per $ of gross property, plant and equipment ($)
1.06 0.90 0.91 0.91 0.97
Value added per $ of revenue ($) 0.43 0.42 0.40 0.41 0.41
48 Making an impact
PERFORMANCE OF THE GROUP
Marine Others
Aerospace Electronics Land Systems
PROFIT BEFORE TAX BY SECTOR ($m)
800
700
600
500
400
300
200
100
0
2008 2009 2010 2011 2012
REVENUE BY SECTOR ($m)
Marine Others
Aerospace Electronics Land Systems
7000
6000
5000
4000
3000
2000
1000
2008 2009 2010 2011 20120
NET PROFIT BY SECTOR ($m)
Marine Others
Aerospace Electronics Land Systems
700
600
500
400
300
200
100
2008 2009 2010 2011 20120
10-YEAR ORDER BOOK ($b)
2002 2012
14
12
10
8
6
4
2
0
$12.1b
49SINGAPORE TECHNOLOGIES ENGINEERING LTD Annual Report 2012

Operating Review & Outlook
In the year, the Group gained growth momentum, expanded geographically, and established new track records. As a result, we closed the year with a healthy order book of $12.1b.
The biggest contract announced was the €534.8m (about $880m) contract secured by ST Marine, to design and build four patrol vessels and the provision of associated logistic support for the Royal Navy of Oman. This is also the largest naval export shipbuilding contract we have ever won. On the commercial front, the sector focused on offshore support, and continued
In FY2012, ST Engineering continued to deliver steady growth and maintain a healthy order book, while building new growth areas.
to build a track record in this segment with newbuild contract wins, including two Anchor Handling Tugs Supply Vessels for Swire Pacific Offshore Operations (Pte) Ltd. and two Offshore Supply Vessels for Hornbeck Offshore Services, LLC.
Other sectors saw a stream of contract wins as well. In Aerospace, we secured new contracts for our Aircraft Maintenance & Modification and Component and Engine Total Support businesses, totalling about $2b for the year. These include a passenger-to-freighter conversion contract for 15 units of 757-200, a 10-year component repair management MBHTM support for 75 of AirAsia’s A320 aircraft, and a contract to provide the Royal Air Force of Oman with a full scale maintenance and modernisation solution for three of its C130 Hercules aircraft.
The Electronics sector continued to extend our reach in the rail electronics market, winning contracts for various rail solutions, such as command and control systems and fare collection systems, in China, Malaysia, Singapore, Thailand and the US. Other than rail solutions, other contracts announced included a $98m contract from the Land Transport Authority to enhance the Expressway Monitoring and Advisory System along eight expressways in Singapore, and new contracts for its AgilFence Perimeter Intrusion Detection System which has since been implemented at eight local sites. In the satellite communications business, we continue to enjoy a global market leadership position and a constant stream of contract wins.
For Land Systems, we announced a US$46m (S$58m) contract to supply the 120mm Super Rapid Advanced Mortar Systems to an overseas customer.
Building new pipelines of growth The Group continued to invest in the future, building new capacity, enhancing capabilities as well as introducing innovative solutions to the market.
In Aerospace, the building of a new three-bay hangar in Guangzhou, China is progressing as planned and expected to be ready by late 2013. We are also adding a two-bay hangar at our Changi facility. The new purpose-built General Aviation aircraft hangar in Seletar Aerospace Park was completed in December.
During the year, ST Aerospace entered into an agreement with Airbus, EADS and EADS EFW, taking a 35% stake in EADS EFW and developing a new passenger-to-freighter conversion programme for the A330. With this partnership, ST Aerospace will add EADS EFW’s facility in Dresden, Germany to its global airframe MRO network. Separately, the Aerospace sector completed the acquisition of a 50.1% stake in EcoServices, LLC. This joint venture with Pratt & Whitney offers the award winning EcoPower® engine wash to aircraft operators to improve aircraft fuel efficiency.
We continued to pursue overseas defence opportunities through new tie-ups. Earlier in the year, ST Kinetics partnered US-based Science Applications International Corporation to offer our TERREX 8x8 Armoured Personnel Carrier for the US Marine Corps’ Marine Personnel Carrier programme. The vehicle was one of four bids selected for the demonstration phase. Meanwhile, VT Halter Marine has partnered French naval shipbuilder DCNS to submit a proposal for the design and
construction of the US Coast Guard Offshore Patrol Cutter.
Group-wide, new solutions designed and developed to address customer needs and trends were introduced to the market. These include, among others, our newest unmanned aerial vehicle, the Skyblade 360; VIP aircraft completions; airline interior modification and refurbishment; our improved all terrain tracked vehicle, the BRONCO New-Gen; the unmanned ground vehicle, the Robotic Mapping Vehicle; and a highly mobile communications systems, the Agilis Manpack VSAT.
outlooK for 2013Global growth is expected to strengthen gradually in 2013, though recovery will be slow. Downside risks to the global economy remain, though they have subsided somewhat. Such risks include a stalling of progress on the Euro crisis, fiscal issues in the US worsening, the possibility of a sharp slowing of investment in China, and a disruption in global oil supplies. (Sources: IMF and World Bank).
Against this backdrop, ST Engineering remains cautious in our 2013 outlook. While we are not immune to external factors, we believe that our well-diversified business portfolio, customer base and geographic presence, coupled with a strong order book and balance sheet, stand us in good stead to weather uncertainties. The Group is well-positioned to build on our strengths in 2013, and we will continue to invest in our business to strengthen our market positions, build new track records, and grow our order book.
Our Aerospace sector will continue to focus on airframe, component and engine maintenance, repair and overhaul work. For passenger-to-
freighter conversions, we will continue to deliver on our Boeing 757 and 767 orders, and start on the development of the A330P2F. At the same time, we will further develop and grow our VIP completions and engine wash businesses.
Our Electronics sector will deliver various projects in 2013, including several rail electronic projects in Singapore and the region, Advanced Combat Man System, communication systems projects, the supply of telematics systems, satellite communications products and electro-optics equipment, milestone completions of a simulator project, and managed services sales.
Our Land Systems sector will deliver military and commercial vehicles, munitions, weapons, test services and agency sales. At the same time, we will continue to pursue key defence programmes as well as deepen existing markets of our specialty vehicles.
In our Marine sector, the newbuild contracts we secured across 2011 and 2012 will keep our yards busy for the next few years. We will also continue to pursue repair and upgrade works, including in the US when the shiprepair business becomes operational in the later part of 2013.
Barring unforeseen circumstances, the Group expects to achieve higher revenue and PBT for FY2013 over FY2012.
A displAy of dynAmism At the singApore Airshow 2012
In February at the Singapore Airshow 2012, we showcased the breadth and depth of ST Engineering’s innovative solutions and capabilities for commercial and defence markets. In focus were the Group’s integrated solutions and collective expertise across all sectors in enabling customers’ operational readiness and immediate capability enhancement, including our operationalised and tested solutions to support the modernisation of armed forces.
New ideas and products included indigenous unmanned air systems such as Next Generation Control System and Skyblade 360; BRONCO New-Gen, the newest iteration of our battle-proven BRONCO All
Terrain Tracked Carrier; TERREX Reconnaissance, Surveillance & Target Acquisition variant; 40mm Day & Night Marker Round; Robotic Mapping Vehicle; Robotic Articulated-Wheel Vehicle and AgilFence Perimeter Intrusion Detection System, our locally designed and developed solution for fence security.
Demonstrating our defence solutions to a packed hall
Our range of unmanned aerial vehicles on display
50 51SINGAPORE TECHNOLOGIES ENGINEERING LTD Annual Report 2012Making an impact

The Aerospace sector crossed the $2b revenue mark for the first time, against a challenging operating environment marked by volatile US dollar and Euro. The increase in sales was fuelled by a healthy order book through new contracts secured in all business segments. In 2012, a steady stream of orders worth more than $2b was announced. With continued focus on productivity and costs management, PBT for the sector improved 9%.
As part of our efforts to address evolving market needs, we moved up the value chain and broadened our range of integrated support. To maintain our competitive edge in the global market, we introduced new service offerings including VIP
completions, freighter conversion for A330 aircraft, rotable asset leasing and green engine washing. We also continued to expand our global presence, adding new nodes in the Americas and Europe through joint ventures and new set-ups.
AircrAft mAintenAnce & modificAtion (Amm) The AMM division continued to grow both in capacity and capability during the year. In November, ST Aerospace broke ground to add a two narrow-body bay hangar in Changi, Singapore, in response to rising demand for narrow-body aircraft line and base maintenance services. In December, we completed the construction of our newest purpose-built General Aviation aircraft hangar at the Seletar Aerospace Park in Singapore, putting us in a strong position to extend our role as a global market leader in aircraft maintenance, repair and overhaul (MRO). Apart from the new hangar, a VIP lounge will be added for our air charter customers, as well as facilities for flying and technical training.
In Guangzhou, China, hangar construction for our joint venture company ST Aerospace (Guangzhou) Aviation Services Company Limited is progressing well. With operations expected to start by late 2013, the hangar will be able to accommodate one wide-body and two narrow-body aircraft simultaneously.
Identifying VIP completions as a new growth area for the Aerospace sector, a new brand – AERIA Luxury Interiors – was introduced to drive our foray into the niche VIP aircraft completions and refurbishments market segment. Located in San Antonio, US with ready access to highly skilled craftsmen and the pool of engineering talent in the region, ST Aerospace is now able to extend a suite of aircraft engineering design and maintenance services to customers.
This complements the earlier acquisition of affiliate company DRB Aviation Consultants, Inc in 2011, a holder of the Federal Aviation Administration (FAA) awarded Organisation Designation Authorisation (ODA). The ODA enables
Moving up the engineering value chain, we strengthened our support to customers through a wider global network and integrated support for airframes, components and engines.
ST Aerospace to accomplish and certify aircraft modifications to the FAA’s requirements in a more efficient and effective manner, ensuring that we deliver reliable turnaround times to our customers. Having completed cabin reconfiguration and refurbishment for over 150 aircraft to date, we will be able to leverage our established programme management and aircraft engineering expertise, to offer a wider range of cabin interior modification capabilities for both airline and VIP aircraft operators.
In the US, VT Aerospace completed the acquisition of Volant Aerospace, LLC, a company with capabilities in commercial aircraft interior products. This acquisition will strengthen the sector’s ability to support our airline customers better. During the year, we secured our first contract for the VIP Boeing Business Jet maintenance check, for a Middle Eastern aircraft owner. Involving A and B level checks and replacement of various IFE system components, the aircraft was redelivered within a month of induction and was well received by the customer.
A second contract was subsequently secured for the interior modification of a Boeing 767-200ER VIP aircraft. On top of an all-inclusive modification which covers design, engineering, installation and project management, heavy maintenance work was concurrently performed to minimise aircraft down time. Additionally, we were awarded a contract to refurbish the cabin interiors of 15 Boeing 747-400 aircraft.
Of the 87 Boeing 757 freighters contracted by FedEx Express, ST Aerospace had delivered over 60 converted aircraft as at end of 2012.Further cementing our engineering and development strengths in aircraft conversions, we were awarded two Supplemental Type Certificates (STC) by the European Aviation Safety Agency (EASA) and the US FAA respectively, for the Boeing 757-200 passenger-to-passenger/cargo (combi) (PTC) conversion programme. With the FAA certification, ST Aerospace becomes the holder of the first and only STC for a PTC, with a main cargo compartment meeting the Class C requirements.
Building on our established track record in aircraft conversions, we partnered Airbus, EADS and EADS Elbe Flugzeugwerke GmbH (EADS EFW) to develop a new freighter conversion programme for the Airbus A330 aircraft. Besides adding a new freighter conversion capability, ST Aerospace has taken a 35% stake in EADS EFW, with its Dresden facility serving as our European MRO centre. This fills the gap in our global airframe MRO footprint.
ST Aerospace partners Airbus, EADS and EADS EFW to develop a new freighter conversion programme for the Airbus A330
Aerospace
wORld's lARgestcommercial airframe MRO service provider,with an annual capacity of close to 9 million manhours
FIRstin Singapore to develop the Multi-crew Pilot Licence programme
tOtAl AvIAtIOn suppORt
Owns Supplemental
Type Certificates from FAA and
EASA for Boeing 757 combi
aircraft
covering
AIRFRAMes, cOMpOnents And engInes
for both military and commercial aircraft
Revenue of $2,019m for FY2012 was 5% or $99m higher than that of FY2011. The higher revenue was contributed mainly by AMM in both its Singapore and US operations.
Despite a challenging aviation market in FY2012, the sector achieved PBT of $303.8m, a growth of 9% or $25.6m as compared to FY2011.
The higher PBT was due mainly to higher gross profit resulting from higher revenue and favourable sales mix, as well as higher other income due mainly to the one-off gain on disposal of a property, but these were partially offset by higher operating expenses, higher finance costs, net and lower contribution from associates.
revenue ($m)
2012
2011 1,920
2,019
15of Singapore’s aerospace industry output
% 2012
2011
profit Before tax ($m)
303.8
278.2
1Q2012 2Q2012 3Q2012 4Q2012
1Q2011 2Q2011 3Q2011 4Q2011
Legend:
52 53SINGAPORE TECHNOLOGIES ENGINEERING LTD Annual Report 2012Making an impact

Aerospace
ST Aerospace continued to work with the Republic of Singapore Air Force (RSAF) on its Public-Private Partnership arrangement. In November, we provided the first two of 12 M346 advanced trainers to the RSAF, as part of a 20-year programme which is worth about $50m in the first year of operations.
successful completion of the first Multi-crew Pilot Licence (MPL) for Tiger Airways, the airline awarded us a five-year pilot training contract, to train more than 100 pilots. We also partnered Hainan Aviation Academy to train 50 cadet pilots for our Chinese partner.
Catering to the growing demand for commercial pilots, our pilot training academy signed a partnership with Lockheed Martin’s Sim-Industries B.V. for the latter to provide an Airbus A320 full flight simulator (FFS) for ST Aerospace’s MPL programme. The FFS will be housed in our simulator training centre in Singapore, which is designed to house six FFSs and one full size fixed base simulator, as well as state-of-the-art computer-based training rooms for both Air Transport Pilot Licence and entry level ground training.
Affirming the sector’s confidence in the pilot training business, we continue to upgrade our flight training capacity and capabilities to meet rising demand. To this end, ST Aerospace’s wholly owned subsidiary, ST Aerospace Engineering Pte Ltd, injected capital into its wholly owned subsidiary ST Aerospace Academy Pte Ltd. Part of the funds will be used to equip a new Flight Operations Centre at Ballarat Airport, Australia.
component totAl support (cts) Our component Maintenance-By-the-Hour (MBHTM) support programmes continued to be the lynchpin of the sector’s CTS business, supporting over 800 aircraft to date.
During the year, we received a 10-year component repair management MBHTM contract to support 75 of AirAsia’s Airbus A320, above and beyond our existing support for 100 of its A320. On top of this, we secured a 10-
year component MBHTM contract for TransAsia Airways’ two new Airbus A330. In Europe, our Copenhagen-based facility, ST Aerospace Solutions, also secured a 10-year contract to provide aircraft rotables MBHTM support for a fleet of Boeing 757 for a US aircraft operator.
In the area of landing gear repair and overhaul, our Madrid facility successfully completed and delivered 38 landing gears in 2012. Expecting landing gear demand to pick up in the near term, ST Aerospace formed an alliance with Iberia Maintenance to jointly market and provide global landing gear maintenance services for various Airbus and Boeing platforms.
Our CTS business was further augmented when Gulfstream Aerospace appointed us as an authorised supplier of component repair and overhaul services. Additionally, ST Aerospace concluded an agreement with Woodward for the maintenance support of Woodward’s components to Bell helicopter operators worldwide.
Identifying rotable asset leasing and management as a complementary extension to our CTS offerings, a new rotable asset management business was established. This new business will also support our global MBHTM programmes.
In view of persisting weakness in the European market for domestic travel and cargo, ST Aerospace embarked on a restructuring programme in September to manage the cost structure and work processes of the Scandinavian operations of our wholly owned subsidiary, ST Aerospace Solutions (Europe) A/S. The exercise is anticipated to conclude by the third quarter of 2013.
As part of an ongoing business review to better support the regional growth of our partner BAE Systems plc through our existing network, ST Aerospace commenced Members’ Voluntary Winding Up of our 51%-owned subsidiary, Singapore British Engineering Pte Ltd. Existing contracts were novated to ST Aerospace’s wholly owned subsidiary, ST Aerospace Supplies Pte Ltd, to ensure uninterrupted support to our customers while we explore further collaboration with BAE Systems plc.
engine totAl support (ets)Recognising that engine MRO will continue to lead in the global MRO scene, we enhanced our ETS capability portfolio with an expansive range of aftermarket services to stay ahead of the competition.
During the year, VT Aerospace completed the investment of a 50.1% stake in EcoServices, LLC, becoming a partner to Pratt & Whitney in the joint venture. Tapping into the engine aftermarket for advanced green technology services, the award winning EcoPower® engine wash reduces fuel burn and CO2 emissions, helping aircraft operators reduce their
environmental impact and improve the operational efficiency of their fleets.
In the second year of its operations, our engine leasing business secured a contract from Lion Air for the lease of three CFM56-7B engines over 10 years.
We also bolstered our footprint in the Korean engine MRO market with a contract to support low fare airline Eastar Jet’s CFM56-7B engines over 10 years. In China, our Xiamen engine MRO business added new customers from the Asia Pacific region. On top of this, the facility received certification from the EASA, adding to its existing certifications from the US FAA, CAAC and Korea MLTM. Our Singapore engine facility obtained certification from the Japanese Civil Aviation Bureau for CFM56 engines.
Progressing up the value chain, ST Aerospace started focusing on engine parts and accessories repairs, on-wing support and engine parts trading in 2012.
inVesting for growth The Aerospace sector continued to invest in existing businesses and establish new focus areas to better support our customers. Acquisitions and capital injections include:
• subscribedtonewsharesinEADS EFW, representing 35% of the enlarged share capital of EADS EFW
• investeda50.1%stakein EcoServices, LLC
• injectedUS$1.44m(approximately$1.8m) into ST Aerospace Academy Pte Ltd
• injectedatotalofUS$2.36m(approximately $2.88m) into engine leasing joint venture Total Engine Asset Management Pte Ltd
• setupwhollyownedsubsidiary, ST Aerospace Rotables Pte Ltd with a total capital of US$75m (approximately $91.68m)
• acquired100%equityinterestinVolant Aerospace, LLC
industry reView & outlooK The global aviation industry operated in a weaker economic environment in 2012, as it coped with oil price fluctuations, the deepening Eurozone crisis and languishing freight growth. Airlines globally delivered profits of US$6.7b, with a small net profit margin of 1%. The marginal improvement in financial performance over the previous year was a result of airlines’ flexibility in adjusting during this tough period, by redefining their business models, exercising discipline in managing capacity, better route planning, shaving costs and improving efficiency.
Airlines in the Middle East and Asia Pacific, notably in China, experienced rising passenger demand while US carriers remained profitable with raised fares and consolidations. However, the EU environment remains delicate as the sovereign debt crisis continues to plague the Eurozone. In 2012 alone, Europe lost many airlines, with the remaining carriers continuing to suffer losses.
Global commercial MRO revenues continue to be under pressure as aircraft operators shift their financial pressures to MRO providers. The industry faces overcapacity, and some MROs have ceased operations. Nevertheless, aviation MRO is expected to grow by about 40% over the next 20 years.
At ST Aerospace, we are confident that our continued focus on efficiency and innovation while maintaining a diversified portfolio of services positions us well to partake in the industry’s growth.
ST Aerospace and Alenia Aermacchi provided the first two M346 aircraft to the RSAF
Additionally, we secured a contract to provide the Royal Air Force of Oman, with a full-scale maintenance and modernisation solution for three of its C130 Hercules aircraft.
On the unmanned aerial vehicle (UAV) front, we showcased our latest mini-UAV system at the Singapore Airshow in February. A joint development with the DSO National Laboratories, the Skyblade 360 boasts increased mission versatility as a result of longer flight endurance.
On pilot training business development, we obtained Joint Aviation Authorities (JAA) certification, becoming one of the first few flight training organisations in Asia Pacific with this qualification. Already licensed by the Civil Aviation Authority of Singapore, Australia’s Civil Aviation Safety Authority and the Civil Aviation Administration of China (CAAC) for various pilot training programmes, ST Aerospace is now able to enrol students from countries that recognise the JAA licence.
We continued to seal pilot training contracts in 2012. Following the
The award winning EcoPower® engine wash helps to improve the operational efficiency of aircraft operators’ fleets
54 55SINGAPORE TECHNOLOGIES ENGINEERING LTD Annual Report 2012Making an impact

With the global economy remaining sluggish, we face increasing competition in the Asian markets as European and American companies looked to Asia for growth. Against this backdrop, we continue to take cognizance of new requirements brought on by urbanisation and other environmental factors. We have embarked on in-depth research and development (R&D) for Smart Utilities solutions and technologies with the support of Singapore’s Economic Development Board. We aim to help cities plan for the future and address urbanisation, sustainability and environmental challenges as they
strive to be efficient, clean and safe. We developed and enhanced our core expertise in intelligent road and rail transportation, homeland and cyber security, smart utilities and satcom solutions.
lArge-scAle systems group (lsg) While building up our track record in rail electronics in Singapore and overseas, we continued to strengthen our capabilities and enhance our product offerings. One notable product enhancement was the incorporation of business analytics and intelligence capabilities in rail transport command, control and communication systems for improved rail management.
2012 saw our maiden entry into new rail electronics markets. In the US, we implemented our SmarTrip Card Dispensers for the Washington Metro. The contract was awarded by the Washington Metropolitan Transit Authority to our partner, General Electric Transportation. We also made inroads into Malaysia
and were awarded a contract by MRT Corporation Sdn Bhd to provide a Facility Supervisory Control & Data Acquisition System for the 51km Sungai Buloh-Kajang Line with our consortium partner, AFS Engineering (M) Sdn Bhd.
In Asia, China’s fast-paced urbanisation also presented opportunities for us, especially in the city of Wuxi. The Wuxi Metro Lines 1 and 2 will implement our $19m Integrated Supervisory Control System which includes Environmental Control and Building Automation Systems. These systems will be delivered by the end of 2014.
In Singapore, we will design, supply, test and commission the onboard equipment for the additional 16 trains for the Circle Line. Valued at $27m, the project is expected to be completed by end 2015. In addition, the Land Transport Authority (LTA) awarded us a $31.6m contract for delivery of a communications system for the 7.5km Tuas West Extension by 2016. We are also providing optical fiber networks, communications and supervisory
The Electronics sector continued to expand our business in the key areas of Intelligent Transportation Systems (ITS), satellite communications (satcom) and eco-enabling Information Communications Technologies (ICT).
control and Automatic Fare Collection systems for the Downtown, East-West, North-East, North-South and Circle Lines in Singapore’s MRT network.
Security management is a key concern for many organisations, and our solutions have been implemented in correctional and educational institutions and transportation depots, as well as at the Marina Bay Financial Centre in Singapore. Our solutions also helped manage public access at major events including the 2012 F1 SingTel Singapore Grand Prix. Some 24
public pools managed by the Singapore Sports Council also benefitted from our Ticketing and Admission Control Access System. The National Environment Agency (NEA) has implemented our incident management system and we will also design and develop an Integrated Environment System for the NEA.
communicAtion & sensor systems group (csg) With rapid urbanisation in Asia, demand is increasing for Smart Utilities solutions for managing water resources and power.
ST Electronics’ rail electronics solutions offer safe and efficient transportation to global train operators
electronics
By deepening our competencies and domain knowledge in Smart Utilities, we are able to offer integrated solutions for utilities service providers/retailers, city operators, building owners and governments around the world.
We were awarded a $29m contract by Arad Technologies Ltd, a world’s leading supplier of smart water meters, to supply Automatic Meter Reading (AMR) radio transceivers to be deployed with Arad’s own AMR solutions in China, Europe, India and the US markets.
Building on our domain expertise in eco-enabling traffic management solutions, ST Electronics secured two contracts totalling $132.5m from the LTA to enhance the Expressway Monitoring and Advisory System (EMAS) equipment along eight expressways and four major arterial road corridors in Singapore. These systems are expected to be commissioned by 2017 and 2014 respectively.
Our cetrac® Fleet Management System manages the
largesttaxi fleet in Asia
iDirect has
62%of global satellite hub market share
Singapore’s leading Information communications technologies company
revenue ($m)
2012
2011
1,578
1,481
FY2012 revenue of $1,578m, 7% or $97m higher than that of FY2011. The increase in revenue was due mainly to milestone completions of rail electronics projects by LSG and higher sales of satcom products and milestone completions of communication projects by CSG.
PBT for FY2012 was $152.3m, 11% or $15.4m higher than that of FY2011, with the increase coming from CSG and SSG.
Increased PBT from CSG was largely due to higher revenue and better contribution from satcom product sales, partially offset by higher operating expenses.
SSG’s higher PBT was mainly from favourable sales mix, partially offset by higher operating expenses as a result of the impairment of intangible assets.
Despite higher revenue, LSG’s FY2012 PBT was lower mainly due to less favourable sales mix and a write-back of allowance for inventory obsolescence in FY2011.
Asia’s leading providerof rail electronics solutions
1Q2012 2Q2012 3Q2012 4Q2012
1Q2011 2Q2011 3Q2011 4Q2011
Legend:
2012
2011
profit Before tax ($m)
152.3
136.9
56 57SINGAPORE TECHNOLOGIES ENGINEERING LTD Annual Report 2012Making an impact

In the area of satcom and sensors, we launched a number of new solutions including some of the world’s smallest communication products such as the Ku and C-Band Block Up Converters, and the new and highly mobile Agilis Manpack Very Small Aperture Terminal (VSAT).
We successfully implemented satcom solutions such as network infrastructure and support services, satellite earth stations, hubs and routers. These included turnkey VSAT antenna systems in Al Khamiah and Sharjah of the United Arab Emirates.
Our AgilFence Perimeter Intrusion Detection System, launched in 2011 through our first customer, Changi Airport Group, has been implemented in eight new sites for other local customers.
VT iDirect (iDirect), our US satcom company, continued to lead in its field. Its iDX 3.0 software was named the Satellite Spotlight 2011 Product of the Year in April. The award recognises companies that demonstrate vision and leadership in the industry, and contribute to the advancement of
electronics
technologies. iDirect’s new iDX 3.1 upgrade enables organisations to build and support large-scale narrowband networks with their existing iDirect Intelligent Platform.
Bentley Walker Limited, one of the largest network operators in Europe, selected iDirect’s platform to strengthen its Ka-band service offerings over the Middle East and Asia. Other partners and customers who chose iDirect platforms to position themselves for growth or the development of new businesses included THAICOM and Yahsat.
During the year, iDirect Government Technologies released its newest satellite router that meets strict airborne communications requirements for operation on military aircraft. Delivering broadband capabilities for voice, video and data applications, the routers provide support for intelligence, surveillance and reconnaissance for customs and border protection operations and emergency response missions.
Our satellite system services joint venture, set up in 2011, has begun conducting engineering and market studies for the next generation of earth observation satellites products and solutions. We are also leveraging the space eco-systems, and will work with government agencies and established players in the industry to build a new industry for Singapore and a new market for ST Electronics.
softwAre systems group (ssg)Revenue stream grew through our managed services, mission critical and modelling and simulation solutions.
ST Electronics continued to invest in the development of security, e-Government and e-Enterprise
Expressway Monitoring & Advisory System provides critical information for motorists
solutions, launching several new solutions during the year. Our Future C2 (command and control) solution for homeland security and complex airport operations enables users to make sense of data to improve situational awareness and to address urbanisation, sustainability and environmental challenges. Meanwhile, our Safe City solutions provide an ideal infrastructure for rapid and sustainable urbanisation.
In the US, VT MÄK (MÄK) launched new versions of its entire line of commercial off-the-shelf products that comply with the latest distributed simulation standard, HLA Evolved.
Aviation authorities in Singapore, India, Tanzania and Vietnam have implemented our Air Traffic Control (ATC) Tower Simulators. In 2012, we were awarded a contract to implement an Integrated ATC simulator in Ecuador. Featuring tower, radar and procedural modules, it is one of the largest in South America.
Our solutions for airports gained entry into Myanmar through our communications systems implemented for the control tower in Nay Pyi Taw International Airport. In Singapore, we were awarded a contract to design and implement an Airport Operations Centre (AOC) System for Changi Airport. The AOC System will be used to enhance the operational efficiency and propel Changi Airport to the next level of excellence.
ST Electronics operates the Helicopter Simulator Centre on behalf of the Republic of Singapore Air Force. We have also been appointed by ATR Eastern Support, the regional subsidiary of Avions de Transport Régional, to provide housing and maintenance services for their flight
Students using MyV, a cloud-based virtual learning application
simulation training equipment in Singapore. We were awarded contracts to deliver the LEARNet programme for the Singapore Armed Forces. We will design, develop and implement the e-Learning content and infrastructure, and provide maintenance and support services for the programme.
In the area of cloud solutions and services, our cloud-based educational series applications, MyV, MyE and MyM, enable students and professionals to embrace learning anywhere and anytime. MyM also supports learning on mobile computing devices such as iPads and Android tablets. NEC STEE Cloud Services Pte Ltd, a joint venture set up by ST Electronics in 2011, has set up its first data centre in Singapore offering cloud services.
Air Traffic Control Tower simulation in Vietnam
We were awarded a contract in June to implement the Housing Development Board of Singapore’s Radio Frequency Identification (RFID) season parking tags. Our e-services business unit also won contracts for administration support, educational development, training and resource management.
Acquisitions & diVestmentsIn 2012, we increased our stakes in MÄK and Telematics Wireless Ltd, which became wholly owned subsidiaries of the Electronics sector.
As part of our effort to streamline operations and optimise resources, we divested our interests in PM-B Project Management Business (Thailand) Limited and in Singapore, we struck off TranSys Pte Ltd.
In February, ST Electronics made an offer to acquire all the shares of Nera Telecommunications Ltd (NERA) by way of a scheme of arrangement under Section 210 of the Companies Act, Chapter 50. However, the shareholders of NERA voted against the scheme in July.
industry reView & outlooKRapid urbanisation presents numerous opportunities for ST Electronics. Emerging markets such as ASEAN, China and India will continue to invest in transportation infrastructure development and MRT projects. In Singapore, the government will focus on expanding MRT capacity, building extension lines, maintenance, upgrading and improving, in order to ensure smooth operations. Meanwhile, cities worldwide are contributing to the demand for ICT applications such as ITS, Advanced Meter Infrastructure and Smart Utilities, to help them manage transportation infrastructure, resources and utilities.
Internet Protocol-based satellite technology offers strong differentiation opportunities in areas such as geographic reach, performance, reliability and security for satcom business. Satcom has become more cost-effective as new technologies optimise the use of bandwidths. Users stand to benefit from higher-speed connectivity which will be capable of meeting the increased data acquisition requirements of critical infrastructure and the energy and utilities markets.
With better communications in place, self-directed and mobile learning pedagogies are becoming key drivers in education and training. New opportunities are opening up for us to target knowledge-based and smart cities with educational applications hosted on the cloud.
With our extensive expertise and an established track record, the Electronics sector is well positioned to capitalise on the above opportunities. We will continue to invest in R&D to strengthen our existing products and develop new offerings for the relevant markets.
58 59SINGAPORE TECHNOLOGIES ENGINEERING LTD Annual Report 2012Making an impact

Unveiled at the Singapore Airshow 2012, the BRONCO New-Gen combines the outstanding mobility of the BRONCO with the proven high survivability of the WARTHOG
In the defence arena, ST Kinetics introduced several new products, such as the BRONCO New-Gen and the 40mm Day & Night Marker Round, providing our global customers with greater options and value for money solutions. On the commercial front, we increased TRXBUILDTM’s penetration into more product segments in new growth markets, by expanding our range of TRXBUILDTM construction equipment and growing our dealership network to cover over 20 countries. At the same time, we increased collaboration with global players and educational institutions to position our defence and commercial businesses for sustainable growth.
smArt defence solutionsST Kinetics unveiled a slew of smart defence solutions at the Singapore Airshow 2012 that aimed to enable customers to derive greater value from
their investments. Leading the lineup was the BRONCO New-Gen, our newest iteration of the battle proven BRONCO All Terrain Tracked Carrier, designed with increased internal space and high protection to survive threats from improvised explosive devices and landmines.
We also demonstrated our robotic solutions including the Robotic Mapping Vehicle, a semi-autonomous surveillance and reconnaissance unmanned ground vehicle (UGV), and the Robotic Articulated-Wheel Vehicle, a highly mobile UGV that can be deployed in multiple roles from combat to logistics support. At the same show, we debuted our new 40mm Day &
Night Marker Round, which enhances soldiers’ training effectiveness by allowing clear recognition of the impact after a round is fired.
To enhance our offering of armoured wheeled vehicles, we announced a collaboration with South Africa’s Paramount Group at Eurosatory 2012, to jointly market, manufacture and support a family of protected wheeled vehicles.
As part of the proposal by US company Science Applications International Corporation for the US Marine Corps’ Marine Personnel Carrier programme, we fielded our TERREX 8x8 Armoured Personnel Carrier and successfully clinched one of four contracts for the demonstration phase of the programme.
During the year, ST Kinetics secured several defence contracts, including a US$46m (about $58m) overseas contract for our 120mm Super Rapid Advanced Mortar System.
productiVe speciAlty VehiclesWe continued to grow the international distribution and sales of our TRXBUILDTM, LEEBOY, HACKNEY and KIDRON specialty vehicles in 2012, penetrating new growth markets as well as growing our product lines for further differentiation in key product segments.
In 2012, we continued to market TRXBUILDTM products at international tradeshows in countries like Brazil (M&T Expo), China (Bauma), Indonesia (ConBuild Mining) and Thailand (Constech).
In China, ST Kinetics’ subsidiary, Jiangsu Huatong Kinetics (JHK), continued to pursue R&D and innovation with 30 patents awarded by the China Patent Office. JHK also introduced two new products, the TRXBUILDTM HM2100A Milling Machine and TRXBUILDTM SDM280 Coal-Sludge Mixing Equipment. Another Chinese subsidiary, Guizhou Jonyang Kinetics (GJK), successfully introduced new variants of the Commercial Articulated Vehicle to include lifting crane, fire
fighting, and oil drilling and exploitation variants. Both JHK and GJK were also recognised by the Chinese construction equipment industry for their innovative products: the TRXBUILDTM SPSE90 Multi-Functional Paver and TRXBUILDTM JY645-GD Electric Hydraulic Steel Grabbing Machine were both named Top 50 Construction Machinery Products of China.
Our Indian subsidiary, LeeBoy India, moved into and inaugurated a 110,000 sq ft production facility in Bangalore, capable of assembling and rolling out over 1,000 units of road construction equipment a year. Along with the new facility, LeeBoy India launched LeeBoy EDGE (School for Expertise Development, Growth & Excellence) as a training academy for its operator technicians and service engineers. LeeBoy India’s investment in product development continued with its introduction of several new products in 2012, like the LEEBOY MG985i 15-tonne Motor Grader, the LEEBOY CX523i 23-tonne Crawler Excavator, the LEEBOY BH799i and BH699i Backhoe Loaders, and the LEEBOY
CB100i and CB200i Concrete Batching Plants. With these new offerings, we now have a wide range of products
land systems
revenue ($m)
2012
2011
1,513
1,480
Revenue for FY2012 of $1,513m was comparable to that of FY2011.
The higher sales from project deliveries in the Munitions & Weapon business group was largely offset by lower sales in the Automotive (Auto) and Services, Trading & Others (S&T) business groups.
PBT for FY2012 increased by 6% or $6.4m to $114.5m as compared to FY2011. The higher PBT was due mainly to favourable product mix and a one-off gain on disposal of a property in Auto and share of higher profit of an associate in S&T. In the year, the sector also made more allowances for doubtful debts and inventory obsolescence.
TRXBUILDTM construction equipment is being sold to customers in
OveR 30 cOuntRIes
wORld leAdeR in 40mm solutions
HACKNEY is the
nuMBeR Onebrand in North America for beverage delivery vehicles
LeeBoy India’s new 110,000 sq ft production facility in Bangalore, is capable of assembling over 1,000 units of road construction equipment in a year
targeted at the road and general construction segments, which account for about 75% of sales in the Indian construction equipment market.
In the US, VT Hackney, opened its new 70,000 sq ft production facility in Kansas, ramping up production to more than 2,000 insulated and refrigerated KIDRON truck bodies annually, targeting new customers in the mid-West to Southern states. VT Hackney also launched its new line of KIDRON ColdBev coolers for the transportation of chilled beverages.
The Land Systems sector continued to pursue growth globally amid challenging conditions in 2012.
1Q2012 2Q2012 3Q2012 4Q2012
1Q2011 2Q2011 3Q2011 4Q2011
Legend:
2012
2011
114.5
108.1
profit Before tax ($m)
60 61SINGAPORE TECHNOLOGIES ENGINEERING LTD Annual Report 2012Making an impact

land systems
Another US company, VT LeeBoy, added the new LEEBOY 8616 Paver, LEEBOY PERFORMANCE PF1510 Paver and G700 Motor Grader to its line of road construction equipment. During the year, VT LeeBoy also expanded its sales beyond the US to Australia, Brazil, Canada, Mexico, Russia and other countries.
In response to growing worldwide demand for disaster relief and rescue solutions, ST Kinetics launched the ExtremV, an all-terrain tracked vehicle customised for disaster relief and rescue missions. Together with Morita Corporation of Japan, ST Kinetics secured an evaluation contract to supply a Rescue and Transporter variant of the ExtremV to Japan’s Fire and Disaster Management Agency.
transmission – incorporated with our patented Integrated Pump Motor technology and with an input rating of 800hp – to its family of infinitely variable transmissions for heavy duty tracked vehicle applications. This brings the HMX transmission family to three modern, high power and drive-by-wire products covering the horsepower range from 350hp to 800hp, meeting the market demand for both tracked vehicle upgrades and new applications.
In Singapore, ST Kinetics was awarded a contract by PSA Singapore Terminals (PSA) to develop two models of Automated Guided Vehicles (AGVs) for transporting containers within PSA’s container terminals in Singapore. The prototype AGVs will also incorporate ST Kinetics’ proprietary HyPower Hybrid Electric Drive System for greater energy efficiencies and higher productivity at the port.
totAl support serVicesIn the maintenance, repair and overhaul (MRO) arena, ST Kinetics’ subsidiary, SDDA, secured new orders for engine MRO services from major oil rig operators and supply vessels, and continued to provide integrated engineering solutions to the offshore, power and seaport industries in the Southeast Asian region. Addressing the growing market trend towards greener marine vessels, SDDA partnered EPD Asia Group to collaborate on more environmentally friendly and more fuel efficient electric-diesel drive systems.
Our testing, inspection and certification arm, Singapore Test Services (STS), continued to expand its range and depth of services for the aerospace and oil and gas industries. To help promote a greener Singapore and in response to new regulations on off-road engine emission standards, STS also set up a Mobile Emission Test Laboratory for the testing of off-road diesel engine emissions.
rAtionAlised Business units ST Kinetics continued to invest in companies that offer growth and strengthen our core capabilities.
We made SMART Systems a subsidiary to better integrate its operations. To optimise resources and rationalise our portfolio of businesses, we closed down STAR in Singapore and China, and divested our entire stake in Nusantara Technologies. As part of the continual review of capital structures to position our subsidiaries for further growth, we injected funds into GFM Maquinaria, Leeboy India, SecurEdge, STS and our Chinese subsidiary, JHK.
collABorAtiVe reseArch & deVelopmentExpanding on our outreach to partner research and educational institutions for collaborative R&D, ST Kinetics and Republic Polytechnic (RP) jointly launched the Advanced Composite Engineering Laboratory to research new composite materials that are ecologically friendlier. Such materials include novel composite fabrics for high performance applications in the aerospace, marine, automobile, textiles and sports industries. We also signed a Memorandum of Cooperation with RP to further collaborate in the area of compact high performance power solutions.
industry reView & outlooK The Land Systems sector enters 2013 with a stronger offering of solutions and an enlarged network of strategic partnerships. We will continue to invest in R&D and capability-building in growth areas for our defence and commercial businesses.
defenceSingapore is expected to sustain its defence budget over the next few years, with spending focused on maintaining an effective and technologically advanced deterrent
military force. Investments in new capabilities and advanced systems are likely to continue, as a means to optimise use of the country’s limited manpower resources. We anticipate that local defence orders will remain a major portion of ST Kinetics’ defence business in the years ahead, and look forward to more deliveries of our mobility, weapon and munitions solutions while we continue to innovate and provide advanced solutions to meet the evolving requirements of the Singapore Armed Forces.
In Western Europe and the US, the tightening of defence budgets are likely to reduce the global demand for new equipment and ammunition, but the impact on ST Kinetics will be limited as defence export sales constitute a small portion of our defence business. Meanwhile, as many countries retain their ageing inventory of equipment due to tight budgets, ST Kinetics is well positioned to upgrade such ageing equipment.
In the emerging markets of Africa, Asia, the Middle East and South America, where governments have committed to military modernisation programmes, we see opportunities to extend our mobility, weapon and munitions solutions.
specialty Vehicles As infrastructure projects are implemented to cater to growing populations and the expanding middle class in emerging markets, the global construction equipment sales volume is forecasted to expand at a compounded annual growth rate of 6% up to 2015, with demand led by China, North America and India. (Source: AlixPartners Global Construction Equipment Industry Outlook, July 2012)
In China, two of our subsidiaries, GJK and JHK, will be moving to new locations over the next two years, increasing their respective capacities to meet the expected growth. Over the next few years, we will be well positioned to capture the increased demand resulting from China’s stimulus spending, primarily on rail networks and other infrastructure projects.
In the US, VT LeeBoy, as the leading asphalt paver manufacturer in North America with an estimated market share of 40%, will explore business opportunities in the burgeoning Latin American market, where large infrastructure projects and increasing private investment are boosting the growth momentum of the construction sector.
With the improving US economy and replacement demand put on hold in recent years, we expect pent-up demand for specialised truck bodies and trailers over the next few years.
In India, we plan to expand our line-up of motor graders, excavators and backhoe loaders. These product categories constitute 75% of the total volume of the Indian construction equipment requirement and will put LeeBoy India in a good position to ride on growing demand in the years ahead.
In Africa, we aim to launch the TRXBUILDTM and LEEBOY brands of construction equipment progressively across the African continent over the next few years to meet the projected growth in demand.
servicesDemand for electrical power is expected to increase in markets like Indonesia and the Philippines, due to shortages resulting from lagging investments in power plants. This presents opportunities for the supply of diesel generator sets and power plant equipment. In Asia, continued activities in oil and gas exploration is likely to fuel demand in MRO and testing services for oil and gas equipment.
With the Singapore government’s continued push to improve public transportation, we anticipate greater demand for additional city buses. Coupled with the ongoing renewal of public bus fleets, this will be an area of growth for our MAN city bus distribution business. Similarly, we project a significant increase in the number of MAN trucks in Singapore. As the local government is expected to further depress the rate of growth of vehicles and the sustained high cost of car ownership will probably keep vehicles on the road longer, demand for our vehicle inspection, car evaluation and accident vehicle assessment services is likely to remain healthy in the coming years.
The LEEBOY PERFORMANCE G700 Motor Grader is one of several new products in VT LeeBoy’s road construction equipment lineup
ST Kinetics’ TERREX 8x8 Armoured Personnel Carrier was selected by the US Marine Corps for the demonstration phase of the Marine Personnel Carrier programme
The Rescue and Transporter variant of the ExtremV is capable of sending up to 12 rescuers into difficult-to-reach disaster hit areas to render timely assistance in search and rescue missions
green trAnsport solutionsST Kinetics’ wholly owned Chinese subsidiary, Kinetics Systems Shanghai, saw increased penetration of its solutions for pure electric buses in the year due to strong market demand and the Chinese government’s push for greener transportation systems. New products included a Smart Vehicle Controller and the HyPower 140kW Full Electric Integrated Permanent Magnet Drive System, developed for the State Grid Corporation of China and Shanghai Sunwin Bus.
Our Canadian subsidiary, Kinetics Drive Solutions, added the HMX3000
62 63SINGAPORE TECHNOLOGIES ENGINEERING LTD Annual Report 2012Making an impact

Given the slow global economy and the euro zone fiscal crisis, the worldwide shipbuilding industry struggled to absorb the impact of the oversupply stemming from the unprecedented order book of 2007 and before. Ship financing also tightened as financial institutions started to deleverage after the Lehman crisis in September 2008.
One positive for the shipbuilding industry is the continuing investment in deep-sea crude oil and natural gas exploration and production. With oil prices poised to remain high, demand is still growing for higher-end offshore support vessels (OSVs) to support the towage and positioning of rigs. However, competition in this sector has also intensified as many yards have
jumped on the bandwagon of building OSVs. In the area of shiprepair, demand for routine repair and maintenance will remain steady, although rates are likely to tighten due to increased competition.
Despite the challenging global shipbuilding environment, the Marine sector announced newbuilding OSV contracts amounting to $186m. Our proven expertise in repair and conversion of vessels, especially in sophisticated vessels requiring high
contracts for the RSN’s Challenger and Archer classes of submarines, which were designed, constructed, tropicalised and delivered by Kockums to the RSN. ST Marine provides up to depot-level maintenance for these boats locally.
In an ongoing effort to build our brand profile internationally, we participated in major exhibitions including Singapore Airshow, Euronaval, SMM, International Workboat Show, Offshore Patrol Vessels and MarineLog Ferries.
ship design And shipBuilding Swire Pacific Offshore Operations (Pte) Ltd (SPO), a wholly owned subsidiary of Swire Pacific Limited, awarded a contract to ST Marine to build and outfit two 18,000bhp Anchor Handling Tug Supply (AHTS) vessels. The two AHTS vessels, measuring 92m by 22m, were in addition to an earlier shipbuilding contract with SPO for four AHTS vessels, announced in June 2011. Construction has commenced,
with delivery scheduled for 2Q2014 and 3Q2014 respectively. The vessels will join SPO’s modern fleet supporting the latest generation of semi-submersible rigs operating in deep water and harsh environments.
We also secured our largest ever naval export shipbuilding contract, through a competitive international tender awarded by the Ministry of Defence of the Sultanate of Oman. Worth €534.8m (about $880m), the contract included the design and build of four patrol vessels (PVs) as well as the provision of associated logistics support for the Royal Navy of Oman (RNO). The 75-metre PVs will be built based on ST Marine’s proprietary Fearless Class of PVs. The first vessel is expected to be delivered in 2Q2015 and the final vessel in 3Q2016.
In the US, Hornbeck Offshore Services, LLC (Hornbeck) exercised options for two OSVs, to be built by our US Shipyard, VT Halter Marine. This adds
Marine
A display of ST Marine’s total naval solutions capabilities at Euronaval 2012 – a leading naval defence and maritime exhibition – in Le Bourget, Paris
level engineering, also enabled us to receive a steady flow of contracts from both naval and commercial customers.
In April, ST Marine in partnership with Kockums AB (Kockums) formed Fortis Marine Solutions Pte Ltd, with the primary objective of providing a higher level of in-country capability in the refitting and life cycle support services for the submarine fleet of the Republic of Singapore Navy (RSN). ST Marine and Kockums have a long standing cooperation managing several
on to an earlier contract announced on 18 November 2011, for VT Halter Marine to construct eight 97.2m long OSVs worth US$353m (about $441m). The two new vessels, valued at about US$89m (about $111m), are expected to be delivered in 4Q2014 and 1Q2015 respectively.
Based on VT Halter Marine’s Super 320 design which was also developed earlier for Hornbeck, these DP2 OSVs are designed to have approximately 20,800 bbl of liquid mud carrying capacity, 1,136sqm of deck area and a fire-fighting class notation. All the OSVs will be constructed in our US yards at Moss Point Marine and Halter Moss Point in Mississippi.
Revenue for FY2012 of $1,011m improved by 15% or $135m as compared to FY2011.
Shipbuilding and Engineering business groups drove the higher revenue.
Higher Shipbuilding revenue was due mainly to reversal of revenue in FY2011 following termination of the Roll-on/ Roll-off Passenger ferry contract, whilst higher engine repairs activities contributed to higher Engineering revenue. Lower ship conversion activities led to lower Shiprepair revenue.
PBT grew by 5% or $6.0m to $127.8m for FY2012 as compared to FY2011, underpinned by higher gross profit from Shipbuilding business group. The sector incurred higher administrative, selling and distribution expenses and finance costs, net in FY2012.
1,011
876
revenue ($m)
2012
2011
Strengthened foothold in OFFshORe suppORt vessel market
FIRst In sIngApORe to be awarded ISO 14064-1 by LRQA
pROven cOMpetency & expeRtIse in both naval & commercial vessels
The Marine sector announced contracts worth over $1.1b in both the naval and commercial markets, in a year when the maritime industry faced tough growth challenges.
1Q2012 2Q2012 3Q2012 4Q2012
1Q2011 2Q2011 3Q2011 4Q2011
Legend:
127.8
121.8
2012
2011
profit Before tax ($m)
64 65SINGAPORE TECHNOLOGIES ENGINEERING LTD Annual Report 2012Making an impact

Marine
The Fast Missile Craft is designed to perform coastal patrol, surveillance, interdiction, surface strike and naval battle group support
Upgrading and refurbishment of Energy Driller, a semi-submersible drilling rig
Fully commissioned Waste Transfer Station, Sungai Paku, Brunei
Major repairs and upgrades for life-extension of drilling rig for Boss 6
During the year, the sector successfully delivered the 141m long Landing Platform Dock to the Royal Thai Navy, the second of three 330,000 bbl Articulated Tug Barge (ATB) units to Crowley, a TAGM-25 Missile Instrumentation Ship to NAVSEA and a 4,000hp offshore tug to Bouchard Transportation. We also launched the first two of six AHTS vessels ordered by SPO, Pacific Diligence and Pacific Dolphin, as well as three of the four Fast Missile Craft (FMC) for the Egyptian Navy.
In the next few years, the Marine sector is on track to deliver the following vessels: an ATB, AHTS vessels, OSVs, a Roll-On/Roll-Off Car Truck Carrier, an Egyptian Navy FMC, RNO Fearless PVs.
be slow as ship owners seek to reduce maintenance expenses due to a low freight market. We will continue to ride on offshore oil and gas activities, securing repair and conversion contracts of OSVs such as seismic survey, pipe-layers, dive support, remotely operated vehicles, platform supply, AHTS, etc.
ST Marine is working progressively on the upgrading of two classes of vessels for the RSN, including detailed system design, installation and integration to enhance the capability of the vessels to meet the RSN’s operational requirements. These works are expected to be completed by 2015.
Shiprepair projects completed during the year included the upgrading and refurbishment of Energy Driller, a semi-submersible drilling rig, and Simpson, a backhoe dredger. Kendrick, a supply vessel, was converted into a multi-purpose deep sea diving support vessel, while Castoro 8, a pipe laying vessel was upgraded to undertake work in the Middle East.
Other projects in the pipeline are the life-extension of drilling rig Boss 6 and the upgrade of drillship Peregrine, as well as major repairs and upgrades of hopper suction dredgers and offshore vessels from regular customers.
ST Marine also offers our customers, both defence and commercial, integrated maintenance and repair solutions, for various high performance engines and generator sets.
As an officially MTU-appointed Service Agent, ST Marine maintains and repairs a comprehensive range of MTU engines. In June 2012, we officially opened our Engine Service Centre, which is equipped with state-of-the-art facilities, such as enhanced work space for dismantling and assembling works;
with a second hand dock purchased to jump start our entry into the repair market for all sorts of vessels operating in the region.
enVironmentAl engineering And serVices During the year, STSE, the environmental engineering arm of ST Marine, fully commissioned the Transfer Station in Sungei Akar and the 110-hectare engineered landfill in Sungai Paku, Brunei. The contract included three years of operation and maintenance of the integrated waste management facility, which commenced in 2012.
In China, equipment installation and testing proceeded at the Waste Transfer Station in Donghu Newtech Zone in Wuhan, Hubei. In September, STSE signed a variation order worth RMB3.5m ($0.7m), to provide a Pneumatic Waste Collection System (PWCS) for the Sino-Singapore Tianjin Eco-City. To be commissioned by end 2012, the proprietary loop-based PWCS collects recyclables, non-recyclables and food waste in the Eco-Business Park.
In July, STSE co-sponsored the inaugural WasteMET Asia. Themed “Waste Management in Growing Cities”, the exhibition was held in conjunction with the Singapore International Water Week and World Cities Summit at Sands Expo and Convention Centre. The exhibition gave STSE a platform to showcase its capabilities with a
testbed demonstrating the concept and operations of the PWCS.
industry reView And outlooK The global maritime industry continues to operate in a weakened state under the shadow of the fragile economic recovery in the US and the ongoing European debt crises. As such, the outlook remains uncertain and the years ahead continue to be challenging as growth remains subdued in many advanced economies. This is exacerbated by the escalating political tensions in various parts of the world.
The slowdown in the global economy and oversupply of vessels has drastically reduced the global newbuild order book for 2012, especially in the container and bulk carrier market. The world’s largest shipbuilding countries, China, Japan and Korea, have reported significant reduction of new orders in 2012. Notwithstanding this, the continuing bright spark is in deep sea crude oil and natural gas exploration. Oil price is projected to stay high and the number of rigs on order remain healthy. However, this also introduces competition as idle yards are now able to compete for orders at a reduced rate. Hence, while both ST Marine and VT Halter Marine continue to see strong orders in this segment, we envisage a much more difficult environment in the future. To mitigate this, we will enhance our competencies and capabilities in the building of OSVs, especially those with higher technical content and requirements.
In the shiprepair and conversion sector, the downturn has affected most shipyards in the Asia Pacific region. There are also fewer ships undergoing repairs in the various yards in Singapore, and this is expected to continue in 2013. ST Marine will therefore focus on the oil and gas sector, where we
have completed conversions of rigs and semi-submersibles. We will continue to expand in this segment through intensive marketing and by building up the relevant expertise. Our new repair capabilities in the US is another positive factor. We believe that the new competencies will add value to our existing customers.
In the defence business, ST Marine has a proven track record in the maintenance and building of various types of naval platforms. In this realm, our local and international base of customers and partners, offers better depth and resilience in this segment of our business. The current export order and recent newbuild contract for the RSN will allow us to further hone our competencies in defence business. VT Halter Marine is also active in naval programmes and continues to be engaged in the pursuit of meeting both the US and new international naval requirements.
Notwithstanding the general slow down in the global shipping and maritime industry, the proven expertise and track records of ST Marine and VT Halter Marine place us in a good position to meet the needs of multiple segments in the maritime industry. To sustain growth in an increasingly challenging environment, we will continue to build on and improve our current competencies and capabilities.
The 141m long Landing Platform Dock for the Royal Thai Navy at sea trials
innovative and quality work benches; dynamometer test-cell control; governor and fuel injector tests; critical component controlled inspection; and a comprehensive range of specialised work tools. ST Marine is now able to better serve our customers with these new facilities.
In the US, VT Halter Marine has been allocated a grant of US$20m from the Mississippi Development Authority towards developing the plot of land at the south side of the existing yard in Pascagoula. Civil works are ongoing,
shiprepAir And engineering serVicesThe general shiprepair market saw some slowdown. However, our Singapore yards continued to win contracts for offshore vessel upgrades and conversions. In the year ahead, the market is expected to continue to
66 67SINGAPORE TECHNOLOGIES ENGINEERING LTD Annual Report 2012Making an impact

maintaining our commitment to corporate social Responsibility
sustainability
At ST Engineering, we believe in doing business responsibly. An integral part of this is investing in our people and processes to create a positive impact on the environment and the communities in which we operate.
98% $17m$70m
savings generated through productivity efforts
customer satisfaction
Investments in stAFF learning and development
68 69SINGAPORE TECHNOLOGIES ENGINEERING LTD Annual Report 2012Making an impact
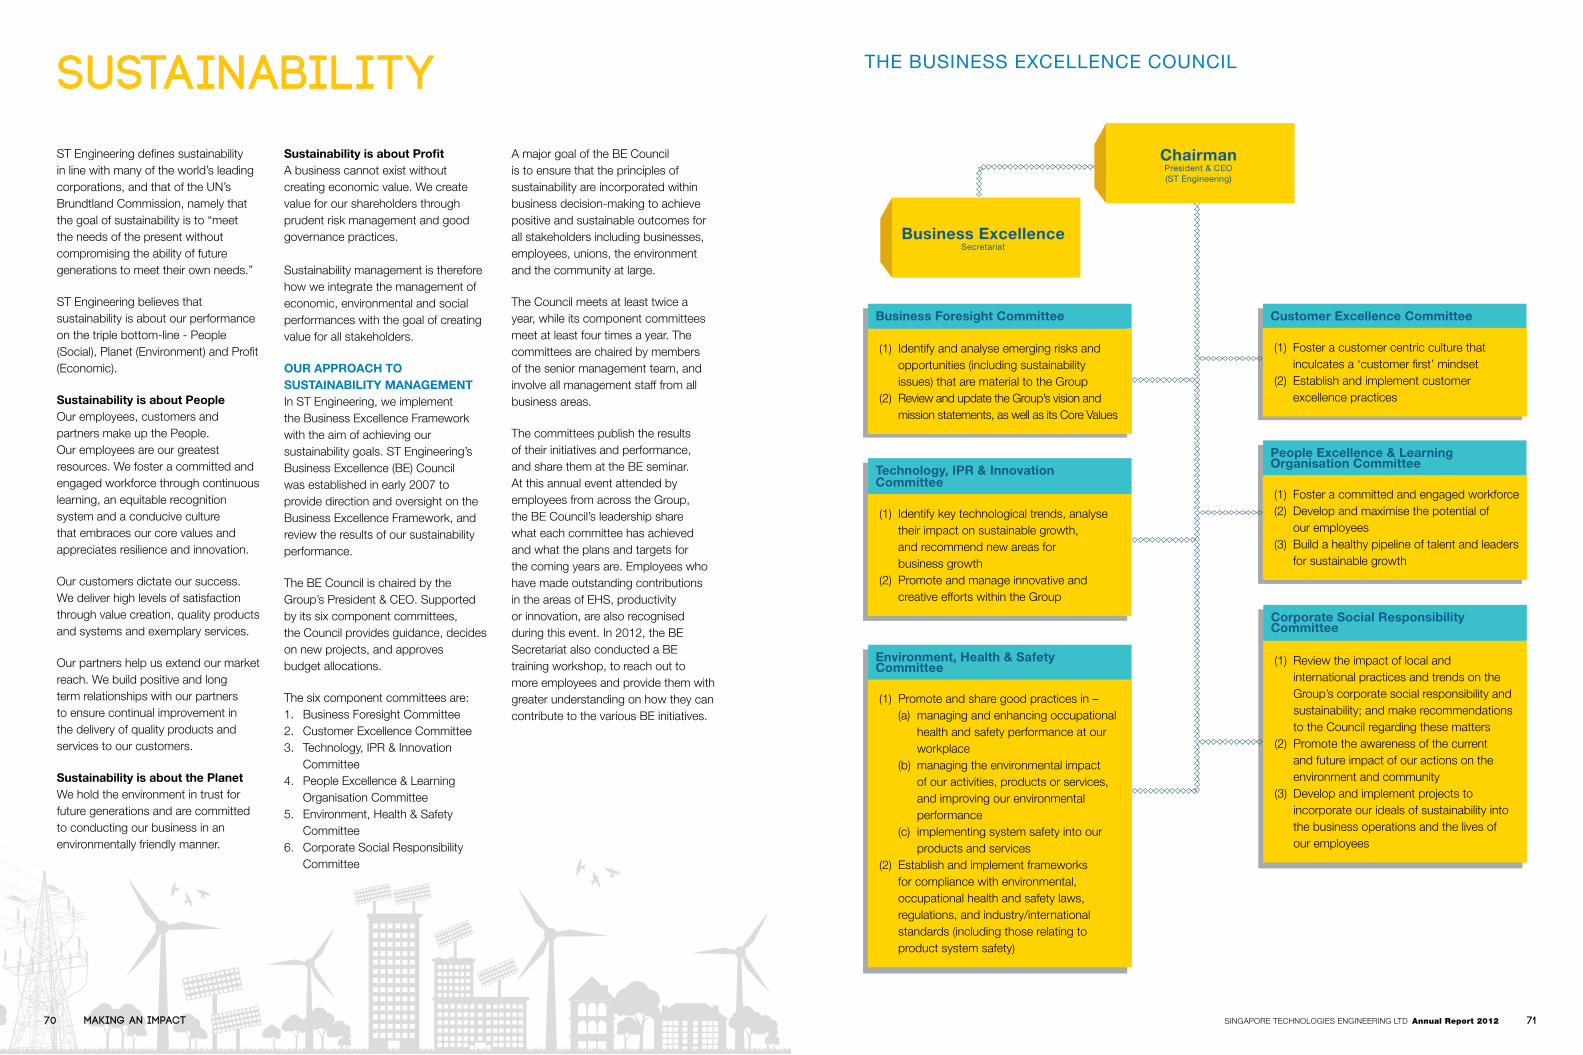
(1) Foster a committed and engaged workforce(2) Develop and maximise the potential of
our employees(3) Build a healthy pipeline of talent and leaders
for sustainable growth
people excellence & learning organisation committee
(1) Promote and share good practices in –(a) managing and enhancing occupational
health and safety performance at our workplace
(b) managing the environmental impact of our activities, products or services, and improving our environmental performance
(c) implementing system safety into our products and services
(2) Establish and implement frameworks for compliance with environmental, occupational health and safety laws, regulations, and industry/international standards (including those relating to product system safety)
environment, health & safety committee
ST Engineering defines sustainability in line with many of the world’s leading corporations, and that of the UN’s Brundtland Commission, namely that the goal of sustainability is to “meet the needs of the present without compromising the ability of future generations to meet their own needs.”
ST Engineering believes that sustainability is about our performance on the triple bottom-line - People (Social), Planet (Environment) and Profit (Economic).
sustainability is about people Our employees, customers and partners make up the People. Our employees are our greatest resources. We foster a committed and engaged workforce through continuous learning, an equitable recognition system and a conducive culture that embraces our core values and appreciates resilience and innovation.
Our customers dictate our success. We deliver high levels of satisfaction through value creation, quality products and systems and exemplary services.
Our partners help us extend our market reach. We build positive and long term relationships with our partners to ensure continual improvement in the delivery of quality products and services to our customers.
sustainability is about the planetWe hold the environment in trust for future generations and are committed to conducting our business in an environmentally friendly manner.
sustainability is about profit A business cannot exist without creating economic value. We create value for our shareholders through prudent risk management and good governance practices.
Sustainability management is therefore how we integrate the management of economic, environmental and social performances with the goal of creating value for all stakeholders.
our ApproAch to sustAinABility mAnAgementIn ST Engineering, we implement the Business Excellence Framework with the aim of achieving our sustainability goals. ST Engineering’s Business Excellence (BE) Council was established in early 2007 to provide direction and oversight on the Business Excellence Framework, and review the results of our sustainability performance.
The BE Council is chaired by the Group’s President & CEO. Supported by its six component committees, the Council provides guidance, decides on new projects, and approves budget allocations.
The six component committees are: 1. Business Foresight Committee2. Customer Excellence Committee3. Technology, IPR & Innovation
Committee4. People Excellence & Learning
Organisation Committee5. Environment, Health & Safety
Committee6. Corporate Social Responsibility
Committee
A major goal of the BE Council is to ensure that the principles of sustainability are incorporated within business decision-making to achieve positive and sustainable outcomes for all stakeholders including businesses, employees, unions, the environment and the community at large.
The Council meets at least twice a year, while its component committees meet at least four times a year. The committees are chaired by members of the senior management team, and involve all management staff from all business areas.
The committees publish the results of their initiatives and performance, and share them at the BE seminar. At this annual event attended by employees from across the Group, the BE Council’s leadership share what each committee has achieved and what the plans and targets for the coming years are. Employees who have made outstanding contributions in the areas of EHS, productivity or innovation, are also recognised during this event. In 2012, the BE Secretariat also conducted a BE training workshop, to reach out to more employees and provide them with greater understanding on how they can contribute to the various BE initiatives.
Business foresight committee
(1) Identify and analyse emerging risks and opportunities (including sustainability issues) that are material to the Group
(2) Review and update the Group’s vision and mission statements, as well as its Core Values
customer excellence committee
(1) Foster a customer centric culture that inculcates a ‘customer first’ mindset
(2) Establish and implement customer excellence practices
technology, ipr & innovation committee
(1) Identify key technological trends, analyse their impact on sustainable growth, and recommend new areas for business growth
(2) Promote and manage innovative and creative efforts within the Group
corporate social responsibility committee
(1) Review the impact of local and international practices and trends on the Group’s corporate social responsibility and sustainability; and make recommendations to the Council regarding these matters
(2) Promote the awareness of the current and future impact of our actions on the environment and community
(3) Develop and implement projects to incorporate our ideals of sustainability into the business operations and the lives of our employees
sustainability THE BuSInESS ExCELLEnCE COunCIL
Business excellence Secretariat
chairmanPresident & CEO(ST Engineering)
70 71SINGAPORE TECHNOLOGIES ENGINEERING LTD Annual Report 2012Making an impact

ST Engineering recognises that customers’ expectations involve both functional and emotional needs. Our customer focus is to deliver high levels of satisfaction through value creation, quality products and exemplary service. Customer excellence efforts are steered by the Customer Excellence Committee, one of the six component committees of the Group’s Business Excellence Council. The Committee has put in place a structured process to determine customer and market requirements. This process enables us to anticipate our customers’ future requirements and position our businesses to pre-empt and seize emerging opportunities.
customer excellence strAtegyWe tailor our offerings to exceed customer expectations by applying a three-pronged strategy:
1. listening and learning channels We adopt multiple listening and learning channels to identify the customer’s requirements. We analyse, evaluate and incorporate the key requirements in our planning process at the business sector and business unit levels.
2. customer engagement We engage with the customer at multiple levels to build a strong and lasting relationship. Senior management interacts with customers to gain a firsthand understanding of their needs, and takes the lead in addressing more complex feedback. At working level, staff respond to customer feedback promptly, and go beyond their duties to support them.
We organise technology seminars and participate in local and international trade shows to keep our customers updated on our new products, solutions and services. In 2012, such events included Singapore Airshow and CommunicAsia in Singapore; Eurosatory and Euronaval in France; Farnborough International Airshow in the UK; Shipbuilding, Machinery and Marine Technology in Germany; and Indo Defence in Indonesia.
3. innovative, value for money products and exemplary services Our business sectors harness technology to cut response times and provide cost-effective and competitive solutions. For example, in 2012, ST Aerospace implemented a benchmarking project to improve the turnaround time of MD11 checks by 28%, while ST Electronics overcame operational and safety challenges to complete the half-height platform screen doors and associated works at elevated Mass Rapid Transit stations ahead of schedule. ST Kinetics appointed a Service Manager as a single point of contact for customer feedback and to give inputs to the project team responsbile for building up maintenance capabilities. Employing out-of-the-box thinking, ST Marine successfully completed its first jack-up rig conversion to a Mobile Offshore Production Unit within the contractual turnaround time.
customer sAtisfActionWe have developed multiple KPIs to measure and track customer satisfaction. Of these, we achieved 98% customer satisfaction and 98% turnaround time compliance across the various business sectors in 2012.
custOMeR excellence productivity
tAKing A holistic View on productiVity Led by our Business Excellence Council, ST Engineering adopts a holistic approach to productivity. At the sector level, Productivity/EVA Steering Committees set the pace and identify critical drivers to work on. In 2012, more than 82% of our people contributed to productivity initiatives resulting in savings of $70m for the year. Continual learning and engagement are the linchpins of our productivity movement, resulting in new or improved products, solutions and processes. Organisational learning may take the form of EVA, Kaizen or innovation projects, Thinkout Sessions, research and development, best practice sharing and benchmarking. Every year, the Group reaps substantial savings and improvements from such efforts. The most significant contributions by teams and individuals are acknowledged by the annual ST Engineering Innovation Awards, ST Engineering Idea Awards and ST Engineering Team Excellence Awards.
productiVity improVement proJects
Aerospace – improved turnaround timeST Aerospace provides heavy maintenance services to a US airfreight operator as part of an agreement that has seen the delivery of over 900 aircraft. A process improvement team consisting of maintenance and planning personnel embarked on a project in 2011 to reduce the turnaround time of the 5YR/10YR maintenance checks on the carrier’s A300 aircraft.
Using the Theory of Constraints and other innovative improvement methodologies, the team was able to reduce the A300 5YR/10YR check turnaround time from 38 to 32 days in 2012. The aggregate effect is a reduction in the number of A300 maintenance lines in 2012 from three to two. This has allowed the operator to keep one more A300 flying, led to cost savings, and has freed up ST Aerospace’s capacity for more work.
Embracing a mindset for continuous process improvements, ST Aerospace reduced the A300 5YR/10YR check turnaround time by 15%
project management initiatives resulted in zero construction rework
turnaround tIMe dOwn FROM 38 dAys
32days
25%
17%
hull construction productivityimprovement
reduced welding cycle tIMe by
REWORK
72 73SINGAPORE TECHNOLOGIES ENGINEERING LTD Annual Report 2012Making an impact

productivity
electronics – enhanced project efficiency The Expressway Monitoring and Advisory System (EMAS) for Arterial Roads is a large-scale project involving surveillance cameras, detection sensors, traffic information and control sub-systems, and electronic signboards to inform motorists of traffic conditions.
ST Electronics deployed field-proven methodologies to track and measure progress of the project. Despite the involvement of deploying massive outdoor infrastructure at many locations island-wide, project implementation was defect-free. Meanwhile, safety campaigns targetted at field engineers and contractors encouraged
compliance with safety regulations and procedures, resulting in zero accidents for 166,000 manhours worked and zero construction re-work. New technologies and an innovative design also boosted productivity. For example, a new customised network for multicast video transmission via Unicast Wide Area Network was designed and this reduces the cost of transmission. The team also designed a robust outdoor external antenna that uses auto reconnection algorithms to improve the connectivity between road site traffic detectors and traffic servers, reducing signal loss incidents.
Expressway Monitoring & Advisory System provides information to road users and assists in traffic management
A Kaizen initiative reduced the welding cycle time of KIDRON refrigerated trucks by 17%
These initiatives resulted in the smooth integration of various sub-systems, enhanced project efficiency and on-time delivery of the project within budget.
land systems – reduced welding cycle time VT Hackney, one of the Land Systems sector’s US companies, operates a plant in Pennsylvania specialising in production of the KIDRON brand of refrigerated trucks and trailers.
Welding is a key step in the production process. The Final Fit department, which is responsible for the welding process, formed a Kaizen team to eliminate muda (waste) and successfully identified and removed non value added activities from the welding process. On top of ensuring that the delivery of materials to the welding bays was accurate and timely, the Kaizen team also implemented a 5S effort that cleared space for materials coming into the welding bays, further contributing to the efficiency of the whole welding process.
This initiative reduced the welding cycle time by 17% and contributed to an overall improvement in the throughput of the plant.
Optimising the usage of our permanent launchway with two AHTS vessels being built concurrently
was being built at the primary position of the launchway. Upon launching the first vessel, the partially constructed second vessel, weighing 1,800 tons, was skidded down to the primary position on the launchway to continue with construction, while construction of the next vessel commenced at the top of the launchway. With this finely orchestrated process, productivity was improved and ST Marine was able to launch the vessels at intervals of four months instead of eight.
In addition, during the launch of each vessel, the use of air bags instead of the conventional steel buoyancy tank reduced the time required to remove the buoyancy attachment from the vessel by 40%.
marine – improved construction processIn 2012, one of ST Marine’s productivity improvement initiatives involved the construction of six Anchor Handling Tug Supply vessels (AHTS) for Swire Pacific Offshore. To maximise the tight space at the Benoi Yard in order to meet the contracted timeline for the project, the team firstly improved the hull construction productivity by 25%. This was done by implementing a more “production-friendly” design and improved production process including adopting a One-Man-Operation approach whenever possible.
Secondly, to optimise use of the permanent launchway, ST Marine designed a system to allow two of the AHTS to be built concurrently on the same launchway at any given time. This was achieved by starting construction of a second vessel at the top of the launchway while another
74 75SINGAPORE TECHNOLOGIES ENGINEERING LTD Annual Report 2012Making an impact

In the area of Smart Management, ST Electronics aims to provide smart water management solutions, which include capabilities in sense and response, optimisation and resource management of water.
ST Electronics is also developing Smart Distribution solutions, such as Advanced Metering Infrastructure (AMI), microgrids and security, for electricity providers. For AMI, ST Electronics’ R&D focus includes multi-utilities compatibility (i.e. water, electricity and gas) in a single module and also the ability to enable multiple communications technologies such as TV Widespace, Radio Frequency and Power Line Communications. TV Widespace as a communication platform for utilities is a new growth area, and it is rare for all three communication technologies to be deployed together. There is also scope for more comprehensive and innovative grid security solutions, as AMI is deployed with minimum security today.
At the tail end of the Smart Utilities value chain is Smart Consumption, which is supported by the Smart Building Energy Management System. This innovative, knowledge-based system is capable of modelling the energy consumption of a building, dynamically adjusting set points and tightly coupled with the measurement and verification of utilities consumption to meet specific green building standards such as Green Mark and Leadership in Energy and Environmental Design (LEED).
land systems – hydro-mechanical infinitely Variable transmission (hm-iVt)ST Kinetics’ HM-IVT is an example of a highly innovative product that resolves a number of issues simultaneously. Designed for power packages in the high horsepower ranges of 250hp
up to and including 1500hp, the HM-IVT provides a parallel power path through the transmission, permitting it to continuously transfer power in a combination of hydraulic and mechanical modes. At low speed, the HM-IVT transmissions allow engines to produce high torque. At high speed, the transmission operates almost fully in mechanical mode, offering significant efficiency. The design provides solutions for heavy duty and high torque applications and for engines with narrow band or constant RPM requirements.
Our HM-IVTs provide speed ratio coverage from infinity to overdrive and do not require a drive belt, torque converter, or reverse gear set. They are inherently scalable due to the use of integrated pump motors which can be combined into multiple, parallel systems. They also provide vehicles with equal speeds in both forward and reverse, and provide extreme creep speed capabilities without the need for high heat dissipation. The hybrid nature of our HM-IVTs allows vehicle designers to utilise the hydraulics features for retardation braking as well as engine control.
By allowing engines to run in their optimal range, our HM-IVTs improve overall vehicle performance and reduce wear and tear. While hybrid and electric vehicles deliver fuel economy, a conventionally powered vehicle with an HM-IVT eliminates emissions at a lower
HMX-3000: Designed for tracked vehicles up to 30T with engine ratings of up to 800hp
LARS enhances the seaman’s safety when launching and recovering boats
InnOvAtIOn
innoVAting for the futureThe Group’s innovation efforts are steered by the Technology, IP and Innovation Committee, one of six component committees of our Business Excellence Council. Chaired by the Group’s Chief Technology Officer, the committee ensures that we leverage technology and innovation to maintain our competitive edge.
The annual ST Engineering Idea Competition is one of the platforms where employees from our global offices are able to present their ideas for innovative products, new businesses or environmentally friendly solutions to a panel of senior management. Promising ideas are then nurtured by the relevant business sector or independently.
During the year, we also held THINKOUT for the second time. Initiated in 2010, this biennial event brings together entrepreneurial and creative problem solvers from across the business sectors and functions to explore new approach or solutions
to overcome challenges facing our customers. The confluence of diverse expertise and experiences has helped generate new perspectives and insights.
To innovate for the future, ST Engineering’s Advanced Engineering Centre, an independent unit called ST Dynamics, focuses on creating new business or product ideas for the Group. It also funds projects to draw insights from emerging technologies.
exAmples of innoVAtiVe engineering
Aerospace – novel welding technique for exotic superalloys The need for fuel efficiency, exhaust gas temperature margins and increasing operating temperatures have resulted in the use of more exotic superalloy material in gas turbines. When welded at room temperature, these superalloys are prone to cracking, making successful repair extremely difficult.
Technology Segment for Smart Utilities
cost. By making critical performance decisions for drivers, our HM-IVTs allow operators to focus on their main task, thereby raising productivity.
marine – launch and recovery system (lArs) for small BoatsLARS is used mainly by coast guard and navy ships to recover small boats from mother ships. Each LARS is usually specific to the hull design of the small boat. During boat recovery, a pull-in winch is used to recover the boats on rails or passive rollers. Human intervention is required during the initial recovery rope capturing, which is difficult in bad sea conditions and may expose the seaman to potential work hazards.
ST Marine has created a design for a LARS on a sloped stern ramp which uses active hydraulic rollers to push the boat up during recovery. This eliminates the need for a seaman to conduct the recovery rope capturing for such a task. The system is also designed to be adjustable for different boats.
Comms Security
Distribution Automation
Advanced Metering
Infrastructure
Smart Distribution
Sense & Response
Resource Management
Resource Optimisation
Smart Management
Measurement & Verification
SmartBuilding System
Performance Optimisation
Smart Consumption
A team of technical staff at ST Aerospace has developed a unique and innovative process that addresses this problem. Upon certification by the OEMs, this new process will shorten the turnaround time for repairs.
electronics – smart utilities Cities worldwide are increasingly seeking to adopt eco-enabling technologies, to meet the challenges of climate change. ST Electronics has identified Smart Utilities as an area in which it can leverage existing core competencies and domain expertise to be among the top global players in the industry. Specific areas that ST Electronics is focusing on are Smart Management, Smart Distribution and Smart Consumption.
76 77SINGAPORE TECHNOLOGIES ENGINEERING LTD Annual Report 2012Making an impact

environment, workplace safety & health
mAKing the enVironment our Business With increased awareness of climate change and the benefits of green technologies, environmentally friendly products and services are gaining traction worldwide. As an engineering group, such solutions are a natural extension of our business.
In the Aerospace sector, we are helping customers to increase productivity and decrease emissions. EcoServices, a joint venture between VT Aerospace and Pratt & Whitney, is the largest provider of engine wash services for commercial and military aircraft operators. Its patented EcoPower® engine wash system reduces fuel burn by as much as 1.2%, eliminating approximately three pounds of carbon dioxide emissions for every pound of fuel saved, while decreasing engine gas temperature. This increases the amount of time an engine can stay on wing. The CO2 savings can also be
certified under the requirements of the Verified Carbon Standard using a new methodology developed by Pratt & Whitney. EcoPower® engine wash received the 2012 Eco-Technology of the Year Award during the inaugural Air Transport World Eco-Aviation Awards.
ST Electronics is working in the emerging area of intelligent energy systems, including Advanced Metering Infrastructure (AMI), integration of alternative energy sources to the main grid, green Information Communication Technologies infrastructure and Intelligent Transport Systems and solutions related to electric vehicles such as charging facilities. Through a strategic partnership with Sino-Singapore Tianjin Eco-City Investment & Development Co Ltd (SSTEC), we are working to develop eco-solutions for the Eco-City, including a Green Energy Solution for the Tianjin GEMS World Academy. In partnership with Accenture Pte Ltd, ST Electronics is designing and
implementing the critical infrastructure to enable smart grid applications for Phase 1 of the Intelligent Energy System pilot project. A leading supplier of Automatic Meter Reading (AMR) and AMI solutions, we are also providing AMR radio transceivers for smart AMR meters which are used to monitor water, electricity or gas usage in China, Europe, India and the US.
Meanwhile, ST Kinetics’ subsidiary, Kinetics Systems Shanghai, saw increased penetration of their solutions for pure electric buses due to strong market demand and the Chinese government’s push for greener transportation systems. New products introduced included a Smart Vehicle Controller and the HyPower 140kW Full Electric Integrated Permanent Magnet Drive System, developed for the State Grid Cooperation of China and Shanghai Sunwin Bus. In Singapore, ST Kinetics was awarded a contract by PSA Singapore Terminals (PSA) to develop two models of Automated Guided Vehicles (AGVs) for transporting containers within PSA’s container terminals. The prototype AGVs will incorporate ST Kinetics’ proprietary HyPower Hybrid Electric Drive System for greater energy efficiencies and higher productivity.
In the Marine sector, we continued to design green features that help customers cut costs. Some of these features include the innovative Fuel Efficiency Module, a system designed by us to reduce ship drag and improve energy efficiency, and an efficient waste management system with recycling management facilities. During
the year, ST Marine’s environmental engineering arm STSE Engineering Services (STSE) continued to deliver on ongoing projects. In Brunei, it fully commissioned the Waste Transfer Station and Engineered Landfill, and commenced the contract for the three years of operations and maintenance of the integrated waste management facility. In China, STSE made progress in the installation and testing of the equipment for the Waste Transfer Station in Donghu Newtech Zone in Wuhan, Hubei. At the Sino-Singapore Tianjin Eco-City, STSE signed a variation order for additional work to provide a proprietary loop-based Pneumatic Waste Collection System (PWCS). The PWCS, which collects recyclables, non-recyclables and food waste in the Eco-Business Park, was successfully commissioned in end 2012.
going green from within As a responsible corporate citizen, we also strive to reduce our own energy consumption and carbon footprint. This is executed as part of an overall Environmental, Occupational Health and Workplace Safety (EHS) framework that we have in place internally.
All of our business sectors review their business processes on an ongoing basis to identify and mitigate any potential adverse impact on the environment. Some projects implemented by the Group include
the use of compressed natural gas in place of acetylene gas, installation of energy-saving lighting, replacement of air-conditioning chillers with more energy-efficient models, as well as monitoring of energy consumption at department level.
During the year, ST Aerospace installed digital electricity meters that monitor energy consumption and allow improvements to be measured accurately. At ST Electronics, four energy-saving projects were completed which resulted in yearly reduced electricity consumption of about 145,000 kWh or 63 tonnes of carbon emission. Other environmental conservation efforts included recycling about 32 tonnes of paper and 1,500 pieces of computers and accessories in 2012.
At ST Kinetics, energy consumption has been reduced by 20-30%. This was achieved by replacing existing lighting with induction and LED lighting and by installing hypermisers which regulate electrical flow and cut power
st engineering’s enVironmentAl, occupAtionAl heAlth And worKplAce sAfety (ehs) chArter:
1. Promote and share good practices in • managingoccupationalhealthandworkplacesafety• managingtheimpactthatouractivities,productsandserviceshaveonourenvironment• incorporatingsystemsafetyintothedesignofourproducts
2. Establish and implement frameworks for compliance with prevailing environmental, occupational health and workplace safety laws and regulations
ST Aerospace’s award winning Eco-Power® engine wash reduces fuel burn and CO2 emissions
ST Kinetics has planted more than 17,000 trees and shrubs since 2008
consumption. ST Kinetics also pressed on in its effort to green its facilities, planting more than 1,000 trees and shrubs on its premises in 2012. Since the start of this project in 2008, ST Kinetics has planted more than 17,000 trees and shrubs.
In 2010 and 2011, ST Marine completed seven abatement projects with an estimated reduction of 959 tonnes per year in carbon footprint, yielding savings of about $1.5m between 2010 and 2012. These efforts were recognised in April 2012 when ST Marine became the first company in Singapore and the first shipyard in Asia to receive the ISO 14064-Part 1:2006 Green House Gases Certificate of Assurance from Lloyd’s Register Quality Assurance Limited.
During the year, all business sectors continued to maintain the Environment Management System certified to ISO 14001:2004 standards. The sectors also shared lessons on audit findings, good practices on energy conservation, management of hazardous substances, trade effluents and industrial waste. The sectors also shared lessons on the types of containment for oil generating machines, use of leak proof waste bins for paints or chemicals, development of procedures for chemical management, and deepening communication channels on Environmental Aspect and Impact Analysis.
78 79SINGAPORE TECHNOLOGIES ENGINEERING LTD Annual Report 2012Making an impact

We seek to assess the Group’s carbon liability in accordance with ISO 14064, and obtained independent assurance of our greenhouse gas emissions inventory for 2010 and 2011.
We track not only our energy consumption, but also the resulting direct and indirect greenhouse gas emissions. Our direct energy consumption generally includes aviation gasoline consumed in test cells, diesel and motor gasoline consumed in vehicles, and acetylene and diesel consumed in the manufacturing process. Indirect energy consumption mainly consists of electricity used for lighting and to power utilities and appliances.
Currently, this is being done for operations in Singapore and the initiative will be extended progressively to operations outside Singapore.
enhAncing occupAtionAl heAlth ST Engineering recognises the importance of occupational health and adheres strictly to the Workplace Safety and Health Act (WSHA). During the year, the Group’s EHS Committee organised several occupational health talks on areas such as eye care, hypertension and high cholesterol,
hearing awareness and noise induced deafness. In addition, we conducted seminars on several regulatory requirements such as WSH (Noise Regulation) 2011 & Noise Prevention, Chemical Management and WSHA C354A and Second Schedule on Occupational Diseases.
The EHS Committee also analysed the results of audiometric tests conducted over the last five years in the business sectors. This led to noise reduction measures being implemented at various premises to safeguard the health of our employees.
improVing worKplAce sAfety Workplace safety is of paramount importance to our operations. Besides the WSHA, the Group observes strict compliance with the Singapore Standard Code of Practice. ST Aerospace, ST Electronics and ST Kinetics continue to be certified to OHSAS:18001, while ST Marine maintains its Safety Management System certification Level 8 with DNV’s International Sustainability Rating System.
In 2012, our business sectors continued to build their system safety competencies. ST Aerospace implemented a system safety database for projects, while ST Electronics incorporated a system safety process at corporate level. ST Kinetics enhanced its system safety hazard analysis template, and ST Marine created new hazard log and database software. At the inaugural ST Engineering System Safety Seminar in October 2012, the business sectors shared their respective practices and experiences.
promoting sAfety AwAreness ST Engineering is a strong proponent of system safety awareness in Singapore and the Asia Pacific region. ST Kinetics became the first Singapore Corporate Member of the International System Safety Society in 2002. Our employees and customers played a vital role in establishing the Singapore Chapter in 2003. Both the Founding President and the immediate past President are Group employees. Through the years, ST Engineering has supported many activities organised by the Singapore Chapter, including the 1st International System Safety Society Regional Conference in 2008 and a number of system safety sharing sessions.
Additionally, ST Engineering jointly organises the Safety@Work Creative Awards with the Workplace Safety and Health Council. In its eighth year, the objectives of the Awards are to raise awareness of workplace safety among tertiary students while developing young artists. The winning posters and animation clips are reproduced and made available to industrial companies as resources for training, thereby spreading the safety message to the wider community.
Accident statistics for the period January to december 2011#
Accident frequency rate
Accident severity rate
National Average -Manufacturing sector*
2.10 116
ST Aerospace 1.00 26.40
ST Electronics 0.60 9.55
ST Kinetics 1.10 35.57
ST Marine 0.26 23.00
We engaged our employees through various activities and campaigns such as Safety Month, Target Zero Programme and WSH Innovation Convention. These outreach activities helped to promote the safety-at-work culture with a heightened level of awareness and increased safety consciousness.
Our efforts in workplace safety earned a slew of awards and accolades during the year. ST Marine was awarded the WSH Innovation Award (Gold) by the Association of Singapore Marine Industries this year. At the Ministry of Manpower’s WSH Awards, ST Marine won the WSH Innovation Award for the third year running; ST Kinetics won the WSH Award for Supervisors; and ST Electronics won the Safety and Health Award for five projects. ST Kinetics and ST Aerospace also clinched the WSH Innovation Award (Silver and Bronze respectively) from the Singapore Manufacturers’ Federation.
Building on system sAfety initiAtiVes Another key focus of the EHS Committee is system safety. Working through a System Safety Subcommittee comprising managers from the key business areas, the aim is to ensure system safety excellence throughout the Group and to keep abreast of international standards in system safety.
We have implemented system safety in all our products since the 1990s, ensuring that new and complex products we develop are safe for their intended use. As we expand our businesses into the commercial arena, we have also introduced system safety concepts and practices to our commercial businesses and key suppliers. Our employees help to educate the suppliers on how to assess the safety of their components and assembly, thus improving the overall safety of our products.
environment, workplace safety & health
For the third year running, the Group’s EHS Committee continued to perform the cross-sector Safety Assessment, leveraging collective experiences across the sectors. The Committee followed up with a dissemination and benchmarking session for all WSH officers, covering the following areas to enhance learning and sharing of good practices:
• Emergencyresponseplansandprocedures
• OccupationalSafetyandHealthTraining
• Permit-to-WorkProcedures• RiskandHazardIdentificationand
Assessment
The Committee also reviewed the effectiveness of initiatives and programmes by analysing the accident statistics related to workplace injuries in the last ten years. Most importantly, the Committee reviewed the potential and actual causes of such injuries. This review was carried out despite the fact that all four sectors already achieved rates that are better than the average rates in their respective industries.
Safety@Work Creative Awards is jointly organised by ST Engineering and the Workplace Safety and Health Council
Winners of the 2012 Safety@Work Creative Awards
* Source: Workplace Safety and Health Report 2011
# 2012 Accident statistics not yet available as of date of printing
80 81SINGAPORE TECHNOLOGIES ENGINEERING LTD Annual Report 2012Making an impact

people excellence
The Group’s vision, mission and core values determine the way we manage our people. We are also guided by the People Excellence and Learning Organisation component of our Business Excellence Framework. In accordance with the Employer’s Pledge of Fair Employment Practices, we promise to:
• recruitandselectemployeesonthe basis of merit, such as skills, experience and ability, regardless of age, race, gender, religion or family status;
• treatemployeesfairlyandwithrespect and implement progressive human resource management systems;
• provideemployeeswithequalopportunities for training and development based on their strengths and needs, to help them achieve their full potential;
• rewardemployeesfairlybasedontheir ability, performance, contribution and experience; and
• abidebylabourlawsandadoptTripartite Guidelines which promote fair employment practices.
The Group also has an Employee Value Proposition, which commits us to:
a) investing in high performing teams through providing continuous development opportunities to our employees, nurturing and grooming our leaders;
b) providing continuous learning and development opportunities to strengthen our technical and leadership competencies;
c) developing a workforce that promotes innovation and entrepreneurship, guided by our core values; and
d) rewarding excellence and encouraging work-life harmony.
recruiting tAlent ST Engineering awards various scholarships to identify and develop talent early. In 2012, we awarded 51 scholarships to Singaporeans for undergraduate, polytechnic and ITE studies. Of these, 15 were Singapore-Industry Scholarships awarded in partnership with the Singapore government.
We also offer internships to students from polytechnics and universities, allowing them to consider a career with us. In 2012, the Group offered internships to 641 students. Separately, ST Aerospace signed a Memorandum of Co-operation with Singapore Polytechnic in February 2012 to train and develop specialists focusing on unmanned aerial vehicle systems. As part of this agreement, students pursuing diplomas in Aeronautical Engineering and Aerospace Electronics Engineering benefit from industrial attachments and get to work on real-life projects. Five students participated in 2012.
To encourage young people to take up engineering, we engage junior college students through the Young Engineers Programme, which includes sharing sessions with our Chief Technology Officers, visits to our operations and internship opportunities. As part of the programme, mentors are assigned to share their experiences and enthuse the students about engineering.
As a way to support our global expansion, we offer scholarships to students at top universities in China and India. These scholars have the opportunity to intern with us at the end of their third year. In 2012, 36 of them did so. ST Kinetics has its own STK Scholarship (China) programme in partnership with five Chinese universities. To date, the scheme has recruited 29 master’s degree holders for
ST Kinetics’ joint venture companies in China.
rewArding And deVeloping our people We offer competitive remuneration and use performance-based pay and bonuses to reward individual contribution. Senior executives receive performance shares based on KPIs that drive the productivity and profitability of the Group.
During the year, ST Engineering introduced the Restricted Cash Plan (RCP) for staff in the lower managerial staff grades to replace their participation in the Restricted Share Plan (RSP). Instead of shares, the RCP grants cash. Like the RSP, RCP awards are subject to achieving a pre-determined KPI over a one-year period, with the final award released in two equal tranches.
The Group continued to invest in staff learning and development, spending $16.6m for the year. This included sponsorships for 44 employees to pursue their undergraduate or postgraduate studies.
These sponsored programmes included the Industrial Postgraduate Programme that was jointly developed by Singapore’s Ministry of Education, the Economic Development Board and local universities to build a pool of postgraduate manpower with industry-critical R&D skill sets; and the Master of Defence Technology and Systems Programme, jointly conducted by the National University of Singapore and the US Naval Postgraduate School. The latter helps the Group to build up a pool of systems engineers as it equips participants with knowledge in key defence technologies, and provides a platform for participants to network with fellow engineers in the defence ecosystem.
For working with our employees towards creating better jobs and raising the employment rate through re-employment, up-skilling and making the workplace more inclusive, ST Marine won the National Trades Union Congress (NTUC) May Day Model Partnership Award 2012. NTUC also identified ST Aerospace as a model for helping workers to raise their pay through progressive upgrading of skills.
grooming leAders Our leadership development programme extends beyond succession planning for key positions, to grooming leaders at all working levels. Besides courses, the online self-assessment tool, Leadership Enhancement Portal, provides a database of learning resources that helps our people to develop based on their preferred learning style.
Other forms of leadership development include assigning mentors and rotating employees across departments to broaden their exposure.
Senior employees may be selected for the Senior Leader Development Programme as well as Executive Education Programmes in premier universities such as Harvard, Stanford and INSEAD.
In addition, the Group nominated two employees to be part of a community of youth leaders being developed by the Singapore National Employers’ Federation and the National Youth Council.
Given our overseas expansion, we seek to equip our people to operate in culturally diverse environments. In particular, overseas postings help us build a pool of globally minded managers. Likewise, we make efforts to expose our overseas managers to the Singapore work culture. This year, seven executives from overseas participated in a two-week attachment at the respective business units. They also attended the Development Centre to help them understand their strengths and areas for improvement.
communicAting with our people Our Employee Information Portal is the main platform to communicate our vision, mission, values and business thrusts. Information on Group performance, directions and plans is communicated at quarterly dialogue sessions and twice-yearly forums at the sector and subsidiary levels.
Other Group-wide communication channels include seminars on business excellence, security, safety, corporate social responsibilty and risk management. The biennial Employee Opinion Survey, e-Staff Suggestion Scheme, circulars, newsletters and email broadcasts are valuable sources of feedback.
At the operational level, specific issues and learning points are highlighted at management briefings, toolbox meetings as well as safety and quality briefings.
Employees having a workout during ST Aerospace’s Active Day
82 83SINGAPORE TECHNOLOGIES ENGINEERING LTD Annual Report 2012Making an impact

promoting A hArmonious worKplAce The Group appreciates the role of work-life harmony in aligning the objectives of the organisation and employees, as well as improving employee satisfaction and retention. We provide a supportive work environment with certain work schedule flexibility, and will implement a more formal framework for flexible work arrangements in 2013.
In addition, we promote employee well-being through sports and recreation, customised wellness programmes such as health and financial talks, and social activities like karaoke competitions and visits to welfare homes.
In 2012, ST Electronics organised an inter-SBU Health competition, where the SBU with the lowest employee medical leave rates was presented
with a plaque as recognition for being the ‘Healthiest SBU’. ST Kinetics also launched an initiative to co-pay for employees’ courses which need not be work-related.
Besides work-life harmony, we strive for harmony between management and unions. Regular Union-Management meetings build mutual trust and confidence, allowing quick resolution of staff issues, clarification of policies and buy-in of new initiatives. Thanks in part to engagement with the unions, the Group has been re-employing those above 62 years of age well before the Retirement & Re-Employment Act came into effect on 1 January 2012.
people excellence communityrelations
cAring for the community In 2012, employees of ST Engineering continued to play meaningful roles in their communities, volunteering their time to various causes and also giving generously. Among their donations in 2012 was a contribution of over $380,000 to the President’s Challenge.
Employees from the different business sectors visited homes for the aged and underprivileged, including the Apex Harmony Lodge, Chen Su Lan Home, Moral Home for the Disabled and Moral Welfare Home. We also organised enjoyable excursions for residents of these homes to places such as Gardens by the Bay, Hort Park, Kranji Farm and Sentosa. For one of these outings, staff from ST Marine took about 20 patients of Assisi Hospice out to sea on a yacht.
On top of the many visits and outings, many of our employees took part in other charity events on their own initiative. For example, 41 employees from ST Marine participated in the Terry Fox Run in support of cancer victims, while ST Electronics employees made mooncakes for residents of Lions Befrienders to celebrate the Mid-Autumn Festival.
In the US, VT Hackney staff made a collective donation to their local food bank, and participated in the Christmas Angel Tree project that benefitted needy families. They also donated a van to their local volunteer firefighters.
Meanwhile, employees from VT iDirect participated in the annual Toys for Tots drive which provides Christmas gifts of new toys to less fortunate children.
A sponsor of the American Cancer Society Chili Cook-Off for the sixth year running, STA Mobile’s employees donned their aprons and put together a cook team to compete with 108 others for the ‘best chili recipe’. While the team did not win the trophy, employees were happy to be part of an event that raised US$200,000, which went towards helping the society fight against cancer.
Besides charitable giving, we believe in providing better opportunities or exposure to the underprivileged. ST Synthesis hosted 12 students from the Assumption Pathway School on an 11-day industrial attachment, providing the youths with hands-on experience under close supervision by senior staff.
At the Group level, ST Engineering has committed $200,000 a year for eight years to sponsor the “Earth Check” and “+5 Degrees” exhibits at Singapore’s Gardens by the Bay. This is in keeping with our efforts to be more environmentally friendly and to spread awareness of climate change.
ST Electronics’ basketball challenge helps to promote employee well-being through sports
ST Kinetics employees at a farm visit with residents of the Moral Welfare Home
ST Marine employees with patients from Assisi Hospice enjoying a day out at sea
sector
humAn resource stAtisticsas at 31 December 2012 Total: 22,745
geogrAphy quAlificAtion
Diploma & equivalent
Trade Certificates
Degree & equivalent
GCE “O” & “A” levels & equilvalent
Secondary level & lower
STA Mobile employees became chefs for a worthy cause
ST Electronics employees at an outing organised for members of NTUC Eldercare
Aerospace
Electronics
Land Systems
Marine
Others
Singapore
Asia Pacific (excluding Singapore)
Europe
USA
Others
32%
24%
7%
18%
19%
19%
14%
3%
<1%
64%
33%
4%
31%
8%
24%
84 85SINGAPORE TECHNOLOGIES ENGINEERING LTD Annual Report 2012Making an impact

investor Relations
ST Engineering is committed to timely and transparent communication with the investment community including investors, financial analysts and shareholders. Recognising the strong competition for the attention of investors and analysts, we seek to enter into long-term, open dialogues with these stakeholders so that they gain a better understanding of our businesses, governance, financial performance and prospects. Our commitment to transparency has been recognised by the investment community. ST Engineering is listed in the Most Transparent Hall of Fame by the Securities Investors Association of Singapore (SIAS).
Our senior management team presents the Group’s financial performance quarterly to analysts and the media. These briefings are available via webcast to allow anyone to participate from any location and to pose questions to the management team
in realtime. We also provide regular news flow to update the market on relevant corporate developments, in addition to regulatory announcements. Our corporate website carries a depository of all SGX and marketing announcements, presentation materials and financial statements, as well as recordings of our results webcasts.
Investors have regular access to senior management through one-on-one meetings, conference calls, non-deal roadshows, investor conferences and facility visits. These interactions help investors to better understand the Group’s investment proposition and operating landscape. Through these various platforms, the Investor Relations team held over 200 meetings in 2012.
ST Engineering continues to support the promotion of investor education and remains a sponsor of the SIAS Investor Education Programme.
share price information ST Engineering shares closed at $3.82 at the end of 2012, representing a share price gain of 42% for the year, outperforming the Straits Times Index by 24%. Market capitalisation was $11.8b at the end of 2012. Average closing share price for the year was $3.25. The highest closing price reached during the year was $3.88 on 13 Dec, and the lowest was $2.70 on 3 and 9 Jan. Average daily trading volume for the year was 1.95m shares.
share structure Temasek Holdings remained our largest shareholder, with 50.5% of shares as at end 2012. Another 33.9% is held by institutional investors, with the rest held by retail and other shareholders. Geographically, shareholders from Singapore held a total of 65%, followed by those from North America at 15% and Europe at 6%.
dividend information We are committed to distributing sustainable returns to our shareholders. For FY2012, the Board has proposed a final dividend of 13.80 cents per share. Together with the interim dividend of 3.0 cents per share, this translates to a total of 16.80 cents per share, 8% more than FY2011, and represents 90% of our net profit.
Ordinary2011 2012201020092008
20
15
10
5
0
8.80
15.80
Cents
13.2814.55
15.50
6.28 7.55
7.00 7.00
8.50
7.007.00
Special
Fund Managers visiting ST Aerospace
ir events in 2012
February FY2011 results briefing with live webcast
February Post-results investor tea
April 15th Annual General Meeting
May 1Q2012 results briefing with live webcast
May Post-results investor lunch
May Non-Deal Roadshow to US and Canada
May CIMB Singapore Corporate Day – Singapore
May HSBC Annual ASEAN Conference – Singapore
May DB Access Asia Conference – Singapore
June Nomura Asian Equity Forum – Singapore
June Citi ASEAN Investor Conference – Singapore
August 2Q2012 results briefing with live webcast
August Facility visit to ST Electronics
August Non-Deal Roadshow to Hong Kong
September UBS ASEAN Conference – Singapore
October Facility visit to ST Aerospace
November 3Q2012 results briefing with live webcast
November Morgan Stanley Summit – Singapore
ST Engineering Share Price
ST Engineering trading volume
2012
FSSTI
Janu
ary
Febr
uary
March
April
MayJu
ne July
Augus
t
Septem
ber
Octobe
r
Novem
ber
Decem
ber
40
30
20
10
0
6M
4M
2M
0
(Normalised, % gain)
(Source: Bloomberg)
(Based on Top 30 Share Register Analysis as at 31 December 2012)
16.80
7.00
9.80
Singapore
Asia (excluding Singapore)
North America
Europe
Others (including shareholders worldwide with shareholdings below the threshold of the analysis)
65%15%
6%2%
12%
86 87SINGAPORE TECHNOLOGIES ENGINEERING LTD Annual Report 2012Making an impact

awARds & cOMMendAtIOns
leAdership Best chief executive officer (for companies with $1b and above in market capitalisation), Singapore Corporate Awards 2012 – Tan Pheng Hock, President & CEO, ST Engineering
quAlity & product excellence ies prestigious engineering Award 2012 by Institute of Engineers Singapore
– ST Electronics– ST Electronics (Info-Comm
Systems)
land transport excellence Awards 2012 by Land Transport Authority
– ST Electronics
cisco gold certified partner – ST Electronics (Info-Comm
Systems) ces innovations 2012 design and engineering Awards by Consumer Electronics Association
– ST Electronics (Info-Security)
top 50 products of china construction machinery Award by Chinese trade magazine, Construction Equipment & Maintenance
– ST Kinetics’ TRXBUILD SPSE90 Multi-Functional Paver and TRXBUILD JY645-GD Electric Hydraulic Steel Grabbing Machine
graphical system design Achievement Awards (industry segment) by National Instruments
– ST Kinetics for its Gate Flow RF Signal Processing for COMINT
eco-technology of the year Award at Air transport world eco-Aviation Awards
– EcoServices for its EcoPower® engine wash
sAfety & heAlth energy efficiency national partnership Awards (Best practices - honourable mention) by National Environment Agency, Energy Market Authority and the Economic Development Board
– ST Marine
safety and health Award recognition for projects (shArp) by Ministry of Manpower and Workplace Safety & Health Council
– ST Electronics
workplace safety & health innovation Award by Workplace Safety and Health Council (WSH Council)
– ST Marine
national safety and security watch group Award (cluster) by Singapore Police Force
– ST Aerospace– ST Marine– ST Aerospace Engineering– ST Aerospace Supplies– ST Aerospace Systems– ST Aerospace Engines– ST Aerospace Services Co.
workplace safety & health innovation Award (manufacturing) by Singapore Manufacturers’ Federation
Silver – ST Kinetics
Bronze – ST Aerospace Engineering
15th convention for wsh innovations in marine industry (gold & Bronze Awards) by Association of Singapore Marine Industries
– ST Marine
singapore heAlth Award 2012 by Singapore’s Health Promotion Board
Platinum Award – ST Electronics
Gold Award – ST Aerospace Engines– ST Aerospace Systems
Bronze Award – ST Aerospace Supplies
iso 14064-1:2006 green house gas certificate of Assurance by Lloyd’s Register Quality Assurance Limited
– ST Marine
corporAte citiZenshiphome team national service Awards 2012 by Ministry of Home Affairs, Singapore
Minister’s Honours Roll & The Minister For Home Affairs Award– ST Electronics (Satcom & Sensor
System)
Distinguished Home Team Partner Award – ST Kinetics– ST Aerospace Services
Meritorious Home Team Partner Award – ST Electronics (Info-Software
Systems)– Advanced Material Engineering
total defence Awards 2012 by Ministry of Defence, Singapore
Minister for Defence Award 2012 – ST Kinetics– ST Electronics (Info-Software
Systems)
Honorary Members of the League in 2012 – ST Electronics – ST Aerospace Systems
Total Defence Award (Employers): Distinguished Defence Partner Award (DDPA)– ST Marine– ST Aerospace Engines– ST Electronics (e-Services)– ST Electronics (Info-Comm
Systems)– ST Electronics (Info-Security)– ST Electronics (Training &
Simulation Systems)– STELCOMMS– STELOP
Total Defence Award (Civil Resource Owners): Distinguished Defence Partner Award (DDPA)– ST Aerospace Supplies– Advanced Material Engineering
– Allied Ordnance of Singapore – SDDA– Singapore Test Services – Unicorn International
Total Defence Award (Employers): Meritorious Defence Partner Award (MDPA)– ST Aerospace Services– ST Aerospace Supplies– ST Electronics (Data Centre
Solutions)– ST Electronics (Info-Software
Systems)
singapore sustainability Awards 2012 by Singapore Business Federation
Sustainable Business Award (Enterprise) – ST Kinetics
community chest shAre Award 2012
Platinum – ST Aerospace – ST Electronics – ST Kinetics – ST Aerospace Engineering – ST Aerospace Engines – ST Aerospace Services – ST Aerospace Systems – ST Electronics (Info-Software
Systems)– Advanced Material Engineering
Gold – ST Marine – ST Aerospace Supplies – ST Electronics (eServices)– ST Electronics (Info-Comm
Systems) – ST Electronics (Training &
Simulation Systems)– Singapore Test Services
Bronze – ST Electronics (Satcom & Sensor
System)
10-Year Outstanding Award – ST Aerospace – ST Marine – ST Aerospace Engineering – ST Aerospace Engines
15-Year Outstanding Award – ST Aerospace Systems
ntuc may day model partnership Award (individual category)
– ST Marine– ST Aerospace Systems
ntuc may day commendation (star)
– ST Aerospace
ntuc may day Awards 2012Medal of Commendation– Sew Chee Jhuen, President,
ST Kinetics
community in Bloom Awards 2012 by National Parks Board
Best Community Garden Award – ST Kinetics
Platinum Award (Organisations) – ST Kinetics
Gold Award (Organisations)– Ordnance Development and
Engineering Company of Singapore
Silver Award (Organisations) – ST Kinetics Integrated Engineering
Bronze Award (Organisations) – Allied Ordnance of Singapore– Applied Material Engineering – SDDA
Tan Pheng Hock, President & CEO, ST Engineering, receiving the Best Chief Executive Officer, Singapore Corporate Awards 2012
88 89SINGAPORE TECHNOLOGIES ENGINEERING LTD Annual Report 2012Making an impact

Contents
FInancIal REPORT
91 Directors' Report 104 Statement by Directors 105 Independent auditors’ Report
FInancIal STaTEmEnTS
106 consolidated Income Statement 107 consolidated Statement of comprehensive Income 108 Balance Sheets 110 Statements of changes in Equity 113 consolidated Statement of cash Flows
118 notes to the Financial Statements 225 SGX listing manual Requirements 226 Sectoral Financial Review
as at 31 December 2012(Currency - Singapore dollars unless otherwise stated)
directors' report
We, the undersigned directors, on behalf of all the directors of the Company, submit this annual report to the members together with the audited financial statements of the Group and of the Company for the financial year ended 31 December 2012.
Directors
The directors of the Company in office at the date of this report are as follows:
Peter Seah Lim Huat (Chairman)Tan Pheng Hock (President and Chief Executive Officer)Koh Beng SengLG Neo Kian HongChan Yeng Kit (Appointed on 1 December 2012)Quek Tong BoonQuek Poh HuatVenkatachalam KrishnakumarDavinder Singh s/o Amar SinghDr Stanley Lai Tze ChangKhoo Boon HuiKwa Chong Seng (Appointed on 1 September 2012)COL Alan Goh Kim Hua (Appointed on 14 December 2012 as Alternate Director to LG Neo Kian Hong)
Arrangements to enable directors to acquire shares or debentures
Except for the Singapore Technologies Engineering Share Option Plan (“ESOP”), Singapore Technologies Engineering Performance Share Plan (“PSP2000”), Singapore Technologies Engineering Performance Share Plan 2010 (“PSP2010”), Singapore Technologies Engineering Restricted Stock Plan (“RSP2000”) and Singapore Technologies Engineering Restricted Share Plan 2010 (“RSP2010”) (collectively the “ST Engineering Share Plans”), neither at the end of nor at any time during the financial year was the Company a party to any arrangement whose objects are, or one of whose objects is, to enable the directors of the Company to acquire benefits by means of the acquisition of shares in or debentures of the Company or any other body corporate.
Directors’ interests in shares or debentures
Except as disclosed in this report, no director who held office at the end of the financial year had interests in shares or debentures of the Company or of related corporations either at the beginning or at the end of the financial year or as at 21 January 2013.
91SInGaPORE TEchnOlOGIES EnGInEERInG lTD Annual Report 2012

directors' reportdirectors' reportas at 31 December 2012(Currency - Singapore dollars unless otherwise stated)
as at 31 December 2012(Currency - Singapore dollars unless otherwise stated)
Directors’ interests in shares or debentures (continued)
According to the register kept by the Company for the purposes of Section 164 of the Singapore Companies Act, Chapter 50, particulars of interests of directors who held office at the end of the financial year in shares or debentures in the Company and its related corporations were as follows:
Holdings in the name of the director, spouse or infant children
1 January 2012 or date of appointment
if later 31 December 2012
The CompanyOrdinary Shares
Peter Seah Lim Huat 494,108 526,025Tan Pheng Hock 2,092,629 2,699,717Koh Beng Seng 175,893 192,205Quek Poh Huat 1,104,184 1,125,637Venkatachalam Krishnakumar 134,656 156,309Davinder Singh s/o Amar Singh 25,138 40,537Dr Stanley Lai Tze Chang 24,471 45,240Kwa Chong Seng 500,000 500,000
Related CorporationsMapletree Commercial Trust Management Ltd.Unit holdings in Mapletree Commercial Trust
Venkatachalam Krishnakumar 100,000 100,000
Mapletree Industrial Trust Management LtdUnit holdings in Mapletree Industrial Trust
Venkatachalam Krishnakumar 8,000 8,000
Mapletree Logistics Trust Management Ltd.Unit holdings in Mapletree Logistics Trust
Quek Tong Boon 2,000 2,000Venkatachalam Krishnakumar – 2,500
Perpetual Securities
Venkatachalam Krishnakumar – 2,500
Directors’ interests in shares or debentures (continued)
Holdings in the name of the director, spouse or infant children
1 January 2012 ordate of appointment
if later 31 December 2012
Neptune Orient Lines LimitedOrdinary Shares
Kwa Chong Seng 400,000 400,000
S$400 million 4.25% Notes due 2017
Kwa Chong Seng $250,000 $250,000
Singapore Airlines LimitedOrdinary Shares
LG Neo Kian Hong 9,000 9,000Venkatachalam Krishnakumar 3,733 3,733
S$300 million 2.15% Bonds due 2015
Davinder Singh s/o Amar Singh $500,000 $500,000
Singapore Telecommunications LimitedOrdinary Shares
Peter Seah Lim Huat 3,040 3,040Tan Pheng Hock 3,350 3,350Koh Beng Seng 1,520 1,520LG Neo Kian Hong 8,030 8,030Quek Tong Boon 2,030 2,030Quek Poh Huat 35,210 35,210Venkatachalam Krishnakumar 34,000 34,000Davinder Singh s/o Amar Singh 1,800 1,800Khoo Boon Hui 3,087 3,087Kwa Chong Seng 26,466 26,466
SMRT Corporation LtdOrdinary Shares
Quek Tong Boon 4,000 4,000Quek Poh Huat 8,000 8,000
92 93Singapore TechnologieS engineering lTd Annual Report 2012Making an impact

Directors’ interests in shares or debentures (continued)
Holdings in the name of the director, spouse or infant children
1 January 2012 ordate of appointment
if later 31 December 2012
SP AusNetStapled Securities
Quek Poh Huat 256,000 256,000
StarHub LtdOrdinary Shares
Peter Seah Lim Huat 519,022 540,762Tan Pheng Hock 25,150 25,150Venkatachalam Krishnakumar 15,716 15,716
STATS ChipPAC Ltd.Ordinary Shares
Peter Seah Lim Huat 6,900 6,900
TeleChoice International LimitedOrdinary Shares
Peter Seah Lim Huat 50,000 50,000Tan Pheng Hock 30,000 30,000
Vertex Technology Fund (II) LtdOrdinary Shares
Koh Beng Seng 15 N.A.@
Davinder Singh s/o Amar Singh 500 N.A.@
Redeemable Preference Shares
Koh Beng Seng 15 N.A.@
Davinder Singh s/o Amar Singh 486 N.A.@
Directors’ interests in shares or debentures (continued)
1 January 2012 ordate of appointment
if later 31 December 2012Exercise
price Exercisable period$
The CompanyOptions to Subscribe for Ordinary Shares
Peter Seah Lim Huat 44,500 – 3.23 16.3.2008 to 15.3.201244,500 – 3.61 11.8.2008 to 10.8.2012
Tan Pheng Hock 175,000 – 2.29 8.2.2003 to 7.2.2012175,000 – 1.92 13.8.2003 to 12.8.2012200,000 200,000 1.79 7.2.2004 to 6.2.2013200,000 200,000 1.86 12.8.2004 to 11.8.2013200,000 200,000 2.09 10.2.2005 to 9.2.2014200,000 200,000 2.12 11.8.2005 to 10.8.2014200,000 200,000 2.37 8.2.2006 to 7.2.2015200,000 200,000 2.57 11.8.2006 to 10.8.2015200,000 200,000 3.01 10.2.2007 to 9.2.2016200,000 200,000 2.84 11.8.2007 to 10.8.2016200,000 200,000 3.23 16.3.2008 to 15.3.2017
Koh Beng Seng 27,500 – 3.23 16.3.2008 to 15.3.201227,500 – 3.61 11.8.2008 to 10.8.2012
Quek Poh Huat 33,000 – 3.23 16.3.2008 to 15.3.201233,000 – 3.61 11.8.2008 to 10.8.2012
Venkatachalam Krishnakumar 25,500 – 3.23 16.3.2008 to 15.3.201225,500 – 3.61 11.8.2008 to 10.8.2012
Related CorporationsSTATS ChipPAC Ltd.Options to Subscribe for Ordinary Shares
Peter Seah Lim Huat 70,000 70,000 1.99 6.8.2004 to 5.8.201335,000 35,000 1.91 17.2.2005 to 16.2.2014
directors' reportdirectors' reportas at 31 December 2012(Currency - Singapore dollars unless otherwise stated)
as at 31 December 2012(Currency - Singapore dollars unless otherwise stated)
94 95Singapore TechnologieS engineering lTd Annual Report 2012Making an impact

Directors’ interests in shares or debentures (continued)
Holdings in the name of the director, spouse or infant children
1 January 2012 ordate of appointment
if later 31 December 2012
The CompanyConditional Award of 250,000 shares under PSP2000for performance period 2009 to 2011
Tan Pheng Hock 0 to 425,000 #1 – #2
Conditional Award of 250,000 shares under PSP2000 for performance period 2010 to 2012
Tan Pheng Hock 0 to 425,000 #1 0 to 425,000 #1
Conditional Award of 250,000 shares under PSP2010 for performance period 2011 to 2013
Tan Pheng Hock 0 to 425,000 #1 0 to 425,000 #1
Conditional Award of 250,000 shares under PSP2010for performance period 2012 to 2014
Tan Pheng Hock – 0 to 425,000 #1
Unvested shares under RSP2000 arising fromrelease of Conditional Award of 96,000 shares forperformance period 2008 to 2009
Tan Pheng Hock 10,248 #3 –
Unvested shares under RSP2000 arising fromrelease of Conditional Award for performance period1 January 2009 to 31 December 2009
Peter Seah Lim Huat (30,500 shares) 6,517 #3 –Koh Beng Seng (15,500 shares) 3,312 #3 –Quek Poh Huat (18,500 shares) 3,953 #3 –Venkatachalam Krishnakumar (18,500 shares) 3,953 #3 –Davinder Singh s/o Amar Singh (14,500 shares) 3,099 #3 –Dr Stanley Lai Tze Chang (5,000 shares) 1,069 #3 –
Directors’ interests in shares or debentures (continued)
Holdings in the name of the director, spouse or infant children
1 January 2012 ordate of appointment
if later 31 December 2012
The CompanyUnvested shares under RSP2000 arising fromrelease of Conditional Award of 96,000 Shares for performance period 2009 to 2010
Tan Pheng Hock 37,296 #3 18,648 #3
Conditional Award of 96,000 Shares under RSP2000for performance period 2010 to 2011
Tan Pheng Hock 0 to 144,000 #4 – #5
Unvested shares under RSP2000 arising fromrelease of Conditional Award of 96,000 Shares for performance period 2010 to 2011
Tan Pheng Hock – 48,192 #3
Conditional Award of 96,000 Shares under RSP2010for performance period 2011 to 2012
Tan Pheng Hock 0 to 144,000 #4 0 to 144,000 #4
Conditional Award of 96,000 Shares under RSP2010for performance period 2012 to 2013
Tan Pheng Hock – 0 to 144,000 #4
Related CorporationsStarHub LtdUnvested Restricted Shares(Performance period from 01/01/2008 to 31/12/2009)
Peter Seah Lim Huat 2,740 #3 –
Unvested Restricted Shares(Performance period from 01/01/2009 to 31/12/2010)
Peter Seah Lim Huat 10,930 #3 5,330 #3
directors' reportdirectors' reportas at 31 December 2012(Currency - Singapore dollars unless otherwise stated)
as at 31 December 2012(Currency - Singapore dollars unless otherwise stated)
96 97Singapore TechnologieS engineering lTd Annual Report 2012Making an impact

Directors’ interests in shares or debentures (continued)
@ Dissolved on 13 January 2012.
#1 A minimum threshold performance over a 3-year period is required for any performance shares to be released and the actual number of performance shares to be released is capped at 170% of the conditional award.
#2 For this period, Mr Tan Pheng Hock was awarded 180,000 new shares respectively upon partial achievement of targets set. The balance of the conditional award covering the period from 2009 to 2011 has thus lapsed.
#3 Balance of unvested restricted shares to be released according to the stipulated vesting periods.
#4 A minimum threshold performance over a 2-year period is required for any restricted shares to be released. A specified number of restricted shares to be released will depend on the extent of achievement of all performance conditions and will be delivered in phases according to the stipulated vesting periods.
#5 For this period, Mr Tan Pheng Hock was awarded 96,384 new shares respectively upon partial achievement of targets set. The balance of the conditional award covering the period from 2010 to 2011 has thus lapsed.
There was no change in any of the above-mentioned directors’ interests in the Company between the end of the financial year and 21 January 2013 except for Mr Tan Pheng Hock, whose interest has increased to 2,899,717 shares.
Directors’ interests in contracts
Since the end of the previous financial year, no director has received or become entitled to receive a benefit (other than a benefit or any fixed salary of a full-time employee of the Company included in the aggregate amount of emoluments shown in the financial statements, or any emoluments received from related corporations and share options/awards granted pursuant to the ST Engineering Share Plans) by reason of a contract made by the Company or a related corporation with the director or with a firm of which the director is a member, or with a company in which the director has a substantial financial interest, except for professional fees paid to a firm of which a director is a member as shown in the financial statements.
Share Plans
The Executive Resource and Compensation Committee (“ERCC”) is responsible for administering the ST Engineering Share Plans.
The Committee members are Mr Peter Seah Lim Huat (Chairman), Mr Venkatachalam Krishnakumar, Dr Stanley Lai Tze Chang and Mr Kwa Chong Seng.
As at 31 December 2012, no options and conditional awards have been granted to controlling shareholders of the Company or associates of the Company and no employees have received 5% or more of the total options and conditional awards available under the Share Plans.
The aggregate number of new shares issued pursuant to the ESOP, RSP2000 and PSP2000 did not exceed 15% of the issued share capital of the Company and the aggregate number of new shares issued pursuant to the RSP2010 and PSP2010 did not exceed 8% of the issued share capital of the Company.
During the financial year, except as disclosed below, there were no options granted and no shares awarded by the Company to any person to take up unissued shares of the Company.
Share Plans (continued)
(a) ESOP
(i) The options granted under the ESOP are as follows:
Name of participant
Options grantedand accepted
during thefinancial yearunder review
Aggregate optionsgranted and
accepted sincecommencement
to end offinancial yearunder review
Aggregate optionsexercised/
lapsed sincecommencement
to end offinancial yearunder review
Aggregate optionsoutstanding as at end of
financial yearunder review
Directors of the Company
Peter Seah Lim Huat – 530,000 530,000 –Tan Pheng Hock – 2,602,500 802,500 1,800,000Koh Beng Seng – 204,000 204,000 –Quek Poh Huat – 375,000 375,000 –Venkatachalam Krishnakumar – 152,500 152,500 –
Non-Executive Directors of the Company and its subsidiaries (including former directors) – 5,405,566 5,405,566 –
Group Executives – 193,717,858 144,957,693 48,760,165
Parent Group Executives and others – 187,320 187,320 –
(ii) The options granted by the Company do not entitle the holders of the options, by virtue of such holdings, to any right to participate in any share issue of any other company.
(iii) During the financial year, ordinary shares in the Company were issued pursuant to the exercise of options to take up unissued shares of the Company.
(b) PSP2000 / PSP2010 (“PSP”)
The PSP is established with the objective of motivating senior management staff to strive for sustained long-term growth and performance in ST Engineering and its subsidiaries (“ST Engineering Group”). Awards of performance shares are granted conditional on performance targets set based on the ST Engineering Group corporate objectives.
Pursuant to the PSP, the ERCC has decided to grant awards on an annual basis, conditional on targets set for a performance period, currently prescribed to be a 3-year performance period. The performance shares will only be released to the recipient at the end of the performance qualifying period. A specified number of performance shares shall be released by the ERCC to the recipient and the actual number of performance shares will depend on the achievement of set targets over the respective performance period. A minimum threshold performance is required for any performance share to be released and the actual number of performance shares to be released is capped at 170% of the conditional award.
For the financial years from 2007 to 2009, the performance measures used in PSP grants under PSP2000 are Wealth Added and ST Engineering Group Total Shareholder Return (“TSR”) against MSCI Asia Pacific ex Japan Industrial Index (“MSCI Index”).
directors' reportdirectors' reportas at 31 December 2012(Currency - Singapore dollars unless otherwise stated)
as at 31 December 2012(Currency - Singapore dollars unless otherwise stated)
98 99Singapore TechnologieS engineering lTd Annual Report 2012Making an impact

Share Plans (continued)
(b) PSP2000 / PSP2010 (“PSP”) (continued)
In February 2010, the Committee reviewed the continued appropriateness of the two performance measures and decided to change the MSCI Index to a Defensive Stock Index, the constituents of which are selected “defensive stock” companies that have similar market risk as ST Engineering and are listed on Singapore Exchange Securities Trading Limited (“SGX”). Therefore, with effect from financial year 2010, the performance measures used in PSP grants are Wealth Added and ST Engineering Group TSR against Defensive Stock Index.
In addition to PSP performance targets being met, the ERCC decided that commencing with the PSP contingent awards for financial year 2009, the final award for PSP is conditional upon the performance targets for RSP that has the same end of performance period being met. Known as the plan trigger condition, this is to create alignment between senior management and other employees. As with PSP2009, the final award for PSP 2010 is therefore conditional on the performance targets for RSP 2011, which has the same end of performance period in December 2012, being met. As the performance targets for RSP 2011 have been made, PSP 2010 which has also met its performance targets will be released.
The awards granted under the PSP2000 / PSP2010 are as follows:
PSP2000
Name of participant
Conditionalawards granted
during thefinancial yearunder review
Awards releasedduring the
financial yearunder review
Aggregateconditional awards
granted sincecommencement
of PSP2000to end of
financial yearunder review
Aggregateawards
released sincecommencement
of PSP2000to end of
financial yearunder review
Aggregateconditional
awardsnot releasedas at end of
financial yearunder review
Director of the Company
Tan Pheng Hock – 180,000 0 to 4,195,000 742,575 0 to 425,000
Group Executives – 979,610 0 to 33,172,800 5,210,852 0 to 2,318,844
PSP2010
Name of participant
Conditionalawards granted
during thefinancial yearunder review
Awards releasedduring the
financial yearunder review
Aggregateconditional awards
granted sincecommencement
of PSP2010to end of
financial yearunder review
Aggregateawards
released sincecommencement
of PSP2010to end of
financial yearunder review
Aggregateconditional
awardsnot releasedas at end of
financial yearunder review
Director of the Company
Tan Pheng Hock 0 to 425,000 – 0 to 850,000 – 0 to 850,000
Group Executives 0 to 2,765,900 – 0 to 5,321,100 – 0 to 5,282,387
Share Plans (continued)
(c) RSP2000 / RSP2010 (“RSP”)
The RSP is established with the objective of motivating managers and above to strive for sustained long-term growth and superior performance in ST Engineering Group. It also aims to foster a share ownership culture among staff within the ST Engineering Group and to better align staff’s incentive scheme with shareholders’ interest.
Pursuant to the RSP, the ERCC has decided to grant awards on an annual basis, conditional on targets set for a performance period, currently prescribed to be a 2-year performance period. The actual number of restricted shares delivered will depend on the achievement of set targets over the respective performance period. This will be determined by the ERCC at the end of the qualifying performance period and released to the recipient over a 3-year vesting period in the ratio of 50%, 25% and 25% consecutively.
A minimum threshold performance is required for any restricted share to be released while the maximum number of restricted shares to be delivered is capped at 150% of the conditional award.
The medium-term stretched targets measured over a 2-year performance period are set based on ST Engineering Group corporate objectives. The performance measures used for the 2-year performance period are ST Engineering Group EVA Spread and EBITDA Margin.
Since 2011, except for Tan Pheng Hock, the awards granted under the ST Engineering RSP2010 to the Non-Executive Directors are outright shares with no performance and vesting conditions but with a Moratorium on selling. These shares will form up to 30% of their total compensation with the remaining 70% payable in cash.
The awards granted under the RSP2000 / RSP2010 are as follows:
RSP2000
Name of participant
Conditionalawards granted
during thefinancial yearunder review
Awardsreleased
during thefinancial yearunder review
Aggregateconditional
awardsgranted since
commencement of RSP2000
to end offinancial yearunder review
Aggregateawards
released sincecommencement
of RSP2000to end of
financial yearunder review
Aggregateawards not
released as at end of
financial year
Aggregateconditionalawards not
releasedas at end of
financial yearunder review
Directors of the Company
Peter Seah Lim Huat – 6,517 0 to 115,500 59,625 – –Tan Pheng Hock – 77,088 0 to 499,500 179,778 66,840 –Koh Beng Seng – 3,312 0 to 58,600 30,205 – –Quek Poh Huat – 3,953 0 to 69,800 35,909 – –Venkatachalam Krishnakumar – 3,953 0 to 71,000 37,109 – –Davinder Singh s/o Amar Singh – 3,099 0 to 54,800 28,237 – –Dr Stanley Lai Tze Chang – 1,069 0 to 31,700 22,540 – –
Non-Executive Directors of the Company and its subsidiaries – 40,504 0 to 812,050 408,663 – –
Group Executives – 6,279,914 0 to 38,301,713 13,409,166 4,917,906 –
directors' reportdirectors' reportas at 31 December 2012(Currency - Singapore dollars unless otherwise stated)
as at 31 December 2012(Currency - Singapore dollars unless otherwise stated)
100 101Singapore TechnologieS engineering lTd Annual Report 2012Making an impact

Share Plans (continued)
(c) RSP2000 / RSP2010 (“RSP”) (continued)
RSP2010
Name of participant
Conditionalawards granted
during thefinancial yearunder review
Awardsreleased
during thefinancial yearunder review
Aggregateconditional
awardsgranted since
commencement of RSP2010
to end offinancial yearunder review
Aggregateawards
released sincecommencement
of RSP2010to end of
financial yearunder review
Aggregateawards not
released as at end of
financial year
Aggregateconditionalawards not
releasedas at end of
financial yearunder review
Director of the Company
Peter Seah Lim Huat 25,400 25,400 25,400 25,400 – –Tan Pheng Hock 0 to 144,000 – 0 to 288,000 – – 0 to 288,000Koh Beng Seng 13,000 13,000 13,000 13,000 – –Quek Poh Huat 17,500 17,500 17,500 17,500 – –Venkatachalam Krishnakumar 17,700 17,700 17,700 17,700 – –Davinder Singh s/o Amar Singh 12,300 12,300 12,300 12,300 – –Dr Stanley Lai Tze Chang 19,700 19,700 19,700 19,700 – –
Non-Executive Directors of the Company and its subsidiaries 186,000 186,000 186,000 186,000 – –
Group Executives 0 to 7,024,468 102,618 0 to 18,494,429 277,568 214,950 0 to 16,811,628
Audit Committee
The Audit Committee comprises three independent non-executive directors, one of whom is also the Chairman of the Committee. The members of the Audit Committee at the date of this report are as follows:
Koh Beng Seng (Chairman)Venkatachalam KrishnakumarDr Stanley Lai Tze Chang
The Audit Committee carried out its functions in accordance with Section 201B(5) of the Singapore Companies Act, Chapter 50. The Audit Committee met during the year to review the scope of the internal audit functions and the scope of work of the statutory auditors, and the results arising therefrom, including their evaluation of the system of internal controls. The Audit Committee also reviewed the assistance given by the Company’s officers to the auditors. The consolidated financial statements of the Group and the financial statements of the Company were reviewed by the Audit Committee prior to their submission to the directors of the Company for adoption.
In addition, the Audit Committee has reviewed the requirements for approval and disclosure of interested person transactions, reviewed the procedures set up by the Group and the Company to identify and report and where necessary, seek approval for interested person transactions and, with the assistance of the internal auditors, reviewed interested person transactions.
The Audit Committee has recommended to the Board of Directors that the auditors, KPMG LLP, be nominated for re-appointment as auditors at the forthcoming Annual General Meeting of the Company.
Auditors
The Auditors, KPMG LLP, have indicated their willingness to accept re-appointment.
On behalf of the Board of Directors
Peter Seah Lim Huat Tan Pheng HockDirector Director
Singapore15 February 2013
directors' reportdirectors' reportas at 31 December 2012(Currency - Singapore dollars unless otherwise stated)
as at 31 December 2012(Currency - Singapore dollars unless otherwise stated)
102 103Singapore TechnologieS engineering lTd Annual Report 2012Making an impact

Independent auditors' reportStatement by dIRECTORSMembers of the Company Singapore Technologies Engineering Ltd
We, Peter Seah Lim Huat and Tan Pheng Hock, being directors of Singapore Technologies Engineering Ltd, do hereby state that, in the opinion of the Directors:
(a) the accompanying balance sheets, consolidated income statement, consolidated statement of comprehensive income, statements of changes in equity, and consolidated statement of cash flows together with notes thereto set out on pages 106 to 224 are drawn up so as to give a true and fair view of the state of affairs of the Company and of the Group as at 31 December 2012, and changes in equity of the Company and of the Group, the results of the business and cash flows of the Group for the year ended on that date; and
(b) at the date of this statement there are reasonable grounds to believe that the Company will be able to pay its debts as and when they fall due.
On behalf of the Board of Directors
Peter Seah Lim Huat Tan Pheng HockDirector Director
Singapore15 February 2013
Report on the financial statements
We have audited the accompanying financial statements of Singapore Technologies Engineering Ltd (the “Company”) and its subsidiaries (collectively the “Group”), which comprise the balance sheets of the Group and the Company as at 31 December 2012, the statements of changes in equity of the Group and the Company, the consolidated income statement, the consolidated statement of comprehensive income and the consolidated statement of cash flows of the Group for the year then ended, and a summary of significant accounting policies and other explanatory information, as set out on pages 106 to 224.
Management’s responsibility for the financial statements
Management is responsible for the preparation of financial statements that give a true and fair view in accordance with the provisions of the Singapore Companies’ Act, Chapter 50 (the “Act”) and Singapore Financial Reporting Standards, and for devising and maintaining a system of internal accounting controls sufficient to provide a reasonable assurance that assets are safeguarded against loss from unauthorised use or disposition; and transactions are properly authorised and that they are recorded as necessary to permit the preparation of true and fair profit and loss accounts and balance sheets and to maintain accountability of assets.
Auditors’ responsibility
Our responsibility is to express an opinion on these financial statements based on our audit. We conducted our audit in accordance with Singapore Standards on Auditing. Those standards require that we comply with ethical requirements and plan and perform the audit to obtain reasonable assurance about whether the financial statements are free from material misstatement.
An audit involves performing procedures to obtain audit evidence about the amounts and disclosures in the financial statements. The procedures selected depend on the auditor’s judgement, including the assessment of the risks of material misstatement of the financial statements, whether due to fraud or error. In making those risk assessments, the auditor considers internal control relevant to the entity’s preparation of the financial statements that give a true and fair view in order to design audit procedures that are appropriate in the circumstances, but not for the purpose of expressing an opinion on the effectiveness of the entity’s internal control. An audit also includes evaluating the appropriateness of accounting policies used and the reasonableness of accounting estimates made by management, as well as evaluating the overall presentation of the financial statements.
We believe that the audit evidence we have obtained is sufficient and appropriate to provide a basis for our audit opinion.
Opinion
In our opinion, the consolidated financial statements of the Group and the balance sheet and statement of changes in equity of the Company are properly drawn up in accordance with the provisions of the Act and Singapore Financial Reporting Standards to give a true and fair view of the state of affairs of the Group and of the Company as at 31 December 2012 and the changes in equity of the Group and of the Company, the results and cash flows of the Group for the year ended on that date.
Report on other legal and regulatory requirements
In our opinion, the accounting and other records required by the Act to be kept by the Company and by those subsidiaries incorporated in Singapore of which we are the auditors have been properly kept in accordance with the provisions of the Act.
KPMG LLPPublic Accountants and Certified Public Accountants
Singapore15 February 2013
104 105Singapore TechnologieS engineering lTd Annual Report 2012Making an impact
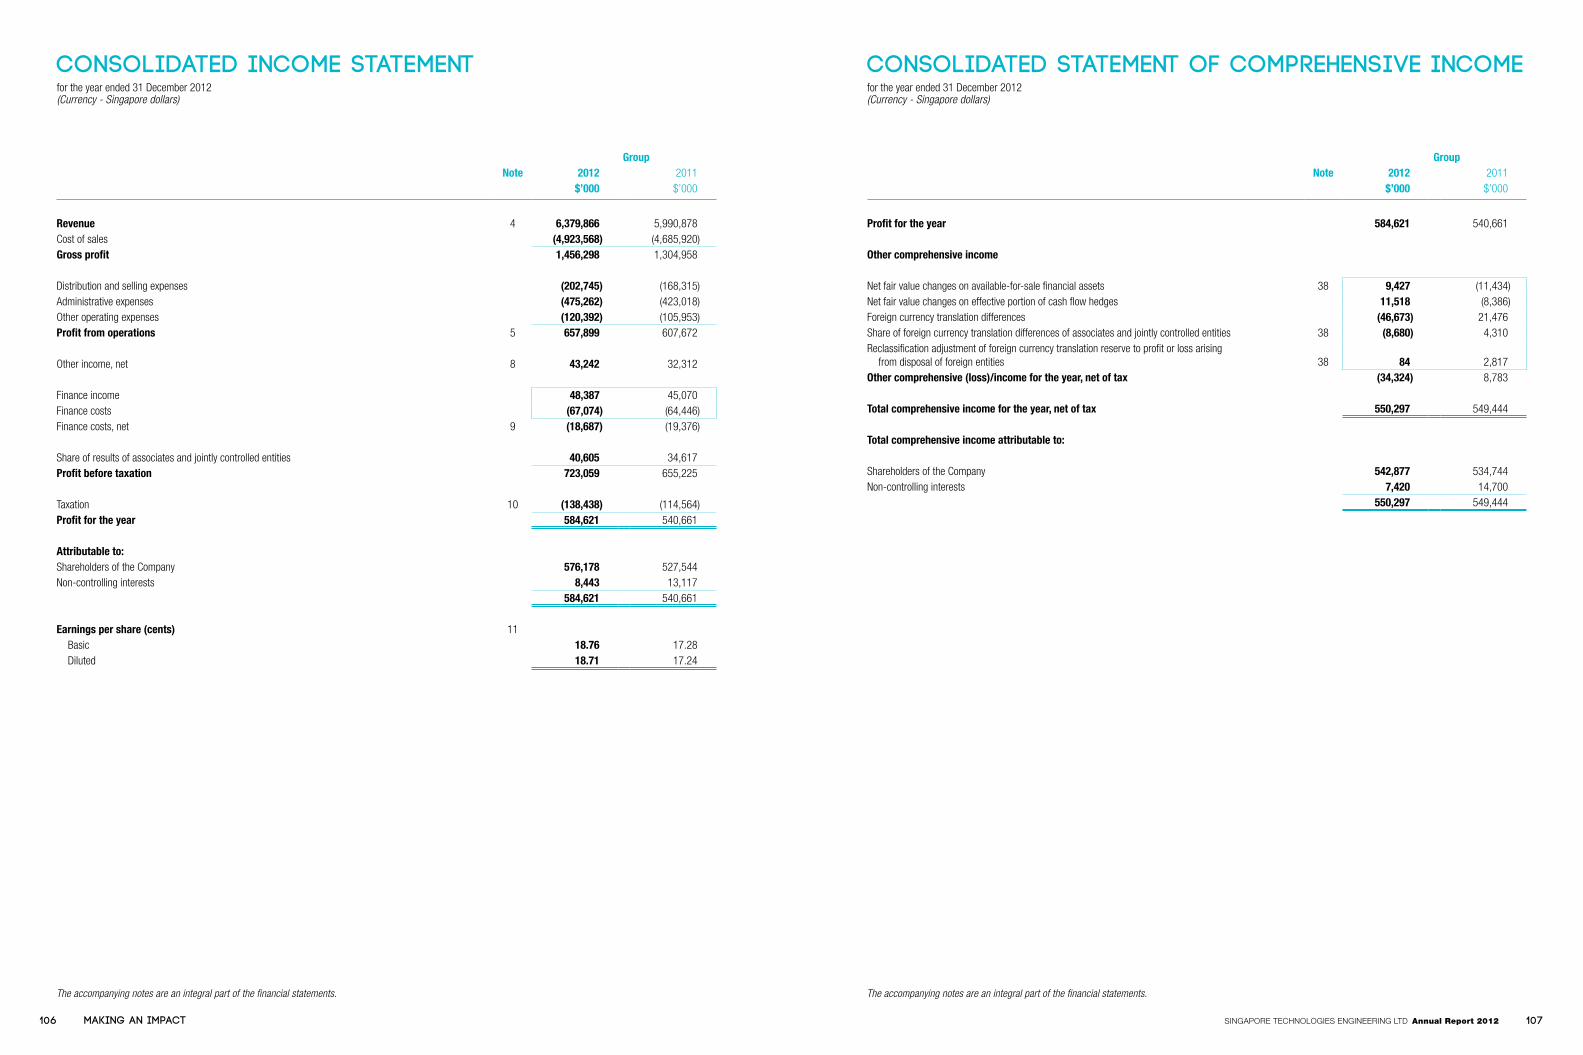
for the year ended 31 December 2012(Currency - Singapore dollars)
for the year ended 31 December 2012(Currency - Singapore dollars)
Consolidated Statement of Comprehensive IncomeConsolidated Income Statement
The accompanying notes are an integral part of the financial statements.The accompanying notes are an integral part of the financial statements.
GroupNote 2012 2011
$’000 $’000
Revenue 4 6,379,866 5,990,878Cost of sales (4,923,568) (4,685,920)Gross profit 1,456,298 1,304,958
Distribution and selling expenses (202,745) (168,315)Administrative expenses (475,262) (423,018)Other operating expenses (120,392) (105,953)Profit from operations 5 657,899 607,672
Other income, net 8 43,242 32,312
Finance income 48,387 45,070Finance costs (67,074) (64,446)Finance costs, net 9 (18,687) (19,376)
Share of results of associates and jointly controlled entities 40,605 34,617Profit before taxation 723,059 655,225
Taxation 10 (138,438) (114,564)Profit for the year 584,621 540,661
Attributable to:Shareholders of the Company 576,178 527,544Non-controlling interests 8,443 13,117
584,621 540,661
Earnings per share (cents) 11 Basic 18.76 17.28 Diluted 18.71 17.24
GroupNote 2012 2011
$’000 $’000
Profit for the year 584,621 540,661
Other comprehensive income
Net fair value changes on available-for-sale financial assets 38 9,427 (11,434)Net fair value changes on effective portion of cash flow hedges 11,518 (8,386)Foreign currency translation differences (46,673) 21,476Share of foreign currency translation differences of associates and jointly controlled entities 38 (8,680) 4,310Reclassification adjustment of foreign currency translation reserve to profit or loss arising
from disposal of foreign entities 38 84 2,817Other comprehensive (loss)/income for the year, net of tax (34,324) 8,783
Total comprehensive income for the year, net of tax 550,297 549,444
Total comprehensive income attributable to:
Shareholders of the Company 542,877 534,744Non-controlling interests 7,420 14,700
550,297 549,444
106 107Singapore TechnologieS engineering lTd Annual Report 2012Making an impact

Balance SheetsBalance Sheetsas at 31 December 2012(Currency - Singapore dollars)
as at 31 December 2012(Currency - Singapore dollars)
Group CompanyNote 2012 2011 2012 2011
$’000 $’000 $’000 $’000
ASSETS
Non-current assets
Property, plant and equipment 12 1,202,366 1,356,750 1,310 1,716Subsidiaries 13 – – 738,992 663,617Associates and jointly controlled entities 14 306,116 320,894 17,657 17,657Investments 15 344,996 11,611 – –Intangible assets 16 552,593 564,238 – –Investment property 17 10,239 1,509 – –Long-term receivables, non-current 18 24,057 38,255 – –Amounts due from related parties, non-current 23 7,232 7,330 364,192 214,446Finance lease receivables, non-current 19 10,379 14,482 – –Derivative financial instruments, non-current 45 28,173 12,033 16 –Deferred tax assets 20 110,288 113,167 570 –
2,596,439 2,440,269 1,122,737 897,436
Current assets
Inventories and work-in-progress 21 1,921,959 1,593,670 – –Trade receivables 22 1,158,582 1,187,503 – –Amounts due from related parties, current 23 23,928 37,332 415,088 683,600Advances and other receivables 24 530,551 340,070 3,956 4,653Long-term receivables, current 18 12,234 12,925 – 19Finance lease receivables, current 19 23,775 26,163 – –Short-term investments 25 25,364 402,799 – –Bank balances and other liquid funds 26 1,712,191 1,366,452 448,034 301,859Assets classified as held for sale 27 26,539 – – –
5,435,123 4,966,914 867,078 990,131
Total assets 8,031,562 7,407,183 1,989,815 1,887,567
EQUITY AND LIABILITIES
Current liabilities
Advance payments from customers, current 800,171 512,061 – –Trade payables and accruals 28 1,694,415 1,690,522 45,191 36,136Amounts due to related parties, current 29 19,953 29,340 44,854 269,076Provisions 30 224,137 214,747 – –Progress billings in excess of work-in-progress 21 761,201 656,163 – –Provision for taxation 179,690 168,241 4,134 3,954Short-term bank loans 31 89,158 204,084 – 17,541Lease obligations, current 31 232 2,934 – –Long-term bank loans, current 31 120,343 41 – –Other loans, current 31 1,054 758 – –
3,890,354 3,478,891 94,179 326,707
Net current assets 1,544,769 1,488,023 772,899 663,424
Group CompanyNote 2012 2011 2012 2011
$’000 $’000 $’000 $’000
Non-current liabilities
Advance payments from customers, non-current 917,572 759,004 – –Deferred income 32 31,448 26,695 – –Deferred tax liabilities 33 84,629 84,090 – 755Lease obligations, non-current 31 244 1,245 – –Long-term bank loans, non-current 31 459,001 507,774 – –Bonds 31 608,721 646,562 – –Other loans, non-current 31 677 856 – –Other long-term payables, non-current 34 2,000 2,500 – –Derivative financial instruments, non-current 45 21,373 23,094 – –Amounts due to related parties, non-current 29 2,961 364 495,625 227,321
2,128,626 2,052,184 495,625 228,076
Total liabilities 6,018,980 5,531,075 589,804 554,783
Net assets 2,012,582 1,876,108 1,400,011 1,332,784
Share capital and reserves
Share capital 35 781,841 723,411 781,841 723,411Capital reserves 37 116,323 116,323 – –Other reserves 38 (136,121) (106,552) 75,780 72,496Retained earnings 39 1,132,644 1,033,013 542,390 536,877Equity attributable to owners of the Company 1,894,687 1,766,195 1,400,011 1,332,784Non-controlling interests 117,895 109,913 – –
2,012,582 1,876,108 1,400,011 1,332,784
Total equity and liabilities 8,031,562 7,407,183 1,989,815 1,887,567
The accompanying notes are an integral part of the financial statements.
108 109Singapore TechnologieS engineering lTd Annual Report 2012Making an impact

Statements of Changes in Equityfor the year ended 31 December 2012(Currency - Singapore dollars)
NoteShare
capitalCapital
reservesOther
reservesRetainedearnings Total
Non-controllinginterests
Totalequity
$’000 $’000 $’000 $’000 $’000 $’000 $’000
The Group
At 1.1.2011 677,590 116,323 (123,180) 950,802 1,621,535 105,299 1,726,834
Total comprehensive income for the yearProfit for the year – – – 527,544 527,544 13,117 540,661
Other comprehensive incomeNet fair value changes on available-for-sale
financial assets 38 – – (11,434) – (11,434) – (11,434)Net fair value changes on effective portion of cash
flow hedges 38 – – (7,177) – (7,177) (1,209) (8,386)Foreign currency translation differences 38 – – 18,684 – 18,684 2,792 21,476Share of foreign currency translation differences of
associates and jointly controlled entities 38 – – 4,310 – 4,310 – 4,310Reclassification adjustment of foreign currency
translation reserve to profit or loss arising from disposal of foreign entities 38 – – 2,817 – 2,817 – 2,817
Other comprehensive income for the year, net of tax – – 7,200 – 7,200 1,583 8,783
Total comprehensive income for the year, net of tax – – 7,200 527,544 534,744 14,700 549,444
Transactions with owners of the Company, recognised directly in equity
Contributions by and distributions to owners of the Company
Issue of shares 45,821 – (10,656) – 35,165 – 35,165Capital contribution by non-controlling interests – – – – – 849 849Cost of share-based payment – – 16,475 – 16,475 91 16,566Dividends paid 40 – – – (444,176) (444,176) – (444,176)Dividends paid to non-controlling interests – – – – – (6,077) (6,077)Total contributions by and distributions to owners of
the Company 45,821 – 5,819 (444,176) (392,536) (5,137) (397,673)
Changes in ownership interests in subsidiaries
Acquisition of non-controlling interests in subsidiaries representing total changes in ownership interests in subsidiaries that do not result in a loss of control – – 2,429 – 2,429 (4,691) (2,262)
Disposal of a subsidiary – – 23 – 23 (258) (235)Total transactions with owners of the Company 45,821 – 8,271 (444,176) (390,084) (10,086) (400,170)Transfer from retained earnings to statutory reserve – – 1,157 (1,157) – – –At 31.12.2011 723,411 116,323 (106,552) 1,033,013 1,766,195 109,913 1,876,108
NoteShare
capitalCapital
reservesOther
reservesRetainedearnings Total
Non-controllinginterests
Totalequity
$’000 $’000 $’000 $’000 $’000 $’000 $’000
The Group
At 1.1.2012 723,411 116,323 (106,552) 1,033,013 1,766,195 109,913 1,876,108
Total comprehensive income for the yearProfit for the year – – – 576,178 576,178 8,443 584,621
Other comprehensive incomeNet fair value changes on available-for-sale
financial assets 38 – – 9,427 – 9,427 – 9,427Net fair value changes on effective portion of cash
flow hedges 38 – – 9,842 – 9,842 1,676 11,518Foreign currency translation differences 38 – – (43,974) – (43,974) (2,699) (46,673)Share of foreign currency translation differences of
associates and jointly controlled entities 38 – – (8,680) – (8,680) – (8,680)Reclassification adjustment of foreign currency
translation reserve to profit or loss arising from disposal of foreign entities 38 – – 84 – 84 – 84
Other comprehensive income for the year, net of tax – – (33,301) – (33,301) (1,023) (34,324)
Total comprehensive income for the year, net of tax – – (33,301) 576,178 542,877 7,420 550,297
Transactions with owners of the Company, recognised directly in equity
Contributions by and distributions to owners of the Company
Issue of shares 58,430 – (16,045) – 42,385 – 42,385Capital contribution by non-controlling interests – – – – – 3,259 3,259Cost of share-based payment – – 19,212 – 19,212 117 19,329Reduction of share capital of a subsidiary – – – – – (1,960) (1,960)Dividends paid 40 – – – (475,809) (475,809) – (475,809)Dividends paid to non-controlling interests – – – – – (14,061) (14,061)Total contributions by and distributions to owners of
the Company 58,430 – 3,167 (475,809) (414,212) (12,645) (426,857)
Changes in ownership interests in subsidiaries
Acquisition of non-controlling interests in subsidiaries representing total changes in ownership interests in subsidiaries that do not result in a loss of control – – (173) – (173) (1,362) (1,535)
Acquisition of subsidiaries with non-controlling interests – – – – – 14,569 14,569
Total transactions with owners of the Company 58,430 – 2,994 (475,809) (414,385) 562 (413,823)Transfer from retained earnings to statutory reserve – – 738 (738) – – –At 31.12.2012 781,841 116,323 (136,121) 1,132,644 1,894,687 117,895 2,012,582
Statements of Changes in Equityfor the year ended 31 December 2012(Currency - Singapore dollars)
110 111Singapore TechnologieS engineering lTd Annual Report 2012Making an impact
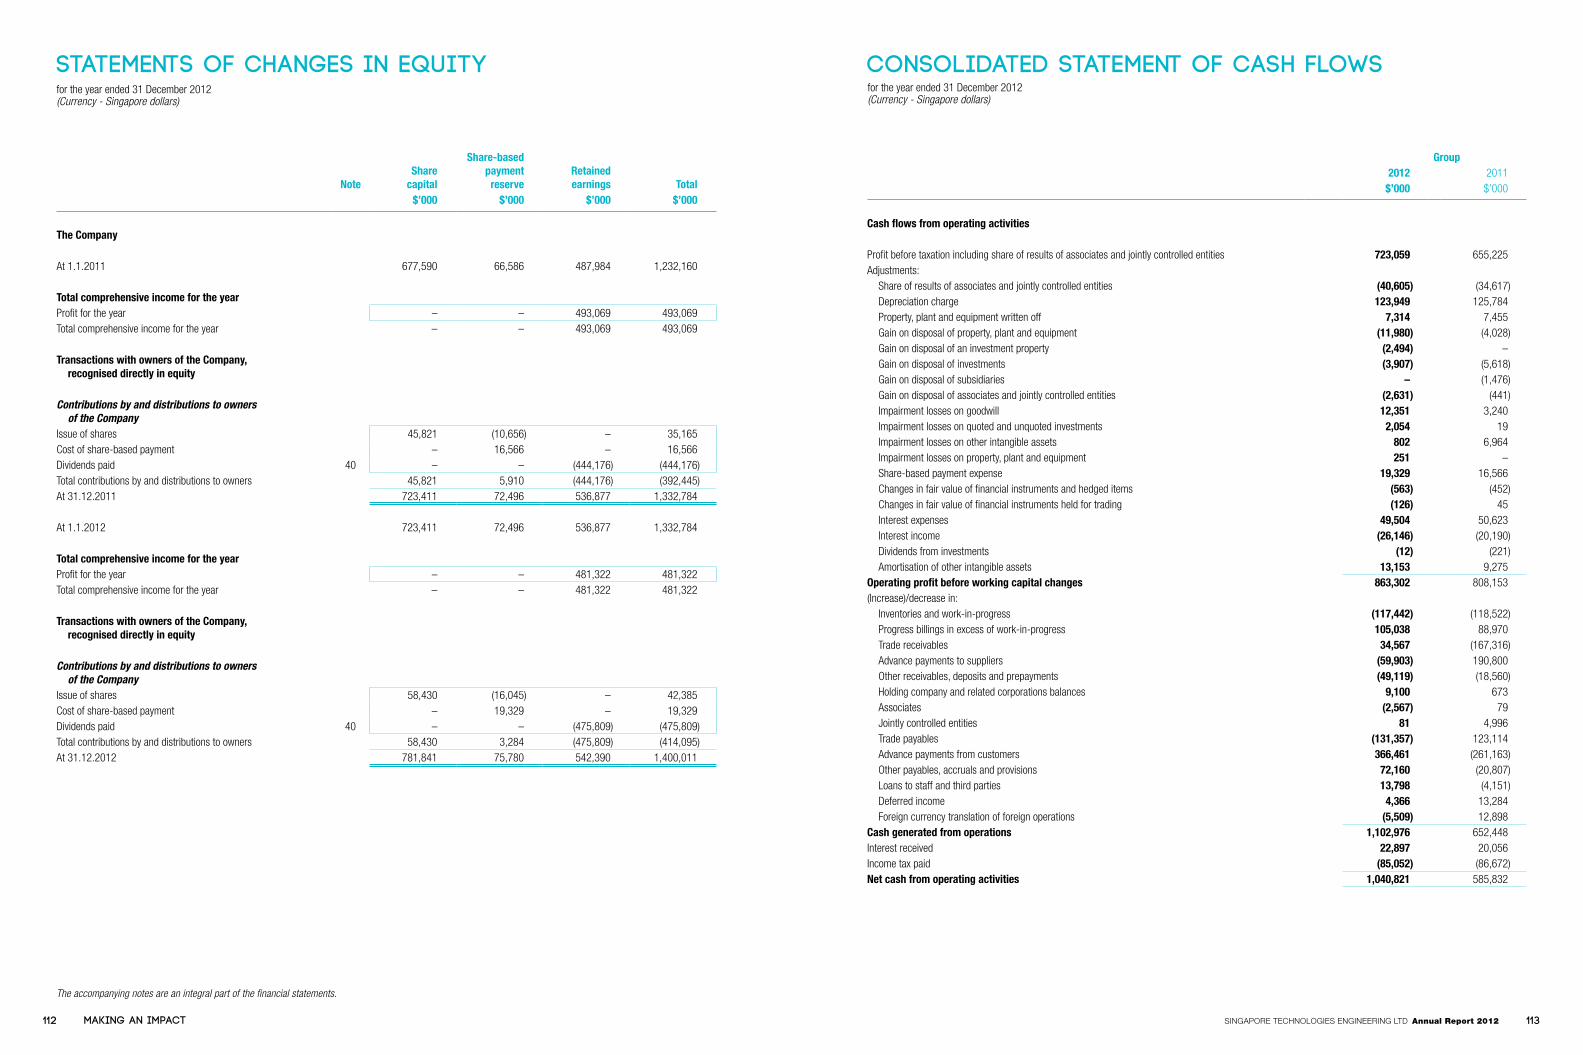
Statements of Changes in Equityfor the year ended 31 December 2012(Currency - Singapore dollars)
The accompanying notes are an integral part of the financial statements.
Consolidated Statement of Cash Flowsfor the year ended 31 December 2012(Currency - Singapore dollars)
NoteShare
capital
Share-basedpayment
reserveRetainedearnings Total
$’000 $’000 $’000 $’000
The Company
At 1.1.2011 677,590 66,586 487,984 1,232,160
Total comprehensive income for the yearProfit for the year – – 493,069 493,069Total comprehensive income for the year – – 493,069 493,069
Transactions with owners of the Company, recognised directly in equity
Contributions by and distributions to owners of the Company
Issue of shares 45,821 (10,656) – 35,165Cost of share-based payment – 16,566 – 16,566Dividends paid 40 – – (444,176) (444,176)Total contributions by and distributions to owners 45,821 5,910 (444,176) (392,445)At 31.12.2011 723,411 72,496 536,877 1,332,784
At 1.1.2012 723,411 72,496 536,877 1,332,784
Total comprehensive income for the yearProfit for the year – – 481,322 481,322Total comprehensive income for the year – – 481,322 481,322
Transactions with owners of the Company, recognised directly in equity
Contributions by and distributions to owners of the Company
Issue of shares 58,430 (16,045) – 42,385Cost of share-based payment – 19,329 – 19,329Dividends paid 40 – – (475,809) (475,809)Total contributions by and distributions to owners 58,430 3,284 (475,809) (414,095)At 31.12.2012 781,841 75,780 542,390 1,400,011
Group2012 2011
$’000 $’000
Cash flows from operating activities
Profit before taxation including share of results of associates and jointly controlled entities 723,059 655,225Adjustments: Share of results of associates and jointly controlled entities (40,605) (34,617) Depreciation charge 123,949 125,784 Property, plant and equipment written off 7,314 7,455 Gain on disposal of property, plant and equipment (11,980) (4,028) Gain on disposal of an investment property (2,494) – Gain on disposal of investments (3,907) (5,618) Gain on disposal of subsidiaries – (1,476) Gain on disposal of associates and jointly controlled entities (2,631) (441) Impairment losses on goodwill 12,351 3,240 Impairment losses on quoted and unquoted investments 2,054 19 Impairment losses on other intangible assets 802 6,964 Impairment losses on property, plant and equipment 251 – Share-based payment expense 19,329 16,566 Changes in fair value of financial instruments and hedged items (563) (452) Changes in fair value of financial instruments held for trading (126) 45 Interest expenses 49,504 50,623 Interest income (26,146) (20,190) Dividends from investments (12) (221) Amortisation of other intangible assets 13,153 9,275Operating profit before working capital changes 863,302 808,153(Increase)/decrease in: Inventories and work-in-progress (117,442) (118,522) Progress billings in excess of work-in-progress 105,038 88,970 Trade receivables 34,567 (167,316) Advance payments to suppliers (59,903) 190,800 Other receivables, deposits and prepayments (49,119) (18,560) Holding company and related corporations balances 9,100 673 Associates (2,567) 79 Jointly controlled entities 81 4,996 Trade payables (131,357) 123,114 Advance payments from customers 366,461 (261,163) Other payables, accruals and provisions 72,160 (20,807) Loans to staff and third parties 13,798 (4,151) Deferred income 4,366 13,284 Foreign currency translation of foreign operations (5,509) 12,898Cash generated from operations 1,102,976 652,448Interest received 22,897 20,056Income tax paid (85,052) (86,672)Net cash from operating activities 1,040,821 585,832
112 113Singapore TechnologieS engineering lTd Annual Report 2012Making an impact

Consolidated Statement of Cash Flowsfor the year ended 31 December 2012(Currency - Singapore dollars)
Consolidated Statement of Cash Flowsfor the year ended 31 December 2012(Currency - Singapore dollars)
GroupNote 2012 2011
$’000 $’000
Cash flows from investing activities
Proceeds from sale of property, plant and equipment 14,310 7,905Proceeds from sale of an investment property 3,908 –Proceeds from sale and maturity of investments 239,206 95,907Proceeds from disposal of subsidiaries 149 (528)Proceeds from disposal of associates 1,620 449Dividends from associates and jointly controlled entities 33,269 25,651Dividends from investments 12 221Purchase of property, plant and equipment (238,390) (199,283)Purchase of investments (197,207) (297,326)Capital reduction in an associate 5,560 –Investment in associates (735) (28,939)Investment in jointly controlled entities (2,996) (2,260)Acquisition of other intangible assets (2,935) (2,803)Acquisition of controlling interests in subsidiaries (28,457) (1,810)Reduction in cost of investment in a subsidiary – 5,733Net cash used in investing activities (172,686) (397,083)
Cash flows from financing activities
Capital contribution from non-controlling interests of subsidiaries 3,259 849Loan from non-controlling shareholders 329 615Repayment of loan to non-controlling shareholders – (1,731)Repayment of other loans (133) (230)Repayment of bank loans (97,440) (406,814)Repayment of lease obligations (3,471) (2,500)Proceeds from issue of shares 42,385 35,165Proceeds from other loans – 1,465Proceeds from bank loans 93,430 457,121Payment to non-controlling interest for reduction of share capital (1,960) –Acquisition of non-controlling interests in subsidiaries (1,198) (2,262)Dividends paid to shareholders of the Company (475,809) (444,176)Dividends paid to non-controlling interests (14,061) (6,077)Interest paid (50,125) (49,975)Deposits pledged (3,778) (7,463)Net cash used in financing activities (508,572) (426,013)
Net increase/(decrease) in cash and cash equivalents 359,563 (237,264)Cash and cash equivalents at beginning of the year 1,358,989 1,591,727Exchange difference on cash and cash equivalents at beginning of the year (17,602) 4,526Cash and cash equivalents at end of the year 26 1,700,950 1,358,989
Acquisition of controlling interests in subsidiaries in 2012
During the year, the Group acquired the following companies:
(i) On 1 April 2012, the Group acquired additional interest of 1% in a jointly controlled entity, SMART Systems Pte Ltd (“SMART”) for a cash consideration of $170,000.
As a result of the additional interest acquired, the Group increased its equity interest in SMART from 50% to 51%. The Group was deemed to have acquired control of SMART and accounted for the additional investment as a step-up acquisition of a subsidiary.
From the date of acquisition, SMART contributed revenue of $3.6 million and net profit of $1.5 million to the Group. If the acquisition had occurred on 1 January 2012, management estimates that the contributions to consolidated revenue and net profit would have been $4.1 million and $1.5 million respectively. In determining these amounts, management has assumed that the fair value adjustments that arose on the date of acquisition would have been the same if the acquisition had occurred on 1 January 2012.
(ii) On 17 May 2012, the Group acquired 50.1% of EcoServices, LLC (“EcoServices”) for a cash consideration of $24,820,000. EcoServices specialises in the provision of engine wash services.
From the date of acquisition, EcoServices contributed revenue of $17 million and net profit of $1.3 million to the Group. If the acquisition had occurred on 1 January 2012, management estimates that the contributions to consolidated revenue and net profit would have been $32 million and $2.3 million respectively. In determining these amounts, management has assumed that the fair value adjustments that arose on the date of acquisition would have been the same if the acquisition had occurred on 1 January 2012.
The final allocation of the purchase price to the identifiable assets acquired, liabilities and contingent liabilities assumed in the business combination is currently being determined and has not been completed. In the meantime, a provisional goodwill of $15.2 million, resulting from the difference between the purchase consideration and the adjusted carrying amounts of the assets acquired and liabilities assumed, is reported under “intangible assets”.
(iii) On 31 December 2012, the Group acquired 100% of Volant Aerospace, LLC (“Volant”) for a cash consideration of $22,094,000. Volant provides new and refurbished interior parts and support services, as well as aircraft interior configuration services.
If the acquisition had occurred on 1 January 2012, management estimates that the contributions to consolidated revenue and net profit would have been $27 million and $2 million respectively. In determining these amounts, management has assumed that the fair value adjustments that arose on the date of acquisition would have been the same if the acquisition had occurred on 1 January 2012.
The final allocation of the purchase price to the identifiable assets acquired, liabilities and contingent liabilities assumed in the business combination is currently being determined and has not been completed. In the meantime, a provisional goodwill of $7.4 million, resulting from the difference between the purchase consideration and the adjusted carrying amounts of the assets acquired and liabilities assumed, is reported under “intangible assets”.
114 115Singapore TechnologieS engineering lTd Annual Report 2012Making an impact

Consolidated Statement of Cash Flowsfor the year ended 31 December 2012(Currency - Singapore dollars)
Consolidated Statement of Cash Flowsfor the year ended 31 December 2012(Currency - Singapore dollars)
The accompanying notes are an integral part of the financial statements.
Acquisition of controlling interests in subsidiaries in 2012 (continued)
The acquisitions had the following effect on the Group’s assets and liabilities on acquisition dates:
Recognised onacquisition
Carryingamount before
acquisition$’000 $’000
Property, plant and equipment 12,052 12,052Intangible assets 19,250 –Inventories and work-in-progress 16,629 16,629Advances and other receivables 70,954 70,954Cash and cash equivalents 18,627 18,627
137,512 118,262
Trade payables and accruals (91,930) (91,930)Deferred income (387) (387)Deferred tax liabilities (1,149) –
(93,466) (92,317)
Net identifiable assets 44,046 25,945Less: Interest held by the Group – (2,329)Non-controlling interests (14,569) 23,616Net identifiable assets, after non-controlling interests 29,477Goodwill arising on consolidation 22,673Total purchase consideration 52,150
Cash outflow on acquisitions in 2012:Cost of acquisitions (47,084)Net cash acquired with the subsidiaries 18,627Net cash outflow on acquisition (28,457)
The Group incurred acquisition-related cost at $3.3 million related to external legal fees and due diligence costs. The legal fees and due diligence costs have been included in administrative expenses in the Group’s income statement.
The goodwill is attributable mainly to the synergies expected to be achieved from integrating the new capabilities of the acquired entities into the Group’s existing business.
Acquisition of controlling interests in subsidiaries in 2011
In prior year, the Group acquired 100% of the equity interests of DRB Aviation Consultants, Inc. for a consideration of $1,835,000.
Following the completion of the final purchase price allocation during the financial year, the Group made adjustments to the provisional fair value originally recorded in the prior year.
The effect of the adjustments made during the 12-month period from acquisition date (the “Window Period”) is set out below:
Fair valuesrecognised
on acquisition(provisional)
2011
Adjustmentsduring Window
Period2012
Fair valuesrecognised
on acquisition(final)2012
$’000 $’000 $‘000
Property, plant and equipment 6 – 6Intangible assets 896 (702) 194Inventories and work-in-progress 26 – 26Advances and other receivables 693 (152) 541Cash and cash equivalents 25 – 25
1,646 (854) 792
Trade payables and accruals (596) (5) (601)
Net identifiable assets/(liabilities) 1,050 (859) 191Goodwill arising on consolidation 785 899 1,684Total purchase consideration 1,835 40 1,875
Cash outflow on acquisitionCost of acquisition (1,835) (40) (1,875)Net cash acquired with the subsidiary 25 – 25Net cash outflow on acquisition (1,810) (40) (1,850)
Purchase price adjustments, which are non-cash in nature, made during the Window Period have not been applied retrospectively as these adjustments, which relate mainly to balance sheet effects and certain consequential income statement effects, are immaterial to the Group.
116 117Singapore TechnologieS engineering lTd Annual Report 2012Making an impact

Notes to the Financial Statements31 December 2012(Currency - Singapore dollars unless otherwise stated)
Notes to the Financial Statements31 December 2012(Currency - Singapore dollars unless otherwise stated)
These notes form an integral part of and should be read in conjunction with the accompanying financial statements.
1. General
The Company is a public limited company domiciled and incorporated in Singapore. The address of the Company’s registered office and principal place of business is 51 Cuppage Road #09-08, Singapore 229469.
The Company’s immediate and ultimate holding company is Temasek Holdings (Private) Limited, a company incorporated in Singapore.
The principal activities of the Company are those of an investment holding company and the provision of engineering and related services. The principal activities of the subsidiaries are set out in Note 13 to the financial statements.
The financial statements of Singapore Technologies Engineering Ltd and the consolidated financial statements of Singapore Technologies Engineering Ltd and its subsidiaries (collectively referred to as the “Group”) as at 31 December 2012 and for the year then ended were authorised and approved by the Board of Directors for issuance on 15 February 2013.
2. Basis of financial statements preparation
The financial statements are prepared in accordance with Singapore Financial Reporting Standards (“FRS”).
The financial statements have been prepared on the historical cost convention, except as disclosed in the accounting policies below.
The financial statements are presented in Singapore dollars and all values are rounded to the nearest thousand ($’000) except when otherwise indicated.
Except for changes in accounting policies discussed in Note 3.20, the accounting policies set out below have been consistently applied by the Company and the Group and are consistent with those used in the previous year.
3. Summary of significant accounting policies
3.1 Basis of consolidation
(i) Business combinations
Business combinations are accounted for using the acquisition method in accordance with FRS 103 Business Combination as at the acquisition date, which is the date on which control is transferred to the Group. Control is the power to govern the financial and operating policies of an entity so as to obtain benefits from its activities. In assessing control, the Group takes into consideration potential voting rights that are currently exercisable.
The consideration transferred does not include amounts related to the settlement of pre-existing relationships. Such amounts are generally recognised in profit or loss.
Costs related to the acquisition, other than those associated with the issue of debt or equity securities, that the Group incurs in connection with a business combination are expensed as incurred.
Any contingent consideration payable is recognised at fair value at the acquisition date. If the contingent consideration is classified as equity, it is not re-measured and settlement is accounted for within equity. Otherwise, any subsequent changes to the fair value of the contingent consideration are recognised in profit or loss.
3. Summary of significant accounting policies (continued)
3.1 Basis of consolidation (continued)
(ii) Subsidiaries
Subsidiaries are entities controlled by the Group. The financial statements of subsidiaries are included in the consolidated financial statements from the date that control commences until the date that control ceases.
Consistent accounting policies are applied to like transactions and events in similar circumstances. Losses applicable to the non-controlling interests in a subsidiary are allocated to the non-controlling interests even if doing so causes the non-controlling interests to have a deficit balance.
In the Company’s separate financial statements, investments in subsidiaries are accounted for at cost less accumulated impairment losses.
(iii) Acquisitions of entities under amalgamation
The Company’s interests in Singapore Technologies Aerospace Ltd, Singapore Technologies Electronics Limited, Singapore Technologies Kinetics Ltd, and Singapore Technologies Marine Ltd (collectively referred to as the “Scheme Companies”) resulted from the amalgamation of the Scheme Companies pursuant to a scheme of arrangement under Section 210 of the Companies Act, Chapter 50 in 1997.
As the amalgamation of the Scheme Companies constitutes a uniting of interests, the pooling of interests method has been adopted in the preparation of the consolidated financial statements in connection with the amalgamation.
Under the pooling of interests method, the combined assets, liabilities and reserves of the pooled enterprises are recorded at their existing carrying amounts at the date of amalgamation. The excess or deficiency of amount recorded as share capital issued (plus any additional consideration in the form of cash or other assets) over the amount recorded for the share capital acquired is recorded as merger reserve.
(iv) Loss of control
Upon the loss of control, the Group derecognises the assets and liabilities of the subsidiary, any non-controlling interests and the other components of equity related to the subsidiary. Any surplus or deficit arising on the loss of control is recognised in profit or loss. If the Group retains any interest in the previous subsidiary, then such interest is measured at fair value at the date that control is lost. Subsequently, it is accounted for as an equity-accounted investee or as an available-for-sale financial asset, depending on the level of influence retained.
118 119Singapore TechnologieS engineering lTd Annual Report 2012Making an impact

Notes to the Financial Statements31 December 2012(Currency - Singapore dollars unless otherwise stated)
Notes to the Financial Statements31 December 2012(Currency - Singapore dollars unless otherwise stated)
3. Summary of significant accounting policies (continued)
3.1 Basis of consolidation (continued)
(v) Investments in associates and jointly controlled entities (equity-accounted investees)
Associates are those entities in which the Group has significant influence, but not control, over the financial and operating policies. Significant influence is presumed to exist when the Group holds between 20% and 50% of the voting power of another entity. Jointly controlled entities are those entities over whose activities the Group has joint control, established by contractual agreement and requiring unanimous consent for strategic financial and operating decisions.
Investments in associates and jointly controlled entities are accounted for by the Group using the equity method and are recognised initially at cost.
The consolidated financial statements include the Group’s share of the profit or loss and other comprehensive income from the date that significant influence or joint control commences until the date that significant influence or joint control ceases.
When the Group’s share of losses exceeds its interest in an equity-accounted investee, the carrying amount of the investment, including any long-term interest, is reduced to zero, and the recognition of further losses is discontinued except to the extent that the Group has an obligation to fund the investee’s operations or has made payments on behalf of the investee.
In the Company’s separate financial statements, investments in associates and jointly controlled entities are accounted for at cost less accumulated impairment losses.
(vi) Acquisition of non-controlling interests
Acquisitions of non-controlling interests are accounted for as transactions with owners in their capacity as owners and therefore no goodwill is recognised as a result. Adjustments to non-controlling interests arising from transactions that do not involve the loss of control are based on a proportionate amount of the net assets of the subsidiary.
(vii) Transactions eliminated on consolidation
All significant inter-company balances and transactions are eliminated on consolidation.
3.2 Foreign currency
(i) Foreign currency transactions
Transactions in foreign currencies are translated to the respective functional currencies of the Company and its subsidiaries and are recorded on initial recognition in the functional currencies at exchange rates approximating those ruling at the transaction dates. The major functional currencies of the Group entities are Singapore dollar, United States dollar and Euro. Monetary assets and liabilities denominated in foreign currencies are translated at the closing rate of exchange ruling at the balance sheet date.
Non-monetary items in a foreign currency that are measured in terms of historical cost are translated using the exchange rates as at the date of the transactions. Non-monetary items measured at fair value in a foreign currency are translated using the exchange rates at the date when the fair value was determined.
Monetary item carried at amortised cost in the functional currency at the beginning of the year, adjusted for effective interest and payments during the year, and the amortised cost in foreign currency are translated at the exchange rate at the end of the year.
3. Summary of significant accounting policies (continued)
3.2 Foreign currency (continued)
(i) Foreign currency transactions (continued)
Foreign currency differences arising on retranslation are recognised in profit or loss, except for differences arising on the retranslation of available-for-sale equity instruments, a financial liability designated as a hedge of the net investment in a foreign operation to the extent that the hedge is effective (see note 3.3(iii) below), or qualifying cash flow hedges to the extent the hedge is effective, which are recognised in other comprehensive income.
(ii) Foreign operations
The assets and liabilities of foreign operations, including goodwill and fair value adjustments arising on acquisition, are translated to Singapore dollars at exchange rates at the reporting date. The income and expenses of foreign operations are translated to Singapore dollars using the exchange rates at the date of the transactions.
Foreign currency differences are recognised in other comprehensive income and presented in the foreign currency translation reserve in equity. However, if the foreign operation is a non wholly-owned subsidiary, then the relevant proportionate share of the translation difference is allocated to the non-controlling interests. When a foreign operation is disposed of such that control, significant influence or joint control is lost, the cumulative amount in the foreign currency translation reserve related to that foreign operation is reclassified to profit or loss as part of the gain or loss on disposal. When the Group disposes of only part of its interest in a subsidiary that includes a foreign operation while retaining control, the relevant proportion of the cumulative amount is re-attributed to non-controlling interests. When the Group disposes of only part of its investment in an associate or jointly controlled entity that includes a foreign operation while retaining significant influence or joint control, the relevant proportion of the cumulative amount is reclassified to profit or loss.
When the settlement of a monetary item receivable from or payable to a foreign operation is neither planned nor likely to occur in the foreseeable future, foreign exchange gains or losses arising from such a monetary item are considered to form part of a net investment in a foreign operation and are recognised in other comprehensive income, and presented in the foreign currency translation reserve in equity.
3.3 Financial instruments
(i) Non-derivative financial assets
Financial assets are recognised on the balance sheet when, and only when, the Group becomes a party to the contractual provisions of the financial instrument. All regular way purchases and sales of financial assets are recognised on the trade date, i.e., the date that the Group commits to purchase or sell the asset. Regular way purchases or sales are purchases or sales of financial assets that require delivery of assets within the period generally established by regulation or convention in the marketplace concerned.
The Group derecognises a financial asset when the contractual rights to the cash flows from the asset expire, or it transfers the rights to receive the contractual cash flows on the financial asset in a transaction in which substantially all the risks and rewards of ownership of the financial asset are transferred. Any interest in transferred financial assets that is created or retained by the Group is recognised as a separate asset or liability.
Financial assets and liabilities are offset and the net amount presented in the balance sheet when, and only when, the Group has a legal right to offset the amounts and intends either to settle on a net basis or to realise the asset and settle the liability simultaneously.
The Group classifies non-derivative financial assets into the following categories: financial assets at fair value through profit or loss, loans and receivables, held-to-maturity financial assets and available-for-sale financial assets. The Group determines the classification of its financial assets after initial recognition and, where allowed and appropriate, re-evaluates this designation at each financial year-end.
120 121Singapore TechnologieS engineering lTd Annual Report 2012Making an impact

Notes to the Financial Statements31 December 2012(Currency - Singapore dollars unless otherwise stated)
Notes to the Financial Statements31 December 2012(Currency - Singapore dollars unless otherwise stated)
3. Summary of significant accounting policies (continued)
3.3 Financial instruments (continued)
(i) Non-derivative financial assets (continued)
Financial assets at fair value through profit or loss
Financial assets held for trading are classified as financial assets at fair value through profit or loss. Financial assets held for trading are financial assets acquired principally for the purpose of selling in the near term. Financial assets at fair value through profit or loss are measured at fair value and gains or losses arising from change in the fair values are recognised in profit or loss. Attributable transaction costs are recognised in profit or loss as incurred.
Loans and receivables
Loans and receivables are financial assets with fixed or determinable payments that are not quoted in an active market. Such assets are recognised initially at fair value plus any directly attributable transaction costs. Subsequent to initial recognition, loans and receivables are measured at amortised cost using the effective interest method, less any impairment losses. Gains or losses are recognised in profit or loss when the loans and receivables are derecognised or impaired, as well as through the amortisation process.
Loans and receivables comprise cash and cash equivalents, and trade and other receivables (including finance lease receivables and amounts due from related parties). Cash consists of cash on hand and cash with banks or financial institutions, including fixed deposits. Cash equivalents are short-term and highly liquid investments that are readily convertible to known amounts of cash and that are subject to insignificant risk of changes in value. For the purpose of the statement of cash flows, cash and cash equivalents also include bank overdrafts that are repayable on demand and form an integral part of the Group’s cash management.
Held-to-maturity financial assets
Financial assets with fixed or determinable payments and fixed maturity are classified as held-to-maturity when the Group has the positive intention and ability to hold the financial assets to maturity. Held-to-maturity financial assets are recognised initially at fair value plus any directly attributable transaction costs. Subsequent to initial recognition, held-to-maturity financial assets are measured at amortised cost using the effective interest method, less any impairment losses. Gains or losses are recognised in the income statement when the held-to-maturity investments are derecognised or impaired, and through the amortisation process. Any sale or reclassification of a more than insignificant amount of held-to-maturity investments not close to their maturity or occurs before the principal amounts are substantially recovered or not attributable to non-recurring isolated events beyond the Group’s control and anticipation would result in the reclassification of all held-to-maturity investments as available for sale. It would also prevent the Group from classifying investment securities as held-to-maturity for the current and the following two financial years.
Available-for-sale financial assets
Available-for-sale financial assets are those financial assets that are designated as available-for-sale or are not classified in any of the three preceding categories. Available-for-sale financial assets are recognised initially at fair value plus any directly attributable transaction costs. After initial recognition, the changes in fair value are recognised in other comprehensive income and presented in the fair value reserve in equity, except for impairment losses and foreign exchange differences on available-for-sale debt instruments, until the financial asset is derecognised. Upon derecognition, the cumulative gain or loss previously recognised in other comprehensive income is reclassified from equity to income statement as a reclassification adjustment.
The fair value of available-for-sale financial assets that are actively traded in organised financial markets is determined by reference to quoted market prices at the close of business on the balance sheet date. For those financial assets where there is no active market, fair value is determined using valuation techniques. Such techniques include using recent arm’s length market transactions; reference to the current market value of another instrument, which is substantially the same; discounted cash flow analysis and option pricing models.
3. Summary of significant accounting policies (continued)
3.3 Financial instruments (continued)
(i) Non-derivative financial assets (continued)
Available-for-sale financial assets (continued)
For those financial assets where there is no active market and where fair value cannot be reliably measured, they are measured at cost.
Available-for-sale financial assets comprise equity securities and bonds.
(ii) Non-derivative financial liabilities
Financial liabilities are recognised on the balance sheet when, and only when, the Group becomes a party to the contractual provisions of the financial instrument. The Group derecognises a financial liability when its contractual obligations are discharged, cancelled or expire.
Financial assets and liabilities are offset and the net amount presented in the balance sheets when, and only when, the Group has a legal right to offset the amounts and intends either to settle on a net basis or to realise the asset and settle the liability simultaneously.
Non-derivative financial liabilities are recognised initially at fair value plus directly attributable transaction costs. Subsequent to initial recognition, these financial liabilities are measured at amortised cost using the effective interest method.
The Group’s financial liabilities comprise bank overdrafts, trade and other payables (including lease obligations and amounts due to related parties), and borrowings.
Bank overdrafts that are repayable on demand and form an integral part of the Group’s cash and cash equivalents are included as a component of cash and cash equivalents for the purpose of the statement of cash flows.
(iii) Derivative financial instruments and hedge accounting
The Group uses derivative financial instruments such as forward currency contracts, interest rate swaps and cross currency swaps to hedge its risks associated with foreign currency and interest rate fluctuations. From time to time, the Group also uses monetary assets and liabilities and embedded derivatives as hedging instruments to hedge its risks associated with foreign currency fluctuations.
Embedded derivatives are separated from the host contract and accounted for separately if the economic characteristics and risks of the host contract and the embedded derivatives are not closely related, a separate instrument with the same terms as the embedded derivatives would meet the definition of a derivative, and the combined instrument is not measured at fair value through profit or loss.
On initial designation of the derivative as the hedging instrument, the Group formally documents the hedge relationship to which the Group wishes to apply hedge accounting and the risk management objective and strategy for undertaking the hedge. The documentation includes identification of the hedging instrument, the hedged item or transaction, the nature of the risk being hedged and the methods used in assessing the hedging instrument’s effectiveness in offsetting the exposure to changes in the hedged item’s fair value or cash flows attributable to the hedged risk. The Group makes an assessment, both at the inception of the hedge relationship as well as on an ongoing basis, of whether the hedging instruments are expected to be “highly effective” in offsetting the changes in the fair value or cash flows of the respective hedged items attributable to the hedged risk, and whether the actual results of each hedge are within a range of 80% to 125%. For a cash flow hedge of a forecast transaction, the transaction should be highly probable to occur and should present an exposure to variations in cash flows that could ultimately affect profit or loss.
122 123Singapore TechnologieS engineering lTd Annual Report 2012Making an impact

Notes to the Financial Statements31 December 2012(Currency - Singapore dollars unless otherwise stated)
Notes to the Financial Statements31 December 2012(Currency - Singapore dollars unless otherwise stated)
3. Summary of significant accounting policies (continued)
3.3 Financial instruments (continued)
(iii) Derivative financial instruments and hedge accounting (continued)
Derivative financial instruments are initially recognised at fair value on the date on which a derivative contract is entered into. Attributable transaction costs are recognised in profit or loss as incurred. Derivatives are carried as assets when the fair value is positive and as liabilities when the fair value is negative. Subsequent to initial recognition, derivatives are measured at fair value, and changes therein are accounted for as described below.
Fair value hedges
The gain or loss from re-measuring the hedging instrument at fair value (for a derivative hedging instrument) or the foreign currency component of its carrying amount measured in accordance with Note 3.2(i) (for a non-derivative hedging instrument) is recognised in profit or loss. The gain or loss on the hedged item attributable to the hedged risk is recognised in profit or loss.
When an unrecognised firm commitment is designated as a hedged item, the subsequent cumulative change in the fair value of the firm commitment attributable to the hedged risk is recognised as an asset or liability with a corresponding gain or loss recognised in profit or loss. The changes in the fair value of the hedging instrument are also recognised in profit or loss.
The Group discontinues fair value hedge accounting if the hedging instrument expires or is sold, terminated or exercised, the hedge no longer meets the criteria for hedge accounting or the Group revokes the designation. Any adjustment to the carrying amount of a hedging instrument for which the effective interest method is used is amortised in the income statement. Amortisation may begin as soon as an adjustment exists and shall begin no later than when the hedged item ceases to be adjusted for changes in its fair value attributable to the risk being hedged.
Cash flow hedges
The portion of the gain or loss on a derivative designated as the hedging instrument that is determined to be an effective hedge is recognised in other comprehensive income and presented in the fair value reserve in equity, while the ineffective portion is recognised immediately in profit or loss.
Amounts taken to equity are transferred to profit or loss when the hedged transaction affects profit or loss, such as when hedged financial income or financial expense is recognised, or when a forecast sale or purchase occurs. When the hedged item is a non-financial asset or liability, the amounts taken to equity are transferred to the initial carrying amount of the non-financial asset or liability.
If the forecast transaction is no longer expected to occur, amounts previously recognised in equity are transferred to profit or loss. If the hedging instrument expires or is sold, terminated, or exercised without replacement or rollover, or if its designation as a hedge is revoked, amounts previously recognised in equity remain in equity until the forecast transaction occurs. If the related transaction is not expected to occur, the amount is then transferred to profit or loss.
Hedge of net investment in foreign operations
The Group has foreign currency differences arising from the translation of financial liabilities that are designated as net investment hedges of foreign operations. These hedging instruments are accounted for similarly to cash flow hedges. The currency translation differences on the financial liabilities relating to the effective portion of the hedge are recognised in other comprehensive income and presented in the foreign currency translation reserve in equity, while the ineffective portion of the hedge are recognised immediately in profit or loss. On the disposal or partial disposal of the foreign operation, the amounts previously recognised in equity are transferred to profit or loss as part of the gain or loss on disposal.
3. Summary of significant accounting policies (continued)
3.3 Financial instruments (continued)
(iii) Derivative financial instruments and hedge accounting (continued)
Separable embedded derivatives and other derivatives
Any gains or losses arising from changes in fair value on derivatives that are not designated in hedging relationships are recognised immediately in profit or loss.
(iv) Intra-group financial guarantees in the separate financial statements
Financial guarantees are financial instruments issued by the Company that require the issuer to make specified payments to reimburse the holder for the loss it incurs because a specified debtor fails to meet payment when due in accordance with the original or modified terms of a debt instrument.
Financial guarantees are recognised initially at fair value and are classified as financial liabilities. Subsequent to initial measurement, the financial guarantees are stated at the higher of the initial fair value less cumulative amortisation and the amount that would be recognised if they were accounted for as contingent liabilities. When financial guarantees are terminated before their original expiry date, the carrying amount of the financial guarantee is transferred to profit or loss.
3.4 Property, plant and equipment and depreciation
(i) Recognition and measurement
All items of property, plant and equipment are initially recorded at cost. The cost of an item of property, plant and equipment is recognised as an asset if, and only if, it is probable that future economic benefits associated with the item will flow to the Group and the cost of the item can be measured reliably.
Cost includes expenditure that is directly attributable to the acquisition of the asset and capitalised borrowing costs. The cost of self-constructed assets also includes the cost of material and direct labour, any other costs directly attributable to bringing the assets to a working condition for their intended use and the costs of dismantling and removing the items and restoring the site on which they are located. Cost may also include transfers from equity of any gain or loss on qualifying cash flow hedges of foreign currency purchases of property, plant and equipment.
Significant components of individual assets are assessed and if a component has a useful life that is different from the remainder of that asset, that component is depreciated separately.
Subsequent to initial measurement, except for certain property, plant and equipment which were subject to a one-time revaluation in 1972 (“the 1972 assets”), property, plant and equipment are measured at cost, net of depreciation and any impairment losses. The 1972 assets stated at valuation are exempted from conducting a regular frequency of revaluation but are measured net of depreciation, and any impairment losses.
The gain or loss on disposal of an item of property, plant and equipment is determined by comparing the proceeds from disposal with the carrying amount of property, plant and equipment, and is recognised net within other income in profit or loss.
The cost of replacing a component of an item of property, plant and equipment is recognised in the carrying amount of the item if it is probable that the future economic benefits embodied within the component will flow to the Group, and its cost can be measured reliably. The carrying amount of the replaced component is derecognised.
124 125Singapore TechnologieS engineering lTd Annual Report 2012Making an impact

Notes to the Financial Statements31 December 2012(Currency - Singapore dollars unless otherwise stated)
Notes to the Financial Statements31 December 2012(Currency - Singapore dollars unless otherwise stated)
3. Summary of significant accounting policies (continued)
3.4 Property, plant and equipment and depreciation (continued)
(ii) Depreciation
Depreciation is based on the cost of an asset less its residual value.
Depreciation is recognised in profit or loss on a straight-line basis over the estimated useful lives of each component of an item of property, plant and equipment. Leased assets are depreciated over the shorter of the lease term and their useful lives unless it is reasonably certain that the Group will obtain ownership by the end of the lease term. Property, plant and equipment purchased specifically for projects are depreciated over the useful life of the class of property, plant and equipment or the duration of the project, whichever is shorter. Construction-in-progress is not depreciated until each stage of development is completed and becomes ready for use. Freehold land is not depreciated.
The estimated useful lives are as follows:
Buildings – 15 to 50 yearsLeasehold land – Over the period of the lease of between 15 to 50 yearsImprovements to premises – 3 to 30 yearsWharves and slipways – 20 yearsSyncrolift and floating docks – 15 yearsBoats and barges – 10 yearsPlant and machinery– Aerospace – 8 to 25 years– Electronics – 10 to 15 years– Land Systems – 5 to 15 years– Marine – 5 to 20 years– Others – 5 yearsProduction tools and equipment– Aerospace – 5 to 15 years– Electronics – 10 years– Others – 3 yearsFurniture, fittings, office equipment and computers – 2 to 5 yearsTransportation equipment and vehicles – 5 yearsAircraft and aircraft engines – 15 to 30 years
The residual value, useful life and depreciation method are reviewed at each financial year-end to ensure that the amount, method and period of depreciation are consistent with previous estimates and the expected pattern of consumption of the future economic benefits embodied in the items of property, plant and equipment. Changes in the expected useful life or the expected pattern of consumption of future economic benefits embodied in the asset is accounted for by changing the depreciation period or method, as appropriate, and treated as changes in accounting estimates.
3. Summary of significant accounting policies (continued)
3.5 Intangible assets
(i) Goodwill
Goodwill represents the excess of:• thefairvalueoftheconsiderationtransferred;plus• therecognisedamountofanynon-controllinginterestsintheacquiree;plus• ifthebusinesscombinationisachievedinstages,thefairvalueoftheexistingequityinterestintheacquiree,over the net recognised amount (generally fair value) of the identifiable assets acquired and liabilities assumed.
When the excess is negative, a bargain purchase gain is recognised immediately in profit or loss.
Goodwill is initially measured at cost. Following initial recognition, goodwill is measured at cost less any accumulated impairment losses. In respect of equity-accounted investees, the carrying amount of goodwill is included in the carrying amount of the investment, and an impairment loss on such an investment is not allocated to any asset, including goodwill, that forms part of the carrying amount of the equity-accounted investee.
(ii) Research and development expenditure
Research expenditure is recognised in profit or loss as and when incurred.
Development expenditure on an individual project is recognised as an intangible asset when the Group can demonstrate the technical feasibility of completing the development so that it will be available for use or sale, its intention to complete and its ability to use or sell the asset, how the asset will generate future economic benefits, the availability of resources to complete and the ability to measure reliably the expenditure during the development. The expenditure capitalised includes the cost of materials, direct labour, overhead costs that are directly attributable to preparing the asset for its intended use, and capitalised borrowing costs. In any other circumstances, development costs are recognised in profit or loss as incurred.
Development expenditure is measured at cost less accumulated amortisation and accumulated impairment losses.
(iii) Film cost inventory
Film cost inventory comprise film production costs which are recognised as an intangible asset when the Group can demonstrate the technical feasibility of completing the film so that it will be available for use or sale, its intention to complete and its ability to use or sell the film, how the film will generate future economic benefits, the availability of resources to complete and the ability to measure reliably the expenditure during the film production. Other film production costs are recognised in profit or loss as incurred.
Film cost inventory is measured at cost less accumulated amortisation and accumulated impairment losses.
(iv) Other intangible assets
Other intangible assets that are acquired by the Group are initially recognised at cost. The cost of intangible assets acquired in a business combination is its fair value as at the date of acquisition. Following initial recognition, intangible assets are carried at cost less any accumulated amortisation and any accumulated impairment losses.
(v) Subsequent expenditure
Subsequent expenditure is capitalised only when it increases the future economic benefits embodied in the specific asset to which it relates. All other expenditure, including expenditure on internally generated intangible assets, is recognised in profit or loss as incurred.
126 127Singapore TechnologieS engineering lTd Annual Report 2012Making an impact

Notes to the Financial Statements31 December 2012(Currency - Singapore dollars unless otherwise stated)
Notes to the Financial Statements31 December 2012(Currency - Singapore dollars unless otherwise stated)
3. Summary of significant accounting policies (continued)
3.5 Intangible assets (continued)
(vi) Amortisation
Amortisation is calculated based on the cost of the asset less its residual value.
Amortisation is recognised in profit or loss on a straight-line basis over the estimated useful lives of intangible assets, other than goodwill and film cost inventory, from the date that they are available for use.
Film cost inventory is amortised using the individual-film-forecast computation method which amortises the film costs in the same ratio that current gross revenue bear to anticipated total gross income for the film. Amortisation commences when each film begins to earn revenue.
The estimated useful lives are as follows:
Dealer network – 5 to 7 yearsDevelopment expenditure – 5 yearsCommercial and intellectual property rights – 2 to 16 yearsBrands– Aerospace – 5 years– Electronics – 20 years– Land Systems – 70 yearsFilm cost inventory – 20 years
The useful lives and amortisation methods are reviewed at the end of each financial year-end to ensure that the amount, method and period of amortisation are consistent with previous estimates and the expected pattern of consumption of the future economic benefits embodied in the intangible assets. Changes in the expected useful life or the expected pattern of consumption of future economic benefits embodied in the asset is accounted for by changing the amortisation period or method, as appropriate, and treated as changes in accounting estimates. The amortisation expense is recognised in the expense category consistent with the function of the intangible asset.
3.6 Investment property
Investment property is property held either to earn rental income or for capital appreciation or for both, but not for sale in the ordinary course of business, use in the production or supply of goods or services or for administrative purposes. Investment property is measured at cost, net of depreciation and any impairment loss. Cost includes expenditure that is directly attributable to the acquisition of the investment property. The cost of self-constructed investment property includes the cost of materials and direct labour, any other costs directly attributable to bringing the investment property to a working condition for their intended use and capitalised borrowing costs. Depreciation is recognised in profit or loss on a straight-line basis so as to write-off the cost of the investment property over its estimated useful life of 12 years.
Investment property is derecognised when either it has been disposed of or when the investment property is permanently withdrawn from use and no future economic benefit is expected from its disposal. Any gain or loss on the retirement or disposal of an investment property are recognised in profit or loss in the year of retirement or disposal.
Transfers are made to or from investment property only when there is a change in use. For a transfer from investment property to owner-occupied property, the carrying value at the date of change in use becomes the cost for subsequent accounting. For a transfer from owner-occupied property to investment property, the property is accounted for in accordance with the accounting policy for property, plant and equipment set out in Note 3.4 up to the date of change in use.
3. Summary of significant accounting policies (continued)
3.7 Inventories and work-in-progress
Inventories are measured at the lower of cost and net realisable value. Cost is calculated on a first-in, first-out basis or by weighted average cost depending on the nature and use of the inventories. Cost includes expenditure incurred in acquiring the inventories, production or conversion costs and other costs incurred in bringing them to their existing location and condition. Cost may also include transfers from equity of any gain or loss on qualifying cash flow hedges of foreign currency purchases of inventories. Allowance is made for deteriorated, damaged, obsolete and slow-moving inventories.
Net realisable value is the estimated selling price in the ordinary course of business, less estimated costs of completion and the estimated costs necessary to make the sale.
Work-in-progress is measured at cost plus profits recognised to date less progress billings and recognised losses. Cost includes all direct material and labour costs, equipment and sub-contracting services, together with appropriate overhead expenses and may also include transfers from equity of any gain or loss on qualifying cash flow hedges of foreign currency purchases of such services. Provision for foreseeable losses on uncompleted contracts is made in the year in which such losses are determined.
Work-in-progress is included in current assets in the balance sheet for all contracts in which costs incurred plus recognised profits exceed progress billings. If progress billings exceed costs incurred plus recognised profits, then the difference is presented as “progress billings in excess of work-in-progress” and is included in current liabilities in the balance sheet.
3.8 Impairment
(i) Non-derivative financial assets
The Group assesses at the end of each reporting period whether there is objective evidence that a financial asset not carried at fair value through profit or loss is impaired.
To determine whether there is objective evidence that financial assets (including equity securities) are impaired, the Group considers factors such as the probability of insolvency or significant financial difficulties of the debtor/issuer, default or significant delay in payments, significant adverse changes in the business environment where the debtor/issuer operates and disappearance of an active market for a security. In addition, for an investment in an equity security, a significant or prolonged decline in its fair value below its cost is objective evidence of impairment.
Financial assets carried at amortised cost
The Group first assesses whether objective evidence of impairment exists individually for financial assets that are individually significant, and collectively for financial assets that are not individually significant. If it is determined that no objective evidence of impairment exists for an individually assessed financial asset, whether significant or not, the asset is included in a group of financial assets with similar credit risk characteristics and that group of financial assets is collectively assessed for impairment. Financial assets that are individually assessed for impairment and for which an impairment loss is or continues to be recognised are not included in a collective assessment of impairment.
In assessing collective impairment, the Group uses historical trends of the probability of default, the timing of recoveries and the amount of loss incurred, adjusted for management’s judgement as to whether current economic and credit conditions are such that the actual losses are likely to be greater or less than suggested by historical trends.
128 129Singapore TechnologieS engineering lTd Annual Report 2012Making an impact

Notes to the Financial Statements31 December 2012(Currency - Singapore dollars unless otherwise stated)
Notes to the Financial Statements31 December 2012(Currency - Singapore dollars unless otherwise stated)
3. Summary of significant accounting policies (continued)
3.8 Impairment (continued)
(i) Non-derivative financial assets (continued)
Financial assets carried at amortised cost (continued)
If there is objective evidence that an impairment loss on loans and receivables or held-to-maturity investments carried at amortised cost has been incurred, the amount of the loss is measured as the difference between the asset’s carrying amount and the present value of estimated future cash flows (excluding future credit losses that have not been incurred) discounted at the financial asset’s original effective interest rate (i.e., the effective interest rate computed at initial recognition). The carrying amount of the asset shall be reduced either directly or through use of an allowance account. The amount of the loss shall be recognised in profit or loss.
If, in a subsequent period, the amount of the impairment loss decreases and the decrease can be related objectively to an event occurring after the impairment was recognised, the previously recognised impairment loss is reversed. Any subsequent reversal of an impairment loss is recognised in profit or loss, to the extent that the carrying value of the asset does not exceed its amortised cost at the reversal date.
Financial assets carried at cost
If there is objective evidence that an impairment loss on an unquoted equity instrument that is not carried at fair value because its fair value cannot be reliably measured, or on a derivative asset that is linked to and must be settled by delivery of such an unquoted equity instrument has been incurred, the amount of the loss is measured as the difference between the asset’s carrying amount and the present value of estimated future cash flows discounted at the current market rate of return for a similar financial asset. The loss recognised is not reversed in future periods.
Available-for-sale financial assets
If an available-for-sale financial asset is impaired, an amount comprising the difference between its cost (net of any principal payment and amortisation) and its current fair value, less any impairment loss previously recognised in the income statement, is transferred from equity to profit or loss.
Reversals in respect of impairment losses on equity instruments classified as available-for-sale are recognised in other comprehensive income. Reversals of impairment losses on debt instruments are reversed through profit or loss, if the increase in fair value of the instrument can be objectively related to an event occurring after the impairment loss was recognised in profit or loss.
(ii) Other non-financial assets
The Group assesses at each reporting date whether there is an indication that its non-financial assets, other than goodwill, investment property, inventories and deferred tax assets, may be impaired. Goodwill is reviewed for impairment, annually or more frequently if events or changes in circumstances indicate that the carrying value may be impaired. If any such indication exists, the Group makes an estimate of the asset’s recoverable amount. An impairment loss is recognised if the carrying amount of an asset or its related cash-generating unit (“CGU”) exceeds its estimated recoverable amount.
The recoverable amount of an asset or CGU is the higher of its fair value less costs to sell and its value in use. In assessing value in use, the estimated future cash flows are discounted to their present value using a pre-tax discount rate that reflects current market assessments of the time value of money and the risks specific to the asset or CGU. For the purpose of impairment testing, assets that cannot be tested individually are grouped together into the smallest group of assets that generates cash inflows from continuing use that are largely independent of the cash inflows of other assets or CGU. Subject to an operating segment ceiling test, for the purposes of goodwill impairment testing, CGUs to which goodwill has been allocated are aggregated so that the level at which impairment testing is performed reflects the lowest level at which goodwill is monitored for internal reporting purposes. Goodwill acquired in a business combination is allocated to groups of CGUs that are expected to benefit from the synergies of the combination.
3. Summary of significant accounting policies (continued)
3.8 Impairment (continued)
(ii) Other non-financial assets (continued)
Impairment losses are recognised in profit or loss. Impairment losses recognised in respect of CGUs are allocated first to reduce the carrying amount of any goodwill allocated to the CGU or group of CGUs, and then to reduce the carrying amounts of other assets in the CGU or group of CGUs on a pro rata basis.
An impairment loss in respect of goodwill is not reversed. In respect of other assets, an assessment is made at each reporting date as to whether there is any indication that previously recognised impairment losses may no longer exist or may have decreased. If such indication exists, the recoverable amount is estimated. A previously recognised impairment loss is reversed only if there has been a change in the estimates used to determine the recoverable amount since the last impairment loss was recognised. If that is the case, the impairment loss is reversed only to the extent that the asset’s carrying amount does not exceed the carrying amount that would have been determined, net of depreciation or amortisation, if no impairment loss had been recognised in prior years. Such reversal is recognised in profit or loss unless the asset is carried at revalued amount, in which case the reversal is treated as a revaluation increase. After such a reversal, the depreciation or amortisation charged is adjusted in future periods to allocate the asset’s revised carrying amount, less any residual value, on a systematic basis over its remaining useful life.
Goodwill that forms part of the carrying amount of an investment in an associate is not recognised separately, and therefore is not tested for impairment separately. Instead, the entire amount of the investment in an associate is tested for impairment as a single asset when there is objective evidence that the investment in an associate may be impaired.
3.9 Provisions
Provisions are recognised when the Group has a present obligation (legal or constructive) as a result of past events, it is probable that an outflow of resources embodying economic benefits will be required to settle the obligation and a reliable estimate can be made of the amount of the obligation.
(i) Warranties
The warranty provision represents the best estimate of the Group’s contractual obligations at the balance sheet date. The provision is based on past experience and industry averages for defective products. The majority of the costs is expected to be incurred over the applicable warranty periods.
(ii) Liquidated damages
Provision for liquidated damages is made in respect of anticipated claims from customers on contracts of which deadlines are overdue or not expected to be completed on time in accordance with contractual obligations. The utilisation of provisions is dependent on the timing of claims.
3.10 Employee benefits
(i) Employee equity compensation benefits
The grant date fair value of share-based payment awards granted to employees is recognised as an employee expense, with a corresponding increase in equity, over the period that the employees unconditionally become entitled to the awards. The amount recognised as an expense is adjusted to reflect the number of awards for which the related service and non-market vesting conditions are expected to be met, such that the amount ultimately recognised as an expense is based on the number of awards that meet the related service and non-market performance conditions at the vesting date.
130 131Singapore TechnologieS engineering lTd Annual Report 2012Making an impact

Notes to the Financial Statements31 December 2012(Currency - Singapore dollars unless otherwise stated)
Notes to the Financial Statements31 December 2012(Currency - Singapore dollars unless otherwise stated)
3. Summary of significant accounting policies (continued)
3.10 Employee benefits (continued)
(ii) Defined contribution plans
The Group participates in national pension schemes as defined by the laws of the countries in which it has operations. In particular, the Singapore companies in the Group make contributions to the Central Provident Fund scheme in Singapore, a defined contribution pension scheme. Contributions to national pension schemes are recognised as an expense in the period in which the related service is performed.
(iii) Short-term employee benefits
Short-term employee benefit obligations are measured on an undiscounted basis and are expensed as the related service is provided. A liability is recognised for the amount expected to be paid under cash bonus plans if the Group has a present legal or constructive obligation to pay this amount as a result of past service provided by the employee, and the obligation can be estimated reliably.
3.11 Revenue
Revenue is recognised to the extent that it is probable that the economic benefits will flow to the Group and revenue can be reliably measured. Revenue is measured at the fair value of consideration received or receivable, net of any returns, trade discounts and volume rebates.
Revenue is recognised using the following methods:
(i) Revenue from sale of goods is recognised when persuasive evidence exists that the significant risks and rewards of ownership have been transferred to the customer, recovery of the consideration is probable, the associated costs and possible return of goods can be estimated reliably, there is no continuing management involvement with the goods and the amount of revenue can be measured reliably.
The timing of the transfer of risks and rewards usually occurs upon delivery of goods and acceptance by customers.
(ii) Revenue from rendering of services is recognised in profit or loss in proportion to the stage of completion of the transaction at the reporting date. The stage of completion is assessed by reference to the work performed.
(iii) Revenue from long-term contracts is recognised by reference to stage of completion, which is measured by either:
(a) a combination of different cost components or a single cost component that would provide the most reliable indication of the stage of completion of a contract; or
(b) when goods and services, representing part of a contract, are delivered; or(c) upon completion of designated phases of a contract.
Provision for foreseeable losses on uncompleted contracts is recognised in profit or loss as soon as such losses are determinable.
(iv) Management fee income is recognised on an accrual basis over the duration upon which management services are rendered.
(v) Where it is probable that a portion of the commission income may not materialise, a certain percentage of the total commission received is treated as downpayment and is deferred and taken up in the income statement only upon the discharge of specified contractual obligations. Commission income in excess of the certain percentage of the total amount received is taken up in the income statement as and when the services are performed.
(vi) Rental income from investment property is accounted for on a straight-line basis over the duration of the lease terms.
3. Summary of significant accounting policies (continued)
3.12 Government grants
Government grants are recognised when the Group complies with the conditions associated with the grants. Grants that compensate the Group for expenses incurred are recognised in profit or loss as other income in the same periods in which the expenses are recognised. Grants relating to depreciable assets are deferred and recognised in profit or loss as other income over the period in which such assets are depreciated and used in the projects subsidised by the grants.
3.13 Finance income and finance costs
Finance income comprises interest income on funds invested (including available-for-sale financial assets), dividend income, gains on disposal of available-for-sale financial assets, fair value gains on financial assets at fair value through profit or loss, gains on hedging instruments that are recognised in profit or loss. Interest income is recognised as it accrues in profit or loss, using the effective interest method. Dividend income is recognised in profit or loss when the shareholder’s right to receive payment is established.
Finance costs comprise interest expense on borrowings, losses on disposal of available-for-sale financial assets, fair value losses on financial assets at fair value through profit or loss, impairment losses recognised on investments and losses on hedging instruments that are recognised in profit or loss.
Borrowing costs that are not directly attributable to the acquisition, construction or production of a qualifying asset are recognised in profit or loss using the effective interest method.
Foreign currency gains and losses on financial assets and financial liabilities are reported on a net basis as either finance income or finance cost depending on whether foreign currency movements are in a net gain or net loss position.
3.14 Hire purchase
Assets acquired on hire purchase arrangements are capitalised in the financial statements and the corresponding obligations treated as a liability. The total interest, being the difference between the total instalments payable and the capitalised amount, is recognised in profit or loss over the period of such hire purchase arrangements in equal monthly instalments to produce a constant rate of charge on the balance of capital repayments outstanding. Assets acquired on hire purchase arrangements are depreciated in accordance with the policy set out in Note 3.4 above.
3.15 Finance leases
(i) As lessee
Finance leases are those leasing agreements, which effectively transfer to the Group substantially all the risks and benefits incidental to ownership of the lease items. Assets financed under such leases are capitalised at the inception of the lease at the fair value of the leased asset or, if lower, at the present value of the minimum lease payments. Any initial direct costs are also added to the amount capitalised. Lease payments are apportioned between the finance charges and reduction of the lease liability so as to achieve a constant rate of interest on the remaining balance of the liability. Finance charges are charged to profit or loss. Assets acquired on finance lease arrangements are depreciated in accordance with the policy set out in Note 3.4 above.
(ii) As lessor
Leases where the Group transferred substantially all the risks and rewards incidental to legal ownership of the leased assets, are classified as finance leases.
The leased asset is derecognised and the present value of the lease receivables (net of initial direct costs for negotiating and arranging the lease) is recognised on the balance sheet. The difference between the gross receivables and the present value of the lease receivables is recognised as unearned finance income.
132 133Singapore TechnologieS engineering lTd Annual Report 2012Making an impact

Notes to the Financial Statements31 December 2012(Currency - Singapore dollars unless otherwise stated)
Notes to the Financial Statements31 December 2012(Currency - Singapore dollars unless otherwise stated)
3. Summary of significant accounting policies (continued)
3.15 Finance leases (continued)
(ii) As lessor (continued)
Each lease payment received is applied against the gross investment in the finance lease receivables to reduce both the principal and the unearned finance income. The finance income is recognised in profit or loss on a basis that reflects a constant periodic rate of return on the net investment in the finance lease receivables.
Initial direct costs incurred by the Group in negotiating and arranging finance leases are added to finance lease receivables and recognised as an expense in profit or loss over the lease term on the same basis as the leased income.
3.16 Operating leases
Leases where the lessor effectively retains substantially all the risks and benefits of ownership of the leased asset, are classified as operating leases. Operating lease payments are recognised as an expense in profit or loss on a straight-line basis over the lease term.
The aggregate benefit of incentives provided by the lessor is recognised as a reduction of rental expense over the lease term on a straight-line basis.
3.17 Income taxes
(i) Current tax
Current tax assets and liabilities for the current and prior periods are measured at the amount expected to be recovered from or paid to the tax authorities. The tax rates and tax laws used to compute the amount are those that are enacted or substantively enacted by the balance sheet date.
Current taxes are recognised in profit or loss except to the extent that it relates to items recognised directly in other comprehensive income or in equity.
(ii) Deferred tax
Deferred income tax is provided, using the liability method, on all temporary differences at the balance sheet date between the tax bases of assets and liabilities and their carrying amounts for financial reporting purposes. Deferred tax is not recognised for temporary differences on the initial recognition of assets or liabilities in a transaction that is not a business combination and that affects neither accounting nor taxable profit or loss and taxable temporary differences arising on the initial recognition of goodwill. Deferred tax assets and liabilities are measured using the tax rates expected to apply to taxable income in the years in which those temporary differences are expected to be recovered or settled based on tax rates enacted or substantively enacted at the balance sheet date.
Deferred tax liabilities are recognised for all taxable temporary differences associated with investments in subsidiaries, associates and jointly controlled entities, except where the timing of the reversal of the temporary differences can be controlled and it is probable that the temporary differences will not reverse in the foreseeable future.
Deferred tax assets are recognised for all deductible temporary differences, carry-forward of unused tax assets and unused tax losses, to the extent that it is probable that taxable profit will be available against which the deductible temporary differences, carry-forward of unused tax assets and unused tax losses can be utilised.
3. Summary of significant accounting policies (continued)
3.17 Income taxes (continued)
(ii) Deferred tax (continued)
At each balance sheet date, the Group re-assesses unrecognised deferred tax assets and the carrying amount of deferred tax assets. The Group recognises a previously unrecognised deferred tax asset to the extent that it has become probable that future taxable profit will allow the deferred tax asset to be recovered. The Group conversely reduces the carrying amount of a deferred tax asset to the extent that it is no longer probable that sufficient taxable profit will be available to allow the benefit of part or all of the deferred tax asset to be utilised.
Deferred income tax relating to items recognised outside profit or loss is recognised in correlation to the underlying transaction either in other comprehensive income or directly in equity and deferred tax arising from a business combination is adjusted against goodwill on acquisition.
Deferred income tax assets and deferred income tax liabilities are offset, if a legally enforceable right exists to set off current income tax assets against current income tax liabilities and the deferred income taxes relate to the same taxable entity and the same tax authority.
3.18 Earnings per share
The Group presents basic and diluted earnings per share data for its ordinary shares. Basic earnings per share is calculated by dividing the profit or loss attributable to ordinary shareholders of the Company by the weighted average number of ordinary shares outstanding during the year, adjusted for own shares held. Diluted earnings per share is determined by adjusting the profit or loss attributable to ordinary shareholders and the weighted average number of ordinary shares outstanding, adjusted for own shares held, for the effects of all dilutive potential ordinary shares, which comprise share plans granted to employees.
3.19 Operating segments
For management purposes, the Group is organised on a worldwide basis into four major operating segments. The management of the Company reviewed the segments’ operating results regularly in order to allocate resources to the segments and to assess the segments’ performance. Additional disclosures on each of these operating segments are shown in Note 43, including the factors used to identify the reportable segments and the measurement basis of segment information.
3.20 Changes in accounting policies
Adoption of new and revised FRS
With effect from 1 January 2012, the Group has adopted all the new and revised FRS and INT FRS that are mandatory for financial years beginning on or after 1 January 2012. The adoption of these FRS and INT FRS has no significant impact to the Group.
3.21 Significant accounting estimates and judgements
Estimates and assumptions concerning the future are made in the preparation of the financial statements. They affect the application of the Group’s accounting policies, reported amounts of assets, liabilities, income and expenses, and disclosures made. They are assessed on an ongoing basis and are based on experience and relevant factors, including expectations of future events that are believed to be reasonable under the circumstances.
134 135Singapore TechnologieS engineering lTd Annual Report 2012Making an impact

Notes to the Financial Statements31 December 2012(Currency - Singapore dollars unless otherwise stated)
Notes to the Financial Statements31 December 2012(Currency - Singapore dollars unless otherwise stated)
3. Summary of significant accounting policies (continued)
3.21 Significant accounting estimates and judgements (continued)
(i) Key sources of estimation uncertainty
The key assumptions concerning the future and other key sources of estimation uncertainty at the balance sheet date, that have a significant risk of causing a material adjustment to the carrying amounts of assets and liabilities within the next financial year are discussed below.
Impairment of non-financial assets
The Group assesses whether there are any indicators of impairment for all non-financial assets at each reporting date. Goodwill and other intangible assets are tested for impairment annually and at other times when such indicators exist. Other non-financial assets are tested for impairment when there are indicators that the carrying amounts may not be recoverable.
When value-in-use calculations are undertaken, management must estimate the expected future cash flows from the asset or CGU and choose a suitable discount rate in order to calculate the present value of those cash flows. Further details of the key assumptions applied in the impairment assessment of goodwill and other intangible assets are given in Note 16 to the financial statements.
Impairment of loans and receivables
The Group assesses at each balance sheet date whether there is any objective evidence that a financial asset is impaired. To determine whether there is objective evidence of impairment, the Group considers factors such as the probability of insolvency or significant financial difficulties of the debtor and default or significant delay in payments.
Where there is objective evidence of impairment, the amount and timing of future cash flows are estimated based on historical loss experience for assets with similar credit risk characteristics. The carrying amount of the Group’s loans and receivables at the balance sheet date is disclosed in Note 45 to the financial statements.
Depreciation charge
Property, plant and equipment and investment property are depreciated on a straight-line basis over their estimated useful lives. Management estimates the useful lives of these property, plant and equipment and investment property to be within 2 to 50 years. Changes in the expected level of usage and technological developments could impact the economic useful lives and the residual values of these property, plant and equipment and investment property, and therefore future depreciation charges could be revised.
Revenue recognition and provision for foreseeable losses
The Group has recognised revenue from long-term contracts by reference to the stage of completion. The bases for measuring the stage of completion are described in Note 3.11(iii). Significant judgement based on management’s knowledge and experience is required in determining the appropriate stage of completion and estimating a reasonable contribution margin or expected losses for revenue and costs recognition.
Allowance for inventory obsolescence
The allowance for inventory obsolescence is based on estimates from historical trends and expected utilisation of inventories. The actual amount of inventory write-offs could be higher or lower than the allowance made.
3. Summary of significant accounting policies (continued)
3.21 Significant accounting estimates and judgements (continued)
(i) Key sources of estimation uncertainty (continued)
Provision for warranty
The provision for warranty is based on estimates from known and expected warranty work to be performed after completion. The warranty expense incurred could be higher or lower than the provision made.
Income Taxes
The Group has exposure to income taxes in numerous jurisdictions. Significant judgement is involved in determining the group-wide provision for income taxes. There are certain transactions and computations for which the ultimate tax determination is uncertain during the ordinary course of business. The Group recognises liabilities for expected tax issues based on estimates of whether additional taxes will be due. Where the final tax outcome of these matters is different from the amounts that were initially recognised, such differences will impact the income tax and deferred tax provisions in the period in which such determination is made.
In addition, certain subsidiaries of the Group have potential tax benefits arising from unutilised tax losses, unabsorbed wear and tear allowances and other temporary differences, which are available for set-off against future taxable profits. Significant judgement is involved in determining the availability of future taxable profits against which the Group can utilise the tax benefits therefrom. The use of the potential tax benefits is also subject to the agreement of the tax authorities and compliance with certain provisions of the tax legislation of the respective countries in which the subsidiaries operate. Where the final outcome of these matters is different from the amounts that were initially recognised, such differences will impact the income tax provision and recognised deferred tax assets relating to the potential tax benefits in the period in which such determination is made.
(ii) Critical judgements made in applying accounting policies
In the process of applying the Group’s accounting policies, management is of the opinion that there is no instance of application of judgement which is expected to have a significant effect on the amounts recognised in the financial statements, apart from those involving estimations as described above.
3.22 Future changes in accounting policies
A number of new standards, amendments to standards and interpretations have been issued but not yet effective, and have not been applied in preparing these financial statements. Those new standards, amendments to standards and interpretations that are expected to have a significant effect on the financial statements of the Group and the Company in future financial periods, and which the Group does not plan to early adopt except as otherwise indicated below, are set out below:
• FRS110Consolidated Financial Statements
FRS 110 Consolidated Financial Statements, which changes the definition of control such that an investor controls an investee when it is exposed, or has rights, to variable returns from its involvement with the investee and has the ability to affect those returns through its power with the investee. FRS 110 introduces a single control model with a series of indicators to assess control. FRS 110 also adds additional context, explanation and application guidance based on the principle of control. The Group is currently assessing whether there will be any impact to the Group’s financial statements when the Group adopts FRS 110 in 2013.
136 137Singapore TechnologieS engineering lTd Annual Report 2012Making an impact

Notes to the Financial Statements31 December 2012(Currency - Singapore dollars unless otherwise stated)
Notes to the Financial Statements31 December 2012(Currency - Singapore dollars unless otherwise stated)
3. Summary of significant accounting policies (continued)
3.22 Future changes in accounting policies (continued)
• FRS111Joint Arrangements
FRS 111 Joint Arrangements, which establishes the principles for classification and accounting of joint arrangements. The adoption of this standard would require the Group to re-assess and classify its joint arrangements as either joint operations or joint ventures based on its rights and obligations arising from the joint arrangements. Under this standard, interests in joint ventures will be accounted for using the equity method, whilst interests in joint operations will be accounted for using the applicable FRSs relating to the underlying assets, liabilities, revenue and expense items arising from the joint operations.
The Group has only three investments in a joint arrangement. It holds 50% interest in Total Engine Asset Management Pte. Ltd, 50% interest in GFM Electronics S.A. de C.V. and 51% in ST Electronics (Satellite Systems) Pte. Ltd. The Group has re-evaluated the rights and obligations of the parties to these joint arrangements and has determined that the parties in these joint arrangements have rights to the net assets of the arrangements. Accordingly, these joint arrangements will be classified as joint ventures under FRS 111 and will be accounted for using the equity method. Currently, Total Engine Asset Management Pte. Ltd, GFM Electronics S.A. de C.V. and ST Electronics (Satellite Systems) Pte. Ltd. are accounted for as jointly-controlled entities under FRS 31 Interests in Joint Ventures using the equity method. As the Group is already applying the equity method of accounting, there will be no impact to the Group’s financial statements when the Group early adopts FRS 111 in 2013.
• FRS112Disclosure of Interests in Other Entities
FRS 112 Disclosure of Interests in Other Entities, which sets out the disclosures required to be made in respect of all forms of an entity’s interests in other entities, including subsidiaries, joint arrangements, associates and unconsolidated structured entities. The adoption of this standard would result in more extensive disclosures being made in the Group’s financial statements in respect of its interests in other entities; as FRS 112 is primarily a disclosure standard, there will be no financial impact on the results and financial position of the Company and the Group upon early adoption of this standard by the Group in 2013. The Group is currently collating the information on the additional disclosures required.
• FRS32Financial Instruments: Presentation – Offsetting Financial Assets and Financial Liabilities
Amendments to FRS 32 Financial Instruments: Presentation – Offsetting Financial Assets and Financial Liabilities, which clarifies the existing criteria for net presentation on the face of the Balance Sheet.
Under the amendments, to qualify for offsetting, the right to set off a financial asset and a financial liability must not be contingent on a future event, and must be enforceable both in the normal course of business and in the event of default, insolvency or bankruptcy of the entity and all counterparties.
The Group currently offsets receivables and payables due from/to the same counterparty if the Group has the legal right to set off the amounts when it is due and payable based on the contractual terms of the arrangement with the counterparty, and the Group intends to settle the amounts on a net basis. Based on the local laws and regulations in certain jurisdictions in which the counterparties are located, the set-off rights are set aside in the event of bankruptcy of the counterparties. On adoption of the amendments, the Group will have to present the respective receivables and payables on a gross basis as the right to set-off is not enforceable in the event of bankruptcy of the counterparty.
The amendments will be applied retrospectively and prior periods in the Group’s 2014 financial statements will be restated.
4. Revenue
Revenue represents invoiced value of sales/services less returns and discounts given and billings recognised on contracts as follows:
Group2012 2011
$’000 $’000
Sale of goods 2,302,575 2,256,546Service income 3,423,603 3,218,669Contract revenue 653,688 515,663
6,379,866 5,990,878
5. Profit from operations
Profit from operations is arrived at:
GroupNote 2012 2011
$’000 $’000
After charging/(crediting)
Auditors’ remuneration– auditors of the Company 2,371 1,320– other auditors 2,120 2,026Non-audit fees– auditors of the Company 1,139 625– other auditors 1,144 1,004Fees and remuneration of directors 7,024 6,753Fees paid to a firm of which a director is a member 994 769Personnel expenses 6 1,775,239 1,645,083Depreciation charges 12, 17 123,949 125,784Allowance/(write-back of allowance) for– inventory obsolescence 17,915 181– doubtful debts (trade) 14,361 (143)– unbilled receivables (trade) (91) 187– doubtful lease receivables 8,077 202Provision for– warranties 30 26,045 19,834– liquidated damages 30 2,875 5,473– foreseeable losses 2,792 9,395Property, plant and equipment written off 7,314 7,455Research, design and development expenses 95,716 96,248Operating lease expenses 43,655 39,362Amortisation of other intangible assets 16 13,153 9,275Impairment losses on property, plant and equipment 12 251 –Impairment losses on goodwill 16 12,351 3,240Impairment losses on other intangible assets 16 802 6,964
138 139Singapore TechnologieS engineering lTd Annual Report 2012Making an impact

Notes to the Financial Statements31 December 2012(Currency - Singapore dollars unless otherwise stated)
Notes to the Financial Statements31 December 2012(Currency - Singapore dollars unless otherwise stated)
6. Personnel expenses
Group2012 2011
$’000 $’000
Wages and salaries * 1,439,813 1,351,316Contributions to defined contribution plans 128,381 110,289Share-based payments 18,733 15,995Other personnel expenses 188,312 167,483
1,775,239 1,645,083
* Includes directors’ remuneration of $4,237,211 (2011: $4,280,276).
7. Key management personnel compensation
Group2012 2011
$’000 $’000
Short-term employee benefits 42,748 42,881Contributions to defined contribution plans * 437 409Other long-term benefits 11 9Share-based payments 6,922 5,094
50,118 48,393
* Relates to post employment benefits.
8. Other income, net
Group2012 2011
$’000 $’000
Gain on disposal of property, plant and equipment and investment property 14,474 4,028Government grants 6,744 3,364Commission income 501 1,889Rental income 4,121 5,030Gain on disposal of– subsidiaries – 1,476– associates and jointly controlled entities * 2,631 441Others 14,771 16,084
43,242 32,312
* Includes gain arising from a step-up acquisition of a jointly controlled entity of $2,608,000 (2011: nil).
9. Finance costs, net
Group2012 2011
$’000 $’000
Finance incomeDividend income– quoted equity investments 12 33– unquoted equity investments – 188Interest income– bank deposits 12,185 5,876– staff loans 20 22– finance lease 812 788– bonds 12,027 11,299– others 1,102 2,205Exchange gain, net 2,117 4,830Gain on disposal of investments 3,907 5,618Gain on fair value changes of investments held for trading 126 –Fair value changes of financial instruments– gain on forward currency contract designated as hedging instrument 1,908 –– gain on forward currency contract and cross currency interest rate swaps not designated as
hedging instrument 7,884 –– gain on ineffective portion of forward currency contract designated as hedging instrument in
cash flow hedges 2 9Fair value changes of hedged items 5,295 10,424Fair value changes of embedded derivatives– not designated as hedging instrument – 1,021– designated as hedging instrument 990 2,757
48,387 45,070
Finance costsInterest expenses– bank loans and overdrafts (22,215) (19,711)– bonds (27,093) (30,433)– finance lease (23) (206)– others (173) (273)Loss on fair value changes of investments held for trading – (45)Net change in fair value of cash flow hedges reclassified from equity– on occurrence of forecast transactions (5,295) (8,289)Fair value changes of financial instruments – loss on forward currency denominated cash balances designated as hedging instrument in
fair value hedges (1,188) –– loss on ineffective portion of foreign currency denominated cash balances designated as
hedging instrument in cash flow hedges (684) –– loss on forward currency contract designated as hedging instrument – (5,382)– loss on forward currency contract not designated as hedging instrument – (88)Fair value changes of hedged items (2,128) –Fair value changes of embedded derivatives– not designated as hedging instrument (6,221) –Impairment losses on unquoted investments (1,295) (19)Impairment losses on quoted investments (759) –
(67,074) (64,446)
Finance costs, net, recognised in profit or loss (18,687) (19,376)
140 141Singapore TechnologieS engineering lTd Annual Report 2012Making an impact

Notes to the Financial Statements31 December 2012(Currency - Singapore dollars unless otherwise stated)
Notes to the Financial Statements31 December 2012(Currency - Singapore dollars unless otherwise stated)
10. Taxation
Group2012 2011
$’000 $’000
Current income tax Current year 168,481 129,533 Overprovision in respect of prior years (25,672) (26,315) Associates and jointly controlled entities 7,679 4,744
150,488 107,962Deferred income tax Current year (15,997) 475 Underprovision in respect of prior years 2,969 6,177 Effect of reduction in tax rate 978 (50)
138,438 114,564
Deferred income tax related to items charged or credited directly to other comprehensive income:
Net change in fair value of derivative financial instruments designated in cash flow hedges 977 3,536
The Group
Unrecognised tax benefits
Deferred tax assets have not been recognised in respect of the following items:
Group2012 2011
$’000 $’000
Deductible temporary differences 7,833 11,991Tax losses 289,838 351,999Unabsorbed wear and tear allowance and investment allowance 12,046 13,064
309,717 377,054
The tax benefits have not been recognised in the financial statements due to the uncertainty of the sufficiency of future taxable profits to be generated in the foreseeable future. The use of these potential tax benefits is subject to the agreement of the tax authorities and compliance with certain provisions of the tax legislation of the respective countries in which the subsidiaries operate.
Unrecognised temporary differences relating to investments in subsidiaries
As at 31 December 2012, no deferred tax liabilities (2011: nil) has been recognised for taxes that would be payable on the undistributed earnings of certain subsidiaries of the Group as the Group has determined that the undistributed profits of some of its overseas subsidiaries will not be remitted to Singapore in the foreseeable future, but be retained for organic growth and acquisitions.
10. Taxation (continued)
A reconciliation between tax expense and the product of accounting profit multiplied by the applicable corporate tax rate for the year ended 31 December is as follows:
Group2012 2011
$’000 $’000
Profit before taxation 723,059 655,225
Taxation at statutory tax rate of 17% (2011: 17%) 122,920 111,388Adjustments:
Income not subject to tax (3,842) (2,168)Expenses not deductible for tax purposes 26,987 9,517Different tax rates of other countries 27,083 11,578Overprovision in prior years, net (22,703) (20,138)Effect of change in tax rates 978 (50)Deferred tax assets not recognised 2,013 7,584Deferred tax assets previously not recognised now recognised (667) (1,004)Deferred tax assets previously not recognised now utilised (12,480) –Others (1,851) (2,143)
138,438 114,564
11. Earnings per share
Basic earnings per share
The calculation for basic earnings per share is based on:
Group2012 2011
$’000 $’000
Profit attributable to shareholders 576,178 527,544
The weighted average number of ordinary shares is arrived at as follows:
Group2012 2011
Number of shares (’000)
Issued ordinary shares at beginning of the year 3,056,465 3,037,566Weighted average number of ordinary shares issued during the year 14,841 15,079Weighted average number of ordinary shares 3,071,306 3,052,645
142 143Singapore TechnologieS engineering lTd Annual Report 2012Making an impact

Notes to the Financial Statements31 December 2012(Currency - Singapore dollars unless otherwise stated)
Notes to the Financial Statements31 December 2012(Currency - Singapore dollars unless otherwise stated)
11. Earnings per share (continued)
Diluted earnings per share
When calculating diluted earnings per share, the weighted average number of shares is adjusted for the effect of all dilutive potential ordinary shares. The number of unissued shares under option granted under the ESOP and their exercise prices are set out in Note 36. The average fair value of one ordinary share during the financial year ended 31 December 2012 was $3.31 (2011: $2.98) per share. The weighted average number of ordinary shares adjusted for the unissued shares under option is as follows:
Group2012 2011
Number of shares (’000)
Weighted average number of ordinary shares (used in the calculation of basic earnings per share) 3,071,306 3,052,645Weighted average number of unissued shares under option 47,584 37,889Number of shares that would have been issued at fair value (39,371) (30,765)Weighted average number of ordinary shares (diluted) 3,079,519 3,059,769
10,568,909 (2011: 34,205,229) of share options granted to employees under the existing employee share option plans have not been included in the calculation of diluted earnings per share because they are anti-dilutive for the current and previous financial years presented.
12. Property, plant and equipment
Valuation/Cost
As at 1.1.2011 Additions
Disposals/write-off
Arising from acquisition
of interest in subsidiaries
Due to disposal of
subsidiariesReclassi-fications
Translation difference
As at 31.12.2011
$’000 $’000 $’000 $’000 $’000 $’000 $’000 $’000
The Group
At ValuationLeasehold land and buildings 1,919 – – – – – – 1,919Wharves and slipways 1,490 – – – – – – 1,490Syncrolift and floating docks 4,603 – – – – – – 4,603Plant and machinery 1,694 – – – – – – 1,694Furniture, fittings, office
equipment and computers 279 – – – – – – 279
At CostFreehold land and buildings 55,679 2,436 (2,528) – – 157 441 56,185Leasehold land and buildings 691,620 11,606 (7,200) – (1,481) 96,578 6,078 797,201Improvements to premises 52,854 5,256 (2,735) – (40) 2,122 91 57,548Wharves and slipways 35,528 – – – – – 73 35,601Syncrolift and floating docks 68,936 – – – – – – 68,936Boats and barges 4,782 3,772 – – – – 12 8,566Plant and machinery 958,870 77,072 (29,241) – (298) 10,851 (3,315) 1,013,939Production tools and equipment 242,060 19,919 (2,955) – – 7,349 2,577 268,950Furniture, fittings, office
equipment and computers 190,146 21,832 (7,878) 6 (388) (743) 665 203,640Transportation equipment and
vehicles 18,339 2,573 (1,579) – (88) (1,441) 128 17,932Aircraft and aircraft engines 182,505 9,744 (5,595) – – 632 3,430 190,716Construction-in-progress 109,336 35,093 (10) – – (118,314) 2,852 28,957
2,620,640 189,303 (59,721) 6 (2,295) (2,809) 13,032 2,758,156
144 145Singapore TechnologieS engineering lTd Annual Report 2012Making an impact
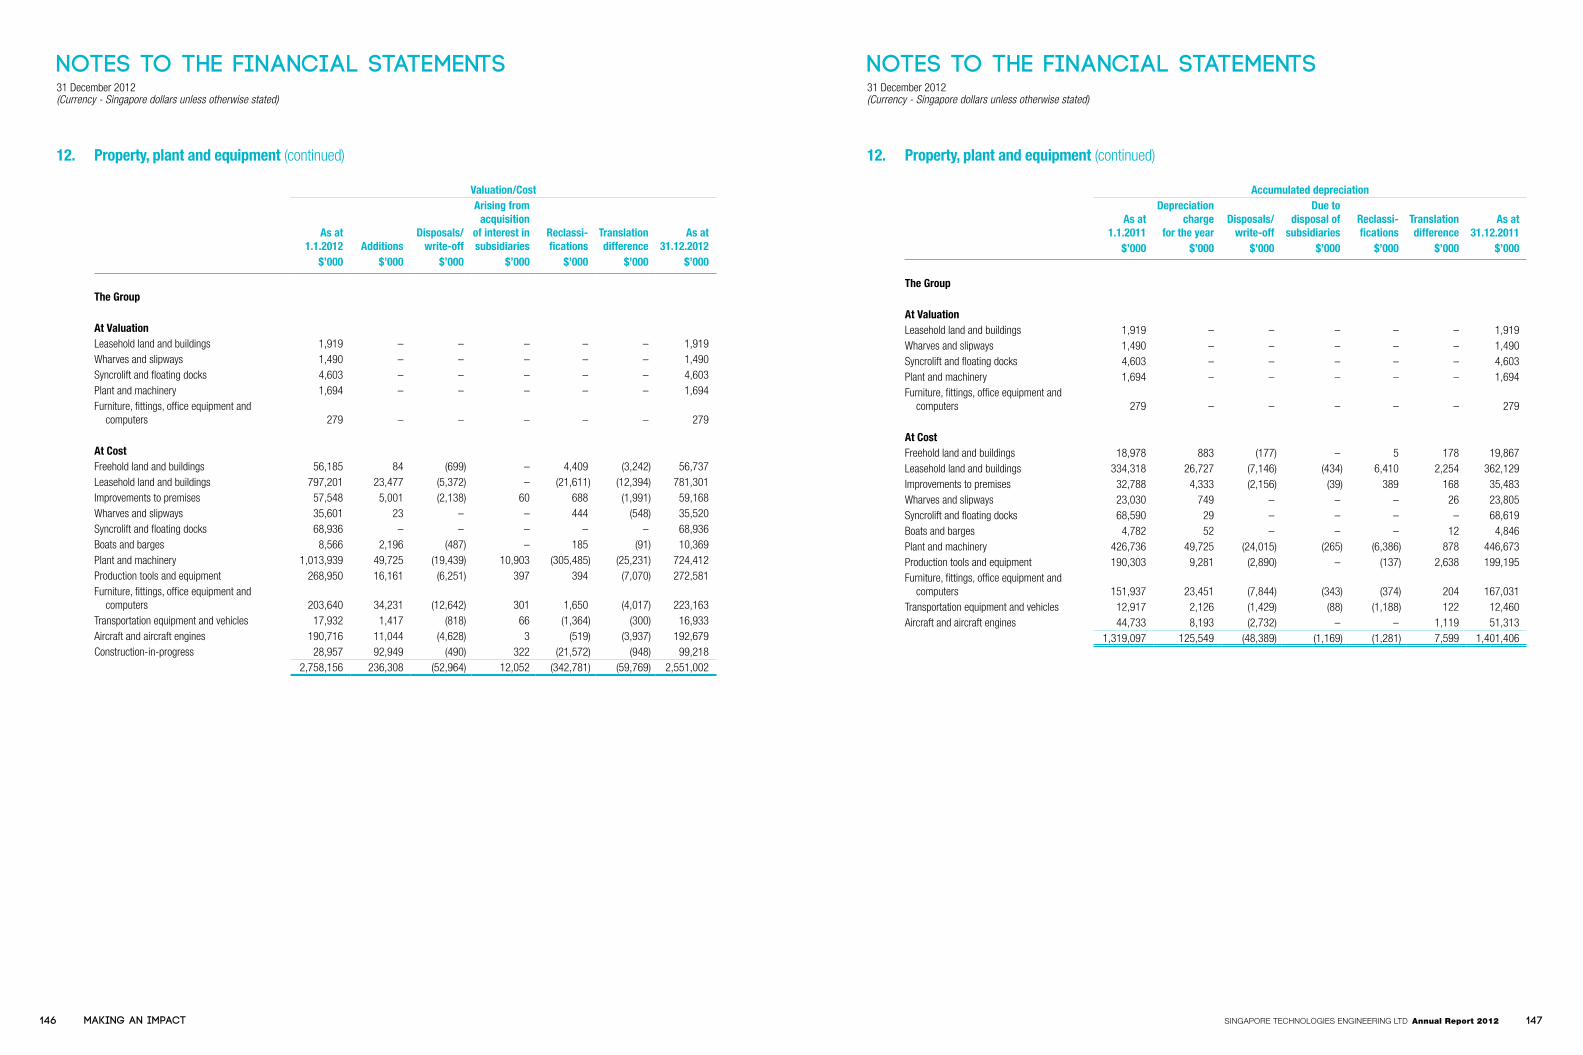
Notes to the Financial Statements31 December 2012(Currency - Singapore dollars unless otherwise stated)
Notes to the Financial Statements31 December 2012(Currency - Singapore dollars unless otherwise stated)
12. Property, plant and equipment (continued)
Valuation/Cost
As at 1.1.2012 Additions
Disposals/write-off
Arising from acquisition
of interest in subsidiaries
Reclassi-fications
Translation difference
As at 31.12.2012
$’000 $’000 $’000 $’000 $’000 $’000 $’000
The Group
At ValuationLeasehold land and buildings 1,919 – – – – – 1,919Wharves and slipways 1,490 – – – – – 1,490Syncrolift and floating docks 4,603 – – – – – 4,603Plant and machinery 1,694 – – – – – 1,694Furniture, fittings, office equipment and
computers 279 – – – – – 279
At CostFreehold land and buildings 56,185 84 (699) – 4,409 (3,242) 56,737Leasehold land and buildings 797,201 23,477 (5,372) – (21,611) (12,394) 781,301Improvements to premises 57,548 5,001 (2,138) 60 688 (1,991) 59,168Wharves and slipways 35,601 23 – – 444 (548) 35,520Syncrolift and floating docks 68,936 – – – – – 68,936Boats and barges 8,566 2,196 (487) – 185 (91) 10,369Plant and machinery 1,013,939 49,725 (19,439) 10,903 (305,485) (25,231) 724,412Production tools and equipment 268,950 16,161 (6,251) 397 394 (7,070) 272,581Furniture, fittings, office equipment and
computers 203,640 34,231 (12,642) 301 1,650 (4,017) 223,163Transportation equipment and vehicles 17,932 1,417 (818) 66 (1,364) (300) 16,933Aircraft and aircraft engines 190,716 11,044 (4,628) 3 (519) (3,937) 192,679Construction-in-progress 28,957 92,949 (490) 322 (21,572) (948) 99,218
2,758,156 236,308 (52,964) 12,052 (342,781) (59,769) 2,551,002
12. Property, plant and equipment (continued)
Accumulated depreciation
As at1.1.2011
Depreciationcharge
for the yearDisposals/
write-off
Due todisposal of
subsidiariesReclassi-fications
Translationdifference
As at31.12.2011
$’000 $’000 $’000 $’000 $’000 $’000 $’000
The Group
At ValuationLeasehold land and buildings 1,919 – – – – – 1,919Wharves and slipways 1,490 – – – – – 1,490Syncrolift and floating docks 4,603 – – – – – 4,603Plant and machinery 1,694 – – – – – 1,694Furniture, fittings, office equipment and
computers 279 – – – – – 279
At CostFreehold land and buildings 18,978 883 (177) – 5 178 19,867Leasehold land and buildings 334,318 26,727 (7,146) (434) 6,410 2,254 362,129Improvements to premises 32,788 4,333 (2,156) (39) 389 168 35,483Wharves and slipways 23,030 749 – – – 26 23,805Syncrolift and floating docks 68,590 29 – – – – 68,619Boats and barges 4,782 52 – – – 12 4,846Plant and machinery 426,736 49,725 (24,015) (265) (6,386) 878 446,673Production tools and equipment 190,303 9,281 (2,890) – (137) 2,638 199,195Furniture, fittings, office equipment and
computers 151,937 23,451 (7,844) (343) (374) 204 167,031Transportation equipment and vehicles 12,917 2,126 (1,429) (88) (1,188) 122 12,460Aircraft and aircraft engines 44,733 8,193 (2,732) – – 1,119 51,313
1,319,097 125,549 (48,389) (1,169) (1,281) 7,599 1,401,406
146 147Singapore TechnologieS engineering lTd Annual Report 2012Making an impact

Notes to the Financial Statements31 December 2012(Currency - Singapore dollars unless otherwise stated)
Notes to the Financial Statements31 December 2012(Currency - Singapore dollars unless otherwise stated)
12. Property, plant and equipment (continued)
Accumulated depreciation
As at1.1.2012
Depreciation charge /
impairment losses*
for the yearDisposals/
write-off Reclassifications Translation difference
As at 31.12.2012
$’000 $’000 $’000 $’000 $’000 $’000
The Group
At ValuationLeasehold land and buildings 1,919 – – – – 1,919Wharves and slipways 1,490 – – – – 1,490Syncrolift and floating docks 4,603 – – – – 4,603Plant and machinery 1,694 – – – – 1,694Furniture, fittings, office equipment and computers 279 – – – – 279
At CostFreehold land and buildings 19,867 1,104 (590) (59) (1,162) 19,160Leasehold land and buildings 362,129 27,934 (2,494) (17,726) (4,412) 365,431Improvements to premises 35,483 4,814 (1,821) (1) (1,087) 37,388Wharves and slipways 23,805 767 – – (118) 24,454Syncrolift and floating docks 68,619 28 – – – 68,647Boats and barges 4,846 533 (487) 167 (91) 4,968Plant and machinery 446,673 42,269 (13,965) (89,444) (9,268) 376,265Production tools and equipment 199,195 9,362 (6,065) 89 (4,005) 198,576Furniture, fittings, office equipment and computers 167,031 26,419 (12,530) 26 (3,414) 177,532Transportation equipment and vehicles 12,460 2,101 (740) (1,326) (214) 12,281Aircraft and aircraft engines 51,313 8,504 (4,628) – (1,240) 53,949
1,401,406 123,835 (43,320) (108,274) (25,011) 1,348,636
* Includes impairment losses of $251,000.
12. Property, plant and equipment (continued)
Net book value2012 2011
$’000 $’000
The Group
At ValuationLeasehold land and buildings – –Wharves and slipways – –Syncrolift and floating docks – –Plant and machinery – –Furniture, fittings, office equipment and computers – –
At CostFreehold land and buildings 37,577 36,318Leasehold land and buildings 415,870 435,072Improvements to premises 21,780 22,065Wharves and slipways 11,066 11,796Syncrolift and floating docks 289 317Boats and barges 5,401 3,720Plant and machinery 348,147 567,266Production tools and equipment 74,005 69,755Furniture, fittings, office equipment and computers 45,631 36,609Transportation equipment and vehicles 4,652 5,472Aircraft and aircraft engines 138,730 139,403Construction-in-progress 99,218 28,957
1,202,366 1,356,750
Property, plant and equipment of net book value amounting to $223,982,000 (2011: $1,528,000) were reclassified to inventories (Note 21) and $10,525,000 (2011: nil) were reclassified to investment property (Note 17), due to changes in the use of these assets.
148 149Singapore TechnologieS engineering lTd Annual Report 2012Making an impact

Notes to the Financial Statements31 December 2012(Currency - Singapore dollars unless otherwise stated)
Notes to the Financial Statements31 December 2012(Currency - Singapore dollars unless otherwise stated)
12. Property, plant and equipment (continued)
Furniture, fittings,office equipment
and computers
Transportationequipment
and vehicles Total$’000 $’000 $’000
The Company
CostAs 1.1.2011 2,632 331 2,963Additions 1,398 398 1,796Disposals/write-off (282) (331) (613)As at 31.12.2011 3,748 398 4,146Additions 361 – 361As at 31.12.2012 4,109 398 4,507
Accumulated depreciationAs 1.1.2011 2,315 215 2,530Depreciation charge for the year 374 78 452Disposals/write-off (282) (270) (552)As at 31.12.2011 2,407 23 2,430Depreciation charge for the year 687 80 767As at 31.12.2012 3,094 103 3,197
Net book valueAs at 31.12.2012 1,015 295 1,310
As at 31.12.2011 1,341 375 1,716
(a) Property, plant and equipment at valuation
Certain property, plant and equipment, which are shown at valuation are stated at values arrived at by an independent firm of professional valuers on 30 November 1972, on the basis of open market value for existing use. As the property, plant and equipment were subject to a one-time revaluation prior to 1984, the Group is exempted from having a regular frequency of revaluation in subsequent years. These property, plant and equipment have been fully depreciated as at 31 December 2012 and 2011.
(b) Property, plant and equipment pledged as security
Property, plant and equipment of certain overseas subsidiaries of the Group with a carrying value of $92,071,000 (2011: $97,668,000) are pledged as security for bank loans.
12. Property, plant and equipment (continued)
(c) Property, plant and equipment under lease obligations
Included in the above are property, plant and equipment acquired under finance lease obligations with a net book value of:
Group2012 2011
$’000 $’000
Leasehold land and buildings – 438Transportation equipment and vehicles 171 293
171 731
(d) Major properties
(i) Freehold land and buildings
Land Net book valueLocation Description area 2012 2011
(sq. m.) $’000 $’000
USA
13442 Emerson RoadKidron, Ohio Industrial buildings 68,351 1,047 1,152
300 Hackney Ave,Independence, Kansas Industrial buildings 117,358 4,525 1,601
400 Hackney Ave,Washington, North Carolina Industrial buildings 39,942 1,496 1,662
914 Saegers Station Drive,Montgomery, Pennsylvania Industrial buildings 122,659 4,371 3,648
7801 Trinity Drive,Escatawpa, Mississippi Shipyard and buildings 839,564 3,583 4,092
5801 Elder Ferry Road,Moss Point, Mississippi Shipyard and buildings 227,151 3,846 3,816
900 Bayou Casotte Parkway,Pascagoula, Mississippi Shipyard and buildings 331,803 13,633 14,500
3800 Richardson Road South,Hope Hull, Alabama Production facility 8,361 2,818 3,227
Australia
2 Bowral PlaceBallarat, Victoria
Office building and trainingclassrooms 7,714 1,725 1,866
150 151Singapore TechnologieS engineering lTd Annual Report 2012Making an impact

Notes to the Financial Statements31 December 2012(Currency - Singapore dollars unless otherwise stated)
Notes to the Financial Statements31 December 2012(Currency - Singapore dollars unless otherwise stated)
12. Property, plant and equipment (continued)
(d) Major properties (continued)
(ii) Leasehold land, buildings and improvements
Land Net book valueLocation Description Tenure area 2012 2011
(sq. m.) $’000 $’000
Singapore
501 Airport Road Factory and office building 20 years from 1.6.1993 23,899 4,208 4,559
503 Airport Road Factory and office building 20 years from 1.6.1993 7,175 445 507
505 Airport Road Lots 087066, 087M, 0870C and 99703 MK22
Jet engine test cell 3 years from 1.7.2009 5,317 17,055 18,826
540 Airport Road Warehouse and office building 30 years from 15.8.1985 5,850 456 601
Hangar and office building 30 years from 1.1.1984 18,918 889 1,396
8 Changi North Way Hangar and office building 30 years from 1.1.1992 75,713 23,156 25,252
Hangar and office building 22.5 years from 16.6.1999 14,860 2,361 2,502
Hangar and office building 16.3 years from 20.8.2005 9,764 10,212 10,572
102 Gul Circle Factory and office building 30 years from 17.7.2012 6,857 8,451 –
540 Airport Road Hangars and office building 2 years lease from 1.7.2012 *
48,882 19,410 20,958
Seletar West Camp Hangars and office building 31.7 years lease from 5.1.2009
26,650 32,365 26,723
24 Ang Mo Kio Street 65 Industrial and commercial buildings
30 years from 1.12.2012 23,970 5,903 6,914
100 Jurong East Street 21 Industrial and commercial buildings
30 years from 1.11.1988, renewable to 2048
11,232 6,767 7,119
5 Ubi Close ^ Car show room cum workshop 30 years from 1.8.1994 to 31.7.2024
6,165 – 11,097
33 Tuas Avenue 2 Factory and office building 30 years from 1.4.1996 to 31.3.2026
6,669 2,084 2,086
16 Benoi Crescent Industrial and commercial buildings
30 years from 16.7.1989 to 15.7.2019
6,981 2,062 2,215
12. Property, plant and equipment (continued)
(d) Major properties (continued)
(ii) Leasehold land, buildings and improvements (continued)
Land Net book valueLocation Description Tenure area 2012 2011
(sq. m.) $’000 $’000
Singapore
249 Jalan Boon Lay Industrial and commercial buildings
27 years from 1.10.2001 to 31.12.2028, renewable to 10.10.2065
201,031 110,825 112,986
16 Tuas Avenue 7 Industrial buildings 30 years from 16.8.1983 to 15.8.2013
12,029 188 373
601 Rifle Range Road Industrial buildings Renewable every year * 1,380,983 858 1,025
15 Chin Bee Drive Industrial buildings 60 years from 1.8.1973 to 31.7.2033
39,640 22,402 23,985
16 Benoi Road Administrative offices and workshop
56 years from 1.6.1969 20,224 7,329 3,083
7 Benoi Road Buildings, foreshore and workshops
56 years from 1.6.1969 103,802 13,059 14,510
60 Tuas Road Buildings, foreshore and workshops
30 years from 1.12.1992 125,262 4,211 4,296
30/36 Kian Teck Avenue Workers’ dormitory 30 years from 1.9.1995 3,908 3,701 3,994
USA
2100 9th Street Brookley Complex,Mobile, Alabama
Hangar and office building 22 years from 1.1.1991 103,825 10,075 11,331
9800 John Saunders Road, San Antonio, Texas
Hangar and office building 16.6 years from 1.6.2002 255,121 22,757 23,899
People’s Republic of China
No 2, Huayu Road, Huli District, Xiamen 361006, Fujian
Leasehold land for factory building
50 years from 20.11.2008 38,618 47,774 51,235
97 Zhong Cao Road, Guiyang, Guizhou
Leasehold land, industrial and commercial buildings
50 years from 26.2.2008 to 21.2.2058
242,662 21,060 22,656
No. 555 Kanghua Road, Kangqiao Industrial Zone, Shanghai
Leasehold land 50 years from 12.6.2003 to 27.7.2052
15,898 – 780
152 153Singapore TechnologieS engineering lTd Annual Report 2012Making an impact

Notes to the Financial Statements31 December 2012(Currency - Singapore dollars unless otherwise stated)
Notes to the Financial Statements31 December 2012(Currency - Singapore dollars unless otherwise stated)
12. Property, plant and equipment (continued)
(d) Major properties (continued)
(ii) Leasehold land, buildings and improvements (continued)
Land Net book valueLocation Description Tenure area 2012 2011
(sq. m.) $’000 $’000
People’s Republic of China
6 Kuang Ji Road,Zhenjiang, Jiangsu
Leasehold land, industrial and commercial buildings
40 years from 21.5.2009 to 21.3.2049
76,711 8,550 9,457
1 Ding Mao Wei San Road, Zhenjiang, Jiangsu
Leasehold land, industrial and commercial buildings
46.5 years from 21.5.2006 to 5.12.2052
55,883 8,410 9,480
Republic of Panama
Bryant Ave,Howard Balboa
Hangar and office building 20 years from 18.8.2006 36,278 – 2,039
* This relates to buildings constructed by subsidiaries on properties rented from the Ministry of Defence Singapore on leases which are renewable from one to three years. In view of the relationship between the landlord and the subsidiaries, the cost of the buildings is depreciated over the period of intended use, i.e. 30 years.
^ The property was reclassified to investment property from property, plant and equipment during the year as it was no longer owner-occupied. The property is currently held for rental and capital appreciation.
13. SubsidiariesCompany
2012 2011$’000 $’000
Unquoted shares, at cost: Singapore Technologies Aerospace Ltd 142,626 142,626 Singapore Technologies Electronics Limited 26,982 26,982 Singapore Technologies Kinetics Ltd 61,938 61,938 Singapore Technologies Marine Ltd 56,000 56,000 Vision Technologies Systems, Inc. 359,021 299,117 Singapore Technologies Dynamics Pte Ltd 6,000 6,000 ST Synthesis Pte Ltd 4,656 4,656 FusionTech Pte. Ltd. 1,000 1,000 Kaz-ST Engineering Bastau Limited Liability Partnership 578 578 ST Engineering Financial I Ltd. – * – * ST Engineering Financial II Pte. Ltd. – * – *
658,801 598,897Impairment in subsidiaries (7,000) (7,000)Carrying amount after impairment in subsidiaries 651,801 591,897Capital contribution in the form of share options, performance shares and
restricted shares issued to employees of subsidiaries 87,191 71,720738,992 663,617
* Amount less than $1,000
13. Subsidiaries (continued)
Details of the subsidiaries are as follows:
Effective equity interest held by the Group
2012 2011% %
(a) Singapore Technologies Aerospace Ltd and its subsidiaries 100 100
ST Aerospace Engineering Pte Ltd and its subsidiaries: 100 100 ST PAE Holdings Pty Ltd and its subsidiaries 100 100 Aerospace Engineering Services Pty Ltd @ 100 50 Aerospace Engineering Services Pty Ltd Unit Trust @ 100 50 Pacific Flight Services Pte Ltd 100 100 Pacific Flight Services Pty Ltd 100 100 ST Aerospace Academy Pte. Ltd. and its subsidiary: 100 100 Aviation Training Academy Australia Pty Ltd and its subsidiary: 100 100 ST Aerospace Academy (Australia) Pty Ltd 100 100ST Aerospace Engines Pte Ltd and its subsidiary: 100 100 ST Aerospace Technologies (Xiamen) Company Limited 80 80ST Aerospace Systems Pte Ltd 100 100ST Aerospace Supplies Pte Ltd and its subsidiaries: 100 100 iShopAero Pte Ltd 100 100 ST Aerospace Guangzhou Aero-Technologies & Engineering Co Ltd. 100 100ST Aerospace International Structures Pte Ltd 100 100ST Aviation Resources Pte Ltd and its subsidiary: 100 100 ST Aviation Resources 1 Limited ^ – 100ST Aerospace Services Co Pte. Ltd. 80 80Singapore Technologies Engineering (Europe) Ltd 100 100Singapore Aerospace Kabushiki Kaisha 100 100Visiontech Investment Pte Ltd 100 100Visiontech Engineering Pte Ltd 51 51Singapore British Engineering (Pte) Ltd 51 51ST Aerospace Solutions (Europe) A/S and its subsidiary: 100 100 Airline Rotables (UK Holdings) Limited and its subsidiary: 100 100 Airline Rotables Limited 100 100ST Aerospace Panama, Inc. 100 100ST Aerospace Rotables Pte. Ltd. 100 –Precision Products Singapore Pte Ltd 100 100
154 155Singapore TechnologieS engineering lTd Annual Report 2012Making an impact

Notes to the Financial Statements31 December 2012(Currency - Singapore dollars unless otherwise stated)
Notes to the Financial Statements31 December 2012(Currency - Singapore dollars unless otherwise stated)
13. Subsidiaries (continued)
Effective equity interest held by the Group
2012 2011% %
(b) Singapore Technologies Electronics Limited and its subsidiaries 100 100
SEEL Electronic & Engineering Sdn Bhd 100 100ST Electronics (Info-Software Systems) Pte. Ltd. and its subsidiaries: 100 100 INFA Systems Limited 100 100 ST Electronics (Software Services) Limited 100 100 ST Electronics (e-Services) Pte. Ltd. and its subsidiary: 100 100 Knowledge Alive Pte. Ltd. and its subsidiary: 100 100 COMAT Training Services Pte Ltd 100 100 ST Electronics (Data Centre Solutions) Pte. Ltd. and its subsidiaries: 100 100 PMB Project Management Business Sdn Bhd 100 100 PM-B (China) Ltd 100 100ST Electronics (Training & Simulation Systems) Pte. Ltd. and its subsidiaries: 100 100 ST Electronics (Digital Media) Pte. Ltd. 100 100 Antycip Simulation Limited and its subsidiary: 93 93 Antycip Simulation SAS 93 93 ST Education & Training Private Limited and its subsidiaries: 70 70 STET Homeland Security Services Pte. Ltd. 70 70 STET Maritime Pte. Ltd. 70 70 MERITS Technologies LLP 51 51ST Electronics (Info-Comm Systems) Pte. Ltd. and its subsidiaries: 100 100 ST Electronics (Info-Security) Pte. Ltd. and its subsidiary: 100 100 DataMark Technologies Pte Ltd 100 100 STELCOMMS Pte. Ltd. 51 51 Telematics Wireless Ltd. and its subsidiary: 100 97.15 Telematics Wireless USA Corp 100 97.15ST Electronics (Satcom & Sensor Systems) Pte. Ltd. and its subsidiaries: 100 100 ST Electronics (Sichuan) Co., Ltd 100 100 iDirect Asia Pte. Ltd. 100 100ST Electronics (Shanghai) Co., Ltd 100 100iTS Technologies Pte Ltd 100 100ST Electronics (Taiwan) Limited 100 100STELOP Pte. Ltd. 50.05 50.05TranSys Pte Ltd ^^ – 100
13. Subsidiaries (continued)
Effective equity interest held by the Group
2012 2011% %
(c) Singapore Technologies Kinetics Ltd and its subsidiaries 100 100
SDG Kinetics Pte. Ltd. and its subsidiary: 100 100 LeeBoy India Construction Equipment Private Limited 97.9 97.9Mobility Systems Pte Ltd and its subsidiaries: 100 100 Silvatech Global Systems Limited 100 100 Silvatech Systems Corporation Pte Ltd and its subsidiary: 100 100 Kinetics Drive Solutions Inc. 100 100STA Inspection Pte Ltd 100 100Singapore Commuter Private Limited and its subsidiaries: 100 100 Jiangsu Huatong Kinetics Co., Ltd. 75.3 75.3 Jiangsu Huaran Kinetics Co., Ltd. 75.3 75.3Securedge Pte. Ltd. 100 100STA Investment Pte Ltd 100 100ST Kinetics International Pte. Ltd. and its subsidiary: 100 100 VT Hackney, S.A. de C.V. 100 100SDDA Pte. Ltd. and its subsidiary: 100 100 Kinetics Link Services Sdn. Bhd. 60 60ST Kinetics Integrated Engineering Pte. Ltd. 100 100Singapore Test Services Private Limited 100 100ST Kinetics Pte. Ltd. 100 100Advanced Material Engineering Pte. Ltd. and its subsidiaries: 100 100 Advanced Pyrotechnic Materials Private Limited 51 51 SMART Systems Pte Ltd @ 51 50Unicorn International Pte Limited 100 100Allied Ordnance of Singapore (Pte) Limited 100 100Ordnance Development and Engineering Company of Singapore (1996) Private Limited 100 100Autonomous Technology Pte Ltd and its subsidiary: 100 100 Guizhou Jonyang Kinetics Co., Ltd. 60 60Kinetics Systems (Shanghai) Co., Ltd. 100 100STAR Automotive Center (Zhejiang) Co., Ltd. @@ – 100
(d) Singapore Technologies Marine Ltd and its subsidiaries 100 100
STSE Engineering Services Pte Ltd and its subsidiaries: 100 100 STSE (Shanghai) Co. Ltd. 100 100 STSE Engineering Services (B) Sdn Bhd 100 100Hovertrans Solutions Pte. Ltd. 51 51ST Marine (Wuhan) Engineering Design Consultancy Co. Ltd. 100 100
156 157Singapore TechnologieS engineering lTd Annual Report 2012Making an impact

Notes to the Financial Statements31 December 2012(Currency - Singapore dollars unless otherwise stated)
Notes to the Financial Statements31 December 2012(Currency - Singapore dollars unless otherwise stated)
13. Subsidiaries (continued)
Effective equity interest held by the Group
2012 2011% %
(e) Vision Technologies Systems, Inc. and its subsidiaries 100 100
VT Systems, Inc. 100 100Vision Technologies Aerospace, Incorporated and its subsidiaries: 100 100 ST Aerospace Mobile, Inc. 100 100 DalFort Aerospace GP, Inc. 100 100 DalFort Aerospace, L.P. 100 100 San Antonio Aerospace GP, LLC 100 100 ST Aerospace San Antonio, L.P. 100 100 DRB Aviation Consultants, Inc. 100 100 EcoServices, LLC 50.1 – Volant Aerospace, LLC 100 –Vision Technologies Electronics, Inc. and its subsidiary: 100 100 VT iDirect, Inc. and its subsidiaries: 100 100 iDirect Hong Kong Limited 100 100 iDirect UK Limited and its subsidiary: 100 100 Parallel Limited 100 100 iDirect Italy S.r.l. 100 100 iDirect International, Inc. 100 100 iDirect Government Technologies, Inc. 100 100 VT iDirect Canada, Inc. 100 100 Intelect Technologies, LLC 100 100Vision Technologies Kinetics, Inc. and its subsidiaries: 100 100 Miltope Corporation and its subsidiary: 100 100 IV Phoenix Group, Inc. 97 95 MÄK Technologies, Inc. 100 90Vision Technologies Land Systems, Inc. and its subsidiaries: 100 100 VT Dimensions, Inc. 100 100 VT LeeBoy, Inc. 100 100 VT Hackney, Inc. 100 100Vision Technologies Marine, Inc. and its subsidiary: 100 100 VT Halter Marine, Inc. 100 100VT Systems International, LLC 100 100 VT Systems Participações Ltda. 100 100
(f) Singapore Technologies Dynamics Pte Ltd 100 100
(g) ST Synthesis Pte Ltd 100 100
(h) FusionTech Pte. Ltd. 100 100
(i) Kaz-ST Engineering Bastau Limited Liability Partnership 51 51
13. Subsidiaries (continued)
Effective equity interest held by the Group
2012 2011% %
(i) ST Engineering Financial I Ltd. 100 100
(k) ST Engineering Financial II Pte. Ltd. 100 100
@ During the year, following additional acquisition of equity interests, these companies became subsidiaries of the Group.
^ The company was dissolved during the year.
^^ The company was struck off from the Registrar of the Accounting and Regulatory Authority during the year.
@@ The company was liquidated during the year.
Further details of the subsidiaries are as follows:
Name of subsidiary Principal activities
Country of incorporation/
place of business
Singapore Technologies Aerospace Ltd Investment holding and provision of engineering, marketing and engineering support services
Singapore
ST Aerospace Engineering Pte Ltd Repair, maintenance and servicing of aircraft Singapore
ST PAE Holdings Pty Ltd Investment holding Australia
Aerospace Engineering Services Pty Ltd Maintenance and servicing of aircraft Australia
Aerospace Engineering Services Pty Ltd Unit Trust Trustee of unit trust fund Australia
Pacific Flight Services Pte Ltd Providing air transport services Singapore
Pacific Flight Services Pty Ltd Flight training school operation and aircraft management Australia
ST Aerospace Academy Pte. Ltd. Flight training school operation and aircraft management Singapore
Aviation Training Academy Australia Pty Ltd Flight training school operation and aircraft management Australia
ST Aerospace Academy (Australia) Pty Ltd Flight training school operation and aircraft management Australia
ST Aerospace Engines Pte Ltd Repair and overhaul of engines Singapore
ST Aerospace Technologies (Xiamen) Company Limited Repair and overhaul of engines People’s Republic of China
ST Aerospace Systems Pte Ltd Service, repair and overhaul of aircraft components Singapore
158 159Singapore TechnologieS engineering lTd Annual Report 2012Making an impact

Notes to the Financial Statements31 December 2012(Currency - Singapore dollars unless otherwise stated)
Notes to the Financial Statements31 December 2012(Currency - Singapore dollars unless otherwise stated)
13. Subsidiaries (continued)
Name of subsidiary Principal activities
Country of incorporation/
place of business
ST Aerospace Supplies Pte Ltd Trading, Maintenance-By-The-Hour services for component and repair management, warehousing services for aircraft equipment, parts and components and provision of jet fuel services
Singapore
iShopAero Pte Ltd Trading, e-commerce and information technology related services for the aerospace industry
Singapore
ST Aerospace Guangzhou Aero-Technologies & Engineering Co Ltd.
Import/export for aircraft component leasing, repair, exchange and trading, warehousing, packaging, distribution and other related services
People’s Republic of China
ST Aerospace International Structures Pte Ltd Designing, developing and manufacturing aircraft, engines, equipment, accessories, components and such other parts
Singapore
ST Aviation Resources Pte Ltd Investment holding Singapore
ST Aerospace Services Co Pte. Ltd. Repair, maintenance, modification and servicing of commercial aircraft Singapore
Singapore Technologies Engineering (Europe) Ltd Providing marketing and investment services to the Group UnitedKingdom
Singapore Aerospace Kabushiki Kaisha # Providing marketing services to the Group Japan
Visiontech Investment Pte Ltd Investment holding Singapore
Visiontech Engineering Pte Ltd Provision of engineering services for the repair, maintenance and modification of aircraft, aircraft equipment and components
Singapore
Singapore British Engineering (Pte) Ltd ∆ Dormant Singapore
ST Aerospace Solutions (Europe) A/S Supply of aircraft components, including purchase, maintenance and logistics services
Denmark
Airline Rotables (UK Holdings) Limited Investment holding UnitedKingdom
Airline Rotables Limited Providing component management and support services for aircraft UnitedKingdom
ST Aerospace Panama, Inc. + Repair and maintenance of aircraft Republic of Panama
ST Aerospace Rotables Pte. Ltd. Trading, leasing and asset services of rotables Singapore
Precision Products Singapore Pte Ltd Manufacture and sale of investment castings, mould toolings and precision formings
Singapore
13. Subsidiaries (continued)
Name of subsidiary Principal activities
Country of incorporation/
place of business
Singapore Technologies Electronics Limited Design, development, supply, installation, integration and maintenance of transportation, intelligent building, defence electronics and communication systems
Singapore
SEEL Electronic & Engineering Sdn Bhd Sales of electronic instruments and equipment, electronic engineering and systems integration services and maintenance and calibration of electronic equipment
Malaysia
ST Electronics (Info-Software Systems) Pte. Ltd. Design, development and supply of real-time/mission critical systems and provision of related maintenance services
Singapore
INFA Systems Limited Provision of services in consulting, designing and developing systems integration, the maintenance and support of operational and computer systems and sales and distribution of system equipment
Hong Kong
ST Electronics (Software Services) Limited Providing IT outsourcing services, software applications development and turnkey solutions
People’s Republic of China
ST Electronics (e-Services) Pte. Ltd. Providing shared services to government ministries, agencies and enterprises
Singapore
Knowledge Alive Pte. Ltd. Offer technologically-driven learning and knowledge solutions, products and services to corporate, tertiary and workforce markets
Singapore
COMAT Training Services Pte Ltd Operating a computer training school, providing training in computer software and applications
Singapore
ST Electronics (Data Centre Solutions) Pte. Ltd. Relate to mechanical, electrical and engineering works to design, build and provide facility management services for mission critical environments such as data centres, disaster recovery and business continuity sites
Singapore
PMB Project Management Business Sdn Bhd Relate to mechanical, electrical and engineering works to design, build and provide facility management services for mission critical environments such as data centres, disaster recovery and business continuity sites
Malaysia
PM-B (China) Ltd * Dormant People’s Republic of China
ST Electronics (Training & Simulation Systems) Pte. Ltd. Design, development, supply, integration and maintenance of training and simulation systems, distribution of games, edutainment and animation programs and the sales and licensing of related products, merchandise and rights
Singapore
160 161Singapore TechnologieS engineering lTd Annual Report 2012Making an impact

Notes to the Financial Statements31 December 2012(Currency - Singapore dollars unless otherwise stated)
Notes to the Financial Statements31 December 2012(Currency - Singapore dollars unless otherwise stated)
13. Subsidiaries (continued)
Name of subsidiary Principal activities
Country of incorporation/
place of business
ST Electronics (Digital Media) Pte. Ltd. Design, development and manufacture of computers and data processing systems, provision of services for the processing and maintenance of data and information, and production of animation pictures
Singapore
Antycip Simulation Limited Investment holding and acting as a selling agent of software and incidental hardware to the defence industry and education establishments
UnitedKingdom
Antycip Simulation SAS A value added reseller/distributor of simulation products and provision of simulation sub-system/components solutions
France
ST Education & Training Private Limited Provision of education and training, management and consultancy services for operational and technical domains of maritime, aerospace and land services industries
Singapore
STET Homeland Security Services Pte. Ltd. Provision of security consultancy, solutions implementation and training Singapore
STET Maritime Pte. Ltd. Provision of marine audit, survey and consultancy services Singapore
MERITS Technologies LLP # Dormant Kazakhstan
ST Electronics (Info-Comm Systems) Pte. Ltd. Design and development, systems integration, manufacturing and sale of communication equipment, GPS-based fleet management system, traffic management system, info appliances and defence electronics
Singapore
ST Electronics (Info-Security) Pte. Ltd. Design, development, sale and provision of technical support for information security products, solutions and services
Singapore
DataMark Technologies Pte Ltd Development and provision of digital water-marking and related solutions Singapore
STELCOMMS Pte. Ltd. To undertake design and integration of projects in the area of communications network and systems and to market and trade in communications related products and subsystems
Singapore
Telematics Wireless Ltd. Development, manufacture, and marketing of products for locating and directing vehicles, other mobile and stationary objects, people, equipment and merchandise, systems for managing vehicular fleets, systems for locating and thwarting car thefts, vehicular wireless equipment and communications for purposes of identification and provision of information, electronic toll-road systems, and electronic systems for reading water meters
Israel
Telematics Wireless USA Corp # Serves as a local point of contact for Telematics Wireless Ltd.’s customers for payments and Return Material Authorization support
USA
13. Subsidiaries (continued)
Name of subsidiary Principal activities
Country of incorporation/
place of business
ST Electronics (Satcom & Sensor Systems) Pte. Ltd. Manufacture of microwave components and sub-systems, system integration and provision of related repairs and maintenance for the telecommunications and defence electronics industries
Singapore
ST Electronics (Sichuan) Co., Ltd Manufacturing and maintenance of communication and other related apparatus and consultant service of telecommunication technology
People’s Republic of China
iDirect Asia Pte. Ltd. Marketing and sales, design, manufacture & engineering services for electronics and communication systems
Singapore
ST Electronics (Shanghai) Co., Ltd Development and manufacturing of monitoring and control systems, microwave systems, training and simulation systems, security systems, metro passenger information systems, metro automated fare collection systems, metro platform screen door systems, integrated transportation systems (including fleet management systems, urban transport management systems, highway management systems, etc.), metro transmission and communication systems, EMC electromagnetic products and software; sale of product manufactured, system integration, after-sales, and consultancy services for the above mentioned products. Engineering contractor for building intelligent projects (involving administrative licensing will need approved certification).
People’s Republic of China
iTS Technologies Pte Ltd Investment holding Singapore
ST Electronics (Taiwan) Limited Provide integration for large-scale system projects in rail, expressway and intelligent building management solutions
Taiwan
STELOP Pte. Ltd. Design and development, manufacturing, maintaining and sale of electro-optical products and systems and the provision of related services
Singapore
Singapore Technologies Kinetics Ltd Provision of design and engineering services, manufacture, sales and knowhow transfer of military and commercial vehicles, automotive subsystems, armament, weapons, weapon systems, ammunition and explosives and the provision of engineering services for assembly, upgrading/modifications, maintenance, repair and overhaul of vehicles and weapon systems, and trading in motor vehicles, equipment, vehicle spares and related accessories
Singapore
SDG Kinetics Pte. Ltd. Investment holding Singapore
LeeBoy India Construction Equipment Private Limited Design, manufacture, sales, distribution and aftersales support of construction equipment
India
Mobility Systems Pte Ltd Investment holding Singapore
162 163Singapore TechnologieS engineering lTd Annual Report 2012Making an impact

Notes to the Financial Statements31 December 2012(Currency - Singapore dollars unless otherwise stated)
Notes to the Financial Statements31 December 2012(Currency - Singapore dollars unless otherwise stated)
13. Subsidiaries (continued)
Name of subsidiary Principal activities
Country of incorporation/
place of business
Silvatech Global Systems Limited # z Owns the intellectual property rights to electro-hydraulic drive, hydro-mechanical and electro-mechanical continuously variable transmissions technologies, and equipment powered by such drives
British Virgin Islands
Silvatech Systems Corporation Pte Ltd Designing, manufacturing, marketing and managing licences of technologies and products using electro-hydraulic drive, hydro-mechanical and electro-mechanical continuously variable transmissions, and equipment powered by such drives, globally
Singapore
Kinetics Drive Solutions Inc. # z Research and development, manufacturing and sales of electro-hydraulic drive, hydro-mechanical and electro-mechanical continuously variable transmissions technologies, and equipment powered by such drives
Canada
STA Inspection Pte Ltd Dormant Singapore
Singapore Commuter Private Limited Investment holding Singapore
Jiangsu Huatong Kinetics Co., Ltd. Manufacture and sale of paving, mixing, road maintenance and compaction equipment and other road construction machineries
People’s Republic of China
Jiangsu Huaran Kinetics Co., Ltd. Manufacture and sale of engineering machinery and equipment People’s Republic of China
Securedge Pte. Ltd. Provision of design and engineering services, manufacture and sales of security related products, and the provision of equipment maintenance services
Singapore
STA Investment Pte Ltd Investment dealing Singapore
ST Kinetics International Pte. Ltd. Investment holding Singapore
VT Hackney S.A. de C.V. Manufacture and marketing of specialised aluminium drop-frame truck bodies and trailers
Mexico
SDDA Pte. Ltd. Assembling and marketing of diesel engines and related products and the provision of technical services, field services, repair and maintenance services
Singapore
Kinetics Link Services Sdn. Bhd. Assembling, distributing and marketing of port handling equipment, diesel engines and related products, and the provision of technical services, field services and maintenance services
Malaysia
ST Kinetics Integrated Engineering Pte. Ltd. Provision of customised solutions, products for defence and commercial markets
Singapore
13. Subsidiaries (continued)
Name of subsidiary Principal activities
Country of incorporation/
place of business
Singapore Test Services Private Limited Provision of professional engineering consultancy, tests, inspection, certification and related services, inspection of heavy goods vehicles, light vehicles, motor cars, buses and motorcycles, provision of vehicle inspection, project management as well as provision of independent damage assessment services
Singapore
ST Kinetics Pte. Ltd. Trading and marketing Singapore
Advanced Material Engineering Pte. Ltd. Provision of design and engineering services, manufacture, sales, disposal and knowhow transfer of precision munitions, ammunition, armament, weapon systems, military equipment, explosives, hand-grenades, thunder-flashes, pyrotechnic products and gunpowder and the provision of engineering services for assembly, upgrading/ modifications, maintenance, repair and overhaul of ammunition and weapon systems, and related services
Singapore
Advanced Pyrotechnic Materials Private Limited Manufacture and sale of pyrotechnic products Singapore
SMART Systems Pte Ltd Life systems integration of weapon system Singapore
Unicorn International Pte Limited Trading and marketing Singapore
Allied Ordnance of Singapore (Pte) Limited Provision of design and engineering services, manufacture, sales and knowhow transfer of armament, weapons, weapon systems, ammunition, explosives, weapon magazines, military equipment, machines, tools, spares and components and the provision of engineering services for assembly, upgrading/modification, maintenance, repair and overhaul of guns and weapons systems, and related services
Singapore
Ordnance Development and Engineering Company of Singapore (1996) Private Limited
Dormant Singapore
Autonomous Technology Pte Ltd Investment holding Singapore
Guizhou Jonyang Kinetics Co., Ltd. Design, manufacture, sales and service support of construction, engineering and industrial-related machinery and accessories, provide engineering consultancy services to engineering and manufacturing companies, provide rental of own-manufactured machinery and accessories
People’s Republic of China
Kinetics Systems (Shanghai) Co., Ltd. Manufacture and sale of vehicle drive systems, industrial drive motors and small external combustion engines
People’s Republic of China
Singapore Technologies Marine Ltd Construction and repair of naval and commercial vessels, design, integration, fabrication, installation of military and commercial engineering equipment and the provision of engineering consultancy and technical management services
Singapore
164 165Singapore TechnologieS engineering lTd Annual Report 2012Making an impact

Notes to the Financial Statements31 December 2012(Currency - Singapore dollars unless otherwise stated)
Notes to the Financial Statements31 December 2012(Currency - Singapore dollars unless otherwise stated)
13. Subsidiaries (continued)
Name of subsidiary Principal activities
Country of incorporation/
place of business
STSE Engineering Services Pte Ltd Design, manufacture, maintain and operate environmental infrastructures and provide planning, consultancy services in environmental and renewable energy management solutions
Singapore
STSE (Shanghai) Co. Ltd. Design, development, manufacturing, sales, after-sales services and consulting services of equipment for environmental protection projects; wholesale, import and export and related business of similar products; consulting services for environmental projects information, consulting services for commercial information
People’s Republic of China
STSE Engineering Services (B) Sdn Bhd Design, manufacture, maintain and operate environmental infrastructures and provide planning, consultancy services in environmental and renewable energy management solutions
Brunei
Hovertrans Solutions Pte. Ltd. Design, marketing and solutioning for employment of heavy lift air cushion marine vessel for use in oil and gas, transportation and other civil engineering purposes
Singapore
ST Marine (Wuhan) Engineering Design Consultancy Co. Ltd.
To provide industrial engineering design, research and development and consultancy services
People’s Republic of China
Vision Technologies Systems, Inc. # Investment holding USA
VT Systems, Inc. # Providing investment and associated services to the Group USA
Vision Technologies Aerospace, Incorporated # Investment holding USA
ST Aerospace Mobile, Inc. # z Repair and maintenance of aircraft USA
DalFort Aerospace GP, Inc. # Dormant USA
DalFort Aerospace, L.P. ++ Dormant USA
San Antonio Aerospace GP, LLC # Investment holding USA
ST Aerospace San Antonio, L.P. # z Repair and maintenance of aircraft USA
DRB Aviation Consultants, Inc. # z Provision of aircraft engineering services USA
EcoServices, LLC # z Provision of engine wash services USA
Volant Aerospace, LLC # ∞ Providing new or refurbishment of aircraft interior parts; support services and aircraft interior configuration services
USA
Vision Technologies Electronics, Inc. # Investment holding USA
13. Subsidiaries (continued)
Name of subsidiary Principal activities
Country of incorporation/
place of business
VT iDirect, Inc. # z Design, develop and market two-way internet protocol – (IP) based broadband satellite networking solutions that deliver voice, data and video services to enterprise and government customer locations worldwide
USA
iDirect Hong Kong Limited Markets two-way internet protocol – (IP) based broadband satellite networking solutions
Hong Kong
iDirect UK Limited Markets two-way internet protocol – (IP) based broadband satellite networking solutions
UnitedKingdom
Parallel Limited Software development and associated services; installation, configuration, consultancy and support
UnitedKingdom
iDirect Italy S.r.l. # z Markets two-way internet protocol – (IP) based broadband satellite networking solutions
Italy
iDirect International, Inc. # z Markets two-way internet protocol – (IP) based broadband satellite networking solutions
USA
iDirect Government Technologies, Inc. # z Design, develop and market two-way internet protocol – (IP) based broadband satellite networking solutions that deliver voice, data and video services to government customers
USA
VT iDirect Canada, Inc. # z Research and development Canada
Intelect Technologies, LLC # z Development and supply of a family of multi-access optical networking equipment
USA
Vision Technologies Kinetics, Inc. # Investment holding USA
Miltope Corporation # z Development of computers and peripheral equipment for rugged and other specialized applications for military and commercial customers, both domestic and international
USA
IV Phoenix Group, Inc. # Dormant USA
MÄK Technologies, Inc. # z Develop and supply software products and services for Networked Synthetic Environments
USA
Vision Technologies Land Systems, Inc. # Investment holding USA
VT Dimensions, Inc. # Investment holding and licensing of intellectual properties USA
166 167Singapore TechnologieS engineering lTd Annual Report 2012Making an impact
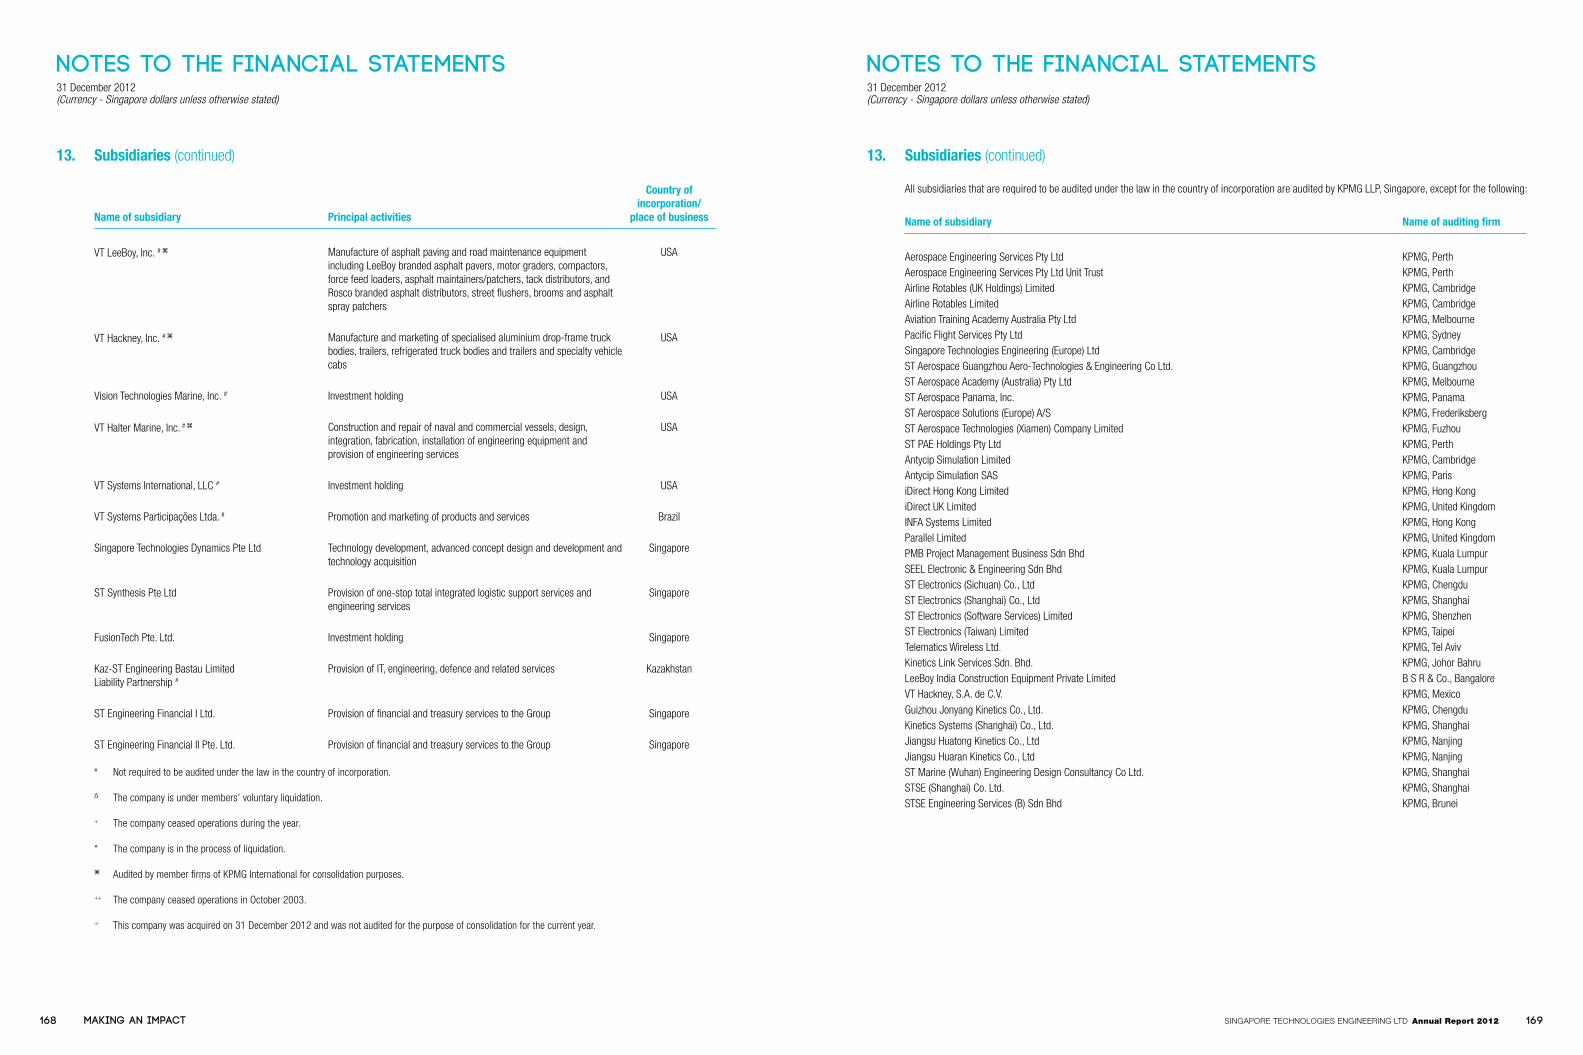
Notes to the Financial Statements31 December 2012(Currency - Singapore dollars unless otherwise stated)
Notes to the Financial Statements31 December 2012(Currency - Singapore dollars unless otherwise stated)
13. Subsidiaries (continued)
Name of subsidiary Principal activities
Country of incorporation/
place of business
VT LeeBoy, Inc. # z Manufacture of asphalt paving and road maintenance equipment including LeeBoy branded asphalt pavers, motor graders, compactors, force feed loaders, asphalt maintainers/patchers, tack distributors, and Rosco branded asphalt distributors, street flushers, brooms and asphalt spray patchers
USA
VT Hackney, Inc. # z Manufacture and marketing of specialised aluminium drop-frame truck bodies, trailers, refrigerated truck bodies and trailers and specialty vehicle cabs
USA
Vision Technologies Marine, Inc. # Investment holding USA
VT Halter Marine, Inc. # z Construction and repair of naval and commercial vessels, design, integration, fabrication, installation of engineering equipment and provision of engineering services
USA
VT Systems International, LLC # Investment holding USA
VT Systems Participações Ltda. # Promotion and marketing of products and services Brazil
Singapore Technologies Dynamics Pte Ltd Technology development, advanced concept design and development and technology acquisition
Singapore
ST Synthesis Pte Ltd Provision of one-stop total integrated logistic support services and engineering services
Singapore
FusionTech Pte. Ltd. Investment holding Singapore
Kaz-ST Engineering Bastau Limited Liability Partnership #
Provision of IT, engineering, defence and related services Kazakhstan
ST Engineering Financial I Ltd. Provision of financial and treasury services to the Group Singapore
ST Engineering Financial II Pte. Ltd. Provision of financial and treasury services to the Group Singapore
# Not required to be audited under the law in the country of incorporation.
∆ The company is under members’ voluntary liquidation.
+ The company ceased operations during the year.
* The company is in the process of liquidation.
z Audited by member firms of KPMG International for consolidation purposes.
++ The company ceased operations in October 2003.
∞ This company was acquired on 31 December 2012 and was not audited for the purpose of consolidation for the current year.
13. Subsidiaries (continued)
All subsidiaries that are required to be audited under the law in the country of incorporation are audited by KPMG LLP, Singapore, except for the following:
Name of subsidiary Name of auditing firm
Aerospace Engineering Services Pty Ltd KPMG, PerthAerospace Engineering Services Pty Ltd Unit Trust KPMG, PerthAirline Rotables (UK Holdings) Limited KPMG, CambridgeAirline Rotables Limited KPMG, CambridgeAviation Training Academy Australia Pty Ltd KPMG, MelbournePacific Flight Services Pty Ltd KPMG, SydneySingapore Technologies Engineering (Europe) Ltd KPMG, CambridgeST Aerospace Guangzhou Aero-Technologies & Engineering Co Ltd. KPMG, GuangzhouST Aerospace Academy (Australia) Pty Ltd KPMG, MelbourneST Aerospace Panama, Inc. KPMG, PanamaST Aerospace Solutions (Europe) A/S KPMG, FrederiksbergST Aerospace Technologies (Xiamen) Company Limited KPMG, FuzhouST PAE Holdings Pty Ltd KPMG, PerthAntycip Simulation Limited KPMG, CambridgeAntycip Simulation SAS KPMG, Paris iDirect Hong Kong Limited KPMG, Hong KongiDirect UK Limited KPMG, United KingdomINFA Systems Limited KPMG, Hong KongParallel Limited KPMG, United KingdomPMB Project Management Business Sdn Bhd KPMG, Kuala LumpurSEEL Electronic & Engineering Sdn Bhd KPMG, Kuala LumpurST Electronics (Sichuan) Co., Ltd KPMG, ChengduST Electronics (Shanghai) Co., Ltd KPMG, ShanghaiST Electronics (Software Services) Limited KPMG, ShenzhenST Electronics (Taiwan) Limited KPMG, TaipeiTelematics Wireless Ltd. KPMG, Tel AvivKinetics Link Services Sdn. Bhd. KPMG, Johor BahruLeeBoy India Construction Equipment Private Limited B S R & Co., BangaloreVT Hackney, S.A. de C.V. KPMG, MexicoGuizhou Jonyang Kinetics Co., Ltd. KPMG, ChengduKinetics Systems (Shanghai) Co., Ltd. KPMG, ShanghaiJiangsu Huatong Kinetics Co., Ltd KPMG, NanjingJiangsu Huaran Kinetics Co., Ltd KPMG, NanjingST Marine (Wuhan) Engineering Design Consultancy Co Ltd. KPMG, ShanghaiSTSE (Shanghai) Co. Ltd. KPMG, ShanghaiSTSE Engineering Services (B) Sdn Bhd KPMG, Brunei
168 169Singapore TechnologieS engineering lTd Annual Report 2012Making an impact
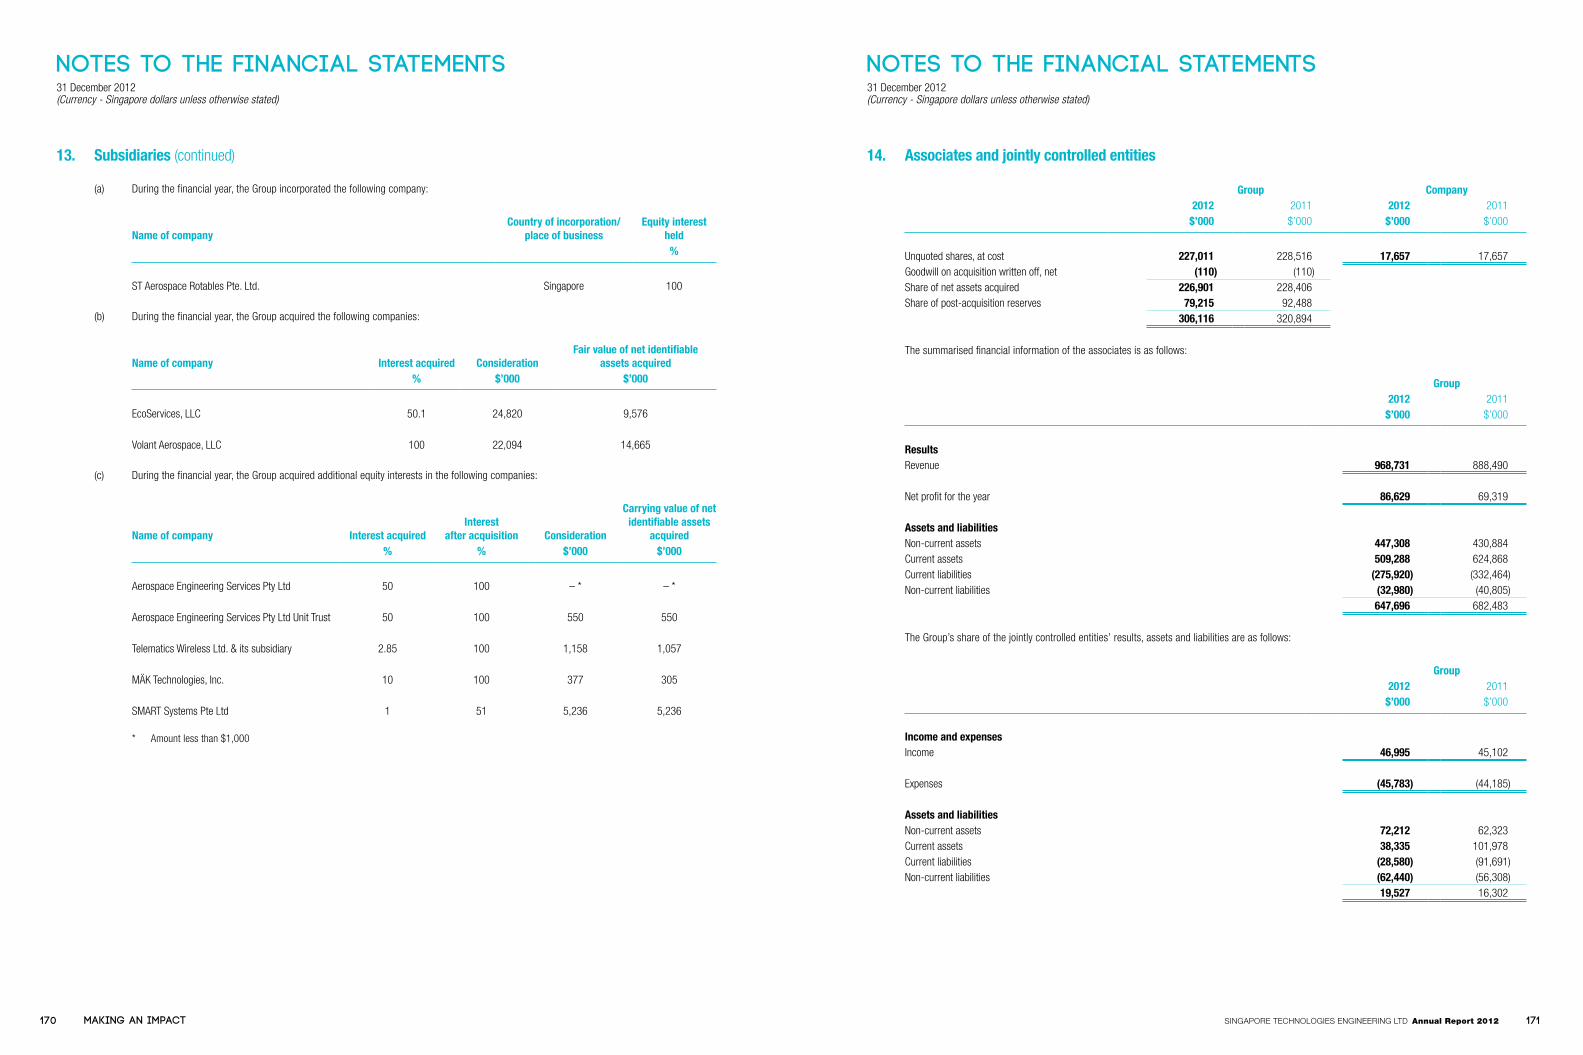
Notes to the Financial Statements31 December 2012(Currency - Singapore dollars unless otherwise stated)
Notes to the Financial Statements31 December 2012(Currency - Singapore dollars unless otherwise stated)
13. Subsidiaries (continued)
(a) During the financial year, the Group incorporated the following company:
Name of companyCountry of incorporation/
place of businessEquity interest
held%
ST Aerospace Rotables Pte. Ltd. Singapore 100
(b) During the financial year, the Group acquired the following companies:
Name of company Interest acquired ConsiderationFair value of net identifiable
assets acquired% $’000 $’000
EcoServices, LLC 50.1 24,820 9,576
Volant Aerospace, LLC 100 22,094 14,665
(c) During the financial year, the Group acquired additional equity interests in the following companies:
Name of company Interest acquiredInterest
after acquisition Consideration
Carrying value of net identifiable assets
acquired% % $’000 $’000
Aerospace Engineering Services Pty Ltd 50 100 – * – *
Aerospace Engineering Services Pty Ltd Unit Trust 50 100 550 550
Telematics Wireless Ltd. & its subsidiary 2.85 100 1,158 1,057
MÄK Technologies, Inc. 10 100 377 305
SMART Systems Pte Ltd 1 51 5,236 5,236
* Amount less than $1,000
14. Associates and jointly controlled entities
Group Company2012 2011 2012 2011
$’000 $’000 $’000 $’000
Unquoted shares, at cost 227,011 228,516 17,657 17,657Goodwill on acquisition written off, net (110) (110)Share of net assets acquired 226,901 228,406Share of post-acquisition reserves 79,215 92,488
306,116 320,894
The summarised financial information of the associates is as follows:
Group2012 2011
$’000 $’000
ResultsRevenue 968,731 888,490
Net profit for the year 86,629 69,319
Assets and liabilitiesNon-current assets 447,308 430,884Current assets 509,288 624,868Current liabilities (275,920) (332,464)Non-current liabilities (32,980) (40,805)
647,696 682,483
The Group’s share of the jointly controlled entities’ results, assets and liabilities are as follows:
Group2012 2011
$’000 $’000
Income and expensesIncome 46,995 45,102
Expenses (45,783) (44,185)
Assets and liabilitiesNon-current assets 72,212 62,323Current assets 38,335 101,978Current liabilities (28,580) (91,691)Non-current liabilities (62,440) (56,308)
19,527 16,302
170 171Singapore TechnologieS engineering lTd Annual Report 2012Making an impact
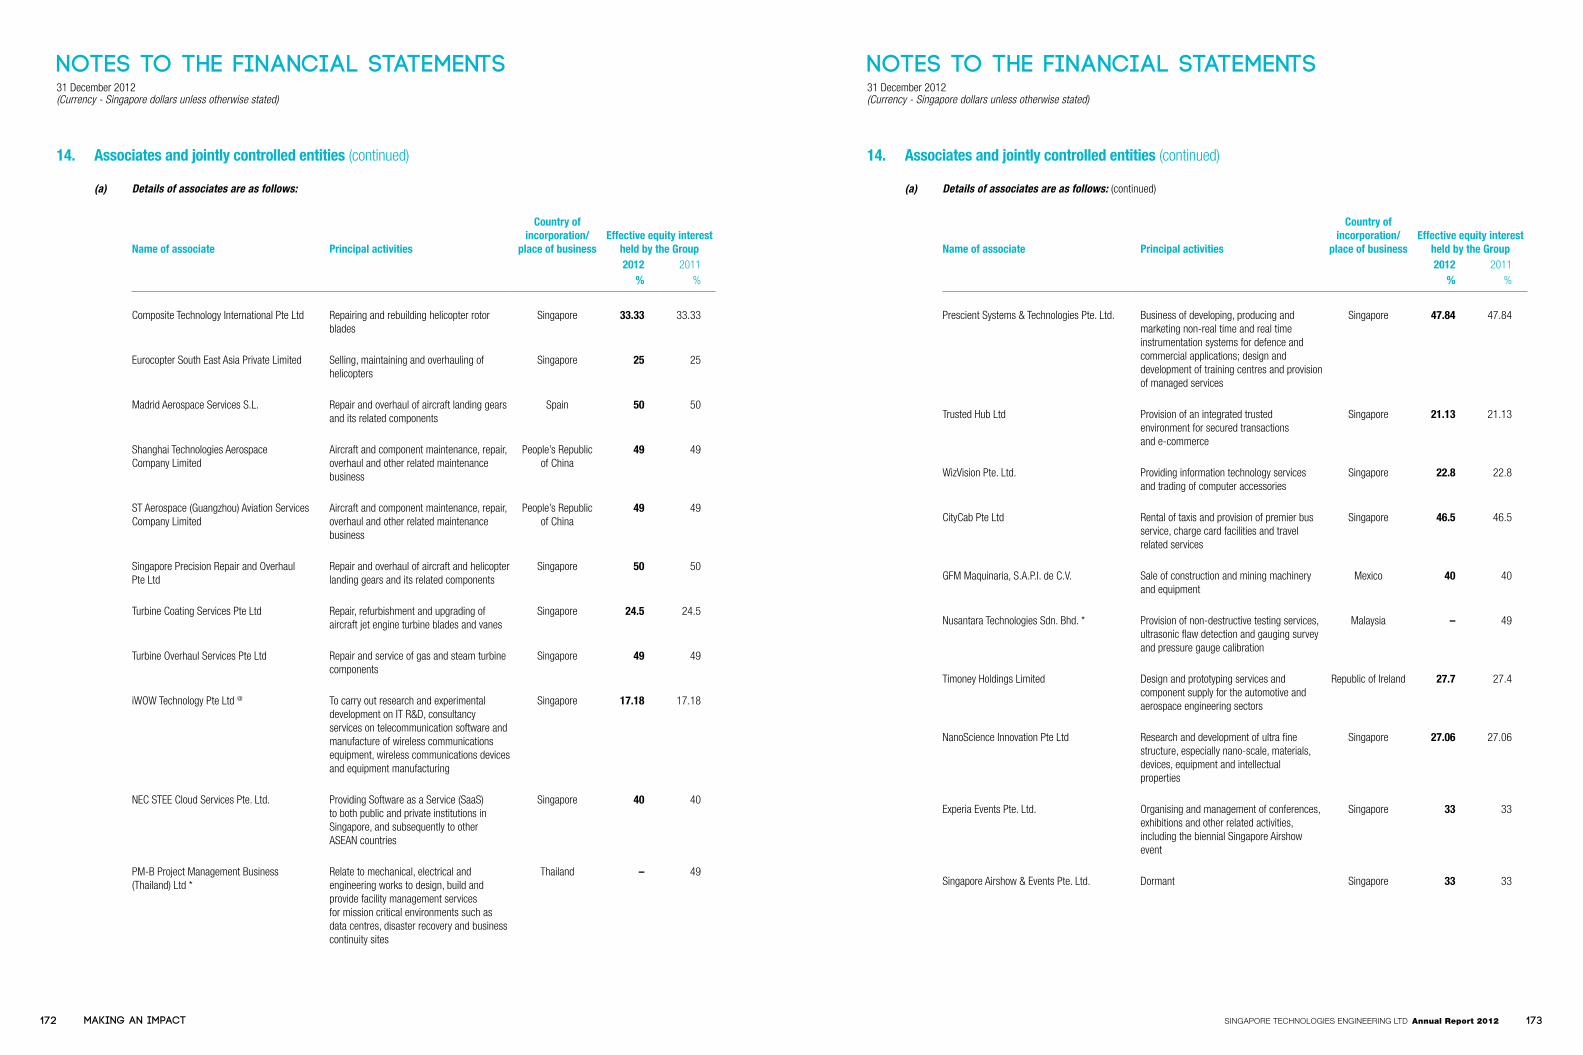
Notes to the Financial Statements31 December 2012(Currency - Singapore dollars unless otherwise stated)
Notes to the Financial Statements31 December 2012(Currency - Singapore dollars unless otherwise stated)
14. Associates and jointly controlled entities (continued)
(a) Details of associates are as follows:
Name of associate Principal activities
Country of incorporation/
place of businessEffective equity interest
held by the Group2012 2011
% %
Composite Technology International Pte Ltd Repairing and rebuilding helicopter rotor blades
Singapore 33.33 33.33
Eurocopter South East Asia Private Limited Selling, maintaining and overhauling of helicopters
Singapore 25 25
Madrid Aerospace Services S.L. Repair and overhaul of aircraft landing gears and its related components
Spain 50 50
Shanghai Technologies Aerospace Company Limited
Aircraft and component maintenance, repair, overhaul and other related maintenance business
People’s Republic of China
49 49
ST Aerospace (Guangzhou) Aviation Services Company Limited
Aircraft and component maintenance, repair, overhaul and other related maintenance business
People’s Republic of China
49 49
Singapore Precision Repair and OverhaulPte Ltd
Repair and overhaul of aircraft and helicopter landing gears and its related components
Singapore 50 50
Turbine Coating Services Pte Ltd Repair, refurbishment and upgrading of aircraft jet engine turbine blades and vanes
Singapore 24.5 24.5
Turbine Overhaul Services Pte Ltd Repair and service of gas and steam turbine components
Singapore 49 49
iWOW Technology Pte Ltd @ To carry out research and experimental development on IT R&D, consultancy services on telecommunication software and manufacture of wireless communications equipment, wireless communications devices and equipment manufacturing
Singapore 17.18 17.18
NEC STEE Cloud Services Pte. Ltd. Providing Software as a Service (SaaS) to both public and private institutions in Singapore, and subsequently to other ASEAN countries
Singapore 40 40
PM-B Project Management Business(Thailand) Ltd *
Relate to mechanical, electrical and engineering works to design, build and provide facility management servicesfor mission critical environments such as data centres, disaster recovery and business continuity sites
Thailand – 49
14. Associates and jointly controlled entities (continued)
(a) Details of associates are as follows: (continued)
Name of associate Principal activities
Country of incorporation/
place of businessEffective equity interest
held by the Group2012 2011
% %
Prescient Systems & Technologies Pte. Ltd. Business of developing, producing and marketing non-real time and real time instrumentation systems for defence and commercial applications; design and development of training centres and provision of managed services
Singapore 47.84 47.84
Trusted Hub Ltd Provision of an integrated trusted environment for secured transactions and e-commerce
Singapore 21.13 21.13
WizVision Pte. Ltd. Providing information technology services and trading of computer accessories
Singapore 22.8 22.8
CityCab Pte Ltd Rental of taxis and provision of premier bus service, charge card facilities and travel related services
Singapore 46.5 46.5
GFM Maquinaria, S.A.P.I. de C.V. Sale of construction and mining machinery and equipment
Mexico 40 40
Nusantara Technologies Sdn. Bhd. * Provision of non-destructive testing services, ultrasonic flaw detection and gauging survey and pressure gauge calibration
Malaysia – 49
Timoney Holdings Limited Design and prototyping services and component supply for the automotive and aerospace engineering sectors
Republic of Ireland 27.7 27.4
NanoScience Innovation Pte Ltd Research and development of ultra fine structure, especially nano-scale, materials, devices, equipment and intellectual properties
Singapore 27.06 27.06
Experia Events Pte. Ltd. Organising and management of conferences, exhibitions and other related activities, including the biennial Singapore Airshow event
Singapore 33 33
Singapore Airshow & Events Pte. Ltd. Dormant Singapore 33 33
172 173Singapore TechnologieS engineering lTd Annual Report 2012Making an impact

Notes to the Financial Statements31 December 2012(Currency - Singapore dollars unless otherwise stated)
Notes to the Financial Statements31 December 2012(Currency - Singapore dollars unless otherwise stated)
14. Associates and jointly controlled entities (continued)
(b) Details of jointly controlled entities are as follows:
Name of jointly controlled entities Principal activities
Country of incorporation/
place of businessEffective equity interest
held by the Group2012 2011
% %
Total Engine Asset Management Pte. Ltd. Leasing of engines Singapore 50 50
GFM Electronics S.A. de C.V. Design and implementation, distribution and sales of high technology systems, services and products, in the communications area, as well as electronics systems, principally closed circuits and alarms for airports, malls, stadiums and highways. Management of reusable electronic equipment and components
Mexico 50 50
ST Electronics (Satellite Systems) Pte. Ltd. Design and development, system integration, manufacturing and sale of satellite equipment
Singapore 51 51
ATREC Pte. Ltd. Research and technology development in advanced materials for both defence and commercial applications
Singapore 50 50
Beijing Zhonghuan Kinetics Heavy Vehicles Co., Ltd.
Develop, manufacture and sale of specialised heavy vehicles and sale of related spare partsand provision of relevant technical consultancy and after sale technical support services
People’s Republic of China
50 50
Takata CPI Singapore Pte Ltd Manufacture of pyrotechnic components for seatbelts and air bags used in motor vehicles
Singapore 49 49
First Response Marine Pte. Ltd. Ship and boat leasing with operator (including chartering)
Singapore 50 50
Fortis Marine Solutions Pte. Ltd. To provide design and systems engineering services and maintenance of specialised naval vessels
Singapore 51 –
Halter-Bollinger Joint Venture, L.L.C. § To bid and secure US boat fabrication contracts for its shareholders
USA 50 50
Joint Shipyard Management Services Pte Ltd Construction and managing workers’ dormitories
Singapore 30 30
@ Despite effective shareholdings below 20%, this entity continues to be classified as an associate as the Group is considered to have significant influence over the entity due to its Board representation.
* These entities were disposed of during the year.
§ Not required to be audited under the law in the country of incorporation.
14. Associates and jointly controlled entities (continued)
All associates and jointly controlled entities that are required to be audited under the law in the country of incorporation are audited by KPMG LLP, Singapore, except for the following:
Name of associate/jointly controlled entity Name of auditing firm
Composite Technology International Pte Ltd Deloitte and Touche LLP, SingaporeMadrid Aerospace Services S.L. Deloitte S.L.Shanghai Technologies Aerospace Company Limited KPMG, ShanghaiST Aerospace (Guangzhou) Aviation Services Company Limited KPMG, GuangzhouTurbine Coating Services Pte Ltd PricewaterhouseCoopers LLP, Singapore Turbine Overhaul Services Pte Ltd PricewaterhouseCoopers LLP, SingaporeTotal Engine Asset Management Pte. Ltd. Ernst & Young LLP, SingaporeGFM Electronics S.A. de C.V. PricewaterhouseCoopers, MexicoiWOW Technology Pte Ltd LW Ong & Associates LLPTrusted Hub Ltd Deloitte and Touche LLP, SingaporeWizVision Pte. Ltd. R Chan & Associates PACCityCab Pte Ltd Deloitte and Touche LLP, SingaporeGFM Maquinaria, S.A.P.I. de C.V. PricewaterhouseCoopers, MexicoTimoney Holdings Limited KPMG, IrelandBeijing Zhonghuan Kinetics Heavy Vehicles Co., Ltd. Crowe Horwath China CPA Co., LtdFortis Marine Solutions Pte. Ltd. Ernst & Young LLP, SingaporeNanoScience Innovation Pte Ltd NSC & Associates
15. Investments
GroupNote 2012 2011
$’000 $’000
Quoted investmentsEquity shares, at fair value (Available-for-sale) 45 10,771 9,342
Unquoted investments Equity shares (Available-for-sale)
Non-related corporations, at cost 1,265 2,265
Bonds, at fair value (Available-for-sale) 45 332,916 –Interest rate: 1.15% to 5.88% per annumMaturity: 18.1.2013 to 7.11.2024
Venture capital funds and limited partnership, at fair value 45 44 4Total unquoted investments 334,225 2,269
Total investments, net of impairment losses 344,996 11,611
For those unquoted investments where the fair value cannot be reliably estimated, the Group has no intention to dispose such investments at the balance sheet date.
174 175Singapore TechnologieS engineering lTd Annual Report 2012Making an impact

Notes to the Financial Statements31 December 2012(Currency - Singapore dollars unless otherwise stated)
Notes to the Financial Statements31 December 2012(Currency - Singapore dollars unless otherwise stated)
16. Intangible assets
(a) Goodwill
GroupNote 2012 2011
$’000 $’000
CostAt beginning of the year 463,378 468,302Acquisition of subsidiaries 22,673 785Finalisation of purchase price allocation 899 –Disposal of subsidiaries – (3,714)Reduction in cost of investment * – (5,733)Translation difference (26,613) 3,738At end of the year 460,337 463,378
ImpairmentAt beginning of the year 18,729 19,061Impairment losses for the year ^ 5 12,351 3,240Disposal of subsidiaries – (3,776)Translation difference (1,818) 204At end of the year 29,262 18,729
Net book value 431,075 444,649
* In prior year, a subsidiary received $5,733,000 from its previous shareholders following a successful outcome of an arbitration case. This amount was accounted as a reduction in cost of investment.
^ For the purpose of annual impairment testing, the recoverable amounts of the CGUs are determined based on its value-in-use calculations. During the year, the recoverable amounts of three subsidiaries (2011: one subsidiary) are determined to be lower than the carrying values and impairment losses of $12,351,000 (2011: $3,240,000) are recognised in other operating expenses in the income statement.
16. Intangible assets (continued)
(b) Other intangible assets
NoteDealer
networkDevelopment expenditure
Commercial and
intellectualproperty rights
Film costinventory Brands Others Total
$’000 $’000 $’000 $’000 $’000 $’000 $’000
The Group
CostAt 1.1.2011 8,378 13,615 64,312 11,803 76,258 6,364 180,730Additions – 2,803 – – – – 2,803Acquisition of a subsidiary – – – – 248 648 896Disposal of a subsidiary – (2,082) – – – – (2,082)Translation difference 67 335 530 – 592 1 1,525At 31.12.2011 and 1.1.2012 8,445 14,671 64,842 11,803 77,098 7,013 183,872Additions – – 2,935 – – – 2,935Acquisition of subsidiaries 4,335 – – – 1,062 13,853 19,250Finalisation of purchase price
allocation – – – – (248) (454) (702)Translation difference (498) (52) (3,275) – (4,454) (5) (8,284)At 31.12.2012 12,282 14,619 64,502 11,803 73,458 20,407 197,071
Accumulated amortisationAt 1.1.2011 5,495 2,115 29,453 4,880 4,565 2,940 49,448Amortisation for the year * 5 778 1,175 5,680 – 1,169 473 9,275Impairment losses 5 – – 874 6,090 – – 6,964Disposal of a subsidiary – (2,082) – – – – (2,082)Translation difference 71 81 459 – 67 – 678At 31.12.2011 and 1.1.2012 6,344 1,289 36,466 10,970 5,801 3,413 64,283Amortisation for the year * 5 1,593 3,346 5,657 31 1,724 802 13,153Impairment loss 5 – – – 802 – – 802Translation difference (397) (71) (1,875) – (342) – (2,685)At 31.12.2012 7,540 4,564 40,248 11,803 7,183 4,215 75,553
Net book valueAt 31.12.2012 4,742 10,055 24,254 – 66,275 16,192 121,518
At 31.12.2011 2,101 13,382 28,376 833 71,297 3,600 119,589
* Amortisation charge of $13,153,000 (2011: $9,275,000) is recognised in the income statement as follows: – Total operating expense of $9,350,000 (2011: $7,590,000); and – Cost of sales of $3,803,000 (2011: $1,685,000)
176 177Singapore TechnologieS engineering lTd Annual Report 2012Making an impact
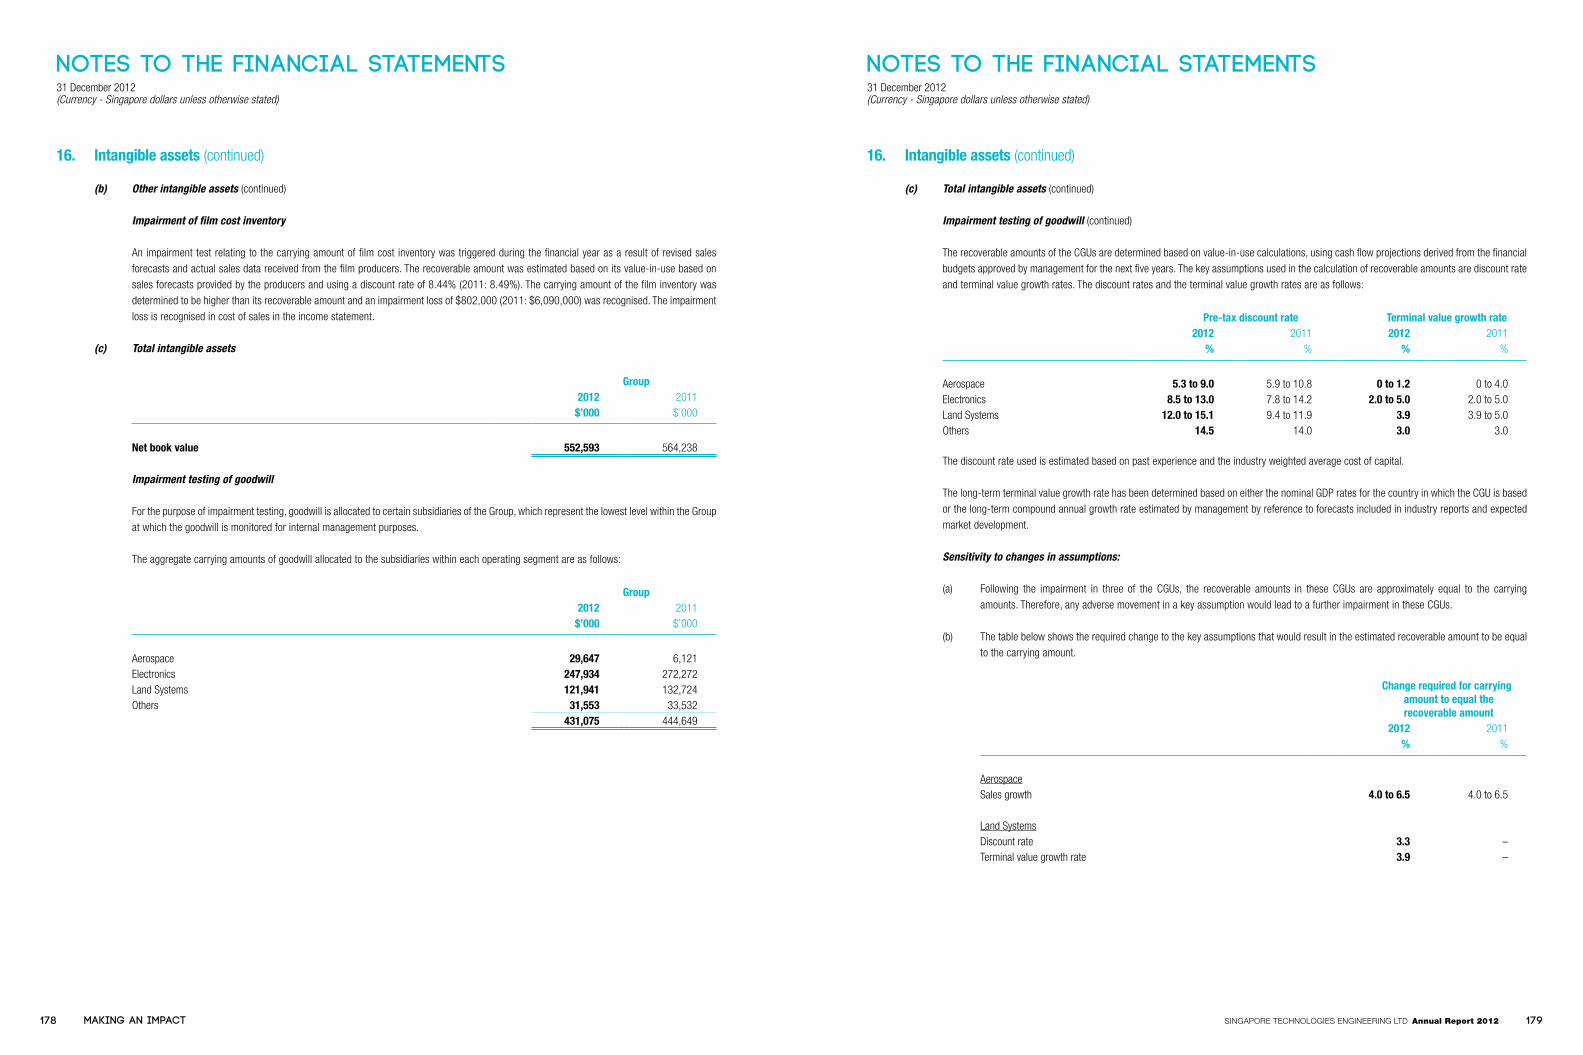
Notes to the Financial Statements31 December 2012(Currency - Singapore dollars unless otherwise stated)
Notes to the Financial Statements31 December 2012(Currency - Singapore dollars unless otherwise stated)
16. Intangible assets (continued)
(b) Other intangible assets (continued)
Impairment of film cost inventory
An impairment test relating to the carrying amount of film cost inventory was triggered during the financial year as a result of revised sales forecasts and actual sales data received from the film producers. The recoverable amount was estimated based on its value-in-use based on sales forecasts provided by the producers and using a discount rate of 8.44% (2011: 8.49%). The carrying amount of the film inventory was determined to be higher than its recoverable amount and an impairment loss of $802,000 (2011: $6,090,000) was recognised. The impairment loss is recognised in cost of sales in the income statement.
(c) Total intangible assets
Group2012 2011
$’000 $’000
Net book value 552,593 564,238
Impairment testing of goodwill
For the purpose of impairment testing, goodwill is allocated to certain subsidiaries of the Group, which represent the lowest level within the Group at which the goodwill is monitored for internal management purposes.
The aggregate carrying amounts of goodwill allocated to the subsidiaries within each operating segment are as follows:
Group2012 2011
$’000 $’000
Aerospace 29,647 6,121Electronics 247,934 272,272Land Systems 121,941 132,724Others 31,553 33,532
431,075 444,649
16. Intangible assets (continued)
(c) Total intangible assets (continued)
Impairment testing of goodwill (continued)
The recoverable amounts of the CGUs are determined based on value-in-use calculations, using cash flow projections derived from the financial budgets approved by management for the next five years. The key assumptions used in the calculation of recoverable amounts are discount rate and terminal value growth rates. The discount rates and the terminal value growth rates are as follows:
Pre-tax discount rate Terminal value growth rate2012 2011 2012 2011
% % % %
Aerospace 5.3 to 9.0 5.9 to 10.8 0 to 1.2 0 to 4.0Electronics 8.5 to 13.0 7.8 to 14.2 2.0 to 5.0 2.0 to 5.0Land Systems 12.0 to 15.1 9.4 to 11.9 3.9 3.9 to 5.0Others 14.5 14.0 3.0 3.0
The discount rate used is estimated based on past experience and the industry weighted average cost of capital.
The long-term terminal value growth rate has been determined based on either the nominal GDP rates for the country in which the CGU is based or the long-term compound annual growth rate estimated by management by reference to forecasts included in industry reports and expected market development.
Sensitivity to changes in assumptions:
(a) Following the impairment in three of the CGUs, the recoverable amounts in these CGUs are approximately equal to the carrying amounts. Therefore, any adverse movement in a key assumption would lead to a further impairment in these CGUs.
(b) The table below shows the required change to the key assumptions that would result in the estimated recoverable amount to be equal to the carrying amount.
Change required for carrying amount to equal the recoverable amount
2012 2011% %
AerospaceSales growth 4.0 to 6.5 4.0 to 6.5
Land SystemsDiscount rate 3.3 –Terminal value growth rate 3.9 –
178 179Singapore TechnologieS engineering lTd Annual Report 2012Making an impact

Notes to the Financial Statements31 December 2012(Currency - Singapore dollars unless otherwise stated)
Notes to the Financial Statements31 December 2012(Currency - Singapore dollars unless otherwise stated)
17. Investment property
GroupNote 2012 2011
$’000 $’000
CostAt beginning of the year 3,244 3,045Transfer from property, plant and equipment * 10,525 –Disposal ^ (3,633) –Translation difference 389 199At end of the year 10,525 3,244
Accumulated depreciationAt beginning of the year 1,735 1,379Depreciation charge for the year 5 365 235Disposal ^ (2,274) –Translation difference 460 121At end of the year 286 1,735
Net book value 10,239 1,509
* During the year, the Group transferred a property from property, plant and equipment to investment property as it was no longer owner-occupied. The property is currently held for rental and capital appreciation.
^ During the year, the Group disposed of an investment property for a cash consideration of $3,908,000.
The property rental income of the Group for the year ended 31 December 2012 from its investment property, which is leased out under operating leases, amounted to $586,000 (2011: $22,000). Direct operating expenses (including repairs and maintenance) arising from the rental-earning investment property amounted to $435,000 (2011: $1,000).
The fair value of the investment property as at 31 December 2012 of $13,000,000 is based on market values, being the estimated amount for which a property could be exchanged on the date of the valuation between a willing buyer and a willing seller in an arm’s length transaction after proper marketing wherein the parties had each acted knowledgeably, prudently and without compulsion.
The investment property held by the Group as at end of the year is as follows:
Land Location Existing Use Tenure area
(sq. m.)
Singapore
5 Ubi Close Car show room cum workshop 30 years from 1.8.1994 to 31.7.2024 6,165
18. Long-term receivables
Group Company2012 2011 2012 2011
$’000 $’000 $’000 $’000
Housing and car loans and advances to staff 932 1,295 – 19Loans to: Third parties * 44,282 58,847 – – Allowance for doubtful loans (8,923) (8,962) – –
35,359 49,885 – –36,291 51,180 – 19
Receivable: Within 1 year 12,234 12,925 – 19 After 1 year 24,057 38,255 – –
36,291 51,180 – 19
Long-term receivables are carried at amortised cost and are subject to impairment.
* Included in the loans to third parties are:
(a) a loan of $8,312,000 (2011: $8,312,000) secured by intellectual property rights, and is not expected to be repaid within the next 12 months. Interest is repriced every month and chargeable at the US dollar prime rate plus 2% (2011: 2%) per annum, which is also the effective interest rate. The loan is convertible to shares of that entity, subject to certain terms and conditions. In a prior year, a notice was given to that entity to convert the loan to shares of that entity but the conversion has not been effected as at the end of the year. The loan is fully impaired in the prior year.
No interest income has been accrued for this financial year due to uncertainty over the collectibility of the interest income.
(b) a bridging loan of $611,300 (US$500,000) (2011: $649,650 (US$500,000)) extended to a third party. The bridging loan is secured by way of a Deed of Debenture, which creates a floating charge over the assets of the third party. This loan is treated as a net investment in the third party and is not expected to be repaid. The loan is stated at cost and has been fully impaired due to uncertainty over collectibility.
(c) an amount of $35,359,000 (2011: $49,885,000) relating to instalment payment plans granted to customers. These loans are unsecured, repayable over a period of 7.5 years from 2008. The interest rates on these loans are LIBOR with margins at 0.63% (2011: 0.63%) per annum. The interest rates range from 1.16% to 1.43% (2011: 0.91% to 1.43%) per annum, which are also the effective interest rates. The interest rates are repriced every 6 months.
180 181Singapore TechnologieS engineering lTd Annual Report 2012Making an impact

Notes to the Financial Statements31 December 2012(Currency - Singapore dollars unless otherwise stated)
Notes to the Financial Statements31 December 2012(Currency - Singapore dollars unless otherwise stated)
19. Finance lease receivables
The Group entered into finance lease arrangements with customers with terms ranging from 1 to 10 years (2011: 1 to 10 years) and effective interest rates ranging from 2.34% to 20.74% (2011: 1.35% to 20.74%) per annum.
Grossinvestment infinance lease
Unearnedinterest
Present value ofminimum lease
receivables
Allowance fordoubtful lease
receivablesNet investment
in finance lease$’000 $’000 $’000 $’000 $’000
The Group
2012
Within 1 year 33,905 814 33,091 (9,316) 23,7752 to 5 years 11,360 981 10,379 – 10,379
45,265 1,795 43,470 (9,316) 34,154
2011
Within 1 year 28,687 1,081 27,606 (1,443) 26,1632 to 5 years 15,361 1,161 14,200 – 14,200More than 5 years 287 5 282 – 282
15,648 1,166 14,482 – 14,48244,335 2,247 42,088 (1,443) 40,645
Group2012 2011
$’000 $’000
Net investment in finance leaseNot past due and not impaired 24,146 33,100Past due and not impaired 10,008 7,545
34,154 40,645
Individually assessedDoubtful lease receivables 9,316 1,443Allowance for doubtful lease receivables (9,316) (1,443)
– –
20. Deferred tax assets
Group Company2012 2011 2012 2011
$’000 $’000 $’000 $’000
At beginning of the year 113,167 118,794 – –Recognised in profit or loss 5,843 9,556 570 –Effect of reduction in tax rate 291 59 – –Disposal of a subsidiary – (30) – –Translation difference (2,970) 385 – –Utilisation of tax losses (5,184) (12,063) – –Changes in fair value of derivative financial
instruments designated as cash flow hedges (859) (3,534) – –At end of the year 110,288 113,167 570 –
The deferred tax assets arise as a result of:
Unabsorbed capital allowances, unutilised tax losses and excess of net book value over tax written down value of property, plant and equipment (6,640) 15,297 – –
Allowance for doubtful debts and inventory obsolescence 9,030 8,693 – –
Provisions 82,785 73,102 – –Other temporary differences 21,708 11,718 570 –Changes in fair value of derivative financial
instruments designated as cash flow hedges 3,405 4,357 – –110,288 113,167 570 –
21. Inventories and work-in-progress
Group2012 2011
$’000 $’000
Inventories of equipment and spares 1,029,116 785,617
Work-in-progress in excess of progress billingsWork-in-progress, including profits recognised 3,152,698 3,093,530Progress billings (2,259,855) (2,285,477)
892,843 808,053Total inventories and work-in-progress at lower of cost and net realisable value 1,921,959 1,593,670
Progress billings in excess of work-in-progressWork-in-progress, including profits recognised 3,059,834 3,078,244Progress billings (3,821,035) (3,734,407)
(761,201) (656,163)
182 183Singapore TechnologieS engineering lTd Annual Report 2012Making an impact

Notes to the Financial Statements31 December 2012(Currency - Singapore dollars unless otherwise stated)
Notes to the Financial Statements31 December 2012(Currency - Singapore dollars unless otherwise stated)
21. Inventories and work-in-progress (continued)
In 2012, raw materials, consumables and changes in finished goods and work-in-progress recognised as cost of sales amounted to $3,768,484,000 (2011: $3,663,208,000).
(i) Allowances for inventory obsolescence and foreseeable losses
As at 31 December 2012, the inventories are stated after allowance for inventory obsolescence of $186,248,000 (2011: $187,674,000) and work-in-progress in excess of progress billings is stated after provision for foreseeable losses of $2,319,000 (2011: $6,365,000).
(ii) Net realisable value write-down
As at 31 December 2012, inventories amounting to $6,230,000 (2011: $38,718,000) were written down to the estimated net realisable value. The write-down was included in cost of sales.
22. Trade receivables
Group2012 2011
$’000 $’000
Not past due and not impaired 525,534 620,068Past due and not impaired 364,328 308,599
889,862 928,667Collectively assessedImpaired receivables (Gross) 16,183 24,141Allowance for doubtful debts (10,398) (6,838)
5,785 17,303Individually assessedImpaired receivables (Gross) 57,377 57,510Allowance for doubtful debts (56,281) (50,378)
1,096 7,132
Unbilled receivables 262,131 235,885Allowance for unbilled receivables (292) (1,484)Trade receivables, net 1,158,582 1,187,503
Trade receivables denominated in currencies other than the functional currencies of the Company and its subsidiaries as at 31 December are as follows:
• $127,461,000(2011:$152,828,000)denominatedinUSD• $34,031,000(2011:$10,619,000)denominatedinEuro• $9,371,000(2011:$7,078,000)denominatedinGBP
Trade receivables amounting to $12,637,000 (2011: $8,210,000) are arranged to be repaid through letters of credit issued by reputable banks.
23. Amounts due from related parties
Group Company2012 2011 2012 2011
$’000 $’000 $’000 $’000
Trade: Subsidiaries – – 5,267 4,607 Associates 6,645 6,124 – – Jointly controlled entities 5,442 9,610 – – Related corporations 11,574 21,242 20 21
23,661 36,976 5,287 4,628
Non-trade: Subsidiaries *1 – – 781,956 931,048 Associates *2 2,434 2,525 – – Jointly controlled entities *3 6,857 7,680 – –
9,291 10,205 781,956 931,048Allowance for doubtful debts (1,792) (2,519) (7,963) (37,630)Amounts due from related parties 31,160 44,662 779,280 898,046
Receivable: Within 1 year 23,928 37,332 415,088 683,600 After 1 year 7,232 7,330 364,192 214,446
31,160 44,662 779,280 898,046
*1 Included in the amounts due from subsidiaries (non-trade) are mainly:
(a) loans of $767,176,000 (2011: $874,083,000) bearing interest at rates ranging from 0.61% to 4.98% (2011: 1.13% to 4.98%) per annum. The loans are unsecured and repayable from 31 January 2013 to 1 September 2015; and
(b) interest-free loans of $7,963,000 (2011: $37,630,000), which are unsecured and not repayable in the foreseeable future. The loans are fully impaired.
*2 Included in the amounts due from associates (non-trade) is a loan to an associate of $2,426,000 (2011: $2,524,000). Interest is charged at EURIBOR + 1.0% per annum (2011: EURIBOR + 1.0% per annum) and is repriced every 3 months (2011: 3 months). The interest rate on the loan is 1.18% (2011: 2.42%) per annum. The loan is unsecured and repayable in 2019.
*3 Included in amounts due from jointly controlled entities (non-trade) are:
(a) a loan of $1,792,000 (2011: $2,519,000) bearing interest at 4% (2011: 4%) per annum. The loan is unsecured and has been fully impaired; and
(b) loans of $4,806,000 (2011: $4,806,000) bearing interest at 6.38% (2011: 6.38%) per annum. The loans are unsecured and repayable by 2029.
184 185Singapore TechnologieS engineering lTd Annual Report 2012Making an impact
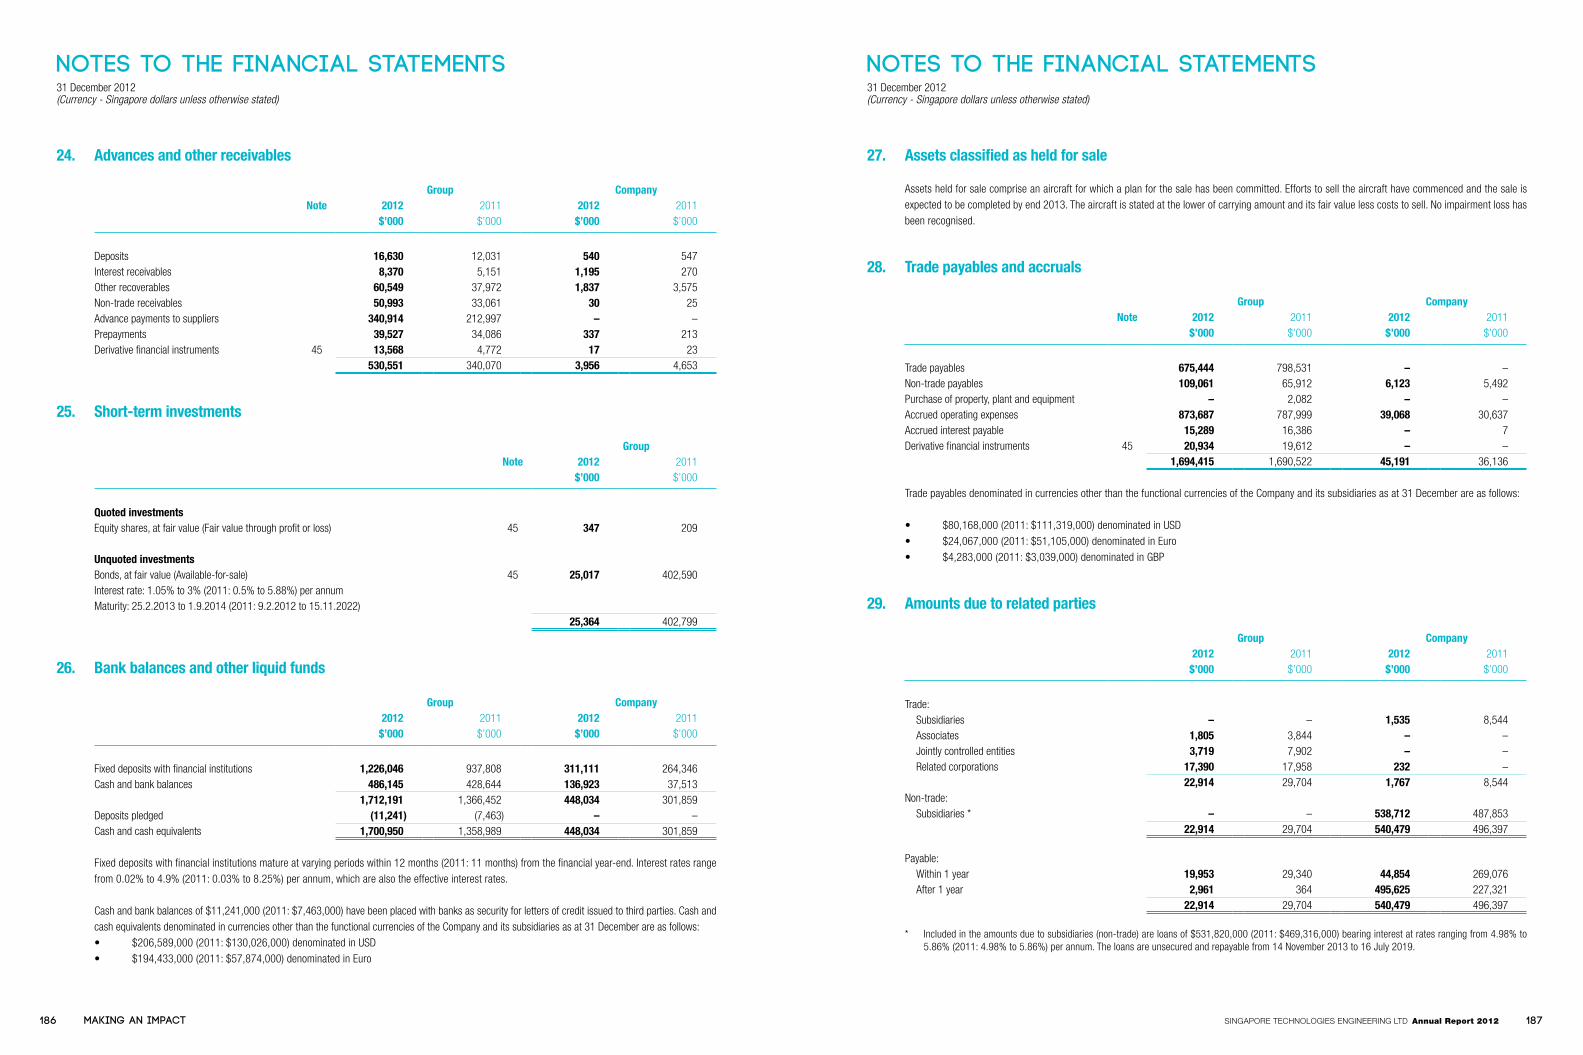
Notes to the Financial Statements31 December 2012(Currency - Singapore dollars unless otherwise stated)
Notes to the Financial Statements31 December 2012(Currency - Singapore dollars unless otherwise stated)
24. Advances and other receivables
Group CompanyNote 2012 2011 2012 2011
$’000 $’000 $’000 $’000
Deposits 16,630 12,031 540 547Interest receivables 8,370 5,151 1,195 270Other recoverables 60,549 37,972 1,837 3,575Non-trade receivables 50,993 33,061 30 25Advance payments to suppliers 340,914 212,997 – –Prepayments 39,527 34,086 337 213Derivative financial instruments 45 13,568 4,772 17 23
530,551 340,070 3,956 4,653
25. Short-term investments
GroupNote 2012 2011
$’000 $’000
Quoted investmentsEquity shares, at fair value (Fair value through profit or loss) 45 347 209
Unquoted investmentsBonds, at fair value (Available-for-sale) 45 25,017 402,590Interest rate: 1.05% to 3% (2011: 0.5% to 5.88%) per annum Maturity: 25.2.2013 to 1.9.2014 (2011: 9.2.2012 to 15.11.2022)
25,364 402,799
26. Bank balances and other liquid funds
Group Company2012 2011 2012 2011
$’000 $’000 $’000 $’000
Fixed deposits with financial institutions 1,226,046 937,808 311,111 264,346Cash and bank balances 486,145 428,644 136,923 37,513
1,712,191 1,366,452 448,034 301,859Deposits pledged (11,241) (7,463) – –Cash and cash equivalents 1,700,950 1,358,989 448,034 301,859
Fixed deposits with financial institutions mature at varying periods within 12 months (2011: 11 months) from the financial year-end. Interest rates range from 0.02% to 4.9% (2011: 0.03% to 8.25%) per annum, which are also the effective interest rates.
Cash and bank balances of $11,241,000 (2011: $7,463,000) have been placed with banks as security for letters of credit issued to third parties. Cash and cash equivalents denominated in currencies other than the functional currencies of the Company and its subsidiaries as at 31 December are as follows:• $206,589,000(2011:$130,026,000)denominatedinUSD• $194,433,000(2011:$57,874,000)denominatedinEuro
27. Assets classified as held for sale
Assets held for sale comprise an aircraft for which a plan for the sale has been committed. Efforts to sell the aircraft have commenced and the sale is expected to be completed by end 2013. The aircraft is stated at the lower of carrying amount and its fair value less costs to sell. No impairment loss has been recognised.
28. Trade payables and accruals
Group CompanyNote 2012 2011 2012 2011
$’000 $’000 $’000 $’000
Trade payables 675,444 798,531 – –Non-trade payables 109,061 65,912 6,123 5,492Purchase of property, plant and equipment – 2,082 – –Accrued operating expenses 873,687 787,999 39,068 30,637Accrued interest payable 15,289 16,386 – 7Derivative financial instruments 45 20,934 19,612 – –
1,694,415 1,690,522 45,191 36,136
Trade payables denominated in currencies other than the functional currencies of the Company and its subsidiaries as at 31 December are as follows:
• $80,168,000(2011:$111,319,000)denominatedinUSD• $24,067,000(2011:$51,105,000)denominatedinEuro• $4,283,000(2011:$3,039,000)denominatedinGBP
29. Amounts due to related parties
Group Company2012 2011 2012 2011
$’000 $’000 $’000 $’000
Trade: Subsidiaries – – 1,535 8,544 Associates 1,805 3,844 – – Jointly controlled entities 3,719 7,902 – – Related corporations 17,390 17,958 232 –
22,914 29,704 1,767 8,544Non-trade: Subsidiaries * – – 538,712 487,853
22,914 29,704 540,479 496,397
Payable: Within 1 year 19,953 29,340 44,854 269,076 After 1 year 2,961 364 495,625 227,321
22,914 29,704 540,479 496,397
* Included in the amounts due to subsidiaries (non-trade) are loans of $531,820,000 (2011: $469,316,000) bearing interest at rates ranging from 4.98% to 5.86% (2011: 4.98% to 5.86%) per annum. The loans are unsecured and repayable from 14 November 2013 to 16 July 2019.
186 187Singapore TechnologieS engineering lTd Annual Report 2012Making an impact

Notes to the Financial Statements31 December 2012(Currency - Singapore dollars unless otherwise stated)
Notes to the Financial Statements31 December 2012(Currency - Singapore dollars unless otherwise stated)
30. Provisions
Group2012 2011
$’000 $’000
Provisions for: Warranties 195,447 188,785 Liquidated damages 11,949 10,957 Foreseeable losses 16,741 15,005
224,137 214,747
(a) Movements in provision for warranties are as follows:
GroupNote 2012 2011
$’000 $’000
At beginning of the year 188,785 188,102Charge to profit or loss 5 26,045 19,834Provision utilised (16,546) (20,186)Translation difference (2,837) 1,048Disposal of subsidiaries – (13)At end of the year 195,447 188,785
(b) Movements in provision for liquidated damages are as follows:
GroupNote 2012 2011
$’000 $’000
At beginning of the year 10,957 12,005Charge to profit or loss 5 2,875 5,473Provision utilised (1,820) (6,553)Translation difference (63) 32At end of the year 11,949 10,957
(c) Movements in provision for foreseeable losses are as follows:
Group2012 2011
$’000 $’000
At beginning of the year 15,005 10,283Charge to profit or loss 4,203 7,149Provision utilised (2,373) (2,337)Translation difference (94) (90)At end of the year 16,741 15,005
31. Borrowings
Group CompanyNote 2012 2011 2012 2011
$’000 $’000 $’000 $’000
Non-currentBonds 608,721 646,562 – –Long-term bank loans 459,001 507,774 – –Lease obligations 244 1,245 – –Other loans 677 856 – –
1,068,643 1,156,437 – –CurrentShort-term bank loans 89,158 204,084 – 17,541Long-term bank loans 120,343 41 – –Lease obligations 232 2,934 – –Other loans 1,054 758 – –
210,787 207,817 – 17,541
Total borrowings 1,279,430 1,364,254 – 17,541
Total borrowings comprise:Unsecured fixed rate bonds (a) 608,721 646,562 – –Secured bank loans (b) 73,700 68,303 – –Unsecured bank loans (b) 594,802 643,596 – 17,541Lease obligations (c) 476 4,179 – –Other loans (d) 1,731 1,614 – –
1,279,430 1,364,254 – 17,541
(a) Unsecured fixed rate bonds
Group2012 2011
$’000 $’000
Principal 611,300 649,650Unamortised discount (2,579) (3,088) 608,721 646,562Unamortised discount: At beginning of the year 3,088 3,392 Amortisation for the year (333) (319) Translation difference (176) 15
2,579 3,088
On 16 July 2009, the Group issued US$500 million 4.80% Notes due 2019 under its US$1.2 billion Multicurrency Medium Term Note Programme. The bonds bear interest at a fixed rate of 4.80% per annum and interest is payable every six months from the date of issue. The bonds are unconditionally and irrevocably guaranteed by the Company.
At the reporting date, the Company does not consider it probable that a claim will be made against the Company under the guarantee.
188 189Singapore TechnologieS engineering lTd Annual Report 2012Making an impact
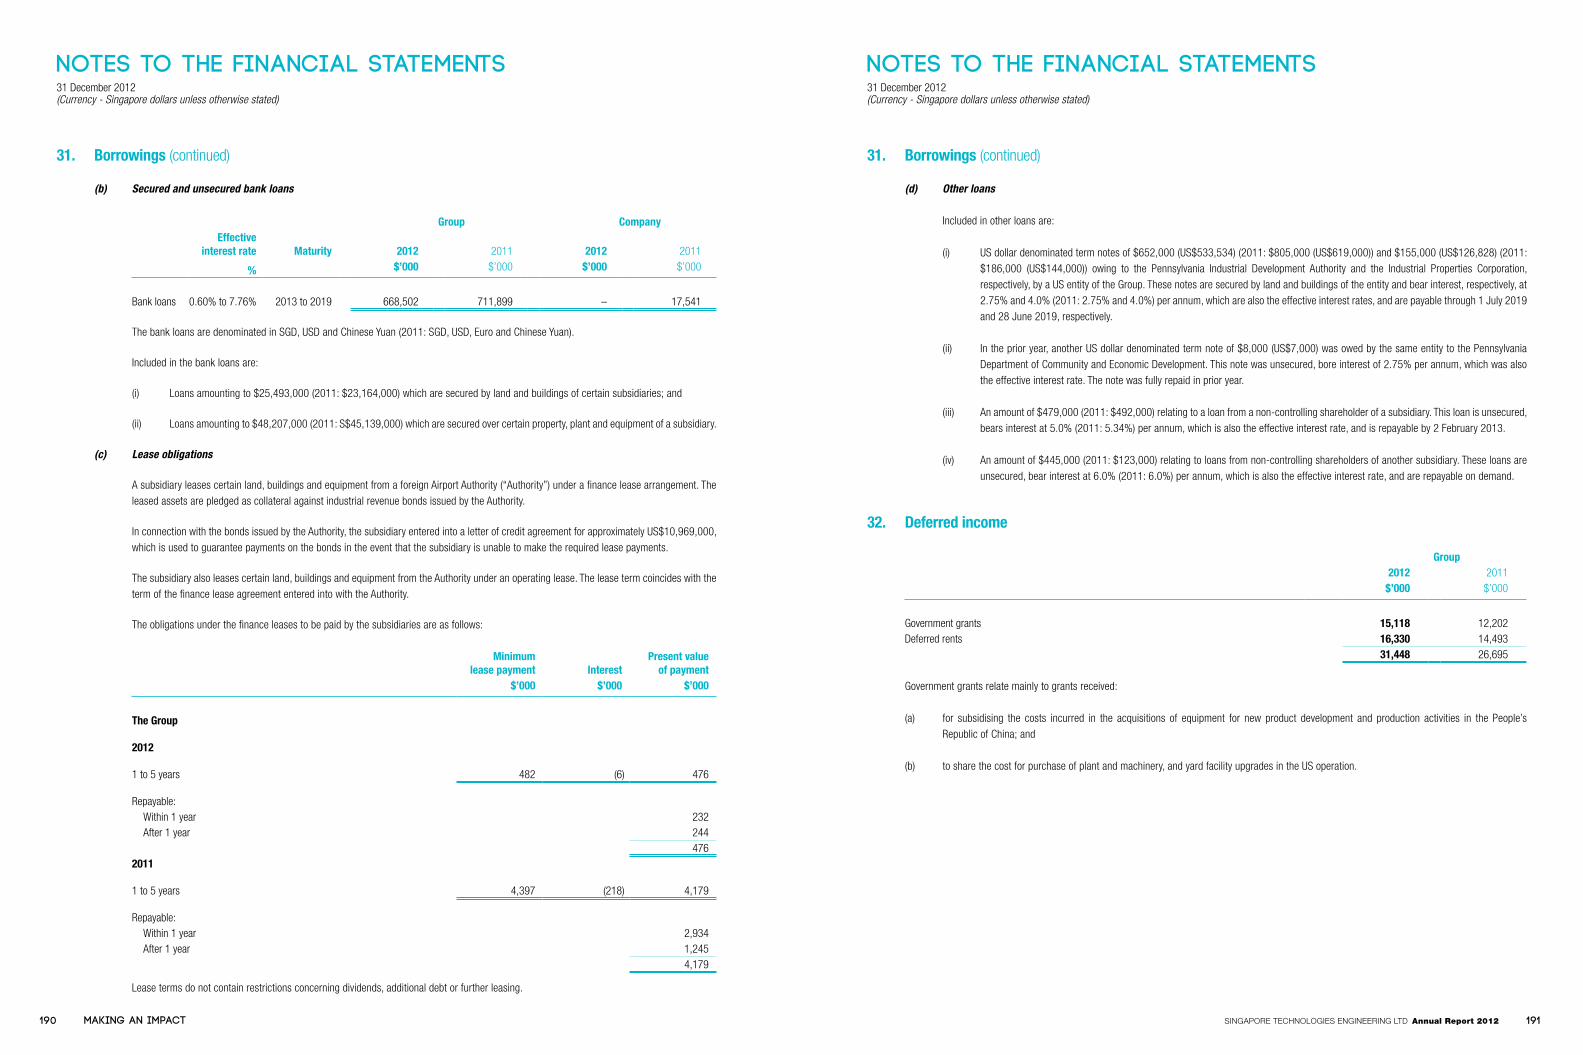
Notes to the Financial Statements31 December 2012(Currency - Singapore dollars unless otherwise stated)
Notes to the Financial Statements31 December 2012(Currency - Singapore dollars unless otherwise stated)
31. Borrowings (continued)
(b) Secured and unsecured bank loans
Group CompanyEffective
interest rate Maturity 2012 2011 2012 2011
% $’000 $’000 $’000 $’000
Bank loans 0.60% to 7.76% 2013 to 2019 668,502 711,899 – 17,541
The bank loans are denominated in SGD, USD and Chinese Yuan (2011: SGD, USD, Euro and Chinese Yuan).
Included in the bank loans are:
(i) Loans amounting to $25,493,000 (2011: $23,164,000) which are secured by land and buildings of certain subsidiaries; and
(ii) Loans amounting to $48,207,000 (2011: S$45,139,000) which are secured over certain property, plant and equipment of a subsidiary.
(c) Lease obligations
A subsidiary leases certain land, buildings and equipment from a foreign Airport Authority (“Authority”) under a finance lease arrangement. The leased assets are pledged as collateral against industrial revenue bonds issued by the Authority.
In connection with the bonds issued by the Authority, the subsidiary entered into a letter of credit agreement for approximately US$10,969,000, which is used to guarantee payments on the bonds in the event that the subsidiary is unable to make the required lease payments.
The subsidiary also leases certain land, buildings and equipment from the Authority under an operating lease. The lease term coincides with the term of the finance lease agreement entered into with the Authority.
The obligations under the finance leases to be paid by the subsidiaries are as follows:
Minimumlease payment Interest
Present valueof payment
$’000 $’000 $’000
The Group
2012
1 to 5 years 482 (6) 476
Repayable: Within 1 year 232 After 1 year 244
4762011
1 to 5 years 4,397 (218) 4,179
Repayable: Within 1 year 2,934 After 1 year 1,245
4,179
Lease terms do not contain restrictions concerning dividends, additional debt or further leasing.
31. Borrowings (continued)
(d) Other loans
Included in other loans are:
(i) US dollar denominated term notes of $652,000 (US$533,534) (2011: $805,000 (US$619,000)) and $155,000 (US$126,828) (2011: $186,000 (US$144,000)) owing to the Pennsylvania Industrial Development Authority and the Industrial Properties Corporation, respectively, by a US entity of the Group. These notes are secured by land and buildings of the entity and bear interest, respectively, at 2.75% and 4.0% (2011: 2.75% and 4.0%) per annum, which are also the effective interest rates, and are payable through 1 July 2019 and 28 June 2019, respectively.
(ii) In the prior year, another US dollar denominated term note of $8,000 (US$7,000) was owed by the same entity to the Pennsylvania Department of Community and Economic Development. This note was unsecured, bore interest of 2.75% per annum, which was also the effective interest rate. The note was fully repaid in prior year.
(iii) An amount of $479,000 (2011: $492,000) relating to a loan from a non-controlling shareholder of a subsidiary. This loan is unsecured, bears interest at 5.0% (2011: 5.34%) per annum, which is also the effective interest rate, and is repayable by 2 February 2013.
(iv) An amount of $445,000 (2011: $123,000) relating to loans from non-controlling shareholders of another subsidiary. These loans are unsecured, bear interest at 6.0% (2011: 6.0%) per annum, which is also the effective interest rate, and are repayable on demand.
32. Deferred income
Group2012 2011
$’000 $’000
Government grants 15,118 12,202Deferred rents 16,330 14,493
31,448 26,695
Government grants relate mainly to grants received:
(a) for subsidising the costs incurred in the acquisitions of equipment for new product development and production activities in the People’s Republic of China; and
(b) to share the cost for purchase of plant and machinery, and yard facility upgrades in the US operation.
190 191Singapore TechnologieS engineering lTd Annual Report 2012Making an impact

Notes to the Financial Statements31 December 2012(Currency - Singapore dollars unless otherwise stated)
Notes to the Financial Statements31 December 2012(Currency - Singapore dollars unless otherwise stated)
33. Deferred tax liabilities
Group Company2012 2011 2012 2011
$’000 $’000 $’000 $’000
At beginning of the year 84,090 58,216 755 426Recognised in profit or loss (7,185) 16,208 (755) 329Effect of reduction in tax rate 1,269 9 – –Translation difference (4,528) 631 – –Utilisation of tax losses and unabsorbed capital
allowance 9,716 9,024 – –Acquisition of a subsidiary 1,149 – – –Changes in fair value of derivative financial
instruments designated as cash flow hedges 118 2 – –At end of the year 84,629 84,090 – 755
The deferred tax liabilities arise as a result of:
Excess of net book value over tax written down value of property, plant and equipment 50,790 46,211 167 227
Allowance for doubtful debts and inventory obsolescence (11,036) (7,802) – –
Other temporary differences (15,658) (2,992) (167) 528Intangible assets 60,533 48,673 – –
84,629 84,090 – 755
34. Other long-term payables
Group2012 2011
$’000 $’000
After 1 year 2,000 2,500
The loan of $2,000,0000 (2011: $2,500,000) is payable to a previous non-controlling shareholder of a subsidiary for the purchase of remaining shareholdings of the subsidiary. The amount payable is unsecured, interest-free and repayable within seven years from 2010.
35. Share capital
Group and Company2012 2011
$’000 $’000
Issued and fully paidAt beginning of the year 723,411 677,590 3,056,464,902 (2011: 3,037,565,745) ordinary sharesIssued during the year 58,430 45,821 23,976,844 (2011: 18,899,157) ordinary shares At end of the year 3,080,441,746 (2011: 3,056,464,902) ordinary shares 781,841 723,411
Included in share capital is a special share issued to the Minister for Finance. The special share enjoys all the rights attached to the ordinary shares. In addition, the special share carries the right to approve any resolution to be passed by the Company, either in general meeting or by its Board of Directors, on certain matters specified in the Company’s Articles of Association. The special share may be converted at any time into an ordinary share.
The holders of ordinary shares are entitled to receive dividends as and when declared by the Company. All ordinary shares carry one vote per share without restriction.
36. Share-based payment arrangements
The Singapore Technologies Engineering Share Option Plan (“ESOP”), the Singapore Technologies Engineering Performance Share Plan (“PSP2000”) and the Singapore Technologies Engineering Restricted Stock Plan (“RSP2000”) of the Company (collectively referred to as the “Existing Share Plans”) were approved by the members of the Company at an Extraordinary General Meeting held on 23 November 2000.
A new share plan comprising the Singapore Technologies Engineering Performance Share Plan 2010 (“PSP2010”) and the Singapore Technologies Engineering Restricted Share Plan 2010 (“RSP2010”) was approved by the members of the Company at the Annual General Meeting held on 21 April 2010 (together, the “New Share Plans”). The Existing Share Plans were terminated following the adoption of the New Share Plans. However, all awards granted under the Existing Share Plans prior to its termination will continue to be valid and be subject to the terms and conditions of the Existing Share Plans.
Singapore Technologies Engineering Share Option Plan (“ESOP”)
The Company ceased to grant options under the ESOP with effect from 2007. Information regarding ESOP is as follows:
(a) The exercise price of the options is equal to volume-weighted average price for the shares on the SGX over the three consecutive trading days immediately preceding the date of grant.
(b) The options are exercisable at the end of the first year after date of grant, in accordance with a vesting schedule to be determined by ERCC and are settled in cash.
(c) The options granted expire after five years for non-executive directors and 10 years for the employees of the Company and its subsidiaries.
During the financial year, the Company issued 16,388,198 (2011: 13,690,266) ordinary shares for cash at the respective price per share upon the exercise of options granted by the Company under ESOP.
192 193Singapore TechnologieS engineering lTd Annual Report 2012Making an impact

Notes to the Financial Statements31 December 2012(Currency - Singapore dollars unless otherwise stated)
Notes to the Financial Statements31 December 2012(Currency - Singapore dollars unless otherwise stated)
36. Share-based payment arrangements (continued)
Grant no. No. of ordinary shares issued Price per ordinary share$
0202N 1,702,641 2.290
0208N 1,319,381 1.920
0302N 539,045 1.790
0308N 622,362 1.860
0402N 981,270 2.090
0408N 1,129,773 2.120
0502N 1,265,709 2.370
0508N 1,807,519 2.570
0602N 1,966,232 3.010
0608N 2,117,194 2.840
0703N 2,086,333 3.230
0708N 850,739 3.610
At the end of the financial year, unissued ordinary shares of the Company under options granted to eligible employees and directors of the Company are as follows:
(i) Options outstanding under the ESOP
Number of shares2012 2011
ESOPAt beginning of the year 67,776,607 84,290,501Exercised (16,388,198) (13,690,266)Lapsed (2,628,244) (2,823,628)At end of the year 48,760,165 67,776,607
Exercisable at end of the year 48,760,165 67,776,607
36. Share-based payment arrangements (continued)
(ii) Details of share options
2012
Details of share options to subscribe for ordinary shares pursuant to ESOP are as follows:
Date ofGrant
Balanceas at
1.1.2012Optionslapsed
Optionsexercised
Balanceas at
31.12.2012
No. ofholders at
31.12.2012Exercise
price Exercisable period$
7.2.2002 2,227,920 525,279 1,702,641 – – 2.290 8.2.2003 to 7.2.201212.8.2002 1,392,538 73,157 1,319,381 – – 1.920 13.8.2003 to 12.8.20126.2.2003 1,451,058 28,384 539,045 883,629 76 * 1.790 7.2.2004 to 6.2.201311.8.2003 1,953,451 30,966 622,362 1,300,123 124 * 1.860 12.8.2004 to 11.8.20139.2.2004 2,812,530 12,632 981,270 1,818,628 181 * 2.090 10.2.2005 to 9.2.201410.8.2004 3,544,964 31,133 1,129,773 2,384,058 234 * 2.120 11.8.2005 to 10.8.20147.2.2005 4,799,068 37,206 1,265,709 3,496,153 306 * 2.370 8.2.2006 to 7.2.201510.8.2005 6,518,149 40,071 1,807,519 4,670,559 397 * 2.570 11.8.2006 to 10.8.20159.2.2006 8,979,721 134,382 1,966,232 6,879,107 680 * 3.010 10.2.2007 to 9.2.201610.8.2006 8,871,700 109,466 2,117,194 6,645,040 648 * 2.840 11.8.2007 to 10.8.201615.3.2007 12,568,040 367,748 2,086,333 10,113,959 979 * 3.230 16.3.2008 to 15.3.201715.3.2007 360,000 360,000 – – – 3.230 16.3.2008 to 15.3.201210.8.2007 11,970,468 550,820 850,739 10,568,909 1,159 * 3.610 11.8.2008 to 10.8.201710.8.2007 327,000 327,000 – – – 3.610 11.8.2008 to 10.8.2012
67,776,607 2,628,244 16,388,198 48,760,165
* Includes one Executive Director of the Company
194 195Singapore TechnologieS engineering lTd Annual Report 2012Making an impact

Notes to the Financial Statements31 December 2012(Currency - Singapore dollars unless otherwise stated)
Notes to the Financial Statements31 December 2012(Currency - Singapore dollars unless otherwise stated)
36. Share-based payment arrangements (continued)
(ii) Details of share options (continued)
2011
Details of share options to subscribe for ordinary shares pursuant to ESOP are as follows:
Date ofgrant
Balanceas at
1.1.2011Optionslapsed
Optionsexercised
Balanceas at
31.12.2011
No. ofholders at
31.12.2011Exercise
price Exercisable period$
19.2.2001 2,646,916 296,026 2,350,890 – – 2.720 20.2.2002 to 19.2.201110.8.2001 4,017,363 380,358 3,637,005 – – 2.680 11.8.2002 to 10.8.20117.2.2002 3,047,010 – 819,090 2,227,920 146 * 2.290 8.2.2003 to 7.2.201212.8.2002 1,638,313 – 245,775 1,392,538 130 * 1.920 13.8.2003 to 12.8.20126.2.2003 1,684,485 – 233,427 1,451,058 145 * 1.790 7.2.2004 to 6.2.20136.2.2003 4,972 – 4,972 – – 1.790 7.2.2004 to 6.2.201311.8.2003 2,230,049 – 276,598 1,953,451 223 * 1.860 12.8.2004 to 11.8.201311.8.2003 8,754 – 8,754 – – 1.860 12.8.2004 to 11.8.20139.2.2004 3,295,905 2,413 480,962 2,812,530 307 * 2.090 10.2.2005 to 9.2.20149.2.2004 11,426 – 11,426 – – 2.090 10.2.2005 to 9.2.201410.8.2004 4,500,115 24,131 931,020 3,544,964 373 * 2.120 11.8.2005 to 10.8.201410.8.2004 11,426 – 11,426 – – 2.120 11.8.2005 to 10.8.20147.2.2005 5,843,288 30,736 1,013,484 4,799,068 461 * 2.370 8.2.2006 to 7.2.20157.2.2005 16,426 – 16,426 – – 2.370 8.2.2006 to 7.2.201510.8.2005 7,662,529 38,467 1,105,913 6,518,149 596 * 2.570 11.8.2006 to 10.8.201510.8.2005 21,426 – 21,426 – – 2.570 11.8.2006 to 10.8.20159.2.2006 9,815,209 266,383 569,105 8,979,721 903 * 3.010 10.2.2007 to 9.2.20169.2.2006 270,750 – 270,750 – – 3.010 10.2.2007 to 9.2.201110.8.2006 10,293,383 187,313 1,234,370 8,871,700 915 * 2.840 11.8.2007 to 10.8.201610.8.2006 344,750 23,000 321,750 – – 2.840 11.8.2007 to 10.8.201115.3.2007 13,359,023 665,330 125,653 12,568,040 1,236 * 3.230 16.3.2008 to 15.3.201715.3.2007 360,000 – – 360,000 18 # 3.230 16.3.2008 to 15.3.201210.8.2007 12,879,983 909,471 44 11,970,468 1,316 * 3.610 11.8.2008 to 10.8.201710.8.2007 327,000 – – 327,000 16 # 3.610 11.8.2008 to 10.8.2012
84,290,501 2,823,628 13,690,266 67,776,607
* Includes one Executive Director of the Company
# Includes Directors of the Company and its subsidiaries
36. Share-based payment arrangements (continued)
(iii) Details of share options exercised
No. of sharesExercise
priceProceeds from
share issue Share price $ $’000 $
2012January to March 3,518,907 1.790 – 3.230 8,205 2.71 – 3.23April to June 2,402,701 1.790 – 3.610 5,567 2.91 – 3.29July to September 5,491,199 1.790 – 3.230 14,017 3.17 – 3.59October to December 4,975,391 1.790 – 3.610 14,596 3.45 – 3.88
16,388,198
2011January to March 7,234,427 1.790 – 3.230 18,825 3.12 – 3.40April to June 3,315,215 1.790 – 3.610 8,323 2.83 – 3.28July to September 2,495,300 1.790 – 2.840 6,568 2.72 – 3.06October to December 645,324 1.790 – 2.570 1,450 2.66 – 2.88
13,690,266
The weighted average share price for options exercised during the year was $3.37 (2011: $3.15). The weighted average remaining contractual life for these options is 3.34 years (2011: 4.0 years).
The fair value of services received in return for share options granted are measured by reference to the fair value of share options granted. The estimate of the fair value of the services received is measured based on a binomial model, taking into account the terms and conditions upon which the options were granted. No options were granted for the years ended 31 December 2012 and 31 December 2011.
Singapore Technologies Engineering Performance Share Plan (“PSP2000”) and Singapore Technologies Engineering Performance Share Plan 2010 (“PSP2010”)
Performance shares are granted on an annual basis with key performance indicator targets set for a performance period, currently prescribed to be a 3-year performance period. The performance shares will only be released to the recipient at the end of the performance qualifying period if the targets are met. The final number of performance shares awarded will depend on the level of achievement of those targets and can range from 0% to 170% of the conditional award of performance shares. In addition, commencing with the PSP contingent awards for financial year 2009, the final award for performance shares is conditional upon the performance targets for restricted shares that have the same end of performance period being met.
PSP2000
Year of grant2010
Number of performance shares
At grant date 1,532,000Lapsed (167,974)Outstanding as at 31.12.2012 1,364,026
196 197Singapore TechnologieS engineering lTd Annual Report 2012Making an impact

Notes to the Financial Statements31 December 2012(Currency - Singapore dollars unless otherwise stated)
Notes to the Financial Statements31 December 2012(Currency - Singapore dollars unless otherwise stated)
36. Share-based payment arrangements (continued)
PSP2010
Year of grant Total2012 2011
Number of performance shares
At grant date 1,627,000 1,503,000 3,130,000Lapsed – (22,713) (22,713)Outstanding as at 31.12.2012 1,627,000 1,480,287 3,107,287
During the year, performance shares amounting to 979,610 ordinary shares were awarded in respect of grant made in 2009 under PSP2000.
The fair value of the performance shares is determined on conditional grant date using the Monte Carlo simulation model.
The significant inputs to the model used for the conditional grants are as follows:
Year of grant2012 2011 2010
Market conditionsVolatility of Defensive Index (%) 12.54 20.33 16.56Volatility of the Company’s shares (%) 15.88 19.21 20.18Correlation of volatility of Defensive Index/MSCI Index vs. the Company (%) 43.2 55.80 50.10Risk-free rate (%) 0.35 0.49 0.71Share price ($) 3.17 3.15 3.26Cost of equity (%) 7.90 7.90 8.90Dividend yield (-- Management’s forecast in line with dividend policy --)
Singapore Technologies Engineering Restricted Stock Plan (“RSP2000”) and Singapore Technologies Engineering Restricted Share Plan 2010 (“RSP2010”)
Restricted shares are granted on an annual basis with key performance indicator targets set for a performance period, currently prescribed to be a 2-year performance period. The restricted shares will only be released to the recipient at the end of the performance qualifying period if the targets are met. The final number of restricted shares awarded will depend on the level of achievement of those targets and range between 0% and 150% of the conditional award of the restricted shares and will be delivered to recipients over a 3-year vesting period; half at the end of the performance qualifying period and the balance will vest equally over the subsequent two years.
Subject to the shareholders’ approval at the Annual General Meeting to be held on 24 April 2013, the awards granted under the Restricted Share Plan 2010 to all Non-Executive Directors (“NEDs”) for financial year 2012 are outright shares with no performance and vesting conditions and will form up to 30% of NEDs’ total compensation. The share award has a Moratorium on selling. Each NED is required to hold a number of shares in the Company based on the lower of: (a) the total number of shares in the Company awarded to such NED as payment of the shares’ component of the NEDs’ fees for financial year 2011 and onwards; or (b) the number of shares of equivalent value to the prevailing annual basic retainer fee for a Director of the Company. Any extra shares can be disposed of. NED can dispose of all shares if they so desire after a year has elapsed from the time they left the Board.
36. Share-based payment arrangements (continued)
Date of grant
Number ofrestricted
shares as atgrant date
Number ofrestricted
shares lapsed
Number ofrestricted
sharesreleased
Balanceoutstanding
as at31.12.2012
RSP200012 November 2007 300,000 – 240,000 60,00024 March 2008 7,603,183 3,252,712 4,350,471 –18 March 2009 8,286,892 2,712,193 4,295,739 1,278,96018 March 2009 210,500 78,958 131,542 –22 March 2010 8,547,400 1,094,351 3,874,103 3,578,946
RSP201025 February 2011 50,000 – 10,000 40,00016 March 2011 7,380,041 703,355 – 6,676,68627 June 2011 349,900 – 174,950 174,95017 October 2011 5,000 – – 5,00022 March 2012 4,617,900 90,167 – 4,527,7334 April 2012 92,618 – 92,618 –11 May 2012 186,000 – 186,000 –
During the year, restricted shares amounting to 6,320,418 and 288,618 ordinary shares were awarded under RSP2000 and RSP2010 respectively.
The fair value of the restricted shares is determined at conditional grant date using the Monte Carlo simulation model.
The significant inputs to the model used for the conditional grant are as follows:
Year of grant2012 2011
Volatility of the Company’s shares (%) 15.88 19.21Risk-free rate (%) 0.24 – 0.45 0.35 – 0.82Share price ($) 3.17 3.15Dividend yield (--Management’s forecast in line with dividend policy--)
For financial year 2012, the actual number of shares granted to each NED will be based on the volume-weighted average price of an ordinary share of the Company on the SGX over the 14 trading days immediately after Annual General Meeting.
198 199Singapore TechnologieS engineering lTd Annual Report 2012Making an impact
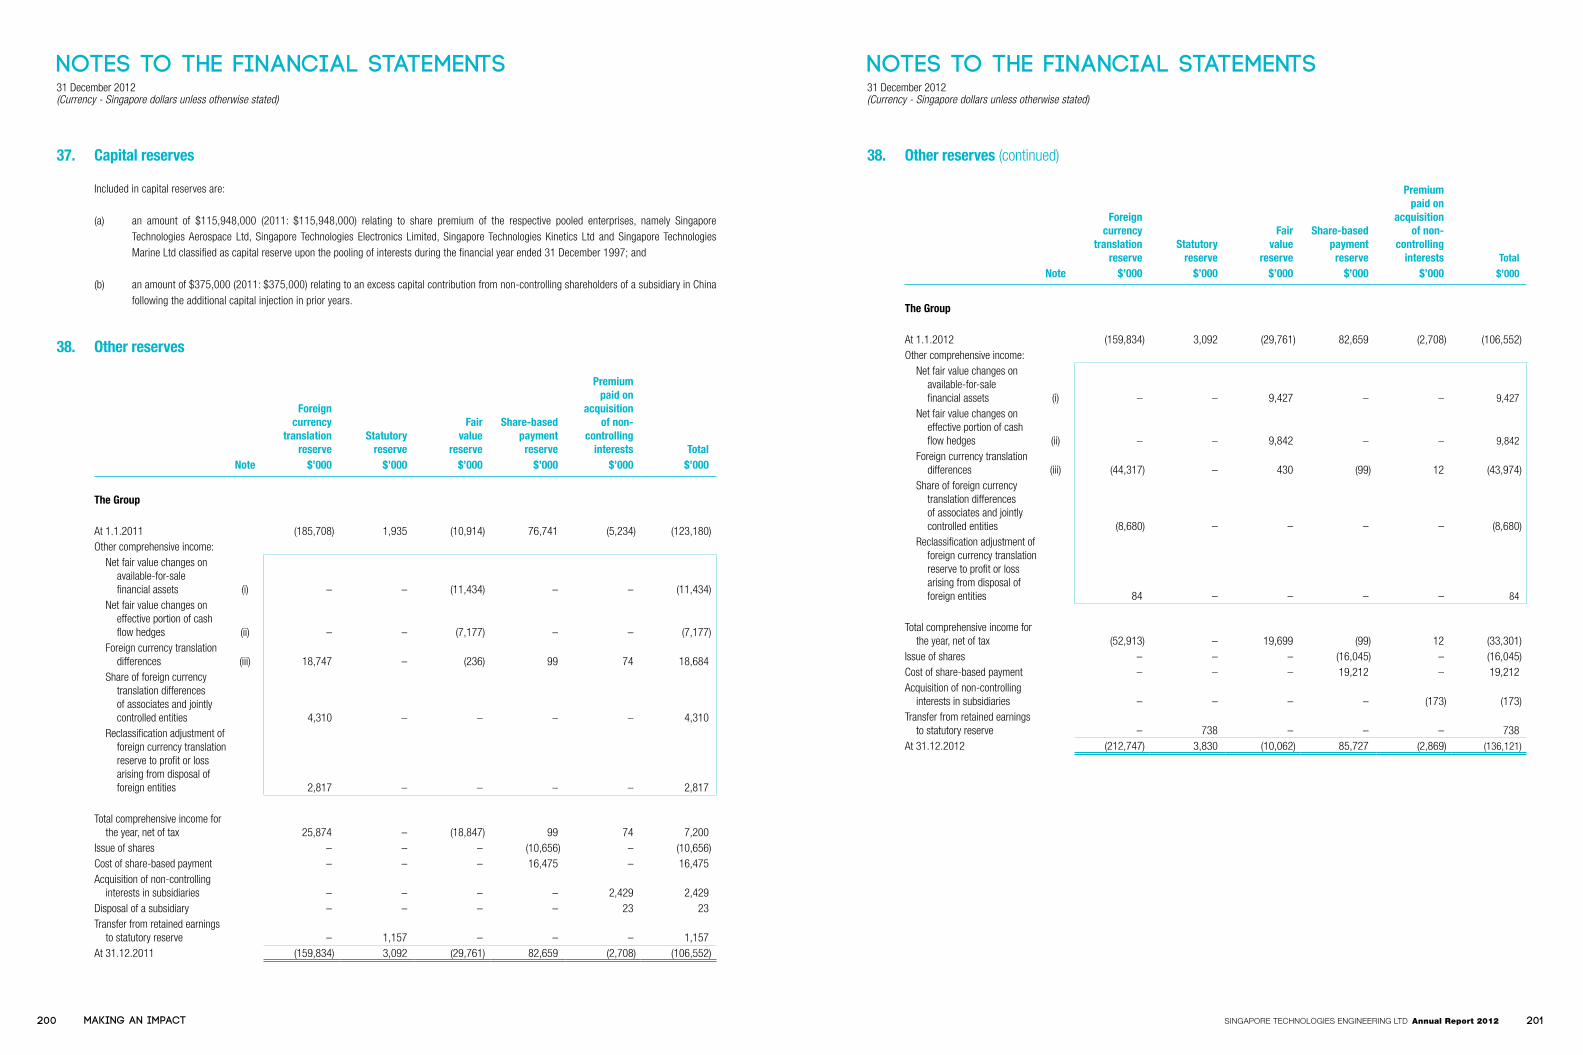
Notes to the Financial Statements31 December 2012(Currency - Singapore dollars unless otherwise stated)
Notes to the Financial Statements31 December 2012(Currency - Singapore dollars unless otherwise stated)
37. Capital reserves
Included in capital reserves are:
(a) an amount of $115,948,000 (2011: $115,948,000) relating to share premium of the respective pooled enterprises, namely Singapore Technologies Aerospace Ltd, Singapore Technologies Electronics Limited, Singapore Technologies Kinetics Ltd and Singapore Technologies Marine Ltd classified as capital reserve upon the pooling of interests during the financial year ended 31 December 1997; and
(b) an amount of $375,000 (2011: $375,000) relating to an excess capital contribution from non-controlling shareholders of a subsidiary in China following the additional capital injection in prior years.
38. Other reserves
Foreigncurrency
translationreserve
Statutoryreserve
Fairvalue
reserve
Share-basedpayment
reserve
Premiumpaid on
acquisitionof non-
controllinginterests Total
Note $’000 $’000 $’000 $’000 $’000 $’000
The Group
At 1.1.2011 (185,708) 1,935 (10,914) 76,741 (5,234) (123,180)Other comprehensive income:
Net fair value changes on available-for-sale financial assets (i) – – (11,434) – – (11,434)
Net fair value changes on effective portion of cash flow hedges (ii) – – (7,177) – – (7,177)
Foreign currency translation differences (iii) 18,747 – (236) 99 74 18,684
Share of foreign currency translation differences of associates and jointly controlled entities 4,310 – – – – 4,310
Reclassification adjustment of foreign currency translation reserve to profit or loss arising from disposal of foreign entities 2,817 – – – – 2,817
Total comprehensive income for the year, net of tax 25,874 – (18,847) 99 74 7,200
Issue of shares – – – (10,656) – (10,656)Cost of share-based payment – – – 16,475 – 16,475Acquisition of non-controlling
interests in subsidiaries – – – – 2,429 2,429Disposal of a subsidiary – – – – 23 23Transfer from retained earnings
to statutory reserve – 1,157 – – – 1,157At 31.12.2011 (159,834) 3,092 (29,761) 82,659 (2,708) (106,552)
38. Other reserves (continued)
Foreigncurrency
translationreserve
Statutoryreserve
Fairvalue
reserve
Share-basedpayment
reserve
Premiumpaid on
acquisitionof non-
controllinginterests Total
Note $’000 $’000 $’000 $’000 $’000 $’000
The Group
At 1.1.2012 (159,834) 3,092 (29,761) 82,659 (2,708) (106,552)Other comprehensive income:
Net fair value changes on available-for-sale financial assets (i) – – 9,427 – – 9,427
Net fair value changes on effective portion of cash flow hedges (ii) – – 9,842 – – 9,842
Foreign currency translation differences (iii) (44,317) – 430 (99) 12 (43,974)
Share of foreign currency translation differences of associates and jointly controlled entities (8,680) – – – – (8,680)
Reclassification adjustment of foreign currency translation reserve to profit or loss arising from disposal of foreign entities 84 – – – – 84
Total comprehensive income for the year, net of tax (52,913) – 19,699 (99) 12 (33,301)
Issue of shares – – – (16,045) – (16,045)Cost of share-based payment – – – 19,212 – 19,212Acquisition of non-controlling
interests in subsidiaries – – – – (173) (173)Transfer from retained earnings
to statutory reserve – 738 – – – 738At 31.12.2012 (212,747) 3,830 (10,062) 85,727 (2,869) (136,121)
200 201Singapore TechnologieS engineering lTd Annual Report 2012Making an impact

Notes to the Financial Statements31 December 2012(Currency - Singapore dollars unless otherwise stated)
Notes to the Financial Statements31 December 2012(Currency - Singapore dollars unless otherwise stated)
38. Other reserves (continued)
Group2012 2011
$’000 $’000
(i) Net fair value changes on available-for-sale financial assets:– Net fair value changes during the year 12,170 (7,437)– Reclassification adjustment to profit or loss on disposal of financial assets in finance
costs, net (2,743) (3,997)9,427 (11,434)
(ii) Net fair value changes on effective portion of cash flow hedges:– Net fair value changes during the year 3,865 (15,457)– Reclassification adjustment to profit or loss on occurrence of forecast transaction in
finance costs, net 5,295 8,289– Ineffective portion in cash flow hedges 682 (9)
9,842 (7,177)
(iii) Foreign currency translation differences arising from:– Translation of quasi equity loans forming part of net investments in foreign entities (7,651) (10,628)– Translation of foreign currency loans used as hedging instruments for effective net
investment hedges 12,849 (5,487)– Translation of foreign entities (49,515) 34,862
(44,317) 18,747
Foreign currency translation reserve
The foreign currency translation reserve is used to record exchange differences arising from the translation of the financial statements of foreign subsidiaries whose functional currencies are different from that of the Group’s presentation currency.
As at 31 December 2012, bonds amounting to $112.5 million (US$92.0 million) (2011: $257.4 million (US$198.1 million)) have been designated as a hedge of the net investment in Vision Technologies Systems, Inc. and its subsidiaries (“US subsidiaries”) and are being used to hedge the Group’s exposure to foreign exchange risk on this investment. Exchange gain or loss on the re-translation of these bonds is transferred to other comprehensive income to offset any exchange gain or loss on translation of the net investment in the US subsidiaries. There is no ineffectiveness in the hedge during the year.
Statutory reserve
(a) In accordance with the foreign Enterprise Law applicable to certain wholly-owned subsidiaries in the People’s Republic of China (“PRC”), the subsidiaries are required to make appropriation to a Statutory Reserve Fund (“SRF”). At least 10% of the statutory after tax profits as determined in accordance with the applicable PRC accounting standards and regulations must be allocated to the SRF until the cumulative total of the SRF reaches 50% of the subsidiaries’ registered capital. Subject to approval from the relevant PRC authorities, the SRF may be used to offset any accumulated losses or increase the registered capital of the subsidiaries. The SRF is not available for standard distribution to shareholders.
(b) In accordance with the Law of the PRC on Joint Ventures Using Chinese and Foreign Investment applicable to certain subsidiaries, appropriations from the net profits are made to the Reserve Fund and the Enterprise Expansion Fund, after offsetting accumulated losses from prior years (if any), and before profit distributions to the investors. The percentage to be appropriated to the Reserve Fund and the Enterprise Expansion Fund is to be determined by the Board of Directors of the PRC entities.
38. Other reserves (continued)
Fair value reserve
Fair value reserve records the cumulative fair value changes of available-for-sale financial assets until they are derecognised or impaired, as well as the portion of the fair value changes on the derivative financial instruments designated as hedging instruments in cash flow hedges that are determined to be an effective hedge.
Share-based payment reserve
Share-based payment reserve represents the equity-settled share options, performance shares and restricted shares granted to employees and non-executive directors. The reserve is made up of the cumulative value of services received from employees recorded on grant of equity-settled share options, performance shares and restricted shares. The expense for services received will be recognised over the vesting periods.
Premium paid on acquisition of non-controlling interests
The reserve represents the difference between the consideration paid on acquisition of non-controlling interests and the carrying value of the proportionate share of the acquiree’s net assets acquired.
39. Retained earnings
Group2012 2011
$’000 $’000
Retained by: The Company 542,390 536,877 Subsidiaries 478,125 379,268 Associates and jointly controlled entities 112,129 116,868
1,132,644 1,033,013
40. Dividends
Group and Company2012 2011
$’000 $’000
Final dividend paid in respect of the previous financial year of 4.0 cents (2011: 4.0 cents) per share 122,259 121,503
Special dividend paid in respect of the previous financial year of 8.5 cents (2011: 7.55 cents) per share 259,784 229,508
Interim dividend paid in respect of the current financial year of 3.0 cents (2011: 3.0 cents) per share 92,184 91,656
474,227 442,667Additional final dividend paid in respect of the previous financial year
due to issue of shares before books closure date 1,582 1,509475,809 444,176
The Directors propose a final dividend of 4.0 cents (2011: 4.0 cents) per share amounting to $123.4 million (2011: $122.3 million) and a special dividend of 9.8 cents (2011: 8.5 cents) per share amounting to $302.2 million (2011: $259.8 million), in respect of the financial year ended 31 December 2012. These dividends have not been recognised as a liability as at year-end as they are subject to approval of the shareholders at the Annual General Meeting of the Company.
202 203Singapore TechnologieS engineering lTd Annual Report 2012Making an impact

Notes to the Financial Statements31 December 2012(Currency - Singapore dollars unless otherwise stated)
Notes to the Financial Statements31 December 2012(Currency - Singapore dollars unless otherwise stated)
41. Related party information
In addition to related party information disclosed elsewhere in the financial statements, the Group has significant transactions with the following related parties on terms agreed between the parties as follows:
Group2012 2011
$’000 $’000
Associates of the GroupSales and services rendered 12,231 10,882Purchases and services received 20,926 24,885Dividend income 30,743 24,104
Jointly controlled entities of the GroupSales and services rendered 1,744 14,687Purchases and services received 6,803 15,762Dividend income 2,526 1,547
Other related parties *Sales and services rendered 78,301 56,641Purchases and services received 21,716 26,763Rental expense 1,655 4,271Rental income 2,935 2,511
* Other related parties refer to subsidiaries, associates and jointly controlled entities of immediate holding company.
42. Commitments
(a) Capital commitments
Group2012 2011
$’000 $’000
Capital expenditure contracted but not provided for in the financial statements 175,761 161,023
(b) Leases
Future minimum lease payments under non-cancellable operating leases are as follows:
Group2012 2011
$’000 $’000
Third partiesWithin 1 year 51,823 47,4092 to 5 years 75,425 85,088After 5 years 213,329 137,263
340,577 269,760
Related partiesWithin 1 year 4,035 3,9902 to 5 years 10,046 11,311After 5 years 26,852 28,020
40,933 43,321
The Group has several operating lease agreements for leasehold land and buildings, office premises and computers. The leases have varying terms, escalation clauses and renewal rights. Lease terms do not contain restrictions on the Group activities concerning dividends, additional debt or further leasing.
None of the operating leases is subject to contingent rent arrangements.
(c) Operating lease commitments – As lessor
The Group has entered into commercial leases on its aircraft, aircraft engines and certain property, plant and equipment. The non-cancellable leases have lease term ranging from 8 months to 19 years. The leases on the aircraft include a clause to enable upward revision of the rental charge on an annual basis based on prevailing market conditions.
The future lease payment receivables under non-cancellable operating leases are as follows:
Group2012 2011
$’000 $’000
Within 1 year 12,278 12,4372 to 5 years 33,656 37,293After 5 years 20,798 21,957
66,732 71,687
204 205Singapore TechnologieS engineering lTd Annual Report 2012Making an impact

Notes to the Financial Statements31 December 2012(Currency - Singapore dollars unless otherwise stated)
Notes to the Financial Statements31 December 2012(Currency - Singapore dollars unless otherwise stated)
42. Commitments (continued)
(d) Investments
(i) As at 31 December 2012, the Group has outstanding commitments in respect of uncalled capital to the extent of $0.1 million (2011: $0.4 million) in subsidiaries.
(ii) As at 31 December 2012, the Group has outstanding commitment in respect of uncalled capital to the extent of $1.9 million (2011: $2.0 million) in a joint venture.
Joint Venture Agreement
On 2 November 2006, an agreement was signed between Singapore Technologies Kinetics Ltd and BF Utilities Limited to form an Equity Joint Venture Company in Pune, India. The joint venture company will have a registered capital of US$6 million to be contributed by each party in the proportion of 26% and 74% respectively, which is to be contributed over three years. To-date, the joint venture company has not been set up.
43. Segment information
(a) Analysis by business segments
The Group is organised on a worldwide basis into four main operating segments, namely:
(i) Aerospace
Provides a spectrum of maintenance and engineering services that include airframe, engine and component maintenance, repair and overhaul; engineering design and technical services; and aviation materials and management services, including Total Aviation Support.
(ii) Electronics
Delivers innovative system solutions to government, commercial, defence, and industrial customers worldwide. It specialises in the design, development and integration of advanced electronics and communications systems, such as broadband radio frequency and satellite communication, e-Government solutions, information communications technologies and IT, rail and traffic management, real-time command and control, modelling and simulation, interactive digital media, intelligent building management and information security.
(iii) Land Systems
Delivers integrated land systems, specialty vehicles and their related through life support for defence, homeland security and commercial applications.
(iv) Marine
Provides turnkey building, repair and conversion services for a wide spectrum of naval and commercial vessels. In shipbuilding, it has the proven capabilities to provide turnkey solutions from concept definition to detailed design, construction, on-board system installation and integration, testing, commissioning to through-life support. It has also established a track record in providing high engineering content shiprepair and ship conversion services for a worldwide clientele. It also provides a suite of sustainable environmental engineering solutions.
43. Segment information (continued)
(a) Analysis by business segments (continued)
Other operations include research and development, treasury, investment holding and provision of management, consultancy, integrated logistics management, integrated facilities management, warehousing and other support services. None of these segments meets any of the quantitative thresholds for determining reportable segments in financial years 2012 and 2011.
Management monitors the operating results of its business units separately for the purpose of making decisions about resource allocation and performance assessment. Segment performance is evaluated based on operating profit or loss which in certain respects, as explained in the table below, is measured differently from operating profit or loss in the consolidated financial statements.
Inter-segment pricing is on an arm’s length basis.
Aerospace ElectronicsLand
Systems Marine Others Elimination Group$’000 $’000 $’000 $’000 $’000 $’000 $’000
2012
Revenue External sales 2,019,270 1,578,045 1,512,601 1,010,546 259,404 – 6,379,866 Inter-segment sales 6,357 40,672 12,740 546 29,574 (89,889) –
2,025,627 1,618,717 1,525,341 1,011,092 288,978 (89,889) 6,379,866
Reportable segment profit from operations 274,306 158,207 98,512 122,226 (46,529) 51,177 657,899
Other income, net 16,070 2,191 18,686 6,109 49,240 (49,054) 43,242Finance income 9,774 3,206 4,448 6,820 618,559 (594,420) 48,387Finance costs (25,904) (6,774) (15,423) (8,843) (83,799) 73,669 (67,074)Share of results of associates and jointly
controlled entities 29,517 (4,537) 8,243 1,516 228 5,638 40,605Profit before taxation 303,763 152,293 114,466 127,828 537,699 (512,990) 723,059Taxation (46,491) (29,792) (24,264) (33,172) (4,296) (423) (138,438)Non-controlling interests (4,030) (2,730) (2,042) 357 – 2 (8,443)Profit attributable to shareholders 253,242 119,771 88,160 95,013 533,403 (513,411) 576,178
Other assets 2,291,275 1,555,994 1,946,157 885,915 4,074,433 (3,028,328) 7,725,446Associates and jointly controlled entities 160,875 4,702 111,550 2,562 17,681 8,746 306,116Segment assets 2,452,150 1,560,696 2,057,707 888,477 4,092,114 (3,019,582) 8,031,562
Segment liabilities 1,975,445 1,408,055 1,907,535 764,093 2,166,357 (2,202,505) 6,018,980
Capital expenditure 108,745 46,722 52,865 49,932 4,551 – 262,815Depreciation and amortisation 49,014 27,452 41,467 14,339 4,876 (46) 137,102Impairment losses/(write-back of
impairment) – 11,079 4,719 – (340) – 15,458Other non-cash expenses 7,202 101 11 – – – 7,314
206 207Singapore TechnologieS engineering lTd Annual Report 2012Making an impact

Notes to the Financial Statements31 December 2012(Currency - Singapore dollars unless otherwise stated)
Notes to the Financial Statements31 December 2012(Currency - Singapore dollars unless otherwise stated)
43. Segment information (continued)
(a) Analysis by business segments (continued)
Aerospace ElectronicsLand
Systems Marine Others Elimination Group$’000 $’000 $’000 $’000 $’000 $’000 $’000
2011
Revenue External sales 1,920,240 1,481,268 1,479,506 876,109 233,755 – 5,990,878 Inter-segment sales 6,560 35,707 26,959 1,095 29,343 (99,664) –
1,926,800 1,516,975 1,506,465 877,204 263,098 (99,664) 5,990,878
Reportable segment profit from operations 242,114 145,587 100,250 110,522 (38,226) 47,425 607,672
Other income, net 7,975 1,821 14,968 7,327 45,744 (45,523) 32,312Finance income 17,662 1,396 3,516 6,248 592,037 (575,789) 45,070Finance costs (22,852) (6,880) (16,715) (3,809) (99,511) 85,321 (64,446)Share of results of associates and jointly
controlled entities 33,299 (5,071) 6,054 1,552 – (1,217) 34,617Profit before taxation 278,198 136,853 108,073 121,840 500,044 (489,783) 655,225Taxation (41,831) (25,690) (17,966) (30,477) 543 857 (114,564)Non-controlling interests (4,573) (2,361) (6,289) 102 – 4 (13,117)Profit attributable to shareholders 231,794 108,802 83,818 91,465 500,587 (488,922) 527,544
Other assets 2,008,646 1,601,647 1,751,679 761,716 4,090,429 (3,127,828) 7,086,289Associates and jointly controlled entities 170,173 8,904 117,573 1,871 18,906 3,467 320,894Segment assets 2,178,819 1,610,551 1,869,252 763,587 4,109,335 (3,124,361) 7,407,183
Segment liabilities 1,711,363 1,466,151 1,714,111 648,339 2,398,914 (2,407,803) 5,531,075
Capital expenditure 74,856 33,170 56,700 18,362 4,233 (163) 187,158Depreciation and amortisation 57,772 23,949 36,586 12,630 4,167 (45) 135,059Impairment losses – 6,090 4,114 – 19 – 10,223Other non-cash expenses 6,823 17 614 – 1 – 7,455
(b) Analysis by country of incorporation
Revenue is based on the country of incorporation regardless of where the goods are produced or services rendered. Non-current assets, excluding derivative financial instruments and deferred tax assets, are based on the location of those assets.
Revenue Non-current assets2012 2011 2012 2011
$’000 $’000 $’000 $’000
Asia 4,393,699 4,173,232 1,638,684 1,276,954USA 1,673,270 1,483,184 634,313 597,017Europe 264,082 283,815 89,585 332,210Others 48,815 50,647 95,396 108,888
6,379,866 5,990,878 2,457,978 2,315,069
43. Segment information (continued)
(c) Analysis by geographical areas
Revenue is based on the location of customers regardless of where the goods are produced or services rendered.
Revenue2012 2011
$’000 $’000
Asia 3,758,800 3,566,778USA 1,738,965 1,541,931Europe 508,018 484,600Others 374,083 397,569
6,379,866 5,990,878
44. Financial risk management objectives and policies
The Group and the Company are exposed to financial risks, namely, interest rate, foreign exchange, market, liquidity and credit risks, arising from its operations and the use of financial instruments. The Group’s principal financial instruments, other than foreign exchange contracts and derivatives, comprise bank guarantees, performance bonds, bank loans and overdrafts, finance leases and hire purchase contracts, investments, cash and short-term deposits. All financial transactions with the banks are governed by banking facilities duly accepted with Board of Directors’ resolutions, with banking mandates, which define the permitted financial instruments and facilities limits. All financial transactions require dual signatories. The Group has various other financial assets and liabilities such as trade receivables and trade payables, which arise directly from its operations.
It is the Group’s policy not to engage in foreign exchange and/or derivatives speculation. The purpose of engaging in treasury transactions is solely for hedging. The Group’s treasury mandates allow only foreign exchange spot, forward or non-deliverable forward, foreign exchange swap, cross currency swap, purchase of foreign exchange call, put or collar option, forward rate agreement, interest rate swap, purchase of interest rate cap, floor or collar option (“Permitted Transactions”). These instruments are generic in nature with no embedded or leverage features and any deviation from these instruments would require specific approval from the Board of Directors. The Group’s accounting policies in relation to derivative financial instruments are set out in Note 3.
The policies for managing each of these risks are broadly summarised below.
Interest rate risk
As at reporting date, the interest rate profile of the interest-bearing financial instruments is:
Group Company2012 2011 2012 2011
$’000 $’000 $’000 $’000
Fixed rate instrumentsFinancial assets 1,265,006 983,259 311,111 264,346Financial liabilities (910,465) (1,207,250) – –
354,541 (223,991) 311,111 264,346Variable rate instrumentsFinancial assets 395,718 454,999 767,176 874,083Financial liabilities (368,965) (157,004) (531,820) (469,316)
26,753 297,995 235,356 404,767
208 209Singapore TechnologieS engineering lTd Annual Report 2012Making an impact

Notes to the Financial Statements31 December 2012(Currency - Singapore dollars unless otherwise stated)
Notes to the Financial Statements31 December 2012(Currency - Singapore dollars unless otherwise stated)
44. Financial risk management objectives and policies (continued)
Interest rate risk (continued)
The Group has cash balances placed with reputable banks and financial institutions. The Group manages its interest rate risk on its interest income by placing the cash balances in varying maturities and interest rate terms with due consideration to operating cash flow requirements and optimising yield.
The Group’s debts include 10-year bonds issued, bank loans and lease commitments. The Group seeks to minimise its interest rate risk exposure through tapping different sources of funds to refinance the debt instruments and/or enter into interest rate swaps, where appropriate. Movements in interest rates will therefore have an impact on the Group. A change of 50 basis points in interest rate at the reporting date would increase/decrease Group’s profit or loss and other comprehensive income by the amounts shown below. This analysis assumes that all other variables remain constant.
Other comprehensive income Profit or loss50bp
Increase50bp
Decrease50bp
Increase50bp
Decrease$’000 $’000 $’000 $’000
The Group
2012Bank loans – – (1,845) 1,845Loans receivable – – 189 (189)Investments in bonds (4,696) 4,804 – –
2011Bank loans – – (785) 785Loans receivable – – 262 (262)Investments in bonds (4,631) 7,442 – –
The Company
2012Amounts due to subsidiaries – – (2,659) 2,659Amounts due from subsidiaries – – 3,836 (3,836)
2011Amounts due to subsidiaries – – (2,347) 2,347Amounts due from subsidiaries – – 4,370 (4,370)
Fixed deposits, bonds, bank loans and other financial instruments with interest rate fixed over the contractual period are excluded from the sensitivity analysis. Information relating to the Group’s interest rate risk exposure is also disclosed in the notes on the Group’s borrowings, investments and loans receivable, where applicable.
44. Financial risk management objectives and policies (continued)
Foreign exchange risk
The Group’s foreign exchange risk arises both from its subsidiaries operating in foreign countries, generating revenue and incurring costs denominated in foreign currencies, and from operations of its local subsidiaries which are transacted in foreign currencies. The Group’s foreign exchange exposures are primarily from USD and Euro and the Group enters mainly into forward currency contracts to hedge against its foreign exchange risk resulting from anticipated sale and purchase transactions denominated in foreign currencies in accordance with the Group’s hedging policy. The Group enters into cross currency swap to hedge the foreign exchange risk of its loans denominated in foreign currency. The Group also uses monetary assets and liabilities and embedded derivatives to hedge its risks associated with foreign currency fluctuation.
The Company’s centralised Treasury Unit (“Unit”) facilitates intra-group foreign exchange transactions within the Group to net-off the foreign exchange exposures before proceeding to transact with the banks.
The Unit executes the Group’s material foreign exchange transactions with proper segregation of duties between authorised dealers and back office. Only authorised dealers can transact with the banks on behalf of the Group, with back office confirming the deals. The dealers’ limits and permitted treasury instruments in the form of an authorisation matrix and mandates are communicated to all counterparties.
No foreign exchange sensitivity analysis was disclosed as the Company had assessed that a reasonable change in the exchange rate would not result in any significant impact on the Group’s results.
Market risk
The Group has strategic investments in quoted equity shares. The market value of these investments will fluctuate with market conditions.
The table below summarises the impact to the Group’s profit or loss and other comprehensive income arising as a result of a 10% increase/decrease in the fair value of the quoted investments, assuming no impairment on the quoted investments. This analysis assumes that all other variables remain constant.
Other comprehensive income Profit or loss 10%
increase10%
decrease10%
increase10%
decrease$’000 $’000 $’000 $’000
The Group
2012Quoted investments 1,077 (1,077) 35 (35)
2011Quoted investments 934 (934) 21 (21)
210 211Singapore TechnologieS engineering lTd Annual Report 2012Making an impact

Notes to the Financial Statements31 December 2012(Currency - Singapore dollars unless otherwise stated)
Notes to the Financial Statements31 December 2012(Currency - Singapore dollars unless otherwise stated)
44. Financial risk management objectives and policies (continued)
Liquidity risk
To manage liquidity risk, the Group monitors its net operating cash flows and maintains an adequate level of cash and cash equivalents and secured committed funding facilities from financial institutions. In assessing the adequacy of these funding facilities, management reviews its working capital requirements regularly.
The table below analyses the Group’s financial liabilities and certain derivative financial instruments that will be settled on a gross basis into relevant maturity groupings based on the remaining period at reporting date to the contractual maturity date. The amounts disclosed in the table below are the contractual undiscounted cash flows.
Contractualcash flow
Within1 year
2 to 5years
More than5 years
$’000 $’000 $’000 $’000
The Group
2012Bank loans (668,502) (209,501) (438,228) (20,773)Bonds (803,330) (29,342) (117,370) (656,618)Other loans (1,731) (1,054) (556) (121)Lease obligations (479) (234) (245) –Other long-term payables (2,000) – (2,000) –Trade and other payables (1,696,395) (1,693,434) (2,961) –Derivative financial instruments:• Forward currency contracts – gross payments (1,728,908) (903,443) (825,465) – – gross receipts 1,750,070 910,488 839,582 –• Cross currency swap – net receipts 9,534 761 8,773 –• Interest rate swaps - settled net (6,571) (5,777) (794) –• Cross currency interest rate swaps - settled net 8,716 3,072 9,095 (3,451)
2011Bank loans (711,899) (204,085) (496,601) (11,213)Bonds (884,910) (31,183) (124,733) (728,994)Other loans (1,614) (758) (574) (282)Lease obligations (4,280) (3,013) (1,267) –Other long-term payables (2,500) – (2,000) (500)Trade and other payables (1,700,614) (1,700,250) (364) –Derivative financial instruments:• Forward currency contracts – gross payments (761,508) (702,580) (58,928) – – gross receipts 753,454 695,716 57,738 –• Cross currency swap – net receipts 11,793 – 11,793 –• Interest rate swaps - settled net (12,850) (6,574) (6,276) –
44. Financial risk management objectives and policies (continued)
Liquidity risk (continued)
Contractualcash flow
Within1 year
2 to 5years
More than5 years
$’000 $’000 $’000 $’000
The Company
2012Trade payables and accruals (45,191) (45,191) – –Amounts due to related parties (540,479) (44,854) (435,721) (59,904)Derivative financial instruments:• Forward currency contracts – gross payments (4,171) (3,102) (1,069) – – gross receipts 4,204 3,119 1,085 –• Intragroup financial guarantee (328,146) (120,304) (207,842) –
2011Trade payables and accruals (36,136) (36,136) – –Amounts due to related parties (496,397) (269,076) (227,321) –Derivative financial instruments:• Forward currency contracts – gross payments (3,846) (3,846) – – – gross receipts 3,869 3,869 – –• Intragroup financial guarantee (348,082) (88,222) (259,860) –
For derivative financial instruments, the cash inflows/(outflows) represent the contractual undiscounted cash flows relating to these instruments. The amounts are compiled on a net basis for derivatives that are net-settled. Gross inflows and outflows are included for derivatives that are gross-settled on a simultaneous basis. Net-settled derivative financial assets are included in the maturity analysis as they are held to hedge the cash flow variability of the Group’s bank loans and bonds.
Except for the cash flow arising from the intragroup financial guarantee, it is not expected that the cash flows included in the maturity analysis of the Group and the Company could occur significantly earlier, or at significantly different amounts.
At the reporting date, the Company does not consider it probable that a claim will be made against the Company under the intragroup financial guarantee.
212 213Singapore TechnologieS engineering lTd Annual Report 2012Making an impact

Notes to the Financial Statements31 December 2012(Currency - Singapore dollars unless otherwise stated)
Notes to the Financial Statements31 December 2012(Currency - Singapore dollars unless otherwise stated)
44. Financial risk management objectives and policies (continued)
Credit risk
Credit risk, or the risk of counterparties defaulting, is managed through the application of credit approvals, credit limits and monitoring procedures. Where appropriate, the Company or its subsidiaries obtain collaterals from customers or arrange master netting agreements. Cash terms, advance payments, and letters of credit or bank guarantees are required for customers of lower credit standing.
The Group limits its exposure to credit risk on investments held by investing mostly in bonds of high credit ratings. Management actively monitors the credit ratings and does not expect any counterparty to fail to meet its obligations.
Derivatives are entered into with financial institutions, which have long-term rating of A3 by Moody’s, A- by Standard & Poor’s or the equivalent by a reputable credit rating agency.
Cash and bank deposits are placed with prime financial institutions.
As at 31 December 2012, there were no significant concentrations of credit risk, except for 29% (2011: 46%) of trade debts relating to three major customers of the Group. The table below analyses the trade receivables by the Group’s four main operating segments.
Group2012 2011
$’000 $’000
Aerospace 384,653 390,242Electronics 342,693 337,504Land Systems 294,236 309,399Marine 96,639 120,387Others 40,361 29,971
1,158,582 1,187,503
The carrying amount of financial assets represents the maximum credit exposure. The maximum exposure to credit risk at the reporting date is:
Group Company2012 2011 2012 2011
$’000 $’000 $’000 $’000
Investments 370,360 414,410 – –Long-term receivables 36,291 51,180 – 19Finance lease receivables 34,154 40,645 – –Derivative financial instruments 28,173 12,033 16 –Trade receivables 1,158,582 1,187,503 – –Amounts due from related parties 31,160 44,662 779,280 898,046Advances and other receivables 150,110 92,987 3,619 4,440Bank balances and other liquid funds 1,712,191 1,366,452 448,034 301,859Recognised financial assets 3,521,021 3,209,872 1,230,949 1,204,364
44. Financial risk management objectives and policies (continued)
Credit risk (continued)
The ageing of financial assets excluding cash and cash equivalents, investments and derivative financial instruments, net of impairment losses, are as follows:
Group Company2012 2011 2012 2011
$’000 $’000 $’000 $’000
Not past due 994,808 1,054,016 782,882 902,4821 – 90 days 260,007 265,459 – –91 – 180 days 58,745 37,018 – –181 – 360 days 61,052 36,453 – –> 360 days 22,117 19,259 – –
1,369,729 1,412,205 782,882 902,482
The movements in allowance for impairment losses during the year are as follows:
Group Company2012 2011 2012 2011
$’000 $’000 $’000 $’000
At beginning of the year 72,292 101,142 37,630 35,813Charge to profit or loss 22,821 536 660 1,800Allowance utilised (4,845) (29,748) (30,200) –Acquisition of subsidiaries 792 15 – –Disposal of subsidiaries – (202) – –Translation difference (2,318) 549 (127) 17At end of the year 88,742 72,292 7,963 37,630
214 215Singapore TechnologieS engineering lTd Annual Report 2012Making an impact

Notes to the Financial Statements31 December 2012(Currency - Singapore dollars unless otherwise stated)
Notes to the Financial Statements31 December 2012(Currency - Singapore dollars unless otherwise stated)
45. Fair value of financial instruments
Fair value is defined as the amount at which the instrument could be exchanged in a current transaction between knowledgeable willing parties in an arm’s length transaction, other than in a forced or liquidation sale. Fair values are obtained from quoted market prices, discounted cash flow models and option pricing models as appropriate.
The following table shows an analysis of financial instruments carried at fair value by level of fair value hierarchy.
Note
Quoted prices inactive markets
for identicalinstruments
(Level 1)
Significantother
observableinputs
(Level 2)
Significantunobservable
inputs(Level 3) Total
$’000 $’000 $’000 $’000
The Group
2012Financial AssetsAvailable-for-sale– Equity investments (quoted) 15 10,771 – – 10,771– Venture capital funds and limited partnership 15 – – 44 44– Bonds (unquoted) 15, 25 – 357,933 – 357,933Fair value through profit or loss– Equity investments (quoted) 25 347 – – 347Derivatives – Forward currency contracts – 28,670 – 28,670– Cross currency swap – 9,541 – 9,541– Cross currency interest rate swaps – 3,530 – 3,530
11,118 399,674 44 410,836Financial LiabilitiesDerivatives– Forward currency contracts – 7,309 – 7,309– Interest rate swaps – 6,564 – 6,564– Embedded derivatives – 28,434 – 28,434
– 42,307 – 42,307
2011Financial AssetsAvailable-for-sale– Equity investments (quoted) 15 9,342 – – 9,342– Venture capital funds and limited partnership 15 – – 4 4– Bonds (unquoted) 25 – 402,590 – 402,590Fair value through profit or loss– Equity investments (quoted) 25 209 – – 209Derivatives – Forward currency contracts – 5,012 – 5,012– Cross currency swap – 11,793 – 11,793
9,551 419,395 4 428,950Financial LiabilitiesDerivatives– Forward currency contracts – 13,066 – 13,066– Interest rate swaps – 12,793 – 12,793– Embedded derivatives – 16,847 – 16,847
– 42,706 – 42,706
45. Fair value of financial instruments (continued)
Significant otherobservable inputs
(Level 2)$’000
The Company
2012Financial AssetsDerivatives – Forward currency contracts 33
2011Financial AssetsDerivatives – Forward currency contracts 23
Fair value hierarchy
The Group classifies fair value measurement using a fair value hierarchy that reflects the significance of the inputs used in making the measurements. The fair value hierarchy have the following levels:
(a) Level 1 – Quoted prices (unadjusted) in active markets for identical assets or liabilities;
(b) Level 2 – Inputs other than quoted prices included within Level 1 that are observable for the asset or liability, either directly (i.e., as prices) or indirectly (i.e., derived from prices); and
(c) Level 3 – Inputs for the asset or liability that are not based on observable market data (unobservable inputs).
The following methods and assumptions are used to estimate the fair value of each class of financial instruments.
Bank balances, other liquid funds and short-term receivables
The carrying amounts approximate fair values due to the relatively short-term maturity of these instruments.
Quoted and unquoted investments
The fair values of quoted investments are determined directly by reference to their quoted bid prices for these investments as at balance sheet date. For unquoted investments, the fair values cannot be reliably estimated because of the lack of quoted market prices and the assumptions used in valuation models to value these investments cannot be reasonably determined. For unquoted bonds, the investments are valued using valuation models which use market observable data.
For unquoted investments in venture capital funds and limited partnerships as stated in Note 15, the fair value is determined by reference to valuation provided by non-related fund managers based on non-observable data. Changing one or more of the inputs to reasonable alternative assumptions is not expected to have a material impact on the changes in fair value.
216 217Singapore TechnologieS engineering lTd Annual Report 2012Making an impact

Notes to the Financial Statements31 December 2012(Currency - Singapore dollars unless otherwise stated)
Notes to the Financial Statements31 December 2012(Currency - Singapore dollars unless otherwise stated)
45. Fair value of financial instruments (continued)
Quoted and unquoted investments (continued)
Movements in level 3 financial instruments measured at fair value
The following table presents the reconciliation for all financial instruments measured at fair value based on significant unobservable inputs (Level 3).
Group2012 2011
$’000 $’000
Equity instruments (unquoted)Opening balance 4 1Total gain or loss: – recognised in profit or loss, in finance costs, net – 56– recognised in other comprehensive income 40 3Sales – (56)Closing balance 44 4
Total gain or loss for the year included in profit or loss (presented in finance costs, net) for assets held at 31 December – 56
Long-term receivables
The fair values of long-term receivables and amount due from related parties are estimated based on the expected cash flows discounted to present value.
Long-term payables
The fair values of amount due to related parties are estimated based on present value of future principal and interest cash flows, discounted at the market rate of interest at the reporting date.
Short-term borrowings and other current payables
The carrying amounts approximate fair values because of the short period to maturity of these instruments.
Derivatives
Forward currency contracts, interest rate swaps, cross currency swap, embedded derivatives and cross currency interest rate swaps are valued using a valuation technique with market observable inputs. The most frequently applied valuation techniques include forward pricing and swap models, using present value calculations. The models incorporate various inputs including the credit quality of counterparties, foreign exchange spot and forward rates and interest rate curves.
Bonds
The fair value of the US$500 million bonds as at 31 December 2012 approximates $710.7 million (2011: $717.8 million) and is determined by reference to market value.
45. Fair value of financial instruments (continued)
Set out below is a comparison by category of carrying amounts of all the Group’s financial instruments that are carried in the financial statements:
Classification of financial instruments
Loans and receivables
Fair value through
profit or loss
Derivatives used for hedging
Available-for-sale
Liabilities at amortised
cost
Totalcarrying amount
Fairvalue
$’000 $’000 $’000 $’000 $’000 $’000 $’000
The Group
2012
AssetsInvestments – – – 344,996 – 344,996 344,996Long-term receivables 36,291 – – – – 36,291 36,291Finance lease receivables 34,154 – – – – 34,154 34,154Derivative financial instruments – 26,809 1,364 – – 28,173 28,173Trade receivables 1,158,582 – – – – 1,158,582 1,158,582Amounts due from related parties 31,160 – – – – 31,160 31,160Advances and other receivables 136,542 6,913 6,655 – – 150,110 150,110Short-term investments – 347 – 25,017 – 25,364 25,364Bank balances and other liquid funds 1,712,191 – – – – 1,712,191 1,712,191
3,108,920 34,069 8,019 370,013 – 3,521,021 3,521,021
LiabilitiesCreditors and accruals – 4,287 16,647 – 1,673,481 1,694,415 1,694,415Amounts due to related parties – – – – 22,914 22,914 22,914Short-term bank loans – – – – 89,158 89,158 89,158Lease obligations – – – – 476 476 476Other loans – – – – 1,731 1,731 1,731Other long-term payables – – – – 2,000 2,000 1,761Bonds – – – – 608,721 608,721 710,691Derivative financial instruments – 11,718 9,655 – – 21,373 21,373
– 16,005 26,302 – 2,398,481 2,440,788 2,542,519
218 219Singapore TechnologieS engineering lTd Annual Report 2012Making an impact

Notes to the Financial Statements31 December 2012(Currency - Singapore dollars unless otherwise stated)
Notes to the Financial Statements31 December 2012(Currency - Singapore dollars unless otherwise stated)
45. Fair value of financial instruments (continued)
Classification of financial instruments (continued)
Loans and receivables
Fair valuethrough
profit or loss
Derivativesused forhedging
Available-for-sale
Liabilities atamortised
cost
Totalcarryingamount
Fairvalue
$’000 $’000 $’000 $’000 $’000 $’000 $’000
The Group
2011
AssetsInvestments – – – 11,611 – 11,611 11,611Long-term receivables 51,180 – – – – 51,180 51,180Finance lease receivables 40,645 – – – – 40,645 40,645Derivative financial instruments – 41 11,992 – – 12,033 12,033Trade receivables 1,187,503 – – – – 1,187,503 1,187,503Amounts due from related parties 44,662 – – – – 44,662 44,662Advances and other receivables 88,215 2,544 2,228 – – 92,987 92,987Short-term investments – 209 – 402,590 – 402,799 402,799Bank balances and other liquid funds 1,366,452 – – – – 1,366,452 1,366,452
2,778,657 2,794 14,220 414,201 – 3,209,872 3,209,872
LiabilitiesCreditors and accruals – 1,670 17,942 – 1,670,910 1,690,522 1,690,522Amounts due to related parties – – – – 29,704 29,704 29,704Short-term bank loans – – – – 204,084 204,084 204,084Lease obligations – – – – 4,179 4,179 4,147Long-term bank loans – – – – 507,815 507,815 507,815Other loans – – – – 1,614 1,614 1,614Other long-term payables – – – – 2,500 2,500 2,077Bonds – – – – 646,562 646,562 717,798Derivative financial instruments – 919 22,175 – – 23,094 23,094
– 2,589 40,117 – 3,067,368 3,110,074 3,180,855
45. Fair value of financial instruments (continued)
Classification of financial instruments (continued)
Loans andreceivables
Fair valuethrough
profit or loss
Liabilitiesat amortised
costTotal Carrying
amountFair
value$’000 $’000 $’000 $’000 $’000
The Company
2012
AssetsDerivative financial instruments – 16 – 16 16Amounts due from related parties 779,280 – – 779,280 779,280Advances and other receivables 3,602 17 – 3,619 3,619Bank balances and other liquid funds 448,034 – – 448,034 448,034
1,230,916 33 – 1,230,949 1,230,949
LiabilitiesTrade payables and accruals – – 45,191 45,191 45,191Amounts due to related parties – – 540,479 540,479 540,479
– – 585,670 585,670 585,670
2011
AssetsAmounts due from related parties 898,046 – – 898,046 898,046Advances and other receivables 4,417 23 – 4,440 4,440Long-term receivables 19 – – 19 19Bank balances and other liquid funds 301,859 – – 301,859 301,859
1,204,341 23 – 1,204,364 1,204,364
LiabilitiesTrade payables and accruals – – 36,136 36,136 36,136Amounts due to related parties – – 496,397 496,397 496,397Short-term bank loans – – 17,541 17,541 17,541
– – 550,074 550,074 550,074
220 221Singapore TechnologieS engineering lTd Annual Report 2012Making an impact

Notes to the Financial Statements31 December 2012(Currency - Singapore dollars unless otherwise stated)
Notes to the Financial Statements31 December 2012(Currency - Singapore dollars unless otherwise stated)
45. Fair value of financial instruments (continued)
Derivative financial instruments
2012 2011Contractual/
notional amount
Estimated fair value Contractual/notionalamount
Estimated fair value
Note Asset Liability Asset Liability$’000 $’000 $’000 $’000 $’000 $’000
Cash flow hedges
Forward currency contracts:– to hedge confirmed sales in foreign currencies (a)(i) 303,667 5,659 (1,344) 182,035 1,504 (2,548)– to hedge firm purchase commitments in foreign currencies (a)(i) 193,977 1,711 (1,174) 91,808 491 (2,431)– to hedge accounts receivable in foreign currencies (a)(i) 12,166 309 – 87,363 15 (2,581)– to hedge accounts payable in foreign currencies (a)(i) 91,643 149 (259) 4,779 16 (116)Interest rate swaps (b)(i)/
(b)(ii) 152,825 – (2,508) 340,479 – (12,793)Cross currency swap (c)(ii) – – – 216,255 11,793 –
Embedded derivatives (a)(i) 466,188 – (20,779) 228,366 – (15,119)
Fair value hedges
Forward currency contracts:– to hedge confirmed sales in foreign currencies (a)(i) – – – 46,110 – (765)– to hedge firm purchase commitments in foreign currencies (a)(i) 16,309 108 (20) 17,396 48 (61)– to hedge accounts receivable in foreign currencies (a)(i) 24,522 44 (215) 83,798 353 (2,720)– to hedge accounts payable in foreign currencies (a)(i) 6,654 39 (3) – – –Embedded derivatives (a)(i) – – – 9,160 – (973)
Non-hedging instruments
Forward currency contracts:– sales (a)(ii) 693,416 6,026 (3,713) 162,819 2,348 (1,130)– purchases (a)(ii) 412,152 14,625 (581) 79,876 237 (714)Interest rate swap (b)(iii) 139,900 – (4,056) – – –Cross currency swap (c)(i) 203,490 9,541 – – – –Cross currency interest rate swaps (d) 246,350 3,530 – – – –Embedded derivatives (a)(ii) 448,566 – (7,655) 28,621 – (755)Total 41,741 (42,307) 16,805 (42,706)Less: Current portion (13,568) 20,934 (4,772) 19,612Non-current portion 28,173 (21,373) 12,033 (23,094)
45. Fair value of financial instruments (continued)
(a) Forward currency contracts
(i) As at 31 December 2012, the Group has forward currency contracts and embedded derivatives separated from the foreign currency portion of sales contracts amounting to $1,115,126,000 (2011: $750,815,000) designated as hedges of confirmed sales in foreign currencies, firm purchase commitments in foreign currencies, accounts receivable in foreign currencies and accounts payable in foreign currencies.
The maturity dates of the forward currency contracts and embedded derivatives separated from the foreign currency portion of the sales contracts approximate the timing of the expected cash flows of their respective hedged items, which are on varying periods up to 5 years (2011: 6 years) from the financial year-end.
(ii) As at 31 December 2012, the Group has outstanding forward currency contracts and embedded derivatives separated from the foreign currency portion of sales contracts amounting to $1,554,134,000 (2011: $271,316,000), which are not designated as hedges of confirmed sales in foreign currencies and firm purchase commitments in foreign currencies.
(b) Interest rate swaps
(i) As at 31 December 2012, the Group has outstanding interest rate swaps amounting to $152,825,000 (2011: $194,895,000), which are designated as cash flow hedges.
The USD interest rate swaps are being used to hedge the exposure to variability in cash flows associated with the floating rate of the unsecured USD long-term loans. Under the USD interest rate swaps, the Group pays fixed rates of interest of 3.68% to 3.69% (2011: 3.68% to 3.80%) per annum and receives variable rates of interest equal to the LIBOR per annum on the notional amount. The USD interest rate swaps have the same maturity terms as the unsecured USD long-term loans due in 2013.
(ii) In the prior year, the Group had entered into a Euro interest rate swap amounting to $145,584,000, which was used to hedge 72% of the exposure to variability in cash flows associated with the floating rate of a cross currency swap. Under the Euro interest rate swap, the Group paid a fixed rate of interest of 2.5% per annum and received a variable rate of interest equal to the EURIBOR per annum on the notional amount. The Euro interest rate swap had the same maturity terms as the cross currency swap.
(iii) As at 31 December 2012, the Group has outstanding interest rate swaps amounting to $139,900,000 (2011: nil), which are not designated as hedging instruments in a cash flow hedge relationship.
(c) Cross currency swap
(i) As at 31 December 2012, the Group has an outstanding cross currency swap amounting to $203,490,000 (2011: nil), which is not designated as hedging instrument in a cash flow hedge relationship.
(ii) In the prior year, a cross currency swap amounting to $216,255,000 was designated as hedging instrument in a cash flow hedge relationship. The cross currency swap was used to hedge foreign currency exposure of a USD bank loan which converted the USD bank loan with floating USD interest rate at LIBOR + 0.60% per annum to an equivalent Euro bank loan (Euro 120 million) with floating Euro interest rate at EURIBOR + 0.41% per annum.
(d) Cross currency interest rate swaps
As at 31 December 2012, the Group has outstanding cross currency interest rate swaps amounting to $246,350,000 (2011: nil), which are not designated as hedging instruments.
The swaps are being used to hedge the foreign currency exposure of the US$500 million bond liability and convert the fixed USD bond interest rate of 4.8% per annum to floating SGD interest rate at 6-month SOR plus margins. The effective SGD interest rates range from 3.0% to 3.8% per annum.
222 223Singapore TechnologieS engineering lTd Annual Report 2012Making an impact

Notes to the Financial Statements31 December 2012(Currency - Singapore dollars unless otherwise stated)
46. Capital management
The primary objective of the Group’s capital management is to ensure that it maintains a strong credit rating and healthy financial metrics in order to support its business and maximise shareholder value.
The Group manages its capital structure and makes adjustment to it, in the light of changes in economic and financial market conditions. The Group may adjust the dividend payout to shareholders, buy back or issue new shares to optimise capital structure within the Group. No major changes were made in the objectives, policies or processes during the years ended 31 December 2012 and 31 December 2011.
The Group is currently in a net cash position. The Group will continue to be guided by prudent financial policies of which gearing is an important aspect. Neither the Company nor any of its subsidiaries are subject to externally imposed capital requirements other than those imposed by local regulatories.
Group2012 2011
$’000 $’000
Gross debt Bank loans 668,502 711,899 Bonds 608,721 646,562 Capitalised lease obligations 476 4,179 Other loans 1,731 1,614 1,279,430 1,364,254
Shareholders’ funds Share capital 781,841 723,411 Other reserves (19,798) 9,771 Retained earnings 1,132,644 1,033,013
1,894,687 1,766,195Non-controlling interests 117,895 109,913
2,012,582 1,876,108
Gross debt/equity ratio 0.6 0.7
Bank balances and other liquid funds 1,712,191 1,366,452Short-term investments and bonds 358,280 402,799
2,070,471 1,769,251Gross debt (excluding bank overdrafts) (1,279,430) (1,364,254)Net cash position 791,041 404,997
47. Subsequent events
On 5 February 2013, a subsidiary, Singapore Technologies Aerospace Ltd completed its investment of 35% equity interest in Elbe Flugzeugwerke GmbH (EADS EFW) for a cash consideration of $4.0 million (Euro 2.5 million). Following the completion of the acquisition, EADS EFW becomes an associate of the Group.
Interested person transactions
Interested person transactions carried out during the financial year pursuant to the Shareholders’ Mandate obtained under Chapter 9 of the Listing Manual of the Singapore Exchange Securities Trading Limited (“SGX”) by the Group are as follows:
Aggregate value of all transactions excluding transactions conductedunder a Shareholders’
Mandate pursuant to Rule 920of the SGX Listing Manual
Aggregate value of all transactions conductedunder a Shareholders’
Mandate pursuant to Rule 920of the SGX Listing Manual
2012 2011 2012 2011$’000 $’000 $’000 $’000
Transactions for the Sale of Goods and Services
CapitaLand Limited and its Associates – – 602 –SembCorp Industries Ltd and its Associates – – 5,515 –SembCorp Marine Ltd and its Associates – – 7,259 –SIA Engineering Company Limited and its Associates – – – 4,212Singapore Airport Terminal Services Limited and its Associates – – – 525Singapore Telecommunications Limited and its Associates – – 1,854 326SMRT Corporation Ltd and its Associates – – 72,820 71,692StarHub Ltd and its Associates – – – 3,440Temasek Holdings (Private) Limited and its Associates – – 14,593 9,944
– – 102,643 90,139
Transactions for the Purchase of Goods and Services
SembCorp Industries Ltd and its Associates 8,233 – – –SembCorp Marine Ltd and its Associates – – – 416Singapore Airport Terminal Services Limited and its Associates – – 3,978 3,087Singapore Telecommunications Limited and its Associates – – 2,483 2,021SMRT Corporation Ltd and its Associates – – 676 5,666StarHub Ltd and its Associates – – 215 –Temasek Holdings (Private) Limited and its Associates – – 4,599 1,071
8,233 – 11,951 12,261
Total Interested Person Transactions 8,233 – 114,594 102,400
SGX listing manual requirements31 December 2012(Currency - Singapore dollars)
225Singapore TechnologieS engineering lTd Annual Report 2012224 Making an impact

SECTORAL FINANCIAL REVIEW – AEROSPACE
INCOME STATEMENT
2012 2011$’000 $’000
Revenue 2,025,627 1,926,800Cost of sales (1,608,913) (1,564,850)Gross profit 416,714 361,950
Distribution and selling expenses (14,111) (7,504)Administrative expenses (110,177) (96,512)Other operating expenses (18,120) (15,820)Profit from operations 274,306 242,114
Other income, net 16,070 7,975
Finance income 9,774 17,662Finance costs (25,904) (22,852)Finance costs, net (16,130) (5,190)
Share of results of associates and jointly controlled entities 29,517 33,299Profit before taxation 303,763 278,198
Taxation (46,491) (41,831)Profit for the year 257,272 236,367
Attributable to:Shareholder of the Company 253,242 231,794Non-controlling interests 4,030 4,573
257,272 236,367
SECTORAL FINANCIAL REVIEW – AEROSPACE
BALANCE SHEET2012 2011
$’000 $’000
ASSETSNon-current assetsProperty, plant and equipment 630,709 836,777Associates and jointly controlled entities 160,875 170,173Investments 44 4Intangible assets 43,359 9,846Long-term receivables, non-current 26,109 40,076Derivative financial instruments, non-current 20,516 11,834Deferred tax assets 21,043 23,163
902,655 1,091,873Current assetsInventories and work-in-progress 603,391 334,451Trade receivables 384,653 390,242Amount due from related parties, current 9,122 9,520Advances and other receivables 208,580 86,091Long-term receivables, current 11,991 12,738Short-term investments 95 68Bank balances and other liquid funds 305,124 253,836Assets classified as held for sale 26,539 –
1,549,495 1,086,946
TOTAL ASSETS 2,452,150 2,178,819
EQUITY AND LIABILITIES
Current liabilitiesAdvance payments from customers, current 282,394 87,500Trade payables and accruals 547,974 567,051Amount due to related parties, current 279,589 161,421Provisions 55,590 58,695Progress billing in excess of work-in-progress 86,661 73,105Provision for taxation 70,150 67,079Short-term bank loans 51,899 65,439Lease obligations, current 67 1,683Long-term bank loans, current 39 41
1,374,363 1,082,014
NET CURRENT ASSETS 175,132 4,932
Non-current liabilitiesAdvance payments from customers, non-current 250,455 291,353Deferred income – 32Deferred tax liabilities 25,037 26,315Lease obligations, non-current 46 43Long-term bank loans, non-current 246,880 247,914Other loans, non-current 2,000 2,500Derivative financial instruments, non-current 4,322 6,141Amount due to related parties, non-current 72,342 55,051
601,082 629,349
TOTAL LIABILITIES 1,975,445 1,711,363
NET ASSETS 476,705 467,456
Share capital and reserves 420,708 420,024Non-controlling interests 55,997 47,432
476,705 467,456
TOTAL EQUITY AND LIABILITIES 2,452,150 2,178,819
226 227Singapore TechnologieS engineering lTd Annual Report 2012Making an impact

SECTORAL FINANCIAL REVIEW – AEROSPACE
STATEMENT OF CASH FLOWS
2012 2011$’000 $’000
Net cash from operating activities 287,449 273,282
Net cash used in investing activities (100,639) (81,418) Proceeds from sale of property, plant and equipment 8,873 4,500 Dividends from associates and jointly controlled entities 21,246 18,977 Dividends from investments – 211 Proceeds from sale and maturity of investments – 287 Purchase of property, plant and equipment (87,255) (75,789) Investment in associates – (25,534) Distribution of capital from associates 5,560 – Investment in jointly controlled entities (2,109) (2,260) Acquisition of subsidiaries (46,954) (1,810)
Net cash used in financing activities (129,882) (261,457) Payment to non-controlling interests for share capital reduction (1,960) – Capital contribution from non-controlling interests 1,236 – Repayment of lease obligations, net (1,510) (1,594) Proceeds from bank loans 10,074 289,770 Repayment of bank loans (9,959) (310,610) Proceeds from loans with related parties, net 136,248 18,023 Dividends paid to shareholder (244,376) (245,600) Dividends paid to non-controlling interests (5,655) (559) Interest paid (13,980) (10,887)
Net increase/(decrease) in cash and cash equivalents 56,928 (69,593)Cash and cash equivalents at beginning of the year 253,836 323,770Exchange difference on cash and cash equivalents at beginning of the year (5,640) (341)Cash and cash equivalents at end of the year 305,124 253,836
FINANCIAL HIGHLIGHTS
2012 2011 2010 2009 2008$’000 $’000 $’000 $’000 $’000
Income StatementRevenue 2,025,627 1,926,800 1,874,995 1,875,225 1,940,954Profit
EBITDA 323,320 299,886 299,864 288,938 331,937EBIT 274,306 242,114 233,829 199,849 234,220PBT 303,763 278,198 262,219 228,288 272,120Net Profit 253,242 231,794 209,767 185,700 225,691
Balance SheetProperty, plant and equipment 630,709 836,777 825,248 770,076 742,433Intangibles and other assets 298,485 255,096 199,426 219,274 187,776Inventories and work-in-progress 603,391 334,451 374,815 388,165 413,610Trade receivables, deposits and prepayments 614,346 498,591 765,529 458,441 642,009Bank balances and other liquid funds, and short-term investments 305,219 253,904 323,869 266,834 117,505
Current liabilities 1,374,363 1,082,014 1,464,573 924,222 1,449,916Non-current liabilities 601,082 629,349 602,227 721,170 237,436
Share capital 152,512 152,512 100,000 100,000 100,000Capital and other reserves (73,513) (65,331) (68,672) (27,235) (20,449)Retained earnings 341,709 332,843 346,649 339,445 296,374Non-controlling interests 55,997 47,432 44,110 45,188 40,056
Financial IndicatorsEarnings per share (cents) 100.29 115.90 104.88 92.85 112.85Net assets value per share (cents) 238.35 233.73 211.04 228.70 207.99Return on sales (%) 12.7 12.3 11.5 10.4 12.1Return on equity (%) 52.0 48.8 48.7 39.9 52.6Return on total assets (%) 10.5 10.8 8.7 9.3 11.2
Productivity DataAverage staff strength (numbers) 7,307 7,303 7,323 7,253 7,081Revenue per employee ($) 277,217 263,837 256,042 258,545 274,107Net profit per employee ($) 34,657 31,740 28,645 25,603 31,873Employment costs 657,440 608,257 591,191 594,184 639,900Employment costs per $ of revenue ($) 0.32 0.31 0.31 0.32 0.33
Economic Value Added 189,716 180,047 163,904 146,146 198,653Economic Value Added spread (%) 14.8 14.2 12.7 11.8 17.8Economic Value Added per employee ($) 25,964 24,654 22,382 20,150 28,054
Value added 1,032,108 959,184 935,010 944,048 1,047,825Value added per employee ($) 141,249 131,341 127,681 130,160 147,977Value added per $ of employment costs ($) 1.57 1.58 1.58 1.59 1.64Value added per $ of gross property, plant and equipment ($) 0.83 0.63 0.64 0.66 0.78Value added per $ of revenue ($) 0.51 0.50 0.50 0.50 0.54
SECTORAL FINANCIAL REVIEW – AEROSPACE
228 229Singapore TechnologieS engineering lTd Annual Report 2012Making an impact

SECTORAL FINANCIAL REVIEW – ELECTRONICS
INCOME STATEMENT
2012 2011$’000 $’000
Revenue 1,618,717 1,516,975Cost of sales (1,121,619) (1,075,059)Gross profit 497,098 441,916
Distribution and selling expenses (92,800) (83,182)Administrative expenses (153,857) (140,493)Other operating expenses (92,234) (72,654)Profit from operations 158,207 145,587
Other income, net 2,191 1,821
Finance income 3,206 1,396Finance costs (6,774) (6,880)Finance costs, net (3,568) (5,484)
Share of results of associates and jointly controlled entities (4,537) (5,071)Profit before taxation 152,293 136,853
Taxation (29,792) (25,690)Profit for the year 122,501 111,163
Attributable to:Shareholder of the Company 119,771 108,802Non-controlling interests 2,730 2,361
122,501 111,163
BALANCE SHEET
2012 2011$’000 $’000
ASSETSNon-current assetsProperty, plant and equipment 104,672 79,393Associates and jointly controlled entities 4,702 8,904Investments 11,582 9,190Intangible assets 279,932 314,354Derivative financial instruments, non-current 15 – Deferred tax assets 33,237 28,011
434,140 439,852Current assetsInventories and work-in-progress 306,697 393,085Trade receivables 342,693 337,504Amounts due from related parties, current 27,594 18,897Other receivables, deposits and prepayments 39,369 24,412Advance payments to suppliers 12,056 25,378Loan receivables, current 11 12Bank balances and other liquid funds 398,136 371,411
1,126,556 1,170,699
TOTAL ASSETS 1,560,696 1,610,551
EQUITY AND LIABILITIES
Current liabilitiesAdvance payments from customers, current 180,912 147,452Trade payables and accruals 336,647 309,142Amounts due to related parties, current 9,014 51,588Provisions 58,421 43,894Progress billings in excess of work-in-progress 407,093 399,936Provision for taxation 42,964 36,635Short-term bank loans (unsecured) – 1,482Lease obligations, current 29 47
1,035,080 990,176
NET CURRENT ASSETS 91,476 180,523
Non-current liabilitiesAdvance payments from customers, non-current 105,310 185,404Deferred income 3,645 2,295Deferred tax liabilities 5,531 6,387Lease obligations, non-current 6 35Derivative financial instruments, non-current – 4Amounts due to related parties, non-current 258,483 281,850
372,975 475,975
TOTAL LIABILITIES 1,408,055 1,466,151
NET ASSETS 152,641 144,400
Share capital and reserves 142,723 131,912Non-controlling interests 9,918 12,488
152,641 144,400
TOTAL EQUITY AND LIABILITIES 1,560,696 1,610,551
SECTORAL FINANCIAL REVIEW – ELECTRONICS
230 231Singapore TechnologieS engineering lTd Annual Report 2012Making an impact

STATEMENT OF CASH FLOWS
2012 2011$’000 $’000
Net cash from operating activities 201,930 273,966
Net cash used in investing activities (46,801) (35,363) Proceeds from sale of property, plant and equipment 66 44 Proceeds from sale of subsidiaries 149 73 Proceeds from sale of an associate 30 – Dividends from associates 53 90 Purchase of property, plant and equipment (45,973) (36,100) Acquisition of an associate – (2,400) Additional investment in a jointly controlled entity (377) – Acquisition of other intangible assets (749) (2,803) Reduction in cost of investment in a subsidiary – 5,733
Net cash used in financing activities (126,405) (117,843) Proceeds from a related party loan 1,923 1,689 Repayment of related parties loans (16,759) (4,542) Loans to related parties (9,526) (27,500) Repayment of loans by related parties 9,783 25,500 Proceeds from bank loans 227 1,014 Repayment of bank loans (1,687) (11,297) (Repayment)/addition of lease obligations (47) 14 Acquisition of non-controlling interests in subsidiaries (1,158) (2,262) Dividends paid to shareholder (100,500) (94,000) Dividends paid to non-controlling interests (3,943) (956) Interest paid (2,894) (5,503) Deposits pledged (1,824) –
Net increase in cash and cash equivalents 28,724 120,760Cash and cash equivalents at beginning of the year 371,411 250,180Exchange difference on cash and cash equivalents at beginning of the year (3,823) 471Cash and cash equivalents at end of the year 396,312 371,411
SECTORAL FINANCIAL REVIEW – ELECTRONICS
FINANCIAL HIGHLIGHTS
2012 2011 2010 2009 2008$’000 $’000 $’000 $’000 $’000
Income StatementRevenue 1,618,717 1,516,975 1,428,467 1,393,356 1,157,704Profit
EBITDA 185,659 169,536 152,948 133,025 140,386EBIT 158,207 145,587 130,322 107,178 118,051PBT 152,293 136,853 127,563 115,276 93,940Net Profit 119,771 108,802 100,708 90,803 68,111
Balance SheetProperty, plant and equipment, and investment property 104,672 79,393 60,862 56,652 60,385Intangibles and other assets 329,671 360,524 380,970 419,908 411,934Inventories and work-in-progress 306,697 393,085 365,162 370,345 330,928Trade receivables, deposits and prepayments 421,520 406,138 376,186 385,977 430,619Bank balances and other liquid funds, and short-term investments 398,136 371,411 250,458 246,071 185,564
Current liabilities 1,035,080 990,176 856,156 849,772 771,724Non-current liabilities 372,975 475,975 455,829 501,245 545,755
Share capital 52,522 52,522 52,522 52,522 52,522Capital and other reserves (32,821) (24,361) (35,834) (5,510) (8,622)Retained earnings 123,022 103,751 88,949 64,241 41,142Non-controlling interests 9,918 12,488 16,016 16,683 16,909
Financial IndicatorsEarnings per share (cents) 114.02 103.58 95.87 86.44 64.84Net assets value per share (cents) 145.31 137.47 115.81 121.79 97.05Return on sales (%) 7.6 7.3 7.2 6.6 6.1Return on equity (%) 43.7 41.4 42.5 37.8 31.8Return on total assets (%) 7.8 6.9 7.2 6.2 5.0
Productivity DataAverage staff strength (numbers) 5,485 5,274 4,987 4,707 4,373Revenue per employee ($) 295,117 287,633 286,438 296,018 264,739Net profit per employee ($) 21,836 20,630 20,194 19,291 15,575Employment costs 493,720 457,155 418,477 394,582 350,801Employment costs per $ of revenue ($) 0.31 0.30 0.29 0.28 0.30
Economic Value Added 101,777 88,689 80,916 66,275 59,967Economic Value Added Spread (%) 19.5 18.0 15.4 10.8 9.4Economic Value Added per employee ($) 18,556 16,816 16,225 14,080 13,713
Value added 691,904 633,677 587,679 561,439 482,469Value added per employee ($) 126,145 120,151 117,842 119,277 110,329Value added per $ of employment costs ($) 1.40 1.39 1.40 1.42 1.38Value added per $ of gross property, plant and equipment ($) 2.69 2.84 3.06 3.12 2.78Value added per $ of revenue ($) 0.43 0.42 0.41 0.40 0.42
SECTORAL FINANCIAL REVIEW – ELECTRONICS
232 233Singapore TechnologieS engineering lTd Annual Report 2012Making an impact

SECTORAL FINANCIAL REVIEW – LAND SYSTEMS
INCOME STATEMENT
2012 2011$’000 $’000
Revenue 1,525,341 1,506,465Cost of sales (1,197,222) (1,198,627)Gross profit 328,119 307,838
Distribution and selling expenses (76,350) (65,226)Administrative expenses (112,065) (99,730)Other operating expenses (41,192) (42,632)Profit from operations 98,512 100,250
Other income, net 18,686 14,968
Finance income 4,448 3,516Finance costs (15,423) (16,715)Finance costs, net (10,975) (13,199)
Share of results of associates and jointly controlled entities 8,243 6,054Profit before taxation 114,466 108,073
Taxation (24,264) (17,966)Profit for the year 90,202 90,107
Attributable to:Shareholder of the Company 88,160 83,818Non-controlling interests 2,042 6,289
90,202 90,107
BALANCE SHEET2012 2011
$’000 $’000
ASSETS
Non-current assetsProperty, plant and equipment 301,522 305,805Associates and jointly controlled entities 111,550 117,573Investments 454 2,417Intangible assets 197,133 205,629Investment properties 10,239 1,509Long-term receivables, non-current 97 151Amounts due from related parties, non-current 5,229 5,556Finance lease receivables, non-current 10,379 14,482Deferred tax assets 12,859 13,760Derivative financial instruments, non-current 939 151
650,401 667,033Current assetsLong-term receivables, current 73 56Inventories and work-in-progress 669,198 541,886Trade receivables 294,236 309,399Other receivables and deposits 16,646 14,634Advances payments to suppliers 127,540 106,468Prepayments 3,284 6,031Finance lease receivables, current 23,775 26,163Bank balances and other liquid funds 247,386 151,452Amounts due from related parties, current 23,401 44,393Derivative financial instruments, current 1,767 1,737
1,407,306 1,202,219
TOTAL ASSETS 2,057,707 1,869,252
EQUITY AND LIABILITIES
Current liabilitiesAdvance payments from customers, current 254,063 203,898Progress billings in excess of work-in-progress 35,137 13,780Amounts due to related parties, current 134,158 222,611Trade payables and accruals 406,162 412,676Provisions 53,935 55,239Provision for taxation 37,092 31,704Derivative financial instruments, current 12,493 7,787Lease obligations, current 136 90Long-term loans, current 130 143Short-term bank loans 37,259 31,400Short-term loan from non-controlling interests 479 492
971,044 979,820
NET CURRENT ASSETS 436,262 222,399
Non-current liabilitiesAdvance payments from customers, non-current 468,325 242,143Amounts due to related parties, non-current 384,990 413,750Lease obligations, non-current 192 247Derivative financial instruments, non-current 7,355 9,657Long-term loans, non-current 677 856Long-term bank loan 4,279 –Deferred income 17,688 17,252Deferred tax liabilities 52,985 50,386
936,491 734,291
TOTAL LIABILITIES 1,907,535 1,714,111
NET ASSETS 150,172 155,141
Share capital and reserves 98,231 105,573Non-controlling interests 51,941 49,568
150,172 155,141
TOTAL EQUITY AND LIABILITIES 2,057,707 1,869,252
SECTORAL FINANCIAL REVIEW – LAND SYSTEMS
234 235Singapore TechnologieS engineering lTd Annual Report 2012Making an impact
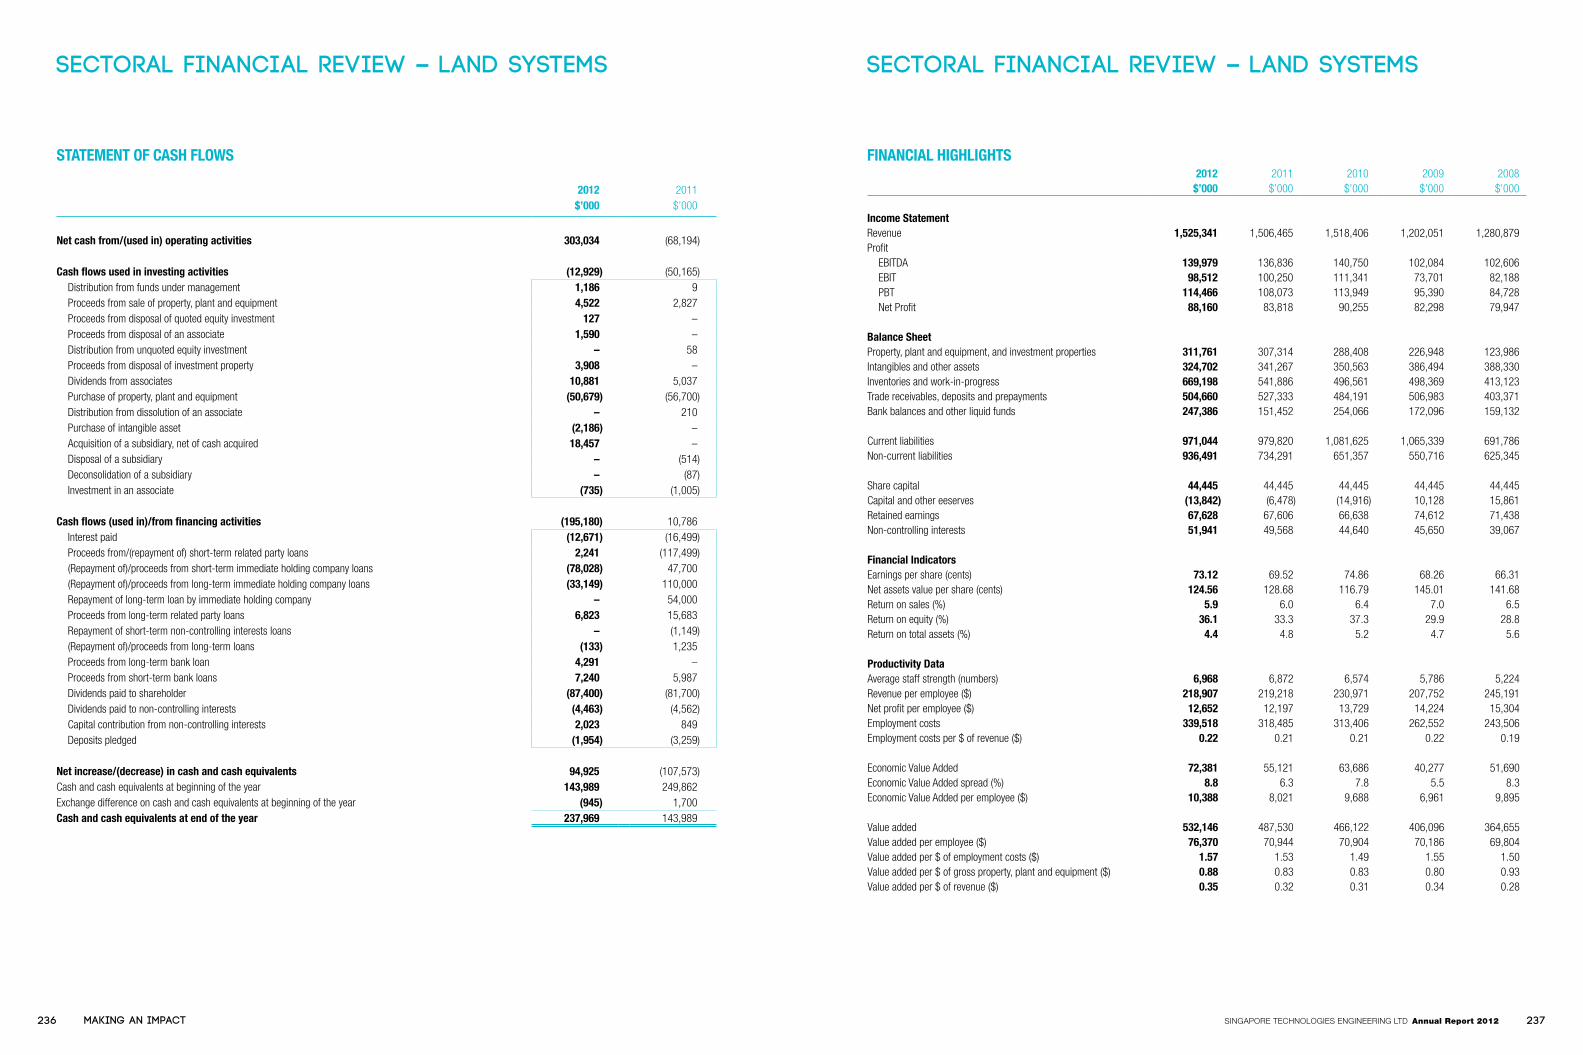
STATEMENT OF CASH FLOWS
2012 2011$’000 $’000
Net cash from/(used in) operating activities 303,034 (68,194)
Cash flows used in investing activities (12,929) (50,165) Distribution from funds under management 1,186 9 Proceeds from sale of property, plant and equipment 4,522 2,827 Proceeds from disposal of quoted equity investment 127 – Proceeds from disposal of an associate 1,590 – Distribution from unquoted equity investment – 58 Proceeds from disposal of investment property 3,908 – Dividends from associates 10,881 5,037 Purchase of property, plant and equipment (50,679) (56,700) Distribution from dissolution of an associate – 210 Purchase of intangible asset (2,186) – Acquisition of a subsidiary, net of cash acquired 18,457 – Disposal of a subsidiary – (514) Deconsolidation of a subsidiary – (87) Investment in an associate (735) (1,005)
Cash flows (used in)/from financing activities (195,180) 10,786 Interest paid (12,671) (16,499) Proceeds from/(repayment of) short-term related party loans 2,241 (117,499) (Repayment of)/proceeds from short-term immediate holding company loans (78,028) 47,700 (Repayment of)/proceeds from long-term immediate holding company loans (33,149) 110,000 Repayment of long-term loan by immediate holding company – 54,000 Proceeds from long-term related party loans 6,823 15,683 Repayment of short-term non-controlling interests loans – (1,149) (Repayment of)/proceeds from long-term loans (133) 1,235 Proceeds from long-term bank loan 4,291 – Proceeds from short-term bank loans 7,240 5,987 Dividends paid to shareholder (87,400) (81,700) Dividends paid to non-controlling interests (4,463) (4,562) Capital contribution from non-controlling interests 2,023 849 Deposits pledged (1,954) (3,259)
Net increase/(decrease) in cash and cash equivalents 94,925 (107,573)Cash and cash equivalents at beginning of the year 143,989 249,862Exchange difference on cash and cash equivalents at beginning of the year (945) 1,700Cash and cash equivalents at end of the year 237,969 143,989
SECTORAL FINANCIAL REVIEW – LAND SYSTEMS
FINANCIAL HIGHLIGHTS2012 2011 2010 2009 2008
$’000 $’000 $’000 $’000 $’000
Income StatementRevenue 1,525,341 1,506,465 1,518,406 1,202,051 1,280,879Profit
EBITDA 139,979 136,836 140,750 102,084 102,606EBIT 98,512 100,250 111,341 73,701 82,188PBT 114,466 108,073 113,949 95,390 84,728Net Profit 88,160 83,818 90,255 82,298 79,947
Balance SheetProperty, plant and equipment, and investment properties 311,761 307,314 288,408 226,948 123,986Intangibles and other assets 324,702 341,267 350,563 386,494 388,330Inventories and work-in-progress 669,198 541,886 496,561 498,369 413,123Trade receivables, deposits and prepayments 504,660 527,333 484,191 506,983 403,371Bank balances and other liquid funds 247,386 151,452 254,066 172,096 159,132
Current liabilities 971,044 979,820 1,081,625 1,065,339 691,786Non-current liabilities 936,491 734,291 651,357 550,716 625,345
Share capital 44,445 44,445 44,445 44,445 44,445Capital and other eeserves (13,842) (6,478) (14,916) 10,128 15,861Retained earnings 67,628 67,606 66,638 74,612 71,438Non-controlling interests 51,941 49,568 44,640 45,650 39,067
Financial IndicatorsEarnings per share (cents) 73.12 69.52 74.86 68.26 66.31Net assets value per share (cents) 124.56 128.68 116.79 145.01 141.68Return on sales (%) 5.9 6.0 6.4 7.0 6.5Return on equity (%) 36.1 33.3 37.3 29.9 28.8Return on total assets (%) 4.4 4.8 5.2 4.7 5.6
Productivity DataAverage staff strength (numbers) 6,968 6,872 6,574 5,786 5,224Revenue per employee ($) 218,907 219,218 230,971 207,752 245,191Net profit per employee ($) 12,652 12,197 13,729 14,224 15,304Employment costs 339,518 318,485 313,406 262,552 243,506Employment costs per $ of revenue ($) 0.22 0.21 0.21 0.22 0.19
Economic Value Added 72,381 55,121 63,686 40,277 51,690Economic Value Added spread (%) 8.8 6.3 7.8 5.5 8.3Economic Value Added per employee ($) 10,388 8,021 9,688 6,961 9,895
Value added 532,146 487,530 466,122 406,096 364,655Value added per employee ($) 76,370 70,944 70,904 70,186 69,804Value added per $ of employment costs ($) 1.57 1.53 1.49 1.55 1.50Value added per $ of gross property, plant and equipment ($) 0.88 0.83 0.83 0.80 0.93Value added per $ of revenue ($) 0.35 0.32 0.31 0.34 0.28
SECTORAL FINANCIAL REVIEW – LAND SYSTEMS
236 237Singapore TechnologieS engineering lTd Annual Report 2012Making an impact

SECTORAL FINANCIAL REVIEW – MARINE
INCOME STATEMENT
2012 2011$’000 $’000
Revenue 1,011,092 877,204Cost of sales (833,891) (720,528)Gross profit 177,201 156,676
Distribution and selling expenses (9,996) (3,091)Administrative expenses (34,021) (31,656)Other operating expenses (10,958) (11,407)Profit from operations 122,226 110,522
Other income, net 6,109 7,327
Finance income 6,820 6,248Finance costs (8,843) (3,809)Finance (costs)/income, net (2,023) 2,439
Share of results of jointly controlled entities 1,516 1,552Profit before taxation 127,828 121,840
Taxation (33,172) (30,477)Profit for the year 94,656 91,363
Attributable to:Shareholder of the Company 95,013 91,465Non-controlling interests (357) (102)
94,656 91,363
BALANCE SHEET2012 2011
$’000 $’000
ASSETSNon-current assetsProperty, plant and equipment 151,322 118,578Jointly controlled entities 2,562 1,871Intangible assets 616 877Long-term receivables, non-current 277 552Amounts due from related parties, non-current 4,806 4,806Derivative financial instruments, non-current 3,157 48Deferred tax assets 29,933 32,418
192,673 159,150Current assetsInventories and work-in-progress 280,740 236,426Trade receivables 96,639 120,387Amounts due from related parties, current 24,625 58,365Other receivables, deposits and prepayments 10,160 5,525Advance payments to suppliers 62,139 43,785Long-term receivables, current 59 60Short-term investments 252 141Bank balances and other liquid funds 221,190 139,748
695,804 604,437
TOTAL ASSETS 888,477 763,587
EQUITY AND LIABILITIES
Current liabilitiesAdvance payments from customers, current 50,735 42,717Trade payables and accruals 270,973 281,895Amounts due to related parties, current 1,974 1,417Provisions 52,078 53,319Progress billings in excess of work-in-progress 231,957 169,155Provision for taxation 16,295 26,150Other loans, current 445 123
624,457 574,776
NET CURRENT ASSETS 71,347 29,661
Non-current liabilitiesAdvance payments from customers, non-current 93,482 40,104Deferred income 10,115 7,116Amounts due to related parties, non-current 26,343 26,343Derivative financial instruments, non-current 9,696 –
139,636 73,563
TOTAL LIABILITIES 764,093 648,339
NET ASSETS 124,384 115,248
Share capital and reserves 124,843 115,362Non-controlling interests (459) (114)
124,384 115,248
TOTAL EQUITY AND LIABILITIES 888,477 763,587
SECTORAL FINANCIAL REVIEW – MARINE
238 239Singapore TechnologieS engineering lTd Annual Report 2012Making an impact

STATEMENT OF CASH FLOWS
2012 2011$’000 $’000
Net cash from operating activities 210,852 32,858
Net cash used in investing activities (49,318) (16,727) Proceeds from sale of property, plant and equipment 22 23 Purchase of property, plant and equipment (49,932) (18,362) Dividends from jointly controlled entities 1,089 1,547 Investment in jointly controlled entities (510) – Dividends from short-term investments 12 10 Proceeds from sale and maturity of investments 1 55
Net cash used in financing activities (75,930) (93,775) Loans from non-controlling shareholders 329 119 Repayment of related corporation loans – (21,000) Dividends paid to shareholder (76,243) (72,066) Interest paid (16) (828)
Net increase/(decrease) in cash and cash equivalents 85,604 (77,644)Cash and cash equivalents at beginning of the year 139,748 217,082Exchange difference on cash and cash equivalents at beginning of the year (4,162) 310Cash and cash equivalents at end of the year 221,190 139,748
SECTORAL FINANCIAL REVIEW – MARINE
FINANCIAL HIGHLIGHTS
2012 2011 2010 2009 2008$’000 $’000 $’000 $’000 $’000
Income StatementRevenue 1,011,092 877,204 1,044,850 955,952 821,754Profit
EBITDA 136,565 123,152 119,946 104,614 78,824EBIT 122,226 110,522 109,389 87,960 62,606PBT 127,828 121,840 117,994 102,279 75,203Net Profit 95,013 91,465 89,057 81,763 74,500
Balance SheetProperty, plant and equipment 151,322 118,578 112,313 102,388 99,255Intangibles and other assets 38,058 35,214 36,702 25,579 75,353Inventories and work-in-progress 280,740 236,426 154,194 61,030 83,881Trade receivables, deposits and prepayment 196,915 233,480 263,015 295,316 330,695Bank balances and other liquid funds and short-term investments 221,442 139,889 167,239 240,329 113,784
Current liabilities 624,457 574,776 597,995 560,799 546,372Non-current liabilities 139,636 73,563 43,022 61,342 61,323
Share capital 50,856 50,856 50,856 50,856 50,856Capital and other reserves (6,920) 2,369 (1,146) 3,237 3,757Retained earnings 80,907 62,137 42,745 48,408 40,660Non-controlling interests (459) (114) (9) – –
Financial IndicatorsEarnings per share (cents) 48.58 46.77 45.54 41.81 38.09Net assets value per share (cents) 63.60 58.93 47.27 52.41 48.72Return on sales (%) 9.4 10.4 8.5 8.6 9.1Return on equity (%) 62.8 64.5 75.0 63.5 61.3Return on total assets (%) 10.7 12.0 12.1 11.3 10.6
Productivity DataAverage staff strength (numbers) 1,834 1,850 1,856 1,734 1,541Revenue per employee ($) 551,304 474,164 562,958 551,299 533,260Net profit per employee ($) 51,806 49,441 47,983 47,153 48,345Employment costs 186,990 174,248 179,228 153,019 126,053Employment costs per $ of revenue ($) 0.18 0.20 0.17 0.16 0.15
Economic Value Added 91,402 81,042 71,095 68,023 59,597Economic Value Added spread (%) 68.8 44.3 39.0 35.0 26.1Economic Value Added per employee ($) 49,838 43,806 38,305 39,229 38,674
Value added 332,510 308,606 307,242 277,054 228,006Value added per employee ($) 181,303 166,814 165,540 159,777 147,960Value added per $ of employment costs ($) 1.78 1.77 1.71 1.81 1.81Value added per $ of gross property, plant and equipment ($) 0.77 0.79 0.83 0.78 0.67Value added per $ of revenue ($) 0.33 0.35 0.29 0.29 0.28
SECTORAL FINANCIAL REVIEW – MARINE
240 241Singapore TechnologieS engineering lTd Annual Report 2012Making an impact

Shareholding Statistics
SHARE CAPITAL
Paid-Up Capital : S$803,523,216.8536Class of Shares : Ordinary Shares
One Special Share held by the Minister for FinanceVoting Rights : One vote per share
SHAREHOLDING HELD IN HANDS OF PUBLIC
Based on the information available to the Company as at 25 February 2013, 32.8993% of the issued ordinary shares of the Company is held by the public and therefore, Rule 723 of the Listing Manual issued by SGX-ST is complied with.
ANALYSIS OF SHAREHOLDINGS
No. of No. ofRange of Shareholdings Shareholders % Shares %
1 --- 999 2,051 7.37 647,937 0.021,000 --- 10,000 21,118 75.92 87,205,297 2.8310,001 --- 1,000,000 4,615 16.59 180,365,152 5.841,000,001 and above 32 0.12 2,819,703,228 91.31
27,816 100.00 3,087,921,614 100.00
Number of Shares
Substantial ShareholderDirect
InterestDeemedInterest
TotalInterest %
Temasek Holdings (Private) Limited 1,554,764,574 4,628,869 (1) 1,559,393,443 50.4998Aberdeen Asset Management PLC – 319,055,071 (2) 319,055,071 10.3324Aberdeen Asset Management Asia Limited – 309,614,071 (3) 309,614,071 10.0266Aberdeen Asset Managers Limited – 173,835,000 (3) 173,835,000 5.6295The Capital Group Companies, Inc. – 188,584,000 (4) 188,584,000 6.1071
As at 25 February 2013
Notes:
(1) Temasek Holdings (Private) Limited is deemed to have an interest in the following shares held by:
Name of Company No. of Shares
DBS Group Holdings Ltd 147,869Keppel Corporation Limited 4,032,000Fullerton Fund Management Company Ltd. 367,000ST Asset Management Ltd. 82,000
(2) Includes interests held by Aberdeen Asset Management PLC’s subsidiaries.
(3) Details of their deemed interest are not available.
(4) The Capital Group Companies, Inc. is deemed to have an interest in the following shares held by:
Name of Company No. of Shares
Raffles Nominees (Pte.) Limited 173,234,000DBS Nominees (Private) Limited 15,350,000
MAJOR SHAREHOLDERS LIST – TOP 20
NO. Name No. of Shares Held %
1 Temasek Holdings (Private) Limited 1,554,764,574 50.352 DBS Nominees (Private) Limited 376,502,853 12.193 DBSN Services Pte. Ltd. 268,789,241 8.704 Citibank Nominees Singapore Pte Ltd 211,119,221 6.845 BNP Paribas Securities Services 161,591,382 5.236 HSBC (Singapore) Nominees Pte Ltd 104,064,683 3.377 United Overseas Bank Nominees (Private) Limited 42,416,137 1.378 Raffles Nominees (Pte.) Limited 21,217,095 0.699 Lee Pineapple Company (Pte) Limited 15,000,000 0.4810 DBS Vickers Securities (Singapore) Pte Ltd 6,917,781 0.2211 DB Nominees (Singapore) Pte Ltd 6,773,160 0.22 12 OCBC Securities Private Limited 5,149,064 0.17 13 Bank of Singapore Nominees Pte. Ltd. 4,506,295 0.15 14 OCBC Nominees Singapore Private Limited 4,362,012 0.14 15 Oversea-Chinese Bank Nominees Private Limited 4,205,644 0.1416 KI Investments (HK) Limited 4,032,000 0.13 17 Morgan Stanley Asia (S’pore) 2,996,081 0.1018 Tan Pheng Hock 2,899,717 0.0919 Societe Generale S’pore Branch 2,713,392 0.0920 Shanwood Development Pte Ltd 2,077,000 0.07
2,802,097,332 90.74
Shareholding StatisticsAs at 25 February 2013
242 243Singapore TechnologieS engineering lTd Annual Report 2012Making an impact

This page is intentionally left blank.
This annual report has been certified by the Forest Stewardship council as an example of environmentally responsible forestry print production:
• Fromtheforest,tothepapermillandprinter,eachstepofthisannualreport’sproductioniscertifiedaccording to FSc standards.
• Thepapermaterial,ArcoprintEW,isanenvironmentallyfriendlypaperthatismanufacturedfromcontrolledsources of recycled wood and/or fibres.
• Thepaper’slocaldistributor,RJPaper,isarecipientoftheNationalEnvironmentAgency’sGreenLeafAward, andisFSCCertified;whilsttheprinterforthisreport,AlsoDominiePress,issimilarlyFSCCertified.

SINGAPORE TECHNOLOGIES ENGINEERING LTD51 Cuppage Road #09-08 Singapore 229469Tel : (65) 6722 1818 • Fax : (65) 6720 2293www.stengg.com
(Regn. No.: 199706274H)
Copyright © 2022 FDOKUMEN