SVEC-14-Regulations.pdf - Sree Vidyanikethan Engineering ...
Upload
ssw-umarylandCategory
view
3download
0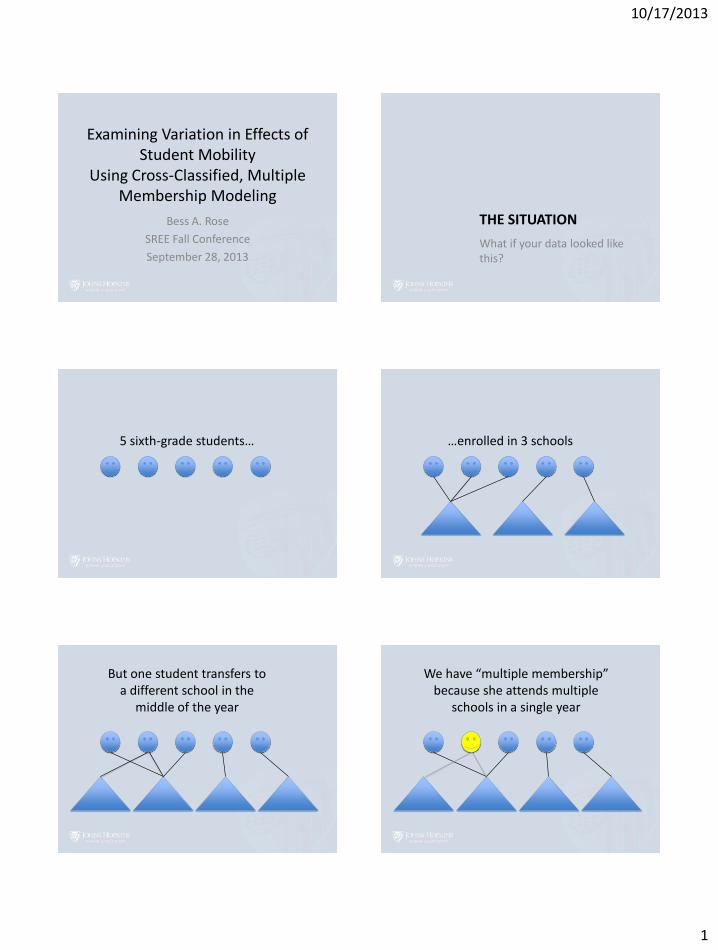
10/17/2013
1
Examining Variation in Effects of Student Mobility
Using Cross-Classified, Multiple Membership Modeling
Bess A. Rose
SREE Fall Conference
September 28, 2013
THE SITUATION
What if your data looked like this?
5 sixth-grade students… …enrolled in 3 schools
But one student transfers to a different school in the
middle of the year
We have “multiple membership” because she attends multiple
schools in a single year

10/17/2013
2
Sch1
Grade 6 Schools
Sch2 Sch3 Sch4
So we have a total of 4 Grade 6 schools
Sch1
Grade 6 Schools
Sch2 Sch3 Sch4
We also have data on the schools these students
attended prior to 6th grade
PS1 PS2 PS3 PS4 PS5 PS6
Sch1
Prior Schools
Grade 6 Schools
Sch2 Sch3 Sch4
Cross-classified
PS1 PS2 PS3 PS4 PS5 PS6
Sch1
Grade 6 Schools
Sch2 Sch3 Sch4
Traditional HLM ignores prior schools
Sch1
Grade 6 Schools
Sch2 Sch3 Sch4
…by including only the last school attended…
Traditional HLM ignores multiple schools attended in the current year…
Sch1
Grade 6 Schools
Sch2 Sch3 Sch4
…or by including only the first school attended…
10/17/2013
3
Sch1
Grade 6 Schools
Sch2 Sch3 Sch4
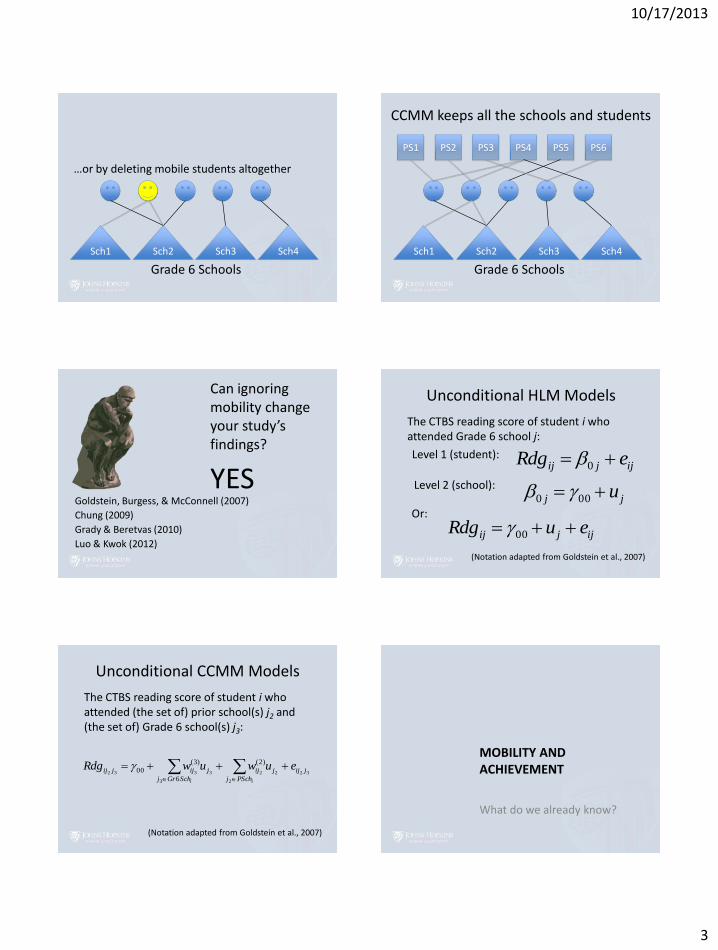
…or by deleting mobile students altogether
PS1 PS2 PS3 PS4 PS5 PS6
Sch1
Grade 6 Schools
Sch2 Sch3 Sch4
CCMM keeps all the schools and students
Can ignoring mobility change your study’s findings?
Goldstein, Burgess, & McConnell (2007)
Chung (2009)
Grady & Beretvas (2010)
Luo & Kwok (2012)
YES
Unconditional HLM Models
ijjij euRdg 00
(Notation adapted from Goldstein et al., 2007)
The CTBS reading score of student i who attended Grade 6 school j:
Or:
ijjij eRdg 0Level 1 (student):
jj u 000 Level 2 (school):
Unconditional CCMM Models
322
2
23
3
332
)2(
6
)3(
00 jijj
PSchj
ijj
SchGrj
ijjij euwuwRdgii
(Notation adapted from Goldstein et al., 2007)
The CTBS reading score of student i who attended (the set of) prior school(s) j2 and (the set of) Grade 6 school(s) j3:
MOBILITY AND ACHIEVEMENT
What do we already know?

10/17/2013
4
Background • Mobility is actually
the norm, not the exception
• Not including normative school changes such as those from elementary to middle school, most students change schools at least once during their K-12 school careers (Rumberger, 2002)
Mobility and Students
School transfers can cause problems for students and their families, psychologically, socially, and academically
(Bradshaw, Sudhinaraset, Mmari, & Blum, 2010; Coleman, 1988; Gruman, Harachi, Abbott, Catalano, & Fleming, 2008; Lareau, 2011; Pribesh & Downey, 1999; South & Haynie, 2004)
(Bryk, Sebring, Allensworth, Luppescu, & Easton, 2010; Lash & Kirkpatrick, 1990; U.S. GAO, 2010)
Mobility can also be a challenge for schools and teachers:
• instructional and social-emotional needs of incoming students
• stable relationships and processes
Mobility and Schools Effect on Achievement
• About 1/3 of a standard deviation
• Math and reading scores
• Dropout rates
• Controlling for student background and prior achievement
Meta-analysis by Reynolds, Chen & Herbers (2009)
Variation in Effect
Not all school changes appear to have the same effect on all students
• Hanushek, Kain, & Rivkin (2004)
• Xu, Hannaway, & D’Souza (2009)
Variation in Effect
Teacher support is especially effective for mobile children’s positive attitudes toward school (Gruman et al., 2008)
10/17/2013
5
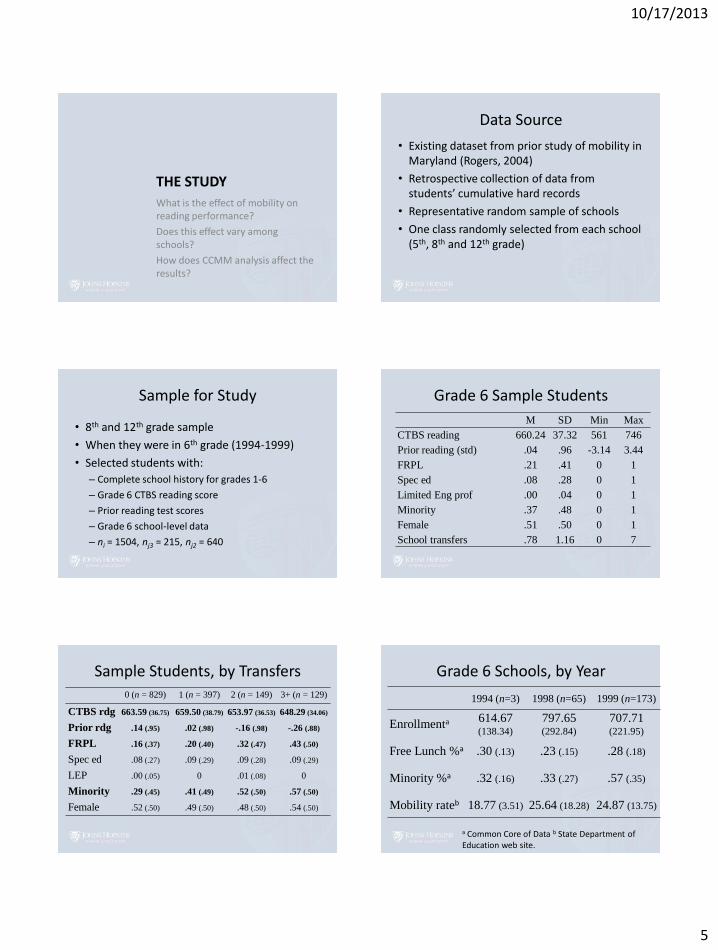
THE STUDY
What is the effect of mobility on reading performance?
Does this effect vary among schools?
How does CCMM analysis affect the results?
Data Source
• Existing dataset from prior study of mobility in Maryland (Rogers, 2004)
• Retrospective collection of data from students’ cumulative hard records
• Representative random sample of schools
• One class randomly selected from each school (5th, 8th and 12th grade)
Sample for Study
• 8th and 12th grade sample
• When they were in 6th grade (1994-1999)
• Selected students with:
– Complete school history for grades 1-6
– Grade 6 CTBS reading score
– Prior reading test scores
– Grade 6 school-level data
– ni = 1504, nj3 = 215, nj2 = 640
Grade 6 Sample Students
M SD Min Max
CTBS reading 660.24 37.32 561 746
Prior reading (std) .04 .96 -3.14 3.44
FRPL .21 .41 0 1
Spec ed .08 .28 0 1
Limited Eng prof .00 .04 0 1
Minority .37 .48 0 1
Female .51 .50 0 1
School transfers .78 1.16 0 7
Sample Students, by Transfers 0 (n = 829) 1 (n = 397) 2 (n = 149) 3+ (n = 129)
CTBS rdg 663.59 (36.75) 659.50 (38.79) 653.97 (36.53) 648.29 (34.06)
Prior rdg .14 (.95) .02 (.98) -.16 (.98) -.26 (.88)
FRPL .16 (.37) .20 (.40) .32 (.47) .43 (.50)
Spec ed .08 (.27) .09 (.29) .09 (.28) .09 (.29)
LEP .00 (.05) 0 .01 (.08) 0
Minority .29 (.45) .41 (.49) .52 (.50) .57 (.50)
Female .52 (.50) .49 (.50) .48 (.50) .54 (.50)
Grade 6 Schools, by Year
1994 (n=3) 1998 (n=65) 1999 (n=173)
Enrollmenta 614.67 (138.34)
797.65 (292.84)
707.71 (221.95)
Free Lunch %a .30 (.13) .23 (.15) .28 (.18)
Minority %a .32 (.16) .33 (.27) .57 (.35)
Mobility rateb 18.77 (3.51) 25.64 (18.28) 24.87 (13.75)
a Common Core of Data b State Department of Education web site.
10/17/2013
6
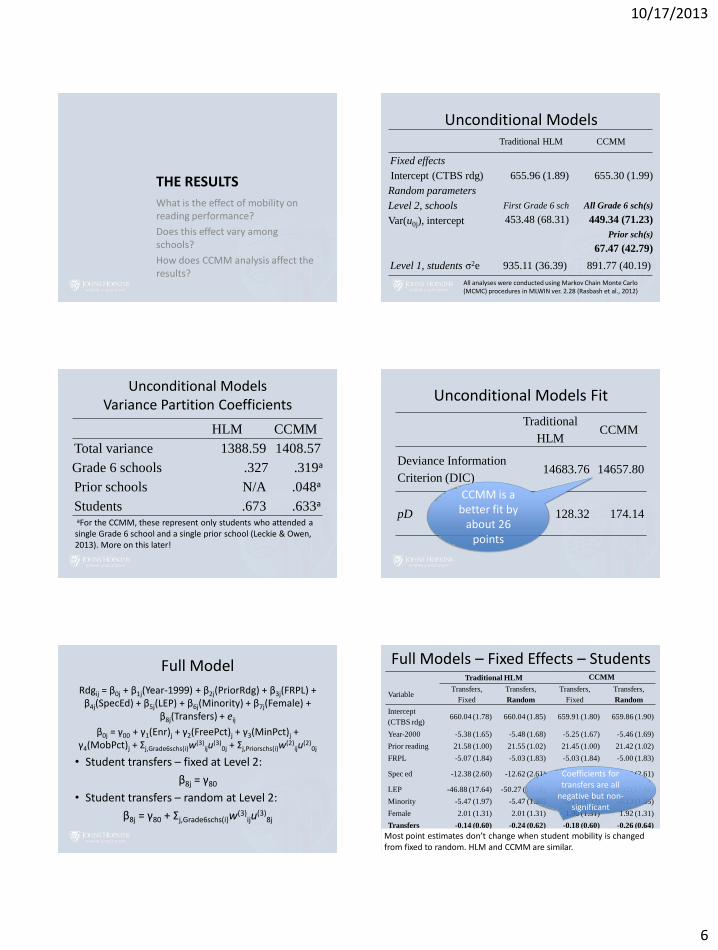
THE RESULTS
What is the effect of mobility on reading performance?
Does this effect vary among schools?
How does CCMM analysis affect the results?
Unconditional Models Traditional HLM CCMM
Fixed effects
Intercept (CTBS rdg) 655.96 (1.89) 655.30 (1.99)
Random parameters
Level 2, schools
Var(u0j), intercept
First Grade 6 sch
453.48 (68.31)
All Grade 6 sch(s)
449.34 (71.23)
Prior sch(s)
67.47 (42.79)
Level 1, students σ2e 935.11 (36.39) 891.77 (40.19)
All analyses were conducted using Markov Chain Monte Carlo (MCMC) procedures in MLWIN ver. 2.28 (Rasbash et al., 2012)
Unconditional Models Variance Partition Coefficients
HLM CCMM
Total variance 1388.59 1408.57
Grade 6 schools .327 .319a
Prior schools N/A .048a
Students .673 .633a aFor the CCMM, these represent only students who attended a single Grade 6 school and a single prior school (Leckie & Owen, 2013). More on this later!
Unconditional Models Fit
Traditional
HLM CCMM
Deviance Information
Criterion (DIC) 14683.76 14657.80
pD 128.32 174.14
CCMM is a better fit by
about 26 points
Full Model
Rdgij = β0j + β1j(Year-1999) + β2j(PriorRdg) + β3j(FRPL) + β4j(SpecEd) + β5j(LEP) + β6j(Minority) + β7j(Female) +
β8j(Transfers) + eij
β0j = γ00 + γ1(Enr)j + γ2(FreePct)j + γ3(MinPct)j + γ4(MobPct)j + Σj,Grade6schs(i)w
(3)iju
(3)0j + Σj,Priorschs(i)w
(2)iju
(2)0j
• Student transfers – fixed at Level 2:
β8j = γ80
• Student transfers – random at Level 2:
β8j = γ80 + Σj,Grade6schs(i)w(3)
iju(3)
8j
Full Models – Fixed Effects – Students Traditional HLM CCMM
Variable Transfers,
Fixed
Transfers,
Random
Transfers,
Fixed
Transfers,
Random
Intercept
(CTBS rdg) 660.04 (1.78) 660.04 (1.85) 659.91 (1.80) 659.86 (1.90)
Year-2000 -5.38 (1.65) -5.48 (1.68) -5.25 (1.67) -5.46 (1.69)
Prior reading 21.58 (1.00) 21.55 (1.02) 21.45 (1.00) 21.42 (1.02)
FRPL -5.07 (1.84) -5.03 (1.83) -5.03 (1.84) -5.00 (1.83)
Spec ed -12.38 (2.60) -12.62 (2.61) -12.29 (2.61) -12.60 (2.61)
LEP -46.88 (17.64) -50.27 (17.58) -46.85 (17.53) -50.02 (17.48)
Minority -5.47 (1.97) -5.47 (1.96) -5.17 (1.97) -5.13 (1.95)
Female 2.01 (1.31) 2.01 (1.31) 1.90 (1.31) 1.92 (1.31)
Transfers -0.14 (0.60) -0.24 (0.62) -0.18 (0.60) -0.26 (0.64)
Most point estimates don’t change when student mobility is changed from fixed to random. HLM and CCMM are similar.
Coefficients for transfers are all
negative but non-significant
10/17/2013
7
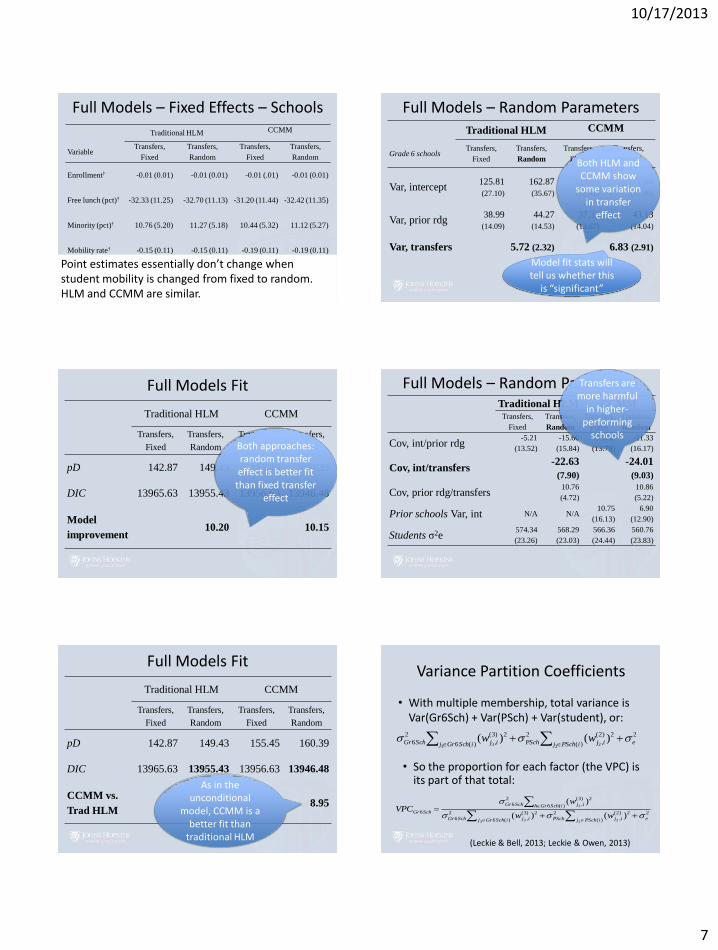
Full Models – Fixed Effects – Schools
Traditional HLM CCMM
Variable Transfers,
Fixed
Transfers,
Random
Transfers,
Fixed
Transfers,
Random
Enrollment† -0.01 (0.01) -0.01 (0.01) -0.01 (.01) -0.01 (0.01)
Free lunch (pct)† -32.33 (11.25) -32.70 (11.13) -31.20 (11.44) -32.42 (11.35)
Minority (pct)† 10.76 (5.20) 11.27 (5.18) 10.44 (5.32) 11.12 (5.27)
Mobility rate† -0.15 (0.11) -0.15 (0.11) -0.19 (0.11) -0.19 (0.11)
†Grand-mean centered Point estimates essentially don’t change when student mobility is changed from fixed to random. HLM and CCMM are similar.
Full Models – Random Parameters Traditional HLM CCMM
Grade 6 schools Transfers,
Fixed
Transfers,
Random
Transfers,
Fixed
Transfers,
Random
Var, intercept 125.81
(27.10)
162.87
(35.67)
129.55
(28.41)
171.04
(37.80)
Var, prior rdg 38.99
(14.09)
44.27
(14.53)
37.33
(13.67)
43.13
(14.04)
Var, transfers 5.72 (2.32) 6.83 (2.91)
Both HLM and CCMM show
some variation in transfer
effect
Model fit stats will tell us whether this
is “significant”
Full Models Fit
Traditional HLM CCMM
Transfers,
Fixed
Transfers,
Random
Transfers,
Fixed
Transfers,
Random
pD 142.87 149.43 155.45 160.39
DIC 13965.63 13955.43 13956.63 13946.48
Model
improvement 10.20 10.15
Both approaches: random transfer effect is better fit
than fixed transfer effect
Full Models – Random Parameters Traditional HLM CCMM
Transfers,
Fixed
Transfers,
Random
Transfers,
Fixed
Transfers,
Random
Cov, int/prior rdg -5.21
(13.52)
-15.66
(15.84)
-1.82
(13.79)
-11.33
(16.17)
Cov, int/transfers -22.63
(7.90)
-24.01
(9.03)
Cov, prior rdg/transfers 10.76
(4.72)
10.86
(5.22)
Prior schools Var, int N/A N/A 10.75
(16.13)
6.90
(12.90)
Students σ2e 574.34
(23.26)
568.29
(23.03)
566.36
(24.44)
560.76
(23.83)
Transfers are more harmful
in higher-performing
schools
Full Models Fit
Traditional HLM CCMM
Transfers,
Fixed
Transfers,
Random
Transfers,
Fixed
Transfers,
Random
pD 142.87 149.43 155.45 160.39
DIC 13965.63 13955.43 13956.63 13946.48
CCMM vs.
Trad HLM 8.95
As in the unconditional
model, CCMM is a better fit than
traditional HLM
Variance Partition Coefficients
• With multiple membership, total variance is Var(Gr6Sch) + Var(PSch) + Var(student), or:
)(6 )(
22)2(
,
22)3(
,
2
6
)(6
2)3(
,
2
6
6
3 2 23
3
)()(
)(
iSchGrj iPSchj eijPSchijSchGr
iSchGrh ijSchGr
SchGrww
wVPC
(Leckie & Bell, 2013; Leckie & Owen, 2013)
)(6 )(
22)2(
,
22)3(
,
2
63 2 23
)()(iSchGrj iPSchj eijPSchijSchGr ww
• So the proportion for each factor (the VPC) is its part of that total:

10/17/2013
8
Full Models Variance Partition Coefficients
HLM CCMM
1 Gr6 Sch
1 Prior Sch
1 Gr6 Sch
2 Prior Sch
2 Gr6 Sch
2 Prior Sch
Total
unexplained
variance
731.16 738.69 735.25 649.73
Grade 6 schools .223 .232 .233 .132
Prior schools N/A .009 .005 .005
Students .777 .759 .763 .863
For mobile students, more of the unexplained variance is due
to students
CCMM does a better job of accounting for school-level
variance CONCLUSIONS
What is the effect of mobility on reading performance?
Does this effect vary among schools?
How does CCMM analysis affect the results?
What is the effect of mobility on reading performance?
• Small, not statistically significant effect of mobility on reading performance (but small dataset with low reliability for this parameter)
• Controlling for prior reading performance, student characteristics, and school context
• Transfers are more harmful in higher-performing schools – i.e. mobility gap is much larger
Does this effect vary among schools?
• There is some variation in the transfer effect among schools
• Multilevel models with random slopes (transfer effects) had lower deviance statistics than those with fixed effects
• More research is needed into school processes that exacerbate or ameliorate the effects of mobility
How does CCMM affect the results?
• CCMM provides better model fit than traditional HLM
• In this instance, CCMM did not make a difference in the point estimates
• CCMM is better than HLM in looking at the proportion of unexplained variance at each level (within-group and between-group) – It allows us to see how the VPCs change based on
mobility patterns
– It better accounts for variation among schools
Note: Funding for the original study was provided by The Annie E. Casey Foundation. Funding for the current study was provided by provided by a grant from the U.S. Department of Education’s Institute of Education Sciences (IES) to Johns Hopkins University’s interdisciplinary pre-doctoral research training program (R305B080020). The opinions expressed are those of the author and do not represent views of the Institute or the U.S. Department of Education.
10/17/2013
9
Future Research
• Growth curve modeling to get more complete picture of students’ development over time
• Propensity score matching to account for selection bias (students are not randomly assigned to mobility)
• Model-based multiple imputation to prevent losing students and schools from dataset
References Alexander, K. L., Entwisle, D. R., & Dauber, S. L. (1996). Children in
motion: School transfers and elementary school performance. Journal of Educational Research, 90, 3-12.
Bradshaw, C. P., Sudhinaraset, M., Mmari, K., & Blum, R. W. (2010). School transitions among military adolescents: A qualitative study of stress and coping. School Psychology Review, 39, 84-105.
Browne, W. J. (2012). MCMC estimation in MLwiN version 2.26. Centre for Multilevel Modelling, University of Bristol.
Bryk, A. S., Sebring, P. B., Allensworth, E., Luppescu, S., & Easton, J. Q. (2010). Organizing schools for improvement: Lessons from Chicago. Chicago: The University of Chicago Press.
Coleman, J. S. (1988). Social capital in the creation of human capital. American Journal of Sociology, 94(Supplement), S95-S120.
References Chung, H. (2009). The Impact of Ignoring Multiple-Membership Data
Structures. Dissertation. The University of Texas at Austin.
Goldstein, H. (2003). Multilevel Statistical Models, 3rd ed. London: Arnold.
Goldstein, H., Burgess, S., & McConnell, B. (2007). Modelling the effect of pupil mobility on school differences in educational achievement. Journal of the Royal Statistical Society, 170, 941-954.
Grady, M. W., & Beretvas, S. N. (2010). Incorporating student mobility in achievement growth modeling: A cross-classified multiple membership growth curve model. Multivariate Behavioral Research, 45, 393-419.
References Gruman, D. H., Harachi, T. W., Abbott, R. D., Catalano, R. F., & Fleming,
C. B. (2008). Longitudinal effects of student mobility on three dimensions of elementary school engagement. Child Development, 79, 1833-1852.
Hanushek, E. A., Kain, J. F., & Rivkin, S. G. (2004). Disruption versus Tiebout improvement: The costs and benefits of switching schools. Journal of Public Economics, 88, 1721–1746.
Lareau, A. (2011). Unequal childhoods: Class, race, and family life (2nd ed.). Berkeley: University of California Press.
Lash, A. A., & Kirkpatrick, S. L. (1990). A classroom perspective on student mobility. The Elementary School Journal, 91, 176-191.
References Leckie, G., & Bell, A. (2013). Cross-Classified Multilevel Models –
MLwiN Practical. LEMMA VLE Module 12, 1-60. http://www.bristol.ac.uk/cmm/learning/course.html
Leckie, G., & Owen, D. (2013). Multiple Membership Multilevel Models – MLwiN Practical. LEMMA VLE Module 13, 1-48. http://www.bristol.ac.uk/cmm/learning/course.html
Luo, W., & Kwok, O. (2012). The consequences of ignoring individuals' mobility in multilevel growth models: A Monte Carlo study. Journal of Educational and Behavioral Statistics, 37, 31-56.
Pribesh, S., & Downey, D. B. (1999). Why are residential and school moves associated with poor school performance? Demography, 36, 521-534.
References
Rasbash, J., Browne, W. J., Healy, M., Cameron, B., & Charlton, C. (2013). MLwiN Version 2.27. Centre for Multilevel Modelling, University of Bristol.
Raudenbush, S. W., & Bryk, A. S. (2002). Hierarchical linear models: Applications and data analysis methods, 2nd ed. Thousand Oaks, CA: SAGE.
Reynolds, A. J., Chen, C.-C., & Herbers, J. E. (June 2009). School Mobility and Educational Success: A Research Synthesis and Evidence on Prevention. Paper presented at the Workshop on the Impact of Mobility and Change on the Lives of Young Children, Schools, and Neighborhoods, National Research Council, Washington, DC.
10/17/2013
10
References
Rogers, L. (2004). Student mobility in Maryland: A report to The Annie E. Casey Foundation. Baltimore, MD: Maryland State Department of Education.
Rumberger, R. W. (2002). Student mobility. In Encyclopedia of Education (2nd ed., Vol. 7, pp. 2381-2385). New York: Macmillan Reference USA.
Rumberger, R. W., & Larson, K. A. (1998). Student mobility and the increased risk of high school dropout. American Journal of Education, 107, 1-35.
South, S. J., & Haynie, D. L. (2004). Friendship networks of mobile adolescents. Social Forces, 83(1), 315-350.
References
Spiegelhalter, D. J., Best, N. G., Carlin, B. P., & van der Linde, A. (2002). Bayesian measures of model complexity and fit (with discussion). Journal of the Royal Statistical Society, Series B, 64, 583-639.
Tucker, C. J., Marx, J., & Long, L. (1998). “Moving on”: Residential mobility and children's school lives. Sociology of Education, 71, 111-129.
U.S. General Accounting Office. (2010). Many challenges arise in educating students who change schools frequently. Retrieved from http://www.gao.gov/products/GAO-11-40
References
Xu, Z., Hannaway, J., & D’Souza, S. (2009). Student transience in North Carolina: The effect of school mobility on student outcomes using longitudinal data. National Center for Analysis of Longitudinal Data in Education Research (CALDER) Working Paper no. 22, March 2009. Retrieved from http://www.caldercenter.org/upload/1001256_student_transience.pdf
Copyright © 2022 FDOKUMEN