Sponsorship Evaluation
396
Sponsorship Evaluation By Norman O’Reilly Eric Sprott School of Business A thesis submitted to the Faculty of Graduate Studies and Research in conformity with the requirements for the degree of Doctor of Philosophy (Management) Carleton University June 2007 © Norman O’Reilly, 2007 Reproduced with permission of the copyright owner. Further reproduction prohibited without permission.
-
Upload
khangminh22 -
Category
Documents
-
view
3 -
download
0
Transcript of Sponsorship Evaluation
Sponsorship Evaluation
By
Norman O’ReillyEric Sprott School of Business
A thesis submitted to the Faculty of Graduate Studies and Research in conformity with the requirements for the
degree of Doctor of Philosophy (Management)
Carleton University June 2007
© Norman O’Reilly, 2007
Reproduced with permission of the copyright owner. Further reproduction prohibited without permission.
Library and Archives Canada
Bibliotheque et Archives Canada
Published Heritage Branch
395 Wellington Street Ottawa ON K1A 0N4 Canada
Your file Votre reference ISBN: 978-0-494-33506-2 Our file Notre reference ISBN: 978-0-494-33506-2
Direction du Patrimoine de I'edition
395, rue Wellington Ottawa ON K1A 0N4 Canada
NOTICE:The author has granted a nonexclusive license allowing Library and Archives Canada to reproduce, publish, archive, preserve, conserve, communicate to the public by telecommunication or on the Internet, loan, distribute and sell theses worldwide, for commercial or noncommercial purposes, in microform, paper, electronic and/or any other formats.
AVIS:L'auteur a accorde une licence non exclusive permettant a la Bibliotheque et Archives Canada de reproduire, publier, archiver, sauvegarder, conserver, transmettre au public par telecommunication ou par I'lnternet, preter, distribuer et vendre des theses partout dans le monde, a des fins commerciales ou autres, sur support microforme, papier, electronique et/ou autres formats.
The author retains copyright ownership and moral rights in this thesis. Neither the thesis nor substantial extracts from it may be printed or otherwise reproduced without the author's permission.
L'auteur conserve la propriete du droit d'auteur et des droits moraux qui protege cette these.Ni la these ni des extraits substantiels de celle-ci ne doivent etre imprimes ou autrement reproduits sans son autorisation.
In compliance with the Canadian Privacy Act some supporting forms may have been removed from this thesis.
While these forms may be included in the document page count, their removal does not represent any loss of content from the thesis.
Conformement a la loi canadienne sur la protection de la vie privee, quelques formulaires secondaires ont ete enleves de cette these.
Bien que ces formulaires aient inclus dans la pagination, il n'y aura aucun contenu manquant.
i * i
CanadaR eproduced with perm ission of the copyright owner. Further reproduction prohibited without perm ission.
Abstract
The application of and investment in sponsorship globally has been increasing
rapidly for over 20 years while the theoretical development and practical ability to
evaluate the effectiveness of sponsorship has lagged behind. It is evident that a strong
theoretical foundation and improved evaluation tools are required. Agency Theory has
made contributions to almost every discipline and sub-discipline within organization
theory, and a review of its tenets supports taking such a perspective on sponsorship
evaluation. Viewing the sponsor-sponsee relationship as an example of the principal-
agent relationship for the purpose of evaluating sponsorship is the focus of the research.
The implication that the sponsee provides a service to the sponsor in return for cash
and/or in-kind product is also fundamental to this research.
This research recognizes the importance of the explicit (formal) and implicit
(unwritten) objectives of both the sponsor and the sponsee in effectively evaluating a
sponsorship. In this regard, the dissertation focuses on the evaluation of the sponsorship
contract (Agency Theory’s unit of analysis) in both its explicit and implicit forms, while
considering important relationship factors (e.g. time) as external influences to the
evaluation of such contracts. Specifically, a review of the literature and a series of expert
interviews and consultations were used to explore the sponsor-sponsee relationship, and
provide the basis for the construction and development of a sponsorship evaluation
process model. The process model was then tested by adopting it to evaluate two major
sponsorships: Kanatek’s sponsorship of an expedition to Mount Everest, and ATB Bank’s
sponsorship of the Edmonton Grand Prix. Based on learning gleaned from these
sponsorship evaluation case studies, a final version of the model is proposed and
recommendations for future research and practice in sponsorship evaluation are
presented.
ii
R eproduced with perm ission of the copyright owner. Further reproduction prohibited without perm ission.

Dedication
This thesis is dedicated to Dr. Sean Egan, team leader of the Kanatek Expedition to Mount Everest and close friend and mentor to the author. He passed away tragically in April 2005 during his quest to summit Everest. Sean’s conscientious guidance and unconditional support of the author and his research is recognized. He was a role model to many, including the author, and is deeply missed.
Special Thanks
A successful thesis is not possible without the support of advisor, family and friends. This research is no different and two particular and equally important expressions of gratitude are noted.
The diligent and knowledgeable support of Dr. Judith Madill, thesis advisor, is thankfully recognized. She has inspired and will continue to inspire the author.
The sacrifices made, support given and understanding expressed by Nadege, Emma and Kian are especially noted. The author is a very fortunate husband and father.
iii
R eproduced with perm ission of the copyright owner. Further reproduction prohibited without perm ission.
Acknowledgements
The journey that was this thesis required the support and participation of many individuals at varying levels of commitment. They are acknowledged here.
Advisor:Dr. Judith Madill, Sprott School of Business, Carleton University
Committee:Dr. Lorraine Dyke, Sprott School of Business, Carleton University Dr. George Haines, Sprott School of Business, Carleton University Dr. Louise Heslop, Sprott School of Business, Carleton University
External Reviewers:External/external: Dr. George Foster, Graduate School of Business, Stanford University External/internal: Dr. Christopher Waddell, School of Journalism, Carleton University
Expert IntervieweesSincere thanks are expressed to each of the expert of their valuable time and their vast knowledge.
• David Bedford• Christine Boon• Cheri Bradish• Bemie Colterman• Carol Gardner• Mark Harrison• Terry Kell
ATB BankThe support of Mr. Kelly Rudan, Marketing Manager, is acknowledged - particularly his belief in the value of this work. Without his support, the thesis would not have been completed.
Kanatek Expedition to Mount EverestA special thank you is expressed to title sponsor Kanatek and its President Terry Kell, and to all members of the expedition including the organizing team of Dr. Sean Egan (University of Ottawa), Mr. Harold Mah (City of Toronto Event Support Manager), and Dr. Dave Valliere (Ryerson University).
Ireland-Canada Scholarship Fund:A special thank you is expressed to the Ireland-Canada Scholarship Board for their support, Mr. Eric Sprott for his financial assistance, and the Kemmy Business School, particularly Dr. John Fahy, at the University of Limerick, for their generous hospitality and support.
iv
interviewees who shared a few hours
• Brian Levine• Tim Maloney• Jim Mintz• Gavin Roth• Kelly Rudan• Hari Sihvo• Scott Smith
R eproduced with perm ission of the copyright owner. Further reproduction prohibited without perm ission.

TABLE OF CONTENTS
Abstract iiDedication iiiSpecial Thanks iiiAcknowledgements ivTable of Contents vList of Tables xList of Figures xiiList of Appendices xiii
1.0 Introduction 1
1.1 Purpose and Relevance 11.2 Outline of Dissertation 71.3 Contribution of Dissertation: Objectives 8
2.0 Sponsorship 11
2.1 Introducing Sponsorship 11
2.1.1 The Origin of Sponsorship 132.1.2 Defining Sponsorship 14
2.1.2.1 Sponsorship Involvement 172.1.2.2 Leveraging 182.1.2.3 Sponsorship and Exclusivity 192.1.2.4 Sponsorship and Image Transfer 202.1.2.5 Sponsee Scenarios 222.1.2.6 Working Definition of Sponsorship 24
2.1.3 The Process of Establishing a Sponsorship 26
2.2 Sponsorship Industry Growth and Key Industry Segments 28
2.3 Sponsorship and Marketing Theory 31
2.4 Summary: Sponsorship 36
3.0 Sponsorship Evaluation 37
3.1 Introducing Sponsorship Evaluation 373.1.1 The Attribution Issue 3 83.1.2 Demand for Improved Sponsorship Evaluation 40
3.2 Evaluation 42
3.3 Performance Measurement 43
v
R eproduced with perm ission of the copyright owner. Further reproduction prohibited without perm ission.

3.4 Sponsorship Evaluation 463.4.1 The Challenges of Sponsorship Evaluation 463.4.2 The Sponsorship Evaluation Literature 483.4.3 Sponsorship Evaluation Practice 503.4.4 Implementing Sponsorship: The Role of Evaluation 59
3.4.4.1 Objective Setting 603.4.4.2 Pre-Sponsorship Measurement 643.4.4.3 Choose Promotional Tactics 653.4.4.4 Sponsorship Implementation 663.4.4.5 Post-Sponsorship Measurement and Results 67
3.5 Summary: Sponsorship Evaluation 71
4.0 Theoretical Framework 73
4.1 Selecting and Introducing Agency Theory 734.1.1 The Scope of Agency Theory 754.1.2 An Overview of Agency Theory 77
4.2 Key concepts in Agency Theory 784.2.1 The Contract as Unit of Analysis 784.2.2 Assumptions in Agency Theory 784.2.3 Monitoring in Agency Theory 804.2.4 Agency Theory in Economics, Marketing and Management 804.2.5 Information and Agency Theory 854.2.6 Risk Preference and the Variables in Agency Theory 854.2.7 Incentives and Self-Interest in Agency Theory 884.2.8 The Two Branches of Agency Theory 88
4.2.8.1 Principal-Agent research 894.2.8.1.2 Pre-Contractual Problems 914.2.8.1.2 Post-Contractual Problems 92
4.2.8.2 The Positivist Branch of Agency Theory 954.2.8.3. Comparison of the Branches 97
4.3 Theory Development: Agency Theory and Sponsorship 984.3.1 Agency Theory, Mega-Sponsees and Typical Sponsees 994.3.2 Agency Theory, the Contract, and the Relationship 994.3.3 Agency Theory Phases in Sponsorship 1014.3.4 Agency Theory, Risk and Sponsorship 1014.3.5 Agency Theory, Imperfect Surveillance and Sponsorship 1024.3.6 A Model of Agency Theory in Sponsorship 1034.3.7 Sponsorship Evaluation and Agency Theory 104
4.3.7.1 Draft Process model for Sponsorship Evaluation 105
4.4 Chapter Summary 110
vi
R eproduced with perm ission of the copyright owner. Further reproduction prohibited without perm ission.
5.0 Methodology 112
5.1 Phase I: Qualitative Study of Sponsorship Evaluation 113
5.2 Phase II: Sponsorship Evaluation Case Studies 1155.2.1 Articulation of Objectives, Metrics and Methods 118
5.3 Summary of Methodology 121
6.0 Results and Analysis 122
6.1 Phase I: Expert Interviews 1226.1.1 Background on Interviewees 1226.1.2 Background Sponsorship Information Results 1276.1.3 Understanding the Sponsor-Sponsee Relationship 127
6.1.3.1 How Sponsorships Begin and End 1286.1.3.2 Frequency of Sponsor-Sponsee Communication 1316.1.3.3 Agency Theory and Sponsorship 133
6.1.3.3.1 Formal Sponsorship Contract 1346.1.3.3.2 Evidence of Sponsee Monitoring 1346.1.3.3.3 Sponsee Compliance 135
6.1.3.4 Sponsor and Sponsee Obj ectives 13 66.1.3.5 Frequency of Intermediary Involvement 1376.1.3.6 The Importance of Exclusivity 13 86.1.3.7 The Importance of Leveraging 140
6.1.4 Understanding Current Practice in Spon. Evaluation 1416.1.4.1 Sponsorship Evaluation Experience 1416.1.4.2 Frequency of Sponsorship Evaluation 1426.1.4.3 Identification of Sponsorship Evaluation Practices 1436.1.4.4 Mega-Sponsee Evaluation Practice 1446.1.4.5 Forecasting Future Practice 146
6.1.5 Barriers, Fears and Benefits of Evaluation 1476.1.5.1 Belief in Sponsorship Evaluation 1476.1.5.2 Senior Management Motivations 1476.1.5.3 Resource Allocation and Sponsorship Evaluation 1496.1.5.4 Barriers to Effective Sponsorship Evaluation 1506.1.5.5 Identification of Fears in Sponsorship Evaluation 1516.1.5.6 Benefits of Evaluation 1526.1.5.7 Frequency of Dually-Supported Evaluation 152
6.1.6 Understanding the Timing of Evaluation 1536.1.7 Updated Sponsorship Evaluation Process model 154
R eproduced with perm ission of the copyright owner. Further reproduction prohibited without perm ission.

6.2 Phase 2: Sponsorship Evaluation Case Studies 1596.2.1 ATB Bank and the Edmonton Grand Prix 159
6.2.1.1 Setting the Stage 1606.2.1.1.1 Identify Sponsorship 160
6.2.1.1.1.1 Pre-Sponsorship Investigation 1646.2.1.1.2 Build Relationships 1666.2.1.1.3 Cost-Benefit Pre-Test 1666.2.1.1.4 Decision 167
6.2.1.2 Collect Data 1676.2.1.2.1 Data Gathering 1676.2.1.2.2 Attributes of the Relationship 170
6.2.1.3 Articulate Objectives 1736.2.1.4 Establish Metrics 1756.2.1.5 Determine Metrics for Resources and Shirking 180
6.2.1.5.1 Resources and Activities 1816.2.1.5.2 Shirking 183
6.2.1.6 Collect Data and Analyze 1856.2.1.6.1 Data Collection Exercises 186
6.2.1.6.1.1 Additional Information Gathered 2066.2.1.6.2 Data Analysis: Objectives 2086.2.1.6.3 Data Analysis: Shirking Behaviours 238
6.2.1.7 Outcomes and Impacts 2496.2.1.7.1 Recommendations to Organizations 253
6.2.2 Kanatek and the 2005 Everest Expedition 2576.2.2.1 Setting the Stage 257
6.2.2.1.1 Identify Sponsorship 2606.2.2.1.2 Build Relationships 2666.2.2.1.3 Cost-Benefit Pre-Test 2676.2.2.1.4 Decision 267
6.2.2.2 Collect Data 2686.2.2.2.1 Data Gathering 2686.2.2.2.2 Attributes of the Relationship 271
6.2.2.3 Articulate Objectives 2736.2.2.4 Establish Metrics 274
6.2.2.4.1 Observations on Research Process 2786.2.2.5 Determine Metrics for Resources and Shirking 278
6.2.2.5.1 Resources and Activities 2796.2.2.5.2 Shirking 280
6.2.2.6 Collect Data and Analyze 2816.2.2.6.1 Data Collection Exercises 281
62.2.1 Outcomes and Impacts 289
6.2.3 Summary: Sponsorship Evaluation Case Studies 290
R eproduced with perm ission of the copyright owner. Further reproduction prohibited without perm ission.
7.0 Summary, Discussion and Conclusion 292
7.1 Research Conclusions: Sponsorship Evaluation Case Studies 2937.1.1 Summary Findings 2947.1.2 Updated Process model 2957.1.3 Methods and Implementation 299
7.2 Contributions to Practice 301
7.3 Contributions to Theory and the Literature 3027.3.1 Contributions to Agency Theory 3037.3.2 Contributions to Sponsorship Theory 3047.3.3 Contributions to Sponsorship Evaluation Theory 3067.3.4 Contributions to the Literature related to Obj ectives 307
7.4 Limitations of this Research 3097.5 A Future Research Agenda 3117.6 The Final Word 313
References 315
Appendices 351
ix
R eproduced with perm ission of the copyright owner. Further reproduction prohibited without perm ission.

List of Tables
Table 1: Sponsorship Arrangements 26Table 2: Global Sponsorship Values 29Table 3: Sponsorship’s Distinction from Advertising 32Table 4: Models, Methods and Frameworks of Sponsorship Evaluation 51 Table 5: Measurable Promotional Tactics 58Table 6: Summary Groupings of Sponsorship Objectives 63Table 7: Top 10 Sponsorship Best Practices 67Table 8: Agency Relationships Example: NFL Franchise and QB 76Table 9: Agency Theory Overview 77Table 10: Comparison of Agency Theory Assumptions and Perspectives 79 Table 11: Cases of the Simple Model of Principal-Agent Research 89Table 12: Two Propositions of Positivist Theory 95Table 13: Principal-Agent Research versus Positivist Theory 97Table 14: Scenarios of the Sponsor-Sponsee Relationships 99Table 15: Basic Typology of Sponsors, Sponsees & Intermediaries 100Table 16: Agency Theory Phases in Sponsorship 101Table 17: Proposed Cases & Dimensions of Operational Definition 116Table 18: Research Plan for Dissertation Objectives 121Table 19: Roster and Expertise of Interviewees 123Table 20: Sponsorship Relationships: Methods of Termination 130Table 21: Top Sponsor Objectives 136Table 22: Top Sponsee Objectives 137Table 23: Estimates of the Frequency of Sponsorship Evaluation 142Table 24: Sponsorship Evaluation-Themes Observed in Current Practices 143 Table 25: Barriers to Effective Sponsorship Evaluation 150Table 26: List: Fears about Sponsorship Evaluation 151Table 27: Process Model Refinements 156Table 28: Financial Institution Market Share, Alberta 1992 & 1993 161Table 29: 2006 EGP Sponsors 162Table 30:2006 EGP Ticket Prices 163Table 31: ATB-EGP Sponsorship and Working Definition 165Table 32: Secondary Data Sources 168Table 33: ATB-EGP Sponsorship: Articulation of Objectives 174Table 34: ATB-EGP Sponsorship: Metrics 176Table 3 5: Data Collection Details 179Table 36: ATB financial/ATB MasterCard Sponsorship Budget Expenses 182 Table 37: Sponsee Shirking in the ATB-EGP Sponsorship 184Table 38: Impact of EGP Sponsorship on Positive Opinion of ATB 188Table 39: ATB Internal Customer Data, 4 Branches 190Table 40: ATB Internal Customer Data, Aggregate 191Table 41: Edmonton versus Calgary Branch Comparison, in-branch 193Table 42: Customer Opinion of Impacts on ATB 194Table 43: Age of Mass Market Survey Respondents 197Table 44: Household Income of Mass Market Survey Respondents 198
x
R eproduced with perm ission of the copyright owner. Further reproduction prohibited without perm ission.
Table 45: Title Sponsor Recognition 199Table 46: Financial Institution Sponsor Recognition 199Table 47: Frequency Responses, EGP Sponsorship Effectiveness 200Table 48: General Results: Post-Event Employee Interviews 203Table 49: Impacts on Decisions to Join or Increase ATB Business 210Table 50: Summary Results, Objective 5 ANOVA 217Table 51: Correlation Matrix: Objective 12 Questions 228Table 52: Evaluation Research Expenses 250Table 53: Summary Results 251Table 54: KEME Sponsorship and Working Definition 261Table 55: 2005 KEME Sponsors 262Table 56: 2005 KEME Planned Itinerary 264Table 57: Secondary Data Sources 269Table 58: KEME: Articulation of Objectives, Reach, Activities, Outputs 274 Table 59: KEME Sponsorship Evaluation: Metrics and Methods 276Table 60: Data Collection Details 277Table 61: Research Output To Date and Forecasted 286Table 62: Summary Results: Outcomes per Objectives 290Table 63: Changes Made to Process Model Version D3 from Version D2 295
xi
R eproduced with perm ission of the copyright owner. Further reproduction prohibited without perm ission.
List of Figures
Figure 1: Models for Performance Measurement 45Figure 2: Steps to Successful Implementation of a Sponsorship 60Figure 3: Framework of Agency Theory Variables 87Figure 4: The Sponsorship Relationship 100Figure 5: Agency Theory adapted to the Sponsorship Relationship 103Figure 6: Draft Process Model of Sponsorship Evaluation: Process model D1 109Figure 7: Defining Metrics and Methods 119Figure 8: Frequency of Sponsor-Sponsee Contact 132Figure 9: Histogram of Frequency of Intermediary Involvement 138Figure 10: Draft Process Model VERSION D2 158Figure 11: FI Market Share (Alberta Only) 162Figure 12: Process Model of Sponsorship Evaluation: Process Model D3 298
xii
R eproduced with perm ission of the copyright owner. Further reproduction prohibited without perm ission.
List of Appendices
AppendixJFootnote: Summary of Evaluation Application 351
Appendix A: List of Sponsorship Objectives 355Appendix B: Script for Expert Interviews 357Appendix C: Online, Pre-Event Survey 359Appendix D: In-Branch questionnaire 361Appendix E: Hospitality Suite Survey 366Appendix F: Interview: Hospitality Hostess/Host - Template 368Appendix G: Mass-market Questionnaire 369Appendix H: Post-event Employee Interview Template 373Appendix I: Internal Data Request, Kanatek Staff 374Appendix J: Kanatek Staff Survey 376Appendix K: Expedition Member Survey 378Appendix L: Current Sponsorship Industry Trends 380Appendix M: Expert Interviewee Description of own Evaluation Model 381
xiii
R eproduced with perm ission of the copyright owner. Further reproduction prohibited without perm ission.
1.0 INTRODUCTION
1.1 Purpose and Relevance
A sponsorship occurs when a “corporation [or other investor] creates a link with
an outside issue or event, hoping to influence the audience by the connection” (Rifon,
Choi, Trimble, & Li, 2004, p. 30). This ‘link’ or ‘association’ with a specific property
(known as the ‘sponsee’ as a way to consider all forms of properties from athletes to
events to clubs to facilities) is the key to differentiating sponsorship from other
promotional strategies. It enables the investor (known as the ‘sponsor’) not only to
receive the related promotional benefits (television exposure, print exposure, branding
opportunity, etc.), but also to be associated, in the minds of consumers, with the sponsee.
For example, Irwin, Lachowetz, Cornwell and Clark (2003), in their survey of 500
spectators at the 2000 FedEx St. Jude Classic Golf Tournament, found evidence which
suggests that spectator response to the sponsor (FedEx) was influenced positively by their
affinity to the cause which the tournament benefits - the St. Jude’s Children’s Research
Hospital. In fact, the association between a sponsor and a sponsee has proven to be
longer-lasting than the sponsorship itself, as it carries on even when the sponsorship
relationship is terminated (Wright, 1988). For example, the long-running sponsorship
between Gatorade and the Hawaii Ironman Triathlon has now ended, yet the benefits for
both parties continue as consumers continue to associate the Hawaii Ironman Triathlon
and Gatorade. Akin to other promotional strategies, sponsorship also enables a sponsor to
efficiently reach its target market (Rodgers, 2003; Pham & Johar, 2001).
R eproduced with perm ission of the copyright owner. Further reproduction prohibited without perm ission.

In a typical sponsorship transaction, the sponsor provides cash and/or in-kind1
product/service to a sponsee in return for promotional opportunities and the ability to
leverage the association. The following two examples of Ottawa-based sponsorships
illustrate this relationship. First, the 2006 ING-National Capital Marathon was a
sponsorship where ING bank, as sponsor, provides cash to the National Capital Marathon
event, the sponsee, in return for promotional value. Second, Scotiabank Place is a
sponsorship relationship where Scotiabank has invested significant financial resources in
order to be the title sponsor of the arena facility, the sponsee, and the exposure it
provides.
International sporting goods conglomerate Adidas’ sponsorship of the 2004
European Football Championship provides a good example of a large international
sponsorship. This sponsorship involved the use of Adidas’ silver and black ‘Roteiro’ ball
in every game of the month long tournament. In demonstrating the significant potential of
a well planned sponsorship, the promotional value provided to Adidas in exchange for
cash led to the sale of over 6 million Roteiro balls in the weeks following the event
(Ewing, 2004). The use of data from the sales of Roteiro balls in the Adidas case
exemplifies a typical sponsorship evaluation measure. Current sponsorship evaluation
practice often involves the use o f ‘eyeballs2’, ‘footsteps3’ or sales projections. Such
evaluation measures lack specificity in terms of how objectives are addressed and,
typically, these projections overstate or include factors that do not indicate whether the
sponsor or the sponsee will achieve their objectives.
1 “In-kind” refers to the contribution of product or services in lieu of cash by a sponsor. For example, an athletic apparel company provides the volunteer T-shirts and draw prizes for a running event.2 The number of people who viewed the promotion, often measured by impressions.3 The number of people who frequented a store as a result of the promotions, often measured by coupon retrieval or questionnaires.
R eproduced with perm ission of the copyright owner. Further reproduction prohibited without perm ission.
In today’s competitive marketplace, sponsees compete for limited sponsorship
opportunities from a variety of sources in an environment where the demand from
sponsees for sponsorship resources is significantly greater than the supply of interested
sponsors (e.g., Nike, General Motors, Coca-Cola). Because of this competitive
environment, the sponsor is placed in a position of power when dealing with all but the
most valuable sponsees, such as the Olympic Games, Expo, Academy Awards, World
Cup of Soccer, Super Bowl, and well-known athletes like Tiger Woods. Although these
‘super-valuable’ or ‘mega’ sponsees are in the enviable business position of having
interested sponsors bidding for their property rights, the majority of sponsees seeking
resources struggle to attract, satisfy and maintain sponsors (Hoek & Gendall, 2002).
Sponsors generally seek promotional means through which they can enhance their brand
and build their networks, creating loyal customers and attracting new business as a
consequence.
The sponsor-sponsee relationship is a marketing relationship which can develop
in many ways and may be viewed from a variety of perspectives. No two sponsor-
sponsee relationships are the same: power structures vary, the size and scope of the
parties vary, the objectives differ, the stage of the relationship between the sponsor and
the sponsee changes, the length of the sponsorship varies, and in some instances the
relationship involves intermediaries. The literature establishes sponsorship as “a strategic
activity with the potential to generate a sustainable competitive advantage in the
marketplace” (Fahy, Farrelly, & Quester, 2004, p. 1013). This implies a divergence from
philanthropy and supports the role of sponsorship as part of marketing strategy where
sponsors gamer promotional value, and sponsees obtain resources.
R eproduced with perm ission of the copyright owner. Further reproduction prohibited without perm ission.
4
Sponsorship has developed from its roots in philanthropy where sponsors
provided resources to third parties based on altruism, to the current situation where
sponsorship is used by practitioners to achieve the goals of their respective organizations
(Dolphin, 2003). In today’s dynamic marketplace, sponsorship is viewed as an effective
and efficient promotional tool that is capable of cutting through the existing advertising
clutter (Rodgers, 2003; Pham & Johar, 2001) and achieving competitive advantage (Fahy,
Farrelly, & Quester, 2004). According to Cornwell and Maignan (1998), sponsorship
continues to be in the early stages of its development and Meenaghan (1998) notes that
sponsorship has received more attention from industry than it has received within
academic circles. This lack of academic attention has been described as an “empirical
chasm” (Westerbeek & Smith, 2002, p. 141).
Three general sponsorship related themes have developed in the sponsorship
literature. The first theme centers on the definition of sponsorship (e.g., Rifon, Choi,
Trimble & Li, 2004; Gardiner & Shuman, 1988; Sandler & Shani, 1993; Meenaghan,
1983). In addition to research focusing on sponsorship definition issues, this theme
includes research concerning the managerial aspects of sponsorship such as sponsors’
objectives, target audiences and media objectives (Cornwell & Maignan, 1998). A second
major theme might be termed ‘methods to obtain corporate donations’. Research in this
theme focuses on sponsorship’s complementary yet distinct position with respect to
philanthropy and cause-related-marketing (CRM) (e.g., Polonsky & Speed, 2001; Webb
& Mohr, 1998). Third, a significant stream of literature has evolved regarding the
implementation side of sponsorship. Topics within this stream focus on sponsor/sponsee
selection (Cornwell & Maignan, 1998), the link to corporate objectives (Gardiner &
R eproduced with perm ission of the copyright owner. Further reproduction prohibited without perm ission.
Shuman, 1988), the ability to measure the effectiveness of a sponsorship (e.g., Farrelly,
Quester, & Burton, 1997), the legal and ethical considerations in sponsorship (Cornwell
& Maignan, 1998), the magnitude of the association between the sponsor and the
property (e.g., Giannelloni, 1993), sponsorship’s influence on consumer attitudes (Parker,
1991), and the sponsor’s commitment to leveraging their investment (Gwinner & Eaton,
1999).
While considerable investigation into sponsorship has taken place during the past
15 years (e.g., Amis, 2003; Bennett, Henson & Zhang, 2002; Javalgi, Traylor, Gross, &
Lampman, 1994), practitioners and academic researchers have recognized that evaluation
remains one of the greatest challenges facing sponsorship development (Crompton,
2004a; Harvey, 2001; Bowey, 1998; Copeland, Frisby, & McCarville, 1996). While
several evaluation tools exist in the literature (Irwin & Asimakopoulos, 1992), they suffer
from a number of deficiencies including failure to assess return on investment (ROI4) and
reliance on simple measures that do not take the objectives of the sponsorship, such as
sales increases and brand equity, into account (Crompton, 2004a; Berrett & Slack, 1995;
Gardiner & Shumman, 1988).
As investment in sponsorship continues to increase (Kolah, 2003) so will the
incentives for both sponsors and sponsees to evaluate sponsorships. Sponsors will
question the resulting effects of an investment in the sponsee as a means of validating its
selection, compared to alternative promotional strategies and/or tactics it did not pursue.
Similarly, the sponsee will want to demonstrate its ability to both attract and maintain
investment by sponsors as well as to provide evaluation of the value provided to
4 ROI is a commonly used term in business to refer to the ratio of money earned or lost on an investment to the amount of money invested in that activity. It is typically measured as a percentage annualized return.
R eproduced with perm ission of the copyright owner. Further reproduction prohibited without perm ission.
sponsors. Clearly, evaluation is vital to a sponsorship’s continuing growth and is the
focus of this dissertation. Specifically, this research is focused on utilizing an Agency
Theory perspective to develop and test a process model for sponsorship evaluation.
Agency Theory, where the sponsor-sponsee relationship is viewed as a principal-
agent relationship and where the agent acts on behalf of the interests of the principal
(Bahli & Rivard, 2003), is adopted as the theoretical foundation for the dissertation. In
this context, Agency Theory provides a way to view cooperative effort where one entity
(the principal) engages another (the agent) to act on their behalf; where the sponsee as
agent is seen as offering a service to the sponsor as principal. Given that “Agency Theory
provides a unique, realistic, and empirically testable perspective on problems of
cooperative effort” (Eisenhardt, 1989, p. 72), and that agency relationships have been
shown to pervade marketing (Bergen, Dutta, & Walker, 1992), the application of an
agency perspective on the sponsor-sponsee relationship, particularly with respect to the
evaluation of its success, may be useful.
This dissertation focuses on designing, developing and testing a process model
that could be used for the evaluation of sponsorship in a variety of settings. The author
could not uncover a similar approach in the available literature, suggesting that no such
model or approach currently exists. This process model was developed by reviewing the
current literature on sponsorship evaluation and evaluation in general. This first phase of
development is outlined in a preliminary model (Version Dl) developed from a review of
the literature and presented in Chapter 4.3.7.1.
A number of knowledge gaps concerning sponsorship evaluation were identified
in the review of the literature. These include the limited research and understanding of (i)
R eproduced with perm ission of the copyright owner. Further reproduction prohibited without perm ission.
the sponsor-sponsee relationship, (ii) current evaluation practices, (iii) barriers to
evaluation, and (iv) when and how evaluation occurs. Therefore, the second phase of the
dissertation research involved in-depth qualitative interviews with 14 experts. The
purpose of these interviews was to improve understanding of sponsorship, focusing on
areas where gaps in the literature are most prevalent. The preliminary sponsorship
evaluation process model was then revised on the basis of knowledge gained from these
expert interviews, and the revised model (Version D2) is presented in Chapter 6.1.6.
The third phase of the research involved the implementation of the process model
in two sponsorship evaluation case studies. In this phase of the research, the process
outlined in the model was applied in evaluating both sponsorships. After applying the
process model in these two sponsorship case studies, it was once again revised and
Version D3 is presented in Chapter 6.2.3.
1.2 Outline o f Dissertation
This dissertation is organized into seven chapters. The current chapter introduces
the concept of sponsorship and outlines its importance. This chapter also describes the
purpose, objectives and structure of the document. The second chapter describes
sponsorship in detail. First, it includes its definition, descriptions of the important players
in the sponsorship relationship, and its distinction from philanthropy and other forms of
corporate donations. Second, the varying views around the position of sponsorship in
marketing theory are presented. Third, the sponsorship literature is reviewed briefly. The
third chapter focuses on sponsorship evaluation and includes a review of general
evaluation theory, a review of literature on sponsorship implementation and evaluation,
R eproduced with perm ission of the copyright owner. Further reproduction prohibited without perm ission.
and an assessment of current practice. The fourth chapter models the sponsor-sponsee
relationship as an occurrence of a principal-agent relationship. This process involves,
first, introducing Agency Theory as the framework by which to view sponsorship;
second, reviewing the literature on Agency Theory; and, finally, viewing sponsorship
from an Agency Theory perspective. The fifth chapter outlines the preliminary
sponsorship evaluation process model, and then describes the research methodology
which details the two-phase research protocol. The sixth chapter presents the results of
both phases of the research, as well as revisions to the sponsorship evaluation process
model, while the seventh chapter discusses the results, limitations and suggestions for
future research.
1.3 Contribution o f Dissertation: Objectives
Given (i) the increasing use of sponsorship, (ii) the calls for improved sponsorship
evaluation in the literature, (iii) the demand for effective evaluation tools by practitioners
of sponsorship, (iv) the limited available literature on sponsorship evaluation, and (v) the
proprietary nature of evaluation methodologies in practice, a number of steps were
undertaken to provide the foundations necessary to build the sponsorship evaluation
model. These steps comprise an iterative process of developing the initial process model
from the literature, gathering needed information from sponsorship experts and revising
the model, applying the model in two sponsorship cases, and once again revising the
model. Specifically, these steps address the major objective of this dissertation as
described below.
R eproduced with perm ission of the copyright owner. Further reproduction prohibited without perm ission.
Major Dissertation Objective: To propose and test a sponsorship evaluation
process model. A preliminary model is developed based on existing literature.
Data on existing sponsorship evaluation practices were gathered from interviews
with sponsorship experts, and the model was revised in light of this enhanced
understanding. The model was then utilized/put into practice in order to evaluate
two different sponsorships. Based on the knowledge and experience gained
through the implementation of the model, the process model is revised once again
and offered as a model to be used and adapted by others in evaluating
sponsorships.
To achieve this objective, four important sub-objectives must also be addressed as
follows:
1. Dissertation Sub-Objective #1: To achieve a deeper understanding of the sponsor-
sponsee relationship. Typical and common objectives of the sponsor as principal
and sponsee as agent must be identified and understood. Further, an
understanding of the inner workings of the sponsor-sponsee relationship, both the
formal contract (explicit) and the informal understandings (implicit), must be
developed and enhanced.
2. Dissertation Sub-Objective #2: To achieve a deeper understanding of current
evaluation practices. Without a clear understanding of what practitioners are
currently doing to evaluate sponsorships, it is very difficult to develop a relevant
and legitimate process model.
R eproduced with perm ission of the copyright owner. Further reproduction prohibited without perm ission.
3. Dissertation Sub-Objective #3: To develop an understanding of the perceptions of
barriers, benefits, and fears regarding evaluation in order to allow for effective
evaluation.
4. Dissertation Sub-Objective #4: To develop knowledge about whether and when
evaluation occurs in practice in sponsorship. In order to evaluate sponsorships,
measurement metrics for each sponsor/sponsee objective must be developed with
knowledge of the timing and depth of analysis that occurs in practice.
R eproduced with perm ission of the copyright owner. Further reproduction prohibited without perm ission.
11
2.0 SPONSORSHIP
The purpose of this chapter is to introduce and describe the promotional activity
known as sponsorship. In doing so, it provides the necessary understanding around the
concept to allow for the research that follows regarding the evaluation of sponsorship.
Included within the chapter is content on the historical development of sponsorship, a
review of its growth, its definition and the definitions of its key variables (e.g. sponsor,
sponsee, intermediary), and the key concepts of sponsorship (e.g. involvement,
leveraging, exclusivity, mega-sponsees, and image transfer). This content led to the
identification of important issues in the related literatures, including the absence of a
consensus definition, the conflicting views on sponsorship’s place in marketing theory,
and the limited understanding of the development of sponsorship relationships. In turn,
the chapter also includes sections devoted to clarifying these important issues, including
(i) constructing a proposed working definition of sponsorship, (ii) articulating the
common sponsee scenarios, (iii) reviewing the process of establishing a sponsorship
relationship, and (iv) presenting the literature related to sponsorship’s place in marketing
theory.
2.1 Introducing Sponsorship
A sponsor5 (e.g., Coke, Jim’s Hardware Store, the Government of Ontario, and
Eric Sprott) is an investor who invests resources in a sponsee and in return seeks
promotional value and other objectives from their association with that sponsee. The
sponsee (e.g., Olympic Games, Michael Jordan, the Tulip Festival, a fundraising dinner,
5 In most cases, the sponsor is a corporation, however a sponsor can also be a charity, a not-for-profit organization, a partnership or an individual.
R eproduced with perm ission of the copyright owner. Further reproduction prohibited without perm ission.
Winterlude) is the property which receives resources and seeks to achieve their own
objectives from the association. Affiliated entities are intermediaries who support the
sponsor-sponsee relationship, such as a benefiting charity, a sponsorship sales agent, an
event manager, or a facility provider.
Sponsorship is attractive to these stakeholders for several reasons. First, faced
with the challenge of a cluttered marketplace (Arthur, Dolan, & Cole, 1998), it is no
longer sufficient for an organization to promote through advertising alone. Sponsorship
may provide an efficient way to differentiate a company from its competitors (Fahy,
Farrelly & Quester, 2004; Amis, Slack & Berrett, 1999). Second, anecdotal evidence
concerning the attractiveness of sponsorship relative to other promotional tools is
supported by sponsors who have bolstered their initial sponsorship investment with
additional funds to leverage that investment (Berrett & Slack, 2001). It is the ability to
leverage a sponsorship extensively as part of an integrated marketing communications
mix that makes it more attractive than other promotional tools such as advertising and
publicity (Cornwell, Pruitt, & Clark, 2005; Belch & Belch, 2001; Shimp, 1997; Cornwell,
1995). Leveraging, used in this context, refers to strategies that the sponsor or sponsee
funds in addition to what was outlined in the contract and then implements in order to
increase the effectiveness of the sponsorship. These techniques are varied and include
such things as the title sponsor of a televised event, and/or developing commercials for
that event and paying for their diffusion leading up to, during, and following the event
(Nicholls, Roslow & Dublish, 1999). Reebok’s recent decision to increase its annual
budget to leverage its sponsorship investments to US$12.6 million (Kolah, 2003)
emphasizes the importance of leveraging.
R eproduced with perm ission of the copyright owner. Further reproduction prohibited without perm ission.
13
2.1.1 Origin o f Sponsorship
There is extensive debate among researchers over the exact origins of
sponsorship. It has been linked to the banning of cigarette advertisements in Britain in
1965 and the subsequent interest of tobacco companies in promoting themselves and their
products through association with televised sporting events (Mason, 1999). Arthur, Scott,
Woods and Booker (1998) claim that sponsorship has been around for thousands of years
since the gladiator days of ancient Rome. Cornwell, Pruitt and Clark (2005) trace its
formal beginnings to the 1984 Olympic Summer Games. Still, others give credit to the
late Mark McCormack, the legendary founder of the sport marketing firm IMG.6
McCormack’s vision that athletes could secure sponsorship and endorsement deals led
him to convince legendary golfer Arnold Palmer to allow him to manage his affairs
(Kolah, 2003). Wilkinson (1993) believes that the first true use of sponsorship was in the
1960s when corporations began to seek a return on their donations to sport and other
social service associations. These were known as “Philanthropic Sponsorships”
(Wilkinson, 1993). Media sponsorship (product mentions on radio programming), a
precursor to sponsorship as we know it today, was first practiced during the 1930’s in the
United States by industry giants Coca-Cola and General Foods (Bloxam, 1998). While
these views are divergent, most authors suggest that modem sponsorship has been around
for at least the last 40-50 years.
It is widely agreed that sponsorship has moved from its roots in philanthropy to a
promotional activity that has mutual benefits for both the sponsor and the sponsee
6 IMG is one of the world’s largest and most successful sport marketing firms. Headquartered in Cleveland, USA the firm has 70 offices in 30 countries, including one in Toronto. For more information see www.imgworld.com.
R eproduced with perm ission of the copyright owner. Further reproduction prohibited without perm ission.

through a relationship where their association is key in the resulting promotional strategy
(Rifon, Choi, Trimble & Li, 2004; Mason, 1999; Mack, 1999; Arthur, Scott, Woods &
Booker, 1998; Scott, 1998; Hoffman, 1998; Thwaites & Carruthers, 1998; Mullen, 1997;
Wilson, 1997; Howard & Crompton, 1995; Smith, 1994; Collins, 1994; Kuzma &
Shanklin, 1994; Irwin, 1993; Shaw & Post, 1993; Sandler & Shani, 1993; Wilkinson,
1993; Woods, 1993; Witcher, Craigen, Culligan & Harvey, 1991; Abratt & Grobler,
1989; Sleight, 1989; Armstrong, 1988; Gross, Traylor & Shuman, 1987). Others are less
convinced of sponsorship’s evolution. For example, Meenaghan (1991a) dubbed
sponsorship the “Chairman’s Choice Syndrome,” suggesting that sponsorship
development was often based on the CEO or President of a given firm supporting his or
her favourite sport so that he/she and his/her colleagues could sit in the crowd and watch.
However, the prevalent view today is that sponsorship is now distinct from philanthropy,
and is utilized as a promotional strategy tied to an organization’s marketing
communications activities (Dolphin, 2003; Cornwell and Maignan, 1998; Meenaghan,
1998; Brooks, 1990).
2.1.2 Defining Sponsorship
Sponsorship is not easily defined. A review of the literature reveals that
definitions of sponsorship - although rarely identical - often contain the same key
elements (Olkkonen, 2001). These key elements include the mutually beneficial exchange
of sponsor resources (cash or in-kind product/services) in return for promotional value,
and - most importantly - the association with the sponsee. The associations made
between sponsor and sponsee can influence consumer perceptions of both (Brown &
R eproduced with perm ission of the copyright owner. Further reproduction prohibited without perm ission.
Dacin, 1997; Aaker, 1996). Each sponsorship relationship has its own distinct personality
and a unique transfer of image values to the sponsor leads to the positive rub-off of image
from the sponsee to the sponsor, or the halo-effect of the association (Meenaghan, 1983).
The modem term for the halo-effect is congruency (Meenaghan, 2001) where it is the
consumer’s perception7 of the congruency between the sponsor, the sponsee and the
association that is important. The fact that the sponsor receives the right to promote the
association (the sponsee also has this right) is either stated or implied in most definitions
of sponsorship (e.g., Dean, 1999; d’Astous & Bitz, 1995).
The first widely accepted definition of sponsorship (Meenaghan, 1983) still
included the concept of philanthropy, while more recent definitions (Polonsky & Speed,
2001; Cornwell & Maignan, 1998; Sandler and Shani, 1993; Otker & Hayes, 1987) do
not include philanthropy in their definitions, indicating sponsorship’s evolution into a
communications strategy/tactic. Gardiner and Shuman (1988) describe sponsorship as a
form of promotion, but indicate that it differs from advertising in that the medium and
creative messages are not as tightly controlled by the sponsor as they would be by an
advertiser. Interestingly, this definition focused on differentiating sponsorship from
advertising, which was a major challenge for the field in the mid-1980’s. The importance
of the ‘association’ was also common in sponsorship definitions around this time
(Sandler & Shani, 1989, p. 12):
[Sponsorship is] the provision of resources (e.g., money, people, equipment) by an organization directly to an event or activity in exchange for a direct association to the event or activity. The providing organization can then use this direct association to achieve either their corporate, marketing or media objectives.
7 Consumer’s perception of congruence has been shown to be determined by their prior knowledge of the sponsor and the sponsee, and how logically they view the connection between the two (Meenaghan, 2001; Jagre, Watson & Watson, 2001).
R eproduced with perm ission of the copyright owner. Further reproduction prohibited without perm ission.
16
Integral to this definition as well as others (Sandler and Shani, 1993; Meenaghan, 1991a;
Sleight, 1989) is the implied relationship between the sponsor and sponsee, and that both
parties expect to benefit from the sponsorship. Similarly, McCarville and Copeland
(1994, p. 103) positioned sponsorship as a promotional strategy that “involves an
exchange of resources with an independent partner in hopes of gaining a corresponding
return for the sponsor”. Ukman’s (1995, p. 2) definition emphasizes the fact that
sponsorship can be paid in cash or via in-kind product, and introduces the notion of
leveraging: "[Sponsorship is] a cash and/or in-kind fee paid to a property...in return for
access to the exploitable commercial potential associated with that property."
Newer definitions of sponsorship focus primarily on the relationship aspects of
sponsorship and leveraging. For example, Cornwell and Maignan (1998, p. 12) provide
this view on sponsorship:
On the basis of the definitions found in the literature, we propose that sponsorship involves two main activities: (1) an exchange between a sponsor and a sponsee whereby the latter receives a fee and the former obtains the right to associate itself with the activity sponsored, and (2) the marketing of the association by the sponsor. Both activities are necessary if the sponsorship fee is to be a meaningful investment.
Specific to the sport industry, Shank’s (1999) definition moves emphasis away from the
concept of the exchange towards taking an investment perspective on sponsorship (i.e., a
sponsor-focused definition). Further, Shank’s definition emphasizes the expansion of the
definition of the sponsee beyond an event or activity to include sports properties such as
athletes, leagues, and events.
Recent publications on sponsorship have moved away from re-defining
sponsorship to accepting past definitions. Cornwell, Pruitt and Clark (2005) adopt the
Reproduced with permission of the copyright owner. Further reproduction prohibited without permission.
definition of sponsorship-linked marketing as “the orchestration and implementation of
marketing activities for the purpose of building and communicating an association to a
sponsorship” (Cornwell, 1995, p. 13) while Crompton (2004a, p. 268) defines
sponsorship as an example of exchange theory where “(i) two or more parties exchange
resources, and (ii) the resources offered by each party must be equally valued by the
reciprocating parties”. Further, Jalleh, Donovan, Giles-Corti, and Holman (2002) defined
sponsorship in the context of a Hierarchical Communications Model, and Madrigal
(2001) reverts to Meenaghan’s definition of sponsorship (1991a).
Intermediaries are entities outside of the sponsor and sponsee (i.e., third parties)
who exert influence on the relationship. They may include player agents, contractors,
event managers, media organizations, security groups and municipalities. From their
point of view, a formal sponsor-sponsee relationship is a means by which to achieve their
specific goals, such as profit, promotion, networking, etc. In this regard, an agent
representing the sponsor or the sponsee, the manager of the facility in which the event
will occur, or the sub-contractor carrying out some task (e.g., advertising design, signage,
etc.) will receive their due share and potentially benefit from the association. For
example, TrojanOne, a Toronto-based sport marketing firm, acts as Coca-Cola’s agent in
determining how to best allocate their promotional dollars for certain marketing
objectives.
2.1.2.1 Sponsorship Involvement
Involvement is “the personal, social, and economic significance of the purchase to
the consumer” (Crane, Kerin, Hartley, Berkowitz & Rudelius, 2006, p. 206). Anne and
Reproduced with permission of the copyright owner. Further reproduction prohibited without permission.

Cheron (1991) find that consumers are more likely to recall a sponsor (i) if they are more
involved with the sponsee, (ii) if they have prior knowledge about the sponsor, and (iii) if
they have interest in the sponsee. D’Astous and Bitz (1995) and Pham (1992) narrow the
list to two key points: (i) an exciting sponsee and (ii) achieving a high level of consumer
involvement in the sponsorship. In either case, the high level of involvement leads to an
increase in information-processing by the consumer and more interest in the sponsorship.
2.1.2.2 Leveraging
Leveraging activities can be defined as any marketing or promotional tactic
implemented with the goal of promoting a sponsee or a sponsor-sponsee association
(Cornwell, Pruitt & Van Ness, 2001; Quester & Thompson, 2001; Crimmins & Horn,
1996). A number of authors (Otker, 1988, Abratt & Grobler, 1989, Meenaghan, 1991a;
1991b; 1998; Sandler & Shani, 1993, 1998) prescribe that it is good practice for sponsors
to leverage their sponsorship by investing additional resources in complementary
promotional activities that strengthen the association. The argument here is that the initial
investment only buys the rights to an association but there is still a need to exploit this
further by investing additional sums. The association can then be promoted and leveraged
beneficially using a variety of marketing communications elements (e.g., Ludwig &
Karabetsos, 1999; Javalgi, Traylor, Gross, & Lampman, 1994; Meenaghan, 1991b).
Examples of leveraging initiatives range from an advertising campaign launched as the
sponsored event approaches, to a PR campaign that increases awareness of the
sponsorship, to linking a sought-after sponsee image with an integrated marketing mix
(Irwin & Sutton, 1994; Hoek, Gendall & Sanders, 1993; Abratt, Clayton & Pitt, 1987).
Reproduced with permission of the copyright owner. Further reproduction prohibited without permission.
Sponsors and occasionally sponsees leverage to (i) achieve competitive advantage
(Fahy, Farrelly & Quester, 2004), (ii) generate revenue (Flynn, 1993), and (iii) impact
consumer-oriented objectives, such as increasing brand awareness, brand image, and
purchase intentions (Meenaghan, 2001; Lardinoit & Quester, 2001; Quester &
Thompson, 1999; Ludwig & Karabetsos, 1999; Cunningham & Taylor; 1995; Gardiner &
Shuman, 1988; Meenaghan, 1991a; Ukman, 1995).
The literature recommends spending at least the same amount as the sponsorship
investment itself, and ideally more, in leveraging (Meenaghan, 2001; Quester &
Thompson, 2001), with authors suggesting that the sums required for successful
leveraging may be up to five times the initial expenditure (Seguin, Teed & O’Reilly,
2005; Shanklin & Kuzma, 1992; Witcher, Craigen, Culligan & Harvey, 1991; Abratt &o
Grobler, 1989; Eisenhart, 1988). For example, a number of the sponsors of Euro 1996
spent in excess of a 3:1 ratio on leveraging their sponsorships (Lardinoit & Quester,
2001). In practice, however, the amount spent on leveraging varies greatly. For example,
in a study of Canadian corporate sponsors, Thwaites, Aguilar-Manjarrez and Kidd (1998)
found that only 63 percent of the sponsors studied leveraged their investment. Thus, 37%
did not invest any resources beyond the initial sponsorship fee.
2.1.2.3 Sponsorship and Exclusivity
The concept of exclusivity refers to a sponsor being given the right to be the only
sponsor of a given event in their business category (e.g. automobile, airline, etc.). The
onus often lies with the sponsee to protect the exclusivity of its sponsors from ambush
8 Euro 1996 refers to the 1996 European Football Championships. The event is held every four years and is one of the largest events in Europe, if not the world.
Reproduced with permission of the copyright owner. Further reproduction prohibited without permission.
2 0
(Crow & Hoek, 2003; McCarthy & Lyberger, 2001). Exclusivity is often given credit for
creating the high level of interest in sponsoring the Olympic Movement in the mid-
1980’s (Pound, 1996). As a result of these very large sponsorship investments,
exclusivity has become a vital aspect of sponsorship. Sponsors now demand to have their
investments protected against ambush marketing, which is where organizations, typically
the competitors of official sponsors, seek the benefits of official association with a mega-
sponsee, but are unwilling to pay for such an association (Crompton, 2004b; Lyberger &
McCarthy, 2002; McCarthy & Lyberger, 2001; Townley, Harrington & Couchman,
1998).
In practice, exclusivity, or category exclusivity as it is now often termed, is
becoming increasingly important. Studies of consumer opinion of ambush (Seguin,
Lyberger, O’Reilly & McCarthy, 2005; Shani & Sandler, 1998) demonstrate empirically
that consumers find ambush marketing to be unacceptable and are confused by it. These
authors note that exclusivity is the key to success in sponsorship as sponsees must
determine ways to protect the exclusive rights of sponsors, particularly in high value
sponsorships (e.g. Super Bowl, Olympic Games), but with growing importance in smaller
properties (Shank, 2005).
2.1.2.4 Image Transfer
An important concept in understanding how sponsorship works and
differentiating sponsorship from other promotional strategies is the idea of image transfer
(Walliser, 2003). Gwinner and Eaton (1999) suggest that the use of image transfer is the
most effective way to leverage a sponsorship. Image transfer in the sponsorship literature
Reproduced with permission of the copyright owner. Further reproduction prohibited without permission.
is defined based on the fact that, in any given sponsorship, both the sponsor and the
sponsee bring their own specific image values (Meenaghan & Shipley, 1999), which in
turn can be transferred to a sponsor, a sponsee or a co-sponsor (Grimes & Meenaghan,
1998). It is important to note that this transfer takes place in the minds of the consumers
who transfer, through the sponsor-sponsee association, some image value from one party
to another (Gierl & Kirchner, 1999; Giannelloni, 1993). There is literature that researches
the image effects of sponsorship and provides empirical support that sponsorship
contributes to the modification of certain image dimensions (Stipp & Schiavone, 1996).
Various authors (Gwinner & Swanson, 2003; Jagre, Watson & Watson, 2001;
Johar & Pham, 1999; Gwinner & Eaton, 1999; Grimes & Meenaghan, 1998; Gwinner,
1997; Keller, 1993; McDonald, 1991) have looked specifically at the transfer of image
from sponsee to sponsor. A review of this literature reveals seven key propositions
concerning image transfer. First, in the case of a well-known and long-established
sponsee and a less established sponsor, the chance of image transfer is less likely as
consumers are more likely to relate to the well-known sponsee, and not to the association
or to the sponsor. This has obvious implications in sponsor selection. Second, in the case
of sport sponsees, consumers (spectators) are likely to be very focused on the event at
hand suggesting that the likelihood of image transfer is reduced. Third, in the case of a
sponsor promoting a low involvement product, Gwinner (1997) suggests that a sponsee
with a positive brand image will be a “potent force” in building the image (brand) of the
sponsor. Fourth, in the case of a sponsor and sponsee with similar images, the transfer of
image and ability to leverage the association effectively is enhanced (Gwinner Sc Eaton,
1999). This further supports the importance of the sponsee selection stage of a
Reproduced with permission of the copyright owner. Further reproduction prohibited without permission.
2 2
sponsorship relationship. Fifth, a sponsor may be able to better leverage its sponsorship if
it sponsors a number of sponsees who possess consistent images (Gwinner, 1997). This
demonstrates the importance of a sponsorship portfolio where the overall effectiveness of
all sponsorships could be hindered by a single, inconsistent one. Sixth, the transfer of
image depends on the exclusivity of the agreement between the sponsor and the sponsee.
That is, the ability of the sponsor and the sponsee to reduce the frequency of ambush may
lead to improved image transfer. Finally, the transfer of the image depends on the level of
involvement the sponsor has with the sponsee. The more involved the sponsor becomes
in the relationship with the sponsee, the stronger the perceived relationship becomes and,
in turn, the greater the image transfer.
2.1.2.5 Sponsee Scenarios
We know that the demand from sponsees for sponsorship resources is
significantly greater than the supply of interested sponsors (Berrett & Slack, 2001). Only
those few sponsees who are major, global properties with significant media interest and
high levels of reach are in a strong business position vis-a-vis potential sponsors. These
sponsees are classified here as mega-sponsees. The remainder (and vast majority) of
sponsees are termed ‘typical’ as they struggle to achieve cash and/or in-kind resources
from sponsors. When considering sponsorship for evaluation or other strategic purposes,
the acknowledgment of which scenario is being dealt with is very important (Witcher,
Craigen, Culligan & Harvey, 1991).
Mega-sponsees, such as the Olympic Games, have been defined as “short-term
events with long-term consequences for the cities that stage them” (Carlsen & Taylor,
Reproduced with permission of the copyright owner. Further reproduction prohibited without permission.
2003, p. 19). It is widely believed that these events provide significant tourist flow to a
region, in turn, providing jobs, economic impact, new urban infrastructure, and income.
(Carlsen & Taylor, 2003; Dimanche, 1996; Hughes, 1993) Further, these mega-sponsees
can be characterized as news events (Getz, 2002; 1998) that are viewed positively by
sponsors interested in mass-market promotions, and who, in turn, compete for official
sponsor status. In practice, the mega-sponsee has many interested sponsors vying for the
sponsorship rights, which leads to incredible sums of money being spent on the rights.
Given the reach of a mega-sponsee, one of the most important reasons that a large
sponsor seeks to enter into such a sponsorship agreement is to increase brand awareness
and alter its image or that of one of its brands (Amis, 2003; Amis, Slack & Berrett, 1999).
An example is the Olympic Games and the International Olympic Committee’s well
known TOP program where sponsors in twelve major categories (non-alcoholic
beverages, information technology, innovative products and services, health care
products, film/photographics and imaging, computing equipment, life
insurance/annuities, retail food services, timing/scoring/venue results services,
audio/TV/video equipment, wireless communications equipment, and consumer payment
systems) compete for the valuable and far-reaching official sponsorships of the Olympic
Games. The value of these sponsorships is profound, as the fees for an Olympic TOP
sponsorship in the 2001-2004 quadrennial averaged US$65 million9.
Typical (smaller) sponsees, on the other hand, often lack the sophistication and
reach required to attract, satisfy and maintain sponsorship (Copeland, 1991). They have
also been defined by their lack of television coverage, which is known to be a very
9 In addition to these fees, TOP sponsors typically invest between US$50 million and US$250 million towards leveraging the sponsorship.
Reproduced with permission of the copyright owner. Further reproduction prohibited without permission.
2 4
important criterion for sponsors when selecting sponsees (Witcher, Craigen, Culligan &
Harvey, 1991; Abratt, Clayton & Pitt, 1987). Typical sponsees often carry out concurrent
complementary marketing activities to make themselves more attractive to sponsors,
since such activities will help create more appeal in specific targets markets where more
sponsors are interested in investing, which, in turn, will increase their ability to obtain
sponsorship and, in some cases, attract sponsors with whom they wish to be associated,
or even encourage premium rates for such sponsorships (Gwinner & Eaton, 1999). It is
also important to note that typical sponsees are often counting on revenue from
sponsorship to survive. Thus, for typical sponsees, revenue-generation takes priority over
image objectives. This is particularly true for cash-starved not-for-profit and charitable
foundations (Rifon, Choi, Trimble & Li, 2004; Bendapudi, Singh & Bendapudi, 1996).
2.1.2.6 Working Definition o f Sponsorship Adopted in this Dissertation
This dissertation adopts the Cornwell and Maignan 1998 definition of sponsorship
as it clearly articulates that sponsorship involves two activities: the exchange between
sponsor and sponsee, and the marketing of the association that results from the exchange.
Further, the Cornwell and Maignan definition (i) is based on an extensive global review
of international research on sponsorship, (ii) is relatively recent and (iii) is quoted
frequently in the literature (e.g. Ali, Cornwell, Nguyen, & Coote, 2006; Felt, 2003; Ruth
& Simonin, 2003). This conceptual definition is adapted in the context of the literature, as
the working definition of sponsorship for this dissertation which suggests that
operationally, a promotional endeavour is termed a sponsorship if the following 10
criteria are met:
Reproduced with permission of the copyright owner. Further reproduction prohibited without permission.

2 5
1. One party (the sponsor) invests resources in another party (the sponsee), where
a. the sponsee provides promotional value in return, and
b. the sponsor makes the investment in order to achieve image-based, brand-based
and/or media-based objectives.
2. In the relationship between the sponsor and the sponsee, the sponsee is seen as
providing a service to the sponsor.
3. Joint sponsor-sponsee activities are part of the sponsorship (i.e. an association exists).
4. Consumers (or members of the target market of the promotion) are exposed to three
specific entities: the sponsor’s brand, the sponsee’s brand and the sponsor-sponsee
association.
5. Consumers (or members of the target market of the promotion) are presented with a
partnership between the sponsor and the sponsee. The impact of the partnership on
consumers is expected to last longer than the sponsorship contract itself due to the
goodwill or emotional ties that consumers build over time.
6. The sponsor-sponsee association is exploited or leveraged by one or both parties.
7. The transfer of elements of the sponsee’s image to the sponsor is of interest to the
sponsor.
8. The exclusivity of the sponsorship is of interest to the sponsor and the sponsee.
9. Congruency (fit) between the sponsor and the sponsee is important to both parties.
10. The primary objectives of the sponsor are marketing based (i.e. non-philanthropic).
In many sponsorships, a number of other stakeholders and intermediaries are
involved in the relationship between the sponsor and the sponsee. These stakeholders
may include other sponsors, suppliers, supporting organizations, property management
Reproduced with permission of the copyright owner. Further reproduction prohibited without permission.

2 6
groups and player agents. All of these influence the relationship and need to be
considered in any related research. Table 1 below provides examples of parties who may
be involved in different sponsorship arrangements.
Table 1: Sponsorship Arrangements
Scenario ExampleSponsor-Sponsee Local bike store sponsors a local athleteSponsor-Agent-Sponsee Coke engages a sport marketing firm to use
sponsorship to achieve a promotional goalSponsor-Agent-Mega Sponsee The Super-Bowl hires a sponsorship consultant
to maximize their revenues from sponsorshipSponsor-Agent-Agent-Sponsee Both sponsor and sponsee have engaged agents
on their behalfSponsor-Agent-Agent-Mega Sponsee Both sponsor and sponsee have engaged agents
on their behalf; and the sponsor is a major property like the Olympic Games
2.1.3 The Process o f Establishing a Sponsorship
After crafting the working definition of sponsorship, the next step is to understand
the process of developing or establishing a sponsorship. The literature suggests that there
are several common stages in the process of establishing sponsorship arrangements
(Hoek & Gendall, 2002; Cornwell & Maignan, 1998). Attracting sponsorships is the act
of convincing an interested sponsor to enter into some sort of exchange transaction with
the sponsee (O’Hagan & Harvey, 2000). This may often take the form of a trial
relationship or an in-kind sponsorship arrangement. Once a sponsor has agreed to enter a
sponsorship arrangement/contract with a given sponsee - in other words, they have been
successfully attracted, the sponsee enters into the stage of attempting to satisfy the
sponsor (O’Hagan & Harvey, 2000). This stage is known to the practitioner as servicing
or activating and involves making sure all of the tenets of the sponsorship contract are
Reproduced with permission of the copyright owner. Further reproduction prohibited without permission.
met, and that all of the sponsor’s expectations are met, if not, exceeded. This would
include such things as meeting the contractual agreements in terms of the amount and
location of signage and television commercial slots, and the visibility or presence of the
sponsor at press conferences. The final phase of sustaining a long-term sponsorship
partnership is the maintenance phase. This involves negotiating with the sponsor to carry
on the sponsorship arrangement in the future; striving to build a healthy long-term
relationship, dedicating sponsee staff to servicing the sponsorship, demonstrating the
sponsee’s appeal over its competition, and undertaking the joint planning of co-
promotional opportunities (O’Hagan & Harvey, 2000).
From the point of view of a sponsor, both selecting and leveraging a sponsorship
requires specific tactics. In this respect, sponsors must carefully evaluate their
promotional options and, if sponsorship is selected as part of that portfolio, consider
which type of sponsee (industry, league, event, etc.) offers the greatest return. The
selection of the sponsee has become an important aspect of sponsorship (Walliser, 2003;
Thwaites & Carruthers, 1998). Once a partnership is contracted, the sponsor must then
plan to fully leverage the partnership to maximize the return on their investment. Seguin,
Teed and O’Reilly (2005) note a number of leveraging activities including (i) media
relations programs to enhance publicity around the sponsorship, (ii) television coverage
to promote the sponsorship, (iii) cross-promotions to build relationships with suppliers
and partners, (iv) public appearances by high-profile athletes or entertainment stars at
retail outlets or company functions, (v) related charitable ventures to associate a positive
social or community benefit with the sponsorship, and (vi) hospitality activities for key
partners, clients and suppliers.
Reproduced with permission of the copyright owner. Further reproduction prohibited without permission.
2 8
2.2 Sponsorship Industry10 Growth and Key Industry Segments
The use of sponsorship as a promotional tool has grown steadily over the past 25
years (Meenaghan, 1998). Grimes and Meenaghan (1998) argue that this growth is a
result of four main factors: (i) the cluttered marketplace, (ii) the onset of government
restrictions on tobacco and alcohol advertising, (iii) the increased popularity and
commercialism of sports and arts, and (iv) the increasing trend towards globalization,
where corporations are attracted to sponsees whose reach transcends borders and cultures.
Global investment has progressed from approximately US$500 million in 1982 (Kuzma
& Shanklin, 1994), to US$3 billion in 1989 (Boyle & Haynes, 2000), to US$11 billion in
1996 (Boyle & Haynes, 2000), to US$19.5 billion (Boyle & Haynes, 2000) in 1999, to
US$24.4 billion in 2002 (Kolah, 2003 n ), to US$28 billion in 2004 (IEG, 2004), and to an
estimated US$30.5 billion in 2006 (IEG, 2006). In terms of its contribution to
promotional spending, sponsorship has increased in importance from 2.5% of all
promotional expenditures in 1987 to an estimated 5.8% in 2001 (IEG, 2000), with Andref
and Nys (2002) suggesting that sponsorship will grow to represent 8.5% of all advertising
expenditures by 2010.
Sponsorship for the 2012 Olympic Games in London, England is reported to be
priced at around $50 million British pounds for a 6-year deal leading up to 2012 (Sport
Business News, 2006). The Royal Canadian Mint was announced as a second tier
sponsor of the 2010 Olympic Games in Vancouver with a $15 million (Canadian)
10 For a summary of important industry trends affecting sponsorship, please go to Appendix L.11 Kolah (2003) also noted that globally (i) 145 sponsorships had a value of US$10,000,000 or greater, (ii) the 50 largest sponsorships averaged 6.7 years in length, and (iii) soccer is the most common sponsee as well as the sponsee that receives the most sponsorship dollars (US$1.44 billion annually).
Reproduced with permission of the copyright owner. Further reproduction prohibited without permission.
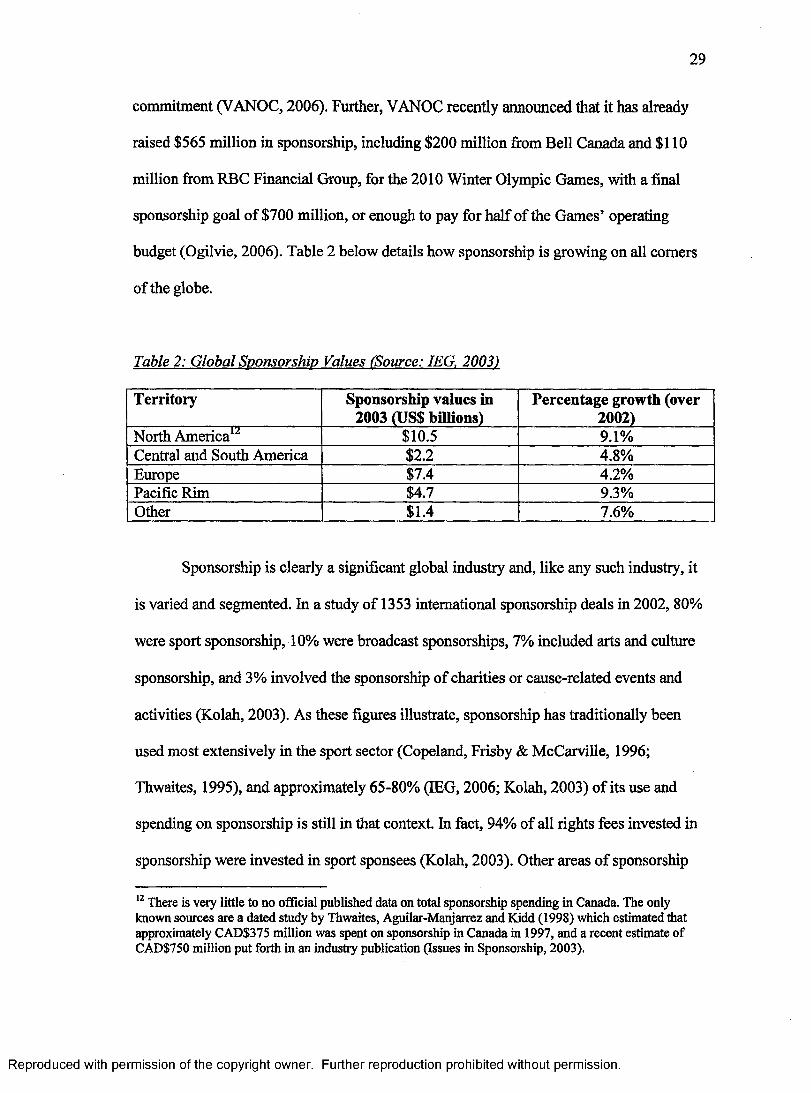
commitment (VANOC, 2006). Further, VANOC recently announced that it has already
raised $565 million in sponsorship, including $200 million from Bell Canada and $110
million from RBC Financial Group, for the 2010 Winter Olympic Games, with a final
sponsorship goal of $700 million, or enough to pay for half of the Games’ operating
budget (Ogilvie, 2006). Table 2 below details how sponsorship is growing on all comers
of the globe.
Table 2: Global Sponsorship Values (Source: IEG. 2003)
Territory Sponsorship values in 2003 (US$ billions)
Percentage growth (over 2002)
North America1̂ $10.5 9.1%Central and South America $2.2 4.8%Europe $7.4 4.2%Pacific Rim $4.7 9.3%Other $1.4 7.6%
Sponsorship is clearly a significant global industry and, like any such industry, it
is varied and segmented. In a study of 1353 international sponsorship deals in 2002,80%
were sport sponsorship, 10% were broadcast sponsorships, 7% included arts and culture
sponsorship, and 3% involved the sponsorship of charities or cause-related events and
activities (Kolah, 2003). As these figures illustrate, sponsorship has traditionally been
used most extensively in the sport sector (Copeland, Frisby & McCarville, 1996;
Thwaites, 1995), and approximately 65-80% (IEG, 2006; Kolah, 2003) of its use and
spending on sponsorship is still in that context. In fact, 94% of all rights fees invested in
sponsorship were invested in sport sponsees (Kolah, 2003). Other areas of sponsorship
12 There is very little to no official published data on total sponsorship spending in Canada. The only known sources are a dated study by Thwaites, Aguilar-Manjarrez and Kidd (1998) which estimated that approximately CAD$375 million was spent on sponsorship in Canada in 1997, and a recent estimate of CAD$750 million put forth in an industry publication (Issues in Sponsorship, 2003).
Reproduced with permission of the copyright owner. Further reproduction prohibited without permission.
3 0
application including the arts, the environment, universities, and social functions - all of
which are also very important - has been much smaller than in sport (Kolah, 2003;
Quester & Thompson, 2001; Witcher, Craigen, Culligan & Harvey, 1991). However, a
number of researchers have forecasted that the gap between sport sponsorship and arts
sponsorship will close over time as sport sponsees’ prices escalate and sport sponsorship
opportunities saturate (Quester & Thompson, 2001; Meerabeau, Gillet, Kennedy,
Adeoba, Byasss & Tabi, 1991).
Although it continues to lag behind sport in its share of the sponsorship market,
the industry known as ‘the arts’ is beginning to receive more attention in the literature,
and receives a significant amount of investment from sponsors each year. In 2002,7% of
all sponsorship deals representing 2% of global sponsorship investment were in the arts
(Kolah, 2003). Although much of the process is the same for an arts sponsorship as it is
for a sport sponsorship, the literature does identify a number of differences (Wolton,
1988). First, as opposed to sponsors of sport who work out of their marketing
departments, sponsors of arts are typically based in their public relations departments
(Quester & Thompson, 2001). Second, arts sponsors typically seek a very specific target
audience that can be reached only by events, while sport sponsorship typically relies
heavily on the media to reach mass market audiences (Sparks, 1997; Marshall & Cook,
1992; Abratt & Grobler, 1989). Finally, the literature demonstrates that arts sponsors
typically seek to pursue image rather than sales-related objectives from the association
(Quester & Thompson, 2001).
Another area that has received attention in the literature is sponsorship involving
celebrities. This is where the celebrity is a sponsee and the sponsor seeks to transfer the
Reproduced with permission of the copyright owner. Further reproduction prohibited without permission.
celebrity’s image to that of their product (McCracken, 1989). This has obvious
similarities to both sport sponsorship and arts sponsorship (i.e., high-profile athletes and
artists as sponsees). A celebrity is defined in a variety of ways, but it typically refers to an
individual who may be a sport star, movie star or politician whose name is well known
and whose image is well understood by some market (see Ferrand & Pages, 1996). Kahle
and Homer (1985) show that the more closely related the images of the celebrity and the
sponsor, the greater the effectiveness of the sponsorship. This finding is very similar to
what happens when consumers perceive a congruent fit between a sponsor and a high
profile sport or art sponsee (McDaniel, 1999). In all cases, it is well established that
consumers respond better to congruent sponsor-sponsee relationships (Cornwell, Roy &
Steinard, 2001; Gwinner & Eaton, 1999; Cornwell, 1995).
2.3 Sponsorship and Marketing Theory
There is consensus in contemporary literature that sponsorship fits as an element
of promotion strategy (Shannon, 1996; Cunningham & Taylor, 1996). However, there
remains considerable lack of agreement as to whether it fits as a distinct element of the
promotional mix or as a sub-tactic of advertising. While some authors consider
sponsorship as part of advertising (see Cornwall & Maignan, 1998); others position it as
different from advertising and as a promotional strategy unique in its application and
benefits (e.g., Amis, Slack & Berrett, 1999; Meenaghan, 1998; 1991b; Cornwell, 1995;
Hastings, 1984). For example, Thwaites (1995), Amis, Slack and Berrett (1994), Furlong
(1994), Meenaghan (1994), and Sleight (1989) argue that sponsorship fits quite naturally
alongside advertising, public relations, sales promotion, and personal selling as an
Reproduced with permission of the copyright owner. Further reproduction prohibited without permission.
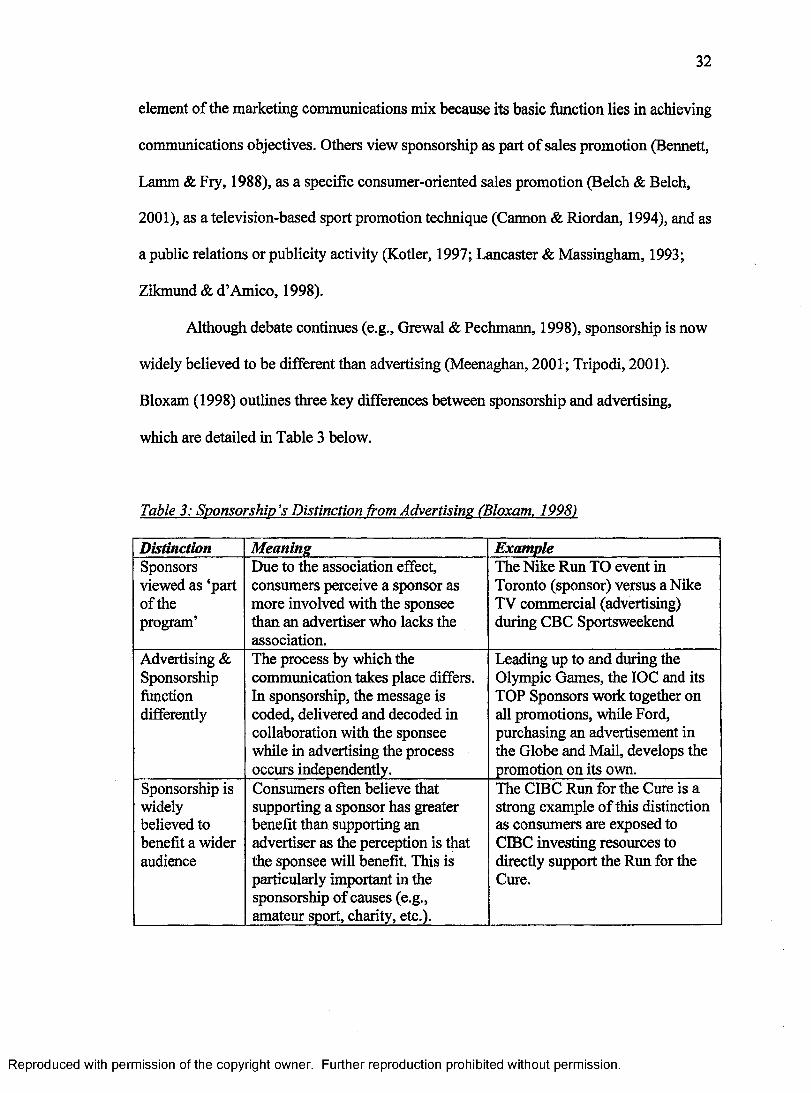
3 2
element of the marketing communications mix because its basic function lies in achieving
communications objectives. Others view sponsorship as part of sales promotion (Bennett,
Lamm & Fry, 1988), as a specific consumer-oriented sales promotion (Belch & Belch,
2001), as a television-based sport promotion technique (Cannon & Riordan, 1994), and as
a public relations or publicity activity (Kotler, 1997; Lancaster & Massingham, 1993;
Zikmund & d’Amico, 1998).
Although debate continues (e.g., Grewal & Pechmann, 1998), sponsorship is now
widely believed to be different than advertising (Meenaghan, 2001; Tripodi, 2001).
Bloxam (1998) outlines three key differences between sponsorship and advertising,
which are detailed in Table 3 below.
Table 3: Sponsorship’s Distinction from Advertising (Bloxam. 1998)
Distinction Meaning ExampleSponsors viewed as ‘part of the program’
Due to the association effect, consumers perceive a sponsor as more involved with the sponsee than an advertiser who lacks the association.
The Nike Run TO event in Toronto (sponsor) versus a Nike TV commercial (advertising) during CBC Sportsweekend
Advertising & Sponsorship function differently
The process by which the communication takes place differs. In sponsorship, the message is coded, delivered and decoded in collaboration with the sponsee while in advertising the process occurs independently.
Leading up to and during the Olympic Games, the IOC and its TOP Sponsors work together on all promotions, while Ford, purchasing an advertisement in the Globe and Mail, develops the promotion on its own.
Sponsorship is widely believed to benefit a wider audience
Consumers often believe that supporting a sponsor has greater benefit than supporting an advertiser as the perception is that the sponsee will benefit. This is particularly important in the sponsorship of causes (e.g., amateur sport, charity, etc.).
The CIBC Run for the Cure is a strong example of this distinction as consumers are exposed to CIBC investing resources to directly support the Run for the Cure.
Reproduced with permission of the copyright owner. Further reproduction prohibited without permission.
What differentiates sponsorship from advertising is the association between the two
parties (sponsor and sponsee) which enhances the relationship beyond a basic cash
purchase of promotional value (advertising). Often, in sport, charity or art sponsorships,
an emotional connection is key to this enhancement (Shank 2005; Meenaghan, 2001;
1999). Lyberger and McCarthy (2002) and Javalgi, Traylor, Gross and Lampman (1994)
note that sponsorship differs from advertising in that the medium and created messaging
are not as tightly controlled by the sponsor as they would be by an advertiser. Meenaghan
(1991b) suggests that ‘goodwill’ is the main differentiating factor between advertising
and sponsorship, since much higher levels of goodwill are created by consumers (often
fans in the sport setting) as a result of a sponsor’s involvement with an event
(Meenaghan, 1991b). Parker (1991) empirically supports this distinction by finding that
consumers who were subject to both sponsorship and advertising programs had a more
positive attitude toward sponsors than toward advertisers (Parker, 1991). In this regard,
the point of difference is that communications to consumers created by sponsorship are
non-verbal and non-argued in nature (Derbaix & Pham, 1991) implying that the process
of encouraging consumer change and action via sponsorship occurs peripherally (Petty &
Cacioppo, 1986).
An additional but very important difference between sponsorship and advertising
lies in how each works to persuade customers. Advertising exploits the construct of
emotion and sponsorship seeks to ‘connect’ with the emotion inherent in sport sponsee or
the arts sponsee or the charity sponsee (Meenaghan, 2001). Other authors describe
sponsorship as fundamentally different from advertising since it persuades consumers
indirectly (Crimmins & Horn, 1996). This is based on the association that exists and the
Reproduced with permission of the copyright owner. Further reproduction prohibited without permission.
fact that consumers are influenced by the sponsee, the association and the sponsor, not
just the sponsor. If a firm is seen to be supportive of a sponsee (team, charity, event,
athlete, etc.), the sponsor’s expectation is that the consumer - who is interested to some
extent in the sponsee - will view the sponsor positively provided that there is a good fit
between the image of the sponsor, the sponsee, and the association. Kover (2001)
differentiates sponsorship by describing how it offers an ‘interaction’ with consumers as
opposed to advertising which only ‘talks’ to them. This, in theory, allows sponsorship to
create a bond with consumers via the values they both share by association with the
sponsee of interest (Kover, 2001). For example, Coke’s sponsorship of the Olympic
Games allows for the transfer of attributes from the sponsee’s image (Olympic Games:
performance, international, etc.) to the sponsor’s product’s image via the promotion of
the association amongst the two.
A brief analysis of the objectives sought by advertising and sponsorship provides
a good view of the similarities and differences between the two promotional tools.
Consistent with advertising, sponsorship may, in some cases, be employed to enhance
public awareness of a sponsor or to improve or change a previously established image
(Cornwell, Roy & Steinard, 2001). Another similarity to advertising is that sponsorship
may seek to increase sales or increase media exposure (Cornwell, Roy & Steinard, 2001).
Conversely, Meenaghan and Shipley (1999) argue that a sponsorship can achieve more
diverse objectives than an advertisement, including the increased awareness towards
altering the image of a brand or the enhanced ability to improve business relationships
with customers. Cornwell, Roy and Steinard (2001) point out that there are two additional
objectives that demonstrate sponsorship’s difference from advertising: (a) achieving
Reproduced with permission of the copyright owner. Further reproduction prohibited without permission.
3 5
corporate hospitality and (b) advancing the personal agendas and interests of senior
executives, both of which are enabled by the fact that a sponsorship can be leveraged and,
thus, more readily allows for associated events and activities. Hoek, Gendall, Jeffcoat and
Orsman (1997) supported this distinction empirically by examining consumers' responses
to sponsorship and advertising and finding that, although neither had a significant impact
on behaviours (intent to purchase), that attitudes were more positively reinforced by
sponsorship.
Sponsorship as a source of competitive advantage for organizations is well
developed in the literature (Fahy, Farrelly & Quester, 2004; Amis, Slack & Berrett, 1999;
Hamel & Prahalad, 1994). The literature on competitive advantage shows that firms must
differentiate themselves from competitors on some asset or process and, to be sustainable,
this capability or competency gap must be enduring (Bharadwaj, Varadarajan & Fahy,
1993). Any advantage gained, of course, is not enduring or sustained if it can be easily
imitated or otherwise replicated (Peteraf, 1993; Grant, 1991). Specifically then, how does
sponsorship enable sustained competitive advantage? The literature suggests that a
sponsorship should yield a unique outcome which fits with the image that the sponsor is
trying to convey (Amis, Slack & Berrett, 1997; Ferrand & Pages, 1996). An example of a
successful sponsor-sponsee relationship, such as Budweiser’s sponsorship of the National
Football League (NFL) where the sponsor (Budweiser) has built an enduring and positive
association with the NFL (sponsee), its fans and the sport of football, illustrates how a
sponsor can develop its sponsorship into a sustained competitive advantage (Amis, Pant
& Slack, 1997).
Reproduced with permission of the copyright owner. Further reproduction prohibited without permission.

3 6
In summary, the literature supports sponsorship as an independent element of
promotion strategy, distinct from advertising.
2.4 Summary: Sponsorship
This chapter has presented an analysis of the literature on sponsorship, which
makes a number of important contributions to this dissertation. First, definitions of
sponsorship were reviewed and a working definition crafted. Second, sponsorship’s
distinction from advertising was presented and supported. Third, the use of sponsorship
as a promotional tool was shown to be growing and expanding. Fourth, the key concepts
of sponsorship (e.g., involvement, leveraging, exclusivity, and mega-sponsor) were
described. Finally, the sponsor-sponsee relationship was presented to provide the basis
for the work on evaluation in subsequent chapters.
Reproduced with permission of the copyright owner. Further reproduction prohibited without permission.
3 7
3.0 SPONSORSHIP EVALUATION
The purpose of the following chapter is to review the current state of sponsorship
evaluation, both in practice and in the literature. This review includes literature on
evaluation in general, performance measurement, objectives, sponsorship evaluation, and
sponsorship implementation, as well as content related to the tactics, methods and general
practice of sponsorship evaluation. This will provide the essential information and
knowledge required to address the major dissertation objective of developing a
sponsorship evaluation process model. The first draft of the model was constructed based
largely on the sponsorship evaluation literature.
3.1 Introducing Sponsorship Evaluation
It has long been understood that the most difficult task in sponsorship is being
able to observe tangible results that are attributed to the sponsorship program (Harvey,
2001; Bowey, 1998; Copeland, Frisby & McCarville, 1996; Cornwell, 1995; Meenaghan,
1983). The literature often discusses evaluation and the need to evaluate sponsorship
relationships yet many researchers have reported that few sponsors evaluate their
investments in sponsorship to any significant extent (e.g., McDaniel & Kinney, 1998;
Farrelly, Quester & Burton, 1997; Marshall & Cook, 1992). In fact, Gardiner and
Shumman (1988) report that over 50% of sponsors do not evaluate their sponsorships.
Berrett and Slack (1995) found that most Canadian companies under study had no clear
idea of the benefits they received from sponsorship and that most evaluations were
relatively informal and fairly infrequent. Further, those who do evaluate often use
procedures, such as media impressions, TV ratings and print coverage (Marshall & Cook,
Reproduced with permission of the copyright owner. Further reproduction prohibited without permission.
3 8
1992). For the most part, academic researchers who have written about sponsorship
evaluation focus on the use of measurement techniques from advertising (Olkkonen,
2001; Meenaghan, 2001), as opposed to the development and adoption of sponsorship-
specific measurement (Farrelly, Quester & Burton, 1997; Abratt & Grobler, 1989).
Although such approaches may provide evidence of impact, they are deficient in their
ability to assess all aspects of a sponsorship. Supporting this point, Brooks (1994) notes
that the fundamental problem in sponsorship evaluation lies in demonstrating that it
worked better, relatively, than more traditional methods of promotion (e.g., advertising or
sales promotion).
A major aspect of the sponsorship evaluation challenge stems from the many
objectives that sponsors seek with sponsorship programs (Cornwell & Maignan, 1998;
Berrett & Slack, 1995; Berrett, 1993). In fact, a review of literature reveals that 61
distinct objectives have been identified by various authors. This list can be found in
Appendix A, where the range of objectives is considerable; each requiring unique
evaluation methods.
3.1.1 The Attribution Issue
A fundamental challenge in all evaluations is the issue of attribution. Within the
attribution issue, two general concerns are always present: (i) issues around measuring
intent, and (ii) consideration of the effect of externalities on the dependent variable. The
attribution issue and these two concerns are relevant to sponsorship evaluation.
In sponsorship evaluation research, like much consumer-based research, the
reliability and validity of a respondent to self-analyze their ‘intent’ to behave (e.g.,
Reproduced with permission of the copyright owner. Further reproduction prohibited without permission.
purchase, act, etc.) is questionable as ‘intent’ may not be the normal way of thinking for
individuals (Schwarz, 1999), making any such questions difficult to answer. Considerable
research explores the underlying question: ‘what is the intent to purchase question
capturing?’ For example, (i) a respondent may construct an answer as opposed to
providing a response based on a decision (intent) that they have already made (a ‘false
positive’) or (ii) respondents who do not like to be manipulated might respond ‘no’ to an
intent based question, even though their purchase patterns are in fact influenced by a
given sponsorship (a ‘false negative’); (Schwarz, 1999; Sia, Lord, Blessum, Ratcliff, &
Lepper, 1997; Feldman & Lynch, 1988). When answering questions, respondents may
refer to the most accessible answer in their memory which infers that respondents may be
providing an overall opinion of all sponsors of a given event as opposed to the specific
sponsor of interest (Feldman & Lynch, 1988). The issue here is not the formation of
questions around the intent to purchase but may be related to the influence of ‘category
exemplars’ that are ‘top of mind’ for respondents when they are asked a question related
to intent to purchase. A category exemplar here refers to the answer that comes to mind
immediately (e.g. Olympic Sponsor = Coke; Super Bowl Sponsor = Budweiser) and what
effect that has on the respondents’ ability to answer correctly (Sia, Lord, Blessum,
Ratcliff & Leppter, 1997). As Schwarz (1999) points out, ‘social desirability’ may also
have an impact. Respondents may answer positively because it appears to be the
appropriate thing to do or they may answer negatively because they do not want to be
tricked by a promotional tactic. This is often handled by assuring respondent anonymity
and communicating clearly that no entity benefits financially from the research.
Identifying whether there are factors other than the sponsorship that affect the
Reproduced with permission of the copyright owner. Further reproduction prohibited without permission.
variable of interest (the dependent variable) (e.g. sales, awareness, employee morale, etc.)
is a major concern in all consumer-based research including sponsorship evaluation. For
sponsorship evaluation researchers, die concern refers specifically to the ability of the
research to attribute the effect of the sponsorship (as opposed to other messaging) on
opinions of the sponsor and/or the sponsee held by the target groups and on its effect to
drive the purchase of that sponsor’s products (i.e. intent to purchase). For example,
Irwin, Lachowetz, Cornwell and Clark’s (2003) finding that courier company Federal
Express’ sponsorship of the 2000 St. Jude Classic golf tournament positively influenced
spectators’ affinity for St. Jude’s Children’s Research Hospital (the charity benefiting
from the event) has to be questioned in light of other external factors which might have
contributed to the result (e.g., other St. Jude’s Children’s hospital promotions, the
percentage of spectators who were parents, etc.). Typically, this issue is handled by
asking respondents multiple questions about the many potential influencers and then
determining which are most impactful.
3.1.2 Demand for Improved Sponsorship Evaluation
The noted expressions of the difficulty or even ‘impossibility’ (Berrett, 1993) of
sponsorship evaluation, however, are not well received in practice. In recent years, the
calls from organizations (both sponsors and sponsees alike) for a viable tool for
measuring sponsorship effectiveness have increased (Mullin, Hardy & Sutton, 2000;
Milne & McDonald, 1999). The original idea for this dissertation was generated from
practitioner interest expressed by the CEO of a medium-sized Canadian sport marketing
agency directly to the author (Mark Harrison, personal communication, October 27,
Reproduced with permission of the copyright owner. Further reproduction prohibited without permission.

41
2002). As described earlier in this document, organizations are increasing their spending
on sponsorships globally. As spending increases, interest in evaluating sponsorships also
increases among both sponsors and sponsees.
Pope and Voges (1994) are believed to be the first researchers to note that
sponsors should begin to make use of evaluation techniques to assess the return on their
sponsorship investments. Following that recommendation, a limited number of methods
to evaluate sponsorship were developed, mostly by practitioners. In practice, these
methods include counting ‘footsteps’ (i.e., number of people who came to your store as a
result of sponsorship), measuring ‘impressions’ or ‘eyeballs’ (i.e., the number of people
who likely saw your sponsorship and were made aware of it), and gauging changes in
sales figures. A few evaluation models also exist in the literature. Cornwell, Pruitt &
Clark (2005), Cornwell (1995), Pope and Voges (1994), and Irwin and Asimakopoulos
(1992) all proposed sponsorship evaluation models to assist sponsors with the evaluation
of their sponsorship programs in relation to the measurement of specific sponsorship
objectives. These models do not include return on investment analysis or the
measurement of sponsor recall in consumers, which limits their value to practitioners.
Although these efforts contribute to the process of moving sponsorship knowledge
forward, to date they do not represent sufficient approaches for dealing effectively with
sponsorship evaluation.
Clearly, there is high demand for improved sponsorship evaluation in the
literature and in practitioner circles. This high demand justifies this research and sets the
stage for the deeper analysis of the evaluation, performance measurement and
sponsorship evaluation literature, which follows in the remainder of this chapter. These
Reproduced with permission of the copyright owner. Further reproduction prohibited without permission.
4 2
sections provide the knowledge foundation for the dissertation. Notably, the brief
reviews of evaluation theory and performance measurement provide guidance and key
concepts for the process model that exist outside of the sponsorship evaluation literature,
while the review of sponsorship evaluation literature provides the underlying necessary
knowledge for the construction of that model.
3.2 Evaluation
The act of assessing the effectiveness of an activity is known as evaluation.
Evaluation can be formal and documented or informal and undocumented. Formal
evaluation refers to assessment exercises which are planned, documented and analyzed
(e.g. a survey of voters post-election to determine the effectiveness of political
campaigns) while informal evaluation refers to everyday assessments that are not
documented (e.g. how does my hair look today?). This dissertation is interested in formal
evaluation. It is important to note that formal evaluation can lead to both positive (e.g.
improved customer or employee satisfaction) and negative (e.g. delaying or avoiding
decisions) results (Newbum, 2001).
Redfem (1998) traces the history of formal evaluation back to the 5th century BC,
when Socrates used evaluative questioning in pedagogy; known as the Socratic Method
of Discourse. Formal evaluation has evolved into what Scriven (1998) describes as two
types of evaluation: formative and summative. Formative evaluation is defined as a
means of improving “an intervention of service with feedback” (Newbum, 2001, p. 6).
This involves querying some group (e.g., consumers, employees, etc.) on some
intervention (e.g., marketing program, employee benefit plan, etc.) to evaluate that
Reproduced with permission of the copyright owner. Further reproduction prohibited without permission.
4 3
interaction. Summative evaluation, conversely, measures the impact and effectiveness of
programs or initiatives (Newbum, 2001). Examples would include the assessment of a
course instructor, a government policy, or a sponsorship. At its basic level, formal
evaluation is abstract with wide-ranging application. At its most complex levels, it is
viewed as a human cognitive process occurring both consciously and unconsciously in
decision making (Kodish, 2003). Examples of evaluation include athletic events,
customer satisfaction surveys, employee performance evaluations, medical examinations,
and standard educational evaluation. This dissertation research is focused on developing a
process model for the summative evaluation of sponsorship.
Formal evaluation practice is widespread in its application in areas of academia,
1 "igovernment, and business . In marketing, the evaluation of consumers on a variety of
measures (e.g., satisfaction, intent to purchase, brand awareness, post-purchase opinion,
etc.) is carried out in a variety of ways (e.g., customer surveys, comment cards, online
surveys, etc.), which impact an organization’s marketing mix (Meredith, 1993). In terms
of its execution, there are generally three important factors required for successful formal
evaluation: (i) clearly articulated baseline measures (to measure effectiveness against),
(ii) clear, measurable objectives, and (iii) support from key stakeholders on the evaluation
(i.e., ‘buy-in’); (Crane, Kerin, Hartley, Berkowitz & Rudelius, 2006).
3.3 Performance Measurement
Performance measurement is an established way of evaluating that prescribes
methods to assess the short-term outputs and long-term impacts of programs, processes
and activities. The purpose of introducing it in this dissertation is that it provides context,
13 See AppendixFootnote for a short summary of the widespread application of evaluation.
Reproduced with permission of the copyright owner. Further reproduction prohibited without permission.
4 4
concepts and an alternative view on evaluation. A number of the tenets of performance
evaluation are applicable to the evaluation of sponsorship and are incorporated in the
development of the process model. The specific benefits that performance measurement
provides to this dissertation are outlined in this sub-section.
The performance measurement literature provides important direction to enable
useful evaluation, as well as for implementing effective measurement practices. Heslop
and Fadaie’s (2002) ‘3 Bs of impact assessment’ are particularly useful in this regard.
Their work on measuring the performance of technology transfer programs reveals that
successful impact assessment requires (i) the buy-in of key stakeholders to the
measurement model and approaches being used, (ii) believability in both the procedures
to be followed and the outcomes that will be generated, and (iii) the existence of buyers
or users of the results who will ensure good application as well as the dissemination and
promotion of the results (Heslop & Fadaie, 2002). The emphasis on efficient process is
evident in performance measurement as demonstrated by Heslop and Fadaie’s (2002, p.
223) rationale for the 3Bs:
Since program assessments of any kind require considerable resources and the outcomes can be expected to affect fixture planning and resource flows, there is value in getting the process right. In many ways, poor assessments can be more detrimental than no assessment at all. Considerably more effort needs to be directed to determining which methods and means yield useable results.. .One overarching determination of the worth of an assessment is the extent to which managers and decision makers at all levels and among all stakeholders both within and outside the organization find the process outcomes useful and useable. Use of the results will only occur if managers feel they are part of the process, have significant input, believe the results are credible, accurate and representative, and decisions based on the outcomes will be better decisions.
In terms of the process of performance measurement itself, models such as cost-
benefit analysis typically guide the determination of targets, indicators, measures and
Reproduced with permission of the copyright owner. Further reproduction prohibited without permission.
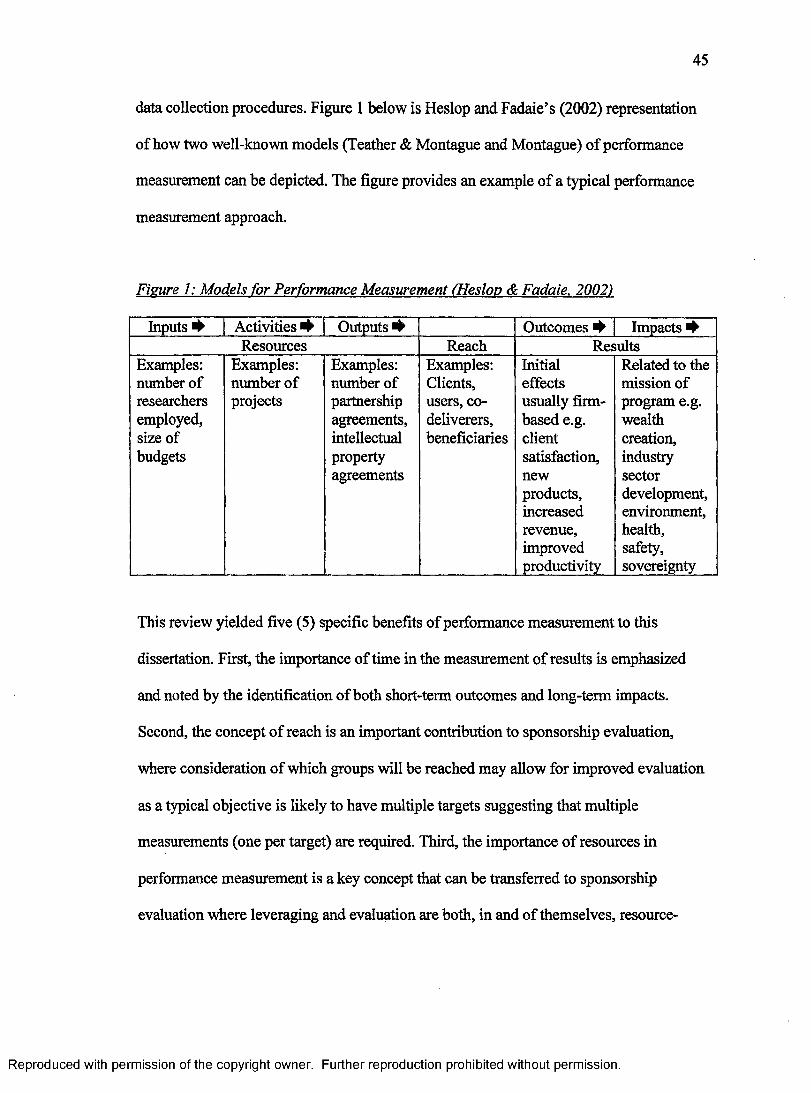
4 5
data collection procedures. Figure 1 below is Heslop and Fadaie’s (2002) representation
of how two well-known models (Teather & Montague and Montague) of performance
measurement can be depicted. The figure provides an example of a typical performance
measurement approach.
Firnre 1: Models for Performance Measurement (Heslop & Fadaie. 2002)
Inputs Activities Outputs Outcomes + Impacts #•Resources Reach Results
Examples: number of researchers employed, size of budgets
Examples: number of projects
Examples:number ofpartnershipagreements,intellectualpropertyagreements
Examples: Clients, users, codeliverers, beneficiaries
Initial effects usually firm- based e.g. clientsatisfaction,newproducts,increasedrevenue,improvedproductivity
Related to themission ofprogram e.g.wealthcreation,industrysectordevelopment,environment,health,safety,sovereignty
This review yielded five (5) specific benefits of performance measurement to this
dissertation. First, the importance of time in the measurement of results is emphasized
and noted by the identification of both short-term outcomes and long-term impacts.
Second, the concept of reach is an important contribution to sponsorship evaluation,
where consideration of which groups will be reached may allow for improved evaluation
as a typical objective is likely to have multiple targets suggesting that multiple
measurements (one per target) are required. Third, the importance of resources in
performance measurement is a key concept that can be transferred to sponsorship
evaluation where leveraging and evaluation are both, in and of themselves, resource
Reproduced with permission of the copyright owner. Further reproduction prohibited without permission.
4 6
intensive undertakings. Fourth, the importance of including non-economic measurements
in sponsorship evaluation is underlined, as die many objectives in sponsorship require
approaches outside of economic measurement which only capture a small part of the
overall value (Heslop & Fadaie, 2002). Finally, while evaluations are often overly broad,
lengthy in their implementation and costly both in terms of human and financial
resources (Melkers & Cozzens, 1997), performance measurement activities are more
results-oriented and can be a major input to good performance reviews (Heslop & Fadaie,
2002). Therefore, since the focus on many processes, specific activities and outcomes
leads to more efficient and effective evaluation (Heslop & Fadaie, 2002; Bozeman &
Papadakis, 1995) the performance measurement approach is readily adopted.
3.4 Sponsorship Evaluation
As noted previously, an objective of this chapter is to review the sponsorship
evaluation literature and provide the baseline information necessary for the construction
of a new process model. In order to accomplish this purpose, this section presents the
challenges of sponsorship evaluation identified in the literature, the development of this
literature, the identification of practical applications of sponsorship evaluation, and the
role of evaluation in implementing a sponsorship.
3.4.1 The Challenges o f Sponsorship Evaluation
Walliser’s (2003) in-depth review of the literature on sponsorship identifies three
specific challenges that researchers are faced with. First, Walliser (2003, p. 88) points out
that “overall, little is known about the conditions which lead to successful and durable
Reproduced with permission of the copyright owner. Further reproduction prohibited without permission.
image transfer from the activity supported to the sponsor”. Here, Walliser is referring to
the obstacle of limited knowledge of the image transfer process, which reinforces the
need to better understand the complexities of the sponsor-sponsee relationship vis-a-vis
image transfer. Second, the literature argues that “objectives other than awareness and
image also need to be addressed. It is more than surprising that the impact of sponsorship
on employee motivation has not received more attention” (Walliser, 2003, p. 90), thereby
noting the challenge of expanding sponsorship evaluation theory and practice beyond
awareness and image. Other researchers (e.g., Harvey, 2001) have similarly noted that
sponsorship evaluation is an area requiring more attention from researchers. In this
regard, Meenaghan (2001) and Olkkonen (2001) both suggest that this is needed as prior
research typically involved (i) non-complex tests of recall and recognition and/or (ii) the
use of advertising measurement tools to measure sponsorship. This further emphasizes
the lack of theory in sponsorship evaluation and the challenge researchers are faced with
to move away from advertising-based evaluation approaches. The third challenge faced
by sponsorship evaluation researchers is to overcome the methodological deficiencies
that currently limit sponsorship evaluation, as summarized by Walliser (2003, p. 93):
On the methodological side, sample quality and size can still be improved considerably.. .extending research [beyond student samples] to other age and professional groups would be beneficial to sponsorship research. Furthermore, a more frequent use of longitudinal designs would make it easier to study how sponsor awareness may be maintained and under what conditions image transfer takes place.
Clearly, more sophisticated metrics are required that are directly related to the objectives
of interest in the sponsor-sponsee relationship of interest.
Reproduced with permission of the copyright owner. Further reproduction prohibited without permission.
4 8
3.4.2 The Sponsorship Evaluation Literature
The literature on sponsorship evaluation involves articles evaluating how
sponsorship affects awareness, image and purchase intention (Walliser, 2003). The
sophistication and form of sponsorship measurement has changed somewhat in recent
years, with emphasis moving from recall and recognition (Lascu, Giese, Toolan,
Guehring & Mercer, 1995) to understanding how the sponsor’s brand and/or products are
perceived by the customer (Scherer & Sam, 2005). The vast majority of the literature
adopts tracking (recall and recognition measures) techniques to examine consumer
changes among targeted customers (Moore, Pickett & Groove, 1999; Easton & Mackie,
1998; Walliser, 1994). Walliser (2003, p. 92) describes the overall output of these
studies:
There is considerable evidence that recall increases as a function of duration of exposure to sponsors, previous brand awareness of sponsors, message length and design, socio-demographic variables of the spectators, such as age and spectator involvement with, and interest in, the activity sponsored. With regards to the integration of sponsorship and other communication tools, an increase of awareness scores is observed when sponsorship is used in conjunction with broadcast sponsorship.. .or classical advertising.
Other research suggests that time is an important consideration in sponsorship evaluation
since it has been demonstrated that brand recall levels increase slightly prior to and
during a sponsored event, then fall back to prior levels following the event (Walliser &
Nanopoulos, 2000; Cornwell, Maignan & Irwin, 1997; Quester, 1997a; 1997b).
Studies on image, purchase intention and location dependency make up the
remaining (but much smaller) three areas of sponsorship evaluation research. The
majority of the studies on image (e.g., Meenaghan & Shipley, 1999; Grimes &
Meenaghan, 1998; Giannelloni, 1993) show that sponsorship contributes to image
Reproduced with permission of the copyright owner. Further reproduction prohibited without permission.

4 9
transfer. Research in the area of purchase intention is limited in the sponsorship
evaluation literature; however several surveys have shown that sponsorship can impact
intent to purchase (Cornwell, Pruitt & van Ness, 2001; Daneshvary & Schwer, 2000).
Research in the area of location dependency is rare in sponsorship evaluation; however a
group of studies (Westerbeek & Smith, 2002; Westerbeek, 2000; Westerbeek & Shilbury,
1999) have evaluated the importance of the geographical location of the venue or facility
where the sponsored property is held.
The early literature on sponsorship evaluation described the published work as
war stories (i.e., unsophisticated evaluation) focused on macro-level issues (Sandler &
Shani, 1993). Pope (1998) reported on this time period noting that most of the work in
sponsorship was descriptive or prescriptive in nature with little attention paid to
measuring consumer opinion. Some examples include (i) Stotlar (1993) mentioning that
Visa demonstrated market share gains following its sponsorship of the 1998 Olympic
Games, (ii) Jeannet and Hennessey (1992) reporting that sales of their tennis racquets
increased 1000% following their sponsorship of athlete Boris Becker in 1985, and (iii)
Volvo measuring a 6:1 ROI on its sport sponsorship programs (Irwin & Asimakopoulos,
1992).
The period that followed (1993-2004) was marked by many calls for more
sophisticated evaluation and evaluation techniques in sponsorship (e.g. Pope & Voges,
1994). Walliser’s (2003) in-depth review of the literature on sponsorship reports on 83
published studies related to the measurement of sponsorship impact and noted that 65%
of those studies were published after 1996. Importantly, Walliser (2003) also noted that
the majority of these studies did not provide actual metrics and, for those few who did,
Reproduced with permission of the copyright owner. Further reproduction prohibited without permission.
5 0
most adopted basic tracking techniques or experiments to measure awareness or image
constructs, with few exploring purchase intention. In this period, a number of researchers
reviewed the evaluation practices of practitioners. For example, Ludwig and Karabetsos
(1999) reviewed the practices implemented by the sponsors of the 1996 Olympic Games.
They found, via questionnaire, that ten out of eleven Olympic sponsors indicated that
benchmarks (pre and post-Olympic measurements) were used to evaluate outcomes of
their respective sponsorships and that hospitality opportunity, sales, media coverage and
image were the most important evaluation criteria (Ludwig & Karabetsos, 1999).
3.4.3 Sponsorship Evaluation Practice
The contemporary literature on sponsorship evaluation documents a variety of
evaluation practices. These practices include tracking changes in the sponsor’s stock
price (if publicly traded) before, during and after the sponsorship relationship (Cornwell,
Pruitt & Clark, 2005; Cornwell, Roy & Steinard, 2001), quantitative assessment of news
clippings, exposure and attitude measures (Cornwell, Roy & Steinard, 2001), media
exposure measures such as ratings, impressions and footsteps (Meenaghan, 2001), and
profiling management practice (i.e., tracking management’s effectiveness in
implementing the sponsorship); (Meenaghan, 2001). These studies demonstrate the
attention on sponsorship evaluation, the varied objectives which sponsorship can seek
and the fact that researchers are seeking new evaluation metrics.
In general, the promotional benefits of sponsorship are classified as either tangible
or intangible (Ludwig & Karabestos, 1999). Tangible benefits are measured through a
number of protocols; including consumer surveys, advertising impressions, televised
Reproduced with permission of the copyright owner. Further reproduction prohibited without permission.
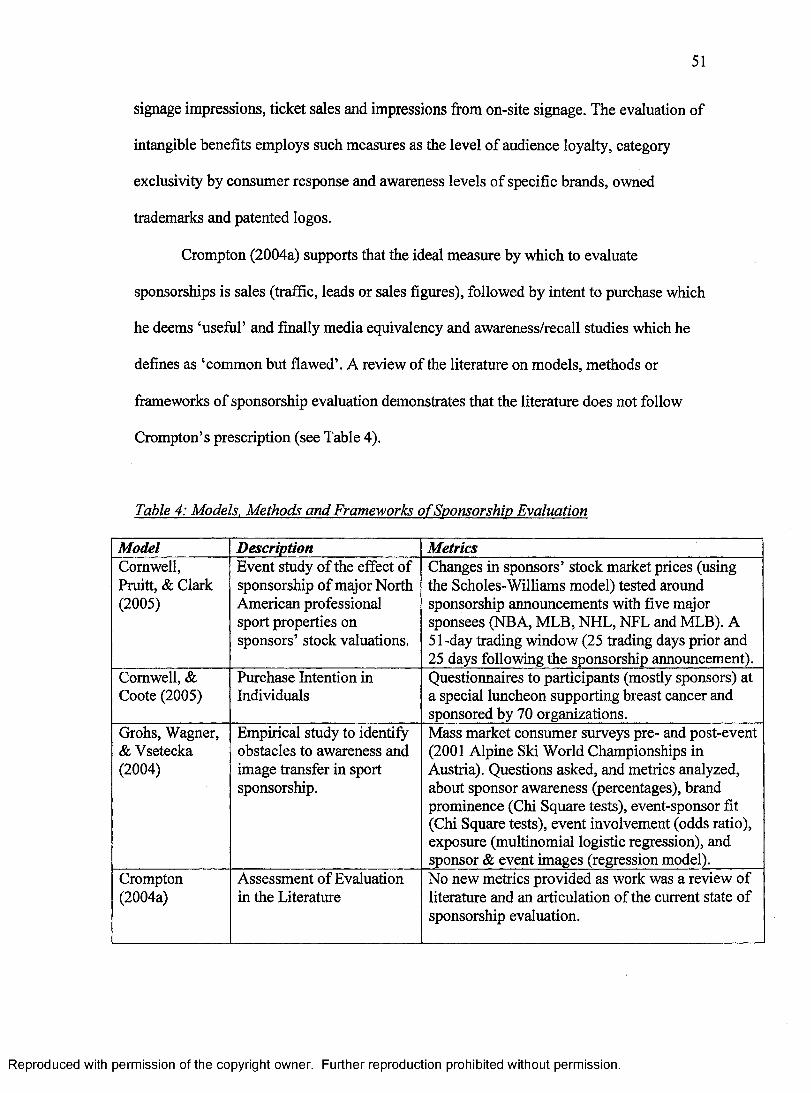
51
signage impressions, ticket sales and impressions from on-site signage. The evaluation of
intangible benefits employs such measures as the level of audience loyalty, category
exclusivity by consumer response and awareness levels of specific brands, owned
trademarks and patented logos.
Crompton (2004a) supports that the ideal measure by which to evaluate
sponsorships is sales (traffic, leads or sales figures), followed by intent to purchase which
he deems ‘useful’ and finally media equivalency and awareness/recall studies which he
defines as ‘common but flawed’. A review of the literature on models, methods or
frameworks of sponsorship evaluation demonstrates that the literature does not follow
Crompton’s prescription (see Table 4).
Table 4: Models, Methods and Frameworks o f Sponsorship Evaluation
Model Description MetricsCornwell, Pruitt, & Clark (2005)
Event study of the effect of sponsorship of major North American professional sport properties on sponsors’ stock valuations.
Changes in sponsors’ stock market prices (using the Scholes-Williams model) tested around sponsorship announcements with five major sponsees (NBA, MLB, NHL, NFL and MLB). A 51-day trading window (25 trading days prior and 25 days following the sponsorship announcement).
Cornwell, & Coote (2005)
Purchase Intention in Individuals
Questionnaires to participants (mostly sponsors) at a special luncheon supporting breast cancer and sponsored by 70 organizations.
Grohs, Wagner, & Vsetecka (2004)
Empirical study to identify obstacles to awareness and image transfer in sport sponsorship.
Mass market consumer surveys pre- and post-event (2001 Alpine Ski World Championships in Austria). Questions asked, and metrics analyzed, about sponsor awareness (percentages), brand prominence (Chi Square tests), event-sponsor fit (Chi Square tests), event involvement (odds ratio), exposure (multinomial logistic regression), and sponsor & event images (regression model).
Crompton(2004a)
Assessment of Evaluation in the Literature
No new metrics provided as work was a review of literature and an articulation of the current state of sponsorship evaluation.
Reproduced with permission of the copyright owner. Further reproduction prohibited without permission.
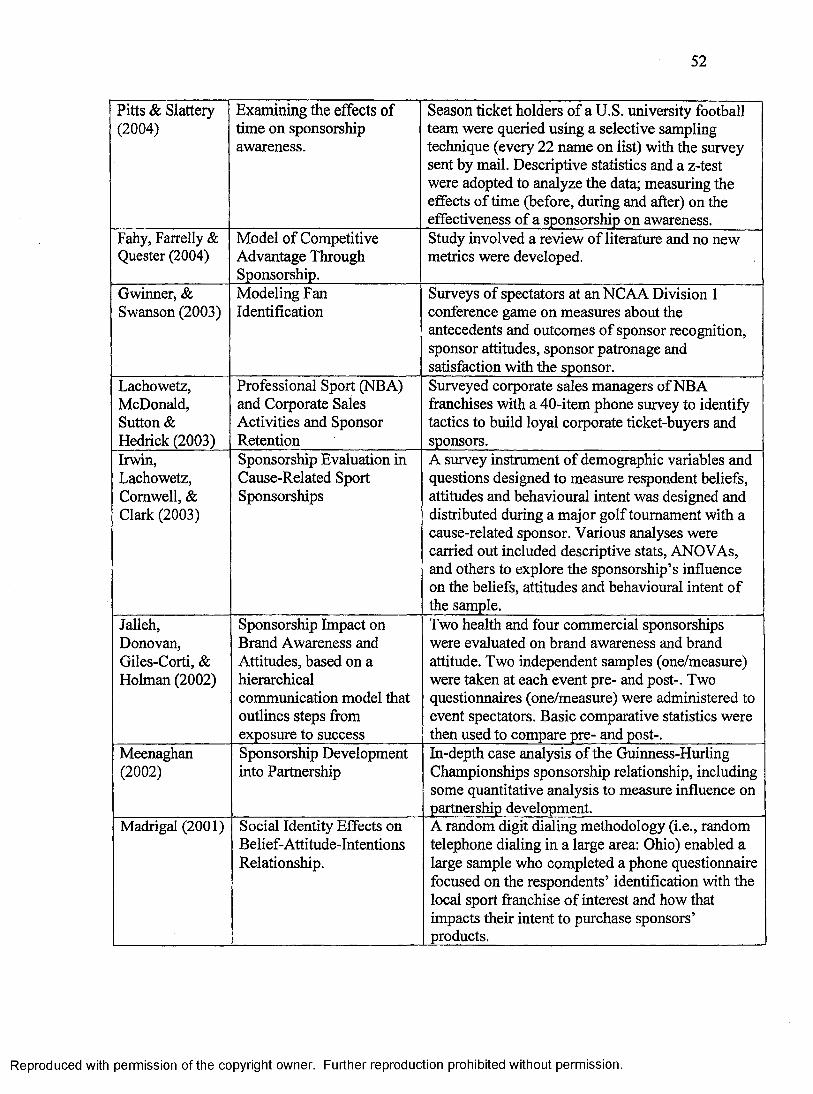
5 2
Pitts & Slattery (2004)
Examining the effects of time on sponsorship awareness.
Season ticket holders of a U.S. university football team were queried using a selective sampling technique (every 22 name on list) with the survey sent by mail. Descriptive statistics and a z-test were adopted to analyze the data; measuring the effects of time (before, during and after) on the effectiveness of a sponsorship on awareness.
Fahy, Farrelly & Quester (2004)
Model of Competitive Advantage Through Sponsorship.
Study involved a review of literature and no new metrics were developed.
Gwinner, & Swanson (2003)
Modeling Fan Identification
Surveys of spectators at an NCAA Division 1 conference game on measures about the antecedents and outcomes of sponsor recognition, sponsor attitudes, sponsor patronage and satisfaction with the sponsor.
Lachowetz, McDonald, Sutton & Hedrick (2003)
Professional Sport (NBA) and Corporate Sales Activities and Sponsor Retention
Surveyed corporate sales managers of NBA franchises with a 40-item phone survey to identify tactics to build loyal corporate ticket-buyers and sponsors.
Irwin, Lachowetz, Cornwell, & Clark (2003)
Sponsorship Evaluation in Cause-Related Sport Sponsorships
A survey instrument of demographic variables and questions designed to measure respondent beliefs, attitudes and behavioural intent was designed and distributed during a major golf tournament with a cause-related sponsor. Various analyses were carried out included descriptive stats, ANOVAs, and others to explore the sponsorship’s influence on the beliefs, attitudes and behavioural intent of the sample.
Jalleh, Donovan, Giles-Corti, & Holman (2002)
Sponsorship Impact on Brand Awareness and Attitudes, based on a hierarchicalcommunication model that outlines steps from exposure to success
Two health and four commercial sponsorships were evaluated on brand awareness and brand attitude. Two independent samples (one/measure) were taken at each event pre- and post-. Two questionnaires (one/measure) were administered to event spectators. Basic comparative statistics were then used to compare pre- and post-.
Meenaghan(2002)
Sponsorship Development into Partnership
In-depth case analysis of the Guinness-Hurling Championships sponsorship relationship, including some quantitative analysis to measure influence on partnership development.
Madrigal (2001) Social Identity Effects on Belief-Attitude-Intentions Relationship.
A random digit dialing methodology (i.e., random telephone dialing in a large area: Ohio) enabled a large sample who completed a phone questionnaire focused on the respondents’ identification with the local sport franchise of interest and how that impacts their intent to purchase sponsors’ products.
Reproduced with permission of the copyright owner. Further reproduction prohibited without permission.
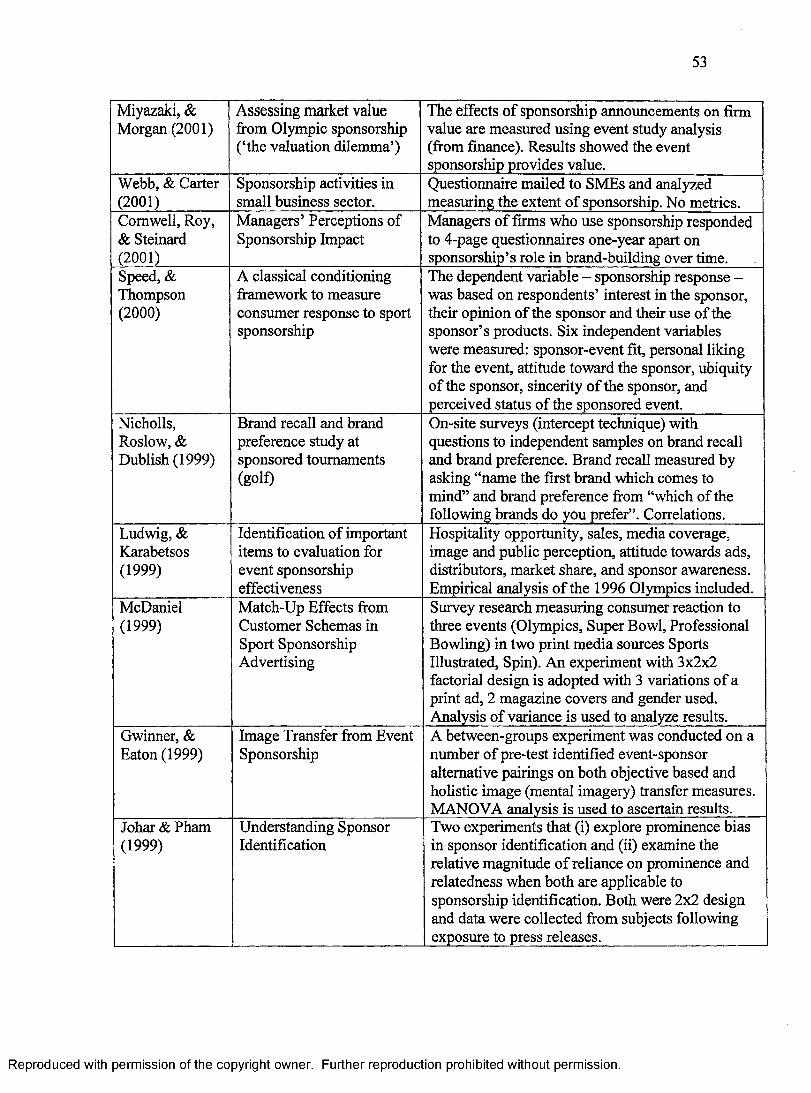
53
Miyazaki, & Morgan (2001)
Assessing market value from Olympic sponsorship (‘the valuation dilemma’)
The effects of sponsorship announcements on firm value are measured using event study analysis (from finance). Results showed the event sponsorship provides value.
Webb, & Carter (2001)
Sponsorship activities in small business sector.
Questionnaire mailed to SMEs and analyzed measuring the extent of sponsorship. No metrics.
Cornwell, Roy, & Steinard (2001)
Managers’ Perceptions of Sponsorship Impact
Managers of firms who use sponsorship responded to 4-page questionnaires one-year apart on sponsorship’s role in brand-building over time.
Speed, & Thompson (2000)
A classical conditioning framework to measure consumer response to sport sponsorship
The dependent variable - sponsorship response - was based on respondents’ interest in the sponsor, their opinion of the sponsor and their use of the sponsor’s products. Six independent variables were measured: sponsor-event fit, personal liking for the event, attitude toward the sponsor, ubiquity of the sponsor, sincerity of the sponsor, and perceived status of the sponsored event.
Nicholls, Roslow, & Dublish (1999)
Brand recall and brand preference study at sponsored tournaments(golf)
On-site surveys (intercept technique) with questions to independent samples on brand recall and brand preference. Brand recall measured by asking “name the first brand which comes to mind” and brand preference from “which of the following brands do you prefer”. Correlations.
Ludwig, & Karabetsos (1999)
Identification of important items to evaluation for event sponsorship effectiveness
Hospitality opportunity, sales, media coverage, image and public perception, attitude towards ads, distributors, market share, and sponsor awareness. Empirical analysis of the 1996 Olympics included.
McDaniel(1999)
Match-Up Effects from Customer Schemas in Sport Sponsorship Advertising
Survey research measuring consumer reaction to three events (Olympics, Super Bowl, Professional Bowling) in two print media sources Sports Illustrated, Spin). An experiment with 3x2x2 factorial design is adopted with 3 variations of a print ad, 2 magazine covers and gender used. Analysis of variance is used to analyze results.
Gwinner, & Eaton (1999)
Image Transfer from Event Sponsorship
A between-groups experiment was conducted on a number of pre-test identified event-sponsor alternative pairings on both objective based and holistic image (mental imagery) transfer measures. MANOVA analysis is used to ascertain results.
Johar & Pham (1999)
Understanding Sponsor Identification
Two experiments that (i) explore prominence bias in sponsor identification and (ii) examine the relative magnitude of reliance on prominence and relatedness when both are applicable to sponsorship identification. Both were 2x2 design and data were collected from subjects following exposure to press releases.
Reproduced with permission of the copyright owner. Further reproduction prohibited without permission.
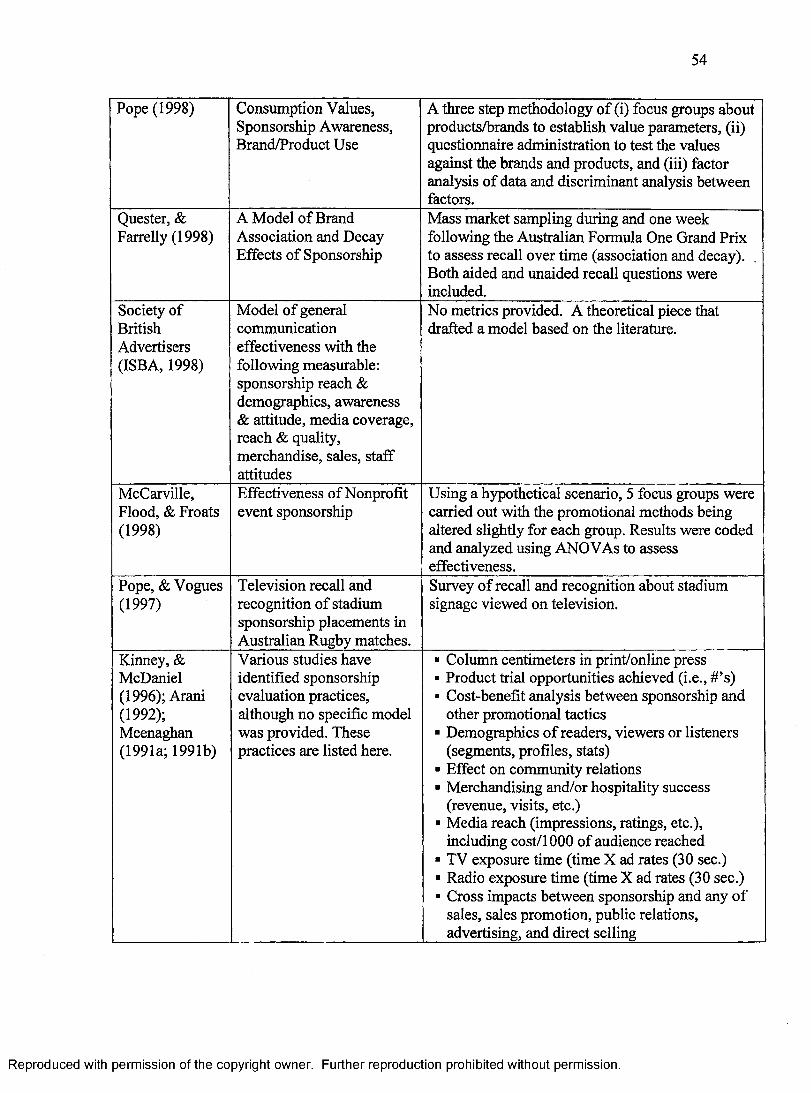
5 4
Pope (1998) Consumption Values, Sponsorship Awareness, Brand/Product Use
A three step methodology of (i) focus groups about products/brands to establish value parameters, (ii) questionnaire administration to test the values against the brands and products, and (iii) factor analysis of data and discriminant analysis between factors.
Quester, & Farrelly (1998)
A Model of Brand Association and Decay Effects of Sponsorship
Mass market sampling during and one week following the Australian Formula One Grand Prix to assess recall over time (association and decay). Both aided and unaided recall questions were included.
Society of British Advertisers (ISBA, 1998)
Model of general communication effectiveness with the following measurable: sponsorship reach & demographics, awareness & attitude, media coverage, reach & quality, merchandise, sales, staff attitudes
No metrics provided. A theoretical piece that drafted a model based on the literature.
McCarville, Flood, & Froats (1998)
Effectiveness of Nonprofit event sponsorship
Using a hypothetical scenario, 5 focus groups were carried out with the promotional methods being altered slightly for each group. Results were coded and analyzed using ANOVAs to assess effectiveness.
Pope, & Vogues (1997)
Television recall and recognition of stadium sponsorship placements in Australian Rugby matches.
Survey of recall and recognition about stadium signage viewed on television.
Kinney, & McDaniel (1996); Arani (1992); Meenaghan (1991a; 1991b)
Various studies have identified sponsorship evaluation practices, although no specific model was provided. These practices are listed here.
■ Column centimeters in print/online press■ Product trial opportunities achieved (i.e., #’s)■ Cost-benefit analysis between sponsorship and
other promotional tactics■ Demographics of readers, viewers or listeners
(segments, profiles, stats)■ Effect on community relations■ Merchandising and/or hospitality success
(revenue, visits, etc.)■ Media reach (impressions, ratings, etc.),
including cost/1000 of audience reached■ TV exposure time (time X ad rates (30 sec.)■ Radio exposure time (time X ad rates (30 sec.)■ Cross impacts between sponsorship and any of
sales, sales promotion, public relations, advertising, and direct selling
Reproduced with permission of the copyright owner. Further reproduction prohibited without permission.
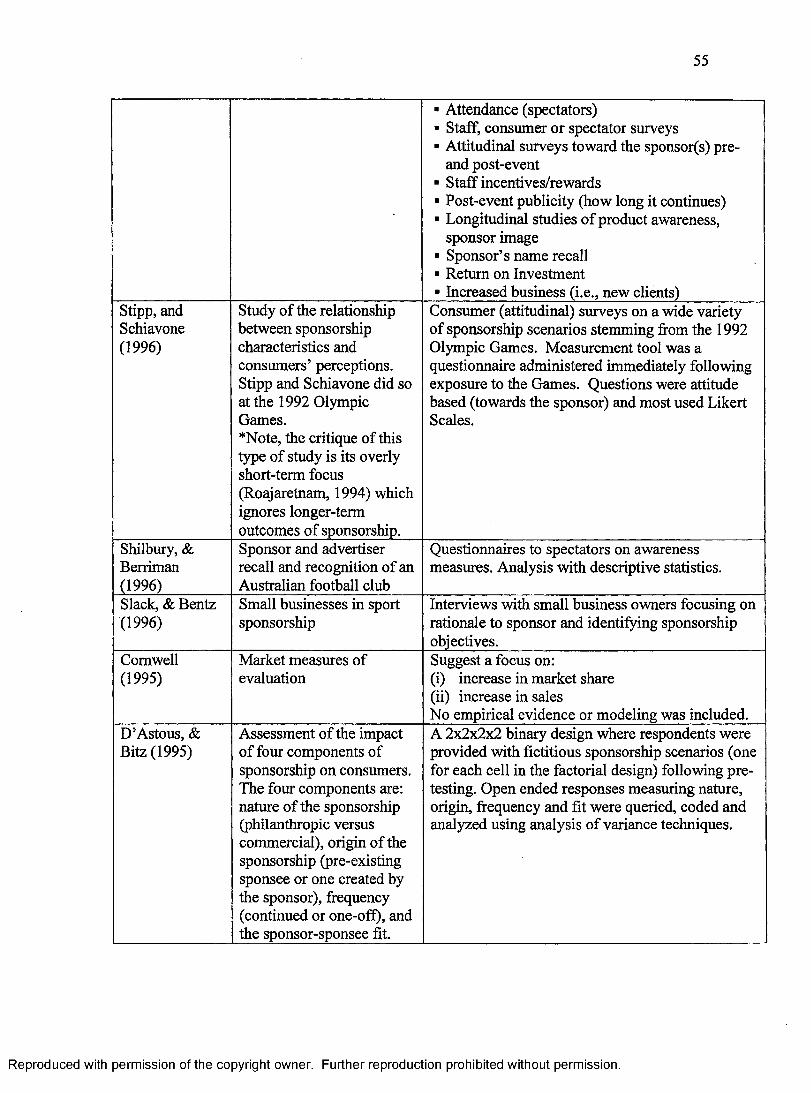
55
■ Attendance (spectators)■ Staff, consumer or spectator surveys■ Attitudinal surveys toward the sponsor(s) pre-
and post-event■ Staff incentives/rewards■ Post-event publicity (how long it continues)■ Longitudinal studies of product awareness,
sponsor image■ Sponsor’s name recall■ Return on Investment■ Increased business (i.e., new clients)
Stipp, and Schiavone (1996)
Study of the relationship between sponsorship characteristics and consumers’ perceptions. Stipp and Schiavone did so at the 1992 Olympic Games.*Note, the critique of this type of study is its overly short-term focus (Roajaretnam, 1994) which ignores longer-term outcomes of sponsorship.
Consumer (attitudinal) surveys on a wide variety of sponsorship scenarios stemming from the 1992 Olympic Games. Measurement tool was a questionnaire administered immediately following exposure to the Games. Questions were attitude based (towards the sponsor) and most used Likert Scales.
Shilbury, &Berriman(1996)
Sponsor and advertiser recall and recognition of an Australian football club
Questionnaires to spectators on awareness measures. Analysis with descriptive statistics.
Slack, & Bentz (1996)
Small businesses in sport sponsorship
Interviews with small business owners focusing on rationale to sponsor and identifying sponsorship objectives.
Cornwell(1995)
Market measures of evaluation
Suggest a focus on:(i) increase in market share(ii) increase in salesNo empirical evidence or modeling was included.
D’Astous, & Bitz (1995)
Assessment of the impact of four components of sponsorship on consumers. The four components are: nature of the sponsorship (philanthropic versus commercial), origin of the sponsorship (pre-existing sponsee or one created by the sponsor), frequency (continued or one-off), and the sponsor-sponsee fit.
A 2x2x2x2 binary design where respondents were provided with fictitious sponsorship scenarios (one for each cell in the factorial design) following pretesting. Open ended responses measuring nature, origin, frequency and fit were queried, coded and analyzed using analysis of variance techniques.
Reproduced with permission of the copyright owner. Further reproduction prohibited without permission.
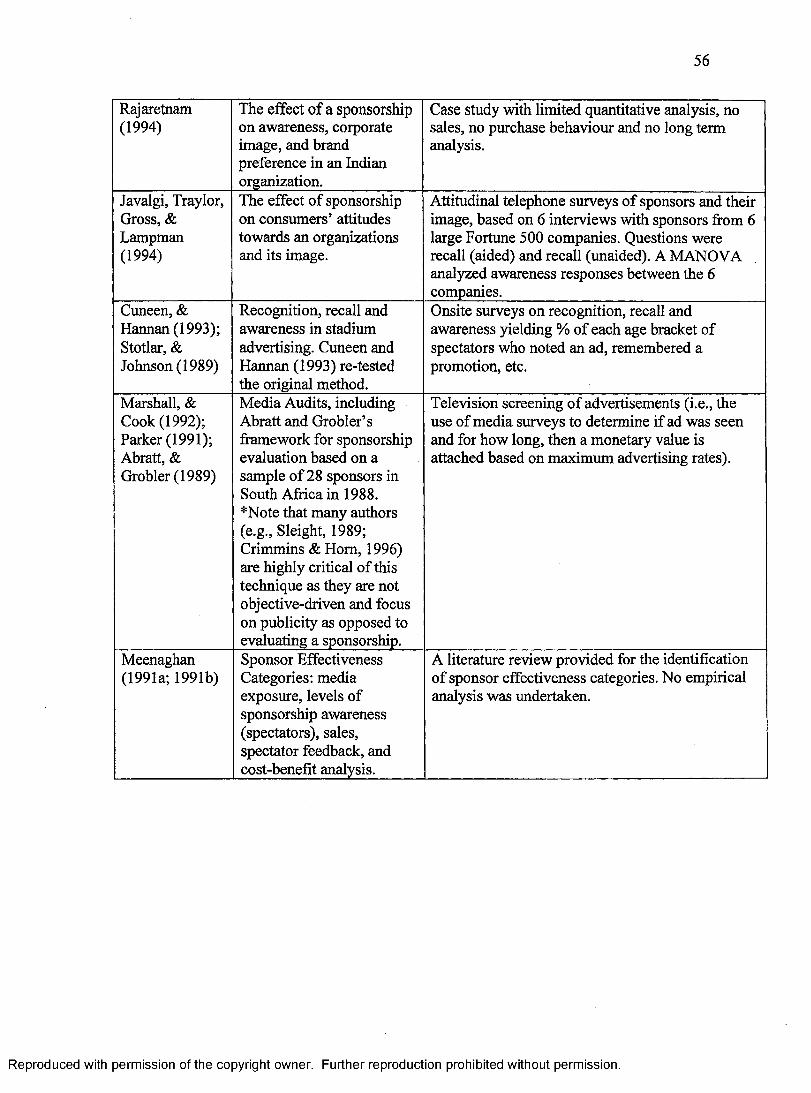
5 6
Rajaretnam(1994)
The effect of a sponsorship on awareness, corporate image, and brand preference in an Indian organization.
Case study with limited quantitative analysis, no sales, no purchase behaviour and no long term analysis.
Javalgi, Traylor, Gross, & Lampman (1994)
The effect of sponsorship on consumers’ attitudes towards an organizations and its image.
Attitudinal telephone surveys of sponsors and their image, based on 6 interviews with sponsors from 6 large Fortune 500 companies. Questions were recall (aided) and recall (unaided). A MANOVA analyzed awareness responses between the 6 companies.
Cuneen, & Hannan (1993); Stotlar, & Johnson (1989)
Recognition, recall and awareness in stadium advertising. Cuneen and Hannan (1993) re-tested the original method.
Onsite surveys on recognition, recall and awareness yielding % of each age bracket of spectators who noted an ad, remembered a promotion, etc.
Marshall, & Cook (1992); Parker (1991); Abratt, & Grobler (1989)
Media Audits, including Abratt and Grobler’s framework for sponsorship evaluation based on a sample of 28 sponsors in South Africa in 1988. *Note that many authors (e.g., Sleight, 1989; Crimmins & Horn, 1996) are highly critical of this technique as they are not objective-driven and focus on publicity as opposed to evaluating a sponsorship.
Television screening of advertisements (i.e., the use of media surveys to determine if ad was seen and for how long, then a monetary value is attached based on maximum advertising rates).
Meenaghan (1991a; 1991b)
Sponsor Effectiveness Categories: media exposure, levels of sponsorship awareness (spectators), sales, spectator feedback, and cost-benefit analysis.
A literature review provided for the identification of sponsor effectiveness categories. No empirical analysis was undertaken.
Reproduced with permission of the copyright owner. Further reproduction prohibited without permission.
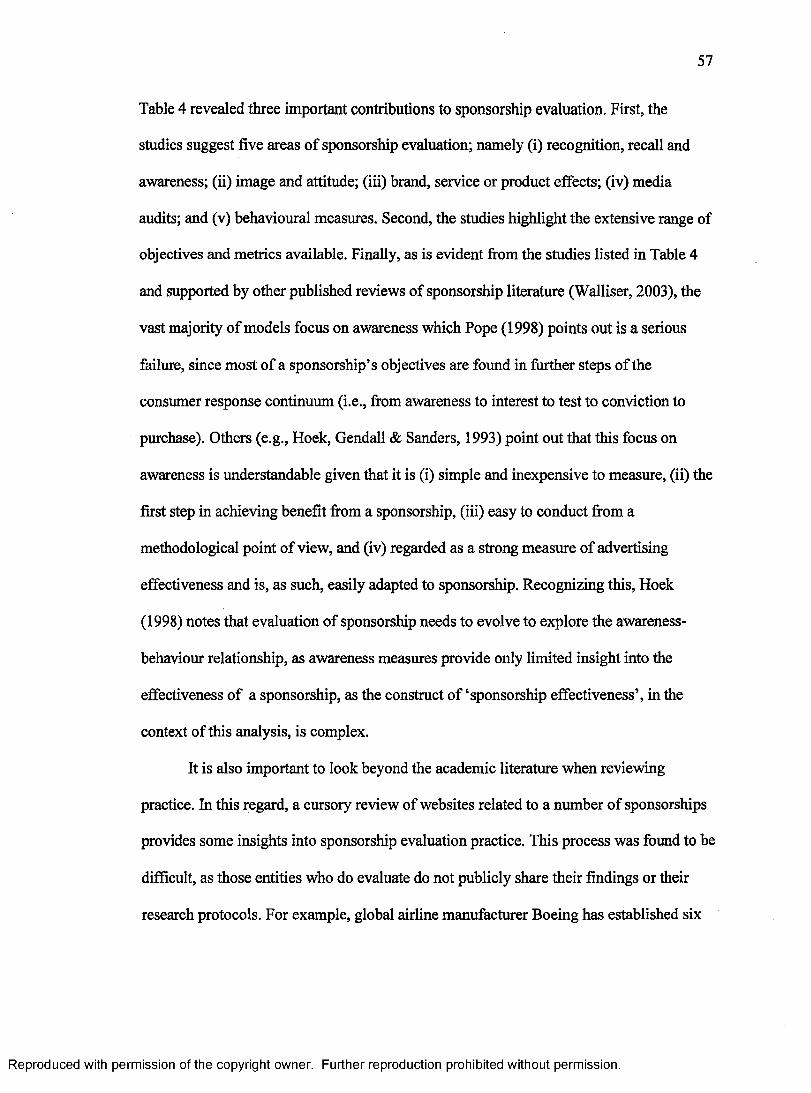
Table 4 revealed three important contributions to sponsorship evaluation. First, the
studies suggest five areas of sponsorship evaluation; namely (i) recognition, recall and
awareness; (ii) image and attitude; (iii) brand, service or product effects; (iv) media
audits; and (v) behavioural measures. Second, the studies highlight the extensive range of
objectives and metrics available. Finally, as is evident from the studies listed in Table 4
and supported by other published reviews of sponsorship literature (Walliser, 2003), the
vast majority of models focus on awareness which Pope (1998) points out is a serious
failure, since most of a sponsorship’s objectives are found in further steps of the
consumer response continuum (i.e., from awareness to interest to test to conviction to
purchase). Others (e.g., Hoek, Gendall & Sanders, 1993) point out that this focus on
awareness is understandable given that it is (i) simple and inexpensive to measure, (ii) the
first step in achieving benefit from a sponsorship, (iii) easy to conduct from a
methodological point of view, and (iv) regarded as a strong measure of advertising
effectiveness and is, as such, easily adapted to sponsorship. Recognizing this, Hoek
(1998) notes that evaluation of sponsorship needs to evolve to explore the awareness-
behaviour relationship, as awareness measures provide only limited insight into the
effectiveness of a sponsorship, as the construct of ‘sponsorship effectiveness’, in the
context of this analysis, is complex.
It is also important to look beyond the academic literature when reviewing
practice. In this regard, a cursory review of websites related to a number of sponsorships
provides some insights into sponsorship evaluation practice. This process was found to be
difficult, as those entities who do evaluate do not publicly share their findings or their
research protocols. For example, global airline manufacturer Boeing has established six
Reproduced with permission of the copyright owner. Further reproduction prohibited without permission.
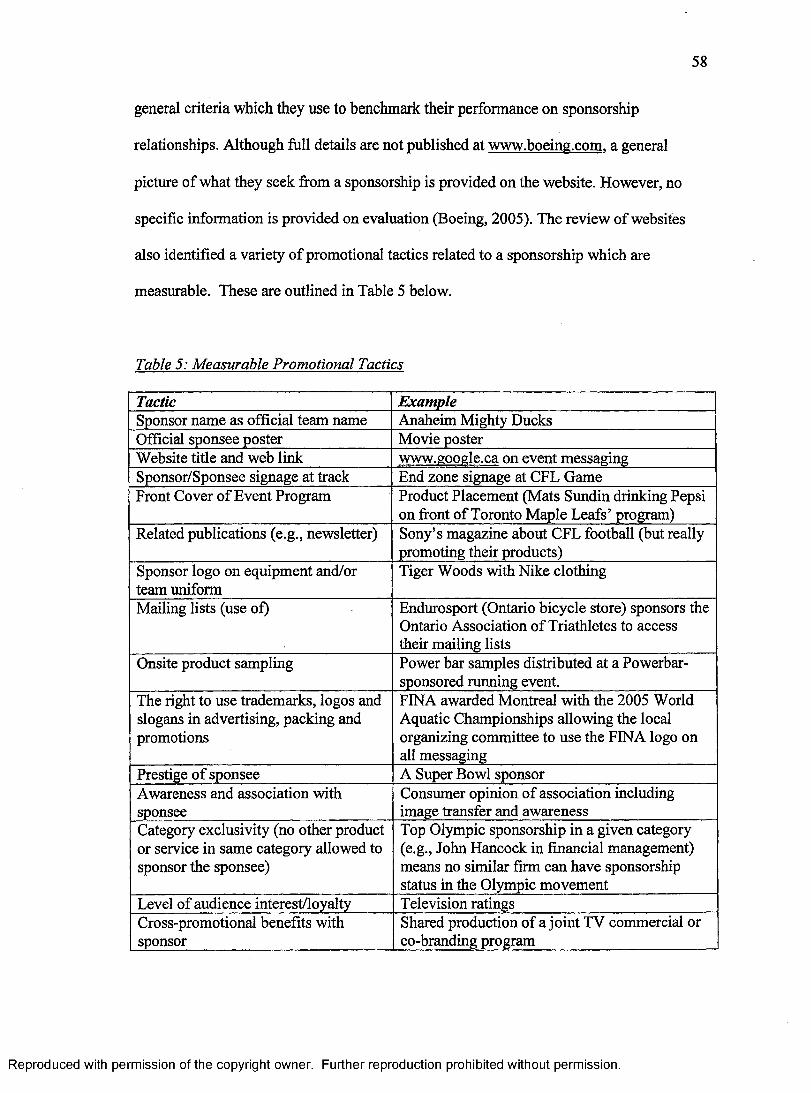
5 8
general criteria which they use to benchmark their performance on sponsorship
relationships. Although full details are not published at www.boeing.com. a general
picture of what they seek from a sponsorship is provided on the website. However, no
specific information is provided on evaluation (Boeing, 2005). The review of websites
also identified a variety of promotional tactics related to a sponsorship which are
measurable. These are outlined in Table 5 below.
Table 5: Measurable Promotional Tactics
Tactic ExampleSponsor name as official team name Anaheim Mighty DucksOfficial sponsee poster Movie posterWebsite title and web link www.gooele.ca on event messagingSponsor/Sponsee signage at track End zone signage at CFL GameFront Cover of Event Program Product Placement (Mats Sundin drinking Pepsi
on front of Toronto Maple Leafs’ program)Related publications (e.g., newsletter) Sony’s magazine about CFL football (but really
promoting their products)Sponsor logo on equipment and/or team uniform
Tiger Woods with Nike clothing
Mailing lists (use of) Endurosport (Ontario bicycle store) sponsors the Ontario Association of Triathletes to access their mailing lists
Onsite product sampling Power bar samples distributed at a Powerbar- sponsored running event.
The right to use trademarks, logos and slogans in advertising, packing and promotions
FINA awarded Montreal with the 2005 World Aquatic Championships allowing the local organizing committee to use the FINA logo on all messaging
Prestige of sponsee A Super Bowl sponsorAwareness and association with sponsee
Consumer opinion of association including image transfer and awareness
Category exclusivity (no other product or service in same category allowed to sponsor the sponsee)
Top Olympic sponsorship in a given category (e.g., John Hancock in financial management) means no similar firm can have sponsorship status in the Olympic movement
Level of audience interest/loyalty Television ratingsCross-promotional benefits with sponsor
Shared production of a joint TV commercial or co-branding program
Reproduced with permission of the copyright owner. Further reproduction prohibited without permission.
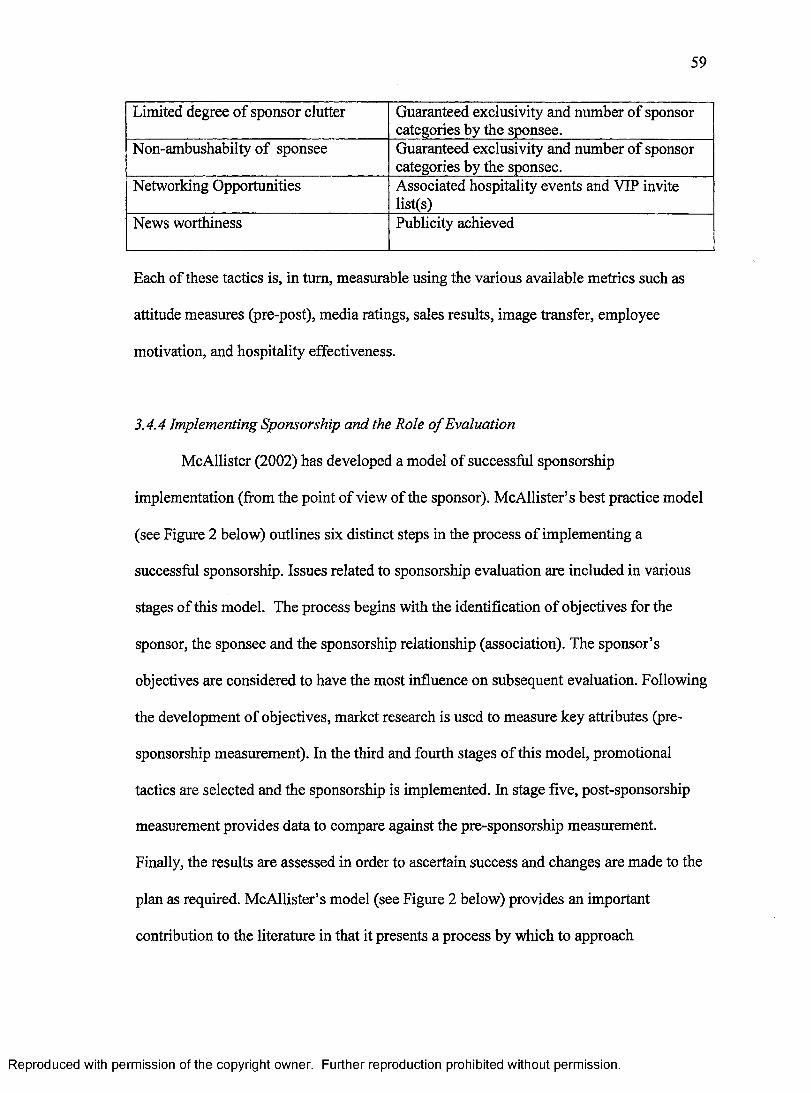
5 9
Limited degree of sponsor clutter Guaranteed exclusivity and number of sponsor categories by the sponsee.
Non-ambushabilty of sponsee Guaranteed exclusivity and number of sponsor categories by the sponsee.
Networking Opportunities Associated hospitality events and VIP invite list(s)
News worthiness Publicity achieved
Each of these tactics is, in turn, measurable using the various available metrics such as
attitude measures (pre-post), media ratings, sales results, image transfer, employee
motivation, and hospitality effectiveness.
3.4.4 Implementing Sponsorship and the Role o f Evaluation
McAllister (2002) has developed a model of successful sponsorship
implementation (from the point of view of the sponsor). McAllister’s best practice model
(see Figure 2 below) outlines six distinct steps in the process of implementing a
successful sponsorship. Issues related to sponsorship evaluation are included in various
stages of this model. The process begins with the identification of objectives for the
sponsor, the sponsee and the sponsorship relationship (association). The sponsor’s
objectives are considered to have the most influence on subsequent evaluation. Following
the development of objectives, market research is used to measure key attributes (pre
sponsorship measurement). In the third and fourth stages of this model, promotional
tactics are selected and the sponsorship is implemented. In stage five, post-sponsorship
measurement provides data to compare against the pre-sponsorship measurement.
Finally, the results are assessed in order to ascertain success and changes are made to the
plan as required. McAllister’s model (see Figure 2 below) provides an important
contribution to the literature in that it presents a process by which to approach
Reproduced with permission of the copyright owner. Further reproduction prohibited without permission.
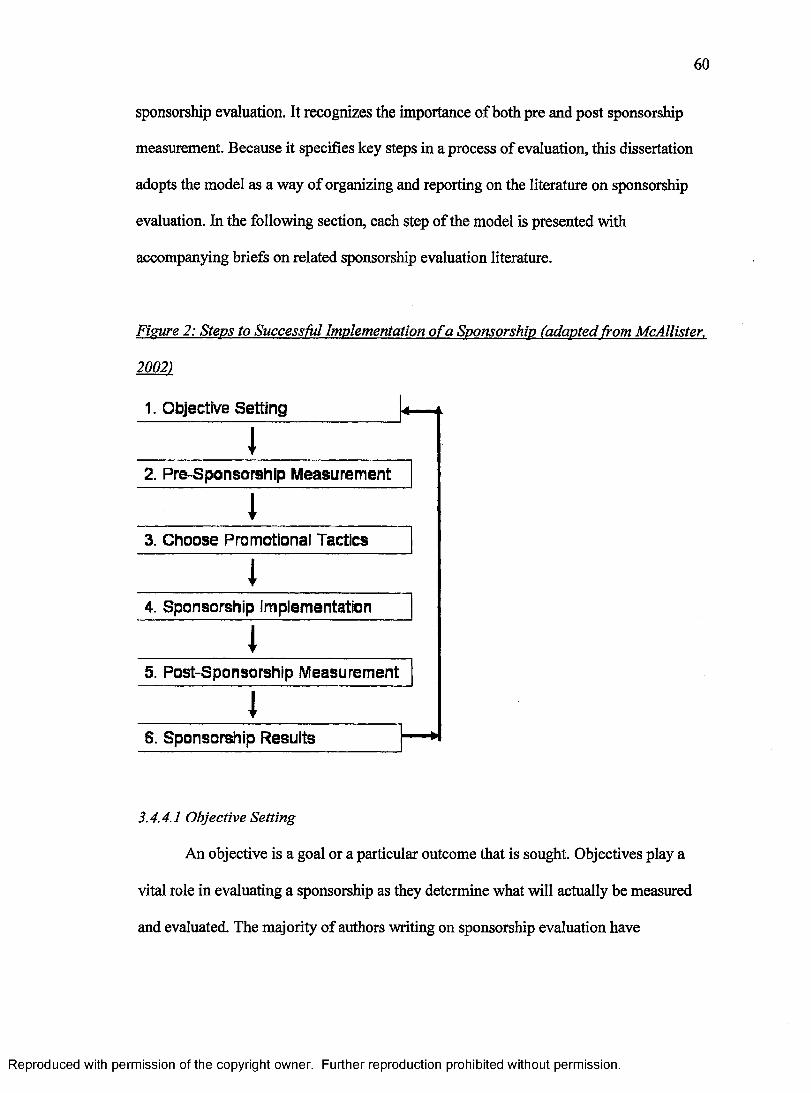
6 0
sponsorship evaluation. It recognizes the importance of both pre and post sponsorship
measurement. Because it specifies key steps in a process of evaluation, this dissertation
adopts the model as a way of organizing and reporting on the literature on sponsorship
evaluation. In the following section, each step of the model is presented with
accompanying briefs on related sponsorship evaluation literature.
Fieure 2: Steps to Successful Implementation o f a Sponsorship (adapted from McAllister,
2002)
1. Objective Setting <
12. Pre-Sponsorship Measurement
13. Choose Promotional Tactics
14. Sponsorship implementation
15. Post-Sponsorship Measurement
1S. Sponsorship Results
3.4.4.1 Objective Setting
An objective is a goal or a particular outcome that is sought. Objectives play a
vital role in evaluating a sponsorship as they determine what will actually be measured
and evaluated. The majority of authors writing on sponsorship evaluation have
Reproduced with permission of the copyright owner. Further reproduction prohibited without permission.
emphasized the importance of objectives in the sponsorship evaluation process
(Cornwell, Pruitt & Clark, 2005; Grohs, Wagner & Vsetecka, 2004; Jalleh, Donovan,
Giles-Corti & Holman, 2002; Meenaghan, 2002; Dean, 1999; Cornwell & Maignan,
1998; McDaniel & Kinney, 1998; Gwinner, 1997; Marshall & Cook, 1992; Crowley,
1991; Meerabeau, Gillet, Kennedy, Adeoba, Byasss & Tabi, 1991; Armstrong, 1988;
Gardiner & Shuman, 1988; Wolton, 1988). Thus, objectives must be developed and
managed carefully (Hoek, 1998). Most writers suggest that sales objectives are not a high
priority amongst sponsorship managers (e.g., Crompton, 2004a; Walliser, 2003; Cornwell
& Maignan, 1998; Grimes & Meenaghan, 1998; Hoek, 1998; Gwinner, 1997; Lee,
Sandler & Shani, 1997; Thwaites, 1995; Crowley, 1991). The most common
methodological approach in the literature has been to ask sponsors to rank the importance
of a set of sponsorship objectives via surveys or interviews (Mount & Niro, 1995;
Kuzma, Shanklin & McCally, 1993; Marshall & Cook, 1992; Otker, 1988). Thwaites,
Aguilar-Manjarrez and Kidd (1998) studied practices in the management of sponsorship
and assessed the extent to which selected Canadian organizations adopted the
prescriptions for effective sponsorship identified in the literature. They found that 82
percent of companies set specific objectives while 69 percent sought to formulate
objectives in a quantifiable manner.
Considerable empirical work exists in the literature on sponsorship objectives.
This research has demonstrated that a necessary first step in sponsorship evaluation is the
specification of clear objectives (Cornwell, Pruitt & Clark, 2005; Crompton, 2004a;
Abratt & Gobbler, 1992). Research also shows that a wide range of objectives are being
pursued by sponsors, sponsees and intermediaries (e.g., Polonsky & Speed, 2001).
Reproduced with permission of the copyright owner. Further reproduction prohibited without permission.
Further, the literature reveals that techniques borrowed from the evaluation of advertising
are most commonly used since consumer attitudes are more easily measured than links to
long-term sales (Nicholls, Roslow & Dublish, 1999; Stipp & Schiavone, 1996).
Cornwell’s (1995) work on the development of sponsorship-linked marketing discusses
two main measurement methods: (i) increase in market share and (ii) increase in sales.
She notes that such measures may be flawed in evaluating sponsorship due to their roots
in the evaluation of advertising whereby an assessment of the association via image
transfer is not included. This research demonstrates that effective evaluation is often not
done.
The literature on objectives specifically related to sponsorship evaluation provides
two important contributions to this dissertation. First, a considerable amount of research
has examined what objectives sponsors are seeking through sponsorship. The most
common objectives are awareness improvement, image enhancement, relationship
building through hospitality, and increased sales (Howard & Crompton, 1995; Berrett,
1993). Second, sponsors are seeking a considerable range of objectives through
sponsorship ranging from television exposure (Scott & Suchard, 1992; Meenaghan,
1991b; Witcher, Craigen, Culligan & Harvey, 1991) to reputation (Mason, 1999) to direct
access to participants (Berrett & Slack, 2001) to increased sales (Shank, 2005; 2002). A
complete list of objectives identified in the literature is attached as Appendix A. This list
of objectives can be grouped into eight summary areas, as presented below in Table 6:
Reproduced with permission of the copyright owner. Further reproduction prohibited without permission.
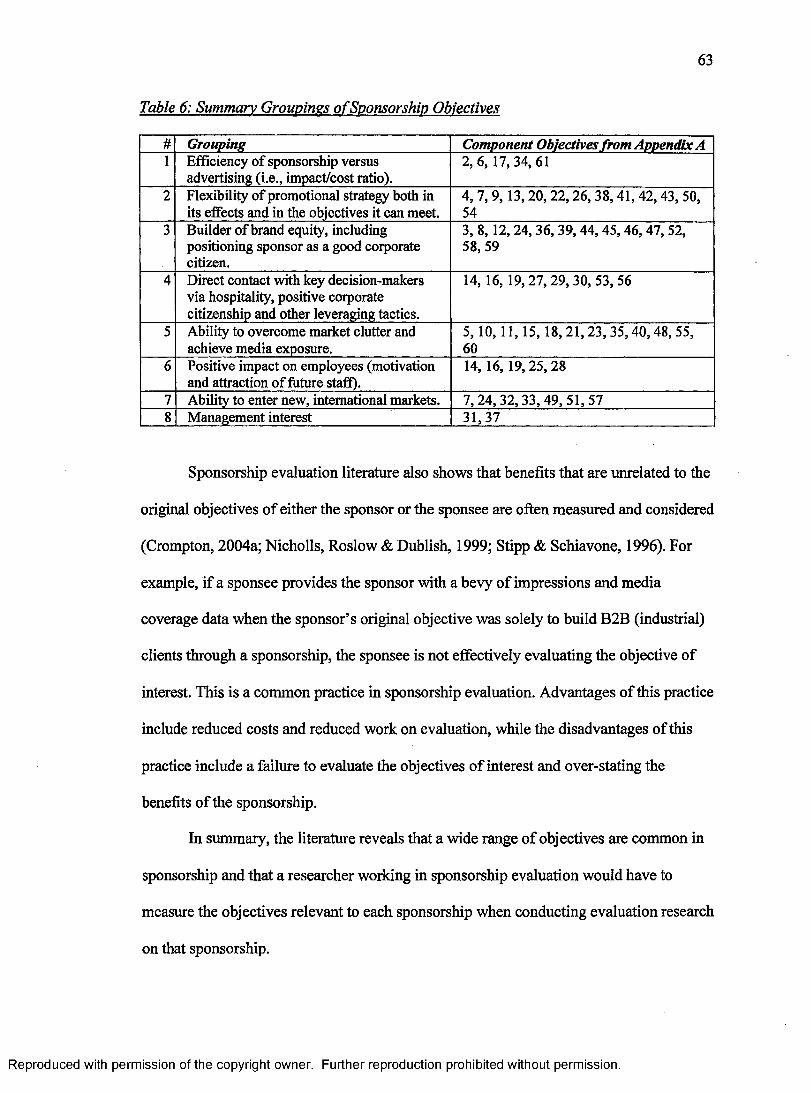
63
Table 6: Summary Groupings o f Sponsorship Objectives
# Grouping Component Objectives from Appendix A1 Efficiency o f sponsorship versus
advertising (i.e., impact/cost ratio).2, 6, 17,34,61
2 Flexibility o f promotional strategy both in its effects and in the objectives it can meet.
4, 7, 9 ,1 3 ,2 0 , 22,26, 38,41, 42,43, 50, 54
3 Builder o f brand equity, including positioning sponsor as a good corporate citizen.
3, 8, 12,24, 36, 39, 44 ,4 5 ,4 6 ,4 7 , 52, 58, 59
4 Direct contact with key decision-makers via hospitality, positive coiporate citizenship and other leveraging tactics.
14, 16, 19 ,27 ,29 ,30 , 53,56
5 Ability to overcome market clutter and achieve media exposure.
5, 10, 11, 1 5 ,1 8 ,2 1 ,2 3 ,3 5 ,4 0 ,4 8 , 55, 60
6 Positive impact on employees (motivation and attraction o f future staff).
14, 16, 19, 25, 28
7 Ability to enter new, international markets. 7 ,24 , 3 2 ,3 3 ,4 9 ,5 1 ,5 78 Management interest 31,37
Sponsorship evaluation literature also shows that benefits that are unrelated to the
original objectives of either the sponsor or the sponsee are often measured and considered
(Crompton, 2004a; Nicholls, Roslow & Dublish, 1999; Stipp & Schiavone, 1996). For
example, if a sponsee provides the sponsor with a bevy of impressions and media
coverage data when the sponsor’s original objective was solely to build B2B (industrial)
clients through a sponsorship, the sponsee is not effectively evaluating the objective of
interest. This is a common practice in sponsorship evaluation. Advantages of this practice
include reduced costs and reduced work on evaluation, while the disadvantages of this
practice include a failure to evaluate the objectives of interest and over-stating the
benefits of the sponsorship.
In summary, the literature reveals that a wide range of objectives are common in
sponsorship and that a researcher working in sponsorship evaluation would have to
measure the objectives relevant to each sponsorship when conducting evaluation research
on that sponsorship.
Reproduced with permission of the copyright owner. Further reproduction prohibited without permission.

6 4
3.4.4.2 Pre-Sponsorship Measurement
The second step in McAllister’s model involves the assessment of the sponsor’s
target market and the perceptions of that target market on a number of potential image
attributes of potential sponsees (e.g., their image, their brand, etc.) in order to determine
if the given sponsee’s image is consistent with the sponsor’s desired organizational
image/brand or product image/brand. McAllister (2002) recommends significant
investigation on the part of sponsors (and sponsees in the case of the mega-sponsee) in
assessing a roster of potential partners for developing a sponsorship relationship. The
literature advises taking a proactive stance in seeking out and selecting the appropriate
partner(s) whose image(s) fit(s) with the promotional objectives that the sponsor/mega-
sponsee is trying to achieve (Gwinner & Eaton, 1999). Achieving such a ‘fit’ enables
both sponsor and sponsee to leverage the association effectively to meet their own
specific objectives.
For sponsorship evaluation specifically, the importance in this step is three-fold.
First, the researcher needs to make sure that the sponsorship is worthy of evaluation. That
is, does the cost-benefit analysis make sense (i.e. is the benefit provided by the evaluation
greater than the resources required to undertake the evaluation (time, financial and
human))? Second, a researcher must identify all the objectives of the sponsors), sponsee
and intermediaries and verify that they are possible to evaluate. Finally, a well-planned
pre-test can provide (i) learning for future data collection and (ii) useful baseline
measurements.
Reproduced with permission of the copyright owner. Further reproduction prohibited without permission.
6 5
3.4.4.3 Choose Promotional Tactics
Following pre-measurement, the promotional tactics are chosen by the sponsor. In
McAllister’s (2002) model, this involves the selection of a sponsee. It is important to note
that, in the case of the mega-sponsee, it is the sponsee who has the greater power and
selects the sponsor.
Sponsee selection is the ‘sponsorship decision-making process’ for the typical
sponsor-sponsee relationship, where the sponsor is selecting from a group of interested
sponsees (e.g., Aguilar-Manjarrez, Thwaites & Maule, 1997; Cousens & Slack, 1996;
Thwaites, Aguilar-Manjarrez & Kidd, 1995). The literature suggests that there are several
considerations in this decision-making process including assessing the ‘fit’ or the
complimentary ability of the sponsor and the sponsee to achieve their objectives (Seguin,
Teed & O’Reilly, 2005; Cornwell & Maignan, 1998), having ‘common geographic
scope’ which refers to shared markets of interest (McCook, Turco & Riley, 1997),
protecting against ambushers/guaranteeing exclusivity (Arthur, Scott, Woods & Booker,
1998; Lee, Sandler & Shani, 1997), consideration of attendees of sponsee events (Brooks,
1994), access to television coverage (Bennett, 1999), and access to naming rights
(McCarthy & Irwin, 2000; 19-98).
With respect to sponsorship evaluation, two important points are revealed during
the selection of promotional tactics. First, the researcher must assess the importance of
the situation (typical versus mega-sponsee) and know where the specific sponsorship
falls. It is clear that the nature of the relationship is significantly different in each
situation. Second, it is vitally important for the researcher to understand how the decision
Reproduced with permission of the copyright owner. Further reproduction prohibited without permission.
6 6
is being made in order to conduct an effective evaluation. In this regard, the evaluator
needs to be very aware of the objectives sought by all parties involved in the sponsorship.
3.4.4.4 Sponsorship Implementation
Following the selection of the sponsee (or sponsor in the case of the mega-
sponsee), the sponsorship is implemented. Practitioners commonly refer to this step as
‘activation’. This involves ‘actioning’ the sponsor-sponsee contract. The implementation
of a sponsorship is a well articulated process with developed literature existing on various
promotional techniques (signage, endorsements, etc.), leveraging the association and the
media, and in various areas of sponsorship management including consumer reactions to
sponsorship, sponsorship objectives, sponsorship budgets, organizational structure and
individual needs addressed by sponsorship (e.g., Crompton, 2004b; Kover, 2001;
Lardinoit & Quester, 2001; Lyberger & McCarthy, 2001; Meenaghan, 2001; Farrelly,
Quester & Burton 1997; Anne & Cheron, 1991; Parker, 1991).
In terms of its benefit to sponsorship evaluation, this literature demonstrates that
the evaluation researcher needs to be involved in the sponsorship prior to activation in
order to enable effective data collection throughout the sponsorship implementation since
it is an iterative process. A number of researchers seek to provide practitioners with
guidance for their sponsorships in general. For example, Seguin, Teed and O’Reilly
(2005) adopted an in-depth, multi-case study approach to identify the Top 10
Sponsorship Best Practices.
Reproduced with permission of the copyright owner. Further reproduction prohibited without permission.
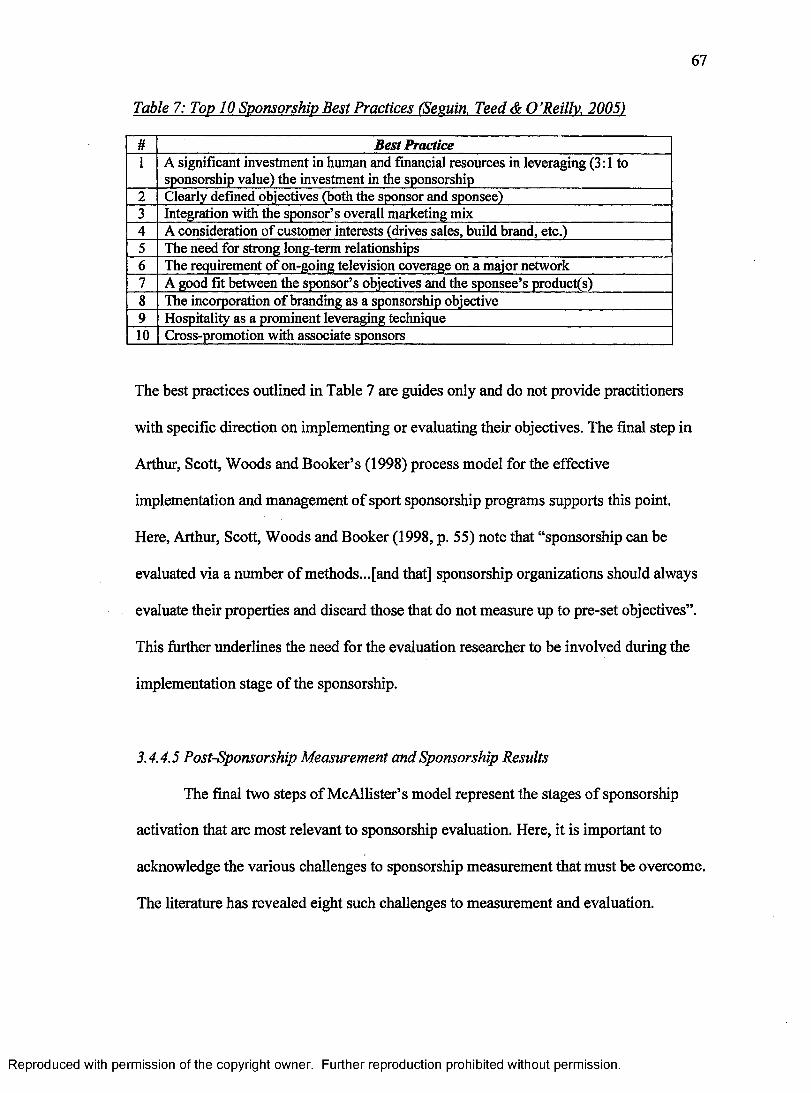
6 7
Table 7; Toy 10 Sponsorship Best Practices (Sesuin. Teed & O ’Reilly. 2005)
# Best Practice1 A significant investment in human and financial resources in leveraging (3:1 to
sponsorship value) the investment in the sponsorship2 Clearly defined objectives (both the sponsor and sponsee)3 Integration with the sponsor’s overall marketing mix4 A consideration o f customer interests (drives sales, build brand, etc.)5 The need for strong long-term relationships6 The requirement o f on-going television coverage on a major network7 A good fit between the sponsor’s objectives and the sponsee’s produces)8 The incorporation o f branding as a sponsorship objective9 Hospitality as a prominent leveraging technique10 Cross-promotion with associate sponsors
The best practices outlined in Table 7 are guides only and do not provide practitioners
with specific direction on implementing or evaluating their objectives. The final step in
Arthur, Scott, Woods and Booker’s (1998) process model for the effective
implementation and management of sport sponsorship programs supports this point.
Here, Arthur, Scott, Woods and Booker (1998, p. 55) note that “sponsorship can be
evaluated via a number of methods...[and that] sponsorship organizations should always
evaluate their properties and discard those that do not measure up to pre-set objectives”.
This further underlines the need for the evaluation researcher to be involved during the
implementation stage of the sponsorship.
3.4.4.5 Post-Sponsorship Measurement and Sponsorship Results
The final two steps of McAllister’s model represent the stages of sponsorship
activation that are most relevant to sponsorship evaluation. Here, it is important to
acknowledge the various challenges to sponsorship measurement that must be overcome.
The literature has revealed eight such challenges to measurement and evaluation.
Reproduced with permission of the copyright owner. Further reproduction prohibited without permission.
6 8
First, as noted earlier in this chapter, considerable literature argues that clear
behavioural objectives must be established upfront in order for sponsorship to be
effectively evaluated (Sandler & Shani, 1993; Abratt & Gobbler, 1992; Marshall & Cook,
1992; Meenaghan, 1991b). The objectives of both the sponsor and the sponsee must be
determined by the researcher. A well-articulated and complete sponsorship contract is
essential (Newbum, 2001; Bergen, Dutta, & Walker, 1992; Eisenhardt, 1989). The term
‘complete’ refers to the formal inclusion of as many of the sponsor’s and the sponsee’s
objectives as possible, as it is the implied, understood or informal objectives that are most
difficult to evaluate since the details are unclear, if not unknown.
Second, previous research has noted that a sponsor who typically invests in
sponsorship as part of an overall promotion strategy has an established promotional mix
prior to launching a sponsorship (Thwaites, Aguilar-Manjarrez & Kidd, 1998; Quester,
Burton & Farrelly, 1998). This implies that organizations who adopt sponsorship are
often doing so as part of a broader marketing strategy that includes integrated
promotional tactics (e.g., advertising, public relations, sales promotion, etc.) and the
leveraging of those tactics. Promotional activity concurrent to or in combination with
sponsorship may cloud or bias evaluation of the sponsorship either from current or carry-
on effects (Thwaites, Aguilar-Manjarrez & Kidd, 1998).
Third, pre-existing views of the sponsor, the sponsee and the sponsorship by
target markets may influence the evaluation process. In this regard, the literature points to
consumers and their awareness levels and opinions of the sponsor and the sponsee, as
well as their attitudes towards and intent to purchase sponsors’ products (Jalleh,
Donovan, Giles-Corti & Holman, 2002). In addition to a given consumer’s attitude
Reproduced with permission of the copyright owner. Further reproduction prohibited without permission.
6 9
towards the sponsor or sponsee, Stipp and Schiavone (1996) point to two additional
factors that decide if a sponsorship is effective or not in reaching a given consumer: how
the consumer perceives the quality of the leveraging activities incorporated by the
sponsor and the overall visibility of the sponsorship program. The measurement of these
factors is very challenging if the objectives being evaluated are broader than sales and
sales promotions (Hoek, 1998).
Fourth, each sponsorship objective may be linked to a different set of preferred
outcomes (e.g., financial, sales, consumers views, branding, etc.) which may or may not
correspond with the measurement tools used in empirical research (Mack, 1999). In
general, difficulty arises for one of three reasons: (i) measurement tools are applied
erroneously, (ii) no evaluation occurs, or (iii) inappropriate measurement tools are
applied. These challenges point to the need to expand and disseminate the tools available
for evaluating based on objectives, not based simply on available methodology. Clearly,
the misapplication of measurement tools (e.g., adopting metrics from advertising research
(recall and recognition) to evaluate sponsorship (Crompton, 2004a)), the snubbing of
evaluation and the failure to ground metrics in the objectives of interest are important
challenges facing sponsorship evaluation (Pope & Voges, 1994).
Fifth, in practice, some sponsorship managers have little interest in evaluating
their sponsorship investments; they adopt sponsorship programs to meet their own
personal needs and objectives (i.e., sponsoring a sport or an art in which they, or their
CEO, have a personal interest); (see Seguin, Teed & O’Reilly, 2005). Berrett and Slack
(1995) note that the existence of stated objectives and the existence of many unstated
objectives, such as personal interest, make the measurement process considerably more
Reproduced with permission of the copyright owner. Further reproduction prohibited without permission.
7 0
challenging. In situations such as these where the sponsorship contract is incomplete, or
the true rationale for its existence is hidden, evaluation will be flawed, particularly if
sponsors wish to keep their true objectives private.
A sixth challenge involves the consideration (if applicable) of the effect of
sponsee success (e.g., a winning sponsored team or a victorious sponsored track runner)
relative to an unsuccessful sponsee (e.g., a poor theatrical performance or technical
difficulties at a concert). Although some research in the area suggests that there is
considerable effect from success (Cornwell, Pruitt & van Ness, 2001) on the overall
ability of a sponsorship to achieve its objectives, the ability to define and measure
success remains a significant challenge in sponsorship evaluation.
Seventh, sponsorship evaluation in practice is often carried out using evaluation
tools from advertising which may not consider the association component of sponsorship
and, thus, does not address its full benefits. The adoption of advertising evaluation
methodologies to evaluate sponsorship is commonly cited in the literature (Crompton,
2004a; Sparks, 1997; Cornwell, 1995; Vavra, 1995; Brooks, 1994; Parker, 1991;
Meenaghan, 1983). Stipp and Schiavone (1996) argue that the development of
sponsorship-specific evaluation tools is needed to overcome such challenges.
Finally, specific metrics to measure awareness, interest and attitude are lacking in
the literature on sponsorship (Wilson, 1997). It is likely that metrics are in place in
practice, but they are proprietary in nature and not shared publicly. In this regard, Quester
and Farrelly (1998) have pointed out that sponsors should be measuring the awareness
that consumers have of their organization and its products and that of their competition.
This is important as market share (Quester & Farrelly, 1998) and prominent brands (Johar
Reproduced with permission of the copyright owner. Further reproduction prohibited without permission.
71
& Pham, 1999) can influence the effectiveness of a sponsorship relative to the
competition. Further, evaluation literature outside of sponsorship (e.g., Greene &
McClintock, 1991) has developed similar metrics that could be adapted.
3.5 Summary: Sponsorship Evaluation
The review via McAllister’s model provides direction around the evaluation of
sponsorship. First, it is necessary to fully identify and understand the objectives sought
by all relevant parties in a sponsorship. Ideally, the researcher would (i) have a reliable
framework with which to organize the evaluation and (ii) be involved early enough in the
sponsorship process to support the development of clear, measurable objectives. Second,
a researcher is directed to collect baseline measurements pre-sponsorship to determine if
the cost-benefit analysisjustifi.es spending resources on the evaluation of the sponsorship.
Third, the distinction between the typical sponsee and mega-sponsee scenarios was again
supported. The researcher needs to know which scenario they are working in and be
involved throughout the process. Finally, the many measurement challenges around
evaluation were described with a number of recommendations provided to the researcher,
including (i) the need for a complete sponsorship contract, (ii) access to marketing plans
for all organizations involved in the sponsorship, and (iii) tactics related to the attribution
issue.
Overall, the literature on sponsorship evaluation strongly supports the need for
improved tools and models for the sophisticated evaluation of sponsorship. A variety of
writers point to a number of these challenges, including (i) a lack of understanding of the
sponsor-sponsee relationship, (ii) the lack of consideration, specification and use of
Reproduced with permission of the copyright owner. Further reproduction prohibited without permission.
objectives in the evaluation process, (iii) the limited development of appropriate metrics,
(iv) the limited understanding of the barriers to, fears about, benefits of, and timing of
sponsorship evaluation, and (v) the difficulty of measuring accurately in the context of
larger marketing mixes. Despite the identification of these challenges, little is provided in
terms of how to evaluate sponsorships effectively. Ideally, a sophisticated process for
conducting sponsorship evaluation would be proposed and tested. However, to date, the
author found limited evidence of such a process. Even the literature that claims to provide
such a framework really does not do so. For example, although the process model
published by Arthur, Scott, Woods and Booker (2001) lists ten practices to adopt for
successful sponsorship management; it is not a step-by-step process model by which to
evaluate a sponsorship effectively.
Reproduced with permission of the copyright owner. Further reproduction prohibited without permission.
73
4.0 THEORETICAL FRAMEWORK
This chapter builds on the literature reviewed in the previous chapters with the
purpose of providing a clear theoretical foundation from which to view and evaluate
sponsorship. A number of business-based theoretical perspectives by which to view
sponsorship relationships are considered and Agency Theory is selected as the theoretical
framework to guide this dissertation. The rationale for this choice is presented, followed
by a review of Agency Theory and its utility as an appropriate theoretical framework on
which to base the research. This includes reviewing (i) the scope of Agency Theory, (ii)
its key concepts, branches and assumptions, (iii) the contract as its unit of analysis, and
(iv) crafting the first draft of the process model for sponsorship evaluation.
4.1 Selecting and introducing Agency Theory
A number of schools of thought have been developing to explain and explore
business relationships including relationship marketing, agency theory, partnership
theory, and strategic alliance theory. Each provides a different perspective on different
types of relationships. Relationship marketing is about improving relationships between
organizations and their customers by “building solid, long-term relationships with
customers [that] require a concentrated effort on the part of all employees and
management to get to know what satisfies the customer and what the customer values”
(Barnes, 2001). A strategic alliance, or interorganizational governance structure (Thorelli,
1986), focuses on relationships between two groups where the two groups become the
same entity with common objectives and an accompanying enhanced competitive
advantage (Ireland & Hitt, 1999; Borys & Jemison, 1989). Partnership theory focuses on
Reproduced with permission of the copyright owner. Further reproduction prohibited without permission.
7 4
situations where two or more entities support each other and work collaboratively
towards common outcomes but do not merge into one entity to do so (Rees & Gardiner,
2003). Deemed “important yet controversial14” (Eisenhardt, 1989, p. 57), Agency Theory
views a business relationship as a principal-agent relationship, where one group (i.e., the
principal) relies on another group (i.e., the agent) to carry out some endeavour on behalf
of the principal (Bahli & Rivard, 2003; Bergen, Dutta, & Walker, 1992; Eisenhardt,
1989).
Agency Theory has received considerable attention in many literatures, including
accounting, economics (where it began), finance, marketing, political science,
organizational behaviour and sociology (Eisenhardt, 1989), as a means to explain the
relationships involved in cooperative effort between a principal and an agent of that
principal in pursuit of a common business outcome. Eisenhardt (1989) points out that an
agency relationship assumes that each party in the relationship has their own motive since
their goals are not congruent. This infers that in any agency relationship, although it
involves the agent working on behalf of the principal towards a common objective (as
determined by the principal), both groups have their own ‘bottom line’ rationale (which
may or may not be profit) for being involved in the relationship. It should also not be
assumed that the principal benefits more than the agent, as this is not always the case
(Sappington, 1991; Ross, 1973).
During its ‘glory years’ of the early 1980’s, Agency Theory was hailed by many
as a powerful lens through which to view organizations (e.g., Jensen, 1983). It was
thought that it would provide the solution to many of the challenges facing principals.
14 This dichotomy proposed by Eisenhardt (1989) stems from the duality of Agency Theory’s effective (i.e. important) yet impersonal (i.e. controversial) view on business relationships.
Reproduced with permission of the copyright owner. Further reproduction prohibited without permission.

7 5
Conversely, other theorists (e.g., Perrow, 1986) viewed Agency Theory as degrading to
those involved and overly simplistic in its application. These authors argue that the
principal-agent view of a relationship is limited in its ability and potentially threatening
for the agent (i.e., the use of an agency approach could potentially lead to the exploitation
of workers).
4.1.1. The scope o f Agency Theory
Ross (1973, p. 134) claimed that “examples of Agency Theory are universal”,
indicating the broadest of scopes. Others have been very critical of the broad range,
stating that Agency Theory looks only at stock prices (Hirsch & Friedman, 1986) or that
it fails to truly address any problems of interest (Perrow, 1986). Historically, the value of
Agency Theory has been most evident in the economics literature (e.g., Sappington,
1991; Harris & Raviv, 1979; Ross, 1973) while it was originally believed to be less
valuable to organizational scholars (Eisenhardt, 1989). Recently, however, organizational
researchers have applied Agency Theory to such relationships as consultants and clients
(Basu & Lederer, 2004), ERP implementation consultants and client organizations (Basu
& Lederer, 2004), IT outsourcers and suppliers (Bahli & Rivard, 2003), international
retailers and franchisees (Doherty & Quinn, 1999), advertising agencies and their clients
(Waller, 2004), shareholders and managers in general (Eisenhardt, 1989) and information
policy in agency relationships (Jacobides & Croson, 2001). Today, research grounded in
Agency Theory continues to be found in the marketing literature and that of political
science, finance, sociology, accounting, organizational behaviour, information
Reproduced with permission of the copyright owner. Further reproduction prohibited without permission.

7 6
technology, economics, and engineering, demonstrating the ongoing relevance of the
theory.
Examples of relationships where an agency perspective would be appropriate are
many and include most relationships between an organization and a facilitating agency
(Bergen, Dutta, & Walker, 1992). A facilitating agency can include such entities as
sponsors, advertising agencies, research suppliers, publication warehouses and marketing
agencies that act as specialists and implement some marketing objective on behalf of the
principal. Facilitating agencies are remunerated by the principal in return for the work
they provide. The form of payment is often fee-for-service or commission, but in the case
of sponsorship could involve either a cash payment or the provision of in-kind product. It
is important to note that an agency relationship may be more complex (i.e., involve more
than 2 parties) than principal-agent. An example (see Table 8) would be the relationship
between the owner of an NFL franchise and her star quarterback, where a number of
other parties (i.e., player agent, General Manager of franchise, lawyers, coach, player’s
family) are also directly and indirectly involved in the relationship.
Table 8: Asencv Relationship Example: NFL Franchise and Star Quarterback
Party Agency Theory Role DescriptionStar Quarterback Agent Asked to complete a role on behalf of the
owner.Player’s Family Intermediary (Agent) Influences player actions.Player’s Agent Intermediary (Agent) Acts on behalf of player in negotiations with
principal (owner).Player’s Doctor Intermediary (Agent) Influences player actions.Player’s Lawyer Intermediary (Agent) Acts on behalf of player and advises player
in negotiations with principal (owner).Owner Principal Entity seeking to achieve objective of on
field success by engaging star quarterback (agent).
Reproduced with permission of the copyright owner. Further reproduction prohibited without permission.
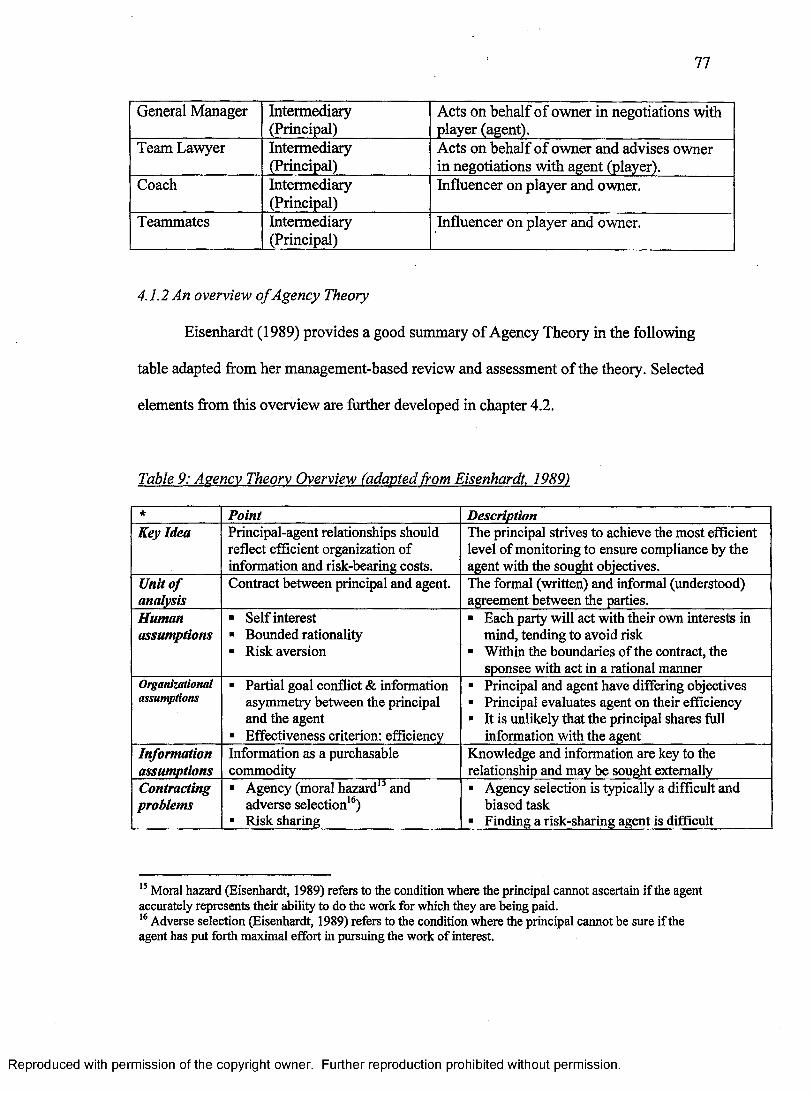
7 7
General Manager Intermediary(Principal)
Acts on behalf of owner in negotiations with player (agent).
Team Lawyer Intermediary(Principal)
Acts on behalf of owner and advises owner in negotiations with agent (player).
Coach Intermediary(Principal)
Influencer on player and owner.
Teammates Intermediary(Principal)
Influencer on player and owner.
4.1.2 An overview o f Agency Theory
Eisenhardt (1989) provides a good summary of Agency Theory in the following
table adapted from her management-based review and assessment of the theory. Selected
elements from this overview are further developed in chapter 4.2.
Table 9: Agency Theory Overview (adapted from Eisenhardt. 1989)
* Point DescriptionKey Idea Principal-agent relationships should
reflect efficient organization o f information and risk-bearing costs.
The principal strives to achieve the most efficient level o f monitoring to ensure compliance by the agent with the sought objectives.
Unit of analysis
Contract between principal and agent. The formal (written) and informal (understood) agreement between the parties.
Humanassumptions
■ Self interest■ Bounded rationality■ Risk aversion
■ Each party will act with their own interests in mind, tending to avoid risk
■ Within the boundaries o f the contract, the sponsee with act in a rational manner
Organizationalassumptions
■ Partial goal conflict & information asymmetry between the principal and the agent
■ Effectiveness criterion: efficiency
■ Principal and agent have differing objectives■ Principal evaluates agent on their efficiency■ It is unlikely that the principal shares full
information with the agentInformationassumptions
Information as a purchasable commodity
Knowledge and information are key to the relationship and may be sought externally
Contractingproblems
■ Agency (moral hazard15 and adverse selection16)
■ Risk sharing
■ Agency selection is typically a difficult and biased task
■ Finding a risk-sharing agent is difficult
15 Moral hazard (Eisenhardt, 1989) refers to the condition where the principal cannot ascertain if the agent accurately represents their ability to do the work for which they are being paid.16 Adverse selection (Eisenhardt, 1989) refers to the condition where the principal cannot be sure if the agent has put forth maximal effort in pursuing the work of interest.
Reproduced with permission of the copyright owner. Further reproduction prohibited without permission.
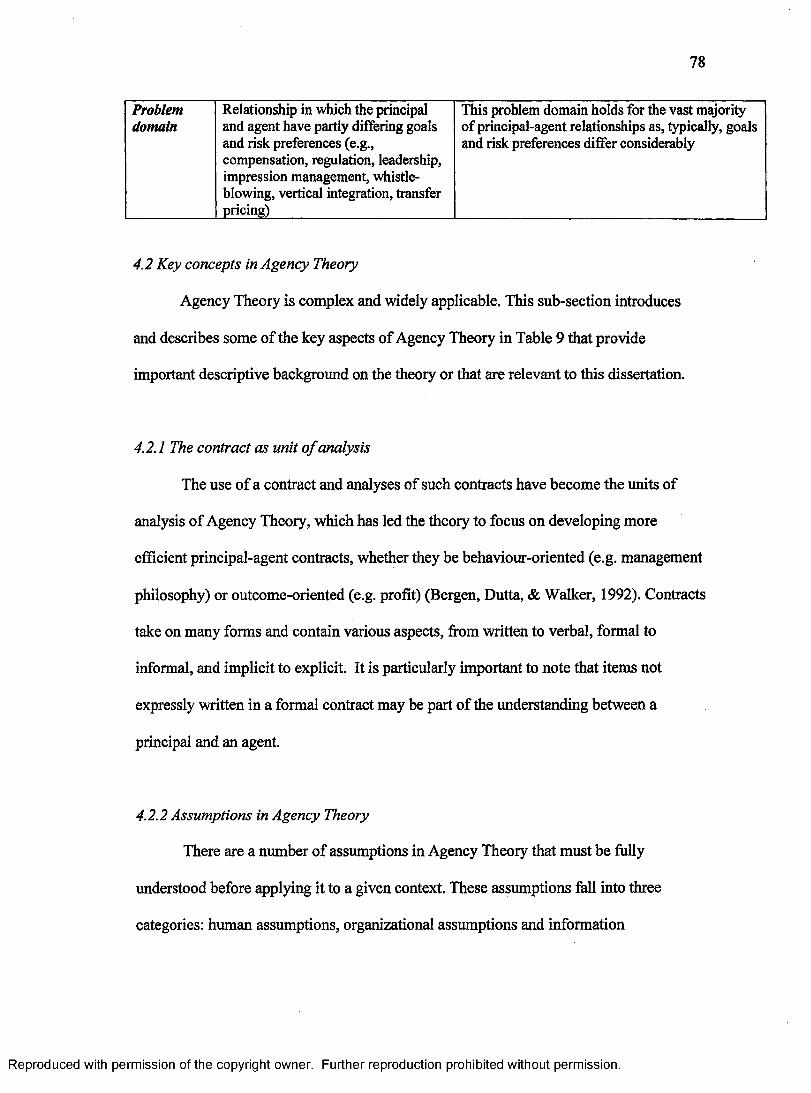
7 8
Problem Relationship in which the principaldomain and agent have partly differing goals
and risk preferences (e.g., compensation, regulation, leadership, impression management, whistleblowing, vertical integration, transfer pricing)
This problem domain holds for the vast majority o f principal-agent relationships as, typically, goals and risk preferences differ considerably
4.2 Key concepts in Agency Theory
Agency Theory is complex and widely applicable. This sub-section introduces
and describes some of the key aspects of Agency Theory in Table 9 that provide
important descriptive background on the theory or that are relevant to this dissertation.
4.2.1 The contract as unit o f analysis
The use of a contract and analyses of such contracts have become the units of
analysis of Agency Theory, which has led the theory to focus on developing more
efficient principal-agent contracts, whether they be behaviour-oriented (e.g. management
philosophy) or outcome-oriented (e.g. profit) (Bergen, Dutta, & Walker, 1992). Contracts
take on many forms and contain various aspects, from written to verbal, formal to
informal, and implicit to explicit. It is particularly important to note that items not
expressly written in a formal contract may be part of the understanding between a
principal and an agent.
4.2.2 Assumptions in Agency Theory
There are a number of assumptions in Agency Theory that must be fully
understood before applying it to a given context. These assumptions fall into three
categories: human assumptions, organizational assumptions and information
Reproduced with permission of the copyright owner. Further reproduction prohibited without permission.
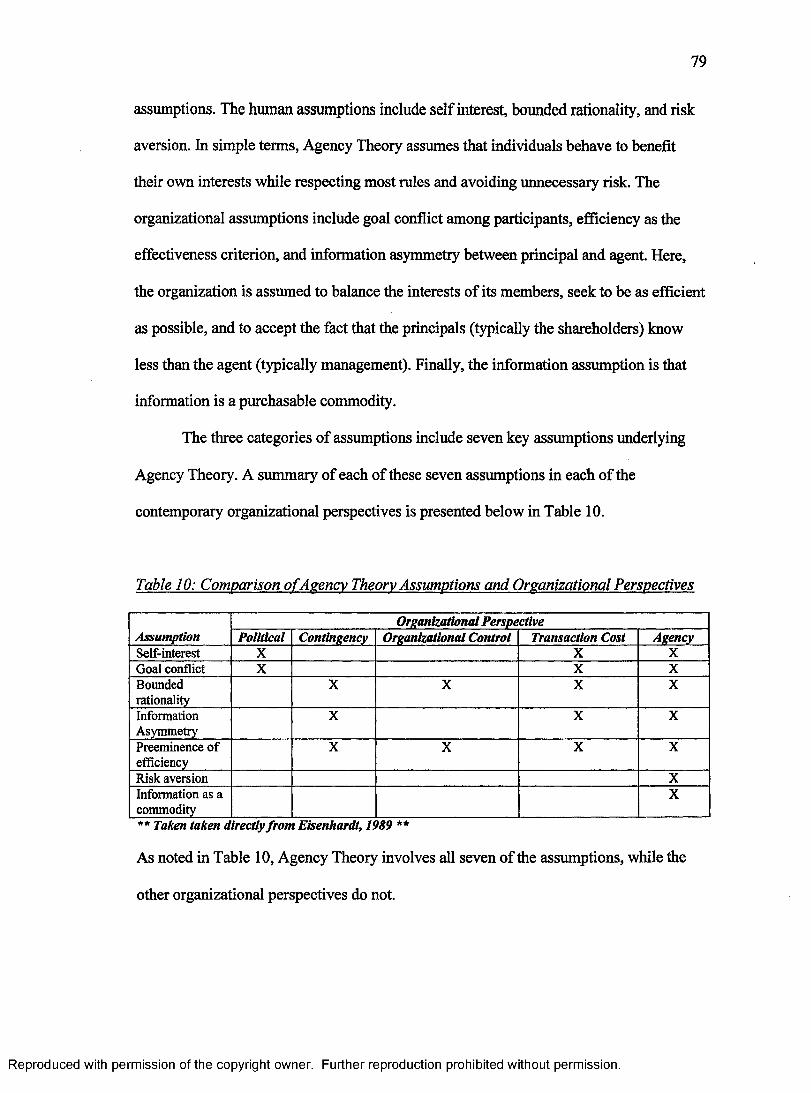
7 9
assumptions. The human assumptions include self interest, bounded rationality, and risk
aversion. In simple terms, Agency Theory assumes that individuals behave to benefit
their own interests while respecting most rules and avoiding unnecessary risk. The
organizational assumptions include goal conflict among participants, efficiency as the
effectiveness criterion, and information asymmetry between principal and agent. Here,
the organization is assumed to balance the interests of its members, seek to be as efficient
as possible, and to accept the fact that the principals (typically the shareholders) know
less than the agent (typically management). Finally, the information assumption is that
information is a purchasable commodity.
The three categories of assumptions include seven key assumptions underlying
Agency Theory. A summary of each of these seven assumptions in each of the
contemporary organizational perspectives is presented below in Table 10.
Table 10: Comparison of Agency Theory Assumptions and Organizational Perspectives
AssumptionOrganizational Perspective
Political Contingency Organizational Control Transaction Cost AgencySelf-interest X X XGoal conflict X X XBoundedrationality
X X X X
InformationAsymmetry
X X X
Preeminence of efficiency
X X X X
Risk aversion XInformation as a commodity
X
** Taken taken directly from Eisenhardt, 1989 **
As noted in Table 10, Agency Theory involves all seven of the assumptions, while the
other organizational perspectives do not.
Reproduced with permission of the copyright owner. Further reproduction prohibited without permission.
8 0
4.2.3 Monitoring in Agency Theory
Agency Theory typically examines, from the principal’s point of view, the trade-
offbetween the cost of monitoring the agent and the attainment of the principal’s
objectives where the contract between the two groups is the unit of analysis. It is a well
established tenet of Agency Theory that the principal cannot monitor the actions of the
agent perfectly or without costs (Sappington, 1991), where the costs refer to resolving
conflicts between principals and their agents and aligning the interests of the two groups
(Jacobides & Croson, 2001). This brings forth such issues as ‘power’ and ‘trust’, as both
variables impact how much autonomy the principal gives to the agent and how much cost
is incurred by the principal when such autonomy is not granted. It must also be
recognized that this issue can swing the other way, where the agent may not trust the
principal and must incur costs in monitoring the principal (e.g., making sure they are
reimbursed, ensuring that their own brand is respected, etc.). In both cases, it is the
combination of the principal’s trust of the agent and the sharing of risk by the agent that
leads to potential costs on both sides (Eisenhardt, 1989). It is important to note that the
dimension of time, either the length of the relationship or the stage of its development,
should also be considered when adopting an Agency Theory approach (Morgan & Hunt,
1994). Typically, however, the literature focuses on the principal’s monitoring costs as
opposed to power, time and trust (Ross, 1973).
4.2.4 Agency Theory in economics, marketing and management
Agency Theory was bom in public sector economics as a way by which to view
the ‘problem’ that governments face in controlling the behaviour of their employees to
Reproduced with permission of the copyright owner. Further reproduction prohibited without permission.
insure that they act in the best interests of society and not themselves (e.g., Harris &
Raviv, 1979). This form of a principal-agent relationship was the beginning of the
development of this theory and focused very much on the incentives required to deal with
the agency problem (Sappington, 1991; Harris & Raviv, 1979; Alchian & Demsetz,
1972). These early writings presumed that the objectives of the relationship were defined
by the principal and implemented by the agent, where the agent possesses more
information than the principal (i.e., asymmetric information) and, as such, the principal is
required to spend resources monitoring the agent to insure compliance. In addition, the
fact that random external events (e.g., unforeseen economic, environmental, political,
competitive and social changes) could influence the relationship was an important aspect
of early Agency Theory (Harris & Raviv, 1979).
From a management perspective, Eisenhardt (1989, p. 58) describes Agency
Theory as “directed at the ubiquitous agency relationship, in which one party (the
principal) delegates work to another (the agent), who performs that work”. Recently,
Agency Theory has been applied in the management literature with a number of useful
applications identified such as the Board-CEO and Sales Director-Sales Person
relationships. For example, Bahli and Rivard (2001) use Agency Theory as one of the
theoretical foundations of their work on outsourcing in IT. Of particular note is the
authors’ use of Agency Theory to develop risk scenarios around IT sourcing principal-
agent relationships. Measurement problems are also identified by Bahli & Rivard (2003)
as a risk factor that can lead to disputes and potential litigation. This point is particularly
relevant to sponsorship evaluation where measurement has limited use in theory and
practice. Whether it evolves to litigation or not, a breakdown in a principal-agent
Reproduced with permission of the copyright owner. Further reproduction prohibited without permission.
8 2
relationship always has consequences: services debasement and/or cost escalation.
Service debasement refers to a reduction in the amount or quality of service performed by
the agent, while cost escalation implies a rise in cost to the principal. Each can occur at
any point in the relationship and both are closely related and one can lead to the other
(Bahli & Rivard, 2003).
The move of the most widely-accepted definition of marketing from its focus on
the concept of the exchange (Arrow, 1985; Bagozzi, 1974) to a relationship-based
17definition (American Marketing Association , 2004) is a demonstration of the growing
importance of relationships in marketing theory (e.g., Barnes, 2001) and further validates
the appropriateness of an Agency Theory perspective on marketing concepts, including
sponsorship evaluation. Aijo (1996) reviewed the theoretical development of
relationships in management and in marketing and proposed that it represented a
paradigm shift in the field, driven by technology improvements that enable closer firm-
customer relationships. Gummesson (2004, p. 136), who defines relationship marketing
as “marketing based on interaction within networks of relationships”, tells of how
relationship marketing evolved into one-to-one marketing and then to customer
relationship marketing (CRM), the name by which it is often described today.
Gummesson’s work demonstrates the evolution of relationship marketing, as it
theoretically develops the concepts of B2B (business-to-business) relationship marketing
as distinct from B2C (business-to-customer) relationship marketing and introduces ROR
(return on relationship). ROR is a marketing metric to measure the “long-term net
17 For reference, the American Marketing Association’s new definition is “marketing is an organizational function and a set of processes for creating, communicating and delivering value to customers and for managing customer relationships in ways that benefit the organization and its stakeholders” (American Marketing Association, 2004).
Reproduced with permission of the copyright owner. Further reproduction prohibited without permission.
83
financial outcome caused by the establishment and maintenance of an organization’s
network of relationships” (Gummesson, 2004, p. 141). Numerous other authors have also
written about relationship marketing, including Rowley (2004) who develops relationship
marketing and knowledge management as complementary paradigms and Gronroos
(2004) who proposes the process by which relationship marketing occurs. Bergen, Dutta
and Walker (1992) add that the majority of all marketing transactions occur via
“facilitating agencies” contracted by the principal or the agent on some kind of
remuneration basis and point out that the ultimate consumer can also be viewed as being
in a principal-agent relationship, as explained below:
A given individual can shift from the role of principal to that of an agent across different contexts. For instance, a purchasing agent acts primarily as an agent whose job is to represent the needs and interests of others in the firm when buying goods and services from outside suppliers.However, when seeking information from a given supplier on which to base a purchase decision, the purchasing agent acts like a principal and the supplier’s salesperson is the agent. Thus, relationships are context specific, and agency models should be used to examine the relationship that is specific within a single context. (Bergen, Dutta, & Walker, 1992, p. 26)
This differs from the view of economists who are primarily interested in the incentives
needed to control the agency problem while marketers are focused on the exchange that
takes place between the two parties in a given relationship, and how to insure that the
objectives of both parties are met in an efficient manner.
The fact that the closely related theory of transaction cost economics has a
significant track record of use in the marketing literature strongly supports the application
of Agency Theory to marketing issues. Both transaction cost analysis and Agency Theory
“examine efficiency aspects of how firms organize functional relationships” (Bergen,
Dutta, & Walker, 1992, p. 29) and are deemed to be complementary as both study
Reproduced with permission of the copyright owner. Further reproduction prohibited without permission.
8 4
contracts and involve relationships where both parties act in self-interest (Williamson,
1988; Anderson & Oliver, 1987).
Bergen, Dutta and Walker (1992) identified three major areas where Agency
Theory has been applied in marketing: (i) sales force management, (ii) distribution
channel coordination and control, and (iii) promotion (Bergen, Dutta, & Walker, 1992).
Research pertaining to the relationship between a sales manager and a sales person (e.g.,
John, Weiss, & Weitz, 1987) has typically centered on the determination of the most
efficient and effective sales compensation plan to enhance sales. Previous studies on
channel coordination and control (e.g., Moorthy, 1987) have been built on the idea that a
distribution channel is a set of principal-agency relationships and related research areas
(i.e., pricing mechanisms, franchising agreements, incentives, etc.). Promotion-based
research using Agency Theory (e.g., Nelson, 1974) has focused mainly on the
organization-consumer relationship and the signals of product quality from producers to
consumers. In this relationship, the consumer is considered an agent as the organization
(principal) seeks to inspire behaviour in consumers that expresses product quality to other
potential consumers (e.g., positive word of mouth, observable product usage, etc.).
In summary, a management (Eisenhardt, 1989) or marketing (Bergen, Dutta, &
Walker, 1992) view of Agency Theory moves beyond the consideration of the principal’s
interest in the formal contract to include a broader understanding of a contract (i.e., both
formal and informal) and to consider the objectives of the agent as equal in importance.
Reproduced with permission of the copyright owner. Further reproduction prohibited without permission.
8 5
4.2.5 Information and Agency Theory
The concept that information is a commodity that has a cost and can be purchased
is unique to organizational research and implies that organizations can invest in
1 Rinformation systems as a method of controlling agent opportunism (Eisenhardt, 1989).
The concept of executive compensation is a good example of this contribution. While
significant literature has called for increased executive compensation based on
performance (Bebchuk & Fried, 2003), an Agency Theory perspective would say that
executive performance is contingent on a number of factors including information
systems, ability to motivate employees, skills, experience, etc. For example, in the case of
information systems, an agency theorist would argue that improved information systems
would decrease managerial opportunism (also known as ‘shirking’) and, in turn, result in
a decrease in performance-based pay.
4.2.6 Risk preference and the variables in Agency Theory
The uncertainty of the external environment on the risk aversion of either the
principal or the agent is important in Agency Theory (Eisenhardt, 1989). Risk, in this
case, is “viewed in terms of risk/reward trade-off, not just in terms of inability to plan”
(Eisenhardt, 1989, p. 62) inferring that the contract between principal and agent is
influenced both by uncertainty and the willingness of both parties to accept risk. As a
point of clarification, a new venture considering the ‘make or buy’ decision illustrates the
18 Information systems can be formal and informal and include such things as budgeting, managerial supervision, boards of directors, and databases. Of note, Eisenhardt (1989) identifies boards of directors as particularly relevant in organizational studies as they may be used as a formal information system to monitor executives on behalf of shareholders. As boards become more involved, opportunities for management ‘shirking’ are decreased and rewards take the form of behaviour-based results (i.e. strategic action) over outcomes.
Reproduced with permission of the copyright owner. Further reproduction prohibited without permission.
8 6
risk contribution. In this situation, the firm has limited resources and the likelihood of
failure (uncertainty) is high, which means that management would likely be risk-averse,
leading them to a ‘buy’ selection (i.e., transfer the risk to the supplier); (Eisenhardt,
1989).
Figure 3 below describes the variables at play in a principal-agent relationship. Of
particular note is the focus on an efficient contract moderated by the environment. In
most cases of principal-agent relationships and contracts, efficiency is defined and
determined from the principal’s point of view. This is because the principal is assumed
to be the dominant party in the relationship where it is their desired outcomes that are
considered as opposed to the objectives of the agent (Bergen, Dutta, & Walker, 1992).
Although the development of Agency Theory has centered on formal contracts, it has
been applied to social contracts as well (Bergen, Dutta, & Walker, 1992) indicating that
the informal aspects of any contract must also be considered. This is very important in
business research as hand shakes, mutual understandings (‘my word’) and informal
contracts are often the relationship guiding mechanism of choice. Due to the realities of
day-to-day business and legal costs, even formal contracts rarely include all details and
fully elaborate all roles and responsibilities.
Reproduced with permission of the copyright owner. Further reproduction prohibited without permission.
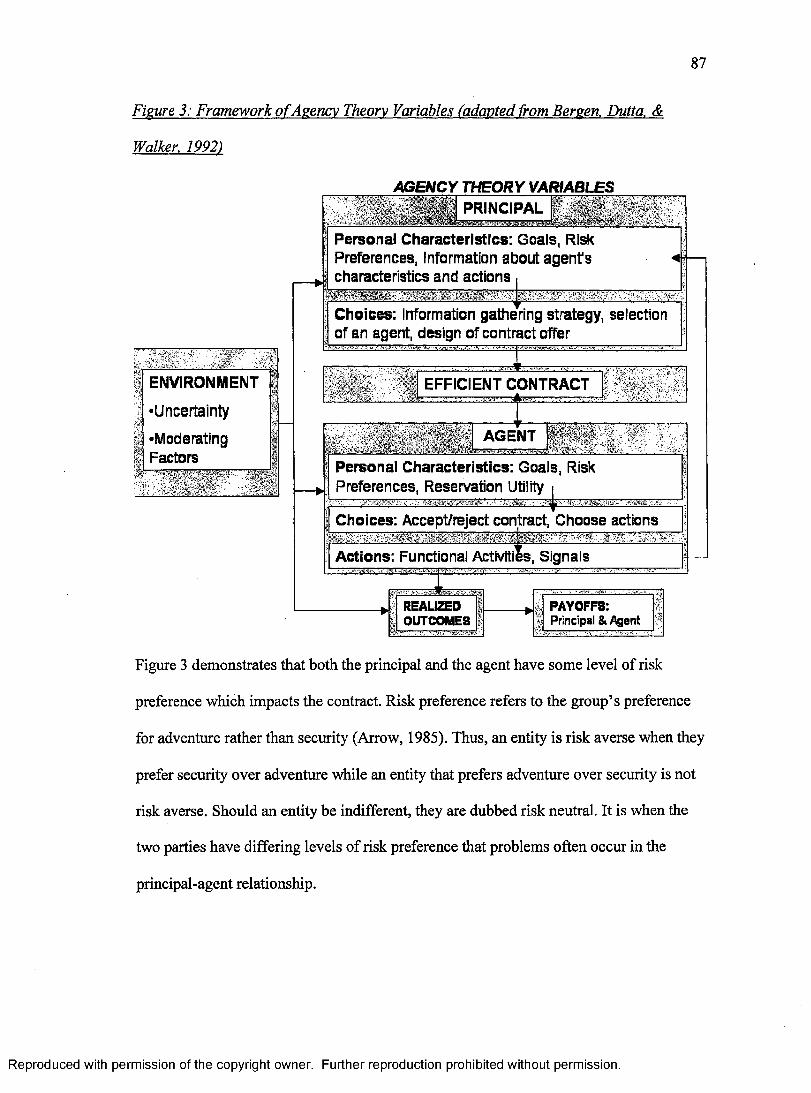
8 7
Fisure 3: Framework o f Asencv Theory Variables (adapted from Bergen. Dutta. &
Walker. 1992)
AGENCY THEORY VARIABLESPRINCIPAL
ENVIRONMENT
•Uncertainty
•ModeratingFactors
A - ilH
Personal Characteristics: Goals, Risk Preferences, Information about agent's characteristics and actions
Choices: Information gathering strategy, selection of an agent, design of contract offer
EFFICIENT CONTRACT
n.* «f w i' R:
tmmt
AGENT
Personal Characteristics: Goals, Risk Preferences, Reservation Utility i
4 sChoices: Accept/reject contract, Choose actions
Actions: Functional Activities, Signals
REALIZEDOUTCOMES
PAYOFFS:Principal & Agent
Figure 3 demonstrates that both the principal and the agent have some level of risk
preference which impacts the contract. Risk preference refers to the group’s preference
for adventure rather than security (Arrow, 1985). Thus, an entity is risk averse when they
prefer security over adventure while an entity that prefers adventure over security is not
risk averse. Should an entity be indifferent, they are dubbed risk neutral. It is when the
two parties have differing levels of risk preference that problems often occur in the
principal-agent relationship.
Reproduced with permission of the copyright owner. Further reproduction prohibited without permission.
8 8
4.2.7 Incentives and self-interest in Agency Theory
Perrow (1986) proposes that the introduction of Agency Theory to organizational
thinking had a role in re-establishing the concepts of incentives and self-interest in related
research. Perrow’s view infers that organizational life - like most forms of life - is based
on self-interest (Eisenhardt, 1989). Although both incentives and self-interest, like
Agency Theory itself, come from economics, Perrow (1986) reminds us of the
complexity of relationships, in particular intra-organizational and inter-organizational
ones implying that Agency Theory plays a key role in keeping business research centered
on theory and topic, as opposed to topic only which some have argued is a problem in
business research (e.g., Barney, 1991; Barzel, 1982). For Agency Theory specifically,
this infers that the self-interest of both principal and agent, as well as the incentives
necessary to engage both, are important considerations.
4.2.8 The two branches o f Agency Theory
Two camps have developed in the literature related to Agency Theory: positivist
Agency Theory and principal-agent research. Positivist researchers focus on “identifying
situations in which the principal and agent are likely to have conflicting goals and then
describing the governance mechanisms that limit the agent’s self-serving behaviour”
(Eisenhardt, 1989, p. 66), while principal-agent researchers focus on the application of
Agency Theory towards the efficient and effective functioning of principal-agent
relationships (Harris & Raviv, 1978).
Reproduced with permission of the copyright owner. Further reproduction prohibited without permission.
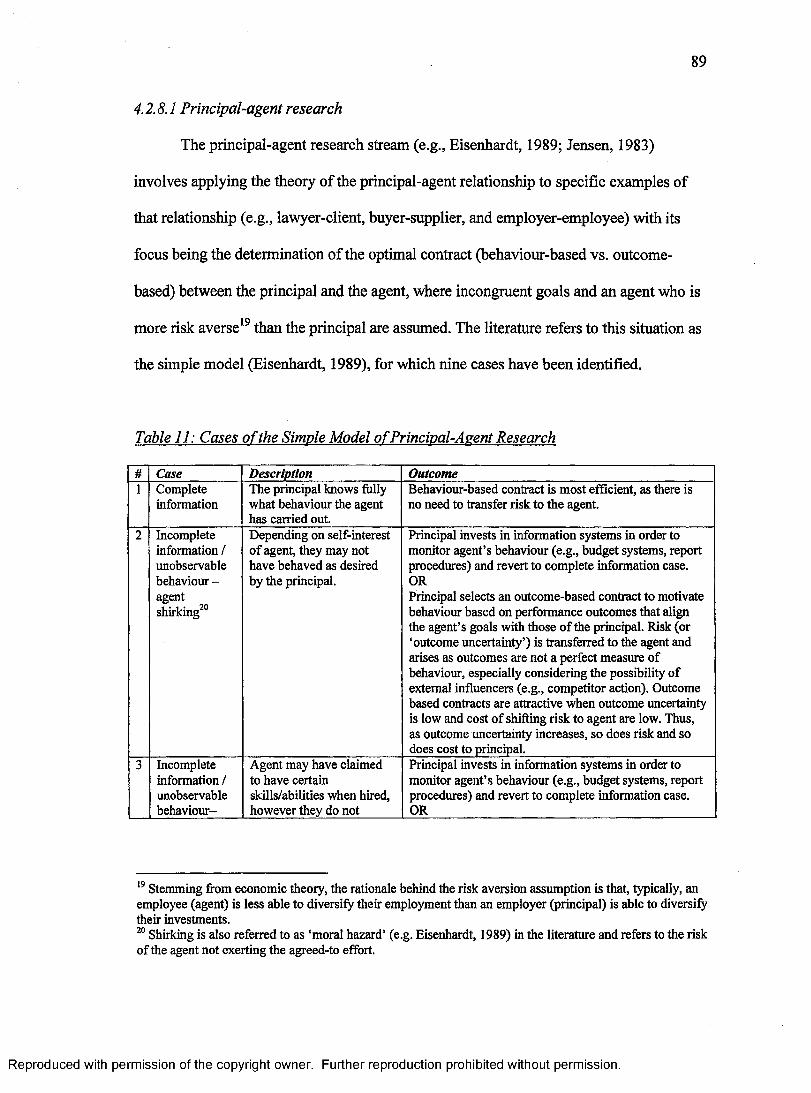
8 9
4.2.8.1 Principal-agent research
The principal-agent research stream (e.g., Eisenhardt, 1989; Jensen, 1983)
involves applying the theory of the principal-agent relationship to specific examples of
that relationship (e.g., lawyer-client, buyer-supplier, and employer-employee) with its
focus being the determination of the optimal contract (behaviour-based vs. outcome-
based) between the principal and the agent, where incongruent goals and an agent who is
more risk averse19 than the principal are assumed. The literature refers to this situation as
the simple model (Eisenhardt, 1989), for which nine cases have been identified.
Table 11: Cases o f the Simple Model ofPrincival-Asent Research
# Case Description Outcome1 Complete
informationThe principal knows fully what behaviour the agent has carried out.
Behaviour-based contract is most efficient, as there is no need to transfer risk to the agent.
2 Incomplete information / unobservable behaviour - agent shirking20
Depending on self-interest of agent, they may not have behaved as desired by the principal.
Principal invests in information systems in order to monitor agent’s behaviour (e.g., budget systems, report procedures) and revert to complete information case.ORPrincipal selects an outcome-based contract to motivate behaviour based on performance outcomes that align the agent’s goals with those of the principal. Risk (or ‘outcome uncertainty’) is transferred to the agent and arises as outcomes are not a perfect measure of behaviour, especially considering the possibility of external influences (e.g., competitor action). Outcome based contracts are attractive when outcome uncertainty is low and cost of shifting risk to agent are low. Thus, as outcome uncertainty increases, so does risk and so does cost to principal.
3 Incomplete information / unobservable behaviour-
Agent may have claimed to have certain skills/abilities when hired, however they do not
Principal invests in information systems in order to monitor agent’s behaviour (e.g., budget systems, report procedures) and revert to complete information case. OR
19 Stemming from economic theory, the rationale behind the risk aversion assumption is that, typically, an employee (agent) is less able to diversify their employment than an employer (principal) is able to diversify their investments.20 Shirking is also referred to as ‘moral hazard’ (e.g. Eisenhardt, 1989) in the literature and refers to the risk of the agent not exerting the agreed-to effort.
Reproduced with permission of the copyright owner. Further reproduction prohibited without permission.
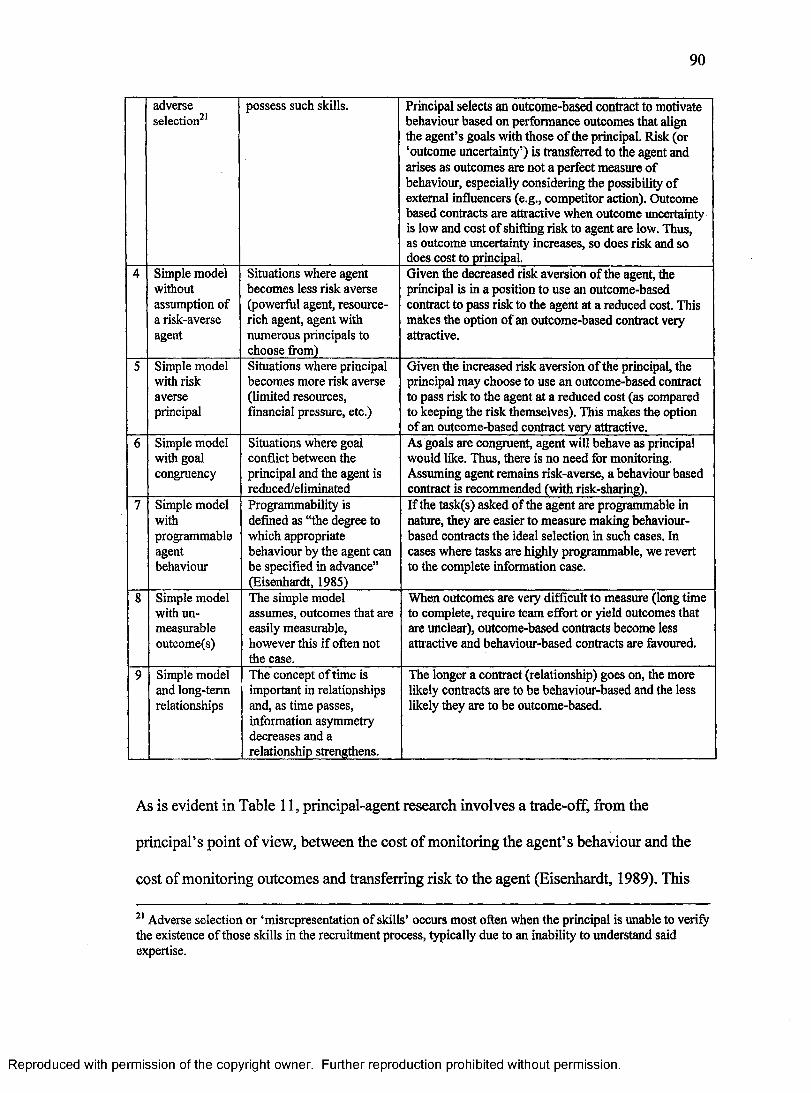
9 0
adverseselection21
possess such skills. Principal selects an outcome-based contract to motivate behaviour based on performance outcomes that align the agent’s goals with those of the principal. Risk (or ‘outcome uncertainty’) is transferred to the agent and arises as outcomes are not a perfect measure of behaviour, especially considering the possibility of external influencers (e.g., competitor action). Outcome based contracts are attractive when outcome uncertainty is low and cost of shifting risk to agent are low. Thus, as outcome uncertainty increases, so does risk and so does cost to principal.
4 Simple model without assumption of a risk-averse agent
Situations where agent becomes less risk averse (powerful agent, resource- rich agent, agent with numerous principals to choose from)
Given the decreased risk aversion of the agent, the principal is in a position to use an outcome-based contract to pass risk to the agent at a reduced cost. This makes the option of an outcome-based contract very attractive.
5 Simple model with risk averse principal
Situations where principal becomes more risk averse (limited resources, financial pressure, etc.)
Given the increased risk aversion of the principal, the principal may choose to use an outcome-based contract to pass risk to the agent at a reduced cost (as compared to keeping the risk themselves). This makes the option of an outcome-based contract very attractive.
6 Simple model with goal congruency
Situations where goal conflict between the principal and the agent is reduced/eliminated
As goals are congruent, agent will behave as principal would like. Thus, there is no need for monitoring. Assuming agent remains risk-averse, a behaviour based contract is recommended (with risk-sharing).
7 Simple model withprogrammableagentbehaviour
Programmability is defined as “the degree to which appropriate behaviour by the agent can be specified in advance” (Eisenhardt, 1985)
If the task(s) asked of the agent are programmable in nature, they are easier to measure making behaviour- based contracts the ideal selection in such cases. In cases where tasks are highly programmable, we revert to the complete information case.
S Simple model with unmeasurable outcome(s)
The simple model assumes, outcomes that are easily measurable, however this if often not the case.
When outcomes are very difficult to measure (long time to complete, require team effort or yield outcomes that are unclear), outcome-based contracts become less attractive and behaviour-based contracts are favoured.
9 Simple model and long-term relationships
The concept of time is important in relationships and, as time passes, information asymmetry decreases and a relationship strengthens.
The longer a contract (relationship) goes on, the more likely contracts are to be behaviour-based and the less likely they are to be outcome-based.
As is evident in Table 11, principal-agent research involves a trade-off, from the
principal’s point of view, between the cost of monitoring the agent’s behaviour and the
cost of monitoring outcomes and transferring risk to the agent (Eisenhardt, 1989). This
21 Adverse selection or ‘misrepresentation of skills’ occurs most often when the principal is unable to verify the existence of those skills in the recruitment process, typically due to an inability to understand said expertise.
Reproduced with permission of the copyright owner. Further reproduction prohibited without permission.

challenge manifests itself in two classes of problems facing principals; pre-contractual
problems and post-contractual issues (Bergen, Dutta, & Walker, 1992; Arrow, 1985).
4.2.8.1.1 Pre-contractual problems in principal-agent research
Pre-contractual problems exist at a number of levels for the principal, including
finding an agent with the required characteristics, determining the specific goals they
would like to gain from the relationship, and developing the strategies required to achieve
those goals. These issues are all mediated by the risk preferences of the principal and take
place prior to the offering of a contract.
Pre-contractual problems are addressed with the Hidden Information Agency
Theory model (Bergen, Dutta, & Walker, 1992). Under the assumption that the principal
knows precisely what he or she wants accomplished and what characteristics they require
in an agent, this model focuses on overcoming the fact that a principal does not possess
full information concerning an agent and whether the agent actually possesses the
knowledge and ability to perform what is expected. This leads directly to the recruitment
and selection of agents. Bergen, Dutta and Walker (1992)’s review of literature provides
three strategies that principals can adopt in this regard: (i) screening, (ii) examining
signals from potential agents, and (iii) providing opportunities for agent self-selection.
Screening potential agents involves a trade-off between costs incurred and information
gathered. If the principal decides screening is worth the expense, they may adopt such
tactics as interviews, reference checks, testing, or re-hiring agents from previous projects.
In making the decision around whether to screen or not, the principal must balance the
costs of screening with the risk of making an error in hiring and the related financial
Reproduced with permission of the copyright owner. Further reproduction prohibited without permission.
losses. The consideration of the effectiveness of screening tools for the traits sought is
also important. It is important to point out that it is possible for situations to arise where
both the screening costs and the learning by experience (i.e., not screening) costs are
high. In these cases, both the principal and the agent may experience losses and other
strategies should be considered. Agents may signal to principals that they possess some
of the desired characteristics (e.g., additional training, certain skills). The principal can
also provide the agent with opportunities for self-selection (Bergen, Dutta, & Walker,
1992), which builds to the ‘examining signals from agents’ option. In such a case, the
principal is not just a passive receiver of signals but a provider of self-selection options to
the agents (e.g., willingness to follow a necessary training program) which could help the
principal better locate an appropriate agent.
4.2.8.1.2 Post-contractual problems in principal-agent research
Following an agreement on the contract, post-contractual issues may also
challenge the principal. The major issues here are around monitoring the agent’s
behaviour and determining what evaluations and reward-structures should be put in place
to insure that the agent’s behaviour mimics the principal’s objectives. Post-contractual
issues are typically addressed with the Hidden Action Agency Theory model (Bergen,
Dutta, & Walker, 1992; Picard, 1987). Such models are based on three important
assumptions. First, both the principal and the agent are assumed to be motivated by self-
interest, typically focused on the maximization of profits. Bergen, Dutta and Walker
(1992, p. 3) also point out that “the theory can also accommodate relationships in which
one or both parties pursue broader social goals”. This may be particularly relevant to
Reproduced with permission of the copyright owner. Further reproduction prohibited without permission.
9 3
marketing, where the parties may be involved in social marketing, green marketing or
not-for-profit marketing. Second, it is assumed that principals normally function with
incomplete information about the characteristics of the agent, while the agent functions
with complete information about the principal. This was described earlier as ‘information
asymmetry’. Third, it is assumed that environmental factors (e.g., competition, the
political environment, economic conditions, environment, and changes in technology)
have some bearing on outcomes, which means that writing a ‘perfect’ contract is
impossible and that both the principal and the agent incur risk.
Hidden action models have typically viewed the principal as risk neutral and the
agent as risk averse (Bergen, Dutta, & Walker, 1992), given that the agent is typically
relying on the relationship for income purposes while the principal has many other
options they could select. However, others (Harris & Raviv, 1979; Picard, 1987) have
considered that the agent may not always be more risk averse than the principal. Given
these assumptions and the risk preferences of both parties, the literature provides
strategies for the principal focused on avoiding shirking behaviour by the agent. Bergen,
Dutta and Walker (1992, p. 3) provide the rationale to why shirking is an issue:
In the basic hidden action model, the agent attempts to maximize his or her own utility by choosing the best action available. Given the incompatible goals and risk preferences of the two parties, though, actions the principal would like the agent to perform are often relatively costly for the agent to undertake (i.e., they require more time, effort, or other resources from the agent). Hence, the agent may try to ‘shirk’ on such actions.
As such, Hidden Action Agency Theory provides the principal with two basic strategic
thrusts by which to limit the chance that an agent might shirk on their post-contract
behaviours. These are behaviour-based contracts (including monitoring systems) and
Reproduced with permission of the copyright owner. Further reproduction prohibited without permission.
9 4
outcome-based contracts (Bergen, Dutta, & Walker, 1992). The contrast between the two
has received attention in the literature. For example, Anderson and Oliver (1987) and
Basu, Rajiv, Srinivasan and Staelin (1985) assess various sales force compensation
systems (i.e., outcome-based versus behaviour-based) and provide recommendations for
when to use each to maximize sales force control.
Behaviour-based contracts include such things as reporting, field observation and
narrow span of control in an attempt to monitor agent behaviour and insure compliance
(Bergen, Dutta, & Walker, 1992). There are challenges with behaviour-based contracts as
they are very costly to implement and cannot fully eliminate information asymmetry. On
the other hand, outcome-based contracts where the agent is evaluated and rewarded based
on performance measures (e.g., sales volume) seek to achieve both parties’ goals based
on the ideas of ‘reservation utility’22 and ‘individual rationality’23. The consideration of
the bottom line (‘payoffs’) is important to both parties in developing the outcome focus
of the contract, with the fact that the resulting payoffs must be relatively equal for both
groups or problems will result (i.e. shirking by the agent or ending of the relationship by
the principal). This is known in the literature as incentive compatibility. The challenge
for the principal with outcome-based contracts is that they shift risk from themselves to
the agent which, should the agent be risk averse, could be costly for the principal.
Bergen, Dutta and Walker provide an example of this situation of shifting risk:
Suppose, for example, that deteriorating economic circumstances make it impossible for a firm to realize its expected sales volume in the current year. A salesperson on straight salary would be unaffected, at least in the
22 ‘Reservation utility’ involves comparison of the benefits to the agent of the current relationship as compared to the best alternative opportunity outside the current relationship (Bergen, Dutta, & Walker, 1992).23 ‘Individual rationality’ refers to the fact that the contract must be interesting enough that the agent will undertake it (Bergen, Dutta, & Walker, 1992).
Reproduced with permission of the copyright owner. Further reproduction prohibited without permission.
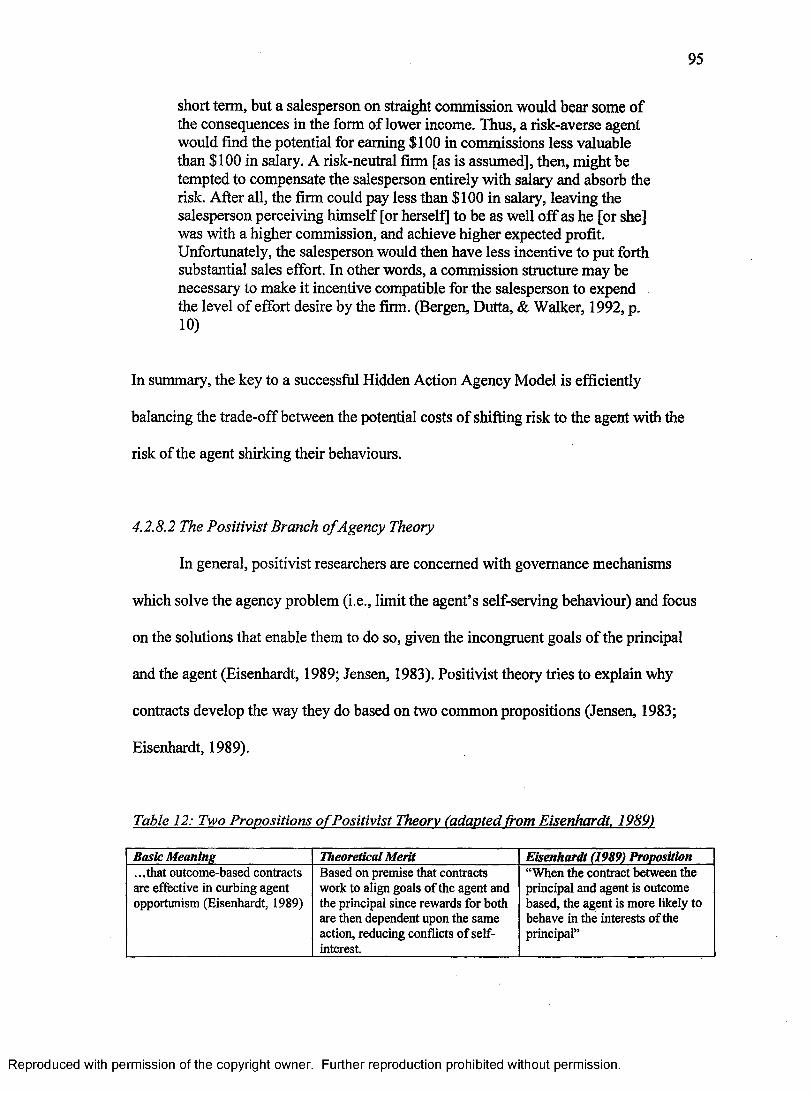
9 5
short term, but a salesperson on straight commission would bear some of the consequences in the form of lower income. Thus, a risk-averse agent would find the potential for earning $100 in commissions less valuable than $100 in salary. A risk-neutral firm [as is assumed], then, might be tempted to compensate the salesperson entirely with salary and absorb the risk. After all, the firm could pay less than $100 in salary, leaving the salesperson perceiving himself [or herself] to be as well off as he [or she] was with a higher commission, and achieve higher expected profit. Unfortunately, the salesperson would then have less incentive to put forth substantial sales effort. In other words, a commission structure may be necessary to make it incentive compatible for the salesperson to expend the level of effort desire by the firm. (Bergen, Dutta, & Walker, 1992, p. 10)
In summary, the key to a successful Hidden Action Agency Model is efficiently
balancing the trade-off between the potential costs of shifting risk to the agent with the
risk of the agent shirking their behaviours.
4.2.8.2 The Positivist Branch o f Agency Theory
In general, positivist researchers are concerned with governance mechanisms
which solve the agency problem (i.e., limit the agent’s self-serving behaviour) and focus
on the solutions that enable them to do so, given the incongruent goals of the principal
and the agent (Eisenhardt, 1989; Jensen, 1983). Positivist theory tries to explain why
contracts develop the way they do based on two common propositions (Jensen, 1983;
Eisenhardt, 1989).
Table 12: Two Propositions o f Positivist Theory (adapted from Eisenhardt. 1989)
Basic Meaning Theoretical Merit Eisenhardt (1989) Proposition...that outcome-based contracts are effective in curbing agent opportunism (Eisenhardt, 1989)
Based on premise that contracts work to align goals of the agent and the principal since rewards for both are then dependent upon the same action, reducing conflicts of self- interest.
“When the contract between the principal and agent is outcome based, the agent is more likely to behave in the interests of the principal”
Reproduced with permission of the copyright owner. Further reproduction prohibited without permission.
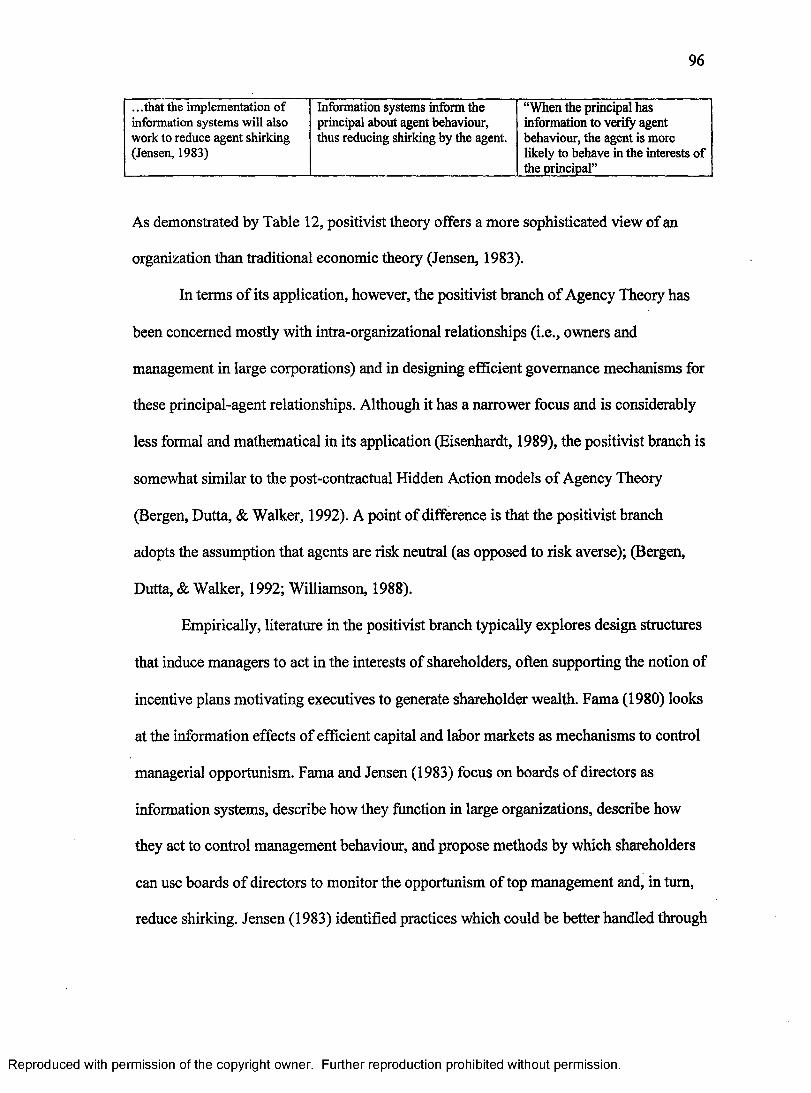
9 6
.. .that the implementation of information systems will also work to reduce agent shirking (Jensen, 1983)
Information systems inform the principal about agent behaviour, thus reducing shirking by the agent.
“When the principal has information to verify agent behaviour, the agent is more likely to behave in the interests of the principal”_________________
As demonstrated by Table 12, positivist theory offers a more sophisticated view of an
organization than traditional economic theory (Jensen, 1983).
In terms of its application, however, the positivist branch of Agency Theory has
been concerned mostly with intra-organizational relationships (i.e., owners and
management in large corporations) and in designing efficient governance mechanisms for
these principal-agent relationships. Although it has a narrower focus and is considerably
less formal and mathematical in its application (Eisenhardt, 1989), the positivist branch is
somewhat similar to the post-contractual Hidden Action models of Agency Theory
(Bergen, Dutta, & Walker, 1992). A point of difference is that the positivist branch
adopts the assumption that agents are risk neutral (as opposed to risk averse); (Bergen,
Dutta, & Walker, 1992; Williamson, 1988).
Empirically, literature in the positivist branch typically explores design structures
that induce managers to act in the interests of shareholders, often supporting the notion of
incentive plans motivating executives to generate shareholder wealth. Fama (1980) looks
at the information effects of efficient capital and labor markets as mechanisms to control
managerial opportunism. Fama and Jensen (1983) focus on boards of directors as
information systems, describe how they function in large organizations, describe how
they act to control management behaviour, and propose methods by which shareholders
can use boards of directors to monitor the opportunism of top management and, in turn,
reduce shirking. Jensen (1983) identified practices which could be better handled through
Reproduced with permission of the copyright owner. Further reproduction prohibited without permission.
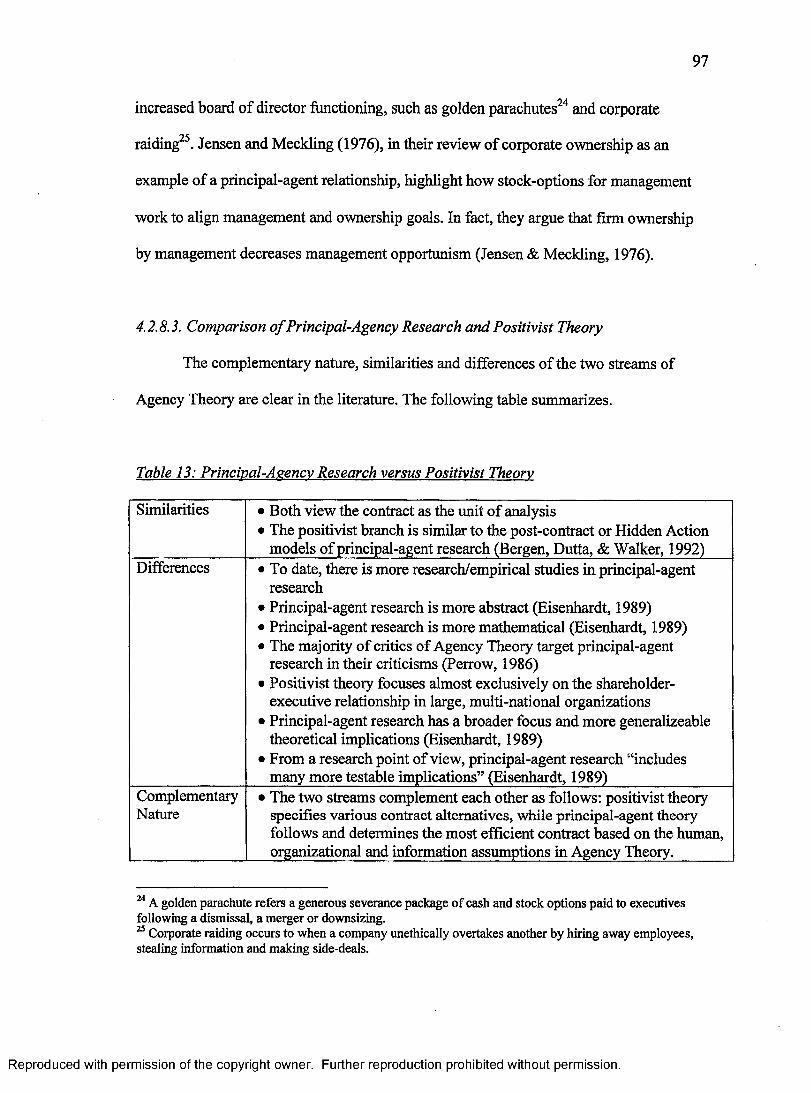
9 7
increased board of director functioning, such as golden parachutes24 and corporate
raiding . Jensen and Meckling (1976), in their review of corporate ownership as an
example of a principal-agent relationship, highlight how stock-options for management
work to align management and ownership goals. In fact, they argue that firm ownership
by management decreases management opportunism (Jensen & Meckling, 1976).
4.2.8.3. Comparison o f Principal-Agency Research and Positivist Theory
The complementary nature, similarities and differences of the two streams of
Agency Theory are clear in the literature. The following table summarizes.
Table 13: Principal-Agency Research versus Positivist Theory
Similarities • Both view the contract as the unit of analysis• The positivist branch is similar to the post-contract or Hidden Action
models of principal-agent research (Bergen, Dutta, & Walker, 1992)Differences • To date, there is more research/empirical studies in principal-agent
research• Principal-agent research is more abstract (Eisenhardt, 1989)• Principal-agent research is more mathematical (Eisenhardt, 1989)• The majority of critics of Agency Theory target principal-agent
research in their criticisms (Perrow, 1986)• Positivist theory focuses almost exclusively on the shareholder-
executive relationship in large, multi-national organizations• Principal-agent research has a broader focus and more generalizeable
theoretical implications (Eisenhardt, 1989)• From a research point of view, principal-agent research “includes
many more testable implications” (Eisenhardt, 1989)ComplementaryNature
• The two streams complement each other as follows: positivist theory specifies various contract alternatives, while principal-agent theory follows and determines the most efficient contract based on the human, organizational and information assumptions in Agency Theory.
24 A golden parachute refers a generous severance package of cash and stock options paid to executives following a dismissal, a merger or downsizing.25 Corporate raiding occurs to when a company unethically overtakes another by hiring away employees, stealing information and making side-deals.
Reproduced with permission of the copyright owner. Further reproduction prohibited without permission.

9 8
4.3 Theory development: Agency Theory and sponsorship
This section argues that Agency Theory is appropriate for sponsorship evaluation.
Bergen, Dutta and Walker (1992) suggest that Agency Theory is most productive in
analyzing four particular marketing situations:
1. where substantial goal conflict between a principal and its agents exists,
2. where there is sufficient environmental uncertainty to trigger the risk-sharing
implications of Agency Theory,
3. where significant information asymmetries exist, and/or
4. where there is difficulty in evaluating performance.
Sponsorship meets all four of these criteria. First, sponsors and sponsees often have very
different goals, which could cause conflict around how the resulting association is
promoted. Second, given the cluttered marketplace and highly competitive environment,
environmental uncertainty is very common in sponsorship. Third, the vast majority of
sponsorship relationships fall under the typical sponsee scenario where the sponsor holds
the balance of power and where information asymmetry exists. Fourth, sponsorship
evaluation has been confirmed to be a difficult task. This is evident for all sponsees;
particularly in the case of the mega-sponsee, where attributing success is very difficult.
Reproduced with permission of the copyright owner. Further reproduction prohibited without permission.

9 9
4.3.1 Agency Theory, mega-sponsees and typical sponsees
The two sponsee scenarios are presented in the following table from an Agency
Theory perspective to outline the differences between a mega-sponsee and a typical
sponsee from an Agency Theory perspective.
Table 14: Scenarios o f the Svonsor-Svonsee Relationship
Case of Sponsor-SponseeRelationship
Power Proportion of Sponsorships
Monitoring & Leveraging
Drivingobjectives
Analogy to Common Agents
Mega-Sponsee Sponsee Very rare Both Both CEOTypical Sponsee Sponsor Majority Sponsor Sponsor Average
employee
4.3.2 Agency Theory, the sponsorship contract, and the sponsor-sponsee relationship
Agency Theory focuses attention on the sponsorship contract as the unit of
analysis when evaluating a sponsor-sponsee relationship. Most sponsorship contracts
include both explicit (formal) and implicit (informal) parts with the explicit aspects being
those that are included in the contract while implicit aspects are understood but are not
written. Agency Theory requires researcher knowledge of all aspects of the sponsorship
contract both explicit and implicit, including both sponsor and sponsee objectives.
Methodologically, all contracted and implicit expectations of a sponsorship contract can
be articulated from both the sponsor’s and the sponsee’s points of view. Of course, full
access to data and decision-makers is required. Further, in most sponsorships, the
promotional impact of the association and the risk attitudes of the sponsor and the
sponsee must be considered. This is often accomplished by understanding the value-
transfer from sponsee-to-sponsor and sponsor-to-sponsee. Figure 4 was developed to
Reproduced with permission of the copyright owner. Further reproduction prohibited without permission.
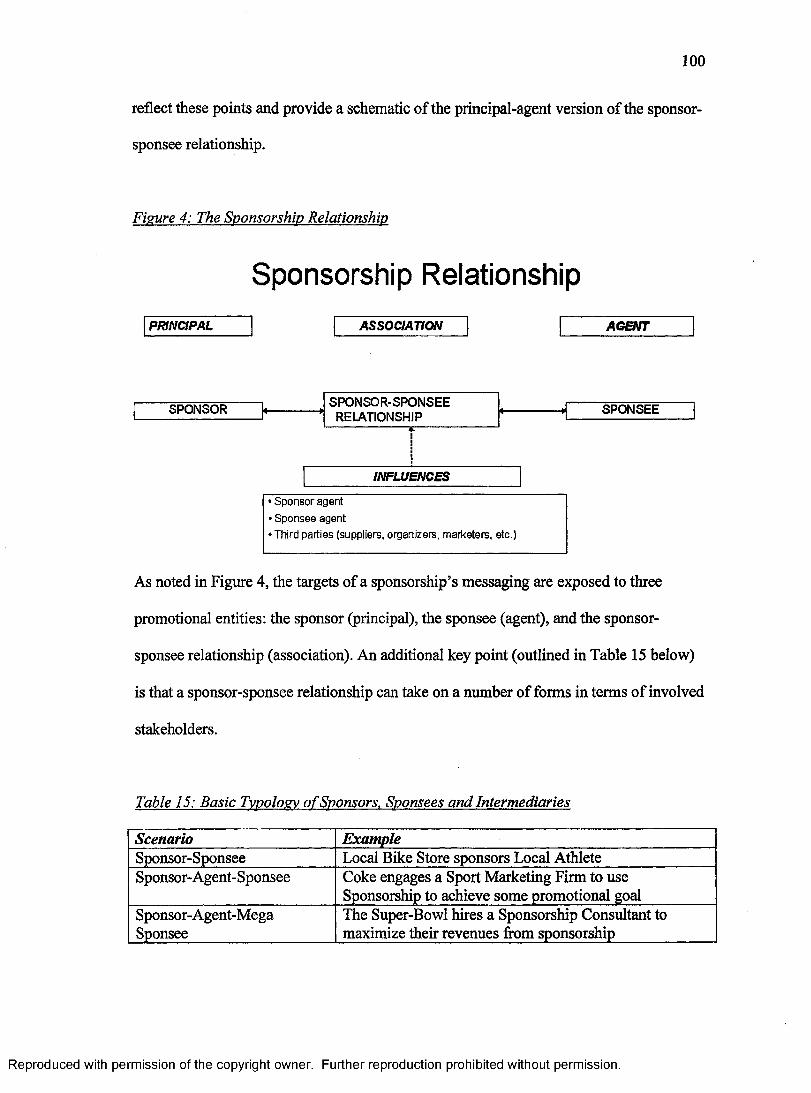
1 0 0
reflect these points and provide a schematic of the principal-agent version of the sponsor-
sponsee relationship.
Figure 4: The Sponsorship Relationship
Sponsorship RelationshipPRINCIPAL ASSOCIATION AGENT
SPONSOR SPONSEE
INFLUENCES
SPONSOR-SPONSEERELATIONSHIP
• Sponsor agent
• Sponsee agent
• Third parties (suppliers, organizers, marketers, etc.)
As noted in Figure 4, the targets of a sponsorship’s messaging are exposed to three
promotional entities: the sponsor (principal), the sponsee (agent), and the sponsor-
sponsee relationship (association). An additional key point (outlined in Table 15 below)
is that a sponsor-sponsee relationship can take on a number of forms in terms of involved
stakeholders.
Table 15: Basic Typology o f Sponsors. Sponsees and Intermediaries
Scenario ExampleSponsor-Sponsee Local Bike Store sponsors Local AthleteSponsor-Agent-Sponsee Coke engages a Sport Marketing Firm to use
Sponsorship to achieve some promotional goalSponsor-Agent-MegaSponsee
The Super-Bowl hires a Sponsorship Consultant to maximize their revenues from sponsorship
Reproduced with permission of the copyright owner. Further reproduction prohibited without permission.
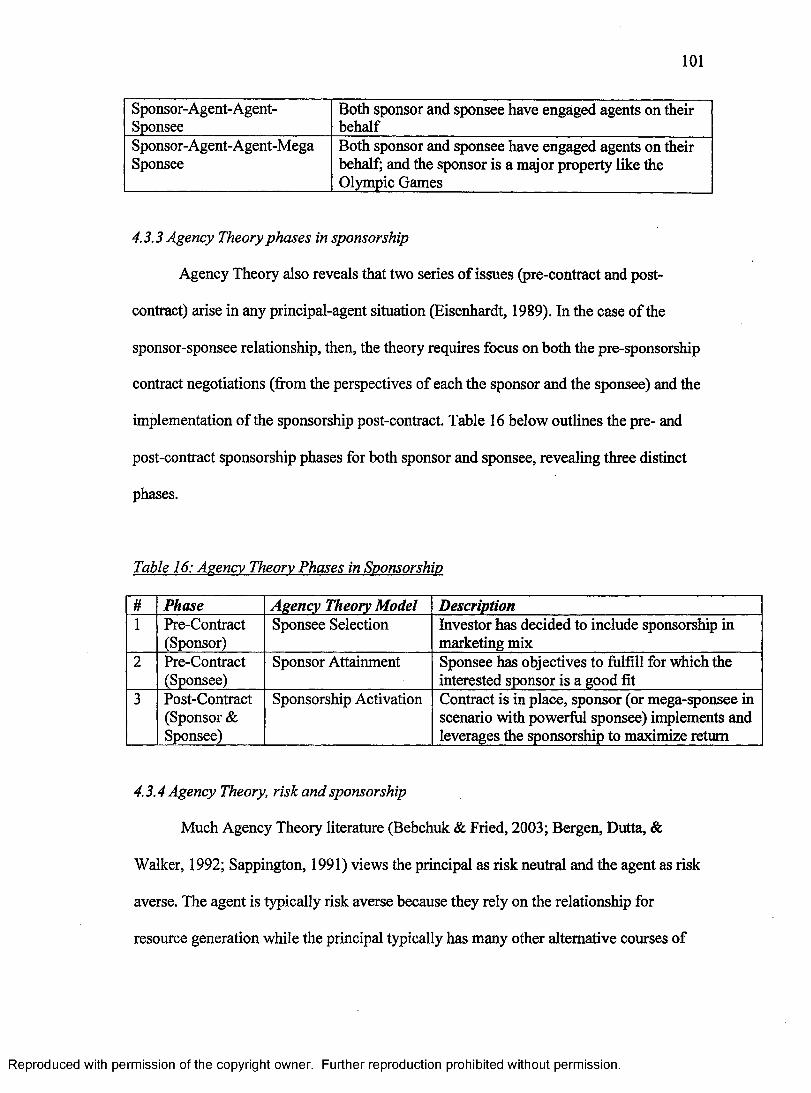
101
Sponsor-Agent-Agent-Sponsee
Both sponsor and sponsee have engaged agents on their behalf
Sponsor-Agent-Agent-MegaSponsee
Both sponsor and sponsee have engaged agents on their behalf; and the sponsor is a major property like the Olympic Games
4.3.3 Agency Theory phases in sponsorship
Agency Theory also reveals that two series of issues (pre-contract and post
contract) arise in any principal-agent situation (Eisenhardt, 1989). In the case of the
sponsor-sponsee relationship, then, the theory requires focus on both the pre-sponsorship
contract negotiations (from the perspectives of each the sponsor and the sponsee) and the
implementation of the sponsorship post-contract. Table 16 below outlines the pre- and
post-contract sponsorship phases for both sponsor and sponsee, revealing three distinct
phases.
Table 16: Agency Theory Phases in Sponsorship
# Phase Agency Theory Model Description1 Pre-Contract
(Sponsor)Sponsee Selection Investor has decided to include sponsorship in
marketing mix2 Pre-Contract
(Sponsee)Sponsor Attainment Sponsee has objectives to fulfill for which the
interested sponsor is a good fit3 Post-Contract
(Sponsor & Sponsee)
Sponsorship Activation Contract is in place, sponsor (or mega-sponsee in scenario with powerful sponsee) implements and leverages the sponsorship to maximize return
4.3.4 Agency Theory, risk and sponsorship
Much Agency Theory literature (Bebchuk & Fried, 2003; Bergen, Dutta, &
Walker, 1992; Sappington, 1991) views the principal as risk neutral and the agent as risk
averse. The agent is typically risk averse because they rely on the relationship for
resource generation while the principal typically has many other alternative courses of
Reproduced with permission of the copyright owner. Further reproduction prohibited without permission.
1 0 2
action to generate resources. Applied to the ‘typical’ sponsor-sponsee relationship, the
sponsee is believed to be risk averse and the sponsor risk neutral, since the sponsee relies
on the sponsor for revenue while the sponsor has many alternate options (i.e., competing
sponsees) to achieve their promotional objectives. Conversely, when applied to the
‘mega’ sponsor-sponsee relationship, the sponsor is believed to be risk averse and the
sponsee risk neutral, since the sponsor relies on the mega-sponsee for the unique
promotional value it provides while the sponsee has numerous alternative sources (i.e.,
competing sponsors) for revenue generation.
4.3.5 Agency Theory, imperfect surveillance and sponsorship
Agency Theory focuses attention on outcomes and end-goals, although they may
be enduring and continue for long periods of time (Sappington, 1991). In this regard,
external influencers (e.g., power, trust, time) must be considered in any agency
relationship where full surveillance of the agent by the principal is not possible. This is
necessary in sponsorship as imperfect surveillance is common in the sponsor-sponsee
relationship. For example, Berrett and Slack (1999) show that the sponsorship activities
of rival companies are influential to a sponsor’s selection of a sponsee, implying that
some organization’s are taking a ‘copy-cat’ approach to sponsorship. They, and others,
further argue that the sponsor must seek to foster a relationship to help prevent other
sponsors from either taking the association for themselves in the future (i.e., outbid) or
ambushing the sponsorship (Crompton, 2004b; Berrett & Slack, 1999; Shani and Sandler,
1998; 1993; 1989).
Reproduced with permission of the copyright owner. Further reproduction prohibited without permission.
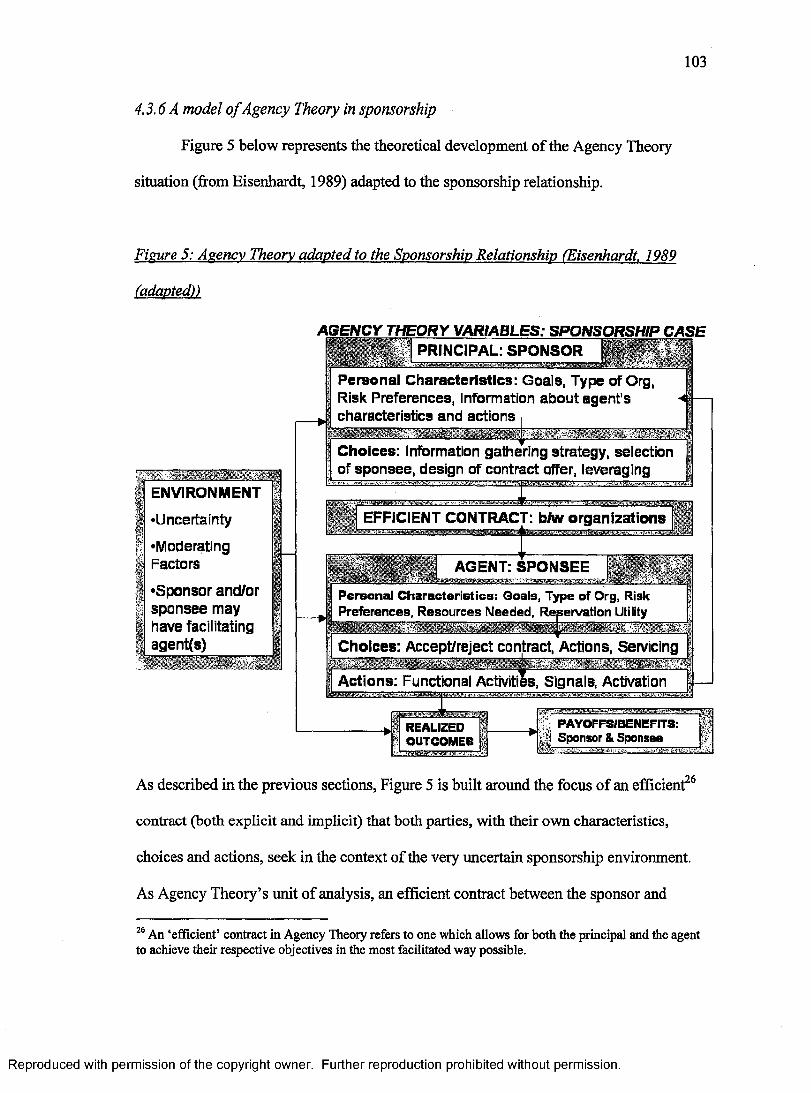
103
4.3.6 A model o f Agency Theory in sponsorship
Figure 5 below represents the theoretical development of the Agency Theory
situation (from Eisenhardt, 1989) adapted to the sponsorship relationship.
Figure 5: Asencv Theory adapted to the Sponsorship Relationship (Eisenhardt. 1989
(adapted))
AGENCY THEORY VARIABLES: SPONSORSHIP CASE
ENVIRONMENT
•Uncertainty
•ModeratingFactors
•Sponsor and/or sponsee may have facilitating agent(s)
PRINCIPAL: SPONSOR
Personal Characteristics: Goals, Type of Org,Risk Preferences, Information about agent's -4 characteristics and actions |
~ r .
Choices: Information gathering strategy, selection of sponsee, design of contract offer, leveraging
EFFICIENT CONTRACT: b/w organizations
:AGENT: SPONSEE
Personal Characteristics: Goals, Type of Org, Risk Preferences, Resources Needed, Reservation Utility
Choices: Accept/reject contract, Actions, Servicing
Actions: Functional Activities, Signals, Activation
REALIZEDOUTCOMES
PAYOFFS/BENEFITS: Sponsor & Sponsee
As described in the previous sections, Figure 5 is built around the focus of an efficient26
contract (both explicit and implicit) that both parties, with their own characteristics,
choices and actions, seek in the context of the very uncertain sponsorship environment.
As Agency Theory’s unit of analysis, an efficient contract between the sponsor and
26 An ‘efficient’ contract in Agency Theory refers to one which allows for both the principal and the agent to achieve their respective objectives in the most facilitated way possible.
Reproduced with permission of the copyright owner. Further reproduction prohibited without permission.
104
sponsee determines the nature of the relationship. The development of the contract (both
explicit and implicit) is a blend of (i) the interests (personal characteristics) and strategic
decisions (choices) of the sponsor, (ii) the interests (personal characteristics), needs
(actions) and strategic decisions (choices) of the sponsee, and (iii) the realities of the
environment. Following the sponsorship, its outcomes (i.e. achievement of objectives) are
assessed, the benefits to each party determined and the contract is renewed, altered or
deleted.
4.3.7 Sponsorship evaluation and Agency Theory
Agency Theory provides a lens by which to evaluate a sponsor’s investment in a
sponsee and the resulting relationship’s ability to achieve both the sponsor’s and the
sponsee’s specific promotional objectives. Here, Agency Theory can respond to a need in
sponsorship evaluation by providing the theoretical framework that both academics and
practitioners seek that will enable the viable measurement of sponsorship effectiveness.
An Agency Theory approach to sponsorship evaluation infers a principal-agent
relationship. In terms of measurement, Agency Theory would view the sponsor as the
principal and the sponsee as the agent, with the sponsorship contract as the unit of
analysis. Once the contract is signed, a ‘principal as sponsor’ situation results and the
principal assumes the role of ensuring the sponsee meets its contractual commitments.
The sponsorship contract refers to both the tenets of the formal written contract and the
understood but unwritten aspects of the relationship; namely the informal contract.
Examples of informal contracts include (i) the understanding that the sponsee will act in
Reproduced with permission of the copyright owner. Further reproduction prohibited without permission.
105
the best interests of the sponsor and (ii) that logos of competitors of the sponsor will not
be seen on participants’ clothing.
Agency Theory focuses an evaluation on the objectives of the sponsor and the
sponsee, as well as any relevant intermediaries. The theory requires the evaluator to
examine the sponsorship contracts) for evidence of the objectives of all parties. It also
requires that the evaluator learn about the objectives of all parties that may come into
play that are not listed in any formal contracts.
4.3.7.1 Draft Process model o f Sponsorship Evaluation
A draft process model for sponsorship evaluation is presented below as Figure 6.
It is important to note that the proposed model is a tool which outlines a process to follow
in evaluating any given sponsorship. The purpose of the model is to guide researchers
and practitioners through the evaluation process in a manner which respects the
sponsorship relationship and its uniqueness. It is intended to be applicable to evaluating a
wide range of sponsees; be they sport, art, culture, charity, public, private or corporate.
The proposed process model is based on Agency Theory in its construction and
the specifics of sponsorship evaluation and performance measurement in its detail. As
dictated by Agency Theory, the unit of analysis is the contract. The fact that the process
model is rooted in the objectives (implicit and explicit) of both the sponsor(s) and
sponsee(s) and does not include other un-related outcomes or impacts follows an Agency
Theory perspective. The consideration of resources and activities committed by the
sponsor as principal is a reflection of Agency Theory’s focus on monitoring the costs of
the principal towards eliminating shirking by the agent (sponsee). The operational
Reproduced with permission of the copyright owner. Further reproduction prohibited without permission.
1 0 6
definition of a sponsorship, which determines if a promotional endeavour is a
sponsorship or not, is built into the model and includes the criterion that the sponsor-
sponsee relationship must be a principal-agent relationship. As well, the importance of
external influences and the link to the market are both drawn from Agency Theory.
Finally, and most importantly, Step 1 (Setting the Stage) uses an Agency Theory lens to
build the relationship, determine if it is a sponsorship and set the basis for an efficient and
effective evaluation.
The process model is comprised of seven steps. The steps are ‘set the stage’,
‘collect data’, ‘articulate objectives’, ‘establish metrics’, ‘determine metrics for resources
and reach’, ‘collect and analyze data’, and ‘generate and interpret outcomes and impacts’.
As noted in Figure 6, the model also considers the effects of the specific sponsor-sponsee
relationship, the market and other uncontrollable external influences during the
evaluation process.
The first step is a pre-cursor to the evaluation which sets the stage for an efficient
and effective evaluation. First, the sponsorship is selected or offered for evaluation. It is
then assessed against the working definition, the key entities (sponsor, sponsee,
intermediaries) are identified and the objectives and metrics are forecasted. All of these
steps are undertaken to make sure that the evaluation can be effective. If so, the
evaluation would continue. If not, the evaluation would stop. If it is appropriate to
continue, the research then works to build a relationship with the sponsor, the sponsee
and, if necessary, the intermediaries, Upon completion, a decision is made (Go/No-Go)
whether to go ahead with the evaluation or not.
Reproduced with permission of the copyright owner. Further reproduction prohibited without permission.
1 0 7
In the second step, ‘collect data’, the researcher accesses four key sources of data
(the sponsorship contract, sponsor input, sponsee input and, if applicable, intermediary
input) to enable the evaluation. The types of data gathered here would typically include
the specific objectives of the sponsorship, the role of the sponsorship in the overall
marketing plan of the sponsor or the sponsee, image transfer goals of the association, etc.
The third step focuses on reviewing the data gathered in Step 1 and articulating,
summarizing and listing all objectives for the sponsorship. This step is known as
‘articulate objectives’ and likely includes two sets of objectives: (i) those that are
explicitly stated and (ii) those that are implicitly understood but perhaps not articulated in
the contract. Of specific note here is the link to the performance measurement concept of
‘reach’ which refers to the consideration of all the markets reached by each objective. An
objective with multiple publics would end up with multiple metrics measuring all of
those publics.
Upon completion of the third step, the ‘establish metrics’ stage (Step 4) takes
place. This involves the assignment of a specific metric or metrics (either from the
literature, past practice or newly developed) for each objective identified in Step 3. Each
metric, whether adopted from past use or newly developed, is then customized to the
sponsorship relationship being evaluated and a research design is planned for each. For
example, this implies that if 17 objectives are identified in the ‘articulation of objectives’
step, then at least 17 metrics must be developed. Metrics are not included unless they
relate specifically to an identified objective.
The fifth step, ‘determine metrics for resources and shirking’, stems from the
performance management and Agency Theory literatures and involves an assessment of
Reproduced with permission of the copyright owner. Further reproduction prohibited without permission.
1 0 8
two specific resource-based items for the sponsor and potentially for the sponsee: inputs
and activities, as well as a consideration of outputs unrelated to the objectives identified
in Step 3 which may indicate sponsee shirking. With respect to inputs and activities, this
refers to determining, respectively, the ways by which to measure the resources
committed (financial, in-kind and human) and the leveraging activities undertaken.
Specific to the resulting outputs which are unrelated to the identified objectives, the
Agency Theory concept of shirking is measurable by the resources committed by the
sponsee to outputs not sought by the sponsorship.
Step 6, the ‘collect and analyze data’ stage is next. This involves the
implementation of each of the metrics identified in Step 3 and Step 5, including both data
collection and analysis of that data. The researcher gathers evaluation data, and analyzes
that data for each of the metrics. Research might include a survey of consumers,
attendees at an event, or employees of a sponsor.
This leads to the final step ‘generate and interpret outcomes and impacts’ where
the results of the analysis are considered cumulatively and presented for each metric with
an overall assessment of effectiveness. Effectiveness, based on performance
measurement models, is articulated as outcomes (what happened) and impacts (what does
it mean for the markets concerned). Further, these benefits are contextualized against the
costs to achieve them.
The draft process model (version Dl) follows on the next page.
Reproduced with permission of the copyright owner. Further reproduction prohibited without permission.
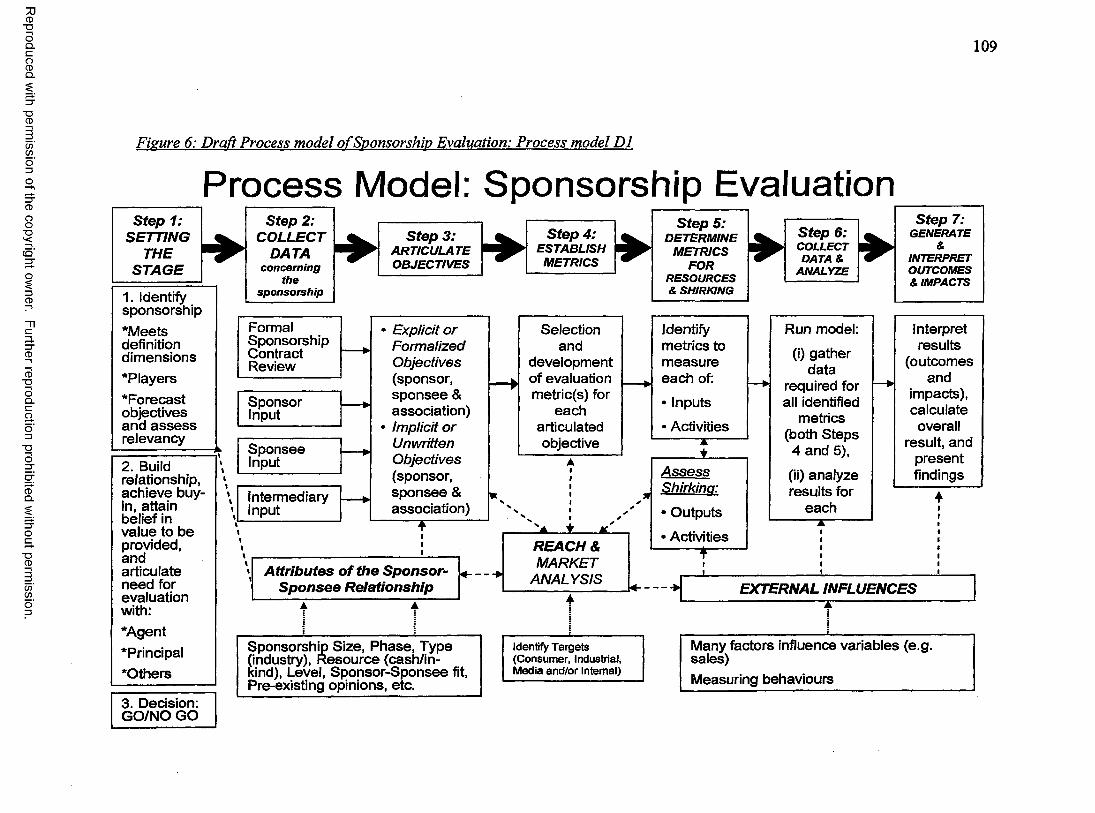
Reproduced
with perm
ission of the
copyright ow
ner. Further
reproduction prohibited
without
permission.
1 0 9
Fizure 6: Draft Process model o f Sponsorship Evaluation: Process model Dl
Process Model: Sponsorship EvaluationStep 1:
1. Identify sponsorship*Meetsdefinitiondimensions*Players‘Forecast objectives and a sse ss relevancy
2. Build relationship, achieve buy- in, attain belief in value to be provided, andarticulate need for evaluation with:‘Agent‘ Principal‘Others
3. Decision: GO/NO GO
Step 2: COLLECT
DATAconcerning
thesponsorship
Step 4:Step 3:ARTICULATE
FormalSponsorshipContractReview
SponsorInput
SponseeInput
IntermediaryInput
Explicit or Formalized Objectives (sponsor, sponsee & association) Implicit or Unwritten Objectives (sponsor, sponsee & association)
*
Attributes of the Sponsor- Sponsee Relationship
Sponsorship Size, Phase, Type (industry), Resource (cash/inkind), Level, Sponsor-Sponsee fit, Pre-existing opinions, etc.
* ---------
♦ tL.REACH &MARKET
ANALYSIS
Step 5: DETERMINE
METRICS FOR
RESOURCES & SHIRKING
Step 6:COLLECT DATA &
ANALYZE
Selection and
development of evaluation metric(s) for
each articulated objective
Identify metrics to measure each of:
• Inputs
• ActivitiesT
AssessShirking:
• Outputs
• Activities
Run model:
(i) gather data
required for all identified
metrics (both Steps 4 and 5),
(ii) analyze results for
each z---------
Step 7:GENERATE
&INTERPRET OUTCOMES & IMPACTS
Interpret results
(outcomes and
impacts), calculate
overall result, and
present findings
— ■ >
Identify Targets (Consumer, Industrial, Media and/or Internal)
1 1 EXTERNAL/NFLUENCES
ik
Many factors influence variables (e.g. sales)Measuring behaviours

110
4.4 Chapter Summary
This chapter develops the theoretical framework for this dissertation. First, it
selects Agency Theory from a number of theories on business relationships as the
theoretical framework for this research. An overview of Agency Theory is then
presented, along with discussions on its scope, its assumptions, its unit of analysis (the
contract), its important aspects (monitoring, information, risk preference, self-interest and
incentives), and its two branches (principal agent and positivist research). The scope of
Agency Theory is particularly important to this dissertation as it is shown to
accommodate sponsorship and the evaluation of sponsorship. The review of the Agency
Theory literature supported this position strongly and outlined the four major tenets of
Agency Theory that have influenced its development significantly. First, Agency Theory
involves ensuring that the agent acts in the interests of the principal (Bahli & Rivard,
2003). Second, it assumes that each party (principal and agent) in the relationship has its
own profit motive since their goals are not congruent (Eisenhardt, 1989). Third, agency
theorists are always aware that the principal-agent relationship may be influenced by two
factors; (i) the case of asymmetric information between principal and agent, and (ii) the
possibility of random external factors or events (Bergen, Dutta, & Walker, 1992). Finally,
it is known that the principal cannot monitor the actions of the agent perfectly or without
costs (Sappington, 1991).
The chapter then focused on the theoretical development of Agency Theory and
sponsorship. This process involved developing many of the key concepts of Agency
Theory in the context of the sponsor-sponsee relationship, including articulating an
agency perspective on (i) the sponsorship contract, (ii) the two sponsee scenarios (typical
Reproduced with permission of the copyright owner. Further reproduction prohibited without permission.
I l l
and mega), (iii) risk, (iv) time, and (v) imperfect surveillance. The theory development is
captured by the adapted model of Agency Theory in sponsorship presented in section
4.3.6. Most importantly, the theory development continues with sponsorship evaluation
and Agency Theory. This work clearly demonstrates how an Agency Theory approach to
sponsorship evaluation will be beneficial to theory and practice by establishing a draft
process model for sponsorship evaluation.
Reproduced with permission of the copyright owner. Further reproduction prohibited without permission.
112
5.0 METHODOLOGY
This chapter outlines the methodology followed to address the main objective and
four sub-objectives of this dissertation. A two-phase methodology was implemented.
Phase I involved qualitative study in the form of expert interviews while Phase II built on
the results of Phase I with two in-depth sponsorship evaluation case studies.
For Phase I, a qualitative study was adopted since an in-depth, yet exploratory,
understanding of evaluation in sponsorship was required. A number of alternative
qualitative and quantitative methodologies were considered. Expert interviews were
selected over alternate qualitative methods (i.e., observation, ethnography and focus
groups) as they offer the best opportunity to fully understand a topic with limited
empirical-based literature within a dynamic marketplace because they (i) provide
detailed, in-depth data and (ii) are based on the views of experts in the area (Yin, 2003;
Patton, 1980). Expert interviews were selected over alternative quantitative methods (i.e.,
surveys) as they (i) provide a smaller yet more appropriate sample of experts, and (ii)
yield in-depth data that is more suited to the issue given the current lack of clarity on
sponsorship evaluation in the literature and in practice (Yin, 2003).
Phase II involves sponsorship evaluation case studies. “A case study is an
empirical inquiry that investigates a contemporary phenomenon within its real-life
context” (Yin, 1994). Case study based research has been shown to be an effective
method by which to develop theory (see Eisenhardt, 1989b), particularly in industrial
(B2B) marketing (Woodside & Wilson, 2003). Notably, sponsorship is often a B2B
marketing activity where a case study method allows for “deep understanding of the
Reproduced with permission of the copyright owner. Further reproduction prohibited without permission.
113
actors, interactions, sentiments, and behaviors occurring for a specific process”
(Woodside & Wilson, 2003, p. 497).
5.1 Phase I: Qualitative Interviews with Experts in Sponsorship
In Phase I of the research, 14 interviews were conducted with experts in
sponsorship. The adoption of the expert interview as a research methodology has
precedence in the literature as past research has used the method to make key findings in
applied marketing (O’Reilly & Madill, 2007; Chalip & Leyns, 2002; Lachowetz & Irwin,
2002; Strauss & Friege, 1999) and sponsorship research (e.g. Jalleh, Donovan, Giles-
Corti & Holman, 2002; Hoek, Gendall, Jeffcoat & Orsman, 1997). The expert interviews
were implemented to respond to the four sub-objectives and major objective of this
dissertation. The four sub-objectives involved improving knowledge of key aspects of
sponsorship evaluation. First, improved understanding of the sponsor-sponsee
relationship was sought with implications for image transfer, leveraging, exclusivity,
sponsee selection, sponsor attainment and activation. Second, an improved understanding
of current practices in sponsorship evaluation was undertaken to help identify metrics
currently being used. Third, a deeper understanding of the sponsor-sponsee relationship
was sought through the articulation of die barriers to evaluation, the fears around
evaluation, and the benefits that evaluation provides. Fourth, a deeper understanding of
the timing of evaluation was sought to shed light on metric identification, and the
implementation or activation of sponsorship. Based on these results, the process model
was refined (the major objective).
27 The term ‘metric’ is used in this dissertation to refer to any method of assessing the effectiveness of a sponsorship to achieve a given objective.
Reproduced with permission of the copyright owner. Further reproduction prohibited without permission.
1 1 4
Fourteen (14) Canadian experts were selected based on (i) their level of expertise
in sponsorship28, (ii) their willingness to participate, and (in) an assessment of the roster
of suggested interviewees, as developed by the researcher. The 14 interviewees were
selected from an original roster of 30 that was put together based on (i) each
individual’s experiences, (ii) the representation of sponsors, sponsees and intermediaries,
(iii) logistics, and (iv) referrals from industry contacts. Each of the selected experts was
contacted in order to set up interview appointments, and then interviewed by the doctoral
researcher between March 27 and May 5,2006. The relevant expertise of each expert
was researched pre-interview (secondary data analysis) and verified during the interview.
Questions were scripted in order to access with as much depth as possible the experts’
knowledge of sponsorship, sponsorship evaluation and the sponsor-sponsee relationship.
The format involved the posing of a scripted question followed by an opportunity for
open discussion. The interview protocol is appended (Appendix B).
All 14 interviews were conducted face-to-face in various locations across Canada
(Calgary, Edmonton, Mississauga, Ottawa, St. Catherines, Toronto, Vancouver) in
English (13) or French (1). The interviews took between 25 and 80 minutes. On a number
of occasions, follow-up discussion about the draft process model continued post
interview over lunch. Each interview was audio recorded, transcribed and analyzed. Each
of the first four objectives of Phase I was addressed by the scripted questions and
feedback on the process model was achieved at the end of the interviews. In many cases,
the interviewee requested the model by email and provided additional feedback by email
28 The known level of expertise of clients resulted from experiences of the doctoral researcher, the supervisor of this dissertation, or on the recommendation of an industry contact or another expert interviewee.29 Note that the selection of 14 of 30 is not reflective of non-response bias but is simply a function of resources (time, travel budgets, etc.). In fact, only one potential interviewee declined the offer.
Reproduced with permission of the copyright owner. Further reproduction prohibited without permission.
115
and/or phone in the weeks following the interviews. Detailed information on the expert
respondents, their experience and roles in the sponsorship industry is provided in section
6 .1.
5.2 Phase II: Sponsorship Evaluation Case Studies
Phase II of the research involved implementing the process model to evaluate two
sponsorship case studies. The use of case studies often involves multiple research
methods within the case itself (Yin, 2003: Patton, 1980) and has recently been adopted to
build theory in social marketing (O’Reilly & Madill, 2007) and technology in marketing
(O’Reilly & Rahinel, 2006). Here, the implementation of the process model was designed
specifically (i) to assess the practical effectiveness of the process model, (ii) to allow the
researcher to determine whether the process model could be implemented in practice, (iii)
to learn about its strengths and weaknesses, (iv) to learn about the key issues, challenges
and benefits associated with its implementation and (v) to build researcher knowledge in
order to refine the model. The sponsorship evaluation case studies carried out in this
dissertation were:
i) The ATB Bank sponsorship of the Edmonton Grand Prix
ii) The 2005 Kanatek Expedition to Mount Everest
In understanding the new process model, it is important for researchers to recognize the
difficulty in identifying and selecting sponsorship evaluation case studies. In fact, the
ability to find sponsorships is based on (i) the researcher’s network or (ii) the researcher’s
ability to speak to industry conferences about sponsorship evaluation. Further, the
researcher must be able to convince sponsors and sponsees of the value of the evaluation.
Reproduced with permission of the copyright owner. Further reproduction prohibited without permission.

1 1 6
It is only then that serious discussions about an evaluation may take place. For this
dissertation, the doctoral researcher has strong ties to industry and speaks regularly at
conferences. This allowed for the identification of four potential sponsorships30 for
evaluation; two of which are included in this evaluation. The two not included
(International Hotel Groups - Canadian Football League and Calgary Stampede - Coca-
Cola) did not proceed past Step 1 of the Process Model.
The ATB and Kanatek sponsorship evaluation case studies developed in very
different ways as outlined in sections 6.2.1 and 6.2.2, respectively. Both, however, had a
number of key points in common that allowed for an evaluation: (i) each includes
sponsors and sponsees with sophisticated objectives; (ii) in both cases, access to good
data existed; (iii) in both cases, an interested and cooperative industry partner existed;
and (iv) each sponsor met all ten dimensions of the operational definition of sponsorship
(see section 2.1.3) as outlined in Table 17 below.
Table 17: Proposed. Cases & Dimensions o f Operational Definition o f Sponsorship
Dimensions o f Operational Definition Kanatek ATBOne party (the sponsor) invests resources in another party (the sponsee), where:a. the sponsee provides promotional value in return, andb. the sponsor makes the investment in order to achieve image-based, brand-based and/or media-based objectives.
X X
The relationship between the sponsor and the sponsee is a principal-agent relationship, where the sponsee provides a service to the sponsor.
X X
Joint sponsor-sponsee activities are part of the sponsorship. X XConsumers (or members of the target market of the promotion) are exposed to three specific entities: the sponsor’s brand, the sponsee’s brand and the sponsor- sponsee association.
X X
Consumers (or members of the target market of the promotion) consider the sponsor of a given sponsee to be a partner of that sponsee, and this consideration lasts longer than the sponsorship due to the goodwill or emotional ties that consumers build over time.
X X
The sponsor-sponsee association is exploited or leveraged by one or both parties. X X
30 Potential sponsorship here refers to those that went beyond noting that the sponsorship exists and includes those where the researcher and partner(s) began seriously exploring an evaluation.
Reproduced with permission of the copyright owner. Further reproduction prohibited without permission.
1 1 7
The transfer of elements of the sponsee’s image to the sponsor is of interest to the sponsor.
X X
The exclusivity of the sponsorship is of interest to the sponsor. X XCongruency (fit) between the sponsor and the sponsee is important to both parties. X XPhilanthropy is not the primary objective of the sponsor (i.e. the investor has non- philanthropic expectations from the sponsorship).
X X
Methodologically, each of the sponsorship evaluation case studies followed the 7
steps of the process model presented in section 4.3.7.1. Given the nature of the process
model, the implementation leads to results that are unique to the sponsorship and that
includes metrics developed specifically for the objectives identified in that specific
sponsorship. The resulting methods for each objective included both qualitative
(interviews) and quantitative (surveys) procedures conducted in time and resource limited
environments which did not allow for pre-tests and did require short questionnaires. The
complete methodological details and accompanying results are presented jointly for each
of the sponsorship evaluation case studies (see sections 6.2.1 and 6.2.2). It is also
important to note the timing around the sponsorship case studies as the outcomes and
impacts of sponsorship could be measured over many years. For this research, outcomes
and impacts were measured up to October 30th, 2006.
It is also important to recognize the challenge that exists in presenting multiple-
method case studies of a high level of complexity. Two methods of presentation were
attempted, with the second being adopted. First, the dissertation was written in the
traditional fashion with a complete methodology followed by presentation of results and
analysis in a subsequent section. This resulted in a document with considerable repetition,
added length and confusion due to repetition. This was deemed ineffective. Second, these
chapters were re-written to include a brief methodology section followed by a chapter
that included methods, results and analysis together. This philosophy was adopted from
Reproduced with permission of the copyright owner. Further reproduction prohibited without permission.
1 1 8
Woodside and Wilson (2003) as an integrative way of presenting a case study that allows
for better understanding of the learning provided by each case study. The approach is
further supported by Stake (1995) whose text titled The Art o f Case Study Research
provides examples of presented case study research in a fashion similar to that adopted
here and focuses on his concept of the unique case as an “integrated system” (p. 2). He
further supports the approach taken for this dissertation by noting that a "case study is the
study of the particularity and complexity of a single case, coming to understand its
activity within important circumstances" (Stake, 1995, p. ix) and that “a 20 - page case is
likely to run 50 if the researcher doesn't 'ruthlessly winnow and sift'" (Stake, 1995, p.
121).
Following the completion of each sponsorship evaluation case study, the process
model was refined based on what was learned about the practical effectiveness, usability,
strengths, weaknesses, challenges and benefits of the process model.
5.2.1 Articulation o f Objectives, Metrics and Methods
A methodological step in the case studies is the process of identifying, defining
and operationalizing the measurement of each objective (or shirking behaviour). For each
case, an extensive process is undertaken to identify all objectives sought through the
sponsorship by sponsor(s), sponsee and intermediaries. Upon completion of this process,
each objective is evaluated individually. The objectives that seek to reach more than one
target market deserve special attention. In these cases, the objective is further evaluated
individually for each target market that it hopes to reach. For example, if an objective for
a sponsor was to increase employee satisfaction with the marketing efforts of the
Reproduced with permission of the copyright owner. Further reproduction prohibited without permission.
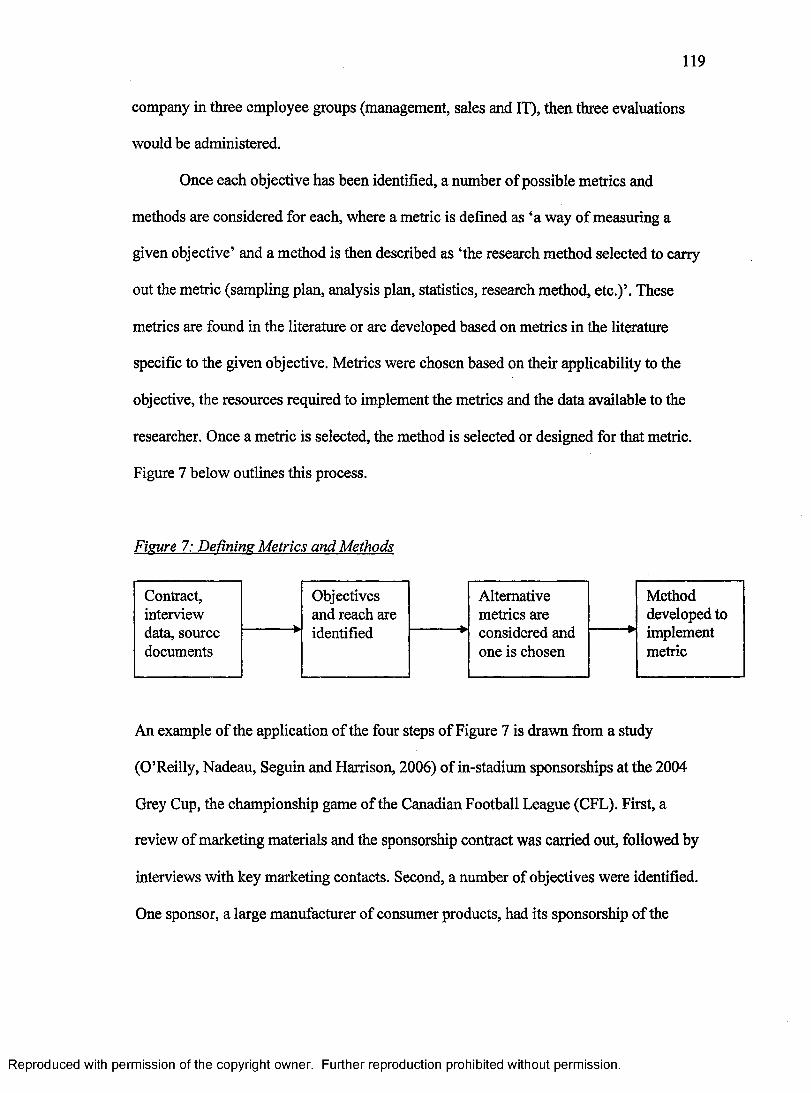
1 1 9
company in three employee groups (management, sales and IT), then three evaluations
would be administered.
Once each objective has been identified, a number of possible metrics and
methods are considered for each, where a metric is defined as ‘a way of measuring a
given objective’ and a method is then described as ‘the research method selected to carry
out the metric (sampling plan, analysis plan, statistics, research method, etc.)’. These
metrics are found in the literature or are developed based on metrics in the literature
specific to the given objective. Metrics were chosen based on their applicability to the
objective, the resources required to implement the metrics and the data available to the
researcher. Once a metric is selected, the method is selected or designed for that metric.
Figure 7 below outlines this process.
Fieure 7: Defining Metrics and Methods
Objectives and reach are identified
Contract, interview data, source documents
Method developed to implement metric
Alternative metrics are considered and one is chosen
An example of the application of the four steps of Figure 7 is drawn from a study
(O’Reilly, Nadeau, Seguin and Harrison, 2006) of in-stadium sponsorships at the 2004
Grey Cup, the championship game of the Canadian Football League (CFL). First, a
review of marketing materials and the sponsorship contract was carried out, followed by
interviews with key marketing contacts. Second, a number of objectives were identified.
One sponsor, a large manufacturer of consumer products, had its sponsorship of the
Reproduced with permission of the copyright owner. Further reproduction prohibited without permission.
National Hockey League cancelled due to a league-wide strike and decided to re-allocate
those resources to other major Canadian sport properties, including the CFL. The
objective was to build awareness of two specific products. In return for the promotional
opportunities offered by the CFL, this sponsor committed $390,000 in return for
sponsorship rights. One of the in-stadium tactics implemented was two broadcast
vignettes (one per product) on the Jumbotron. Third, the evaluation was planned by
considering a variety of metrics. Options included (i) post-event interviews with
marketing staff, (ii) tracking sales data following the Grey Cup, (iii) random, in-stadium
questionnaires immediately following the vignettes, (iv) pre- and post-event recall
surveys around the stadium, and (v) post-event mass market studies. A combination of
options iii and iv was chosen for a number of reasons including granted access to the
stadium, resources available, ability to measure immediate impact of the vignettes, access
to data, ability to achieve ethics approval and overall cost. Fourth, the specific method
was developed to implement the metric, which included having 8 researchers in randomly
selected stadium sections with clipboards, short surveys (one-page) and stadium access
passes so that the researchers were at the ready to exploit the small window of
opportunity in the minute(s) following the diffusion of each of the vignettes. The same
group of researchers also collected data pre-game and post-game with an additional set of
surveys. The questions included on all three surveys were designed to assess the
effectiveness of the vignettes in achieving awareness of the two products.
Reproduced with permission of the copyright owner. Further reproduction prohibited without permission.
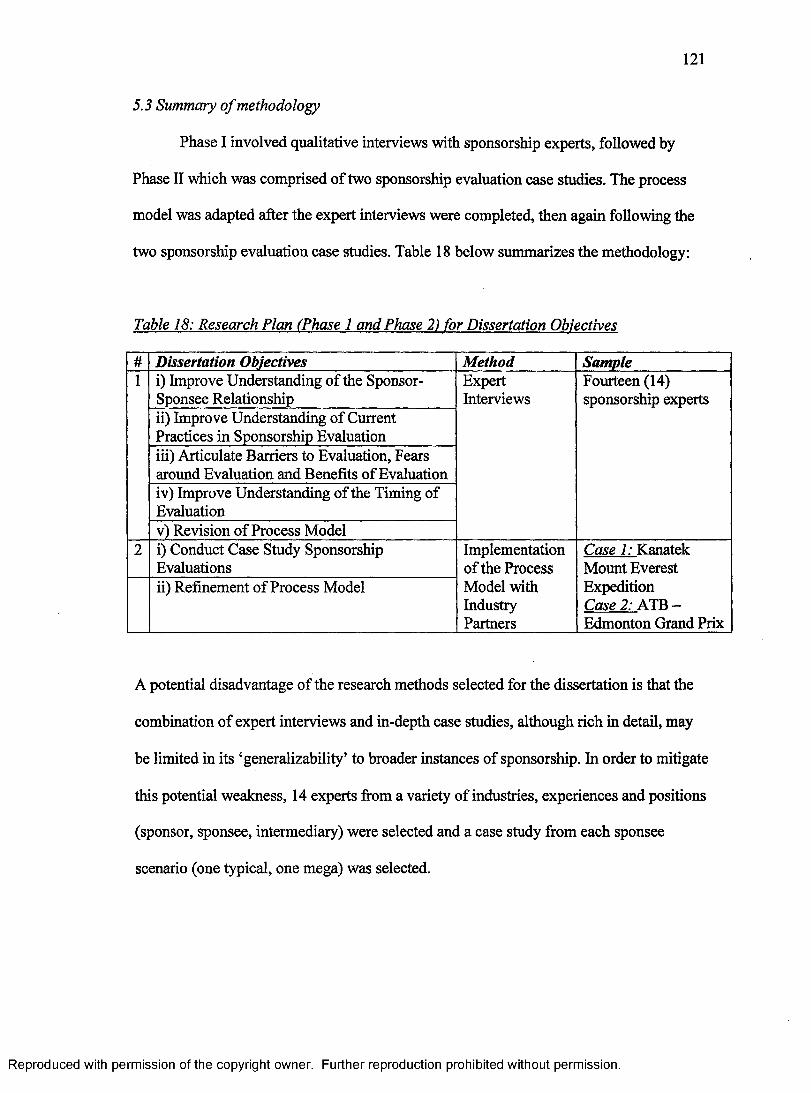
121
5.3 Summary o f methodology
Phase I involved qualitative interviews with sponsorship experts, followed by
Phase II which was comprised of two sponsorship evaluation case studies. The process
model was adapted after the expert interviews were completed, then again following the
two sponsorship evaluation case studies. Table 18 below summarizes the methodology:
Table 18: Research Plan (Phase 1 and Phase 2) for Dissertation Objectives
# Dissertation Objectives Method Sample1 i) Improve Understanding of the Sponsor-
Sponsee RelationshipExpertInterviews
Fourteen (14) sponsorship experts
ii) Improve Understanding of Current Practices in Sponsorship Evaluationiii) Articulate Barriers to Evaluation, Fears around Evaluation and Benefits of Evaluationiv) Improve Understanding of the Timing of Evaluationv) Revision of Process Model
2 i) Conduct Case Study Sponsorship Evaluations
Implementation of the Process Model with Industry Partners
Case 1: Kanatek Mount Everest Expedition Case 2: ATB - Edmonton Grand Prix
ii) Refinement of Process Model
A potential disadvantage of the research methods selected for the dissertation is that the
combination of expert interviews and in-depth case studies, although rich in detail, may
be limited in its ‘generalizability’ to broader instances of sponsorship. In order to mitigate
this potential weakness, 14 experts from a variety of industries, experiences and positions
(sponsor, sponsee, intermediary) were selected and a case study from each sponsee
scenario (one typical, one mega) was selected.
Reproduced with permission of the copyright owner. Further reproduction prohibited without permission.

6.0 RESULTS AND ANALYSIS
This chapter presents the results and analysis for Phase I and Phase II. The first
sub-section reports on the results and analyses of the Phase I expert interviews ending
with an updated draft of the process model. The second sub-section is divided in two
parts, one for each of the sponsorship evaluation case studies. Given the step-by-step,
iterative nature of the process model, results and analysis for each of the sponsorship
evaluation case studies are presented concurrently to the methodological developments of
each process model. A final process model refinement is presented following the two
sponsorship evaluation case studies.
6.1 Phase I: Expert Interviews
The expert interviews were structured in six sections. First, interviewees were
asked to verify their expertise, to provide background information on sponsorship
practice in their experience, and to comment on issues in sponsorship. The remaining
sections of the interviews corresponded to the four dissertation sub-objectives plus an
opportunity to provide feedback on the process model (the major dissertation objective).
The results and analyses of these interviews are summarized and presented using the
same structure.
6.1.1 Background on Interviewees
Table 19 below summarizes the roster of interviewees and outlines their
involvement and expertise with sponsorship evaluation. The overall goal of the selection
of these expert interviewees was to include experts representing the points of view of the
Reproduced with permission of the copyright owner. Further reproduction prohibited without permission.
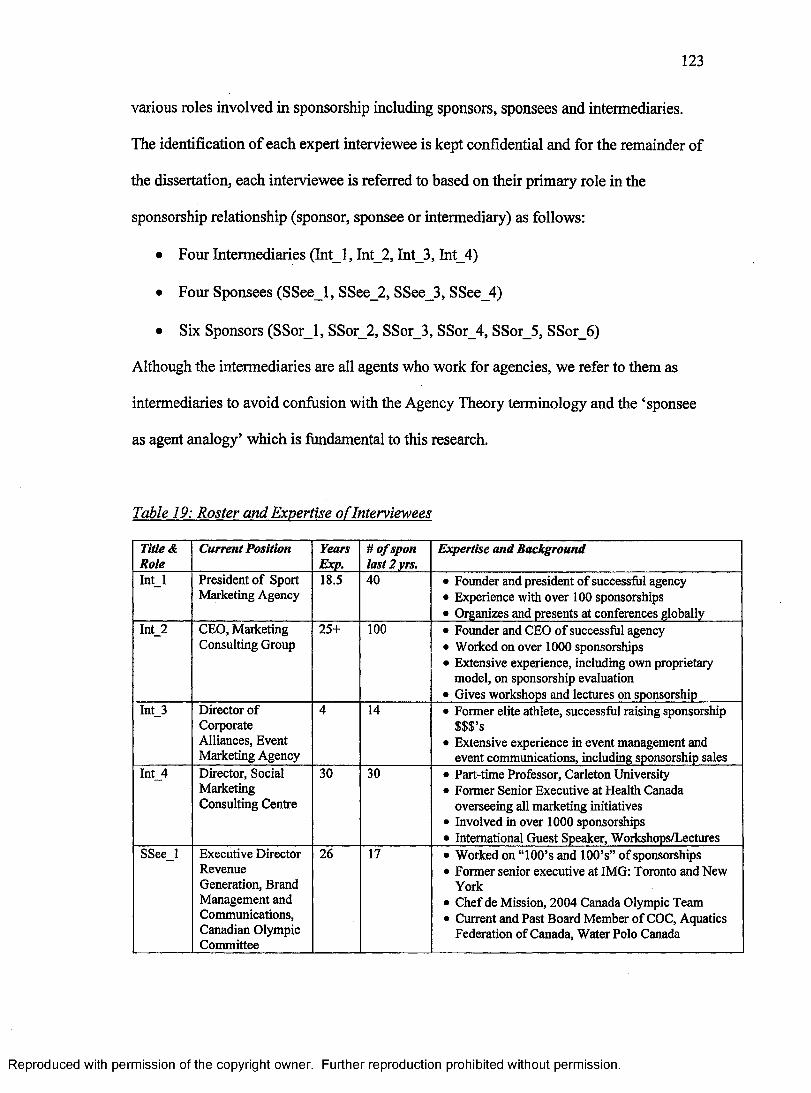
123
various roles involved in sponsorship including sponsors, sponsees and intermediaries.
The identification of each expert interviewee is kept confidential and for the remainder of
the dissertation, each interviewee is referred to based on their primary role in the
sponsorship relationship (sponsor, sponsee or intermediary) as follows:
• Four Intermediaries (Int_l, Int_2, Int_3, Int_4)
• Four Sponsees (SSee_l, SSee_2, SSee_3, SSee_4)
• Six Sponsors (SSorl, SSor_2, SSor_3, SSor_4, SSor_5, SSor_6)
Although the intermediaries are all agents who work for agencies, we refer to them as
intermediaries to avoid confusion with the Agency Theory terminology and the ‘sponsee
as agent analogy’ which is fundamental to this research.
Table 19: Roster and Expertise o f Interviewees
Title & Role
Current Position YearsExp.
# of spon last 2 yrs.
Expertise and Background
I n t i President of Sport Marketing Agency
18.5 40 • Founder and president of successful agency• Experience with over 100 sponsorships• Organizes and presents at conferences globally
Int_2 CEO, Marketing Consulting Group
25+ 100 • Founder and CEO of successful agency• Worked on over 1000 sponsorships• Extensive experience, including own proprietary
model, on sponsorship evaluation• Gives workshops and lectures on sponsorship
Int_3 Director of Corporate Alliances, Event Marketing Agency
4 14 • Former elite athlete, successful raising sponsorship $$$’s
• Extensive experience in event management and event communications, including sponsorship sales
Int_4 Director, Social Marketing Consulting Centre
30 30 • Part-time Professor, Carleton University• Former Senior Executive at Health Canada
overseeing all marketing initiatives• Involved in over 1000 sponsorships• International Guest Speaker, Workshops/Lectures
SSee_l Executive Director RevenueGeneration, Brand Management and Communications, Canadian Olympic Committee
26 17 • Worked on “100’s and 100’s” of sponsorships• Former senior executive at IMG: Toronto and New
York• Chef de Mission, 2004 Canada Olympic Team• Current and Past Board Member of COC, Aquatics
Federation of Canada, Water Polo Canada
Reproduced with permission of the copyright owner. Further reproduction prohibited without permission.
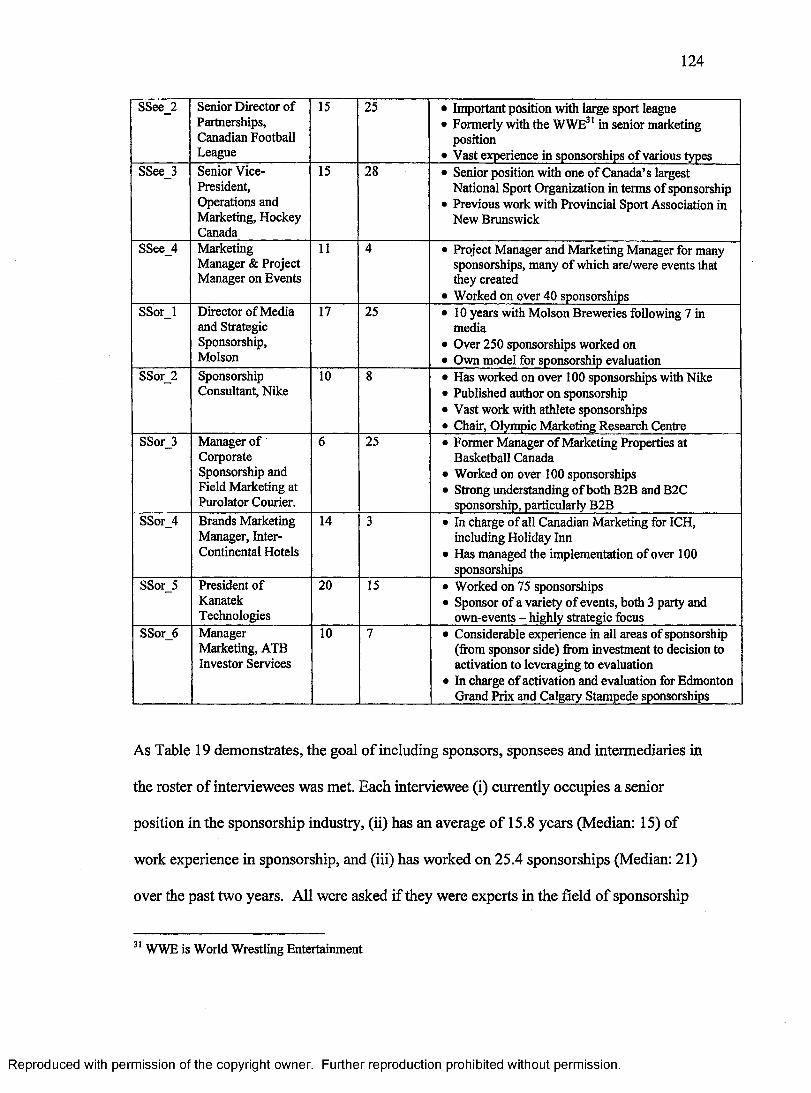
124
SSee_2 Senior Director of Partnerships, Canadian Football League
15 25 • Important position with large sport league• Formerly with the WWE31 in senior marketing
position• Vast experience in sponsorships of various types
SSee_3 Senior Vice- President, Operations and Marketing, Hockey Canada
15 28 • Senior position with one of Canada’s largest National Sport Organization in terms of sponsorship
• Previous work with Provincial Sport Association in New Brunswick
SSee_4 Marketing Manager & Project Manager on Events
11 4 • Project Manager and Marketing Manager for many sponsorships, many of which are/were events that they created
• Worked on over 40 sponsorshipsSSor_l Director of Media
and Strategic Sponsorship, Molson
17 25 • 10 years with Molson Breweries following 7 in media
• Over 250 sponsorships worked on• Own model for sponsorship evaluation
SSor_2 Sponsorship Consultant, Nike
10 8 • Has worked on over 100 sponsorships with Nike• Published author on sponsorship• Vast work with athlete sponsorships• Chair, Olympic Marketing Research Centre
SSor_3 Manager of Corporate Sponsorship and Field Marketing at Purolator Courier.
6 25 • Former Manager of Marketing Properties at Basketball Canada
• Worked on over 100 sponsorships• Strong understanding of both B2B and B2C
sponsorship, particularly B2BSSor_4 Brands Marketing
Manager, InterContinental Hotels
14 3 • In charge of all Canadian Marketing for ICH, including Holiday Inn
• Has managed the implementation of over 100 sponsorships
SSor_5 President ofKanatekTechnologies
20 15 • Worked on 75 sponsorships• Sponsor of a variety of events, both 3 party and
own-events - highly strategic focusSSor_6 Manager
Marketing, ATB Investor Services
10 7 • Considerable experience in all areas of sponsorship (from sponsor side) from investment to decision to activation to leveraging to evaluation
• In charge of activation and evaluation for Edmonton Grand Prix and Calgary Stampede sponsorships
As Table 19 demonstrates, the goal of including sponsors, sponsees and intermediaries in
the roster of interviewees was met. Each interviewee (i) currently occupies a senior
position in the sponsorship industry, (ii) has an average of 15.8 years (Median: 15) of
work experience in sponsorship, and (iii) has worked on 25.4 sponsorships (Median: 21)
over the past two years. All were asked if they were experts in the field of sponsorship
31 WWE is World Wrestling Entertainment
Reproduced with permission of the copyright owner. Further reproduction prohibited without permission.
1 2 5
and all but one expert self-identified as an expert, with modesty expressed in many cases
(considering their high levels of expertise). These experts have worked on a wide range
of different sizes and types of sponsorships including international mega-sponsees like
the Olympic Games or the Grey Cup and a variety of typical-sponsees such as the Nike
Toronto 10km run and Clear & Clean Basketball Skills Days32.
Interviewees were also asked about the nature of their specific work on
sponsorships. The wording of the question was: “In working on a sponsorship, both
during negotiations to sign a contract and during the implementation of the contract itself,
what kinds of things are you typically involved in?” The information provided by the
sponsees reveals that all have been involved in most aspects of the sponsorship process
ranging from the first stages of planning to sales through to contract negotiation,
activation and evaluation. Some provided very detailed descriptions while others were
more general in their responses. One expert provided a detailed description of the
sponsorship process which provides valuable insight:
It would start with a presentation where our focus is making that sales pitch or presentation to show that we are the right property and in doing that, we attempt to do the research and understand what the sport strategy and more specifically what the hockey strategy is of the partner and we spin that back to them in such a way as to show that we are an attractive resource for them and present that in a format to their key marketing representative. We [then] attempt to structure the sales presentation to the level of the person you are pitching it to. You may have someone who is intricately involved both in negotiating and signing the deal and also executing the deal so the attention to detail in that presentation is critical or you may be presenting to a high level marketing representative who wants to know the high level components. So, that is more of the verbal approach to how you are making the pitch. Through the negotiation process it is clearly critical to document any modifications, any adjustments, [and] any side agreements to insure that expectations are managed. And then, once the agreement is in place, then the real work begins to make sure that you can deliver on what the expectations are against the
32 Clear and Clean Basketball Skills Days are events run in Ontario high schools targeted at high school females and promoting basketball skills and healthy skin.
Reproduced with permission of the copyright owner. Further reproduction prohibited without permission.
1 2 6
opportunities that you promised. At [the organization], we have a document called our seasonal plans which includes everything from quarterly meetings to weekly telephone calls to regular conference calls to the delivery of say goods & services.. .tickets, banners, promotional materials, processes for the singing off of activation, sign off on point of sale or point of purchase materials.. .reporting against the objectives, regularly through the year but then in a formal way at the end of the year. Documenting details and critical dates on the submission of advertisements for event programs, those types of technical components. And, then once through the agreement, conducting a detailed assessment on the ROI. (SSee_3)
All interviewees have worked in most aspects of sponsorship, with particular emphasis
on the areas related to their position, function or organization. Differences between the
work of sponsors, sponsees and intermediaries is also clear with the work of sponsors
emphasizing sponsorship renewal, activation and contract negotiations; the work of
sponsees involving the monitoring of the sponsor and intermediaries, as well as resource
allocation; and that of intermediaries typically including work to keep both sponsor(s)
and sponsee(s) happy.
Interestingly, one sponsee expert added that part of his work recently involved
engaging a 3rd party to evaluate sponsorships up for renewal: “we conducted an
independent assessment with IEG on what the value of the sponsor offering was”
(SSee_3). He further added that the main reason for obtaining the 3rd party review was
“to develop a good negotiation support document [an evaluation study] to be able to say
‘a bona fide agency who you do some work with also believes that this offering is worth
what we’re asking for’...it is more about what their [IEG - the firm doing the evaluation]
reputation is than the report they send back” (SSee_3).
Reproduced with permission of the copyright owner. Further reproduction prohibited without permission.
1 2 7
6.1.2 Background Sponsorship Information
At the onset of the interviews, the interviewees were asked a series of questions
around three topics related to the sponsorship literature: (i) the definition of sponsorship,
(ii) sponsorship’s effectiveness vis-a-vis the other promotional strategies, and (iii)
sponsorship’s distinction from advertising. The posing of these questions had two
purposes; to delve deeper into issues yet to be resolved in the literature and to set the
stage for the more important questions that followed. Full results and analysis are not
reported here although a few summary points directly related to the objectives of this
dissertation are noted. First, the responses of the interviewees supported all 10 tenets of
the working definition of sponsorship crafted for this dissertation. Second, when asked
for their general opinion on the overall effectiveness of sponsorship, responses were
unanimously very positive. Third, interviewees were asked if sponsorship is different
from advertising with 13 of the 14 experts agreeing clearly that they are distinct and the
final expert being undecided.
6.1.3 Understanding the sponsor-sponsee relationship
A major section of the interviews sought to improve understanding of the
sponsor-sponsee relationship and asked interviewees 10 questions on related issues that
were identified in the review of literature. The questions posed ranged from how
sponsorship relationships are typically started to how they are typically terminated. These
results are summarized in the subsections that follow.
Reproduced with permission of the copyright owner. Further reproduction prohibited without permission.
128
6.1.3.1 How sponsorships begin and end
In order to learn more about how sponsorship relationships are created,
interviewees were asked to describe how a recent sponsorship was initiated and how, in
their experience, they are normally terminated. The resulting responses show a varied
landscape of how sponsorships are initiated and how they are terminated, where sponsors,
sponsees and intermediaries all expressed that they typically started sponsorship
relationships themselves. It appears that each group believes that they play the most
important role in creating sponsorships.
Three of the four intermediaries suggested that sponsorship relationships typically
begin with them working on behalf of a sponsor who has identified specific marketing
objectives that they wish to achieve. As stated by Int_2: “we start off with what we are
trying to achieve for our client [sponsor] and we take a look at what it is that we need to
achieve through a sponsorship component and identify properties [sponsees] who provide
for that”, while Int_l said that “we recommended a relationship [sponsee] to the client
[sponsor].”
All four sponsees indicated that they typically begin sponsorships based on the
need for resources (typical sponsees) or for the pursuit of specific global marketing
objectives (mega-sponsees). SSee_l provided an example of the most recent IOC Top
Sponsor:
It was started because for years this major global corporation was looking for a platform that they could leverage in multiple countries and then when Beijing [China] was named the 2008 host city and China is their single largest growing market. And, their research said that the Olympic Games were incredibly well known in China and very popular and so they decided that this gave them a platform to - one - grow their business in China which was their number 1 corporate objective but - two - give all regions a common platform to deal with. (SSee_l)
Reproduced with permission of the copyright owner. Further reproduction prohibited without permission.

1 2 9
Although this story is an interesting mega-sponsee example, SSee_l admitted that this
was not normal practice for typical sponsees. In his experience of how mega-sponsee
relationships are initiated, he noted the following.
There is a myriad of ways that they happen from the CEO likes to golf so he wants to invest in golf, to the people who own the sponsorship rights out flogging them on the street with no understanding of what the corporate needs are of the people they are flogging them to - to corporations that clearly know what their goals and objectives are and identify a need within those objectives that a sponsorship program can help deliver against.... [basically] various levels of sophistication.(SSee_l)
Thus, for typical sponsees, the impetus for beginning sponsorship relationships is to gain
access to additional resources. In drawing on his long experience as a sponsee at Health
Canada, Int_4 recalled that they decided to embark on sponsorship “based on a policy
initiative or strategy based on our marketing plan with clear measurable objectives and
then [we] went out and sought sponsors who tied into our plan.” Int_4 also indicated that
“other times, it does come from the sponsor who wants to work with us and approaches
us”; although in this case he noted that “if somebody [sponsee] comes to you, it is always
a problem as it is very rare that it is a good fit”. He further noted that in the case of
sponsors approaching the sponsee:
Sometimes sponsors will come and pitch you on why you should put antismoking messages on their products or their events with not a thought if it meets the needs of Health Canada and/or its target groups. Sometimes the political arm gets involved and Health Canada may be forced to do something that doesn’t fit with the plan and is not the best fit for the message or product or service. This is rare but it does happen. Sometimes people also get ‘starry-eyes’.. .and they just want to be part of some property for the wrong reasons so this leads to potential sponsors going after properties that are not really a good fit or a smart business choice.(Int_4)
Reproduced with permission of the copyright owner. Further reproduction prohibited without permission.
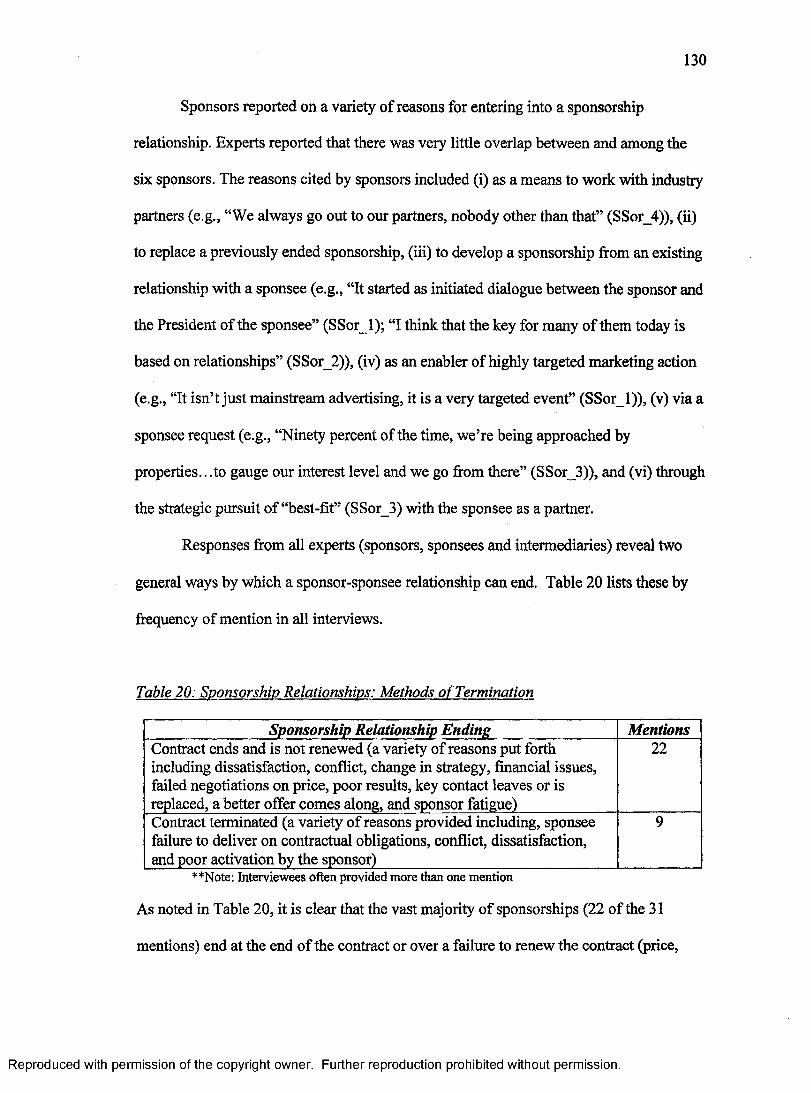
1 3 0
Sponsors reported on a variety of reasons for entering into a sponsorship
relationship. Experts reported that there was very little overlap between and among the
six sponsors. The reasons cited by sponsors included (i) as a means to work with industry
partners (e.g., “We always go out to our partners, nobody other than that” (SSor_4)), (ii)
to replace a previously ended sponsorship, (iii) to develop a sponsorship from an existing
relationship with a sponsee (e.g., “It started as initiated dialogue between the sponsor and
the President of the sponsee” (SSorl); “I think that the key for many of them today is
based on relationships” (SSor_2)), (iv) as an enabler of highly targeted marketing action
(e.g., “It isn’t just mainstream advertising, it is a very targeted event” (SSor_l)), (v) via a
sponsee request (e.g., “Ninety percent of the time, we’re being approached by
properties.. .to gauge our interest level and we go from there” (SSor_3)), and (vi) through
the strategic pursuit of “best-fit” (SSor_3) with the sponsee as a partner.
Responses from all experts (sponsors, sponsees and intermediaries) reveal two
general ways by which a sponsor-sponsee relationship can end. Table 20 lists these by
frequency of mention in all interviews.
Table 20: Sponsorship Relationships: Methods o f Termination
Sponsorship Relationship Ending MentionsContract ends and is not renewed (a variety of reasons put forth including dissatisfaction, conflict, change in strategy, financial issues, failed negotiations on price, poor results, key contact leaves or is replaced, a better offer comes along, and sponsor fatigue)
22
Contract terminated (a variety of reasons provided including, sponsee failure to deliver on contractual obligations, conflict, dissatisfaction, and poor activation by the sponsor)
9
* *Note: Interviewees often provided more than one mention
As noted in Table 20, it is clear that the vast majority of sponsorships (22 of the 31
mentions) end at the end of the contract or over a failure to renew the contract (price,
Reproduced with permission of the copyright owner. Further reproduction prohibited without permission.
131
strategy, etc.). One of the experts recounts a good anecdote that demonstrates how
tenuous these relationships can be:
I think the last one I’ll tell you is that we have had a couple of situations, one in particular when I first started that they were sold.. .a telecommunications company was sold an opportunity to be title to one of our development programs.. .and, we were clear with them through the sales process that they were buying the right to be title sponsor and have promotional rights in and around that and their marketing staff thought that they had the right to adjust, manipulate, maneuver, change the title and the delivery methods of the program and we spent the better part of 15 months realizing that we weren’t meant for each other and we agreed to shake hands and walk away. So, you know, we also operate with the philosophy that - even with our top sponsors who pay us a pretty substantial amount of money, you know well into the 6 figures nearing 7 figures on an annual basis - if it is not right, let’s have the conversation and see if it is not best to just shake hands and walk away. (SSee_3)
6.1.3.2 Frequency o f Sponsor-Sponsee Communication
An important aspect of any sponsorship relationship is the amount of effort and
time that the parties involved in the relationship spend communicating. All experts were
asked about the frequency of contact in the relationship. The responses of the 14 experts
are summarized in the histogram (Figure 8) below.
Reproduced with permission of the copyright owner. Further reproduction prohibited without permission.
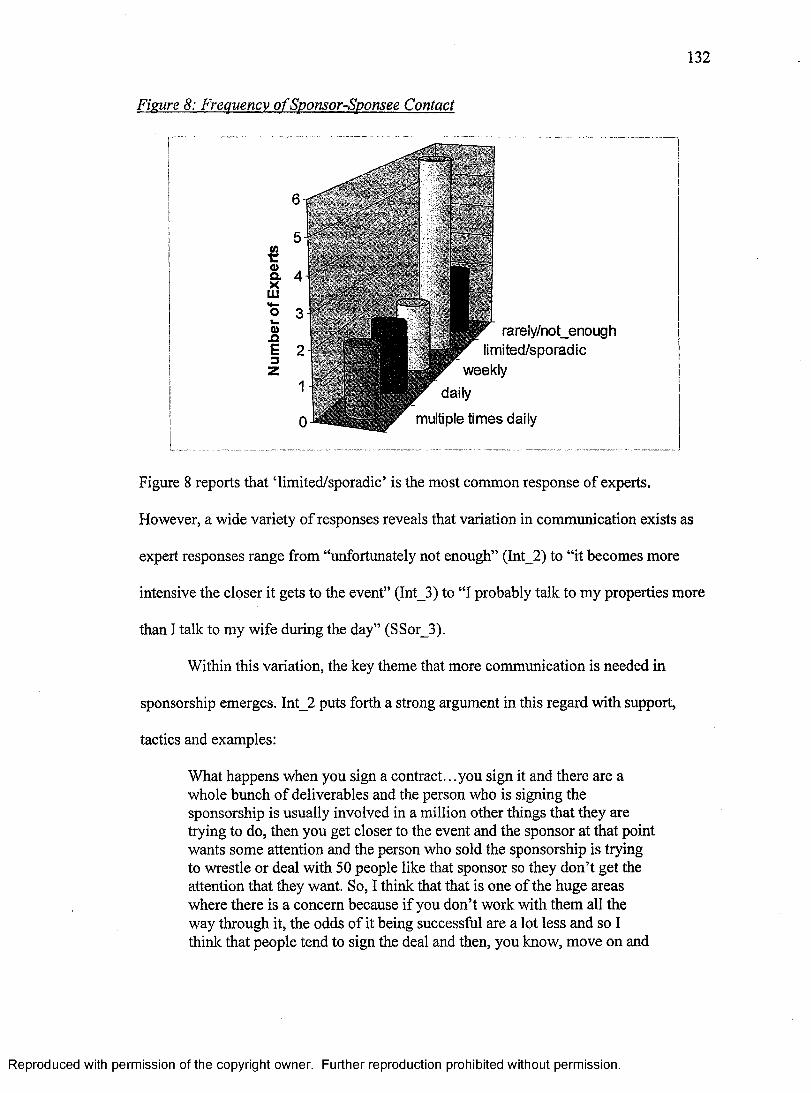
1 3 2
Fisure 8: Frequency ofSponsor-Sponsee Contact
p P g r rareIy/not_enough ■ N r limited/sporadic
T&jgr weekly ^ daily
multiple times daily
Figure 8 reports that ‘limited/sporadic’ is the most common response of experts.
However, a wide variety of responses reveals that variation in communication exists as
expert responses range from “unfortunately not enough” (Int_2) to “it becomes more
intensive the closer it gets to the event” (Int 3) to “I probably talk to my properties more
than I talk to my wife during the day” (SSor_3).
Within this variation, the key theme that more communication is needed in
sponsorship emerges. Int_2 puts forth a strong argument in this regard with support,
tactics and examples:
What happens when you sign a contract.. .you sign it and there are a whole bunch of deliverables and the person who is signing the sponsorship is usually involved in a million other things that they are trying to do, then you get closer to the event and the sponsor at that point wants some attention and the person who sold the sponsorship is trying to wrestle or deal with 50 people like that sponsor so they don’t get the attention that they want. So, I think that that is one of the huge areas where there is a concern because if you don’t work with them all the way through it, the odds of it being successful are a lot less and so I think that people tend to sign the deal and then, you know, move on and
Reproduced with permission of the copyright owner. Further reproduction prohibited without permission.
133
then when there is an issue, they deal with it because they are dealing with so many other crises and such. But, you know, what we tend to do is, for example, is when we sign a sponsorship deal with somebody it sort of depends whether it is short term or long term or whatever. So, for example, I was involved with raising about $5 million for school-net grass-roots program which was a national initiative to get people to encourage teachers to use online technologies in the classroom. And, we went out and got anywhere from 60 thousand to a million dollar sponsorships with companies like Microsoft and AOL and Cisco Systems and Imperial Oil and CN and all these companies and the agreement was over a 3 year period so what we did was that we built in a quarterly reporting mechanism to provide people with updates so that they were always getting updates. We gave them an annual report that said here is the reach and here is what we accomplished over the last year so we built reporting mechanisms right into that. The other thing that we do.. .is we’ll give them a list of key deliverables and deadlines that are required on their part so that when the sign the agreement, the next thing that they get from this thing is a letter saying thanks a lot now here is your list of what is due and when it is due by. (Int_2)
SSee_3 agrees and adopts some alternate strategies to encourage communication:
We structure a process on any major project.. .we have an account manager assigned to every sponsor who is the point of contact and the goto person for that sponsor. We try to divvy up those responsibilities and that contact is happening on a regular basis, at least on a week-to-week basis but, in some cases because of the need and the desire for a little bit of hand holding, it could be on a daily basis. Formally, that group comes together on a monthly basis via conference call starting about 6 months out from the event.. .so that gives you a bit of a framework of how things were initiated and managed through the process.
6.1.3.3 Agency Theory in sponsorship
Throughout the interviews, a number of questions were asked around key
components of Agency Theory (e.g. the contract, monitoring, etc.) and if they fit with
sponsorship. These results are summarized in the following sub-sections.
Reproduced with permission of the copyright owner. Further reproduction prohibited without permission.

134
6.1.3.3.1 Formal Sponsorship Contract
The contract is the unit of analysis in Agency Theory. Thus, a question was asked
to assess the relative occurrence of formal contracts in sponsorship. All 14 of the experts
reported that, today, contracts - either a formal legal contract or a simpler letter of
understanding (Int_2) - are involved in all sponsorships.
6.1.3.3.2 Evidence o f Sponsee Monitoring
In looking at the sponsor-sponsee relationship as an instance of a
principal-agent relationship, we would expect to see evidence of the sponsor
monitoring the activities of the sponsee to control for shirking behaviour. The
question posed was “does the sponsor monitor the sponsee in any way?” with
further explanation required if requested by the interviewee or determined to be
necessary by the interviewer. Results indicate that “increased attention is being
paid to monitoring” (SSee l), and that the monitoring of sponsees is common in
sponsorship as all six of the sponsors, three of four sponsees, and three of the four
intermediaries reported that sponsors monitor sponsees to some level. The
sponsee and intermediary who reported to the contrary were strong in their
claims. For example, Int_l indicated that “sponsors often don’t monitor”.
This line of questioning also revealed that the monitoring that is taking place is
often of limited sophistication and scope. SSee_2 clarifies that “many factors will result
in how often the sponsor will follow-up with the sponsee” and SSee_3 notes that “we
monitor each other” reminding us that monitoring and shirking are two-way constructs.
Reproduced with permission of the copyright owner. Further reproduction prohibited without permission.
135
SSor l has taken this a step further and now has “a recent contract with a clause in there
that sort of holds them [sponsee] to ensuring that they comply with the contract”.
6.1.3.3.3 Sponsee Compliance
Interviewees were asked to respond on what sponsors do (or can do) to encourage
sponsee compliance to the items agreed to in a sponsorship contract. In Agency Theory
terms, what can the sponsor do vis-a-vis timing to monitor the sponsee to reduce
shirking? The importance of sponsee compliance in sponsorship renewal was noted:
A huge part of servicing sponsors and the whole sponsorship process is having people renew sponsorships. The worse kind of sponsorship you can have is a one- off, one-year opportunity because you can’t really generate true results in a one year opportunity and so, you know, we do what we can to try to make them happy since if they like you the odds are that they’11 forgive you on something too. (Int_2)
In total, the interviews suggested 12 different strategies that a sponsor could employ to
encourage compliance. These responses were then grouped by common theme into 4
general recommendations to sponsors: (i) ensure the development of a clear, strong and
binding contract that includes deadlines and termination clauses for deliverables (5
mentions), (ii) monitor the sponsee regularly with sponsee-provided weekly reports and
daily communication (5 mentions), (iii) adopt project management practices (2
mentions), and (iv) engage outside sponsorship expertise where necessary (1 mention).
Reproduced with permission of the copyright owner. Further reproduction prohibited without permission.
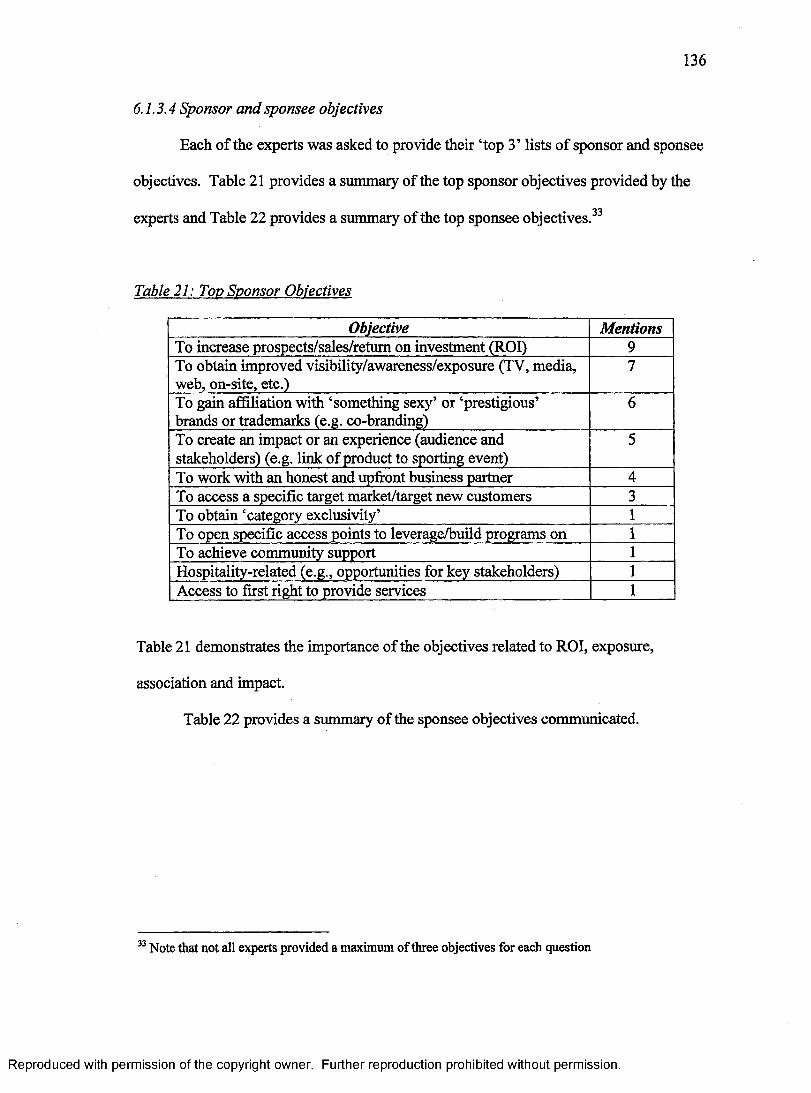
1 3 6
6.1.3.4 Sponsor and sponsee objectives
Each of the experts was asked to provide their ‘top 3’ lists of sponsor and sponsee
objectives. Table 21 provides a summary of the top sponsor objectives provided by the
experts and Table 22 provides a summary of the top sponsee objectives.33
Table 21: Top Sponsor Objectives
Objective MentionsTo increase prospects/sales/retum on investment (ROI) 9To obtain improved visibility/awareness/exposure (TV, media, web, on-site, etc.)
7
To gain affiliation with ‘something sexy’ or ‘prestigious’ brands or trademarks (e.g. co-branding)
6
To create an impact or an experience (audience and stakeholders) (e.g. link of product to sporting event)
5
To work with an honest and upfront business partner 4To access a specific target market/target new customers 3To obtain ‘category exclusivity’ 1To open specific access points to leverage/build programs on 1To achieve community support 1Hospitality-related (e.g., opportunities for key stakeholders) 1Access to first right to provide services 1
Table 21 demonstrates the importance of the objectives related to ROI, exposure,
association and impact.
Table 22 provides a summary of the sponsee objectives communicated.
33 Note that not all experts provided a maximum of three objectives for each question
Reproduced with permission of the copyright owner. Further reproduction prohibited without permission.
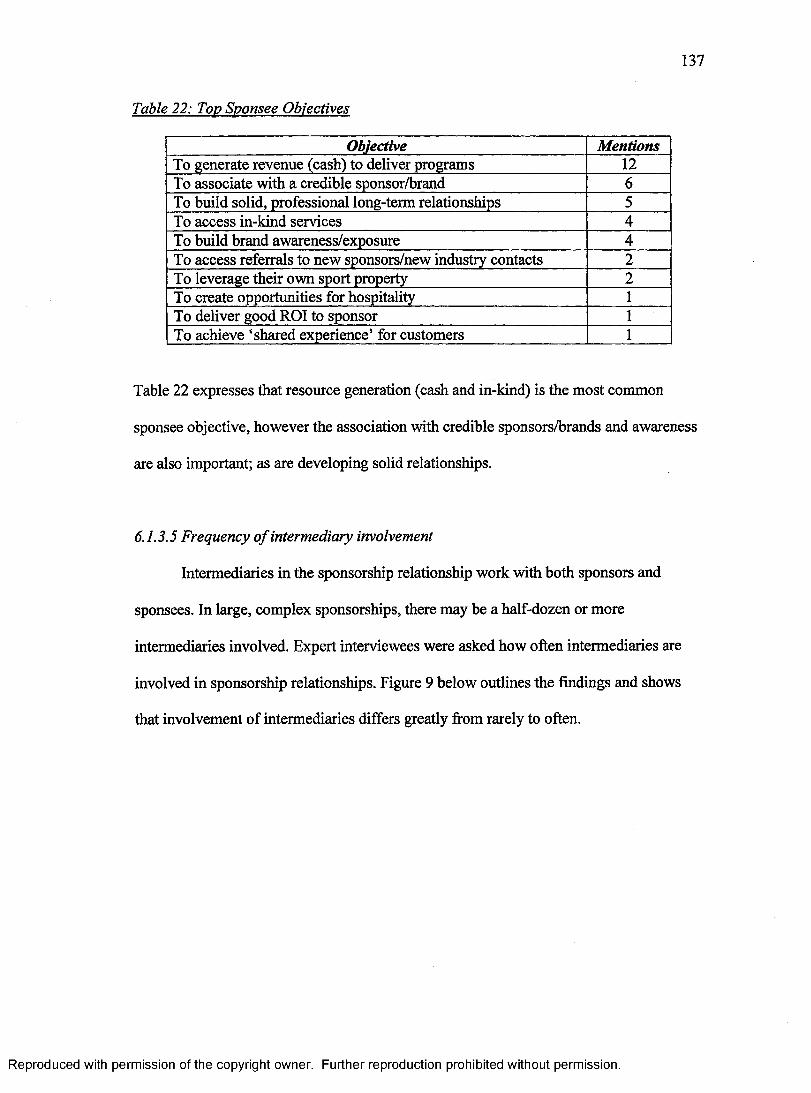
1 3 7
Table 22: Top Sponsee Objectives
Objective MentionsTo generate revenue (cash) to deliver programs 12To associate with a credible sponsor/brand 6To build solid, professional long-term relationships 5To access in-kind services 4To build brand awareness/exposure 4To access referrals to new sponsors/new industry contacts 2To leverage their own sport property 2To create opportunities for hospitality 1To deliver good ROI to sponsor 1To achieve ‘shared experience* for customers 1
Table 22 expresses that resource generation (cash and in-kind) is the most common
sponsee objective, however the association with credible sponsors/brands and awareness
are also important; as are developing solid relationships.
6.1.3.5 Frequency o f intermediary involvement
Intermediaries in the sponsorship relationship work with both sponsors and
sponsees. In large, complex sponsorships, there may be a half-dozen or more
intermediaries involved. Expert interviewees were asked how often intermediaries are
involved in sponsorship relationships. Figure 9 below outlines the findings and shows
that involvement of intermediaries differs greatly from rarely to often.
Reproduced with permission of the copyright owner. Further reproduction prohibited without permission.
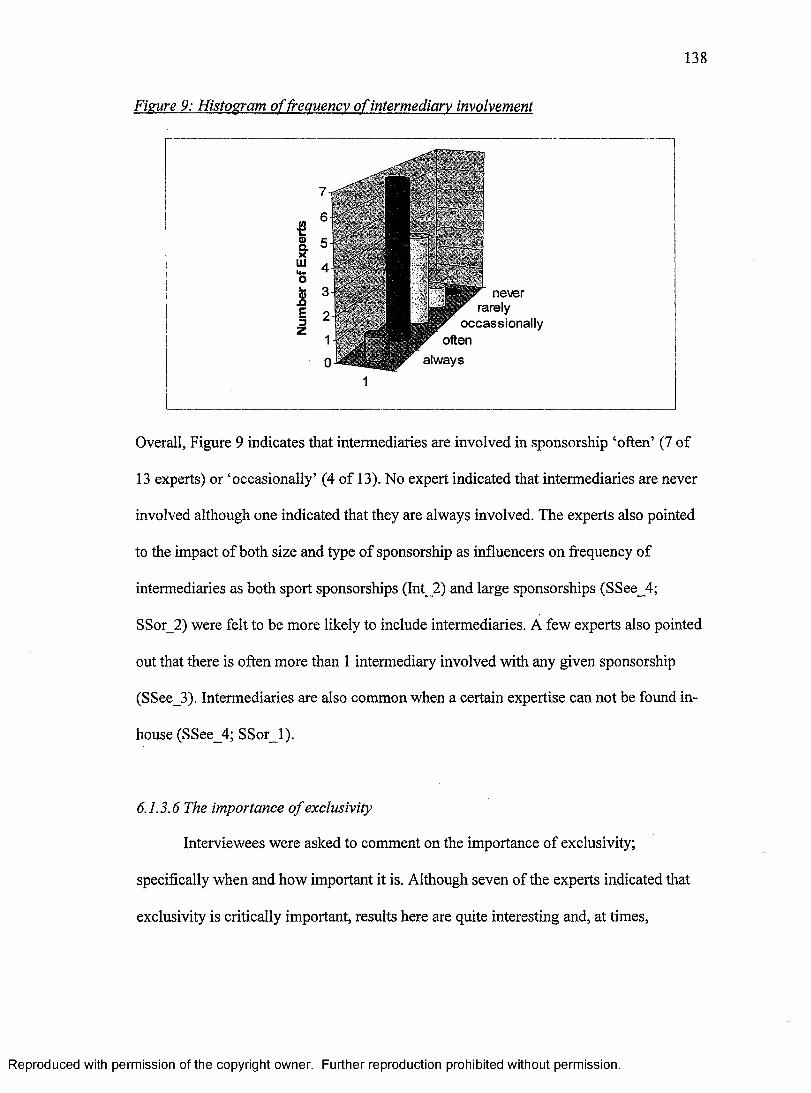
1 3 8
Fisure 9: Histosram o f frequency o f intermediary involvement
never * rarely occassionally
V often always
1
Overall, Figure 9 indicates that intermediaries are involved in sponsorship ‘often’ (7 of
13 experts) or ‘occasionally’ (4 of 13). No expert indicated that intermediaries are never
involved although one indicated that they are always involved. The experts also pointed
to the impact of both size and type of sponsorship as influencers on frequency of
intermediaries as both sport sponsorships (Int_2) and large sponsorships (SSee_4;
SSor_2) were felt to be more likely to include intermediaries. A few experts also pointed
out that there is often more than 1 intermediary involved with any given sponsorship
(SSee_3). Intermediaries are also common when a certain expertise can not be found in-
house (SSee_4; SSor_l).
6.1.3.6 The importance o f exclusivity
Interviewees were asked to comment on the importance of exclusivity;
specifically when and how important it is. Although seven of the experts indicated that
exclusivity is critically important, results here are quite interesting and, at times,
Reproduced with permission of the copyright owner. Further reproduction prohibited without permission.
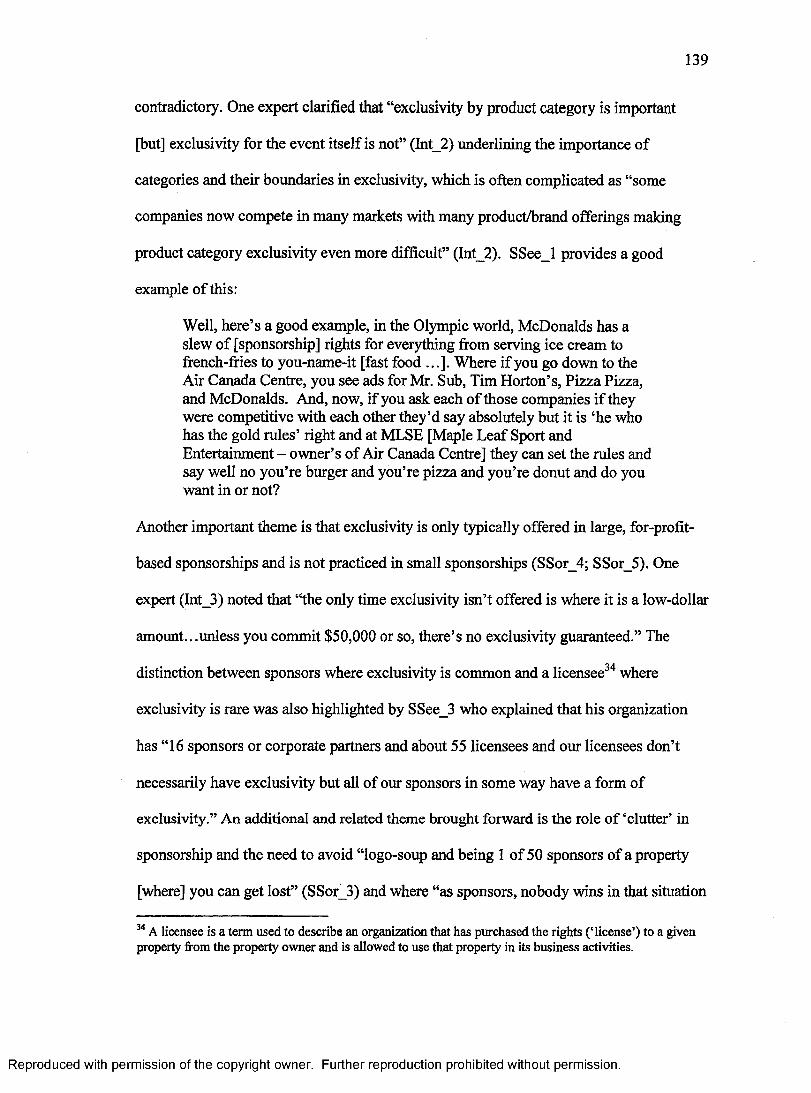
1 3 9
contradictory. One expert clarified that “exclusivity by product category is important
[but] exclusivity for the event itself is not” (Int_2) underlining the importance of
categories and their boundaries in exclusivity, which is often complicated as “some
companies now compete in many markets with many product/brand offerings making
product category exclusivity even more difficult” (Int_2). SSee_l provides a good
example of this:
Well, here’s a good example, in the Olympic world, McDonalds has a slew of [sponsorship] rights for everything from serving ice cream to french-fries to you-name-it [fast food ...]. Where if you go down to the Air Canada Centre, you see ads for Mr. Sub, Tim Horton’s, Pizza Pizza, and McDonalds. And, now, if you ask each of those companies if they were competitive with each other they’d say absolutely but it is ‘he who has the gold rules’ right and at MLSE [Maple Leaf Sport and Entertainment - owner’s of Air Canada Centre] they can set the rules and say well no you’re burger and you’re pizza and you’re donut and do you want in or not?
Another important theme is that exclusivity is only typically offered in large, for-profit-
based sponsorships and is not practiced in small sponsorships (SSor_4; SSor_5). One
expert (Int_3) noted that “the only time exclusivity isn’t offered is where it is a low-dollar
amount...unless you commit $50,000 or so, there’s no exclusivity guaranteed.” The
distinction between sponsors where exclusivity is common and a licensee34 where
exclusivity is rare was also highlighted by SSee_3 who explained that his organization
has “16 sponsors or corporate partners and about 55 licensees and our licensees don’t
necessarily have exclusivity but all of our sponsors in some way have a form of
exclusivity.” An additional and related theme brought forward is the role of ‘clutter’ in
sponsorship and the need to avoid “logo-soup and being 1 of 50 sponsors of a property
[where] you can get lost” (SSor_3) and where “as sponsors, nobody wins in that situation
34 A licensee is a term used to describe an organization that has purchased the rights (‘license’) to a given properly from the property owner and is allowed to use that property in its business activities.
Reproduced with permission of the copyright owner. Further reproduction prohibited without permission.

14 0
because nobody is getting.. .their pound of flesh out of the agreement.. .nobody wins”
(SSor_l).
Contradicting these views is SSee_l who brings forth the NASCAR model as it
allows exclusivity as competing sponsors are visible on cars, stadiums and television
broadcasts. He states: “I personally prefer the NASCAR model but that is because I’d
rather be able to sell more!” (SSee_l). SSee_2 also points out that exclusivity is not
always important, particularly when “a brand can’t afford to buy exclusivity and they’ll
be willing to bet that they’ll get it”. Further, he indicates that
.. .it is a bit superficial though because they know and the property knows that it is pretty rare to go out and get somebody else to come on board in that category if a competitor is already there. You’d think that, yes, they’d want to be there to compete with that competitor but they’ll say no that they’d rather find their own property that they can own. So, yes, in a couple of cases, we won’t have exclusivity language written in [the contract]. (SSee_2)
Similarly, SSee_4 points out that she had not encountered problems around exclusivity
since they organize all of their events and sponsorships with partners who they know and
work with regularly.
6.1.3.7 The Importance o f leveraging
Experts were asked for their opinions on the role of leveraging in sponsorship in
an attempt to further understand the sponsorship relationship. Eleven of the experts
expressed views that were very consistent in suggesting that leveraging is very important.
Typical comments included “leveraging is important 100% of the time” (SSor_6) and
“I’d say that 50% of sponsors are really committed to and looking for ways to leverage it,
which is not enough in my mind” (SSee_2). One expert noted that “if you don’t leverage,
Reproduced with permission of the copyright owner. Further reproduction prohibited without permission.
141
you are wasting the investment [since] sponsorship is the purchase of some asset that
needs, in turn, to be leveraged. It is not an end-promotion in and of itself’ (Int_4). Two
additional key points were expressed. First, one expert identified a marketing strategy
where no leveraging takes place: “I mean there is only one reason to buy a sponsorship
and not leverage it and that is if you want to freeze out your competitors and that is a
strategic buy just to keep them out of it” (SSeel). Second, it was widely noted (five
experts) that leveraging is unique to the sponsorship and the ratio and tactics should be
determined based on the sponsorship.
6.1.4 Understanding current practice in sponsorship evaluation
The next series of questions was posed in order to develop increased awareness
and a better understanding of sponsorship evaluation practices.
6.1.4.1 Sponsorship evaluation experience
All interviewees were asked to describe their own experience with sponsorship
evaluation. Results showed that all the experts have significant experience in sponsorship
evaluation, including four (SSor_l, SSor_3, Int_3, SSee_2) who have developed their
own models to do so. In terms of the intermediaries, all four sell evaluation as a service to
clients. Of note is that seven of the experts are rarely involved in the data collection,
analysis or application of evaluations, they (likely due to their senior positions) normally
only read the summary reports, particularly in the case where a 3rd party is engaged to do
the evaluation.
Reproduced with permission of the copyright owner. Further reproduction prohibited without permission.
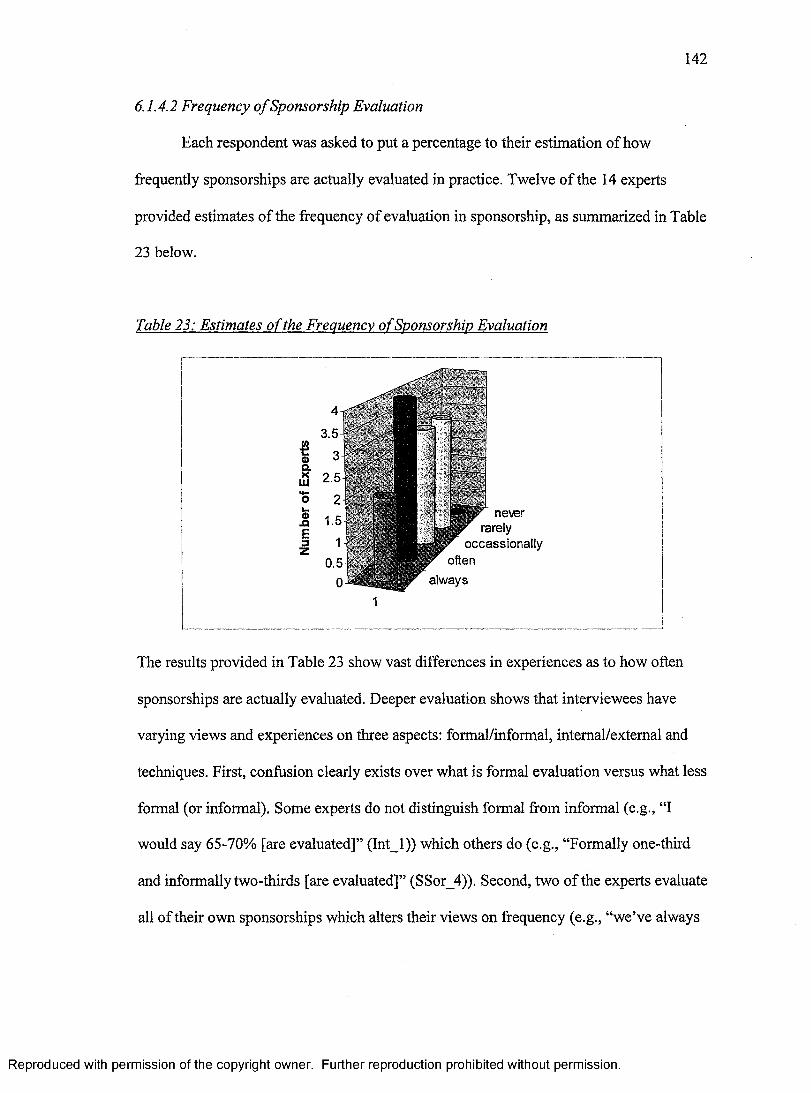
1 4 2
6.1.4.2 Frequency o f Sponsorship Evaluation
Each respondent was asked to put a percentage to their estimation of how
frequently sponsorships are actually evaluated in practice. Twelve of the 14 experts
provided estimates of the frequency of evaluation in sponsorship, as summarized in Table
23 below.
Table 23: Estimates o f the Frequency o f Sponsorship Evaluation
never F rarely occassionally
r often always
1
The results provided in Table 23 show vast differences in experiences as to how often
sponsorships are actually evaluated. Deeper evaluation shows that interviewees have
varying views and experiences on three aspects: formal/informal, internal/external and
techniques. First, confusion clearly exists over what is formal evaluation versus what less
formal (or informal). Some experts do not distinguish formal from informal (e.g., “I
would say 65-70% [are evaluated]” (Int_l)) which others do (e.g., “Formally one-third
and informally two-thirds [are evaluated]” (SSor_4))- Second, two of the experts evaluate
all of their own sponsorships which alters their views on frequency (e.g., “we’ve always
Reproduced with permission of the copyright owner. Further reproduction prohibited without permission.
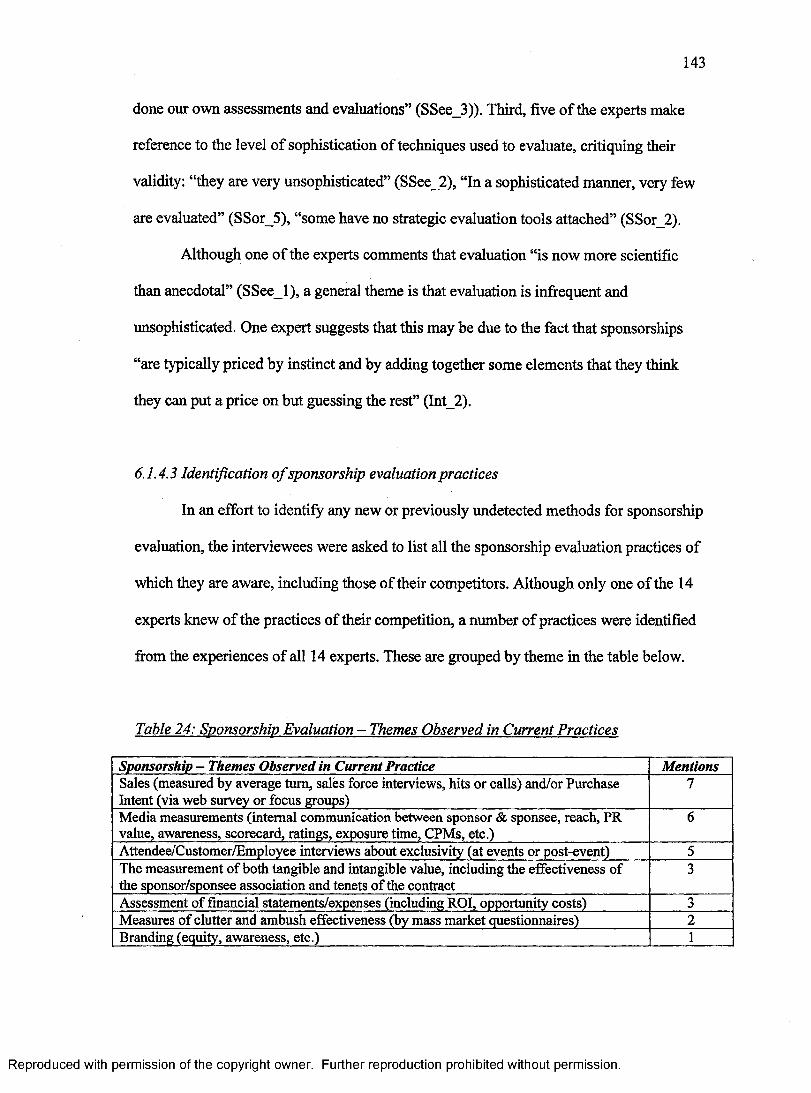
143
done our own assessments and evaluations” (SSee_3)). Third, five of the experts make
reference to the level of sophistication of techniques used to evaluate, critiquing their
validity: “they are very unsophisticated” (SSee_2), “In a sophisticated manner, very few
are evaluated” (SSor_5), “some have no strategic evaluation tools attached” (SSor_2).
Although one of the experts comments that evaluation “is now more scientific
than anecdotal” (SSee l), a general theme is that evaluation is infrequent and
unsophisticated. One expert suggests that this may be due to the fact that sponsorships
“are typically priced by instinct and by adding together some elements that they think
they can put a price on but guessing the rest” (Int_2).
6.1.4.3 Identification o f sponsorship evaluation practices
In an effort to identify any new or previously undetected methods for sponsorship
evaluation, the interviewees were asked to list all the sponsorship evaluation practices of
which they are aware, including those of their competitors. Although only one of the 14
experts knew of the practices of their competition, a number of practices were identified
from the experiences of all 14 experts. These are grouped by theme in the table below.
Table 24: Svonsorship Evaluation - Themes Observed in Current Practices
Sponsorship - Themes Observed in Current Practice MentionsSales (measured by average turn, sales force interviews, hits or calls) and/or Purchase Intent (via web survey or focus groups)
7
Media measurements (internal communication between sponsor & sponsee, reach, PR value, awareness, scorecard, ratings, exposure time, CPMs, etc.)
6
Attendee/Customer/Employee interviews about exclusivity (at events or post-event) 5The measurement of both tangible and intangible value, including the effectiveness o f the sponsor/sponsee association and tenets o f the contract
3
Assessment of financial statements/expenses (including ROI, opportunity costs) 3Measures o f clutter and ambush effectiveness (by mass market questionnaires) 2Branding (equity, awareness, etc.) 1
Reproduced with permission of the copyright owner. Further reproduction prohibited without permission.
144
Table 24 provides a summary of the groupings of the expert-identified evaluation
practices. In agreement with the literature, the most common practice suggested by the
experts is to measure sales or intent to purchase, followed by media measurements and
consumer surveys to study the effectiveness of exclusivity as a concept.
It was noted previously that four of the respondents had developed their own
models of evaluation. One respondent, Int_2, provided a full and detailed report of his
model for sponsorship evaluation. His model fully supports the mandate of this
dissertation and is described in detail in Appendix M.
6.1.4.4 Mega-sponsee evaluation practice
A question was asked to assess whether or not the experts viewed mega-sponsees
differently from typical sponsorships in terms of how they evaluate sponsorship. Results
suggest that the majority of experts (ten of 14) believe that sponsorships involving mega-
sponsees and those involving typical sponsees are evaluated differently due to the
resources involved. One expert summarizes that “it is a matter of the resources that you
are able to put against the measurement techniques [for the evaluation]” (SSee_l).
Another expert (Int_3) said “the bigger the money involved, the deeper the evaluation
goes”. Three other experts further provide support: SSor_5 notes that “with mega-
sponsees, they are likely more sophisticated in their evaluation processes as there are
higher stakes and they don’t rely on volunteers”. SSee_4 reiterates that “size has a
considerable impact”, and Int_4 says that “of course the mega ones have to as they are
spending a great deal of money”.
Reproduced with permission of the copyright owner. Further reproduction prohibited without permission.
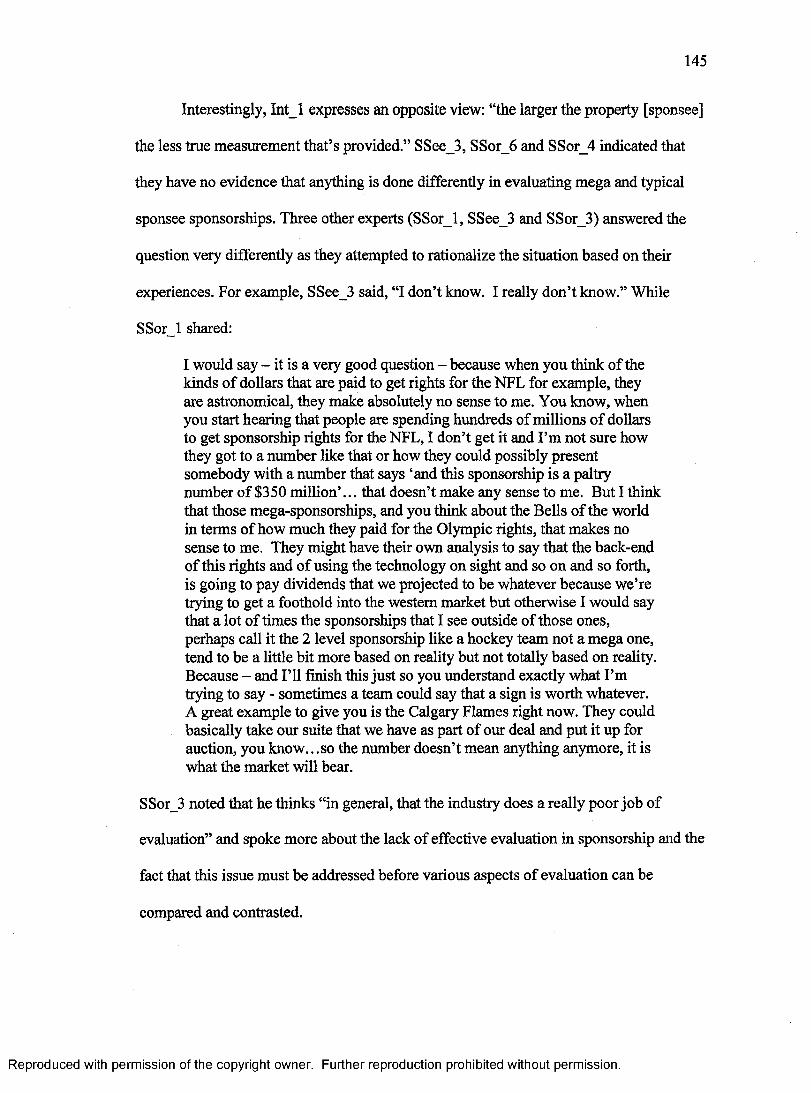
145
Interestingly, Int_l expresses an opposite view: “the larger the property [sponsee]
the less true measurement that’s provided.” SSee_3, SSor_6 and SSor_4 indicated that
they have no evidence that anything is done differently in evaluating mega and typical
sponsee sponsorships. Three other experts (SSorl , SSee_3 and SSor_3) answered the
question very differently as they attempted to rationalize the situation based on their
experiences. For example, SSee_3 said, “I don’t know. I really don’t know.” While
SSor l shared:
I would say - it is a very good question - because when you think of the kinds of dollars that are paid to get rights for the NFL for example, they are astronomical, they make absolutely no sense to me. You know, when you start hearing that people are spending hundreds of millions of dollars to get sponsorship rights for the NFL, I don’t get it and I’m not sure how they got to a number like that or how they could possibly present somebody with a number that says ‘and this sponsorship is a paltry number of $350 million’... that doesn’t make any sense to me. But I think that those mega-sponsorships, and you think about the Bells of the world in terms of how much they paid for the Olympic rights, that makes no sense to me. They might have their own analysis to say that the back-end of this rights and of using the technology on sight and so on and so forth, is going to pay dividends that we projected to be whatever because we’re trying to get a foothold into the western market but otherwise I would say that a lot of times the sponsorships that I see outside of those ones, perhaps call it the 2 level sponsorship like a hockey team not a mega one, tend to be a little bit more based on reality but not totally based on reality. Because - and I’ll finish this just so you understand exactly what I’m trying to say - sometimes a team could say that a sign is worth whatever.A great example to give you is the Calgary Flames right now. They could basically take our suite that we have as part of our deal and put it up for auction, you know.. .so the number doesn’t mean anything anymore, it is what the market will bear.
SSorJ3 noted that he thinks “in general, that the industry does a really poor job of
evaluation” and spoke more about the lack of effective evaluation in sponsorship and the
fact that this issue must be addressed before various aspects of evaluation can be
compared and contrasted.
Reproduced with permission of the copyright owner. Further reproduction prohibited without permission.

1 4 6
6.1.4.5 Forecasting the Future o f Sponsorship Evaluation Practice
The final question related to current practice in sponsorship evaluation asked the
experts to forecast the future of sponsorship evaluation and provide their views on where
it is headed. Again, expert opinions were consistent with all 14 interviewees supporting
the view that sponsorship evaluation must improve and develop in terms of its theory, its
practice, and its tools. A few of the many relevant expert statements are presented here.
The lack of evaluation was supported by six of the experts with one (Int_2) claiming that
“currently 26 per cent don’t spend a nickel on evaluation and another 30 per cent of
sponsors spend less than one per cent of their total sponsorship funds on evaluation”.
Some of the experts (three) focused on the benefits of evaluation. SSee_l notes that “the
more evaluations that people do, the better job they can do of weeding out [weak...]
properties. And, the more crappy properties that are weeded out, the more legitimate and
popular sponsorship will become”. See_2 proposed that “agencies that specialize or
position themselves as specialists in not just brokering sponsorship but in evaluating
sponsorship will be well-positioned to succeed”. The most important contribution from
this line of questioning is that all of the experts emphasized the need for better tools in
evaluation, especially given the growth of sponsorship. For example, SSee_4 suggested
that “better developed tools and tactics” are needed. Int_4, SSor_l, SSor4, and SSor_6 all
called for a more quantitative/ROI-based approach focused on sales generation. The
experts stressed a need for an enhanced link between sponsorship and sales/ROI.
Reproduced with permission of the copyright owner. Further reproduction prohibited without permission.
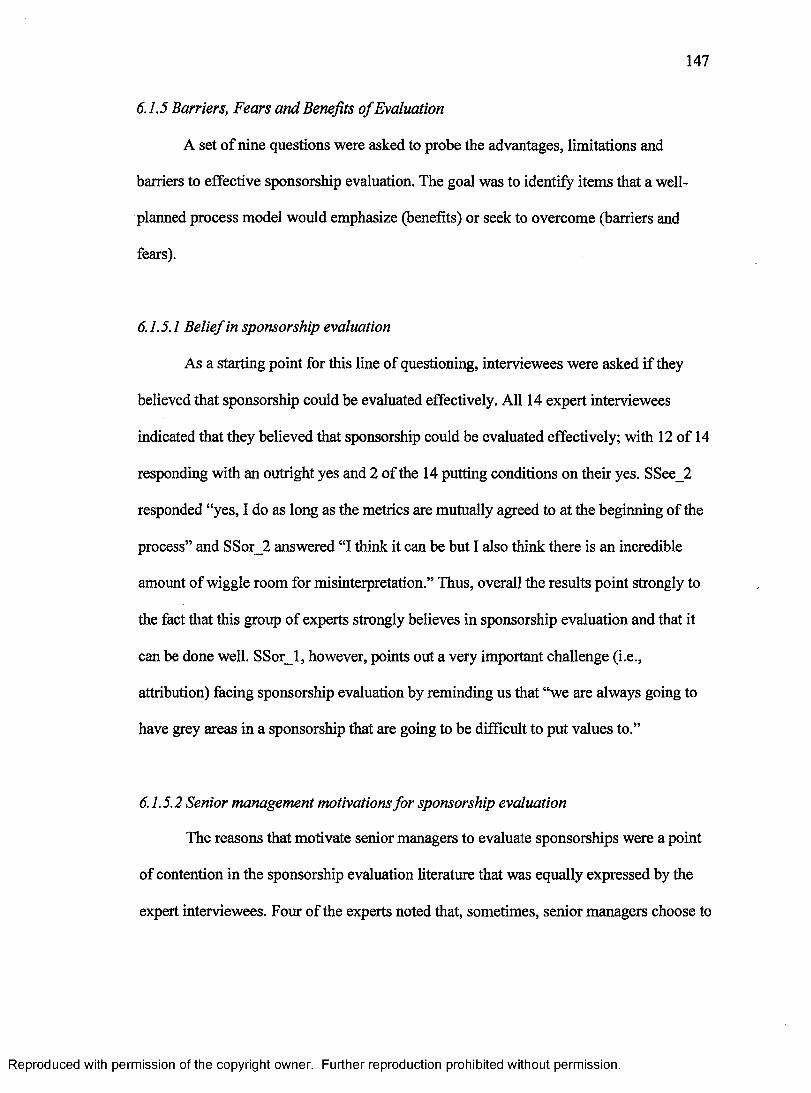
1 4 7
6.1.5 Barriers, Fears and Benefits o f Evaluation
A set of nine questions were asked to probe the advantages, limitations and
barriers to effective sponsorship evaluation. The goal was to identify items that a well-
planned process model would emphasize (benefits) or seek to overcome (barriers and
fears).
6.1.5.1 Belief in sponsorship evaluation
As a starting point for this line of questioning, interviewees were asked if they
believed that sponsorship could be evaluated effectively. All 14 expert interviewees
indicated that they believed that sponsorship could be evaluated effectively; with 12 of 14
responding with an outright yes and 2 of the 14 putting conditions on their yes. SSee_2
responded “yes, I do as long as the metrics are mutually agreed to at the beginning of the
process” and SSor_2 answered “I think it can be but I also think there is an incredible
amount of wiggle room for misinterpretation.” Thus, overall the results point strongly to
the fact that this group of experts strongly believes in sponsorship evaluation and that it
can be done well. SSor_l, however, points out a very important challenge (i.e.,
attribution) facing sponsorship evaluation by reminding us that “we are always going to
have grey areas in a sponsorship that are going to be difficult to put values to.”
6.1.5.2 Senior management motivations for sponsorship evaluation
The reasons that motivate senior managers to evaluate sponsorships were a point
of contention in the sponsorship evaluation literature that was equally expressed by the
expert interviewees. Four of the experts noted that, sometimes, senior managers choose to
Reproduced with permission of the copyright owner. Further reproduction prohibited without permission.
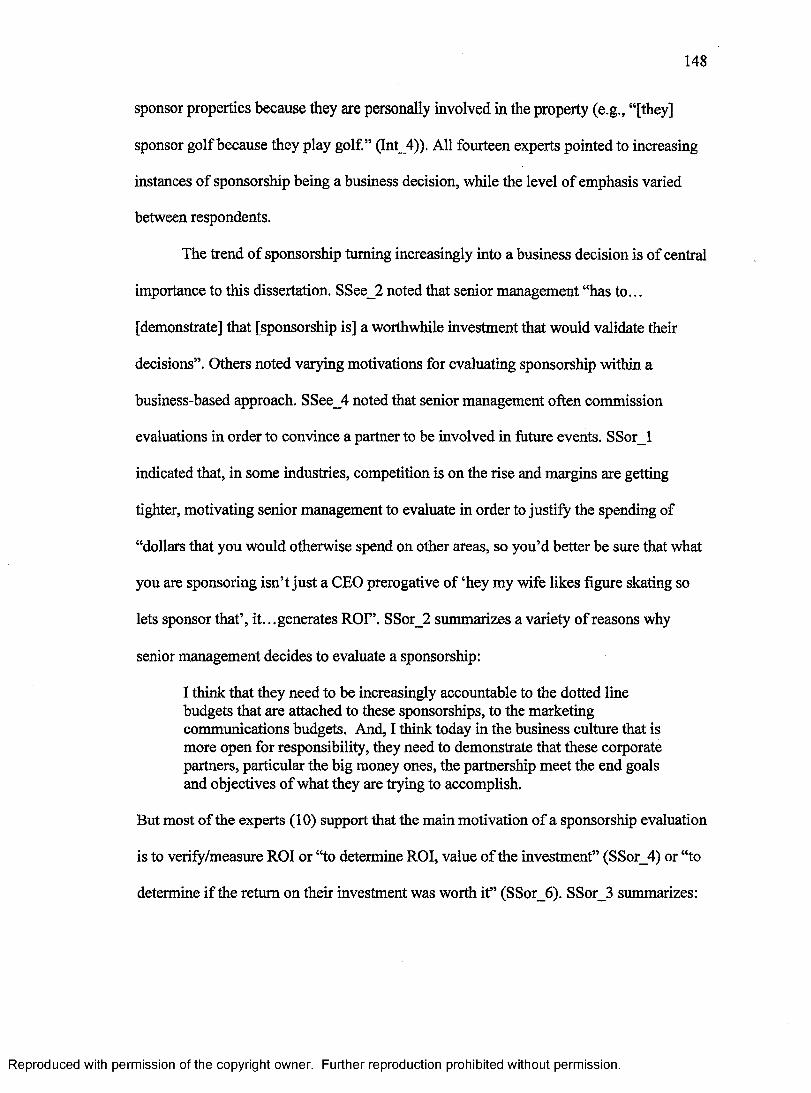
1 4 8
sponsor properties because they are personally involved in the property (e.g., “[they]
sponsor golf because they play golf.” (Int_4)). All fourteen experts pointed to increasing
instances of sponsorship being a business decision, while the level of emphasis varied
between respondents.
The trend of sponsorship turning increasingly into a business decision is of central
importance to this dissertation. SSee_2 noted that senior management “has to...
[demonstrate] that [sponsorship is] a worthwhile investment that would validate their
decisions”. Others noted varying motivations for evaluating sponsorship within a
business-based approach. SSee_4 noted that senior management often commission
evaluations in order to convince a partner to be involved in future events. SSor l
indicated that, in some industries, competition is on the rise and margins are getting
tighter, motivating senior management to evaluate in order to justify the spending of
“dollars that you would otherwise spend on other areas, so you’d better be sure that what
you are sponsoring isn’t just a CEO prerogative of ‘hey my wife likes figure skating so
lets sponsor that’, it.. .generates ROI”. SSor_2 summarizes a variety of reasons why
senior management decides to evaluate a sponsorship:
I think that they need to be increasingly accountable to the dotted line budgets that are attached to these sponsorships, to the marketing communications budgets. And, I think today in the business culture that is more open for responsibility, they need to demonstrate that these corporate partners, particular the big money ones, the partnership meet the end goals and objectives of what they are trying to accomplish.
But most of the experts (10) support that the main motivation of a sponsorship evaluation
is to verify/measure ROI or “to determine ROI, value of the investment” (SSor_4) or “to
determine if the return on their investment was worth it” (SSor_6). SSor_3 summarizes:
Reproduced with permission of the copyright owner. Further reproduction prohibited without permission.

149
To me, it is just them being responsible as senior managers and understanding what the return is on the investment that they are making. I think marketing has always been seen as an expense which it is and thus there has always been this difficultly linking it to revenue growth. So think that again as sponsorship grows and becomes more important to companies across the globe and plays a bigger role in their overall marketing efforts and takes a bigger chunk of their marketing budgets, with that increased spending senior management are going to have to justify, whether it be to their senior management or to the shareholders, what the return is on the investment.
Motivations to not evaluate were also expressed from a business point of view. For
example, SSor_2 noted that fatigue in the form of “de-motivated people” post
sponsorship (where evaluations usually take place) often leads to the cancelling of
evaluations.
6.1.5.3 Resource allocation and sponsorship evaluation
Interviewees were asked if they thought sponsorship evaluations had an effect on
future funding decisions and resource allocations by sponsors and sponsees. As expected,
experts reported that a positive evaluation affects future funding and/or resource
allocation decisions.
The expert interviewees unanimously supported the notion that future decisions
would be affected by either a positive or a negative evaluation. But they were emphatic
that a negative evaluation would likely have a more significant impact than a positive
evaluation, since “generally with a bad experience, you are less likely to want to repeat”
(SSee_l) “with a greater pre-disposition for termination” (SSee_3). SSee_2 summarized:
On the negative side, sponsorship is very fickle by nature; it is not a commodity like media. There are a lot of emotional, a lot of experiential elements to it that if it didn’t work or if it didn’t drive sales or it didn’t return or give a good ROI, well then 100% it would be still an easy decision to say let’s spend our money elsewhere.
Reproduced with permission of the copyright owner. Further reproduction prohibited without permission.

1 5 0
With respect to the impact of a positive evaluation, experts were strong in their support
including Int_4 who emphatically reported: “absolutely.. .you have the results.. .you can
go back next year” and SSor_3 who explained that “if you show that your investment has
been paid off and that it has been a valuable property, it gives you ammunition and
leverage to go back and do that deal again but it also provides for investigating new
opportunities with other properties”.
6.1.5.4 Barriers to effective sponsorship evaluation
When building towards a process model for the evaluation of sponsorship, it is
important to identify the key barriers that affect one’s ability to effectively evaluate a
sponsorship. Once these barriers are known, the model can be developed to overcome or
mitigate their effects. The 14 experts provided a total of 31 barriers during the interviews.
Their responses were reviewed and grouped by theme in Table 25 below.
Table 25: Barriers to Effective Sponsorship Evaluation
Barrier Mentions ExplanationA lack of communication between sponsor and sponsee
9 Weak preparation, poor planning and limited resources leads to a lack of information sharing between sponsor, sponsee & intermediary
Lack of effective and consistent evaluation tools
8 Although many have their own proprietary methods, there exist few options, no agreed upon metrics (including for ROI and brand/image effects) and no cohesive, recognized model
Lack of energy, support and resources to complete postevent evaluation
8 After hard work to make an event happen, not much left to get geared up for a full evaluation, including those who fear the effects of a poor evaluation
Poorly conceived strategy and implementation plan for the evaluation
5 A common barrier identified is that evaluation is often an after-thought which means it is not properly planned and implemented, leading to poor and ‘untrusted’ results
Philanthropic activity still being carried out under the banner of sponsorship
1 pretending donations are sponsorships hurts both future sponsorship and future philanthropy
Reproduced with permission of the copyright owner. Further reproduction prohibited without permission.
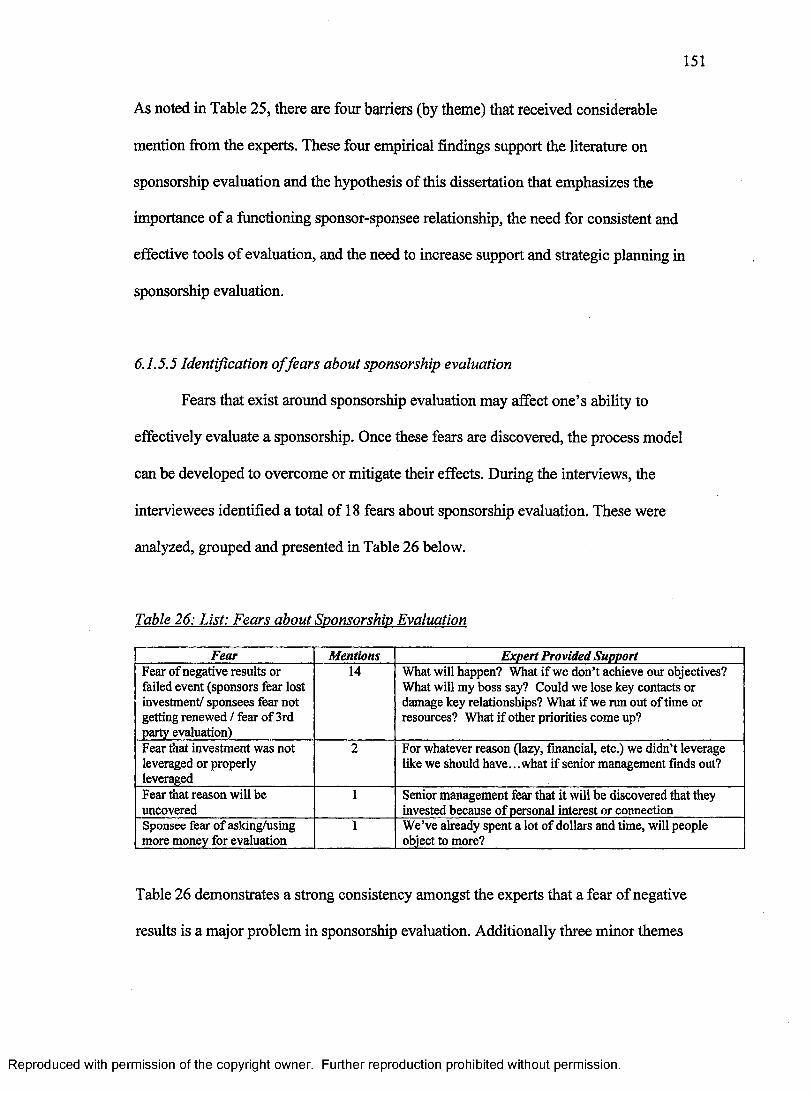
151
As noted in Table 25, there are four barriers (by theme) that received considerable
mention from the experts. These four empirical findings support the literature on
sponsorship evaluation and the hypothesis of this dissertation that emphasizes the
importance of a functioning sponsor-sponsee relationship, the need for consistent and
effective tools of evaluation, and the need to increase support and strategic planning in
sponsorship evaluation.
6.1.5.5 Identification o f fears about sponsorship evaluation
Fears that exist around sponsorship evaluation may affect one’s ability to
effectively evaluate a sponsorship. Once these fears are discovered, the process model
can be developed to overcome or mitigate their effects. During the interviews, the
interviewees identified a total of 18 fears about sponsorship evaluation. These were
analyzed, grouped and presented in Table 26 below.
Table 26: List: Fears about Sponsorship Evaluation
Fear Mentions Expert Provided SupportFear of negative results or failed event (sponsors fear lost investment/ sponsees fear not getting renewed / fear of 3rd party evaluation)
14 What will happen? What if we don’t achieve our objectives? What will my boss say? Could we lose key contacts or damage key relationships? What if we run out of time or resources? What if other priorities come up?
Fear that investment was not leveraged or properly leveraged
2 For whatever reason (lazy, financial, etc.) we didn’t leverage like we should have... what if senior management finds out?
Fear that reason will be uncovered
1 Senior management fear that it will be discovered that they invested because of personal interest or connection
Sponsee fear of asking/using more money for evaluation
1 We’ve already spent a lot of dollars and time, will people object to more?
Table 26 demonstrates a strong consistency amongst the experts that a fear of negative
results is a major problem in sponsorship evaluation. Additionally three minor themes
Reproduced with permission of the copyright owner. Further reproduction prohibited without permission.
1 5 2
were identified that may also be related to the major theme, as fears about leveraging,
revealing the true reason for a sponsorship and asking for resources for an evaluation
could all be generated by a fear of negative results or a fear of those who fear negative
results.
6.1.5.6 Benefits o f Evaluation
Given the expectation that evaluation results - positive or negative - would
impact future funding decisions and that various barriers and fears would impede
sponsorship evaluation, interviewees were asked to share some of the benefits of a well-
done evaluation so that the benefits could be used to help make the case to sponsors and
sponsees to evaluate properly. The interviewees mentioned 22 benefits, which were
analyzed and grouped by theme. This process generated two major themes around the
benefits of evaluation. First, experts pointed to the fact that a well-done sponsorship
evaluation provides direction and justification (mitigated risk) for future business
decisions (12 mentions). Second, the interviewees stressed the benefit that a well-done
sponsorship evaluation provides specific measured results on the objectives of interest to
all parties involved (including shared objectives) including both ROI and media benefits
(10 mentions).
6.1.5.7 Frequency o f Dually-Supported (Sponsor and Sponsee) Evaluation
The final question in this part of the interview simply asked experts to estimate
how often sponsorship evaluation occurs with both the sponsor and the sponsee fully
supportive of the evaluation. Given the position that this is an ideal scenario, the
Reproduced with permission of the copyright owner. Further reproduction prohibited without permission.
153
frequency of this occurrence was deemed important to the research. Reporting provided
by the expert interviewees was varied and inconclusive: three experts opted out of
answering the question, five noted that such situations are very rare, four noted that it is
common or increasing in frequency (“I think it is more common than it used to be
(SSee_l)), and 2 (SSee_2; Int_l) suggested it is something that sponsees would like but
are not privy to.
6.1.6 Understanding the Timing o f Evaluation
The final series of interview questions focused on developing an understanding
around the timing of evaluation. The results of these questions were reviewed and
analyzed to provide background on timing. When asked at what point evaluation is
typically first discussed, the experts were divided in their opinions: six indicated ‘pre
contract’, five said ‘during-contract’, and three noted ‘post-contract’. Deeper analysis
provides interesting results. Of the six experts who indicated that evaluation was first
mentioned pre-contract during negotiations, four were sponsors and two were
intermediaries, but notably, none were sponsees. Of the five experts who said that
evaluation was mentioned during the contract, three were sponsees and two sponsors;
perhaps implying that evaluation in these cases was driven by a senior management
request for an ROI. The three experts who recalled that evaluation is typically mentioned
post-contract are all involved principally with non-profit and minor properties, so perhaps
this is their reality due to resource issues. One of the interviewees (SSee_3) provided a
detailed response that summarizes these issues and demonstrates the importance of
evaluation.
Reproduced with permission of the copyright owner. Further reproduction prohibited without permission.
1 5 4
When I first started [this job] there was a mixture of ROI relationships and there were buddy to buddy or colleague relationships. So, through that first 4 years, we kind of lived through the ups and downs of that and we conducted a major process of renewal in 2001/2002 season.. .and attempted to shift everything more to ROI deliverables. Then we talked at that time knowing that the possibility of the Olympics coming to Vancouver and our concern was sponsorship.. .36 to 38% of our gross revenue and we thought that we needed to protect ourselves and position ourselves properly leading up to 2010 but also more importantly protect post 2010. So, knowing that you need a product to sell, we spent some time managing.. .kind of collecting and building our inventory of events.. .so we gathered that, put that all in place and we had that package ready to go pre the July 2003 or 2004 announcement regarding 2010.. .we then went through a process where we evaluated our sales agency at the time and decided it was best to bring it in house and contracted a new sponsorship sales employee dedicated to us and also dedicated to selling inventory around our major events so we’re not re-inventing the wheel.Then the last piece of the puzzle was OK how do we find out what all of this is worth.. .how do we put in place some reasonable approach to evaluate this and see what it is worth. So, evaluation is kind-of the last piece of that puzzle.
The experts (13 out of 14) believe strongly that evaluation can happen post-hoc but they
caution - on a number of levels - that it can only work if planned properly, in an
unbiased fashion, with access to reliable and valid data as noted by SSee_2: “it is just a
matter of having access to deliverables and research, such as ratings or visibility scores”.
6.1.7 Updated Sponsorship Evaluation Process Model
Expert interviewees were asked to review the first draft (Dl) of the Process
Model. The protocol involved allowing the interviewee as much time as they would like
to review the model followed by the interviewer taking three to five minutes to explain
the model and its terminology. This then led, typically, to discussion around the model
and identification of areas where it could potentially be improved. The level of this
discussion varied widely by interviewee, ranging from no discussion (one expert) to
Reproduced with permission of the copyright owner. Further reproduction prohibited without permission.
155
animated feedback that lasted 30 minutes and carried over into lunch (five experts). Three
of the experts asked for the model to be sent by email and then provided additional
feedback in the weeks following their interviews.
Results revealed unanimous agreement amongst the 14 interviewees that the
model is needed and appropriate to sponsorship evaluation. SSee_l commented that: “I
think it is actually really good.. .these are things that I know but I haven’t seen it laid out
like that” while SSor_4 said “it is complex but looks good to me”. SSee_3 supported the
model as well: “I think that we follow many of those steps. I don’t think that there is
anything there I would look at and go ‘oh jeez we do something differently” (SSee_3).
SSee_4 said “I have nothing to add.. .looks comprehensive to me”. A very positive sign
was that five of the experts offered one of their sponsorships to test the model. In
general, the experts also like the concept of reach (SSee_3; SSee_2; SSee_4) and the fact
that the model was conservative and realistic in nature (Int_l; SSor_l; SSor_6).
A number of suggestions (18) were proposed to improve the process model. In
this regard, two sources of suggestions were obtained: (i) those explicitly provided in the
final question of the expert interviews, as well as (ii) those refinements gleaned from the
analysis of the expert interviews. Each suggestion was reviewed in detail and carefully
considered. A list of the suggested alterations, the rationales for consideration and the
adoption statuses follows in Table 27:
Reproduced with permission of the copyright owner. Further reproduction prohibited without permission.
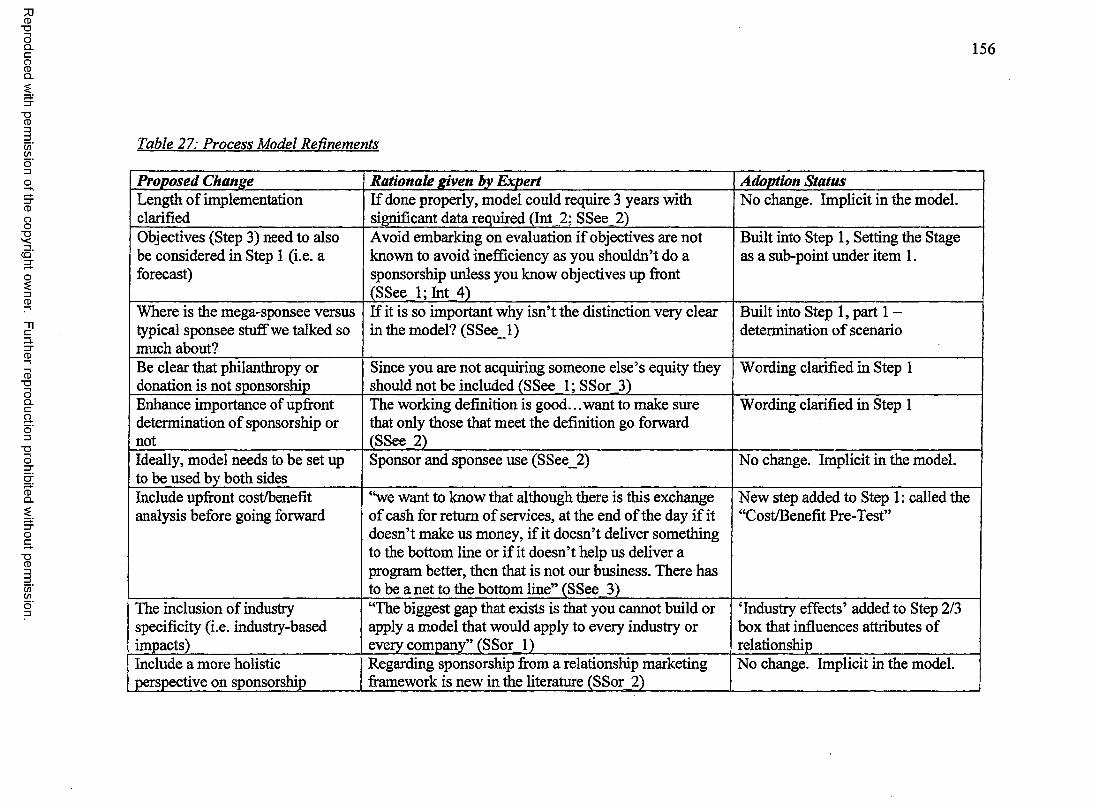
Reproduced
with perm
ission of the
copyright ow
ner. Further
reproduction prohibited
without
permission.
1 5 6
Table 27: Process Model Refinements
Proposed Change Rationale given by Expert Adoption StatusLength of implementation clarified
If done properly, model could require 3 years with significant data required (Int 2; SSee 2)
No change. Implicit in the model.
Objectives (Step 3) need to also be considered in Step 1 (i.e. a forecast)
Avoid embarking on evaluation if objectives are not known to avoid inefficiency as you shouldn’t do a sponsorship unless you know objectives up front (SSee 1; Int 4)
Built into Step 1, Setting the Stage as a sub-point under item 1.
Where is the mega-sponsee versus typical sponsee stuff we talked so much about?
If it is so important why isn’t the distinction very clear in the model? (SSee_l)
Built into Step 1, part 1 - determination of scenario
Be clear that philanthropy or donation is not sponsorship
Since you are not acquiring someone else’s equity they should not be included (SSee 1; SSor_3)
Wording clarified in Step 1
Enhance importance of upfront determination of sponsorship or not
The working definition is good.. .want to make sure that only those that meet the definition go forward (SSee. 2)
Wording clarified in Step 1
Ideally, model needs to be set up to be used by both sides
Sponsor and sponsee use (SSee_2) No change. Implicit in the model.
Include upfront cost/benefit analysis before going forward
“we want to know that although there is this exchange of cash for return of services, at the end of the day if it doesn’t make us money, if it doesn’t deliver something to the bottom line or if it doesn’t help us deliver a program better, then that is not our business. There has to be a net to the bottom line” (SSee 3)
New step added to Step 1: called the “Cost/Benefit Pre-Test”
The inclusion of industry specificity (i.e. industry-based impacts)
“The biggest gap that exists is that you cannot build or apply a model that would apply to every industry or every company” (SSor l)
‘Industry effects’ added to Step 2/3 box that influences attributes of relationship
Include a more holistic perspective on sponsorship
Regarding sponsorship from a relationship marketing framework is new in the literature (SSor_2)
No change. Implicit in the model.

Reproduced
with perm
ission of the
copyright ow
ner. Further
reproduction prohibited
without
permission.
1 5 7
Include ‘major event’ impact “If something happened that changed the flow of the partnership. Let’s say something major so an athlete drops out of an event. For example, Mats Sundin leaves the Leafs and a sponsor had their program built around them. Do you feel that this contingency factor, this feedback loop is included in the model?” (SSor 2)
“Unplanned events” impact added to shirking box (Step 5)
Consideration of co-sponsorship effects
“There is usually more than one sponsor who all have different goals and you have to know that going in.. .move it up to beginning” (Int 4)
“Co-sponsoring effects (activities of other sponsors)” added to external influences box (Step 6/7)
Consider augmenting consideration of ‘shirking’ effect
I don’t think it has every really been measured (SSor_3)
(-) added to shirking box (Step 5) to demonstrate that it will be subtracted from results
Include rigourous data collection which includes face-to-face time with key decisions makers
Necessary to understand clearly the objectives and motivations of those involved, which then enables improved evaluation (SSor 3)
‘Talk to Key Players’ box added to Step 4 (Establish Metrics)
The role of economic impact needs to be further considered
Would consideration of these models help? (SSor_3) Nothing added but concept of direct, indirect and intangible impacts may be used to report results
Flexible implementation is a necessary aspect of the model
“.. .everybody’s business objectives are different.. .1 think that there has to be some sort of flexibility or something that allows you to tailor the model to your business that will make sense for your world.. .it would be great if an adaptable, flexible model that was easy to implement could be developed and shared” (SSor 1)
The process model designed with flexibility in mind so it can be customized for each sponsorship evaluation
As outlined in Table 27 above, a number of changes were made to the model to improve its functional usefulness. Based on these
changes, the updated model follows:
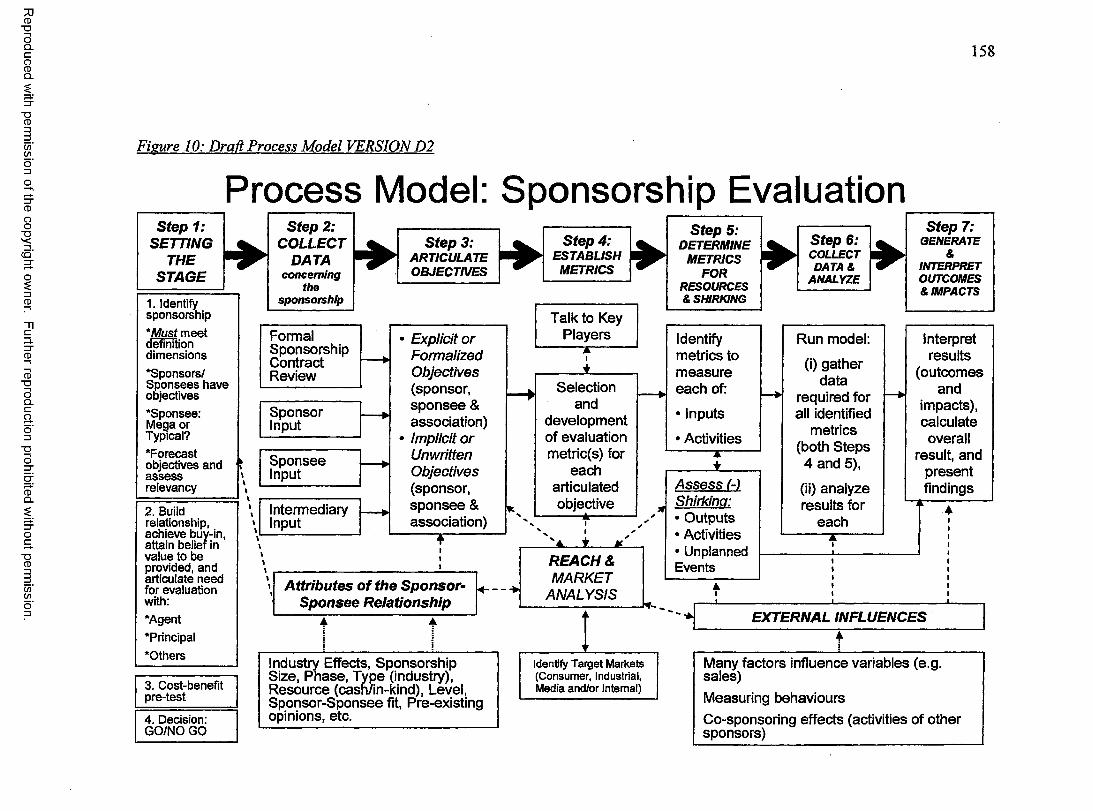
Reproduced
with perm
ission of the
copyright ow
ner. Further
reproduction prohibited
without
permission.
Figure 10: Draft Process Model VERSION D2
Process Model:Step 1:
SETTING THE
STAGE
1. Identify sponsorship*Must meetdefinitiondimensions‘ Sponsors/ Sponsees have objectives‘ Sponsee: Mega or Typical?‘ Forecast objectives and assess relevancy
2. Build relationship, achieve buv-in, attain belief in value to be provided, and articulate need for evaluation with:‘Agent‘ Principal‘ Others
3. Cost-benefit pre-test
4. Decision: GO/NO GO
Step 2: COLLECT
DATAconcerning
thesponsorship
Step 3: ARTICULATE OBJECTIVES
FormalSponsorshipContractReview
— ►
SponsorInput
— ►
SponseeInput
— ►
IntermediaryInput
— ►
Explicit orFormalizedObjectives(sponsor,sponsee &association)Implicit orUnwrittenObjectives(sponsor,sponsee &association)
fIIi
Attributes of the Sponsor- Sponsee Relationship
Industry Effects, Sponsorship Size, Phase, Type (industry), Resource (cash/in-kind), Level, Sponsor-Sponsee fit, Pre-existing opinions, etc.
1 5 8
Sponsorship EvaluationStep 4:
METRICS
Talk to Key Players
z-------i♦
Selection and
development of evaluation metric(s) for
each articulated objective
--------A-------
REACH &MARKET
ANALYSIS
Identify Target Markets (Consumer, Industrial, Media and/or Internal)
Step 5: DETERMINE
METRICS FOR
RESOURCES & SHIRKING
Identify metrics to measure each of:
• Inputs
• ActivitiesTT
Assess (-) Shirking:• Outputs• Activities• Unplanned Events
*Step 6; COLLECT DATA&
ANALYZE
Run model:
(i) gather data
required for all identified
metrics (both Steps
4 and 5),
(ii) analyze results for
eachTt
Step 7:GENERATE
&INTERPRET OUTCOMES & IMPACTS
Interpret results
(outcomes and
impacts), calculate overall
result, and present findings
EXTERNAL INFLUENCES
Many factors influence variables (e.g. sales)Measuring behavioursCo-sponsoring effects (activities of other sponsors)
1 5 9
6.2 Results Phase 2: Sponsorship Evaluation Case Studies
Each of the two sponsorship evaluation case studies is presented in this section
separately. For each evaluation, the research approach involves implementing the steps of
Process Model D2. Results and analysis are presented for each of the case studies per the
steps taken and the data gathered at each step, with methodological considerations
provided where necessary, including an introductory background analysis on how each
case study was conceived. For each case, the steps and sub-steps are presented in the
same order as they appear in Process Model D2. As noted in Chapter 5 (methodology),
methods, results and analysis are presented together to best articulate the implementation
of the process model.
6.2.1 Sponsorship evaluation 1: ATB Financial - Edmonton Grand Prix Sponsorship
On November 26,2005, the author presented an early version of this process
model at the Canadian Sponsorship Forum in Vancouver, British Columbia. Following
the presentation, he was approached by Kelly Rudan, the Marketing Manager of ATB
Investor Services - a key division of a large Alberta-based financial services institution -
and a discussion ensued regarding the model and sponsorship evaluation. The discussion
carried over into further phone and email communication leading to the proposed idea of
using the model to evaluate ATB’s forthcoming (at the time) sponsorship of the
Edmonton Grand Prix car race, one of the largest events in the province.
Reproduced with permission of the copyright owner. Further reproduction prohibited without permission.
1 6 0
6.2.1.1 Step 1: setting the stage
The following four sub-sections follow the four sub-sections of Step 1 of the
process model.
6.2.1.1.1 Identify sponsorship
This sub-section introduces the key players in the sponsorship. Alberta Treasury
Branches (ATB Financial) has assets of $17.6 billion making it one of Alberta’s largest
full-service financial institutions. Its competitors include the ‘Big 5’ Canadian banks
(CIBC, RBC, Scotiabank, TD Bank, and Bank of Montreal), Credit Unions and the
Canadian Western Bank (Rudan, 2006a). Headquartered in Edmonton, ATB serves over
600,000 Albertans in 245 communities through 151 branches, 135 agencies35, and a
Customer Contact Centre in Calgary. ATB has approximately 3,500 employees who
work in the head office, the call centers, the processing centers and the branches. ATB
also reaches its customers via Automated Banking Machines (ABMs), Internet and
Telephone. The bank offers a wide range of wealth management products and services
through its ATB Investor Services division. ATB, formerly a government entity, is
managed by a Board of Directors which is appointed by the Lieutenant Governor of
Alberta. ATB has been performing very well in recent years. In fact, since 1997, the
bank has reported a profit in every quarter and its market share has grown significantly.
The results of ATB Financial’s year-end March 31,2006 report underline the bank’s
strong position with net income of $198.7 million, assets of $17.6 billion, total deposits
of $15.9 billion, loans amounting to $14.8 billion, and equity of $1.35 billion. ATB also
holds a number of important memberships and maintains partnerships with key
35 Agencies refer to partner financial institutions such as a local credit union
Reproduced with permission of the copyright owner. Further reproduction prohibited without permission.

161
organizations, including Canadian Payments Association, Interac Association,
MasterCard Canada, and Canadian Bankers Association. ATB is organized in four
divisions including ATB MasterCard. The other divisions are Investor Services,
Business Financial Services and Customer Financial Services.
ATB’s market share has been growing; however industry study results
demonstrate some uncertainty as to how much. One study (see Table 28 below) shows
ATB Financial as ranking 3rd in Alberta with 13% of the market of Albertan Financial
Institutions.
Table 28: Financial Institution Market Share. Alberta. 2002 and 2005
Financial Institution Market Share (2005) Market Share (2002)RBC Financial 21% 20%TD Canada Trust 17% 18%ATB Financial 13% 8%CIBC 12% 14%Any Credit Union 11% 12%Scotiabank 10% 6%Bank of Montreal 9% 14%President’s Choice 4% 1%HSBC 1% 0%ING Direct 0% 0%National Bank 0% 0%Source: Market Share in Alberta (Main Institution, Primary Users), Third Party Agency Report
However, based on a different study that shows ATB Financial with an 8.7% market
share, Figure 11 below shows ATB Financial trailing the Big 5 Canadian banks in
Alberta.
Reproduced with permission of the copyright owner. Further reproduction prohibited without permission.
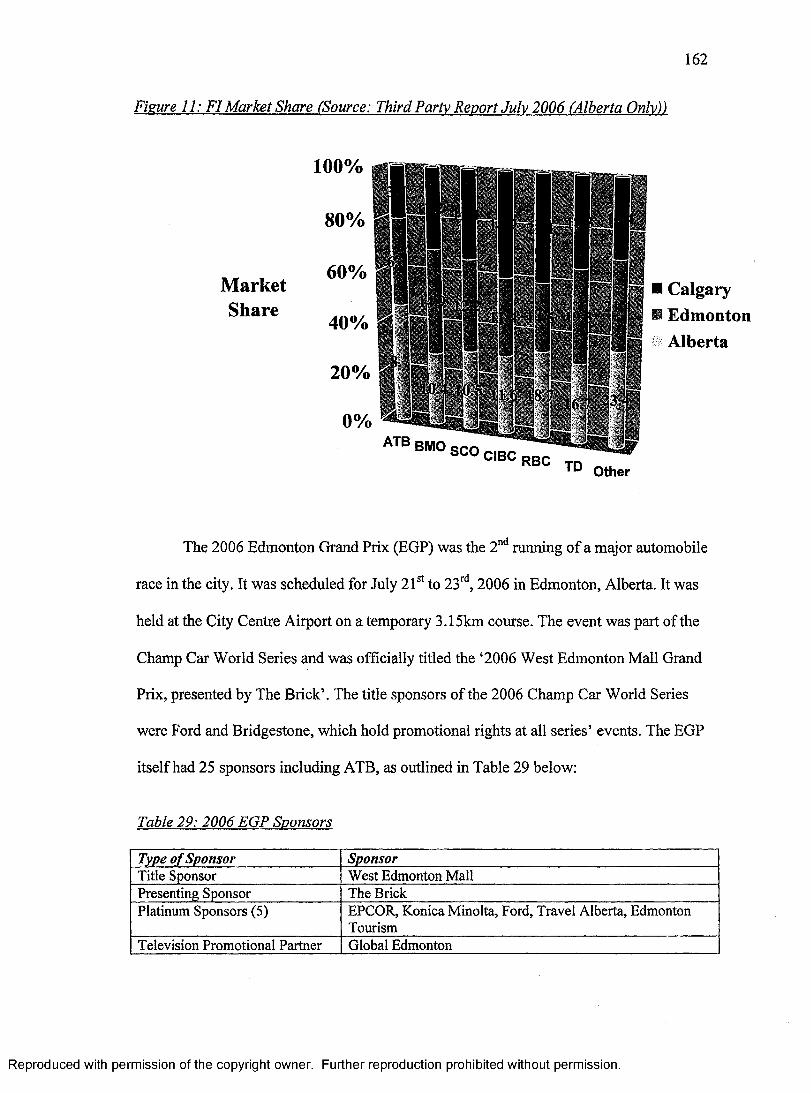
1 6 2
Figure 11: FI Market Share (Source: Third Party Report July 2006 (Alberta Only))
MarketShare
100%
80%
60%
40%
20%
0%
I r
ATB
■ Calgary fiS Edmonton i Alberta
o h r f'8.7 ' i 2^ t j>' 16.7-•j : 1 1= • i ' 1
BMO SCOCIBC RBCTD Other
The 2006 Edmonton Grand Prix (EGP) was the 2nd running of a major automobile
race in the city. It was scheduled for July 21st to 23rd, 2006 in Edmonton, Alberta. It was
held at the City Centre Airport on a temporary 3.15km course. The event was part of the
Champ Car World Series and was officially titled the ‘2006 West Edmonton Mall Grand
Prix, presented by The Brick’. The title sponsors of the 2006 Champ Car World Series
were Ford and Bridgestone, which hold promotional rights at all series’ events. The EGP
itself had 25 sponsors including ATB, as outlined in Table 29 below:
Table 29: 2006 EGP Sponsors
Type o f Sponsor SponsorTitle Sponsor West Edmonton MallPresenting Sponsor The BrickPlatinum Sponsors (5) EPCOR, Konica Minolta, Ford, Travel Alberta, Edmonton
TourismTelevision Promotional Partner Global Edmonton
Reproduced with permission of the copyright owner. Further reproduction prohibited without permission.
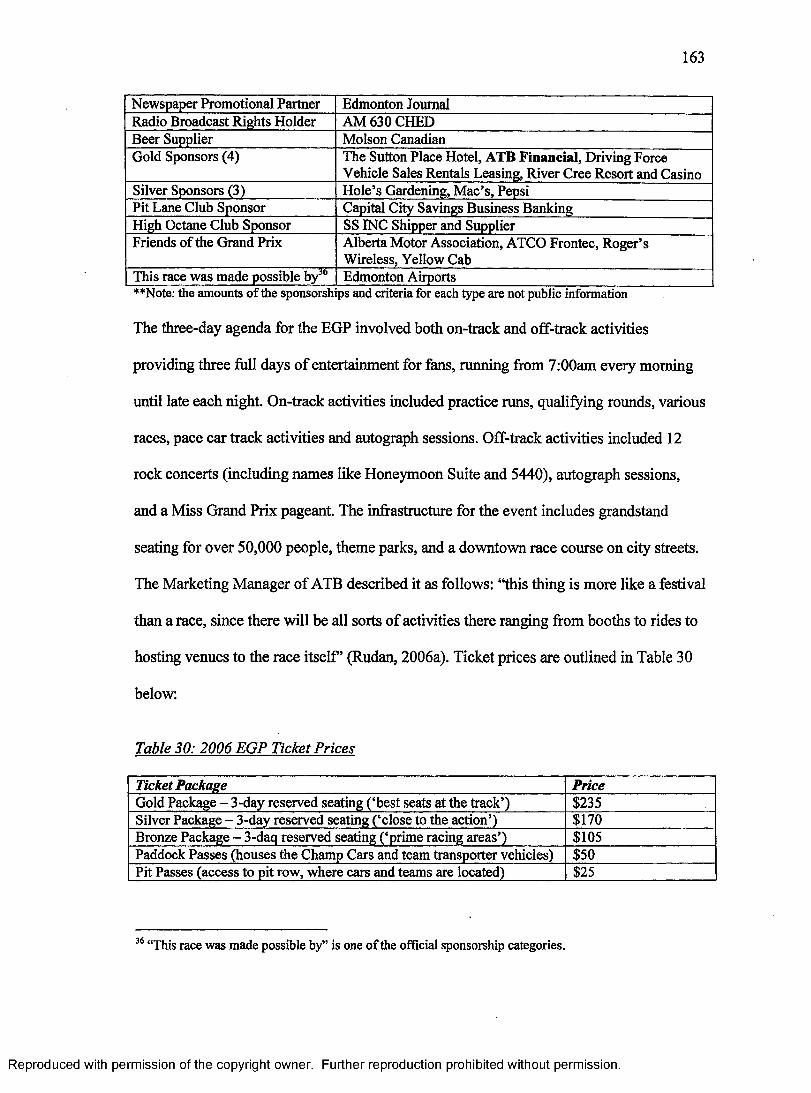
163
Newspaper Promotional Partner Edmonton JournalRadio Broadcast Rights Holder AM 630 CHEDBeer Supplier Molson CanadianGold Sponsors (4) The Sutton Place Hotel, ATB Financial, Driving Force
Vehicle Sales Rentals Leasing, River Cree Resort and CasinoSilver Sponsors (3) Hole’s Gardening, M ac’s, PepsiPit Lane Club Sponsor Capital City Savings Business BankingHigh Octane Club Sponsor SS EMC Shipper and SupplierFriends o f the Grand Prix Alberta Motor Association, ATCO Frontec, Roger’s
Wireless, Yellow CabThis race was made possible by36 Edmonton Airports**Note: the amounts of the sponsorships and criteria for each type are not public information
The three-day agenda for the EGP involved both on-track and off-track activities
providing three full days of entertainment for fans, running from 7:00am every morning
until late each night. On-track activities included practice runs, qualifying rounds, various
races, pace car track activities and autograph sessions. Off-track activities included 12
rock concerts (including names like Honeymoon Suite and 5440), autograph sessions,
and a Miss Grand Prix pageant. The infrastructure for the event includes grandstand
seating for over 50,000 people, theme parks, and a downtown race course on city streets.
The Marketing Manager of ATB described it as follows: “this thing is more like a festival
than a race, since there will be all sorts of activities there ranging from booths to rides to
hosting venues to the race itself’ (Rudan, 2006a). Ticket prices are outlined in Table 30
below:
Table 30: 2006 EGP Ticket Prices
Ticket Package PriceGold Package - 3-day reserved seating ( ‘best seats at the track’) $235Silver Package - 3-day reserved seating (‘close to the action’) $170Bronze Package - 3-daq reserved seating (‘prime racing areas’) $105Paddock Passes (houses the Champ Cars and team transporter vehicles) $50Pit Passes (access to pit row, where cars and teams are located) $25
36 “This race was made possible by” is one of the official sponsorship categories.
Reproduced with permission of the copyright owner. Further reproduction prohibited without permission.
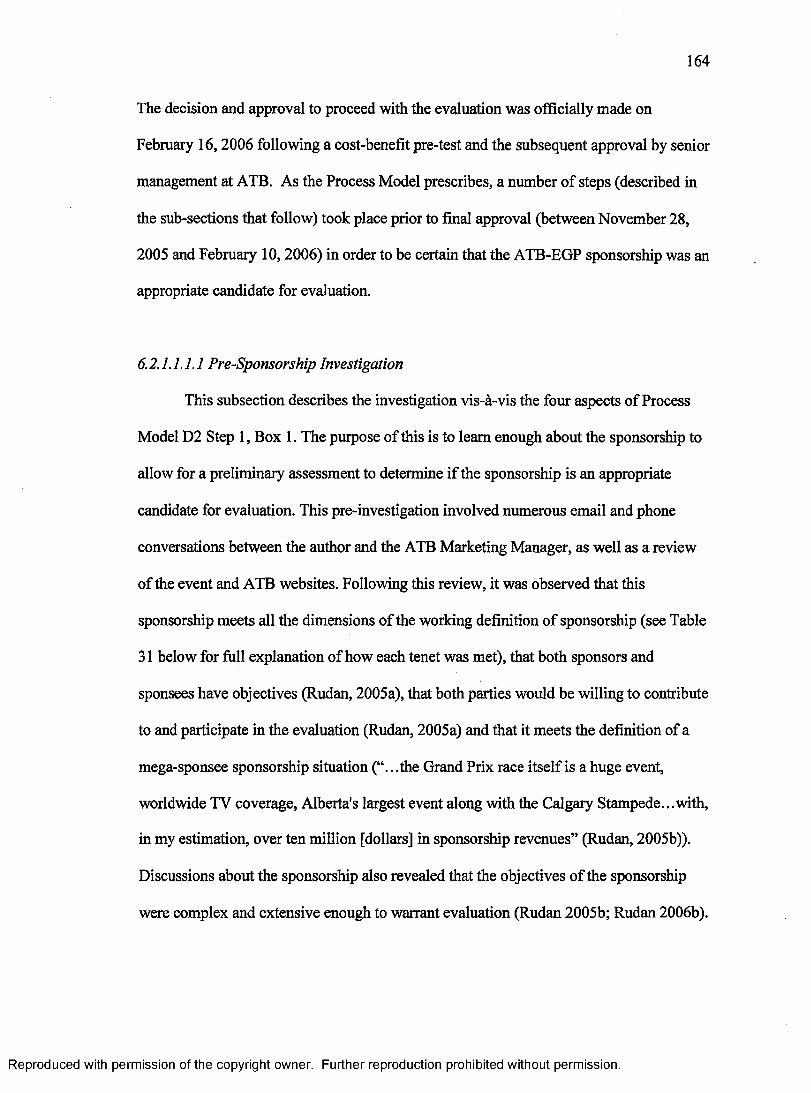
1 6 4
The decision and approval to proceed with the evaluation was officially made on
February 16,2006 following a cost-benefit pre-test and the subsequent approval by senior
management at ATB. As the Process Model prescribes, a number of steps (described in
the sub-sections that follow) took place prior to final approval (between November 28,
2005 and February 10,2006) in order to be certain that the ATB-EGP sponsorship was an
appropriate candidate for evaluation.
6.2.1.1.1.1 Pre-Sponsorship Investigation
This subsection describes the investigation vis-a-vis the four aspects of Process
Model D2 Step 1, Box 1. The purpose of this is to learn enough about the sponsorship to
allow for a preliminary assessment to determine if the sponsorship is an appropriate
candidate for evaluation. This pre-investigation involved numerous email and phone
conversations between the author and the ATB Marketing Manager, as well as a review
of the event and ATB websites. Following this review, it was observed that this
sponsorship meets all the dimensions of the working definition of sponsorship (see Table
31 below for full explanation of how each tenet was met), that both sponsors and
sponsees have objectives (Rudan, 2005a), that both parties would be willing to contribute
to and participate in the evaluation (Rudan, 2005a) and that it meets the definition of a
mega-sponsee sponsorship situation (“...the Grand Prix race itself is a huge event,
worldwide TV coverage, Alberta's largest event along with the Calgary Stampede.. .with,
in my estimation, over ten million [dollars] in sponsorship revenues” (Rudan, 2005b)).
Discussions about the sponsorship also revealed that the objectives of the sponsorship
were complex and extensive enough to warrant evaluation (Rudan 2005b; Rudan 2006b).
Reproduced with permission of the copyright owner. Further reproduction prohibited without permission.
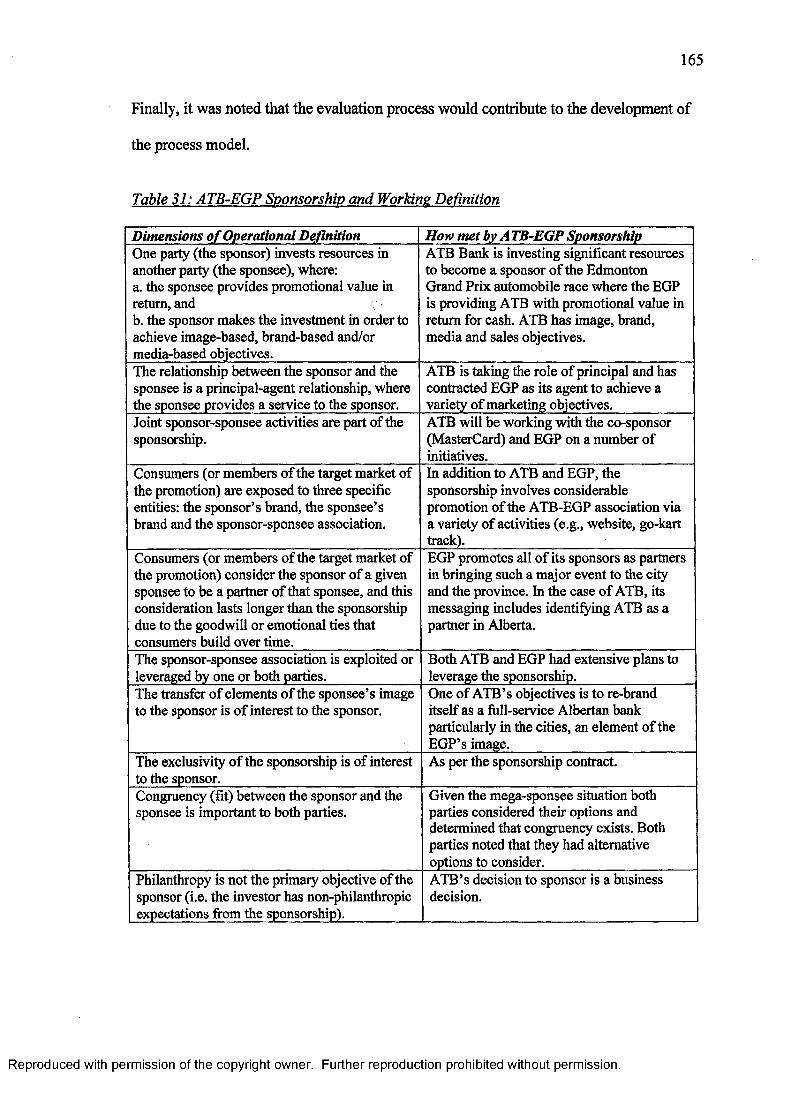
1 6 5
Finally, it was noted that the evaluation process would contribute to the development of
the process model.
Table 31: ATB-EGP Sponsorship and Working Definition
Dimensions o f Operational Definition How met by ATB-EGP SponsorshipOne party (the sponsor) invests resources in another party (the sponsee), where:a. the sponsee provides promotional value in return, andb. the sponsor makes the investment in order to achieve image-based, brand-based and/or media-based objectives.
ATB Bank is investing significant resources to become a sponsor of the Edmonton Grand Prix automobile race where the EGP is providing ATB with promotional value in return for cash. ATB has image, brand, media and sales objectives.
The relationship between the sponsor and the sponsee is a principal-agent relationship, where the sponsee provides a service to the sponsor.
ATB is taking the role of principal and has contracted EGP as its agent to achieve a variety of marketing objectives.
Joint sponsor-sponsee activities are part of the sponsorship.
ATB will be working with the co-sponsor (MasterCard) and EGP on a number of initiatives.
Consumers (or members of the target market of the promotion) are exposed to three specific entities: the sponsor’s brand, the sponsee’s brand and the sponsor-sponsee association.
In addition to ATB and EGP, the sponsorship involves considerable promotion of the ATB-EGP association via a variety of activities (e.g., website, go-kart track).
Consumers (or members of the target market of the promotion) consider the sponsor of a given sponsee to be a partner of that sponsee, and this consideration lasts longer than the sponsorship due to the goodwill or emotional ties that consumers build over time.
EGP promotes all of its sponsors as partners in bringing such a major event to the city and the province. In the case of ATB, its messaging includes identifying ATB as a partner in Alberta.
The sponsor-sponsee association is exploited or leveraged by one or both parties.
Both ATB and EGP had extensive plans to leverage the sponsorship.
The transfer of elements of the sponsee’s image to the sponsor is of interest to the sponsor.
One of ATB’s objectives is to re-brand itself as a full-service Albertan bank particularly in the cities, an element of the EGP’s image.
The exclusivity of the sponsorship is of interest to the sponsor.
As per the sponsorship contract.
Congruency (fit) between the sponsor and the sponsee is important to both parties.
Given the mega-sponsee situation both parties considered their options and determined that congruency exists. Both parties noted that they had alternative options to consider.
Philanthropy is not the primary objective of the sponsor (i.e. the investor has non-philanthropic expectations from the sponsorship).
ATB’s decision to sponsor is a business decision.
Reproduced with permission of the copyright owner. Further reproduction prohibited without permission.
1 6 6
6.2.1.1.2 Build relationships
This sub-section reports on the status of the relationships between each
organization involved with the sponsorship and the doctoral researcher. In addition to the
sponsor (ATB) and the sponsee (EGP), four intermediaries were identified: (i) Stratotech
who ran the Go-Kart track, (ii) ATB MasterCard, (iii) the sign-maker, and (iv) the vendor
who supplied food and drink for the hospitality suite. The author then assessed that solid
relationships were in place - or would be possible to develop - with the sponsor, the co
sponsor, the sponsee and the related intermediaries. This was accomplished through
frequent communications, ‘selling’ the benefits of the evaluation and meeting deadlines.
A key factor in this process was the strong support and high level of interest expressed by
representatives from ATB (Rudan, 2006b).
6.2.1.1.3 Cost-beneflt pre-test
Following the identification of the sponsorship and the establishment of solid
relationship foundations, an informal cost-benefit pre-test was carried out by the author.
This involved consideration of (i) the reach of the Mega-sponsee, (ii) the estimated size
of the sponsorship that was communicated (Rudan, 2005a), and (iii) the potential impact
of the general objectives expressed or forecasted from the discussions to that point
(Rudan, 2005b; Rudan, 2006a). The results of the pre-test indicated that considerable
costs were to be incurred and that considerable benefits were anticipated, thus making the
sponsorship an ideal candidate for evaluation.
Reproduced with permission of the copyright owner. Further reproduction prohibited without permission.
1 6 7
6.2.1.1.3 Decision
The fourth step was the GO/NO-GO decision which was made over a two day
period of February 15,2006 when the author proposed going ahead formally and
February 16,2006 when ATB Financial agreed to the evaluation, with final approvals of
surveys and a non-disclosure agreement to be completed at a later date.
6.2.1.2 Step 2: Collect data concerning the sponsorship
Following the February 16 approval of the evaluation, data collection concerning
the sponsorship (Step 2 of the Process Model) began. This process lasted for a total of 10
months. This length of time was required for four major reasons, including (i) achieving
ATB internal approvals for the sharing of information including the signing of non
disclosure agreements (NDAs), (ii) awaiting completion of important documents related
to the sponsorship (e.g. marketing plan), (iii) updating work due to consistently changing
documentation (e.g. budgets), and (iv) the process of convincing other parties (beside
ATB) of the value of the sponsorship evaluation.
6.2.1.2.1 Data gathering
The purpose of this step is to accumulate the necessary information related to the
sponsorship, with the particular goal of identifying the objectives sought by the
sponsorship. This process included obtaining and reviewing various documents, based on
Process Model D2, which prescribes a review of the formal sponsorship contract, sponsor
input, sponsee input and intermediary input. The documents accessed are presented in the
following table in chronological order.
Reproduced with permission of the copyright owner. Further reproduction prohibited without permission.
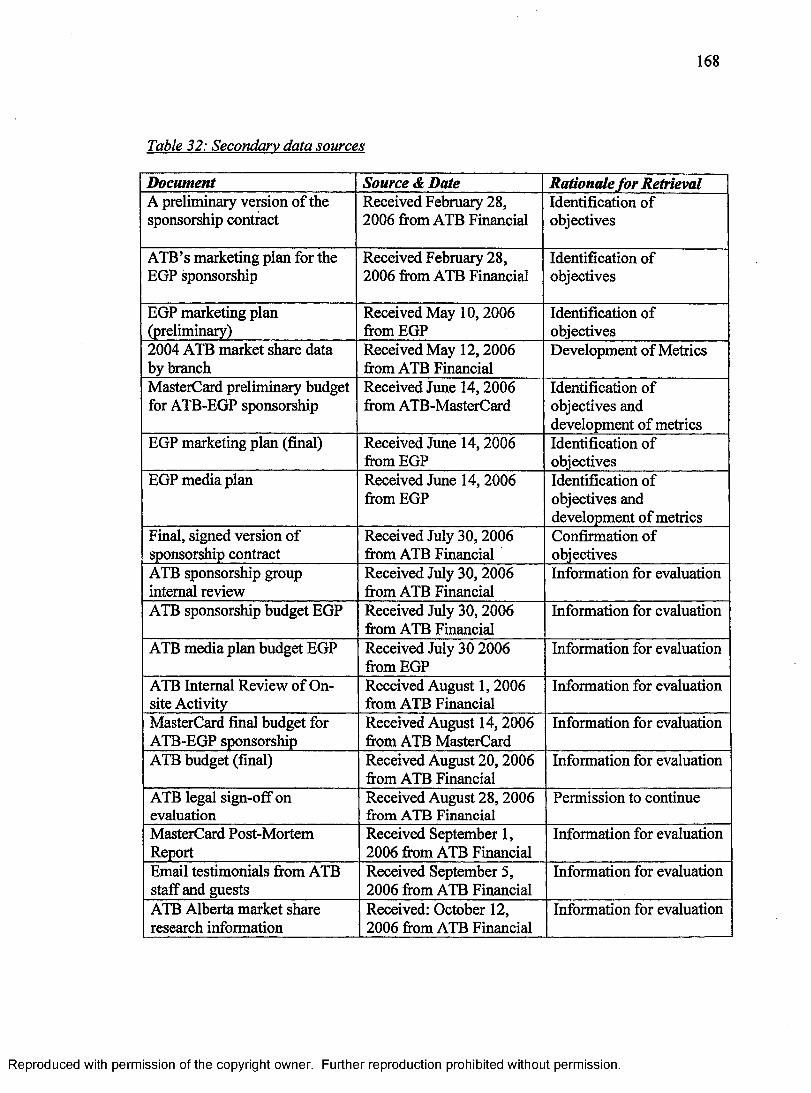
168
Table 32: Secondary data sources
Document Source & Date Rationale fo r RetrievalA preliminary version of the sponsorship contract
Received February 28, 2006 from ATB Financial
Identification of objectives
ATB’s marketing plan for the EGP sponsorship
Received February 28, 2006 from ATB Financial
Identification of objectives
EGP marketing plan (preliminary)
Received May 10,2006 from EGP
Identification of objectives
2004 ATB market share data by branch
Received May 12,2006 from ATB Financial
Development of Metrics
MasterCard preliminary budget for ATB-EGP sponsorship
Received June 14,2006 from ATB-MasterCard
Identification of objectives and development of metrics
EGP marketing plan (final) Received June 14,2006 from EGP
Identification of objectives
EGP media plan Received June 14, 2006 from EGP
Identification of objectives and development of metrics
Final, signed version of sponsorship contract
Received July 30,2006 from ATB Financial
Confirmation of objectives
ATB sponsorship group internal review
Received July 30,2006 from ATB Financial
Information for evaluation
ATB sponsorship budget EGP Received July 30,2006 from ATB Financial
Information for evaluation
ATB media plan budget EGP Received July 30 2006 from EGP
Information for evaluation
ATB Internal Review of Onsite Activity
Received August 1,2006 from ATB Financial
Information for evaluation
MasterCard final budget for ATB-EGP sponsorship
Received August 14,2006 from ATB MasterCard
Information for evaluation
ATB budget (final) Received August 20,2006 from ATB Financial
Information for evaluation
ATB legal sign-off on evaluation
Received August 28,2006 from ATB Financial
Permission to continue
MasterCard Post-Mortem Report
Received September 1, 2006 from ATB Financial
Information for evaluation
Email testimonials from ATB staff and guests
Received September 5, 2006 from ATB Financial
Information for evaluation
ATB Alberta market share research information
Received: October 12, 2006 from ATB Financial
Information for evaluation
Reproduced with permission of the copyright owner. Further reproduction prohibited without permission.
1 6 9
The contract noted on two occasions in Table 32 is of particular interest given that is
serves as the unit of analysis for this evaluation. The approved version of the contract
was 16 pages in length and very detailed.
The documents noted in Table 32 were supplemented with considerable personal
communication (including emails and phone calls) and interviews, notably:
1. Extensive Feedback on Questions by Kelly Rudan (received: March 27,2006)
2. Phone Conference Interview with ATB Marketing Team (Rudan and Arychuk)
(completed: March 28,2006)
3. Extensive Feedback on Questions by Kelly Rudan (received: April 25,2006)
4. Extensive Feedback on Questions by Kelly Rudan (received: May 10,2006)
5. Extensive Feedback on Questions by Kelly Rudan (received: May 12,2006)
6. Extensive Feedback on Questions by Kelly Rudan (received: June 26,2006)
7. Extensive Feedback on Questions by Kelly Rudan (received: July 10,2006)
8. Extensive Feedback on Questions by Kelly Rudan (received: July 11,2006)
9. Phone Interview with Kathy Arychuk (ATB) on July 27,2006
10. Phone Interview with Candice Sperling (MasterCard) on July 27,2006
11. Author 3-day visit to Edmonton and ATB offices (July 30th to Aug 1,2006), which
included in-depth interviews with 2 representatives of the sponsee and 5
representatives of the sponsor.
It should also be noted that ATB did considerable due diligence on the nature of this
research and the researcher to protect ATB and validate the project; particularly with two
initiatives:
1. Non-Disclosure Agreement
Reproduced with permission of the copyright owner. Further reproduction prohibited without permission.

1 7 0
2. Interview with ATB’s Vice-President of Marketing on August 1,2006
Through the investigation, only one of the intermediaries was identified as having
more interest in the ATB-EGP sponsorship than simply supplying services to either the
sponsor or the sponsee. This was ATB MasterCard whose situation vis-a-vis the
sponsorship is quite interesting. ATB’s MasterCard Marketing Manager describes the
relationship:
MasterCard International is sort of the governing body for MasterCard so they don’t actually have a MasterCard but they own the brand. So that would be brand ownership and then we [MasterCard at ATB] are a MasterCard supplier.. .Let me just clarify the funding of the sponsorship a little bit. MasterCard International put in a little bit of money but we [MasterCard at ATB] put in the majority here. Because MasterCard International is always interested in branding and they do have funds set aside to help suppliers or - from their perspective - vendors. But, we put in the majority of the dollars. (Sperling, 2006)
Essentially, MasterCard is one of the products that ATB offers (Sperling, 2006; Rudan,
2006d), so ATB MasterCard and ATB Investor Services could be viewed as co-sponsors
of the EGP. This was further supported by ATB’s Manager of Community Relationships
who indicated that “MasterCard is one of our products, our product lines and so this
sponsorship was sort of a co-sponsorship” (Arychuk, 2006). Based on this, the ATB
sponsorship was viewed as a co-sponsorship for the process model implementation.
6.2.1.2.2 Attributes o f the sponsor-sponsee relationship
The following attributes of the sponsor-sponsee (ATB-EGP) relationship were
observed as per Process Model D2:
• Sponsorship Age: This was the first year of a two-year agreement for ATB-EGP. For
the EGP, it was the second year of its existence. This sponsorship took place in the
Reproduced with permission of the copyright owner. Further reproduction prohibited without permission.
171
third year of ATB’s enhanced marketing efforts and planning that included
sponsorship (Rudan, 2006c). Thus, it was a new sponsorship as ATB had not
sponsored a car race previously.
• Sponsorship Size: In considering sponsorship fees, leveraging investments and other
costs, the ATB sponsorship of the EGP exceeds $500,000/year, making it a medium-■J'T
sized sponsorship .
• Sponsee Type: As supported above, this is an instance of a Mega-sponsee (see section
2.1.2.5 for definitions of mega-sponsee and typical sponsee).
• Phase : the research started during the contract negotiations phase of the sponsorship,
eight months prior to the event and continued until two months post-event.
• Type (industry): There are three industries of interest here:
o Financial Services and Credit Card Services: these industries are both
characterized by the following trends: (i) increased competition, (ii) satisfied
customers, (iii) the high-growth economy in Alberta: new people, more
investment dollars, etc., (iv) baby boomer inheritances to come, (v) increased
confidence in credit/bank cards, and (vi) increased investments for
retirement/education/etc. (Rudan, 2006c).
o Car Races: comprised of a number of different sub-industries (Formula 1,
NASCAR, Champ Car, etc.), this is a fast growing (spectator) sport in North
America. Although much of its popularity is in the United States, it is gaining
acceptance in Canada (Edmonton Grand Prix General Manager, 2006).
37 The label of ‘medium-sized’ sponsorship is based on an author-created scale which views any sponsorship of under $10,000 in value as very small, between $10,000 and $100,000 as small, from $100,000 to $1,000,000 as medium: from $1,000,000 to $10,000,000 as larse: and greater than $10,000,000 as very laree.
Reproduced with permission of the copyright owner. Further reproduction prohibited without permission.
1 7 2
• Resources'. The ATB sponsorship of the EGP is cash only. No in-kind contributions
are included. Both the sponsor and sponsee leveraged with additional funds:
o Sponsor (ATB) - ATB (including MasterCard) invested an additional $240,289.63
to leverage its $200,000 sponsorship, ratio of 1.2:1.
o Sponsee (EGP) - invested $2.9 million in a promotional budget (TV, internet,
radio, etc.) was put in place in Alberta (90%) and beyond. ATB had minor
coverage as a gold sponsor in such promotions,
o The media collateral (materials: posters, flyers, etc.) that accompanied the
sponsorship went out in branches in early June, media shortly after with primary
theme: “Win tickets by visiting www.atbgrandprix.com”.
o Merchandising: ATB decided against any merchandising.
• Level: ATB is a gold sponsor of the EGP (see table 29 above), meaning that ATB is
an important but secondary sponsor (i.e. not title) of the EGP.
• Sponsor-Sponsee fit: Representatives from both sides confirm that they feel there is a
good strategic fit between ATB and the EGP due to their shared markets.
• Pre-existing opinions: No significant pre-existing opinions of the sponsor by the
sponsee and vice-versa were observed; as expected with a first-time sponsorship.
• Target Market: Research conducted by the EGP at the 2005 event provides a general
description of the target market who attends the event:
o 93% attendees live in the province of Alberta o Average age: 36o Age range: 86% were between 18 and 54 o More than 50% had post-secondary education o Average household income: $75,000 o 72% male o 67% married
Reproduced with permission of the copyright owner. Further reproduction prohibited without permission.
173
6.2.1.3 Step 3: Articulate Objectives
The purpose of this sub-section is to review the contract, interview data and
source documents with the purpose of harvesting and articulating all the objectives of the
sponsorship. Following a review of the contract, marketing plans, organizational
strategies, sponsor input (via interview), sponsee input (via interview) and intermediary
input (via interview), the articulation of objectives chart was first drafted on May 4,2006.
This chart was then sent to the marketing group at ATB (4 individuals) requesting
comments. Detailed feedback concerning the sponsorship was returned from ATB on
May 10,2006 by the marketing department in the form of comments for each objective.
This type of communication continued until post-event as input and documentation
continued to be received until October of 2006.
The final version of the ‘articulation of objectives’ table is outlined below in
Table 33 and includes both the formal and the implicit objectives obtained from the data
collection. Specifically, objectives and their targets (reach) were obtained following
review of the following (i) the sponsorship contract, (ii) marketing plans for each of
sponsor, sponsee and co-sponsor, and (iii) in-depth interviews (transcripts) with the leads
on the sponsorship from each of the sponsor, sponsee and co-sponsor. Note that those
objectives from the contract would be the formal/explicit ones while those from the
interviews would be considered informal/implicit. It is important to note that objectives
are presented as they were expressed in the contract, documentation or interview
transcripts. This research did not involve the researcher constructing or altering the
wording of any of the objectives.
Reproduced with permission of the copyright owner. Further reproduction prohibited without permission.
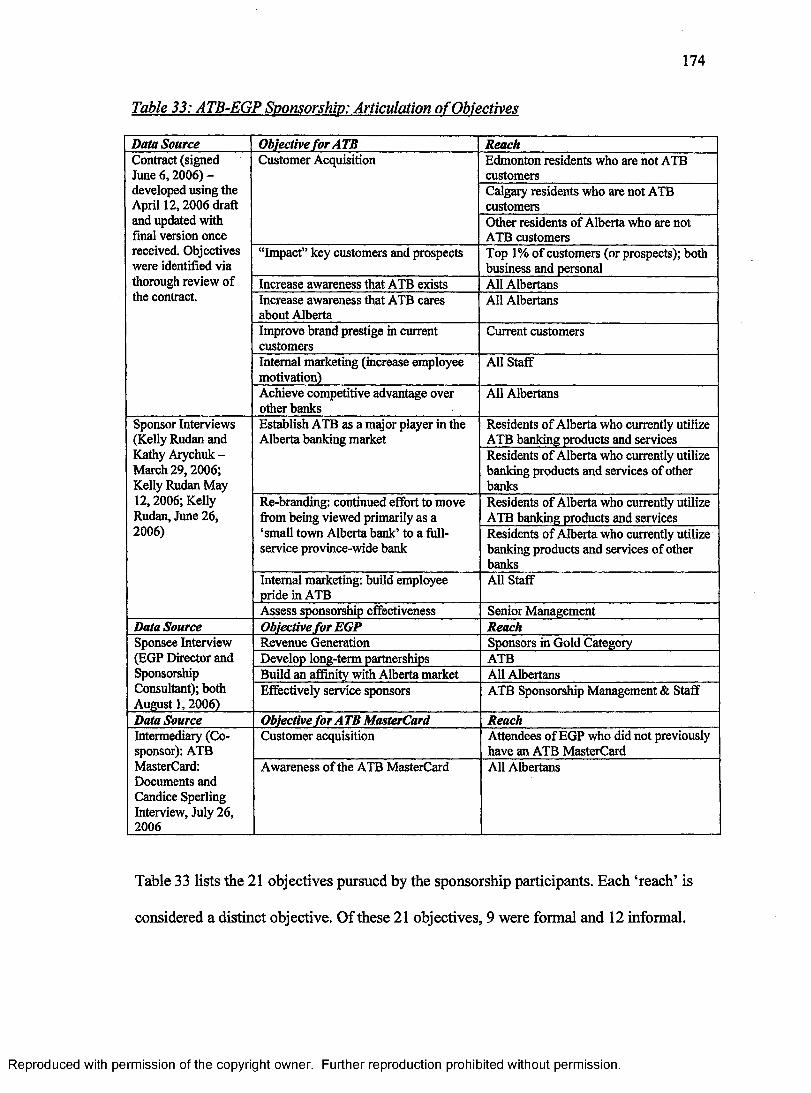
1 7 4
Table 33: ATB-EGP Sponsorship: Articulation o f Objectives
Data Source Objective for A TB ReachContract (signed June 6,2006) - developed using the April 12,2006 draft and updated with final version once received. Objectives were identified via thorough review of the contract.
Customer Acquisition Edmonton residents who are not ATB customersCalgary residents who are not ATB customersOther residents of Alberta who are not ATB customers
“Impact” key customers and prospects Top 1% of customers (or prospects); both business and personal
Increase awareness that ATB exists All AlbertansIncrease awareness that ATB cares about Alberta
All Albertans
Improve brand prestige in current customers
Current customers
Internal marketing (increase employee motivation)
All Staff
Achieve competitive advantage over other banks
All Albertans
Sponsor Interviews (Kelly Rudan and Kathy Arychuk - March 29,2006; Kelly Rudan May 12,2006; Kelly Rudan, June 26, 2006)
Establish ATB as a major player in the Alberta banking market
Residents of Alberta who currently utilize ATB banking products and servicesResidents of Alberta who currently utilize banking products and services of other banks
Re-branding: continued effort to move from being viewed primarily as a ‘small town Alberta bank’ to a full- service province-wide bank
Residents of Alberta who currently utilize ATB banking products and servicesResidents of Alberta who currently utilize banking products and services of other banks
Internal marketing: build employee pride in ATB
AH Staff
Assess sponsorship effectiveness Senior ManagementData Source Objective for EGP ReachSponsee Interview (EGP Director and Sponsorship Consultant); both August 1,2006)
Revenue Generation Sponsors in Gold CategoryDevelop long-term partnerships ATBBuild an affinity with Alberta market All AlbertansEffectively service sponsors ATB Sponsorship Management & Staff
Data Source Objective for ATB MasterCard ReachIntermediary (Cosponsor): ATB MasterCard: Documents and Candice Sperling Interview, July 26, 2006
Customer acquisition Attendees of EGP who did not previously have an ATB MasterCard
Awareness of the ATB MasterCard All Albertans
Table 33 lists the 21 objectives pursued by the sponsorship participants. Each ‘reach’ is
considered a distinct objective. Of these 21 objectives, 9 were formal and 12 informal.
Reproduced with permission of the copyright owner. Further reproduction prohibited without permission.
175
6.2.1.4 Step 4: Establish Metrics
The purpose of this step is to work with the relevant players involved in the
sponsorship to collaboratively develop the evaluation metrics for each objective. Table 34
below outlines the metric developed for each of the 21 objectives. Eight data collection
exercises (see Table 35) were designed to acquire the data necessary for evaluating the 21
objectives. It is important to note that the selection of metrics and methods to measure
each objective was based on a collaborative decision-making process between the
researcher, ATB, the EGP and ATB MasterCard vis-a-vis resources available and the
relative importance of the objective.
Reproduced with permission of the copyright owner. Further reproduction prohibited without permission.
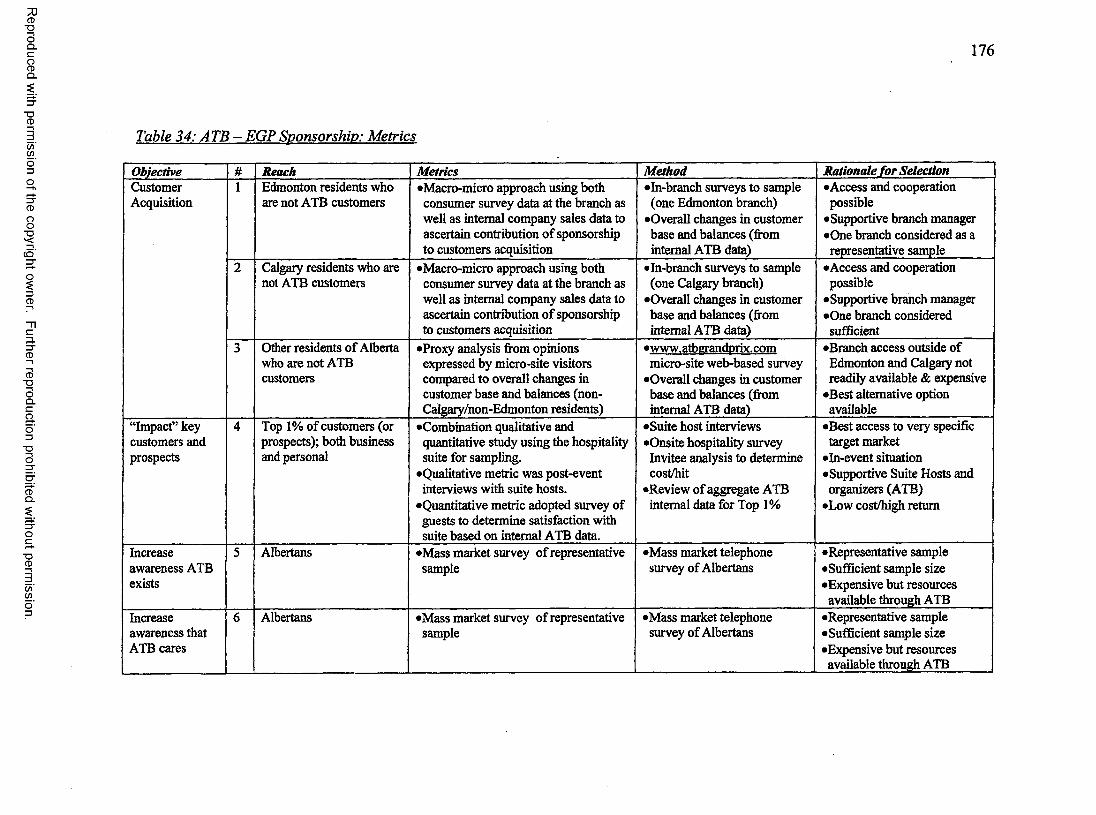
Reproduced
with perm
ission of the
copyright ow
ner. Further
reproduction prohibited
without
permission.
1 7 6
Table 34: A T B - EGP Sponsorship: Metrics
Objective Reach Metrics Method Rationale for SelectionCustomerAcquisition
1 Edmonton residents who are not ATB customers
•Macro-micro approach using both consumer survey data at the branch as well as internal company sales data to ascertain contribution of sponsorship to customers acquisition
•In-branch surveys to sample (one Edmonton branch)
•Overall changes in customer base and balances (from internal ATB data)
•Access and cooperation possible
•Supportive branch manager •One branch considered as a representative sample
2 Calgary residents who are not ATB customers
•Macro-micro approach using both consumer survey data at the branch as well as internal company sales data to ascertain contribution of sponsorship to customers acquisition
•In-branch surveys to sample (one Calgary branch)
•Overall changes in customer base and balances (from internal ATB data)
•Access and cooperation possible
•Supportive branch manager •One branch considered sufficient
3 Other residents of Alberta who are not ATB customers
•Proxy analysis from opinions expressed by micro-site visitors compared to overall changes in customer base and balances (non- Calgary/non-Edmonton residents)
•www.atberandnrix.com micro-site web-based survey
•Overall changes in customer base and balances (from internal ATB data)
•Branch access outside of Edmonton and Calgary not readily available & expensive
•Best alternative option available
“Impact” key customers and prospects
4 Top 1% of customers (or prospects); both business and personal
•Combination qualitative and quantitative study using the hospitality suite for sampling.
•Qualitative metric was post-event interviews with suite hosts.
•Quantitative metric adopted survey of guests to determine satisfaction with suite based on internal ATB data.
•Suite host interviews •Onsite hospitality survey Invitee analysis to determine cost/hit
•Review of aggregate ATB internal data for Top 1%
•Best access to very specific target market
•In-event situation •Supportive Suite Hosts and organizers (ATB)
•Low cost/high return
Increase awareness ATB exists
5 Albertans •Mass market survey of representative sample
•Mass market telephone survey of Albertans
•Representative sample •Sufficient sample size •Expensive but resources available through ATB
Increase awareness that ATB cares
6 Albertans •Mass market survey of representative sample
•Mass market telephone survey of Albertans
•Representative sample •Sufficient sample size •Expensive but resources available through ATB

Reproduced
with perm
ission of the
copyright ow
ner. Further
reproduction prohibited
without
permission.
1 7 7
Improve brand prestige in current customers
7 Current customers •Branch surveys of representative sample of ATB customers
•Branch surveys in one Edmonton and one Calgary branch
•Access and cooperation possible
•Supportive branch manager •Two branches considered sufficient
Internalmarketing(motivation)
S Staff •Survey staff on satisfaction with the sponsorship including an analysis of employee ticket program
•Jan 2006 ATB-wide satisfaction survey
•Employee interviews •Analysis of employee ticket program
•Ideal metric (employee survey post-event) cancelled by ATB senior admin
•Best alternative available
Achievecompetitiveadvantage
9 Albertans •Mass market survey of representative sample
•Mass market telephone survey of Albertans
•Representative sample •Sufficient sample size •Expensive but resources available through ATB
Establish ATB as a major player in the Alberta banking market
10 Residents of Alberta who currently utilize ATB banking products and services
•Branch surveys of representative sample of ATB customers
•Branch surveys in one Edmonton and one Calgary branch
•Microsite survey
•Access and cooperation possible
•Supportive branch manager •Two branches considered sufficient
11 Residents of Alberta who currently utilize banking products and services of other banks
•Mass market survey of representative sample
•Mass market telephone survey of Albertans
•Representative sample •Sufficient sample size •Expensive but resources available through ATB
Re-branding: continued effort to move from being viewed primarily as a ‘small town Alberta bank’ to a full-service provide-wide bank
12 Residents of Alberta who currently utilize ATB banking products and services
•Branch surveys of representative sample of ATB customers
•Branch surveys in one Edmonton and one Calgary branch
•Microsite survey
•Access and cooperation possible
•Supportive branch manager •Two branches considered sufficient
13 Residents of Alberta who currently utilize banking products and services of other banks
•Mass market survey of representative sample
•Mass market telephone survey of Albertans
•Representative sample •Sufficient sample size •Expensive but resources available through ATB
Build employee pride in ATB
14 Staff •Survey staff on pride including an analysis of employee ticket program
•Employee interviews •Analysis of employee ticket program
•Ideal metric (employee survey post-event) cancelled by ATB senior admin
•Best alternative available
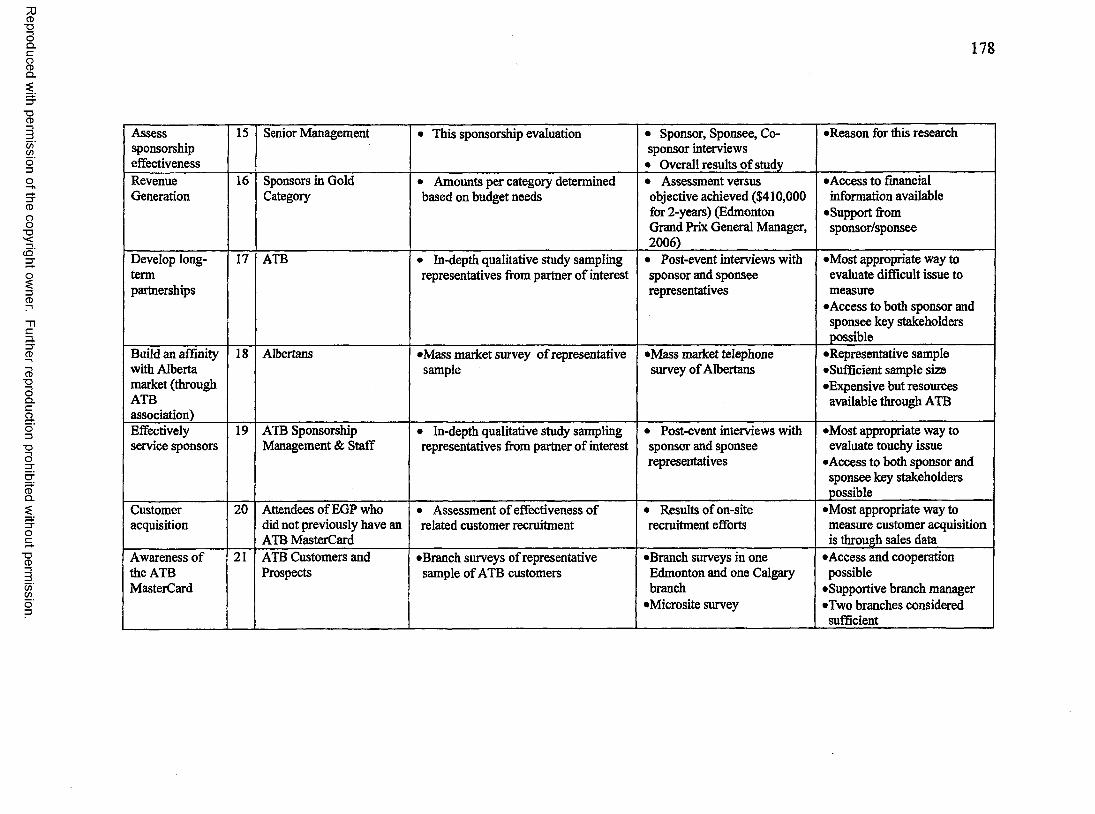
Reproduced
with perm
ission of the
copyright ow
ner. Further
reproduction prohibited
without
permission.
1 7 8
Assesssponsorshipeffectiveness
15 Senior Management • This sponsorship evaluation • Sponsor, Sponsee, Cosponsor interviews• Overall results of study
•Reason for this research
RevenueGeneration
16 Sponsors in Gold Category
• Amounts per category determined based on budget needs
• Assessment versus objective achieved ($410,000 for 2-years) (Edmonton Grand Prix General Manager, 2006)
•Access to financial information available
•Support from sponsor/sponsee
Develop longtermpartnerships
17 ATB • In-depth qualitative study sampling representatives from partner of interest
• Post-event interviews with sponsor and sponsee representatives
•Most appropriate way to evaluate difficult issue to measure
•Access to both sponsor and sponsee key stakeholders possible
Build an affinity with Alberta market (through ATBassociation)
18 Albertans •Mass market survey of representative sample
•Mass market telephone survey of Albertans
•Representative sample •Sufficient sample size •Expensive but resources available through ATB
Effectively service sponsors
19 ATB Sponsorship Management & Staff
• In-depth qualitative study sampling representatives from partner of interest
• Post-event interviews with sponsor and sponsee representatives
•Most appropriate way to evaluate touchy issue
•Access to both sponsor and sponsee key stakeholders possible
Customeracquisition
20 Attendees of EGP who did not previously have an ATB MasterCard
• Assessment of effectiveness of related customer recruitment
• Results of on-site recruitment efforts
•Most appropriate way to measure customer acquisition is through sales data
Awareness of the ATB MasterCard
21 ATB Customers and Prospects
•Branch surveys of representative sample of ATB customers
•Branch surveys in one Edmonton and one Calgary branch
•Microsite survey
•Access and cooperation possible
•Supportive branch manager •Two branches considered sufficient
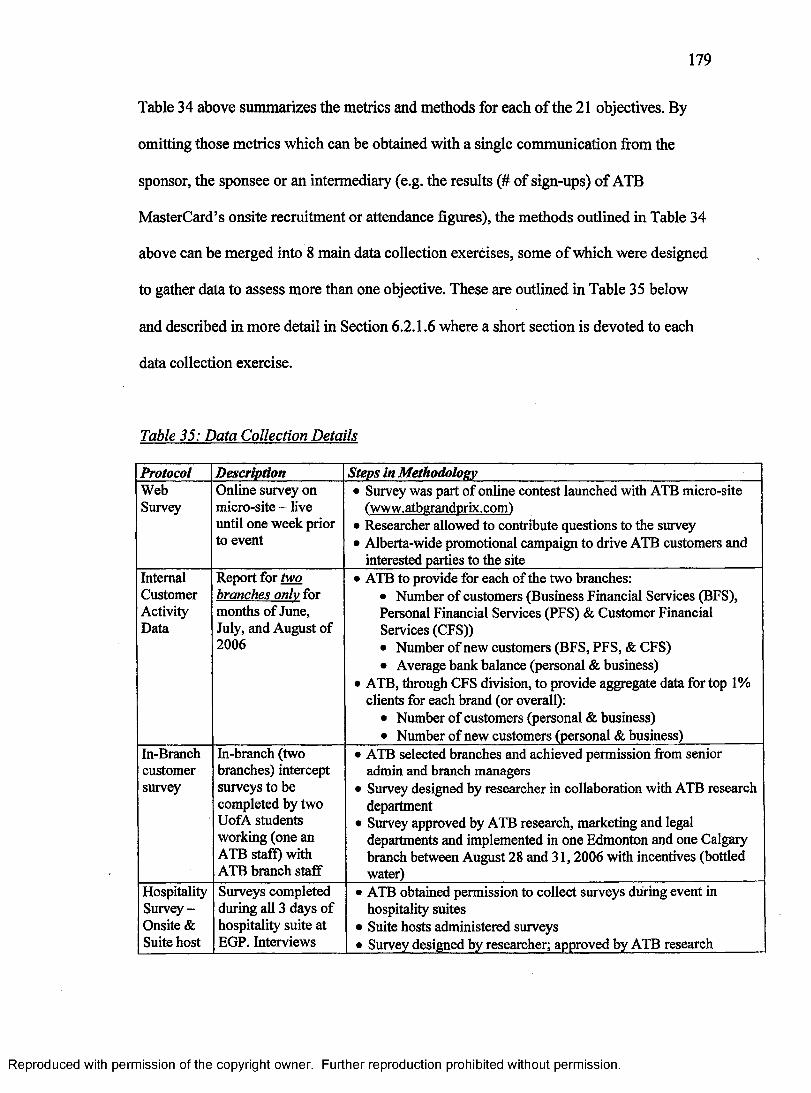
1 7 9
Table 34 above summarizes the metrics and methods for each of the 21 objectives. By
omitting those metrics which can be obtained with a single communication from the
sponsor, the sponsee or an intermediary (e.g. the results (# of sign-ups) of ATB
MasterCard’s onsite recruitment or attendance figures), the methods outlined in Table 34
above can be merged into 8 main data collection exercises, some of which were designed
to gather data to assess more than one objective. These are outlined in Table 35 below
and described in more detail in Section 6.2.1.6 where a short section is devoted to each
data collection exercise.
Table 35: Data Collection Details
Protocol Description Steps in MethodologyWebSurvey
Online survey on micro-site - live until one week prior to event
• Survey was part o f online contest launched with ATB micro-site ('www.atberandorix.com')
• Researcher allowed to contribute questions to the survey• Alberta-wide promotional campaign to drive ATB customers and
interested parties to the siteInternalCustomerActivityData
Report for two branches onlv for
• ATB to provide for each o f the two branches:• Number o f customers (Business Financial Services (BFS), Personal Financial Services (PFS) & Customer Financial Services (CFS))• Number o f new customers (BFS, PFS, & CFS)• Average bank balance (personal & business)
• ATB, through CFS division, to provide aggregate data for top 1% clients for each brand (or overall):
• Number o f customers (personal & business)• Number o f new customers (personal & business)
months o f June, July, and August of 2006
In-Branchcustomersurvey
In-branch (two branches) intercept surveys to be completed by two UofA students working (one an ATB staff) with ATB branch staff
• ATB selected branches and achieved permission from senior admin and branch managers
• Survey designed by researcher in collaboration with ATB research department
• Survey approved by ATB research, marketing and legal departments and implemented in one Edmonton and one Calgary branch between August 28 and 31, 2006 with incentives (bottled water)
Hospitality Survey - Onsite & Suite host
Surveys completed during all 3 days o f hospitality suite at EGP. Interviews
• ATB obtained permission to collect surveys during event in hospitality suites
• Suite hosts administered surveys• Survey designed by researcher; approved by ATB research
Reproduced with permission of the copyright owner. Further reproduction prohibited without permission.
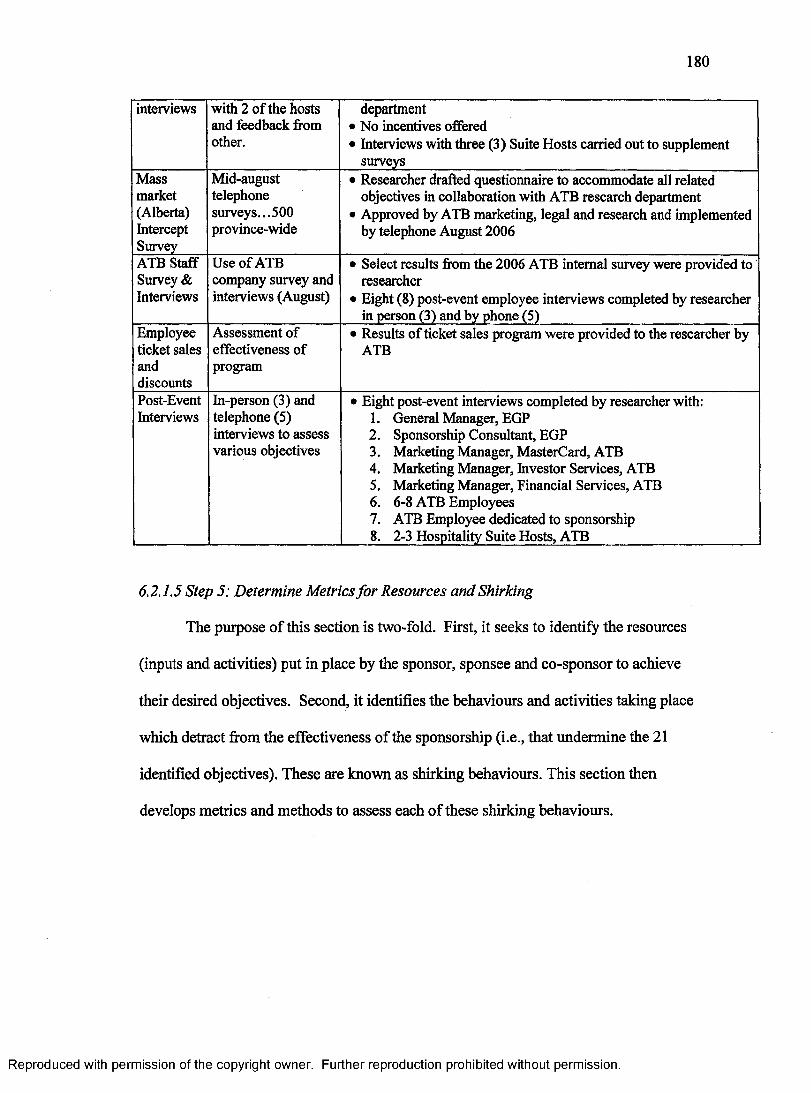
1 8 0
interviews with 2 of the hosts and feedback from other.
department• No incentives offered• Interviews with three (3) Suite Hosts carried out to supplement
surveysMassmarket(Alberta)InterceptSurvey
Mid-august telephone surveys... 500 province-wide
• Researcher drafted questionnaire to accommodate all related objectives in collaboration with ATB research department
• Approved by ATB marketing, legal and research and implemented by telephone August 2006
ATB Staff Survey & Interviews
Use of ATB company survey and interviews (August)
• Select results from the 2006 ATB internal survey were provided to researcher
• Eight (8) post-event employee interviews completed by researcher in person (3) and by phone (5)
Employee ticket sales anddiscounts
Assessment of effectiveness of program
• Results of ticket sales program were provided to the researcher by ATB
Post-EventInterviews
In-person (3) and telephone (5) interviews to assess various objectives
• Eight post-event interviews completed by researcher with:1. General Manager, EGP2. Sponsorship Consultant, EGP3. Marketing Manager, MasterCard, ATB4. Marketing Manager, Investor Services, ATB5. Marketing Manager, Financial Services, ATB6. 6-8 ATB Employees7. ATB Employee dedicated to sponsorship8. 2-3 Hospitality Suite Hosts, ATB
6.2.1.5 Step 5: Determine Metrics for Resources and Shirking
The purpose of this section is two-fold. First, it seeks to identify the resources
(inputs and activities) put in place by the sponsor, sponsee and co-sponsor to achieve
their desired objectives. Second, it identifies the behaviours and activities taking place
which detract from the effectiveness of the sponsorship (i.e., that undermine the 21
identified objectives). These are known as shirking behaviours. This section then
develops metrics and methods to assess each of these shirking behaviours.
Reproduced with permission of the copyright owner. Further reproduction prohibited without permission.
181
6.2.1.5.1 Resources and Activities
The sponsorship fees paid by ATB Financial and ATB MasterCard for the 2006
Gold sponsorship of die EGP totaled $200,000 ($115,000 ATB Financial and $85,000
ATB MasterCard). Note that $45,000 of the ATB MasterCard portion was paid by
MasterCard International). For the 2007 sponsorship, the contract stipulates an increase
in this fee to $210,000 ($120,750 ATB Financial and $89,250 ATB MasterCard). As
noted previously, in 2006, the $200,000 fee was leveraged by a 1.75 to 1 ratio as
described in the summary expense budget (see Table 36 below).
ATB committed the $410,000 to be a two-year gold level sponsor of the EGP.
The package included exclusivity as official financial institution, category exclusivity in
Alberta Zone, Tuner Show, and Alberta National Resources Show, a race car appearance
at an ATB branch, rights to the grand prix logo/name, and an advertising/signage
package. ATB leveraging activities included a variety of activities including a micro
website ('www.atbgrandprix.coml. online contest with prize packages, branch
promotions, sponsorship of the Go-Kart track, a client hosting program, an employee
discounted ticket program, a road show, ATB race week activities, a merchandising plan,
a communications/media plan, and the participation of ATB associates as event
volunteers. A number of these activities required additional resources, including the
hospitality suite which was designed for 75 guests (3 days of 25 each) and included a
variety of hosting related activities including the daily visit of a high profile race car
driver, gift-bags, and the full serviced of a suite host/hostess.
The EGP also committed resources to the sponsorship in the form of a dedicated
staff person to work with ATB (shared with all sponsors), tickets, paddock passes, the
Reproduced with permission of the copyright owner. Further reproduction prohibited without permission.
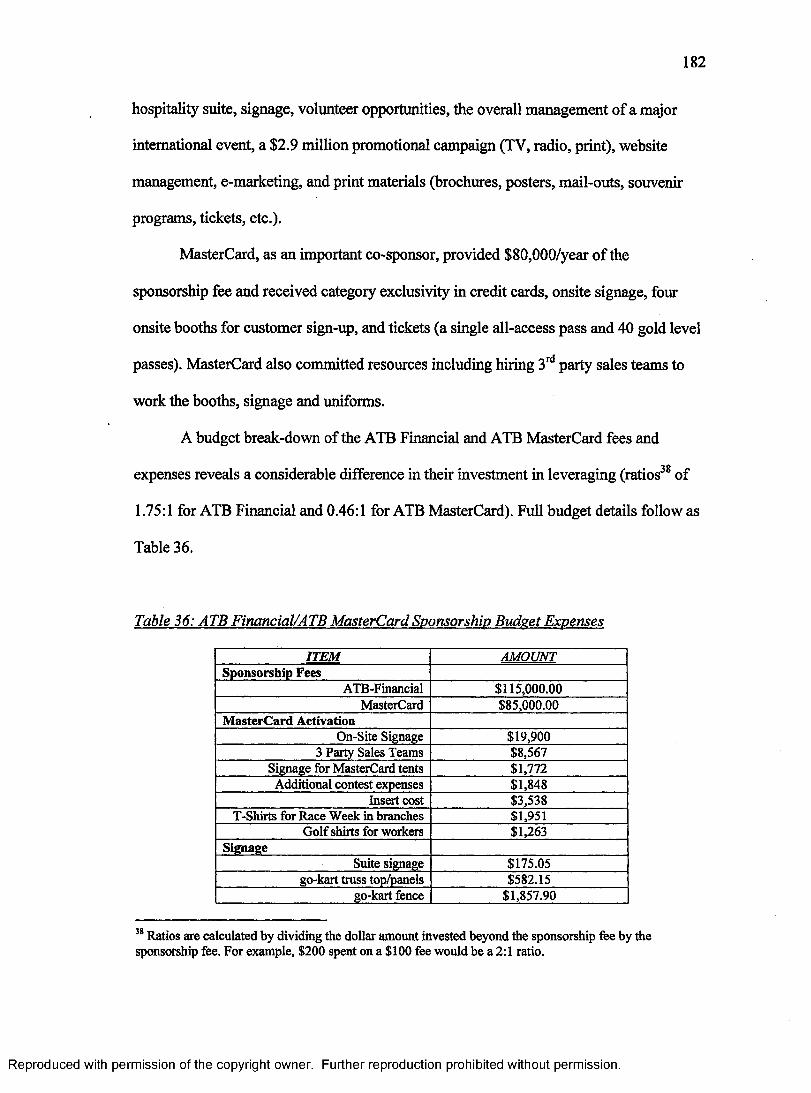
182
hospitality suite, signage, volunteer opportunities, the overall management of a major
international event, a $2.9 million promotional campaign (TV, radio, print), website
management, e-marketing, and print materials (brochures, posters, mail-outs, souvenir
programs, tickets, etc.).
MasterCard, as an important co-sponsor, provided $80,000/year of the
sponsorship fee and received category exclusivity in credit cards, onsite signage, four
onsite booths for customer sign-up, and tickets (a single all-access pass and 40 gold level
passes). MasterCard also committed resources including hiring 3rd party sales teams to
work the booths, signage and uniforms.
A budget break-down of the ATB Financial and ATB MasterCard fees and
expenses reveals a considerable difference in their investment in leveraging (ratios38 of
1.75:1 for ATB Financial and 0.46:1 for ATB MasterCard). Full budget details follow as
Table 36.
Table 36: ATB Financial/ATB MasterCard Sponsorship Budget Expenses
ITEM AMOUNTSponsorship Fees
ATB-Financial $115,000.00MasterCard $85,000.00
MasterCard ActivationOn-Site Signage $19,900
3 Party Sales Teams $8,567Signage for MasterCard tents $1,772Additional contest expenses $1,848
Insert cost $3,538T-Shirts for Race Week in branches $1,951
Golf shirts for workers $1,263Signage
Suite signage $175.05go-kart truss top/panels $582.15
go-kart fence $1,857.90
38 Ratios are calculated by dividing the dollar amount invested beyond the sponsorship fee by the sponsorship fee. For example, $200 spent on a $100 fee would be a 2:1 ratio.
Reproduced with permission of the copyright owner. Further reproduction prohibited without permission.
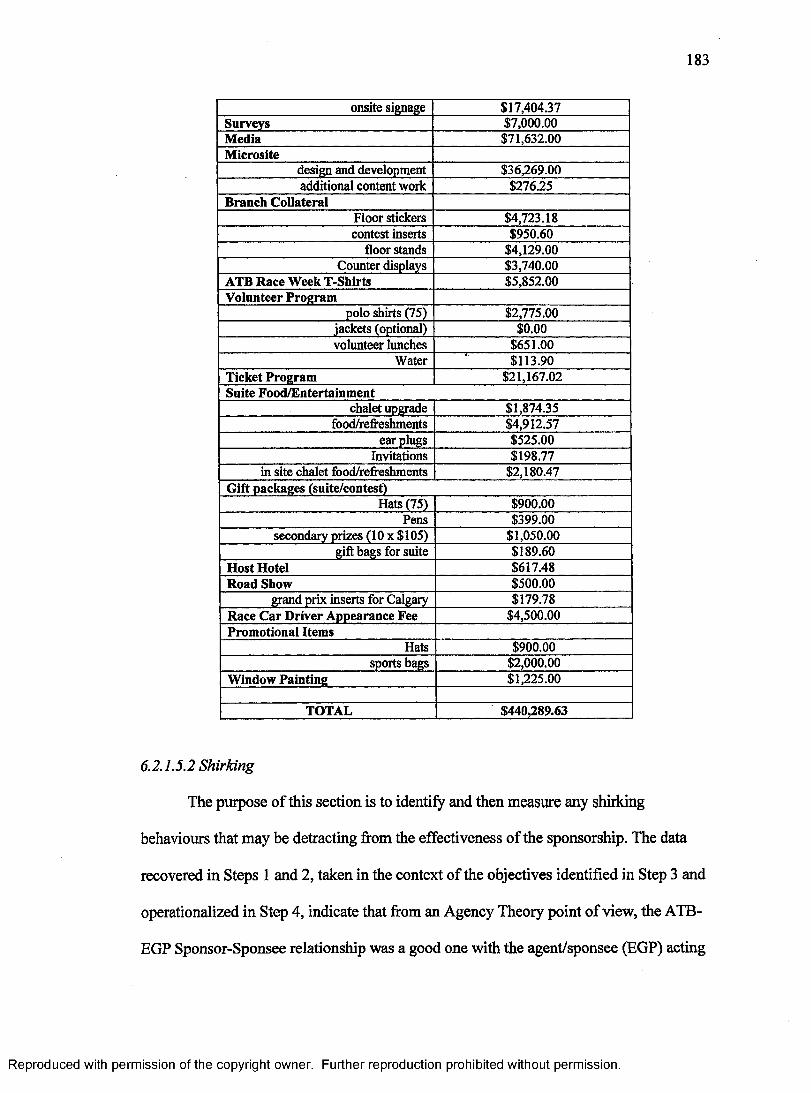
183
onsite signage $17,404.37Surveys $7,000.00Media $71,632.00Microsite
design and development $36,269.00additional content work $276.25
Branch CollateralFloor stickers $4,723.18contest inserts $950.60
floor stands $4,129.00Counter displays $3,740.00
ATB Race Week T-Shirts $5,852.00Volunteer Program
polo shirts (75) $2,775.00jackets (optional) $0.00volunteer lunches $651.00
Water $113.90Ticket Program $21,167.02Suite Food/Entertainment
chalet upgrade $1,874.35food/refreshments $4,912.57
ear plugs $525.00Invitations $198.77
in site chalet food/refreshments $2,180.47Gift packages (suite/contest)
Hats (75) $900.00Pens $399.00
secondary prizes (10 x $105) $1,050.00gift bags for suite $189.60
Host Hotel $617.48Road Show $500.00
grand prix inserts for Calgary $179.78Race Car Driver Appearance Fee $4,500.00Promotional Items
Hats $900.00sports bags $2,000.00
Window Painting $1,225.00
TOTAL $440,289.63
6.2.1.5.2 Shirking
The purpose of this section is to identify and then measure any shirking
behaviours that may be detracting from the effectiveness of the sponsorship. The data
recovered in Steps 1 and 2, taken in the context of the objectives identified in Step 3 and
operationalized in Step 4, indicate that from an Agency Theory point of view, the ATB-
EGP Sponsor-Sponsee relationship was a good one with the agent/sponsee (EGP) acting
Reproduced with permission of the copyright owner. Further reproduction prohibited without permission.
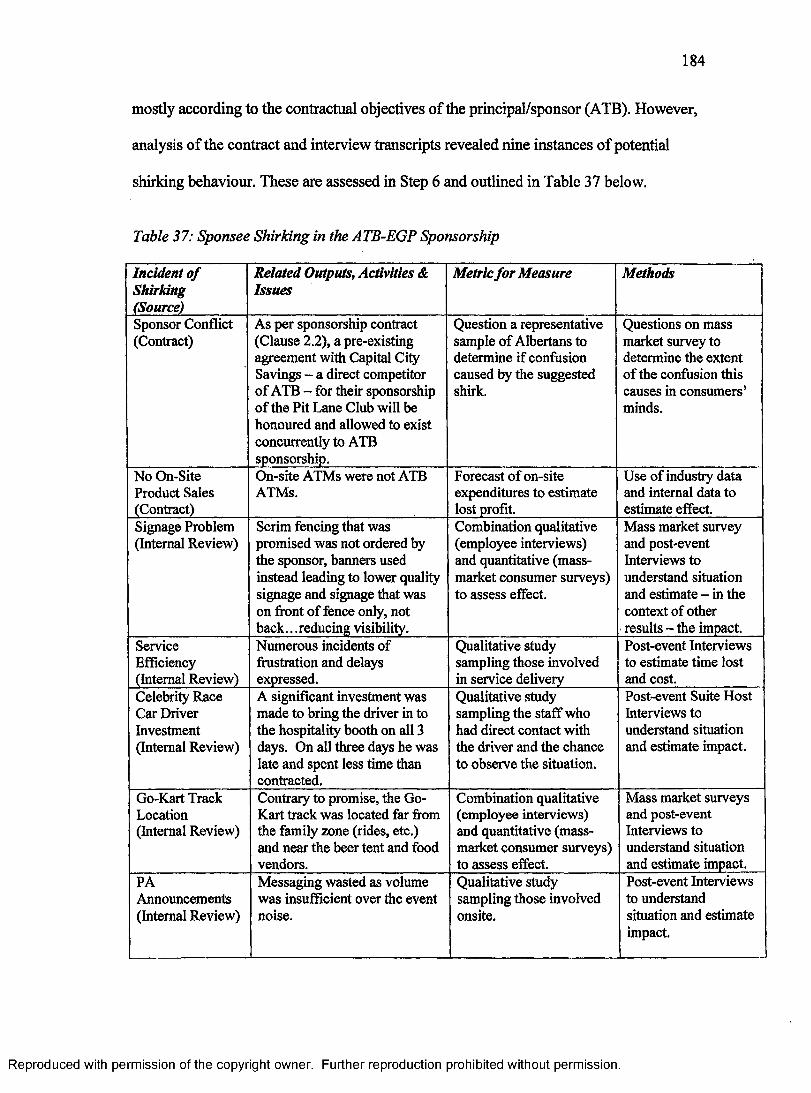
1 8 4
mostly according to the contractual objectives of the principal/sponsor (ATB). However,
analysis of the contract and interview transcripts revealed nine instances of potential
shirking behaviour. These are assessed in Step 6 and outlined in Table 37 below.
Table 37: Sponsee Shirking in the ATB-EGP Sponsorship
Incident ofShirking(Source)
Related Outputs, Activities & Issues
Metric for Measure Methods
Sponsor Conflict (Contract)
As per sponsorship contract (Clause 2.2), a pre-existing agreement with Capital City Savings - a direct competitor of ATB - for their sponsorship of the Pit Lane Club will be honoured and allowed to exist concurrently to ATB sponsorship.
Question a representative sample of Albertans to determine if confusion caused by the suggested shirk.
Questions on mass market survey to determine the extent of the confusion this causes in consumers’ minds.
No On-Site Product Sales (Contract)
On-site ATMs were not ATB ATMs.
Forecast of on-site expenditures to estimate lost profit.
Use of industry data and internal data to estimate effect.
Signage Problem (Internal Review)
Scrim fencing that was promised was not ordered by the sponsor, banners used instead leading to lower quality signage and signage that was on front of fence only, not back...reducing visibility.
Combination qualitative (employee interviews) and quantitative (mass- market consumer surveys) to assess effect.
Mass market survey and post-event Interviews to understand situation and estimate - in the context of other results - the impact.
Service Efficiency (Internal Review)
Numerous incidents of frustration and delays expressed.
Qualitative study sampling those involved in service delivery
Post-event Interviews to estimate time lost and cost.
Celebrity Race Car Driver Investment (Internal Review)
A significant investment was made to bring the driver in to the hospitality booth on all 3 days. On all three days he was late and spent less time than contracted.
Qualitative study sampling the staff who had direct contact with the driver and the chance to observe the situation.
Post-event Suite Host Interviews to understand situation and estimate impact.
Go-Kart Track Location (Internal Review)
Contrary to promise, the Go- Kart track was located far from the family zone (rides, etc.) and near the beer tent and food vendors.
Combination qualitative (employee interviews) and quantitative (mass- market consumer surveys) to assess effect.
Mass market surveys and post-event Interviews to understand situation and estimate impact.
PAAnnouncements (Internal Review)
Messaging wasted as volume was insufficient over the event noise.
Qualitative study sampling those involved onsite.
Post-event Interviews to understand situation and estimate impact.
Reproduced with permission of the copyright owner. Further reproduction prohibited without permission.
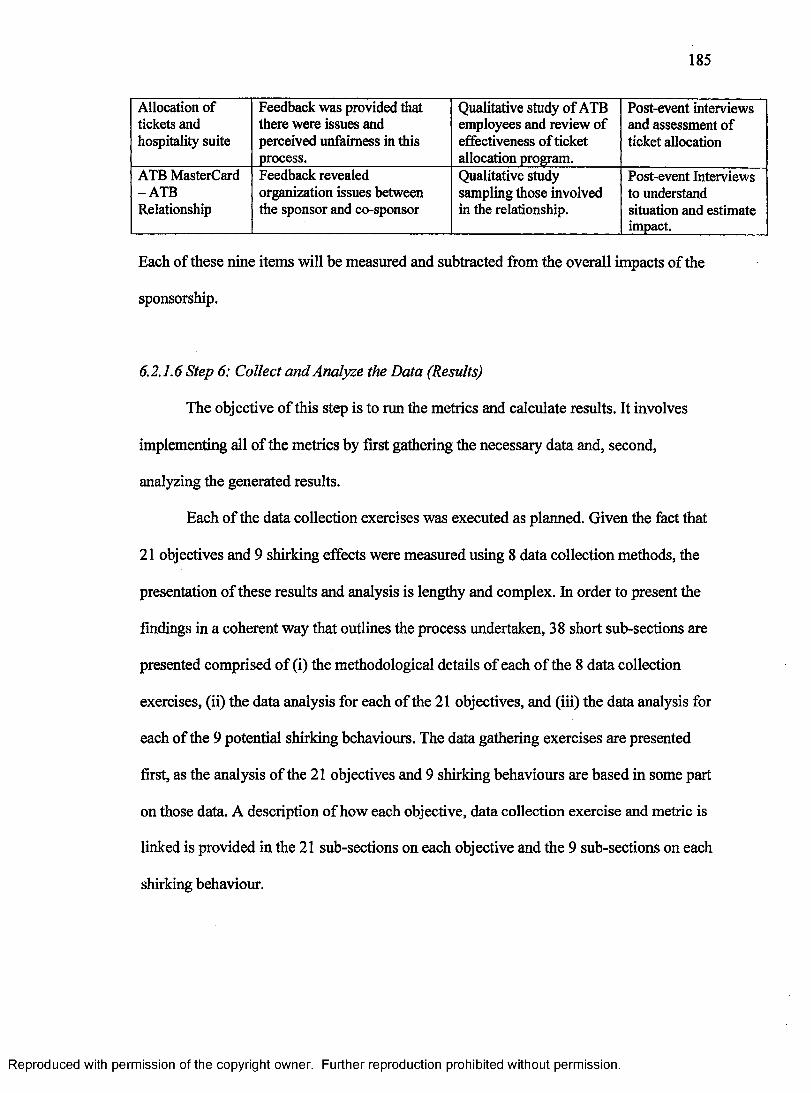
185
Allocation of tickets and hospitality suite
Feedback was provided that there were issues and perceived unfairness in this process.
Qualitative study of ATB employees and review of effectiveness of ticket allocation program.
Post-event interviews and assessment of ticket allocation
ATB MasterCard-ATBRelationship
Feedback revealed organization issues between the sponsor and co-sponsor
Qualitative study sampling those involved in the relationship.
Post-event Interviews to understand situation and estimate impact.
Each of these nine items will be measured and subtracted from the overall impacts of the
sponsorship.
6.2.1.6 Step 6: Collect and Analyze the Data (Results)
The objective of this step is to run the metrics and calculate results. It involves
implementing all of the metrics by first gathering the necessary data and, second,
analyzing the generated results.
Each of the data collection exercises was executed as planned. Given the fact that
21 objectives and 9 shirking effects were measured using 8 data collection methods, the
presentation of these results and analysis is lengthy and complex. In order to present the
findings in a coherent way that outlines the process undertaken, 38 short sub-sections are
presented comprised of (i) the methodological details of each of the 8 data collection
exercises, (ii) the data analysis for each of the 21 objectives, and (iii) the data analysis for
each of the 9 potential shirking behaviours. The data gathering exercises are presented
first, as the analysis of the 21 objectives and 9 shirking behaviours are based in some part
on those data. A description of how each objective, data collection exercise and metric is
linked is provided in the 21 sub-sections on each objective and the 9 sub-sections on each
shirking behaviour.
Reproduced with permission of the copyright owner. Further reproduction prohibited without permission.
1 8 6
6.2.1.6.1 Data Collection Exercises
Data Collection Exercise #1: Web Survey: To provide the data necessary to
measure the objectives targeted at residents of Alberta related to customer acquisition,
building awareness and re-branding ATB (i.e., objectives #3, #10, #12, and #21 from
Table 34), it was decided to utilize a pre-event web-based survey. In developing the final
survey, the researcher worked with ATB’s in-house research professional, who approved
the final product. Questions were designed related to objectives #3, #10, #12 and #21, as
well as (i) to shed light on how individuals came to visit the site, (ii) to ascertain their
opinions of ATB Financial and (iii) to understand their views about the EGP sponsorship.
The web survey, consisting of 10 questions designed to evaluate opinions of the site and
the sponsorship (Appendix C), was posted on the ATB-EGP micro-site
('www.atbgrandnrix.com) which launched on June 1,2006. Banner advertising on
www.atb.com was launched concurrently using banner rotation to promote the microsite
(i.e. the EGP banner was displayed to approximately 1 out of 5 visitors to the ATB
website). On June 5, banner rotation stopped (i.e. all ATB website visitors see micro-site
link), in branch promotions (e.g. signage) began and media campaign launched (e.g. radio
and television advertising).
Designed as a pre-event promotional site, the micro-site was live for 43 days
(June 1st to July 13th) closing at mid-night on July 13th, 2006. During that time, there
were 28,934 total visits by 14,583 different users (unique visits) with a total of 81,915
page views. Traffic was consistent throughout the 43 days except for the days following
the marketing launch (June 5 to 8,2006) when traffic was approximately double. As a
result, 3484 valid responses were obtained from individuals who came to the site in one
Reproduced with permission of the copyright owner. Further reproduction prohibited without permission.
1 8 7
of three ways: (i) via learning about the site through collateral materials (tent cards,
stand-up units) in branches in June 2006, (ii) via newspaper, print and radio
advertisements in Edmonton (mainly) and Calgary in June, or (iii) via the atb.com home
page banner that had a link to the micro-site (Rudan, 2006d). The demographics of the
visitors show that the sample consisted of Albertan residents, 48.9% male, distributed
evenly by age, of varied job backgrounds (21 career fields well represented), and from all
geographic areas of Alberta (over 200 municipalities represented, most being from
Edmonton (37.1% of the sample) and Calgary (11.2% of the sample). Thus, 51.7% of the
respondents were from outside of Calgary and Edmonton.
Respondents were asked how they learned about the micro-website. One-third
(32.3% (1158)) came to the micro-site from the banner advertisement at www.atb.com.
13.9% (498) from newspaper ads, 13.3% (478) via an email invitation, 12.2% (438)
learned of the micro-site from an in-branch poster, 10.6% (382) via word-of-mouth, 1.8%
(63) through a search engine, and 1.7% (61) as a result of a radio ad. They were also
asked about their perceptions of ATB’s quality with over 76% of respondents indicating
that they viewed ATB as very high or high quality and an additional 20% indicating
average quality. Many (82%) also noted that they knew ATB products and services very
well. In terms of the EGP sponsorship itself, 53.7% of respondents believed that it is the
best choice for ATB, 19.8% noted that it is a good choice while only 1.6% indicated that
the event was not appropriate for an ATB sponsorship.
Interestingly, when asked if ATB’s sponsorship of the Grand Prix had changed
their opinion of ATB, results (see table 38 below) show some effect. Notably, 557
Reproduced with permission of the copyright owner. Further reproduction prohibited without permission.

1 8 8
respondents (15.5%) indicated that the sponsorship significantly positively increased their
opinion of ATB.
Table 38: Impact o f EGP sponsorship on positive opinion o f ATB
SPIMPACT
Frequency Percent Valid PercentCumulative
PercentValid Significantly increased 557 15.5 16.0 16.0
Somewhat increased 1021 28.5 29.3 45.3No change 1896 52.8 54.4 99.7Somewhat decreased 8 .2 .2 99.9Significantly decreased 2 .1 .1 100.0Total 3484 97.1 100.0
Missing System 104 2.9Total 3588 100.0
A question was asked to assess the potential effects of the sponsorship on behaviour (i.e.,
increased business measured by branch visits), where 24.2% indicate that they were very
likely or likely to visit an ATB branch more in the near future due to the sponsorship,
while 39% responded that they were very unlikely or unlikely to do so. This is perhaps as
a result of the fact that the vast majority of respondents were already ATB Financial
customers. This point is supported by the question related to switching financial
institutions to ATB Financial where 84% of respondents indicated no change or that they
were already ATB Financial customers. Of the remaining 16%, only 0.5% indicated that
the EGP sponsorship decreased their chance of switching their business to ATB
Financial.
Finally, respondents were asked to describe their perception of ATB Financial in
the Alberta market. Ninety-one percent responded that they felt ATB Financial is a
‘major player’ in the Albertan market. Most respondents (82.9%) also knew that ATB is
Reproduced with permission of the copyright owner. Further reproduction prohibited without permission.
a full-service Albertan bank, however there remains some confusion about the scope of
the financial institution’s operations with 5.6% thinking it operates coast-to-coast, 6.8%
viewing it only as a small-town Albertan bank, and a single respondent supporting that it
is a BC bank expanding into Alberta. Finally, when asked if the EGP sponsorship could
potentially change their opinion of ATB Financial, only 28 of the 109 who incorrectly
described ATB as “a Canadian bank from coast-to-coast” and 19 of the 226 who
described it as “a small town Alberta bank” (the organization’s past image which they are
seeking to change) noted that they would consider changing their opinion of ATB.
Data Collection Exercise #2: ATB Internal Customer Data: Following the signing
of the NDAs and considerable effort by ATB marketing personnel, ATB officials
provided data (received October 24,2006) for two Calgary and two Edmonton branches
for each of the months of June, July, and August 2006 to support the measurement of
objectives #1, #2, #3, and #4 (see Table 34). Branches were selected by ATB based on
one urban/one suburban branch in each city. This data included (i) # of households, (ii) #
of households lost from previous month, (iii) # of households gained from previous
month, (iv) average deposit balance of households, (v) average loan balance of
households, (vi) average deposit balance of households gained from previous month, and
(vii) average loan balance of households gained from previous month. The data was
requested in order to calculate metrics related to customer acquisition in Edmonton and
Calgary. Reports were generated by assessing internal ATB reporting systems and are
summarized below in Table 39.
Reproduced with permission of the copyright owner. Further reproduction prohibited without permission.
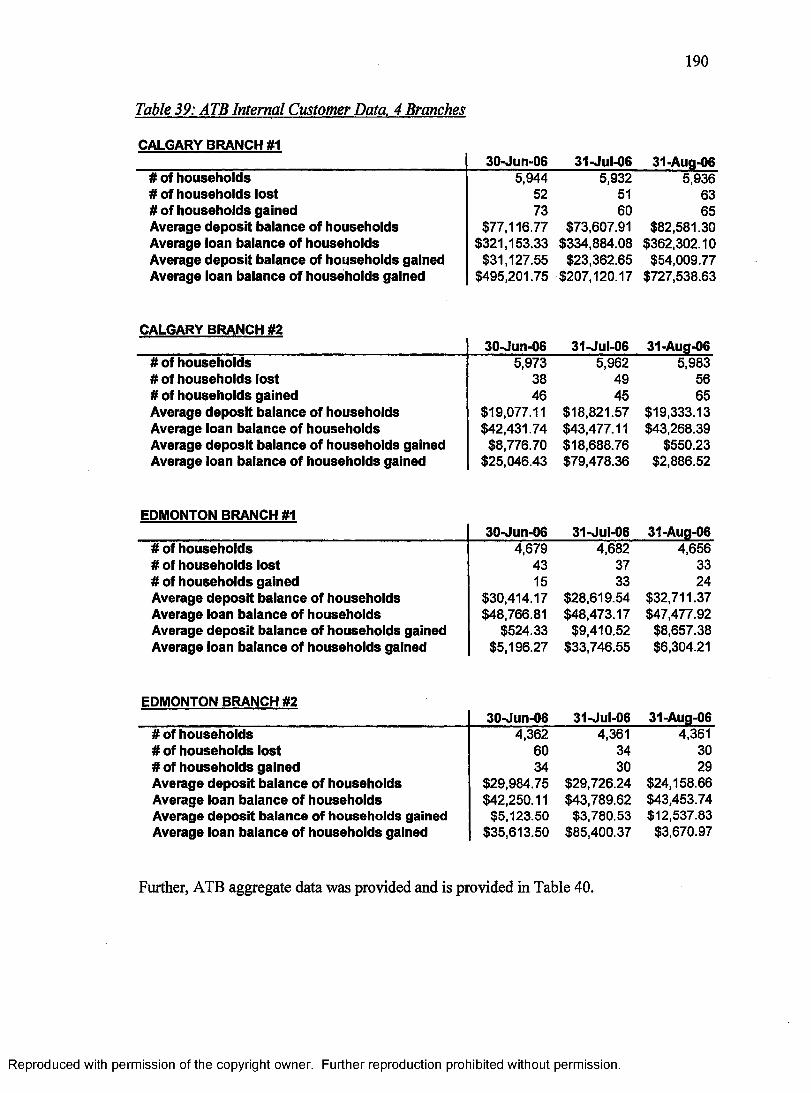
1 9 0
Table 39: ATB Internal Customer Data. 4 Branches
CALGARY BRANCH #130-Jun-06 31-Jul-06 31-Aug-06
# of households# of households lost# of households gainedAverage deposit balance of households Average loan balance of households Average deposit balance of households gained Average loan balance of households gained
5,9445273
$77,116.77$321,153.33
$31,127.55$495,201.75
5,9325160
$73,607.91$334,884.08
$23,362.65$207,120.17
5,9366365
$82,581.30$362,302.10
$54,009.77$727,538.63
CALGARY BRANCH #230-Jun-06 31-Jul-06 31-Aug-06
# of households# of households lost# of households gainedAverage deposit balance of households Average loan balance of households Average deposit balance of households gained Average loan balance of households gained
5,9733846
$19,077.11$42,431.74
$8,776.70$25,046.43
5,9624945
$18,821.57$43,477.11$18,688.76$79,478.36
5,9835665
$19,333.13$43,268.39
$550.23$2,886.52
EDMONTON BRANCH #130-Jun-06 31-Jul-06 31-Aug-06
# of households# of households lost# of households gainedAverage deposit balance of households Average loan balance of households Average deposit balance of households gained Average loan balance of households gained
4,6794315
$30,414.17$48,766.81
$524.33$5,196.27
4,6823733
$28,619.54$48,473.17
$9,410.52$33,746.55
4,6563324
$32,711.37$47,477.92
$8,657.38$6,304.21
EDMONTON BRANCH #230-Jun-06 31-Jul-06 31-Aug-06
# of households# of households lost# of households gainedAverage deposit balance of households Average loan balance of households Average deposit balance of households gained Average loan balance of households gained
4,3626034
$29,984.75$42,250.11
$5,123.50$35,613.50
4,3613430
$29,726.24$43,789.62
$3,780.53$85,400.37
4,3613029
$24,158.66$43,453.74$12,537.83
$3,670.97
Further, ATB aggregate data was provided and is provided in Table 40.
Reproduced with permission of the copyright owner. Further reproduction prohibited without permission.
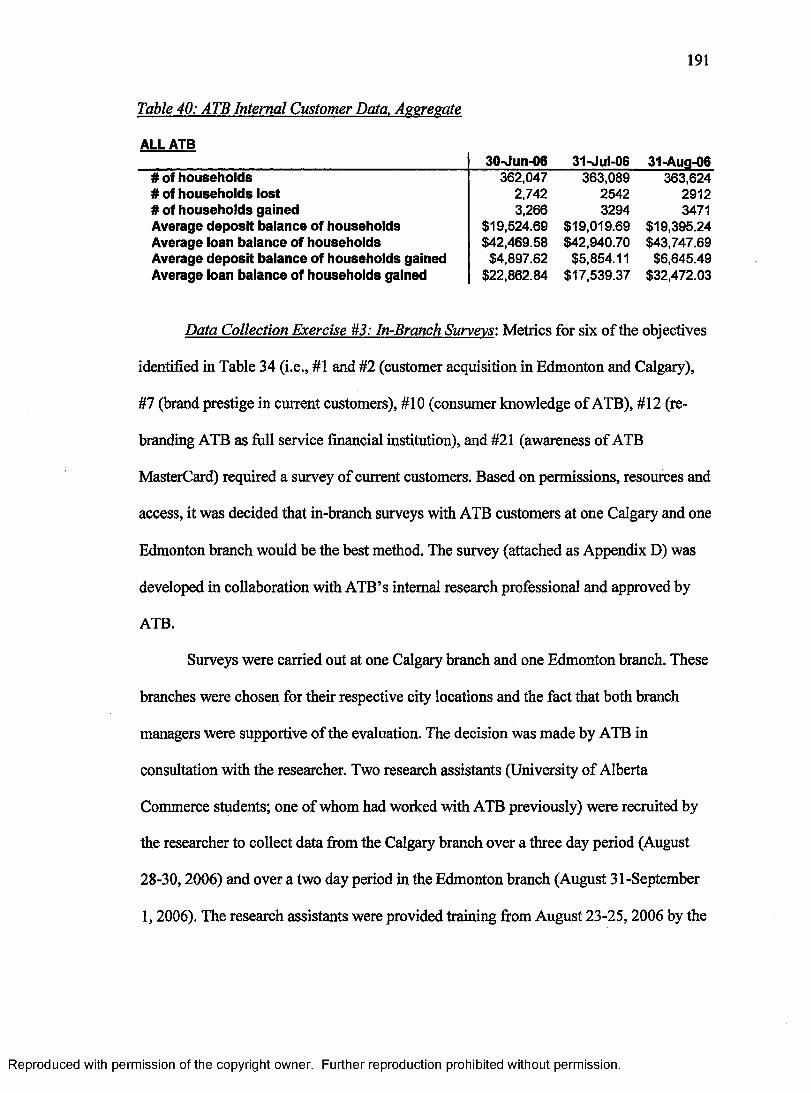
191
Table 40: ATB Internal Customer Data. Aggregate
ALL ATB3(KJun-06 31-Jul-06 31-Aug-06
# of households# of households lost# of households gainedAverage deposit balance of households Average loan balance of households Average deposit balance of households gained Average loan balance of households gained
3,266 3294 3471$19,524.69 $19,019.69 $19,395.24$42,469.58 $42,940.70 $43,747.69$4,897.62 $5,854.11 $6,645.49
$22,862.84 $17,539.37 $32,472.03
362,047 363,089 363,6242,742 2542 2912
Data Collection Exercise #3: In-Branch Surveys: Metrics for six of the objectives
identified in Table 34 (i.e., #1 and #2 (customer acquisition in Edmonton and Calgary),
#7 (brand prestige in current customers), #10 (consumer knowledge of ATB), #12 (re
branding ATB as full service financial institution), and #21 (awareness of ATB
MasterCard) required a survey of current customers. Based on permissions, resources and
access, it was decided that in-branch surveys with ATB customers at one Calgary and one
Edmonton branch would be the best method. The survey (attached as Appendix D) was
developed in collaboration with ATB’s internal research professional and approved by
Surveys were carried out at one Calgary branch and one Edmonton branch. These
branches were chosen for their respective city locations and the fact that both branch
managers were supportive of the evaluation. The decision was made by ATB in
consultation with the researcher. Two research assistants (University of Alberta
Commerce students; one of whom had worked with ATB previously) were recruited by
the researcher to collect data from the Calgary branch over a three day period (August
28-30,2006) and over a two day period in the Edmonton branch (August 31-September
1,2006). The research assistants were provided training from August 23-25,2006 by the
ATB.
Reproduced with permission of the copyright owner. Further reproduction prohibited without permission.
1 9 2
author and ATB’s Marketing Manager, Investor Services. Researchers set up at a table in
the branch and offered customers an incentive (cold bottled water and an energy bar) to
complete the survey, which took three to five minutes to self-complete. Each customer in
the bank was approached to participate.
One-hundred-eleven (111) and 106 surveys were collected from the Calgary and
Edmonton branches, respectively. Approximately 20% of the surveys were collected on
each of Monday, Tuesday, Wednesday, Thursday and Friday distributed throughout the
banking day (Morning (39.5%), Noon-Hour (24.9%), and Afternoon (35.6%)).
Researchers reported that data collection was smooth and that most bank patrons
completed the survey and that those who did not typically did not do so because there
was already a line-up of people completing it. The support of the branch staff was noted.
In order to measure the objectives #1, #2, #7, #12 and #21 a number of questions
were asked. Ten (or 4.6%) indicated that they had become ATB customers in the past two
months while 22 (or 9.2%) noted that they had increased their business with ATB over
the past two months. Characteristics of the sample measured included gender (50.6%
male), age (18-24 (10.3%), 25-34 (15.9%), 35-44 (15.9%), 45-54 (25.8%), 55-64
(16.4%), 65+ (15.4%)), and household income (Refused/Don’t Know (12.4%), Less than
$50k (34.5%), $50k-$100k (26.7%), $100k-$150k (11.9%), $150k-$250k (7.3%),
$250k+ (6.9%)). Table 41 below, provides a comparison between the Edmonton and
Calgary results as some of these objectives (#1 and #2, particularly) are specific to each
market.
Reproduced with permission of the copyright owner. Further reproduction prohibited without permission.
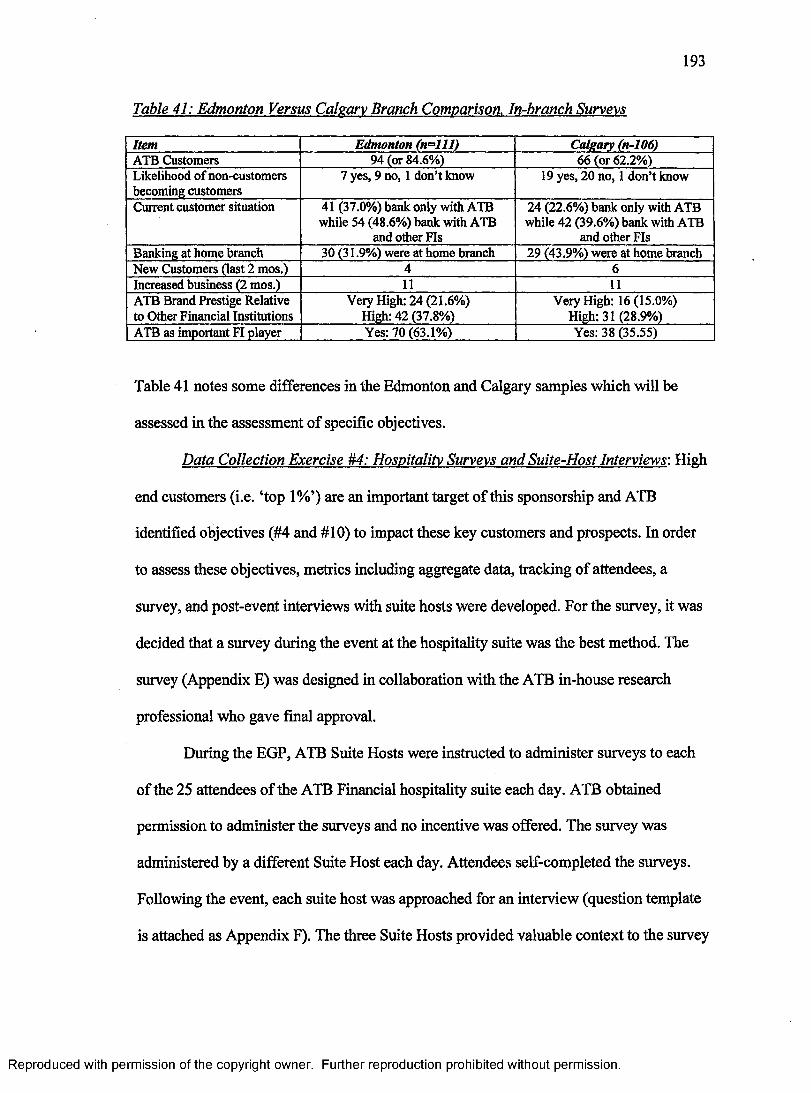
193
Table 41: Edmonton Versus Calgary Branch Comparison. In-branch Surveys
Item Edmonton (n=lll) Calgary (n-106)ATB Customers 94 (or 84.6%) 66 (or 62.2%)Likelihood of non-customers becoming customers
7 yes, 9 no, 1 don’t know 19 yes, 20 no, 1 don’t know
Current customer situation 41 (37.0%) bank only with ATB while 54 (48.6%) batik with ATB
and other FIs
24 (22.6%) bank only with ATB while 42 (39.6%) bank with ATB
and other FIsBanking at home branch 30 (31.9%) were at home branch 29 (43.9%) were at home branchNew Customers (last 2 mos.) 4 6Increased business (2 mos.) 11 11ATB Brand Prestige Relative to Other Financial Institutions
Very High: 24 (21.6%) High: 42 (37.8%)
Very High: 16 (15.0%) High: 31 (28.9%)
ATB as important FI player Yes: 70 (63.1%) Yes: 38 (35.55)
Table 41 notes some differences in the Edmonton and Calgary samples which will be
assessed in the assessment of specific objectives.
Data Collection Exercise #4: Hospitality Surveys and Suite-Host Interviews'. High
end customers (i.e. ‘top 1%’) are an important target of this sponsorship and ATB
identified objectives (#4 and #10) to impact these key customers and prospects. In order
to assess these objectives, metrics including aggregate data, tracking of attendees, a
survey, and post-event interviews with suite hosts were developed. For the survey, it was
decided that a survey during the event at the hospitality suite was the best method. The
survey (Appendix E) was designed in collaboration with the ATB in-house research
professional who gave final approval.
During the EGP, ATB Suite Hosts were instructed to administer surveys to each
of the 25 attendees of the ATB Financial hospitality suite each day. ATB obtained
permission to administer the surveys and no incentive was offered. The survey was
administered by a different Suite Host each day. Attendees self-completed the surveys.
Following the event, each suite host was approached for an interview (question template
is attached as Appendix F). The three Suite Hosts provided valuable context to the survey
Reproduced with permission of the copyright owner. Further reproduction prohibited without permission.
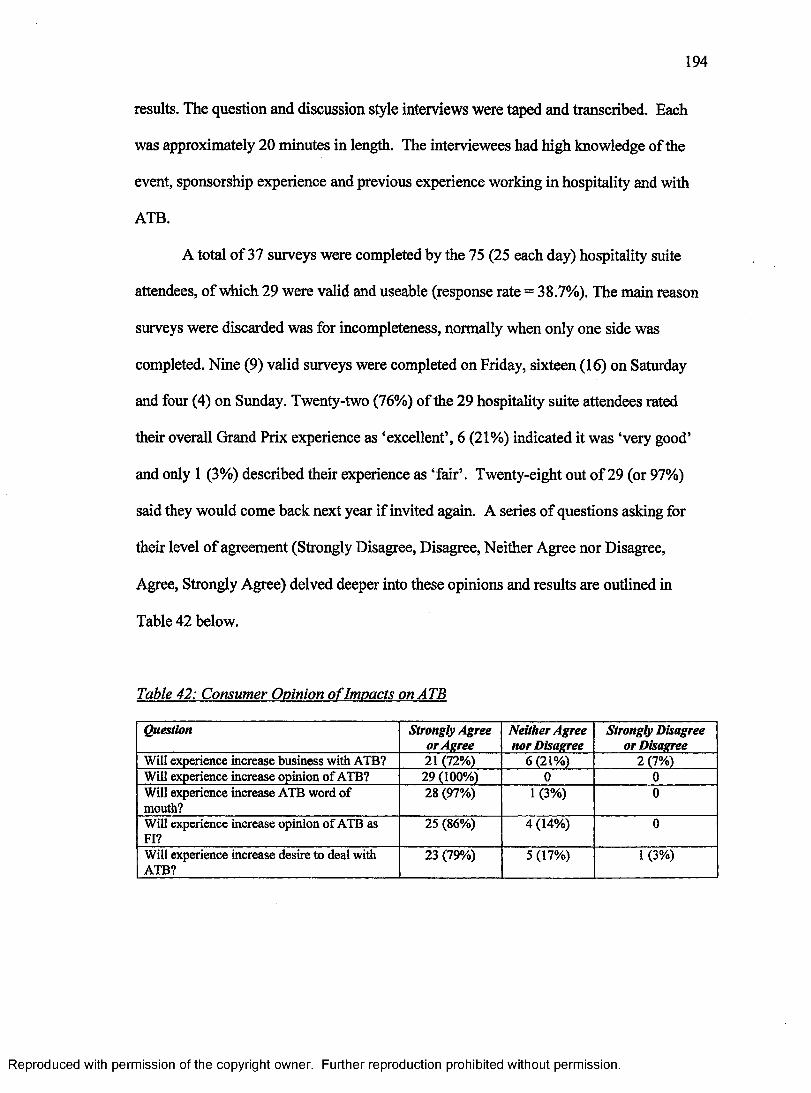
results. The question and discussion style interviews were taped and transcribed. Each
was approximately 20 minutes in length. The interviewees had high knowledge of the
event, sponsorship experience and previous experience working in hospitality and with
ATB.
A total of 37 surveys were completed by the 75 (25 each day) hospitality suite
attendees, of which 29 were valid and useable (response rate = 38.7%). The main reason
surveys were discarded was for incompleteness, normally when only one side was
completed. Nine (9) valid surveys were completed on Friday, sixteen (16) on Saturday
and four (4) on Sunday. Twenty-two (76%) of the 29 hospitality suite attendees rated
their overall Grand Prix experience as ‘excellent’, 6 (21%) indicated it was ‘very good’
and only 1 (3%) described their experience as ‘fair’. Twenty-eight out of 29 (or 97%)
said they would come back next year if invited again. A series of questions asking for
their level of agreement (Strongly Disagree, Disagree, Neither Agree nor Disagree,
Agree, Strongly Agree) delved deeper into these opinions and results are outlined in
Table 42 below.
Table 42: Consumer Opinion o f Impacts on ATB
Question Strongly Agree or Agree
Neither Agree nor Disagree
Strongly Disagree or Disagree
Will experience increase business with ATB? 21 (72%) 6 (21%) 2 (7%)Will experience increase opinion of ATB? 29 (100%) 0 0Will experience increase ATB word of mouth?
28 (97%) 1 (3%) 0
Will experience increase opinion of ATB as FI?
25 (86%) 4 (14%) 0
Will experience increase desire to deal with ATB?
23 (79%) 5 (17%) 1 (3%)
Reproduced with permission of the copyright owner. Further reproduction prohibited without permission.
A number of additional points about the sample are important to this data collection
exercise. First, 22 (76%) of the respondents were ATB clients while 7 (24%) were not.
Second, 15 (52%) respondents indicated that ATB is their primary bank while 14 (28%)
indicated that it is not (note that for the 14 for whom ATB is not their primary bank, 7
(24%) do bank at ATB and 7 (24%) do not bank at ATB at all). Third, 7 (24%)
respondents only bank at ATB while 22 (76%) also use the services of other financial
institutions. Fourth, within the sample of 22 who use other financial institutions, it was
determined that they (a) use 1.8 (+/- .9) other FIs with a minimum of 1 and a maximum
of 4, and (b) they do 47.0% +/- 38.0% of their banking with ATB; range of 0 to 95%.
Fifth, of those attendees who were ATB clients, they have been clients for an average of
15.8 +/-15 years with a range of 1 year to 50 years. Finally, household income was asked
as a proxy for level of customer, where results showed that 21 (or 72%) had a household
income greater than $100,000,6 (or 21%) had a household income between $60,000 and
$100,000 and 2 (or 7%) had a household income under $60,000.
The suite host interviewees described the suite as a success from both a
hospitality and sponsorship point of view, and indicated that guests had a very good time
while there (Suite_Host_l, 2006; Suite_Host_2,2006). With respect to the benefit to
ATB’s sponsorship of the EGP, the hosts pointed out that the suite was a particular
success in targeting and reaching the top end clients and showing that they are valued
customers (Suite Host l, 2006; Suite_Host_2,2006), however “there were some
invitation logistics as perhaps too many executives were there and not enough clients”
(Suite_Host_2,2006). The interviewees were also asked to describe the suite attendees
Reproduced with permission of the copyright owner. Further reproduction prohibited without permission.
1 9 6
demographically, noting that “executives were there...relationship managers, the COO39
and two other executives, the COO with his guest.. .it was a mix of couples, friends,
daughter, top end customers who had money” (Suite_Host_2,2006) and that attendees
were mostly “ATB’s top customers.. .all with guests. About 20 total, 10 groups of two,
50/50 men/women with a few kids” (Suite Host l, 2006).
The interviewees reported that (i) ATB signage and gift bags were well presented
and distributed, (ii) that they, as hosts, took on many other roles during the day
(barkeeper, ticket manager, event program distribution, gift bag assembly and
distribution, and coordinating the race car driver suite visit), (iii) that attendees were very
cooperative and willing to complete surveys although some never did, and (iv) that guests
were treated very well (lobster and filet mignon lunch, taxi chits to get home, and classy
service) (Suite_Host_l, 2006; Suite_Host_2,2006). Finally, two specific suggestions
were brought forth for improvement; (i) to invite fewer people or to rent a larger suite in
order to reduce the congestion and to allow for all guests to sit down and (ii) to manage
the ticket allocation to allow for more clients and fewer ATB employees and their
spouses.
Data Collection Exercise #5: Mass Market (Alberta) Surveys: In order to assess
the 5 objectives related to the impact of the sponsorship on the Albertan market (i.e.,
increased awareness (#5 and #6), achievement of competitive advantage (#9), consumer
opinion of ATB (#11), re-branding ATB as full-service FI (#13), and the EGP’s ability to
build an affinity with Albertans (#18)), 500 phone surveys (random) were completed
province wide in August 2006 by a market research house (Trend Research Inc.) partner
contracted by ATB. As with the previous questionnaires, the researcher developed the
39 COO refers to the Chief Operating Officer of ATB.
Reproduced with permission of the copyright owner. Further reproduction prohibited without permission.
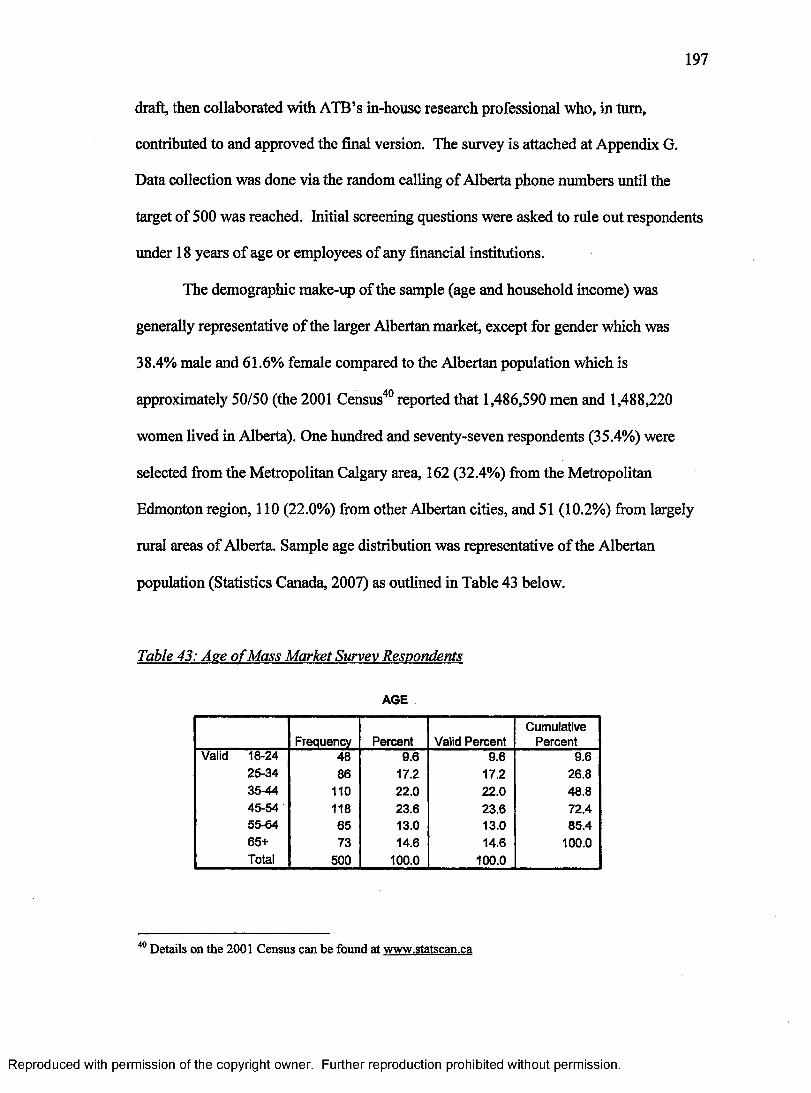
1 9 7
draft, then collaborated with ATB’s in-house research professional who, in turn,
contributed to and approved the final version. The survey is attached at Appendix G.
Data collection was done via the random calling of Alberta phone numbers until the
target of 500 was reached. Initial screening questions were asked to rule out respondents
under 18 years of age or employees of any financial institutions.
The demographic make-up of the sample (age and household income) was
generally representative of the larger Albertan market, except for gender which was
38.4% male and 61.6% female compared to the Albertan population which is
approximately 50/50 (the 2001 Census40 reported that 1,486,590 men and 1,488,220
women lived in Alberta). One hundred and seventy-seven respondents (35.4%) were
selected from the Metropolitan Calgary area, 162 (32.4%) from the Metropolitan
Edmonton region, 110 (22.0%) from other Albertan cities, and 51 (10.2%) from largely
rural areas of Alberta. Sample age distribution was representative of the Albertan
population (Statistics Canada, 2007) as outlined in Table 43 below.
Table 43: Ase o f Mass Market Survey Respondents
AGE
Frequency Percent Valid PercentCumulative
PercentValid 18-24 48 9.6 9.6 9.6
25-34 86 17.2 17.2 26.835-44 110 22.0 22.0 48.845-54 118 23.6 23.6 72.455-64 65 13.0 13.0 85.465+ 73 14.6 14.6 100.0Total 500 100.0 100.0
40 Details on the 2001 Census can be found at www.statscan.ca
Reproduced with permission of the copyright owner. Further reproduction prohibited without permission.
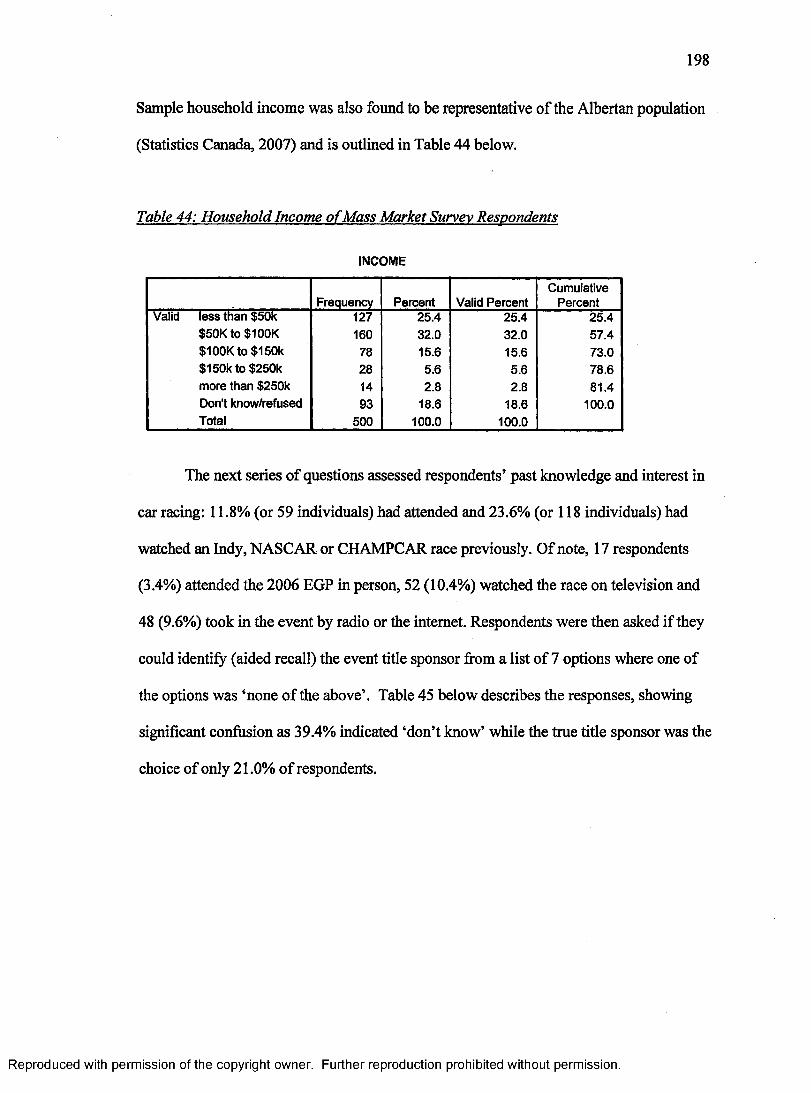
1 9 8
Sample household income was also found to be representative of the Albertan population
(Statistics Canada, 2007) and is outlined in Table 44 below.
Table 44: Household Income ofMass Market Survey Respondents
INCOME
Frequency Percent Valid PercentCumulative
PercentValid less than $50k 127 25.4 25.4 25.4
$50K to $100K 160 32.0 32.0 57.4$100Kto $150k 78 15.6 15.6 73.0$150k to $250k 28 5.6 5.6 78.6more than $250k 14 2.8 2.8 81.4Don't know/refused 93 18.6 18.6 100.0Total 500 100.0 100.0
The next series of questions assessed respondents’ past knowledge and interest in
car racing: 11.8% (or 59 individuals) had attended and 23.6% (or 118 individuals) had
watched an Indy, NASCAR or CHAMPCAR race previously. Of note, 17 respondents
(3.4%) attended the 2006 EGP in person, 52 (10.4%) watched the race on television and
48 (9.6%) took in the event by radio or the internet. Respondents were then asked if they
could identify (aided recall) the event title sponsor from a list of 7 options where one of
the options was ‘none of the above’. Table 45 below describes the responses, showing
significant confusion as 39.4% indicated ‘don’t know’ while the true title sponsor was the
choice of only 21.0% of respondents.
Reproduced with permission of the copyright owner. Further reproduction prohibited without permission.
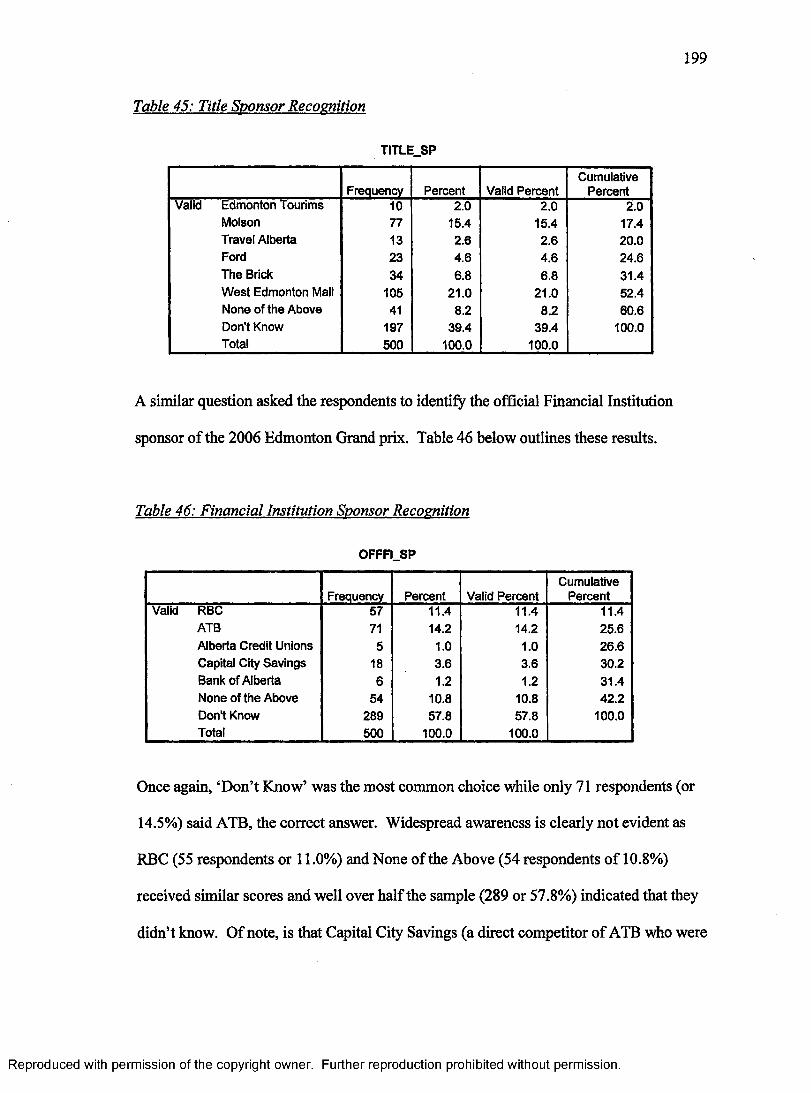
1 9 9
Table 45: Title Sponsor Recognition
TITLE SP
Frequency Percent Valid PercentCumulative
PercentValid Edmonton Tourims 10 2.0 2.0 2.0
Molson 77 15.4 15.4 17.4Travel Alberta 13 2.6 2.6 20.0Ford 23 4.6 4.6 24.6The Brick 34 6.8 6.8 31.4West Edmonton Mall 105 21.0 21.0 52.4None of the Above 41 8.2 8.2 60.6Don’t Know 197 39.4 39.4 100.0Total 500 100.0 100.0
A similar question asked the respondents to identify the official Financial Institution
sponsor of the 2006 Edmonton Grand prix. Table 46 below outlines these results.
Table 46: Financial Institution Sponsor Recognition
OFFFI SP
Frequency Percent Valid PercentCumulative
PercentValid RBC 57 11.4 11.4 11.4
ATB 71 14.2 14.2 25.6Alberta Credit Unions 5 1.0 1.0 26.6Capital City Savings 18 3.6 3.6 30.2Bank of Alberta 6 1.2 1.2 31.4None of the Above 54 10.8 10.8 42.2Don't Know 289 57.8 57.8 100.0Total 500 100.0 100.0
Once again, ‘Don’t Know’ was the most common choice while only 71 respondents (or
14.5%) said ATB, the correct answer. Widespread awareness is clearly not evident as
RBC (55 respondents or 11.0%) and None of the Above (54 respondents of 10.8%)
received similar scores and well over half the sample (289 or 57.8%) indicated that they
didn’t know. Of note, is that Capital City Savings (a direct competitor of ATB who were
Reproduced with permission of the copyright owner. Further reproduction prohibited without permission.

200
also involved with the EGP as sponsor of the Capital City Savings Pit Lane Club) were
noted by 18 respondents (3.6%).
The remainder of the survey occurred after each respondent was told that ATB
was the official FI sponsor. Background questions revealed that 87 respondents (17.4%)
are currently customers of ATB and that the majority (56.8% or 284) define ATB
correctly as a ‘full service, province-wide Albertan financial institution’. However, a
significant portion (43.2%) of the sample still defines ATB incorrectly.
The next series of 8 questions assessed the effectiveness of the EGP sponsorship
using 5-option (Strongly Agree, Agree, Neither Agree nor Disagree, Disagree, Strongly
Disagree) Likert scale type questions. In order to clearly present
agreement/neither/disagreement, results are collapsed into 3 groups with the agreement
and disagreement options joined and presented in Table 47.
Table 47: Frequency Responses. EGP Sponsorship Effectiveness
Question Strongly Agree or Agree
Neither Agree nor Disagree
Strongly Disagree or Disagree
I am now more aware of the products and services of ATB Financial after their sponsorship of the Edmonton Grand Prix.
82 (16.4%) 71 (14.2%) 320 (64.0%)
After learning that ATB Financial was sponsoring the Edmonton Grand Prix, my belief that they care about Albertans increased.
217 (43.4%) 109 (21.8%) 146 (29.2%)
In my opinion, the ATB sponsorship of the Edmonton Grand Prix helps demonstrate that ATB is a major player in die Alberta banking market
324 (64.8%) 61 (12.2%) 90 (18.0%)
When I think of ATB Financial, I think of a full- service, province wide financial institution.
377 (75.4%) 40 (8.0%) 56 (11.2%)
ATB being one of the sponsors for Edmonton Grand Prix made me prouder that the event is hosted in Alberta.
244 (48.8%) 117(23.4%) 114(22.8%)
The feet that ATB Financial sponsored the Edmonton Grand Prix makes me more likely to [open an account at ATB OR use more of ATB’s services].
69 (13.8%) 70 (14.0%) 339 (67.8%)
Reproduced with permission of the copyright owner. Further reproduction prohibited without permission.
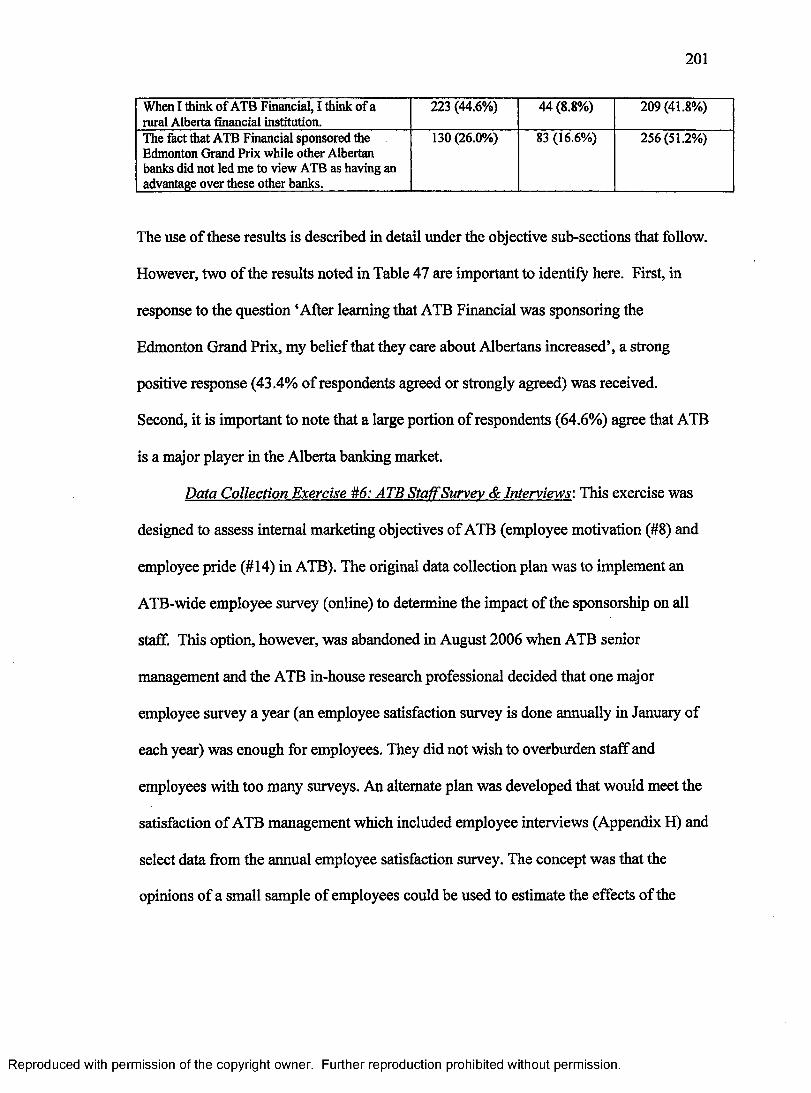
201
When I think of ATB Financial, I think of a rural Alberta financial institution.
223 (44.6%) 44 (8.8%) 209 (41.8%)
The fact that ATB Financial sponsored the Edmonton Grand Prix while other Albertan banks did not led me to view ATB as having an advantage over these other banks.
130 (26.0%) 83 (16.6%) 256 (51.2%)
The use of these results is described in detail under the objective sub-sections that follow.
However, two of the results noted in Table 47 are important to identify here. First, in
response to the question ‘After learning that ATB Financial was sponsoring the
Edmonton Grand Prix, my belief that they care about Albertans increased’, a strong
positive response (43.4% of respondents agreed or strongly agreed) was received.
Second, it is important to note that a large portion of respondents (64.6%) agree that ATB
is a major player in the Alberta banking market.
Data Collection Exercise #6: ATB Staff Survey & Interviews: This exercise was
designed to assess internal marketing objectives of ATB (employee motivation (#8) and
employee pride (#14) in ATB). The original data collection plan was to implement an
ATB-wide employee survey (online) to determine the impact of the sponsorship on all
staff. This option, however, was abandoned in August 2006 when ATB senior
management and the ATB in-house research professional decided that one major
employee survey a year (an employee satisfaction survey is done annually in January of
each year) was enough for employees. They did not wish to overburden staff and
employees with too many surveys. An alternate plan was developed that would meet the
satisfaction of ATB management which included employee interviews (Appendix H) and
select data from the annual employee satisfaction survey. The concept was that the
opinions of a small sample of employees could be used to estimate the effects of the
Reproduced with permission of the copyright owner. Further reproduction prohibited without permission.
202
sponsorship on employee pride and satisfaction in the context of the macro-level results
from the annual survey.
The data shared from the January 2006 version of annual employee survey
included the following from the 3520 returned surveys (a response rate of 88% of all
ATB employees as of January 2006) which showed that 64% either ‘strongly agree’ or
‘agree’ that ATB overall is a good place to work and that 91% either ‘agree’ or ‘strongly
agree’ that ATB acts as a good corporate citizen. In the context of this general level of
employee satisfaction that exists at ATB, seven phone interviews were conducted with
ATB employees to assess the impact of the EGP sponsorship. A suggested list of
potential interviewees (approximately 20) was suggested by ATB and a random selection
of seven of these individuals was actually interviewed. In an attempt to reduce selection
bias and provide generalizeable results, ATB was asked to provide a roster of potential
interviewees who were representative of the organization and connected to the marketing
function. The names of the interviewees are not disclosed to protect the privacy of the
individuals.
The sample of interviewees represented a wide range of functions at ATB
(including Director, Customer Service Representative, Financial Advisor, and Mortgage
Specialist) and included representation from head office and the branches. Interviews
lasted between 3 and 15 minutes. They were recorded and transcribed. All interviews
were completed by phone. It should be noted that the roster of interviewees was provided
by ATB and may be biased to include those known to head office who are perhaps more
satisfied with ATB than the general population of employees. The possibility of bias is
recognized here and Table 48 below highlights the results.
Reproduced with permission of the copyright owner. Further reproduction prohibited without permission.

2 0 3
Table 48: General Results - Post-Event Employee Interviews
Metric/Concept ResultsNumber of interviews 7Number who attended event 0Gender breakdown 4 F / 3 MYears worked @ ATB 8.2 +/- 4.9 years (range: 3-18)
ATB (Good place to work) Yes - 6 / No - 1 (similar to survey results)ATB (Satisfied with way you are treated)
Yes - 7 / No - 0 (similar to survey results)
ATB (Are most employees satisfied)
Variable answers including “for the most part”, “about 50/50”, “yes”, “I think so...actually, somewhat...some are not happy”
Performance of ATB marketing group over past year
Variable answers including: “Yes, wonderful job”, “Fun guys”, “I tend to deal with the marketing guys on the business side of the office.. .I’d probably give them a 5/10 and the reason I would do that is that they are very challenged in terms of the number of resources they have relative to priorities and I am always on the low end of priorities”, “Strong performance except on employee retention”
Identification of specific activities run by the marketing group
A number of positive activities pointed out including charity work, community events, sponsorship of big ticket items, “the razor stuff” (i.e., new razor cell phone), staff prizes and internal events
Did ATB-EGP sponsorship contribute to your pride in ATB?
Mixed comments. Bottom line: it may have helped other ATB branches in the Edmonton market but these particular individuals were not impacted directly, although some of their clients were. Here’s a sample:(i) “.. .our clients [6] were happy - all of them enjoyed it - they were wined and dined”(ii) “That is not a mickey mouse event and for us to be a gold sponsor, I think that that is money well spent but it is hard to quantify. But I think that it is important for ATB to have its name out there.”(iii) “I think so big time.. .because they are everywhere.. .all events.”(iv) “Yes, But I think more for the Edmonton market.”
Can you allocate a percentage as to how much the EGP sponsorship contributed to employee satisfaction/pride?
No one gave a numeric value. However, two respondents inferred a ‘fairly big impact’
Reproduced with permission of the copyright owner. Further reproduction prohibited without permission.
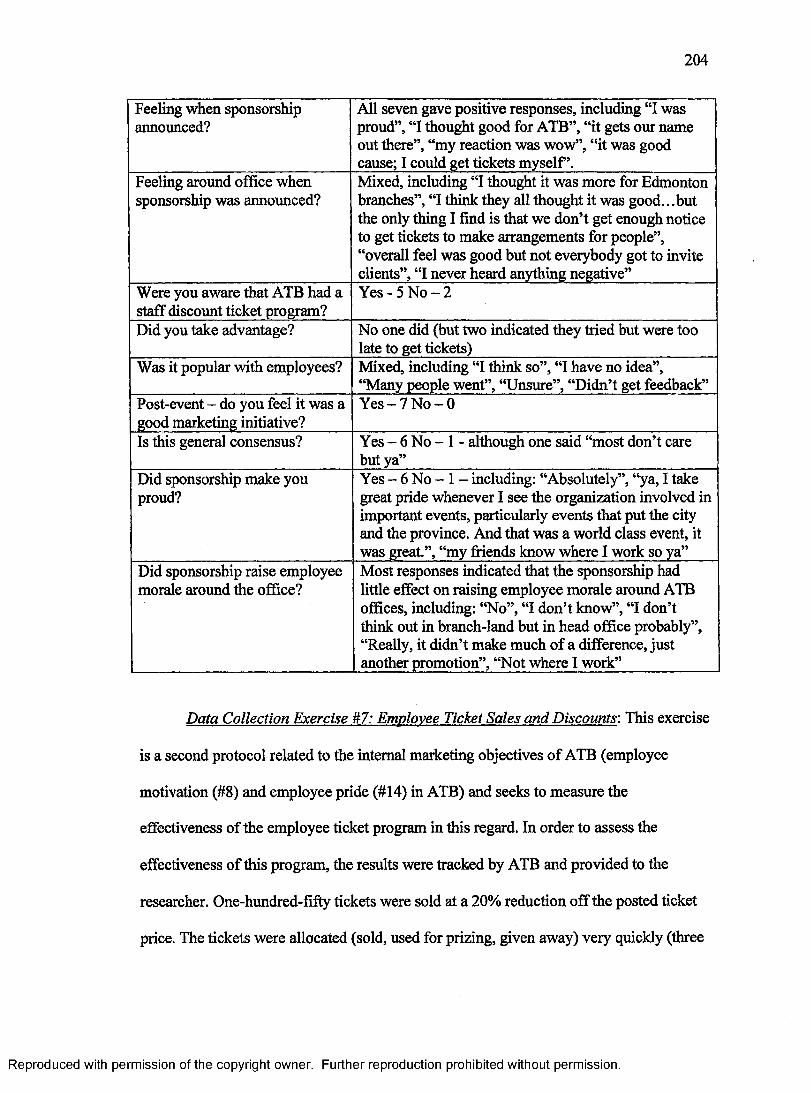
2 0 4
Feeling when sponsorship announced?
All seven gave positive responses, including “I was proud”, “I thought good for ATB”, “it gets our name out there”, “my reaction was wow”, “it was good cause; I could get tickets myself’.
Feeling around office when sponsorship was announced?
Mixed, including “I thought it was more for Edmonton branches”, “I think they ail thought it was good.. .but the only thing I find is that we don’t get enough notice to get tickets to make arrangements for people”, “overall feel was good but not everybody got to invite clients”, “I never heard anything negative”
Were you aware that ATB had a staff discount ticket program?
Yes-5 N o - 2
Did you take advantage? No one did (but two indicated they tried but were too late to get tickets)
Was it popular with employees? Mixed, including “I think so”, “I have no idea”,“Many people went”, “Unsure”, “Didn’t get feedback”
Post-event - do you feel it was a good marketing initiative?
Yes - 7 No- 0
Is this general consensus? Yes - 6 No - 1 - although one said “most don’t care but ya”
Did sponsorship make you proud?
Yes - 6 No - 1 - including: “Absolutely”, “ya, I take great pride whenever I see the organization involved in important events, particularly events that put the city and the province. And that was a world class event, it was great.”, “my friends know where I work so ya”
Did sponsorship raise employee morale around the office?
Most responses indicated that the sponsorship had little effect on raising employee morale around ATB offices, including: “No”, “I don’t know”, “I don’t think out in branch-land but in head office probably”, “Really, it didn’t make much of a difference, just another promotion”, “Not where I work”
Data Collection Exercise #7: Employee Ticket Sales and Discounts: This exercise
is a second protocol related to the internal marketing objectives of ATB (employee
motivation (#8) and employee pride (#14) in ATB) and seeks to measure the
effectiveness of the employee ticket program in this regard. In order to assess the
effectiveness of this program, the results were tracked by ATB and provided to the
researcher. One-hundred-fifty tickets were sold at a 20% reduction off the posted ticket
price. The tickets were allocated (sold, used for prizing, given away) very quickly (three
Reproduced with permission of the copyright owner. Further reproduction prohibited without permission.
2 0 5
days following announcement) and demand was “significantly” higher than supply
(Rudan, 2006c). Tickets ordered included 47 Gold, 24 Silver, and 79 Bronze. Of those,
41 Gold, 18 Silver and 33 Bronze were purchased by employees; 40 Bronze were used
for prizing (internal ATB) and 6 Gold, 6 Silver and 6 Bronze were given away
(destination uncertain). In addition, the EGP provided seven paddock passes to ATB,
two of which were given to employees. The paddock passes were “good ground seats for
all three days but not a private suite pass” (Kelly Rudan, 2006a). As noted above, several
of the post-event employee interviews (see data collection exercise #6 above) reported on
how well this program worked.
Data Collection Exercise #8: Post-Event Expert Interviews/Reports-. As part of
the metrics to measure objectives related to the development of long-term partnerships
and sponsor servicing (#15, #16, #17, and #19), a second set of post-event interviews
were completed with key ‘experts’ from both the sponsor and the sponsee side of the
sponsorship. The expert interviewees included:
1. Lisa McKillop (in-person), Marketing and Community Relations, ATB, worked
directly on sponsorship
2. Candice Sperling (by phone), Marketing Manager, MasterCard, contact for
sponsorship
3. General Manager (by phone), Edmonton Grand Prix
4. Kathie Arychuk (by phone), Manager of Community Relations, ATB
5. Kelly Rudan (in-person), Marketing Manager, ATB Investor Services, lead on
sponsorship
6. Jade Tan (in-person), In-House Research Professional, ATB
Reproduced with permission of the copyright owner. Further reproduction prohibited without permission.
2 0 6
7. Sponsorship Consultant (by phone), Edmonton Grand Prix
The interviews were carried out either in-person, on the phone or via email. Based on the
responses to the questions, the interviews ranged from a short email or a 10 minute phone
interview to interviews that lasted over an hour. All were recorded and transcribed.
Questions were scripted for each interview based on the individual’s role.
Given the unique nature of each interview, details of the results are not presented
here. Results will be reported under the analysis of each objective where the relevant
interview fits.
6.2.1.6.1.1 Additional Information Gathered
In addition to the eight protocols described above, additional information was
collected as follows:
1) EGP officials provided final and official attendance figures of: Friday: 47,932,
Saturday: 59,538, Sunday: 63,921, and Total: 171,391.
2) Calgary Urban Strategy - Rudan (2006c) reported on ATB’s successful strategy to
increase market share through sponsorship of the Calgary Stampede and how this
strategy spawned the idea of working with the EGP in Edmonton. Tactics included
official sponsorship, large displays in 4 downtown branches, a Stampede breakfast
with showpiece car, hand-out cards in downtown core over lunch hours, and regular
displays/promotions in suburban branches.
3) Media Buy - ATB’s media buy totaled approximately $71,600 which included the
following:
Reproduced with permission of the copyright owner. Further reproduction prohibited without permission.
2 0 7
a) $27,500 for considerable newspaper coverage (ads, publicity and contest
information from June 12 to July 20,2006) in the Edmonton Journal and a few
TV spots (60 second driver profiles presented by ATB) plus some pre-promotion
on Global Edmonton.
b) $15,600 for newspaper coverage in the Edmonton Sun, St. Albert Gazette, St.
Albert Saint CityNews, Sherwood Park News, Leduc Representative, Spruce
Grove Examiner and the Stony Plain Reporter.
c) $2,700 for online coverage at www.EdmontonJoumal.com and
www.EdmontonSun.com.
d) $ 18,000 for extensive radio coverage on 4 major Edmonton stations (CISN,
CFBR, CKNG, CFCW)
4) ATB Race Week T-Shirts - $5,852 was spent on T-shirts for ATB staff in Edmonton
and area branches to wear the week before the race.
5) Road Show - $500 was spent to have a race car in Calgary to promote the
sponsorship.
6) Alberta National Resources Show - originally part of the sponsorship, this was
cancelled pre-event because “not enough companies were interested” (Rudan, 2006a).
7) “Money Can’t Buy Packages” were awarded through customer contests (three on the
microsite and one by MasterCard) using an enter-to-win lottery. The package
included a pace car ride and a gold level ticket package. The MasterCard package
was awarded via a random draw where every person who signed up for or used their
MasterCard was eligible (Rudan, 2006a).
Reproduced with permission of the copyright owner. Further reproduction prohibited without permission.
2 0 8
8) In conjunction with Kelly Rudan (2006a; 2006n), a basic segmentation of ATB
employees was carried out, identifying the following segments:
a) ‘Frontline staff (approx. 1000 people) - those who deal with customers or seek
new business
b) ‘Support staff (approx. 1650 people) - administrative, channel administration,
technical and behind-the-scenes support in branches and central offices
c) ‘Finance staff (approx. 200 people) - those who advise on financial matters,
carry out complex financial transactions or manage lending programs/accounts
d) ‘Branch managers’ (150) people) - individuals responsible for the overall
direction and operation of individual branches
e) ‘Head office staff (approx. 500 people) - functional area employees (marketing,
HR, operations, legal, etc.) who work out of head office
9) National TV spots - these were included in early versions of the sponsorship contract
(pre-signing), however were removed prior to signing. About 2 weeks prior to the
race, the EGP mentioned to ATB that some ‘unsold’ spots remained and they would
run the ATB spot. However, formatting and delivery issues prevented it from ever
being developed (Rudan, 2006c).
6.2.1.6.2 Data Analysis: Objectives
The following section is comprised of 21 sub-sections, one per objective, which
describes the analysis of each objective and the method that was followed.
Objective 1: ATB Customer Acquisition - Edmonton Residents: The metric
developed to assess Objective 1 was designed to estimate the effects of the EGP
Reproduced with permission of the copyright owner. Further reproduction prohibited without permission.
2 0 9
sponsorship on customer acquisition for ATB, where customer acquisition includes both
new customers and increased business from current customers (assumed to mean transfer
of business from other FIs). The metric is a three-stage approach: (i) survey data of
branch customers to ascertain the contribution of the sponsorship to changes (if any) in
reported customer activity, (ii) analysis of ATB internal data to track customer growth
and decline monthly, and (iii) any changes in the macro level data are multiplied by the
calculated attribution of the sponsorship to those changes (from survey data) in order to
estimate customer acquisition (or loss) due to the sponsorship.
A sample (n=l 11) of one Edmonton area branch is used to determine the effects
of the EGP sponsorship on branch customer acquisition. Within this sample, it was
determined that a smaller sub-sample of respondents (n=4, or 3.6%) had become ATB
customers in the months of July or August, 2006 and 11 others (or 9.9%) had increased
the amount of business with ATB in the same time frame. This total sub-sample of 15
respondents was considered to measure customer acquisition. Of the four new customers,
only 1 indicated that the EGP sponsorship had ‘at least some’ impact on the decision to
join ATB. Similarly, 2 of the 11 who indicated that they had increased their business
with ATB said that the EGP sponsorship had ‘at least some impact’ on that decision.
These respondents also indicated that other factors had ‘at least some’ impact on
their decisions to become ATB customers or increase their business with ATB. Table 49
(below) reports the frequency of these factors.
Reproduced with permission of the copyright owner. Further reproduction prohibited without permission.
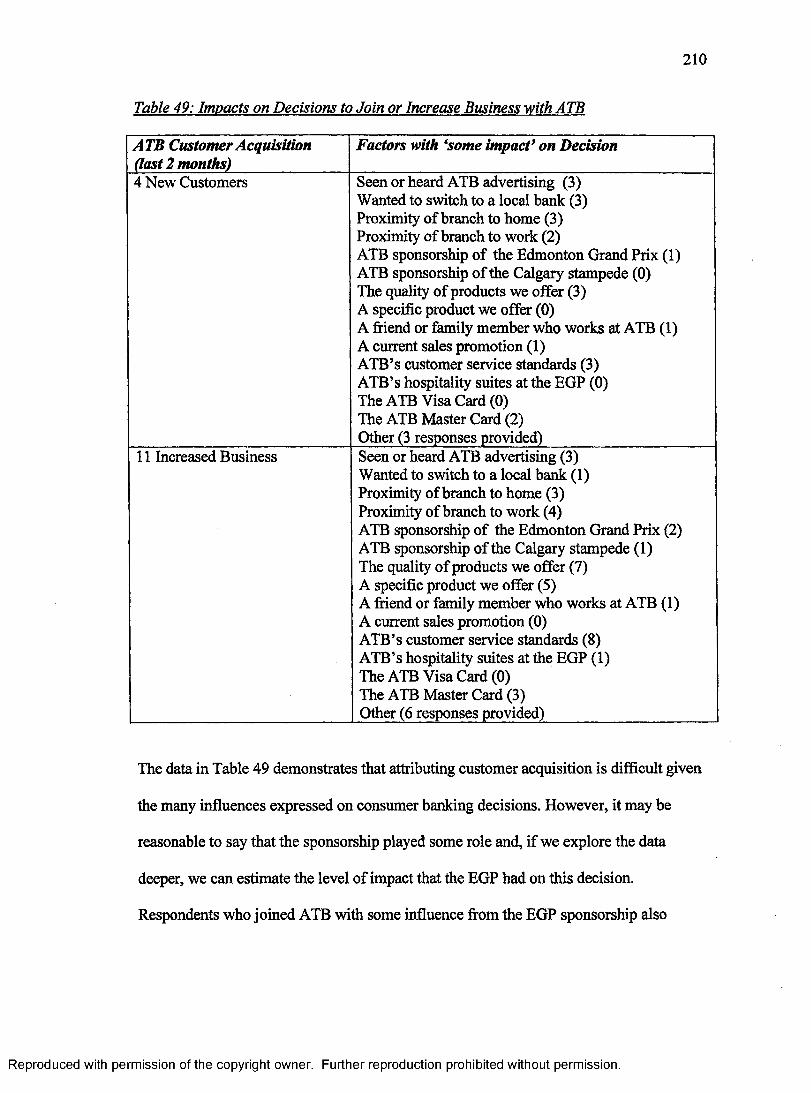
210
Table 49: Impacts on Decisions to Join or Increase Business with ATB
ATB Customer Acquisition (last 2 months)
Factors with 4some impact * on Decision
4 New Customers Seen or heard ATB advertising (3)Wanted to switch to a local bank (3)Proximity of branch to home (3)Proximity of branch to work (2)ATB sponsorship of the Edmonton Grand Prix (1) ATB sponsorship of the Calgary stampede (0)The quality of products we offer (3)A specific product we offer (0)A friend or family member who works at ATB (1) A current sales promotion (1)ATB’s customer service standards (3)ATB’s hospitality suites at the EGP (0)The ATB Visa Card (0)The ATB Master Card (2)Other (3 responses provided)
11 Increased Business Seen or heard ATB advertising (3)Wanted to switch to a local bank (1)Proximity of branch to home (3)Proximity of branch to work (4)ATB sponsorship of the Edmonton Grand Prix (2) ATB sponsorship of the Calgary stampede (1)The quality of products we offer (7)A specific product we offer (5)A friend or family member who works at ATB (1) A current sales promotion (0)ATB’s customer service standards (8)ATB’s hospitality suites at the EGP (1)The ATB Visa Card (0)The ATB Master Card (3)Other (6 responses provided)
The data in Table 49 demonstrates that attributing customer acquisition is difficult given
the many influences expressed on consumer banking decisions. However, it may be
reasonable to say that the sponsorship played some role and, if we explore the data
deeper, we can estimate the level of impact that the EGP had on this decision.
Respondents who joined ATB with some influence from the EGP sponsorship also
Reproduced with permission of the copyright owner. Further reproduction prohibited without permission.
211
indicated that 7 other factors affected that decision. Thus, if we assume that all factors
influence equally, one could infer that one eighth of new customer activity was inspired
by the EGP sponsorship. Similarly, the two respondents who increased their business
with ATB with some influence from the EGP sponsorship indicated that 7 and 9 other
factors, respectively, affected their decisions. Thus, one could infer that one ninth
(average of one eighth and one tenth) of all customers who increased their business were
inspired by the EGP sponsorship.
Examination or analysis of macro-level ATB internal data for the Edmonton
branch reveals an increase of 33 and 24 customers in the months of July and August,
respectively. Using the estimate calculated above, one could infer that 7 of these
customers (4 in July and 3 in August) resulted from the EGP sponsorship. Given the
average size of new accounts provided, it can be estimated that these customers bring
$63,614.22 in deposits and $153,898.83 in loans to ATB in the first month as new clients.
With respect to ATB customers who increased their business with ATB in the months of
July and August, there is no support for any impact of the EGP sponsorship as both
average deposits and average loan balances for the Edmonton branch did not show any
significant increase.
In summary, the metric for Objective 1 estimates an acquisition of 7 new
customers in the 2 months following the EGP sponsorship attributed to that sponsorship.
It also notes no change in increased business from current customers in that 2 month
period due to the sponsorship.
Objective 2: ATB Customer Acquisition - Calearv Residents: Objective 2 adopts
the same metric as Objective 1 but using a Calgary branch instead. Here, a sample of one
Reproduced with permission of the copyright owner. Further reproduction prohibited without permission.
212
Calgary area branch is used to estimate customer acquisition. As with Objective 1, the
metric involves a branch-level intercept survey (n=106) and internal sales data for the
branch. The sample assessed was comprised of those respondents (n=6, or 5.6%) who had
become ATB customers in the months of July or August, 2006 and those (n=l 1, or
10.4%) who indicated that they had increased the amount of business with ATB in the
same time frame. Of the six new customers, no one indicated that the EGP sponsorship
had ‘at least some’ impact on the decision to join ATB. Similarly, no one of the 11 who
indicated that they had increased their business with ATB said that the EGP sponsorship
had ‘at least some impact’ on that decision. Thus, no effect on customer acquisition was
found on the Calgary market. This finding lends credibility to the finding in Objective #1
related to customer acquisition in Edmonton.
Objective 3: ATB Customer Acquisition - Other Alberta Residents: Given that no
empirical data was collected at branches outside of Metropolitan Edmonton and
Metropolitan Calgary, an alternate metric for customer acquisition was developed for the
sample of Albertan residents outside of Edmonton and Calgary. Here, the metric involved
taking survey data from the micro-site web survey (for non-Edmonton, non-Calgary
residents only) to ascertain contribution of sponsorship to changes (if any) in customer
base and activity and estimating overall customer acquisition (or loss) due to the EGP
sponsorship based on any changes to the macro level (internally generated) ATB
customer data. A 3-month period is considered for this metric as the web survey was
implemented in early June.
Results from the micro-site survey were taken over a 43-day period prior to the
EGP but provide an estimate of the sponsorship’s impact on customer acquisition since
Reproduced with permission of the copyright owner. Further reproduction prohibited without permission.
2 1 3
respondents were attracted to the micro-site by promotions related to the sponsorship and
asked questions about the sponsorship. Of the 1937 respondents who indicated that they
were not ATB customers, 82 (4.2%) reported that the EGP sponsorship ‘significantly
increased’ the probability that they would switch from their current financial institution to
ATB. An additional 371 (19.2%) said the chances were ‘somewhat increased’ while the
majority (1469 or 75.8%) indicated ‘no change’ and a very small number (15 or 0.8%)
said that the chances were somewhat or significantly decreased. A related question that
asked respondents who were not ATB customers of their interest in visiting an ATB
branch in the near future provides supporting results. Of these 1937 respondents, 192
(9.9%) said ‘very unlikely’, 554 (28.6%) indicated ‘unlikely’, 799 (41.2%) said ‘maybe’,
272 (14.0%) indicated ‘likely’, and 120 (6.2%) said ‘very likely’.
From the internal data, it is observed that ATB saw an increase in number of
customers (+1577 customers) over the months of June, July and August 2006, with an
accompanying growth in average loan balances ($1278.11) and deposit balances that
were constant throughout the 3-month period. Although previous data was not available
for comparison, a senior ATB official noted that these increases were considerably higher
than typical trends in recent years (Rudan, 2006e).
If we assume that those who indicated ‘significantly increases’ are largely
motivated to switch to ATB due to the EGP sponsorship, we can infer that 66 new
customers41 were generated in Alberta by the EGP sponsorship. We also know that
51.7% of the sample came from outside of Calgary and Edmonton (this is the
geographical distribution of the overall survey population), suggesting that 34 new
41 The number 66 is calculated by considering that 82 respondents of the original sample of 1937 (or 4.2%) indicated ‘strongly increases’. Considering that 1577 new customers were added, 4.2% is 66.
Reproduced with permission of the copyright owner. Further reproduction prohibited without permission.
2 1 4
customers were generated outside Edmonton and Calgary. Using averages from the
internal data, this would infer $197,168.50 in first month household deposits and
$825,908.25 in first month household loans.
In summary, results for Objective 3 suggest that 34 new customers were acquired
due to the sponsorship, however - given that the estimate is based on a pre-event web
survey (as opposed to a direct, post-event survey of the target market), this result should
be considered a weak estimate at best.
Objective 4: Impact Key ATB Customers and Prospects'. The assessment of this
objective involves a metric developed to calculate how the hospitality suite impacted key
ATB customers and prospects. Given that ATB defines ‘key’ as the Top 1% of
customers, the best sampling opportunity available was the ATB hospitality suite at the
EGP. The metric involves the use of three sources of data: (i) surveys administered to
hospitality suite guests (invite-only) over the 3-days of the EGP, (ii) post-event
interviews with the suite hosts and (iii) a report, provided by ATB marketing, outlining
the invitee list and hospitality suite budget. These sources are combined to make an
assessment of cost per hit to impact key customers and prospects. Impact is measured as
satisfaction with the hospitality experience.
The Suite Host interviewees offered their opinions that attendee satisfaction was
very high with the event, the service, the food, the race car driver visit and the
atmosphere provided by ATB. One host noted that “three of those that attended called me
the next day and also sent thank you cards to me, it was very cool, they all had fun, it was
very worthwhile” (Suite_Host_2,2006). A relationship manager (who provided a client
with tickets to the suite but was not there himself) reported: “I spoke to my client and he
Reproduced with permission of the copyright owner. Further reproduction prohibited without permission.
2 1 5
was thrilled with the event. He said that he was looked after very well and he is a huge
race car fan, so it went over very well... [he also said that] the quality of the event was
truly stunning” (ATB relationship manager, personal communication, August 6,2006).
The survey of hospitality suite attendees (response rate = 39%) supported these
views with questions related to their satisfaction with the EGP experience. The majority
(76%) of attendees rated their overall EGP experience as ‘excellent’ and 97% said they
would come back next year if invited again. More importantly, 72% said they’d increase
their business with ATB and 100% reported that their experience at the EGP had
improved their overall opinion of ATB. Considering those respondents defined as
prospects (i.e., non-ATB clients), 71% expressed agreement that their experience could
lead to an increase in the amount of business they do with ATB. These findings may be
biased as surveys were administered in the midst of an enjoyable ATB activity.
ATB top clients and prospects were defined as the Top 1% of ATB customers and
a benchmark of household income greater than $100,000/year was used to determine if
guests were from the sought target. Results showed that 72% of attendees had a
household income greater than $100,000 while 21% between $60,000 and $100,000 and
7% under $60,000. This means that there were some individuals present who did not fit
the target market. ATB marketing personnel and the Suite Hosts led an assessment of the
allocation of spots in hospitality. The analysis was based on the fact that 75 total guest
places were available for the suite (25 places for each of three days). These 75 spots were
taken as follows: (i) 12 by ATB executives and their guests, (ii) 10 by ATB staff (non
executive) and their spouses, (iii) 48 by Guests (Top Clients & Prospects) and their
spouses, and (v) 5 by no-shows (all Friday). Given that the 48 guests were comprised of
Reproduced with permission of the copyright owner. Further reproduction prohibited without permission.
2 1 6
26 clients/prospects and 22 spouses, one could infer that the hospitality suite was for 26
targets. The total cost of the suite was $37,402.73, which included entertainment (suite
upgrade, food, drinks, ear plugs, invitations, race car driver visit) and gift bags (hats,
pens, cash giveaways, secondary prizing). If we divide this number by the 26 targets
attending, we can estimate a cost per target of $1,432.78. If we consider only those
Guests who meet the definition of Top 1% (i.e. household income greater than $100,000),
which was 21 of the 26 guests, the cost per target ratio goes to $1,781.08.
In summary, it is clear that the suite was a success in ‘impacting’ key targets and
top customers who were present. Noting that the number of true Top 1%
customers/prospects attending could have been higher, the cost per target to reach these
high-end customers is still low considering die size of the accounts and loans that these
individuals have or could have with ATB. The survey also found high levels of guest
satisfaction and a strong intent to increase business with ATB.
Objective 5: Increase Awareness that ATB exists: Awareness levels of the ATB in
Alberta were measured using questions included in the mass market survey of 500
Albertans. In measuring the effect of the EGP sponsorship on the awareness of ATB,
results from the mass market survey revealed that 16.4% (87 out of 500) of Albertans’
awareness of the products and services of ATB increased following the EGP sponsorship.
Of note, increases in awareness were similar across most demographic variables: (i) no
gender differences between male and female (t=.012), (ii) no difference between high and
low household income ($100,000 cut point for t=.507), and (iii) no difference between
Edmonton and Calgary (t=.456). There were some notable differences: (i) those under 55
years of age experienced significantly higher increases in awareness than those 55 years
Reproduced with permission of the copyright owner. Further reproduction prohibited without permission.
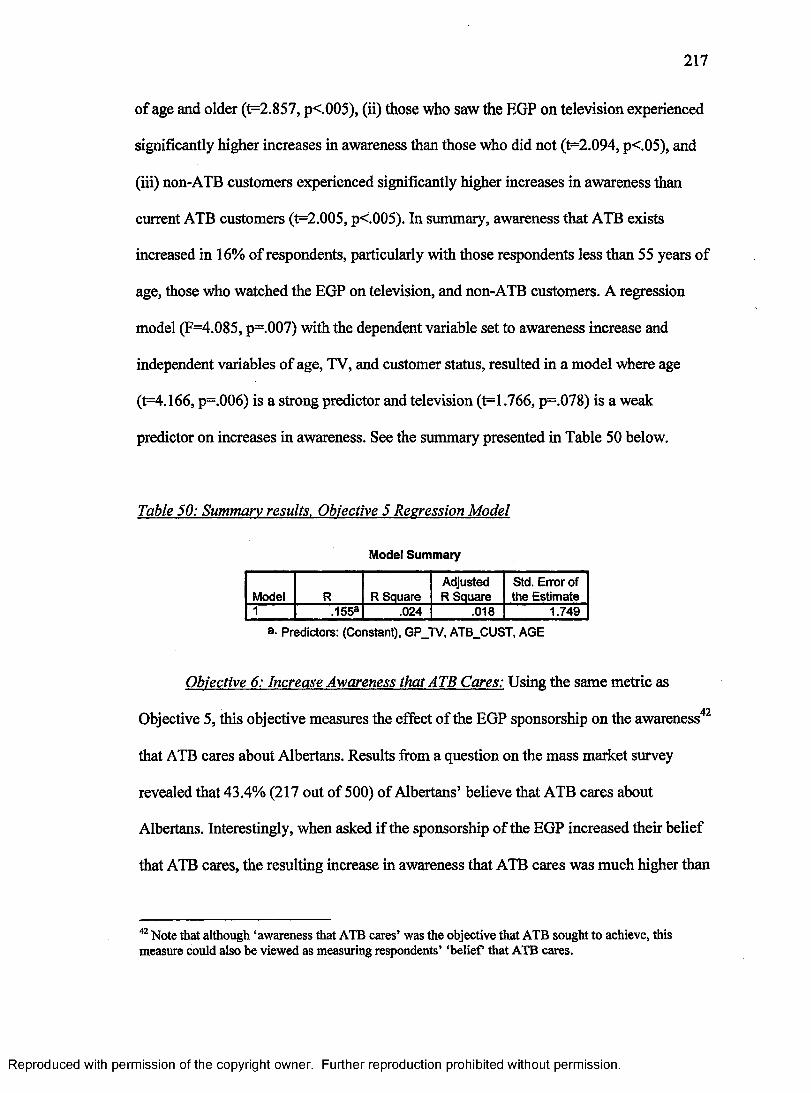
2 1 7
of age and older (t=2.857, p<.005), (ii) those who saw the EGP on television experienced
significantly higher increases in awareness than those who did not (t=2.094, p<.05), and
(iii) non-ATB customers experienced significantly higher increases in awareness than
current ATB customers (t=2.005, p<.005). In summary, awareness that ATB exists
increased in 16% of respondents, particularly with those respondents less than 55 years of
age, those who watched the EGP on television, and non-ATB customers. A regression
model (F=4.085, p=.007) with the dependent variable set to awareness increase and
independent variables of age, TV, and customer status, resulted in a model where age
(t=4.166, p=.006) is a strong predictor and television (t=1.766, p=.078) is a weak
predictor on increases in awareness. See the summary presented in Table 50 below.
Table 50: Summary results. Objective 5 Regression Model
Model Summary
Model R R SquareAdjusted R Square
Std. Error of the Estimate
1 ,155a .024 .018 1.749a- Predictors: (Constant), GP_7V, ATB_CUST, AGE
Objective 6: Increase Awareness that ATB Cares: Using the same metric as
Objective 5, this objective measures the effect of the EGP sponsorship on the awareness42
that ATB cares about Albertans. Results from a question on the mass market survey
revealed that 43.4% (217 out of 500) of Albertans’ believe that ATB cares about
Albertans. Interestingly, when asked if the sponsorship of the EGP increased their belief
that ATB cares, the resulting increase in awareness that ATB cares was much higher than
42 Note that although ‘awareness that ATB cares’ was the objective that ATB sought to achieve, this measure could also be viewed as measuring respondents’ ‘belief that ATB cares.
Reproduced with permission of the copyright owner. Further reproduction prohibited without permission.
2 1 8
the increase in awareness that ATB exists (Objective 5); in fact the difference is highly
significant (t=8.542, p<.001). In summary, there is strong evidence that the EGP
sponsorship was effective in increasing levels of awareness that ATB cares about
Albertans.
Objective 7: ATB — Improve Brand Prestige in Current Customers: ATB’s
objective to improve levels of brand prestige with current customers was measured using
the in-branch surveys (one Calgary branch and one Edmonton branch). A series of
questions sought to assess ATB’s brand prestige relative to other FIs and then evaluate
the impact of the EGP sponsorship on those levels. Of the 217 completed surveys, 160
respondents indicated that they were ATB customers, and as such they are the focus of
this objective. When asked to rate ATB’s brand prestige relative to other FIs, most
(70.6%) reported that ATB had very high (25.0%) or high (45.6%) brand prestige relative
to other FIs while 25% rated ATB as ‘average’ and only 1.8% expressed that ATB brand
prestige relative to other FIs was low or very low.
The sample of 160 ATB customers was then asked if their assessment of the
prestige of the ATB brand had increased in the past two months. Here, 20% (32) of ATB
customer respondents indicated that it had. These 32 respondents were then asked about
factors (aided recall but with 15 stated factors and ability to insert others) which led to
this increased opinion of ATB brand prestige in the past two months. In total, the 32
respondents identified 157 different factors. This represents an average of 4.9 mentions
per respondent with ‘ATB’s customer service standards’ being the most mentioned (29)
followed by the quality of ATB products with 22 mentions. ATB’s sponsorship of the
EGP was mentioned 12 times (tied for the 5th most mentioned factor), 3 more than the
Reproduced with permission of the copyright owner. Further reproduction prohibited without permission.

2 1 9
number of mentions about ATB’s sponsorship of the Calgary Stampede. Thus, for those
customers who noted an increase in brand prestige in the past two months, 37.5% (12 of
32) noted that the EGP sponsorship played a role. It is important to note the role that
branch location plays here, as analysis showed that Edmonton customers had a
significantly higher assessment of both ATB brand prestige (t=3.411, p<.005) and the
increase in ATB brand prestige the past two months (t=3.627, p<001) than Calgary
customers. These relationships may be due to the Edmonton location of the EGP.
Assuming an equal contribution of all 157 identified factors to the increased brand
prestige, we can estimate that the EGP sponsorship provided 7.6% (12/157) of the
rationale for the increased opinion of ATB brand prestige in those ATB consumers who
indicated such. Considering the overall sample of 160 ATB customers, it could be said
that the sponsorship of the EGP enabled an increase in brand equity opinion in 1 out of
every 66 ATB customers43. If we consider the differences between Calgary (Mean
response =1.10) and Edmonton (Mean response = 1.65), the ratio could be further
divided to 1 out of every 44 Edmonton-based ATB customers and 1 out of every 99
Calgary-based ATB customers.
In summary, results of this metric provide support that the EGP sponsorship had
an impact in improving ATB brand prestige in current customers, more so in Edmonton
than in Calgary, however.
Objective 8: ATB Internal Marketing (Motivate Staff)'. The metric for Objective 8
was developed in response to ATB’s interest in leveraging the EGP sponsorship to
43 This figure was calculated by dividing the number of respondents who felt that ATB’s brand prestige had improved over the past two months (32) by the total number or respondents (160). This figure was then multiplied by the ratio of ATB mentions to all mentions (12/157) to come up with the 1 in 66 figure (384/25120),
Reproduced with permission of the copyright owner. Further reproduction prohibited without permission.
220
motivate staff (i.e., internal marketing). Here, satisfaction is used as a proxy for
motivation. The metric was developed using three data sources: (i) the annual ATB
employee survey (provided by ATB), (ii) employee interviews and (iii) the employee
ticket program. It is noted that this metric is not ideal but given the realities of
permissions, it allows for an estimate of the effectiveness of the sponsorship. In addition
to the ticket program, ATB employees (20 in total) were also able to get involved by
volunteering for the Go-Kart track or MasterCard booths.
First, ATB’s annual employee survey (completed in January 2006) found that
most (91%) ATB employees believe that ATB is a good corporate citizen and the
majority (64%) considers it to be a good place to work. These results suggest that ATB
employees are satisfied with their work environment and believe strongly that ATB is
doing a good job as a corporate citizen. However, there remains a significant proportion
of staff (36%) who do not consider ATB to be a good place to work.
Second, results from the post-event employee interviews (Data Collection #6)
provide three important contributions. First, six of the seven interviewees believe that
ATB is a good place to work and all seven are satisfied with their employer. Two of the
interviewees, however, noted that they have colleagues who are not happy with ATB;
again showing that there is room for improvement. Also, with respect to the ATB-EGP
sponsorship, very mixed views were provided, ranging from high levels of support for the
sponsorship (three mentions by interviewees) to concerns about how the sponsorship was
leveraged with employees (five mentions by interviewees). Certainly, the expression of
these concerns notes that frustration as opposed to motivation may be what was achieved
in some employees. Finally, when asked to assess the impact of the sponsorship, no
Reproduced with permission of the copyright owner. Further reproduction prohibited without permission.
221
employee was able to assign a quantitative value, although all interviewees (seven of
seven) felt it was a good marketing idea and all but one (six of seven) indicated that they
believe that most employees felt this way. In responding to this question, two of the
interviewees reported that they believed that some employees felt it was an Edmonton-
centric event.
Third, the ATB employee-ticket program was analyzed. ATB’s Marketing
Manager described the program:
we are communicating via email and the intranet to our staff about the sponsorship, we are recruiting volunteers, and we are allowing a limited number of staff (via open call) to purchase the discounted tickets.. .on the MasterCard side, they are giving away tickets to staff who sign up the most new M/C customers. And, of course, our in-branch collateral is meant to start conversations between customers and staff to go to the microsite and sign up for the customer contest (Rudan, 2006a).
Although two of the seven employee interviewees were not even aware the program
existed, five of the interviewees knew of the program and responded that it was a
resounding success. Three respondents even suggested that it should be expanded in
2007. As outlined in Data Collection Exercise #7, the ticket program was a success with
demand far outreaching supply. The ticket program must also be considered from a
budget point of view as well. A cost of $21,167.02 was incurred by ATB to cover the
discounts provided to employees. Without an employee survey, it is not possible to assess
the cost/employee affected however, given the positive qualitative results generated, it is
reasonable to consider this a success. A few notes from employee interviews may help
with future sponsorships: (i) “I think they all thought it was good.. .but the only thing I
find is that we don’t get enough notice to get tickets to make arrangements for people”
(Employee, personal communication, August 1,2006) and (ii) “I thought I got in on it but
Reproduced with permission of the copyright owner. Further reproduction prohibited without permission.
222
they didn’t find my order.. .so then I would’ve had to get a regular one. I thought I had
Sunday” (Employee, personal communication, July 30,2006).
In summary, following the cancellation of the employee satisfaction survey, this
alternative measure was implemented. Objective 8 was measured indirectly using three
sources of data which provides support that the EGP sponsorship was generally effective
in employee motivation (i.e., positive employee interviews and the sold-out ticket
program), although the weakness of the measure must be noted.
Objective 9: ATB-Achieve Competitive Advantage: The ninth ATB objective
was to create a competitive advantage in Alberta. In other words, they were seeking a
way by which to differentiate themselves from their competition through reminding
Albertans that they are a bank for Alberta only. The mass-market survey of 500 Albertans
included a question to describe this. Specifically, respondents were asked if the fact that
ATB sponsored the EGP while other Albertan banks did not led them to consider ATB as
having an advantage over these other banks. Due to limits on the length of the
questionnaire, only one question was asked. More than one-half of the respondents
(51.2%) reported that they either strongly disagree or disagree that advantage was
achieved, a few (6.2%) said ‘do not know’, and a small portion (16.6%) said ‘neither
agree nor disagree’. This suggests that the sponsorship was not effective in achieving
competitive advantage for ATB. However, approximately one-quarter of respondents
were influenced positively (3.6% of respondents strongly agreed and 22.4% agreed that
advantage was achieved). Although these are relatively small percentages, some positive
effect must be noted for the sponsorship.
Reproduced with permission of the copyright owner. Further reproduction prohibited without permission.
Deeper analysis provides more insight into those who do believe advantage was
achieved. First, Edmonton respondents ranked the ability of the EGP to provide
competitive advantage significantly higher than did Calgary respondents (t=2.122,
p<.05). Second, respondents who had previously watched an entire Indy or CHAMP car
race on television (some level of fandom) ranked the ability of the EGP to provide
competitive advantage significantly higher than respondents who had not (t=2.008,
p<.05). Finally, and interestingly, respondents who were ATB customers ranked the
ability of the EGP to provide a competitive advantage lower (with weak significance)
than respondents who were not previously customers (t=1.528, p<.l). Thus, one could
infer that people who were not ATB customers, who live in Edmonton, and who are fans
of auto-racing were most influenced.
Objective 10: Establish ATB as major vlaver in Alberta banians - with
Customers: An additional ATB objective stemmed from the organization’s goal to
become a major player in the Alberta banking industry. Although this is similar in nature
to achieving competitive advantage, it was articulated as a distinct goal by ATB as they
believe that achieving competitive advantage through the sponsorship and being viewed
as a major player in the banking market with customers and non-customers are not the
same (Rudan, 2005b). Thus, the metric for measuring this objective involved survey
questions specific to this objective in order to assess any increase in the number of
current ATB customers who believe that ATB is a major player in the market. This was
implemented using questions on the in-branch customer surveys (Edmonton and Calgary)
and the pre-event microsite online survey (Albertan customers outside of Edmonton and
Calgary).
Reproduced with permission of the copyright owner. Further reproduction prohibited without permission.
2 2 4
With respect to ATB customers outside of the two major Albertan cities, the pre
event survey of ATB customers showed that 1675 of the 1787 (or 93.7%) non-Calgary/
non-Edmonton respondents believed (yes or no question) that ATB is a major player in
the Alberta banking market. Further analysis showed that those (n=l 578) who believed
that ATB’s sponsorship of the EGP significantly increased or somewhat increased their
opinion of ATB were significantly more likely (t-4.243, p<.001) to note that ATB is a
major player in the market than those who noted that the sponsorship had no effect
(n=1896) or a decreasing effect (n=10) on their opinion of ATB. This suggests, albeit
imperfectly, that the EGP sponsorship played a role here.
In terms of the Edmonton and Calgary customers who were queried via the in
branch surveys, the majority (65.5%) felt that ATB was already a major player in the
Albertan banking market. Specific to the sponsorship, respondents were then asked if
they believed that ATB’s importance in Alberta’s financial services industry had
increased in the last two months. For the ATB customers (n=162) in the sample, 57
(35%) believed it had, 76 (47%) said no and 29 (18%) did not know. Consistent with
previously reported results, respondents from Edmonton ranked ATB as a major player
significantly more frequently (weak significance) than respondents from Calgary
(t=l .630, p<.l); once again suggesting the importance of the EGP in Edmonton. In total,
the 57 respondents (31 from Edmonton, 26 from Calgary) mentioned 304 factors that
influenced the increase in their support of ATB’s importance in the FI sector the past two
months. Of these mentions, ATB’s customer service standards (50), ATB being Alberta-
only (49), and the opening of new branches (26) were the most frequent, while the
sponsorship of the EGP was the 4th most mentioned factor with 23 mentions (15 from
Reproduced with permission of the copyright owner. Further reproduction prohibited without permission.
2 2 5
Edmonton, 8 from Calgary). If the influence of the EGP sponsorship is considered in the
context of the 304 overall factors, one can estimate that the EGP sponsorship was
responsible for 7.5% of the increase in the importance of ATB in the Albertan market
over the two month period following the EGP sponsorship. Cross-tabulations revealed
that two individuals exist in the sample of 162 ATB customers who (i) originally reported
that ATB was not a major player in the Albertan banking market, (ii) then indicated that
ATB’s importance had increased in the past two months and (iii) noted that the
sponsorship of the EGP was one of the reasons for their increased view of ATB’s
importance. Although this is a small number, it does demonstrate some success here.
In summary, the analysis of Objective 10 shows that the EGP sponsorship was
responsible for an estimated 7.5% of the increase in opinions of the importance of ATB
in the customers from Edmonton and Calgary, although response in Edmonton was
significantly higher. Results from outside of Edmonton and Calgary were also positive
with over 93% indicating that they feel that ATB is a major player in the Albertan FI
market, although the impact of the sponsorship on this figure is uncertain.
Objective 11: Establish ATB as major vlccver in Alberta banking - with Non-
Customers: ATB also sought to increase their position as a major player in the Albertan
market with non-customers. This method looked at non-customers and their belief that
ATB was a major player in the market. It was measured by asking Albertans (via
questions on the mass market survey) if they believed if that the ATB sponsorship of the
EGP helps demonstrate that ATB is a major player in the Alberta banking market. Of
non-customers (n=413), 63.7% agreed (227) or strongly agreed (36) that the EGP
sponsorship was a factor in establishing ATB as a major player in the Alberta banking
Reproduced with permission of the copyright owner. Further reproduction prohibited without permission.
2 2 6
market. Further analysis of non-customers revealed that some groups were more likely
than others to report that the EGP sponsorship helped demonstrate that ATB is a major
player: (i) those under 45 years of age (t=2.035, p<.05), (ii) those who were unable to
correctly identify ATB as ‘a full-service province wide Albertan financial institution’
(t=3.963, p<.001), (iii) those who had watched the EGP on TV (t=1.848, p<.l), and (iv)
those who could be called fans (i.e., had previously watched an entire car race on TV)
(t=2.094, p<.05). Notably, no difference in Edmonton versus Calgary (t=.456) is found
here. The influence of the EGP sponsorship was greater in those young (under 45) non
customers who were fans of auto racing, who saw the event on TV, and who previously
were uncertain of the scope of ATB’s operations.
Objective 12: Re-Brand ATB as Full Service Financial Institution - with
Customers: ATB also sought to use the EGP sponsorship as a means to re-position from a
rural bank to a full service financial institution with its customers. The metric uses data
from both the pre-event online surveys (customers outside of Calgary and Edmonton) and
in-branch, post-event questionnaires (Calgary and Edmonton based customers).
For customers in rural or small city Alberta, the pre-event online survey included
a two part question. Respondents were first asked to select which of the following best
describes ATB Financial: ‘a full-service Albertan bank’, ‘a Canadian bank from coast-to-
coast’, ‘a small town Albertan bank’, ‘an urban banking institution with branches in all
major Canadian cities’, ‘a British Columbia bank expanding into Alberta’, or ‘none of the
above’. The desired response ‘a full-service Albertan bank’ was provided by 82.9% of
the sample demonstrating a high level of awareness of a key aspect of the ATB brand.
The most undesirable response (‘a small town Alberta bank’) was the next most common
Reproduced with permission of the copyright owner. Further reproduction prohibited without permission.
2 2 7
selection at 6.8%. The remaining 10.3% either expressed that they did not know or
responded with an incorrect answer. Respondents were then asked if the fact that ATB
had decided to sponsor the EGP had changed their response to the question. Here, the
vast majority (94.1%) of ATB customers outside of Edmonton and Alberta believe that
the EGP sponsorship had a limited effect in changing their reported opinions. Further
analysis, however, reveals that the EGP sponsorship significantly influenced two groups
of respondents to change their response to the question more than those who had
provided the desirable response; namely those who previously defined ATB as a small
town Albertan bank (t=7.614, p<.001) or those who described ATB as a Canadian bank
from coast to coast (t=2.014, p<.05).
The in-branch surveys also enabled an analysis of Edmonton and Calgary based
ATB customers. This metric involved a three stage question; one asking if the EGP
sponsorship improved the prestige of the ATB brand, one asking if sponsoring the EGP
helped demonstrate that ATB is a rural financial services institution and the other asking
if sponsoring the EGP helped demonstrate that ATB is a financial services institution for
all Albertans. Results here support the view that the EGP sponsorship was able to
influence knowledge of the ATB brand. Analysis of the first question revealed that 72 (or
45%) of ATB customers either strongly agreed or agreed that the EGP sponsorship
helped increase the ATB brand while only 16 (10%) disagreed or strongly disagreed.
Descriptive results from the second question demonstrate that customers appear to view
ATB as a rural financial services institution (which is opposite to what most non
customers thought in Objective 11), as 69 (43%) of ATB customers either strongly agree
or agree that the EGP sponsorship helped demonstrate that ATB is a rural FI while 30
Reproduced with permission of the copyright owner. Further reproduction prohibited without permission.

2 2 8
(19%) disagreed or strongly disagreed. Results from the third question show that 85
(53%) of respondents agree or strongly agree that the EGP sponsorship helped
demonstrate that ATB is a FI for all Albertans, with only 19 (12%) in disagreement. A
correlation matrix was run with all three questions and the relationships between each of
the variables was found to be significant (p<.01) indicating a similarity of responses
between the three questions. The details are presented in Table 51 below.
Table 51: Correlation Matrix: Objective 12 Questions
Correlations
EGP SP on ATB brand
EGP SP = rural FI
EGP SP = for all Albertans
EGP SP on ATB brand Pearson Correlation 1 .484** .531*Sig. (2-tailed) . .000 .000N 217 217 217
EGP SP = rural FI Pearson Correlation .484** 1 .687*Sig. (2-tailed) .000 .000N 217 217 217
EGP SP = for all Albertans Pearson Correlation .531** .687** 1Sig. (2-tailed) .000 .000N 217 217 217
**• Correlation is significant at the 0.01 level (2-tailed).
A data reduction (principal component analysis) was then run on data related to the three
questions with the first question (Eigen value = 2.259) found to explain 75.3% of the
variance and thus being selected to represent the three questions for further analysis.
It is important to note two issues around the data generated by this group of
questions. First, in all three cases, there were high numbers of respondents who indicated
‘Don’t Know’ perhaps indicating difficulty in understanding the questions or the
challenge of attributing a promotion to a brand. Second, there were a number of
contradictory responses including 11 respondents who noted ‘strongly agree’ that ATB is
Reproduced with permission of the copyright owner. Further reproduction prohibited without permission.
2 2 9
both a rural FI and a FI for all Albertans. This could be due to a lack of customer
knowledge of the ATB brand or the wording of the questions where the first question
may have been construed to mean that ATB provides services to rural Albertans but not
necessarily only to rural Albertans.
In summary, all three (correlated) questions suggest that the EGP sponsorship
played a role in re-branding ATB as a full service FI; particularly effective with non
customers outside of Edmonton and Calgary who previously lacked knowledge about the
ATB brand and with 45% of customers in both Edmonton and Calgary.
Objective 13: Re-Brand ATB as Full Service Financial Institution - with non-
Customers: The rationale for Objective 13 is the same as Objective 12 except that the
target is non-ATB customers. This is measured primarily using data from the mass-
market survey of 500 Albertans (n=413 non-customers), with supporting data from the
non-ATB customers (n=57) who responded to the in-branch survey.
Respondents to the mass market survey were asked to respond to the following
questions after being made aware (aided recall) that ATB was a sponsor of the EGP:
“when I think of ATB Financial, I think of a rural Alberta financial institution” and
“when I think of ATB Financial, I think of a full-service, province wide financial
institution”. For the first question, a balanced distribution of opinions was found with 21
strongly disagreeing, 155 disagreeing, 156 agreeing and 17 strongly agreeing. However,
for the second question, results for ATB as a full-service FI are very strong as 72.5%
(298) of non-customers agree or strongly agree. A paired samples comparison of means
between the two questions showed a strongly significant difference (t=8.852, p<.001)
Reproduced with permission of the copyright owner. Further reproduction prohibited without permission.
2 3 0
between the two questions supporting that ATB’s brand is recognized as they would like
(i.e., as a foil service FI) and not as a rural bank.
Further evidence of the effectiveness of the EGP sponsorship on the re-branding
of ATB is provided by the 56 respondents of the in-branch surveys who indicated they
were not customers of ATB. First, 26 (or 46%) noted that they are likely to open an ATB
account in the near future where 19 of the 26 (73%) either agreed (11) or strongly agreed
(8) that sponsoring the EPG improved the prestige of ATB’s brand.
Objective 14: ATB Internal Marketine (Build Employee Pride): Following the
cancellation of the employee survey by ATB, this objective was measured in the same
way as Objective 8 (employee motivation). The identical metric and analysis is used (see
Objective 8) which found that the EGP sponsorship was effective in increasing employee
motivation (i.e., positive employee interviews and the sold-out ticket program).
Objective 15: ATB-Assess Sponsorship Effectiveness: An objective of this
sponsorship for ATB (and one of the reasons it came to be a part of this dissertation) was
to evaluate the sponsorship as a promotional activity to support future business decisions.
The fact that this evaluation was undertaken responds to this objective.
Objective 16: EGP-Revenue Generation: The objective of revenue generation to
support the operation of its event was of primary importance for the EGP. The metric
adopted here is an analysis of the budget and EGP marketing plan. First, it is noted that
ATB agreed to a 2-year contract at the set fee of $410,000 to be a gold sponsor of the
event in 2006 and 2007. This met the EGP’s revenue generation objective for a gold
sponsor (Edmonton Grand Prix General Manager, 2006). The fact that ATB spent
considerable additional resources (approximately $240,000) and energy leveraging the
Reproduced with permission of the copyright owner. Further reproduction prohibited without permission.
231
sponsorship in 2006 considered by the Executive Director of the EGP to be “a very
positive advantage” (Edmonton Grand Prix General Manager, 2006).
Objective 17: EGP - Develop Lone-Term Partnerships'. The EGP clearly
articulated its desire to build long-term partnerships as a key objective in its sponsorships.
In the case of the EGP-ATB sponsorship, this was assessed qualitatively using post-event
interviews with key people in both organizations. A series of questions around the
relationship were asked including satisfaction, objectives, issues, and servicing.
On the EGP (sponsee) side, interviews were conducted with the two individuals
responsible for the sponsorship: (i) EGP General Manager, and (ii) EGP Sponsorship
Consultant for the event, on August 1,2006. The General Manager overseas all
operations of the EGP including the contract negotiations with ATB (Edmonton Grand
Prix General Manager, 2006) while the Sponsorship Consultant was contracted by the
EGP to manage and service all EGP sponsorships, including ATB. She outlined her role:
“I am the primary sponsorship liaison for all sponsors...I was the primary contact working
on the deliverables promised [to ATB]” (Edmonton Grand Prix Sponsorship Consultant,
2006).
On the ATB (sponsor) side, interviews were carried out with all ATB staff
involved with the sponsorship including five (5) marketing staff, three (3) suite hosts,
seven (7) employees and two (2) MasterCard representatives. All were conducted in the
two week period following the event (July 24 to August 7,2006) by telephone. The
details and questions posed are outlined in Data Collection Exercises #5 and #8. Given
the sensitive nature of the comments, the identities of the interviewees are kept
confidential and, thus, their comments are not referenced in the following paragraphs.
Reproduced with permission of the copyright owner. Further reproduction prohibited without permission.

2 3 2
Interviewees from both sides reported satisfaction with the sponsor-sponsee
relationship with some significant concerns expressed. The majority of the concerns were
expressed by representatives of the sponsor, particularly with respect to EGP’s attention
to the deliverables promised in the contract and ATB’s onsite needs. For example, one
interviewee commented that “they [EGP] performed at 70-80% of my expectations” and
another similarly acknowledged that “we [ATB] got about 70 or 80% of the attention that
we should o f’ and when pressed to explain said:
They [EGP] were generally very disorganized. So, it took quite a while to get answers from them.. .it felt a little like babysitting. You know, signage was put up late, booth locations were not what we wanted, that kind of stuff. So, it took a lot of extra effort on our part to get what we needed. It wasn’t really a well oiled machine.. .in the end we were generally happy but we had to work harder [than expected] to get what we needed.
Another ATB interviewee responded similarly: “...there were things that they [EGP]
didn’t come through with but overall they provided what we agreed upon and did a pretty
good job, so I’d probably say about 85% [performance on EGP’s role in the
sponsorship].” One interviewee summarized “I think that there were probably two or
three sort of gaps that could have been avoided.” When pressed to identify the problems,
some interviewees refused while others eventually explained the issues. First, “there was
a problem with family zone.. .logistic problem that they ran in to”. When asked to
explain, the interviewee responded that:
we were informed before that the family fun zone would include the rides and be an alcohol free area with all family stuff BUT it turned out that there was a beer tent beside and all rides were far away.. .so, I think we lost a lot of traffic from the Go-Kart track. It ended up being kind of a Go-Kart track with a few people around drinking beer. And, they’d committed to us that’d we’d be part of family fun zone.
Reproduced with permission of the copyright owner. Further reproduction prohibited without permission.
2 3 3
Second, three of the ATB interviewees mentioned signage; notably the lack of providing
the committed signage, while another noted the lack of delivery on a promised television
broadcast. Third, many stressed communication issues and the difficulty as the event
approached in getting calls returned and deliverables acted upon. For example, one noted
“I felt sometimes that we weren’t necessarily the top of the list... .often what was agreed
on, wasn’t happening or wasn’t happening as was planned” while another reported that
“Our contact at the Grand Prix seemed to have a lot of other things on the go and until
crunch time we got 75% attention from EGP but when it came to crunch time.. .it became
more like 50% of that, if that high.”
When the EGP interviewees were asked by the researcher to respond about any
problems with their relationship with ATB, the EGP General Manager (2006) reported no
problems and the EGP Sponsorship Consultant (2006) responded:
...we had a great relationship. I do apologize for one thing.. .that being the broadcast tape.. .that is just a learning curve from my end dealing with computers and things like that until the race.. .working through webmail and getting messages. I think everything else went smoothly.
After indicating that she felt that the event was a success and that she felt that she had
enough resources to deal effectively with 25 sponsors, the EGP Sponsorship Consultant
(2006) provided her opinion on whether the ATB sponsorship was a success or not: “I
hope it was. It is difficult for me to say as I wasn’t part of negotiation side as I don’t
know what was promised and what was expected.” She felt that ATB signage was high-
quality and well-displayed, that the Go-Kart track was very effective, and that ATB
people onsite were well trained and friendly. Her only recommendation was that ATB
needed to do more onsite promotion of the sponsorship to get the message out more to the
Reproduced with permission of the copyright owner. Further reproduction prohibited without permission.
2 3 4
people on site. When asked about the EGP side of the relationship and what could have
been done differently, she indicated that:
I found that everything was delayed - especially from our end - due to the temporary site.. .1 think that having a year under their belts and having more time to work through the program and take advantage of it should be better. Trying to rush a program through in 4 months was tough”(Edmonton Grand Prix Sponsorship Consultant, 2006).
When asked for specific recommendations, she provided a few: (i) “I would comment
that they should include something with ticket mailers (gets recognition upfront)”, (ii)
“[they should be] having more people roaming the site and reinforcing the brand”, and
(iii) [they need] more 1 on 1 interaction with customers (Edmonton Grand Prix
Sponsorship Consultant, 2006). Finally, she was asked about how the EGP Board of
Directors felt about the current relationship with ATB. She indicated that “they are
happy with ATB as a sponsor and the sponsorship programs that they
[implemented]...they are happy with any sponsor who does activate and co-promote and
they definitely feel that the ATB brand is a good fit” (Edmonton Grand Prix Sponsorship
Consultant, 2006).
In summary, it is obvious that both sides view the relationship with concern and
identified a number of issues (communication, delivery of promises, leveraging, etc.)
which need to be resolved. However, it certainly appears that both sides are committed to
improving the relationship in the future. Many of these concerns were viewed to be
relatively minor in nature. Also, the Sponsorship Consultant (2006) pointed to the fact
that ATB is one of many EGP sponsors. Further, the EGP representatives (Edmonton
Grand Prix General Manager, 2006; Edmonton Grand Prix Sponsorship Consultant,
2006) commented that ATB was not a title or presenting sponsor which meant they were
Reproduced with permission of the copyright owner. Further reproduction prohibited without permission.
2 3 5
not top priority, however they reported that they would improve the sponsor servicing in
the future towards building a long-term relationship with ATB.
Objective 18: EGP - Build an affinity44 with Alberta Market ('through ATB
association): One of the key reasons why the EGP was interested in the ATB as a sponsor
was its ability to provide an Alberta-focused message through the sponsorship
(Edmonton Grand Prix General Manager, 2006). This was then translated into an
objective for the EGP and was measured via two questions on the mass market survey.
The first question asked if the respondent believed that the fact that ATB was a sponsor
of the EGP made them prouder that the event is hosted in Alberta, while the second asked
respondents if learning that ATB was sponsoring the EGP increased their belief that ATB
cares about Albertans. On the first query, 48.8% either agreed or strongly agreed, while
22.8% disagreed or strongly disagreed. For the second question, a similar result was
achieved with 43.4% either agreeing or strongly agreeing, while 29.2% disagreed or
strongly disagreed. In fact, responses to the two questions were significantly correlated
(r=.517, p<.01). In both cases, evidence is provided that the sponsorship had some effect
on the EGP objective of building an affinity with the Alberta market.
Deeper analysis provides limited additional insight into Albertans’ affinity with
the event as no influencing variables had an significant impact other than the fact that
fans (those who had watched an entire car race previously on TV) believed more than
non-fans (t=T .939, p=.053) that the sponsorship increased their pride that the EGP is held
in Alberta. A similar difference (t=2.047, p<.05) occurred with the ‘care’ question. Thus,
in summary, there is support that the sponsorship had an influence on increasing
44 ‘affinity’ here refers to attachment between the EGP and Albertans
Reproduced with permission of the copyright owner. Further reproduction prohibited without permission.
2 3 6
Albertans’ affinity with the event (via pride and care constructs) with an enhanced effect
on those who were already fans of auto racing.
Objective 19: Effectively Service Sponsors: This objective is measured in a similar
fashion to Objective 17 where, post-event, representatives of both the sponsor and the
sponsee were interviewed to assess the relationship between ATB and the EGP. One
aspect of this relationship is the servicing provided by the sponsor (EGP) to the sponsee
(ATB). As noted in Objective 17, interviewees from ATB noted some problems with
communication and service; which was also supported by one EGP interviewee. One
particular question in those interviews asked respondents to evaluate the service provided
by EGP to ATB, where three ATB interviewees responded that service was 70-80% of
expectations.
Objective 20: Customer Acquisition (MasterCard Onsite Sisn-up): During the
event, there were 4 MasterCard booths with volunteers (ATB associates) circulating
around the event grounds seeking to sign people up for ATB MasterCard. Provided they
completed a form, the respondents received a giveaway t-shirt. Maximizing the number
of complete sign-ups was an important objective for ATB MasterCard.
ATB MasterCard officials provided the results of the sign-up campaign at the
event. Over the course of the 3-day event, 699 people had signed up for a MasterCard,
52% of who were eventually approved for a card (i.e. 364 individuals). If we consider
this in the context of their budget, we can calculate the cost per sign-up and the cost per
sign-up leading to approved cardholder (i.e., potential new customer). The total cost to
MasterCard for the sponsorship was $123,839 (or $85,000 fee plus $38,839 leveraging).
Dividing by the number of sign-ups (699) and approved cards (364) gives a cost per sign
Reproduced with permission of the copyright owner. Further reproduction prohibited without permission.
2 3 7
up of $177.17 and cost per approved cards of $340.22. MasterCard representatives noted
that this is an acceptable figure for them (Sperling, 2006).
ATB MasterCard also sought to acquire customers through the promotions
launched on the pre-event microsite where it was noted that 869 visitors to the microsite
did click on the link to the ATB MasterCard webpage. No tracking was done to
determine if any of the 869 became cardholders. Further, MasterCard representatives
verified that two additional EGP-related promotional contests led to 320 new approved
cardholders; 195 from a regional branch contest and 125 from a call centre contest. No
further details on these promotions were provided, although no additional costs were
incurred (Sperling, 2006; Rudan, 2006b).
In summary, 684 new cardholders (approved) were acquired by MasterCard from
the EGP sponsorship at a cost of $181.05 each. This is considered to be a very good cost
per approved cardholder sign-up by MasterCard officials (Sperling 2006).
Objective 21: MasterCard - Build Awareness: The co-sponsor ATB MasterCard
had one promotional objective in addition to its goal of customer acquisition. This
resulted from the fact that MasterCard International committed $45,000 in resources to
ATB MasterCard towards the EGP sponsorship in return for the inclusion of its logo in
all related ATB promotions (Rudan, 2006b). The ability of the sponsorship to build
awareness of ATB MasterCard with ATB customers and prospects was, thus, a further
objective of the sponsorship. This was measured through questions on the in-branch
surveys where respondents were asked whether sponsorship of the EGP increased their
awareness of the ATB MasterCard product. Results indicate that the sponsorship had
limited effect in building awareness of the ATB MasterCard as nearly half (49.6%) of the
Reproduced with permission of the copyright owner. Further reproduction prohibited without permission.
2 3 8
responds either disagreed or strongly disagreed that the EGP sponsorship increased their
awareness of MasterCard. However, almost one quarter of the respondents (22.7%)
agreed or strongly agreed, which may be considered significant considering the high pre
existing levels of awareness that MasterCard has globally. A high level of awareness of
MasterCard was demonstrated in the in-branch survey population in the metrics of each
of Objectives 1,2, and 3. An ‘ATB Visa Card’ (which does not exist) was used as an
option as an influencing factor but was never chosen by a respondent. Further analysis
found no significant differences between Calgary and Edmonton or between customers
and non-customers.
6.2.1.6.3 Data Analysis: Shirking Behaviours
Concurrent to gathering the data for the objectives to be measured, the process of
identifying potential shirking behaviours or activities was also undertaken. Note that in
many cases, metrics for shirking could not be planned until the researcher became aware
of the potential shirk and related information became available. The same combined
format of presenting methods concurrent with results is adopted here for the nine
potential shirking effects assessed.
Shirkin2 Effect #1: The contract between ATB and the EGP included a clause
(2.2) allowing for a previous agreement with Capital City Savings (a direct ATB
competitor) to sponsor the Pit Lane Club at the EGP. Given the importance of exclusivity
in sponsorship, the fact that ATB was given exclusivity in the FI category, and the
Capital City Savings sponsorship of the Pit Lane Club, this was classified as a shirking
behaviour. The metric developed to determine its impact was a question on the mass
Reproduced with permission of the copyright owner. Further reproduction prohibited without permission.
market survey to determine the level of confusion created by the Capital City Savings
sponsorship of Pit Lane. The question asked respondents (n=500) to select the official FI
sponsor of the EGP from a list of 5 options with an additional choice to select ‘none of
the above’. Results clearly show that some confusion was generated in both ATB
customers and non-ATB customers. The vast majority, 343 (68.6%), either did not know
or reported ‘none of the above’. After that, ATB was the most mentioned (n=71 or
14.2%), followed by RBC (n=57 or 11.4%), Capital City Savings (n=18 or 3.6%), Bank
of Alberta (fictional) (n=6 or 1.2%), and Alberta Credit Unions (n=5 or 1.0%). In the
context of these various levels of confusion (market, shirk, clutter) and noting the
difficulty involved in attributing the lack of awareness to this particular shirk, this
analysis suggests that some negative effect of the Capital City Savings Pit Row
sponsorship is evident. If we analyze further the 18 respondents who selected Capital
City Savings as the official FI sponsor of the EGP, it is observed (i) that being outside of
Edmonton did not lead to more confusion as 11 of the 18 were Edmonton based (with 6
from Calgary and 1 from outside), (ii) that one of them attended the race in person, (iii)
that 4 watched the EGP on television, (iv) that 11 of the 18 had household incomes under
$100k, and (v) that 13 of the 18 were female.
In addition to the overall finding that 3.6% of respondents selected Capital City
Savings as official EGP FI sponsor, additional support that negative effects resulted is
evident through the 87 respondents in the sample who were already ATB customers. Of
these 87 ATB customers, 3 selected Capital City Savings as the official FI sponsor of the
EGP.
Reproduced with permission of the copyright owner. Further reproduction prohibited without permission.
Shirking Effect #2: Similar to Shirking Effect #1, Shirking Effect #2 was
discovered following a detailed review of the sponsorship contract. It involves another
contracted issue where ATB was not provided the option to supply the onsite ATM
machines during the event. It is considered a potential shirk as it is a behaviour
potentially counter to ATB’s interests. Given the ‘white label’ (i.e. generic, non-branded)
style of machines typically used at such events, it is estimated that ATB could have made
approximately $2 per transaction had the machines been onsite. Expenses are unknown
but would include the transport, delivery, maintenance and service of the machines. If we
estimate (conservatively) that each attendee (total attendance was 171,391), on average,
would use an onsite ATM machine 0.5 times/day during the event and that expenses are
$1 per transaction, lost revenue is estimated to be $42,848.
Shirkin2 Effect #3: As noted previously, a potential shirking behaviour was
identified during one of the post-event interviews where it was noted that ATB had been
promised “signs at Go-Kart track but did not get half of them” (Rudan, 2006b).
Qualitative feedback was sought from the various post-event interviews. ATB
interviewees reported frustration with the lack of signage, although they did not express
much concern about the potential marketing impact of the lack of signage, other than
noting that any detraction would be most noticeable for the television audience. EGP
interviewees expressed that they were not aware of the problem. Given the point that the
television audience would be most affected (Rudan, 2006a), the sample of 52 Albertans
who responded to the mass market survey who indicated that they had watched the EGP
on television was looked at further. Of the 52,12 (23%) were current ATB customers.
Interestingly, not one member of this group was able (unaided) to identify ATB as the
Reproduced with permission of the copyright owner. Further reproduction prohibited without permission.
2 4 1
official FI sponsor of the EGP, with 3 respondents selecting RBC and 9 reporting ‘I do
not know’. Similarly, the non-ATB customers who had watched the EGP on television
(40) were also confused about the identity of the official FI of the EGP, although 6 (15%)
were able to correctly identify ATB.
The summary point of this analysis is that, among television viewers,
considerable confusion exists about sponsorship of the EGP. Although attributing a
portion of this confusion to the loss of signage is impossible to show empirically in this
research, it is likely that the lack of signage issue had some role in this confusion.
Shirking Effect #4: Throughout the post-event interviews, a number of issues
around the service efficiency provided by the EGP were identified by a number of ATB
interviewees. Given that these were related to activities of the EGP or its suppliers, they
were considered as potential shirks of ATB and included: (i) communication challenges
for ATB personnel with EGP contacts, (ii) delayed delivery and slow servicing with the
truss structure for the ATB sponsored Go-Kart track, (iii) production error on flags for
the event, (iv) late delivery of signage and challenges with signage sub-contractor
Stratotech, (v) late delivery of prizes for ATB retail contest, (vi) failure to finalize
promised television commercial spot for ATB in time, and (vii) failure by the EGP to
deliver post-event report to ATB (as of December 2006). Other than lost promotional
benefits for ATB from the lost television commercial spot/signage errors and planning
challenges for 2007 from the late report, these activities did not result in any significant
detraction from the sponsorship although they did result in considerable aggravation,
frustration and a loss of time for ATB employees.
Reproduced with permission of the copyright owner. Further reproduction prohibited without permission.
2 4 2
Shirking Effect #5: As noted in Objective #4, ATB had a goal to impact its high-
end customers and prospects with the EGP sponsorship. One particular aspect of that
objective involved a significant investment to contract a high profile professional race car
driver to visit the ATB hospitality booths on all three days of the EGP. Two ATB
interviewees and the suite hosts all indicated that there may have been shirking behaviour
(lateness, less time committed than contract, difficulty to find, etc.) on the part of the
driver’s team, which is assessed here. In addition to the $10,515 invested in food, drinks,
upgrades, invitations and giveaways for the hospitality suite, a fee of $5,500 was paid to
the driver for the visits. The assessment of the potential shirk is analyzed using
qualitative data from the post-event interviews with the three Suite Hosts as the metric.
The Suite Host for one of the days described how the visit worked out on that day:
“he [the driver] got there about 1:00 and was there for a good 35 minutes. He did a great
job and spent time signing autographs as much as we wanted and also reviewed the track
details and more about the cars...people were happy” (Suite Host_l, 2006). An attendee
at the hospitality suite the same day echoes these positive comments: “he [the race car
driver] was the best part of the sponsorship.. .very good” (Relationship Manager,
personal communication, July 27,2006).
The Suite Host of another day had a much different experience. Similar to the day
described above, it was planned (per the contract) that the driver would come to the
hospitality booth about 30 minutes after the race (arrive around 1:30pm). However,
“today he came at 3 [pm]” (Suite Host, personal communication, July 30th, 2006), which -
as the Suite Host explains - was not ideal for the guests at the suite:
.. .it was planned that he would come after the race which finished at 1pmso we expected him at 1:30 or 2 ...but he came at 3. Clients were excited.
Reproduced with permission of the copyright owner. Further reproduction prohibited without permission.
2 4 3
We had to eventually go and get him. It was frustrating from a client perspective. They [clients] were fine with it. It was no big deal, you know. Some of them waited and some of them left. Most of the clients actually left at that point. I told them that he’d be there in 20 minutes but we couldn’t force them to stay. It was hot. Now, that was my biggest let down as the host as I had to explain why he wasn’t there. You know, they were excited to meet him and things were designed for him. Now, we gave some pictures/signatures to those who’d left but it wasn’t the same.(Suite Host_2,2006)
This Suite Host also pointed out that continued calling to the driver and his agent was
required to find him and encourage him to come right away, although she noted that the
main negative was her frustration as it appeared that the lateness and short visit “had
limited, if any, affect on the effectiveness of the sponsorship” (Suite Host_2,2006).
The Suite Host on the third and final day of the EGP also had only positive things
to say about the driver and his contribution to the sponsorship:
I think there is huge value in having the driver come to the suite. He was paid by ATB to come for an hour or so on all 3 days. He let customers know that we’d [ATB] paid for him when he was there. It is very valuable.. .his manager also came in before the driver to set up his visit which was nice. Food and drink was quality and great and we didn’t run out. Taxi chits worked well and were appreciated [by attendees]. One lesson learned was on food., .after the race, there was no one left [in the suite] to eat food so we lost some money. (Suite Host, personal communication, July 30th, 2006)
In summary, 2 out of the 3 Suite Hosts reported that the driver fulfilled and exceeded the
tenets of his contract while the 3 noted he was late but otherwise did what he was asked
and that the negative effects were very limited. As such, it is reasonable to conclude that
no shirking behaviour took place here.
Shirking Effect #6: A sixth potential shirking effect related to the ATB-sponsored
Go-Kart Track at the EGP was reported to the researcher in two of the post-event
interviews. This promotion was included in the ATB-EGP sponsorship contract because
Reproduced with permission of the copyright owner. Further reproduction prohibited without permission.
2 4 4
of (i) its high profile and (ii) its planned location in the family zone (i.e. near rides, kids’
events, etc.). The shirk resulted when the Go-Kart track ended up being located near the
beer garden and far from the other kids’ rides (Rudan, 2006b). Given the lateness of this
change and the challenge of forecasting what benefits would have resulted from a
location, as planned, near the kid’s zone and away from the beer garden, the effects are
estimated using the post-event interview transcripts. One of the ATB interviewees
summarized:
We were informed before that the family fun zone would include the rides and be an alcohol free area with all family stuff but it turned out that there was a beer tent beside and all rides were far away and signage was weak.So, I think we lost a lot of traffic from the Go-Kart track. It ended up being kind of a Go-Kart track with a few people around drinking beer.And, they’d committed to us that’d we’d be part of family fun zone.. ..and there is no question that this impacted the effectiveness of the Go-Kart track.
During one of the post-event interviews, an ATB staff member used a map to show where
the Go-Kart track was supposed to have been and where it actually ended up being and
commented “I am positive that the location change was a negative issue for our
promotions”. Another interviewee referred specifically to the potential loss of
promotional benefit for ATB: “personally, I think the Go-Kart thing was great.. .they
should continue it...but in a better location.. .where it was, was not good for promotion”.
Although the actual impact could not be specifically measured, the results of the post
event interviews demonstrate that a loss of promotional capacity did occur to some
degree.
Shirkim Effect #7: The seventh potential shirking effect was identified in a post
event interview with one of the Suite Hosts, who noted that the ATB announcements that
were played over the public address system on site were incomprehensible (as were all
Reproduced with permission of the copyright owner. Further reproduction prohibited without permission.

2 4 5
announcements). Given the post-event timing of this shirk being identified; it was not
possible to put a specific metric in place, although data from the Suite Host post-event
interviews provide some input. Notably, two of the Suite Hosts commented specifically
on the loss of promotional value: “they were a waste of time”, and “one filing they should
change is the public announcing system. We could never hear a word of what was being
said”.
Shirking Effect #8: Two ATB employees raised sensitive internal ATB issues as
potential shirks in the post-event employee interviews. First, they pointed out that the
allocation of tickets in the employee ticket program likely detracted from ATB’s internal
marketing objectives (Objective 8 to motivate staff and Objective 14 to build employee
pride). Second, they noted that the selection of guests in the ATB hospitality suite had
likely detracted from the effectiveness of the hospitality suite (Objective 4 - Impact Top
1% of customers). Based on these suggestions, both are considered potential shirking
behaviours and their impact is assessed separately.
Results from the post-event ATB employee interviews were used to assess the
employee ticket program, where three interviewees noted that communications from
ATB to its staff failed to reach everyone. Specifically, two of the seven interviewees had
not heard of the program, another believed it was an Edmonton-only offer, and 3 noted
that they knew of colleagues who had wanted to attend but were unable to as tickets were
sold out before they knew about the ticket program. This issue around communication
must be taken in the context of an otherwise very successful program which sold-out
quickly and got ATB staff widely excited about the sponsorship.
Reproduced with permission of the copyright owner. Further reproduction prohibited without permission.
246
Analysis of the employee interviews was used to review the potential shirking
behaviour with respect to access to the hospitality suite. This is considered a potential
shirk as the activities involved could undermine the sponsorship and one of its objectives.
Suite Host l (2006) described the issue: “we had some tactical struggles over who was
invited” and another ATB official explained in detail that:
The original plan for the hospitality suite was to have 25 guests per day which were to include 8/day who were top customers with over $2,000,000 in loans, 15/day from investor services clients and prospects and 2/day to be a single ATB executive and his or her spouse. However, jealousy and politics came into play and the number of ATB executives and spouse grew to 6/day and some other ATB staff used some of the other ticket places for themselves or friends instead of for clients and prospects.
Some employees were disappointed that their clients were invited but they were
not; and one noted “it is tough but we were not invited. We were allowed to send
clients. So, we could buy tickets but we weren’t invited.” The same interviewee,
however, noted that “my clients were happy - all of them enjoyed it - they were
wined and dined. I sent 6 but would have liked to have been there myself’. In
addition to the issue around ATB executives and staff attending, determining how
many spots would be provided to guests became an issue, as noted by one of the
Suite Hosts:
.. .the goal was to invite top-end clients to [allow ATB to] interact with top-end clients.. .that was very much achieved. I mean there were some invitation logistics. I thought that there were too many executive types there.. .maybe more relationship managers would have been ideal: the people who clients deal with on day to day. There may have been too many ATB employees as well. On my day, there was myself and there was 4 executive types and their guests.. .so 8 spots of 25 taken up by ATB employees. And that has to be looked at for sure.
Reproduced with permission of the copyright owner. Further reproduction prohibited without permission.
2 4 7
There was also some concern expressed around the invitation of spouses to the
event as expressed by one of the Suite Hosts:
There is also debate about [inviting] spouses for each ATB person.For clients, I think it is necessary to invite a guest but for an ATB executive, there is good and bad.. .it is business so you don’t need the guest but then again if you bring your spouse/guest, they can relate to the client’s spouse/guest and talk while others are doing business. In general, I’d say yes but a small suite limits this and we need more clients there.
These four potential shirks - whether from actions of specific individuals or from
ATB policy around the event - are amplified since only 48 (26 clients/prospects
with 22 guests) of the 75 spots were taken by clients or prospects is an issue. This
means that 36% (27) of the places were taken by ATB employees and their
guests, for a ratio of less than 2:1 (1.78:1 to be exact) of Clients/Prospects:ATB
representatives. If we reduce the sample to include only clients/prospects who
meet the Top 1% definition (i.e., household income > $100,000), the ratio drops
to 1.28:1. From all accounts, these ratios are low and likely led to some hurt
feelings and disappointed employees, clients and prospects.
Overall, the hospitality suite places are reported by interviewees to be a
significantly more impactful issue detracting from the sponsorship than the
employee ticketing program. In fact, the employee ticket program suffered only
from the issues around any normal popular program so it is not deemed shirking
behaviour. Considering the fact that a low percentage of places in the hospitality
suite were occupied by ATB clients and prospects (not all of whom met the Top
1% criteria), it is reasonable to suggest that activities around hospitality suite
Reproduced with permission of the copyright owner. Further reproduction prohibited without permission.
2 4 8
invitations undermined the effectiveness of the sponsorship and Objective 4 in
particular.
Shirking Effect #9: A review of the transcripts of the post-event interviews with
ATB MasterCard and ATB staff suggested that there may have been some cooperation
issues between the sponsor and co-sponsor that potentially detracted from the
effectiveness of the sponsorship. It was deemed a potential shirk as both sponsor and co
sponsor were contractually linked to the sponsorship and an undermining of the
deliverables on the contract would fit the definition of shirking behaviour. A deeper
assessment of the interview transcripts and further communication with both ATB and
MasterCard representatives revealed that there is not a specific shirk here but a larger
organizational issue of how the ATB MasterCard unit fits in at ATB. One interviewee
summarized the situation: “3 years ago, we had more marketers at MasterCard - 6 on our
floor - than we have in ATB marketing and they only work on MasterCard and there is
no collaboration between the units which makes no sense”. When asked if this issue
needed addressing, the interviewee articulated that “I’m pretty confident that in 5 years
that won’t look the same.. .things are changing.. .all sponsorships small and large should
come through 1 unit who have linkages with everybody [both MasterCard and ATB]”.
Many additional comments were made by interviewees on the specific issues and
challenges of the ATB - ATB MasterCard relationship. The comments can be grouped
based on how they affect the sponsorship: (i) inefficient budgeting, (ii) mutually
exclusive strategies, (iii) strained communications, and (iv) distinct and uncoordinated
leveraging plans. In summary, no shirking behaviour specific to sponsorship is identified,
however the larger issue of inefficient activity and competing interests between ATB
Reproduced with permission of the copyright owner. Further reproduction prohibited without permission.
2 4 9
marketing and ATB MasterCard is noted, as is the effect it had on the sponsorship.
Results clearly point out the pressing need for ATB and ATB MasterCard to deal with
this issue.
6.2.1.7 Step 7: Generate and Interpret Outcomes and Impacts
The process of developing and implementing this evaluation revealed a number of
challenges in sponsorship evaluation research, with particular challenges stemming from
decisions, resource and permission issues which are discussed in this section.
The process of making strategic decisions around the evaluation turned out to be
considerably more complex than originally thought. In fact, seven individuals influenced
how the evaluation developed. These individuals were representatives from ATB
marketing, ATB legal, ATB research, EGP management, ATB MasterCard, the doctoral
researcher and the doctoral research supervisor. Of particular note, approvals were
necessary from lawyers and research experts on behalf of ATB in order for the evaluation
to proceed.
With respect to permissions, ATB required the signing of NDAs by the
researcher, the PhD supervisor and the PhD committee with versions of the NDA
designed specifically for each by the ATB legal department. ATB’s Vice-President of
Marketing also interviewed the researcher in person on the research. Following these two
steps, the researcher was allowed full disclosure and support. The EGP was more
reluctant. Interviews came only after the event and following considerable
communication from ATB and the researcher. Information from co-sponsor ATB
MasterCard was full and complete.
Reproduced with permission of the copyright owner. Further reproduction prohibited without permission.
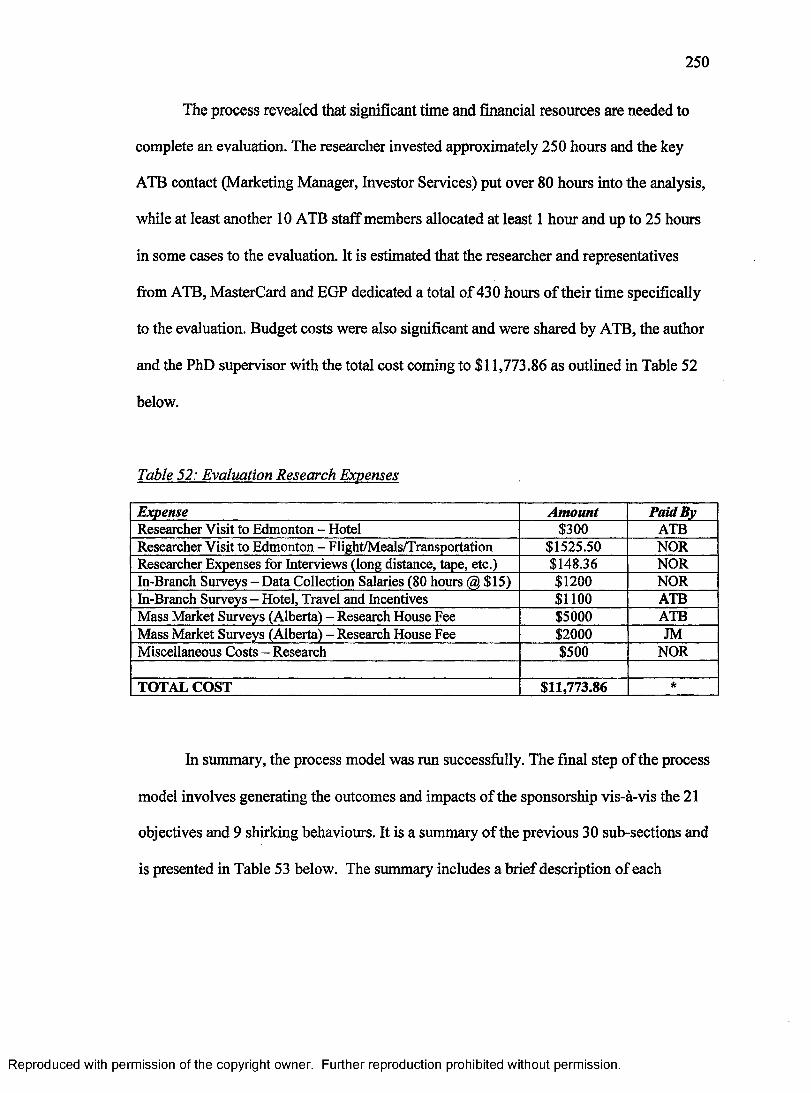
2 5 0
The process revealed that significant time and financial resources are needed to
complete an evaluation. The researcher invested approximately 250 hours and the key
ATB contact (Marketing Manager, Investor Services) put over 80 hours into the analysis,
while at least another 10 ATB staff members allocated at least 1 hour and up to 25 hours
in some cases to the evaluation. It is estimated that the researcher and representatives
from ATB, MasterCard and EGP dedicated a total o f430 hours of their time specifically
to the evaluation. Budget costs were also significant and were shared by ATB, the author
and the PhD supervisor with the total cost coming to $11,773.86 as outlined in Table 52
below.
Table 52: Evaluation Research Expenses
Expense Amount Paid ByResearcher Visit to Edmonton - Hotel $300 ATBResearcher Visit to Edmonton - Flight/Meals/Transportation $1525.50 NORResearcher Expenses for Interviews (long distance, tape, etc.) $148.36 NORIn-Branch Surveys - Data Collection Salaries (80 hours @ $15) $1200 NORIn-Branch Surveys - Hotel, Travel and Incentives $1100 ATBMass Market Surveys (Alberta) - Research House Fee $5000 ATBMass Market Surveys (Alberta) - Research House Fee $2000 JMMiscellaneous Costs - Research $500 NOR
TOTAL COST $11,773.86 *
In summary, the process model was run successfully. The final step of the process
model involves generating the outcomes and impacts of the sponsorship vis-a-vis the 21
objectives and 9 shirking behaviours. It is a summary of the previous 30 sub-sections and
is presented in Table 53 below. The summary includes a brief description of each
Reproduced with permission of the copyright owner. Further reproduction prohibited without permission.

2 5 1
objective/shirking behaviour, a researcher ranking45 on the level of attainment of the
objective (or ‘detraction’ in the case of shirking) and the results that support that ranking.
Table 53: Summary Results
Objective Results# Description Objective
ObtainedResults of Analysis
1 ATB Customer Acquisition - Edmonton Limited + 7 new customers2 ATB Customer Acquisition - Calgary No No effect3 ATB Customer Acquisition - Other Partial + 34 new customers4 ATB Impact Top 1% customers/prospects Yes + 26 Top Customers & Prospects
‘impacted’ @ $1780 each5 Increase Awareness (that ATB exists) Yes + 16.4% increase6 Increase Awareness (that ATB cares) Yes + 43.4% increase7 Improve ATB Brand Prestige (customers) Partial + 1 in 66 customers (1 in 44 EDM/1 in
99 CAL) influenced8 ATB Internal Marketing (motivate staff) Yes + Sold-out ticket program
+ Positive employee interviews9 ATB Achieve competitive advantage Limited + 3.6% of respondents impacted
+ Significantly greater impact on noncustomers, fans and Edmonton
10 Establish ATB as major player in Alberta banking market - with customers
Partial + Over 90% believe so already, 3.5% of 57 non-believers impacted
11 Establish ATB as major player in Alberta banking market - with non-customers
Yes + 64.8% of Albertans (strongly) agree that EGP sponsorship helped
+ Significantly greater impact on young, fans of sport and TV viewers
12 Re-brand ATB to full-service operation from small town rural bank - customers
Yes + 45% of customers noted that EGP sponsorship aided re-positioning
13 Re-brand ATB to full-service operation from rural bank - non-customers
Yes + 72.5% agree or strongly agree that ATB is full-service FI
+ Significant difference b/w those who correctly chose and those who did not
14 Internal marketing ATB - build pride Yes + Sold-out ticket program + Positive employee interviews
15 ATB: assess sponsorship effectiveness Yes + The occurrence of this evaluation16 EGP - revenue generation Yes + Target price achieved ($410k)
+ ATB leveraging investment ($240k)17 EGP - develop long-term partnerships No Numerous concerns to overcome, but
commitment to improve in 200718 EGP - build affinity with Alberta market
through association with ATBYes
................. ..+ Strong effect (50%) in building pride
in Alberta-based event
45 Given the varied nature of the 21 objectives and 9 shirking behaviours, coupled with the feet that many of the objectives were not constructed by ATB, MasterCard or EGP with measurable components, a 4-level ranking system (yes, partial, limited, and no) was used with ranking based on researcher assessment. The 4- levels were defined as follows: yes (objective achieved as desired), partial (considerable but incomplete evidence of successful achievement of the objective), limited (low levels of success, often uncertain), no (no evidence of success).
Reproduced with permission of the copyright owner. Further reproduction prohibited without permission.
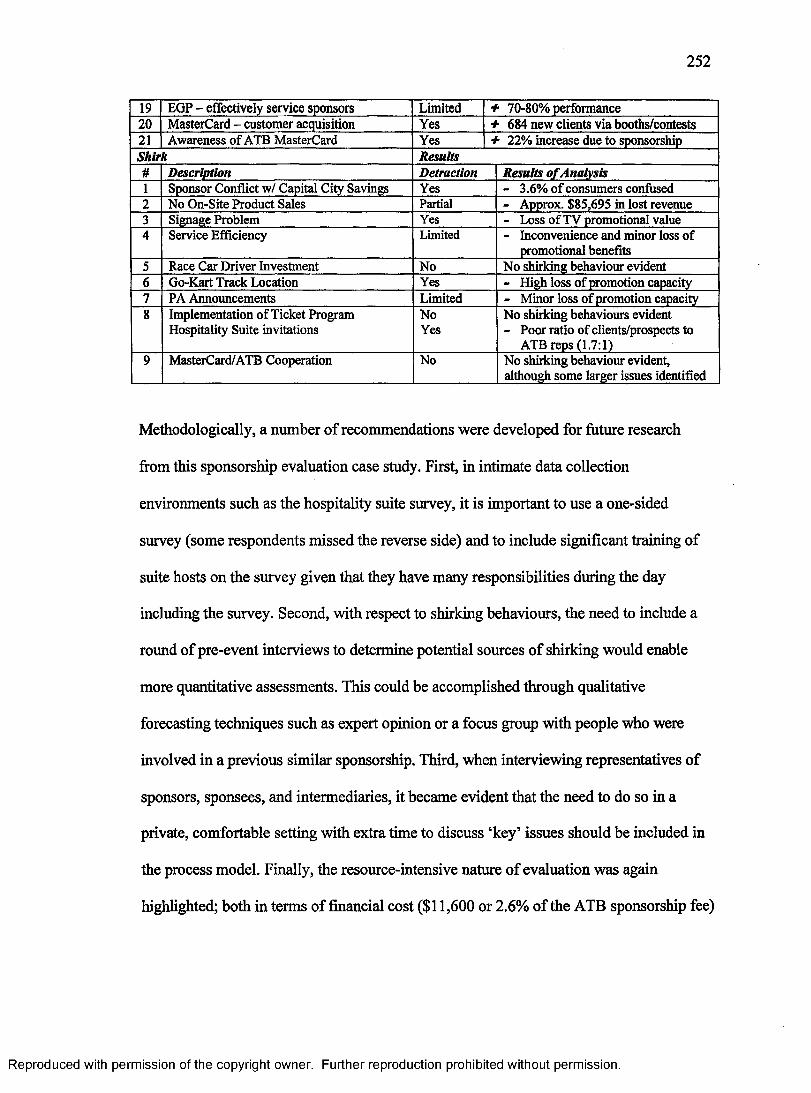
2 5 2
19 EGP - effectively service sponsors Limited + 70-80% performance20 MasterCard - customer acquisition Yes + 684 new clients via booths/contests21 Awareness of ATB MasterCard Yes + 22% increase due to sponsorshipShirk Results# Description Detraction Results of Analysis1 Sponsor Conflict w/ Capital City Savings Yes - 3.6% of consumers confused2 No On-Site Product Sales Partial - Approx. $85,695 in lost revenue3 Signage Problem Yes - Loss of TV promotional value4 Service Efficiency Limited - Inconvenience and minor loss of
promotional benefits5 Race Car Driver Investment No No shirking behaviour evident6 Go-Kart Track Location Yes - High loss of promotion capacity7 PA Announcements Limited - Minor loss of promotion capacity8 Implementation of Ticket Program
Hospitality Suite invitationsNoYes
No shirking behaviours evident - Poor ratio of clients/prospects to
ATB reps (1.7:1)9 MasterCard/ATB Cooperation No No shirking behaviour evident,
although some larger issues identified
Methodologically, a number of recommendations were developed for future research
from this sponsorship evaluation case study. First, in intimate data collection
environments such as the hospitality suite survey, it is important to use a one-sided
survey (some respondents missed the reverse side) and to include significant training of
suite hosts on the survey given that they have many responsibilities during the day
including the survey. Second, with respect to shirking behaviours, the need to include a
round of pre-event interviews to determine potential sources of shirking would enable
more quantitative assessments. This could be accomplished through qualitative
forecasting techniques such as expert opinion or a focus group with people who were
involved in a previous similar sponsorship. Third, when interviewing representatives of
sponsors, sponsees, and intermediaries, it became evident that the need to do so in a
private, comfortable setting with extra time to discuss ‘key’ issues should be included in
the process model. Finally, the resource-intensive nature of evaluation was again
highlighted; both in terms of financial cost ($11,600 or 2.6% of the ATB sponsorship fee)
Reproduced with permission of the copyright owner. Further reproduction prohibited without permission.
2 5 3
and time commitment. The demands are considerable and may not be well understood
when embarking on an evaluation.
6.2.1.7.1 Recommendations to Participating Organizations
Throughout the implementation of the process model in the ATB-EGP
sponsorship evaluation case study, a number of recommendations specific to the sponsor
(ATB), sponsee (EGP) and co-sponsor (ATB MasterCard) were developed. They are
presented here for the benefit of the participating organizations and for the improvement
of the process model.
Recommendations to ATB". A number of specific recommendations are provided
to ATB from the sponsorship evaluation case study. First, it is suggested that the
relationship between ATB marketing and ATB MasterCard marketing be clarified and re
organized. The specific recommendation is to accelerate the previously discussed idea
(Rudan, 2006a) of merging of the two units into one cohesive entity. Concurrent to
accelerating die merger, it is further recommended (i) to balance the leveraging ratios of
ATB Financial and ATB MasterCard to the EGP sponsorship to ensure an equal
contribution towards maximizing the value of the sponsorship and (ii) to develop a
coordinated plan for the 2007 EGP. Second, it is recommended that ATB implement a
second evaluation exercise for the customer acquisition objectives in 12-18 months time
to determine if longer-term impacts were generated where short-term outcomes were
weak. Third, ATB should prioritize sponsorship for future awareness and branding
objectives but NOT for future customer acquisition or competitive advantage objectives
since results here show sponsorship to be effective in awareness/branding but not
Reproduced with permission of the copyright owner. Further reproduction prohibited without permission.
customer acquisition. Fourth, for the Hospitality Suite at the 2007 EGP, ATB should
consider the following suggestions for action: (i) repeat the high profile race car driver
visit but with a different star driver, (ii) reserve a larger suite and consider alternative
suite layouts to increase numbers and improve the experience, (iii) review invitation
policy to increase the ratio of customers and prospects to ATB representatives, (iv) re
consider the option for ATB executives and relationship managers to bring a guest with
them, (v) ask EGP for better suite signage, (vi) ask EGP for improved bathroom facilities
(both quality and location), (vii) ask EGP for more visitors passes (i.e. 4 for every 25
person suite) which are valid all day (not just after 2:30pm), and (vii) address a number
of other minor issues identified in the post-event employee interviews (i.e., (a) improve
delivery and inventory of food including no food on Sunday afternoon, (b) order less
alcohol or lower prices in the booth, (c) eliminate or reduce gift bag, and (d) ask EGP if
younger bands could be included for younger crowds). Fifth, considering the employee
discount ticket program, the following three suggestions are offered for the 2007 EGP: (i)
improving communication program so all ATB staff are aware of the program, (ii)
implement a strategic ticket allocation system, and (iii) allocate more budget to
expanding the number of tickets available in the program. Sixth, it is suggested that ATB
(i) meet immediately with the EGP to express strong concern over the Capital City
Savings sponsorship, (ii) demonstrate (using results from this evaluation) that such a
conflicting sponsorship is detracting from the benefits of the ATB sponsorship, and (iii)
negotiate for exclusivity or price reduction or position ATB for better negotiations if
sponsorship is to continue beyond 2007. Seventh, it is recommend that ATB try to meet
immediately with the EGP to discuss the on-site ATM machines as both a marketing and
Reproduced with permission of the copyright owner. Further reproduction prohibited without permission.

revenue-generation function for ATB. Eighth, ATB should meet immediately with the
EGP to make sure the location of the Go-Kart track in 2007 is in the fan zone, near rides
and away from beer tents. This effort should also include improved training (potentially
in collaboration with Stratotech) of ATB Go-Kart track volunteers on (i) Go-Kart track
operations, (ii) equipment needs and storage, (iii) accreditation, and (iv) volunteer
operations (recruitment, breaks, nutrition, etc.). Ninth, it is suggested that ATB meet
immediately with the EGP to discuss the 2007 signage plan for the Go-Kart track and put
a monitoring plan in place to ensure compliance. Tenth, it is recommended that ATB
meet immediately with the EGP and request a dedicated EGP staff contact during the
event who will be reachable in ‘crunch time’. Finally, ATB must deal with the service
efficiency items identified under Shirking Element #4, including (i) requesting an
improved PA system for 2007, and (ii) researching and developing marketing tactics to
work towards overcoming confusion with RBC as official FI sponsor.
Recommendations to EGP: Six recommendations for the EGP were identified from
the sponsorship evaluation case study. First, it is suggested that the EGP implement a
strategy to develop long-term partnerships with secondary level sponsors such as ATB
that includes increased attention to the sponsor’s needs and increased human resources
allocated towards sponsor servicing. Second, the EGP should consider increasing the
prices of sponsorship and then using these additional funds to help sponsors leverage the
association by providing additional promotional value (signage, TV, radio, etc.),
investing in co-promotions, and increasing its sponsor servicing capacity. Third, it is
recommended that the EGP consider selecting a minimum number of sponsors with a
provincial geographic focus (e.g. ATB and Alberta) to continue to build affinity between
Reproduced with permission of the copyright owner. Further reproduction prohibited without permission.
2 5 6
the event and Albertans. Fourth, it is suggested that the EGP revamp sponsor servicing
during the event with improved communications and increased human resources. Fifth, it
is recommended that EGP management review the drop in attendance over the past two
years (there has been a decrease of 27,000 spectators from 2005 to 2006) in order to
understand why this happened and to avoid it from happening again in 2007. Finally, it is
recommended that the EGP respond positively to the many requests that will come their
way from ATB as per recommendations to ATB above.
Recommendations to ATB-MasterCard: The sponsorship evaluation case study
also provides five specific recommendations to ATB MasterCard (the co-sponsor). It is
suggested that they (i) increase their presence on the ground to 6 or 8 smaller-sized
booths with an increased number of volunteers to increase sign-ups, (ii) identify and
locate sign-up volunteers in more strategic ‘roaming locations’ such as inside a beer tent
or near lineups, (iii) develop a more cost-effective and appealing sign-up premium (in
lieu of a t-shirt), (iv) consider more activities targeted at under-30 target markets, and (v)
recognize the role that ATB played in building awareness of MasterCard and accelerate
the process of merging their marketing functions with ATB.
Reproduced with permission of the copyright owner. Further reproduction prohibited without permission.
2 5 7
6.2,2 Sponsorship Evaluation 2: Kanatek - Mount Everest Expedition Sponsorship
The second sponsorship evaluation case study implemented as part of this
dissertation is the 2005 Kanatek Expedition to Mount Everest. Like the ATB-EGP
sponsorship, the presentation of this sponsorship evaluation case study follows the steps
in Process Model D2. Note that Step 1, as presented here, is more detailed than for the
ATB-EGP sponsorship evaluation case study due to the fact that the evaluation developed
over a five year period of time and that an unexpected tragedy took place that drastically
altered the nature of the evaluation. Although this tragedy limited the ability to fully
evaluate the sponsorship, much learning around the evaluation process occurred and the
risks inherent in implementing the process model were clarified.
6.2.2.1 Step 1: Setting the Stage
The Svonsee: In the summer of 2000, following his second major research
expedition to the base camp of Mount Everest, Dr. Sean Egan, a University of Ottawa
health sciences professor, decided that he wanted to summit the world’s highest
mountain. However, by the fall of 2001, his dream was in doubt due to his inability to
acquire the necessary resources to finance his trek. Although he had approached
numerous potential sources, including corporate sponsors, granting agencies, foundations,
and his own University, the significant resources necessary to support such an endeavour
were not readily available. It was at this point that Dr. Egan asked the author of this thesis
(a former research assistant of his) to become involved in the project. In the fall of 2003,
Harold Mah - event support manager for the city of Toronto - also joined the core
organizing team, followed by Dr. Dave Valliere, Ryerson University Professor in
Reproduced with permission of the copyright owner. Further reproduction prohibited without permission.
2 5 8
Entrepreneurship and Strategy, in the fall of 2004 as Research Director for the
expedition.
During the period from early 2000 to early 2004, a number of sponsors
(approximately 125 (Egan, 2005a)) had been approached. Considerable interest was
generated, however no deals were signed and the expedition date was delayed from
spring 2004 (Dr. Egan’s original goal (Egan, 2003a)) to spring 2005 with hopes that the
extra year would enable the necessary resource generation. Dr. Egan noted (Egan, 2005a)
that some positive energy had been created in late 2003 and early 2004 that kept him
motivated. First, following a meeting with senior administration at the University of
Ottawa, the University had allocated one of its Development Officers (Ric Cuthbertson)
to help raise resources for the expedition. In the winter of 2004, Irving, Home Depot and
Honda Canada were all sent detailed sponsorship proposals following an initial
expression of interest by these organizations (Cuthbertson, 2004). Nothing materialized
and Ric left the University shortly thereafter and was replaced by Tony Giampietro a few
months later (Egan, 2005b). Second, Dr. Egan and his core organizing team had
developed a number of resource-generating strategies that he felt could be successful
(Egan, 2005b) although only limited success was ever achieved. These strategies
included seeking internal and external research grants and opening up the expedition to
other climbers, researchers and trekkers who would pay a premium towards supporting
the expedition. As part of the efforts to attract researchers and trekkers, Dr. Egan spent
considerable time attending related academic conferences on hypoxia, sport psychology,
and mountaineering spreading the word about the expedition (Egan, 2005a). He received
over 50 written expressions of interest from researchers from 12 different countries and 6
Reproduced with permission of the copyright owner. Further reproduction prohibited without permission.
2 5 9
would end up joining the trek (Egan, 2005a). Third, Ryerson University in Toronto had
come on board as a partner institution on the research aspects of the expedition, with
initial plans involving one (1) senior administrator, five (5) professors and two (2)
research assistants to join the trek (Luk, 2004). Fourth, a colleague of Dr. Egan’s who
had been to Everest with him in 1998, Dr. Roger Broughton of the Medical School at the
University of Ottawa, joined the team. As one of the world’s top sleep researchers, Dr.
Broughton immediately took an active planning and fundraising role, particularly with
granting agencies (Egan, 2005b), although health reasons forced him to withdraw from
the expedition in the fall of 2004 (Broughton, 2004b). Finally, Dr. Egan had successfully
ridden his bicycle across Canada in the summer of 2004 generating media attention and
building his fitness level.
The Sponsor. Founded in 1981, Kanatek is an Ottawa-based independent systems
integrator specializing in data availability, networked storage, and backup and recovery
solutions (www.kanatek.cay Kanatek does business in the private sector, the public
sector, and academic marketplaces and its customers include Nortel, Rogers, Government
of Canada, Provincial Governments (Ontario and Quebec), Bank of Nova Scotia, CIBC,
Bank of Canada, Siemens, Alcatel, Via Rail, and McGill University (Kell, 2004a). In the
early 2000s, Kanatek was seeking a way to (i) increase sales, (ii) send a positive message
to its partners and (iii) increase employee satisfaction (Gardner, 2004a; Kell, 2004a) since
things were starting to ‘turn around’ in their market after the crash of the high technology
market in the late 1990’s when Kanatek’s “core industry was failing”, the company had
decreased in size by 50% and employee morale was low (Kell, 2005a).
Reproduced with permission of the copyright owner. Further reproduction prohibited without permission.

2 6 0
Throughout 2003 and 2004, Kanatek’s President Terry Kell, who lived in the
same town (Almonte, Ontario) as Dr. Egan, had heard of the expedition and had
discussed it in-person with Dr. Egan who had proposed Kanatek sponsoring the
expedition. He brought this idea to Kanatek’s management team in late 2003 and,
following a review of the potential business impacts, they decided not to pursue the
opportunity (Kell, 2004b). However, they also decided to keep ‘a close eye’ on the
development of the expedition and, following a second review of the opportunity in the
spring of 2004, the Kanatek senior management team decided to sponsor the expedition
(Kell, 2004b). It was noted that the decision to sponsor was “100% a business decision”
(Kell, 2004b). Following some additional discussion amongst the expedition and
Kanatek, the contract was agreed to via email on June 10,2004 and the 2005 Kanatek
Expedition to Mount Everest (KEME) was bom.
6.2.2.1.1 Identify Sponsorship
This sub-section is presented in 4 parts; (i) Sponsorship Investigation, (ii) The
Sponsorship, (iii) The Expedition, and (iv) Post-Expedition.
Sponsorship Investigation: Following the agreement in June of 2004 on the
sponsorship contract, the sponsorship itself was investigated. This involved a review of
the contract and regular communication with the President of Kanatek, the Leader of
KEME and other expedition members (by email, by phone and in person). From these
communications, it was observed that both the sponsor and the sponsee had specific
articulated objectives (Egan, 2004a; Kell, 2004a). Both parties were willing to contribute
to the evaluation (Egan, 2004a; Egan, 2004b; Kell, 2004a). This sponsorship is an
Reproduced with permission of the copyright owner. Further reproduction prohibited without permission.
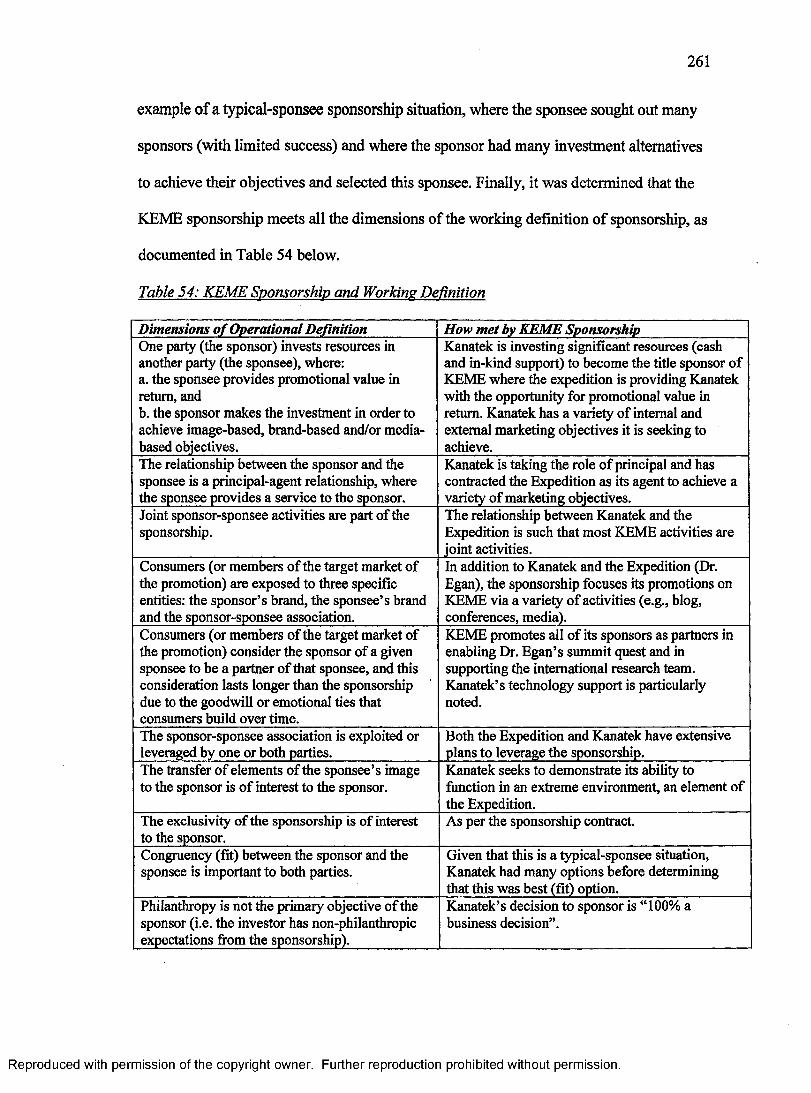
2 6 1
example of a typical-sponsee sponsorship situation, where the sponsee sought out many
sponsors (with limited success) and where the sponsor had many investment alternatives
to achieve their objectives and selected this sponsee. Finally, it was determined that the
KEME sponsorship meets all the dimensions of the working definition of sponsorship, as
documented in Table 54 below.
Table 54: KEME Sponsorship and Working Definition
Dimensions o f Operational Definition How met by KEME SponsorshipOne party (the sponsor) invests resources in another party (the sponsee), where:a. the sponsee provides promotional value in return, andb. the sponsor makes the investment in order to achieve image-based, brand-based and/or media- based objectives.
Kanatek is investing significant resources (cash and in-kind support) to become the title sponsor of KEME where the expedition is providing Kanatek with the opportunity for promotional value in return. Kanatek has a variety of internal and external marketing objectives it is seeking to achieve.
The relationship between the sponsor and the sponsee is a principal-agent relationship, where the sponsee provides a service to the sponsor.
Kanatek is taking the role of principal and has contracted the Expedition as its agent to achieve a variety of marketing objectives.
Joint sponsor-sponsee activities are part of the sponsorship.
The relationship between Kanatek and the Expedition is such that most KEME activities are joint activities.
Consumers (or members of the target market of the promotion) are exposed to three specific entities: the sponsor’s brand, the sponsee’s brand and the sponsor-sponsee association.
In addition to Kanatek and the Expedition (Dr. Egan), the sponsorship focuses its promotions on KEME via a variety of activities (e.g., blog, conferences, media).
Consumers (or members of the target market of the promotion) consider the sponsor of a given sponsee to be a partner of that sponsee, and this consideration lasts longer than die sponsorship due to the goodwill or emotional ties that consumers build over time.
KEME promotes all of its sponsors as partners in enabling Dr. Egan’s summit quest and in supporting the international research team. Kanatek’s technology support is particularly noted.
The sponsor-sponsee association is exploited or leveraged by one or both parties.
Both the Expedition and Kanatek have extensive plans to leverage the sponsorship.
The transfer of elements of the sponsee’s image to the sponsor is of interest to the sponsor.
Kanatek seeks to demonstrate its ability to function in an extreme environment, an element of the Expedition.
The exclusivity of the sponsorship is of interest to the sponsor.
As per the sponsorship contract.
Congruency (fit) between the sponsor and the sponsee is important to both parties.
Given that this is a typical-sponsee situation, Kanatek had many options before determining that this was best (fit) option.
Philanthropy is not the primary objective of the sponsor (i.e. the investor has non-philanthropic expectations from the sponsorship).
Kanatek’s decision to sponsor is “100% a business decision”.
Reproduced with permission of the copyright owner. Further reproduction prohibited without permission.
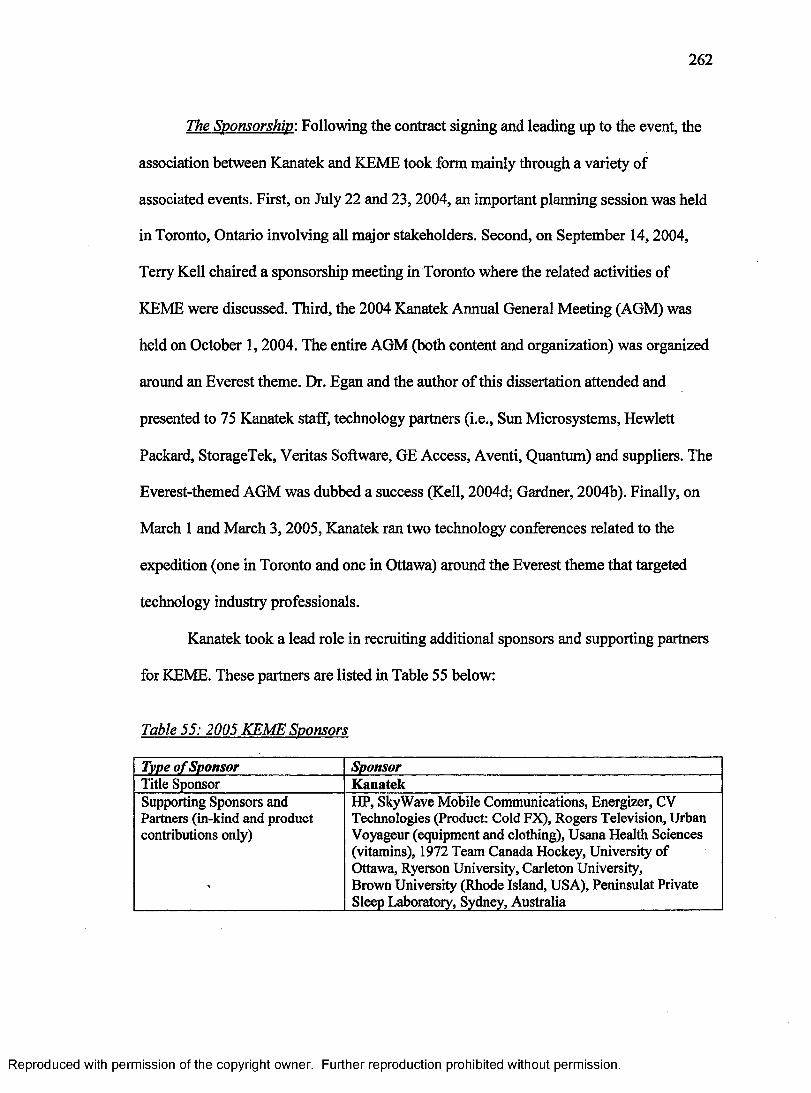
2 6 2
The Sponsorship: Following the contract signing and leading up to the event, the
association between Kanatek and KEME took form mainly through a variety of
associated events. First, on July 22 and 23,2004, an important planning session was held
in Toronto, Ontario involving all major stakeholders. Second, on September 14,2004,
Terry Kell chaired a sponsorship meeting in Toronto where the related activities of
KEME were discussed. Third, the 2004 Kanatek Annual General Meeting (AGM) was
held on October 1,2004. The entire AGM (both content and organization) was organized
around an Everest theme. Dr. Egan and the author of this dissertation attended and
presented to 75 Kanatek staff, technology partners (i.e., Sun Microsystems, Hewlett
Packard, StorageTek, Veritas Software, GE Access, Aventi, Quantum) and suppliers. The
Everest-themed AGM was dubbed a success (Kell, 2004d; Gardner, 2004b). Finally, on
March 1 and March 3,2005, Kanatek ran two technology conferences related to the
expedition (one in Toronto and one in Ottawa) around the Everest theme that targeted
technology industry professionals.
Kanatek took a lead role in recruiting additional sponsors and supporting partners
for KEME. These partners are listed in Table 55 below:
Table 55: 2005 KEME Sponsors
Type of Sponsor SponsorTitle Sponsor KanatekSupporting Sponsors and Partners (in-kind and product contributions only)
HP, SkyWave Mobile Communications, Energizer, CV Technologies (Product: Cold FX), Rogers Television, Urban Voyageur (equipment and clothing), Usana Health Sciences (vitamins), 1972 Team Canada Hockey, University of Ottawa, Ryerson University, Carleton University,Brown University (Rhode Island, USA), Peninsulat Private Sleep Laboratory, Sydney, Australia
Reproduced with permission of the copyright owner. Further reproduction prohibited without permission.
2 6 3
Following the contract agreement, an aggressive media campaign was launched by
Kanatek and the Expedition that included (i) media spots (TV, radio, newspaper), (ii) a
blog managed by Kanatek that eventually hit an estimated 100,000 readers (Kell, 2005a;
Kell, 2005b), (iii) industry conferences, (iv) a special hockey game played at Base Camp
(“The World’s Highest Hockey Game”) that achieved considerable media attention
(including a mention on the CBC evening news with Peter Mansbridge), (v) sponsorship
from the famed ‘ 1972 Team Canada’ hockey team, (vi) calls to elementary schools from
the mountain by Dr. Egan, satellite feeds to the blog from the mountain, and (vi) the
filming of a documentary (yet to be released as of December 2006).
The Expedition: The date for the trek was finalized and the team was developed
after the sponsorship contract was signed. Following the final deadline for enrollment
fees on November 30th, 2004, the team was finalized at 21 members, including one
climber, 8 trekkers, and 12 researchers. The sole climber and expedition leader was Dr.
Egan. He was also the only one to have previously been to Everest. The 12 researchers,
included the author of this dissertation, as well as people from Carleton University,
Ryerson University, the University of Ottawa, the University of Sydney Sleep Institute
(Australia) and Brown University (USA). The trekkers included a camera crew (Rogers),
sponsors, and hikers of varying abilities.
The multi-project, multi-party, multi-research expedition of 21 left for Everest in
March and April of 2005. A support team of 48 people accompanied the trek; including 2
cooks, 8 kitchen helpers, 25 porters, 5 yak drivers, 7 Sherpa, 1 manager and 16 yaks. The
three month agenda for KEME involved a general schedule, with some customizations
organized for the various groups (researcher, climber, trekker, and media crew) based on
Reproduced with permission of the copyright owner. Further reproduction prohibited without permission.
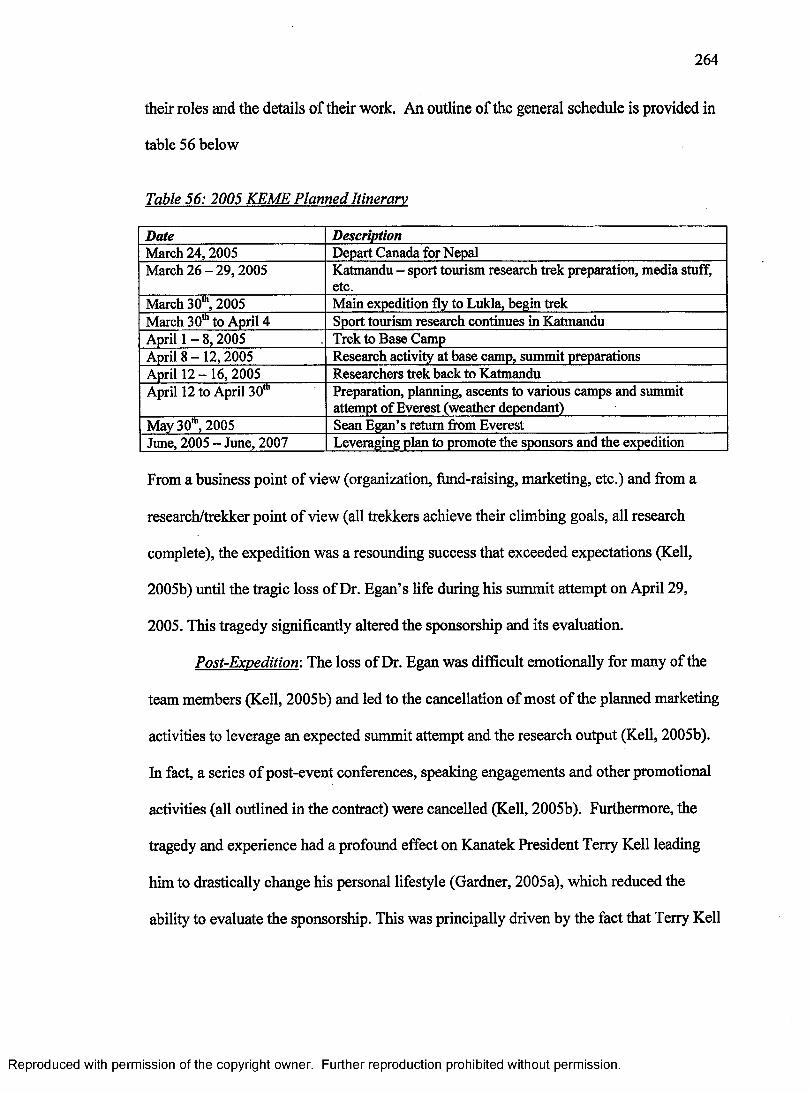
2 6 4
their roles and the details of their work. An outline of the general schedule is provided in
table 56 below
Table 56: 2005 KEME Planned Itinerary
Date DescriptionMarch 24,2005 Depart Canada for NepalMarch 26-29,2005 Katmandu - sport tourism research trek preparation, media stuff,
etc.March 30th, 2005 Main expedition fly to Lukla, begin trekMarch SO01 to April 4 Sport tourism research continues in KatmanduApril 1 - 8, 2005 Trek to Base CampApril 8 - 12, 2005 Research activity at base camp, summit preparationsApril 12 - 16, 2005 Researchers trek back to KatmanduApril 12 to April 30th Preparation, planning, ascents to various camps and summit
attempt of Everest (weather dependant)May 30th, 2005 Sean Egan’s return from EverestJune, 2005 - June, 2007 Leveraging plan to promote the sponsors and the expedition
From a business point of view (organization, fund-raising, marketing, etc.) and from a
research/trekker point of view (all trekkers achieve their climbing goals, all research
complete), the expedition was a resounding success that exceeded expectations (Kell,
2005b) until the tragic loss of Dr. Egan’s life during his summit attempt on April 29,
2005. This tragedy significantly altered the sponsorship and its evaluation.
Post-Exvedition: The loss of Dr. Egan was difficult emotionally for many of the
team members (Kell, 2005b) and led to the cancellation of most of the planned marketing
activities to leverage an expected summit attempt and the research output (Kell, 2005b).
In fact, a series of post-event conferences, speaking engagements and other promotional
activities (all outlined in the contract) were cancelled (Kell, 2005b). Furthermore, the
tragedy and experience had a profound effect on Kanatek President Terry Kell leading
him to drastically change his personal lifestyle (Gardner, 2005a), which reduced the
ability to evaluate the sponsorship. This was principally driven by the fact that Terry Kell
Reproduced with permission of the copyright owner. Further reproduction prohibited without permission.
2 6 5
embraced Dr. Egan’s messages of healthy living and removed himself from the day-to-
day operations of Kanatek to focus on other aspects of his life (Gardner, 2006a; Kell,
2006b).
However, some of the objectives of the sponsorship were still addressed and new
charitable efforts resulting from the tragedy were also developed; largely to honour Dr.
Egan and extend his legacy (Gardner, 2006a). As of January 2007, a major ongoing fund
raising effort to build a school at the ‘Child Haven’ Canadian orphanage just outside of
Katmandu in Dr. Egan’s name was approximately a year from completion. The effort was
developed by the ‘ Ad-Astra’ group (‘ad astra’ was an often-heard Dr. Egan quote
meaning ‘aim high’). The mission of Ad-Astra, which was started and managed by
expedition team members, was to build the school to honour Dr. Egan and to promote
many of the ideas that Dr. Egan believed in (www.adastra-aimhigh.comT As of
December 1,2006, approximately $140,000 of the $150,000 required had been raised
from a variety of fund-raising and message-sharing activities, including (i) two annual
charity golf tournaments in Ottawa that raised $70,000 combined, (ii) an art show called
“A Show of Love” in February 2006 held in Dr. Egan’s hometown of Almonte which
donated 50% of its proceeds, (iii) presentations and tributes at the ‘Green Door
Restaurant Evening’ held in Ottawa on January 30th, 2006, (iv) a tribute to Dr. Egan in
January 2006 in Sherbrooke, Quebec by Gabriel Filippi, who successfully climbed
Everest in 2005, where all proceeds were donated to Ad Astra, (v) a unique fundraiser
organized by Dr. Egan’s nephew, Gordon Hassett, in Ireland where he grew his hair for
15 months and organized a ‘shaveathon’ where people sponsored him to shave it off, (vi)
two Nepalese nights jointly organized by Expedition members and the Nepalese-
Reproduced with permission of the copyright owner. Further reproduction prohibited without permission.

2 6 6
Canadian community were held at a Nepalese restaurant in Toronto in the fall of 2005,
(vi) an Ad-Astra Christmas Card drive in December 2005, (vii) a photography exhibit in
Almonte, (viii) seminars given by expedition members to organizations around the
Everest theme, (ix) a 40th birthday party turned into a $4,000 fundraiser by one
expedition member, and (x) a campaign kick-off for Ad-Astra on June 2005 that included
an auction of 250 items of expedition paraphernalia which generated over $20,000.
6.2.2.1.2 Build Relationships
Prior to committing to the evaluation, it was confirmed that relationships were in
place with the sponsor (Kanatek) and the sponsee (KEME). No intermediaries were
identified as having significant influence on the sponsorship. The relationship on the
sponsee side was considered very strong as the researcher was a core team member. On
the sponsor side, Kanatek noted strong interest in the evaluation and the relationship
developed over time. Full disclosure of information and support from both sides was
strong between June 2004 and July 2006. However, a change in management structure at
Kanatek in 2006 included Terry Kell reducing his role in the day-to-day operations at
Kanatek and the hiring of a new managing director to take over that responsibility. This,
in turn, rendered the evaluation a low priority.
Reproduced with permission of the copyright owner. Further reproduction prohibited without permission.
2 6 7
6.2.2.1.3 Cost-Beneflt Pre-Test
An informal cost-benefit pre-test was carried out by the author following the
signing of the sponsorship contract. This involved (i) consideration of the reach of
KEME, (ii) estimation of the size of the sponsorship (Kell, 2004b) and (iii) assessment of
the potential impacts of the general objectives expressed or forecasted from the
discussions to that point (Kell, 2004c; Egan 2004b). The results of this pre-test indicated
that sufficient costs would be incurred and that benefit to both the sponsor and the
sponsee was possible, supporting an evaluation.
6.2.2.1.4 Decision
Recorded officially in emails between the researcher and Kell (2004c) on
September 24,2004, the ‘Go’ decision for the evaluation was jointly made during a
September 2004 visit to Kanatek headquarters by the researcher. As the Process Model
prescribes, a number of steps had been carried out prior to the decision point to determine
whether or not to evaluate the sponsorship. These steps were implemented in the spring
and summer o f2004 in order to be certain that the process model was worth
implementing. Given the relatively small size of the sponsorship and the close proximity
of the researcher to the sponsorship, this was done on an ad-hoc basis (i.e., a less formal
approach was sufficient given strong relationships and high levels of knowledge).
The decision to evaluate was revisited on four future occasions by both the
researcher and the sponsor: (i) following the death of Dr. Egan, (ii) in March 2006 (Kell,
2006b) due to the slow process of dissertation research, (iii) in August 2006 following a
change in management structure at Kanatek which put the evaluation process in doubt
Reproduced with permission of the copyright owner. Further reproduction prohibited without permission.
2 6 8
(Kell, 2006a), and (iv) in December 2006 by the researcher following 14 weeks of no
response from Kanatek, at which point the decision was made to shelve the evaluation.
On each of the four occasions, Kanatek representatives expressed interest in continuing
with and completing the evaluation, however it became evident over time that the
evaluation was becoming less and less of a priority.
6.2.2.2 Step 2: Collect Data Concerning the Sponsorship
The collection of data for this case study was a lengthy process that was impacted
by a few unforeseen events, including (i) the length of dissertation research, (ii) the death
of Dr. Egan and (iii) changes in management at Kanatek.
6.2.2.2.1 Data Gathering
Following the ‘GO’ decision of September 2004, background data collection
began in an organized fashion as per Step 2 of the Process Model D2. In anticipation of
the potential evaluation, however, data had been collected since June 2004. Data was
gathered from both the sponsor and the sponsee only. Although no intermediaries (other
sponsors, minor partners, suppliers) were determined to be significantly enough involved
to be included in the evaluation, at the request of the sponsor (Kell, 2004c) Kanatek’s
relationship with one of the co-sponsors, HP, was included in the evaluation plan. The
data collection process continued until the fall of 2006 and included obtaining and
reviewing the documents as described in the following table.
Reproduced with permission of the copyright owner. Further reproduction prohibited without permission.
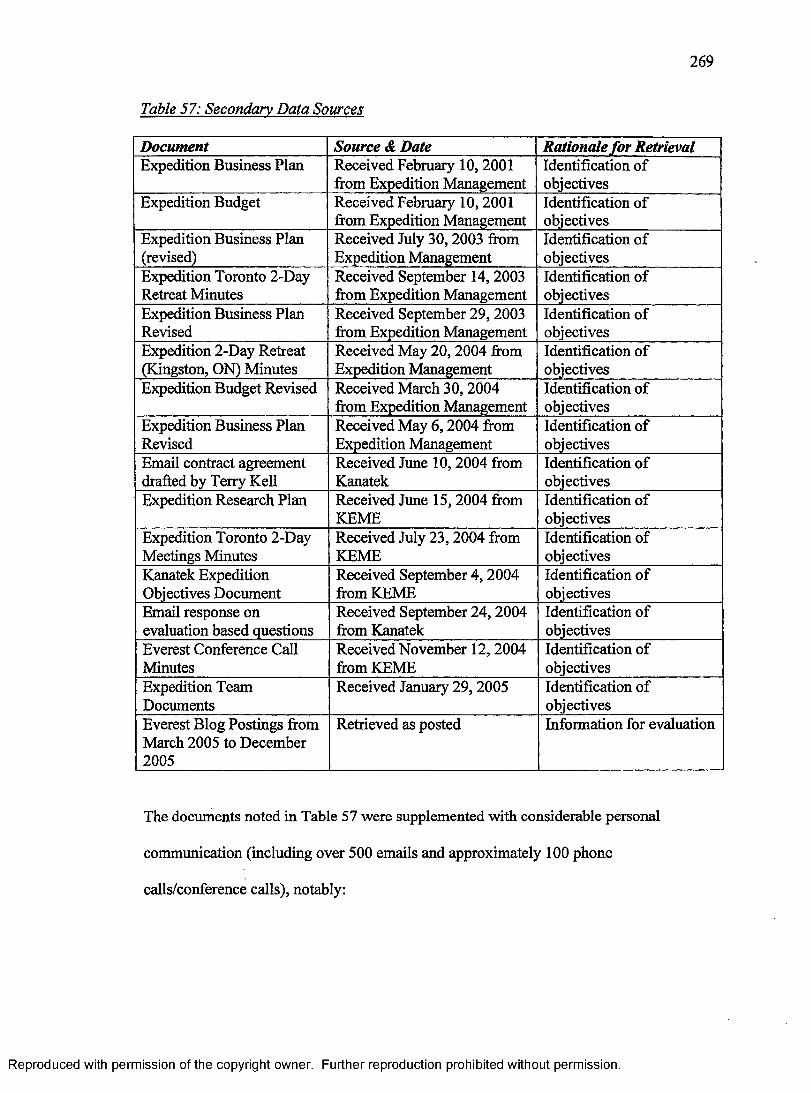
2 6 9
Table 57: Secondary Data Sources
Document Source & Date Rationale for RetrievalExpedition Business Plan Received February 10,2001
from Expedition ManagementIdentification of objectives
Expedition Budget Received February 10, 2001 from Expedition Management
Identification of objectives
Expedition Business Plan (revised)
Received July 30,2003 from Expedition Management
Identification of objectives
Expedition Toronto 2-Day Retreat Minutes
Received September 14,2003 from Expedition Management
Identification of objectives
Expedition Business Plan Revised
Received September 29,2003 from Expedition Management
Identification of objectives
Expedition 2-Day Retreat (Kingston, ON) Minutes
Received May 20,2004 from Expedition Management
Identification of objectives
Expedition Budget Revised Received March 30,2004 from Expedition Management
Identification of objectives
Expedition Business Plan Revised
Received May 6,2004 from Expedition Management
Identification of objectives
Email contract agreement drafted by Terry Kell
Received June 10,2004 from Kanatek
Identification of objectives
Expedition Research Plan Received June 15,2004 from KEME
Identification of objectives
Expedition Toronto 2-Day Meetings Minutes
Received July 23,2004 from KEME
Identification of objectives
Kanatek Expedition Objectives Document
Received September 4,2004 from KEME
Identification of objectives
Email response on evaluation based questions
Received September 24,2004 from Kanatek
Identification of objectives
Everest Conference Call Minutes
Received November 12,2004 from KEME
Identification of objectives
Expedition Team Documents
Received January 29,2005 Identification of objectives
Everest Blog Postings from March 2005 to December 2005
Retrieved as posted Information for evaluation
The documents noted in Table 57 were supplemented with considerable personal
communication (including over 500 emails and approximately 100 phone
calls/conference calls), notably:
Reproduced with permission of the copyright owner. Further reproduction prohibited without permission.
2 7 0
1. Various meetings, lunches, calls and emails with expedition leader Dr. Sean Egan
(March 2000 to March 2005).
2. Various meetings, lunches, calls and emails with expedition Base Camp manager
Harold Mah (Sep 2004 to Aug 2006).
3. Meeting with Sean Egan and Terry Kell, Ottawa, September 8,2004.
4. Meetings with various Kanatek employees and partners at the 2004 Kanatek AGM.
5. Meeting at Kanatek Headquarters with Terry Kell (President) and Carol Gardner
(Project Manager), June 7,2005.
6. Various discussions during the expedition (March/April, 2005).
7. Meeting with Terry Kell in Ottawa, October 1,2005.
8. Ryerson presentation on Everest on November 9,2005; which included discussions
with sponsors, researchers and expedition members.
9. Meetings with Terry Kell and Carol Gardner on February 10,2006 at Kanatek
Headquarters and over breakfast; which included two separate in-depth interviews
and the sharing of various internal documents.
10. Meeting with Terry Kell in Ottawa on August 28,2006.
It should also be noted that Kanatek did its due diligence on the evaluation in
order to make sure that the process would meet their needs. This was evident via detailed
discussions and follow-up in the spring and summer of 2004 leading up to the formal
decision to evaluate in September 2004. Further, following the management change at
Kanatek in 2006, the decision to evaluate was re-visited by the new management team
where it was not identified as a top priority (Kell, 2006c). This led to the eventual
Reproduced with permission of the copyright owner. Further reproduction prohibited without permission.
2 7 1
decision to stop the data collection process in December 2006 due to a lack of response
from the new management team.
6.2.2.2.2 Attributes o f the Sponsor-Sponsee Relationship
The following attributes of the sponsor-sponsee relationship were observed as per
the process model:
• Sponsorship Age: conceived in 2004, the researcher was involved at all stages of this
sponsorship; pre-sponsorship, during the contract phase and following the expedition.
• Sponsee Type: this is an instance of a typical-sponsee (see section 2.1.2.5 for
definitions of mega-sponsee and typical sponsee).
• Industry Effects: the industries of both sponsor and sponsee are described here:
o Systems Integrators: since the mid-1990’s, this industry has been under
considerable pressure with all players shrinking in size, including Kanatek and
with a large number having exited the business altogether (Kell, 2005b). More
precisely, Kell estimated that in the early 1990’s, they had 25 direct competitors
and that, today, there are about 8 (Kell, 2005b). The fact that the market was
beginning to turn around in the early 2000’s was an impetus for this sponsorship,
o Everest Expeditions: over 2300 people have reached the summit of Mount Everest
over the past 30 years (BBC News, 2005), making the achievement of financial
support (sponsorship or otherwise) for an expedition increasingly difficult as the
novelty effect has worn off.
• Sponsorship Size: At $50,000 (sponsorship fee), this is a small sponsorship46.
46 The label of ‘medium-sized’ sponsorship is based on an author-created scale which views anysponsorship of under $10,000 in value as very small: between $10,000 and $100,000 as small: from
Reproduced with permission of the copyright owner. Further reproduction prohibited without permission.
2 7 2
• Phase: At the date of writing (January, 2007), we are 21 months post-expedition.
• Resources-. The Kanatek sponsorship is a combination of cash contribution, in-kind
investments and related charity and other activities that will benefit both the sponsor
and the sponsee. Approximately a quarter million Canadian dollars were invested.
• Level: Kanatek is the title sponsor of the expedition.
• Sponsor-Sponsee f i t : Representatives from the sponsor and the sponsee confirm that
there is a good strategic fit between Kanatek and KEME (Egan, 2004a, Kell, 2004b;
2004c) because Kanatek would be able to leverage KEME to achieve its objectives
and KEME received the resources it needed from a quality sponsor.
• Leveraging: Both the sponsor and sponsee invested additional funds:
o Sponsor (Kanatek) - A review of sponsorship budgets and reports of senior staff
(Gardner, 2005a; Kell, 2005b) supports that Kanatek leveraged the sponsorship
significantly but strategically. In addition to the sponsorship fee of $50,000,
Kanatek estimates that it invested $250,000 of cash and in-kind resources
(including a $20,000 contribution from co-sponsor HP) towards the sponsorship
(Kell, 2005c) for a leveraging ratio of 5:1. An example of the strategic leveraging
of KEME is the two related ‘data-assault’ industry conferences built around the
expedition. These events had a total budget of $94,750 but also generated $73,000
in sponsorship from industry partners which reduced Kanatek’s overall cost to
$21,750.
o Sponsee (KEME) - By virtue of research funding, self-investment, and other
activities, the sponsee (i.e. climbers, researchers and non-sponsor-related trekkers
$100,000 to $1,000,000 as medium: from $1,000,000 to $10,000,000 as larze: and greater than $10,000,000as very large.
Reproduced with permission of the copyright owner. Further reproduction prohibited without permission.
on the expedition) invested approximately $300,000 in additional resources. The
composition of the $300,000 is varied and from many sources, including
individual researcher, trekker and climber fees.
• Pre-existing opinions: No significant pre-existing opinions were observed as expected
with a first-time sponsorship (Egan, 2004a; Kell, 2004a).
• Target Market. The Expedition plan outlined seven stakeholders: climbers,
researchers on the expedition, researchers for whom the expedition collects data,
trekkers, sponsors, charities and media partners. These targets were identified as
potential sources of funding, promotional value and/or a cause in need of support
(Egan, 2004b). Kanatek’s plan outlined 5 target markets: industry, staff, key partners
and clients, key prospects and charity. These targets were identified as potential
sources of business, promotional value and/or a cause in need of support (Kell,
2004b).
6.2.2.3 Step 3: Articulate Objectives
The third stage of the process model involves articulating the objectives to be
evaluated. Following a review of the contract, sponsor input, and sponsee input, the
articulation of objectives chart was first drafted in September 2004. The chart was then
sent to Kanatek and Dr. Egan and, following the receipt of their continued feedback over
the life of the sponsorship, the final version (August 29,2006) is provided below in Table
58 and includes the formal and the implicit objectives obtained from the data collection.
Specifically, objectives and their reach were obtained following review of (i) the
sponsorship contract, (ii) marketing plans for each of sponsor, sponsee and co-sponsor,
Reproduced with permission of the copyright owner. Further reproduction prohibited without permission.

2 7 4
and (iii) in-depth interviews (transcripts) with the leaders of the sponsor and the sponsee.
It is important to note that objectives are presented as they were expressed in the contract,
documentation or interview transcripts. This research did not involve the construction of
the objectives.
Table 58: KEME: Articulation o f Objectives. Reach Activities and Outputs
Data Source Objective ReachContract (emailed on June 10,2004 and agreed to by sponsee same day).
To leverage the sponsorship into business for Kanatek
Existing CustomersNew Customers
To raise Kanatek’s profile in its market Kanatek’s target markets47
Kanatek Expedition Plan (received September 4, 2004)
To support Dr. Egan successfully summiting Mount Everest
Expedition
To demonstrate the successful use of technology in a hostile environment
Blog readers
To support important scientific research by Canadian Universities
Expedition researchers
To organize the world’s highest hockey game
Expedition
To raise money for the Child Haven International orphanage
Child Haven International
Sponsor Interviews (Terry Kell on February 7,2005 and Carol Gardner on February 10, 2006)
To increase employee morale CEOTechnology employeesAdministrative staffSales teamContractors/Sub-contractors
Sponsee Interviews (Sean Egan, October 22, 2000) & Business Plan
To raise the resources necessary Sponsors, Granting Agencies, Universities, Foundations
To provide a great and safe experience Trekkers, Climbers, ResearchersTo promote the benefits of active living Mass marketTo conduct applied academic research Researchers
6.2.2.4 Step 4: Establish Metrics
Metrics and methods for each of the objectives in Table 58 were established and
developed. Subsequently some were implemented and many cancelled due to the
developments reported in the description of this case. Table 59 below outlines the metrics
47 Kanatek (Kell, 2004c) defines its target market: “any organization that is managing large amounts of data so government (prov/fed), communications (service providers and tech developers), finance (schedule A banks, tier 2 financials, brokerage firms), and commercials (manufacturers, Pharma, insurance)”
Reproduced with permission of the copyright owner. Further reproduction prohibited without permission.
developed for each of the objectives. Due to the fact that several of the metrics were
cancelled or altered during the evaluation, the objectives and their metrics are numbered
1 through 11 with reach only being considered for metrics or methods that were being
assessed. A further table (Table 60) delves deeper into such metrics and combines them
as certain methods are used to respond to more than one objective. It is important to note
that the selection of metrics and methods to measure each objective was based on a
collaborative decision-making process between the researcher, Kanatek and KEME vis-a-
vis resources available and the relative importance of the objective.
Reproduced with permission of the copyright owner. Further reproduction prohibited without permission.
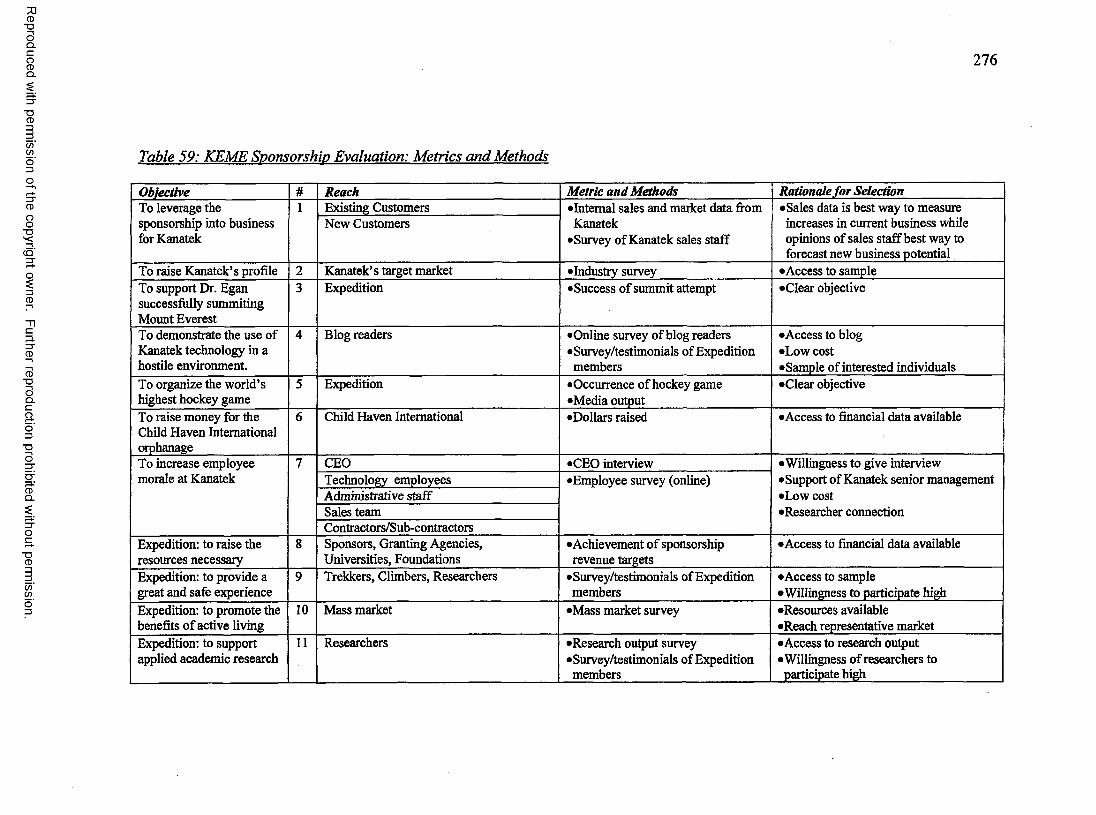
Reproduced
with perm
ission of the
copyright ow
ner. Further
reproduction prohibited
without
permission.
2 7 6
Table 59: KEME Sponsorship Evaluation: Metrics and Methods
Objective it Reach Metric and Methods Rationale for SelectionTo leverage the sponsorship into business for Kanatek
1 Existing Customers •Internal sales and market data from Kanatek
•Survey of Kanatek sales staff
•Sales data is best way to measure increases in current business while opinions of sales staff best way to forecast new business potential
New Customers
To raise Kanatek’s profile 2 Kanatek’s target market •Industry survey •Access to sampleTo support Dr. Egan successfully summiting Mount Everest
3 Expedition •Success of summit attempt •Clear objective
To demonstrate the use of Kanatek technology in a hostile environment.
4 Blog readers •Online survey of blog readers •Survey/testimonials of Expedition members
•Access to blog •Low cost•Sample of interested individuals
To organize the world’s highest hockey game
5 Expedition •Occurrence of hockey game •Media output
•Clear objective
To raise money for the Child Haven International orphanage
6 Child Haven International •Dollars raised •Access to financial data available
To increase employee morale at Kanatek
7 CEO •CEO interview •Willingness to give interview •Support of Kanatek senior management •Low cost•Researcher connection
Technology employees •Employee survey (online)Administrative staffSales teamContractors/Sub-contractors
Expedition: to raise the resources necessary
8 Sponsors, Granting Agencies, Universities, Foundations
•Achievement of sponsorship revenue targets
•Access to financial data available
Expedition: to provide a great and safe experience
9 Trekkers, Climbers, Researchers •Survey/testimonials of Expedition members
•Access to sample •Willingness to participate high
Expedition: to promote the benefits of active living
10 Mass market •Mass market survey •Resources available •Reach representative market
Expedition: to support applied academic research
11 Researchers •Research output survey •Survey/testimonials of Expedition members
•Access to research output •Willingness of researchers to participate high
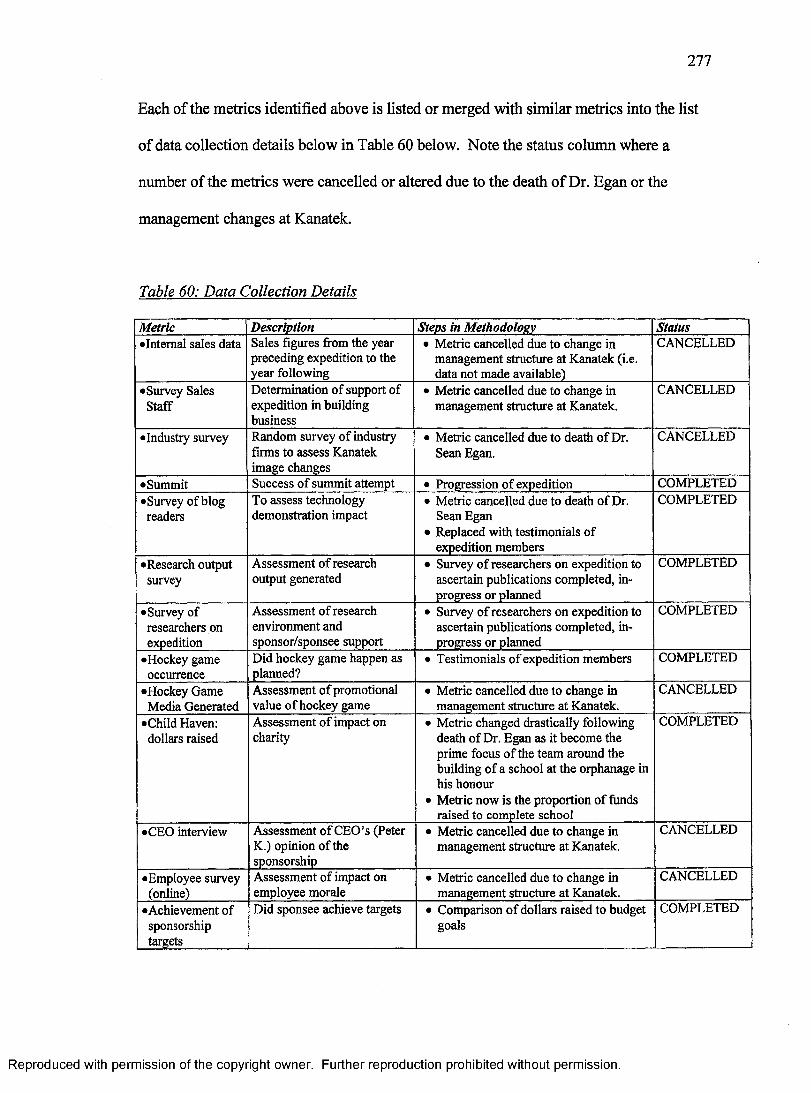
2 7 7
Each of the metrics identified above is listed or merged with similar metrics into the list
of data collection details below in Table 60 below. Note the status column where a
number of the metrics were cancelled or altered due to the death of Dr. Egan or the
management changes at Kanatek.
Table 60: Data Collection Details
Metric Description Steps in Methodology Status•Internal sales data Sales figures from the year
preceding expedition to the year following
• Metric cancelled due to change in management structure at Kanatek (i.e. data not made available)
CANCELLED
•Survey Sales Staff
Determination of support of expedition in building business
• Metric cancelled due to change in management structure at Kanatek.
CANCELLED
•Industry survey Random survey of industry firms to assess Kanatek image changes
• Metric cancelled due to death of Dr. Sean Egan.
CANCELLED
•Summit Success of summit attempt • Progression of expedition COMPLETED•Survey of blog readers
To assess technology demonstration impact
• Metric cancelled due to death of Dr. Sean Egan
• Replaced with testimonials of expedition members
COMPLETED
•Research output survey
Assessment of research output generated
• Survey of researchers on expedition to ascertain publications completed, inprogress or planned
COMPLETED
•Survey of researchers on expedition
Assessment of research environment and sponsor/sponsee support
• Survey of researchers on expedition to ascertain publications completed, inprogress or planned
COMPLETED
•Hockey game occurrence
Did hockey game happen as planned?
• Testimonials of expedition members COMPLETED
•Hockey Game Media Generated
Assessment of promotional value of hockey game
• Metric cancelled due to change in management structure at Kanatek.
CANCELLED
•Child Haven: dollars raised
Assessment of impact on charity
• Metric changed drastically following death of Dr. Egan as it become the prime focus of the team around the building of a school at the orphanage in his honour
• Metric now is the proportion of funds raised to complete school
COMPLETED
•CEO interview Assessment of CEO’s (Peter K.) opinion of the sponsorship
• Metric cancelled due to change in management structure at Kanatek.
CANCELLED
•Employee survey (online)
Assessment of impact on employee morale
• Metric cancelled due to change in management structure at Kanatek.
CANCELLED
•Achievement of sponsorship targets
Did sponsee achieve targets • Comparison of dollars raised to budget goals
COMPLETED
Reproduced with permission of the copyright owner. Further reproduction prohibited without permission.
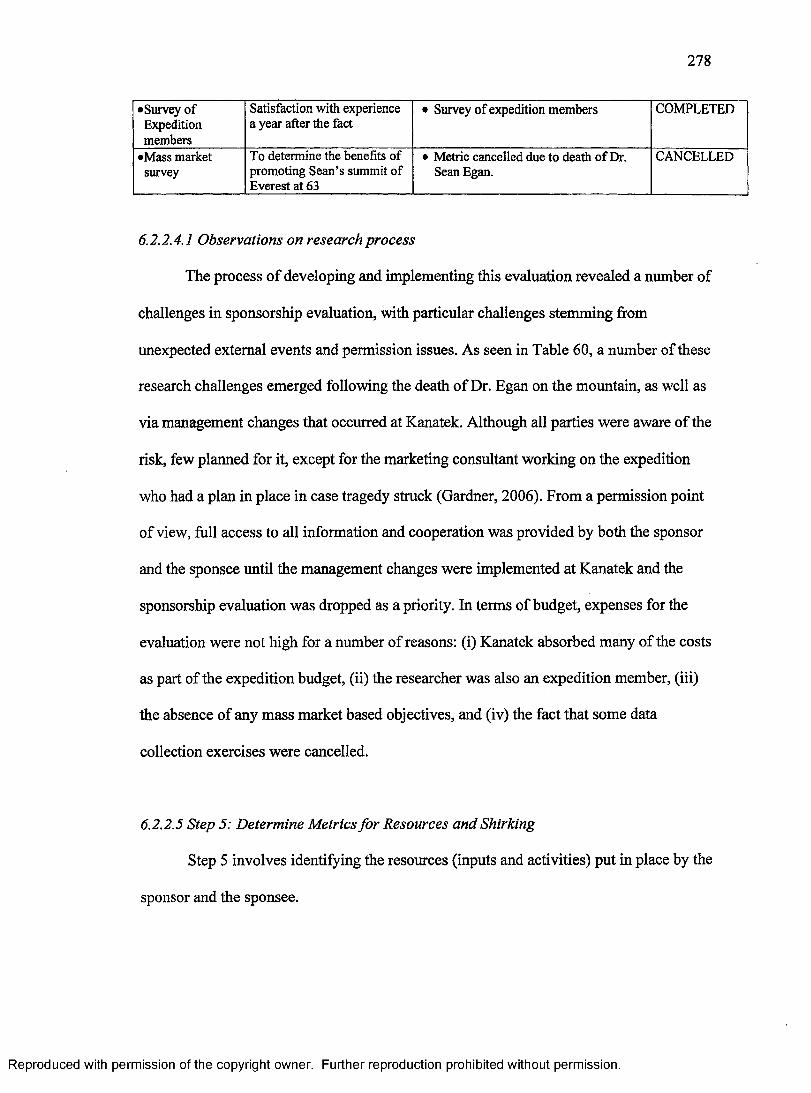
2 7 8
•Survey of Expedition members
Satisfaction with experience a year after the fact
• Survey of expedition members COMPLETED
•Mass market survey
To determine the benefits of promoting Sean’s summit of Everest at 63
• Metric cancelled due to death of Dr. Sean Egan.
CANCELLED
6.2.2.4.1 Observations on research process
The process of developing and implementing this evaluation revealed a number of
challenges in sponsorship evaluation, with particular challenges stemming from
unexpected external events and permission issues. As seen in Table 60, a number of these
research challenges emerged following the death of Dr. Egan on the mountain, as well as
via management changes that occurred at Kanatek. Although all parties were aware of the
risk, few planned for it, except for the marketing consultant working on the expedition
who had a plan in place in case tragedy struck (Gardner, 2006). From a permission point
of view, full access to all information and cooperation was provided by both the sponsor
and the sponsee until the management changes were implemented at Kanatek and the
sponsorship evaluation was dropped as a priority. In terms of budget, expenses for the
evaluation were not high for a number of reasons: (i) Kanatek absorbed many of the costs
as part of the expedition budget, (ii) the researcher was also an expedition member, (iii)
the absence of any mass market based objectives, and (iv) the fact that some data
collection exercises were cancelled.
6.2.2.5 Step 5: Determine Metrics for Resources and Shirking
Step 5 involves identifying the resources (inputs and activities) put in place by the
sponsor and the sponsee.
Reproduced with permission of the copyright owner. Further reproduction prohibited without permission.
2 7 9
6.2.2.5.1 Resources and Activities
The sponsorship fees paid by Kanatek for title sponsorship of the 2005 Everest
Expedition were $50,000. As noted previously, the $50,000 fee was leveraged by a five
to one ratio (i.e., approximately $250,000 of cash and in-kind contributions). Kanatek’s
two-year plan for leveraging the KEME sponsorship was termed ‘The Kanatek Trek to
Base Camp’ and involved a number of coordinated activities including: (i) an invitation
to key customers, partners and potential customers to come along as trekkers and partake
in the experience, (ii) a technology demonstration at base camp over satellite link, (iii) a
co-sponsorship program which sought to involve key suppliers and customers in KEME,
(iv) technology conferences in Toronto and Ottawa (March 2005), (v) an event kick-off
and launch (March 2005), (vi) technology conferences and dinners in Toronto, Ottawa
and Montreal (November 2004), (vii) an expedition preparation meeting with trekkers,
climbers and researchers (February 2005), (viii) an expedition send-off at the Ottawa and
Toronto airports (March 2005), (ix) a welcome back reception for the expedition team
(changed to a celebration of Dr. Egan around his funeral in May 2005), and (x) a
minimum of four one-day Technology Conferences and Dinners in Ottawa, Montreal,
and Toronto (planned for the fall 2005 but later cancelled). Kanatek also leveraged its
activities strategically with co-sponsors generating $73,000 in sponsorship from industry
partners for the conferences and $20,000 from HP for co-sponsorship of the expedition.
Kanatek, as title sponsor, also provided significant support to KEME, including
(i) providing financial and in-kind support to the expedition, (ii) supporting the various
Reproduced with permission of the copyright owner. Further reproduction prohibited without permission.
2 8 0
research projects48, (iii) managing public relations and media events for KEME, (iv)
developing and managing the KEME website, (iv) hiring of a base camp manager to
support the summit bid, (v) supporting the participation of the Kanatek CEO on the trek,
(vi) providing the necessary technology equipment for the trek including satellite links,
(vii) providing data back-up services and equipment to the researchers, and (viii)
organizing a hockey game at Base Camp, including providing and transporting the
necessary equipment. In return, Kanatek required (i) the naming rights to the expedition,
(ii) photos of the Kanatek flag (and that of co-sponsor HP) on the summit and at base
camp, (iii) the right of refusal on any other sponsor, (iv) the right to bring in other
sponsors, (v) the placement of the Kanatek logo (and that of HP) embroidered on clothing
of all expedition team members, and (vi) the right to use the expedition to raise money
for the charity of Kanatek’s choice.
6.2.2.5.2 Shirking
The second aspect of Step 5 involves identifying the potential shirking
behaviours. In this sponsorship evaluation case study, no evidence of shirking was
observed or found. In fact, the opposite occurred, where the sponsor was more
supportive, engaged and involved than expected. Their additional involvement included
investing additional resources as the process went on, and driving the activities of the
charity that was formed following the tragedy on the mountain.
48 Note that Kanatek requested it be acknowledged on all resulting research papers.
Reproduced with permission of the copyright owner. Further reproduction prohibited without permission.
2 8 1
6.2.2.6 Step 6: Collect and Analyze the Data (Results)
This step involves implementing all of the metrics by first gathering the necessary
data and, second, analyzing the generated results. Given that the effects of 11 objectives
were measured using 14 data collection methods, the presentation of these results and
analysis is lengthy and complex. In order to present the findings in a coherent way that
outlines the process undertaken, 14 short sub-sections are presented comprised of (i) the
methodological details of each of the 14 data collection exercises, and (ii) a summary
results section and table of the data analysis for each of the 11 objectives.
6.2.1.6.1 Data Collection Exercises
The data gathering phase of Step 6 in Process Model D2 is described here with
the presentation of the methodological details of each of the 14 data collection exercises.
Data Collection Exercise #1: Internal Sales Data-. In order to assess Objective #1,
Kanatek internal sales and market data, both pre- and post-expedition, was to be provided
to the researcher. This was cancelled following the change in management structure at
Kanatek. A memo outlining the data requested is attached at Appendix I.
Data Collection Exercise #2: Survey Sales Staff. The survey was prepared as part
of the metric for Objectives #1 and #7, but its implementation was cancelled following
the change in management structure at Kanatek. A copy of the survey is attached as
Appendix J.
Data Collection Exercise #3: Industry Survey. Kanatek had agreed to provide the
researcher with its database of clients and potential clients in its markets. A phone survey
was planned to address Objective #3 with each organization to assess if the KEME
Reproduced with permission of the copyright owner. Further reproduction prohibited without permission.
2 8 2
sponsorship had an effect on Kanatek’s profile in these markets. This data collection
exercise was cancelled following the tragedy.
Data Collection Exercise #4: Summit: With respect to supporting the summit
attempt (Objective #4), Kanatek provided all resources requested by the sponsee
($50,000 cash, media support, equipment, clothing and communications). In terms of
climbing progress, the expedition was a success at all levels until the tragedy which saw
the expedition leader die during his preparations to summit the mountain. At the time, Dr.
Egan was 3 weeks into the acclimatization phase and was going back and forth between
base camp, camp 1 and camp 2. The objective of attaining the summit was not achieved.
Data Collection Exercise #5: Survey o f Bios Readers'. One of Kanatek’s
objectives, the purpose of objective 4 was to demonstrate the ability of technology to
support the expedition both in its research and as part of its communications function.
The plan was to create an online survey to query blog readers about Kanatek’s ability to
use technology on Everest and the effects (if any) of that ability on Kanatek’s brand and
market positioning. This data collection exercise was cancelled following the tragedy.
Data Collection Exercise #6: Survey o f Expedition Members: The survey of
expedition members (Appendix K) was planned to assess Objectives 9 and 11. Following
the cancellation of the anticipated survey of blog readers, it was adapted to also assess
Objective 4.
For Objective 4, expedition members were asked to comment on Kanatek’s ability
to demonstrate the use of technology in a ‘hostile’ environment via an open-ended
question in the survey of expedition members. Of 21 expedition members, 8 responded
to the optional open-ended question to provide detailed comments about the technology
Reproduced with permission of the copyright owner. Further reproduction prohibited without permission.
2 8 3
demonstration. Results are mixed, perhaps revealing the group’s varied levels of
technology knowledge or interest in the technology demonstration. One member
summarized the situation:
Objectives of the IT demos were unclear. The technology was unreliable, and inadequate backup plans were in place. Protocol for access to the technology (who can use it, and for what purposes) was unclear. Kanatek spun the “recovery of iPaq data” situation into a version that was somewhat misleading. The VHF radio technology worked fine, but suffered from unclear communications protocols and roles/responsibilities during ascents.
This view was summarized by a few others. One responded: “from what I know (very
little), technology did not seem to work well (less than expected)”, while another said
“the video uplinks did not work, from that perspective I was not thoroughly impressed”.
A fourth critical viewpoint (tempered with some positive comments) was also provided:
The technology was implemented to get sponsors signed up ($$) and was really an afterthought. It was obvious that Kanatek’s management thought it was important, but the people working at Kanatek were not directly tasked with helping the effort. Only one or two really cared, and it showed. Had Sean not passed away, it would have been difficult to spin the technology to promote the effort and make the investment worthwhile.Having a backup satellite system (or cables) would have been a good idea.The sat phones, however, worked wonderfully and really gave a feeling of comfort and security. Calling my family from Everest Base camp was one of the highlights of the trip.
Interestingly, these four (4) critical viewpoints were offset by four (4) mostly positive
comments, including “good setup of equipment, temperamental due to field condition”,
“very interesting and impressive”, “overall I found the research and experiments
fascinating”, and “very good but we should have had a communication technologist on
the trek”.
The majority of the survey was designed to measure the satisfaction of expedition
members with their experience (Objective 9). Of the 20 expedition members remaining
Reproduced with permission of the copyright owner. Further reproduction prohibited without permission.
2 8 4
alive, 15 responded to the questionnaire for a 75% response rate. They were asked a
variety of Likert scale and open-ended questions, of which some address specifically the
issues of safety and satisfaction. The 5-point Likert scales were structured with responses
of very satisfied (1), satisfied (2), neither satisfied nor dissatisfied (3), dissatisfied (4),
and very dissatisfied (5). When asked to describe their level of satisfaction with the
safety provided, the mean response was a very positive 1.76 with no respondent
indicating either dissatisfied or very dissatisfied. Overall satisfaction was asked at two
points in time (post-expedition and at the date of completion). The effect of the tragedy
on satisfaction was also measured. Levels of satisfaction both post-expedition and
‘today’ were exceptionally high with means of 1.31 and 1.38, respectively. In both cases
over 50% of the respondents indicated “very satisfied”. When assessing the impact of
Dr. Egan’s death on their satisfaction, a different 5-point scale was used with a mean of
3.00 resulting (where 3 is ‘no change). It should be noted that 3 individuals noted that
they were more dissatisfied or much more dissatisfied following the tragedy. An
additional open-ended question allowed respondents to further elaborate on their ideas
around the expedition and how it might have been a better experience. Twelve responses
were provided. Those with particular direction to the sponsorship are presented here.
One respondent pointed out that “the role and specific expectations of the main sponsor
could have been clearer. We did not know if the sponsor was satisfied or not, during and
after the expedition”. A second expedition member underlines their high level of
satisfaction: “it was a wonderful, life-altering experience for which I will be eternally
grateful”. A third identifies the lack of medical support as a key issue:
Without the involvement of Dr. Keith [a researcher on the expedition whoalso happened to be a medical doctor], we would have had NO Medical
Reproduced with permission of the copyright owner. Further reproduction prohibited without permission.
2 8 5
personnel on this trip. This would have been a serious oversight. Given the doctor’s contributions to the health and safety of several people, both on our expedition and outsiders, I consider medical personnel essential to this kind of travel.
One of the sponsors on the trek also pointed out a concern they had:
As a sponsor, it would be important on future trips to establish who gets the best spots for banners and promotional photos. Several times flags and banner of small sponsors and non-sponsors found their way into prominent positions early at key photographic sites with no recourse for removal.When a major sponsor pays thousands of dollars to be involved and cannot obtain the same visibility as a non-sponsor, there is an issue. These “visibility” issues should be taken care of up front.
An interesting dichotomy also emerged from two contradictory points. While one
expedition member noted that “there was a very interesting dichotomy of
science/researcher vs. adventure trekkers in the expedition and the camaraderie that was
fostered between interest groups was simply fantastic”, another critiqued that there were
“too many agendas involved with the expedition...various research projects, technology
and sports.. .should have just focused on three for the entire group”.
An important objective of both the sponsor and the sponsee, Objective 11, was to
create an environment that was conducive to research. Five of nine researchers responded
to the open-ended question about the research environment. Four of them reported a very
positive environment and one respondent suggested that the conditions were not ideal for
the researcher’s work. One respondent noted emphatically that “the expedition was an
extraordinary opportunity to test theory under unique conditions”, while another said that
“doing high-altitude research in this way is very effective. Linking with other researchers
provides a very supportive environment of people and equipment, and shared logistics”
and added that the experience was “highly recommended!” The only negative respondent
Reproduced with permission of the copyright owner. Further reproduction prohibited without permission.
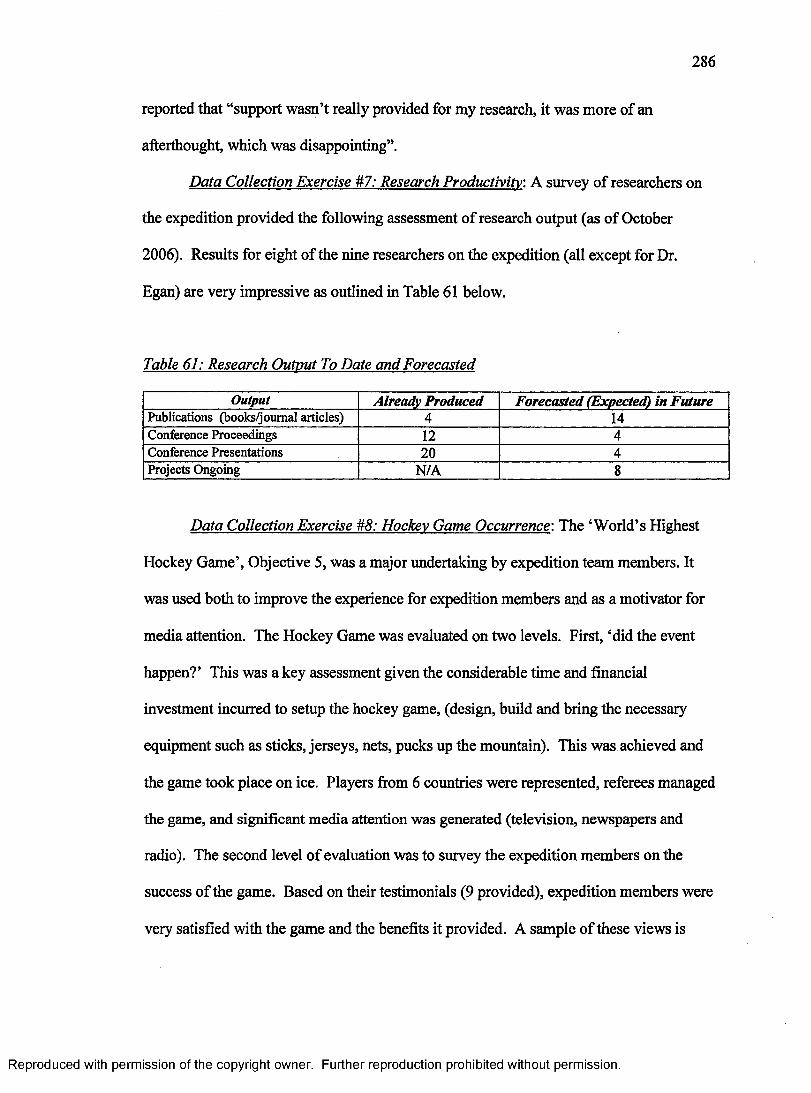
reported that “support wasn’t really provided for my research, it was more of an
afterthought, which was disappointing”.
Data Collection Exercise #7: Research Productivity: A survey of researchers on
the expedition provided the following assessment of research output (as of October
2006). Results for eight of the nine researchers on the expedition (all except for Dr.
Egan) are very impressive as outlined in Table 61 below.
Table 61: Research Output To Date and Forecasted
Output Already Produced Forecasted (Expected) in FuturePublications (books/journal articles) 4 14Conference Proceedings 12 4Conference Presentations 20 4Projects Ongoing N/A 8
Data Collection Exercise #8: Hockey Game Occurrence: The ‘World’s Highest
Hockey Game’, Objective 5, was a major undertaking by expedition team members. It
was used both to improve the experience for expedition members and as a motivator for
media attention. The Hockey Game was evaluated on two levels. First, ‘did the event
happen?’ This was a key assessment given the considerable time and financial
investment incurred to setup the hockey game, (design, build and bring the necessary
equipment such as sticks, jerseys, nets, pucks up the mountain). This was achieved and
the game took place on ice. Players from 6 countries were represented, referees managed
the game, and significant media attention was generated (television, newspapers and
radio). The second level of evaluation was to survey the expedition members on the
success of the game. Based on their testimonials (9 provided), expedition members were
very satisfied with the game and the benefits it provided. A sample of these views is
Reproduced with permission of the copyright owner. Further reproduction prohibited without permission.
2 8 7
provided here. Expedition members noted that the “hockey game was an amazing
concept, executed well. High enjoyment factor and media value”, “it was fun”, and that it
was “a great idea, a superb story”. Another went into more detail:
The game was great. Professionally managed with fantastic equipment and rink, given the circumstances. Congratulations to the organizers. It had a huge impression on the other expeditions on the mountain. But the media impact back home was very minimal (it served only as a story hook for newspapers before we left). It should have been televised live, or at least the highlights and score reported. This fantastic opportunity was underleveraged.
A third expedition member’s testimonial reveals an incredible personal experience:
Another highlight of the trip!!! The hockey game was a blast and a really needed diversion from the technology and politics.. .of base camp. So glad that Terry suggested it and really happy to have played in the highest game ever played. Considering that skating was not an option, and pucks would not have worked, I can’t imagine how it could have been better. To play in the bright sunshine, under the khumbu glacier, with a Sherpa for a ref, and yaks walking through, was worth all the effort.
A few others, while still demonstrating satisfaction, pointed out some issues with having
a game such as this as part of an expedition. One noted that “the link between the hockey
game and the expedition was not clear for me (probably not also for media). However, it
was well organized and I enjoyed the experience.” Another cautioned that “playing any
sport activity could have led to injury. Yes we received some media coverage because of
the NHL strike so we received some media but the fact jerseys and sticks were sold for
charity was very good. Unfortunately not for Child Haven”. Finally, another expressed
frustration that the event was not leveraged as it could have been: “hockey was
outstanding, too bad nothing further was done with it. The momentum was lost and
opportunities were not seized and the moment passed. This is a huge post expedition
mistake especially when extensive amounts of money were invested”.
Reproduced with permission of the copyright owner. Further reproduction prohibited without permission.
2 8 8
Data Collection Exercise #9: Hockey Game Media Generated: Kanatek
articulated an objective (Objective 5) that was put on hold following the tragedy and
cancelled following the change in management structure at Kanatek. However, an
informal assessment of this objective is significant. For example, the game was
mentioned by Peter Mansbridge on the CBC evening news, the Hockey Hall of Fame
wanted a puck and various Ottawa media outlets provided coverage (Kell, 2005c).
Data Collection Exercise #10: Funds Raised for Charity. From the beginning of
the sponsorship (Egan, 2005a; Kell, 2005c), raising money for charity was an important
goal of the expedition (Objective 6). As of December 1,2006,90% of the money
required to build the school in Dr. Egan’s honour at the Child Haven orphanage in
Katmandu, Nepal had been raised. A variety of activities (golf tournaments, theme
nights, buy a brick, etc.) had been successful and plans to complete the fundraising were
expected. In addition to the school, it is important to note that money was raised for Teen
Ranch via the World’s Highest Hockey Game (approximately $25,000) and for Child
Haven (pre-tragedy; approximately $10,000).
Data Collection Exercise #11: CEO Opinion'. As part of Kanatek’s objective to
increase employee morale (Objective 7), an interview with the CEO of the organization
was planned to acquire his opinion. This was cancelled following the change in
management structure at Kanatek.
Data Collection Exercise #12: Employee Online Survey. Employee opinion was
also an important component of Kanatek’s objective to increase employee morale
through the expedition (also Objective 7). The survey was planned for distribution to
management, sales staff, contractors, sub-contractors, administrative staff, and
Reproduced with permission of the copyright owner. Further reproduction prohibited without permission.
2 8 9
technology employees. This was cancelled following the change in management structure
at Kanatek.
Data Collection Exercise #13: Achievement ofSponsorshiv Revenue Targets: The
sponsorship deal with Kanatek provided the resources sought by the expedition in its
sponsorship plan. This was an important objective of the Expedition (Objective 8) and a
necessary one to make the expedition a reality. This included $50,000 in cash and
$30,000 in in-kind services.
Data Collection Exercise #14: Mass Market Survey: One of the drivers of Dr.
Egan’s desire to summit Mount Everest was his hope to promote the benefits of active
living to people of all ages. The data gathering plan called for an assessment of Objective
10 through a mass market survey (Ontario) of randomly selected respondents. This data
collection exercise was cancelled following the tragedy.
6.2.2.7 Step 7: Generate and Interpret Outcomes and Impacts
The final step of the process model involves assessing the outcomes and impacts
of this sponsorship evaluation case study on each of the 11 identified objectives. Given
the major challenges facing this sponsorship (tragedy and sponsor management changes),
the results of the evaluation were not completed as originally planned. However, as table
62 below summarizes, they provide significant insight into the importance of risk
management in sponsorship and the importance of senior management support in
sponsorship evaluation.
Reproduced with permission of the copyright owner. Further reproduction prohibited without permission.

2 9 0
Table 62: Summary Results: Outcomes per Objectives
Objective Results# Description Objective
Obtained49Results of Analysis
1 To leverage the sponsorship into business N/A NOT EVALUATED2 To raise Kanatek’s profile in its market N/A NOT EVALUATED3 To support Dr. Egan successfully
summiting Mount EverestSupport: Partial + Strong support of effort providedSummit: No - Tragedy (summit not achieved)
4 To demonstrate the successful use of technology in a hostile environment.
Limited + 4 positive testimonials- 4 negative testimonials
5 To play the world’s highest hockey game Yes + Game played & media generated + Very positive testimonials
6 To raise money for Charity (pre-tragedy plans for Child Haven and Teen Ranch + post-tragedy plan for school in Dr. Egan’s name)
Yes + $’s for Teen Ranch & Child Haven + Post-tragedy: 90% of funds for Egan
school at Child Haven (as of Dec 06)
7 To increase employee morale N/A NOT EVALUATED8 To raise the resources necessary Yes + Kanatek provided full request9 To provide a great and safe experience on
trekPartial + Very satisfied with safety and trek
- Tragedy (Dr. Egan’s death)10 To promote the benefits of active living N/A NOT EVALUATED11 To support applied academic research Yes + 36 outputs produced already (Oct/06)
+ 22 future outputs expected + 4 of 5 testimonials positive
Shirk: NO SHIRKING BEHA VIO URS WERE IDENTIFIED
In summary, the results of the KEME case - although not complete - provide a number
of important findings for this dissertation. These are discussed in detail in the conclusion
(Chapter 7).
6.2.3 Summary o f Sponsorship Evaluation Case Studies
Chapter 6 presented two sponsorship evaluation case studies. Each case study
included a detailed report on the process of implementing the sponsorship evaluation and
provided an evaluation of the sponsorship. The first example, the ATB-EGP sponsorship
evaluation case study, was an example of a mega-sponsee situation and involved a
complete evaluation of a very complex sponsorship. Extensive results are provided
49 Adopting the same ranking system as developed for the ATB-EGP sponsorship evaluation (see Table 53), the achievement of each objective is measured using a 4-level ranking system (yes, partial, limited, and no) where the levels were defined as follows: yes (objective achieved as desired), partial (considerable but incomplete evidence of successful achievement of the objective), limited (low levels of success, often uncertain), no (no evidence of success). N/A is used to refer to objectives not measured.
Reproduced with permission of the copyright owner. Further reproduction prohibited without permission.
2 9 1
including recommendations for model implementation, for sponsorship evaluation and
for each of the participating organizations (ATB, EGP and ATB MasterCard). The
second example, the KEME sponsorship evaluation case study, was an example of a
typical-sponsee situation that was plagued by uncontrollable external events, namely a
tragedy on the expedition and a major change in management at the sponsor post-event.
Although the sponsor adapted the sponsorship following the impact of the external
events, it greatly reduced the value of the sponsorship evaluation to the participating
organizations. The learning achieved from both case studies is discussed in Chapter 7.
Reproduced with permission of the copyright owner. Further reproduction prohibited without permission.
2 9 2
7.0 Summary, Discussion and Conclusion
The purpose of this dissertation was to apply Agency Theory to sponsorship
evaluation and develop a way to conduct sponsorship evaluations in a meaningful,
legitimate and reliable fashion. This involved constructing and validating a process model
for sponsorship evaluation. The inspiration for the work came from the expressed need of
practitioners and an identified gap in the sponsorship literature. Based on these
motivations, the dissertation set out to accomplish its major objective of constructing the
process model, as well as to address its four specific sub-objectives around the evaluation
of sponsorships to support the development of the process model. In this regard, the
dissertation reviewed the literature on sponsorship, evaluation, sponsorship evaluation
and Agency Theory (i) to improve understanding of the sponsor-sponsee relationship, (ii)
to take inventory of current practice, (iii) to articulate the barriers preventing good
evaluation, and (iv) to outline the benefits of evaluation.
In pursuing the major objective and the four sub-objectives of this dissertation, a
number of contributions to sponsorship theory, Agency Theory and evaluation theory
were made, including contributions to practice (e.g., providing a validated, step-wise
process model that addresses a specific need) and improvements to our understanding of
theory and its application (e.g., the adoption of an Agency Theory framework for
sponsorship evaluation).
A draft process model (version Dl) was crafted based on the literature review on
the topics of sponsorship, evaluation, Agency Theory, performance measurement and
sponsorship evaluation. The draft model was then vetted through an iterative testing
process that included two phases of extensive empirical work. First, the opinions of 14
Reproduced with permission of the copyright owner. Further reproduction prohibited without permission.
2 9 3
experts representing sponsors, sponsees and agencies were garnered through in-depth
interviews to improve the process model (version D2) and to enhance the understanding
of the sponsorship relationship and sponsorship evaluation. Second, two sponsorship
evaluation case studies were undertaken to test Process Model version D2 and to further
improve the Process Model (see version D3).
In an effort to articulate the contributions of this dissertation succinctly, this final
chapter is organized in 6 sub-sections that provide a detailed summary of the research.
These sections are (i) research conclusions from the sponsorship evaluation case studies,
including an updated version of the process model, (ii) contributions to practice, (iii)
contributions to theory and the literature, (iv) limitations of the research, (v) suggestions
for future research and (vi) a conclusion.
7.1 Research Conclusions: Sponsorship Evaluation Case Studies
Building on the literature and on the opinions of expert interviewees, the results
and analysis of the sponsorship evaluation case studies serve as a test of the process
model. The case studies lead to learning about the implementation of the process model
and to the identification of necessary changes. As such, this section of the dissertation is
organized in three parts: (i) the summary findings from the two sponsorship evaluation
case studies, (ii) the updated process model and (iii) the learning vis-a-vis the methods of
implementing the process model.
Reproduced with permission of the copyright owner. Further reproduction prohibited without permission.
2 9 4
7 .1.1 Summary Findings
The ATB-EGP sponsorship evaluation case study is an example of a successful
implementation of the process model. All seven stages of the model were run to
completion, final results were generated and recommendations were provided to the
participating organizations. This sponsorship evaluation case study was an example of a
mega-sponsee scenario where intermediaries were included in the evaluation. In total, 21
objectives and 9 shirking behaviours were assessed. These 30 measurement exercises
provided feedback for an improved process model (as will be noted in section 7.1.2),
methodological improvements (see section 7.1.3), and a better understanding of the array
of objectives available in sponsorship (see section 7.3.4).
The KEME sponsorship evaluation case study is an example of a process model
implementation that was successful in some regards but very unsuccessful in others. Most
notably, two uncontrollable external factors (a tragedy and a change in management
structure at the sponsor) led to the cancellation of a number of the planned data collection
exercises, metrics and methods. Although this led to an incomplete evaluation of the 11
objectives of the sponsorship, a number of important contributions to the development of
the process model were generated. For example, the need to consider the ‘riskiness’ of
the sponsee was evident as was the importance of having a senior champion within the
sponsor or sponsee to ensure that the evaluation is completed. These contributions are
noted in sections 7.1.2 (updated process model), 7.1.3 (methodological improvements),
and 7.3.4 (better understanding of objectives in sponsorship).
These conflicting case outcomes make for an important discussion point. On one
hand, the ATB-EGP case was an example of a near-perfect implementation of the process
Reproduced with permission of the copyright owner. Further reproduction prohibited without permission.
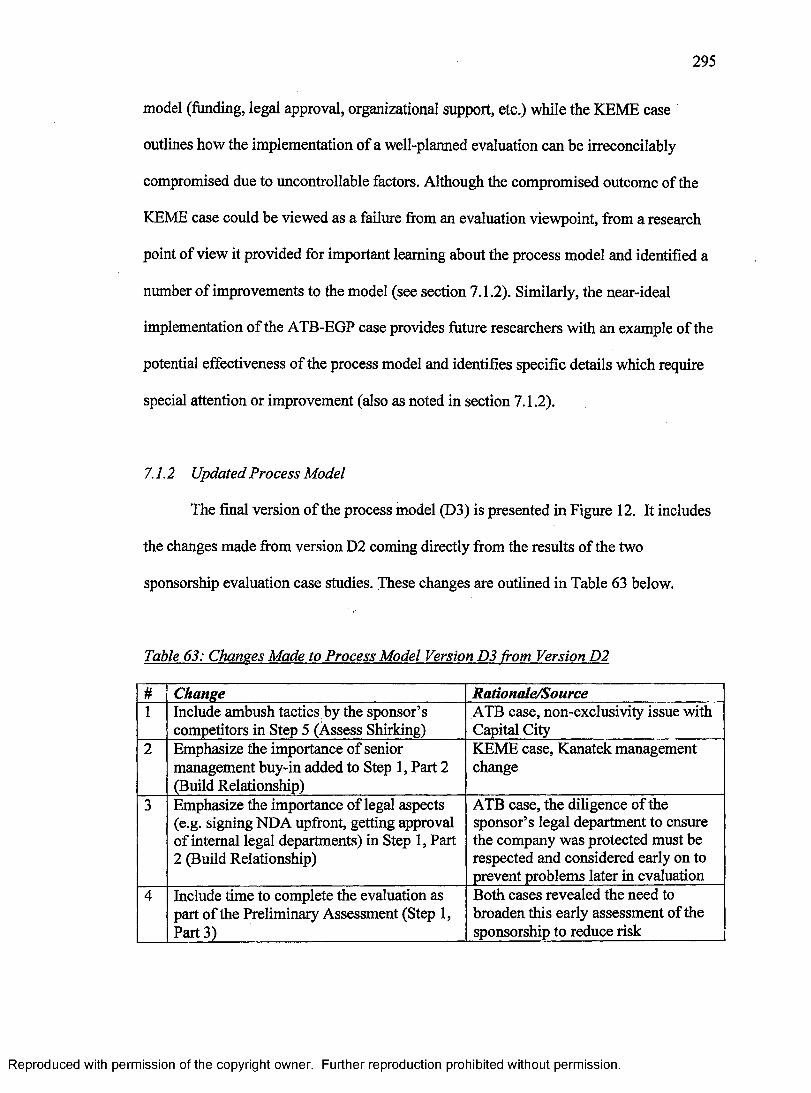
2 9 5
model (funding, legal approval, organizational support, etc.) while the KEME case
outlines how the implementation of a well-planned evaluation can be irreconcilably
compromised due to uncontrollable factors. Although the compromised outcome of the
KEME case could be viewed as a failure from an evaluation viewpoint, from a research
point of view it provided for important learning about the process model and identified a
number of improvements to the model (see section 7.1.2). Similarly, the near-ideal
implementation of the ATB-EGP case provides future researchers with an example of the
potential effectiveness of the process model and identifies specific details which require
special attention or improvement (also as noted in section 7.1.2).
7.1.2 Updated Process Model
The final version of the process model (D3) is presented in Figure 12. It includes
the changes made from version D2 coming directly from the results of the two
sponsorship evaluation case studies. These changes are outlined in Table 63 below.
Table 63: Chames Made to Process Model Version D3 from Version D2
# Change Rationale/Source1 Include ambush tactics by the sponsor’s
competitors in Step 5 (Assess Shirking)ATB case, non-exclusivity issue with Capital City
2 Emphasize the importance of senior management buy-in added to Step 1, Part 2 (Build Relationship)
KEME case, Kanatek management change
3 Emphasize the importance of legal aspects (e.g. signing NDA upfront, getting approval of internal legal departments) in Step 1, Part 2 (Build Relationship)
ATB case, the diligence of the sponsor’s legal department to ensure the company was protected must be respected and considered early on to prevent problems later in evaluation
4 Include time to complete the evaluation as part of the Preliminary Assessment (Step 1, Part 3)
Both cases revealed the need to broaden this early assessment of the sponsorship to reduce risk
Reproduced with permission of the copyright owner. Further reproduction prohibited without permission.
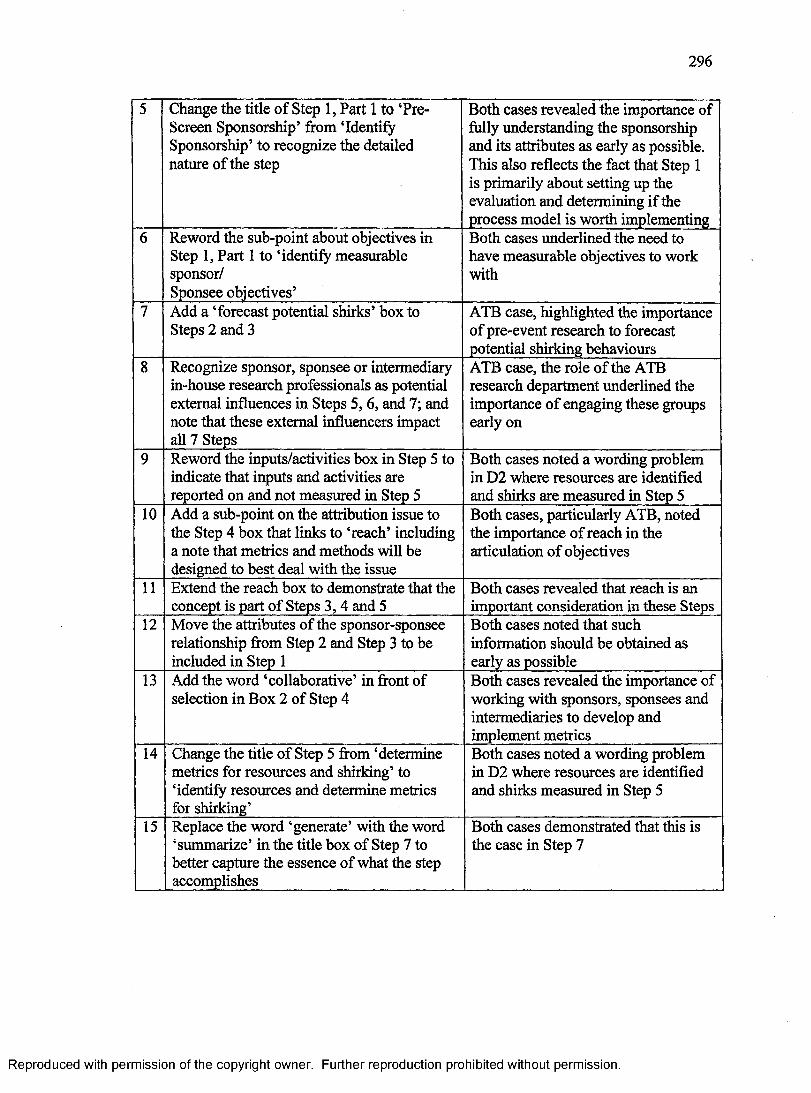
2 9 6
5 Change the title of Step 1, Part 1 to ‘Pre- Screen Sponsorship’ from ‘Identify Sponsorship’ to recognize the detailed nature of the step
Both cases revealed the importance of fully understanding the sponsorship and its attributes as early as possible. This also reflects the fact that Step 1 is primarily about setting up the evaluation and determining if the process model is worth implementing
6 Reword the sub-point about objectives in Step 1, Part 1 to ‘identify measurable sponsor/Sponsee objectives’
Both cases underlined the need to have measurable objectives to work with
7 Add a ‘forecast potential shirks’ box to Steps 2 and 3
ATB case, highlighted the importance of pre-event research to forecast potential shirking behaviours
8 Recognize sponsor, sponsee or intermediary in-house research professionals as potential external influences in Steps 5,6, and 7; and note that these external influencers impact all 7 Steps
ATB case, the role of the ATB research department underlined the importance of engaging these groups early on
9 Reword the inputs/activities box in Step 5 to indicate that inputs and activities are reported on and not measured in Step 5
Both cases noted a wording problem in D2 where resources are identified and shirks are measured in Step 5
10 Add a sub-point on the attribution issue to the Step 4 box that links to ‘reach’ including a note that metrics and methods will be designed to best deal with the issue
Both cases, particularly ATB, noted the importance of reach in the articulation of objectives
11 Extend the reach box to demonstrate that the concept is part of Steps 3,4 and 5
Both cases revealed that reach is an important consideration in these Steps
12 Move the attributes of the sponsor-sponsee relationship from Step 2 and Step 3 to be included in Step 1
Both cases noted that such information should be obtained as early as possible
13 Add the word ‘collaborative’ in front of selection in Box 2 of Step 4
Both cases revealed the importance of working with sponsors, sponsees and intermediaries to develop and implement metrics
14 Change the title of Step 5 from ‘determine metrics for resources and shirking’ to ‘identify resources and determine metrics for shirking’
Both cases noted a wording problem in D2 where resources are identified and shirks measured in Step 5
15 Replace the word ‘generate’ with the word ‘summarize’ in the title box of Step 7 to better capture the essence of what the step accomplishes
Both cases demonstrated that this is the case in Step 7
Reproduced with permission of the copyright owner. Further reproduction prohibited without permission.
The changes noted in Table 63 are substantive in nature. They are based directly on
experiences from the sponsorship evaluation case studies and improve the process model.
Following the implementation of these suggested changes, the final version (D3) of the
process model represents the core contribution of this dissertation. It contributes to both
the literature and to practice. For the literature, it represents the first theory-based process
model for the evaluation of sponsorship that is openly shared. It is hoped that this should
lead to further testing of sponsorships, to the development of extensions of the process
model (e.g. a model specific to Mega-events, a simplified version for implementation
with small sponsorships, or a model designed for social marketing sponsorships), and to
discussions on its validity both in its operation and its agency theory-based design.
Theoretically, this work on the process model supports the distinction of sponsorship
from advertising in the promotional mix, which will undoubtedly foster further
discussion. For practitioners, the process model will provide both sponsors and sponsees
with a tool for the assessment of their sponsorship-related activities. Further, the process
model could be used to improve or to collaborate with the developers of other
sponsorship evaluation models. As one practitioner noted: “I would like to vet the process
model through my own [model for sponsorship evaluation]” (Sp_Exp_l). In addition, the
adaptability of the process model to a wide variety of sponsorship situations benefits both
academics and practitioners. One of the expert interviewees noted that the model’s range
goes from “a simple sponsorship... [that] starts with saying ‘Joe, what would be
important to you?’ when Joe is the owner of a local convenience store asked by a group
running a local event in the park to be a sponsor.. .to major sponsorships” (Int_2,2006).
Reproduced with permission of the copyright owner. Further reproduction prohibited without permission.
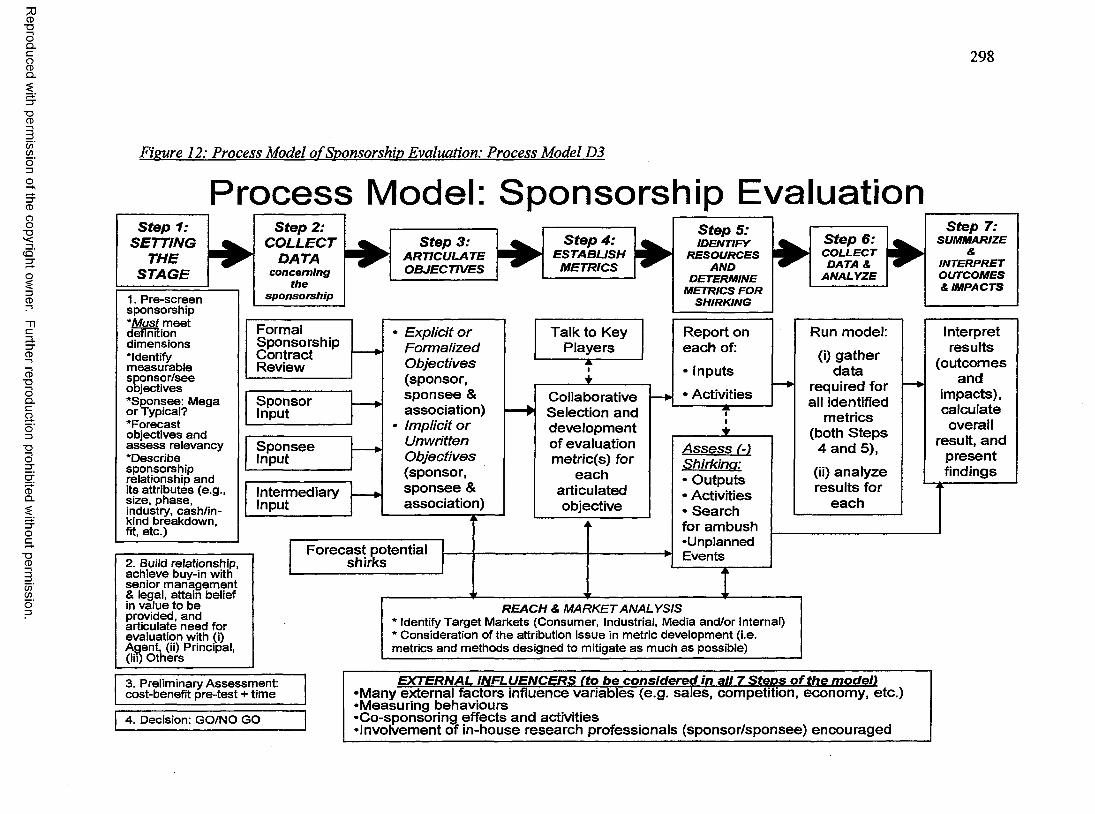
Reproduced
with perm
ission of the
copyright ow
ner. Further
reproduction prohibited
without
permission.
2 9 8
Figure 12: Process Model o f Sponsorship Evaluation: Process Model D3
Process Model: Sponsorship EvaluationStep 1:
SETTINGTHE *
STAGE1. P re -sc re ensponso rsh ip*Must m ee tdefinitiond im ensions'Identifym e asu rab lesp o n so r/se eobjectives'S p o n s e e : M egao r Typical?'F o re c a s tob jectives an da s s e s s relevancy'D e sc rib esponso rsh iprelationship an dits a ttribu tes (e.g .,size, p h ase ,industry, ca sh /in kind breakdow n.fit, etc .)
Step 2: COLLECT
DATAconcerning
thesponsorship
Step 4:Step 3:
FormalSponsorshipContractReview
SponsorInput
SponseeInput
IntermediaryInput
2. Build relationship, ach iev e buy-in with sen io r m an ag e m en t & legal, attain belief in value to b e provided, and articulate n ee d for evaluation with (i) A gent, (ii) Principal, (iii) O thers
Forecast potential shirks
Explicit or Talk to KeyFormalized PlayersObjectives " A ”i(sponsor, ♦sponsee & Collaborativeassociation) — ► Selection andImplicit or developmentUnwritten of evaluationObjectives metric(s) for(sponsor, eachsponsee & articulatedassociation) objective
Step 5:IDENTIFY
R E SO U R C E S AND
DETERMINE M ETRICS FOR
SHIRKING
Report on each of:• Inputs• Activities
II
_±_Assess (-) Shirking:• Outputs• Activities• Search for am bush •Unplanned Events
~ r
^ Step 6: ^C O LLE C T D ATA & Y W -
A N A L Y Z E
REACH & MARKET ANALYSIS* Identify T a rg e t M arkets (C onsum er, Industrial, M edia and /o r Internal)* C onsideration of th e attribution is s u e in m etric developm en t (i.e. m etrics an d m ethods d es ig n ed to m itigate a s m uch a s possib le)
Run model:(i) gather
datarequired for all identified
metrics (both S teps
4 and 5),(ii) analyze results for
each
Step 7;SUM M ARIZE
&IN TE RP R E T OUTCOM ES & IM PAC TS
Interpret results
(outcomes and
impacts), calculate overall
result, and present findings
3. Prelim inary A sse ssm e n t: cost-benefit p re -tes t + tim e
4. Decision: GO/NO GO
E X T E R N A L IN F L U E N C E R S ( to b e c o n s id e r e d in a ll 7 S t e p s o f t h e m o d e l ) •Many external factors influence variables (e.g. sales, competition, economy, etc.) •Measuring behaviours •Co-sponsoring effects and activities•Involvement of in-house research professionals (sponsor/sponsee) encouraged
2 9 9
7.1.3 Methods and Implementation
Methodologically, the implementation of the model in both sponsorship
evaluation case studies was shown to be a risky, lengthy and resource-intensive research
procedure. The changes suggested in process model version D3 (Figure 12) will help
mitigate this risk. A number of additional recommendations are provided here to improve
the implementation of the process model. For example, results from the sponsorship
evaluation case studies support the recommendations (i) that evaluations be included in
sponsorship contracts so that sufficient budgets for evaluation are allocated at the onset of
a sponsorship, (ii) that researchers doing an evaluation prioritize the objectives to be
measured in order to efficiently allocate metrics and methods to maximize the value of
the evaluation, and (iii) that the necessary thought and planning goes into determining
who collects the data for each objective to minimize any bias that may exist.
The results of the sponsorship evaluation case studies also highlight the learning
about the implementation of the process model in addition to the ‘how-to’ description
provided earlier with version Dl. Specifically, seven directions for the future use of the
process model were identified and each is explained briefly here. First, sponsorship
evaluation researchers are directed to get a copy of the final version of the sponsorship
contract(s) early and prior to making a decision on whether to proceed. In the ATB-EGP
sponsorship evaluation case, a final version of the sponsorship contract was not received
until the days prior to the event which resulted in the occurrence of two ‘potentially-
avoidable’ shirking behaviours due to the contract. Second, the important role of
MasterCard in the ATB-EGP sponsorship demonstrates that a sponsorship evaluation
researcher must make a concerted effort (as the process model notes) to determine and
Reproduced with permission of the copyright owner. Further reproduction prohibited without permission.

include all intermediaries and their objectives. Third, the definition of ‘shirk’ must be
broadened to include behaviours that ambush the sponsorship or any of the objectives
sought by any sponsor, sponsee or intermediary. Fourth, sponsorship evaluation
researchers are encouraged to plan for the long-term nature of evaluation, both in terms
of measurement and implementation. In the ATB-EGP case, the need to measure a
number of the objectives (e.g., customer acquisition) again in 12-18 months demonstrates
the long-term nature of some measurements, while results from the KEME case
emphasize the long-term nature of implementation and the accompanying risks. Fifth,
results from both sponsorship evaluation case studies support the need to have established
senior contacts in all involved organizations. Sixth, particularly when researchers are not
well versed in the dynamics of the sponsor’s industry and the sponsee’s industry, they
must dedicate time to learn such. This point was evident with Kanatek, a B2B company,
whose industry was a challenge to define and understand. Finally, the importance of
accessing confidential qualitative data from all sides (sponsor, sponsee, intermediary) as
early as possible was learned in the ATB-EGP case, where the lack of confidential input
from the sponsee (i.e., not via the sponsor) until post-event limited the effectiveness of
the evaluation.
The determination of metrics and methods to measure identified objectives is also
noted as an important aspect of implementing the process model. The ATB-EGP and
KEME case studies both included data collection instruments with weaknesses (e.g.
retrospective questions in expert interviews and on surveys, alternate methods adopted
for resource reasons) that are acknowledged. As noted in Version D3 of the process
Reproduced with permission of the copyright owner. Further reproduction prohibited without permission.
3 0 1
model, researchers need to prioritize objectives, metrics and methods vis-a-vis the
resources (human, financial and time) available.
7.2 Contributions to Practice
As noted above, results from the sponsorship evaluation case studies support the
decision making of sponsors, sponsees and intermediaries. Most importantly, these
practitioners are provided with a process model for sponsorship evaluation. By providing
a validated, 7-stage process model, this research addresses a need that was expressed by
both practitioners (e.g., Mark Harrison, personal communication, October 27,2002) and
in the literature (Crompton, 2004a; Mullin, Hardy & Sutton, 2000; Milne & McDonald,
1999; Berrett, 1993). In this regard, it is of particular importance to note that the process
model demonstrates that evaluation methods specific to sponsorship (i.e., distinct from
those designed to evaluate advertising) are required as suggested by a variety of previous
studies (e.g., Cornwell, Pruitt & Clark, 2005; Belch & Belch, 2001; Tripodi, 2001;
Shimp, 1997; Cornwell, 1995). The fact that advertising and sponsorship function
differently (Bloxam, 1998) is at the heart of this distinction and is supported in a number
of ways by the process model which (i) considers the objectives of all parties (sponsors,
sponsees, and intermediaries) in the evaluation, (ii) views the sponsorship relationship
from the point of view of the consumer who typically is exposed to three distinct images
- the sponsor, the sponsee and the association between them - where the sponsorship can
support the transfer of images between the three, (iii) prioritizes objective specificity in
its design, and (iv) has adopted Agency Theory as a framework that allows for clear
understanding of the evaluation process.
Reproduced with permission of the copyright owner. Further reproduction prohibited without permission.
3 0 2
For practitioners, the process model will provide sponsors and sponsees, as well
as agencies providing evaluation services, with a tool for the assessment of their
sponsorships. The inclusion of the ‘how-to’ guide, the detailed steps with GO/NO GO
decision points, and a graphical depiction of the model will facilitate and, ideally,
encourage its use in practice. The fact that the model is also adaptable to any sponsorship
situation should also be attractive to potential users as it distinguishes it from previous
models in the literature (e.g., Cornwell, Pruitt & Clark, 2005; Cornwell, 1995; Pope &
Voges, 1994; Irwin & Asimakopoulos, 1992). It was also noted in the expert interviews,
that the process model could be used to improve or collaborate with other models
currently in use.
7.3 Contributions to Theory and the Literature
This dissertation involves applied research. As such, it is more about applying and
understanding theory than it is about building theory. However, it does take some
important steps in developing theory in sponsorship evaluation as insight is provided
towards responding to the various challenges facing sponsorship (Weick, 1995) through
the construction and testing of the process model for sponsorship evaluation (Swenson,
2001; Sutton & Staw, 1995).
The research adopted an Agency Theory perspective to sponsorship evaluation
and it developed a process model that was then tested through (i) expert interviews and
(ii) two sponsorship evaluation case studies. Contributions were made to the literatures of
Agency Theory, sponsorship, sponsorship evaluation and objectives. Each of these areas
is discussed separately in the following four sub-sections.
Reproduced with permission of the copyright owner. Further reproduction prohibited without permission.
303
7. 3.1 Contributions to Agency Theory
Agency Theory was adopted to provide the theoretical foundation for the
dissertation where the sponsor-sponsee relationship is viewed as an instance of
cooperative effort in a principal-agent relationship, where the sponsee/agent acts on
behalf of the interests of the sponsor/principal (Bahli & Rivard, 2003). As noted
throughout this dissertation, contributions in this regard from Agency Theory to theory
development are tri-directional as (i) the use of Agency Theory provided focus, structure
and clarity to sponsorship evaluation, (ii) Agency Theory provided the framework for the
Process Model supporting its development, and (iii) viewing sponsorship evaluation
through an Agency Theory lens further developed the theory and its applicability to
marketing practice.
Based on the direction of scholars (Bergen, Dutta, & Walker, 1992; Eisenhardt,
1989), Agency Theory was selected from a set of relationship theories as the theoretical
framework for this dissertation. The fact that Agency Theory was selected supports the
work of Bergen, Dutta and Walker (1992) who noted that Agency Theory has a role to
play in the marketing literature. In addition, the use of Agency Theory in an evaluation
setting widens its range of its applicability beyond viewing relationships to evaluating the
effectiveness of relationships. Adopting Agency Theory’s unit of analysis - the contract -
as the basis of measurement within the evaluation is critical to this point. This is a
significant contribution and one which fits with calls from the Agency Theory literature
to expand the scope of its application (Eisenhardt, 1989) and could lead to additional
research in the area. The finding that Agency Theory works well in the sponsor-sponsee
Reproduced with permission of the copyright owner. Further reproduction prohibited without permission.
3 0 4
relationship is also a contribution as it demonstrates that Agency Theory can work in
complex, B2B relationships as well as its typical purview of employer-employee and
Board-CEO relationships (Bergen, Dutta, & Walker, 1992; Jensen, 1983; Jensen & Fama,
1983; Jensen & Meckling, 1976).
Agency Theory provided a lens by which to evaluate a sponsor’s investment in a
sponsee and the resulting relationship’s ability to achieve both the sponsor’s and the
sponsee’s specific objectives. As outlined in Chapter 4, this fills a gap in sponsorship
evaluation by providing the theoretical framework sought by both academics and
practitioners that will enable the effective and efficient measurement of sponsorship
effectiveness.
Another important contribution of Agency Theory to sponsorship evaluation lies
in the expansion of the definition of the contract to include both the tenets of the formal
written contract and the understood but unwritten aspects of the relationship; namely the
informal contract. In turn, this expanding definition leads to a broader consideration of
objectives for evaluation and the identification of those objectives (the informal ones)
that are often neglected in evaluation (see Newbum 2001; Sandler & Shani, 1993).
Further, the consideration of intermediaries and their objectives stems from Agency
Theory and is an additional important contribution to sponsorship evaluation.
7.3.2 Contributions to Sponsorship Theory
In addition to the major contribution of the process model to the sponsorship
evaluation literature, this dissertation sought to achieve 4 sub-objectives related to
improving the understanding of the sponsorship relationship required to construct the
Reproduced with permission of the copyright owner. Further reproduction prohibited without permission.
process model. As such, the process of addressing these 4 sub-objectives represents the
main contributions of this dissertation to the sponsorship literature. First, viewing the
sponsor-sponsee relationship as a version of a principal-agent relationship was shown to
have merit, particularly as a way by which to evaluate the relationship. In this regard,
Agency Theory put the focus on the contract (explicit and implicit) as the unit of analysis
which, in turn, put the focus on identifying and measuring only those objectives and
shirking behaviours related to the contract (Bergen, Dutta, & Walker, 1992; Eisenhardt,
1989). Second, the inclusion of performance evaluation theory in combination with
Agency Theory to look at sponsorship evaluation was beneficial to the development of
the process model, particularly in emphasizing the importance of reach (i.e., the target(s)
sought for each objective) and separating the results by impacts and outcomes to
recognize the influence of time and challenges of attribution and intent in measurement
(Capko, 2003; Heslop & Fadaie, 2002). In the ATB-EGP sponsorship evaluation case
study, for example, the use of the concept of ‘reach’ led to the identification of 21
objectives as opposed to 18, while for the KEME sponsorship evaluation case study, it
allowed for the targets of two of the objectives to be further specified to 2 and 5 targets,
respectively. Third, results from both sponsorship evaluation case studies provide
considerable direction to sponsors, sponsees and intermediaries for future
business/promotion decisions. For example, in the ATB-EGP sponsorship evaluation
case, detailed and specific recommendations were provided to ATB, EGP and
MasterCard. Fourth, the applied nature of the dissertation should be noted. Specifically
that it recognizes that each sponsorship is unique and that it develops an adaptable
Reproduced with permission of the copyright owner. Further reproduction prohibited without permission.
3 0 6
process model for practitioners that was developed with the input of industry experts and
tested on two ‘real’ cases of sponsorship.
In addition, this dissertation makes a strong contribution to the sponsorship
literature by emphasizing analysis on the sponsee as an equal contributor to the sponsor-
sponsee relationship. Similarly, it also responds to Shank’s (1999) suggestion and
broadens the definition of the sponsee, including proposing the mega-sponsee/typical
sponsee scenarios. Other authors had previously noted this as a weakness in the
sponsorship literature (Cornwell & Maignan, 1998) and some prior definitions of
sponsorship had focused entirely on the sponsor (Dean, 1999; d’Astous & Bitz, 1995).
Finally, the generalizability of the process model to any sponsorship is an
important contribution to the sponsorship literature as it recognizes and emphasizes the
principle that each sponsorship relationship is unique and that each should be evaluated
accordingly. Although only two case studies have been tested to date, the resulting
process model is adaptable to all potential sponsorship scenarios and will be improved as
testing continues.
7.3.3 Contributions to Sponsorship Evaluation Theory
The most important contribution of this dissertation is its delivery of version D3
of the process model for sponsorship evaluation. Although the model cannot yet be
referred to as theory, it provides impetus for future research and, over time and through
additional testing could develop into theory. In terms of this contribution specific to the
sponsorship evaluation literature, it represents the first theory-based process model for
Reproduced with permission of the copyright owner. Further reproduction prohibited without permission.
307
the evaluation of sponsorship that will be openly shared with the academic and business
communities.
Considering the limited pre-existing theory in sponsorship evaluation (Walliser,
2003; Harvey, 2001; Meenaghan, 2001; Olkkonen, 2001), the overall impact of this work
on sponsorship evaluation theory is considerable. A process model specifically designed
for sponsorship evaluation has been carefully constructed from three bodies of literature
and consultation with experts. Following a pre-test, it was then tested in two extensive
and very different sponsorship evaluation case studies. Throughout this process, three
versions of the model were presented with the resulting third draft (version D3) ready for
use in practice and for continued testing and development by researchers. Continued
testing, broadened application and structured assessment of each ‘box’ in the process
model will also continue to improve and build much needed theory on sponsorship
evaluation.
7.3.4 Contributions to the Literature Related to Objectives
Objectives, or goals, are of the utmost importance to this dissertation as the »
process model, in taking an Agency Theory approach, carries out a process of evaluation
that is based on the implicit (informal) and explicit (formal) objectives of the sponsor,
sponsees and relevant intermediaries. It is these objectives that form the basis for the
metrics and methods that are implemented to measure the effectiveness of the
sponsorship.
Practically, the results of the dissertation point to two important aspects of
objectives that are noted in version D3 of the process model. First, the lack of clear,
Reproduced with permission of the copyright owner. Further reproduction prohibited without permission.

measurable objectives as a challenge in sponsorship evaluation is evident in both
sponsorship evaluation case studies and is noted in the literature (Crompton, 2004a;
Cornwell & Maignan, 1998; Berrett & Slack, 1995; Berrett, 1993). Version D3 of the
process model notes this finding and specifies that an evaluation would not proceed
unless proper objectives are provided. Second, and this is a finding exclusive to this
dissertation, is that there is a need to prioritize objectives vis-a-vis the resources available
to measure them (human, financial and time). Specifically, it is unlikely that the
necessary resources for a complete evaluation would ever be available, thus decisions
must be made to prioritize objectives, reach, metrics and methods. It is suggested that this
would involve framing a set of possible of objectives for each sponsorship and then
selecting metrics and methods based on the priority of objectives, the ability to measure
and the cost of the research. This is noted in version D3 and is seen as an important
contribution.
As noted in Appendix A, 61 different sponsorship objectives were identified in
the literature. These objectives were many and included a vast array of objectives ranging
from enhancing corporate image (Pope & Voges, 1998) to increasing television coverage
(Liu, Putler & Weinberg, 2004; Erdogan & Kitchen, 1998) to encouraging product sales
(Crompton, 2004a) to entertaining clients (Pope & Voges, 1998) to blocking competition
(Irwin & Sutton, 1994). The current research explored 32 different objectives (21 in the
ATB-EGP sponsorship and 11 in the KEME sponsorship), including seven that were new
(or newly adapted) to the literature including (i) impacting key prospects (top 1%), (ii)
improving brand prestige in current customers, (iii) re-branding ATB from being viewed
primarily as a small town Alberta bank to a full-service provide-wide bank, (iv)
Reproduced with permission of the copyright owner. Further reproduction prohibited without permission.
3 0 9
demonstrating the successful use of technology in a hostile environment, (v) supporting
important scientific research, (vi) organizing the world’s highest hockey game, and (vii)
promoting the benefits of active living. These additions to the objectives in the literature
and their accompanying metrics and methods are a contribution to future research in
sponsorship evaluation.
7.4 Limitations o f this Research
It is also important to recognize the limitations of this dissertation, particularly
with respect to the process model. Eight such limitations were identified. First, as noted
in the literature review on sponsorship evaluation, the attribution by self-opinion in the
context of multiple influences is very difficult to evaluate. There is no ideal solution,
however metrics grounded in a clear objective that asks aided and unaided questions with
options to select competing influences can allow for a reasonable estimate of the
influence of a sponsorship on particular image, branding, or awareness objective. Second,
the sponsorship evaluation literature review also stressed the challenges in measuring
intent to behave (e.g., intent to purchase) since the respondents ability to express if the
intent will actually turn into behaviour is difficult to ascertain. This research recognizes
this weakness and refers to other sponsorship evaluation researchers (Crompton, 2004a)
who also note this weakness but also stresses that in the absence of sales data, intent to
purchase is the next best measure available. Third, the lack of measurable objectives by
sponsors and sponsees was evident in both sponsorship evaluation case studies and
limited the effectiveness of the evaluations as there were often no targets to measure
against. This will be addressed in future implementations of Process Model D3 which
Reproduced with permission of the copyright owner. Further reproduction prohibited without permission.
now includes a requirement for measurable objectives in Step 1. This will involve the
sponsorship evaluation researcher working with the sponsor(s) and sponsee pre
sponsorship. Fourth, as noted in both sponsorship evaluation case studies, the resource
implications (human and financial) of implementing the process model are significant
and could potentially be a barrier to its implementation. The updated Process Model D3
includes an estimation of resources in Step 1 as an attempt to mitigate this risk which will
allow the researcher to prioritize metrics and methods pre-sponsorship. Fifth, the length
of the research process in the KEME and ATB-EGP cases underlines the challenge of
time as a third resource challenge, in addition to financial cost and human resources risk,
that sponsorship evaluation researchers need to consider. An assessment of time in the
context of the Step 1 Cost-Benefit Test has been added to Process Model D3 to try to
mitigate the time effect by seeking to advise a researcher not to embark on an evaluation
that is unlikely to be completed. Sixth, the implementation of the two sponsorship
evaluation case studies revealed that a challenge exists with respect to the clarity of roles
between the sponsor and the sponsee as principal and agent, respectively. This challenge
is commonly identified in the Agency Theory literature (Eisenhardt, 1989).
Methodologically, this resulted - in the ATB-EGP case - in some confusion at times over
who was pursuing which objective and who was potentially shirking whom. It is
important that sponsorship evaluation researchers use pre-sponsorship interviews to
clearly articulate each entity and its objectives as Step 1 of the model advises. Seventh,
the fact that drafts D1 and D2 of the process model did not consider the ‘riskiness’ of
sponsees was a weakness that has been corrected in D3. This weakness was evident in the
KEME sponsorship evaluation which was, for the most part, cancelled following the
Reproduced with permission of the copyright owner. Further reproduction prohibited without permission.
311
tragic death of Dr. Sean Egan. Finally, the generalizability of the findings from 14 expert
interviews and 2 sponsorship evaluation case studies must be questioned. This weakness
is enhanced by the fact that only 1 sponsorship evaluation case study was fully
implemented and completed. This weakness, however, is mitigated considerably by the
fact that the model is a process model that is designed to be adapted to each sponsorship
that it is used to evaluate; based on the premise that all sponsorships are unique.
7.5 A Future Research Agenda
A number of avenues for future research are identified in this dissertation. First
and of the most importance is the continued testing and updating of version D3 of the
process model. Ideally this will include evaluations of a broad array of sponsorships (e.g.,
mega-sponsee/typical-sponsee, cash/in-kind, sponsors/sponsees of all sizes, social
marketing sponsors/sponsees, etc.). The need to further explore risky sponsees is also
noted from the KEME case. Additionally, it is recommended that future research include
partial evaluations and the evaluations of single objectives in response to the resource
challenges that were shown to typically affect evaluations. Finally, future research is
suggested to further explore some of the key issues built into each of the boxes of the
model, including assessing the specificity of the mega/typical sponsee scenarios,
evaluating sponsorships with varying levels of collaboration with a champion,
determining methods to better forecast shirking behaviours, and developing an improved
method of determining metrics and methods for a given objective.
In order to scope a future research agenda, a number of hypotheses to be tested or
explored are provided here:
Reproduced with permission of the copyright owner. Further reproduction prohibited without permission.
3 1 2
1. H I; That the Process Model will be applicable for sponsorships that include social
marketing (i.e. behaviour change) objectives.
2. H2: That the Process Model can be adapted for use when limited resources (i.e.
less than required for complete implementation) for evaluation are available to the
researcher.
3. H3: That longitudinal study using the Process Model will provide enhanced
evaluation of sponsorships.
4. H4: That the Process Model can be adapted to evaluate sponsorships that include
sponsors, sponsees and intermediaries of all sizes (e.g. mega-sponsees, small
sponsors, etc.).
5. H5: That the following concepts (‘boxes’) in the Process Model are further
explored:
a. Shirking: developing a better understanding of how to account for both (i)
behavioural and (ii) contractual shirking.
b. Shirking: developing improved measurement techniques.
c. Legal support for evaluation: farther research on understanding its
importance and achieving support for implementation.
d. Metric Development: that future research considers and develops other
techniques to measure sponsorship-based objectives including (i)
experimental design, (ii) observation, and (iii) focus groups.
6. H6: To support that Agency Theory is the best theoretical framework upon which
to base the Process Model for sponsorship evaluation.
Reproduced with permission of the copyright owner. Further reproduction prohibited without permission.
3 1 3
7. H7: That the Process Model be compared to other industry-based models for
sponsorship evaluation.
8. H8: That the Process Model is applicable in sponsorships (i) in all industries, (ii)
of global, national, regional and local reach, and (iii) in all countries/regions of
the world.
These 11 hypotheses outline a number of future research studies demonstrating the need
for work in sponsorship evaluation and the role of this dissertation in encouraging future
research.
7.6 The Final Word
One of the sponsorship experts summarized the overall impact of this dissertation
by noting that “the key to the future of sponsorship lies in how to then re-package [the
common need for evaluation] into some kind of general tool with wide application”
(SSor_3). This research has taken a number of important steps in developing sponsorship
evaluation theory towards this goal with the construction of a validated process model for
sponsorship evaluation.
This research began by focusing on an important topic that was of high interest to
both practitioners and researchers, as expressed in trade publications, the marketing
literature and in-person to the author. This emphasis towards ‘solving’ the sponsorship
evaluation challenge resulted in a two-stage, multi-method dissertation that has taken
important steps - both theoretically and practically - to achieving its goal. The research
process itself outlines both the difficulty and the interest in the topic. Three literatures,
expert input, a pre-test and two in-depth case studies were required. Agency Theory
Reproduced with permission of the copyright owner. Further reproduction prohibited without permission.
3 1 4
provided the necessary framework. Corporate partners were intimately involved and
invested significant resources in the process. The importance of time, resources, high-
level support of partners, and confidentiality was clear. Each iteration of the process
model was better than the previous version, both practically and theoretically.
Reproduced with permission of the copyright owner. Further reproduction prohibited without permission.
3 1 5
References
Aaker, D.A. (1996). Measuring brand equity across products and markets. California
Management Review, 38(3), 102-120.
Abratt, R., & Grobler, P.S. (1989). The evaluation of sports sponsorships. International
Journal o f Advertising, 5(4), 351-362.
Abratt, R., Clayton, B.C., & Pitt, L.F. (1987). Corporate objectives in sports sponsorship.
International Journal o f Advertising, 6, 299-311.
Aguilar-Manjarrez, R., Thwaites, D., & Maule, J. (1997). Modelling sport sponsorship
selection decisions. Asia-Australia Marketing Journal, 5(1), 9-20.
Aijo, T.S. (1996). The theoretical and philosophical underpinnings of relationship
marketing: Environmental factors behind the changing marketing paradigm.
European Journal o f Marketing, 30(2), 8-18.
Alchian, A.A., & Demsetz, H. (1972). Production, information cost and economic
organization. American Economic Review, 62, 777-792.
Algozzine, B., Beattie, J., Bray, M., Flowers, C., Gretes, J., Howley, et al. (2004).
Student evaluation of college teaching. College Teaching, 52(4), 134-142.
Ali, C., Cornwell, T.B., Nguyen, D., & Coote, L. (2006). Exploring the usefulness of a
consumer activity index in the sponsorship-linked marketing context.
International Journal o f Sport Marketing and Sponsorship, 7(2), 115-124.
American Marketing Association (2004). A New definition of marketing. Marketing
News, Sept. 15,2004.
Amis, J. (2003). Good things come to those who wait: The strategic image and reputation
at Guinness. European Sport Management Quarterly, 3(3), 189-214.
Reproduced with permission of the copyright owner. Further reproduction prohibited without permission.
3 1 6
Amis, J., Slack, T., & Berrett, T. (1999). Sport sponsorship as distinctive competence.
European Journal o f Marketing, 33(4), 250-272.
Amis, J., Pant, N., & Slack, T. (1997). Achieving a sustainable competitive advantage: A
resource-based view of sport sponsorship. Journal o f Sport Management, 11,80-
96.
Anderson, E., & Oliver, R. (1987). Perspective on behavior-based versus outcome-based
salesforce control systems. Journal o f Marketing, 51 (October), 76-88.
Andreff, W., & Nys, J-F. (2002). Economie du sport. Paris : Presses universitaires de
France.
Anne F., & Cheron EJ. (1991). Mesure de l’efficacite du sponsoring : une analyse des
effets intermediaires sur l’audience directe de l’evenement. Revue Franqaise du
Marketing, 131, 69-81.
Arani, A. (1992). How corporations take advantage of Olympic marketing opportunities.
Sport Marketing Quarterly, 1(1), 7-12.
Arychuk, K (2006). Personal communication, July 27.
Armstrong, C. (1988). Sports sponsorship: A case study approach to measuring its
effectiveness. European bulletin o f Himalayan research, 16(2), 97-103.
Arrow, K.J. (1985). The Economics of Agency. Principals and Agents: The Structure of
Business (Pratt, J., & Zeckhauser, R., Eds.). Boston, USA: Harvard Business
School Press, 37-51.
Arthur, D., Dolan, G., & Cole, M. (1998). The benefits of sponsorship success: An
analysis of the relationship between television exposure and the position of the
motorcycle rider. Cyber-Journal o f Sport Marketing, 2(2).
Reproduced with permission of the copyright owner. Further reproduction prohibited without permission.
3 1 7
Arthur, D., Scott, D., Woods, T., & Booker, R. (1998). Sport sponsorship should... A
process model for the effective implementation and management of sport
sponsorship programs. Sport Marketing Quarterly, 7(4), 49-60.
Asimakopoulos, M.K. (1993). Sport marketing and sponsoring: The experience of
Greece. Sport Marketing Quarterly 2(3), 44-48.
Bagozzi, R.P. (1975). Marketing as exchange. Journal o f Marketing, 39, 32-39.
Bahli, B., & Rivard, S. (2003). The information technology outsourcing risk: A
transaction cost and agency theory-based perspective. Journal o f Information
Technology, 18,211 -221.
Barnes, James G. (2001). Secrets o f customer relationship management: I t’s all about
how you make them feel. New York: McGraw-Hill.
Barney, J. (1991). Firm resources and sustained competitive advantage. Journal o f
Management, 17(1), 99-120.
Barzel, Y. (1982). Measurement cost and the organization of markets. Journal o f Law
and Economics, 25(1), 203-225.
Basu, V., & Lederer, A.L. (2004). An agency theory model of ERP implementation.
Proceedings from the 2004 SIGMIS Conference on Computer Personnel
Research: Careers, culture, and ethics in a networked environment, Tucson,
USA, 8-13.
Basu, A., Rajiv, L., Srinivasan, V., & Staelin, R. (1985). Salesforce compensation plans:
An agency theoretic framework. Marketing Science, 4(Fall), 267-291.
BBC News (2005). Dozens reach Mount Everest summit, retrieved September 14,2006,
from http://www.bbc.co.uk.
Reproduced with permission of the copyright owner. Further reproduction prohibited without permission.
3 1 8
Bebchuk, L.A., & Fried, J.M. (2003). Executive compensation as an agency problem.
Journal o f Economic Perspectives, 17(3), 71-92.
Belch, G.E., & Belch, M.A. (2001). Advertising and promotion: An integrated marketing
communications perspective (5 ed.). Boston, USA: McGraw-Hill.
Bendapudi, N., Singh, S.N., & Bendapudi, B. (1996). Enhancing helping behavior: An
integrative framework for promotion planning. Journal o f Marketing, 60(July),
33-49.
Bennett, G., Henson, R., & Zhang, J. (2002). Action sports sponsorship recognition.
Sport Marketing Quarterly, 11(3), 174-185.
Bennett, P.D., Lamm, R.P., & Fry. R.A. (1988). Marketing. Boston, USA: McGraw-Hill.
Bennett, R. (1999). Sport sponsorship, spectator recall, and false consensus. European
Journal o f Marketing, 3 3 (3/4), 291-313.
Bergen, M., Dutta, S., & Walker, O.C. (1992). Agency relationships in marketing: A
review of the implications and applications of agency and related theories.
Journal o f Marketing, 56(July), 1-24.
Berrett, T., & Slack, T. (2001). A framework for the analysis of strategic approaches
employed by non-profit sport organisations in seeking corporate sponsorship.
Sport Management Review, 4,21-45.
Berrett, T., & Slack, T. (1999). An analysis of the influence of competitive and
institutional pressures on corporate sponsorship decisions. Journal o f Sport
Management, 13,114-138.
Reproduced with permission of the copyright owner. Further reproduction prohibited without permission.
3 1 9
Berrett, T. & Slack, T. (1995). Approaches to corporate sponsorship in Canada’s
national sport organizations. A report submitted to Sport Canada. Faculty of
Physical Education and Recreation, University of Alberta, Alberta, Canada.
Berrett, T. (1993). The sponsorship of amateur sport: Government, national sport
organization, and the corporate perspectives. Leisure and Society 16, 323-46.
Bharadwaj, S.G., Varadarajan, P.R., & Fahy, J. (1993). Sustainable competitive
advantage in service industries: A conceptual model and research propositions.
Journal o f Marketing, 57(October), 83-99.
Bloxam, M. (1998). Brand affinity and television progamme sponsorship. International
Journal o f Advertising, 17(1), 89-98.
Boeing (2005). Sponsorship evaluation criteria, retrieved March 10,2005, from
http ://www.boeing.com.
Borys, B., & Jemison, D.B. (1989). Hybrid arrangements as strategic alliances:
theoretical issues in organizational combinations. Academy o f Management
Review, 14(2), 234-249.
Bowey, S. (1998). Editorial. European Research, 16(2), 85.
Boyle, R., & Haynes, R. (2000). Power game: Why sport matters to television. Power
Play: Sport, The Media and Popular Culture, 2000, 67-88.
Bozeman, B., & Papadakis, M. (1995). Company interactions with federal laboratories:
what they do and why they do it. Technology Transfer, 20(4), 64-74.
Brassington, F., & Pettit, S. (2000). Principles o f marketing (2 ed.). Italy: Harlow,
Financial Times Management.
Reproduced with permission of the copyright owner. Further reproduction prohibited without permission.
320
Brooks, C.M. (1994). Sports marketing: Competitive business strategies for sports.
Englewood Cliffs, USA: Prentice Hall.
Brooks, C. (1990). Sponsorship: strictly business. Athletic Business, October, 59-62.
Broughton, R. (2004). Personal Communication, September 23.
Brown, T.J., & Dacin, P.A. (1997). The company and the product: Corporate associations
and consumer product reponses. Journal o f Marketing, 61(1), 68-84.
Cannon, H., & Riordan, E. (1994). Effective reach and frequency: Does it really make
sense? Journal o f Advertising Research, 34(2), 19-28.
Cantillon, P (1998). Evaluation: beyond the rhetoric. Journal o f Evaluation in Clinical
Practice, 5(3), 265-268.
Capko, Judy (2003). 5 steps to a performance evaluation system: keep your staff
productive and motivated by conducting regular performance evaluations. Family
Practice Management, 10(3), 43-48.
Carlsen, J., & Taylor, A. (2003). Mega-events and urban renewal: The case of the
Manchester 2002 Commonwealth Games. Event Management, 8,15-22.
Chalip, L. & Leyns, A. (2002). Local business leveraging of a sport event: Managing an
event for economic benefit. Journal o f Sport Management, 16(2), 132-158.
Collins, M. (1994). Global corporate philanthropy and relationship marketing. European
Management Journal, 12(2), 226-233.
Copeland, R., Frisby, W., & McCarville, R. (1996), Understanding the sport sponsorship
process from a corporate perspective. Journal o f Sport Management, 10(1), 32 -
48.
Reproduced with permission of the copyright owner. Further reproduction prohibited without permission.
321
Copeland, R. (1991). Sport sponsorship in Canada: A study o f exchange between
corporate sponsors and sport groups. Unpublished Master’s Thesis, University of
Waterloo, Canada.
Cornwell, T.B., Pruitt, S.W., & Clark, J.M. (2005). The relationship between major-
league sports’ official sponsorship announcements and the stock prices of
sponsoring firms. Journal o f the Academy o f Marketing Science, 33(4), 401 -412.
Cornwell, T., & Coote, L. (2005). Corporate sponsorship of a cause: the role of
identification in purchase intent. Journal o f Business Research, 58(3), 268-276.
Cornwell, T.B., Pruitt, S.W., & van Ness, R. (2001). The value of winning in
motorsports: sponsorship-linked marketing. Journal o f Advertising Research,
41(1), 17-31.
Cornwell, T.B., Roy, D.P., & Steinard II, E.A. (2001). Exploring managers’ perceptions
of the impact of sponsorship on brand equity. Journal o f Advertising, 30(2), 41-
51.
Cornwell, T.B., & Maignan, I. (1998). An international review of sponsorship research.
Journal o f Advertising, 27(1), 1-21.
Cornwell, T.B. (1997). The use of sponsorship-linked marketing by tobacco firms:
International public policy issues. The Journal o f Consumer Affairs, 31(2), 238-
254.
Cornwell, T.B., Maignan, I., & Irwin, R. (1997). Long-term recall of sponsorship
sources. An empirical investigation of stadium and sport cafe audiences. Asia-
Australia Marketing Journal, 5(1), 45-57.
Reproduced with permission of the copyright owner. Further reproduction prohibited without permission.
Cornwell, T.B. (1995). Sponsorship-linked marketing development. Sport Marketing
Quarterly, 4(4), 13-24.
Crane, F.G., Kerin, R.A., Hartley, S.W., Berkowitz, E.N., and Rudelius, W. (2006).
Marketing (6 ed.). Toronto: McGraw-Hill.
Crimmins, J., & Horn, M. (1996). Sponsorship: From management ego trip to marketing
success. Journal o f Advertising Research, 36(4), 11-21.
Crompton, J. (2004a). Conceptualization and alternate operationalizations of the
measurement of sponsorship effectiveness in sport. Leisure Studies, 23(3), 267-
281.
Crompton, J.L. (2004b). Sponsorship ambushing in sport. Managing Leisure, 9,1-12.
Crow, D., & Hoek, J. (2003). Ambush marketing: A critical review and some practical
advice. Marketing Bulletin, 14(1), retrieved May 3, 2005 from
http://www.marketing-bulletin.massey.ac.nz.
Crowley, M.G. (1991). Prioritising the sponsorship audience. European Journal o f
Marketing, 25(11), 11-21.
Cuneen, J., & Hannan, M.J. (1993). Intermediate measures of sponsorship advertising
at an LPGA tournament. Sport Marketing Quarterly, 2(1), 47-56.
Cunningham, W.H., & Taylor, S.F. (1995). Event marketing: State of the industry and
research agenda. Festival Management and Event Tourism, 2,123-137.
Cuthbertson, R. (2004). Personal communication, January 13.
Daneshvary, R., & Schwer, R.K. (2000). The association endorsement and consumers
intention to purchase. Journal o f Consumer Marketing, 17(3), 203-213.
Reproduced with permission of the copyright owner. Further reproduction prohibited without permission.
323
D’Astous, A., & Bitz, P. (1995). Consumer evaluations of sponsorship programmes.
European Journal o f Marketing, 29(12), 6-22.
Dean, D.H. (1999). Brand endorsement, popularity, and event sponsorship as advertising:
Cues affecting consumer pre-purchase attitudes. Journal o f Advertising, 28(3), 1-
12.
Derbaix, C., & Pham, M.T. (1991). Affective reactions to consumption situations: A pilot
investigation. Journal o f Economic Psychology, 12, 325-355.
Dimanche, F. (1996). Special events legacy: The 1984 Louisiana Worlds Fair in New
Orleans. Festival Management and Event Tourism, 4(1), 49-54.
Doherty, A.M., & Quinn, B. (1999). International retrial franchising: an agency theory
perspective. International Journal o f Retail & Distribution Management, 27(6),
224-236.
Dolphin, R.R. (2003). Sponsorship: Perspectives on its strategic role. Corporate
Communications: An International Journal, 8(3), 176-183.
Easton, S., & Mackie, P. (1998). When football came home: A case history of the
sponsorship activity at EURO 96. International Journal o f Advertising, 17(1), 99-
114.
Egan, S. (2003a). Personal communication, September 24.
Egan, S. (2004a). Personal communication, August 3.
Egan, S. (2004b). Personal communication, December 20.
Egan, S. (2005a). Personal communication, January 11.
Eisenhardt, K.M. (1989). Agency theory: An assessment and review. Academy o f
Management Review, 14(1), 57-74.
Reproduced with permission of the copyright owner. Further reproduction prohibited without permission.

Eisenhardt, K.M., (1989b). Building theory from case study research. Academy o f
Management Review, 14 (4), 532-550.
Eisenhart, T. (1988). Sporting changes zap competitors. Business Marketing, 6,92-97.
Erdogan, B.Z., & Kitchen, P.J. (1998). Managerial mindsets and the symbiotic
relationship between sponsorship and advertising. Marketing Intelligence &
Planning, 16(6), 369-374.
Ewing, J. (2004). Can Football be saved? Business Week, New York, July 19.
Fahy, J., Farrelly, F., & Quester, P. (2004). Competitive advantage through sponsorship.
European Journal o f Marketing, 38 (8), 1013-1030.
Fama, E.F., & Jensen, M.C. (1983). Separation of ownership and control. Journal o f Law
and Economics, 26, 301-325.
Fama, E.F. (1980). Agency problems and the theory of the firm. Journal o f Political
Economy, 88,288-307.
Farrelly F., Quester, P., & Burton, R. (1997). Integrating sports sponsorship into the
corporate marketing function: An international comparative study. International
Marketing Review, 14(3), 170-182.
Feldman, J.M., & Lynch, J.G. (1988). Self-generated validity and other effects of
measurement on belief, attitude, intention, and behaviour. Journal o f Applied
Psychology, 73(3), 421-435.
Felt, J. (2003). How sports sponsorship can help your brand. Managing Intellectual
Property, 125,24-26.
Ferrand, A., & Pages, M. (1996). Image sponsoring: a methodology to match event and
sponsor. Journal o f Sport Management, 10, 278-291.
Reproduced with permission of the copyright owner. Further reproduction prohibited without permission.
3 2 5
File, K.M., & Prince, R.A. (1998). Cause related marketing and corporate philanthropy in
privately held enterprise. Journal o f Business Ethics, 17(14), 1529-1539.
Flynn, D.M. (1993). Sponsorship and the survival of new organizations. Journal o f Small
Business Management, 31 (1), 51-62.
Furlong, R. (1994). Tobacco advertising legislation and the sponsorship of sport.
Australian Business Review, 22,159-162.
Gardiner, M., & Shuman, P. (1988). Sponsorships and small businesses. Journal o f Small
Business Management, 44-50.
Gardner, C. (2004a). Personal communication, November 6.
Gardner, C. (2004b). Personal communication, October 1.
Gardner, C. (2006). Personal communication, February 10.
Getz, D. (2002). Editorial: On the nature and significance of event studies. Event
Management, 7,141-142.
Getz, D. (1998). New age, new name, new direction. Festival Management and Event
Tourism, 5,167-169.
Gianelloni, J-L. (1993). L’influence de la communication de l’evenement sur la structure
de limage de l’entreprise. Recherche et Applications en Marketing, 8(1), 5-29.
Gierl, H., & Kirchner, A. (1999). Emotionale bindung und imagetransfer durch
sportsponsoring. Werbeforschung & Praxis, 44(3), 32-35.
Gladden, J.M., & Funk, D.C. (2002). Developing an understanding of brand associations
in team sport: Empirical evidence from consumers of professional sport. Journal
o f Sport Management, 16, 54-81.
Reproduced with permission of the copyright owner. Further reproduction prohibited without permission.
3 2 6
Gladden, J., Milne, G., & Sutton, W. (1998). A conceptual framework for assessing brand
equity in Division I college athletics. Journal o f Sport Management, 12(1), 1-19.
Gomey, B., & Ness, R.G. (2000). Evaluating dimensions for full-time head coaches at
NCAA Division II institutions. Journal o f Personnel Evaluation in Education,
14(1), 47-65.
Grant, R. M. (1991). The resource-based theory of competitive advantage: Implications
for strategy formulation. California Management Review, 33,114-135.
Greene, J.C., & McClintock, C. (1991). The evolution of evaluation methodology.
Theory into Practice, 30,13-21.
Grewal, D., & Pechmann, C. (1998). American marketing association winter educators ’
conference proceedings: Marketing theory and applications, 9, Chicago, Illinois:
American Marketing Association.
Grimes, E., & Meenaghan, T. (1998). Focusing commercial sponsorship on the internal
corporate audience. International Journal o f Advertising, 17(1), 51-74.
Grohs, R., Wagner, U., & Vsetecka, S. (2004). Assessing the effectiveness of sport
sponsorships - An empirical examination. Schmalenbach Business Review, 56,
119-138.
Gronroos, C. (2004). The relationship marketing process: Communication, interaction,
dialogue, value. Journal o f Business & Industrial Marketing, 19(2), 99-113.
Gross, A.C., Traylor, M.B., & Shuman, P.J. (1987). Corporate sponsorship of art and
sports events in North America. Proceedings from the General Sessions o f the
40th ESOMAR Marketing Research Congress, Montreux, Switzerland, 535-561.
Reproduced with permission of the copyright owner. Further reproduction prohibited without permission.

Gummesson, E. (2004). Return on relationships (ROR): The value of relationship
marketing and CRM in business-to-business contexts. Journal o f Business &
Industrial Marketing, 19(2), 136-148.
Gwinner, K., & Swanson, S. (2003). A model of fan identification: Antecedents and
sponsorship outcomes. Journal o f Services Marketing, 17(3), 275-294.
Gwinner, K.P., & Eaton, J. (1999). Building brand image through event sponsorship: The
role of image transfer. Journal o f Advertising, 28(4), 47-57.
Gwinner, K.P. (1997). A model of image creation and image transfer in event
sponsorship. International Marketing Review, 14(3), 145-158.
Hamel, G., & Prahalad, C.K. (1994). Competing for the future. Boston, MA: Harvard
Business School Press.
Hastings, G., (1984). Sponsorship works differently from advertising. International
Journal o f Advertising, 3,171-180.
Harris, M., & Raviv, A. (1979). Optimal incentive contracts with imperfect information.
Journal o f Economic Theory, 20,231-259.
Harvey, B. (2001). Measuring the effects of sponsorships. Journal o f Advertising
Research, 41(Jan/Feb), 59-65.
Heslop, L., & Fadaie, K. (2002). The 3Bs of impact assessment of technology transfer
programs: Rationale, technique and a case example from the Canada Centre for
Remote Sensing. International Journal o f Technology Transfer and
Commercialisation, 1(3), 217-248.
Reproduced with permission of the copyright owner. Further reproduction prohibited without permission.

3 2 8
Hirsch, P., & Friedman, R. (1986). Collaboration or paradigm shift? Economics vs.
behavioural thinking about policy? In J. Pearce & R. Robinson (Eds.), Best
Papers Proceedings: Academy o f Management, Chicago, USA, 31-35.
Hoek, J., & Gendall, P. (2002). When do ex-sponsors become ambush marketers?
International Journal o f Sports Marketing & Sponsorship, 3 (4), 383-402.
Hoek, J. (1998). Sponsorship: An evaluation of management assumptions and practices.
Marketing Bulletin, 10,1 -11.
Hoek, J., Gendall, P., Jeffcoat, M., & Orsman, D. (1997). Sponsorship and advertising: A
comparison of their effects. Journal o f Marketing Communications, 3,21-32.
Hoek J., Gendall P., & Sanders J. (1993). Sponsorship management and evaluation: Are
managers’s assumptions justified? Journal o f Promotion Management, 1 (4),
1993,53-66.
Hoffman, A. (1998). Two sides of the coin, corporate giving is business. Fund Raising
Management, 29(1), 27-30.
Howard, D. R., & Crompton, J. L. (1995). Financing sport. Morgantown, WV: Fitness
Information Technology.
Hughes, H. (1993). Olympic tourism and urban regeneration. Festival Management and
Event Tourism, 1(4), 157-162.
IEG Sponsorship Report (2006). 2006 sponsorship spending. IEG Sponsorship Report,
25.
IEG Sponsorship Report (2004). 2004 sponsorship spending. IEG Sponsorship Report,
23, 1-3.
Reproduced with permission of the copyright owner. Further reproduction prohibited without permission.
IEG Sponsorship Report (2003). 2003 sponsorship spending. IEG Sponsorship Report,
22, 1-2 .
IEG Sponsorship Report (2000). 2000 sponsorship spending. IEG Sponsorship Report,
19,4-5.
Ireland, R.D., & Hitt, M.A. (1999). Achieving and maintaining strategic competitiveness
in the 21 century: the role of strategic leadership. Academy o f Management
Executive, 13(1), 43-57.
Irwin, R.L., Lachowetz, T., Cornwell, T.B., & Clark, J.S. (2003). Cause-related sport
sponsorship: An assessment of spectator beliefs, attitudes and behavioural
intentions. Sport Marketing Quarterly, 12(3), 131-139.
Irwin, R., & Sutton, W. (1994). Sport sponsorship objectives: An analysis of their relative
importance for major corporate sponsors. European Journal o f Sport
Management, 1(2), 93-101.
Irwin, R. D. (1993). In search of sponsors. Athletic Management, 11-16.
Irwin, R.L., & Asimakopoulos, M.K. (1992). An approach to the evaluation and selection
of sport sponsorship proposals. Sport Marketing Quarterly, 1(2), 43 - 51.
ISBA (1998). A guide to sponsorship evaluation. London, UK: Incorporated Society of
British Advertisers.
Issues in Sponsorship (2003). How big is the Canadian sponsorship pie? The Sponsorship
Report. Retrieved September 29,2004, from http://www.sponsorship.ca.
Jacobides, M., & Croson, D.C. (2001). Informational policy: Shaping the value of agency
relationships. Academy o f Management Review, 26(2), 202-233.
Reproduced with permission of the copyright owner. Further reproduction prohibited without permission.
330
Jagre, E., Watson, J.J., & Watson, J.G. (2001). Sponsorship and congruity theory: A
theoretical framework for explaining consumer attitude and recall of event
sponsorship. Advances in Consumer Research, 28,439-45.
Jalleh, G., Donovan, R.J., Giles-Corti, B., & Holman, C.D. (2002). Sponsorship: Impact
on brand awareness and brand attitudes. Sport Marketing Quarterly, 8(1), 35-45.
Javalgi, R.G., Traylor, M.B., Gross, A.C., & Lampman, E. (1994). Awareness of
sponsorship and corporate image: An empirical investigation. Journal o f
Advertising, 23(4), 47-58.
Jeannet, J.-P., & Hennessey, H. D. (1992). Global Marketing Strategies (2 ed.). Boston,
MA: Houghton Mifflin Company.
Jensen, M. (1983). Organization theory and methodology. Accounting Review, 56,319-
338.
Jensen, M., & Meckling, W. (1976). Theory of the firm: Managerial behaviour, agency
costs and capital structure. Journal o f Financial Economics, 3, 305-360.
Jobber, D. (1998). Principles and practice of marketing (2 ed.). London: McGraw-Hill.
Johar, G.V., & Pham, M.T. (1999). Relatedness, prominence, and constructive sponsor
identification. Journal o f Marketing Research. 36(3), 299-312.
John, G., Weiss, A., & Weitz, B. (1987). An organizational coordination model of
salesforce compensation plans: Theoretic analysis and empirical test. Journal o f
Law, Economics, and Organization, 3(Fall), 373-396.
Kahle, L., & Homer, P. (1985). Physical attractiveness of the celebrity endorser: A social
adaptation perspective. Journal o f Consumer Research, 11(3), 954-961.
Kell, T. (2004a). Personal communication. October 22.
Reproduced with permission of the copyright owner. Further reproduction prohibited without permission.
331
Kell, T. (2004b). Personal communication. December 1.
Kell, T. (2004c). Personal communication. September 24.
Kell, T. (2004d). Personal communication. December 10.
Kell, T. (2005a). Personal communication. February 7.
Kell, T. (2005b). Personal communication. August 11.
Kell, T. (2005c). Personal communication. October 14.
Kell, T. (2006a). Personal communication. August 28.
Kell, T. (2006b). Personal communication. April 23.
Kell, T. (2006c). Personal communication. Nov 13.
Keller, K.L., (1993). Conceptualising, measuring, and managing customer-based brand
equity. Journal o f Marketing, 57 (1), 1-22.
Kinney, L., & McDaniel, S. (1996). Strategic implications of attitude-toward-the-ad
leveraging event sponsorships. Journal o f Sport Management, 10(1), 250 - 261.
Kitchen, PJ. (1993). Marketing communications renaissance. International Journal o f
Advertising, 12(4), 367-386.
Kodish, B. (2003). General semantics: A general theory of evaluation. Concord, 60(3),
286-294.
Kolah, A. (2003). Maximizing the value o f sponsorship. Sport Business Group Limited
Publication.
Kotler, P. (1997). Marketing Management (9 ed.). New Jersey: Prentice Hall.
Kover, A.J. (2001). Editorial: The sponsorship issue. Journal o f Advertising Research,
41(Jan-Feb), 5.
Reproduced with permission of the copyright owner. Further reproduction prohibited without permission.
332
Kuzma, J., & Shanklin, W. (1994). Corporate sponsorship: A framework for analysis.,
Dubuque, USA: Brown & Benchmark.
Kuzma, J.R., Shanklin, W.L., & McCally, J.R. (1993). Number one principle for sporting
events seeking corporate sponsors: Meet benefactor's objectives. Sport Marketing
Quarterly, 2(3), 27-32.
Lachowetz, T., McDonald, M., Sutton, W.A., & Hedrick, D.G. (2003). Corporate sales
activities and the retention of sponsors in the National Basketball Association
(NBA). Sport Marketing Quarterly, 12(1), 19-26.
Lachowetz, T., & Irwin, R. (2002). FedEx and the St. Jude Classic: An application of a
cause-related marketing program (CRMP). Sport Marketing Quarterly, 11(2),
114-116.
Lancaster, G., & Massingham, L. (1993). Essentials o f marketing. London, UK:
McGraw- Hill.
Lardinoit, T., & Quester, P. (2001). Attitudinal effects of combined sponsorship and
sponsor’s prominence on basketball in Europe. Journal o f Advertising Research,
41(Jan-Feb), 48-58.
Lascu, D., Giese, T.D., Toolan, C., Guehring, B., & Mercer, J. (1995). Sport
involvement: A relevant individual difference factor in spectator sports. Sport
Marketing Quarterly, 4(4), 41-46.
Law, A., Harvey, J., & Kemp, S. (2002). The global sport mass media oligopoly: The
three usual suspects and more. International Review for the Sociology o f Sport,
37, 279-302.
Reproduced with permission of the copyright owner. Further reproduction prohibited without permission.
333
Lee, J.K. (2005). Marketing and promotion of the Olympic Games. The Sport Journal,
8(3), retrieved from http://www.thesportioumal.org.
Lee, M.S., Sandler, D.M., & Shani, D. (1997). Attitudinal constructs towards
sponsorship. International Marketing Review, 14(3), 159-169.
Liu, Y., Putler, D.S., & Weinberg, C.B. (2004). Is having more channels really better? A
model of competition among commercial television broadcasters. Marketing
Science, 23(1), 120-133.
Ludwig, S., and Karabetsos, J.D. (1999). Objectives and evaluation processes utilized by
sponsors of the 1996 Olympic Games. Sport Marketing Quarterly, 8 (1), 11-19.
Luk, P. (2004). Personal communication. May 31.
Lyberger, M.R., & McCarthy, L. (2002). An analysis of volume consumption, consumer
interest and perceptions of sport sponsorship as they related to the Super Bowl.
International Journal o f Sports Marketing and Sponsorship, 1 (Dec/Jan), 429-
447.
Lyberger, M., & McCarthy, L. (2001). An assessment of consumer knowledge of, interest
in, and perceptions of ambush marketing strategies. Sport Marketing Quarterly,
10(2), 130-137.
Mack, R.W. (1999). Event sponsorship: An exploratory study of small business
objectives, practices, and perceptions. Journal o f Small Business Management,
37(3), 25-30.
Madrigal, R. (2001). Social identity effects in a belief-attutide-intentions hierarchy:
Implications for corporate sponsorship. Psychology & Marketing, 18(2), 145-165.
Reproduced with permission of the copyright owner. Further reproduction prohibited without permission.
3 3 4
Marshall, D., & Cook, G. (1992). The corporate sports sponsor. International Journal o f
Advertising, 11, 307-324.
Mason, D.S. (1999). What is the sports product and who buys it? The marketing of
professional sport leagues. European Journal o f Marketing, 33(3/4), 402-418.
McCarthy, L. M., & Irwin, R. I. (2000). An examination of the rationale and motives for
corporate purchase of stadia and arena naming rights. The Cyber-Journal o f Sport
Marketing, 4(2/3).
McCarthy, L. M., & Irwin, R. I. (1998). Names in lights: Corporate purchase of sport
facility naming rights. The Cyber-Journal o f Sport Marketing, 2(3).
McCarville, R.E., Flood, C.M., & Froates, T.A. (1998). The effectiveness of selected
promotions on spectators’ assessments of a non-profit sporting event sponsor.
Journal o f Sport Management, 12, 51-62.
McCarville, R.E., & Copeland, R.P. (1994). Understanding sport sponsorship through
exchange theory. Journal o f Sport Management, 8,102-114.
McCook, K., Turco, D., & Riley, R. (1997). A look at the corporate sponsorship
decision-making process. Cyber-Journal o f Sport Marketing, 1(3).
McCracken, G. (1989). Who is the celebrity endorser? Cultural foundations of the
endorsement process. Journal o f Consumer Behaviour, 16(3), 310-321.
McCarthy, L., & Lyberger, M. (2001). An assessment of consumer knowledge of interest
in, and perceptions of ambush marketing strategies. Sport Marketing Quarterly,
Vol. 10, No. 4, pp. 130-137.
Reproduced with permission of the copyright owner. Further reproduction prohibited without permission.
McDaniel, S. (1999). An investigation of match-up effects in sport sponsorship
advertising: The implications of consumer advertising schemas. Psychology &
Marketing, 16 (2), 163-184.
McDaniel, S.R., & Mason, D.M. (1999). An exploratory study of influences on public
opinion towards alcohol and tobacco sponsorship of sporting events. Journal o f
Services Marketing, 13(6), 481-^499.
McDaniel, S.R., & Kinney, L. (1998). The implications of recency and gender effects on
consumer response to ambush marketing. Psychology & Marketing, 15(4), 385—
403.
McDonald, C. (1991). Sponsorship and the image of the sponsor. European
Journal o f Marketing, 25(11), 31-38.
Meenaghan, T. (2002). From sponsorship to marketing partnership: The Guinness
Sponsoring of the GAA All-Ireland Hurling Championships. Irish Marketing
Review, 15(1), 3-15.
Meenaghan, T. (2001). Understanding sponsorship effects. Psychology and Marketing,
18(2), 95-122.
Meenaghan, T., & Shipley, D. (1999). Media effect in commercial sponsorship.
European Journal o f Marketing, 25(11), 39-56.
Meenaghan, T. (1998). Current developments and future directions in sponsorship.
International Journal o f Advertising, 17, 3-28.
Meenaghan, T. (1994). Point of view - Ambush marketing: Immoral or imaginative
practice? Journal of Advertising Research, September/October, 77 - 88.
Reproduced with permission of the copyright owner. Further reproduction prohibited without permission.

3 3 6
Meenaghan, T. (1991a). Sponsorship - legitimising the medium. European Journal o f
Marketing, 25(11), 5 -10.
Meenaghan, T. (1991b). The role of sponsorship in the communications and marketing
mix. International Journal o f Advertising, 10 (1), 35-47.
Meenaghan, T. (1983). Commercial sponsorship. European Journal o f Marketing,
Special issue, 1-73.
Meerabeau, E., Gillet, R., Kennedy, M., Adeoba, J., Byasss, M., & Tabi, K. (1991).
Sponsorship and the drinks industry in the 1990s. European Journal o f
Marketing, 25(11), 39 - 56.
Melkers, J.E., & Cozzens, S.E. (1997). A review of performance measurement in state
science and technology-based economic development programs. In S.A. Rood
(Ed.), Technology Transfer: How Do We Know What Works? Proceedings o f the
Technology Transfer Metrics Summit (pp. 109-117). New Mexico: Technology
Transfer Society.
Mendez, H.Y. (1999). Virtual signage: The pitfalls of ‘now you see it, now you don’t.’”
Sport Marketing Quarterly, 8 (4), 15-21.
Meredith, L. (1993). A customer evaluation system. The Journal o f Business and
Industrial Marketing. 8(1), 58-73.
Messmer, M. (2004). Developing effective performance reviews. Strategic Finance,
85(9), 13-14.
Meyer, H. (1999). When the cause is just. Journal o f Business Strategy, 20(6), 27-31.
Milne, G. R., & McDonald, M. A. (1999). Sport Marketing: Managing the exchange
process. Sudbury, Mass.: Jones and Bartlett.
Reproduced with permission of the copyright owner. Further reproduction prohibited without permission.
337
Miyazaki, A.D., & Morgan, A.G. (2001). Assessing market value of event sponsoring:
Corporate Olympic sponsorships. Journal o f Advertising Research, 41(1), 9-16.
Moore, J.N., Pickett, G.M., & Grove, S.J. (1999). The impact of a video screen and
rotational-signage systems on satisfaction and advertising recognition. Journal o f
Services Marketing, 13(6), 453-468.
Moorthy, K.S. (1987). Managing channel profits: comment. Marketing Science, 6(Fall),
375-379.
Morgan, R.M., & Hunt, S.D. (1994). “The commitment-trust theory of relationship
marketing. Journal o f Marketing, 58(July), 20-38.
Mount, J., & Niro, B. (1995). Sponsorship: An empirical study of its application to local
business in a small town setting festival. Management and Event Tourism, 2,167-
175.
Mullin, B., Hardy, S., & Sutton, W. (2000). Sport marketing (2 ed.). Champaign, IL:
Human Kinetics.
Mullin, J. (1997). Performance-based corporate philanthropy: How ‘giving smart’ can
further corporate goals. Public Relations Quarterly, 42(2), 42-48.
Nelson, P. (1974). Advertising as information. Journal o f Political Economy,
82(July/August), 729-754.
Newbum, T. (2001). What do we mean by evaluation? Children and Society, 15, 5-13.
Nicholls, J.A.F., Roslow, S., & Dublish, S. (1999). Brand recall and brand preference at
sponsored golf and tennis tournaments. European Journal o f Marketing, 33(3/4),
365-386.
Oakley, A. (1998). Public policy experimentation: Lessons from America. Policy Studies,
Reproduced with permission of the copyright owner. Further reproduction prohibited without permission.
3 3 8
1 9 (2 ) , 9 3 - 1 1 4 .
Ogilvie, C. (2006, December 4). Sponsorship, a challenge, not charity: It’s about
legacies, brand association and being Canadian. The Vancouver Province. p.A4.
O’Hagan, J., & Harvey, D. (2000). Why do companies sponsor arts events? Some
evidence and a proposed classification. Journal o f Cultural Economics, 24,205-
24.
Ojala, C.F., & Edmondson, B. (1987). Businesses that sponsor women’s sports gain loyal
customers. American Demographics, October, 35-37.
Olkkonen, R. (2001). Case study: The network approach to international sport
sponsorship arrangement. Journal o f Business and Industrial Marketing, 16(4),
309-329.
O’Reilly, N., & Madill, J. (2007). The World Anti-Doping Agency: The role of social
marketing. Journal o f Nonprofit and Public Sector Marketing, 17(1/2).
O’Reilly, N., & Rahinel, R. (2006). Forecasting the importance of media technology in
sport: The case of the televised ice hockey product in Canada. International
Journal o f Sport Marketing and Sponsorship, 8(1).
O’Reilly, N., Nadeau, J., Seguin, B., & Harrison, M. (2007). In-stadium sponsorship
evaluation of a mega-sponsee: The 2004 Grey Cup. International Journal o f Sport
Marketing and Sponsorship, 8(2).
Otker, T. (1988). Exploitation: The key to sponsorship success. Marketing and Research
Today, 16(2), 77-86.
Otker, T., & Hayes, P. (1987). Judging the efficiency of sponsorship: Experience from
the 1986 Soccer World Cup. European Research, 15(4), 3-9.
Reproduced with permission of the copyright owner. Further reproduction prohibited without permission.

3 3 9
Palumbo, G. (2001). Trial procedures and optimal limits on proof-taking. International
Review o f Law and Economics, 21(3), 309-327.
Parker, K. (1991). Sponsorship: The research contribution. European Journal o f
Marketing, 25(11), 22-30.
Edmonton Grand Prix General Manager (2006). Personal communication. Aug 1.
Edmonton Grand Prix Sponsorship Consultant (2006). Personal communication. Aug 1.
Patton, M. (1980). Qualitative evaluation methods. London: Sage.
Perrow, C. (1986). Complex organizations. New York, USA: Random House.
Peteraf, M. A. (1993). The cornerstones of competitive advantage: A resource-based
view. Strategic Management Journal, 14,179-191.
Petty, R.E., & Cacioppo, J.T. (1986). Communication and persuasion: Central and
peripheral routes to attitude change. New York: Springer Verlag.
Pham, M.T., & Johar, G.V. (2001). Market prominence biases in sponsor identification:
Processes and consequentiality. Psychology and Marketing, 18(2), 123-143.
Pham, M.T. (1992). Effects of involvement, arousal, and pleasure on the recognition of
sponsorship stimuli. Advances in Consumer Research, 19, 85-93.
Picard, P. (1987). On the design of incentive schemes under moral hazard and adverse
selection. Journal o f Public Economics, 33, 305-332.
Pitts, B., & Slattery, J. (2004). An examination of the effects of time on sponsorship
awareness levels. Sport Marketing Quarterly, 13(1), 43-54.
Polonsky, M.J. & Speed, R. (2001). Linking sponsorship and cause related marketing.
European Journal o f Marketing, 35(11/12), 1361-1385.
Reproduced with permission of the copyright owner. Further reproduction prohibited without permission.
Pope, N., & Voges, K. (2000). The impact of sport sponsorship activities, corporate
image, and prior use on consumer purchase intention. Sport Marketing Quarterly,
9(2), 96-102.
Pope, N. (1998). Consumption values, sponsorship awareness, brand and product use.
Journal o f Product and Brand Management, 7(2), 124-135.
Pope, N. K., & Voges, K. (1998). Awareness of sponsorship and corporate image: An
investigation replicated. Journal o f Marketing Communication, 5(1), 17-28.
Pope, N. K., & Voges, K. (1997). An exploration of sponsorship awareness by product
category and message location in televised sporting events. Cyber-Journal o f
Sport Marketing, 1(1), 16-27.
Pope, N. K., & Voges, K. (1994). Sponsorship evaluation: Does it match the motive and
the mechanism? Sport Marketing Quarterly, 3(4), 38-45.
Pound, R.W. (1996). The Importance of Commercialism for the Olympic Movement.
International Olympic Committee: Olympic Message Sources o f Financing
Sports, 3, 10-13.
Quester, P., & Thompson, B. (2001). Advertising and promotion leverage on arts
sponsorship effectiveness. Journal o f Advertising Research, 41(Jan-Feb), 33-47.
Quester, P., Burton, R., & Farrelly, F. (1998). Organizational power games: Decisions in
sports sponsorship investment. Marketing Management, 7 (1), 6-15.
Quester, P., & Farrelly, F. (1998). Brand association and memory decay effects of
sponsorship: the case of the Australian Formula One Grand Prix. The Journal o f
Product and Brand Management, 7(6), 539-550.
Reproduced with permission of the copyright owner. Further reproduction prohibited without permission.
3 4 1
Quester, P.G. (1997a). Sponsorship returns: the value of naming rights. Corporate
Communications: An International Journal, 2(3), 101-108.
Quester, P.G. (1997b). Awareness as a measure of sponsorship effectiveness: The
Adelaide Formula One Grand Prix and evidence of incidental ambush effects.
Journal o f Marketing Communications, 3, 1-20.
Rajaretnam, J., (1994). The long-term effects of sponsorship on corporate and product
image: Findings of a unique experiment. Marketing and Research Today,
February, 62-74.
Redfem, S. (1998). The evaluation boom: is it new? Journal o f Clinical Nursing, 1, 389-
391.
Rees, P., & Gardiner, H. (2003). Best value, partnerships and relationship marketing in
local government. International Journal o f Nonprofit and Voluntary Sector
Marketing, 8(2), 143-152.
Rifon, N.J., Choi, S.M., Trimble, C.S., & Li, H. (2004). Congruence effects in
sponsorship. Journal o f Advertising, 33(1), 29-42.
Rodebaugh, T.L. (2005). The factor structure of the DSM-III-R personality disorders: an
evaluation of competing models. International Journal o f Methods in Psychiatric
Research, 14(1), 43-55.
Rodgers, S. (2003). The effects of sponsor relevance on consumer reactions to internet
sponsorships. Journal o f Advertising, 32(4), 66-76.
Rosenberg, N.J., & Siegel, M. (2001). Use of corporate sponsorship as a corporate
marketing tool: a review of tobacco industry sponsorship in the USA, 1995-1999.
Tobacco Control, 10,239-246.
Reproduced with permission of the copyright owner. Further reproduction prohibited without permission.
3 4 2
Ross, S. (1973). The economic theory of agency: The principal’s problem. American
Economic Review, 63,134-139.
Rowley, J. (2004). Partnering paradigms? Knowledge management relationship
marketing. Industrial Management & Data Systems, 104(2), 149-157.
Rowley, J. (1998). Promotion and marketing communications in the information
marketplace. Library Review, 47(8), 383-387.
Rudan, K. (2005a). Personal Communication, December 4.
Rudan, K. (2005b). Personal Communication, December 9.
Rudan, K. (2006a). Personal Communication, February 11.
Rudan, K. (2006b). Personal Communication, February 12.
Rudan, K. (2006c). Personal Communication, July 31.
Rudan, K. (2006d). Personal Communication, May 10.
Rudan, K. (2006e). Personal Communication, November 16.
Ruth, J.A., & Simonin, B.L. (2003). Brought to you by Brand A and Brand B:
investigating multiple sponsors’ influence on consumers’ attitudes towards
sponsorsed events. Journal o f Advertising, 32(3), 19-30.
Sacks, P. (1997). Standardized testing: Meritocracy’s crooked yardstick. Change, 29(2),
24-32.
Sandler, D.M., & Shani, D. (1998). Ambush marketing: Is confusion to blame for the
flickering of the flame? Psychology & Marketing, 15(4), 367-383.
Sandler, D.M., & Shani, D. (1993). Sponsorship and the Olympic Games: The consumer
perspective. Sport Marketing Quarterly, 2(3), 38-43.
Reproduced with permission of the copyright owner. Further reproduction prohibited without permission.
Sandler, D.M., & Shani, D. (1989). Olympic sponsorship vs. 'ambush' marketing: Who
gets the gold? Journal o f Advertising Research, 11 (Aug/Sept), 9-14.
Sappington, D. (1991). Incentives in principal-agent relationships. Journal o f Economic
Perspectives, 3(2), 45-66.
Scherer, J., & Sam, M. (2005). Sporting sign wars: advertising and the contested terrain
of sporting events and venues. International Journal o f Sport Management and
Marketing, 1(1/2), 17-36.
Schwarz, N. (1999). Self-reports: How the questions shape the answers. American
Psychologist, 54(2), 93-105.
Scott, J.C. (1998). Seeing Like a State. New Haven, USA: Yale University Press.
Scott, D., & Suchard, H. (1992). Motivations for Australian expenditure on sponsorship:
An analysis. International Journal o f Advertising, 11, 325-332.
Scriven, M. (1998). The new science of evaluation. Scandinavian Journal o f Social
Welfare, 7,79-86.
Seguin, B., Lyberger, M., O’Reilly, N., & McCarthy, L. (2005) Internationalizing
ambush marketing: The Olympic brand and country of origin. International
Journal o f Sport Sponsorship and Marketing, 6(4).
Seguin, B., Teed, K., & O’Reilly, N. (2005). National sport organizations and
sponsorship: An identification of Best Practices. International Journal o f Sport
Management and Marketing, 1(1/2), 69-83.
Shank, M.D. (2005). Sports marketing: A strategic perspective (3 ed.). Upper Saddle
River, NJ: Prentice Hall.
Reproduced with permission of the copyright owner. Further reproduction prohibited without permission.
Shank, M.D. (2002). Sports marketing: A strategic perspective (2 ed.). Upper Saddle
River, NJ: Prentice Hall.
Shank, M.D. (1999). Sports marketing: A strategic perspective. Upper Saddle River, NJ:
Prentice Hall.
Shanklin, W., & Kuzma, J. (1992). Buying that sporting image: What senior executives
need to know about corporate sports sponsorship. Marketing Management,
Spring, 59-64.
Shannon, R., & Turley, L.W. (1997). The influence of in-arena promotions on purchase
behavior and purchase intentions. Sport Marketing Quarterly, 6(4), 53-62.
Shannon, J.R. (1996). The new promotion mix: A proposed paradigm, process, and
application. Journal o f Marketing Theory and Practice, (4)1,56-68.
Shaw, B., & Post, F.R. (1993). A moral basis for corporate philanthropy. Journal o f
Business Ethics, 12,745-751.
Shilbury, D., & Berriman, M. (1996). Sponsorship awareness: A study of St. Kilda
Football Club supporters. Sport Marketing Quarterly, 1(1), 27-33.
Shimp, T.A. (1997). Advertising, promotion, and supplemental aspects o f integrated
marketing communications (4 ed.). Fort Worth, USA and London, UK: Dryden
Press.
Sia, T.L., Lord, C.G., Blessum, K.A., Ratcliff, C.D., & Leppter, M.R. (1997). Is a rose
always a rose? The role of social category exemplar change in attitude stability
and attitude-behavior consistency. Journal ofpersonality and social psychology,
72(3), 501-514.
Reproduced with permission of the copyright owner. Further reproduction prohibited without permission.

3 4 5
Siegel, M. (2001). Counteracting tobacco motor sports sponsorship as a promotional tool:
in the tobacco settlement. American Journal o f Public Health, 7,1100-1106.
Slack, T. (1997). Understanding sport organizations: The application o f organization
theory. Champaign, USA: Human Kinetics.
Slack, T., & Bentz, L. (1996). The involvement of small businesses in sport sponsorship.
Managing Leisure, 1,175-184.
Sleight, S. (1989). Sponsorship: What it is and how to use It. Bershire, England:
McGraw-Hill.
Smith, C. (1994). The new corporate philanthropy. Harvard Business Review, 72(3), 105-
116.
Sparks, R. (1997). Tobacco-control legislation, public health and sport sponsorship. Asia-
Australian Marketing Journal, 5(1), 59-70.
Speed, R., & Thompson, P. (2000). Determinants of sports sponsorship response. Journal
o f the Academy o f Marketing Science, 28(2), 226-238.
Sperling, C. (2006). Personal Communication, July 27.
Sperling, C. (2006b). Personal Communication, December 1.
Sport Business News (2006). London 2012 Sponsorship Interest Soars. August 9,2006.
Retrieved from http://www.sportbusiness.com.
Stake, R.E. (1995). The art o f case study research. Thousand Oaks, California: Sage.
Statistics Canada (2007). Provincial and territorial highlights: 2001 Census. March 10,
2007. Retrieved from http://www.statscan.ca.
Stipp, H. (1998). The impact of Olympic sponsorship on corporate image. International
Journal o f Advertising, 17(1), 75-87.
Reproduced with permission of the copyright owner. Further reproduction prohibited without permission.
Stipp, H., & Schiavone, N.P. (1996). Modeling the impact of Olympic sponsorship on
corporate image. Journal o f Advertising Research, 36(4), 5-21.
Stotlar, D.K. (1993). Sponsorship and the Olympic winter games. Sport Marketing
Quarterly, 2(1), 35-43.
Stotlar, D.K., & Kadlecek, J.C. (1993). What’s in it for me? Athletic Business, April, 32-
36.
Stotlar, D.K., & Johnson, D.A. (1989). Assessing the impact and effectiveness of stadium
advertising on sport spectators at division I institutions. Journal o f Sport
Management, 2(2), 100-114.
Strauss, B., & Friege, C. (1999). Regaining service customers. Journal o f Service
Research, 1(4), 347-361.
Suite Host l (2006). Expert interview, Edmonton, AB, July 27,2006.
Suite_Host_2 (2006). Expert interview, Edmonton, AB, July 31,2006.
Sutton, R.I., & Staw, B.M. (1995). What theory is not. Administrative Science Quarterly,
40, 371-384.
Swenson, D. (2001). How to evaluate a theory. Management Department, The College of
St. Scholastica, Duluth, MN, web publication.
Tenner, A.R., & DelToro, I.J. (2000). Process redesign. Upper Saddle River, New
Jersey: Prentice Hall.
Thorelli, H.B. (1986). Networks: between markets and hierarchies. Strategic
Management Journal, 7, 37-51.
Reproduced with permission of the copyright owner. Further reproduction prohibited without permission.
3 4 7
Thwaites, D., Aguilar-Manjarrez, R., & Kidd, C. (1998). Sports sponsorship development
in Canadian companies: Issues and trends. International Journal o f Advertising,
17,29-49.
Thwaites, D., & Carruthers, A. (1998). Practical applications of sponsorship theory:
Empirical evidence from English rugby clubs. Journal o f Sport Management, 12,
203-219.
Thwaites, D. (1995). Professional football sponsorship: Profit or profligate? International
Journal o f Advertising, 14(2), 149-164.
Townley, S., Harrington, D., & Couchman, N. (1998). The legal and practical prevention
of ambush marketing in sports. Psychology & Marketing, 15(4), 333-348.
Tripodi, J. (2001). Sponsorship - a confirmed weapon in the promotional armoury.
International Journal o f Sports Marketing and Sponsorship, March/April, 1-20.
Turner, P. (1999). Television and the internet convergence: Implications for sports
broadcasting. Sport Marketing Quarterly, 8(2), 43-51.
Ukman, L. (1995). IEG's complete guide to sponsorship. Chicago: International Events
Group.
VANOC. (2006). Mint named as official sponsor ofVANOC. Vancouver: VANOC
Communications.
Valliere, D. (2004). Personal Communication. September 3.
Vavra, T.G. (1995). Aftermarketing: How to keep customers for life through relationship
marketing. Chicago: Irwin Professional Publishing.
Waller, D.S. (2004). Developing an account-management lifecycle for advertising
agency-client relationships. Marketing Intelligence & Planning, 22(1), 95-112.
Reproduced with permission of the copyright owner. Further reproduction prohibited without permission.

3 4 8
Walliser, B. (2003). An international review of sponsorship research: extension and
update. International Journal o f Advertising, 22 (1), 5-40.
Walliser, B,. & Nanopoulos, P. (2000). Qui a gagne la coupe du monde 1998?
Determinants et importance de lassociation durable des sponsors a l'evenement.
Proceedings o f the 16 Congress o f the French Marketing Association (AFM),
May, 723-734, Montreal.
Walliser, B. (1994). Les determinants de la memorisation des sponsors. Revu Francaise
du Marketing, 150, 83-95.
Webb, J., & Carter, S. (2001). Sponsorship activities and the small firms sector.
Managing Leisure, 6(3), 168-179.
Webb, D.J., & Mohr, L.A. (1998). A Typology of Consumer Responses to Cause-Related
Marketing: from Skeptics to Socially Concerned. Journal o f Public Policy and
Marketing, 17(2), 226-238.
Wegerif, R. (1998). The social dimension of asynchronous learning networks. Journal o f
Asynchronous Learning Networks, 2(1), 34-49.
Weick, K.E. (1995). What Theory is Not, Theorizing is. Administrative Science
Quarterly, 40, 385-390.
Westerbeek, H.M., & Smith, A. (2002). Location Dependency and Sport Sponsors: A
Factor Analytic Study. Sport Marketing Quarterly, 11(3), 140-150.
Westerbeek, H.M. (2000). Is sponsorship dependent on geographic location of the sport
facility? Journal o f Marketing Communications, 6(1), 53-68.
Reproduced with permission of the copyright owner. Further reproduction prohibited without permission.
Westerbeek, H.M., & Shilbury, D. (1999). Increasing the focus on ‘place’ in the
marketing mix for facility dependent sport services. Sport Management Review,
2(1), 1-24.
Wilkinson, D.G. (1993). Sponsorship marketing: A practical reference guide for
corporations in the 1990’s. Toronto: The Wilkinson Group.
Williams, D.W. (2003). Measuring government in the early twentieth century. Public
Administration Review, 63(6), 643-659.
Williamson, O. (1988). Corporate finance and corporate governance. Journal o f Finance,
43(3), 567-591.
Willis, R. (2005). Testing times. History Today, 55(8), 38-39.
Wilson, G.A. (1997). Does sport sponsorship have a direct effect on product sales? The
Cyber-Journal o f Sport Marketing, 1(4).
Witcher, B., Craigen, J. G., Culligan, D., & Harvey, A. (1991). The links between
objectives and function in organizational sponsorship. International Journal o f
Advertising, 10, 13-33.
Wolton, C. (1988). Arts sponsorship: Harmony or discord? European Research, 16(2),
87-94.
Wong, C.K., Wong, W., & Yeung, C.H. (2001). Student behaviour and performance in
using a web-based assessment system. Innovations in Education and Teaching
International, 38(4), 339-346.
Woods, S.M. (1993). Attracting foreign sponsorship for American events: The myth.
Sport Marketing Quarterly, 2(2), 43-45.
Reproduced with permission of the copyright owner. Further reproduction prohibited without permission.
3 5 0
Woodside, A.G., & Wilson, E J . (2003). Case study research methods for theory building.
Journal o f Business & Industrial Marketing, 18(6/7), 493-508.
Worthen, B.R., & Sanders, J.R. (1991). The changing face of educational evaluation.
Theory Into Practice, 30(1), 3-13.
Wright, R. (1988). Measuring awareness of British football sponsorship. European
Research, 16(2), 104-108.
Yin, R.K. (2003). Applications o f case study research (2 ed.). London: Sage.
Yin, R.K. (1994). Case study research. Thousand Oaks, USA: Sage
Zikmund, W.G. & d'Amico, M. (1998). Marketing. Mason, USA: South-Western
Thomson Learning.
Reproduced with permission of the copyright owner. Further reproduction prohibited without permission.
351
APPENDIX_FOOTNOTE: Summary of Evaluation Application
Since the early 1800’s, formal evaluation in education has been observed in
various forms through the testing of students skills, and assessments of teacher
effectiveness (Willis, 2005; Redfem, 1998; Worthen & Sanders, 1991). Today
evaluation is viewed as fundamental to the learning process (Algozzine, Beattie, Bray,
Flowers, Gretes, Howley, Mohanty, & Spooner, 2004; Cantillon, 1998) with
sophisticated research on such aspects as measurement techniques (e.g., Wong, Wong &
Yeung, 2001; Sacks, 1997) and technology (e.g., Priluck, 2004; Wegerif, 1998)
dominating that literature. In business, formal evaluation plays a key role in various
feedback-driven business functions such as consumer behaviour, human resources,
financial planning and market forecasting (e.g., Tenner & DelToro, 2000). In government
and public policy, formal evaluation is important since “information about the
effectiveness of public services is hard to come by using any other means” (Oakley,
1998) and since such information is necessary in order to ensure that policy is suitable
for, and preserves, the prosperity of, citizens (Williams, 2003; Newbum, 2001). In the
legal system, evaluation is inherent as a trial itself could be described as a formal
evaluation (Palumbo, 2001). The field of psychology employs a number of evaluative
methods to assess human behavior and thought (e.g., Rodebaugh, 2005). In marketing,
the evaluation of consumers on a variety of measures (e.g., satisfaction, intent to
purchase, pricing, brand awareness, post-purchase opinion, etc.) is carried out in a variety
of ways (e.g., customer surveys, comment cards, online surveys, etc.), which impacts an
organization’s marketing mix (Meredith, 1993). Similarly, in human resources, the
formal evaluation of employees enables organization decisions on staffing, strategy and
Reproduced with permission of the copyright owner. Further reproduction prohibited without permission.
operations (Messmer, 2004; Capko, 2003; Slack, 1997). Formal evaluation is also
fundamental to the scientific method, and the medical sciences, since it involves the
processes of analyzing observations and comparing them back to previous studies and
experiments. (Scriven, 1998). Finally, in sport, athletes and teams of athletes are
constantly being evaluated against themselves and the performances of others, prior to
competition and post competition, and in such forms as physical training (improvement,
following program, etc.), medical (doping, health, injury prevention, etc.) mental training
(motivation, confidence, etc.), and team-building (morale, cohesiveness, etc.), all towards
a larger plan of athletic goals (Gomey & Ness, 2000).
This appendix provides a synopsis of the vast reach of evaluation and an outline
of the many areas where it has been applied. This is useful for this dissertation which
seeks to understand, develop and advance evaluation in sponsorship.
Reproduced with permission of the copyright owner. Further reproduction prohibited without permission.
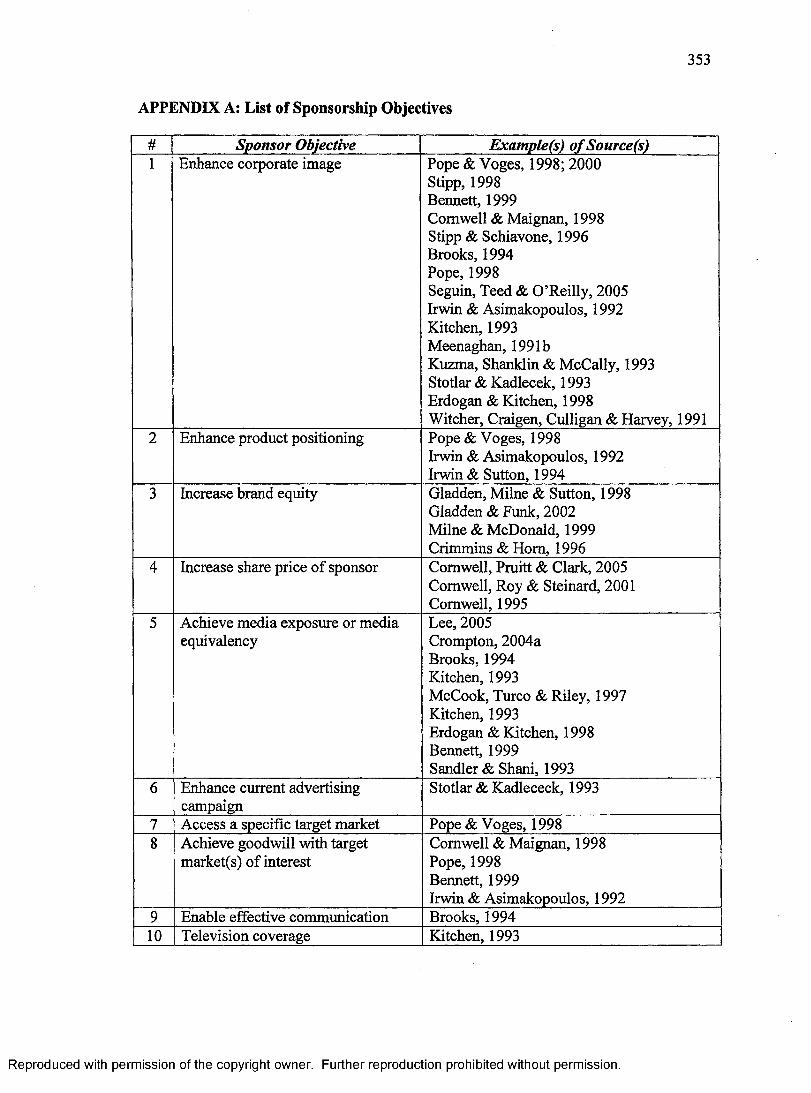
3 5 3
APPENDIX A: List of Sponsorship Objectives
# Sponsor Objective Example(s) of Source(s)1 Enhance corporate image Pope & Voges, 1998; 2000
Stipp, 1998 Bennett, 1999 Cornwell & Maignan, 1998 Stipp & Schiavone, 1996 Brooks, 1994 Pope, 1998Seguin, Teed & O’Reilly, 2005Irwin & Asimakopoulos, 1992Kitchen, 1993Meenaghan, 1991bKuzma, Shanklin & McCally, 1993Stotlar & Kadlecek, 1993Erdogan & Kitchen, 1998Witcher, Craigen, Culligan & Harvey, 1991
2 Enhance product positioning Pope & Voges, 1998 Irwin & Asimakopoulos, 1992 Irwin & Sutton, 1994
3 Increase brand equity Gladden, Milne & Sutton, 1998 Gladden & Funk, 2002 Milne & McDonald, 1999 Crimmins & Horn, 1996
4 Increase share price of sponsor Cornwell, Pruitt & Clark, 2005 Cornwell, Roy & Steinard, 2001 Cornwell, 1995
5 Achieve media exposure or media equivalency
Lee, 2005 Crompton, 2004a Brooks, 1994 Kitchen, 1993McCook, Turco & Riley, 1997Kitchen, 1993Erdogan & Kitchen, 1998Bennett, 1999Sandler & Shani, 1993
6 Enhance current advertising campaign
Stotlar & Kadlececk, 1993
7 Access a specific target market Pope & Voges, 19988 Achieve goodwill with target
market(s) of interestCornwell & Maignan, 1998 Pope, 1998 Bennett, 1999Irwin & Asimakopoulos, 1992
9 Enable effective communication Brooks, 199410 Television coverage Kitchen, 1993
Reproduced with permission of the copyright owner. Further reproduction prohibited without permission.
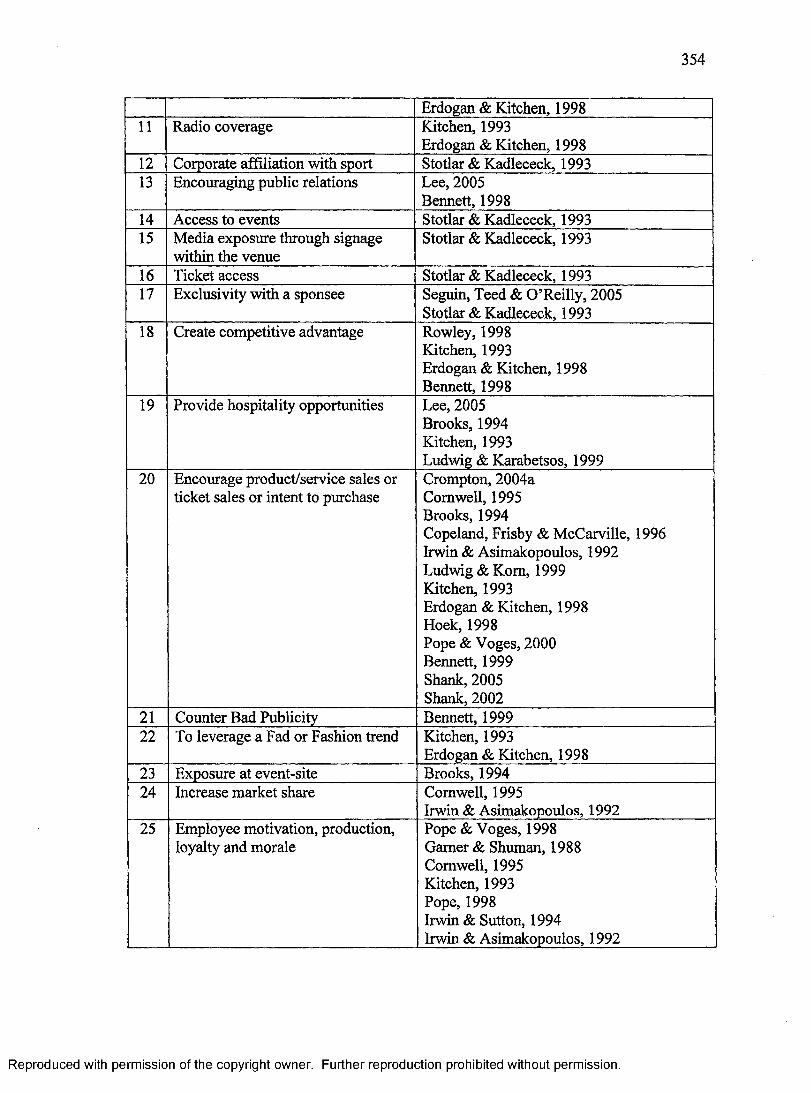
3 5 4
Erdogan & Kitchen, 199811 Radio coverage Kitchen, 1993
Erdogan & Kitchen, 199812 Corporate affiliation with sport Stotlar & Kadlececk, 199313 Encouraging public relations Lee, 2005
Bennett, 199814 Access to events Stotlar & Kadlececk, 199315 Media exposure through signage
within the venueStotlar & Kadlececk, 1993
16 Ticket access Stotlar & Kadlececk, 199317 Exclusivity with a sponsee Seguin, Teed & O’Reilly, 2005
Stotlar & Kadlececk, 199318 Create competitive advantage Rowley, 1998
Kitchen, 1993 Erdogan & Kitchen, 1998 Bennett, 1998
19 Provide hospitality opportunities Lee, 2005 Brooks, 1994 Kitchen, 1993Ludwig & Karabetsos, 1999
20 Encourage product/service sales or ticket sales or intent to purchase
Crompton, 2004a Cornwell, 1995 Brooks, 1994Copeland, Frisby & McCarville, 1996Irwin & Asimakopoulos, 1992Ludwig & Korn, 1999Kitchen, 1993Erdogan & Kitchen, 1998Hoek, 1998Pope & Voges, 2000Bennett, 1999Shank, 2005Shank, 2002
21 Counter Bad Publicity Bennett, 199922 To leverage a Fad or Fashion trend Kitchen, 1993
Erdogan & Kitchen, 199823 Exposure at event-site Brooks, 199424 Increase market share Cornwell, 1995
Irwin & Asimakopoulos, 199225 Employee motivation, production,
loyalty and moralePope & Voges, 1998Gamer & Shuman, 1988Cornwell, 1995Kitchen, 1993Pope, 1998Irwin & Sutton, 1994Irwin & Asimakopoulos, 1992
Reproduced with permission of the copyright owner. Further reproduction prohibited without permission.
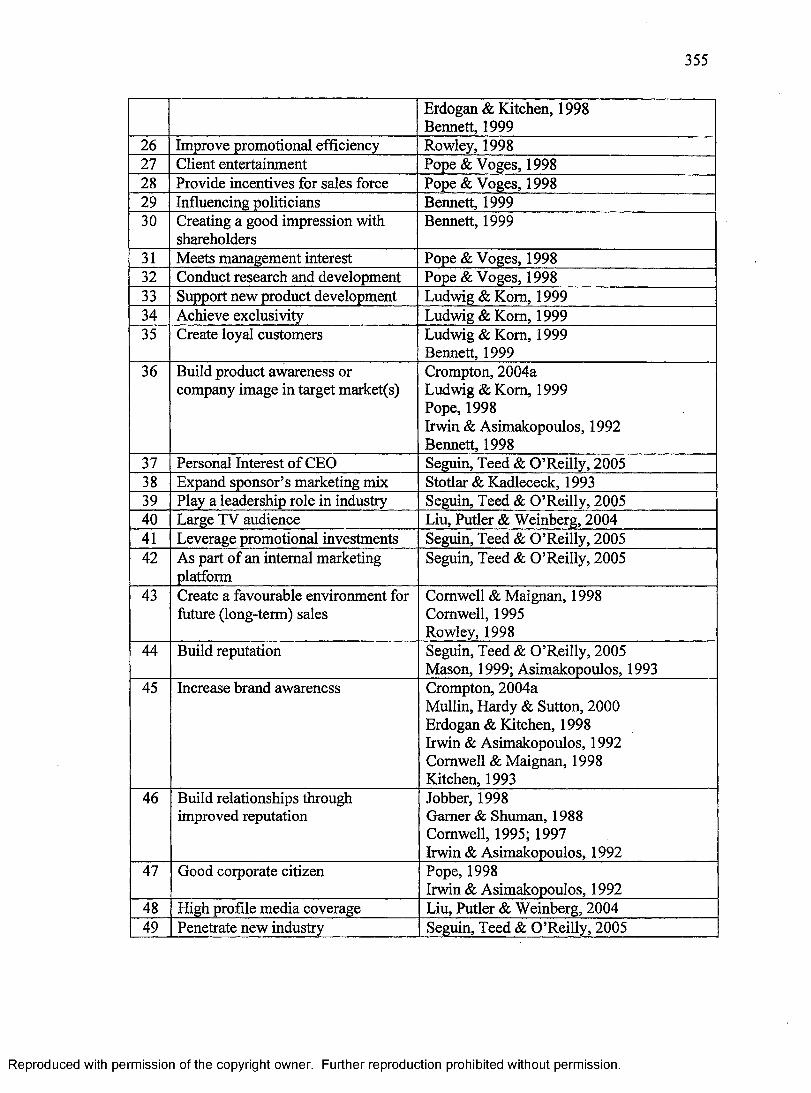
3 5 5
Erdogan & Kitchen, 1998 Bennett, 1999
26 Improve promotional efficiency Rowley, 199827 Client entertainment Pope & Voges, 199828 Provide incentives for sales force Pope & Voges, 199829 Influencing politicians Bennett, 199930 Creating a good impression with
shareholdersBennett, 1999
31 Meets management interest Pope & Voges, 199832 Conduct research and development Pope & Voges, 199833 Support new product development Ludwig & Korn, 199934 Achieve exclusivity Ludwig & Korn, 199935 Create loyal customers Ludwig & Korn, 1999
Bennett, 199936 Build product awareness or
company image in target market(s)Crompton, 2004a Ludwig & Korn, 1999 Pope, 1998Irwin & Asimakopoulos, 1992 Bennett, 1998
37 Personal Interest of CEO Seguin, Teed & O’Reilly, 200538 Expand sponsor’s marketing mix Stotlar & Kadlececk, 199339 Play a leadership role in industry Seguin, Teed & O’Reilly, 200540 Large TV audience Liu, Putler & Weinberg, 200441 Leverage promotional investments Seguin, Teed & O’Reilly, 200542 As part of an internal marketing
platformSeguin, Teed & O’Reilly, 2005
43 Create a favourable environment for future (long-term) sales
Cornwell & Maignan, 1998 Cornwell, 1995 Rowley, 1998
44 Build reputation Seguin, Teed & O’Reilly, 2005 Mason, 1999; Asimakopoulos, 1993
45 Increase brand awareness Crompton, 2004a Mullin, Hardy & Sutton, 2000 Erdogan & Kitchen, 1998 Irwin & Asimakopoulos, 1992 Cornwell & Maignan, 1998 Kitchen, 1993
46 Build relationships through improved reputation
Jobber, 1998Gamer & Shuman, 1988Cornwell, 1995; 1997Irwin & Asimakopoulos, 1992
47 Good corporate citizen Pope, 1998Irwin & Asimakopoulos, 1992
48 High profile media coverage Liu, Putler & Weinberg, 200449 Penetrate new industry Seguin, Teed & O’Reilly, 2005
Reproduced with permission of the copyright owner. Further reproduction prohibited without permission.
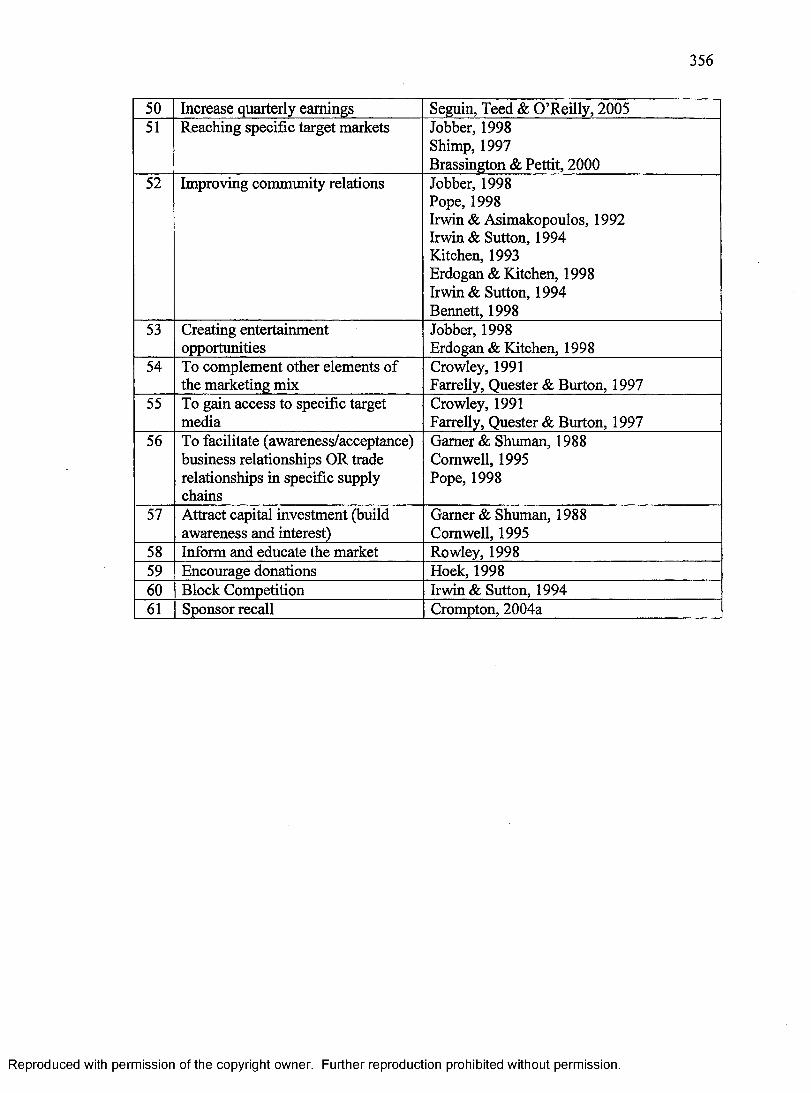
3 5 6
50 Increase quarterly earnings Seguin, Teed & O’Reilly, 200551 Reaching specific target markets Jobber, 1998
Shimp, 1997Brassington & Pettit, 2000
52 Improving community relations Jobber, 1998 Pope, 1998Irwin & Asimakopoulos, 1992 Irwin & Sutton, 1994 Kitchen, 1993 Erdogan & Kitchen, 1998 Irwin & Sutton, 1994 Bennett, 1998
53 Creating entertainment opportunities
Jobber, 1998Erdogan & Kitchen, 1998
54 To complement other elements of the marketing mix
Crowley, 1991Farrelly, Quester & Burton, 1997
55 To gain access to specific target media
Crowley, 1991Farrelly, Quester & Burton, 1997
56 To facilitate (awareness/acceptance) business relationships OR trade relationships in specific supply chains
Gamer & Shuman, 1988 Cornwell, 1995 Pope, 1998
57 Attract capital investment (build awareness and interest)
Garner & Shuman, 1988 Cornwell, 1995
58 Inform and educate the market Rowley, 199859 Encourage donations Hoek, 199860 Block Competition Irwin & Sutton, 199461 Sponsor recall Crompton, 2004a
Reproduced with permission of the copyright owner. Further reproduction prohibited without permission.
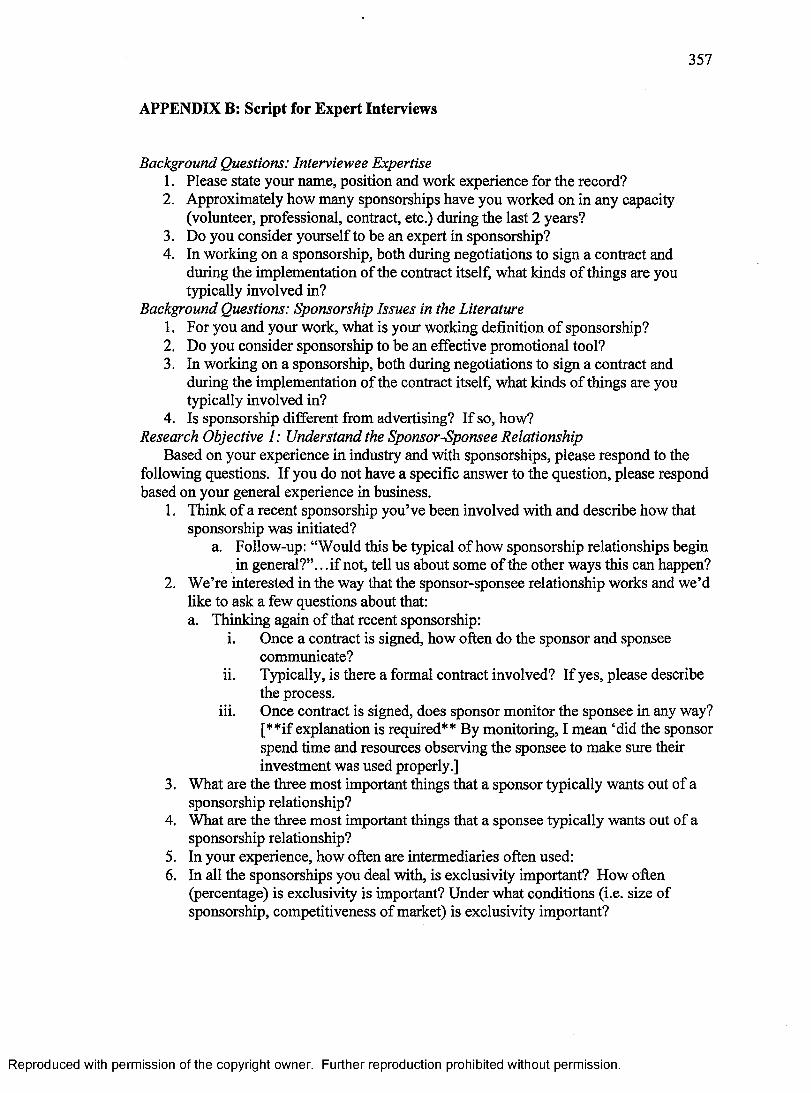
3 5 7
APPENDIX B: Script for Expert Interviews
Background Questions: Interviewee Expertise1. Please state your name, position and work experience for the record?2. Approximately how many sponsorships have you worked on in any capacity
(volunteer, professional, contract, etc.) during the last 2 years?3. Do you consider yourself to be an expert in sponsorship?4. In working on a sponsorship, both during negotiations to sign a contract and
during the implementation of the contract itself, what kinds of things are you typically involved in?
Background Questions: Sponsorship Issues in the Literature1. For you and your work, what is your working definition of sponsorship?2. Do you consider sponsorship to be an effective promotional tool?3. In working on a sponsorship, both during negotiations to sign a contract and
during the implementation of the contract itself, what kinds of things are you typically involved in?
4. Is sponsorship different from advertising? If so, how?Research Objective 1: Understand the Sponsor-Sponsee Relationship
Based on your experience in industry and with sponsorships, please respond to the following questions. If you do not have a specific answer to the question, please respond based on your general experience in business.
1. Think of a recent sponsorship you’ve been involved with and describe how that sponsorship was initiated?
a. Follow-up: “Would this be typical of how sponsorship relationships begin in general?”.. .if not, tell us about some of the other ways this can happen?
2. We’re interested in the way that the sponsor-sponsee relationship works and we’d like to ask a few questions about that:a. Thinking again of that recent sponsorship:
i. Once a contract is signed, how often do the sponsor and sponsee communicate?
ii. Typically, is there a formal contract involved? If yes, please describe the process.
iii. Once contract is signed, does sponsor monitor the sponsee in any way? [**if explanation is required** By monitoring, I mean ‘did the sponsor spend time and resources observing the sponsee to make sure their investment was used properly.]
3. What are the three most important things that a sponsor typically wants out of a sponsorship relationship?
4. What are the three most important things that a sponsee typically wants out of a sponsorship relationship?
5. In your experience, how often are intermediaries often used:6. In all the sponsorships you deal with, is exclusivity important? How often
(percentage) is exclusivity is important? Under what conditions (i.e. size of sponsorship, competitiveness of market) is exclusivity important?
Reproduced with permission of the copyright owner. Further reproduction prohibited without permission.
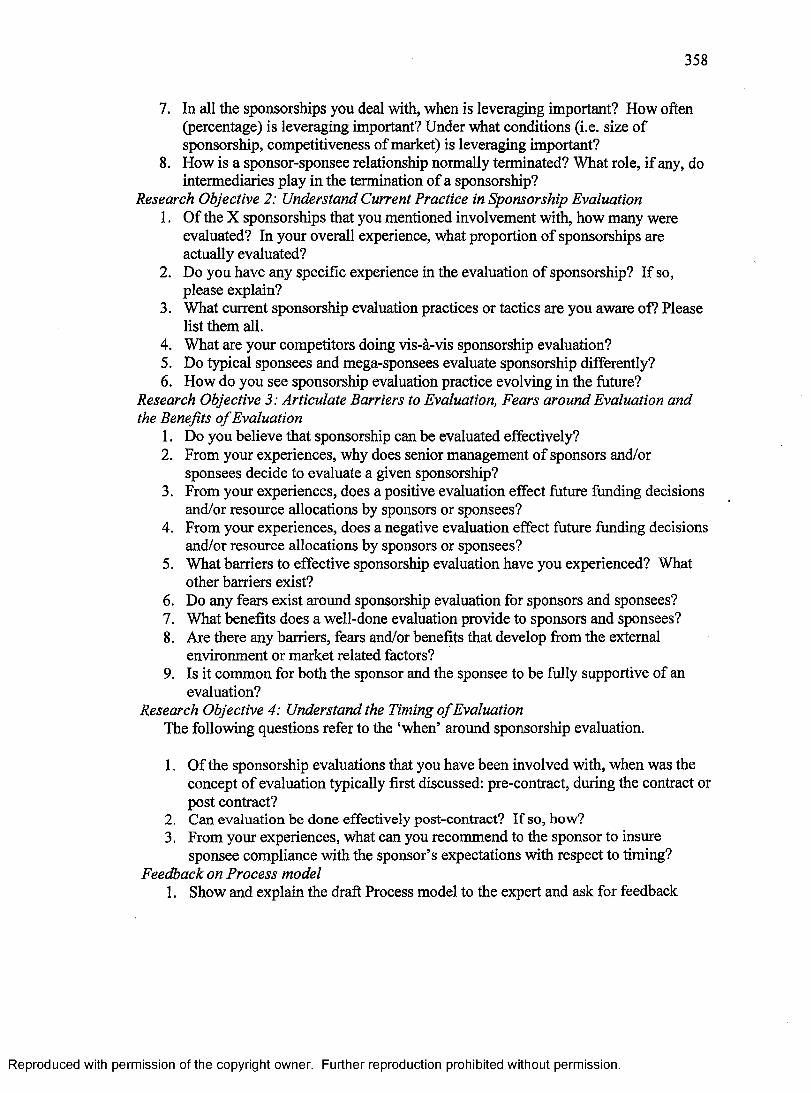
3 5 8
7. In all the sponsorships you deal with, when is leveraging important? How often (percentage) is leveraging important? Under what conditions (i.e. size of sponsorship, competitiveness of market) is leveraging important?
8. How is a sponsor-sponsee relationship normally terminated? What role, if any, do intermediaries play in the termination of a sponsorship?
Research Objective 2: Understand Current Practice in Sponsorship Evaluation1. Of the X sponsorships that you mentioned involvement with, how many were
evaluated? In your overall experience, what proportion of sponsorships are actually evaluated?
2. Do you have any specific experience in the evaluation of sponsorship? If so, please explain?
3. What current sponsorship evaluation practices or tactics are you aware of? Please list them all.
4. What are your competitors doing vis-a-vis sponsorship evaluation?5. Do typical sponsees and mega-sponsees evaluate sponsorship differently?6. How do you see sponsorship evaluation practice evolving in the future?
Research Objective 3 : Articulate Barriers to Evaluation, Fears around Evaluation andthe Benefits o f Evaluation
1. Do you believe that sponsorship can be evaluated effectively?2. From your experiences, why does senior management of sponsors and/or
sponsees decide to evaluate a given sponsorship?3. From your experiences, does a positive evaluation effect future funding decisions
and/or resource allocations by sponsors or sponsees?4. From your experiences, does a negative evaluation effect future funding decisions
and/or resource allocations by sponsors or sponsees?5. What barriers to effective sponsorship evaluation have you experienced? What
other barriers exist?6. Do any fears exist around sponsorship evaluation for sponsors and sponsees?7. What benefits does a well-done evaluation provide to sponsors and sponsees?8. Are there any barriers, fears and/or benefits that develop from the external
environment or market related factors?9. Is it common for both the sponsor and the sponsee to be fully supportive of an
evaluation?Research Objective 4: Understand the Timing o f Evaluation
The following questions refer to the ‘when’ around sponsorship evaluation.
1. Of the sponsorship evaluations that you have been involved with, when was the concept of evaluation typically first discussed: pre-contract, during the contract or post contract?
2. C an evaluation be done effectively post-contract? I f so, how ?3. From your experiences, what can you recommend to the sponsor to insure
sponsee compliance with the sponsor’s expectations with respect to timing?Feedback on Process model
1. Show and explain the draft Process model to the expert and ask for feedback
Reproduced with permission of the copyright owner. Further reproduction prohibited without permission.
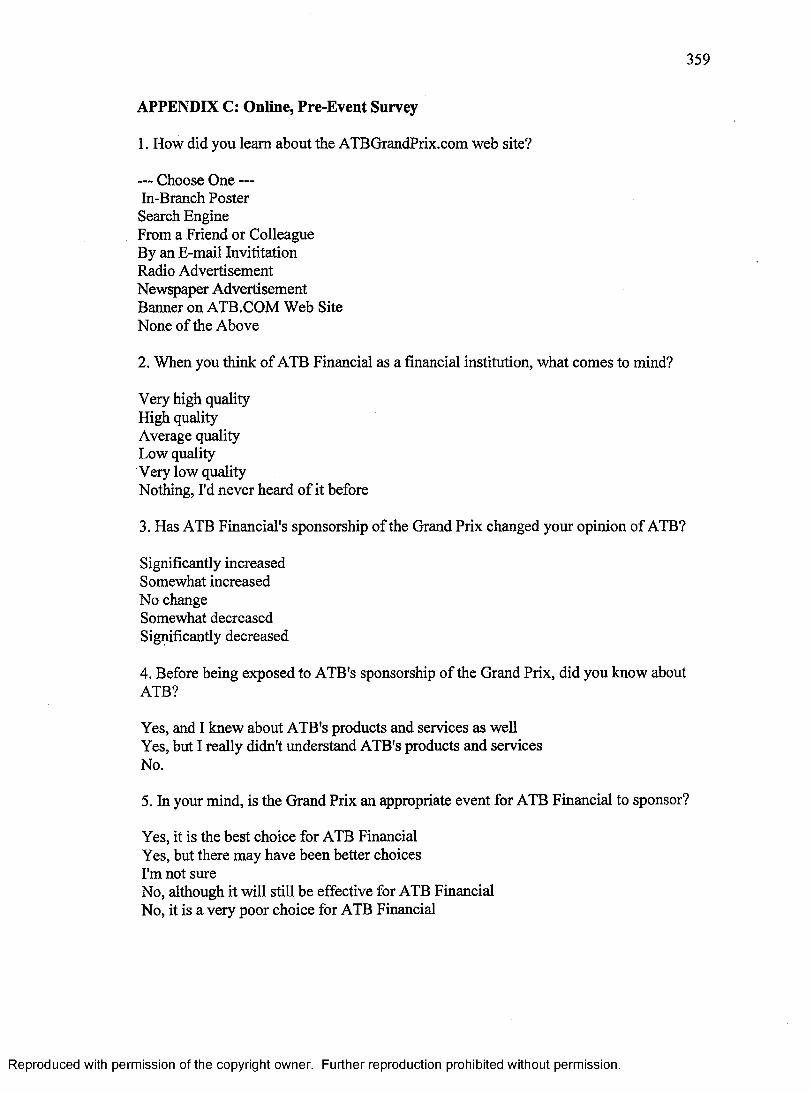
3 5 9
APPENDIX C: Online, Pre-Event Survey
1. How did you learn about the ATBGrandPrix.com web site?
— Choose One —In-Branch Poster Search Engine From a Friend or Colleague By an E-mail Invititation Radio Advertisement Newspaper Advertisement Banner on ATB.COM Web Site None of the Above
2. When you think of ATB Financial as a financial institution, what comes to mind?
Very high quality High quality Average quality Low quality Very low qualityNothing, I'd never heard of it before
3. Has ATB Financial's sponsorship of the Grand Prix changed your opinion of ATB?
Significantly increased Somewhat increased No change Somewhat decreased Significantly decreased
4. Before being exposed to ATB's sponsorship of the Grand Prix, did you know about ATB?
Yes, and I knew about ATB's products and services as well Yes, but I really didn't understand ATB's products and services No.
5. In your mind, is the Grand Prix an appropriate event for ATB Financial to sponsor?
Yes, it is the best choice for ATB Financial Yes, but there may have been better choices I'm not sureNo, although it will still be effective for ATB Financial No, it is a very poor choice for ATB Financial
Reproduced with permission of the copyright owner. Further reproduction prohibited without permission.
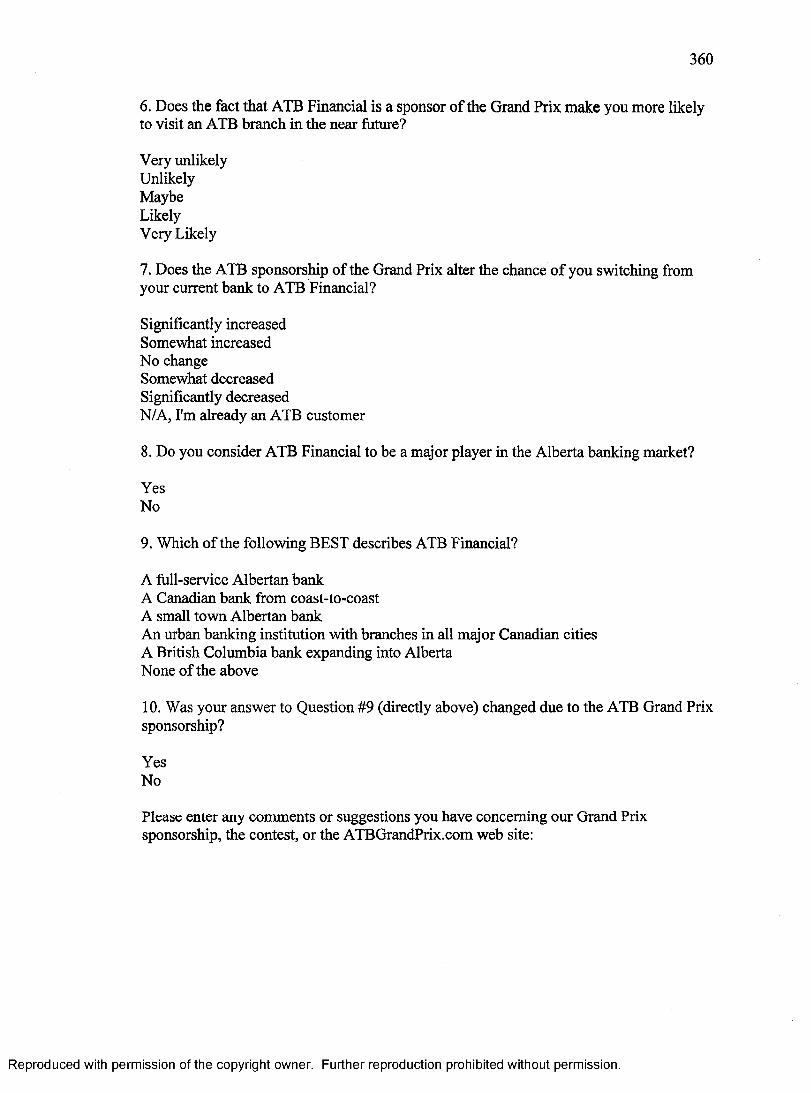
3 6 0
6. Does the fact that ATB Financial is a sponsor of the Grand Prix make you more likely to visit an ATB branch in the near future?
Very unlikely Unlikely Maybe Likely Very Likely
7. Does the ATB sponsorship of the Grand Prix alter the chance of you switching from your current bank to ATB Financial?
Significantly increasedSomewhat increasedNo changeSomewhat decreasedSignificantly decreasedN/A, I'm already an ATB customer
8. Do you consider ATB Financial to be a major player in the Alberta banking market?
YesNo
9. Which of the following BEST describes ATB Financial?
A full-service Albertan bank A Canadian bank from coast-to-coast A small town Albertan bankAn urban banking institution with branches in all major Canadian cities A British Columbia bank expanding into Alberta None of the above
10. Was your answer to Question #9 (directly above) changed due to the ATB Grand Prix sponsorship?
YesNo
Please enter any comments or suggestions you have concerning our Grand Prix sponsorship, the contest, or the ATBGrandPrix.com web site:
Reproduced with permission of the copyright owner. Further reproduction prohibited without permission.
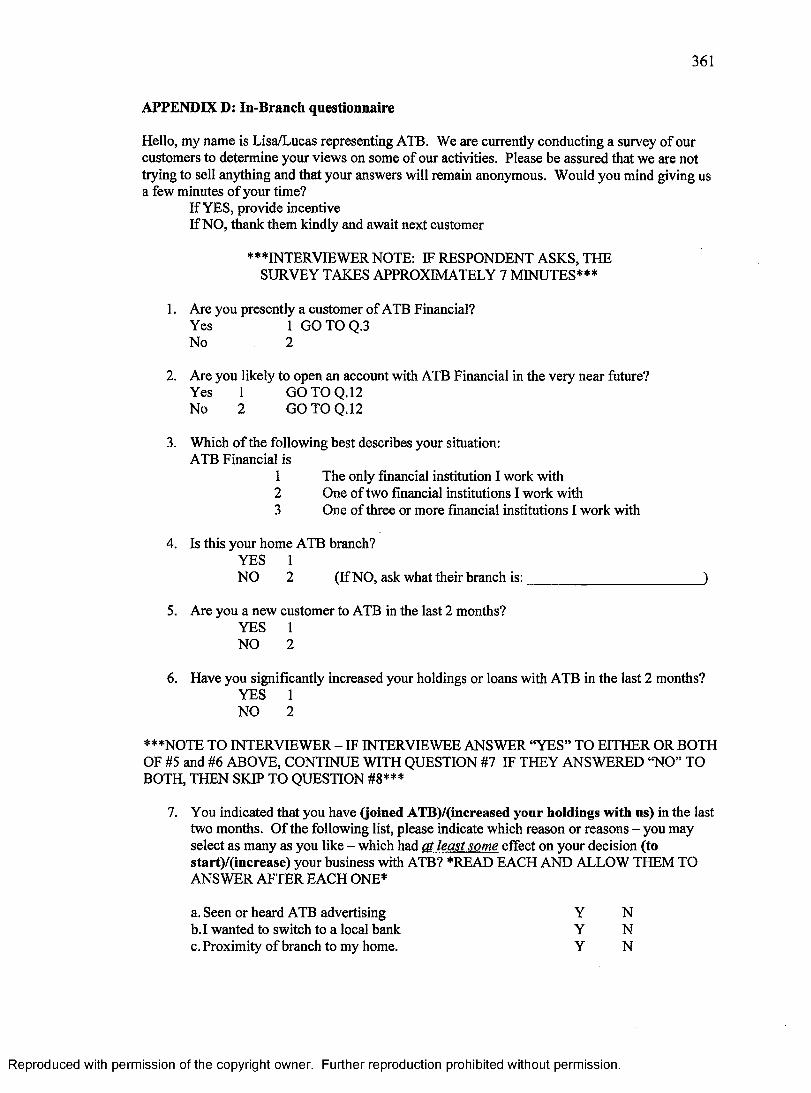
361
APPENDIX D: In-Branch questionnaire
Hello, my name is Lisa/Lucas representing ATB. We are currently conducting a survey of our customers to determine your views on some o f our activities. Please be assured that we are not trying to sell anything and that your answers will remain anonymous. Would you mind giving us a few minutes o f your time?
If YES, provide incentiveIf NO, thank them kindly and await next customer
* * * INTERVIEWER NOTE: IF RESPONDENT ASKS, THE SURVEY TAKES APPROXIMATELY 7 MINUTES***
1. Are you presently a customer o f ATB Financial?Yes 1 GO TO Q.3No 2
2. Are you likely to open an account with ATB Financial in the very near future?Yes 1 GO TO Q.12No 2 GO TO Q.12
3. Which o f the following best describes your situation:ATB Financial is
1 The only financial institution I work with2 One o f two financial institutions I work with3 One o f three or more financial institutions I work with
4. Is this your home ATB branch?YES 1NO 2 (If NO, ask what their branch is :__________________________ )
5. Are you a new customer to ATB in the last 2 months?YES 1NO 2
6. Have you significantly increased your holdings or loans with ATB in the last 2 months?YES 1NO 2
***NOTE TO INTERVIEWER - IF INTERVIEWEE ANSWER “YES” TO EITHER OR BOTH OF #5 and #6 ABOVE, CONTINUE WITH QUESTION #7 IF THEY ANSWERED “NO” TO BOTH, THEN SKIP TO QUESTION #8***
7. You indicated that you have (joined ATB)/(increased your holdings w ith us) in the last two months. O f the following list, please indicate which reason or reasons - you may select as many as you like - which had at least some effect on your decision (to start)/(increase) your business with ATB? *READ EACH AND ALLOW THEM TO ANSWER AFTER EACH ONE*
a. Seen or heard ATB advertising Y Nb.I wanted to switch to a local bank Y Nc. Proximity of branch to my home. Y N
Reproduced with permission of the copyright owner. Further reproduction prohibited without permission.

3 6 2
d.Proximity o f branch to my work. Y Ne.The fact that ATB sponsored the Edmonton Grand Prix Y Nf. The fact that ATB sponsored the Calgary stampede Y Ng.The quality o f products we offer Y Nh.A specific product we offer Y Ni. I have a friend or family member who works at ATB Y Nj. A current sales promotion we are running Y Nk.TB’s customer service standards Y N1. Since I sat in one o f ATB’s hospitality suites at the Edmonton Grand Prix
Y Nm. The ATB Visa Card Y Nn. The ATB Master Card Y N1. Other: Y N2. Other: Y N3. Other: Y N
8. How do you rate the ‘prestige’ o f the ATB brand relative to other financial institutions?
Very High High Average Low Very Low
9. Has your opinion o f the prestige o f the ATB brand improved in the last 2 months?
YES NO (SKIP TO QUESTION 10)
a. If yes, can you identify as many of the following reasons as you like which had at least some affect on your opinion o f the prestige o f the ATB brand improving? *READ EACH AND ALLOW THEM TO ANSWER AFTER EACH ONE*
a. Seen or heard ATB advertising Y Nb. New branches opening Y Nc. Proximity o f branch to my work Y Nd. The fact that ATB sponsored the Edmonton Grand Prix Y Ne. The fact that ATB sponsored the Calgary Stampede Y Nf. The quality o f products we offer Y Ng- A specific product we offer Y Nh. I have a friend or family member who works at ATB Y Ni. A current sales promotion we are running Y Nj- ATB’s customer service standards Y Nk. The ATB Visa Card Y N1. The ATB Master Card Y Nm. Other: Y Nn. Other: Y N0 . Other: Y N
10. Do you view ATB as a major player in the Alberta Financial Services market?
Yes Somewhat No
Reproduced with permission of the copyright owner. Further reproduction prohibited without permission.
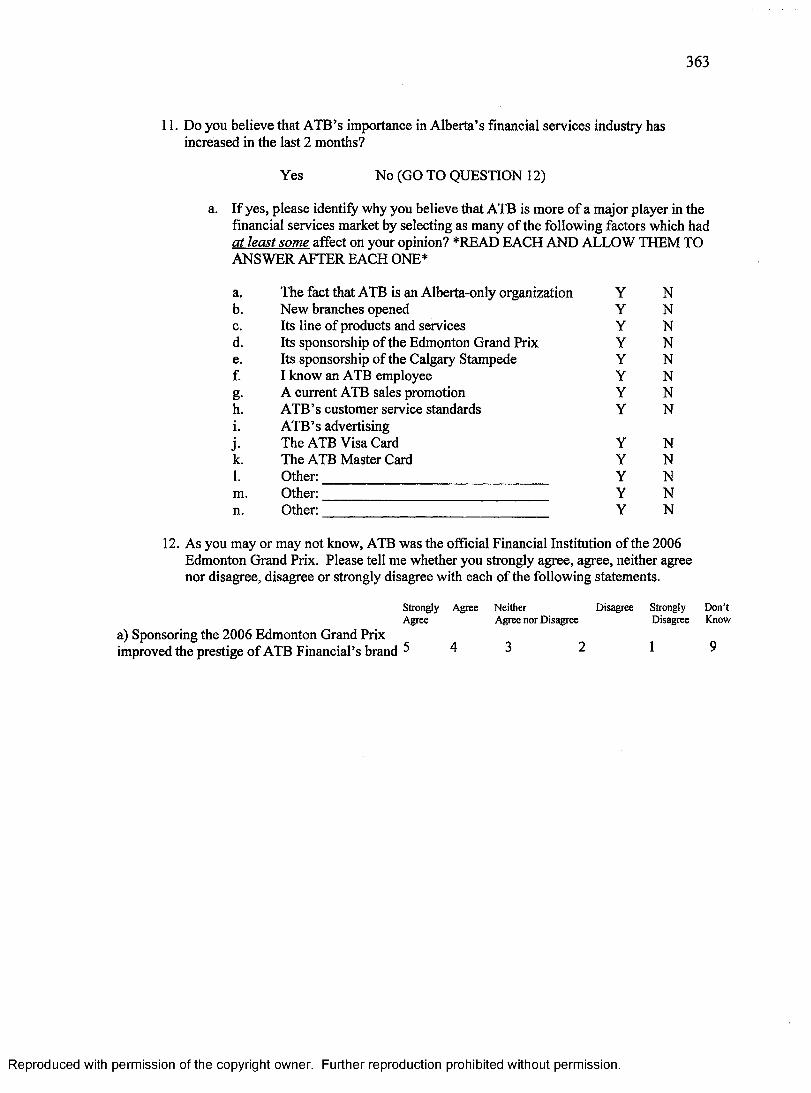
3 6 3
11. Do you believe that ATB’s importance in Alberta’s financial services industry has increased in the last 2 months?
Yes No (GO TO QUESTION 12)
a. If yes, please identify why you believe that ATB is more o f a major player in the financial services market by selecting as many o f the following factors which had at least some affect on your opinion? *READ EACH AND ALLOW THEM TO ANSWER AFTER EACH ONE*
a. The fact that ATB is an Alberta-only organization Y Nb. New branches opened Y Nc. Its line o f products and services Y Nd. Its sponsorship o f the Edmonton Grand Prix Y Ne. Its sponsorship o f the Calgary Stampede Y Nf. I know an ATB employee Y Ng- A current ATB sales promotion Y Nh. ATB’s customer service standards Y Ni. ATB’s advertisingj- The ATB Visa Card Y Nk. The ATB Master Card Y N1. Other: Y Nm. Other: Y Nn. Other: Y N
12. As you may or may not know, ATB was the official Financial Institution of the 2006 Edmonton Grand Prix. Please tell me whether you strongly agree, agree, neither agree nor disagree, disagree or strongly disagree with each o f the following statements.
Strongly Agree Neither Disagree Strongly Don’tAgree Agree nor Disagree Disagree Know
a) Sponsoring the 2006 Edmonton Grand Priximproved the prestige o f ATB Financial’s brand 5 4 3 2 1 9
Reproduced with permission of the copyright owner. Further reproduction prohibited without permission.
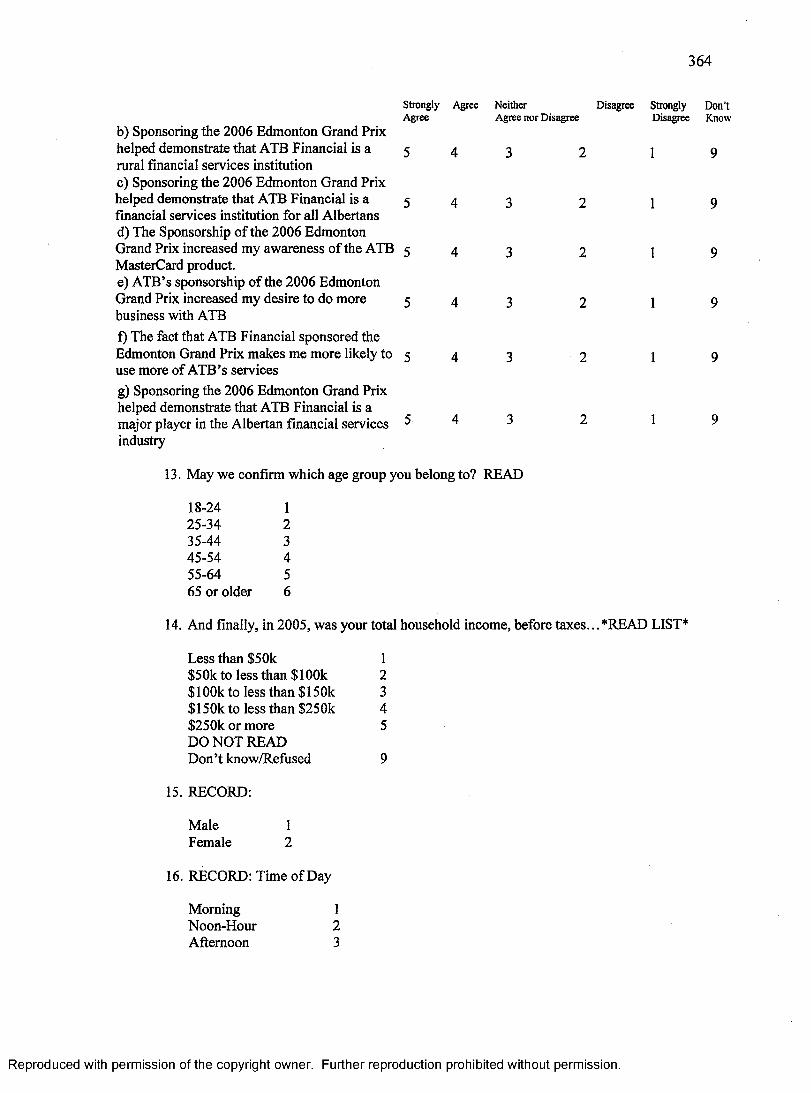
3 6 4
StronglyAgree
Agree
b) Sponsoring the 2006 Edmonton Grand Prix helped demonstrate that ATB Financial is a 5 4 3rural financial services institutionc) Sponsoring the 2006 Edmonton Grand Prixhelped demonstrate that ATB Financial is a 5 4 3financial services institution for all Albertansd) The Sponsorship o f the 2006 EdmontonGrand Prix increased my awareness of the ATB 5 4 3 MasterCard product.e) ATB’s sponsorship o f the 2006 EdmontonGrand Prix increased my desire to do more 5 4 3business with ATBf) The fact that ATB Financial sponsored theEdmonton Grand Prix makes me more likely to 5 4 3use more of ATB’s servicesg) Sponsoring the 2006 Edmonton Grand Prix helped demonstrate that ATB Financial is amajor player in the Albertan financial services 5 4 3industry
13. May we confirm which age group you belong to? READ
NeitherAgree nor Disagree
Disagree StronglyDisagree
Don’tKnow
18-24 25-34 35-44 45-54 55-64 65 or older
123456
14. And finally, in 2005, was your total household income, before taxes... *READ LIST*
Less than $50k 1$50k to less than $100k 2$ 100k to less than $ 15 0k 3$150k to less than $250k 4$250k or more 5DO NOT READDon’t know/Refused 9
15. RECORD:
Male 1Female 2
16. RECORD: Time of Day
Morning 1Noon-Hour 2Afternoon 3
Reproduced with permission of the copyright owner. Further reproduction prohibited without permission.
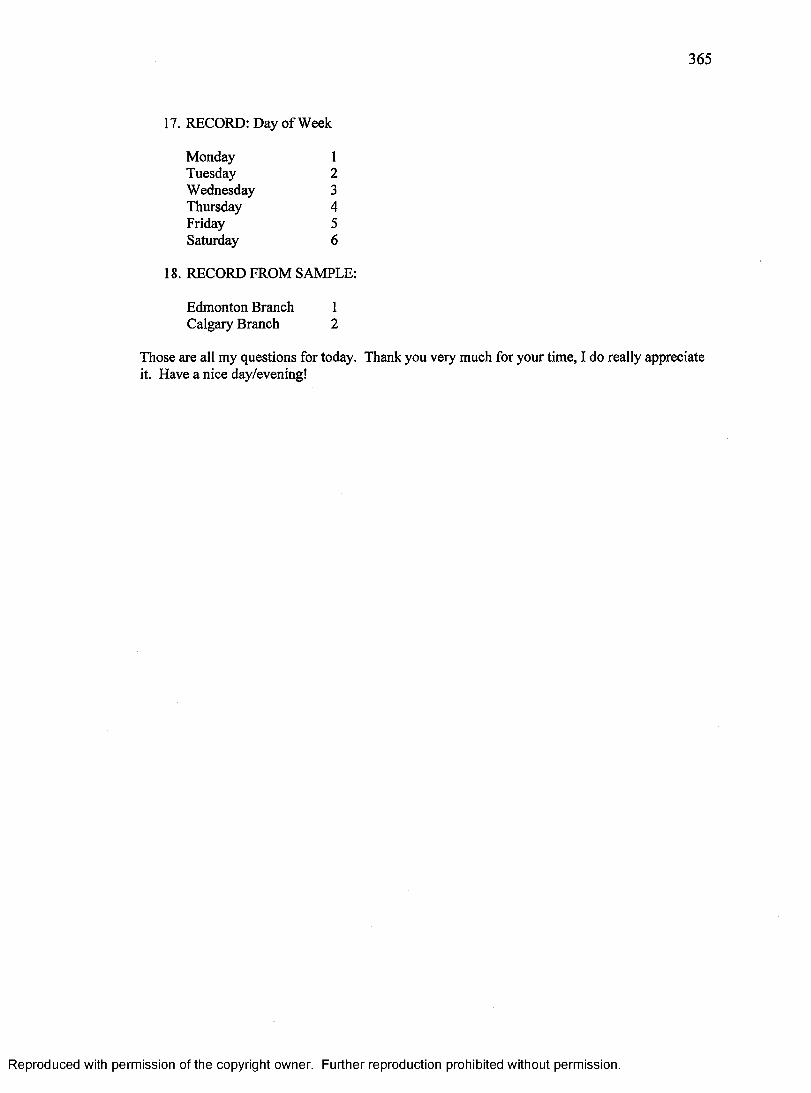
3 6 5
17. RECORD: Day o f Week
Monday 1Tuesday 2Wednesday 3Thursday 4Friday 5Saturday 6
18. RECORD FROM SAMPLE:
Edmonton Branch 1Calgary Branch 2
Those are all my questions for today. Thank you veiy much for your time, I do really appreciate it. Have a nice day/evening!
Reproduced with permission of the copyright owner. Further reproduction prohibited without permission.
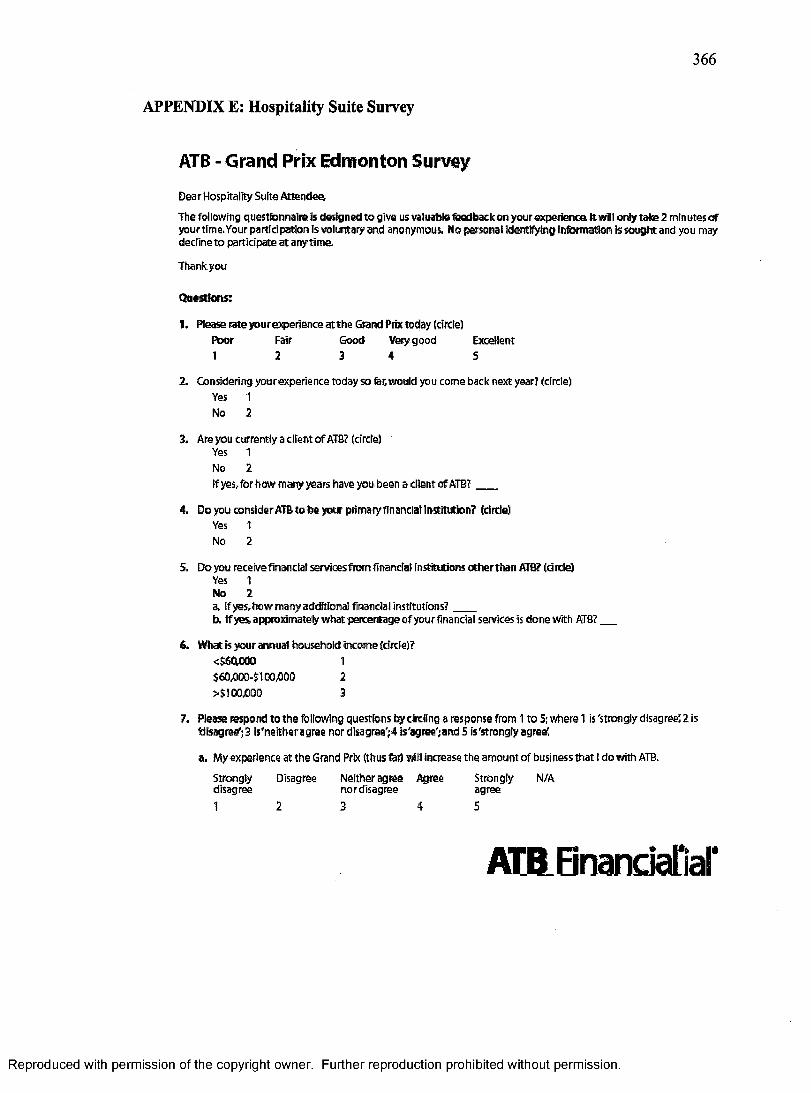
3 6 6
APPENDIX E: Hospitality Suite Survey
ATB - Grand Prix Edmonton Survey
DearHospitality Suite Attendee,
The following questionnaire is designed to give us valuable feedback on your experience It will only take 2 minutes of yourtime.Your participation is voluntary and anonymous. No personal identifying information is sought and you may decline to participate a t anytime.
Thankyou
Questions:
1. Please rate your experience a t the Grand Prix today (circle)Poor Fair Good Very good Excellent
2. Consideri ng your experience today so far, would you come back next year? (circle)Yes 1 No 2
3. Are you currently a client o f ATS? (circle)Yes 1 No 2If yes, for how many years have you been a client of ATB?____
4. Do you consider ATS to be your primaryfinancial institution? (circle)
5. Do you receive financial servicesfrom financial institutions otherthan ATS? (circle)Yes 1 No 2a. If yes, how many additional financial institutions?____b. If yes, approximately what percentage of your financial services is done with ATB?___
6. What is your annual household income (circle)?<$60,000 1$60jOGO-$TQOOGO 2>$100)000 3
7. Please respond to th e following questions by circling a response from 1 to 5; where 1 is 'strongly disagree! 2 Is tiisagre^;3 is'neither agree nor disagree';4 is'agree';and5 is'strongly agree!
a. My experience at the Grand Prix (thus far) will increase the amount of business that I do with ATB.
Strongly Disagree Neither agree Agree Strongly N/A disagree nor disagree agree
2 3 4 5
Yes 1 No 2
2 3 4 5
ATB Financial’
Reproduced with permission of the copyright owner. Further reproduction prohibited without permission.
3 6 7
b. My experience a t the Grand Prix (thus far) has improved my overall opinion of ATS as an organization.
Strongly Disagree Neither agree Agree Strongly N/Adisagree nor disagree agree1 2 3 4 5
c. My experience at the Grand Prix (thus far) will encourage me to tell others positive information about ATB.
Strongly Disagree Neither agree Agree Strongly N/Adisagree nor disagree agree1 2 3 4 5
d . AT&'s sponsorship of the Edmonton Grand Prix has positively impacted my opinion of ATB as a financial institution.
Strongly Disagree Neither agree Agree Strongly N/Adisagree nor disagree agree1 2 3 4 5
e. ATBis sponsorship of the Edmonton Grand Prix has positively impacted my desire to deaf with ATB.
Strongly Disagree Neither agree Agree Strongly N/Adisagree nor disagree agree1 2 3 4 5
Thank you. Your feedback is greatly appreciated.
ATB RnanciaTi W « t f t 8 ^ i . M w i h i w l w M s » h g i < 8 'k t . l i i i i J i w d t a K f e w f c B f A l b v f e T i s a M y E n r t f t w i .
Reproduced with permission of the copyright owner. Further reproduction prohibited without permission.

APPENDIX F: Hospitality Hostess/Host Interview Template
Date: X X X Form: Telephone Time: X X m inutes
1. P lease state your position and w ork experience fo r the record?
2. H ow m any sponsorships have you w orked on in your life, including as a volunteer?
3. W hat is your w orking definition o f sponsorship?
4. W hat is your ro le in the A TB -Edm onton G rand Prix sponsorship?
5. C an you describe the crow d dem ographically?
6. W ould you consider the hospitality suite to be a success?
7. D o you consider the hospitality suite to be a success for A T B ?
8. A t the hospitality W as the ATB logo easily view able and w ell presented?
9. W hat else did you do?
10. H ow did they respond?
11. A nything else?
Reproduced with permission of the copyright owner. Further reproduction prohibited without permission.
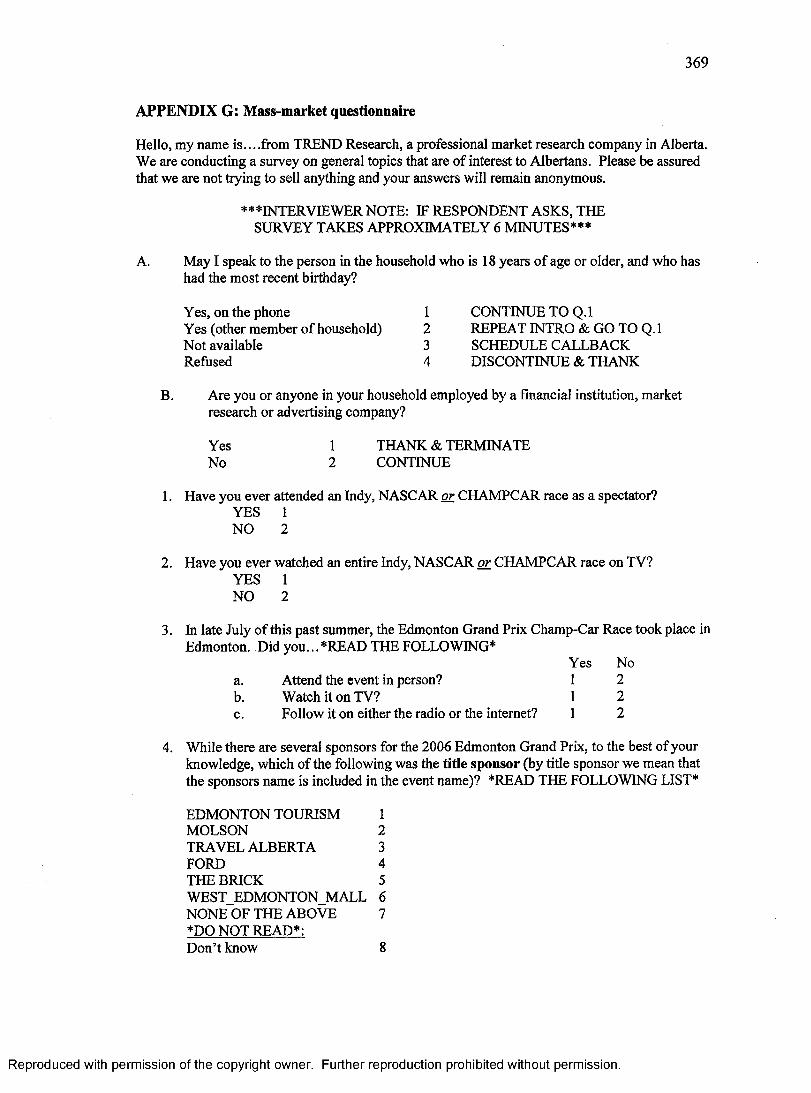
3 6 9
APPENDIX G: Mass-market questionnaire
Hello, my name is ... .from TREND Research, a professional market research company in Alberta. We are conducting a survey on general topics that are o f interest to Albertans. Please be assured that we are not trying to sell anything and your answers will remain anonymous.
* * * INTERVIEWER NOTE: IF RESPONDENT ASKS, THE SURVEY TAKES APPROXIMATELY 6 MINUTES***
A. May I speak to the person in the household who is 18 years o f age or older, and who has had the most recent birthday?
Yes, on the phone 1Yes (other member o f household) 2Not available 3Refused 4
CONTINUE TO Q.l REPEAT INTRO & GO TO Q. 1 SCHEDULE CALLBACK DISCONTINUE & THANK
B. Are you or anyone in your household employed by a financial institution, market research or advertising company?
Yes 1 THANK & TERMINATENo 2 CONTINUE
1. Have you ever attended an Indy, NASCAR or CHAMPCAR race as a spectator?YES 1 NO 2
2. Have you ever watched an entire Indy, NASCAR or CHAMPCAR race on TV?YES 1 NO 2
In late July o f this past summer, the Edmonton Grand Prix Champ-Car Race took place in Edmonton. Did you...*READ THE FOLLOWING*
Yes Noa. Attend the event in person? 1 2b. Watch it on TV? 1 2c. Follow it on either the radio or the internet? 1 2
4. While there are several sponsors for the 2006 Edmonton Grand Prix, to the best o f your knowledge, which o f the following was the title sponsor (by title sponsor we mean that the sponsors name is included in the event name)? *READ THE FOLLOWING LIST*
EDMONTON TOURISM 1MOLSON 2TRAVEL ALBERTA 3FORD 4THE BRICK 5WEST_EDMONTON_MALL 6 NONE OF THE ABOVE 7*DO NOT READ*:Don’t know 8
Reproduced with permission of the copyright owner. Further reproduction prohibited without permission.
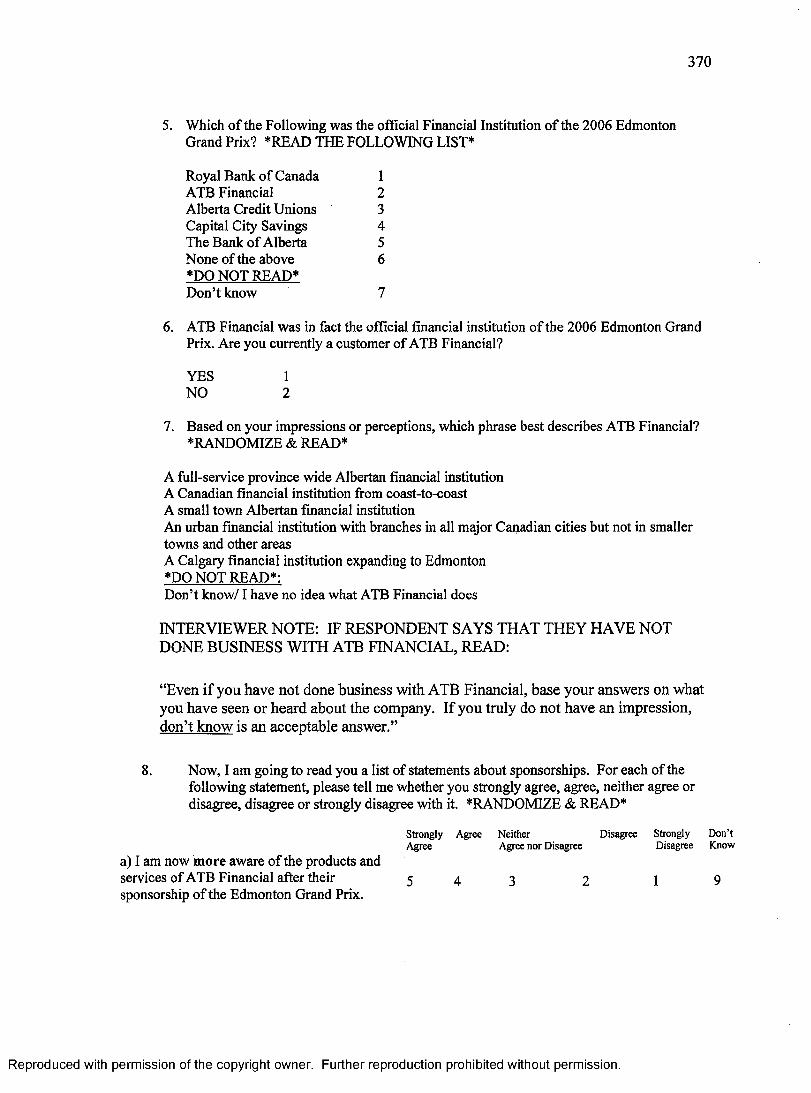
3 7 0
5. Which o f the Following was the official Financial Institution o f the 2006 Edmonton Grand Prix? *READ THE FOLLOWING LIST*
Royal Bank o f Canada 1ATB Financial 2Alberta Credit Unions 3Capital City Savings 4The Bank o f Alberta 5None o f the above 6*DO NOT READ*Don’t know 7
6. ATB Financial was in fact the official financial institution o f the 2006 Edmonton Grand Prix. Are you currently a customer o f ATB Financial?
YES 1NO 2
7. Based on your impressions or perceptions, which phrase best describes ATB Financial? ♦RANDOMIZE & READ*
A full-service province wide Albertan financial institution A Canadian financial institution from coast-to-coast A small town Albertan financial institutionAn urban financial institution with branches in all major Canadian cities but not in smaller towns and other areasA Calgary financial institution expanding to Edmonton *DO NOT READ*;Don’t know/1 have no idea what ATB Financial does
INTERVIEWER NOTE: IF RESPONDENT SAYS THAT THEY HAVE NOT DONE BUSINESS WITH ATB FINANCIAL, READ:
“Even if you have not done business with ATB Financial, base your answers on what you have seen or heard about the company. If you truly do not have an impression, don’t know is an acceptable answer.”
Now, I am going to read you a list of statements about sponsorships. For each o f the following statement, please tell me whether you strongly agree, agree, neither agree or disagree, disagree or strongly disagree with it. *RANDOMIZE & READ*
a) I am now m ore aware o f the products and services o f ATB Financial after their sponsorship o f the Edmonton Grand Prix.
Strongly Agree Neither Disagree StronglyAgree Agree nor Disagree Disagree
Don’tKnow
9
Reproduced with permission of the copyright owner. Further reproduction prohibited without permission.
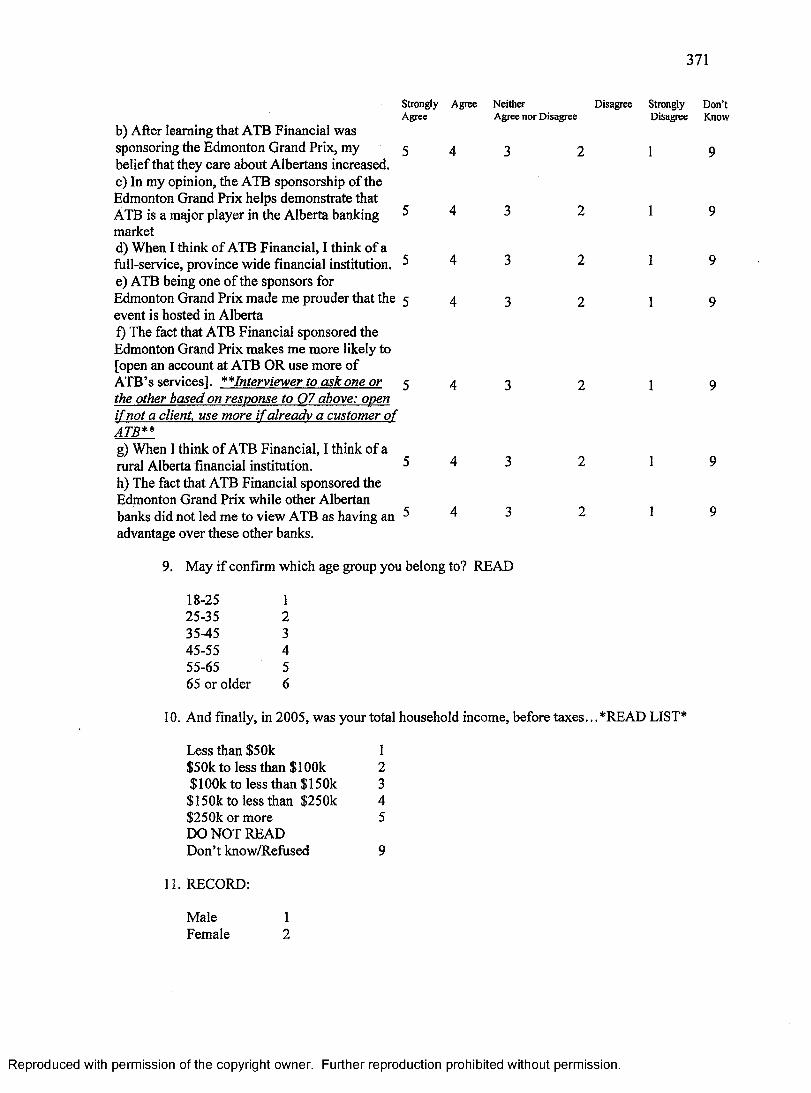
371
b) After learning that ATB Financial was sponsoring the Edmonton Grand Prix, my belief that they care about Albertans increased.c) In my opinion, the ATB sponsorship of the Edmonton Grand Prix helps demonstrate that ATB is a major player in the Alberta banking marketd) When I think o f ATB Financial, I think o f a fiill-service, province wide financial institution.e) ATB being one o f the sponsors for Edmonton Grand Prix made me prouder that the event is hosted in Albertaf) The fact that ATB Financial sponsored the Edmonton Grand Prix makes me more likely to [open an account at ATB OR use more o f ATB’s services]. **Interviewer to ask one or the other based on response to 07 above: open if not a client, use more if already a customer of ATB**g) When I think o f ATB Financial, I think of a rural Alberta financial institution.h) The fact that ATB Financial sponsored the Edmonton Grand Prix while other Albertan banks did not led me to view ATB as having an advantage over these other banks.
9. May if confirm which age group you belong to? READ
18-25 125-35 235-45 345-55 455-65 565 or older 6
10. And finally, in 2005, was your total household income, before taxes... *READ LIST*
Less than $5 Ok 1$50k to less than $100k 2$ 100k to less than $ 150k 3$150k to less than $250k 4$250k or more 5DO NOT READDon’t know/Refused 9
11. RECORD:
Male 1Female 2
Strongly Agree Neither Disagree Strongly Don’tAgree Agree nor Disagree Disagree Know
5 4
5 4
5 4
Reproduced with permission of the copyright owner. Further reproduction prohibited without permission.
372
12. RECORD FROM SAMPLE:
Metro Edmonton 1Metro Calgary 2Other cities 3Other towns/rural areas 4
Those are all my questions for today. Thank you very much for your time, I do really appreciate it, Have a nice day/evening!
Reproduced with permission of the copyright owner. Further reproduction prohibited without permission.
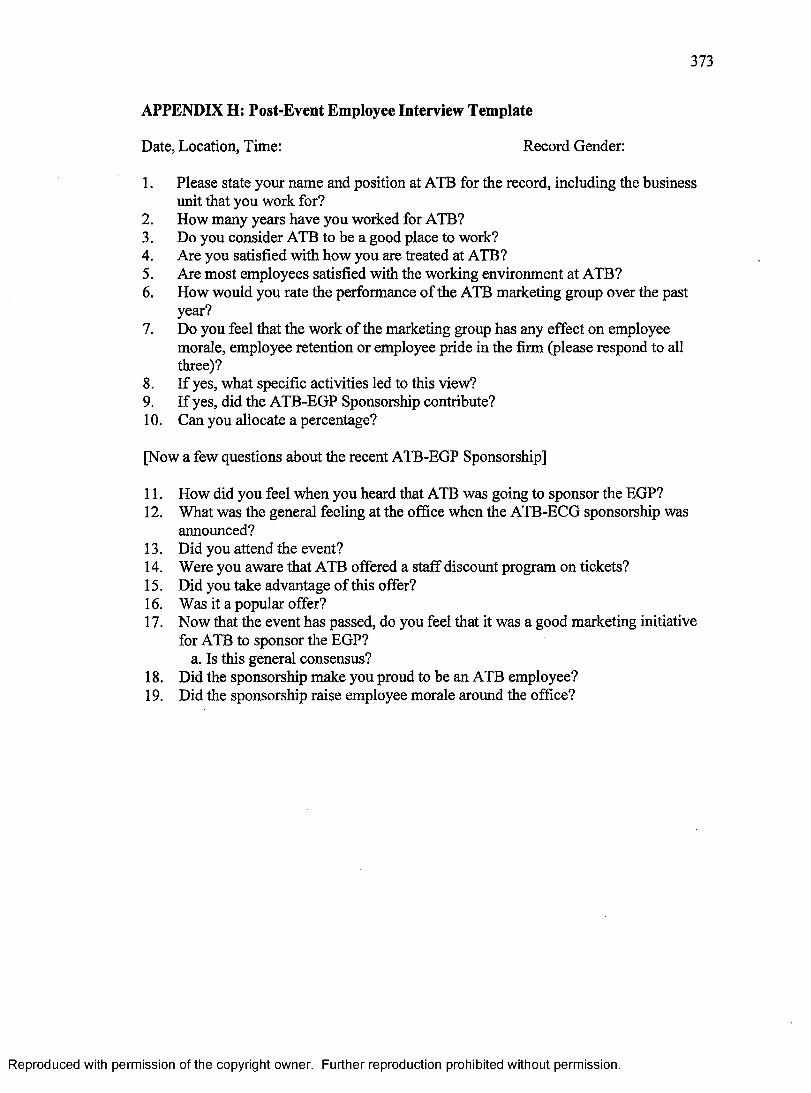
373
APPENDIX H: Post-Event Employee Interview Template
Date, Location, Tim e: R ecord Gender:
1. P lease state your nam e and position at ATB for the record, including the business unit that you w ork for?
2. H ow m any years have you w orked for A TB?3. Do you consider A TB to be a good place to w ork?4. A re you satisfied w ith how you are treated at A TB ?5. A re m ost em ployees satisfied w ith the w orking environm ent at A T B ?6. H ow w ould you rate the perform ance o f the ATB m arketing group over the past
year?7. D o you feel tha t the w ork o f the m arketing group has any effect on em ployee
m orale, em ployee reten tion or em ployee pride in the firm (please respond to all three)?
8. I f yes, w hat specific activities led to this view ?9. I f yes, did the A T B -EG P Sponsorship contribute?10. C an you allocate a percentage?
[Now a few questions about the recent A TB-EG P Sponsorship]
11. H ow did you feel w hen you heard that ATB w as going to sponsor the EG P?12. W hat w as the general feeling at the office w hen the A T B -E C G sponsorship was
announced?13. D id you attend the event?14. W ere you aw are that A TB offered a s ta ff d iscount program on tickets?15. D id you take advantage o f th is offer?16. W as it a popu lar offer?17. N ow that the event has passed, do you feel that it w as a good m arketing initiative
for A T B to sponsor the EG P?a. Is th is general consensus?
18. D id the sponsorship m ake you proud to be an A T B em ployee?19. D id the sponsorship raise em ployee m orale around the office?
Reproduced with permission of the copyright owner. Further reproduction prohibited without permission.
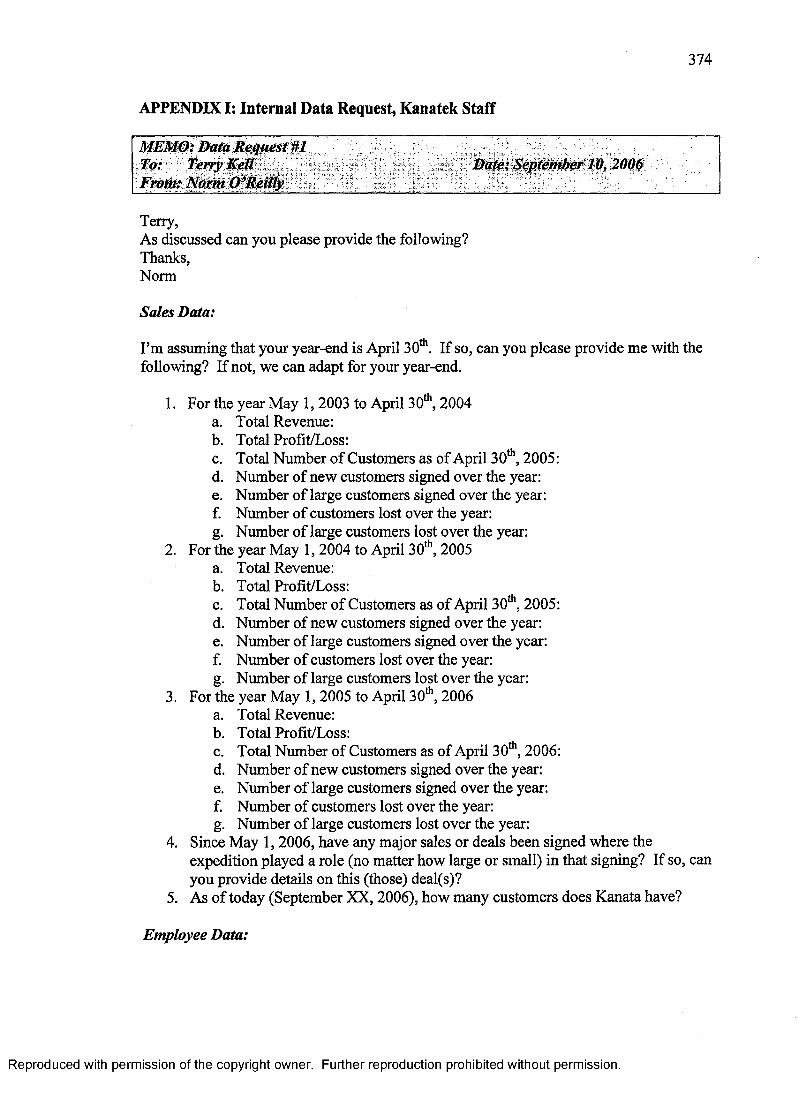
3 7 4
APPENDIX I: Internal Data Request, Kanatek Staff
MEMO: Data Request #1 To: Terry Kell Date: September 10,2006From: Norm O’Reilly
Terry,As discussed can you p lease provide the follow ing?Thanks,Norm
Sales Data:
I ’m assum ing that your year-end is A pril 30th. I f so, can you p lease provide m e w ith the following? I f not, w e can adapt for your year-end.
1. For the year M ay 1 ,2003 to A pril 30th, 2004a. Total Revenue:b. Total Profit/Loss:c. Total N um ber o f Custom ers as o f A pril 30th, 2005:d. N um ber o f new custom ers signed over the year:e. N um ber o f large custom ers signed over the year:f. N um ber o f custom ers lost over the year:g- N um ber o f large custom ers lost over the year:
2. For the year M ay 1, 2004 to A pril 30 ,2 0 0 5a. Total Revenue:b. Total Profit/Loss:c. T otal N um ber o f Custom ers as o f A pril 30th, 2005:d. N um ber o f new custom ers signed over the year:e. N um ber o f large custom ers signed over the year:f. N um ber o f custom ers lost over the year:
g- N um ber o f large custom ers lost over the year:3. For the year M ay 1 ,2005 to A pril 30 ,2 0 0 6
a. Total Revenue:b. Total Profit/Loss:c. Total N um ber o f Custom ers as o f A pril 30th, 2006:d. N um ber o f new custom ers signed over the year:e. N um ber o f large custom ers signed over the year:f. N um ber o f custom ers lost over the year:g- N um ber o f large custom ers lost over the year:
4. Since M ay 1 ,2 0 0 6 , have any m ajor sales or deals been signed w here theexpedition played a role (no m atter how large o r sm all) in that signing? I f so, can you provide details on this (those) deal(s)?
5. A s o f today (Septem ber XX , 2006), how m any custom ers does K anata have?
Employee Data:
Reproduced with permission of the copyright owner. Further reproduction prohibited without permission.
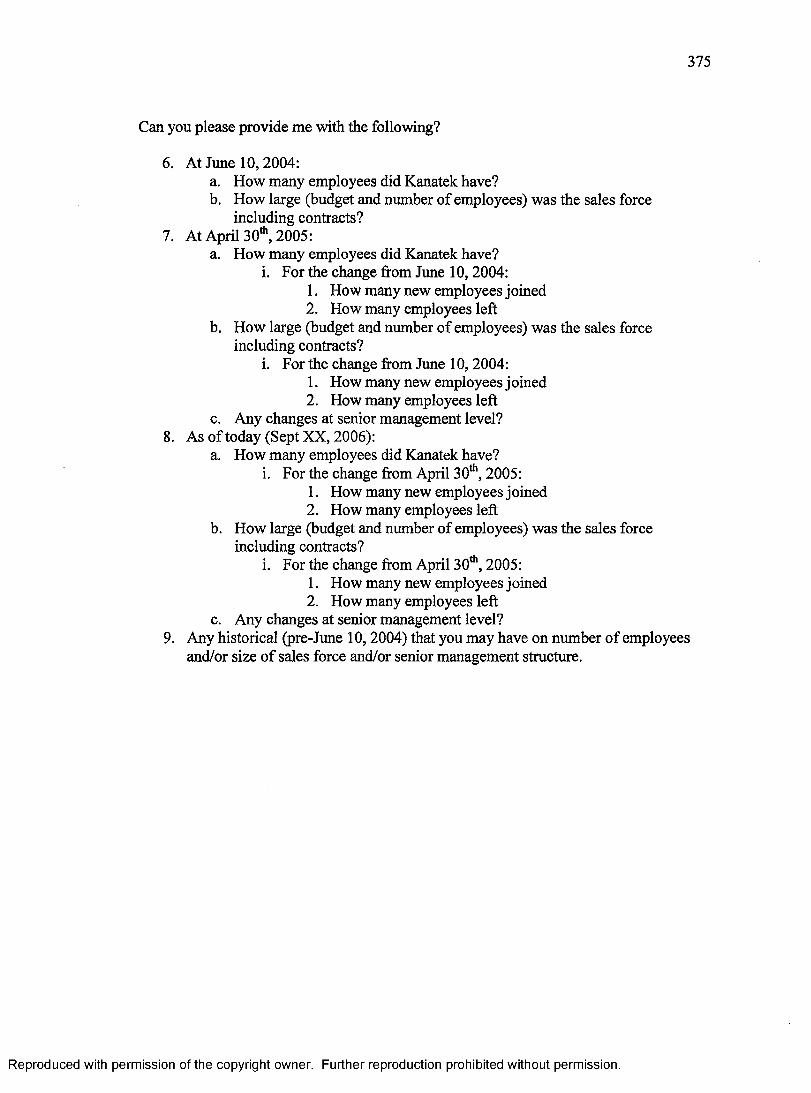
3 7 5
Can you please provide me with the following?
6. At June 10, 2004:a. How many employees did Kanatek have?b. How large (budget and number of employees) was the sales force
including contracts?7. At April 30th, 2005:
a. How many employees did Kanatek have?i. For the change from June 10, 2004:
1. How many new employees j oined2. How many employees left
b. How large (budget and number of employees) was the sales force including contracts?
i. For the change from June 10, 2004:1. How many new employees j oined2. How many employees left
c. Any changes at senior management level?8. As of today (Sept XX, 2006):
a. How many employees did Kanatek have?i. For the change from April 30th, 2005:
1. How many new employees j oined2. How many employees left
b. How large (budget and number of employees) was the sales force including contracts?
i. For the change from April 30th, 2005:1. How many new employees j oined2. How many employees left
c. Any changes at senior management level?9. Any historical (pre-June 10,2004) that you may have on number of employees
and/or size of sales force and/or senior management structure.
Reproduced with permission of the copyright owner. Further reproduction prohibited without permission.
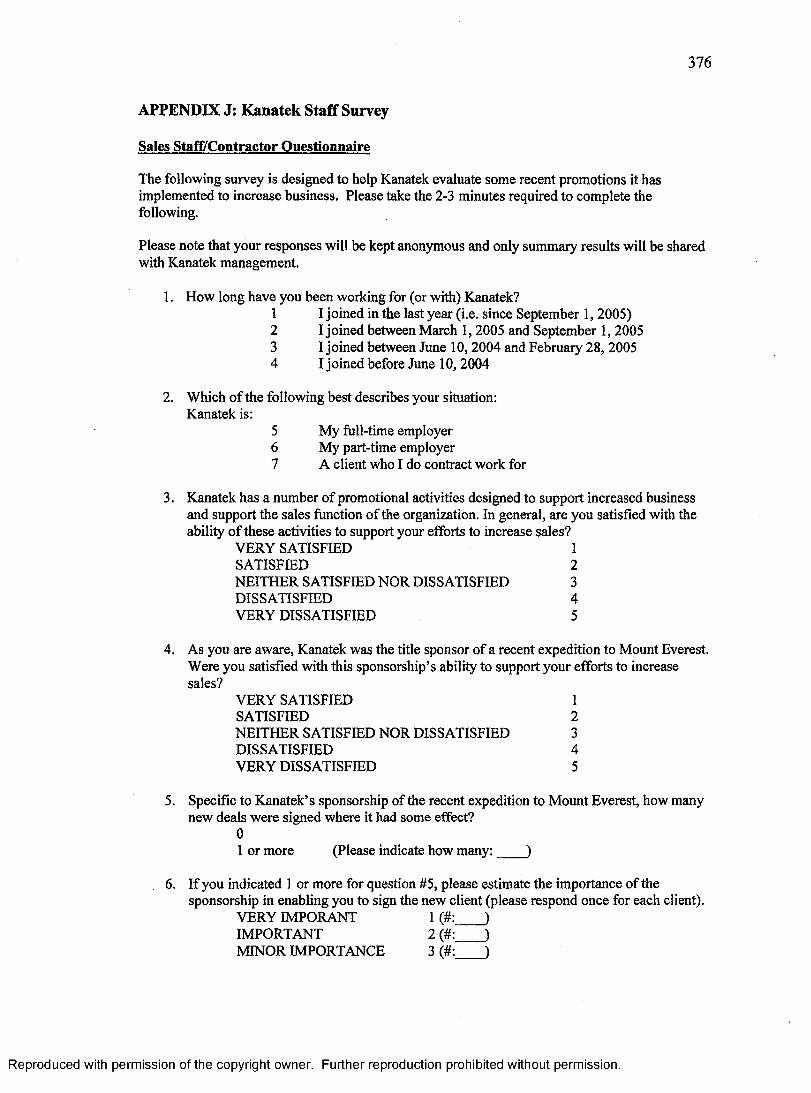
3 7 6
APPENDIX J: Kanatek Staff Survey
Sales Staff/Contractor Questionnaire
The following survey is designed to help Kanatek evaluate some recent promotions it has implemented to increase business. Please take the 2-3 minutes required to complete the following.
Please note that your responses will be kept anonymous and only summary results will be shared with Kanatek management.
1. How long have you been working for (or with) Kanatek?1 I joined in the last year (i.e. since September 1, 2005)2 I joined between March 1,2005 and September 1, 20053 I joined between June 10,2004 and February 28, 20054 I joined before June 10, 2004
2. Which o f the following best describes your situation:Kanatek is:
5 My full-time employer6 My part-time employer7 A client who I do contract work for
3. Kanatek has a number o f promotional activities designed to support increased business and support the sales function o f the organization. In general, are you satisfied with the ability o f these activities to support your efforts to increase sales?
VERY SATISFIED 1SATISFIED 2NEITHER SATISFIED NOR DISSATISFIED 3DISSATISFIED 4VERY DISSATISFIED 5
4. As you are aware, Kanatek was the title sponsor o f a recent expedition to Mount Everest. Were you satisfied with this sponsorship’s ability to support your efforts to increase sales?
VERY SATISFIED 1SATISFIED 2NEITHER SATISFIED NOR DISSATISFIED 3DISSATISFIED 4VERY DISSATISFIED 5
5. Specific to Kanatek’s sponsorship of the recent expedition to Mount Everest, how many new deals were signed where it had some effect?
01 or more (Please indicate how m any:____ )
6. If you indicated 1 or more for question #5, please estimate the importance o f the sponsorship in enabling you to sign the new client (please respond once for each client).
VERY IMPORANT 1 (#:____ )IMPORTANT 2 (#:____)MINOR IMPORTANCE 3 (#:____)
Reproduced with permission of the copyright owner. Further reproduction prohibited without permission.
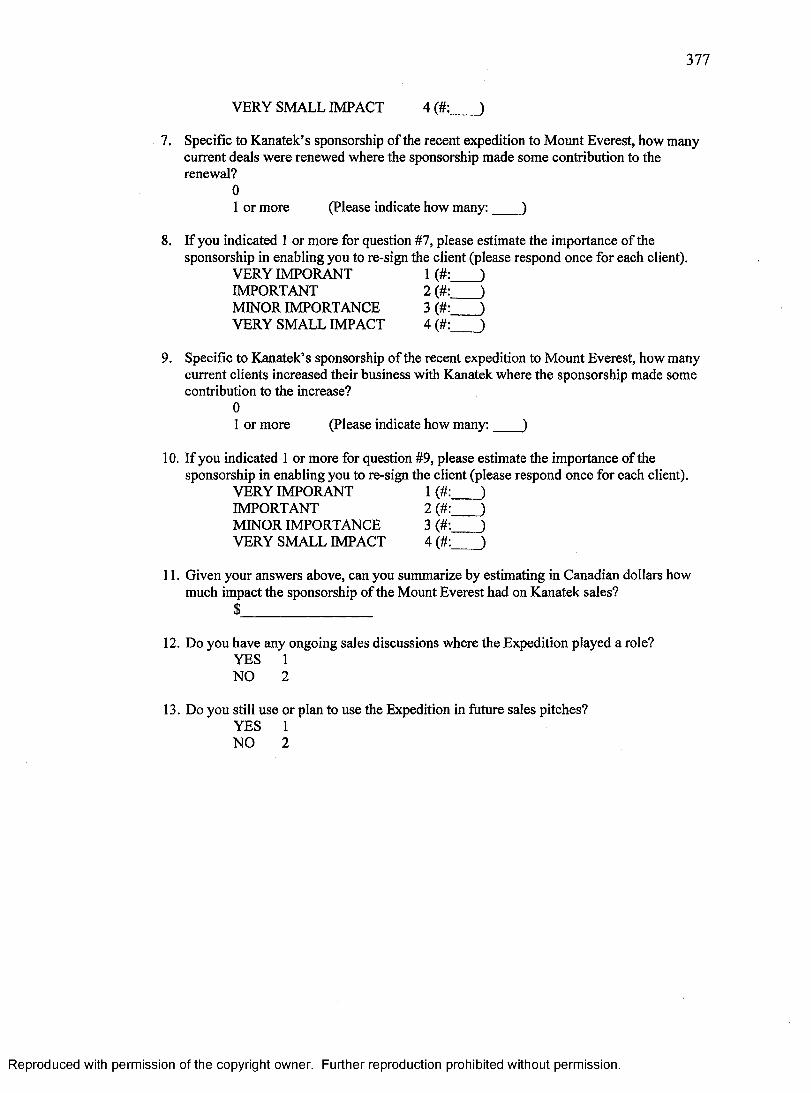
3 7 7
VERY SMALL IMPACT 4 (#:____ )
7. Specific to Kanatek’s sponsorship o f the recent expedition to Mount Everest, how many current deals were renewed where the sponsorship made some contribution to the renewal?
01 or more (Please indicate how m any:____ )
8. If you indicated 1 or more for question #7, please estimate the importance of the sponsorship in enabling you to re-sign the client (please respond once for each client).
VERY IMPORANT 1 (#IMPORTANT 2 (#MINOR IMPORTANCE 3 (#VERY SMALL IMPACT 4 (# J
9. Specific to Kanatek’s sponsorship o f the recent expedition to Mount Everest, how many current clients increased their business with Kanatek where the sponsorship made some contribution to the increase?
0I or more (Please indicate how m any:____ )
10. If you indicated 1 or more for question #9, please estimate the importance of the sponsorship in enabling you to re-sign the client (please respond once for each client).
VERY IMPORANT 1 (#IMPORTANT 2 (#MINOR IMPORTANCE 3 (#VERY SMALL IMPACT 4 (# J
11. Given your answers above, can you summarize by estimating in Canadian dollars how much impact the sponsorship o f the Mount Everest had on Kanatek sales?
$___________________
12. Do you have any ongoing sales discussions where the Expedition played a role?YES 1 NO 2
13. Do you still use or plan to use the Expedition in future sales pitches?YES 1 NO 2
Reproduced with permission of the copyright owner. Further reproduction prohibited without permission.
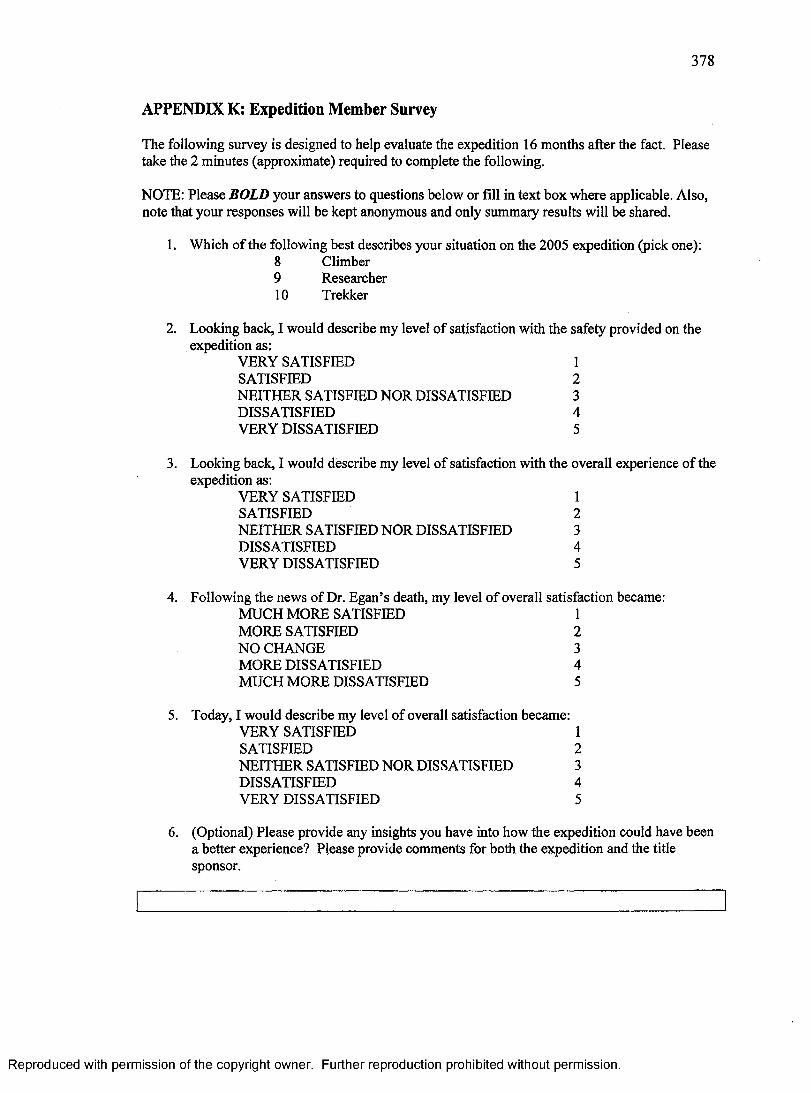
3 7 8
APPENDIX K: Expedition Member Survey
The following survey is designed to help evaluate the expedition 16 months after the fact. Please take the 2 minutes (approximate) required to complete the following.
NOTE: Please BOLD your answers to questions below or fill in text box where applicable. Also, note that your responses will be kept anonymous and only summary results will be shared.
1. Which o f the following best describes your situation on the 2005 expedition (pick one):8 Climber9 Researcher10 Trekker
2. Looking back, I would describe my level o f satisfaction with the safety provided on theexpedition as:
VERY SATISFIED 1SATISFIED 2NEITHER SATISFIED NOR DISSATISFIED 3DISSATISFIED 4VERY DISSATISFIED 5
3. Looking back, I would describe my level o f satisfaction with the overall experience o f the expedition as:
VERY SATISFIED 1SATISFIED 2NEITHER SATISFIED NOR DISSATISFIED 3DISSATISFIED 4VERY DISSATISFIED 5
4. Following the news o f Dr. Egan’s death, my level o f overall satisfaction became:MUCH MORE SATISFIED 1MORE SATISFIED 2NO CHANGE 3MORE DISSATISFIED 4MUCH MORE DISSATISFIED 5
5. Today, I would describe my level o f overall satisfaction became:VERY SATISFIED 1SATISFIED 2NEITHER SATISFIED NOR DISSATISFIED 3DISSATISFIED 4VERY DISSATISFIED 5
6. (Optional) Please provide any insights you have into how the expedition could have been a better experience? Please provide comments for both the expedition and the title sponsor.
Reproduced with permission of the copyright owner. Further reproduction prohibited without permission.
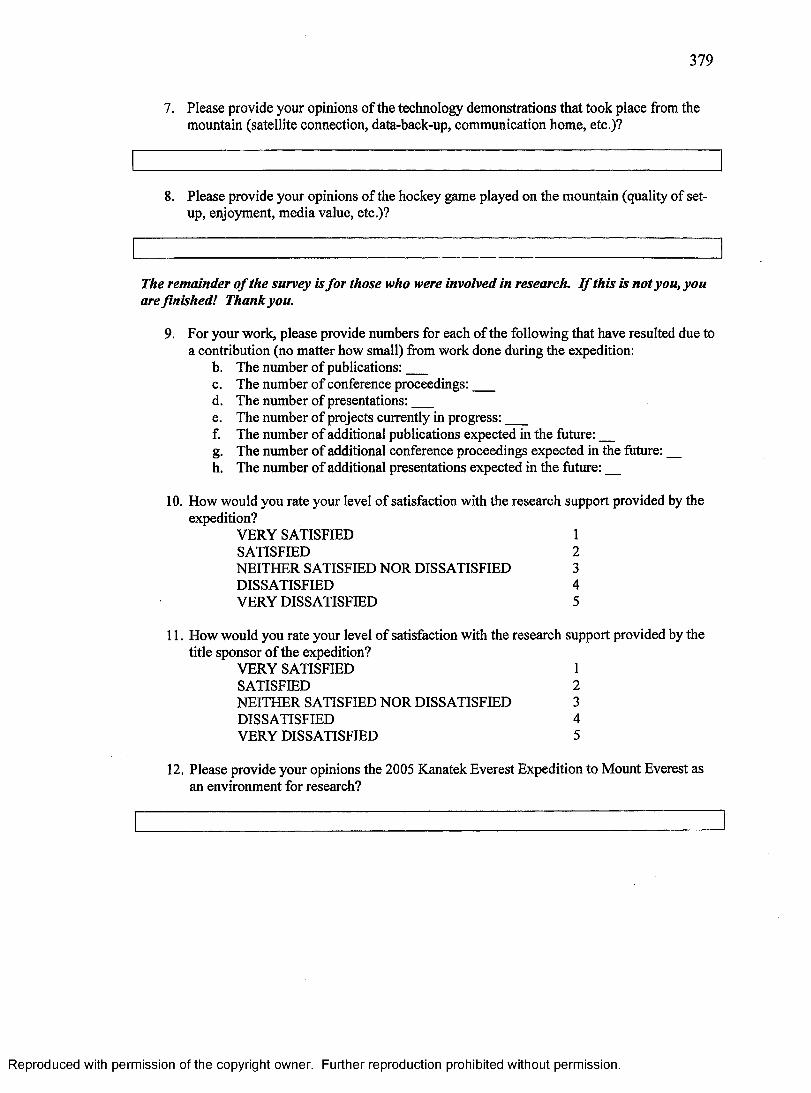
3 7 9
7. Please provide your opinions o f the technology demonstrations that took place from the mountain (satellite connection, data-back-up, communication home, etc.)?
8. Please provide your opinions o f the hockey game played on the mountain (quality of setup, enjoyment, media value, etc.)?
The remainder of the survey is for those who were involved in research. I f this is not you, you are finished! Thank you.
9. For your work, please provide numbers for each o f the following that have resulted due to a contribution (no matter how small) from work done during the expedition:
b. The number o f publications:___c. The number o f conference proceedings:___d. The number o f presentations:___e. The number o f projects currently in progress:___f. The number o f additional publications expected in the future:__g. The number o f additional conference proceedings expected in the future:__h. The number o f additional presentations expected in the future:__
10. How would you rate your level o f satisfaction with the research support provided by the expedition?
VERY SATISFIED 1SATISFIED 2NEITHER SATISFIED NOR DISSATISFIED 3DISSATISFIED 4VERY DISSATISFIED 5
11. How would you rate your level o f satisfaction with the research support provided by the title sponsor o f the expedition?
VERY SATISFIED 1SATISFIED 2NEITHER SATISFIED NOR DISSATISFIED 3DISSATISFIED 4VERY DISSATISFIED 5
12. Please provide your opinions the 2005 Kanatek Everest Expedition to Mount Everest as an environment for research?
Reproduced with permission of the copyright owner. Further reproduction prohibited without permission.
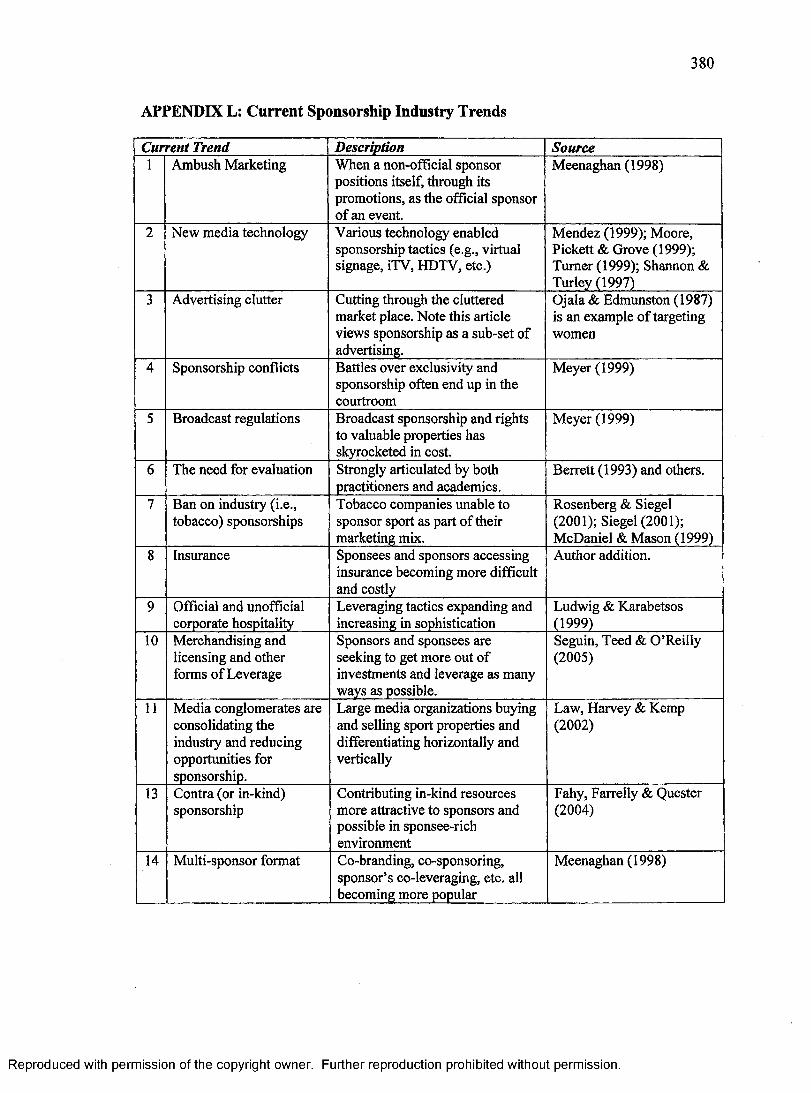
3 8 0
APPENDIX L: Current Sponsorship Industry Trends
Current Trend Description Source1 Ambush Marketing When a non-official sponsor
positions itself, through its promotions, as the official sponsor of an event.
Meenaghan (1998)
2 New media technology Various technology enabled sponsorship tactics (e.g., virtual signage, iTV, HDTV, etc.)
Mendez (1999); Moore, Pickett & Grove (1999); Turner (1999); Shannon & Turley (1997)
3 Advertising clutter Cutting through the cluttered market place. Note this article views sponsorship as a sub-set of advertising.
Ojala & Edmunston (1987) is an example o f targeting women
4 Sponsorship conflicts Battles over exclusivity and sponsorship often end up in the courtroom
Meyer (1999)
5 Broadcast regulations Broadcast sponsorship and rights to valuable properties has skyrocketed in cost.
Meyer (1999)
6 The need for evaluation Strongly articulated by both practitioners and academics.
Berrett (1993) and others.
7 Ban on industry (i.e., tobacco) sponsorships
Tobacco companies unable to sponsor sport as part o f their marketing mix.
Rosenberg & Siegel (2001); Siegel (2001); McDaniel & Mason (1999)
8 Insurance Sponsees and sponsors accessing insurance becoming more difficult and costly
Author addition.
9 Official and unofficial corporate hospitality
Leveraging tactics expanding and increasing in sophistication
Ludwig & Karabetsos (1999)
10 Merchandising and licensing and other forms o f Leverage
Sponsors and sponsees are seeking to get more out of investments and leverage as many ways as possible.
Seguin, Teed & O ’Reilly (2005)
11 Media conglomerates are consolidating the industry and reducing opportunities for sponsorship.
Large media organizations buying and selling sport properties and differentiating horizontally and vertically
Law, Harvey & Kemp (2002)
13 Contra (or in-kind) sponsorship
Contributing in-kind resources more attractive to sponsors and possible in sponsee-rich environment
Fahy, Farrelly & Quester (2004)
14 Multi-sponsor format Co-branding, co-sponsoring, sponsor’s co-leveraging, etc. all becoming more popular
Meenaghan (1998)
Reproduced with permission of the copyright owner. Further reproduction prohibited without permission.

38 1
APPENDIX M: Int_2 Description Of Own Evaluation Model
So, the way we start is that we start with assessing all the sponsor benefits, we take a look at the reach of each one of those benefits - eyeballs, audience exposure, audience reach, each one of those things - and we apply a value to that to come up with a total tangible value of that property. Then, we look at it and say OK what are the intangible assets of the property? So, then the second level is the intangible and we go through an assessment of where we look at what are the intangible elements that are added to that to come up with a total value of that property. So, for example, if somebody had a bunch of quantitative assets that we added together and it come up to $10,000 and they were offering product exclusivity - so we put a range of anywhere from 25% to 50% on product exclusivity - so, let’s say it was a really exclusive property, you know they were shutting out all of their competitors and everybody else, and we gave it a 50%. So, that $10,000 now becomes $15,000 in value and we add in a number of other key factors and we come up with the total value of the sponsorship. OK? Now, we use a common asset evaluation for public events and this shows you what we do and how we lay out different things. So, in ID and in event program, a mogul ID can range anywhere from a 14 of a cent to 5 cents. There are some variables here that shows you how it can work.. .for example, a value on a sing at an entrance to an event is a lot different value that a sign that is along a walkway at an event that has a lot of other moguls on it. I mean who looks at the sign with 4 or 5 moguls.. .nobody does but do you look at the sign at the entrance to the event.. .the odds are that you are going to see it. So, we place the highest value on signs where they are behind a stage where you are staring at it for a half an hour. Those are the signs with the highest value. So what we do is to keep the tangible assets consistent we work with the numbers and we change the values - we don’t try to think about how many people will see that sign along the walkway and we don’t try to think about how many people will see that entrance sign, we say there is 20,000 people attending so the entrance sign has a value of 4 cents/impression whereas the sign along the way has a value of 1 cent/impression.. .so, we’re taking into account that it probably won’t be seen like the one at the entrance. These values are based on my experiences. So, we’ve done is that we’ve looked at around 300 sponsorship properties at least and we’ve come up with averages of what things are worth and then we say based on this, this is where basic tangible assets come in at. So, what I’m going to give you here is the chart that shows you how this works and how these things apply. So what we do when we do this is.. .and this is sort of standard to what we do.. .we talk about the methodology or what we do with the company, then we talk about the types of things that we look at from an intangible perspective. So, you can see the prestige of the property, is it a worthwhile cause, does it have media potential, impact on the audience, does it have networking opportunities, is it adaptable to geographic considerations, what is the ease of activation, how exclusive is it, what is its ability to stimulate sales. So,
Reproduced with permission of the copyright owner. Further reproduction prohibited without permission.
3 8 2
you can see how - in this case here - that the tangible value is $10,000 so we then assessed these other key [intangible] elements as being really important and we put them and we came up with $18,500. Well, this $10,000 is based on our stuff and the rest of it is based on experience, instinct, what other people are paying in the market, all that kind of stuff. This is where it gets fuzzy. We’re starting with a quantitative number to start with.. .and we’re saying purely on a quantitative level - forget the associative value of this - what is this worth from a pure media perspective. Then we add up. As you can see here, we have everything from websites, to ID on tickets, to logos, to PA announcements... You know if with something like this when you are looking at something like advertising on a publication to do with the sponsorship. If they are selling ads for $2,500 and you are actually getting money $2,500 to sell those ads, and you give up and ad as part of the benefit, then you should have a $2,500 value. So, whenever there are rate cards established for things, those are the values we put on it. So, that is kind of that point.
Reproduced with permission of the copyright owner. Further reproduction prohibited without permission.