Spending on Social Events through Microfinance- Evidence from an impact evaluation programme...
47
Spending on Social Events through Microfinance- Evidence from an impact evaluation programme conducted in Hyderabad, India Pochampally Gargi Rao Candidate No: 122783 Submitted in partial fulfilment of the requirements for the degree of MSc in Development Economics BMEc – School of Business, Management and Economics University of Sussex 6 November 2014
Transcript of Spending on Social Events through Microfinance- Evidence from an impact evaluation programme...

Spending on Social Events
through Microfinance-
Evidence from an impact
evaluation programme conducted
in
Hyderabad, India
Pochampally Gargi Rao
Candidate No: 122783
Submitted in partial fulfilment of the requirements for the degree of
MSc in Development Economics
BMEc – School of Business, Management and Economics
University of Sussex
6 November 2014

Candidate Number: 122783
i
Acknowledgments
I am pleased to submit my dissertation as part fulfillment of the requirements to
complete my MSc in Development Economics. I owe a lot to all those who helped me
in completion of this task within the given time. I would be failing in my duty if I do
not thank my supervisor Dr. Pedro Rosa Dias without whose valid suggestions and
guidance this could have not been completed.
I thank my course coordinator Mr. Alan Winters who helped me in successfully
completing my degree with an internship variant and was kind enough to give me an
extension to submit my thesis.
I owe a lot to my parents who have given me a great support and strength during my
stay in Brighton. Equally important is my uncle, Dr. PSM Rao whom I cannot afford to
miss. Discussions with him on microfinance systems in Hyderabad were always a
pleasure and showed me a path to take up this research topic.
Last but not the least, I thank the staff of School of Business, Management, and
Economics; the library staff who always helped me whenever I wanted.
I again take the opportunity to thank all those who have been helpful in completing
this work. If I missed anyone, I may be pardoned since it is not deliberate.

Candidate Number: 122783
ii
Contents Acknowledgments ........................................................................................................... i
Contents .......................................................................................................................... ii
List of tables and figures .............................................................................................. iii
Abbreviations ................................................................................................................ iv
Abstract........................................................................................................................... v
1. Introduction ......................................................................................................... 1
2. Background of Microfinance ............................................................................... 4
2.1 Microfinance in Andhra Pradesh ................................................................... 6
2.2 Social pressure and need for credit ................................................................ 8
3. Literature Review .............................................................................................. 12
3.1 Health and Microfinance ............................................................................. 13
3.2 Education and Microfinance ........................................................................ 16
3.3 Social traditions and expenditure ................................................................ 18
4. Data.................................................................................................................... 22
4.1 Background on the Microfinance Policy.....................................................22
4.2 Structure of the Randomised Control Trial.................................................23
4.3 Results of Duflo et al...................................................................................24
4.4 Descriptive Statistics...................................................................................25
5. Methods ............................................................................................................. 27
6. Results ............................................................................................................... 29
6.1 Quantile Regressions ................................................................................... 33
7. Conclusions ....................................................................................................... 36
8. References ......................................................................................................... 38

Candidate Number: 122783
iii
List of tables and figures
List of figures
Figure 1: Growth in Private sector MFIs in AP ............................................................. 7
Figure 2: Social pressure on borrowing from MFIs and moneylenders for social
expenditure ..................................................................................................................... 9
Figure 3: Quantile graphs for social expenditures ........................................................ 34
List of Charts
Chart 1: Unadjusted treated-control difference for social expenditures ....................... 26
Chart 2: Adjusted treated-control difference for social expenditures .......................... 26
List of tables
Table 1: Description of variables ................................................................................. 28
Table 2: Treatment coefficients in regression models for social, health and education
expenditures .................................................................................................................. 29
Table 3: Treatment coefficients in regression models for social, health and education
expenditures .................................................................................................................. 31
Table 4: Treatment coefficients in regression models for social expenditures ............ 32

Candidate Number: 122783
iv
Abbreviations
AP Andhra Pradesh
ITT Intent-to-treat
LFP Low Fee Private Schools
MFI Microfinance Institutions
NABARD National Bank for Agriculture and Rural Development
NGOs Non-Governmental Organisations
OLS Ordinary Least Square
SEWA Self Employment Women Association
SHG Self-help group
RCT Randomized Control Trials Randomised Control Trials
RRB Regional Rural Banks

Candidate Number: 122783
v
Abstract Microcredit is a tool to reduce poverty. It is documented that microfinance
leads to improvements in health, education, improving businesses and
standard of living of the poor. This research tries to look at a possible second
channel of microfinance linked to social expenditures. These comprise
festivals, other ceremonies, weddings and funerals. This dissertation
estimates the effect of microfinance on household social expenditure by re
examining data from a randomised control trial, previously used to evaluate
the impact of a well-known microfinance intervention: the provision of
microcredit to poor in Hyderabad by Spandana, a leading Microfinance
institution (MFI) in India. Recent literature suggests that this social
expenditure can be largely ‘unwanted’ and caused by social pressure; it has
also been shown that it can make poor households poorer. This dissertation
finds large and statistically significant effects of microcredit on social
expenditures; in some cases microcredit indices an increase in these
expenditures that is larger than its effect on education and healthcare.

Candidate Number: 122783
1
1. Introduction
Microfinance has both economic and social impacts on poor households. These
economic and social impacts come in the form of affecting the expenditure pattern
of the poor households. Poor households are in need of financial assistance to have
better economic standards of living. Hence, microfinance has emerged as a helping
hand not only for the needy but also for economists and anthropologists to suggest
models to deal with poverty. Microcredit has generated considerable enthusiasm
and hope for poverty alleviation at a faster pace, culminating in the Nobel Prize for
Peace, awarded in 2006 to Mohammed Yunus and the Grameen Bank for their
contribution to the reduction in world poverty.
A strong link between access to credit and poverty persists in economic literature.
Microfinance; giving credit in small quantities to poor households; is now a tool to
deal with poverty and is considered as a poverty reduction strategy to target the
inaccessible and provide them with loans to enable them generate sustainable
livelihoods. The character of Microfinance has thus come up with a promising hand in
enabling policymakers to rethink about banking for the poor. There is another side of
the argument, which talks about being in poverty leads to inaccessibility to loans.
Therefore, a causal link between access to credit and poverty cannot go unnoticed.
According to Armendariz1, “one of the notable aspects of these microfinance
approaches is that improvements are possible even when lenders do not actually
acquire more information. Instead, the contracts harness local information and give
borrowers incentives to use their own information on their peers to the advantage of
the bank. It is not that the older analyses of information problems were incorrect, it
is just that they failed to consider new ideas to circumvent information
problems.”The microfinance revolution started with the recognition that poor people
1Beatriz Armendáriz de Aghion and Jonathan Morduch –“The Economics of Microfinance”; The MIT
Press Cambridge, Massachusetts, London, England.

Candidate Number: 122783
2
needed access to loans and that they could use these funds productively. It has also
changed the perception that poor people are not credit worthy. However, these
programmes do not intend to divert the credit to un-viable and avoidable
extravagant expenditure like expenditure on social events, and customary practices.
Economists have looked into the direct link between microfinance and better
economic outcomes such as improvement in health care services, better schooling,
setting up new businesses, etc. The literature highlights that there is a positive link
between microfinance and these economic aspects when it comes to poor
households who are in need of money. Such as Dunford (2001)2 studies the
integration of microfinance with promotion of family planning/birth control and
combating HIV/AIDS; Pronyk et al. (2006)3 found that microfinance is associated with
reduced risk of physical or sexual abuse; Barnes et al (2001)4 looked at significant
increase in paying the school fees for households who were treated with
microfinance; Khandker (2001)5 found out that by providing small loans to poor
households led to fall in dropout rates for children in the treatment group, etc. But
there are leakages as well to this concept and positive link can be questioned.
As poor individuals get more money due to microfinance, they tend to spend it for
their immediate economic and social needs to enhance their standard of living and
improve their social image. Hence, there could be a plausible ‘social link’ through
microfinance. Thus this research paper tries to see whether there is a link between
microfinance and social expenditures.
2 Christopher, Dunford. “Sustainable Integration of Microfinance and Education in Child Survival, Reproductive Health, and
HIV/AIDS Prevention for the Poorest Entrepreneurs” Journal of Microfinance, Volume 3 Number 2
3 Pronyk PM, Hargreaves JR, Kim JC, Morison LA, Phetla G, Watts C et al. Effect of a structural intervention for the prevention
of intimate-partner violence and HIV in rural South Africa: a cluster randomised trial. Lancet 2006;368:1973–83.
doi:10.1016/S0140-6736(06)69744-4 PMID:17141704
4 Barnes, C., Keogh, E., & Nemarundwe, N. (2001b). Microfinance program clients and impact: An assessment of Zambuko
Trust Zimbabwe. Washington, DC: Assessing the Impact of Microenterprise Services (AIMS).
5 Khandker, S. (2001). Does micro-finance really benefit the poor? Evidence from Bangladesh. Paper delivered at the Asia and
Pacific Forum on Poverty: Reforming Policies and Institutions for Poverty Reduction, 5–9 February.
Candidate Number: 122783
3
The growing concern is that households now spend more on social events and social
occasions than on economic and sustenance activities. Due to social pressure from
the society they live in, in the form of fear of social exclusion, stigmatisation, ridicule,
peer pressure, the poor households struggle to acquire social recognition and status
in society. To live up to these expectations and due to pressure from social
surroundings and circumstances, households take loans from institutions and
individuals. Overall, social spending could lead to negative externalities and welfare
loss, especially for poor households. Some documented to this effect is available in
the literature. Splendid funerals (The Economist, 2007; Mango et al., 2009), roaring
bride‐prices and dowries (Rao, 1993; Dekker and Hoogeveen, 2002), inflating social
spending (Brown et al., 2011), lavish ceremony expenditure squeezing out nutritional
outcomes (Chen and Zhang, 2012), and lavish festivals (Banerjee and Duflo, 2007).
This raises an important topic about social pressures governing the expenditure
pattern of poor income households. Thus, I try to formulate my hypothesis by looking
at how microfinance and social expenditures are linked.
This research is a re-search (Searching again) into the data based on secondary
datasets produced for Spandana, hence results are subject to the data published by
Spandana way back in 2010. Further, this study tries to replicate the study performed
by Banerjee and Duflo (2009) but looking at social pressure impacts on expenditure
of low-income households. Hence, this research thesis takes up a randomised control
trial that was conducted by Banerjee and Duflo (2009) to access the impact of
microfinance on various economic outcomes. The study uses the data collected from
household surveys of various households living in the slums of Hyderabad.
From the available literature, we can predict that microfinance has a positive effect
on social expenditure. The indicative results suggest that there might be a positive
effect on festival spending and wedding spending as a percentage of health and
education expenditures. In order to test the hypothesis, the research is divided into
seven sections. Section one, deals with the introduction of the research, which traces
the evidences of formulating the hypothesis; section two provides brief on

Candidate Number: 122783
4
microfinance and its origins, looks at evidence of microfinance structure in
Hyderabad and the need of microfinance for social spending. Section three looks at
the evidence from past literature on social spending, health and education. Section
four looks at the collection of data including the microfinance policy adopted
structure of the RCT, and descriptive statistics. Section five looks at regression
strategy implemented to support the hypothesis. Section six analyses the results,
including quantile regressions. Finally, the paper is concluded in the seventh section.
The usage of graphs, tables and charts are seen wherever relevant. Simple
percentages are used to analyse the data and to support conclusions, and to give a
reader the basic facts and ground realities.
2. Background of Microfinance Microfinance is a developing concept that has mushroomed from the ideas of
Muhammad Yunus of supplying small loans to poor households. He argued that one
day these small loans would generate income and the poor clients would be able to
repay the loans. Now, this idea of providing small loans to poor households has
brought in structural changes in economies and the way to fight back poverty. As
Armendariz puts it, ‘Muhammad Yunus is recognized as a visionary in a movement
that has spread globally, claiming over 65 million customers at the end of 2002.’6
Otero (1998) defines “Microfinance as the provision of financial services to low-
income poor and very poor self-employed people”. It focuses on providing financial
services such as short-term loans, savings and insurance products to poor
households, who lack access to credit. The importance of Microfinance was
reinforced with the launch of the Microcredit Summit in 1997, where the aim to
reach 175 million poor households with credit, and other financial services by the
end of 2015 was discussed. With the acceleration of participations of various
international organizations and Non Governmental organizations, recently led the
UN to recognise 2005 as the International Year of Microcredit.
6Beatriz Armendáriz de Aghion and Jonathan Morduch –“The Economics of Microfinance”; The MIT Press Cambridge, Massachusetts, London, England .

Candidate Number: 122783
5
In fact, institutionalisation for microfinance through public sector banking began way
back in 1975 in India with the establishment of Regional Rural Banks (RRBs) or
Grameen Banks, and regulating them with a Regional Rural Bank Act 1976. Through
this act, the financial needs of farmers with smallholdings, (up to a maximum of five
acres of land); agricultural labourers, rural artisans, small businesspersons in rural
areas, rural women, vegetable vendors etc. were supported with institutional credit.
These banks served a cluster of 10 to 15 villages and they were made accessible for
users. They have transformed rural economic scenario altogether. The main
philosophy behind the establishment of those banks by the Government was to
reduce rural indebtedness, and take out the farmers and others with small means
out of the clutches of rural unregulated/traditional moneylenders (Rao, P. Madhava,
Vishalandhra, 1989). Major public sector banks have sponsored these RRB, and by
1990 almost all the villages in India were served by these banks. Coming to urban
areas like Hyderabad, it was urban cooperative banks, and regulated private money
lenders extended credit to the people with small means for business purposes.
The awareness about the need for microfinance lies with the policymakers who have
tried to work their way out to develop exiting credit institutions to work on poverty
reduction by providing credit to the poor households for whom the credit was
inaccessible, but with disappointing results. In that sense, Microfinance has come up
with a promising hand in enabling policymakers to rethink about banking for the
poor. According to Armendariz7, the existence of microfinance institutions is a
solution to existing problems of adverse selection and moral hazard in financial
sectors. In her words, “one of the notable aspects of these microfinance approaches
is that improvements are possible even when lenders do not actually acquire more
information. Instead, the contracts harness local information and give borrowers
incentives to use their own information on their peers to the advantage of the bank.
It is not that the older analyses of information problems were incorrect, it is just that
they failed to consider new ideas to circumvent information problems.”
7Beatriz Armendáriz de Aghion and Jonathan Morduch –“The Economics of Microfinance”; The MIT
Press Cambridge, Massachusetts, London, England.
Candidate Number: 122783
6
In a related argument, interest rates to play a vital role in augmenting the growth of
Micro Finance Institutions. They rose as high as is needed to fully cover operating
costs, and profits to the promoters otherwise programs could not be financially
sustainable. This is the Microfinance institution’s (MFI) viewpoint of financing itself
to help the needy. Armendariz says “this has been a hard-fought argument, and we
agree that prudently raising interest rates can be a key to microfinance success”8.
Thus, the challenge for microfinance is to couple smart interest rate policies with
new ways of doing business to ensure good incentives for its clients. The MFIs set up
after 2000 saw themselves less in developmental mould and more as businesses in
the financial services space. This overriding shift brought about changes in
institutions’ legal forms, capital structures, sources of funds, growth strategies and
strategic alliances. We will now look at the growth of microfinance in Andhra
Pradesh, the place we are interested in. This research takes up the data collected
from slums of Hyderabad, Andhra Pradesh.
2.1 Microfinance in Andhra Pradesh Microfinance is not a new concept when it comes to India. It had its roots from the
cooperative moment in India, Self Employed Women Association (SEWA) Gujarat
Model of savings of 1974, and the Government of India’s Flagship Banking for the
poor approaches of 1975 to establish Grameen Banks. These Grameen banks were
established to provide small loans to farmers for agriculture purposes and for small
businesses. This approach was later given a legal status through a Regional Rural
Bank Act 1976. The microfinance movement was initiated by Government of India,
and later by National Bank for Agriculture and Rural Bank Development (NABARD) in
collaboration with Banks and Non-Governmental Organizations (NGOs) for unbanked
population known as Self-help groups (SHGs) - bank linkage program in 1992. Thus,
the microfinance concept started to grow with Government endeavours to engage
itself in financing the poor, and later with the involvement of private sector by
8Beatriz Armendáriz de Aghion and Jonathan Morduch –“The Economics of Microfinance”; The MIT
Press Cambridge, Massachusetts, London, England.
Candidate Number: 122783
7
setting up Microfinance Institutions (MFIs). From there on microfinance activities
were being implemented by two channels MFI model and SHG bank linkage model.
The Micro Finance sector with private sector participation witnessed growth from
2006 to 2010.
Coming to Andhra Pradesh (AP), there has been a large amount of lending through
MFIs in gross terms until the government of AP decided to regulate their functioning
in 2010, which led to drastic fall in microfinance history. As Taylor (2011, p. 3)
explains, within the expansion of microfinance in the late 1990s: “Andhra Pradesh
became a magnet for microfinance start-ups and witnessed a proliferation of loans
from private MFIs. [. . .] The ability of MFIs to scale up their operations in Andhra
Pradesh rests in part upon the institutional infrastructure and culture of formal credit
put in place through the social and development banking schemes of the 1970s and
1980s, alongside the expansion of the self-help group (SHG) model under the auspices
of the state in the 1990s and 2000s”.
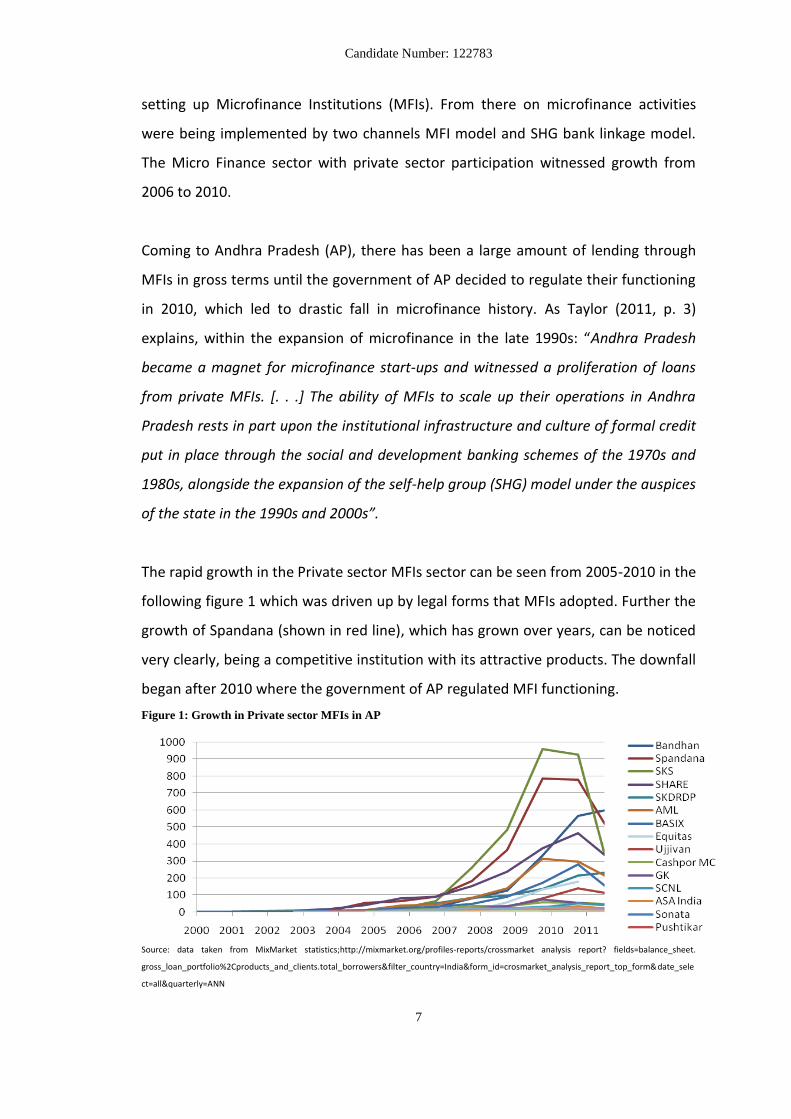
The rapid growth in the Private sector MFIs sector can be seen from 2005-2010 in the
following figure 1 which was driven up by legal forms that MFIs adopted. Further the
growth of Spandana (shown in red line), which has grown over years, can be noticed
very clearly, being a competitive institution with its attractive products. The downfall
began after 2010 where the government of AP regulated MFI functioning.
Figure 1: Growth in Private sector MFIs in AP
Source: data taken from MixMarket statistics;http://mixmarket.org/profiles-reports/crossmarket analysis report? fields=balance_sheet.
gross_loan_portfolio%2Cproducts_and_clients.total_borrowers&filter_country=India&form_id=crosmarket_analysis_report_top_form&date_sele
ct=all&quarterly=ANN

Candidate Number: 122783
8
The AP government required the MFIs operating in the state to get registered with
local district authorities who forced the MFIs to put on hold their collections and
disbursements. Overall, this led to a crisis in the microfinance sector as it faced with
funding constraints due to regulatory uncertainty.
Having briefly looked at the trend of microfinance in AP, we now look at the need for
microfinance. This will be analysed by looking at social pressure as a need for
microcredit so as to spend more on social occasions and events. The next section
tries to find an answer to why poor households spend on social occasions and the
reasons for it being bad.
2.2 Social pressure and need for credit Many poor households come from closely-knit community. Hence, they are highly
integrated into the society in every aspect including social expenditure. It is highly
documented that a significant amount of their income goes into social spending such
as spending on lavish festivals, extravagant wedding ceremonies and funerals
accompanied by higher spending on gifts (Chen 2012). In recent years, economists
have increasingly interested to look at the connection between consumption and
social experience, especially in connection with consumption of global commodities
(Friedman, 1994; Miller 1987).
Access to credit and reason to get credit from Microfinance institutions (MFIs)
among poor households is governed by social pressure. In the following diagram
(figure 2), we look at five different dimensions that define social pressure, which
causes households to spend on social occasions at the cost of health and education.
The first reason, which is very common to think of, is that of Social Status. This is
because higher social status is associated with higher rewards in near future. Taking
the case of Chinese rural areas, according to an experiment conducted by Chen
(2012), “Gift giving may also signal wealth and social status. If a higher social status
is associated with greater rewards, such as a higher likelihood of marriage for

Candidate Number: 122783
9
offspring, than concerns for status may intensify gift-giving competition.” To this V.
Rao, explains the paradox between rational and non-rational behaviour of
households in consumption expenditure. This is because money spent on
celebrations, festivals, funerals, weddings and other ceremonies is after all the
money that was not spent on health, education and other production inputs.
Another aspect explaining social pressure is that of customs and traditions. It is a
well-known fact that poor households are excluded from society. In order to acquire
a social recognition, getting included in their social group, they tend to spend more
on festivals, traditions, customary rituals, and feasts. Turner (1982), for instance,
describes festivals as "generally connected with expectable culturally shared events."
He suggests that when a social group celebrates a particular event, it “celebrates
itself” by “manifesting in symbolic form what it conceives to be its essential life."
Thus, festivals may serve to build social cohesion by reinforcing ties within a
community. Public rituals identify and shape individual preferences. To this V. Rao,
takes the case of households in South India and looks at their expenditure pattern on
festivals and ceremonies. He concludes that for the maintenance of status and rank,
households tend to acquire greater assets such as wealth, a prestigious job, or
acquisition of rich husband or son-in-law is desired. And these are some of the
preconditions to the acquisition of greater public respect and regard.
Figure 2: Social pressure on borrowing from MFIs and moneylenders for social expenditure

Candidate Number: 122783
10
Going further, more recent development shows peer pressure as a motive behind
high social expenditure. This was well laid out by Chen (2012), who looked at the
increased expenditure on expensive gifts among poor households in rural China. In
his words “Peer effects can generate both positive and negative externality. On the
positive side, peer pressure may facilitate technology adoption and social learning
(Benabou, 1993; Hoxby 2000; Glaeser and Scheinkman 2001; Conley and Udry 2010).
However, peer pressure can also induce socially undesirable behaviour, such as
juvenile delinquency (Haynie 2001). It is therefore likely that one’s gift-giving
behaviour is influenced by peers as well.”
Studies have shown that there have been increases in social demands, which mount
for status in society. A study from Ethiopia, that looked at the village poultry
consumption and marketing in relation to gender, socio-cultural events and market
access, shows that vital consumption has reduced. Religious festivals and traditions
periodically shift the local demand towards unwanted products rather than
productive inputs.
Moving on, poor households tend to live in the present rather than saving for the
future. This is because they are tied with social commitments. Dupas and Robinson
(2011), closely looked at the spending and savings pattern of households in Kenya;
where they estimated the bundle with social commitment and credit to have the
largest effect on naive present-based individuals. Another form of commitment
arises from households being risk averse. Even though, money is fungible,
households tend to spend it on ‘unwanted expenditures’ just to treat them with
luxury. The terminology used ‘unwanted’ expenditure was well versed by Banerjee
and Mullainathan (2010).
Taking up the argument of Banerjee and Mullainathan (2010) further, there have
been studies that looked at why social expenditure was ‘unwanted’. They propose
that the sophisticatedly tempted poor will not save money that they know will be
wasted in the future. They explore the idea “that the fraction of the marginal dollar

Candidate Number: 122783
11
that is spent on temptation goods decreases with overall consumption,”9 where
temptation goods are goods in a multi-period/multi-self-model that only generate
utility for the self of the period when they are consumed.
To add to this, a study conducted by Mango, et al (2009) identifies the reason behind
poor people falling into poverty trap through increased social expenditure, in a study
conducted in Kenya. He suggests that heavy funeral expenditures is one of the
reasons why poor households fall into deep poverty. He described, “A third set of
descent-inducing factors are related to social and cultural practices, which also vary
considerably among the five livelihood zones. Social and cultural factors, giving rise to
uneconomic land subdivision, were of primary importance in Zones 1 and 3, while
heavy funeral expenses are implicated in Zones 1 and 2.”
As our hypothesis looks at the effect of microfinance on social expenditures at cost of
education and health, a recent study by Chen (2010) looked at the increased
ceremony spending at the expense of food consumption among poor households in
China. They found that “because poor often lack the necessary of resources, they are
forced to cut back on basic consumption, like food, in order to afford a gift to attend
the social festivals”. In addition, they found significant results on children health care,
due to less nutrition as a result of gift-giving. To this, he concludes, “the toll of
participating in social events is heavy for the poor- doubling the number of prenatal
exposures to social ceremonies in a village would lower the height-for-age z score of
children”.
Overall, the economic principle behind the expenditure depends on the flow of
income of the poorest households. The main argument here is that households, who
are now had more money in their hand came as a microcredit, tend to choose their
own consumption pattern. Some of this amount goes into expenditure on health,
education, productive assets; and some of the income flows into expenditure on
9 Banerjee, A. Mullainathan, S. “The shape of Temptation: Implications for the economics lives of the
poor”. CEPR Discussion Papers 7828, C.E.P.R. Discussion papers. 2010

Candidate Number: 122783
12
social occasions such as festivals, funerals, weddings, gifts, and other ceremonies. In
economic terms, this is called a leakage. The recent literature highlights some
evidence on these leakages and how spending pattern of poor households has
changed with regards to social reasons. We have identified some of the prominent
social reasons (discussed above), and now we move to analyse the empirical
literature showing evidence that social expenditure has increased.
3. Literature Review Microfinance Institutions (MFIs) are often seen by the aid practitioners as
transparently effective means of improving the position of the poor. There is an
abundance of literature available today on microfinance. Literature reveals many
impact evaluation studies that look at the success of microfinance institutions in
helping and aiding the poor for better economic outcomes. Most of these studies
have been conducted in developing countries. Also, little is known about the
effectiveness of targeting the ‘core poor’- which is a major flaw in Spandana’s
intervention. However, keeping in view the wider area of microfinance knowledge
and limited area of my research, I would focus here on some selected works that are
relevant to our study. Moreover, it is the general perception and belief that social
responsibilities, cultural rituals, traditions, customs, festivals, etc. play a dominant
role in the lives of many who are in financial needs. These events, even decide the
quantum of credit requirements, and expenditure patterns of borrowers from MFIs.
The paper that throws light on microfinance is by Banerjee and Duflo (2009)10 which
looks at randomized control trial of microfinance implemented in Hyderabad, India.
The details on the randomized control trial will be taken up in the Data and Analysis
section. Banerjee and Duflo (2009) in their paper look at the impact of microfinance
on various issues such as expenditure on health, education, setting up new
businesses, women's participation, etc. The program in Hyderabad does not mandate
microloans to be spent on businesses; moreover, the spending pattern of the
10
Banerjee, Abhijit V., Esther Duflo, Rachel Glennerster, and Cynthia Kinnan. 2010. “The Miracle of Microfinance? Evidence
from a Randomized Evaluation.” Cambridge, Mass.: J-PAL and MIT, June.

Candidate Number: 122783
13
households is not monitored by the MFI. Although, the conventional motivation for
the household to take up the loans were to start a business, but this was not
mentioned specifically when the experiment was conducted, hence it’s a form of a
randomized control trial. Briefly, this paper showed that microfinance did help the
poor households to overcome the shocks of health and improve school facilities, but
it did not lead to support a greater increase in expenditure for health care or better
health outcomes for children neither there were any scarring effects on education as
a whole.
In parts, I would like to evaluate the existing literature on microfinance and its impact
on health, education and social traditions in light of how much households spend
when microloans are being provided.
3.1 Health and Microfinance At the global level, strengthening health systems and giving priorities to health
indicators is one of the tools to achieve poverty reduction. Many MFIs are now
inclined towards achieving better health outcomes and reduce poverty. Numerous
impact evaluation studies support the effectiveness of microfinance and its impact
on poverty. Research funded by The World Bank examined the impact of three
microfinance institutions in Bangladesh over a seven-year period and found dramatic
decreases in overall poverty, with the highest impact on those families in extreme
poverty.11 To this Leatherman and Dunford (2010)12 say that “However, microfinance
is not a silver bullet; legitimate issues exist, such as the ability to address the needs of
extremely poor people, the level of debt burden for individuals, and the uneven
performance of microfinance institutions worldwide.”
11Khandker SR. Micro-finance and poverty: evidence using panel data from Bangladesh. World Bank Econ Rev 2005;19:263–86.
doi:10.1093/wber/lhi008
12 Sheila Leatherman & Christopher Dunford. “Linking Health to Microfinance to reduce Poverty.” Bull World Health Organ
2010;88:470–471 | doi:10.2471/BLT.09.071464

Candidate Number: 122783
14
A small but growing number of studies show that the MFIs are capable of
contributing to health improvement. Dunford (2001)13 in his paper looks at the
integration of microfinance with promotion of family planning/birth control and
combating HIV/AIDS in Bolivia and Uganda. They show that there has been positive
impact on health situation by creating awareness about HIV/AIDS. Pronyk et al.
(2006)14 found that microfinance is associated with reduced risk of physical or sexual
abuse in South Arica. In Ghana, de la Cruz15 et al found that microfinance institutions
could effectively contribute to community and national malaria initiatives by
increasing knowledge, leading to increased ownership of bed-nets used by
vulnerable members of the households. Another study by Gertler et al (2009)16, show
that there is a positive correlation between household’s consumption and measure
of health in Indonesia.
Recently, MFIs in India have integrated their services into achieving better healthcare
for the poor households. Some run health camps by educating their clients about the
basic health needs and management of diseases such as malaria, dengue and
HIV/AIDS. According to Metcalfe, et al (2012)17, MFIs have achieved significant
impacts in areas such as neonatal and maternal mortality and infant and child
feeding. Dunford and Metcalfe (2011)18 look at the low marginal costs of MFIs as an
indicator for them to participate and engage themselves in providing better
healthcare systems.
13 Christopher, Dunford. “Sustainable Integration of Microfinance and Education in Child Survival, Reproductive Health, and
HIV/AIDS Prevention for the Poorest Entrepreneurs” Journal of Microfinance, Volume 3 Number 2
14 Pronyk PM, Hargreaves JR, Kim JC, Morison LA, Phetla G, Watts C et al. Effect of a structural intervention for the prevention
of intimate-partner violence and HIV in rural South Africa: a cluster randomised trial. Lancet 2006;368:1973–83.
doi:10.1016/S0140-6736(06)69744-4 PMID:17141704
15 De La Cruz N1, Crookston B, Gray B, Alder S, Dearden K. “Microfinance against malaria: impact of Freedom from Hunger's
malaria education when delivered by rural banks in Ghana.” Trans R Soc Trop Med Hyg. 2009 Dec;103(12):1229-36. doi:
10.1016/j.trstmh.2009.03.018. Epub 2009 Apr 23.
16 Gertler, P., Levine, D. I. and Moretti, E. (2009), Do microfinance programs help families insure consumption against illness?.
Health Econ., 18: 257–273. doi: 10.1002/hec.1372
17 “Integrated Health and Microfinance in India: Harnessing the Strengths of Two Sectors toImprove Health and Alleviate
Poverty”State of the Field of Integrated Health and Microfinance in India, 2012.
18 Metcalfe, M., S.Leatherman with C. Dunford, B. Gray, M. Gash, M. Reinsch and C. Chandler. 2010.”Health and
microfinance:leveraging the strengths of two sectors to alleviate Poverty”. Freedom from Hunger Research
Paper No.9, p. 27.

Candidate Number: 122783
15
There is the other side of the story as well. Considering the Indian health situation,
there could have been a strong linkage between the Micro finance and health care.
Healthcare providers need to look at the importance of social intermediary role
those MFIs play in local communities. However, the literature does not throw much
light on this aspect. Other impact studies show that there is no relationship between
microfinance and health. For instance, the study by Desai and Tarozzi (2013)19 looked
at the effect of family planning services and microcredit in Ethiopia. They conducted
baseline and follow up surveys of cross-section of households. They found that none
of the interventions significantly increased contraceptive use or the intent to use
family planning methods over the control group. In 2004, Dohn et al20, implemented
and evaluated a 13-month health promotion programme targeting childhood illness
and women’s health in the Dominican Republic. They failed to show that microcredit
led to increase in health outcomes in all the 11 indicators that they identified. In
similar lines, Smith21 in his 2002 study about comparison of conventional banking
systems to that of health bank model combining microfinance and health education
services in urban slums of Ecuador did not lead to overall lower diarrhoea
probability.
The recent literature fails to identify the reasons behind low health spending by poor
households. The money, which they get in the form of small loans, is running out into
expenditures governed by social traditions and customs. Taking the example of India,
which is a wide economy mixed with high social values, customs and traditions.
According to Vijendra Rao (World Bank), poor households tend to spend heaps of
money on celebrations to acquire social status and recognition in the society. He
19
Alessandro Tarozzi & Jaikishan Desai & Kristin Johnson, 2013. "On the impact of microcredit: Evidence from a randomized
intervention in rural Ethiopia," Economics Working Papers 1407, Department of Economics and Business, Universitat Pompeu
Fabra.
20 Dohn AL, Chávez A, Dohn MN, Saturria L, Pimentel C. Changes in health indicators related to health promotion and
microcredit programs in the Dominican Republic. Revista Panamericana de Salud Pública. 2004;15(3):185- 93.
21 Smith, Stephen C., 2002, Village banking and maternal and child health: Evidence from Ecuador and Honduras, World
Development 30, 707-723.

Candidate Number: 122783
16
argues that ‘publicly observable celebrations have two functions -- they provide a
space for maintaining social reputations and webs of obligation, and serve as arenas
for status-enhancing competitions’22. Further, the link between health and spending
governed by social customs is not dealt in existing literature. Hence, this research
paper tries to see whether there is a correlation between the microfinance and social
spending, given the data from Spandana.
3.2 Education and Microfinance According to Littlefield et al (2003) one of the first things poor people all over the
world do with new income from microenterprise is to invest in their children's
education. There is an abundance of literature, which focuses on the positive link
between microfinance and attainment of education qualifications among the poorest
households. Most of the recent literature focuses on whether or not microfinance
led to a sizeable impact on education via literacy rates, number of years of schooling,
school dropout rates, etc. In addition, the literature fails to identify any solid
conclusion about the correlation between microfinance and education being
positive.
One such impact evaluation looks at a microfinance program in Uganda that showed
that client households tend to spend more on schooling and education than non-
client households do. Barnes et al (2001)23 in their words, concludes, “Clients have
also been significantly more likely than non-clients pay school charges for a non-
household member.” On similar lines, Khandker (2001)24 found out that by providing
small loans to poor households led to fall in dropout rates for children in the
treatment group as compared to non- treated households. Further, their study found
out that children stayed for a longer period at schools when their families received
loans from microfinance institutions. The Indian example of the Self Employed
22
Poverty and Public Celebrations in Rural India, Vijendra Rao, Development research group, World Bank
23 Barnes, C., Keogh, E., & Nemarundwe, N. (2001b). Microfinance program clients and impact: An assessment of Zambuko
Trust Zimbabwe. Washington, DC: Assessing the Impact of Microenterprise Services (AIMS).
24 Khandker, S. (2001). Does micro-finance really benefit the poor? Evidence from Bangladesh. Paper delivered at the Asia and
Pacific Forum on Poverty: Reforming Policies and Institutions for Poverty Reduction, 5–9 February.

Candidate Number: 122783
17
Women’s Association (SEWA) Bank led to positive improvement in enrolment of boys
in primary and secondary schooling in Ahmadabad. Over the period from 1997 to
1999, borrowing from the SEWA Bank had a positive impact on boys' secondary-
school enrolment rates, which rose to 70 percent.
Holvoet (2004)25 in his study looks at the specific effects of microfinance on
childhood education. They look at South India and gather data on literacy rates; and
how credit enters the household and who bring in the credit. The results were mixed.
It did not matter who brought the credit in when it came in the case of direct bank-
borrower credit delivery. However, the cases where women got credit from women's
associations, the money spent on childhood education somewhat increased in favour
of Girls’ education but left the boys’ education outcomes largely unchanged. He did
not find out any causal link or correlation between micro loans and spending on
children’s education. In addition, he found out that gender of individual bank loan
clients had no impact on their children’s education. Hence, there is ambiguity with
the data in the literature about linkages between education and microfinance.
Adding to this ambiguity, credit constraints often lead to negative impact on
education in the context of poor households. For instance, Todd and Ralph (2007)26
looked at credit constraints and low incomes are the two reasons for the high
number of school dropout rates. They took up panel data estimation to validate their
results, and concluded that while credit constraints likely to play an important role in
the dropout decisions of some students, the large majority of attrition of students
from low-income families should be primarily attributed to reasons other than credit
constraints.
25 Nathalie, Holvoet. “Impact of Microfinance Programs on Children’s Education. Do the gender of the borrower and the delivery
model matter?” Journal of Microfinance, Volume6 Number2.
26 Todd R. Stinebrickner Ralph Stinebrickner. “The effect of credit constraints on the college drop-out decision: A Direct
approach using a panel study” NEBR working paper 13340. NATIONAL BUREAU OF ECONOMIC RESEARCH, 1050
Massachusetts Avenue Cambridge, MA 02138. August 2007

Candidate Number: 122783
18
Apart from credit constraints, literature exists in the quality of education, where
individuals face the choice between private schooling and public schooling.
Considering India as an example, for households living in the rural areas are unable
to afford the overwhelming costs of seeking good quality education for their
children. A study by Joanna Härmä (2009) looks at the effect of ‘low fee private’ (LFP)
schools to promote education for all, taking the case of Uttar Pradesh in India. They
based their study on a 13‐village survey of 250 households and visits to 26 private
and government schools in rural Uttar Pradesh, India. In particular, the paper
explores the issue of whether private provision is affordable and accessible to poor
rural parents. It finds that LFP school costs are unaffordable for over half of the
sampled children, including the majority of low caste and Muslim families. It also
finds that while LFPs are greatly preferred under current conditions, what parents
actually want is a well‐functioning government school system.
Having discussed the recent literature on education, the question of how traditional
values and customs governing the minds of the poor household’s expenditure
pattern remains a mystery that has to be solved. A poor household living in rural
areas when exposed to small loans tends to spend on social functions to gain
recognition in the society rather than spending on basic needs such as education.
Thus, the available empirical evidence shows that households are spending on social
occasions to develop social capital. By social capital, we mean the internal and social
coherence of society, the norms and the values that govern interactions among
people and institutions in which they are embedded.
3.3 Social traditions and expenditure Nowadays, expenditure of households depends on a variety of issues and specific
when it comes to building social capital. Spending on social events to get recognized
in society; an ambition to attain a high social status is driving the households to
spend their pockets on various cultural programs, marriages, festivals, and other
customary occasions. The growing literature suggests that the financial decision in
the poor household is made mainly on social events, customs, culture, and traditions

Candidate Number: 122783
19
of the individuals who control income in the family. A study by Nazli Kibria (2014)27
looks at the women's garment industry in Bangladesh and their expenditure pattern.
Despite the traditional low economic autonomy of Bangladeshi women, the women's
ability to control their income was varied, and in fact, a substantial number of the
women workers exercised full control over their wages. Socioeconomic background
affected women's income control by shaping both the symbolic meaning of women's
income and the ability of male kin to fulfil their traditional obligations to women.
With the exception of some young unmarried workers, women's employment in the
garment industry had not posed a significant challenge to patriarchal family
relations.28
The literature has shown some plausible insights into social expenditure. For
instance, the study by Cynthia Werner29 looked at consumption pattern in rural
Kazakhstan with regards to changes in wedding feasts. The author points out that
despite economic hardship post-Soviet transition to a market economy, rural Kazakhs
have continued to spend a large amount of their income and resources on feasts and
marriages. She found that exchanging gifts and utilizing imported goods led to the
enhancement of social status and identity among rural Kazakhs. In her own words
she concludes that “The process of further social stratification has intensified the
level of competition in feasting and gift giving among the local elite. And the same
process has generated resentment among poor households who find it more and
more difficult to continue participating in the ritual economy.”
27
Nazli Kibria. “Culture, Social Class, and income control in the lives of women garment workers in Bangladesh” Gender &
Society June 1995 vol. 9 no. 3 289-309
28Nazli Kibria. “Culture, Social Class, and income control in the lives of women garment workers in Bangladesh” Gender &
Society June 1995 vol. 9 no. 3 289-309
29 Cynthia Werner. “Marriage, Markets, and Merchants: Changes in Wedding Feasts and Household Consumption Patterns in
Rural Kazakstan” Culture & Agriculture Vol. 19, Nos. 1/2 Spring/Summer 1997

Candidate Number: 122783
20
A very recent study by Susan Wolcott (2013, The New Handbook of Microfinance)30
looks at the situation of rural credit markets in colonial India and how Indian
cultivators spend on ceremonies, marriages and funerals. She links this leakage at the
expense of increases in agricultural activity and investment. According to her “Indian
cultivators spent a remarkable portion of their income on festivals, marriages and
death ceremonies.” “For all of India, ceremonial expenditures for one year on average
constituted 18 percent of annual crop values.” Further she notes this difference
among poor households who relatively spent more on ceremonies as compared to
agricultural activities; and “for those families, consumption clearly crowed out
investment”. The reason for such high social expenditures is “social caste” and how
different caste demands the needs for ceremonial expenditures. Further the major
implication of her study looked at how poor households took credit for funding
ceremonies rather than investing in their agricultural business.
Some of the recent studies also throw some light on social exclusion as being the
cause for spending on social events. The study by Bittman31 looks at social exclusion
being a multi-dimensional concept explaining the significance of social identity,
culture, agency and power relations. His argument was that households spend on
leisure activities as part of social exclusion. He performed an analysis of the most
recent household expenditure survey that showed consumption of leisure goods and
services was powerfully determined by income. His conclusions looked at how low
income can lead to exclusion from leisure participation.
Another study by Brown, et al (2007) looked at a panel estimation of rural villages in
China on how there has been a sharp increase in socially observable spending. They
suggest that “social spending is either positional in nature (that is motivated by
status concern) or subject to herding behaviour.” They found that the welfare
30
Susan Wolcott. “Microfinance in Colonia India”. Published in “The New Handbook of Microfinance-
A financial market system perspective” 2013.
31 Michael Bittman, 1999.Social Participation and Family Welfare: The Money and Time Costs of Leisure, University of New
South Wales, Social Policy Research Centre.

Candidate Number: 122783
21
implications of spending, in order to ‘keep up with the Joneses” are potentially large,
particularly for poor households.
The dynamics governing the borrowing behaviour of micro credit borrowers show
the trends of growing social capital as a motive to drain expenditure on social
occasions, additionally; social stigma in Indian societies too played an important role.
Poverty reduction among poor households not only means development of health
care services, better educational facilities or setting up a new business, but also to
expand human capabilities by avoiding violence. A recent study in Kerala looked at
the impact of marital violence on the economic outcomes of women in rural
households. Many studies have looked at the correlation between marital violence
and economic prosperity, but often neglected the link though credit constraints. In
achieving social status and sticking to the social norms of the society, households are
pouring money into celebrating festivals and occasions rather than spending on
essential economic needs.
Adding to the above reason of social violence, Chen (2011) looked at the social link,
peer effect, and status concern as being the motivation behind high gift expenditure
in China. He tries to answer the question raised by Banerjee and Duflo (Poor
Economics, 2011) about ‘why do poor people spend more on social occasions such as
marriages, festivals and other ceremonies’. According to his evaluation, he found
that “a 1% increase in peers’ gift spending per occasion leads to a .13-.34% increase
in ones’ own gift per occasion”. Chen (2011) explains that it is easier for poor
household to climb the social ladder while engaging themselves with the rich rather
than insuring themselves against the future risk (risk pooling strategy). “Overall, large
social spending may result in negative externalities and welfare loss, especially for
households living close to subsistence”- but this is subject to Chen’s findings on gift
expenditure as compared to risk-pooling mechanisms.
However, no literature has seriously and strongly looked in to the link between
microfinance and social expenditure (spending on weddings, funerals, festivals, etc.).

Candidate Number: 122783
22
Anthropologists and sociologists did look at the trend on social expenditure, which is
being imposed upon through social pressure, but economists are still in early stages
to find a causal link between access to credit and that credit being used to finance
social occasions. What an economist would think is that it was individuals’ own
satisfaction or behaviour that makes him/her spends on social events, but
sociologists argue that being under pressure poor people focus on social spending
and neglect valuable spending on health outcomes and educational outcomes. The
above papers do provide an insight into growing social expenditure, but this is not
economics. Hence, more research on economic evidences has to be performed to
look at the causal link. Hence, the present paper tries to attempt to fill the gap by
looking at the impact of microfinance on festivals and other social expenditures
varying across households, limiting its conclusions to the dataset designed by
Spandana.
The next section deals with the data and closely looks at the microfinance policy,
structure of the RCT used and descriptive statistics.
4. Data
4.1 Background on the Microfinance Policy
To look at the effect of microfinance on poor household’s, Banerjee and Duflo (2009)
took the help of Spandana to conduct their analysis. They looked at the products and
services being provided by Spandana and laid out their experimental design.
Spandana is believed to be most of the most profitable organizations in the industry
and has been one of the main targets of government activism in Andhra Pradesh.
Their microfinance product is basically a group loan product which was similar to that
of Grameen Banks model. A group is comprised of six to ten women, ageing between
24-45 groups form a “centre”. Women are jointly responsible for the loan of their
group, and of the centre. The first loan is of 10,000 rupees and an interest rate of
12% is charged. It takes fifty weeks for the principal and interest rate to be
reimbursed. If they all reimburse, then they can take up a second loan worth Rs.
Candidate Number: 122783
23
10,000-Rs. 12,000; increasing in the loan amount up to Rs. 20,000. Unlike other MFIs,
Spandana does not require it clients to take up a loan just for starting up a business;
money taken up from Spandana is fungible, and clients are left completely free to
choose the best use of their money, as long as they repay the loan.
The eligibility of taking up a loan is determined by various characteristics. They
should be (a) female, (b) aged 18 to 59, (c) residing in the same area for the last one
year, (d) has valid identification and residential proof, (e) at least 80% of the women
in the group must own their home. Also, these groups are formed by women
themselves and Spandana does not determine loan eligibility based on their
expected productivity of the investment. Further, Spandana is only a lending
organisation and does not directly involve in business training, financial literacy
promotion, etc.
4.2 Structure of the Randomised Control Trial
The data used for this research is from a randomised control trial (RCT) in Hyderabad,
India. The microfinance institution that took up the initiative to survey was
Spandana. Spandana is one of the largest Microfinance Institution (MFI) in India,
which had around 4.2 million loan clients, with an outstanding portfolio of 42 billion
rupees. Spandana took up an evaluation in some areas of Hyderabad city to know the
situation and the impact of microfinance.
Spandana selected 120 areas in Hyderabad as places in which they were interested in
opening up branches, based on those communities having no pre-existing
microfinance presence, and having residents who were desirable potential
borrowers. Banerjee and Duflo (2009) in collaboration with Spandana collected data
from 104 slums in Hyderabad, out of which 52 areas were chosen at random for the
opening of MFI branch immediately, while another 52 served as the comparison
communities. A series of baseline and end line surveys were conducted to look at
various aspects of lending and expenditure pattern of poor households. It conducted
a baseline survey in 2005 by randomly selecting some 20 to 40 households per slum,
leading to 2800 households in total. The baseline survey was used for stratification

Candidate Number: 122783
24
and descriptive analysis, and to collect area-level characteristics that are used for
control group comparisons.
Prior to randomization, Duflo, et al (2009) dropped 16 areas from its sample as those
16 areas consisted of a large number of migrant worker households. They had a rule
to provide loans to only those households that lived at least one year in that
particular community. Spandana then progressively started operating in 52
treatment areas from 2006-07. They also performed a follow up survey in 2008-09 to
look at the expenditure pattern and growth of businesses after 12 months Spandana
began to distribute out loans to the households.
The measured impact is done here through Intention to Treat (ITT) method. By this
we mean that the study conducted by Banerjee and Duflo (2009) was to look at the
impact of microfinance programs exposure to poor households rather than strictly
borrowing from MFI.
4.3 Results of Duflo et al.
Having looked at the structure and design of the RCT, I have taken up this dataset to
look at new variables, which were overlooked by Banerjee and Duflo (2009) in their
study. Duflo et al looked at various outcomes such as loan-take up and use, new
business and business profits, expenditure, education, health, and female
empowerment.
In brief, they found out that nearly 27% of the eligible households in the treatment
area took up loans from Spandana or any other MFI by the time of the end-line
survey. They reported that 30% of Spandana borrowers reported that they used
loans for starting up a new business. Looking at the household use, 15% replied that
they took it to buy durable good and 15% to smooth household consumption.
Coming to the expenditure, they found varying results depending on the pattern of
the different groups. Those with an existing business bought more number of
durable goods for their home and for the businesses. Those most likely to start a new

Candidate Number: 122783
25
business cut back sharply on temptation goods (like tobacco, alcohol, cigarettes, etc.)
and invested more.
Further, they found no significant evidence on education al outcomes and health
outcomes. No evidence was found to suggest that microcredit empowers women as
women in the treated area were no more likely to take household decisions about
spending, investment, savings or education.
Hence, my study takes up this dataset, to look at the increase in social expenditure
compared to expenditures on health and education. I will focus on the link between
microcredit and social expenditure; and look at whether there are any changes to
social expenditure when taken as a percentage of expenditures on health and
education. Further, I will discuss the descriptive statistics of the whole data before
conducting my regression analysis.
4.4 Descriptive Statistics
This section looks at the descriptive statistics differentiated across treated and
control groups both at the baseline and endline levels. The below chart 1 looks at the
differences between treated and control groups among social expenditures as well as
on health and education expenditure at baseline. We find that there is no difference
with respect to spending on health and education among the two groups.
Households tend to spend more on festivals, other ceremonies and funerals when in
treated than in control.

Candidate Number: 122783
26
Chart 1: Unadjusted treated-control difference for social expenditures
Having looked at the unadjusted effects of being in treated area, now I will look at
the adjusted difference referring to endline data. The data is adjusted along with the
regression model used, where area id, household id, number of members in a
household were the control variables. The chart 2 looks at health, education and
social expenditures in relative terms when measured per capita in monthly terms.
The number of observations is different, suggesting that there are missing values.
Clearly, we can see marked difference between the treated and control groups for
various expenditures, when the dataset is unadjusted to any control variables. To
give a clear insight, a t-test of the mean difference has been performed to look at the
significance of this difference between the groups.
Chart 2: Adjusted treated-control difference for social expenditures
0
0.5
1
1.5
2
2.5
3
3.5
Health Education Festivals Funeral Weddingsother ceremonies
Treated
Control

Candidate Number: 122783
27
When looked at relative (taken as a percentage of total expenditure) health and
education expenditures, there was no difference between the two groups.
Households in treated and control groups spend equal amounts when it comes to
health expenditure. From the t-tests, we found no significant results for the mean
difference between the treated and control groups.
Relative festival expenditure in per capita terms, shows only 0.62% difference
between the treated and control areas. The mean difference t-test shows that there
is a highly significant difference in expenditure on festivals when people receive
income in the form of loans from Microfinance Institutions such as Spandana. The
same applies to relative Funeral expenditure, there is no significant difference
between the treated and control groups.
Wedding expenditure and other ceremony expenditures show a remarkable increase
in treated areas rather than control areas. The mean difference was significant at 1%
level of significance. Other ceremony expenditures shot up by nearly 15% in treated
areas as compared to non-treated areas.
Having, looked at the summary statistics, we now run our regressions to see whether
there holds any significant difference between the treated and control areas when it
comes to social expenditure. The next section would evaluate the regression results.
5. Methods In order to look at the difference between treated and control areas, the borrowing
is expected to be higher in treated areas from MFIs as compared to control group.
Hence, the ITT estimates measures the averaging differences in both areas over
customers and non-customers of the MFIs. The formal model32 used is:
.....................................1
Where is the outcome variable for household ‘i’ in area ‘a’; is a dummy
variable which takes a value one if the household is in treatment area (meaning that
32
Banerjee, Abhijit V., Esther Duflo, Rachel Glennerster, and Cynthia Kinnan (2010). “The Miracle of
Microfinance? Evidence from a Randomized Evaluation.” Cambridge, Mass.: J-PAL and MIT, June.
Candidate Number: 122783
28
household has borrowed from MFI) and takes a value zero if the household is in
controlled group (meaning household didn’t borrow from MFI); basically it talks
about the household living in the treated area. Here the MFI is Spandana. The
looks at the control variables, which have to be taken into consideration while
performing the regressions such as area id, household id, household size, etc. The ITT
estimate is given by . The coefficient in percentage points gives the differences in
outcome variable ‘y’ between treatment and control groups.
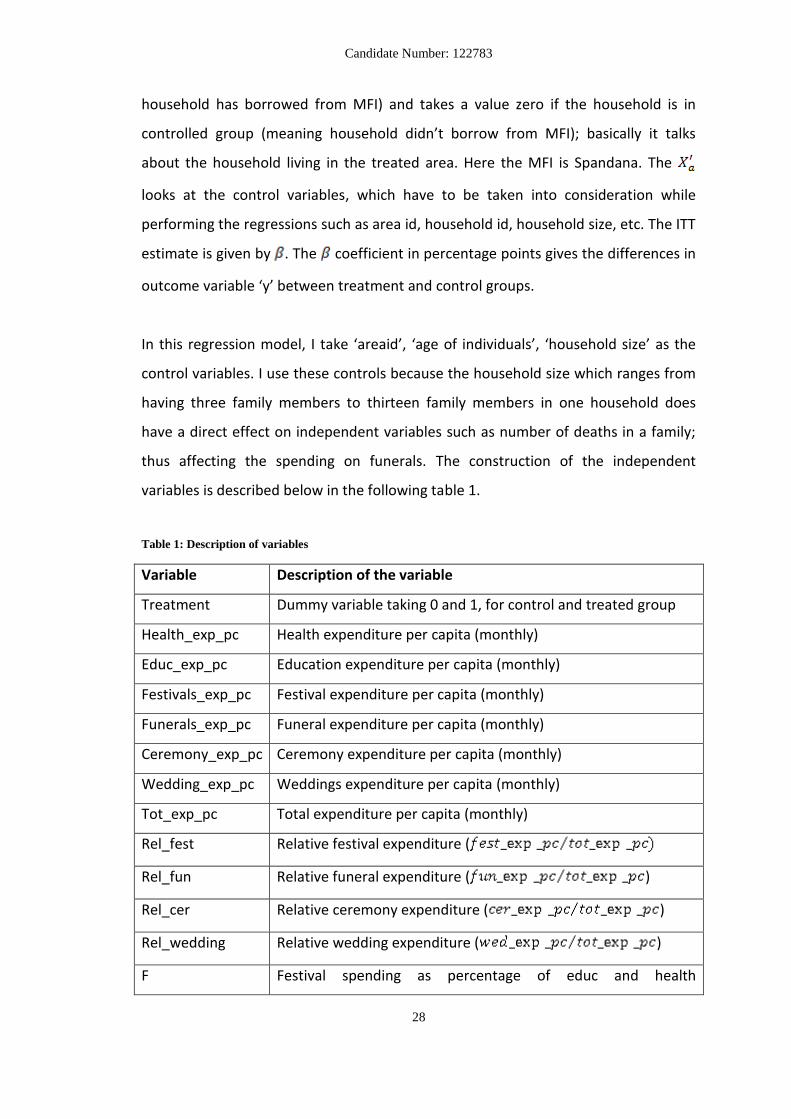
In this regression model, I take ‘areaid’, ‘age of individuals’, ‘household size’ as the
control variables. I use these controls because the household size which ranges from
having three family members to thirteen family members in one household does
have a direct effect on independent variables such as number of deaths in a family;
thus affecting the spending on funerals. The construction of the independent
variables is described below in the following table 1.
Table 1: Description of variables
Variable Description of the variable
Treatment Dummy variable taking 0 and 1, for control and treated group
Health_exp_pc Health expenditure per capita (monthly)
Educ_exp_pc Education expenditure per capita (monthly)
Festivals_exp_pc Festival expenditure per capita (monthly)
Funerals_exp_pc Funeral expenditure per capita (monthly)
Ceremony_exp_pc Ceremony expenditure per capita (monthly)
Wedding_exp_pc Weddings expenditure per capita (monthly)
Tot_exp_pc Total expenditure per capita (monthly)
Rel_fest Relative festival expenditure (
Rel_fun Relative funeral expenditure ( )
Rel_cer Relative ceremony expenditure ( )
Rel_wedding Relative wedding expenditure ( )
F Festival spending as percentage of educ and health

Candidate Number: 122783
29
( )
C Ceremony spending as percentage of educ and health
( )
W Wedding spending as percentage of educ and health
( )
Fun Funerals spending as percentage of educ and health
( )
6. Results The effect of the treatment on the dependent variables is shown in table 2. We run
the regressions both in terms of absolute expenditures and in terms of relative
expenditures. The control variables of the regressions were ‘area id’, ‘household size’
and ‘age of the individuals’. The results are subject to a number of observations
when the dataset was clustered by areas into 23 areas.
Table 2: Treatment coefficients in regression models for social, health and education expenditures
Dependant Variable Treatment coefficient
Health expenditure -3.22
Education expenditure 4.45
Festival expenditure -8.14***
Funeral expenditure 43.51
Wedding expenditure 942.1**
Other ceremony expenditure 185.9***
From the above table 2, consistent with Banerjee and Duflo’s findings, we find no
significant impact on health and education expenditure when measured in monthly
terms per capita when the household is being treated by the microfinance program
offered by Spandana. In fact, being in the treated reduces the expenditure on health

Candidate Number: 122783
30
as compared to control group. The difference in the number of observations is due to
missing values and the regressions being controlled for area id.
Coming to social expenditure, the stand out results show that festival expenditure
and ceremony expenditure are highly significant. Hence, being in the treated area
decreases the festival expenditure by 8 rupees per capita as compared to households
who did not receive microfinance from Spandana. Similarly, households in the
treated area, when received more funds spent more on other ceremonies for both
social and individual satisfaction. Thus, they spend approximately 185 rupees per
capita if they were treated with microfinance. The t-values of both these variables
are significant at the one percent level of significance.
As previously noticed that weddings did play a significant role, looking at the
regression, there is a 1% level of significant difference in spending on weddings when
households are treated with microfinance. Overall expenditure on wedding
ceremonies increases by nearly 942 rupees per capita (measured in monthly terms)
when treated as compared to control groups.
In our next table 3, we run the regression on looking at relative expenditures- looking
at social expenditures relative to total expenditure; on the interested variables. The
results for health and education in relative terms remain the same, being
insignificant. As funeral expenditure is mostly considered to be sudden expenditure,
overall it only leads to 4% increase when in treated as compared to control groups.
After controlling for household size and age of the individuals in the household, there
is no significant difference between the two groups. Most prominent and significant
results are that of relative festival expenditure and relative ceremony expenditures.
Both of them are highly significant at the one percent level of significance. The
festival expenditure in relative terms to total expenditure per capita reduces by 0.6%.
Relative ceremony expenditures too are significant showing that households spend
on weddings more lavishly when they are treated with microfinance as compared to
non-treated areas. It increases by nearly 16% per capita. This further explains the
reason being social status and higher social returns in future when there are more
funds in individual’s pocket.
Candidate Number: 122783
31
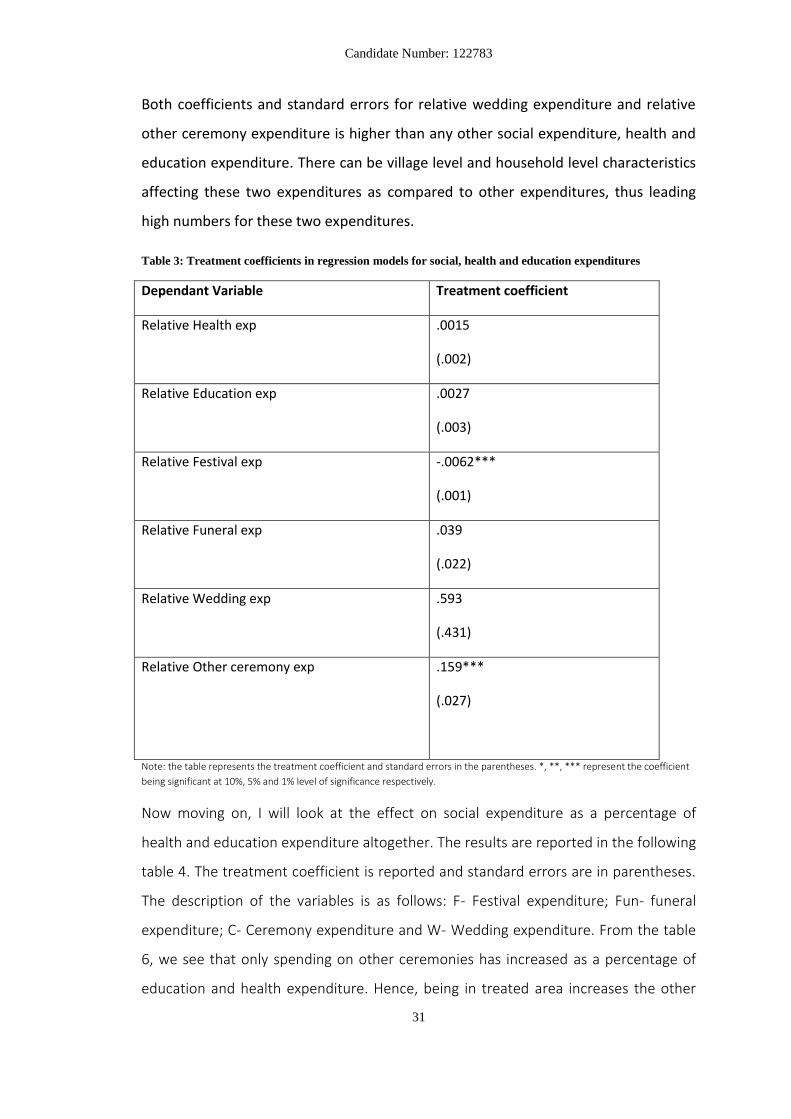
Both coefficients and standard errors for relative wedding expenditure and relative
other ceremony expenditure is higher than any other social expenditure, health and
education expenditure. There can be village level and household level characteristics
affecting these two expenditures as compared to other expenditures, thus leading
high numbers for these two expenditures.
Table 3: Treatment coefficients in regression models for social, health and education expenditures
Dependant Variable Treatment coefficient
Relative Health exp .0015
(.002)
Relative Education exp .0027
(.003)
Relative Festival exp -.0062***
(.001)
Relative Funeral exp .039
(.022)
Relative Wedding exp .593
(.431)
Relative Other ceremony exp .159***
(.027)
Note: the table represents the treatment coefficient and standard errors in the parentheses. *, **, *** represent the coefficient
being significant at 10%, 5% and 1% level of significance respectively.
Now moving on, I will look at the effect on social expenditure as a percentage of
health and education expenditure altogether. The results are reported in the following
table 4. The treatment coefficient is reported and standard errors are in parentheses.
The description of the variables is as follows: F- Festival expenditure; Fun- funeral
expenditure; C- Ceremony expenditure and W- Wedding expenditure. From the table
6, we see that only spending on other ceremonies has increased as a percentage of
education and health expenditure. Hence, being in treated area increases the other

Candidate Number: 122783
32
ceremony expenditure by 1.82 as compared to control groups. The festivals, funerals
and Wedding expenditures do not show any significant increases as percentage of
education and health.
Table 4: Treatment coefficients in regression models for social expenditures
Dependant Variable Treatment coefficient
F .022
(.079)
Fun -.036
(.49)
C 1.82***
(.59)
W 13.44
(7.69)
Note: the table represents the treatment coefficient and standard errors in the parentheses. *, **, *** represent the coefficient
being significant at 10%, 5% and 1% level of significance respectively.
I also run regressions to see whether having male or female head of household
effects the social, health and education expenditure. From the regression results, we
find no evidence of significant changes in health, education, weddings and funeral
expenditures having either a female or a male head of the given household. Only
when it comes to other ceremonies, male lead household spend more as compared
to female led households.
Having looked at the regressions, the results are somewhat disturbing. We want to
know whether social spending has increased to a level that affects the other
outcomes of the households. To look at the heterogeneity in the expenditure pattern
of the households, we run quantile regressions to disseminate the expenditure
between different income clusters. We also run quantile regressions to see whether
there are any differences in social expenditures with respect to difference in total
amount of outstanding loan from Spandana, total amount of outstanding loan from

Candidate Number: 122783
33
other MFIs and religion. The next section looks at the quantile regressions and sees
whether these results hold true.
6.1 Quantile Regressions In microfinance impact literature, what we find is that microfinance affects the less
poor. Hulme and Mosley (1996) study the fact that microfinance only helps the poor
who are more influential and better off the villagers. Here, the case is somewhat
similar. Spandana’s microfinance program did not reach the poorest of the poor but
affected the standard of living of the ‘richest’ of the poor.
To look at the effect of microfinance with the increase in income and expenditure
accordingly, we run quantile regressions. In order to study the possibility of
heterogeneity impact across the distribution of the dependent variable, we use
quantile regression. It started with Koenkar and Basset (1978) who looked at the
importance of quantile regression in disseminating the data into parts. Quantile
regressions are helpful to look at the effect of the independent variable on different
levels of the dependent variable, say for instance different levels of log wage or log
income.
The linear regressions that were estimated before, gave results considering the
whole sample. However, there can be flaws due to the presence of heterogeneity
among the variables and its relation to the dependent variables. Hence, by quantile
regressions, we can look at the effect of microfinance for the whole sample in small
quintiles or look at the differences at different points of the distribution. A graphical
representation is adopted here, where at first, the dependent variable was divided
into categories and then for each category, the regressions were performed and
analysed.
The dependent variable that we are interested in is the income that households
receive per month. We want to see the difference between the spending pattern on
social occasions depending upon the income and being in the treated area. The
following graphs represent the quantile regressions and OLS (Ordinary Least Square)
regressions for spending pattern on social occasions. In the figures below, the bold

Candidate Number: 122783
34
dotted line represents the OLS regression, the green line is the quantile regression
line. The small dotted line around the OLS regression is the confidence interval that
the coefficient will lay within the range. The grey shaded area is the confidence
interval with respect to quantile regressions.
Figure 3: Quantile graphs for social expenditures
The four figures show the impact of microfinance at different levels of income for the
respective social occasion spending. For festival expenditure, from OLS regression,
we found that there is a significant impact when households are in treated area as
compared to control group. Here with quantile regression, we see that for low levels
of income, the spending on festivals is not different and similar to that of OLS
regression results. However, at for the households who received higher income and
were in 75% quantile, they tend to spend more on festivals. This is visible by the
upward trend in expenditure (green line) and highly significant from OLS regressions.
Further, this can be noticed by the coefficient estimates on festivals being not able to
fit in the confidence interval of the OLS regression.
I also run quantile regressions to look at the impact of microfinance at different
levels of outstanding loans for the respective social occasion spending. We find that
there is no significant difference on spending pattern at lower quintiles, i.e. to say
Candidate Number: 122783
35
where the outstanding loan amount was almost nil. Coming to higher quantiles, we
find that expenditures on ceremonies and weddings shoot up showing some
significant difference from OLS regressions. For funerals and festivals, we do not find
any significant difference from OLS regression.
Similarly, we also run quantile regressions to see whether there are any differences
with respect to different amount of outstanding loan from all other MFIs on social
occasion expenditures. The results show that for all social expenditure variables
there is no significant difference between OLS and quantile with lower amounts of
outstanding loans. It means that having nil amount of outstanding loan with other
MFIs did not have any effect on expenditure pattern on social occasions. For higher
quantiles, we find that festivals, ceremonies and wedding expenditures fall but still
lay within the confidence interval of OLS regressions suggesting no difference. The
same is with the case with funeral, but here the expenditure on funerals show an
upward trend at higher quantiles. This suggests the fact that funerals are sudden
expenditures and thus mounts to this difference.
Similarly, I ran regressions to look at whether religion has an effect on spending on
social expenditures. From the regressions, we find no difference between treated
and control groups with respect to different religions.
As per the regressions, we find significant influences overall for festivals, weddings
and other ceremonies; but here we find insignificant results. Most of the coefficients
lie within the confidence interval and are not significantly different from being in
treated and control areas. This is because, for low-income households among the
poor, even if there are social pressures, they tend not to spend much on social
occasions. However, looking at the households with higher income, they spend a
significant amount of social occasions, but different from being treated with
microfinance.

Candidate Number: 122783
36
7. Conclusions This dissertation examines to see the impact of microfinance on social expenditure. It
uses data from one of the longest running evaluation of microcredit intervention,
covering 103 slums in Hyderabad and providing a sample size of 2800 households.
The possibility that microcredit may have unintended effects on social expenditure
has been hypothesized in the literature. ‘It has been documented that poor people in
the developing world spend a large amounts on weddings, dowries, and christenings,
probably in part as a result of the compulsion not to lose face’- Poor Economics
(2011). Poor households may even spend more on social occasions relative to other
expenditures such as in health care services and educational facilities due to social
pressures. For example, evidence from rural South African suggests that increased
expenditure on social events may be an important contributing factor for countries
to acquire more debt.33
To support the hypothesis, we constructed a model to look at the ITT estimates; and
run regressions given the outcome variable and the control variables. The interesting
part was to find varied results on wedding ceremonies, even though prima face loan
takes up for weddings was higher as compared to any other reason. In relative terms,
it was significant, but after constructing quantile regressions, we do not find any valid
difference. This could be the case that, poor household’s tend to borrow for
weddings from more non-institutionalised organisations such as local moneylenders,
friends, family and relatives. Another reason could also be the interest rates attached
to the amount of money being taken as loans. MFIs and other regulated agencies do
charge a certain rate of interest, which may be a burden for the poor household to
bear and repay the loan on time. This argument is supported in Banerjee and Duflo’s
(poor economics) observation of how it is not possible for the MFIs and regulated
authorities to look at the conditions of the poor people who are unable to make
repayments on time due to sudden expenses such as ill health or sudden death of
‘bread-earner’ of the household.
33
This dissertation does not examine the impact of debt, due to data limitations.

Candidate Number: 122783
37
Another interesting result was to look at the festival expenditures. It did not have a
positive effect and this was significant in all cases. As income increases, people spent
less on festivals, which is in stark contrast to our hypothesis. In addition, the festival
expenditure as a percentage of expenditure in health and education too did not
show any significant difference. By looking at the quantile regressions, more income
led to more spending on festivals and it is quite different from OLS results. However,
with funerals and other ceremony expenditures, even though being significant with
basic OLS regressions, in quantile regression the results seem to be insignificant.
They were almost the same for each income strata. In some cases, it actually
declined at higher quartiles. The quantile regressions for total amount of outstanding
loan too did not affect the pattern of changes in social expenditure at lower
quartiles, but at higher quartiles, we do find significant differences.
This dissertation has limitations subject to available data. The major hurdle in this
research is to look at the effect of microfinance on social expenditures via social
pressures. Measuring social pressure is one of the difficulties of this research.
Banerjee and Duflo conclude that ‘there is restricted consumption of festivals,
temptation goods and expenditures on parties’- to this, here we look at the other
dimensions of social expenditure and do find high significant results. Also, the results
are subject to endline 1 data and endline 2 data has not been taken up in this
dissertation.
The title of this research suggests, “spending on social events through microfinance”-
we do find increases in wedding expenditure, and other ceremonies expenditure due
to social pressure and no impacts on either health or education in the case of
borrowing from Spandana. However, other sources of money lending have helped
people spend more on social obligations. This suggests that further research has to
be conducted to look deeper into the expenditures on social events, and examine
why the microfinance institutions are not inclined to provide such credit, whereas
unregulated moneylenders are. The view of microfinance and social expenditure has
to be further researched upon to understand the causal link between the two.

Candidate Number: 122783
38
8. References Books
Beatriz Armendáriz, Marc Labie “The handbook of Microfinance”.Published by World Scientific Publishing Co. Pte. Ltd. Proceedings(2012) “International Scientific Symposium on Food and Nutrition Security information: from Valid Measurement to Effective Decision Making” Rome, 17-19 January
Research Papers
Alessandro Tarozzi & Jaikishan Desai & Kristin Johnson(2013) "On the impact of microcredit: Evidence from a randomized intervention in rural Ethiopia," Economics Working Papers 1407, Department of Economics and Business, Universitat Pompeu Fabra. Banerjee, Abhijit V., Esther Duflo, Rachel Glennerster, and Cynthia Kinnan (2010). “The Miracle of Microfinance? Evidence from a Randomized Evaluation.” Cambridge, Mass.: J-PAL and MIT, June. Banerjee, A. Mullainathan, S. “The shape of Temptation: Implications for the economics lives of the poor”. CEPR Discussion Papers 7828, C.E.P.R. Discussion papers. 2010 Brown, Philip H., Erwin Bulte, and Xiaobo Zhang. 2011. “Positional Spending and Status. Seeking in Rural China.” Forthcoming, Journal of Development Economics. Chen, Xi (2011): Accounting for social spending escalation in rural China, IAMO Forum, No. 6 Chen,Xi.( 2013) “Essays on Social Networks: Relative Concerns, Social Interactions, and Unintended Consequences.” American Journal of Agricultural Economics Advance Access published September 7, Chen, X. and X. Zhang. 2010. “Costly Posturing: Relative Status, Ceremonies and Early Child Development,” working paper, Cornell University. Christopher, Dunford. “Sustainable Integration of Microfinance and Education in Child Survival, Reproductive Health, and HIV/AIDS Prevention for the Poorest Entrepreneurs” Journal of Microfinance, Volume 3 Number 2. Cynthia Werner.(1997) “Marriage, Markets, and Merchants: Changes in Wedding Feasts and Household Consumption Patterns in Rural Kazakstan” Culture & Agriculture Vol. 19, Nos. 1/2 Spring/Summer De La Cruz N1, Crookston B, Gray B, Alder S, Dearden K.(2009) “Microfinance against malaria: impact of Freedom from Hunger's malaria education when delivered by rural banks in Ghana.” Trans R Soc Trop Med Hyg. 2009 Dec;103(12):1229-36. doi: 10.1016/j.trstmh.2009.03.018. Epub Apr 23. Dekker, M. and H. Hoogeveen. 2002. “Bridewealth and Household Security in Rural Zimbabwe,” Journal of African Economies 11(1): 114‐145.

Candidate Number: 122783
39
Dohn AL, Chávez A, Dohn MN, Saturria L, Pimentel C(2004) “Changes in health indicators related to health promotion and microcredit programs in the Dominican Republic”. Revista Panamericana de Salud Pública. 2004;15(3):185- 93. Dr. Md. Tarique& Ranjan Kumar Thakur(2007) “growth of micro-credit in india: an evaluation” .90th Conference volume of Indian Economic Association, 2007. Dupas, Pascaline, and Jonathan Robinson (2011) “Savings Constraints and Microenterprise Development: Evidence from a Field Experiment in Kenya.” NBER Working Paper No. 14693. Cambridge, Mass.: National Bureau of Economic Research. Elizabeth Littlefield, Jonathan Murduch, and Syed Hashemi.(2003) “Is Microfinance an Effective Strategy to Reach the Millennium Development Goals?” January Florencia Castro-Leal, Julia Dayton,Lionel Demery, Kalpana Mehra.(1999) “Public Social Spending in Africa: Do the Poor Benefit?”The World Bank Research Observer, vol. 14, no. 1 (February), pp. 49-72 Gertler, P., Levine, D. I. and Moretti, E. (2009), “Do microfinance programs help families insure consumption against illness?” Health Econ., 18: 257–273. doi: 10.1002/hec.1372 H. A. Aklilu &C. J. M. Almekinders &H. M. J. Udo &A. J. Van der Zijpp(2007). “Village poultry consumption and marketing in relation to gender, religious festivals and market access”. Trop Anim Health Prod 39:165–177 DOI 10.1007/s11250-007-9002-8 Jessica, Goldberg.(2011) “The Lesser of Two Evils: The Roles of Social Pressure and Impatience in Consumption Decisions”. December, Jonathan Bauchet, Cristobal Marshall, Laura Starita, Jeanette Thomas, and Anna Yalouris(2011); “Latest findings from randomized evaluations of Microfinance” Access to Finance Forum Reports by CGAP and Its Partners No. 2, December Jorge H. Maldonado, Claudio González-Vega Vivianne Romero.(2003) “The Influence of Microfinance on the Education Decisions of Rural Households: Evidence from Bolivia”. Paper prepared for presentation at the Annual Meeting of the American Agricultural Economics Association Montreal, Canada July 27-30, Katsushi S. Imai, Thankom Arun and Samuel Kobina Annim.(2010) “Microfinance and Household Poverty Reduction: New Evidence from India” World Development Vol. 38, No. 12, pp. 1760–1774, Khandker SR.(2005) “Micro-finance and poverty: evidence using panel data from Bangladesh”. World Bank Econ Rev;19:263–86. doi:10.1093/wber/lhi008 Khandker, S. (2001). “Does micro-finance really benefit the poor? Evidence from Bangladesh” Paper delivered at the Asia and Pacific Forum on Poverty: Reforming Policies and Institutions for Poverty Reduction, 5–9 February. Mahabub Hossain(1988). “Credit Alleviation of Rural Poverty: The Grameen Bank in Bangladesh” Research Report 65International Food Policy Research InstituteIn collaboration with the Bangladesh Institute of Development Studies February,

Candidate Number: 122783
40
Mango N, Kristjanson P, Krishna A, Radeny M, Omolo A and Arunga M. 2009. “Why is it some households fall into poverty at the same time others are escaping poverty? Evidence from Kenya,” DP No. 16. ILRI (International Livestock Research Institute), Nairobi, Kenya. Michael Bittman(1999) “Social Participation and Family Welfare: The Money and Time Costs of Leisure”, University of New South Wales, Social Policy Research Centre. Michelle Adato , Professor Michael R. Carter & Julian May (2006) “Exploring poverty traps and social exclusion in South Africa using qualitative and quantitative data”, The Journal of Development Studies, 42:2, 226-247, DOI: 10.1080/00220380500405345 Nathalie, Holvoet. “Impact of Microfinance Programs on Children’s Education. Do the gender of the borrower and the delivery model matter?” Journal of Microfinance, Volume6 Number2. Nazli Kibria. (1995) “Culture, Social Class, and income control in the lives of women garment workers in Bangladesh” Gender & Society June vol. 9 no. 3 289-309 Niels Hermes, Robert Lensink(2011) “Microfinance: Its Impact, Outreach, and Sustainability”. World Development Vol. 39, No. 6, pp. 875–881 Pascaline Dupas and Jonathan Robinson,(2013) “Why Don’t the Poor Save More? Evidence from Health Savings Experiments” American Economic Review 103(4): 1138–1171 Price Variation and Social Status in Rural India, The Journal of Development Studies, 38:1, 71-97, DOI: 10.1080/713601102 Pronyk PM, Hargreaves JR, Kim JC, Morison LA, Phetla G, Watts C et al.(2006) “Effect of a structural intervention for the prevention of intimate-partner violence and HIV in rural South Africa: a cluster randomised trial” Lancet ;368:1973–83. doi:10.1016/S0140-6736(06)69744-4 PMID:17141704 Rushidan Islam Rahman and Shahidur R. Khandker(1994). “Role of Targeted Credit Programmes in Promoting Employment and Productivity of the Poorin Bangladesh”.The Bangladesh Development Studies, Vol. 22, No. 2/3, Women, Development and Change (June-Sept. ) pp. 49-92 Sheila Leatherman & Christopher Dunford.(2010) “Linking Health to Microfinance to reduce Poverty.” Bull World Health Organ;88:470–471 | doi:10.2471/BLT.09.071464 Smith, Stephen C.(2002) “Village banking and maternal and child health: Evidence from Ecuador and Honduras” World Development 30, 707-723. T.Paul, Schultz. “The role of education and human capital in economic development: An empirical Assessment.” Yale University, August 1992. Centre Discussion Paper no.670 Thierry van Bastelae.(2000) “Does Social Capital Facilitate The Poor’s Access To Credit?A Review Of The Microeconomic Literature”. Social Capital Initiative Working Paper No. 8. The World BankSocial Development Family Environmentally and Socially Sustainable Development Network February.
Candidate Number: 122783
41
Todd R. Stinebrickner Ralph Stinebrickner(2007). “The effect of credit constraints on the college drop-out decision: A Direct approach using a panel study” NEBR working paper 13340. National Bureau of Economic Research, 1050 Massachusetts Avenue Cambridge, MA 02138. August. V. Rao; “Poverty and Public Celebrations in India” Development Research Group The World Bank 1818 H Street NW Washington, DC 20433 Vijayendra, Rao(2001). “Celebrations as Social Investments: Festival Expenditures, Unit Price Variation and Social Status in Rural India.” The Journal of Development Studies, Vol38, No.1, October, pp, 71-97. Published by Frank Cass, London. Xi Chen, Ravi Kanbur, Xiaobo Zhang(2001) “Peer effects, Risk Pooling, and Status Seeking: What Explains Gift spending escalation in rural china?” December
Reports “Integrated Health and Microfinance in India: Harnessing the Strengths of Two Sectors toImprove Health and Alleviate Poverty”State of the Field of Integrated Health and Microfinance in India, 2012. “Status of Microfinance in India”- 2013-13. Printed and Published by National Bank for Agriculture and Rural Development, Head office, Bandra, Mumbai. “Study on the Drivers of Over-Indebtedness of Microfinance Borrowers in Cambodia: An In-depth Investigation of Saturated Areas”.Final ReportDannet Liv. Cambodia Institute of Development Study;March 2013 Barnes, C., Keogh, E., & Nemarundwe, N. (2001b). “Microfinance program clients and impact: An assessment of Zambuko Trust Zimbabwe” Washington, DC: Assessing the Impact of Microenterprise Services (AIMS). Metcalfe, M., S.Leatherman with C. Dunford, B. Gray, M. Gash, M. Reinsch and C. Chandler. (2010).”Health and microfinance:leveraging the strengths of two sectors to alleviate Poverty”. Freedom from Hunger Research Paper No.9, p. 27.