Speech Enhancement Algorithm to Reduce the Effect of Background Noise in Mobile Phones
13
International Journal of Wireless & Mobile Networks (IJWMN) Vol. 5, No. 1, February 2013 DOI : 10.5121/ijwmn.2013.5114 177 Speech Enhancement Algorithm to Reduce the Effect of Background Noise in Mobile Phones Premananda B S 1 and Dr. Uma B V 2 1 Department of Telecommunication Engineering, R.V. College of Engineering, Bangalore, India. [email protected] 2 Department of Electronics and Communication Engineering, R.V. College of Engineering, Bangalore, India. [email protected] ABSTRACT In mobile phones, perceived quality of speech signal deteriorates significantly in the presence of background noise since near-end/surrounding noise also arrives at the near-end listener’s ears. The quality of the received signal varies widely depending upon signal strength and unavoidable background noise in the user environment. There is a need to improve the quality of received speech signal in noisy conditions by developing the speech enhancement algorithms. This paper focuses on the impact of the various background noises on signal degradation and mechanisms to mitigate the noise impact for improved speech signal perception. Gain adjustment process with simple time domain and frequency domain approach using psychoacoustic has been adapted to improve the quality and intelligibility of the speech signal in the noisy environments by automatically enhancing the speech signals when the noise dominates. Time domain approach is less complex and frequency domain using psychoacoustic is more efficient in overcoming the degradation of speech signals in presence of near-end or background noise. KEYWORDS Absolute Threshold of Hearing, Background noise, Degradation, Gain, Psychoacoustic, Speech enhancement. 1. INTRODUCTION Mobile phones are essential component of day to day life and have become the best friend of a person. Day by day they are becoming very affordable making the communication infrastructure as the backbone of daily life. Background noise is a natural part of a conversation. A high background acoustic noise level is annoying to the listener side. Listener fatigue (the ears get tired) and difficult to understand each other. Considerable attention has been paid over the past decade for the enhancement of speech degraded by additive background noise [6]. Listening to speech or audio signals becomes more difficult as the background noise level dominates. The near-end listener perceives a combination of the clean far-end (downlink) speech and the background noise from the near-end and thus experiences an increased listening effort. As the noise signal cannot be influenced, a reasonable approach is to manipulate the clean far-end speech signal depending on the local background noise. Hence, there is a strong need to improve the quality of the speech signal in noisy conditions by developing speech enhancement algorithms to minimize the effect of background noise. In the gain adjustment process the quality of the speech signal in noisy environment is improved by automatically adjusting the output level when the background noise exceeds the noise masking threshold.
-
Upload
independent -
Category
Documents
-
view
0 -
download
0
Transcript of Speech Enhancement Algorithm to Reduce the Effect of Background Noise in Mobile Phones

International Journal of Wireless & Mobile Networks (IJWMN) Vol. 5, No. 1, February 2013
DOI : 10.5121/ijwmn.2013.5114 177
Speech Enhancement Algorithm to Reduce the
Effect of Background Noise in Mobile Phones
Premananda B S 1 and Dr. Uma B V
2
1Department of Telecommunication Engineering,
R.V. College of Engineering, Bangalore, India.
2Department of Electronics and Communication Engineering,
R.V. College of Engineering, Bangalore, India.
ABSTRACT
In mobile phones, perceived quality of speech signal deteriorates significantly in the presence of
background noise since near-end/surrounding noise also arrives at the near-end listener’s ears. The
quality of the received signal varies widely depending upon signal strength and unavoidable background
noise in the user environment. There is a need to improve the quality of received speech signal in noisy
conditions by developing the speech enhancement algorithms. This paper focuses on the impact of the
various background noises on signal degradation and mechanisms to mitigate the noise impact for
improved speech signal perception. Gain adjustment process with simple time domain and frequency
domain approach using psychoacoustic has been adapted to improve the quality and intelligibility of the
speech signal in the noisy environments by automatically enhancing the speech signals when the noise
dominates. Time domain approach is less complex and frequency domain using psychoacoustic is more
efficient in overcoming the degradation of speech signals in presence of near-end or background noise.
KEYWORDS
Absolute Threshold of Hearing, Background noise, Degradation, Gain, Psychoacoustic, Speech
enhancement.
1. INTRODUCTION
Mobile phones are essential component of day to day life and have become the best friend of a
person. Day by day they are becoming very affordable making the communication infrastructure
as the backbone of daily life. Background noise is a natural part of a conversation. A high
background acoustic noise level is annoying to the listener side. Listener fatigue (the ears get
tired) and difficult to understand each other. Considerable attention has been paid over the past
decade for the enhancement of speech degraded by additive background noise [6]. Listening to
speech or audio signals becomes more difficult as the background noise level dominates. The
near-end listener perceives a combination of the clean far-end (downlink) speech and the
background noise from the near-end and thus experiences an increased listening effort. As the
noise signal cannot be influenced, a reasonable approach is to manipulate the clean far-end
speech signal depending on the local background noise. Hence, there is a strong need to
improve the quality of the speech signal in noisy conditions by developing speech enhancement
algorithms to minimize the effect of background noise. In the gain adjustment process the
quality of the speech signal in noisy environment is improved by automatically adjusting the
output level when the background noise exceeds the noise masking threshold.

International Journal of Wireless & Mobile Networks (IJWMN) Vol. 5, No. 1, February 2013
178
The traditional noise cancellation algorithms cannot be used as the near-end noise directly
arrives at the near-end listener’s ears. The approaches proposed for far-end noise cancellation
discussed in literature [1], [2], [3], [4] are not suitable. In the subtractive-type approach
proposed by Virag [1], a psychoacoustic model was used to guide the derivation of the spectral
subtractive parameters. Jeon Yu-young et al. discusses about the compensation for partial
masking effect [5]. Several approaches to mitigate the background (near-end) noise using
speech enhancement are discussed by Bastian et al. [6], [7], [8], [9] and Jong Won Shin et al.
[10], [11], [12]. Speech intelligibility improvement in presence of near-end noise and loud-
speaker output power constraint are discussed in [6], [7]. Perceptual speech reinforcement based
on partial specific loudness is discussed in [10], [11] focuses on mitigating near end noise at the
speaker not at the receiver. Psychoacoustic model in frequency domain approach using wavelet-
threshold multitaper magnitude spectra as alternate to Fast Fourier Transform (FFT) was
incorporated by Yi Hu [13]. The speech enhancement methods today are more exploiting the
auditory masking properties of human [3]. Many approaches discussed above have not fully
exploited the psychoacoustic approach for speech enhancement in presence of near-end noise.
The paper is organized as follows: In section 2, proposed time domain approach is described
with implementation details and results. Section 3, describes the proposed frequency domain
approach using psychoacoustic with the implementation details and results. Comparison results
of both the approaches are discussed in Section 4, and the conclusions are given in Section 5.
2. PROPOSED TIME DOMAIN SPEECH ENHANCEMENT METHOD
This paper proposes a method to overcome the relative degradation of the speech signal in the
noisy environment. In order to retain the signal quality in the noisy environment different
algorithms have been proposed and implemented in [6-9], but the complexity involved in
determining the gain seems to be unresolved. In this paper a concept which is simple to analyze
and implement in real time is presented. A multiplier is required to enhance the speech signals
degraded in the presence of background noise. As the speech and noise signals are dynamic it is
difficult to find a constant multiplication factor (MF) for the incoming signal. Thus the signal
strength and noise present in the environment is to be analyzed. The speech signal is to be
amplified by applying a dynamically varying gain depending upon the different parameters of
speech and noise signal. The external volume control of the devices can’t be used for this
purpose as it is painful.
Block diagram of the proposed time domain approach is shown in the figure 1. Energy of
the downlink speech signal and near-end noise signal is computed. By comparing energy of
both the speech and noise signals, gain/MF is computed for enhancing the speech signal. Gain
obtained is multiplied with speech (element by element) signal to get enhanced speech signal.
Fig. 1: Proposed time domain approach.
Background/Near-
End Noise (N)
Gain = f(S, N)
Incoming (downlink)
Speech Signal (S)
Output Speech
Signal (O)
Gain
Multiplier

International Journal of Wireless & Mobile Networks (IJWMN) Vol. 5, No. 1, February 2013
179
The sound energy is proportional to the square of the amplitude. Energy, EdB in decibels is
calculated using,
EdB =10 * log10 ∑(X2)/N (1)
where X is the amplitude of the speech signal and N, number of samples.
The Gain is to be adaptive for being effective in most of the scenarios. It can be modelled as,
Gain = ∑p
i=
ii xc1
(2)
where x1…xi…xp represent different parameters and c1…ci…cp represent different coefficients
to be derived corresponding to one or more of the above mentioned parameters.
The challenge lies in finding out the correct coefficients for adapting equation (2). Hit
and trial methods or human expertise can be utilized for setting these values, works for limited
categories of speech signals and noises.
2.1. Deriving the Gain
The correct gain/MF for a pair of speech and noise sample (selected parameters) is user
specific. System provides a mechanism for user to declare whether system generated MF (auto
gain) is acceptable or not. Such an assumption is easy to realize for most of the devices as
volume control can be used for the purpose. In figure 1, gain block calculates the amplification
factor/MF of speech signal in the presence of varying background noise which can dominate
the received speech signal as well. Different parameters of signal and noise (energy in the
present case) can be considered. In order to avoid the perceptual artefacts like clicks & pops
due to signal saturation/ overflows and signal bursts due to sudden gain changes, optimal gain
computed must be characterized by slow and configurable response time for the gain
variations.
The Gain is derived using the equation,
Gain = A + maximum (B, (C - D)) · E (3)
where A, B, C, D, and E are experimental constants. Value of A (default gain) is set to 1 so that
Gain =1 when no enhancement for the speech signal is required, B (default enhancement) is set
to 0. (C – D) is extent of noise over speech signal, (if negative no amplification is required), E
(compensation factor) is used to control the gain (<1).
When signal energy (SE) is sufficiently greater than noise energy (NE) then gain of 1 is
used so that no amplification is required, input signal buffer value will be copied to output
signal buffer. When SE is approximately equal to NE then gain is selected such that enhanced
speech signal is increased nearly by 1 dB. When SE is less than NE then gain is calculated using
eq. 3. Present frame gain/MF is compared with previous frame MF if the difference is more,
then current frame MF is adjusted to avoid sudden change in large gain to avoid click and pop
noise. If the hearing and perception choice of user varies with time, the proposed mechanism is
capable of capturing such alterations. If the amplification value exceeds the maximum loudness
[7] of the loud speaker [9] then end capping can be performed depending on minimum and
maximum values computed using,
Case-1: for +ve amplified value (AV)
AV = minimum (AV, 215
- 1) (4)
Case-2: for -ve amplified value (AV)
AV = maximum (AV, -215) (5)

International Journal of Wireless & Mobile Networks (IJWMN) Vol. 5, No. 1, February 2013
180
Signal buffer value can be overridden with new amplified value and output to output speech
signal buffer. Most mobile phone applications limit the overall power of the loudspeaker signal
to a constant maximum power instead of the power of the original signal.
2.2. Experimental Results
Algorithm has been verified for different speech signals with varying background (tapering,
hammer, parabolic type ...) noise signals. To illustrate a speech signal of 16-bit PCM with
sampling rate of 8 kHz with duration of 5 seconds is considered. The speech signal is captured
using an audio editor tool Gold Wave and saved in .wav format. The captured speech signal has
40000 (8000*5) samples, total samples are divided into frame size of 1024 each, resulting in 39
frames. Varying background noise (Fig. 2(b)) for 5 seconds, sampled at 8 kHz is captured using
an audio editor tool Gold Wave and saved in .wav format for experimenting and gain/MF are
calculated. Microphone in the mobile phones can be used to capture the background noise
signals. Experiment is performed by considering the difference in energy of background noise
(dB) and speech signal (dB). Figure 2 show the results obtained for varying background noise.
The speech signal in figure 2(a) corresponds to input (downlink) speech signal, figure 2(b)
represents noise signal whose amplitude is continuously decreasing, and figure 2(c) shows the
amplified speech signal in presence of noise where the gain is varied from 1 to 7.
Fig. 2(a): Original down linked speech signal.
Fig. 2(b): Varying background noise signal.
Fig. 2(c): Enhanced speech signal using time domain approach.
International Journal of Wireless & Mobile Networks (IJWMN) Vol. 5, No. 1, February 2013
181
Fig. 2(d): Enhanced speech signal using frequency domain approach.
Fig. 3: Variations of speech, noise, enhanced speech signal and gain/MF using
time domain approach.
Figure 2(c) reflects the variation in the amplification of speech signal based on changing noise
signals. Speech signal can be further enhanced by increasing the value of gain control, E in
equation 3 as desired. The obtained results are plotted in figure 3 to verify how dynamically
gain/MF is varied in accordance with speech and noise signals. Number of frames is indicated
in x-axis and y-axis indicates energy of the speech, noise & enhanced signal and variation of
gain w.r.t. speech and noise signal. For a gain of ≈ 7, when the noise signal is at maximum, the
speech signal energy is enhanced by ≈ 17 dB. Speech signal has enhanced to a maximum
energy of ≈ 82 dB.
3. PROPOSED FREQUENCY DOMAIN SPEECH ENHANCEMENT METHOD
3.1 Psychoacoustics
Psychoacoustics is the study of sound perception (including speech and music) [1], [7]. The
range of human hearing is about 20 Hz to 20 kHz and frequency range of the speech (voice) is
typically from 500 Hz to 4 kHz. The dynamic range of sound (ratio of the maximum sound
amplitude to the quietest sound that can be heard), is of the order of about 120 dB [14]. Equal-
loudness contours indicate the sound pressure level (dB), over the range of audible frequencies,
which are perceived as being of equal loudness. Equal-loudness contours were first measured by
Fletcher and Munson using pure tones reproduced via headphones, and the data collected are
called Fletcher-Munson curves.
Speech enhancement methods today are more often exploiting the human auditory masking
properties [3]. Yi Hu et al. proposes speech enhancement in the frequency domain as a
constrained minimization problem and includes the masking thresholds as the constraints. In
[13], psychoacoustic model is integrated in the derived spectral weighting function, paper
further investigate the importance of using good (low variance) spectrum estimators in speech

International Journal of Wireless & Mobile Networks (IJWMN) Vol. 5, No. 1, February 2013
182
enhancement. The human listener will not perceive any noise distortion as long as the power
spectrum density of the distortion lies below the masking threshold (the masking thresholds can
be obtained by performing critical band analysis of the speech signal [13]). As an alternative to
time domain approach (section 2) is to amplify the frequency components of the signal so that
the noise level in each critical band becomes lower than the masking threshold. In most of the
above speech enhancement methods, the incorporation of auditory masking was done
heuristically.
A. Absolute Threshold of Hearing
ATH is minimum sound level of a pure tone that an average ear with normal hearing can hear
with no other sound present, this is also known as the auditory threshold. It is the lowest of
the equal-loudness contours. If one has a low absolute threshold, it means that he is able to
detect small amounts of stimulation, and thus is more sensitive. If one has a high absolute
threshold, then he requires more stimulation and thus is less sensitive [14]. ATH varies with the
frequency of the sound, which is shown in figure 4.
Fig. 4: Threshold of hearing.
The threshold of hearing is given by,
4
33.3
10006.0
8.0
1000105.6
100064.3)(
2
+−
=
−
−−
−
fe
ff
f
qT (6)
where
Tq(f ) =Threshold of Hearing (dB) and f = frequency (Hz)
The threshold of hearing is generally reported as the RMS sound pressure of 20 µPa. It is
the sound a young human with undamaged hearing can detect at 1000 Hz. The threshold of
hearing is frequency dependent and it has been shown that the ear's sensitivity is best at
frequencies between 1 kHz to 5 kHz [14].
B. Masking
The masking phenomenon occurs because any loud sound will distort the ATH, making quieter,
otherwise perceptible sounds inaudible [14]. The masking effect stands for the phenomenon that
a certain weak signal called a maskee cannot be heard, i.e., ‘masked’ in the presence of a strong
signal called a masker in a nearby time or frequency region [12]. A weaker sound is masked if it
is made inaudible in the presence of a louder sound. The stronger signal that masks the weaker
one is called masker and the one that is masked is the maskee. The masking threshold will
depend upon the sound pressure level (SPL), the frequency of the masker and the characteristics
of the masker and the maskee, such as whether the masker or maskee is a tone or noise. The
masking characteristics are measured by signal to mask ratio (SMR) and mask to noise ratio

International Journal of Wireless & Mobile Networks (IJWMN) Vol. 5, No. 1, February 2013
183
(MNR). SMR at a given frequency is expressed as the difference (in dB) between the sound
pressure level of the masker and the masking threshold at that frequency. MNR at a given
frequency is expressed as the difference (in dB) between the masking threshold at that frequency
and the noise level. To make the noise inaudible, its level should be below the masking threshold
i.e. the MNR should be positive [3].
If there is more than one masker, then each masker contributes to its own masking threshold
and global masking threshold is computed that describes just noticeable distortion as a function
of frequency.
Simultaneous Masking: masking between two concurrent sounds often observed when the
sounds share a frequency band.
Temporal Masking: characteristic of the auditory system where sounds are hidden due to
maskers which have just disappeared, or even after maskers which are about to appear.
Loudness: Sound loudness is a subjective term describing the strength of the ear's perception of
a sound, also referred to as volume or strength. The units used to measure loudness are the,
Sone (loudness N) and Phon (loudness level L).
3.2. Deriving the Weighted Curve using Psychoacoustic
In the measurement of loudness, weighted curve is used to emphasize frequencies around 3 to 5
kHz where the human ear is most sensitive, while attenuating very low and high frequencies to
which the ear is insensitive [14]. Deriving a weighted curve is considered as one of the most
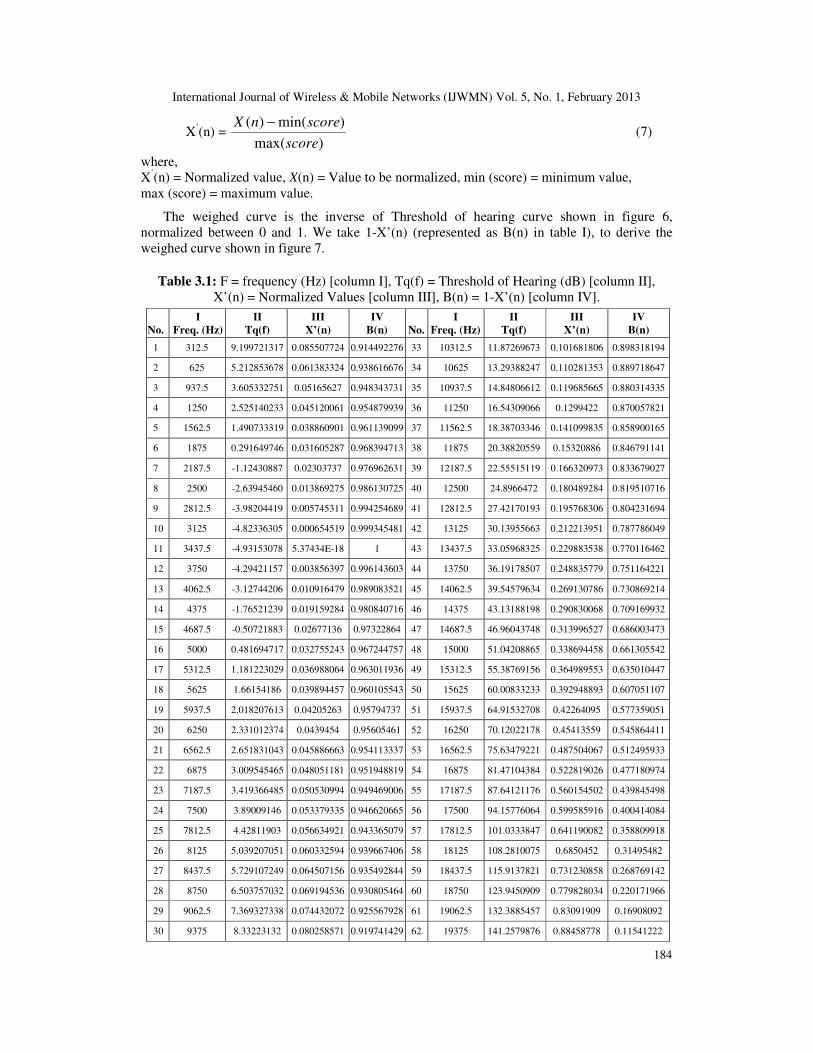
important factors which facilitates in measuring noise loudness. Table I shows the derived
threshold of hearing (dBSPL) values using equation 6, for frequencies ranging from 20 Hz to 20
kHz (frequency range for human hearing). In table I, the column I represent 64 different
frequency values ranging from 20 Hz to 20 KHz, and column 2 represents threshold of hearing
computed (dB) for the respective frequencies.
The linear curve (figure 5) is derived for 64 vectors, with a fixed linear frequency interval of
312.5 Hz along the X axis, using the equation 6. The threshold of the hearing was found to be
-4.983187589 dB at 3320.3125 Hz, and 160.3313427 dB at 20 kHz which shows, our ear is
most sensitive to the frequency around 3.3 to 3.5 kHz. It is observed that maximum audibility
lies in the range of 1 to 5 kHz; any signal with least loudness can be heard in this range.
Fig. 5: Threshold of Human Hearing.
After deriving 64 Vectors for a frequency range of 20 Hz to 20 kHz, its weighted curve has
to be derived, for this we have normalized 64 vectors to lie in between 0 and 1 (figure 6). To
normalize these values we use equation 7 to set maximum value 160.3313427 dB (threshold) of
20 kHz to be 1 and minimum value -4.931530782 dB of 3.4375 KHz to 0.
International Journal of Wireless & Mobile Networks (IJWMN) Vol. 5, No. 1, February 2013
184
X’(n) =
)max(
)min()(
score
scorenX − (7)
where,
X’(n) = Normalized value, X(n) = Value to be normalized, min (score) = minimum value,
max (score) = maximum value.
The weighed curve is the inverse of Threshold of hearing curve shown in figure 6,
normalized between 0 and 1. We take 1-X’(n) (represented as B(n) in table I), to derive the
weighed curve shown in figure 7.
Table 3.1: F = frequency (Hz) [column I], Tq(f) = Threshold of Hearing (dB) [column II],
X’(n) = Normalized Values [column III], B(n) = 1-X’(n) [column IV].
No.
I
Freq. (Hz)
II
Tq(f)
III
X’(n)
IV
B(n)
No.
I
Freq. (Hz)
II
Tq(f)
III
X’(n)
IV
B(n)
1 312.5 9.199721317 0.085507724 0.914492276 33 10312.5 11.87269673 0.101681806 0.898318194
2 625 5.212853678 0.061383324 0.938616676 34 10625 13.29388247 0.110281353 0.889718647
3 937.5 3.605332751 0.05165627 0.948343731 35 10937.5 14.84806612 0.119685665 0.880314335
4 1250 2.525140233 0.045120061 0.954879939 36 11250 16.54309066 0.1299422 0.870057821
5 1562.5 1.490733319 0.038860901 0.961139099 37 11562.5 18.38703346 0.141099835 0.858900165
6 1875 0.291649746 0.031605287 0.968394713 38 11875 20.38820559 0.15320886 0.846791141
7 2187.5 -1.12430887 0.02303737 0.976962631 39 12187.5 22.55515119 0.166320973 0.833679027
8 2500 -2.63945460 0.013869275 0.986130725 40 12500 24.8966472 0.180489284 0.819510716
9 2812.5 -3.98204419 0.005745311 0.994254689 41 12812.5 27.42170193 0.195768306 0.804231694
10 3125 -4.82336305 0.000654519 0.999345481 42 13125 30.13955663 0.212213951 0.787786049
11 3437.5 -4.93153078 5.37434E-18 1 43 13437.5 33.05968325 0.229883538 0.770116462
12 3750 -4.29421157 0.003856397 0.996143603 44 13750 36.19178507 0.248835779 0.751164221
13 4062.5 -3.12744206 0.010916479 0.989083521 45 14062.5 39.54579634 0.269130786 0.730869214
14 4375 -1.76521239 0.019159284 0.980840716 46 14375 43.13188198 0.290830068 0.709169932
15 4687.5 -0.50721883 0.02677136 0.97322864 47 14687.5 46.96043748 0.313996527 0.686003473
16 5000 0.481694717 0.032755243 0.967244757 48 15000 51.04208865 0.338694458 0.661305542
17 5312.5 1.181223029 0.036988064 0.963011936 49 15312.5 55.38769156 0.364989553 0.635010447
18 5625 1.66154186 0.039894457 0.960105543 50 15625 60.00833233 0.392948893 0.607051107
19 5937.5 2.018207613 0.04205263 0.95794737 51 15937.5 64.91532708 0.42264095 0.577359051
20 6250 2.331012374 0.0439454 0.95605461 52 16250 70.12022178 0.45413559 0.545864411
21 6562.5 2.651831043 0.045886663 0.954113337 53 16562.5 75.63479221 0.487504067 0.512495933
22 6875 3.009545465 0.048051181 0.951948819 54 16875 81.47104384 0.522819026 0.477180974
23 7187.5 3.419366485 0.050530994 0.949469006 55 17187.5 87.64121176 0.560154502 0.439845498
24 7500 3.89009146 0.053379335 0.946620665 56 17500 94.15776064 0.599585916 0.400414084
25 7812.5 4.42811903 0.056634921 0.943365079 57 17812.5 101.0333847 0.641190082 0.358809918
26 8125 5.039207051 0.060332594 0.939667406 58 18125 108.2810075 0.6850452 0.31495482
27 8437.5 5.729107249 0.064507156 0.935492844 59 18437.5 115.9137821 0.731230858 0.268769142
28 8750 6.503757032 0.069194536 0.930805464 60 18750 123.9450909 0.779828034 0.220171966
29 9062.5 7.369327338 0.074432072 0.925567928 61 19062.5 132.3885457 0.83091909 0.16908092
30 9375 8.33223132 0.080258571 0.919741429 62 19375 141.2579876 0.88458778 0.11541222

International Journal of Wireless & Mobile Networks (IJWMN) Vol. 5, No. 1, February 2013
185
31 9687.5 9.39912406 0.086714303 0.913285697 63 19687.5 150.5674867 0.940919241 0.059080759
32 10000 10.57690112 0.093840991 0.906159009 64 20000 160.3313427 1 1.98947E-10
3.3 Deriving the Gain
Deriving the gain in frequency domain approach is more critical than time domain approach.
Background noise is captured and sampled at a rate of 8 kHz. The total samples are divided into
frame size of 1024 each, resulting in 39 frames as explained in section 2.2. Each frame of 1024
samples are sub-divided into 16 sub-frames for processing, each sub-frame has 64 samples.
Flow representation of the approach is shown in figure 8.
Fig. 6: Normalized vectors Vs frequency (Hz).
Fig. 7: Weighted Curve.
Obtain the magnitude of each sample by computing 64 point FFT of captured noise signal and
compute the loudness level of varying background noise. The magnitude of frequency samples
obtained by computing FFT is multiplied by 64 point weighed curve on sample basis and noise
energy or noise loudness is calculated using the equation,
∑−
=
=
1
0
2
10)))(((10)/1(Loudness log
N
i
iRN
(8)
where
))(*)(()(1
0
∑−
=
=
N
n
nBnMiR (9)
M(n) = Magnitude of FFT samples
B(n ) = 1-X’(n), weighted N samples derived from figure 7

International Journal of Wireless & Mobile Networks (IJWMN) Vol. 5, No. 1, February 2013
186
Compute the magnitude of down-linked speech samples (with Fs = 8 kHz) using 64 point
FFT for 16 sub-frames and calculate the energy (frame wise) of speech samples using equation
1. The energy of the speech and noise signals computed (figure 8) is compared and gain is
derived for enhancing the degraded speech signal as explain in section 2. For deriving the gain
equation 3 is used. Present frame gain is compared with previous frame gain if the difference is
more, then current frame gain is adjusted to avoid sudden change in the output levels to avoid
click & pop noise which fatigue the ears. Updated gain is multiplied with speech (element by
element) signal in time or frequency domain (multiplying by constant is a linear function) to get
enhanced speech signal. If the enhanced/amplified value of speech signal exceeds the maximum
loudness of the loud speaker then end capping can be performed depending on minimum and
maximum values computed using equations 4 and 5 as explained in section 2.1.
Fig. 8: Flow diagram of frequency domain approach using psychoacoustic.
3.4. Experimental Results
To illustrate a speech signal (Fig. 2(a)) and varying noise signal (Fig. 2(b)) of 16-bit PCM with
sampling rate of 8 kHz with duration of 5 seconds is captured using an audio editor tool, Gold
Wave and saved in .wav format. The captured speech signal has 40000 samples; total samples
are further divided into frame size of 1024 each, resulting in 39 frames. Figure 2(d) reflects the
variation in the amplification of speech signal based on changing noise signals. Speech signal
can be further enhanced by increasing the gain control, E in equation 3 as desired.
Normalize ATH curve to
lie in between 0 & 1
Derive ATH curve from
Psychoacoustics
Derive weighted curve
Capture Background Noise (N) and
divide entire signal into frames of
1024 samples each
Divide each frame into 16 sub-frames of 64 samples each and compute
magnitude using 64 point FFT
Multiply 64 point magnitude samples
of noise with weighted curve
Repeat for entire 16 sub-frames of
1024 samples and for entire signal
Derive noise loudness curve/
compute the energy of near-end
noise
Compare noise (N) and speech signal
(S) energy to derive the gain

International Journal of Wireless & Mobile Networks (IJWMN) Vol. 5, No. 1, February 2013
187
Fig. 9: Variation of speech, noise, enhanced speech signal and gain/MF using
frequency domain approach.
The obtained results are plotted in figure 9. Number of frames is indicated in x-axis and y-axis
indicates energy of the speech, noise & enhanced signal and variation of gain w.r.t. speech and
noise signal. For a maximum gain of 4 the speech signal energy is enhanced by 13 dB.
4. EVALUATION OF BOTH THE METHODS
The gain derived from both the time and frequency domain (using psychoacoustic) approach is
plotted in figure 10. Results indicate that later approach promises minimal gain required for
speech enhancement, which is more realistic with reference to human audibility since
psychoacoustic was involved. Complexity involved in the processing the samples will more in
the latter approach because of frequency transformations (FFT) involved as compared to earlier
approach. Algorithm enhances only the selected frequency components hence amplification
required for enhancing speech signal is minimal which reduces the battery power as well as ears
will not get fatigue.
Fig. 10: Variation of gain/MF in time and frequency domain approach.
5. CONCLUSIONS
In this contribution we presented an efficient algorithm to enhance the speech signals in
presence of noisy background noise. The paper discusses the implication of background noise
on signal perception by the user and necessity of this problem needs to be solved for extended
user experience and growth of mobile technology. The paper also discusses avenues to mitigate

International Journal of Wireless & Mobile Networks (IJWMN) Vol. 5, No. 1, February 2013
188
the effect of such noise by gain adjustment of speech signal according to noise variations.
Experimental results are presented for a few combinations of parameters against the varying
background noise, highlighting acceptable gain of the signal. Results indicate that gain obtained
is adaptive and varies w.r.t. change in speech and noise signal. The proposed system is capable
of tracking change in the user perception levels with time. The gain derived from frequency
domain approach is more realistic because derived gain uses the masking properties of the
human auditory system. Simulation results were verified using an audio editor tool Gold Wave
v5.58, compiled with Eclipse C/C++ IDE and implemented on Beagle-Board-xM (OMAP-
3530) platform.
ACKNOWLEDGEMENTS
The authors would like to thank everyone, just everyone!
REFERENCES
[1] S. F. Boll, “Suppression of acoustic noise in speech using spectral subtraction”, IEEE Transaction
on Acoustic, Speech, Signal Processing, vol. ASSP -27, pp. 113–120, April. 1979.
[2] Y. Ephraim and D. Malah, “Speech enhancement using a minimum mean square error short-time
spectral amplitude estimator”, IEEE Transaction on Acoustic, Speech, Signal Processing, vol.
ASSP-32, pp. 1109–1121, Dec. 1984.
[3] N Virag, “Single channel speech enhancement based on masking properties of human auditory
system”, IEEE Transaction on Speech and Audio Processing, vol. 7, pp. 126–137, 1999.
[4] Jeon Yu-young and Lee Sang-min, “A speech enhancement algorithm to reduce noise and
compensate for partial masking effect”, Journal of Central South University of Technology, vol.
18, issue 4, pp. 1121-1127, August 2011.
[5] Malihe hassani and M. R. Karami mollaei, “Speech enhancement based on spectral subtraction in
wavelet domain”, IEEE 7th
International Colloquium on Signal Processing and its Applications, pp.
366-370, March 2011.
[6] Bastian Sauert and Peter Vary, “Near End Listening Enhancement: Speech Intelligibility
Improvement in Noisy Environments”, in: Proceeding of International Conference on Acoustics,
Speech, and Signal Processing (ICASSP), pp. 493–496, May 2006.
[7] Bastian Sauert, Gerald Enzner and Peter Vary, “Near End Listening Enhancement with Strict
Loudspeaker Output Power Constraining”, in: Proceeding of International Workshop on Acoustic
Echo and Noise Control (IWAENC), pp. 01–04, Sept. 2006.
[8] Bastian Sauert and Peter Vary, “Near End Listening Enhancement Optimized with respect to
Speech Intelligibility Index”, in: Proceeding of European Signal Processing Conference
(EUSIPCO) vol. 17, EURASIP. New York, Hindawi Publication, pp. 1844–1848, Aug. 2009.
[9] Bastian Sauert and Peter Vary, “Near End Listening Enhancement considering Thermal Limit of
Mobile Phone Loudspeakers”, in: Konferenez Elektronische Sprachsignal Verarbeitung (ESSV),
Germany, vol. 61, pp. 333-340, 28-30th Sept. 2011.
[10] Jong Won Shin, Student Member, IEEE and Nam Soo Kim, Member, IEEE, “Perceptual
Reinforcement of the Speech Signal Based on Partial Specific Loudness”, IEEE signal processing
letters, vol. 14, No. 11, pp. 887 – 890, Nov. 2007.
[11] Jong Won Shin, Woohyung Lim, Junesig Sung and Nam Soo Kim, “Speech Reinforcement based on
Partial Specific Loudness”, in 8th
Annual Conference of International Speech Communication
Association (ISCA), INTERSPEECH 2007, Antwerp, Belgium, 27-31st Aug. 2007. PP. 978-981.

International Journal of Wireless & Mobile Networks (IJWMN) Vol. 5, No. 1, February 2013
189
[12] Jong Won Shin, Yu Gwang Jin, Seung Seop Park and Nam Soo Kim, “Speech Reinforcement based
on Partial Masking Effect”, in: Proceeding of IEEE Transaction on Acoustic, Speech, Signal
Processing (ICASSP), pp. 4401 - 4404, April 2009.
[13] Yi Hu and Philipos C. Loizou, “Incorporating a Psychoacoustic Model in Frequency Domain Speech
Enhancement”, in IEEE signal processing letters, vol. 11 no. 2, February 2004.
[14] Eberhard Zwicker and Hugo Fastl, Psychoacoustics, Facts and Models. New York: Springer, 2007.
Authors
Premananda B. S. has completed his M.Tech. in Digital Electronics from V.T.U.,
Karnataka. He has published 12 papers in national, international conferences and
journals. His areas of interests are in the field of Communication and VLSI.
Dr. Uma B. V. has obtained her M.E. in Digital Tech. & Instrumentation and
Ph.D. from V.T.U., Karnataka. She has published 20 papers in national,
international conferences and journals. Her areas of interests are in the field of
Communication and VLSI.