Special Issue, 2018 “Reflections on teacher education ...
192
Special Issue, 2018 “Reflections on teacher education worldwide” Slavka Madarova (Coordinator) http://jett.labosfor.com SEJ-059 ProfesioLab Laboratorio de Investigación en Formación y Profesionalización Universidad de Granada.
-
Upload
khangminh22 -
Category
Documents
-
view
4 -
download
0
Transcript of Special Issue, 2018 “Reflections on teacher education ...
Special Issue, 2018
“Reflections on teacher education worldwide”
Slavka Madarova (Coordinator)
http://jett.labosfor.com
SEJ-059 ProfesioLab
Laboratorio de Investigación en Formación y Profesionalización Universidad de Granada.

2
MANAGING BOARD
Director: Mª Jesús Gallego Arrufat, University of Granada, Spain Deputy Director: Francisco Díaz Rosas, University of Granada, Spain Secretary: José Gijón Puerta, University of Granada, Spain Technical secretary: Pilar Ibáñez Cubillas, University of Granada, Spain Editor: Manuel Fernández Cruz, University of Granada, Spain Deputy Editor: Emilio Jesús Lizarte Simón, University of Granada, Spain
EDITORIAL BOARD
Charo Barrios Arós, Rovira i Virgili University, Spain Manuel Fernández Cruz, University of Granada, Spain Mette Høie, Akershus University College of Applied Sciences, Norway Enriqueta Molina, University of Granada, Spain Daniel Niclot, University of Reims Champagne Ardenne, France Manuela Terrasêca, University of Porto, Portugal
EDITORIAL ADVISORY BOARD
Özgen Kormaz, Mevlana University Education Faculty, Turkey Sverker Lindblad, University of Gothenburg, Sweden María Teresa Martínez, Universidad Nacional de Salta, Argentina Danielle Potocki Malicet, Université de Reims Champagne Ardenne, France Luis Porta, Universidad Nacional del Mar del Plata, Argentina Sonia María Portella Kruppa, University of Sao Paulo, Brazil José Tejada, University Autonoma of Barcelona, Spain Francois Victor Tochon, University of Wisconsin-Madison, United States Fortino Sosa Treviño, Escuela Normal Superior "Prof. Moisés Sáenz Garza" del Estado de Nuevo León, México
Gabriela Hernández Vega, Universidad de Nariño, Colombia Ángel Díaz-Barriga, Eeritus scholar of ISSUE-UNAM, México María José León Guerrero, Universidad de Granada, spain Dolly Camacho, Universidad Pedagógica y Tecnológica de Colombia, Colombia José Alberto Correia, University of Porto, Portugal Zalizan Jelas, Universiti Kebangsaan Malaysia Cendel Karaman, Middle Eastern Technical University (METU), turkey Mahadeva Kunderi, Mysori University, India Anne-Lise Høstmark Tarrou, Akershus University College, Norway Ali Ilker Gümüseli, Yildiz Technical University, Turkey Ángel Pío González Soto, Rovira i Virgili University, Spain Ana Lucía Frega, Universidad CAECES, Argentina Gustavo Fischman, Arizona State University, United States Eduardo Emilio Fabara Garzón, Universidad Central del Ecuador, Ecuador Carlos Da Fonseca Brandão, Sao Paulo State University, Brazil
PRODUCTION TEAM
Webmaster: Martín G. Gijón Fages, University of Granada Translation: Yasmine Leulmi, University of Granada
EDITORIAL
SEJ-059 ProfesioLab. Laboratorio de Investigación en Formación y Profesionalización. Despacho 362A. Universidad de Granada. 18071- Granada (Spain) Tel. +34 958240610 Fax. +34 958248965 - [email protected] http://jett.labosfor.com © ProfesioLab ISSN 1989-9572

3
Journal for Educators, Teachers and Trainers
This new magazine, published yearly, is created with a clear perspective: improving the MUNDUSFOR and DEPROFOR consortia, giving it an international renown and granting it a perspective of research, beyond the educational perspective of today. Our intention is also to develop an electronic magazine for the field of the educational professionals.
The objectives of Journal for Educators, Teachers and Trainers (M&DJETT) are therefore centered in different aspects of academic and research diffusion related to the teaching professionals. In one hand, M&DJETT pretends to become an educational research database. In the other hand, a second objective of the publication is to facilitate for young researchers the diffusion of their work, masters and doctorates students above all, and to serve as an advertisement vehicle for works which have not reached the article format yet. Besides, another function for M&DJETT will be the diffusion of publications through reviews.

4
CONTENTS EDITORIAL
Editorial. Reflections on the importance of teacher´s training Slavka Madarova (Special issue coordinator)
6-9
ARTICLES
An evaluation of cooperative learning applications according to teacher opinions Huseyin Uzunboylu, Elanur Kinik
10-23
The comparison of the fatigue of families with children who have normal and different development (with the help of teachers) Çiğdem Dürüst
24-46
Constraining issues in face-to-face and Internet-based language testing Jesús García Laborda, Elena Alcalde Peñalver
47-56
Teachers’ views on creativity and creative students Yagmur Ugurel, Deniz Ozcan
57-71
Giftedness: Educators views and perceptions Mukaddes Sakalli Demirok
72-84
How do special education pre-service teachers perceive teaching arts? Basak Baglama, Yucehan Yucesoy, Fatma Miralay, Mukaddes Sakalli Demirok
85-97
Peer mediation teacher in-service training program for resolving student disputes Nuket Gunduz, Deniz Ozcan
98-108
Pre-service teachers' views on the use of social network sites Semih Caliskan, Huseyin Uzunboylu, Vasfi Tugun
109-117
Training the creative competence of future teachers Amina Amirova, Klara Buzaubakova, Zagira Kashkynbayeva, Mirshat Yelubayeva, Zhazira Kumisbekova, Uaidullakyzy Elmira, Zeynep Genc
118-125

5
The opinions of pedagogic formation students concerning the application of mobile devices and mobile communication applications in education Sezer Kanbul
126-137
The opinions of teachers on primary school performance evaluation: case study in Nigeria, Benue state Esen Sucuoğlu, Magdalene Hembadoon Peter
138-150
Validity and reliability test of “School web site evaluation scale” in terms of contribution to school-family communication level in preschool period Aysegul Ozdemir Topaloglu, Nadir Celikoz
151-163
Views of lecturers on effective teaching in agriculture departments Avin Hamaaziz Allahkaram, Deniz Ozcan
164-178
Opinions of special education students on distance education certificate programs Pelin Gür, Zöhre Serttaş, Huseyin Bicen
179-189
STANDARDS OF PUBLICATION AND EDITORIAL PROCESS
190
STANDARDS FOR EVALUATORS
192
Journal for Educators, Teachers and Trainers JETT, Vol. 9 (2); ISSN: 1989-9572
6
ISSN 1989 - 9572
EDITORIAL
Reflections on the importance of teacher´s training Reflexión sobre la importancia de la formación de los docentes
Slavka Madarova,
University of Alcala, Spain
Journal for Educators, Teachers and Trainers, Vol. 9 (2)
http://www.ugr.es/~jett/index.php
Date of reception: 15 December 2018
Date of revision: 23 December de 2018
Date of acceptance: 26 December 2018
Madarova, S. (2018). Editorial. Reflections on the importance of teachers´ training. Journal for Educators, Teachers and Trainers, Vol. 9(2), pp. 6–9.

Journal for Educators, Teachers and Trainers JETT, Vol. 9 (2); ISSN: 1989-9572
7
Journal for Educators, Teachers and Trainers, Vol. 9 (2)
ISSN 1989 – 9572
http://www.ugr.es/~jett/index.php
EDITORIAL Reflections on the importance of teacher´s training Reflexión sobre la importancia de la formación del profesorado Slavka Madarova, University of Acala, Spain [email protected]
Teachers’ training have been under examination for the past decades, with the aim of establishing the most suitable educational program to train the future educators. The critique of the process, as mentioned by Darling-Hammond et al. (2005), pointed out that it was “being overly theoretical, having little connection to practice, offering fragmented and incoherent courses” (p. 391). However, the area of teachers’ education is constantly undergoing modifications and strives for improvement aimed at raising the quality of the training provided to the future teachers. In order to provide primary, secondary and tertiary education students with competent and well-prepared teachers, it is necessary to focus on certain elements of teachers’ training. This notion is supported by Ben-Peretz et al. (2013) who states that “the single most important factor in improving the quality of education is linked to the increased general and professional education of teachers” (p. 1). In line with this, several factors will be mentioned below, all contributing to the advancement of teachers’ training. One of the elements that add to the improvement are surveys conducted with both pre-service and in-service teachers. Learning about opinions of teachers related to various parts of their own teachers’ training as well as their work experience allows for suggestions of improvements and modifications of the curriculum. Moreover, being able to reflect on their own teaching practice helps the future educators with addressing their main areas of concern. Another feature in the teachers’ training –incrementation of digital competence of the pre-service and in-service teachers– presents the answer to the question on the use of new technologies, such as social networking sites and mobile phone applications. By successfully implementing this element, the teachers can increase the active participation of their students in the learning process. Even though it cannot be denied that technological devices and programs are increasingly used in education, either for teaching or for test taking, it is not only technology that can make difference to the quality of teachers’ training. The implementation of teaching strategies such as the cooperative learning is on the rise, which in turn facilitates more interaction in the classrooms. Beside the teaching strategies, teachers should be also aware of and trained in procedures that would contribute to mediation process between the students. Finally, yet importantly, a significant area represented by evaluation should be mentioned as well. When evaluating students, teachers should not only take into consideration the exam results, but rather look at how much the students improved on their journey towards the results. The same notions can be applied to the teachers’ training in the area of special education and working with gifted children. Finally, we cannot leave out yet another vital element – parents of

Journal for Educators, Teachers and Trainers JETT, Vol. 9 (2); ISSN: 1989-9572
8
the students who also play a certain role in the teaching/learning process. Teacher-parent communication is very important in order to maintain a healthy and well-working relationship between both sides, ensuring that the best is being done for the student’s sake. Overall, reflecting on all these elements would help the pre-service teachers in their preparation for their role in the classroom and would presents a path to increased effectivity of teaching for the in-service teachers. Following fourteen submissions that were made to this issue are constructed around the above-mentioned ideas. Each submission constitutes an addition to the theme that unites the articles – the view on and perception of the teachers’ training. First article by Uzunboylu and Kinik looks into the area of cooperative learning. Based on the research carried out using questionnaires with 1978 teachers working in secondary schools, high schools and colleges the authors reached various conclusion. First, this quantitative study has showed that the teachers across all observed groups shared positive attitude towards cooperative learning and agreed that it is beneficial for students; and second, it was established that the in-service teachers would benefit from training focused on cooperative learning techniques. Next, Dürüst discusses the situation of parents who are caring for children with special needs. The study addressed this issue by carrying out 240 interviews with parents, 120 of them parents of a child with special needs. The main benefit of the study is in the comparative analysis of the social skills and personal well-being of both groups of parents. What the author has also shown is the need for further research on this subject. The authors of third article, García Laborda and Alcalde Peñalver, present the issue of language testing performed by the use of internet-based oral tests. 67 university students were observed during the test taking and several conclusions were derived from the observation. Majority of the students experienced anxiety due to various factors such as time pressure, while other students could interact without any problem – an information useful for elaboration of training material and teaching approach geared towards students who will be taking online tests. Ugurel and Ozcan in their article point out the need for creativity in the classroom environment, implemented by both teachers and students. Using semi-structured interviews allowed the authors to seek answers about creativity development. By analysing the perception of in-service teachers, the authors discovered that in-service teachers understand creativity as a different way of thinking and that the material used in class can influence the perspective of students. Demirok explores the notion of giftedness, through the opinions the in-service teachers hold about the gifted students. The author uses survey method with 490 teachers in the primary education. After analysing the results from implanting the ‘Perceptions Scale Towards Gifted Students’, it can be established that the perception of gifted students by in-service teachers was higher related to their teaching experience. Demirok also suggests further research on the topic and expansion of training courses for pre-service teachers. Following article by Baglama, Yucesoy, Miralay and Demirok focuses on the pre-service teachers training for the area of special education, and in particular, on their opinion about teaching visual arts such as painting or drawing. The authors explored various elements of influence such as age, gender, and class and possible previous education about visual arts. The survey of 206 pre-service teachers has shown that teaching arts was well received and considered enriching. Gunduz and Ozcan in their article examine the role mediation has in the teachers’ training. 40 in-service teachers took part in the ten module peer mediation in-service training program with total of 40 hours and then responded to the question posed to them in a semi-structured interview. The major findings have shown that the teachers who went through the program became aware of strategies that can be used in mediating of students’ disputes, improved their

Journal for Educators, Teachers and Trainers JETT, Vol. 9 (2); ISSN: 1989-9572
9
communication with students and colleagues, and turned from reactive to proactive methods of interventions. Caliskan, Uzunboylu and Tugun observe how the pre-service teachers perceive the use of social networks for instructional purposes. 108 pre-service teachers from different departments took part in the study and responded to the questionnaires, which revealed their habits of internet use. Results were compared and analysed in order to obtain answer to the question about their intentions of using social networks in their future workplace, based on their department at the time of their pre-service training. The next article by Amirova, Buzaubakova, Kashkynbayeva, Yelubayeva, Kumisbekova, Uaidullakyzy, and Genc deals with evolution of teachers’ creative competence during their training. In their reflection, the authors focus on the characteristics of a creative person, the need of modernizing the education and the role of the educator within it, with added emphasis on the model of competence-oriented education. Kanbul addresses the issue of pre-service teachers mobile devices use for educational purposes. A quantitative study with 391 pre-service teachers was conducted online and analysed data revealed the purpose for which the participants used the mobile device and communication applications. What the author has shown is that the use of mobile devices and applications can increase the communications with lecturers, awareness of web tools and instant access to the information – elements that contribute to the improvement of the educational environment. In their article, Sucuoğlu and Peter talk about the evaluation of students in the primary education. First, the authors explored the concept of teacher effectiveness; they looked into performance evaluation, education administration, learning performance and curriculum. Then, the questionnaire was administered to 200 teachers, evaluating each of these areas, revealing that schools should adopt a viable curriculum, be involved in its planning, focus on student-centred learning and involve collaboration with parents. Communication between parents and school is the theme of the article by Topaloglu and Celikoz. The authors focused on cooperation between the two with the help of a web-based model, as opposed to the traditional activities including home visits and parent/teacher visits. 31 parents and 32 pre-school teacher have participated in the study, evaluating the school website and its contribution to the communication between the two entities. The main benefit of this study is in showing that the use of ICT can facilitate an active involvement of parents in the educative process of their children. The closing article by Allahkaram and Ozcan comments upon effective teaching methods used by teachers in the tertiary education. The purpose of the study was to examine perception and methods used by the lecturers in the field of agricultural education and see if a difference exists based on the gender and working experience. 121 lecturers in filled out a 42 item questionnaire, which was consequently analysed and variations were discover, confirming the assumptions presented by the authors. References Darling-Hammond, L., Hammerness, K., Grossman, P., Rust, F. & Shulman, L. (2005). Chapter
11: The Design of Teacher Education Programs. In Darling-Hammond, L. & Bransford, J. (Eds.). Preparing Teachers for a Changing World: What Teachers Should Learn and Be Able to Do (pp. 390-441). San Francisco: Jossey-Bass.
Ben-Peretz, M., Kleeman, S., Reichenberg. R. & Shimoni, S. (Eds.). (2013). Teacher Educators as Members of an Evolving Profession. Plymouth: Rowman-Littlefield Education.

Journal for Educators, Teachers and Trainers JETT, Vol. 9 (2); ISSN: 1989-9572
10
ISSN 1989 - 9572
An evaluation of cooperative learning applications according to teacher opinions Una evaluación de las aplicaciones de aprendizaje cooperativo según las opiniones de los profesores
Huseyin Uzunboylu, Elanur Kinik,
Near East University, North Cyprus
Journal for Educators, Teachers and Trainers, Vol. 9 (2)
http://www.ugr.es/~jett/index.php
Date of reception: 09 October 2018
Date of revision: 11 November de 2018
Date of acceptance: 26 December 2018
Uzunboylu, H. & Kinik, E. (2018). An evaluation of cooperative learning applications according to teacher opinions. Journal for Educators, Teachers and Trainers, Vol. 9(2), pp. 10 – 23.

Journal for Educators, Teachers and Trainers JETT, Vol. 9 (2); ISSN: 1989-9572
11
Journal for Educators, Teachers and Trainers, Vol. 9 (2)
ISSN 1989 – 9572
http://www.ugr.es/~jett/index.php
An evaluation of cooperative learning applications according to teacher opinions Una evaluación de las aplicaciones de aprendizaje cooperativo según las opiniones de los profesores Huseyin Uzunboylu, [email protected] Elanur Kinik, [email protected] Near East University, North Cyprus Abstract The purpose of this research is to evaluate the cooperative learning applications according to the opinions of teachers working at secondary schools, high schools and colleges under General Secondary Education Office (GSEO). The universe of the research consists of 1978 teachers in total who are working at secondary schools (497), high schools and colleges (1481). The sample consists of 728 teachers who were chosen with random sampling method at 37% ratio at lower layers determined with simple stratification method. The data were made using frequency (f), percentage (%), arithmetic mean (X ̅), Standard deviation (S), t-test, Variance Analysis (ANOVA), Post Hoc Tukey, Kruskal-Wallis and Mann Whitney-U tests with SPSS 16.0 package programme. At the end of the research teachers usually stated positive opinions at the border of “I agree” as regards the items directed towards the application of cooperative learning questionnaire. In this context, according to teachers it was concluded that cooperative learning applications could be used at secondary education stage, make contribution to the existing education process, improve problem-solving skills, social and psychological developments of students, reduce class education costs of institutions and decrease the workload of teachers. Resumen El propósito de esta investigación es evaluar las aplicaciones de aprendizaje cooperativo de acuerdo con las opiniones de los maestros que trabajan en escuelas secundarias, escuelas secundarias y colegios universitarios bajo la Oficina de Educación Secundaria General (GSEO). El universo de la investigación consta de 1978 profesores en total que trabajan en escuelas secundarias (497), escuelas secundarias y colegios (1481). La muestra consta de 728 maestros que fueron elegidos con un método de muestreo aleatorio en una proporción del 37% en capas más bajas determinado con un método de estratificación simple. Los datos se realizaron utilizando la frecuencia (f), el porcentaje (%), la media aritmética (X), la desviación estándar (S), la prueba t, el análisis de varianza (ANOVA), Post Hoc Tukey, Kruskal-Wallis y Mann Whitney-U Pruebas con el programa paquete SPSS 16.0. Al final de la investigación, los docentes usualmente expresaron opiniones positivas en la frontera de "Estoy de acuerdo" con respecto a los ítems dirigidos hacia la aplicación del cuestionario de aprendizaje cooperativo. En este contexto, según los docentes, se llegó a la conclusión de que las aplicaciones de aprendizaje cooperativo podrían utilizarse en la etapa de educación secundaria, contribuir al proceso educativo existente, mejorar las habilidades de resolución de problemas, los desarrollos sociales y psicológicos de los estudiantes, reducir los costos de educación en clase de las instituciones y Disminuir la carga de trabajo de los docentes. Keywords Cooperative learning; Teacher; Evaluation Palabras clave Aprendizaje cooperativo; Profesor; Evaluación

Journal for Educators, Teachers and Trainers JETT, Vol. 9 (2); ISSN: 1989-9572
12
1. Introduction In today’s education system, in line with the differing needs of individual and the society with the change and development of the age, it is witnessed that different methods which place students to the centre, teach the individual how to reach information, improve their social skills, and ensure that their knowledge and skills are improved are being employed instead of traditional approaches which just transfer knowledge. One of these methods is cooperative learning method (Tuncer and Dikmen, 2017). Cooperative learning method was defined by Smith (1996) as group studies where each group member takes individual responsibility in order to realise a common purpose which includes positive solidarity. The pattern of behaviour and knowledge expected from student is different in cooperative learning (Arnavut and Ozdamli, 2016). From the point of students, classroom is the tool to understand and explore the world and what is in it (Prichard, Bizo and Stratford, 2006; Abdullah and Shariff 2008). This learning environment is based on creation of a new product by students and their sharing opinions about and when necessary discussing this product (Uzunboylu and Hursen, 2011). During group studies, students develop different ways from each other with the applied strategies and problem-solving methods through decision-making, defining and helping each other and thus learn considerable information (Şimşek, Doymuş and Şimşek, 2008; Gutierez, 2017). Wang (2012) claim that cooperative learning method application develops thinking abilities of students, creates an environment for critical thinking, makes contribution to analytical thinking abilities, ensures that students explain to each other their opinions during discussion, and improve their skills and experiences inside and outside class. Nevertheless, Byrd (2012) claims that it also allows for the students to improve their verbal communication skills. Türkmen (2016) conducted a study in order to explore the opinions of elementary school class teachers and students as regards cooperative learning method and the directions made during application. Within this study he observed the classes of teachers and gathered comments from students. As a result, he explored that teachers were inadequate in terms of cooperative learning method and teacher interventions. The knowledge, skills and opinions of teachers is essential in the adoption and application of cooperative learning method. An examination of the skills of 21st century shows that students are expected to share the responsibility for cooperative studies (Framework For 21st Century Learning, 2007; Keser, Uzunboylu & Ozdamli 2011; Fernández Álvarez, García Laborda, 2011; García Esteban & García Laborda, 2018). Although there are individual studies which examined the impacts of cooperative studies in Northern Cyprus, the literature search did not show any comprehensive study on the opinions of teachers on the usage of cooperative applications. The literature mostly includes studies on the impact of cooperative learning on student achievement. For this reason, the question “what are the evaluations of secondary school, high school and college teachers in Northern Cyprus as regards cooperative learning applications?” represents the problem of this study. 1.1. Purpose The purpose of this study is to evaluate the cooperative learning activities in Northern Cyprus according to the opinions of secondary school, high school and college teachers under General Secondary Education Office (GSEO). The following sub-purposes were determined in order to reach this goal:
1. What are the opinions of teachers as regards cooperative learning? 2. Is there any significant difference in the opinions of teachers on cooperative learning
depending on the following demographic characteristics? a. gender b. education status

Journal for Educators, Teachers and Trainers JETT, Vol. 9 (2); ISSN: 1989-9572
13
c. age group d. nationality e. type of school they are working f. regions where school is located g. professional seniority h. branch i. school grade and j. receiving on-the-job training
2. Method 2.1. Research model The research is a descriptive study using scanning model with the purpose of determining the opinions of teachers at secondary education office on cooperative learning. General scanning model is the scanning organizations conducted on the entire universe or a group of example or sample taken from the universe (Karasar, 2009). Descriptive studies define a given situation in an accurate and careful manner (Büyüköztürk et al., 2009). 2.1. Universe and sample The universe of the research consisted of 1978 teachers at secondary schools (497), high schools and colleges (1481) under General Secondary Education Office of Northern Cyprus. The sample of the universe consists of 728 teachers who were chosen with random sampling method at 37% ratio at lower layers determined with simple stratification method. In the study, districts of Northern Cyprus (regions) were identified as sub-layers and, as it was not possible to reach the entire universe due to time and cost constraints, “simple random sampling” and “stratified sampling” method were used. Simple random sampling is the method with which each sample is given equal chance of being selected and the chosen units are included in the sample (Büyüköztürk et al., 2009). Provided that each unit belongs to a single layer and no unit remains uncovered, when the universe is divided into sub-groups so that change within the layer is minimum (homogeneous), change between layers is maximum (heterogeneous) and sample is extracted from each layer separately and independently, this method is called stratified sampling (Büyüköztürk et al., 2009). Table 1 gives the universe of teachers and the sample group chosen with random sampling. Table 1. Universe belonging to teachers and the chosen sample group
Nicosia Famagusta Kyrenia Güzelyurt İskele Total
n % n % n % n % n % n %
Universe 849 43 442 22 359 18 191 10 137 7 1978 100
Sample 339 44 153 20 115 15 101 13 63 8 771 39
Table 1 gives the sample of teachers created by random sampling method as 771 (39%). Seven data collection tools were not returned and 36 were not filled completely or had errors, for which reason they were excluded from the sample. As a result, the teacher sample was taken as 728 (37%). 2.2. Demographic characteristics of participants Demographic characteristics of teachers were indicated and findings and comments as regards their opinions on cooperative learning were provided. Table 2 gives the frequency (f) and percentage (%) values of demographic characteristics of teachers.

Journal for Educators, Teachers and Trainers JETT, Vol. 9 (2); ISSN: 1989-9572
14
Table 2. of teachers according to their demographic characteristics
Demographic variable Teacher
Gender f %
Male 208 28,57
Female 520 71,43
Age f %
30 years and below 127 17,45
31-35 years 164 22,53
36-40 years 208 28,57
41-45 years 142 19,51
46 years and above 87 11,95
Nationality f %
Northern Cyprus 692 95,05
Republic of Turkey (TC) 16 2,20
Other 3 0,41
Northern Cyprus-Republic of Turkey
17 2,34
Education status f %
Undergraduate 627 86,13
Graduate 101 13,87
Professional seniority f %
1-5 years 57 7,83
6-10 years 142 19,51
11-15 years 205 28,16
16-20 years 199 27,34
21 years and above 125 17,17
Branch f %
Science-maths 170 23.35
Social sciences and literature 259 35.58
Foreign languages 123 16.90
Art – technic sciences – physical education
176 24.18
Regions where he/she works
f %
Nicosia 329 45,19
Kyrenia 107 14,70
Famagusta 143 19,64
Güzelyurt 93 12,77
İskele 56 7,69
Teaching grade f %
Secondary school 228 31,32
High school 312 42,86
College 188 25,82
Participation at on-the-job training
f %
Participant 200 27
Non-participant 528 73
Total 728 100,0
When table 2 is examined, it can be seen that the number of female teachers is higher compared to male teachers, the number of teachers at 31-40 age interval is higher, teachers who are citizens of Northern Cyprus are in majority, education status of teachers is undergraduate level, the demand for graduate education is not sufficient, majority of teachers had 11-20 years of experience, the number of teachers in verbal fields is higher compared to teachers in maths, arts and technical fields, most teachers work in the capital Nicosia region, teachers want to improve themselves and have positive opinions towards learning novel education techniques and methods.

Journal for Educators, Teachers and Trainers JETT, Vol. 9 (2); ISSN: 1989-9572
15
2.2. Data collection tool and collection of data Data collection tool of the study consists of 2 sections. The first section consists of “personal information form” consisting of 9 items with the purpose of gathering personal information of teachers. The form was prepared in order to determine the “gender”, “age”, “nationality”, “education status”, “professional seniority”, “branch”, “participation at on-the-job training courses” and “region of duty”. In the second section, the “Opinion survey on usage of cooperative learning method of teachers” consisting of 48 items which was adapted from English to Turkish by Kara, Bicen and Uzunboylu (2009) to study on philosophy group teachers. The survey was applied to 20 teachers reporting to secondary education office in the scope of validity and reliability. In calculating the survey reliability coefficient, Cronbach Alpha test which is a method based on item variance was conducted and reliability level was found as .70. Then, scores arising from item analysis was examined and the 8 items which received low scores was excluded under the guidance of 2 educationists and improvements were made on the items. A questionnaire consisting of 40 items and 5 Likert type questions was made suitable for the target group. 2.3. Analysis and interpretation of data SPSS 16.0 (Statistical Package for the Social Sciences) package programme was used in the statistical analysis of the data. In order to determine the hypothesis tests to be used in statistical analysis, Shapiro-Wilk (S-W) which is a normality test was employed so as to examine whether the data set showed normal distribution. According to K-S test results, it was found out that the data set showed normal distribution. Accordingly, parametric hypothesis tests were used in comparing the opinions of teachers on the questionnaire with independent variables. Frequency tables were used in determining the demographic and professional characteristics of teachers. If the number of independent variables was two, t test was used. If the number of independent variables was more than two and variances were homogeneous, Variance Analysis (ANOVA) was employed. If statistically significant difference is found as a result of variance analysis, Post Hoc Tukey test was applied as an advanced analysis method in order to find the variable which is the origin of the difference. As the variances of regions where teachers work is not homogeneous, Kruskal-Wallis test which is a non-parametric hypothesis test was used in comparing the questionnaire scores according to regions. If statistically significant difference is found as a result of Kruskal-Wallis test, Mann Whitney U test was applied as an advanced analysis method in order to find the variable which is the origin of the difference. 3. Findings and interpretations This section includes the conclusions and interpretations as regards the findings in the direction of determined purposes. 3.1. Distribution of answers given by teachers to cooperative learning questionnaire The distribution of answers given by teachers to cooperative learning survey and minimum and maximum item values as well as general mean values are given in table 3.

Journal for Educators, Teachers and Trainers JETT, Vol. 9 (2); ISSN: 1989-9572
16
Table 3. Distribution of Answers given by teachers to cooperative learning questionnaire
Str
on
gly
Dis
ag
ree
Dis
ag
ree
Neu
tra
l
Ag
ree
Str
on
gly
Ag
ree
ss % % % % %
1. When I use cooperative learning methods my students tend to deviate from their tasks.
21,86 27,13 13,23 21,46 16,33 3,37 1,37
2. Each teacher is able to successfully apply cooperative learning.
17,68 21,46 15,65 25,78 19,43 3,08 1,40
3. Material resources are needed to apply cooperative learning.
14,30 20,78 10,93 26,18 27,80 3,33 1,44
4. Competition is the best method which prepares students to real life.
15,65 20,24 13,50 30,09 20,51 3,59 1,26
5. Cooperative learning leaves successful students in the shadows.
30,09 43,72 11,47 8,77 5,94 3,03 1,41
6. Currently there is too much demand for change in education.
8,10 13,90 12,28 35,63 30,09 3,66 1,26
7. Cooperative learning is suitable for my education philosophy.
8,50 9,45 12,01 40,49 29,55 3,74 1,22
8. My students lack the qualifications needed for cooperative group study.
19,97 30,77 14,17 21,59 13,50 3,39 1,31
9. My success in cooperative learning depends on the support I receive from my teacher colleagues.
25,10 25,51 12,96 20,78 15,65 2,77 1,43
10. Using cooperative learning method can cause several disciplinary problems between students in my class.
19,97 31,04 12,01 22,40 14,57 3,42 1,32
11. Using cooperative learning methods ensured my progress in career.
22,94 20,38 17,68 23,62 15,38 2,87 1,39
12. One of the requirements for success in cooperative learning method is the support of school management.
6,34 9,04 6,34 39,81 38,46 3,95 1,18
13. Cooperative learning conflicts with the goals of parents.
22,94 35,76 16,60 16,19 8,50 3,24 1,31
14. Cooperative learning is a valuable teaching approach.
2,29 3,51 7,56 46,29 40,35 4,19 0,89
15. If the groups are homogeneous students can learn the material better.
4,05
8,10
9,72
45,34
32,79
3,95
1,06
16. During the employment of cooperative learning method several students can expect the project to be prepared by other group members.
7,56 11,20 12,82 41,84 26,59 3,69 1,20
17. Cooperative learning is suitable for 1st level
grades. 12,01 14,84 19,43 32,52 21,19 3,36 1,30
18. It is impossible to apply cooperative learning method without special materials.
18,76 27,40 14,84 22,40 16,60 2,91 1,38
19. Cooperative learning puts too much emphasis on the improvement of social aspects of students.
9,18 18,35 16,19 31,98 24,29 3,80 1,10
20. Being in interaction in cooperative learning improves the social aspects of students.
2,56 4,45 5,13 48,85 39,00 4,17 0,91
21. It is impossible to evaluate students fairly with cooperative learning method.
22,13 33,60 17,00 17,95 9,31 3,27 1,30
22. There is too little time to prepare students for working effectively in groups.
13,63 19,16 8,50 28,07 30,63 3,80 1,26
23. There are so many students in my classroom that it is not possible to implement
14,17 21,73 7,56 31,58 24,97 3,75 1,24
X

Journal for Educators, Teachers and Trainers JETT, Vol. 9 (2); ISSN: 1989-9572
17
cooperative learning effectively.
24. Using cooperative learning method makes contribution to the friendship relations between students.
1,75 2,70 3,37 46,69 45,48 4,32 0,82
25. Cooperative learning develops social aspects of students.
1,48 2,16 3,51 50,20 42,65 4,30 0,77
26. Equal responsibility is given to each group member in cooperative learning.
4,05 10,80 10,12 43,05 31,98 3,88 1,10
27. Cooperative learning can be performed in a student-centred manner.
2,16 2,83 8,10 46,56 40,35 4,20 0,87
28. Using cooperative learning increases the positive attitudes of students towards teachers.
2,02 2,43 7,29 49,93 38,33 4,20 0,84
29. Cooperative learning facilitates the learning of students at lower levels.
4,45 7,29 13,77 44,67 29,82 3,88 1,06
30. Students in the classroom possess the qualifications needed for cooperative group work.
14,98 19,16 17,95 28,34 19,57 3,18 1,35
31. Cooperative learning is a valuable teaching approach.
2,56 2,29 6,75 46,02 42,38 4,23 0,87
32. Students can perform studies in small groups with cooperative learning.
1,08 2,83 6,07 51,96 38,06 4,23 0,78
33. Cooperative learning creates a suitable environment for the creation of supporting learning products.
1,75 2,16 8,23 52,23 35,63 4,18 0,81
34. In cooperative learning group members are responsible not only for their own learning but also the learning of their friends.
3,37 6,34 8,91 47,23 34,14 4,02 0,99
35. Cooperative learning puts too much responsibility on students.
8,50 14,57 12,42 38,60 25,91 3,88 1,07
36. Cooperative learning can act as a guide for the learning of students.
2,97 3,51 6,88 50,07 36,57 4,14 0,91
37. Preparation and application of cooperative learning method takes too much time.
13,90 27,26 16,60 24,43 17,81 3,60 1,20
38. Cooperative learning can leave successful students in the shadows.
21,86 31,85 18,49 17,68 10,12 3,26 1,31
39. Applying cooperative learning steals away too many class hours.
18,22 27,94 13,63 22,67 17,54 3,48 1,30
40. Cooperative learning is an easily applicable method. 14,57 24,02 17,68 26,05 17,68 3,08 1,33
When table 3 is examined, it is seen that teachers thought that cooperative learning increased social relations between students, improved friendship relations, that cooperative learning could be applied in classroom environment and that the method was really valuable; it is also noticeable that they think that they have self-confidence that they will be successful in cooperative learning, that they thought that the development related to their careers were not relevant to cooperative learning and that they thought that cooperative learning could be applied without using a special tool or instrument. Table 4 gives the general mean scores of the answers given by teachers to cooperative learning questionnaire. Table 4. Definitive statistics of answers given by teachers to cooperative learning questionnaire
N
sd Min. Max.
Cooperative learning questionnaire 728 3,51 0,33 2,50 4,43
When table 4 is examined, it is found out that teachers agreed to the cooperative learning questionnaire at the ratio of 3.51. In this context, teachers agreed that cooperative learning applications would make contribution to teaching process.
X

Journal for Educators, Teachers and Trainers JETT, Vol. 9 (2); ISSN: 1989-9572
18
3.2. Comparison of opinions of teachers as regards cooperative learning according to their demographic characteristics In this section the tables, findings and comments as regards comparison of opinions of teachers as regards cooperative learning according to their demographic characteristics are provided. 3.2.1. Comparison of opinions of teachers as regards cooperative learning according to their gender and education status T test results as regards comparison of mean scores obtained by teachers covered by the study from cooperative learning questionnaire according to their gender and education status are given in table 5. Table 5. T test results as regards comparison of cooperative learning questionnaire scores of teachers according to their gender and education status
Demographic characteristics n
sd t p
Gender Male 208 3,49 0,33 -1,06 0,29
Female 520 3,52 0,33 Education status
Undergraduate 627 3,52 0,34 1,82 0,07
Graduate 101 3,45 0,31
An examination of table 5 shows that there is no statistically significant difference between mean scores obtained by teachers covered by the study from cooperative learning questionnaire according to their gender and education status [t=-1,06, p>0,05]. The opinions of female and male teachers as regards the questionnaire are similar. Likewise, when the scores obtained by teachers from cooperative learning questionnaire are examined according to their education status, it has been found out that the difference between mean scores obtained by teachers with undergraduate and graduate degrees from the questionnaire was statistically insignificant [t=1,82, p>0,05]. 3.2.2. Comparison of opinions of teachers as regards cooperative learning according to their age group and nationality ANOVA results as regards comparison of mean scores obtained by teachers from cooperative learning questionnaire according to their age group and nationality are given in table 6. In addition, Tukey test was used as variances were homogeneous.
X

Journal for Educators, Teachers and Trainers JETT, Vol. 9 (2); ISSN: 1989-9572
19
Table 6. Variance analysis (ANOVA) results as regards the comparison of cooperative learning questionnaire scores of teachers according to their age group and nationality
Demographic characteristics n
sd Min. Maks. F p Tukey
Age group
30 years and below 127 3,52 0,31 2,63 4,18 3,84 0,00* 2-3
31-35 years 164 3,44 0,33 2,60 4,30
36-40 years 208 3,57 0,34 2,55 4,43
41-45 years 142 3,48 0,32 2,50 4,20
46 years and above 87 3,53 0,36 2,83 4,35
Nationality**
Northern Cyprus 692 3,51 0,33 2,55 4,43 2,23 0,11
TC (Republic of Turkey) 16 3,59 0,27 3,18 4,13
Northern Cyprus -TC 17 3,36 0,34 2,50 3,83
*p<0,05 , **”other” option was not included in the analysis.
When table 6 is examined, it is found out that there is statistically significant difference between mean scores obtained by teachers covered by the study from cooperative learning questionnaire according to their age group [F(df)= 3,84; p<0,05]. This difference is caused by the teachers in 31-35 age group and 36-40 age group. teachers in 31-35 age group received 3,44±0,33 points from the questionnaire which is lower compared to teachers in 36-40 age
group ( 57,3x ). As the other option was n=3, it was not included in the analysis so that it would not affect the result accordingly, it can be seen that teachers in 36-40 age group at schools under secondary education office had a more positive stance towards cooperative learning. 3.2.3. Comparison of opinions of teachers as regards cooperative learning according to their type of school The comparison of secondary school-high school and college-science high school where the teachers worked is given in table 7. Table 7. T Test results as regards the comparison of cooperative learning questionnaire scores of teachers according to their type of school
School type n
ss t p
Regular secondary school-high school 514 3,50 0,33 -1,18 0,24
College-science high school 214 3,53 0,33
When table 7 is examined, it is seen that there is no statistically significant difference between opinions of teachers covered about cooperative learning questionnaire according to their type of school [t= -1,18, p>0,05]. 3.2.4. Comparison of opinions of teachers as regards cooperative learning according to the region they are working Table 8 gives the results on Nicosia, Kyrenia, Famagusta, Güzelyurt and İskele regions where the teachers worked.
X
X

Journal for Educators, Teachers and Trainers JETT, Vol. 9 (2); ISSN: 1989-9572
20
Table 8. Kruskal Wallis Test Results as regards the comparison of cooperative learning questionnaire scores of teachers according to the region they work
Region n Rank mean value χ2 p U
Nicosia 329 352,29 15,05 0,00* 1-4
Kyrenia 107 372,43
3-4
Famagusta 143 370,76
3-5
Güzelyurt 93 427,73 İskele 56 300,11 *p<0,05
When table 8 is examined, it was found out as a result of Ksuskal Wallis Test that distributions were not homogeneous. Mann Whitney U test was conducted to compare regions with each other on an individual basis. In the end, there is difference between opinions of teacher son cooperative learning in Nicosia-Güzelyurt, Famagusta-Güzelyurt and Famagusta-İskele. Accordingly, teachers working at Nicosia region at schools under secondary education office have more positive opinions on cooperative learning compared to teachers in Güzelyurt region, and that teachers in Famagusta region provided more positive opinion compared to teachers in Güzelyurt and İskele regions. 3.2.5. Comparison of opinions of teachers as regards cooperative learning according to the professional seniority, branch and level of school of teachers Anova results as regards cooperative learning according to their professional seniority, branch and school level is given in table 9. Table 9. Variance Analysis (ANOVA) results as regards the comparison of cooperative learning questionnaire scores of teachers according to professional seniority, branch and level of school of teachers
n sd Min. Max. F p Tukey
Professional seniority 5 years and below 57 3,48 0,33 2,65 4,18 1,26 0,28
6-10 years 142 3,46 0,33 2,60 4,43 11-15 years 205 3,52 0,32 2,55 4,30 16-20 years 199 3,52 0,33 2,50 4,25 21 years and above 125 3,54 0,36 2,83 4,35 Branch
Science studies - maths 170 3,48 0,35 2,50 4,35 0,85 0,47 Social studies - literature 259 3,53 0,32 2,55 4,43
Foreign languages 123 3,52 0,33 2,60 4,30 Arts-technical knowledge-physical education 176 3,51 0,34 2,60 4,18 School level
Secondary school 228 3,44 0,34 2,60 4,35 7,36 0,00* 1-2
High school 312 3,55 0,32 2,55 4,30
1-3
College 188 3,52 0,33 2,50 4,43 *p<0,05
When table 9 is examined, it is seen that there is no statistically significant difference between opinions of teachers on cooperative learning according to their seniority [F(df)=1,26; p>0,05]
X

Journal for Educators, Teachers and Trainers JETT, Vol. 9 (2); ISSN: 1989-9572
21
and branch [F(df)=0,85; p>0,05]. However, it is found out that there is significant difference according to school level. Tukey test was conducted in order to determine the source of this difference and it was found out that there is difference between secondary school-high school and secondary school-college levels. Accordingly, it is observed that teachers working at secondary schools under secondary school office have more positive views about cooperative learning compared to teachers working at high schools and colleges. 3.2.6. Comparison of opinions of teachers as regards cooperative learning according to their participation at on-the-job training courses on cooperative learning Test results as regards cooperative learning of teachers according to their participation at on-the-job training courses are given in table 10. Table 10. T Test results as regards the comparison of cooperative learning questionnaire scores of teachers according to their participation at on-the-job training courses on cooperative learning
Participation at on-the-job training n
sd t p
Participants 200 3,44 0,32 -3,73 0,00*
Non-participants 528 3,54 0,33 *p<0,05
When table 10 is examined, it was concluded that the opinions of teachers who participate and do not participate at on-the-job training courses as regards were positive cooperative learning, but the opinions of teachers who receive don-the-job training provided slightly higher approval [t= -3,73, p<0,05]. Accordingly, it is observed that the teachers working at schools under secondary education office who participated at on-the-job training provided more positive opinions on cooperative learning and that on-the-job training courses were effective. 4. Conclusions and recommendations In this study, the opinions of teachers working at schools under general secondary education level on cooperative learning were evaluated. In this context it was concluded that the opinions of teachers on cooperative learning applications were positive and similar according to their gender. Likewise, the opinions of teachers with undergraduate and graduate degrees on cooperative learning applications are also positive and similar. In addition, the opinions of teachers working at secondary schools, high schools and colleges on cooperative learning applications are also positive and similar. Another conclusion is that teachers in 36-40 age interval have more positive views towards cooperative learning. It is found out that the teachers in Nicosia region working at schools under secondary education office have more positive views towards cooperative learning compared to teachers at Güzelyurt region and that teachers working in Famagusta region have more positive views on cooperative learning according to teachers in Güzelyurt and İskele regions. The opinions of teachers on cooperative learning are positive and similar according to their seniority and branch. However, it is concluded that teachers working at secondary schools have more positive views on cooperative learning compared to teachers working at high schools and colleges. The opinions of teachers who receive and do not receive on-the-job training are positive on cooperative learning; however, it is concluded that teachers who received courses provided slightly more positive views. It is found out that all teachers provided their opinion as “I agree” at 3.51 ratio to cooperative learning questionnaire.
X

Journal for Educators, Teachers and Trainers JETT, Vol. 9 (2); ISSN: 1989-9572
22
In this context, teachers provided positive opinion that cooperative learning applications would make contribution to education process. When the answers given by teachers to the applied questionnaire are examined, the opinions that cooperative learning improved social relations between students, improved theirs friendship relations, that cooperative learning could be applied to students in class environment and that the method was really valuable became evident. In addition, it is noticeable that teachers have self-confidence in that they could be successful in cooperative learning, believed that the developments related to their career were not relevant to cooperative learning and thought that cooperative learning could be applied without special tools and instruments. Contrary to these results, Kara, Bicen and Uzunboylu (2009) conducted a study in order to determine the opinions of 38 philosophy group teachers in Northern Cyprus on cooperative learning method and found out that there was a neutral attitude towards the application of cooperative learning. This situation showed that teachers did not have much information on this method. There are parallel studies in the literature on these conclusions. Arslan and Zengin (2016) examined the impact of cooperative learning method and traditional learning method on the scientific and social skills of university science studies teachers in laboratory classes and determined that “together learning technique” which is a cooperative learning method technique had positive impact on scientific and social skills. Likewise, Aydın and Alakuş (2009, 66) stated a parallel opinion by expressing in their study that cooperative leaning method had important contributions to development of cognitive field, that this method ensured that social skills are developed, anxiety is eliminated and classes and school were more liked. Recommendations are provided according to the conclusions of the study:
Cooperative learning environments must be increased and used in several classes. however, teachers need on-the-job training programmes conducted by experts so that teachers can implement cooperative learning techniques.
On-the-job training courses must be organized on cooperative learning and it must be emphasised in these training activities that cooperative learning is more comprehensive than a group study.
5. References Abdullah, S., and Shariff, A., (2008). The effects of inquiry-based computersimulation with
cooperative learning on scientific thinking and conceptualunderstanding of gas laws. Eurasia Journal of Mathematics, Science & Technology Education, 4 (4), 387-398.
Arnavut, A., & Ozdamli, F. (2016). Examination of studies on technology-assisted collaborative learning published between 2010-2014. Cypriot Journal of Educational Sciences, 11(3), 119-125. doi:10.18844/cjes.v11i3.1021
Arslan, A. and Zengin, R. (2016). The Effect of Cooperative Learning on Scientific and Social Skills. Adıyaman University Journal of Educational Sciences. doi: http://dx.doi.org/ 10.17984/adyuebd.18078
Aydın, S. and Alakuş, A. O. (2009). İşbirlikli Öğrenmeyle Görsel Sanatlar Dersini İşlemenin Öğrencilerin Başarısına ve Öğrenilenlerin Kalıcılığına Etkisi. Dicle Üniversitesi Ziya Gökalp Eğitim Fakültesi Dergisi, 13 (2009), 63-77.
Büyüköztürk, Ş., Çakmak, E. K.; Akgün, Ö. E., Karadeniz, Ş., Demirel, F. (2009). Bilimsel araştırma yöntemleri. Ankara: Pegem A Yayıncılık.
Byrd, D. (2012). Social studies education as a moral activity: teaching towards ajust society. Educational Philosophy and Theory, 44 (10), 1073-1079.
Fernández Álvarez, M. y García Laborda, J. (2011). Teachers’ interest for a computer EFL University Entrance Examination. British Journal of Educational Technology, 46(6), E136-140.
Framework For 21st Century Learning (2007). from http://www.p21.org/our-work/p21-framework15.09.2017

Journal for Educators, Teachers and Trainers JETT, Vol. 9 (2); ISSN: 1989-9572
23
García Esteban, S & García Laborda, J. (2018). Technology Based Reflective Practice in Primary ELT Teacher Education. Onomázein. http://onomazein.letras.uc.cl/Articulos/N41/41_9-Garcia.pdf
Gutierez, S. (2017). Breaking barriers: Research-based collaborative professional development between in-service teachers and university researchers. New Trends And Issues Proceedings On Humanities And Social Sciences, 4(1), 261-269. doi:10.18844/prosoc.v4i1.2264
Kara, N.S., Bicen, A. and Uzunboylu, H.(2009). Assessment of the views of philosophy group teachers about cooperative learning. TRNC Journal of National Education, 3, pp.41-56
Karasar, N. (2009). Bilimsel Araştırma Yöntemi (19b.). Ankara: Nobel Yayınları. Keser, H., Uzunboylu, H., & Ozdamli, F. (2011). The trends in technology supported
collaborative learning studies in 21st century. World Journal on Educational Technology, 3(2), 103-119.
Prichard, J. S., Bizo, L. A., and Stratford, R. J. (2006). The educational ımpact of team skills training: preparing students to work in groups. British Journal of Educational Psychology, 76, 119–140.
Smith, K. A. (1996). Cooperative Learning Making “Groupwork” Work. New Directions for Teaching and Learning, 67, 71-81.
Şimşek, Ü., Doymuş, K. and Şimşek, U. (2008). “İşbirlikçi öğrenme yöntemi üzerine derleme çalışması: II. işbirlikçi öğrenme yönteminin sınıf ortamında uygulanması”. Erzincan Eğitim Fakültesi Dergisi, 10(1), 123-142.
Tuncer, M., & Dikmen, M. (2017). The effect of cooperative learning on academic achievement: A metaanalysis on the relationship between the study group size and effect size. Journal of Human Sciences, 14(1), 473-485. doi:10.14687/jhs.v14i1.4314
Türkmen, H. (2016). Evaluation Of Teachers’ Views of Cooperative Learning and Their Interventions in Cooperative Learning Process. Journal of European Education. 6 (1) 2016.
Uzunboylu, H., and Hursen, Ç. (2011). Öğretim ilke ve yöntemleri. Ankara: Pegem Akademi. Wang, M., (2012). Effects of cooperative learning on achievement motivation of female
university students. Asian Social Science. 8 (15) 2012. http://dx.doi.org/10.5539/ass.v8n15p108

Journal for Educators, Teachers and Trainers JETT, Vol. 9 (2); ISSN: 1989-9572
24
ISSN 1989 - 9572
The comparison of the fatigue of families with children who have normal and different developments (with the help of teachers) La comparación de la fatiga de familias con niños que tienen los desarrollos normales y diferentes (con la ayuda de los profesores)
Çiğdem Dürüst,
Cyprus Science University, Norther Cyprus
Journal for Educators, Teachers and Trainers, Vol. 9 (2)
http://www.ugr.es/~jett/index.php
Date of reception: 09 October 2018
Date of revision: 04 December 2018
Date of acceptance: 27 December 2018
Dürüst, Ç. (2018). The comparison of the fatigue of families with children who have normal and different developments (with the help of teachers). Journal for Educators, Teachers and Trainers, Vol. 9(2), pp. 24 – 46.

Journal for Educators, Teachers and Trainers JETT, Vol. 9 (2); ISSN: 1989-9572
25
Journal for Educators, Teachers and Trainers, Vol. 9 (2)
ISSN 1989 – 9572
http://www.ugr.es/~jett/index.php
The comparison of the fatigue of families with children who have normal and different developments (with the help of teachers) La comparación de la fatiga de familias con niños que tienen los desarrollos normales y diferentes (con la ayuda de los profesores) Çiğdem Dürüst, Cyprus Science University, North Cyprus [email protected] Abstract: The research was conducted as a comparative analysis of families with children with special needs and families which have normally developed children. The aim of this study is to determine whether perceived stress, personal well-being, self-esteem, burnout, anxiety and depression levels are affected by having children with special needs. In addition, the study was conducted to determine the relationship between parents’ social skill levels with and without special needs, stress, burnout, self-esteem, anxiety, depression, personal well-being and socio-demographic variables. Interviews were carried out with 240 parents who have at least one 3 years old or above child with and without special needs. Face-to-face interviews were conducted with some participants and others were contacted through teachers. A 'Personal Information Form' was filled in by the participants, ‘Social Skill Scale A‘, ‘Perceptual Stress Scale', 'Personal Well-Being Index-Adult (KIO-Y) Form', 'Rosenberg Self-Esteem Scale', ‘Burnout Inventory Scale’ and 'Hospital Anxiety and Depression Scale were used to determine the level of stress, personal well-being, self-esteem, burnout, depression and anxiety respectively. The findings of the statistical analyses were discussed in according to the results of the research on similar subjects. Six variables related to the parents’ physical and mental health levels were considered. The regression models established to predict the differences in the lives of these parents through these variables were found to be significant for the two groups supporting the literature. Resumen: Esta investigación se realizó para un análisis comparativo de las familias que tienen niños con necesidades especiales y las familias que tienen niños desarrollados normales. El objetivo de este estudio es determinar si los niveles de estrés percibido, bienestar personal, autoestima, agotamiento, ansiedad y depresión se ven afectados por tener hijos con necesidades especiales. Además, se llevó a cabo para determinar ninguna relación entre los niveles de habilidades sociales de los padres con y sin necesidades especiales, estrés, agotamiento, autoestima, ansiedad, depresión, bienestar personal y variables sociodemográficas. Se realizaron entrevistas con 240 padres que tienen al menos un niño de 3 años o más con y sin necesidades especiales. Se condujeron entrevistas personales con algunos participantes. Aquellos que no aceptaron entrevistas personales fueron contactados con la ayuda de los profesores. Se aplicó un "Formulario de información personal" a los participantes. Con el fin de determinar los niveles de habilidad social de los padres, Se utilizaron la 'Escala de Habilidad Social A' y la ‘Escala de estrés perceptual’ para determinar el nivel de estrés, el 'Formulario de índice de bienestar personal-adulto (KIO-Y)' para determinar el nivel de bienestar personal, la 'Escala de autoestima de Rosenberg' para determinar el nivel de autoestima, la 'Escala de inventario de agotamiento' para determinar los niveles de agotamiento y la 'Escala hospitalaria de ansiedad y depresión' para determinar los niveles de depresión y ansiedad. Los resultados de los análisis estadísticos se discutieron de acuerdo con los resultados de la investigación en temas similares. Se consideraron seis variables que se pensaba que estaban relacionadas con los niveles de salud física y mental de los padres en la investigación. Se encontró que los modelos de regresión establecidas para predecir los cambios en las vidas de los padres que tienen niños con y sin necesidades especiales a través de estas variables a ser significativa para los dos grupos con el fin de apoyar la literatura. Keywords: Disabled children; Family; Family needs; Fatigue; Depression; Anxiety
Palabras clave: Niños discapacitados; Familia; Necesidades familiares; Fatiga; Depresión; Ansiedad

Journal for Educators, Teachers and Trainers JETT, Vol. 9 (2); ISSN: 1989-9572
26
1. Introduction Although the concept of family has different functions in different societies or different parts of the society, it is the basic unit of the society. Due to the differentiated functions, it is difficult to make a specific family definition that everyone accepts. In general, it can be defined as the smallest unit of the society in which some common developmental events occur individually or as a group (Gülerce, 2007; Kasapoglu, 1990). Although the structure and functions of the family have changed in the time, the family has survived by preserving its existence. By adapting to all social and environmental conditions, it has adapted itself to the necessary changes. This evolutionary progress shows that in the future, different family types can emerge by continuing the change and development process of the corporation (family) (Cavkaytar, 2000). The question of how the family will progress to the future is an important issue. Since the progress of a healthy and productive existence of humanity is the common point on which all scientific studies are based, the capacity to shape the family and to raise future generations is important. The family existence is still valuable for the future generations. This value is important for the existence of the family as well as the quality of the family. Children are born with a number of qualities. A child finds the first answers about natural curiosity, the desire to learn, the ability to research as well as the conditions of existence in family. In other words, the first educators of children are the parents. Although they are different subgroups, such as parents or other caregivers, they are generally summarized as family surveillance. With the qualities that the child develops at home, the child can be prepared for more rich and qualified learning opportunities in formal education settings or outside the home. Since the age at which pre-school education institutions accept children, parents must support the activities of the school at home even if they think that the education is entirely undertaken by teachers. As education cannot be carried out solely by school, only by family, only by environment or by any case alone (Cook, Klein &Tessier, 2008). At this stage, the relationship between the child and the future will proceed in a meaningful way as much as the parents are equipped to support the process for the future of their children and the society in a quality manner. It is clear that the family is accepted as the basis of the society. It is accepted that children also constitute the most important element in the existence of the family. The child is a product of the family. It is a common part of men and women. A child has the role of the continuation of the generation, a bond which connects the spouses, a vehicle that eliminates longing, the future insurance of the parents, a gift given by the mother and love (Ataman, 2005). With the participation of the child in the family, family relations change. Innovations in relationships occur. Each family tries to prepare for these changes and innovations to the extent of their knowledge, skills and competences. During pregnancy, mothers and fathers dream about the child to be born. During pregnancy, the mother shapes her child to be born. Parents' expectations from life, profession, close environment, individuals and the society differ starting from the pregnancy (Akkök, Aşkar, Karancı; 1992). There are no plans for children that cannot develop normally within the imagination starting with the pregnancy period. Every parent wants their children to be healthy and normal. However, this dream does not always come true. Sometimes, instead of the expected healthy child, a child may be born with disabilities who needs special attention and who will need care throughout their life. Even if the birth of a healthy child can be a disturbing event in the family system for parents, the participation of a child in the family with special development can create significant changes in the family structure and functioning of the family members. It can affect the feelings, thoughts and lives of family members in a negative way. Parents of children with special development have to undertake and fulfill some additional duties and responsibilities compared to families with normal developmental children (Tamer, 2010).

Journal for Educators, Teachers and Trainers JETT, Vol. 9 (2); ISSN: 1989-9572
27
Today, many research reveal that children born with special needs need different attention, different attitudes and behaviors, different technologies, in short, different living standards. This can also be observed in practice. It is evident that parents with children with special needs have to work more in some areas in order to overcome some of the obstacles and inadequacies that parents have to cope with or have to cope with. Even for some children and their families, who are often unaware of normal development, some conditions may be encountered as difficult problems for children and families with special development. Therefore, the removal of obstacles will be possible by determining what obstacles are actually (Öznacar, 2018; Entwisle et al. ,2017). In the comparative studies of the families of children with normal development and the families of children with special development, some differences were determined in the responses of the families. These reactions are tried to be explained with various models. It is known as “Stage Model” and it is assumed that families come through various stages and come to the stage of acceptance and adaptation. Shock, denial, grief and depression (depression) in the first stage described by the stage model; mixed feelings in the second stage, anxiety, guilt, resentment, shame; in the third stage, they experience the feeling of door-to-door travel, agreement, adaptation-rearrangement, acceptance and adaptation (Ataman, 2005; MEB, 2006; Pearce, 1996; Yörükoğlu, 1998). The idea that has been supported for years in the literature is that having a child with special needs causes the family to undergo significant tremors as a whole (Hintermair, 2006; Jackson & Turnbul, 2004; Longo & Bond, 1984; Pipp-Siegel, Sedey & Yoshinaga-Itano, 2002; Şen, 1991). The fact that one of the members in the family is in a state of inability can change the life of the family in such a way that there is no return. In this case, the psychological requirements of family members may change over time, crisis situations and long-term stress sources can affect all family members (Walsh, 2006). The role of a child with different characteristics is not a role of parents and they never prepare themselves for this role. Having children with special needs increases the emotional, social, economic and physical difficulties in families. Parents who struggle to cope with life challenges have to face and challenge more difficulties due to the special needs of their children. In some respects, institutional structures seem to alleviate the struggle of families with difficulties, but social prejudices still continue. The inadequacy of the studies on the determination of the problems caused the families not being able to cope with the problems alone and the institutional studies on this issue are also insufficient (Güngör, 1999). If the child who is born as a disabled person cannot play his / her role in the family fully, this may lead to adaptation problems in the family. Due to the inadequacy of the individual, age, sex, social and cultural differences due to their inability to play properly is an obstacle. This may cause harmony problems within the family (Özgüven, 1999; Özsoy, Özyürek & Eripek, 1998). The relationship between parents is negatively affected by the participation of a child with disability. The duties and responsibilities of all family members, especially the parents, increase considerably. Social, physical, material and spiritual difficulties begin. This may disrupt family relations. Some families have difficulty dealing with this situation (Sandalcı, 2002). Parents, who have children with special needs, therefore need attention and motivation (Kiani & Nami, 2017). Families with children with special needs may experience difficulties such as anxiety, stress, depression and disagreements between spouses. They may be affected by the negativity that may arise due to the degree of inadequacy of the child with special needs. It can be observed that this situation is more complicated than the families with normal development (Hastings & Brown, 2002).

Journal for Educators, Teachers and Trainers JETT, Vol. 9 (2); ISSN: 1989-9572
28
2. Aim of the research Having a child with special needs can create social, psychological and physical influences compared to non-families. Even if the parenting skills of the individuals are affected by this situation, the social relationships of the parents, mental health, social skills which have important place in life can continue in a negative way. In the studies reviewed in the literature, it is noteworthy that mental health is affected by the difficulties experienced by the family members who have children with special needs. In addition to having to live with an individual who already has difficulties and insufficiencies, they will make life more difficult for them to feel and practice some emotional and spiritual difficulties in their lives. For this reason, it is obvious that they need to get help from experts in this field for early intervention. In the studies conducted in the field, it is noteworthy that in the interviews conducted with the participants during the study, the families expressed the need for psychological help in order to cope with the problems (Özşenol et al., 2003). All these reasons shaped this research. In this study, it is aimed to evaluate the families with and without special needs in terms of the relevant variables. Comparative analysis of families with and without children with special needs was conducted by assessing the subject in terms of depression, anxiety and burnout. Thus, it is planned to show whether there are some deficiencies due to the fact that families with children with special needs have children with special needs. 3. Methodology
3.1. Participants The participants of the study consist of 240 parents living in the northern part of Cyprus with at least one three years old and above child. 120 of them have children with special needs and constitute 50% of the research population. The other 50% are 120 parents with normally developed children. The parents of children with special needs are families who continue their education in a rehabilitation center. Parents, who do not have children with special needs, are the parents who attend a kindergarten or school. Having a child over 3 years of age is determined by assuming that the parent has practiced a 3-year parenting practice. It is thought that the probabilities of living in the difficulties that come with the parenthood in 3 years and their deficiencies and experienced psychological, emotional and social problems will be seen more clearly. 3.2. Scales The personal information of the parents who participated in the study was collected by the researcher 'Personal Information Form'. In order to determine the social skill levels of the parents, ‘Social Skill Scale A’ is used to determine the level of stress, 'Perceived Stress Scale' to determine stress levels, ‘Personal Well-Being Index-Adult (KIO-Y) Form’ in order to determine their personal well-being, ‘Rosenberg Self-Esteem Scale' in order to determine self-esteem levels, 'Burnout Scale' to determine burnout levels 'Hospital Anxiety and Depression Scale was used to determine depression and anxiety levels. Personal Information Form is an information form created and applied by the researcher for the purpose of age, marital status, income level, educational status, working status of the participants. Social Skills Scale-80 A is a 5-point Likert-type scale consisting of 80 items. The items of the scale consisting of 24 reverse items are scored between 1 and 5 (1: Never, 5: Always). High score from the scale shows that social skill level is high (Tatar et al., 2018).

Journal for Educators, Teachers and Trainers JETT, Vol. 9 (2); ISSN: 1989-9572
29
Perceived Stress Scale (PSS-Perceived Stress Scale) is a 14-item scale developed by Cohen et al. In the following part of the study, the item total correlation of the 10-item short form-generated Perceived Stress Scale was calculated by Cohen et al. It was decided to subtract the sixth and eighth item from the scale since the item total score correlation values were below 0.20. Item total correlation was recalculated after the items were removed from the scale. The Cronbach Alpha coefficient, which was 0.54 before the substances were removed, increased to 0.81 (Bilge, Öğce, Genç and Oran, 2009). Perceived Stress Scale is a 5-point Likert-type scale (0: None, 4: Very frequent). Five items of the scale were plain (1, 2, 3, 7, and 8 items) and three items were reversed (items 4, 5, 6). The scale has two subscales: the stress subscale (items 1, 2, 3, 7, and 8) and the coping subscale (items 4, 5, 6). The Cronbach Alpha coefficient of the stress subscale was 0.84 and the Cronbach Alpha coefficient of the coping subscale was 0.69. The total score to be taken from the scale is 0-32, the total score to be taken from the stress subscale is 0-20, and the total score to be taken from the coping subscale is between 0 and 12 points. High scores on the scale and the subscales indicate that the perceived stress is high (Bilge, Öğce, Genç ve Oran, 2009) Personal Well-Being Index-Adult Turkish Form is a 11-point likert that aims to measure satisfaction levels of individuals in eight living areas, including standard of living, spirituality/religion, personal health, future survival, life success, social bonding, personal relationships and personal security. type (0: I'm not satisfied at all-5: I'm unsure 10: I'm completely satisfied) is a measurement tool. There is no reverse coded item of this measurement instrument. The score that can be taken from the scale ranges between 0-80 (0: Lowest, 80: Highest). The average of the scores obtained from eight habitats is the score obtained from the scale. The increase in the score obtained from this scale shows that personal well-being increases. The score obtained from the scale is indicated by the formula [(Maximum Score from the Scale / Highest Score of the Scale) x 100] and it is evaluated between 0 and 100 points (Lau, Cummins & Mcpherson, 2005; Meral, 2014). According to the results of the item analysis, the item total correlation values ranged from 0.42 to 0.71. This shows that the scale items represent the scale adequately. The reliability of the scale was also measured by the internal consistency method. Cronbach Alpha coefficient was 0.86. Confirmatory factor analysis as a result of the factor structure of the scale is the only original form in Turkey (Meral, 2014) as a result of Northern Cyprus is maintained in the adult sample was determined. The Rosenberg Self-Esteem Scale was developed in 1965. From 63 items and 12 subscales (Self-Esteem, Self-Concept Continuity, Criticism to Criticism, Participation in Debates, Feeling Threatened in Interpersonal Relations, Trusting People, Depressive Affection, Imagination, Parental Interest, Father Relationship, 36 Psychic Isolation and Psychosomatic Symptoms) income. It was translated into Turkish in 1986 by Çuhadaroğlu (1986). The validity of the scale is 0.71, and the test-retest reliability is variable between 0.49 and 0.89 (Çuhadaroğlu, 1986). In this study, Self-Esteem of the Rosenberg Self-Esteem Scale was used. The Rosenberg Self-Esteem Scale consists of 10 questions and six items (The quaternary is in the form of a Likert type and each item contains options such as ‘Completely True', 'True', 'False', 'Completely False'). The first three items of the scale (Article 1), the fourth and fifth items (Article 2), the sixth (Article 3), the seventh (Article 4) and the eighth (Article 5) separately, the ninth and the tenth items (Article 6) are scored among themselves. The scores are 0-6 points and 0-2 points high, 2-4 points moderate, 5-6 points low self-esteem (Çuhadaroğlu, 1986). The original form of Burnout Scale was developed in 1988 by Pines and Aronson. Adaptation to Turkish was done by Çapri (2006). The Cronbach Alpha coefficient was found to be 0.93 according to the results of the validity and reliability studies of the 21-item Burnout Inventory. As

Journal for Educators, Teachers and Trainers JETT, Vol. 9 (2); ISSN: 1989-9572
30
a result of the factor analysis, the scale has three components but it is stated that it has only one factor. Seven items of the scale (2, 5, 8, 12, 14, 17, 21) include emotional exhaustion; seven items (3, 6, 9, 11, 15, 18, 19) mental exhaustion; the remaining seven items (1, 4, 7, 10, 13, 16, 20) are the items of physical exhaustion components. The correlation between the three components ranges from 0.78 to 0.96("p and lower" scores no burnout, points between "3-4" is burnout sign of danger; points between “4-5” is burnout status, points between “5 and above” is high burnout level (Çapri, 2006) 3.2.1. Implementation of the scales Face-to-face interviews were held with parents who accepted face-to-face interviews. Those who preferred to participate in the face-to-face interview were included in the research by scaling the scales to rehabilitation centers and schools. Participants with and without special needs were not asked for any identification. Answering the questions in the individually filled form lasted approximately 45-50 minutes according to the measurement of time to face. 3.2.2. Data analysis Frequency analysis was performed to measure the distribution of sociodemographic variables. Descriptive analysis was performed in order to measure the smallest and largest values of the total scores and to examine the averages and standard deviations. Correlation analysis was performed to see the relationship between the scores of the scales. All analyses were done by using SPSS program. 4. Results A child with special needs from the family imposes important responsibilities on the whole family. Providing special education skills for the child, managing behavioral problems, being in constant communication with the school, maintaining the relationship between spouses and other children, accepting that the child develops differently from their peers, his responsibilities such as visiting the hospital, doctor, physiotherapist, special education teacher in the order required are among the most important. Time spent with special needs and responsibilities for the care of children from their families is more than the families of children with normal development. Therefore, families who have children with special needs are more active in dealing with problems (Cavkaytar, Batu & Çetin, 2008; Ersoy & Çürük, 2009; Kiani & Nami, 2017; Özşenol, Işıkhan, Ünay, Aydın, Akın & Gökçay, 2003). The social life and social activities of the parent, who undertakes the care of the child with special needs and who are struggling more for the child, have difficulty in fulfilling their roles. It may need more social support (Cangür, Civan, Çoban, Koç, Karakoç et al., 2013). Therefore, the families of children with special needs are much more affected by the difficulties. Economic problems may increase emotional exhaustion. Continuous care may cause these families to suffer from physiological disturbances, social closure, shame, guilt, anger, overload and loss of control particularly (Gallagher, Phillips, Oliver & Carroll, 2008; Sivrikaya & Tekinarslan, 2013). As a result, families of children with special needs experience more psychological problems such as stress, anxiety and depression than families with normal developmental children (Ersoy ve Çürük, 2009; Kiani & Nami, 2017; Sivrikaya & Tekinarslan, 2013). Many studies emphasize this (Şengül & Baykan, 2013). In related studies, the families with children with special needs show more depressive symptoms than other families, and they experience problems such as depression, anxiety, alcohol dependence and somatic complaints and have low social support (Smith & Grzywacz, 2014; Uğuz, Toros, İnanç & Çolakkadıoğlu, 2004). Among the mothers who have children with special needs, it is stated that mothers with mentally handicapped children experience more stress and depression than other families (Özşenol, Işıkhan, Ünay, Aydın, Akın & Gökçay, 2003; Smith & Grzywacz, 2014). Parents with mentally handicapped children, who need more care than those with mental disability levels, are reported to have more psychological and physical health problems than other parents (Cangür, Civan, Çoban, Koç, Karakoç et al., 2013;

Journal for Educators, Teachers and Trainers JETT, Vol. 9 (2); ISSN: 1989-9572
31
Özşenol, Işıkhan, Ünay, Aydın, Akın & Gökçay, 2003). Likewise, the families of adults with mental disabilities who expressed less social support than their surroundings stated that they had more adverse conditions (Ben-Zur, Duvdevany & Lury, 2005). When the reasons of the physiological, psychological and social problems experienced by the family with having children with special needs are examined, it is noteworthy that families have many difficulties in meeting the needs of the care and education of children with special needs (Ersoy & Çürük, 2009). The negative reactions of the family and the surrounding environment to the situation, the disruption of the social environment, the decrease in social life activities, the changes in the roles of the parents, the mismatches between the spouses, the material problems, the family is not understood by the experts, the problems arising from the diagnosis of the child, the concern about the future of the child and the mother of the child - the high level of addiction to the father is one of the difficulties experienced (Cangür, Civan, Çoban, Koç, Karakoç et al., 2013; Özşenol, Işıkhan, Ünay, Aydın, Akın & Gökçay, 2003; Smith & Grzywacz, 2014). There are some factors affecting these difficulties. Children with special needs have disability status, behavior problems, child's gender, lack of social skills of the child, age of the child, family with other special needs, age of parents, education level of parents, occupation of parents, economic level of family and social security are shown to be the factors. (Sivrikaya & Tekinarslan, 2013; Uğuz, Toros, İnanç & Çolakkadıoğlu, 2004). The study includes 55 people (22.9%) aged 34 or under, 67 (35.9 years) aged 35-39 years (27.9%), 50 people (20.8%) aged 40-44 years, 38 people aged 45-49 years. A total of 240 parents (15.8%) and 30 persons (50% and over) were included in the study. The marital status group consisted of single (0.8%), married 225 (93.8%), widowed 4 persons (1.7%) and divorced 9 (3.8%). 78 of the participants were primary school (32.5%), 33 secondary school (13.8%), 66 (27.5%) high school and 63 (26.3%) university education. Of the participants, 23 (9.6%) had spent most of their life in the village and 117 (90.4%) in the town / county. In the northern part of Cyprus, because of the lack of a settlement with a provincial character, the settlement was separated only as town and county. 31 (12.9%) reported physical / psychological disorders and 209 (87.1%) did not report any discomfort (Table 1). Table 1. Age, marital status, education, the place of a major part of life, number and percentage distribution of physical / psychological disorders
Variables Whole Group Children with special needs
No children with special
needs
N % n % n %
Age
34 & under 35-39 40-44 45-49
50 & over
55 67 50 38 30
22,9 27,9 18,3 12,5 0,8
44 35 22 15 4
36,7 29,2 18,3
12,5 3,3
11 32 28 23 26
9,2 26,7
23,3 19,2 21,7
Marital Status
Single Married Widow
Divorced
2 225 4 9
0,8 93,8 1,7 3,8
1 112
2 5
0,8 93,3 1,7 4,2
1 113 2 4
0,8 94,2 1,7 3,3
Education
Primary Middleschool Highschool University
78 33 66 63
32,5 13,8 27,5 26,3
48 18 31 23
40 15
25,8 19,2
30 15 35 40
25 12,5
29,2 33,3
The Place of Major Part of Life
County Town
23 117 9,6 90,4
12 118
10 90
11 109
9,2 90,8
Physical / Psychological Disorders
Yes No
31 209
12,9 87,1
22 98
18,3 81,7
9 111
7,5 92,5
TOTAL
240 100 120 100 120 100
The study included 39 people (16.3%) who were married for 9 years and less, 102 people (42.5%) who were married between 10 and 19 years, 86 persons (35.8%) who were married for

Journal for Educators, Teachers and Trainers JETT, Vol. 9 (2); ISSN: 1989-9572
32
20 years or more, and left blank. 13 people (5.4%), physical / psychological discomfort in his wife 29 (12.1%), his wife / partner physical / psychological discomfort without physical / psychological disturbance (82.5%) 13 people (5.4%) to be blank A total of 240 mothers attended (Table 2). Table 2. Number of marriage period and physical / psychological disorder variables in the parent
Variables Whole Group
Children with Special Needs
No Children with Special Needs
n % N % n %
Marriage Period
9 years & under 39 16,3 25 20,8 14 11,7
10-19 years 102 42,5 61 50,8 41 34,2
20 years & above 86 35,8 28 23,3 58 48,3
Unanswered 13 5,4 6 5 7 5,8
Physical / Psychological Disorder in the Family
Yes 29 12,1 20 16,7 9 7,5
No 198 82,5 93 77,5 105 87,5
Unanswered 13 5,4 7 5,8 6 5
TOTAL 240 100 120 100 120 100
The number of people living at home is 69 persons (28.8%), 101 persons (42.1%) with 4, 42 people (17.5%) with 5 A total of 240 people (28%) were enrolled in the study. 54 people (22.5%) with one child, 115 people (47.9%) with 2 children, 51 children (21.3%) with 3 children and 20 people (8.3%) with 4 and more children. There are 52 people (21.7%) and 188 people (78.3%) who do not receive assistance for the care of the child. While 74 people (30.8%) spent enough time for themselves, 166 people (69.2%) did not have enough time (Table 3). Table 3. Number of people living at home, number of children, getting help for child care, number and percentage distribution of self-sufficient time allocation variables
Variables Whole Group Children with Special Needs
No Children with Special Needs
n % N % n %
Number of people living at home
3 or more people 69 28,2 30 25 39 32,5
4 people 101 42,1 52 43,3 49 40,8
5 people 42 17,5 24 20 18 15
6 or more people 28 11,7 14 11,7 14 11,7
Number of Children
1 child 54 22,5 30 25 24 20
2 children 115 47,9 58 48,3 57 47,5
3 children 51 21,3 23 19,2 28 23,3
4 children or more 20 8,3 9 7,5 11 9,2
Getting help for children care
Getting help 52 21,7 29 24,2 23 19,2
Unhelpful 188 78,3 91 75,8 97 80,8
Self-Sufficient Time Allocation
Time spare 74 30,8 17 14,2 57 47,5
No time spare 166 69,2 103 85,8 63 52,5
TOTAL
240 100 120 100 120 100
When the descriptive results of the total scores and sub-dimensions scores of the scales used for mothers with children with special needs were examined, the total score of A Social Skill

Journal for Educators, Teachers and Trainers JETT, Vol. 9 (2); ISSN: 1989-9572
33
Scale-80 was between 189-387 points (x = 315,07 ± 40,05 points), and the total Stress Scale score was 4. -30 points (x = 17,73 ± 5,47 points), Perceived Stress Scale perceived stress sub-dimension total score 0-20 points (x = 11,78 ± 4,58 points) and Perceived Stress Scale perceived coping The total sub-dimension score was found to be between 1-11 points (x = 5.94 ± 2.11 points). Personal Well-Being Index (PPI-Y) Adult Form total score is between 16-78 points (x = 49,83 ± 14,60 points), Personal Well-Being Index (KIO-Y) Adult Form Standard (over 100) -98 points (x = 62,28 ± 18,25 points), Rosenberg Self-Esteem Scale total score 0-3,66 points (x = 1,15 ± 0,74 points), Burnout Scale total score 1-6 between points (x = 3,64 ± 1,35 points), HAD Scale Anxiety total score between 1-21 points (x = 9,60 ± 4,37 points) and HAD Scale Depression total score between 0-16 points (x = 7.88 ± 3.96 points) (Table 4). Table 4. General total scores of scales used for families with special needs children - descriptive statistical table of sub-size scores
Total Scores n Smallest
Value Largest Value X
Standard Deviation
A Social Skill Scale-80 120 189 387 315,07 40,05
Perceived Stress Scale 120 4 30 17,73 5,47
Perceived Stress Scale Perceived Stress Sub Size 120 0 20 11,78 4,58
Perceived Stress Scale Perceived Coping Lower Size 120 1 11 5,94 2,11
Personal Well-Being Index (KIO-Y) Adult Form 120 16 78 49,83 14,6
HAD Scale Anxiety 120 1 21 9,6 4,37
HAD Scale Deppression 120 0 16 7,88 3,96
Personal Well-Being Index (KIO-Y) Adult Form Standard (over 100) 120 20 98 62,28 18,25
Rosenberg Self-Esteem Scale 120 0 3,66 1,15 0,74
Burnout Scale 120 1 6 3,64 1,35
When the descriptive results of the total scores and sub-dimensions scores of the scales used for the mothers without special needs were examined, the total score of A Social Skill Scale-80 was found between 243-389 points (x = 331,75 ± 28,92 points), and the Perceived Stress Scale total score. 0-31 points (x = 15,17 ± 6,12 points), Perceived Stress Scale perceived stress sub-dimension total score 0-20 points (x = 9,88 ± 4,65 points) and Perceived Stress Scale detected head the total sub-dimension total score was found between 0-12 points (x = 5.29 ± 2.33 points). Total score of Personal Well-Being Index (PPI-Y) Adult Form between 18-79 points (x = 57,08 ± 13,11 points), Personal Well-Being Index (KIO-Y) Adult Form Standard (over 100) total score 23 -99 points (x = 71.34 ± 16.38 points) and Rosenberg Self-Esteem Scale total score is between 0-3 points (x = 0.86 ± 0.57 points), Burnout Scale total score is between 1-7 points (x = 2,86 ± 1,13 points), HAD Scale Anxiety total score between 1 and 13 points (x = 8,41 ± 3,69 points) and HAD Scale Depression total score between 0-19 points (x = 5). , 65 ± 3,31 points) (Table 5). Table 5. Descriptive statistical table of the general total scores-sub-size scores of the scales used for families without special needs children
Total Scores n Smallest
Value Largest Value X
Standard Deviation
A Social Skill Scale-80 120 243 389 331,75 28,92
Perceived Stress Scale 120 0 31 15,17 6,12
Perceived Stress Scale Perceived Stress Sub Size 120 0 20 9,88 4,65
Perceived Stress Scale Perceived Coping Lower Size 120 1 12 5,29 2,33
Personal Well-Being Index (KIO-Y) Adult Form 120 18 79 57,08 13,11

Journal for Educators, Teachers and Trainers JETT, Vol. 9 (2); ISSN: 1989-9572
34
HAD Scale Anxiety 120 1 20 8,41 3,69
HAD Scale Deppression 120 0 19 5,65 3,31
Personal Well-Being Index (KIO-Y) Adult Form Standard (over 100) 120 23 99 71,34 16,38
Rosenberg Self-Esteem Scale 120 0 3 0,86 0,57
Burnout Scale 120 1 7 2,86 1,13
The results of item analysis and reliability analysis for the whole group of 240 participants: Social Skill Scale of 80 items with a value of 0.93, Percepted Stress Scale of 8 items with 0,81 value, Perceived Stress Scale with 5 items was found to be 0.86, Perceived Stress Scale with 3 items is 0.53 in the perceived coping sub-dimension, The Personal Well-Being Index (KIO-Y) with 8 items was calculated as 0.85 in Adult Form, Burnout Scale of 21 items with a value of 0.94, HAD Scale made with 7 items According to the anxiety rate of 0,80, HAD Scale with 7 items An alpha value of 0.75 was found in depression dimension. s a result of the reliability analysis, the Cronbach Alpha coefficients showed only the low reliability coefficient for the
perceived coping subscale of the Perceived Stress Scale (=0,53) (Table 6). Table 6. Internal consistency reliability analysis results for research scale and sub-dimensions
TOTAL Whole Group
Special Need
Children
No Special need
children
A Social Skill Scale-80
No of items 80 80 80
Alpha 0,93 0,94 0,9
N 240 120 120
Perceived Stress Scale
No of items 8 8 8
Alpha 0,81 0,76 0,84
N 240 120 120
Perceived Stress Scale Perceived Stress Sub Size
No of items 5 5 5
Alpha 0,86 0,85 0,85
N 240 120 120
Perceived Stress Scale Perceived Coping Lower Size
No of items 3 3 3
Alpha 0,53 0,42 0,62
N 240 120 120
Personal Well-Being Index (KIO-Y) Adult Form
No of items 8 8 8
Alpha 0,85 0,84 0,85
N 240 120 120
HAD Scale Anxiety
No of items 7 7 7
Alpha 0,8 0,83 0,74
N 240 120 120
HAD Scale Depression
No of items 7 7 7
Alpha 0,75 0,75 0,7
N 240 120 120
Burnout Scale
No of items 21 21 21
Alpha 0,94 0,94 0,94
N 240 120 120

Journal for Educators, Teachers and Trainers JETT, Vol. 9 (2); ISSN: 1989-9572
35
4.1. Comparison of the problems of families with and without special needs
4.1.1. Stress It refers to a state of physical or mental discomfort that occurs in the person with the change in the internal or external environment. Stress due to an illness and a trauma, as physical stress or stress caused by actual, expected and perceived threats is called psychological stress (Özer, 2002). Stress is discussed in two ways as useful and harmful stress. While beneficial stress facilitates the adaptation of the person to changes and improves his performance, harmful stress leads to decrease in efficiency, deterioration of health and depression (Ünal, 1999). Stressful events can be determined based on the relationship between vital events and their negative consequences for the person. In some cases, even if the death of a parent is not a great source of stress for some people, small life events such as living together with a helpful but annoying relative can be a great source of stress (Baxter, Cummins & Yiolitis, 2000). The cognitive-behavioral model of stress provides a theoretical perspective to stressful life events. According to this model, stress is the result of a stressful event, the cognitive evaluation of the stressful event, the personal resources needed to cope, and the interaction of coping reactions (Miller, Gordon, Daniele & Diller, 1992). The reactions of the person in the face of stressful events consists of three stages. It is called 'General Harmony Syndrome'. These stages are the alarm response, resistance and extinction stages (Güçlü, 2001).
1) Alarm Response: When a person encounters a stressful event, the body gives 'fight or go'. This is called alarm response. As a result of the stress, the person's sympathetic nervous system becomes effective, accelerating the heart rate, accelerating breathing, and increasing the release of adrenalin. This is exactly what leads to the reaction of fight or go.
2) Resistance Stage: It is the stage where the person strives to resist stress. If a person
adapts to the state of stress, everything begins to return to normal. Lost energy is gained. It normalizes bodily symptoms such as heart rate, respiratory acceleration.
3) Extinction Stage: As long as the stressful situation does not diminish and continues to
increase, the resistance of the person is broken, deviations and frustrations occur in his behavior. If the person cannot cope with the stressful situation, he / she cannot use his / her physical resources and the person goes into the depletion stage.
Having a child with special needs causes many negative changes within the family and causes negative feelings. The care of the child with special needs, the difficulties experienced in the education process, the negative attitude of the peers against the special need of the child and the society, the restriction of the social life due to the responsibilities of the home and the child, the lack of self-sufficient time, the difficulties experienced when going out with the child causes the parent to experience stress. In addition, the child's need for special needs is occasionally perceived and blamed as a failure of the parent. Various physical and psychological disorders occur as a result of the stress experienced in this process (Ayyıldız, Şener, Kulakçı & Veren, 2012; Duygun & Sezgin, 2003). Studies on the relationship between having a child with special needs and stress revealed that having a child with special needs for the family is more stressful than having a normal developing child (Baxter, Cummins & Yiolitis, 2000; Cummings, Bayley & Rie, 1966; Esdaile & Greenwood, 2003; Macias, Saylor, Rowe & Bell, 2003). In a study, it was stated that families perceived their children with special needs as a more significant source of stress than other children (Baxter, Cummins & Yiolitis, 2000). There are significant studies demonstrating that mothers with children with special needs have two or three times more prevalence of stress than mothers with normal-developing children (Miller, Gordon, Daniele & Diller, 1992).

Journal for Educators, Teachers and Trainers JETT, Vol. 9 (2); ISSN: 1989-9572
36
4.1.2. Anxiety One of the reasons for many psychopathologies is a feeling that is demonstrated with fear and anxiety that can accompany many psychopathologies. Low satisfaction and high levels of arousal in anxiety (Şahin, Batıgün & Uzun, 2011). The concept of anxiety is different from fear. In the case of anxiety, the fact that the source of the threat and the absence of a dangerous situation are important points of the difference between anxiety and fear (Karamustafalıoğlu & Yumrukçal, 2011). Fear would last longer than anxiety. The severity is higher. The effects of fear are felt longer (Cüceloğlu, 2003). Anxiety is a feeling condition with many clinical signs and causes. One of the two most important components of anxiety is the recognition of fear and anxiety. The person is concerned at this stage that something bad will happen at any moment, the person would be uneasy but cannot show a dangerous situation or source of threat that will cause this. The other component of anxiety is physiological symptoms such as tremors, sweating and restlessness (Çelik & Acar, 2007). The autonomic nervous system is stimulated with the increase of the person's anxiety, and arousal causes problems such as diarrhea, dizziness, palpitations, physiological symptoms such as frequent urination, problems related to memory, decreased attention, and learning difficulties (Kocabaşoğlu, 2008). The evaluation of anxiety, the way of life of the patient, the presence of a medical condition, the substance or drug use, the situations in which anxiety occurs, the characteristics of the problem, how the problem arises, the factors that cause the problem to arise, increase and decrease, the person's coping mechanisms The person's perspective and the results of the problem should be evaluated from a general point of view (Karamustafalıoğlu & Yumrukçal, 2011). Having examined the related studies, it was seen that parents who have children with special needs experience anxiety problems. The parent, who has to deal with the care of the child with special needs, lays down their other roles, sacrifices their personal development and freedom, and participates less in social life. The uncertainty of the child's present and future situation and the inability to see who will care for the child in the future increase the concerns of the parent. In this process, stressful life of the mother cannot cope with stress and anxiety problems are reported to live (Ayyıldız, Şener, Kulakçı & Veren, 2012; Cummings, Bayley ve Rie, 1966; Kazak & Marvin, 1984; Tura, 2017). Having analysed the studies about the anxiety levels of the parents with and without special needs, it was seen that the anxiety levels of the mothers who have children with special needs are higher (Toros, 2002; Tura, 2017; Uğuz, Toros, İnanç & Çolakkadıoğlu, 2004).
4.1.3. Depression It is a very common disorder that one out of every five people live in a period of life (Mete, 2008). It is an important condition that affects not only the person but also the family and the society (Glidden & Schoolcraft, 2003). The prevalence of depression was found between 6.7% and 87% in European and American studies. In terms of Turkey, 'the prevalence of depressive episodes by the Ministry of Health 'Mental Health Profile of Turkey' performed in the study was found to 4% (5.4% for women and 2.3% for men) (Bag, 2014). Symptoms of depression include (Mete, 2008): 1. Grief, unhappiness, crying, sadness, 2. Unwillingness, apathy and lack of pleasure, 3. Despair, failure and feelings of guilt, feelings of worthlessness, 4. Suicidal thoughts, 5. Energy loss, fatigue, 6. Appetite problems (over or under eating),7. Attention clutter, indecision, 8. Sleep problems (More or less sleep, sleep asleep), 9. Agitation or psychomotor deceleration. Depression loss, energy shortage and depression are the most important symptoms. These symptoms, along with other symptoms, lead to significant deterioration in the social and occupational functionality of the individual. Each period of depression may take place with different severity. The severity of depression, what the symptom is, the intensity of 24, and the number of symptoms present in the individual have an effect (Karamustafalıoğlu & Yumrukçal, 2011). Having compared the families with special needs, families with children with special needs seem to have high risk of physical and psychological disorders such as clinical depression (Oelofsen & Richardson, 2006). In studies conducted on the levels of depression of parents with and without special needs, mothers with children with special needs were reported to have

Journal for Educators, Teachers and Trainers JETT, Vol. 9 (2); ISSN: 1989-9572
37
higher levels of depression (Miller, Gordon, Daniele & Diller, 1992; Toros, 2002). In particular, the mother's accusation of the child's condition inappropriately blames herself may be an important risk factor for depression (Esdaile & Greenwood, 2003).
4.1.4. Burnout Depression of internal resources seen in people who are faced with unacceptably intense demands, depletion and energy reduction accompanied by symptoms of helplessness, failure, hopelessness of the person's business life, life and people around it is a syndrome that reflects the reflection of negative attitudes (Ardıç & Polatcı, 2008; Maslach & Jackson, 1981). The concept of burnout is addressed through three components: emotional exhaustion, lack of personal success, and depersonalization. Emotional exhaustion is the result of exhaustion of emotional resources. Desensitization is that the person is insensitive to them by developing negative attitudes and feelings towards the people around them. Lack of personal success is a person's negative self-assessment of human relations and work, insufficient to feel insufficient to work and do not feel (Ardıç & Polatcı, 2008; Maslach & Jackson, 1981). Burnout is a slowly occurring condition and can be rendered ineffective as a result of ignoring symptoms. The symptoms of burnout are examined under three categories as psychological, physical and behavioral (Ardıç ve Polatcı, 2008; Erçen, 2009):
1) Physical symptoms: Sleep problems, fatigue, weakness in the immune system, skin diseases, respiratory disorders, weight loss, heart related problems, high blood pressure, drowsiness, forgetfulness and headache.
2) Psychological symptoms: Restlessness, lack of self-confidence, lack of disability, lack
of energy, alienation, depression, aggression, disappointment, increase in problems related to family and social environment, uncertainty in thoughts, loss of interest and hopelessness.
3) Behavioral symptoms: Anger can be listed as the lack of control, family conflicts, desire
to stay alone, delay to work, permanent leave or not to work, low job performance, loss of concentration, susceptibility, personal inadequacy and feeling of failure. It causes many physical, psychological and behavioral problems such as burnout, morale, fatigue, non-attendance, stress, depression, anxiety, physical fatigue, insomnia, respiratory diseases, heart diseases, increased drug and substance use, and family members feel lonely. It makes individuals feel ignored. It leads to marriage and family problems. Family members accuse the individual of thinking that they do not want to be with them. This situation increases the feeling of guilt that the person feels as a result of burnout, and this leads to problems such as increased family conflicts, divorce, and the separation of children and parents (Ardıç ve Polatcı, 2008; Güleryüz & Aydın, 2006; Maslach & Jackson, 1981). Factors affecting burnout include individual factors, motivation, age, personality, marital status, personal expectations, number of children, education level, and occupation. Organizational factors are expressed as values, work load, justice, control, awards and belonging. Having examined the gender studies, it was seen that women generally have more burnout than men (Erçen, 2009). The inclusion of a new individual in the family leads to many innovations within the family and increases the duties and responsibilities of family members. Families who learn that the child has special needs give a strong reaction. This creates an additional source of stress that significantly affects the family life. Families with children with special needs assume different duties and responsibilities in addition to the responsibilities undertaken by other families. It consumes a lot of energy for the care of their children. The responsibilities of the child cause stress. As a result of their accumulation, they experience a state of burnout dominated by physical and psychological fatigue. Relevant studies show that parents, who have a stressful process in providing care for children with special needs, show burnout symptoms. As a result of an interview with families with children with chronic diseases, it was found out that these families live with a load for a long time, but also show signs of stagnation and fatigue and showed signs of burnout (Duygun & Sezgin, 2003;

Journal for Educators, Teachers and Trainers JETT, Vol. 9 (2); ISSN: 1989-9572
38
Lindström, Aman & Norberg, 2010). When the studies comparing the levels of burnout of parents with and without special needs are examined, it can be seen that those who have children with special needs have a higher level of burnout compared to those who do not have children with special needs. (Duygun & Sezgin, 2003; Lindström, Aman & Norberg, 2010; Weiss, 2002).
4.1.5. Self-esteem Self is a dynamic and complex system of thoughts, positive and negative attitudes and beliefs (Avşaroğlu & Üre, 2007). Self-esteem is a general evaluation of self and is measured by the expressions used in evaluating the self. (Baumeister & Tice, 1985). In other words, self-esteem is a person's self-acceptance, acceptance, and self-esteem (Avşaroğlu & Üre, 2007). The high or low self-esteem affects the person's power, the perspective of the world, the ability to love and be loved, the person's perspective, social participation, academic life, thought, behavior, emotions, choices and discourses (Aydın & Güloğlu, 2001). Individuals who want to feel valuable try to protect their self-esteem and to have high self-esteem. Individuals with high self-esteem accept themselves as they are, find themselves valuable and have high self-esteem. High self-esteem, which is one of the important symptoms of psychological health, is one of the important indicators of general well-being. Individuals with low self-esteem have a structure dependent on others, see themselves as inadequate, do not have confidence in their behaviors and beliefs (Avşaroğlu & Üre, 2007; Karaırmak & Çetinkaya 2011; Nir & Neumann, 1995). Symbols such as social life, talents, material possibilities determine the value in the society. One of the symbols that causes a decrease in the value of a person in the society is to have a child if he or she does not have or is lost. The physical, intellectual and psychological characteristics of the child affect the perception of the family towards its own value. Particularly, the negative attitudes of the society towards families with children with special needs causes them to think that they are worthless. (Cummings, Bayley & Rie, 1966; Girli, Yurdakul, Sarısoy & Özekes, 2000). In addition, the family, who has a child with special needs, experiences a stressful process, financial difficulties, family relations are damaged, and the burden of children with special needs leads to the restriction of employment opportunities of families. Although there is a child with special needs, families are experiencing isolation, not being satisfied and a decrease in self-esteem as a result of increasing family burden and limiting employment opportunities (Gallagher, Phillips, Oliver & Carroll, 2008; Özşenol, Işıkhan, Ünay, Aydın, Akın & Gökçay, 2003).
4.1.6. Personal well-being In recent years, the concept of quality of life has become an important indicator in understanding people's lives and needs. The subjective quality of life, also known as subjective well-being, expresses how the individual feels about his or her life and provides a broad knowledge of the individual's quality of life. Although it is stated that there are some differences between the concept of subjective well-being and the concept of personal well-being, the concept of personal well-being is a more general framework. These two concepts are sometimes used interchangeably. At the same time, it can be seen that the Personal Well-Being Scale is accepted as a measure of subjective well-being (Lau, Cummins & Mcpherson, 2005; Meral, 2014). Therefore, it is preferred that the concept of subjective well-being and personal well-being are used interchangeably in the research. Studies show that life satisfaction is related to other criteria of personal well-being (Yiengprugsawan, Seubsman, Khamman, Lim, Sleigh & Thai Cohort Study Team, 2010). Personal well-being refers to a comprehensive and long-term evaluation of life satisfaction, not the feelings that a person feels about life in a given period. The concept of personal well-being, which points to life satisfaction, good level of mental health and overall happiness, includes an individual assessment of the person's emotional responses, life satisfaction, cognitive satisfaction and quality of life (Meral, 2014). In general, it can be seen that personal well-being is composed of three characteristics (Diener, 1984): 1. Personal well-being is subjective and includes personal experiences of the individual. 2. Personal well-being includes positive measures with the absence of negative factors. 3.

Journal for Educators, Teachers and Trainers JETT, Vol. 9 (2); ISSN: 1989-9572
39
Personal well-being includes a general assessment of every aspect of a person's life. Emotion or satisfaction in a particular area is assessed, but an emphasis is placed on the whole of the individual's life. While assessing the personal well-being of the individual, it can be done by testing eight areas that include personal assessments. These are the standard of living, health, success in life, relationships, security, social relations and commitment, future security and religion/spirituality (International Wellbeing Group, 2006). According to the cross-sectional studies, families with special needs show flexibility over their well-being. In order to adapt to the care and needs of children with special needs, mothers participate in less business life, fathers work longer hours and family responsibilities are arranged accordingly (Seltzer, Greenberg, Floyd, Pettee & Hong, 2001). Experimental studies investigating the effect of special necessity on the well-being of the family indicate that the special need has a negative effect on well-being and that this negative effect is on the most material well-being (Fafchamps & Kebede, 2008). The study by Emerson, Hatton, Llewellyn, Blacker and Graham (2006), it was stated that mothers with children with special needs have a lower level of well-being than mothers who do not have children with special needs. 5. Discussion Individuals need to establish social relations in order to interact with their environment. At the same time, social relations, which have a significant impact on the psychological health of the person, support health protection and prevent physical and psychological problems against stressful life events. The fact that these social relations are established in a healthy way is related to the acquisition of social skills. Social skills are important in the field of mental health in order to be able to strike out emotions, to reject the inappropriate requests, to protect their rights and to ask for help when necessary (Sorias, 1986; Yalçın, 2012). When the variables that affect social skill are examined, sociodemographic variables such as age, gender, social status, marital status, socio-economic level, birth order, educational status, gender, working status, cultural structure, family width, as well as depression anxiety, anxiety, burnout etc., it is seen that the problems are related to the social skill level of vital problems such as illness and divorce. (Booth, Mitchell, Barnard & Spieker, 1989; Elliott, Sheridan & Gresham, 1989; Karahan, Dicle & Eplikoç, 2007; Seven, 2008; Trower, 1987; Yüksel, 1999). Having a child with special needs is an important vital problem. When a child with special needs is present in the family, parents, especially mothers, may experience physical and psychological disorders as a result of many difficulties (Ayyıldız, Şener, Kulakçı & Veren, 2012). In families with children with special needs, who struggle with more difficulties than families without children with special needs, it is observed that the person interested in the care of the child with special needs is mostly mother. Physical and psychological disorders interact with social skills. As a result of physical and psychological disturbances, people may experience social skills deficiency, and the lack of social skills may aggravate the consequences of physical and psychological disorders (Rustin & Kuhr, 1999). 22 out of 31 240 participants who stated that they had a physical/psychological problem had parents with special needs and only nine of the parents had normal problems. This rate is approximately 2.5 times higher. Those who define physical/psychological problems in their spouses are close to the same rates and corresponds to 20 people. Having taken the marriages of couples living in the country into consideration, it is also noteworthy that the couples with children with special needs have stayed longer together. This may lead to the conclusion that supporting each other and the needs and difficulties are linked to each other for a long time. In case of further investigation, the real result can be revealed (Rustin & Kuhr, 1999) (Table1). According to the number of children the parents have, it can be seen that parents with children with special needs are less likely to have children than those who do not, and do not exceed 2 children. It is also possible to investigate in which order the child has special needs and to evaluate the family from various perspectives (Table2).

Journal for Educators, Teachers and Trainers JETT, Vol. 9 (2); ISSN: 1989-9572
40
There was no significant difference between the families in terms of getting help in the answers to the questions about getting child care. With little difference, families with children with special needs were found to receive more help (Table 2). While 85.8% of the parents with children with special needs did not have enough time, only 14.2% of them took the time, while the parents who had no children with special needs had plenty of time for them (Table 3). Having a child with special needs brings many problems and responsibilities. Children with special needs require intensive care and support. Generally, the need for care and support is met by mothers (Doğru & Arslan, 2008; Tura, 2017). The need for continuous care creates a burden on the family. This condition, called caregiver burden, is also referred as mother burden. This is due to the fact that the care of the child with special needs is usually provided by mothers. This type of mother burden may sometimes cause negative feelings in mothers and these negative emotions may cause stress (Sivrikaya & Tekinarslan, 2013). In a study by Esdaile and Greenwood (2003), parents with children with special needs have higher levels of parenting stress associated with children than families with no children with special needs. In the study by Uğuz, Toros, İnanç & Çolakkadıoğlu (2004), the stress levels of the mothers, who had children with special needs, were higher than those of the other mothers. The mothers expressed that their children were more dependent on their family life. It was declared that more responsibility increased their stress levels. As a result of studies investigating the stress levels of parents with and without special needs, the perceived stress and coping subscale total scores of the parents with children with special needs were higher than those of mothers who do not have children with special needs. The stress levels of parents with children with special needs are significantly affected by the difficulties of having children with special needs. In addition to problems such as the child's social skills being weak, having difficulty in communication, increasing the burden of the parent for most of his time and increasing the external responsibilities of the child may lead to an increase of the stress life (Sivrikaya & Tekinarslan, 2013). In a study by Kazak and Marvin (1984), similar to the findings of the study, it was stated that families with children with special needs experience more stress than families without children with special needs. The child's need for constant care and living dependent on the parent leads to stress and anxiety in the parent. Anxiety problems are experienced, especially in cases where the mother takes care of the child and the child is seen as the parent's failure to have special needs (Doğru & Arslan, 2008; Tura, 2017). As a result of the study, the mean total anxiety scores of the parents, who have children with special needs, are higher than the anxiety scores of the parents who do not have children with special needs. There are many studies demonstrating that parents, who have children with special needs, have higher levels of anxiety than those without children with special needs (Toros, 2002; Tura, 2017; Uğuz, Toros, İnanç & Çolakkadıoğlu, 2004) This study reveals that the levels of depression of parents with children with special needs are higher than those without special needs. Parents, who have children with special needs, also have higher levels of depression (Şengül & Baykan, 2013; Uğuz, Toros, İnanç & Çolakkadıoğlu, 2004). In a study by Miller, Gordon, Daniele and Diller (1992), it was reported that mothers with children with special needs had more depressive symptoms than mothers who do not have children with special needs. Similarly, in studies conducted by Toros (2002) and Tura (2017), the fact that parents with special needs had higher levels of depression compared to mothers without children with special needs reveals that having children with special needs is an important risk factor for depression. In addition, there is a statistically significant correlation between social skill and depression at r = -0,50, indicating that social skills levels may decrease as mothers with special needs increase their depression levels. Parents with children with special needs are thought to have suffered from burnout due to the child's being held responsible for his situation and feeling helpless, having difficulty accepting his diagnosis, and overloading a large part of the responsibilities for home and child (Duygun & Sezgin, 2003). At the same time, individuals who have been under stress for a long time are reported to have burnout when they have difficulty in performing their roles (Lindström, Aman & Norberg, 2010). Parents who have children with special needs who have many stress factors in their lives are considered to be a risk factor for burnout. In the study conducted by Duygun and Sezgin (2003), it can be seen that parents who have children with special needs
Journal for Educators, Teachers and Trainers JETT, Vol. 9 (2); ISSN: 1989-9572
41
have higher emotional exhaustion scores than those who do not have children with special needs. Another study showed that families with children with special needs show more burnout symptoms than families who do not have children with special needs. It is stated that this difference is seen especially among mothers with and without special needs (Lindström, Aman ve Norberg, 2010). In line with the results of the study, similarly supported in the literature, it is seen that the burnout levels of the parents with children with special needs are higher than the mothers who do not have children with special needs. According to the results of the study, the mean score of the Rosenberg Self-Esteem scale of the parents having children with special needs was found to be higher than the ones without the children with special needs. However, the high score from this scale indicates low self-esteem (Çuhadaroğlu, 1986). In other words, parents who have children with special needs have lower self-esteem than those who do not have children with special needs. In a study by Emerson, Hatton, Llewellyn, Blacker and Graham (2006), it was reported that parents with children with special needs had lower self-esteem than parents without children with special needs. In a study on families with children with special needs, it was stated that mothers who have children with special needs have more feelings of guilt than their fathers, and that self-esteem increases as a result of group counseling to these families. In this study, self-esteem problems due to feelings of guilt, inadequacy and loneliness may be improved as a result of group counseling (Yurdakul, Sarısoy & Özekes, 2000). It is thought that the parents who have children with special needs, who feel guilt and inadequacy, think that they have lost their value in the society when they have such a child and therefore their self-esteem decreases. It is stated that families with children with special needs have a negative effect on the well-being, especially when the child's behavioral problems increase. Problems such as stress, low self-esteem, anxiety, and depression in parents who have a difficult process with the difficulties of having children with special needs are more common than those who do not have children with special needs. The change in mood with these problems negatively affects the quality of life and life satisfaction (Canarslan & Ahmetoğlu, 2015). In a study by Werner & Shulman, 2013), families with children with autism were found to have personal well-being below normal. In this discriminatory study, it is stated that the feelings of shame, stigmatization, quality of life, concern about the future of the child and the restriction of leisure activities are effective on low personal well-being. Similar to the results of the study conducted by Palancı (2018), it can be seen that the personal well-being of the families with children with special needs is lower than the families with normal development. The analysis of many qualitative and quantitative data together with these studies shows that families with children with special needs are at risk for low quality of life (Cummins, 2001). 6. Conclusion The study conducted with the aim of examining the social skill levels of mothers with and without special needs in terms of relevant variables have various results. Within the scope of the research, a statistically significant difference was found between the social skill levels of parents with special needs and age, the place where a large part of life is spent, physical/psychological discomfort, and the duration of marriage and socio-demographic variables. There was no significant difference in terms of physical/psychological disturbance, educational status, working status, working condition before child, income level, social security, getting social assistance, number of people living, self-sufficient time allocation, number of children and getting child care. Parents who have children with special needs were generally found to have lower social skill scores as the age increases, social skills scores of mothers living in districts are higher than the mothers growing up in the villages, and parents who do not have physical/psychological discomfort have higher social skill scores than their parents who have physical/psychological discomfort. There was a statistically significant difference between social skills, perceived stress, personal well-being, self-esteem, burnout, anxiety and depression levels of parents who have children with and without special needs.

Journal for Educators, Teachers and Trainers JETT, Vol. 9 (2); ISSN: 1989-9572
42
The social skills and personal well-being total scores of the parents who do not have children with special needs were found to be higher than the mean scores of the social skills and personal well-being of the parents with special needs. The mean scores of perceived stress, self-esteem, burnout, anxiety and depression of the parents with children with special needs were found to be higher than the total points of perceived stress, self-esteem, burnout, anxiety and depression of those without special needs. The multiple regression model for predicting the Social Skills Scale A total score was found to be statistically significant in mothers with special needs. A Social Skill Scale, 39% of the independent variables taken from the model, Rosenberg Self-Esteem and HAD Scale Depression subscale were statistically significant. A multiple regression model was used to predict the total score of A Social Skills Scale for mothers without special needs. The HADS Scale Anxiety subscale was statistically significant. Within the scope of the research, the limitations of the study are the lack of special needs of children with special needs. Although there is a significant relationship between the social skill levels of parents and their parenting skills and mental health, it was observed that there are very few studies conducted in the literature on this subject. Therefore, there is a need to conduct more research on the social skill levels of families. 7. References
Akçamete, G., & Avcıoğlu, H. (2005). Sosyal becerileri değerlendirme ölçeğinin (7–12 yaş)
geçerlik ve güvenirlik çalışması. Abant İzzet Baysal Üniversitesi Eğitim Fakültesi Dergisi,
5(2), 61-77.
Ardıç, K., & Polatçı, S. (2008). Tükenmişlik sendromu akademisyenler üzerinde bir uygulama
(GOÜ örneği). Gazi Üniversitesi İktisadi ve İdari Bilimler Fakültesi Dergisi, 10(2), 69-96.
Ataman, A. (2005). Özel gereksinimli çocuklar ve özel eğitim, özel gereksinimli çocuklar ve özel eğitime giriş, İkinci baskı, Ankara: Gündüz eğitim ve yayıncılık.
Akkök, F., P. Aşkar, A.N. Karancı. (1992). Özürlü bir çocuğa sahip anne babalardaki stresin yordanması, Özel Eğitim Dergisi, Ankara 2(2), 8-12.
Avşaroğlu, S., & Üre, Ö. (2007). Üniversite öğrencilerinin karar vermede özsaygı, karar verme
ve stresle başa çıkma stillerinin benlik saygısı ve bazı değişkenler açısından incelenmesi.
Selçuk Üniversitesi Sosyal Bilimler Enstitüsü Dergisi, 18, 85-100.
Aydın, G., & Güloğlu, B. (2001). Coopersmith özsaygı envanteri’nin faktör yapısı. Eğitim ve
Bilim Dergisi, 26(122), 66-71.
Ayyıldız, T., Şener, D. K., Kulakçı, H., & Veren, F. (2012). Zihinsel engelli çocuğa sahip
annelerin stresle baş etme yöntemlerinin değerlendirilmesi. Ankara Sağlık Hizmetleri
Dergisi, 11(2), 1-12.
Bag, B. (2014). Kanser hastalarında depresyon. Psikiyatride Güncel Yaklaşımlar, 6(2), 186-198.
Baumeister, R. F., & Tice, D. M. (1985). Self-esteem and responses to success and failure:
Subsequent performance and intrinsic motivation. Journal of Personality, 53(3), 450-467.
Baxter, C., Cummins, R. A., & Yiolitis, L. (2000). Parental stress attributed to family members
with and without disability: A longitudinal study. Journal of Intellectual and Developmental
Disability, 25(2), 105-118.
Ben-Zur, H., Duvdevany, I., & Lury, L. (2005). Associations of social support and hardiness with
mental health among mothers of adult children with intellectual disability. Journal of
Intellectual Disability Research, 49(1), 54-62.
Bilge, A., Öğce, F., Genç, R. E., & Oran, N. T. (2009). Algılanan stres ölçeği (ASÖ)’nin Türkçe
versiyonunun psikometrik uygunluğu. Ege Üniversitesi Hemşirelik Yüksekokulu Dergisi,
25(2), 61-72

Journal for Educators, Teachers and Trainers JETT, Vol. 9 (2); ISSN: 1989-9572
43
Booth, C. L., Mitchell, S. K., Barnard, K. E., & Spieker, S. J. (1989). Development of maternal
social skills in multiproblem families:Effects on the mother-child relationship.
developmental psychology, 25(3), 403-412.
Canarslan, H., & Ahmetoğlu, E. (2015). Engelli çocuğa sahip ailelerin yaşam kalitesinin
incelenmesi. Trakya Üniversitesi Sosyal Bilimler Dergisi, 17(1), 13-31.
Canbul, S., (1995). İşitme engelli çocuğa sahip ailelerde aile fonksiyonlarının etkilenmesi.
Yayınlanmamış uzmanlık tezi, Hacettepe Üniversitesi Sağlık Bilimleri Enstitüsü Eğitim
Odyolojisi Programı, Ankara.
Cangür, Ş., Civan, G., Çoban, S., Koç, M., Karakoç, H., Budak, S., İpekçi, E., & Ankaralı, H.
(2013). Düzce ilinde bedensel ve/veya zihinsel engelli bireylere sahip ailelerin toplumsal
yaşama katılımlarının karşılaştırmalı olarak değerlendirilmesi. Düzce Üniversitesi Sağlık
Bilimleri Enstitüsü Dergisi, 3(3), 1-9.
Cavkaytar, A. (2000). (Yaşar, Ş. Ed.) Okulöncesi Eğitimde Okul, Aile Ve Çevre İş Birliği. Okul
Öncesi Eğitimin İlke ve Yöntemleri, Açıköğretim Okul Öncesi Öğretmenliği Lisans
Programı, Anadolu Üniversitesi Yayınları, Eskişehir.
Cavkaytar, A., Batu, S., & Çetin, O. B. (2008). Perspectives of Turkish mothers on having a
child with developmental disabilities. International Journal of Special Education, 23(2),
101-109
Cook, R.E., Klein, M.D. ve Tessier, A. (2008). Adapting early childhood curricula for children
with special needs. Upper Saddle River, NJ: Merrill/Prentice Hall
Cummings, S. T., Bayley, H. C., & Rie, H. E. (1966). Effects of the child’s deficiency on the mother: a study of mothers of mentally retarded, chronically ill and neurotic children. American Journal of Orthopsychiatry, 36(4), 595-608.
Cummins, R. A. (2001). The subjective well-being of people caring for a family member with a severe disability at home: A review. Journal of Intellectual and Developmental Disability, 26(1), 83-100.
Cüceloğlu, D. (2003). İnsan Ve Davranışı: Psikolojinin Temel Kavramları. İstanbul: Remzi Kitabevi.
Çapri, B. (2006). Tükenmişlik ölçeğinin Türkçe uyarlaması: Geçerlik ve güvenirlik çalışması. Mersin Üniversitesi Eğitim Fakültesi Dergisi, 2(1), 62-77.
Çelik, H. C., & Acar, T. (2007). Kronik hemodiyaliz hastalarında depresyon ve anksiyete düzeylerinin çeşitli değişkenlere göre incelenmesi. Fırat Tıp Dergisi, 12(1), 23-27.
Çuhadaroğlu, F. (1986). Adolesanlarda benlik saygısı (Uzmanlık tezi), Hacettepe Üniversitesi, Tıp Fakültesi Psikiyatri Anabilim Dalı, Ankara.
Dürüst, Ç. (2017). Bilişsel çelişki kuramına göre boşanmış bireylerin değerlendirilmesi. Turkish International Journal of Special Education an Guidance & Conselling. Vol. 6 (2).
Diener, E. (1984). Subjective well-being. Psychological Bullettin, 95(3), 542-575.
Doğru, S. S. Y., & Arslan, E. (2008). Engelli çocuğu olan annelerin sürekli kaygı düzeyi ile
durumluk kaygı düzeylerinin karşılaştırılması. Selçuk Üniversitesi Sosyal Bilimler
Enstitüsü Dergisi, 19, 543-553.
Duygun, T., & Sezgin, N. (2003). Zihinsel engelli ve sağlıklı çocuk annelerinde stres belirtileri,
stresle başa çıkma tarzları ve algılanan sosyal desteğin tükenmişlik düzeyine olan etkisi.
Türk Psikoloji Dergisi, 18(52), 37-52.
Elliott, S. N., Sheridan, S. M., & Gresham, F. M. (1989). Assessing and treating social skills
deficits: A case study for the scientist-practitioner. Journal of School Psychology, 27(2),
197-222.
Emerson, E., Hatton, C., Llewellyn, G., Blacker, J., & Graham, H. (2006). Socioeconomic
position household composition, health status and indicators of the well-being of mothers
of children with and without intellectual disabilities. Journal of Intellectual Disability
Research, 50(12), 862-873
Entwisle, Doris R., Alexander, Karl L. ve Olson, Linda Steffel (2018). Children, Schools and
Inequality, Routledge, New York London
Ed. Yıldız, T. Anne Baba Eğitimi, 2017 Pegem Akademi, Ankara.

Journal for Educators, Teachers and Trainers JETT, Vol. 9 (2); ISSN: 1989-9572
44
Erçen, A. E. Y. (2009). Öğretmenlerin mesleki tükenmişlik düzeyleri mersin ilinde karşılaştırmalı
bir inceleme. Çukurova Üniversitesi Eğitim Fakültesi Dergisi, 3(36), 1-8.
Ersoy, Ö., & Çürük, N. (2009). Özel gereksinimli çocuğa sahip annelerde sosyal desteğin
önemi. Sosyal Politika Çalışmaları Dergisi, 5(17), 104-110.
Esdaile, S. A., & Greenwood, K. M. (2003). A comparison of mothers and fathers experience of
parenting stress and attributions for parent-child interaction outcomes. Occupational
Therapy International, 10(2), 115-126.
Fafchamps, M., & Kebede, B. (2008). Subjective well-being, disability and adaptation: a case
study from rural Ethiopia. https://ueaeprints.uea.ac.uk/18858/2/WP07.pdf , 16.09.2018.
Gallagher, S., Phillips, A. C., Oliver, C., & Carroll, D. (2008). Predictors of psychological
morbidity in parents of children with intellectual disabilities. Journal of Pediatric
Psychology, 33(10), 1129-1136.
Girli, A., Yurdakul, A., Sarısoy, M., Özekes, M. (2000). Zihinsel engelli ve otistik çocukların Anne babalarına yönelik grup danışmanlığının depresyon, benlik saygısı ve tutumları üzerine etkisi. Saray Rehabilitasyon, 6, 2-9.
Glidden, L. M., & Schoolcraft, S. A. (2003). Depression: Its trajectory and correlates in mothers rearing children with intellectual disability. Journal of Intellectual Disability Research, 47(4-5), 250-263.
Güçlü, N. (2001). Stres yönetimi. Gazi Üniversitesi Gazi Eğitim Fakültesi Dergisi, 21(1), 91-109. Güleryüz,E. & Aydın, O. (2006). İş kontrolü ve kontrol isteği ile tükenmişlik ve fiziksel sağlık
arasındaki ilişkiler. Türk Psikoloji Dergisi, 21(58), 59-71. Gülerce, A. (2007). Dönüşümsel aile modeli ve türkiye’de ailelerin psikolojik örüntüleri, İkinci
baskı, İstanbul: Boğaziçi Üniversitesi. Güngör, A. (1999). Anne-baba çocuk iletişimi, Gazi Üniversitesi Anaokulu/Anasınıfı Öğretmen
El Kitabı Rehber Kitaplar Dizisi, İstanbul: Ya-Pa yayınları. International Wellbeing Group. (2006). Personal Wellbeing Index-Adult. Melbourne: Australian
Centre on Quality of Life, Deakin University Karahan, T. F., Dicle, A. N., & Eplikoç, H. (2007). Üniversite öğrencilerinin stresle başa çıkma
tarzlarının sosyal beceri düzeylerine ve mutluluk algılarına göre incelenmesi. Ankara Üniversitesi Eğitim Bilimleri Fakültesi Dergisi, 40(2), 41-61.
Karaırmak, Ö., & Çetinkaya, R. S. (2011). Benlik saygısının ve denetim odağının psikolojik sağlamlık üzerine etkisi: duyguların aracı rolü. Türk Psikolojik Danışma ve Rehberlik Dergisi, 4(35), 30-43.
Karamustafalıoğlu, O., & Yumrukçal, H. (2011). Depresyon ve anksiyete bozuklukları. Şişli Etfal Hastanesi Tıp Bülteni, 45(2), 65-74.
Kazak, A. E., & Marvin, R. S. (1984). Differences, difficulties and adaptation: Stress and social networks in families with a handicapped child. Family Relations, 33, 67-77
Hastings R.& Brown, T. (2002). Behavior problems of children with autism, parental self-efficacy and mental health, American Journal of Mental Retardation: AJMR 107(3):222-32.
Hintermair, M. (2006). Parental resources, parental stress, and socioemotional development of deaf and hard of hearing children. The Journal of Deaf Studies and Deaf Education, 11(4), 493–513.
Jackson, W. Turnbull, C. (2004). Impact of deafness on early family lıfe: A review of the literature. TECSE 24:1.
Kasapoglu, M.A. (1990). Birey – Aile – Toplum”, I. Aile Şûrası Bildirileri, Aile Araştırma Kurumu Başkanlığı Yayınları, Ankara:
Kiani, B., & Nami, M. (2017). A comparative analysis on psychological well-being in mothers of autistic, blind and normal-functioning children. Psychology and Neuroscience, 10(1), 83-90.
Kocabaşoğlu, N. (2008). Anksiyete bozukluklarına genel bir bakış. İstanbul Üniversitesi Cerrahpaşa Tıp Fakültesi Sürekli Tıp Eğitimi Etkinlikler, 62, 175-184.
Lau, A. L., Cummins, R. A., & Mcpherson, W. (2005). An investigation into the crosscultural equivalence of the Personal Wellbeing Index. Social Indicators Research, 72(3), 403-430.
Lindström, C., Aman, J., & Norberg, A. L. (2010). Increased prevalence of burnout symptoms in parents of chronically ill children. Acta Paediatrica, 99(3), 427-432.
Longo & Bond (1984). Handicapped Children and Their Families. 64(4). 274-277.

Journal for Educators, Teachers and Trainers JETT, Vol. 9 (2); ISSN: 1989-9572
45
Macias, M. M., Saylor, C. F., Rowe, B. P., & Bell, N. L. (2003). Age-related parenting stress differences in mothers of children with spina bifida. Psychological Reports, 93, 1223-1232.
Maslach, C., & Jackson, S. E. (1981). The measurement of experienced burnout. Journal of Occupational Behavior, 2, 99-113.
Meral, B. F. (2014). Kişisel iyi oluş indeksi-yetişkin türkçe formunun psikometrik özellikleri. The Journal of Happiness and Well-Being, 2(2), 119-131.
Mete, H. E. (2008). Kronik hastalık ve depresyon. Klinik Psikiyatri, 11(3), 3-18.
Öznacar, B. (2018). Risk Management Strategies in School Development and the Effect of Policies on Tolerance Education.Open & Equal Acessfor Learning in School Management. Ch.7,2018, (https://www.intechopen.com/books/open-and-equal-access-for-learning-in-school-management)
Özsoy, Y., Özyürek, M., Eripek, S. (1998). Özel eğitime muhtaç çocuklar “özel eğitime giriş. Ankara: Karatepe Yayınları.
Özgüven, (1999). Çağdaş Eğitimde Rehberlik ve Psikolojik Danışma. Ankara: PDREM Yayınları.
Pearce, j. (1996). Çocuklarda Büyüme ve Gelişme. (Çev. Ayşegül Yeşildağlar), (1996). Ankara: Doruk Yayıncılık
Pipp-Siegel S, Sedey AL, Yoshinaga-Itano C. (2002). Predictors of parental stress in mothers of young children with hearing loss. J Deaf Stud Deaf Educ. 2002 Winter;7(1):1-17
Sandalcı F(2002). Özürlü çocuğu olan aileler ve sosyal hizmet mesleği. Ufkun Ötesi Bilim Dergisi 2(1):1-8
Şen, F. M. (1991). İşitme engelli kardeşi olan çocukların psikolojik durumlarının değerlendirilmesi (Yayınlanmamış Yüksek Lisans Tezi), Ankara Üniversitesi Sosyal Bilimler Enstitüsü, Ankara.
Tamer, M. (2010). Zihinsel engelli çocuk annelerinde stres yönetimi eğitiminin etkileri. Yayımlanmamış Yüksek Lisans Tezi, Ege Üniversitesi, Sosyal Bilimler Enstitüsü, İzmir.
MEB(2006).15.09.2018.https://sgb.meb.gov.tr/ekutuphane/butcesunuslari/butcesunusu_2006/html5/index.html?&locale=TRK.
Walsh, S. (2006) Investigating classroom discourse, London: Routledge. Yörükoğlu, A. (1998). Çocuk ruh sağlığı (22. Baskı). İstanbul: Özgür Yayınları. Miller, A. C., Gordon, R. M., Daniele, R. J., & Diller, L. (1992). Stress, appraisal, and coping in
mothers of disabled and nondisabled children. Journal of Pediatric Psychology, 17(5), 587-605.
Nir, Z., & Neuman, L. (1995). Relationship among self-esteem, internal external locus of control and weight change after participation in a weight reduction program. Journal of Clinical Psychology, 51, 482-490
Oelofsen, N., & Richardson, P. (2006). Sense of coherence and parenting stress in mothers and fathers of preschool children with developmental disability. Journal of Intellectual and Developmental Disability, 31(1), 1-12.
Özer, N. (2002). Stres ve anksiyete için alternatif ve tamamlayıcı modeller. Atatürk Üniversitesi Hemşirelik Yüksekokulu Dergisi, 5(1), 101-104.
Özşenol, F., Işıkhan, V., Ünay, B., Aydın, H. İ., Akın, R., & Gökçay, E. (2003). Engelli çocuğa sahip ailelerin aile işlevlerinin değerlendirilmesi. Gülhane Tıp Dergisi, 45(2), 156-164.
Palancı, M. (2018). Engelli çocuğa sahip anne babaların aile yılmazlığı, öznel iyi oluş ve evlilik uyumlarının psiko-sosyal yeterlikler ile yordanması. Eğitim ve Bilim, 43(193), 217-236.
Rustin, L., & Kuhr, A. (1999). Social skills and the speech ımpaired. london: whurr publishers ltd. scotch, r. k. (2000). models of disability and the americans with disabilities act. Berkeley Journal of Employment and Labor Law, 21(1), 213-222.
Seltzer, M. M., Greenberg, J. S., Floyd, F. J., Pettee, Y., & Hong, J. (2001). Life course impacts of parenting a child with a disability. American Journal on Mental Retardation, 106(3), 265-286.
Seven, S. (2008). Yedi-sekiz yaş çocuklarının sosyal becerilerinin incelenmesi. Fırat Üniversitesi Sosyal Bilimler Dergisi, 18(2), 151-174.
Sivrikaya, T., & Tekinarslan, İ. Ç. (2013). Zihinsel yetersizliği olan çocuğa sahip annelerde stres, sosyal destek ve aile yükü. Ankara Üniversitesi Eğitim Bilimleri Fakültesi Özel Eğitim Dergisi, 14(2), 17-29.

Journal for Educators, Teachers and Trainers JETT, Vol. 9 (2); ISSN: 1989-9572
46
Smith, A. M., & Grzywacz, J. G. (2014). Health and well-being in midlife parents of children with special health needs. Families, Systems, and Health, 32(3), 303-312.
Sorias, O. (1986). Sosyal Beceriler ve Değerlendirme Yöntemleri. Psikoloji Dergisi, 5(20), 25-29.
Şahin, N. H., Batıgün, A. D., & Uzun, C. (2011). Anksiyete bozukluğu: kişilerarası tarz, kendilik algısı ve öfke açısından bir değerlendirme. Anadolu Psikiyatri Dergisi, 12(2), 107-113.
Şengül, S., & Baykan, H. (2013). Zihinsel engelli çocukların annelerinde depresyon, anksiyete ve stresle başa çıkma tutumları. Kocatepe Tıp Dergisi, 14(1), 30- 39.
Tatar, A., Özdemir, H., Haşlak, F. D., Atsızelti, Ş., Özüdoğru, M. T., Çavuşoğlu, F., Çelikbaş, B., Uysal, A. R., Toklu, N., Uyğur, G., Astar, M., & Saltukoğlu, G. (2018). Yetişkinler için a sosyal beceri ölçeğinin geliştirilmesi ve psikometrik özelliklerinin incelenmesi. Akademik Sosyal Araştırmalar Dergisi, 6(68), 69-88.
Toros, F. (2002). Zihinsel ve/veya bedensel engelli çocukların annelerinin anksiyete, depresyon, evlilik uyumunun ve çocuğu algılama şeklinin değerlendirilmesi. Türkiye Klinikleri Journal of Psychiatry, 3(2), 45-52.
Trower, P. (1987). Social skills training. British Medical Journal, 294, 663-664. Tura, G. (2017). Engelli çocuğu olan ve çocuğu engelli olmayan annelerin anksiyete, depresyon
ve psikolojik sağlamlık düzeylerinin incelenmesi. Dicle Üniversitesi Sosyal Bilimler Enstitüsü Dergisi, 9(18), 30-36.
Türkiye Otizm Erken Tanı ve Eğitim Vakfı (2010). Otizm spektrum bozuklukları raporu. İstanbul: TOHUM
Uğuz, Ş., Toros, F., İnanç, B. Y., & Çolakkadıoğlu, O. (2004). Zihinsel ve/veya bedensel engelli çocukların annelerinin anksiyete, depresyon ve stres düzeylerinin belirlenmesi. Klinik Psikiyatri, 7(1), 42-47.
Ünal, S. (1999). Okullardaki stres kaynakları verimlilik ilişkisi. Atatürk Eğitim Fakültesi Eğitim Bilimleri Dergisi, 11, 365-372.
Weiss, H. M. (2002). Deconstructing job satisfaction: Separating evaluations, beliefs and affective experiences. Human Resource Management Review, 12(2), 173-194. http://dx.doi.org/10.1016/S1053-4822(02)00045-1
Werner, S. & Shulman, C. (2013). Subjective well-being among family caregivers of individuals with developmental disabilities: The role of affiliate stigma and psychosocial moderating variables. Research in Developmental Disabilities; Nov 34(11), 4103-14.
World Health Organization (1981). Disability prevention and rehabilitation. World Health Organization.
Yalçın, H. (2012). Sosyal beceri seviyesinin okul öncesi öğretmenlerinde incelenmesi. Akademik Bakış Dergisi, 29, 1-11.
Yiengprugsawan, V., Seubsman, S. A., Khamman, S., Lim, L. Y., Sleigh, A. C., & Thai Cohort Study Team. (2010). Personal wellbeing index in a national cohort of 134 Thai adults. Social Indicators Research, 98(2), 201-215.
Yüksel, G. (1999). Sosyal beceri eğitiminin üniversite öğrencilerinin sosyal beceri düzeylerine etkisi. Türk Psikolojik Danışma ve Rehberlik Dergisi, 2(11), 37-47.
Journal for Educators, Teachers and Trainers JETT, Vol. 9 (2); ISSN: 1989-9572
47
ISSN 1989 - 9572
Constraining issues in face-to-face and Internet-based language testing
Problemas en la realización de exámenes de idiomas presenciales y online
Jesús García Laborda, Elena Alcalde Peñalver,
University of Alcala, Spain
Journal for Educators, Teachers and Trainers, Vol. 9 (2)
http://www.ugr.es/~jett/index.php
Date of reception: 06 October 2018
Date of revision: 29 November 2018
Date of acceptance: 24 de December 2018
García Laborda, J. & Alcalde Peñalver, E. (2018). Constraining issues in face-to-face and Internet-based language testing. Journal for Educators, Teachers and Trainers, Vol. 9(2), pp. 47 – 56.
Journal for Educators, Teachers and Trainers JETT, Vol. 9 (2); ISSN: 1989-9572
48
Journal for Educators, Teachers and Trainers, Vol. 9 (2)
ISSN 1989 – 9572
http://www.ugr.es/~jett/index.php
Constraining issues in face-to-face and Internet-based language testing Problemas en la realización de exámenes de idiomas presenciales y online Jesús García Laborda, [email protected] Elena Alcalde Peñalver, [email protected] University of Alcala, Spain Abstract Despite the increasing importance of language testing, technology design matters related to testing have hardly been addressed in academic research, yet not enough has been written on test-taking anxiety related to computerized speaking tests. Although students nowadays are digital natives, in our experience they seem to experience a significant level of anxiety when facing Internet-based oral. This research addresses an observational study of 67 students at the University of Alcalá who took a computer-delivered exam. The study concludes that despite students growing up with computers in their lives, we are far from invisible interfaces and independence when it comes to the way an exam is delivered. The results of this research study can shed light on what needs to be revised in computer or internet speaking tasks in high-stakes language tests Resumen A pesar de la creciente importancia de los exámenes de idiomas, los asuntos relacionados con el diseño tecnológico aplicados a la realización de estas pruebas cuando se realizan por ordenador apenas se han abordado en la investigación académica, y no se han publicado suficientes estudios sobre la ansiedad del estudiante a la hora de realizar pruebas orales de idiomas en frente de un ordenador. Aunque podemos considerar que los estudiantes de hoy en día son nativos digitales, la experiencia nos muestra que estos manifiestan un importante nivel de ansiedad a la hora de realizar pruebas orales de idiomas a través de Internet. En este artículo se analizan los resultados de un estudio observacional realizado con una muestra de 67 estudiantes de la Universidad de Alcalá que hicieron una prueba de idioma por ordenador. El estudio concluye que, a pesar de que los estudiantes crecen con los ordenadores y están familiarizados con los mismos, aún estamos lejos de conseguir interfaces invisibles y de la independencia en cuanto a la forma en que se entrega un examen. Los resultados de este estudio de investigación pueden arrojar luz sobre lo que necesita revisarse a la hora de diseñar exámenes de idiomas que se realizan a través del ordenador Keywords Language testing; Computer-delivered exam; Language learning Palabras clave Exámenes de idiomas; Exámenes por ordenador; Aprendizaje de idiomas

Journal for Educators, Teachers and Trainers JETT, Vol. 9 (2); ISSN: 1989-9572
49
1. Introduction Computer-based languages tests are common in education today (Chapelle and Voss, 2016; Yu & Zhang, 2017). Recent work in this area has looked at the use of devices such as mobile phones (García Laborda, Magal Royo, Litzler and Giménez López, 2015) or tablet PCs (García Laborda, Magal Royo and Bakieva, 2016). Excellent reviews have analysed some of the reasons for their overwhelming use. Some of the advantages related to it are their reduced cost, rapidness to mark tests and the inclusion of contextual videos to help students understand what they need to do (García Laborda, 2007). Today, it is hard to understand the significant advances in high-stakes language tests such as tests for citizenship, placement of international students, university entrance examinations and many more without the influence of the facility of delivery of computer or web tests. Although computer language tests differ from web-based tests in their design and retrieval, for practical purposes both types have been considered in this paper to be similar enough not to make a distinction. Despite a number of technological implementations (Labi, 2006), García Laborda, Magal Royo & Carrasco (2010) considered a few years ago that computer-based testing would completely replace pen and paper in just a few years (Dooey, 2008; Tahmasebi & Rahimi, 2013). However, reality has proved an unexpected co-existence of both ways of delivery. Thus, the question is why these pen-and-paper tests are still among us. Some factors that may affect this presence are related to the high age of test takers, the incapability of places in the third world to have good Internet access, obsolete hardware in some schools, wi-fi defective or weak connections. However, these may not actually explain the case for traditional exams in developed countries (at least, not always). Thus, it is necessary to get to know what the constraints are in foreign language testing. This paper addresses the observations done in the OPENPAU research project on computer-based University Entrance Examination between 2011 and 2016. 2. Literature review Language tests have been traditionally contrasted against pen-and-paper foreign language tests. Khoshsima, Hosseini & Toroujeni (2017) consider that in most cases the interest has been placed on converting traditional paper tests into computer delivered ones. However, they believe that computer-based language tests may not measure “Foreign Language only” but other aspects as well. Obviously, if this is true the validity of the exam would be jeopardized. According to Schneberger, Amoroso & Durfee (2007) the drawbacks introduced by the use of computers can be overcome by training and an adequate knowledge of the test. García Laborda, Litzler, Amengual Pizarro, García Esteban & Otero de Juan (2017) observed in a study on the APTIS test that when students know well what they are expected to do in a test and are very familiar with the candidate’s instructions book, their scores improve. Mei, Brown & Teo (2018) suggest that there is an increasing acceptance of the use of technology in the English as a Foreign Language classroom and that leads to better training in assessment through computers. Thus, as it can be seen, knowing the skills that can be more accessible is a key issue. Coniam (2006; 2009) describes how to write listening items for language tests. He also implies that listening, especially with multiple choice questions, is more accessible than other methods. The use of multiple-choice items facilitates delivery especially in adaptive testing (He & Min, 2017) but may well put the validity of a four-skill language test at stake since multiple choice language knowledge in real life does not exist. Besides, according to Odo (2012) familiarity with computers facilitates test performance. This is especially important because the increasing use of adaptive language tests is due to the fact that they make it easier to create new items and this can be done at a lower cost. García Laborda & Magal Royo (2009) researched the facility that senior teachers had to adapt to computer-based tests. They found that even older teachers would be accepting to orientate their teaching towards computer-based exams if they are trained properly. In a three-month training course, they observed that teachers are willing to respond positively if they are shown the functional and beneficial aspects of using computers that way.

Journal for Educators, Teachers and Trainers JETT, Vol. 9 (2); ISSN: 1989-9572
50
Fox & Cheng (2015) studied some of the issues that unsuccessful IB TOEFL test takers referenced as part of their personal experience with the test. Among the most significant aspects, they mention speediness, test anxiety, and test preparation. Naturally, these aspects have been found in current literature on the topic and Fox & Cheng include them in their paper. However, they fail to explain the issues that have to be specifically considered. Like other papers, this one also ignores the important issue of class observation done by researchers. Another important study was done by Zhan & Wan (2016) who report on students’ experience when preparing for a listening and speaking test (CELST). Thus, it was also important to get to know how teachers prepare their students for computer tests. García Laborda, Magal Royo & Enríquez Carrasco (2010) as well as Liu & Kleinsasser (2015) suggest that what seems to be a crucial aspect is teachers becoming aware of technology as well as getting the training to specifically address the necessary computer skills to their students through classroom activities. Gebril & Eid (2017) suggested a number of activities to prepare for online high-stakes tests. Teachers also mentioned that high-stakes tests may lead to negative washback (Messick, 1996; Popham, 2001) and put the emphasis on training techniques and test skills rather than focusing on learning the language. As seen in this review, it would be desirable to inform teachers about the most significant aspects to consider when training students for language tests based on the difficulties they have when taking them and how to solve some of the problems that derive from it. This paper intends to respond to these two questions. 3. Method 3.1. Participants The sample consisted of 67 students. Observations were done in three high-schools in Madrid and two in Guadalajara (Spain). Data collection was done on a research diary and, additionally, some of the parts of the research were videorecorded. The schools were categorized as average in the compulsory University Entrance Examination English scores. This observational study intends to address two main questions from the researcher’s perspective:
1) What are the difficulties that test takers have when taking an online test? 2) How can some of these problems improve?
This research involves the presence of the researcher and his observation may bias the research. A special effort has thus been made to verify the observations against the recorded videos of the observed experiences. Moreover, despite this potential bias, it has been especially important to understand and record the context and the interaction with the test and the computer. This observational experience will open new questions and research for future experiences that have not been implemented yet. The methodological approach hereby followed corresponds to Bryman (1988). The observations correspond to the OPENPAU project (2011-2016). 3.2. Procedure As already said, the researcher used observational methods to collect ground notes on students’ use and interaction. Each exam session lasted two hours, usually in two shifts due to the number of computers or the wifi capacity when using tablet PCs. During each visit, students were identified by a number code in order to track them, although this information may not be necessary for this paper. Before the visit, the research team was unaware of the situation in each high-school. Only the technicians of the research team were able to see the hardware and connections in advance. Although other publications have informed about the results of the OPENPAU, this is actually the first time that constraints are specifically addressed.

Journal for Educators, Teachers and Trainers JETT, Vol. 9 (2); ISSN: 1989-9572
51
The researcher operationally annotated different modes of interaction despite the number of occurrences in the research. Annotations were classified according to the different skills. However, the most significant observations refer to the speaking section. 4. Results and discussion Testing requires a state of slight positive anxiety. In the observations, two types of attitudes were observed. While most students showed relative anxiety, a few actually evidenced high anxiety because of certain discomfort while taking the test. This discomfort was due to the following factors:
Time pressure. This feeling was emphasized by the presence of a clock in the interface (like in all computer-based tests). This is obviously very different from pen-and-paper tests where the clock may be in front of test takers and increase their anxiety (Roever, 2006; Liu et al., 2010; Namdar & Bagheri, 2012; David, 2016). A second matter in this sense is that in a traditional exam students generally do not need to “pack” their oral responses in a given time. We observed, for instance, that the guide to a number of the Cambridge Suite exams recommend not only what and how to respond but to adjust the response to the given time. Thus, students have the feeling that they have to keep speaking until the time is reached.
Lack of interaction. This has been mentioned in a number of papers such as the one published by Qian (2009) but we found that most students do not hesitate to interact with semi-communicative videos especially when addressing descriptions. In another research study done with French students in the Pennsylvania State Examinations at State College High School in 2013, the researcher observed that when the input of the test task is not visually supported, results tend to be more discrete.
Problems with body language. We even observed students using their body language (Chen & Wang, 2008). Therefore, hesitation or “emptiness” may well be associated to personality styles. In a different research study with the APTIS test, it was considered that the least and the most extroverted students were more fluent and used more body language when doing descriptions in the speaking section.
Feeling unheard. Additionally, it has been observed that in paired interviews there is considerable support and interaction not only verbally but also through body language which is missing in online testing (Ockey, 2009). A number of students mentioned that they lack the motivation to answer to questions prompted by a video with little expectations to communicate meaningfully.
“Dehumanization” (nobody could care about what they said). As in the previous point, the lack of communication is connected to dehumanization where there can be repulsion towards what they are doing. In extreme situations research suggests that this fact could lead to lowering their scores.
Prompts cannot replace human presence. Although a number of studies have intended to provide evidence that videos in computer-based testing can help to contextualize the prompts, this fact depends on the testee’s personality.
After the observations, the researcher, however, observed some positive aspects which could actually be related to positive reactions to computer language testing. Again, it was perceived that the main trait that could actually make a distinction between the previous and the following reactions would be the test taker’s personality. Among the interesting reactions it was observed:
Body language in one-way interaction. Some students, who were mostly considered as introverted by their teachers, evidenced a great capacity to interact with the
Journal for Educators, Teachers and Trainers JETT, Vol. 9 (2); ISSN: 1989-9572
52
computer. It was even observed that around 15% did some kind of body language when addressing the speaking questions.
Relation with competence (lower competence demands more interaction). This body language was also observed in students with lower competence who may need to rely on body language.
High adaptability to computers. It has been observed in literature that some people are more adaptable to interact with computers than others. Some of the test takers proved to be more capable to adapt to this kind of tests than others. However, although this could be a natural thing, it is important to find the features that make some students more prone to interact with computers in language tests and those that actually do the opposite.
Despite the “empty responses” students are able to synthesize and be able to articulate good monologues. The researcher observed that, all in all, most students with at least a B1 competence are able to articulate the adequate responses and even monologues.
Although so far we have addressed significant problems that may threaten students’ final scores, we observed quite a positive situation among high schoolers. That may well indicate that we are not far from that transparent and normalized interface which may have little or no effect on how students perform. This may be due to the fact that students are becoming more familiar with online language tests and also because technology involves many daily interactions. Additionally, technology in language recognition may make this easier even in the future (Chiu, Liou & Yeh, 2007). Therefore, students are getting used to interacting with avatars, videos and digital prompts as well as using online applications to trigger their speaking skills (Yen, Hou & Chang, 2015). Test designers should thus develop prompts similar to the most common ones found in digital communication (Yang, Miller & Bai, 2011; Yang, Gamble & Tang, 2012; Andújar-Vaca & Cruz-Martínez, 2017). It was also observed that some semi-communication can be established with our current ways to assess through computer delivered language tests. This is currently presented in many language lab activities. It was also considered that there is still some scarcity of online published materials that have been specifically designed for test training. 5. Conclusions The results of this observational study have shown that even though students nowadays are more familiar with new technologies and these are indeed part of their everyday lives, when taking a test anxiety still seems to be an issue if this is done in front of a computer. As stated above, the advantages of online testing are obvious, such as the possibility to spread them all over the world and obtain results more quickly. However, if we want our students to improve their performance when using computers to take tests, we need to make sure that they are completely comfortable with it after having practiced for a long time with the format of the test. They need to be sure that they will not waste any time learning how to use the tool or reading instructions and that they can start working on the contents of the test as soon as they have it in front of them. This is why teachers need to be prepared to be able to train their students properly on the use of these tests. The demands and speed of technology of the world of education nowadays demand a critical teacher that is able to combine the teaching of language content with the digital competencies that students need to develop to successfully meet the requirements of online testing. Therefore, the crucial aspect of teachers’ preparation is not just teaching students the language contents they need for the test but making them aware of the skills they need to develop to specifically address the challenges of online testing. This will result in fewer problems related to time pressure and lack of interaction and will help students realize that not having the presence of a human when they speak does not mean that what they are saying is meaningless or empty.

Journal for Educators, Teachers and Trainers JETT, Vol. 9 (2); ISSN: 1989-9572
53
This research has addressed an observational study of 67 students at the University of Alcalá who took a computer-delivered exam. The observations were part of the OPENPAU research project on computer-based University Entrance Examination between 2011 and 2016. The questions that the research study intended to give an answer to were related to the difficulties that test takers had when taking an online test and how some of the problems that derive from it could be solved. Results show that the anxiety experienced by students when taking a computer-based test was linked to factors such as time pressure, lack of interaction, problems with body language, feeling unheard and lack of human presence to interact with. However, some positive aspects were also observed since many students were able to adapt to the computer-based test and successfully interact with it. The variation in reactions seems to depend on the test taker’s personality. This may well be a sign of progress in web-based testing since students are becoming more used to interacting with technology. Moreover, results help teachers understand what factors they need to work on in order to facilitate students’ experience when taking an online test and more online materials need to be created in order to support training in this regard. However, we are aware that this research study is clearly limited by the sample and the circumstances in which the observations were done. Thus, further research is necessary. One of the issues that needs to be developed as contrasted to real life is how to achieve a “flow” state of mind in an online test (in fact, either traditional or online tests) (In’nami, 2006; Aydin, 2013; Bayat, Jamshidipour & Hashemi, 2017; Valencia Robles, 2017) despite the time and other issues constraints (Behnam, Jenani & Ahangari, 2014). The reduction of high negative anxiety could facilitate student’s performance in most cases. This reduction of negative anxiety should be a goal in any exam to achieve the student’s full potential and thus currently needs specific training (Wang & Chang, 2011). Another significant potential study would be that of personality in online language testing Lai, 2010) which could also relate to age and socio-economic status, although the latter is gradually disappearing as a differentiating factor. All in all, this paper has addressed the researcher’s observations. However, larger studies are still necessary since new issues will appear as technology evolves. In this sense, this paper may serve to trigger future studies and serve as food for thought for teachers, researchers and administrators. 6. References
Andújar-Vaca, A., & Cruz-Martínez, M. (2017). Mobile instant messaging: Whatsapp and its
potential to develop oral skills. Comunicar: Media Education Research Journal, 25(50), 43-52. Retrieved from https://search.proquest.com/docview/2013524090?accountid=14609
Aydin, S. (2013). Factors affecting the level of test anxiety among EFL learners at elementary schools. E-International Journal of Educational Research, 4(1), 63-81. Retrieved from https://search.proquest.com/docview/1347458261?accountid=14609
Bayat, A., Jamshidipour, A., & Hashemi, M. (2017). The beneficial impacts of applying formative assessment on iranian university students' anxiety reduction and listening efficacy. International Journal of Languages' Education and Teaching, 5(2), 1-11. Retrieved from https://search.proquest.com/docview/1941339629?accountid=14609
Behnam, B., Jenani, S., & Ahangari, S. (2014). The effect of time-management training on test-anxiety and self-efficacy of iranian intermediate EFL learners. Iranian Journal of Language Teaching Research, 2(1), 45-61. Retrieved from https://search.proquest.com/docview/1895983152?accountid=14609
Bryman, A. (1988). Doing research in organizations. Oxford: Taylor & Francis. Chapelle, C. A., & Voss, E. (2016). 20 years of technology and language assessment in
Language Learning & Technology. Language Learning & Technology, 20(2), 116–128.pç Chen, N., & Wang, Y. (2008). Testing principles of language learning in a cyber face-to-face
environment. Educational Technology & Society, 11(3), 97-113. Retrieved from https://search.proquest.com/docview/61942649?accountid=14609

Journal for Educators, Teachers and Trainers JETT, Vol. 9 (2); ISSN: 1989-9572
54
Chiu, T., Liou, H., & Yeh, Y. (2007). A study of web-based oral activities enhanced by automatic speech recognition for EFL college learning. Computer Assisted Language Learning, 20(3), 209-233. Retrieved from https://search.proquest.com/docview/62068722?accountid=14609
Coniam, D. (2006). Evaluating computer-based and paper-based versions of an english-language listening test. ReCALL, 18(2), 193-211. Retrieved from https://search-proquest-com.ezproxy.uned.es/docview/61866638?accountid=14609
Coniam, D. (2009). Experimenting with a computer essay-scoring program based on ESL student writing scripts. ReCALL, 21(2), 259-279. Retrieved from https://search-proquest-com.ezproxy.uned.es/docview/61880506?accountid=14609
David, V. (2016). A comparison of two approaches for assessing L2 writing: Process-Based and impromptu timed writing exams. Applied Language Learning, 26(1), 65-82. Retrieved from https://search.proquest.com/docview/1773217472?accountid=14609
Dooey, P. (2008). Language testing and technology: Problems of transition to a new era. ReCALL, 20(1), 21-34. Retrieved from https://search-proquest-com.ezproxy.uned.es/docview/61946517?accountid=14609
Fox, J., & Cheng, L. (2015). Walk a mile in my shoes: Stakeholder accounts of testing experience with a computer-administered test. TESL Canada Journal, 32(9), 65-86. Retrieved from https://search.proquest.com/docview/1826524519?accountid=14609
García Laborda, J. (2007). On the net: Introducing standardized EFL/ ESL exams. Language Learning & Technology, 11(2), 3-9.
García Laborda, J., Amengual Pizarro, M., Litzler, M.F., García Esteban, S. & Otero de Juan, N. (2017). Student perceptions of the CEFR levels and the impact of guided practice on Aptis Oral test performance. Cambridge: British Council.
García Laborda, J., & Magal Royo, T. M. (2009). Training senior teachers in compulsory computer based language tests. Procedia: Social and Behavioral Sciences, 1(1), 141-144.
García Laborda, J., Magal Royo, MT & Bakieva, M. (2016). Looking towards the Future of Language Assessment: Usability of Tablet PCs in Language Testing. Journal of Universal Computer Science, 22(1), 114-123.
García Laborda, J., Magal Royo, T. & Enríquez Carrasco, E.V. (2010). Teachers' trialing procedures for Computer Assisted Language Testing Implementation. Eurasian Journal of Educational Research. 39, 161-174.
García Laborda, J., Magal Royo, T., Litzler, M.F. & Giménez López, J.L. (2014). Mobile phones for a University Entrance Examination language test in Spain. Educational Technology & Society, 17(2), 17-30.
Gebril, A., & Eid, M. (2017). Test preparation beliefs and practices in a high-stakes context: A teacher's perspective. Language Assessment Quarterly, 14(4), 360-379.
He, L., & Min, S. (2017). Development and validation of a computer adaptive EFL test. Language Assessment Quarterly, 14(2), 160-176. Retrieved from https://search-proquest-com.ezproxy.uned.es/docview/1913353776?accountid=14609
In'nami, Y. (2006). The effects of test anxiety on listening test performance. System: An International Journal of Educational Technology and Applied Linguistics, 34(3), 317-340. Retrieved from https://search.proquest.com/docview/61928846?accountid=14609
Khoshsima, H., Hosseini, M., & Toroujeni, S. M. H. (2017). Cross-mode comparability of computer-based testing (CBT) versus paper-pencil based testing (PPT): An investigation of testing administration mode among iranian intermediate EFL learners. English Language Teaching, 10(2), 23-32. Retrieved from https://search-proquest-com.ezproxy.uned.es/docview/1895981640?accountid=14609
Labi, A. (2006). European educators predict chaos if ETS expands internet-based english test to 100 countries. Chronicle of Higher Education, 52(22), 2. Retrieved from https://search-proquest-com.ezproxy.uned.es/docview/61803385?accountid=14609
Lai, Y. (2010). Which do students prefer to evaluate their essays: Peers or computer program. British Journal of Educational Technology, 41(3), 432-454. Retrieved from https://search.proquest.com/docview/742869291?accountid=14609
Liu, M., & Kleinsasser, R. C. (2015). Exploring EFL teachers' CALL knowledge and competencies: In-service program perspectives. Language Learning & Technology,
Journal for Educators, Teachers and Trainers JETT, Vol. 9 (2); ISSN: 1989-9572
55
19(1), 119-138. Retrieved from https://search-proquest-com.ezproxy.uned.es/docview/1697493382?accountid=14609
Liu, X., Liu, H., Bao, Z., Ju, B., & Wang, Z. (2010). A web-based self-testing system with some features of web 2.0: Design and primary implementation. Computers & Education, 55(1), 265-275. Retrieved from https://search.proquest.com/docview/742866834?accountid=14609
Mei, B., Brown, G. T., & Teo, T. (2018). Toward an understanding of preservice english as a foreign language teachers' acceptance of computer-assisted language learning 2.0 in the People's Republic of China. Journal of Educational Computing Research, 56(1), 74-104. Retrieved from https://search-proquest-com.ezproxy.uned.es/docview/2013521916?accountid=14609
Messick, S. (1996). Validity and washback in language testing. Language Testing, 13(3), 241 256.
Namdar, S., & Bagheri, M. S. (2012). The effect of instructing impression management behaviors on maximizing applicants' performance in the IELTS speaking test. English Language Teaching, 5(4), 150-160. Retrieved from https://search.proquest.com/docview/1773223947?accountid=14609
Ockey, G. J. (2009). Developments and challenges in the use of computer-based testing for assessing second language ability. Modern Language Journal, 93, 12. Retrieved from https://search.proquest.com/docview/61819498?accountid=14609
Odo, D. M. (2012). Computer familiarity and test performance on a computer-based cloze ESL reading assessment. Teaching English with Technology, 12(3), 18-35. Retrieved from https://search-proquest-com.ezproxy.uned.es/docview/1941340773?accountid=14609
Popham, W. J. (2001). Teaching to the test? Educational Leadership, 58(6), 16–21. Qian, D. D. (2009). Comparing direct and semi-direct modes for speaking assessment: Affective
effects on test takers. Language Assessment Quarterly, 6(2), 113-125. Retrieved from https://search.proquest.com/docview/61813075?accountid=14609
Roever, C. (2006). Validation of a web-based test of ESL pragmalinguistics. Language Testing, 23(2), 229-256. Retrieved from https://search.proquest.com/docview/62005537?accountid=14609
Schneberger, S., Amoroso, D.L. & Durfee, A. (2007). Factors that influence the performance of computer-based assessments: an extension of the technology acceptance model. Journal of Computer Information Systems, 48 (2), 74-90.
Tahmasebi, S., & Rahimi, A. (2013). Computer-assisted assessment: Highlights and challenges. Teaching English with Technology, 13(2), 55-74.
Valencia Robles, J.,de F. (2017). Anxiety in language testing: The APTIS case. PROFILE: Issues in Teachers' Professional Development, 19, 12. Retrieved from https://search.proquest.com/docview/2011270812?accountid=14609
Wang, L., & Chang, H. (2011). Improve oral training: The method of innovation assessment on english speaking performance. International Journal of Distance Education Technologies, 9(3), 56-72. Retrieved from https://search.proquest.com/docview/964179571?accountid=14609
Yang, Q., Miller, M., & Bai, K. (2011). Testing the improvement of english as a foreign language instruction among chinese college students through computerized graphic visuals. TESOL Quarterly: A Journal for Teachers of English to Speakers of Other Languages and of Standard English as a Second Dialect, 45(1), 170-182. Retrieved from https://search-proquest-com.ezproxy.uned.es/docview/881457615?accountid=14609
Yang, Y. C., Gamble, J., & Tang, S. S. (2012). Voice over instant messaging as a tool for enhancing the oral proficiency and motivation of English-as-a-foreign-language learners. British Journal of Educational Technology, 43(3), 448-464. Retrieved from https://search.proquest.com/docview/1018481249?accountid=14609
Yanxia, Y. (2017). Test anxiety analysis of Chinese college students in computer-based spoken English test. Educational Technology & Society, 20(2), 63-73. Retrieved from https://search.proquest.com/docview/1913345293?accountid=14609
Yen, Y., Hou, H., & Chang, K. E. (2015). Applying role-playing strategy to enhance learners' writing and speaking skills in EFL courses using facebook and skype as learning tools: A case study in taiwan. Computer Assisted Language Learning, 28(5), 383-406. Retrieved

Journal for Educators, Teachers and Trainers JETT, Vol. 9 (2); ISSN: 1989-9572
56
from https://search-proquest-com.ezproxy.uned.es/docview/1773216934?accountid=14609
Yu, G., & Zhang, J. (2017). Computer-based english language testing in china: Present and future. Language Assessment Quarterly, 14(2), 177-188. Retrieved from https://search-proquest-com.ezproxy.uned.es/docview/1913352985?accountid=14609
Zhan, Y., & Wan, Z. H. (2016). Test takers' beliefs and experiences of a high-stakes computer-based english listening and speaking test. RELC Journal: A Journal of Language Teaching and Research, 47(3), 363-376.

Journal for Educators, Teachers and Trainers JETT, Vol. 9 (2); ISSN: 1989-9572
57
ISSN 1989 – 9572
Teachers’ views on creativity and creative students Opiniones de los profesores sobre creatividad y estudiantes creativos
Yagmur Ugurel, Near East University, North Cyprus
Deniz Ozcan,
Ondokuz Mayıs University, Turkey
Journal for Educators, Teachers and Trainers, Vol. 9 (2)
http://www.ugr.es/~jett/index.php
Date of reception: 09 October 2018
Date of revision: 24 December 2018
Date of acceptance: 27 December 2018
Ugurel, Y. & Ozcan, D. (2018). Teachers’ views on creativity and creative students. Journal for Educators, Teachers and Trainers, Vol. 9(2), pp. 57 – 71.

Journal for Educators, Teachers and Trainers JETT, Vol. 9 (2); ISSN: 1989-9572
58
Journal for Educators, Teachers and Trainers, Vol. 9 (2) ISSN 1989 – 9572
http://www.ugr.es/~jett/index.php
Teachers’ Views on Creativity and Creative Students
Opiniones de los Profesores Sobre Creatividad y Estudiantes Creativos Yagmur Ugurel, Near East University, North Cyprus [email protected] Deniz Ozcan, Ondokuz Mayıs University, Turkey [email protected]
Abstract The purpose of this study is to determine the opinions of teachers’ regarding creativity and creative students. The data was collected through interview form prepared by researchers for this purpose. It was aimed to determine the teachers' views on creativity, creative student characteristics, activities that can be done in class to improve creativity, use of material in creativity and opinions about creative classroom environment. Qualitative research method was utilized using a semi-structured interview technique. Study group of the research consisted of 17 teachers working in both in the North Cyprus and in different regions of Turkey. Seven of them are classroom teachers, four are mathematics, three are science, two are electrical-electronics teachers and one of them is a biology teacher. The data obtained from the study were analysed through content analysis. As a result; teachers' creativity and creative student definitions focus on the concepts of 'difference' and 'originality' and there are many different methods that can be used to develop creativity in the classroom. It is important that the classroom environment that develops creativity is an environment where the student feels free and comfortable and material use is considered to be important Resumen El propósito de este estudio es determinar las opiniones de los maestros sobre la creatividad y los estudiantes creativos. Los datos fueron recolectados a través de un formulario de entrevista preparado por los investigadores para este propósito. El objetivo fue determinar los puntos de vista de los maestros sobre la creatividad, las características creativas de los estudiantes, las actividades que se pueden realizar en clase para mejorar la creatividad, el uso del material en la creatividad y las opiniones sobre el entorno creativo en el aula. El método de investigación cualitativa se utilizó mediante una técnica de entrevista semiestructurada. El grupo de estudio de la investigación estuvo compuesto por 17 profesores que trabajaban tanto en el norte de Chipre como en diferentes regiones de Turquía. Siete de ellos son profesores de aula, cuatro son matemáticas, tres son ciencias, dos son profesores de electrónica y uno de ellos es un profesor de biología. Los datos obtenidos del estudio fueron analizados mediante análisis de contenido. Como resultado; La creatividad de los profesores y las definiciones creativas de los estudiantes se centran en los conceptos de "diferencia" y "originalidad", y existen muchos métodos diferentes que se pueden utilizar para desarrollar la creatividad en el aula. Es importante que el ambiente en el aula que desarrolla la creatividad sea un entorno donde el estudiante se sienta libre y cómodo y se considere importante el uso del material Keywords Creativity; Creative students; Teacher views Palabras clave Creatividad; Alumnos creativos; Puntos de vista del profesor

Journal for Educators, Teachers and Trainers JETT, Vol. 9 (2); ISSN: 1989-9572
59
1. Introduction Creativity is one of the most important events that bring human history to the present day. It has been a source of many innovations in everyday life since the early ages, with its Latin origin ''create'' which means ''to create, to breed ''. Important events, such as fire, wheel inventions, and writing, were nourished by creativity as they emerged from need. Especially in Europe during the Renaissance period, art, sculpture, painting and music are associated with art, but later on, it has become indispensable for science and technique. When we look at today, creativity is one of the most important cognitive processes that different groups of people need for different reasons at every stage of daily life. Fromm’s (1959) definition of creativity is a form of curiosity, a capacity to cope with mismatch and tension, an individual's self - renewal, a consciousness of experience, and to react to it with its whole self. Creativity in this way focuses on features and processes that are thought to result in creative productivity, rather than product quality. Torrance (1965, 1977) defines creative gaps as a way to sense gaps, disturbing or incomplete elements, to develop ideas about them, to make assumptions, to test them, to compare and evaluate the results, and to retest. (Kale, 1994). San, on the other hand, defines creativity as the ability to establish relationships between previously unrelated associations so that they can reveal new livings, experiences, new ideas and new products in a new scheme of thinking. (Zongur, 1996). Vance & Deacon (1995) argue that “creativity is the production of the new one and the reorganization of the old one" (Bentley, 1999). According to Rhodes (1961) l, creativity has been shaped by the combination of press, person, process, product, which he calls "four p of creativity". Creativity also appear in the in-classroom dialogical relation among the different educational stakeholders García Esteban, S. & García Laborda, 2016; 2018). Hermann reveals his preconceptions about the concept of creativity as follows:
Creativity is an innate one. Creativity is human specific. Every human being has the chance to be creative.
It is not necessary to be a genius to be creative.
Although creativity is blurred for a variety of reasons, it can be regenerated, motivated and improved with life experiences and special programs.
Many different definitions can be made about creativity. It is also extremely ridiculous to limit a concept like creativity to one definition. In general, when we look at the definitions we have in common, we see ''doing new and different things, introducing a new idea or product'' in the name of creativity. At the same time, the definitions tell us that creativity is a very valuable scientific process. Creativity is an ability with different characteristics in every age group. There are many individual features that positively affect creativity. However, when we try to explain creativity with individual characteristics, we are mistaken only by reducing it to the individual's cognitive skills. On the contrary, creativity must be explored in the whole life of the individual. Creativity lies in the individual's perceptions, personality, social relations, work habits, thinking and perception of the world. Some creativity researchers have identified the characteristics of creative individuals in scientific research on creativity and in creativity theories (Tardif & Sternberg, 1988). They classified the characteristics of the creative individual into 20 categories. These are; originality, high intelligence, awareness of creativity, logical thinking, extraordinary thinking, interrogating, knowledge and experience, not hesitating to make independent decisions, taking risks, being energic, curios, being funny, interest towards the unknown, imaginative, interested in arts, open minded, preferring to be alone, strong insight, emotional and high ethical values. The most important features of creative people are their original, extraordinary, logical and critical thinking skills and their imagination (Sak, 2004). Creative people show excitement and interest when they encounter an innovation. Less creative people may be suspicious or even hostile in the same situation. When a probing new solution was proposed in the research that Martindale had done, creative students were interested in it, presented other suggestions and ignored the problems in the solution. Less creative students were looking for solutions rather than focusing on the potential of solutions.

Journal for Educators, Teachers and Trainers JETT, Vol. 9 (2); ISSN: 1989-9572
60
It is necessary to look at the creativity of the students and the characteristics of the creative students by moving on from this sample. The inevitable consequence when we compare child and adulthood creativity is that the creativity in the child is very different from the creativity in adulthood. The developmental differences of growth and maturity along with the environment make it difficult to assess childhood creativity based on the criteria of adult creativity. We can assess adulthood creativity with social impact criteria, but not with the same criterion nor with measuring children's creativity levels, nor in identifying developmental differences in creativity. The most common features of creativity in creative children emerging from scientific research are compiled below There are, of course, many features that distinguish creative children from other children. However, only the most common and obvious ones are addressed here.
1. They have an ability to connect or associate ideas that are unrelated. 2. High ability to rearrange and merge ideas to create new ideas or products. 3. The idea repertoires are very rich in problem solving. They produce many ideas to
solve the problem. 4. There have intelligence jokes. They notice jokes that others cannot see. 5. Their imagination surpasses the anticipated limits at the time they create confusion.
Their talent skills are far ahead. 6. There are trends and concerns to change, correct or adapt existing ideas or products. 7. They may have unusual, futuristic, or bizarre ideas about a topic or for solving a
problem. Producing original ideas is a priority for them. 8. In order to complete their extra ordinary work they show focus, responsibility and
ambition at a level of obsession. 9. Due to the curiosity of discovering and knowing, they start asking a lot of questions at
an early age and this behavior can continue until adolescence. 10. While there is no interest in most issues, the interest in a few areas is so intense that it
can turn into a passion. All children are born with creativity, but the ability to be developed requires an environment that supports creativity. The children who spend long hours of school days with their teachers from the young age are undoubtedly influenced by their teachers in terms of creativity. In this sense, the teacher has a difficult duty. To uncover creative children, to identify them with features that are different from other children, and to nurture the creativity of all children… First of all, the teacher must be a very good observer for this. They should also analyse the problem solutions, games and social relations of the children and should observe the children during the classes or during the breaks. The teacher should serve as a guide to guide the students rather than limiting them. Frequently open-ended questions should be asked to the class to talk, analyse and give examples. By creating problem situations, children should be encouraged to seek different solutions. The teacher must constantly use different methods and techniques and should be able to make creative drama activities in the class. Instead of just being stuck in the classroom environment a teacher should open the perceptions of children to be able to learn in the garden, in the library, in the laboratory, in the museums or in art galleries. They should know the innovations made in science, art and technology, and share them with students in a way they can understand. Artists and scientists who have shed light with their works should give their courage in their ideas, projects, and experiments. A child who does not hesitate to share his ideas with his/her teachers and friends whom she/he trusts in different environments will undoubtedly be a creative individual who is highly confident, not afraid to think and not afraid to produce. In this sense, of course, the teacher must have a high intellectual accumulation. Creative attitudes are not limited to what is been done in class but also to online search and creations – such as webquests- (Costa & Loureiro, 2016; Garcia Laborda, 2009). Creative teacher is a problem-solving, adaptive person who can meet the needs of the students from different angles by bringing materials and ideas to the class. It is the individual who is able to constantly create different activities for his/her students and encourage the students to be creative, allowing the child to show that he/she can be creative. The creative teacher makes the boring classroom atmosphere more appealing by using the tools and other materials in different

Journal for Educators, Teachers and Trainers JETT, Vol. 9 (2); ISSN: 1989-9572
61
shapes to make the lesson enjoyable. This allows students to improve their creativity and increase their learning desire. In addition to this, the development of the child's creativity needs to be regulated in such a way that the teacher's creativity or creative thinking as well as the educational programs allow the students to improve their creativity (Emir & Bahar, 2003). Creativity is a cognitive ability that interests the educational, artistic and business world for different reasons. Although creative individuals have always been one step ahead of ordinary people for many years, we cannot say this for every period of the society. Developing this desirable feature also starts with the awareness of creativity in the early ages. Children who meet with formal education at a very young age spend long hours at school with their teachers. After family, the teacher is the most important factor that shapes the child's personality. The sooner teachers notice the precious stones in their class, the sooner they start to shape. Teachers have no difficulty noticing the academic success students however, they may not immediately notice children who have creativity, analytical thinking, etc. This research tells us how teachers evaluate creativity. However, it also includes information on how teachers can understand creative students, what they can do for them, how effective the used materials are, and how they can make the classroom more creative. In the light of all these, teachers will be able to see the relationships of teachers in different fields with creativity and creative children in their classrooms, laboratories or workshops and they will be able to develop themselves on this field. The findings of this research will contribute to the literature in this sense. So, the aim of the study is to determine teachers' views on the concept of creativity and the creative students in their class? To reach this aim, the study seeks to answer following questions.
1) How are teachers' opinions about creativity? 2) How are teachers' opinions about creative students? 3) What is the opinion of the teachers about the features that distinguish creative
students from other students 4) What do teachers do to improve the creativity of students in their classes? 5) How are teachers' views on the effect of the course materials used on creativity? 6) How are the views of the teachers about the classroom environment that improved the
creativity of the students? 1.1. Methodology Qualitative research method was utilized using a semi-structured interview technique. Qualitative research is a type of scientific research. In general terms, scientific research consists of an investigation that seeks answers to a question, systematically uses a predefined set of procedures to answer the question, collects evidence, produces findings that were not determined in advance, and applicable beyond the immediate boundaries of the study. 1.1.1. Study group For the experimental design, the model by Yıldırım & Şimşek (2006) was mostly followed. The "purposeful sampling" method was used to determine the teachers involved in this study. Purposive sampling allows for in-depth study of situations that are thought to have rich knowledge. One of the purposeful sampling methods used in the research was "sampling of easily accessible situations". This method of sampling gives speed and practicality to research; because in this method the researcher chooses a situation that is close and easy to access. most different branches. Within the scope of this study, 17 teachers who constituted the study group were included in the first part of the semi-structured interview form, questions were asked about the gender of the teachers, year of study, level of education and the field they graduated from. Thus, preliminary information was obtained about the teachers who participated in the research and it was tried to increase the reliability level of the research. As the knowledge and experience of the teachers are important in this research and it is thought that to express them sincerely will contribute to the scientific ness of the research. The study group of this study is composed of 17 teachers. 7 of these are classroom teachers, 4 are mathematics, 3 science, 2

Journal for Educators, Teachers and Trainers JETT, Vol. 9 (2); ISSN: 1989-9572
62
electrical-electronics and 1 biology. Teachers are also classified as verbal and numerical tutors within themselves. This classification is one of the variables of the research. According to this, 7 of the participants enter the verbal courses and 10 of them enter the numerical courses. 17 teachers participating in the research consisting of 3 males and 14 females ages range between 25 and 50. 10 of the teachers are in the undergraduate level whereas 4of them are at master's level. Teachers' working years range from 2 to 25 years. When we look at years of experience, 3 teachers in the study year 1-5 years, the study period of 7 teachers is 6-10 years, 1 teacher's study year between 11-15 and 6 years of work are 16 years and over. These teachers work at primary, secondary and high school levels, 6 are private schools and 11 are state school teachers. In the study, the codes of the teachers were given as T1 ... T17. 1.1.2. Data collection tool In this study, the data were obtained by the semi-structured interview form prepared by the researcher. In this technique, the researcher prepares an interview form with questions that she plans to ask in advance. Depending on the flow of the interview, the researcher can influence the flow of the interview with side or bottom questions and can help the person to open and give details about their answers. After the semi-structured interview form was formed, it was presented to two training teachers and two class teachers and their ideas were taken. Some changes were made to the scale questions after the views received. Before piloting, the scale was tested on a classroom teacher and a foreign language teacher and the clarity and comprehensibility of the questions were examined. The pilot application gives the researcher an idea of how well the interview form is prepared and whether the statements used are appropriate for the interview. The first part of the data collection tool includes demographic information such as age, gender, education level, seniority and branch of the teachers. The second part consists of six open ended questions. In the first part of the question, teachers' perceptions about the concept of ''creativity'' were seek. The second and third questions relate to creative students, while the fourth question concerns activities that teachers can do to improve creativity. The fifth question examines the course materials used and the sixth question suggests the creative classroom environment.
1.1.3. Data analysis Since the questions directed to the participant of the survey were open ended questions, they had the necessary flexibility in terms of time. Attempts have been made to reveal the common and different aspects of the participants' responses to each item. Descriptive analysis within the scope of basic level analysis was used to analyse the qualitative data obtained in the research. In descriptive analysis, the data can be organized according to the theme set out by the research questions as well as the questions or dimensions used in the interview and observation processes. Descriptive analysis consists of 4 steps. These are: "framework for descriptive analysis, processing of data according to thematic framework, identification of findings, interpretation of findings". In this study, data were presented considering the questions used in the interview. Messages (codes) have been removed from responses to each question. Later, similar codes were collected under the same group and categories were created. Direct citation has often been given in order to reflect the views of the interviewed individuals in a striking way. Participant names are not used and coded in excerpts. The followings were carried out for validity and reliability. Validity: The collected data are written in detail and how the results are achieved is explained in a clear and understandable manner. The opinions of interviewed teachers were frequently given through direct citations and the results of the research are explained in this way. This was the way the validity study of the study was made. Internal Validity: The research findings are consistent and meaningful in themselves. The resulting concepts are likely to form a whole. In addition, the findings are consistent with the conceptual framework established. Data has been benefited from this framework in total; Research questions have been prepared in accordance with this framework. In short, both in

Journal for Educators, Teachers and Trainers JETT, Vol. 9 (2); ISSN: 1989-9572
63
data collection processes and in the analysis and interpretation of data, it is explained in detail how this consistency is provided. The researchers who conducted the study constantly questioned themselves and the research process with a critical eye; and to check whether the findings obtained and the results of these findings reflect the reality. External Validity: The results of the research are consistent with the conceptual framework of the research question. In the research, there are necessary explanations for the detection of the findings in other investigations. In order for the results of the research to be generalized to similar environments, the researchers informed the reader in detail about all stages of the research. Readers may not be able to generalize directly to their own environment from the results of research; however, they can gain some lessons or experiences that might apply to their environment. If this happens, the generalizability of qualitative research results increases. Realiability: The researcher refrained from directing the teachers interviewed in this study. In short, the role of the researcher has been to enable teachers to talk about the subject matter of the research and its purpose. In the study, the data obtained by interview and writing were resolved by researchers and categorized by means of messages (codes). In order to demonstrate the reliability of the coding used in the research, common codes evaluated separately by papers, researcher and expert have been reached. The second measure to be taken by researchers on external reliability is the explicit identification of individuals who are data sources in research. Thus, other researchers doing similar research can take these definitions into account when creating a sample. For this reason, the individuals interviewed in this study are described in detail (seniority, place of duty, duty period). The data is stored so that it can be examined by others. 2. Findings
2.1. Perception of creativity
Table 1 shows the perception of ''creativity'' varies from one person to another. In this study, it was aimed to determine the creativity perceptions that teachers had. For this reason, the first question of the interview form directed to the teachers was, "What comes to your mind when it comes to creativity?" All of the teachers answered this question. The following table shows the answers given by the teachers and the number of teachers who answered this question.
Table 1. Teachers' Perceptions of Creativity
Teachers’ Perceptions Number of Teachers
Different thoughts, different perspectives 10
Unique products, putting out ideas 5
Producing alternative solutions 4
Dreaming of something that does not exist 3
Uncovering a new meaning 3
Imagination 2
Making inventions that make people happy 1
When we look at the teachers' creativity perceptions, we often see that their interpretations are on the word “difference”. Teachers see creativity as a different way of thinking and as different perspectives. Apart from that, producing alternative solutions that are known and unexpected for a problematic situation, revealing new meanings by using their ability to analyse and synthesize their own unique products and ideas in whichever way they are, is also what teachers put in the concept of creativity. It is also in creativity to imagine something new that is not outside them and to translate these dreams into discoveries that will make people happy. The number of teachers on the concept of imagination that is based on creativity is also seen as 5 people. Some teacher opinions about this are as follows:

Journal for Educators, Teachers and Trainers JETT, Vol. 9 (2); ISSN: 1989-9572
64
'' New, original, different, worth seeing, acceptable productivity.'' '' To imagine something that is not creativity, to think differently than others.'' '' To present original ideas or works from existing materials or from the information they have learned. Creativity is dreaming.''
2.2. Creative student perception Creative student perception needs to be discussed secondly after creativity. In the second and third questions, it was aimed to learn how teachers see creative students and how they can identify them among other students. The answers of the question "What kind of students are creative students?" are given in Table 2. Table 2. Teachers’ views on creative students
Teachers’ views Number of Teachers
Being able to look from different angles 7
Asking questions, inquiring, curious 5
Innovative 3
Producing original ideas 3
Able to adapt learned information to new conditions
3
Wider boundaries 2
More flexible 2
Developed imagination 1
Can see details and the whole 1
Can give examples from daily life 1
When we look at teacher views in Table 2 we see 28 different comments. There are 7 teachers who consider creative students as students who can look at staff from different angles. In addition, 5 teachers said that creative students are asking, questioning, curious and evaluating them as curious, while 3 of the teachers perceive creative students who are open to newness, not afraid of innovation, producing unique ideas and adapting to new conditions. It is also said that creative students are students who have developed imaginative worlds, who can see both the details and the whole, the boundaries are wide and flexible, the lessons can be reconciled with everyday life and the daily life is abundant. Teachers have also said that creative students are self-confident, well communicative, and outgoing. However, teachers also noted that they did not encounter so many types of pupils in their class. Some opinions are as follows:
“These students can think in many ways and demonstrate their creativity difference. Creative children are children whose imagination worlds are developed, who have a high level of interest, who like to try different and new things, have a lot of thoughts in their minds and sometimes have difficulty classifying them. " “First of all, they are curious and interested. Creative student wonders, researches and inquires. They try to do new things. They are innovative. Sometimes they are out of the ordinary. They are contrarian.'' “I think that they will change according to their experiences. They are outgoing, curious, active, for frant if they are not hindered by their creativity. Besides, they receive a negative feedback in their previous experiences, they may turn into students who are introverted and hesitant to say their thoughts.” “Today, unfortunately, we do not encounter many creative students. They are generally waiting for things to be presented to them. Unfortunately, we are not able to meet a student in this perspective as we continue to work more and more day by day.”
After teachers' views on creative students, their views on creative students in their classes were addressed for this, the teachers were directed with the question "What are the characteristics of

Journal for Educators, Teachers and Trainers JETT, Vol. 9 (2); ISSN: 1989-9572
65
the creative students in your class that distinguish them from the other students?" Table 3 gives information about that teachers’ views are the hallmarks of creative students in the classroom. The number of teachers who agree with this thought are given below; Table 3. Key features of creative students
Teachers’ Views Number of Teachers
Looking for alternative solutions 6
Providing different startegies and comments 5
Providing different startegies and comments 5
Asking different questions 3
Self Realiance 2
Like to share thoughts 2
Solution oriented 2
In favour of self-study 2
Careful with details 2
Think beyond the boundaries 2
Sociable and cheerful 2
Not a rote learner 2
Effort to improve oneself 1
In favour of being in the forefront 1
As it is seen in Table 3, the creative student features in the classroom are very diversified. Teachers talk about all positive student characteristics in 35 different answers. In the first place, 6 teachers had the ability to find alternative remedies. He brings different interpretations, applies different strategies, asks different questions and these features are told by 5 teachers. Apart from these characteristics, teachers can distinguish the creative students in their class from the other students through the following characteristics: Liking to share ideas, effort to improve oneself, solution oriented, in favour of self-study, careful with details, self-reliance, think beyond the boundaries, in favour of being in the forefront, being sociable, being cheerful, not being a rote learner. Some teacher opinions given to this question are as follows:
“They are more interested and curious about the course, they try to bring out different projects, they attach importance to detail, they can apply them to their daily life and assignments by blending them together, they are not satisfied with a single answer and they constantly open to learning new information and all these market hem different from other students” “Thinking about the students in secondary education, confident, aware of his ability, asking more questions and eager to learn, they are separated from other students as students putting effort to improve themselves. In addition, they are students with future plans and dreams in a professional sense” “These students know how to look at events and issues from different perspectives. At first, they use different solutions. (These roads are so precious that they find and use them without being taught). They are more sensitive. Every word that is said for them, every meaning of the behavior is deep and important. So, they cannot show arbitrary behavior”
2.3. Activities to increase creativity of students After the teachers' "perceptions of the creative student” were examined, the next question was focused on the activities that teachers carried out in order to improve the creativity of the students in their class. The activities that teachers can do to improve the creativity of the students in the classes are presented in Table 4.

Journal for Educators, Teachers and Trainers JETT, Vol. 9 (2); ISSN: 1989-9572
66
Table 4. Activities to improve creativity
Teachers’ views Number of teachers
I answer and support every question 6
I force my students to thinks and give clues 6
I provide alternative perspectives 6
I give extra homework according to the students’ interests 4
I relate the subjects to daily life 3
I let them be free with activities 3
I use different techniques in lessons 2
I use materials in lessons 2
I ask them to make additions to previous tasks 2
I can not do anything 2
I encourage creative thinking with developmental games 1
I focus on problem solutions 1
I always let the students ask questions 1
Judging from the views of teachers in the table, it can be seen that the vast majority of teachers are able to do many different exercises in their classes to improve creativity. 13 different categories have been identified for this substance. When we look at the comments and the numbers of the teachers, the situation is determined as follows: 6 teachers stated that they provide alternative perspectives, support and answer all questions, force the students to think and give clues; 4 teachers stated they provide extra homework according to their interests; 3 teachers relate topics with daily life and let them be free in activities; 2 teachers use different techniques in the lessons, use materials in lessons and ask them to make additions to previous tasks and 1 teacher; encourages creative thinking with developmental games, focus on solutions and let the students question what is being thought . 2 of the teachers stated that they will not do anything and that the curriculum of education and training will not be compatible with creativity. Some of the teachers’ opinions for some questions are given below;
“I would have encouraged people to experiment new things and rewarded the students in these directions. I would have also encouraged students to ask questions”. “I will allow alternative perspectives for a question. I will share all possible solutions and ask for alternative ones”. ''I will not do anything. In addition, education in my opinion is a process that destroys creativity". “Not to make restrictions on matters in activities, project tasks, models made in class - model work, material selection, dimension, etc. '' as far as possible, to approach with tolerance even if the answer given by each student is wrong, answer every question from students (although sometimes it seems very irrelevant), ask the students if they have something they want to add at the end of the course”
2.4. The effects of teaching materials on creativity In classes, in laboratories, the contribution to creativity of the materials used in the lessons should be questioned. The answer to the question of whether or not the course materials used in the 5th question of the scale contributed to creativity, and how and if it contributed to it, were searched. The following table also includes teacher opinions.

Journal for Educators, Teachers and Trainers JETT, Vol. 9 (2); ISSN: 1989-9572
67
Table 5. Teaching methods used by lecturers
Teachers’ views Number of teachers
The material has a contribution as it is concrete 6
If the student prepares the material it is helpful 4
Creates a new perspective 4
Does not improve creativity 3
Making internalisation easier 3
Ready materials limit the students 2
Material encourages the students to search 2
Enables analytic thinking 1
As seen in Table 5, 12 of the teachers who fill the form think that materials are developing creativity while 3 of them think that the materials do not improve creativity. 2 of the teachers thought that the ready materials would limit the student but the creation of the material by the student will help the improvement of creativity. There are 4 teachers with the same opinion. 6 of the teachers thought that having concrete materials will contribute to creativity. 4 of the teachers said that the materials will help students gain a different perspective whereas 3 of the teachers stated that it will make internalization easier. Apart from these, 2 teachers said that the material used in the class would encourage the student to research and 1 teacher stated that the material provided will enable analytical thinking. Some teacher responses to this question are as follows:
“I do not think it's enough. I think that the creativity of the students is what they do and cannot do in their daily life and improves activities. I mean, I do not think that only the school environment and the course materials are developing creativity on their own”. “It changes the students' view of the lesson. Students from different perspectives invent new invention, new discovery, new game”. “Materials develop creativity. There is no education and talent without material. I do not think that there should be a lot of material. The required materials should encourage the student to research and the child must make use of these materials to create different materials. More material than necessary does not improve the student, the creativity of the student depends on the materials he/she will make”. “I think that ready-made materials limit students and the teachers. I think that if the teacher and student make the course material together, this work will contribute to creativity”.
2.5. Classroom environment for developing creativity
In the last sub-aim of the study. It is emphasized how the classroom environment should be in order to improve creativity and creative student perceptions after the teacher views on the effect of course materials on creativity were obtained. Teachers' views on this issue are presented in Table 6.
Table 6. Classroom Environment to Develop Creativity
Teachers’ View Number of teachers
The student should have a comfortable environment 8
An environment suitable for sharing should be available 4
Classes should be separated by branches 3
The student should access the material easily 3
The material should address students visually, tactually, audibly 3
It should be a place with a lot of activities 3
It should be a place where different thoughts products are respected 2
It has to be interacting with the nature and technology 2
Teaching cannot be limited in a class 1
It should be a place to play and make experiments 1
It should be big enough for group Works 1

Journal for Educators, Teachers and Trainers JETT, Vol. 9 (2); ISSN: 1989-9572
68
As it is seen in Table 6, a large part of the teachers (8 teachers) suggested that the environment for a creative class should be a place where the student can feel comfortable. 4 teachers suggested that it should be an environment where the students can share with each other and the teachers easily. 3 teachers stated that the classes should be separated by branches so that the students can easily access materials. 2 people said that the class should visually, tactually, audibly appeal to students and another 2 stated that it should be a place with a lot of activities. 2 of the teachers said that it should be interacting with the nature and technology. 1 of the teachers stated that it should be a place where the students can play and do experiments and another person said that it should be a big enough of a place suitable for group work. A teacher with a different opinion says that the child can develop creativity everywhere since education cannot be limited by class. Some answers to this question are as follows:
“The classroom environment is abstracted from the outside world and is not seen as a place made up of four walls instead it should be a place of nature, technology where each student can freely present ideas, without being afraid of reproach when giving wrong / different answers, sharing ideas with friends and teachers and a place where a student can bring a piece of stone that they found on their way to the school to examine”. “I think that classroom environments which constantly produce and where students do their own work and the teacher acts as a guide, students are researchers and presenters, they share knowledge, can be creative”. “Even if it is not a suitable environment for every activity the classroom should at least be a big and meaningful environment for group work to be done. There should not be a group faces looking at the board. Especially in the primary school period”.
3. Conclusions and discussion One of the first variables examined in this research is teachers' perceptions of creativity. For this reason, they were asked to express their thoughts on "creativity". When we look at the teachers' answers, we see that a large part of the perception of creativity begins with ''difference''. Thinking of what is different from the others and having a different point of view is seen as the first step of creativity. Of course, this difference is a difference with positive meanings. This difference is a continuation of useful inventions, original ideas and projects. Otherwise it is not always desirable to be different from the others in the class. Teachers often have to deal with different children and it ends up with a suppression of this child. In this process creativity disappears. There is no doubt that creativity is a different way of thinking than others. As a result, it is the process of producing alternative solutions to a problem, imagining something that does not exist and creating it. It is also seen as a component of creativity, synthesizing a large number of knowledge, establishing bonds among them, and making new meanings. Discoveries and behaviours that make people happy and smile are identified with creativity and it is said that the ability to be creative will continue in the future. Of course, creativity begins with imagination before all. Imaginary people, regardless of how old they are, do not give up their imagination and engage in all kinds of creative activities. In short, teachers want to see a product in the field of science, in the field of art, or in everyday life as a result of the creative process. This product is sometimes an idea, sometimes a solution suggestion and sometimes it can be a concrete material. Fromm's curiosity is emphasized as one of the conditions for creativity by teachers. Again, the state of being original which is emphasized by the teachers overlaps with the definitions made by different scientists. In a study by Fryer and Collings (1991) of how teachers describe creativity, teachers have defined creativity as imagination, originality, and original expressions by individual. In Yildirim's research (2006), teachers described creativity as the most product discovery and as a hereditary feature and the creative individual as the most curious, innovative, and differentiated.

Journal for Educators, Teachers and Trainers JETT, Vol. 9 (2); ISSN: 1989-9572
69
As a result of the research Aslan and Esra (2001) conducted he found that, enduring creativity emerged as a new, original and skill-based product or something that has not yet turned into a product, involving a specific problem-solving process, defines a person's intelligence as a cognitive ability that is used in a unique and productive way. In the second and third items on the scale, teachers' opinions about creative students and the characteristics that distinguish creative students in their classes from other students were determined. The answers given show how the perception of creativity and creative student perception resemble each other. Teachers view creative students, whether they are in general or in their classrooms, as students who can look at different angles and produce alternative solutions. The features that teachers can initially observe and identify in the classroom environment make it possible for the teacher to have an idea about the creativity of the child. A creative student is described as a student who is asking a lot of questions, producing original ideas, being open to newness, developing imaginative worlds, giving examples of everyday life, and using the information he learns in other situations. In addition, these students are sociable in terms of personality, cheerful, like to share, like to be on the forefront, loved by their friends, are self-confident students. While students who are out of the mold in some way are the students whose ideas are interpreted as inspiration by others in group activities and they are considered as students who do not face any problems in individual studies. In the research Kerem & Kamaraj (2000) conducted, which included a survey of preschool education teachers 'opinions on the concept of creativity’, teachers listed the features of creative children as follows; unconventional, bringing solutions in the same and different directions, who can express themselves verbally and in movements, independent, collaborative, entrepreneurial, leader and successful in artistic activities. Teachers tend to determine the features of creative students as imaginative, self-reliant, students who has goals and can think in an independent and critical way, as divergent thinkers with a lot of hobbies and artistic tendencies. Not all expressions related with creativity are positive. On the other hand, we see that many individuals with negative characteristics in daily life can be very creative individuals and we can see this by looking at the past to present with especially artists, scientists and athletes. This question is quite different and we see many comments. The vast majority of teachers say that the most important way to improve the creativity of children in their class is to encourage them to think with the hints they give. This is followed by answering questions students ask, encouraging them to ask questions and giving alternative perspectives on the topics. While some of the teachers thought it was right to explore the interests of the students and give them additional assignments and to associate lessons and topics with everyday life, and to free them in classroom activities. Teachers' opinions are that the use of different lecture techniques and material, problem solving, playing creative thinking, developing games are also effective. As a different point of view, some teachers say " I allow students to question what I tell them in class”. This point of view, which we have not seen so much, will undoubtedly be a behavior that can lead to radical changes throughout the lives of students. If the child learns to approach with suspicion, he will be curious, inquisitive and more creative. Some teachers emphasize that they cannot do much to improve the creativity of their students, as the curriculum is a process that dulls creativity. In Yildirim's research (2006), the teachers directed the behaviors they thought developed creativity to activities, by presenting unstructured materials and by making the individual feel important. In this sense, the results of the two researchers show great similarities. In the research conducted by Aslan and Cansever (2009), teachers' opinions about creativity in the classroom are similar in many areas with the opinions of the teachers participating in the research. It was observed that teachers emphasized on learning by living and they needed the use different techniques in lessons. In this context, the teachers allow various role distributions and personations for the students, acrostic studies, improvisation, conduction different lessons which require hand skills together, directing the students who have musical skills to different lessons and organizing trips related with the topic. The contribution of the course materials used

Journal for Educators, Teachers and Trainers JETT, Vol. 9 (2); ISSN: 1989-9572
70
after the education activities to the creativity was questioned. Teachers have stated that it will definitely work because the material used makes the lesson and the subject more concrete. Some teachers say that the material presented will limit both the teacher and the student, and the creativity of the child if the student prepares the material. If we take the creativity of the material prepared by the teacher candidates as a result of the "Material Development" lessons of the education faculties as the base we can see that this is a correct point of view. The creative student will show their creativity by using what they already see around them, using past experiences and what they learn in class. The role of the teacher here is to guide the student. Teachers say that the material gives the student a different perspective, facilitates internalization, encourages analytical thinking, and pushes the student to explore. 2 vocational high school teachers who participated in the research emphasized the importance of using materials and stated that the diversity of the materials used in the workshops will make a significant contribution to both learning and creativity of the students but that these materials are not available in sufficient numbers in the schools. It is worth noting that all of the teachers who say that material is not necessary are teachers who enter the numerical courses. The final topic explored in the context of creativity is the creative classroom environment. To determine this, teachers were asked how the classroom environment would be in order to improve the creativity of the students. Nearly half of the teachers expressed the classroom environment as a place where the student could feel comfortable and move freely. Following these it was stated that the class should be a place where students are able to share easily, have plenty of activities, and be a place where students can play and experiment. Some of the teachers said that classes need to be separated according to branches and that these classes can be enriched by visual materials and which can be can easily accessed by the students and this will contribute to creativity. Nowadays, it is seen that this practice is made especially in middle and high school levels. There is no doubt that the logic in science laboratories will also contribute in other courses. Visual arts, music, computer and drama classes are also courses that can be easily applied to schools. One of the ideas that are thought to develop creativity in the last place is a classroom environment where different ideas are valued. The students always come to class with different ideas. If they are encouraged, noticed and appreciated by the class, they can express their ideas comfortably. This will greatly affect creativity when combined with the guidance of the teacher. In Maier's work, it was also said that in order to be able to direct students to creativity, it was necessary to save them from the fear of failure, mockery, and not being creative. (Griffith & Clark, 1981). In a study conducted by Tezci & Gürol (2003) they have come to the conclusion that moving from the traditional learning environment which is repressive, unreliable and keeping the student passive to a more reliable education which allows as the student to be active and free it will lead to the development of the creativity of students. One of the teachers said that learning cannot be restricted with a classroom environment and that learning develops in every aspect of life as we continue to live. The answers given by 7 verbal and 10 numerical course teachers to the survey were compared among themselves but there was no significant difference in thought or type of thought that concentrated in one group. There were no significant differences in the answers given by the 8 teachers from the TRNC and 9 teachers from Turkey to the interview form, or the type of thinking that concentrated in one group. Only each teacher interprets the activities and classroom environment that he / she will perform according to his / her class level and course. As a result of the research, it is suggested that teacher candidates and teachers be trained in creativity. In this sense, teachers who need to be more intellectual in this sense need to read, produce and travel. The Ministry of National Education should lead the art activities and cultural trips that pupils and teachers can participate both nationally and internationally. Students and teachers, who are more cumulative and more experienced, will undoubtedly be creative and will produce more.
Journal for Educators, Teachers and Trainers JETT, Vol. 9 (2); ISSN: 1989-9572
71
4. References Aslan, A. & Esra (2001). Kavram Boyutunda Yaratıcılık. Türk Psikolojik Danışma ve Rehberlik
Dergisi, Sayı 16. Aslan, N. & Cansever, B (2009). Eğitimde Yaratıcılığın Kullanımına İlişkin Öğretmen Tutumları.
TÜBAV Bilim, 2(3) 2009 333-340. Bentley, T. (1999). Takımınızın Yeteneklerini Geliştirmede Yaratıcılık, (Çeviren: Onur Yıldırım).
İstanbul: Hayat Yayıncılık. Costa, C. & Loureiro, L. (2016). Learning by experimentation: children’s laboratory experiences
at the polytechnic institute of Tomar. International Journal of Learning and Teaching. 8(2), 119–128.
Fryer, M. & Collings, J. (1991). Teachers’ View About Cerativity. British Journal of Educational Psychology, 61, 1991: 207-219.
Emir, S., & Bahar, M. (2003). Yaratıcılıkla İlgili Öğretmen ve Öğrenci Görüşleri. Abant İzzet Baysal Üniversitesi Sosyal Bilimler Enstitüsü Dergisi, 1(1), 91-110.
Fromm, E. (1959). The creative attitude. New York: Harper & Row Garcia Laborda, J., (2009). Using Webquests for Oral Communication in English as a Foreign
Language for Tourism Studies, Educational Technology & Society,12(1), 258-270 García Esteban, S. & García Laborda, J. (2016). Human communicative dialogic practices in
content and language-based educational interactions with technology. The Anthropologist, 25(3), 220-228.
García Esteban, S & García Laborda, J. (2018). Technology Based Reflective Practice in Primary ELT Teacher Education. Onomázein, 79-94.
Kerem Aktan, E., Kamaraj, I. & Yelland, N. ‘An Analysis of Turkish Preschool Teachers’ About the Consept of Creativity And The Activities That Can Foster creativity Young Children.’ , Contemporary Issues in Earlychildhod, 2 (2,) 2001.
Rhodes, M. (1961). An analysis of creativity. Phi Delta Kappan, 42, 305–310. Sak, U. (2014). Yaratıcılık Gelişimi ve Geliştirilmesi. Ankara: Vize Yayıncılık. Tardif, T. Z., & Sternberg, R. J. (1988). What do we know about creativity? In Sternberg, R. J.
(Eds.). The nature of creativity: contemporary psychological perspectives (pp. 429-440). New York: Cambridge University Press.
Tezci, E. & Gürol, A. (2003), Oluşturmacı Öğretim Tasarımı ve Yaratıcılık.The Turkish Online Journal of Educational Technology – TOJET January 2003 ISSN: 1303-6521 volume 2 Issue 1 Article 8. Available at http://www.tojet.net/articles/v2i1/218.pdf
Torrance, E. P. (1965). Rewarding creative behavior: Experiments in classroom creativity. NJ: Prentice-Hall.
Torrance, E. P. (1977). Creativity in the classroom. Washington, DC: National Education Association.
Vance, M. and Deacon, D., Think Out of the Box, Career Press, New Jersey, 1995. Yıldırım, B. (2006). Öğretmenliğin Yaratıcılığa Bakış Açısı ve Anasınıfı Çocuklarının Yaratıcılık
Düzeylerinin, Öğretmenin Yaratıcılık Düzeyine Göre İncelenmesi. Yüksek Lisans Tezi, Hacettepe Üniversitesi, Ankara.
Yıldırım, A. & Şimşek, H. (2006). Sosyal bilimlerde nitel araştırma yöntemleri. Ankara: Seçkin Yayınevi.
Zongur, N., (1996). Family Structure and Education System. In The Role of Television Unpublished Master's Thesis in Context Creative Thinking in Children in Turkey. Mimar Sinan University Social Sciences Institute, Istanbul.

Journal for Educators, Teachers and Trainers JETT, Vol. 9 (2); ISSN: 1989-9572
72
ISSN 1989 - 9572
Giftedness: Educators views and perceptions Superdotación: visiones y percepciones de los educadores
Mukaddes Sakalli Demirok,
Near East University, North Cyprus
Journal for Educators, Teachers and Trainers, Vol. 9 (2)
http://www.ugr.es/~jett/index.php
Date of reception: 19 November 2018
Date of revision: 24 December 2018
Date of acceptance: 28 December 2018
Demirok, M.S. (2018). Giftedness: Educators views and perceptions. Journal for Educators, Teachers and Trainers, Vol. 9(2), pp. 72 – 84.

Journal for Educators, Teachers and Trainers JETT, Vol. 9 (2); ISSN: 1989-9572
73
Journal for Educators, Teachers and Trainers, Vol. 9 (2) ISSN 1989 – 9572
http://www.ugr.es/~jett/index.php
Giftedness: educators views and perceptions Superdotación: visiones y percepciones de los educadores Mukaddes Sakalli Demirok, Near East University, North Cyprus [email protected] Abstract Teachers have the highest responsibility in education. Each student has different learning styles. Teachers need to have sufficient knowledge for student characteristics and organize education environments of students. There are students with different cognitive styles in every class. Gifted students have specific characteristics different from their peers. Teachers are expected to prepare appopriate learning environments and materials for gifted students. This study was aimed at determining the perceptions and opinions of teachers towards gifted students. Stratified sampling method was determined and 490 teachers constituted the sample of the study. Data of the research were collected with “Perceptions scale towards gifted students” and “Point of view scale towards the gifted”. The results showed that teachers have positive perceptions and positive opinions regarding gifted students. The findings revealed that there was a positive and significant relationship among teachers’ perceptions and opinions about gifted students. Resumen Los profesores tienen la mayor responsabilidad en la educación. Cada alumno tiene diferentes estilos de aprendizaje. Los maestros deben tener conocimientos suficientes sobre las características de los estudiantes y organizar los entornos educativos de los estudiantes. Hay estudiantes con diferentes estilos cognitivos en cada clase. Los estudiantes dotados tienen características específicas diferentes de sus compañeros. Se espera que los maestros preparen ambientes de aprendizaje apropiados y materiales para estudiantes dotados. Este estudio tuvo como objetivo determinar las percepciones y opiniones de los maestros hacia los estudiantes dotados. Se determinó el método de muestreo estratificado y 490 docentes constituyeron la muestra del estudio. Los datos de la investigación se recopilaron con “Escala de percepciones hacia estudiantes superdotados” y “Escala de punto de vista hacia los dotados”. Los resultados mostraron que los maestros tienen percepciones positivas y opiniones positivas con respecto a los estudiantes dotados. Los hallazgos revelaron que había una relación positiva y significativa entre las percepciones y opiniones de los maestros sobre los estudiantes dotados. Keywords Giftedness; Teacher; perception; Views; Special education; Gifted students. Palabras clave Superdotación profesor; Percepción; Puntos de vista; Educación especial; Estudiantes superdotados

Journal for Educators, Teachers and Trainers JETT, Vol. 9 (2); ISSN: 1989-9572
74
1. Introduction
The development of a country to a level of civilisation is directly related with the community using its human resources, in other words, building blocks effectively. One of the most important responsibilities of the contemporary education system is to discover the gifted children who can play an important role in the development of society and educate them in a way that will contribute to the development of the society. ‘Gifted’ can be explained as perceiving the world in a different way in different fields. In the world that they are in with the many challenges to be faced in their future lives. Therefore, the concept of gifted and different abilities may be open to cultural diversity. The needs of gifted individuals in different cultures, diagnostic programmes and training practices should be implemented to upgrade the potential of the gifted individuals that will play an important role in the development of society and educate them in a way that will contribute to the development of the society. There are many different characteristics distinguishing gifted individuals from normal developing individuals. These characteristics include an advanced level of language development when compared to their peers, differences in concentration and focusing, a higher level of memory and activity performance, interest levels, goals and high levels of perfectionism (Berger, 2006; Sak, 2010). These differences among gifted students also affect their learning processes. These students require comprehensive educational opportunities and services which may not always be provided through standard education programmes because of these different characteristics (Renzulli & Reis, 1985). Early identification of gifted individuals and the development of their talents play an important role for their development and improvement. Therefore, there is a big burden on teachers concerning their responsibilities due to this early identification and developing their special talents. Awareness of the families is an important issue which affects children’s reactions compared to their peers and also teachers have roles in discovering different competencies of these children (Capan, 2010). Identification of gifted individuals allows provision for appropriate education and for their learning speed. In this context, class teachers’ evaluations of their students behavioural characteristics in terms of giftedness enable them to be directed to related centres for identification (Hunsaker et al., 1997). The efficiency and efficacy of this process are parallel with teachers’ professional development (Rohrer, 1995). The situation of gifted students with different learning characteristics compared to their peers needs to be considered in the planning process of education programmes (Davis & Rimm 2004; Tomlinson, 1999). Gifted children have special educational needs (Van-Tassel-Baska, 2005; Delisle, 2003; Clark, 2002; Chan, 2001; Maker & Nielson, 1996; Tomlinson, 1999). In order to meet learning needs of these children, motivating, flexible and creative activities that can develop their interests and competencies should be provided (Koshy, 2002). According to Renzulli and Reis (1985), these students require comprehensive education which may not be provided through standard programmes. Otherwise, these students might become bored with school or loose interest in school (Clark, 2002; Colangelo, 1991). Researchers who are accepted as authorities in the area of the education of gifted individuals claim that teachers need to know the characteristics of these students in order to meet their special needs and receive sufficient training about the differentiation of instruction (Toll 2000; Gallagher 2000; Griffin 1999; Copenhaver & McIntyre 1992; Feldhusen 1991; Cross & Dobbs 1987; Davalos & Feldhusen 1997; Feldhusen & Huffman 1988; Hanninen 1988; Hansen & Feldhusen 1990; Lyon, Vaassen, & Toomey, 1989; Parke 1989; Pigge & Marso 1987). Lack of appropriate training related to gifted students’ education remains insufficient support in meeting the needs of these students (Archambault et al., 1993; Westberg & Daoust, 2003). Unfortunately, adequate training about giftedness is not provided to teachers during their undergraduate education (Copenhaver & McIntyre, 1992). Teachers without enough special education knowledge and awareness face the probabilty of experiencing difficulties in understanding and eliminating problem behaviours of the gifted in the classroom. Literature (Sari, 2014; Sak, 2010) reveals that more studies should be conducted in different countries compared to the past with various projects and models being developed for the education of gifted

Journal for Educators, Teachers and Trainers JETT, Vol. 9 (2); ISSN: 1989-9572
75
students. In Cyprus, topics such as the educational needs of gifted children, rules and regulations and insufficiency requirements of educational environments for gifted students seemed to be ignored and studies related to these issues are limited, although there are new developing challenges on their effective education. Technology develops rapidly and the concepts of democracy and governance have varied recently. Accordingly, concepts of “knowledge” and “science” also vary. In order to adapt to these changes, the expected individual skills of the gifted within society should also need to reflect these changes on the worldwide basis (The Ministry of National Education Report, 2005). Therefore, Turkish Cypriot society is in need of new planning and development of the human resources and infrastructure to keep up with the latest developments of the world. Providing required education to upgrade intelligence and emphasising research for creativeness with an approach based on “life-long learning”. Formal and informal educational might pave the way to Turkish Cypriot society competitiveness in the international education fields. All students during their school lives in Cyprus are exposed to common learning experiences regardless of their interest, competency and status. Today, students share the common learning experiences in the first stage of all elementary schools and first and second stages of elementary education in some countries. In some countries, students follow educational programmes which are not differentiated in other words, not enriched and not individualised during their regular education. Even if this leads to equality of opportunity in education for all this allows inequality for all individuals with special needs (Davasligil, 2004). Nowadays, the studies related to gifted students in Northern Cyprus are given importance. However, few studies on perceptions and opinions of teachers towards gifted students show the need for practices in education of gifted students. Therefore, it is important to explore the perceptions and opinions of teachers. This study aims to determine the perceptions and opinions of teachers working at different education fields in terms of gifted students. The study tries to explore the following research questions:
1. What are the teachers' perceptions about gifted students’? 2. What are the teachers' opinions about gifted students’? 3. What is the relationship between the teachers' perceptions and their opinions in terms of
gifted students? 4. How do perceptions of teachers differ in terms of gender about the gifted students? 5. How do perceptions of teachers differ in terms of age about the gifted students? 6. How do perceptions of teachers differ in terms of work experience about the gifted students? 7. How do opinions of teachers differ in terms of gender about the gifted students? 8. Is there a significant difference in the teachers' perceptions of gifted students in relation to
previously received training about the gifted? 9. Is there a significant difference of the teachers' opinions of gifted students in relation to
whether a special programme is required or not?
2. Method 2.1. Research method Survey method, as one of the quantitative research methods, was used in this research to be able to investigate perceptions and opinions of teachers working at different education fields in terms of gifted students. 2.2. Participants Participants in the study are teachers selected from Cyprus. 1330 teachers teaching at primary schools were the target population due to being unable to reach the whole population. The stratified sampling and simple random sampling methods were used to choose 30 percent of the target population. Thirty percent was equal to 520 teachers. Thus, the research was administered with 490 teachers, since 30 scales were eliminated from the research due to various reasons. Information

Journal for Educators, Teachers and Trainers JETT, Vol. 9 (2); ISSN: 1989-9572
76
related with the demographic characteristics of the participants was also gathered. In the study, 66.5% of the teachers were female and 33.5% were male. Age distribution among the participants revealed that 33.6% of the participants’ age ranged from 21 to 30, 36.3% ranged from 31 to 40, 22.0% ranged from 41 to 50 and 5.3% of them were 51 years old and above. Besides, 26.9% of the participants’ work experience ranged from 1 to 5 years, 19.6% of them ranged from 6 to 10 years, 21.0% of them ranged from 11 to 15 years, 19.4% of them ranged from 16 year to 20 years, 13.1% of them were 21 years and above. 2.3. Instruments In the present study, ‘Perceptions scale towards gifted students’ and ‘Opinion scale towards the Gifted’ developed by Uzunboylu and Demirok (2012) were administered to the participants. The development process of the ‘Perceptions scale towards gifted students’ and ‘Opinion scale towards the Gifted’ is explained in details in the next section. 2.4. The perceptions scale towards gifted students ‘The Perceptions Scale Towards Gifted Students’ was developed to explore the teachers’ perceptions about gifted students. The determination of the perceptions of teachers towards gifted students, 20 teachers working at elementary schools with 10 and more years of teaching experience were asked to write a composition including their perceptions and behaviors towards gifted students. Then, a draft form was constituted through an item pool for the instrument. 15 expert opinions were received for this form. The scale developed was based on an extensive review of the literature and experts’ opinions which were administered to 175 teachers as a pre-test. This was a pilot study and the validity and reliability of the scale were tested. The structure validity, factor analysis of the scale and internal consistency reliability test were examined with Cronbach Alpha Coefficient. Based on the statistical analysis, ten items with which load factor was estimated below 0.40 were excluded from the scale and therefore, the final draft version of the scale included 33 items. The scale consisted of two sections. The first section consisted of information about the teachers' gender, age, work experience and previously received training about gifted students. The second section consisted of 33 items which focused on five themes including "willing to learn (9 items)", "expression factors (8 items)", "personality factors (6 items)", "learning factors (6 items)" and "mental factors (4 items)". The scale used a 5-point Likert scale in which 1 represented strongly disagree and 5 represented strongly agree. The scale consisted of positive statements which were scored as 5,4,3,2 and 1. The Cronbach's alpha score was calculated as 0.956. Cronbach’s alpha values of the scale’s sub-dimensions were calculated as “willing to learn” (0.929), “expression factors” (0.896), "personality factors" (0.907), "learning factors" (0.861) and “mental factors” (0.680). 2.5. The opinion scale towards the gifted “The Opinion Scale Towards the Gifted” was developed to explore the teachers’ opinions about gifted students. In order to determine the opinions of teachers about gifted students, 20 teachers working at elementary schools were asked to write a composition related to gifted students. Then, a draft form was constituted through an item pool for the instrument. 15 expert opinions were received for this form. The scale was developed based on an extensive review of the literature and experts’ opinions were administered to 175 teachers as a pre-test. This was a pilot study and the validity and reliability of the scale were tested. The structure validity, factor analysis of the scale and internal consistency reliability test were examined with Cronbach Alpha Coefficient. Based on the statistical analysis, the ten items with which load factor was estimated below 0.40 were excluded from the scale and therefore the final draft version of the scale included 31 items. The scale consisted of two sections. The first section yielded information about the participant teachers' gender, age, work experience and previously received training about the gifted. The second section consisted of 31 items which focused on five themes: "educational features" (11 items), "educational policies" 6 (items), "education programmes” (7 items), "requirements in education " (4 items) and "the duty of the ministry" (3 items). The five-point Likert-type scale was applied, 1 representing strongly disagree and 5 representing strongly agree. The scale consisted of positive statements which were scored as 5,4,3,2 and 1. Cronbach Alpha internal consistency was calculated as 0.89 based on item analysis for the reliability
Journal for Educators, Teachers and Trainers JETT, Vol. 9 (2); ISSN: 1989-9572
77
of the scale and split-half reliability was calculated as 0.93. According to these results, the scale has reliability characteristics. Cronbach’s alpha values of the scale’s sub-dimensions were calculated as ‘educational features’ (0.94), ‘educational policies’ (0.88), ‘education programmes’ (0.86), and ‘requirements in education’ (0.73, ‘the duty of the ministry’ (0.72). 2.6. Data collection The data were collected after getting permission from the Ministry of National Education school administrators. The instruments were administered to the teachers while the researcher visited each school. 2.7. Data analysis After the data were gathered, the data were analyzed with using SPSS 18 version. In addition, Pearson Correlation, percentages, means and Standard Deviations were used to analyse the data taken from the teachers. In the situations, where the obtained data, towards the sub-aims of the study show normal distribution, t-test and single-factor variance technics (One-Way ANOVA) were used. If the ANOVA results are significant, Dunnet C test is used to specify the significant difference among the means of the groups if the group variances are not equal and Scheffe test is applied when group variances are equal. Mann-Whitney U test was applied because of the nonparametric distribution. The findings were interpreted at the 0.05 significance level. 3. Results 3.1. The teachers’ perceptions of gifted students
Teachers’ general perceptions mean scores of gifted students were M=3.74, SD=.584. The item “willing to learn” is M=3.66, SD=.589 for “expression factors” is M=3.71, SD=.660, as for "personality factors" is M=3.65, SD=.672, for “learning factors" is M=3.83, SD=.628 and "mental factors" is M=3.83, SD=.643. Perception mean scores of teachers related with factors in the scale were within “agree” option borders. The results showed that teachers have positive perceptions regarding gifted students. 3.2. The teachers’ opinions about gifted students
Teachers’ general opinions about gifted students were calculated as M=3.72, SD=.535. The item “educational features” is M=4.00, SD=.705, for “educational policies” is M=3.88, SD=.730, for "education programs" is M=3.85, SD=.723, as for “things to be considered in education" is M=3.47, SD=.672, and "responsibilities of the ministry" is M=3.24, SD=.812. Mean scores of teachers towards opinions of gifted students related with factors in the scale were within “agree” option borders. The results revealed that teachers have positive opinions about gifted students. 3.3. The relationship between teachers’ perceptions and opinions about gifted students According to the results, there was a positive and significant relationship between teachers’ perceptions and opinions about gifted students (r2=.311, p<0.01). When the determination coefficient is considered, it is seen that explained variance between these two variables is 31.1%. Therefore, it can be said that the two variables affect each other at a moderate level. 3.4. Teachers’ perceptions of gifted students in relation to gender
Gender variable was specified by t-test aiming to determine in the teachers’ perceptions Table 1 shows the results related with the teachers’ (n=490) perceptions regarding gifted students according to gender.

Journal for Educators, Teachers and Trainers JETT, Vol. 9 (2); ISSN: 1989-9572
78
Table 1. The teachers' perceptions of gifted students in relation to the gender of the teachers
Gender N M SD df t p
Willing to learn Female 326 3.68 .59
488 .975 .330 Male 164 3.63 .56
Expression Factors Female 326 3.73 .67 488
1.042 .298 Male 164 3.67 .62
Personality Factors Female 326 3.66 .66 488
.820 .412 Male 164 3.61 .68
Learning Factors Female 326 3.86 .62 488
1.568 .118 Male 164 3.77 .65
Mental Factors Female 326 3.86 .63 488 1.547 .122
Male 164 3.77 .65
As it can be seen in Table 1, the scores of the female teachers' perceptions of "willing to learn" (M=3.68, SD=.59) were higher than the male teachers' perceptions (M=3.63, SD=.56). The mean scores of male teachers’ perceptions related to expression factors of gifted students were (M=3.67,SD=.62) and female teachers’ perceptions were (M=3.73,SD=.67). Besides, the mean scores of male teachers’ perceptions related to personality factors were (M=3.61, SD=.68) and female teachers’ perceptions were (M=3.66, SD=.66). The mean scores of male teachers’ perceptions related to learning factors were (M=3.77, SD=.65) and female teachers’ perceptions were (M=3.86, SD=.62).The mean scores of male teachers’ perceptions related to mental factors regarding the students were (M=3.77, SD=.65) and female teachers’ perceptions were found to be (M=3.86, SD=.63). These results indicated that the gender of the teachers do not affect their perceptions towards gifted students. 3.5. The teachers’ perceptions of gifted students in relation to the age of the teachers
Table 2 demonstrates the teachers’ perceptions of gifted students regarding to age (Please see Table 2 for detailed information). Table 2. The teachers’ perceptions of gifted students in relation to age
Dimension Age N M SD df F p
Willing to learn
21-30 178 3,62 ,61 3 1,113
,343
31-40 178 3,69 ,57 41-50 108 3,65 ,56 51 and above 26 3,82 ,60
Expression factors
21-30 178 3,65 ,70 3 1,162
,324
31-40 178 3,75 ,65 41-50 108 3,71 ,58 51 and above 26 3,85 ,68
Personality Factors
21-30 178 3,56 ,69 3
1,651
,177
31-40 178 3,72 ,63 41-50 108 3,65 ,67 51 and above 26 3,72 ,75
Learning Factors
21-30 178 3,77 ,67 3
1,562
,198 31-40 178 3,87 ,60 41-50 108 3,80 ,59 51 and above 26 4,02 ,55
Mental factors
21-30 178 3,79 ,67 3 ,740
,528
31-40 178 3,86 ,63 41-50 108 3,83 ,61 51 and above 26 3,97 ,60
As Table 2 shows, the teachers’ age range is between 21- 51 and above. As can be seen from Table 2, no significant difference was observed between the teachers’ ages and their perceptions regarding the gifted students’ willingness to learn (F(3;486)=1.113, p>0.05), their perceptions regarding the gifted students’ expression factors (F(3;486)=1.162, p>0.05), their perceptions regarding the gifted students’ personality factors (F(3;486)=1.651, p>0.05), their perceptions regarding the gifted students’ learning factors, their perceptions regarding the gifted students’ mental factors (F(3;486)=.740, p>0.05) and their

Journal for Educators, Teachers and Trainers JETT, Vol. 9 (2); ISSN: 1989-9572
79
general perceptions regarding the gifted students (F(3;486)=1.366, p>0.05). These obtained results revealed that teachers’ perceptions towards gifted students are positive and ages of teachers do not significantly affect their perceptions towards gifted students. 3.6. Teachers' perceptions of gifted students in relation to work experience
Table 3 shows the statistical findings of the teachers’ perceptions of gifted students regarding work experience (Please see Table 2 for detailed information). Table 3. The teachers’ perceptions of gifted students in relation to work experience
Dimension Experince N M SD df F p Explanation
Willing to learn
1-5 years 132 3,58 ,57 4
1,905
.105
p>0.05 Insignificant 6-10 years 96 3,60 ,63
11-15 years 103 3,73 ,55 16-20 years 95 3,70 ,57 21 years and above 64 3,77 ,58
Expression factors
1-5 years 132 3,60 ,66 4
1,928
.105
p>0.05 Insignificant 6-10 years 96 3,65 ,69
11-15 years 103 3,77 ,68 16-20 years 95 3,78 ,60 21 years and above 64 3,81 ,60
Personality Factors
1-5 years 132 3,53 ,63
1,855
.117
p>0.05 Insignificant 6-10 years 96 3,62 ,67
11-15 years 103 3,69 ,66 16-20 years 95 3,71 ,70 21 years and above 64 3,76 ,68
Learning Factors
1-5 years 132 3,74 ,65 4
1,851
.118
p>0.05 Insignificant 6-10 years 96 3,75 ,67
11-15 years 103 3,91 ,60 16-20 years 95 3,87 ,61 21 years and above 64 3,92 ,53
Mental factors
1-5 years 132 3,73 ,63 4
2,973 .019
p<0.05 Significant 1-3,1-4, 1-5,2-3,2-4, 2-5
6-10 years 96 3,72 ,67 11-15 years 103 3,94 ,59 16-20 years 95 3,91 ,65 21 years and above
64 3,92 ,61
As can be seen in Table 3, the teachers’ work experience range is between 1- 21 and above. Also, One- Way ANOVA was applied to find out whether there was a significant relationship between the teachers’ perceptions of gifted students and their work experience. As can be seen from Table 3, there is a significant difference between work experience of teachers and their perceptions regarding the gifted students’ mental factors (F(4;485)=2.973, p<0.05). These results indicated that teachers’ work experience affects their perceptions regarding gifted students. A Scheffe test was applied in order to figure out in which groups these differences exist and it was revealed that there is a significant difference regarding teachers’ perceptions of gifted students’ mental factors among teachers with 1-5 years of work experience and 21 years and above; teachers with 1-5 years of work experience and 16-20 years; teachers with 1-5 years of work experience and 11-15 years of work experience. In addition, there is a significant relationship between teachers’ perceptions of gifted students’ mental factors among teachers with 6-10 years and 11-15 years of work experience, teachers with 6-10 years and 16-20 years of work experience, 6-10 years and 21 and above years of work experience. In the light of these obtained results, it can be said that teachers’ work experience significantly affects their perceptions of gifted students. 3.7. Comparison of teachers’ perceptions with their participation in training about gifted
students
A t-test was applied in order to determine whether teachers’ perceptions regarding gifted students significantly differ based on their previous participation on a training course on gifted students. In

Journal for Educators, Teachers and Trainers JETT, Vol. 9 (2); ISSN: 1989-9572
80
Table 4, results on teachers’ perceptions and their participation in a training course on gifted students are provided. Table 4. Comparison of mean scores of teachers’ perceptions with their participation in a training course on gifted students
No significant difference was observed (t=.367, p>0.05) between the scores on perceptions of teachers who did not participate in training related to gifted students towards gifted students’ willingness to learn (M=3.68, SD=.51) and the scores on perceptions of teachers who participated in training related to gifted students towards gifted students’ willingness to learn (M=3.66, SD=.61). Therefore, it can be interpreted that teachers’ previous participation in a training course on gifted students does not affect their perceptions towards gifted students.. 3.8. Comparison of teachers’ opinions towards gifted students with regard to the gender of the
teachers An independent t-test was used to determine whether teachers’ perceptions regarding gifted students significantly differ based on their gender. Table 5 demonstrates descriptive data related to teachers’ perceptions towards gifted students and their gender. Table 5. Comparison of general mean scores of teachers’ opinions towards gifted students with regard to the gender of the teachers
Gender N M SD df T p Explanation
Instructional Properties
Female 326 4.03 .65 488 1.499 .135
p>0.05 Insignificant Male 164 3.93 .79
Education Policy Female 326 3.89 .68
488 .419 .675 p>0.05 Insignificant Male 164 3.86 .80
Curriculum Female 326 3.90 .69
488 2.015 .044 p<0.05 Significant Male 164 3.76 .77
Requirements in Education
Female 326 3.48 .66
488 .420 .674 p>0.05 Insignificant Male 164 3.45 .70
The duties of the Ministry
Female 326 3.24 .83 488 .071 .943
p>0.05 Insignificant Male 164 3.23 .77
As can be seen from the Table 5, female teachers’ scores on Instructional Properties factors were (M=4.03, SD=.65) higher than male teachers’ scores on their opinions related to Instructional Properties factors (M=3.93, SD=.79). However, this score does not reveal a significant difference (t=-1.499, p>0.05). View scores of female teachers related to policy factors were calculated as M=3.89 SD=.68 and View scores of male teachers were calculated as M=3.86, SD=.80. This result showed that the opinions of both male and female teachers on the statements in this factor are in the “agree” option borders and gender differences do not result in a significant difference on education policy. It was seen that view scores of female teachers related to curriculum factors (M=3.90, SD=.69) were higher than view scores of male teachers (M=3.76, SS=.77). This result reveals a significant difference between the opinions of female and male teachers towards this factor (t=-2.015, p<0.05). No significant difference was observed between the view scores of female and male teachers regarding
N M SD df t p Explanation
Willing to learn Attend 137 3,68 ,51
488 .367 .714 p>0.05 Insignificant Not Attend 353 3,66 ,61
Expression factors
Attend 137 3,70 ,61 488 .152 .879
p>0.05 Insignificant Not Attend 353 3,71 ,67
Personality Factors
Attend 137 3,60 ,64 488 .897 .370
p>0.05 Insignificant Not Attend 353 3,66 ,68
Learning Factors
Attend 137 3,84 ,55 488 .407 .707
p>0.05 Insignificant Not Attend 353 3,82 ,65
Mental factors Attend 137 3,82 ,58 488 .300 .777
p>0.05 Insignificant Not Attend 353 3,84 ,66

Journal for Educators, Teachers and Trainers JETT, Vol. 9 (2); ISSN: 1989-9572
81
Requirements in Education and the duties of the Ministry factors (p>0.05). According to this result, it can be interpreted that gender variables do not affect teachers’ opinions. 3.9. Comparison of teachers’ opinions towards gifted students with their participation in
training on gifted students An independent t-test was used to determine whether teachers’ opinions regarding gifted students significantly differ based on their participation in training on gifted students. Table 6 shows the results related to teachers’ perceptions towards gifted students and their participation in training on gifted students. Table 6. Comparison of general mean scores of teachers’ opinions towards gifted students with their participation in training on gifted students
As can be seen from Table above, no significant difference was observed between the scores on opinions of teachers who participated in training related to gifted students towards first factor (M=4.07, SD=.67) and the scores on opinions of teachers who did not participate in training related to gifted students towards first factor (M=3.97, SD=.71), (t=1.416, p>0.05). Nevertheless, no statistically significant difference was observed between the scores on opinions of teachers who participated in training related to gifted students towards Education Policy factor (M=3.96, SD=.71) and the scores on opinions of teachers who did not participate in training related to gifted students towards Education Policy factor (M=3.84, SD=.73), (t=1.651, p>0.05). A statistically significant difference was observed between the scores on opinions of teachers who participated in training related to gifted students towards the third factor (M=3.99, SD=.67) and the scores on opinions of teachers who did not participate in training related to gifted students towards the third factor (M=3.80, SD=.73), (t=2.572, p<0.05). It can be interpreted that teachers who participated in training related to gifted students have positive opinions when compared to teachers who did not participate in training related to gifted students. No statistically significant difference was observed between the scores on opinions of teachers who participated in training related to gifted students towards requirements in the education factor (M=3.47, SD=.68) and the scores on opinions of teachers who did not participate in training related to gifted students towards requirements in the education factor (M=3.47, SD=.67), (t=-.064, p>0.05). In addition, no statistically significant difference was observed between the scores on opinions of teachers who participated in training related to gifted students towards the duties of the ministry factor (M=3.22, SD=.79) and the scores on opinions of teachers who did not participate in training related to gifted students towards the duties of the ministry factor (M=3.25, SD=.81), (t=-.375, p>0.05). Futhermore, there was a significant difference between the scores on opinions of teachers who participated in training related to gifted students towards the sixth factor (M=2.83, SD=.93) and the scores on opinions of teachers who did not participate in training related to gifted students towards the sixth factor (M=2.59, SD=.91), (t=2.597, p<0.05). It can be interpreted that teachers who participated in training related to gifted students have positive opinions when compared to teachers who did not participate in training related to gifted students before. Therefore, it can be interpreted that teachers’ previous participation in training on gifted students does not affect their opinions towards gifted students.
Gender N M SD df T p Explanation
Instructional Properties
Attended 137 4,07 ,67 488 1.416 .188
p>0.05 Insignificant Not Attended 353 3,97 ,71
Education Policy Attended 137 3,96 ,71
488 1.651 .099 p>0.05 Insignificant Not Attended 353 3,84 ,73
Curriculum Attended 137 3,99 ,67
488 2.572 .010 p<0.05 Significant Not Attended 353 3,80 ,73
Requirements in Education
Attended 137 3,47 ,68 488 -064. .949
p>0.05 Insignificant Not Attended 353 3,47 ,67
The duties of the Ministry
Attended 137 3,22 ,79 488 -.375 .708
p>0.05 Insignificant Not Attended 353 3,25 ,81

Journal for Educators, Teachers and Trainers JETT, Vol. 9 (2); ISSN: 1989-9572
82
3.10. Comparison of teachers’ opinions towards gifted students with their willingness to prepare separate programmes for gifted students A Mann-Whitney U test was applied in order to determine whether teachers’ opinions regarding gifted students significantly differ based on their willingness to prepare separate programmes for gifted students. Since teachers’ willingness status did not show normal distribution, a non-parametric test was used. In Table 7, results related to teachers’ opinions towards gifted students and their willingness to prepare separate programmes for gifted students are provided. Table 7. Comparison of teachers’ opinions towards gifted students with their willingness to prepare separate programmes for gifted students N Mean
Rank Sumof Ranks U p Explanation
Instructional Properties
Required 453 252,33 114307,00 5285 .000
p<0.05 Significant
Not Required 37 161,84 5988,00
Education Policy
Required 453 253,11 114660,00 4932 .000
p<0.05 Significant
Not Required 37 152,30 5635,00
Curriculum Required 453 250,22 113350,50
6241,5 .009 p<0.05
Significant Not Required 37 187,69 6944,50
Requirements in Education
Required 453 249,62 113076,50 6515 .023
p<0.05 Significant
Not Required 37 195,09 7218,50 The duties of the Ministry
Required 453 247,86 112278,50 7313,5 .193
p>0.05 Insignificant Not Required 37 216,66 8016,50
There was a significant difference between teachers’ opinions on instructional properties factor and teachers’ opinions who would like to prepare a separate programme for gifted students (Mean Rank=252,33) and teachers’ opinions who would not like to prepare a separate programme for gifted students (Mean Rank=161,84), (u=5285, p<0.05). There was a significant difference between teachers’ opinions on the education policy factor and teachers’ opinions who would like to prepare a separate programme for gifted students (Mean Rank=253,11) and teachers’ opinions who would not like to prepare a separate programme for gifted students (Mean Rank =152,30), (u=4932, p<0.05). There was a significant difference between teachers’ opinions on the curriculum factor and teachers’ opinions who would like to prepare a separate programme for gifted students (Mean Rank=250,22) and teachers’ opinions who would not like to prepare a separate programme for gifted students (Mean Rank =187,69), (u=6241, p<0.05). There was a significant difference between teachers’ opinions on requirements in the education factor and teacher opinions who would like to prepare a separate programme for gifted students (Mean Rank=249,62) and teacher opinions who would not like to prepare a separate programme for gifted students (Mean Rank =195,09), (u=6515,5, p<0.05). There was a significant difference between teachers’ opinions on requirements in the education factor and teachers’ opinions who would like to prepare a separate programme for gifted students (Mean Rank=247,86) and teacher opinions who would not like to prepare a separate programme for gifted students (Mean Rank =216,66), (u=7313, p>0.05).

Journal for Educators, Teachers and Trainers JETT, Vol. 9 (2); ISSN: 1989-9572
83
4. Conclusions and recommendations In conclusion, the present study aimed to explore the perceptions and opinions of teachers towards gifted students. It is important to understand and reveal the perceptions and opinions of teachers since they determine the attitudes and behaviours of teachers towards gifted students. The results of the study provide sufficient information about the teachers’ perceptions and opinions towards gifted students in North Cyprus. Innovations and performances of the individuals open the door to a required framework for gifted education. Individuals possessing such abilities need to be empowered for the sake of their country’s future. Overall, the study showed that teachers have positive perceptions and opinions relating to gifted students. This study, when compared with other studies in different countries, revealed educational implication differences. Gifted students would benefit if teachers could provide appropriate and effective educational programmes which will meet the educational needs of gifted students. Recommendations are provided based on the results of the study:
1. A special education network might be constituted for gifted students in order to provide them with an appropriate and qualified education.
2. There should be more courses related to providing the educational needs of gifted students offered by the universities’ faculties of education and teacher training programmes.
3. Educational policies and programmes should be developed in order to improve teachers’ knowledge, understanding and awareness of gifted students.
4. An instruction programme might be developed for gifted students and experimental research might be conducted to test the effectiveness of the programme.
In relation to the pertinent recommendations, the authors would consider necessary to address: 1. Further research might investigate the opinions, knowledge and awareness levels of
special education teachers in order to reveal the current situation. 2. Future research might include more schools in order to have more generalised results
and make comparisons. 5. References Archambault, F. X., Westberg, K. L., Brown, S. W., Hallmark, B. W., Zhang, W. & Emmons, C.
L. (1993). Classroom practices used with gifted third and fourth grade students. Journal for the Education of the Gifted, 16, 103-119.
Berger, S. (2006). College planning for gifted students: Choosing and getting into the right college (3rd ed.). Waco, TX. Prufrock Press.
Capan,E.B. (2010). Metaphoric perceptions of teacher candidates towards gifted students. Journal of International Social Reseach, 3(12), 140-154.
Chan, D.W. (2001). Learning styles of gifted and nongifted secondary students in Hong Kong. Gifed Child Quarterly, 45(1), 35-44.
Clark, B. (2002). Growing up gifted: Developing the potential of children at home and at school, 6th ed. Upper Saddle River, NJ: Prentice Hall.
Colangelo, N. (1991). Counseling gifted students. In N. Colangelo & G. A. Davis (Eds.), Handbook of gifted education (pp. 273-284). Boston: Allyn and Bacon.
Copenhaver, R.W. & McIntyre, D.J. (1992). Teachers’ perceptions of gifted students. Roeper Review, 14, 151–153.
Cross, J.A, Dobbs, C. (1987). Goals of a teacher training program for teachers of the gifted. Roeper Review, 9(3), 170-171.
Davalos, R. & Griffin, G. (1999). The impact of teachers’ individualized practices on gifted students in rural, heterogeneous classrooms. Roeper Review, 21(4), 308-314.
Davaslıgil, U. (2004). Üstün zekâlı çocukların eğitimi [Training of gifted students]. Birinci Türkiye Üstün Yetenekli Çocuklar Kongresi Seçilmiş Makaleler Kitabı, No:63, İstanbul: Çocuk Vakfı Yayınları.

Journal for Educators, Teachers and Trainers JETT, Vol. 9 (2); ISSN: 1989-9572
84
Davis, G.A. & Rimm, S.B. (2004). Educated of the Gifted and Talented. (fifth edition). Boston: Pearson Education.
Delisle, J.R. (2003). To be or to do: Is a gifted child born or developed? Roeper Review, 26(1), 12–13.
Feldhusen, J.F., Huffman, L. (1988). Practicum experiences in an educational program for teachers of the gifted. Journal for the Education of the Gifted, 12, 34-45.
Feldhusen, J.F. (1991). Full-time classes for gifted youth. The Gifted Child Today, 14(5), 10- 13. Feldhusen, J.F. (1997). Educating teachers for work with talented youth. In N. Colangelo & G.
A. Davis (Eds.), Handbook of Gifted Education (pp. 547-555). Gallagher, J.J. (2000). Unthinkable thoughts: Education of gifted students. Gifted Child
Quarterly, 44, 5-12. Hanninen, G.E. (1988). A study of teacher training in gifted education. Roeper Review, 10(3),
139-144. Hansen, J.B & Feldhusen, J.F. (1990). Off campus training of teachers of the gifted: A program
model. Gifted International, 6, 54-62. Hunsaker, S.L, Finley, V.S & Frank, E.I. (1997). An analysis of teacher nominations and student
performance in gifted programs. Gifted Child Quarterly, 41 (2), 19-24. Koshy, V. (2002). Survey of infant school teachers on provision for gifted children. UK: Brunel
Able Children’s Education Centre: Brunel University. Lyon, G.R, Vaassen, M. & Toomey, F. (1989). Teachers' perceptions of their undergraduate
and graduate preparation. Teacher Education and Special Education, 12(4), 164-169. Maker, J.N. & Nelson, A.B. (1996). Curriculum Development and teaching Strategies Gifted
Students. (2. Ed): Pro-Ed, Austin, Tex. Özdemir, N. N. & Demirel, S. (2012). Üstün zekâ kavramları: sosyokültürel bakış açıları. Türk
Üstün Zekâ ve Eğitim Dergisi, 2(1), 77-82. Parke, B.N. (1989). Gifted students in regular classrooms. Needham Heights, MA: Allyn &
Bacon. Pigge F.N. & Marso R.N. (1987). Relationships between student characteristics and changes in
attitudes, concerns, anxieties, and confidence about teaching during teacher preparation. Journal of Educational Research, 81, 109-115
Renzulli, J.S, Reis, S.M. (1985). The schoolwide enrichment model: A comprehensive plan for educational excellence. Mansfield Center, CT: Creative Learning Press.
Rohrer, J.C. (1995). Primary teacher conceptions of giftedness: image, evidence, and nonevidence, Journal For The Education Of The Gifted, 18 (3), 269-283.
Sak, U. (2010). Üstün zekalılar, özellikleri tanılanmaları, eğitimleri (Characteristics, diagnosis and education of gifted individulas). Ankara: Maya Academia Publishing.
Sarı, H. (2014). ‘What is the Future of Special Talented Children in Turkey’ (Unpublished Conference Paper), Necmettin Erbakan Universitesi, Erol Gungor Konferans Salonu, 16 May 2014.
The Ministry of National Education, (2005). Kuzey Kıbrıs Türk Cumhuriyeti, Milli Eğitim ve Kültür Bakanlığı. Kıbrıs Türk Eğitim Sistemi. <talimterbiye.mebnet.net/kibristurkegitimsistemi.pdf> (Retrieved on 15 June 2015).
Toll, M.F. (2000). The importance of teacher preparation programs to appropriately serve students who are gifted. Understanding Our Gifted, 12, 14-16.
Tomlinson, C. (1999). The differentiated classroom: Responding to the needs of all learners. Alexandria, VA:ASDC.
Uzunboylu, H. & Demirok, M. (2012). Üstün yetenekli öğrencilere yönelik görüş, algı ve eğitim ihtiyaçlarının belirlenmesi. Yakın Doğu Üniversitesi, PhD Thesis, Unpublished. North Cyprus. Nicosia: Near East Univeristy
Westberg, K.L., Daoust, M.E. (2003). The results of the replication of the classroom practices survey replication in two states. The National Research Center on the Gifted and Talented Newsletter,Fall: 3-8.
VanTassel-Baska, J. (2005). Domain-specific giftedness: Applications in school and life. In R. J. Sternberg & J. E. Davidson (Eds.), Conceptions of giftedness (2nd ed., pp. 358–377). New York: Cambridge University Press.

Journal for Educators, Teachers and Trainers JETT, Vol. 9 (2); ISSN: 1989-9572
85
ISSN 1989 - 9572
How do special education pre-service teachers perceive teaching arts? ¿Cómo perciben los maestros en formación de educación especial la enseñanza de las artes?
Basak Baglama, Yucehan Yucesoy,
Fatma Miralay, Mukaddes Sakalli Demirok,
Near East University, Turkey
Journal for Educators, Teachers and Trainers, Vol. 9 (2)
http://www.ugr.es/~jett/index.php
Date of reception: 19 November 2018
Date of revision: 24 December 2018
Date of acceptance: 28 December 2018
Baglama, B., Yucesoy, Y., Miralay, F. & Demirok, M.S. (2018). How do special education pre-service teachers perceive teaching art? Journal for Educators, Teachers and Trainers, Vol. 9(2), pp. 85 – 97.

Journal for Educators, Teachers and Trainers JETT, Vol. 9 (2); ISSN: 1989-9572
86
Journal for Educators, Teachers and Trainers, Vol. 9 (2) ISSN 1989 – 9572
http://www.ugr.es/~jett/index.php
How do special education pre-service teachers perceive teaching arts?
¿Cómo perciben los maestros en formación de educación especial la enseñanza de las artes? Basak Baglama, [email protected] Yucehan Yucesoy, [email protected] Fatma Miralay, [email protected] Mukaddes Sakalli Demirok, [email protected]
Near East University, Turkey Abstract Arts is looked upon as empowering social and adaptive skills of individuals with special needs.Therefore, special needs individuals involvement with arts plays a big role in their development. İn order to be able to integrate arts activities into instructional practices teachers in the field of special education are in need to have competence in teaching arts during their professional lives. The study aims to explore how the pre-service special education teachers perceive teaching arts. Quantitative research method was applied in the present study demographic information and a scale was used to collect the data. Participants of the study consisted of 361 pre-service teachers enrolled in Near East University. The collected data was analyzed with SPSS 20.00 program. The results of the study indicated that pre-service teachers special education teachers perceptions regarding arts teaching are positive. More interestingly, perceptions on teaching arts showed a significant difference regarding gender, class level and attending lecture on arts teaching. Applying arts teaching in the special education training sessions and recommendations for further research was provided in the study Resumen Las artes son consideradas como habilidades empoderadoras y sociales de individuos con necesidades especiales. Por lo tanto, la participación de individuos con necesidades especiales en las artes juega un papel importante en su desarrollo. Para poder integrar las actividades artísticas en las prácticas de instrucción, los maestros en el campo de la educación especial tienen la necesidad de tener competencia en la enseñanza de las artes durante su vida profesional. El objetivo del estudio es explorar cómo los profesores de educación especial antes del servicio perciben las artes de enseñanza. El método de investigación cuantitativa se aplicó en el presente estudio de información demográfica y se utilizó una escala para recopilar los datos. Los participantes del estudio constaron de 361 maestros en servicio previo inscritos en la Universidad del Cercano Oriente. Los datos recogidos se analizaron con el programa SPSS 20.00. Los resultados del estudio indicaron que las percepciones de los maestros de educación especial antes del servicio y las percepciones sobre la enseñanza de las artes son positivas. Más interesante aún, las percepciones sobre la enseñanza de las artes mostraron una diferencia significativa con respecto al género, el nivel de clase y la asistencia a conferencias sobre la enseñanza de las artes. La aplicación de la enseñanza de las artes en las sesiones de capacitación de educación especial y las recomendaciones para futuras investigaciones se proporcionaron en el estudio Keywords Arts; Special education; Preservice teachers; Perception Palabras clave Letras; Educación especial; Profesores de servicio; Percepción

Journal for Educators, Teachers and Trainers JETT, Vol. 9 (2); ISSN: 1989-9572
87
1. Introduction Today, definition of education covers skills and understandings acquired in order to take place in the social life of the individuals. Accordingly, education is broadly defined as all social processes that are effective in helping individuals to acquire the standards, beliefs and ways of living in a society (Ozdemir & Calik, 2009). Special education includes categories of disability groups and these groups receive special education services since the changes planned to be achieved in the behaviors of the individuals who need special education are realized through education (Diken, 2011). Special education includes education strategies and methods used to meet the educational and social needs of individuals with special needs and adjust environments for their individual qualifications and developmental characteristics (Cantimer, Sengul & Akcin, 2017; Baglama & Demirok, 2016). Individuals with special needs are classified as visually impaired, hearing impaired, mentally disabled and gifted individuals. Considering the social, legal, economic and psychological conditions in which individuals with special needs live in, it can be seen that they cannot be discriminated from the education system. Educational requirements of individuals with special needs differ according to their characteristics and they show might significant individual differences among themselves depending on their various characteristics. These differences can lead them to need more support in learning many skills that are necessary for their social life. For this reason, it is important for individuals with special needs to be prepared seriously so that they can maintain their lives in different environments. Therefore, the most important objective in the education of the individuals with special needs is to improve their independent living skills. It is stated that arts and painting lessons have a major role in accomplishing this aim and that it is an important factor in helping the individual be independent, creative and confident (Buyurgan & Buyurgan, 2007; Kirisoglu, 2014). As it is in all areas of education, painting education, which is now called visual arts course, takes place in the education of special needs individuals as well. From the beginning of the 21st century to today, visual arts education is described as in-school and out-of-school creative arts education, conceptually and generically, involving art disciplines and relevant areas. The visual arts course is also known as a mean of expressing the inner world with its intelligence, personality, close environment characteristics as well as being a criterion for defining the child in psycho-pedagogical sense (Mamur, 2015; Yavuzer, 2012). Furthermore, the change in children's artistic activities follows a path parallel to their mental and physical development. Every child starts their first drawing act with scrabbling and the change in drawings may differ. For instance, it might take a long time for a house to be transformed into shaped and meaningful lines in a short time (Kehnemuyi, 1995). This drawing, called scribbling, is carried to a different stage by the development of hand-eye-brain coordination and psycho-motor skills. According to Yavuzer (2012), the development stages of children's pictures are divided into five stages. These five stages are listed below:
• Scrubbing Period (2-4 years) • Pre-Schedule Period (4-7 years) • Schematic Period (7-9 years) • Realism (Grouping) Period (9-12 years) • Visually Naturalistic Period (12-14 years)
Visual arts education for an individual with special need is effective in describing and proving oneself, in perception and representation of beings in the nature. It is known that visual arts in special education are conducted systematically or unsystematically in educational institutions (Penketh, 2016). It is a fact that individuals with special needs enjoy visual arts education at any age. Nevertheless, it is known that children can enjoy activities in teaching arts and these activities will benefit the development of their skills (Mitchell, Scanlon & Weber, 2013). While individuals with special needs learn many abilities as their peers, their learning speed might be slower and more difficult compared with other individuals. An individual with special needs might encounter with factors that make learning difficult such as distractibility and physical disabilities

Journal for Educators, Teachers and Trainers JETT, Vol. 9 (2); ISSN: 1989-9572
88
including vision or hearing and when the environment, they are living in is limited or the opportunities are not given, it can lead to delays in gaining necessary skills (Ozyurek, 1991). Visual arts education for individuals with special needs, in order to bring the level of knowing and doing to a better position; is interpreted as a systematic series of applications which are formed by taking into account the present needs of the individual (Salderay, 2012). The main purpose of the education programs designed for these individuals is not to produce a product. Participation of the individual with special needs in the working process work process, pleasure and happiness feelings from his work is more important than the product that is produced. The aim of visual arts education for individuals with special needs is to contribute to the development of the individual. Studies conducted in the visual arts course are extremely important in terms of contributing to the integration of the individual with special needs and to the awareness of these individuals in society (Malley & Silverstein, 2014). It is important that the teacher is a good observer in the process of planning and implementing visual arts lessons in private educational institutions. A separate room can be arranged for this course as well as a special corner in the class. This environment should be arranged in such a way that children can perform painting activities whenever they want. Closely observing the child and talking about his work is a sign that the teacher cares for the process for a very long time (Mercin & Alakus, 2007; Uslu, 2016). Teachers and teacher candidates have great tasks in this sense in order to achieve the purpose of the painting lesson and to benefit the children. During the course, a trainer who knows himself well should be able to provide necessary explanations and activities to his students in the art class. The activities carried out in the course are helping individuals with special needs to identify their surroundings, express themselves and socialize. The guidance and information provided by the special education teacher who conducts the lesson and the information about the structural features, measures, colors and many subjects of the objects that individuals meet in daily life are provided. As a result of these studies, while the individual is delighted and pleased with the work, she/he is doing on the other hand the information they are gaining enhances their cognitive level. When the determined plans or programs for the purpose of the drawing lesson are applied, it is possible to contribute to the cognitive, emotional and psycho-motor development of the disabled individuals as well as to make them feel happy. Regardless the disability group, the visual arts education painting can help them to learn the feeling of success (Caglayan, 2014; Dursin & Pamuklu, 2015). When we look at studies with special needs individuals, it is seen that they are mostly paint materials, brushes, paper, cardboard, pencils, scissors, clay, play cloth, waste materials, adhesives and many other materials. In other words, the studies done with these materials are given gradual programming for instance from rough machine operators such as paper tearing, tearing, to a finer motor skill such as cutting, folding, gluing. The main purpose of the teaching materials prepared for teaching purposes is to firstly give information to children and to inform them directly (Mamur, 2012). These drawings, which are specially prepared for individuals to prepare them for learning and usually create visual items are supported and are an important element in the teaching function. Products that meet the learning needs of learners such as concepts, phenomena, nature and imagination by reflecting it with correct and valid information in accordance with their level are the main factors of artistic skills. When these activities are carried out, the teacher becomes the model, shows the appropriate behaviors patiently and step by step, encourages the student and provides physical assistance when necessary. Moreover, as a result to these studies, the individual has an idea about the functioning of these materials in his/her daily life. It is important to determine the perceptions of special education teacher candidates about visual arts education to make studies about visual arts education in their professional lives in the future and to give academic and artistic skills to individuals with special needs through arts. Brushes, papers, cardboards, clay and playcloths can be used in the art activities as well as waste or recycled materials. Painting studies starting with the use of pastel and dry paint studies show that the child develops step by step with holding a brush and using watercolour paint. The exercises should be arranged in order to paint certain shapes and to draw a picture in accordance with the directive, without making any random paintings (Kulaksizoglu, 2003). It is observed that individuals with special needs become more productive and more durable when

Journal for Educators, Teachers and Trainers JETT, Vol. 9 (2); ISSN: 1989-9572
89
such studies are used correctly. Individuals with special needs contribute to the development of self-confidence as well as activating levels of collective participation when artistic products are introduced. For instance, the promotion of the products of students with special needs in the art classes by the special education teacher will enable not only the teachers but also the other individuals in the society to have positive responses. In this context, the visual arts course needs to be thought of as both an academic skill and an activity that will increase the social participation levels of the special needs students. Therefore, it turns out that special education teachers should have sufficient knowledge, skills and equipment about visual arts lesson. When literature on this topic is examined, it has been determined that there is a limited number of studies examining the perceptions of special education teacher candidates regarding the education of visual arts. In light of this information, the aim of the research is to determine the perceptions of special education teachers regarding the education of visual arts. Within the scope of this purpose, the following questions were sought:
1. What are the perceptions of the preservice special education teachers regarding the visual arts lesson?
2. Do the perceptions of preservice special education teachers about visual arts show a significant difference according to age?
3. Do the perceptions of preservice special education teachers about visual arts show a significant difference according to the gender variable?
4. Do the perceptions of preservice special education teachers regarding the visual arts lessons significantly differ from the class level variable?
5. Is there a significant difference between the perceptions of preservice special education teachers about visual arts lesson based on receiving a lecture on teaching arts or not?
2. Materials and methods 2.1. Research model In this study which was aimed to determine the perceptions of preservice special education teachers on teaching arts, survey model was used. In survey model, it is aimed to describe or explain a past or an existing situation without any manipulation or intervention (Karasar, 2006). 2.2. Participants Participants of the study consisted of 206 volunteer preservice special education teachers studying in the department of Teaching the Mentally Retarded at Near East University in North Cyprus. Participants were determined based on simple random sampling method. Simple random sampling is generally used when every unit in a population has the same inclusion and all of the units are independent (Coladarci, Cobb, Minium & Clarke, 2010).

Journal for Educators, Teachers and Trainers JETT, Vol. 9 (2); ISSN: 1989-9572
90
Table 1. Demographic characteristics of the participants
Demographic Characteristics f %
Age
19-21 89 43.2
22-25 97 47.1
26 and above Total
20 206
9.7 100
Gender Male 114 44.7
Female 92 55.3
Total 206 100
Class First year 11 5.3
Second year 95 46.1
Received a lecture on teaching arts or not
Third year Fourth year
Total Yes No
Total
69 31 206 125 81 206
33.5 15.0 100 60.7 39.3 100
Demographic characteristics of the participants are shown in (Table 1). According to Table 1, it is seen that 89 of the participants (43.2%) were between the ages of 19 and 21; 97 of them (47.1%) were between 22 and 25 and 20 of them (9.7%) were 26 and above. In addition, 114 of the participants (44.7%) were male and 92 of them (55.3%) were female. As it can be seen from the table, majority of the participants were second year students (f=95, 46.1%). Besides, 11 participants (5.3%) were first year students, 69 of them (33.5%) were third year students and 31 of them (15.0%) were fourth year students. Approximately 61% of the participants indicated that they received a lecture on teaching arts and 81 of them reported that they did not receive such a lecture. 2.3. Data collection tools Two different instruments including a Demographic Information Form and Perceptions on Teaching Arts Scale were used to collect the data. Demographic information form included questions on age, gender, class level and information on having received a lecture on teaching arts or not. The scale on perceptions on teaching arts was originally developed by (29) in order to determine the perceptions of preschool teacher candidates on teaching arts. The scale includes 31 statements and each item is rated on a 5-point scale ranging from “Strongly Agree” (5), “Agree” (4), Neutral (3), “Disagree” (2) and “Strongly Disagree” (1). The scale consists of 20 positive and 11 negative expressions. It was found that the Cronbach Alpha reliability coefficient of the scale was .71. 2.4. Procedure Data collection tools were administered to the participants during the lecture hours. Students who were currently enrolled in Teaching the Mentally Retarded program at Near East University in North Cyprus were eligible to participate in the study. It took participants approximately 15 minutes to complete the study. 2.5. Data analysis Data of the study were analyzed with SPSS 20 program. Significance level was considered as p < .05 in statistical analysis. Percentage, frequency, t-test, chi-square, Kruskal-Wallis test and correlation and regression analysis were used in data analysis. The score ranges used in interpreting the responses to scale are provided in Table 2.

Journal for Educators, Teachers and Trainers JETT, Vol. 9 (2); ISSN: 1989-9572
91
Table 2. Score intervals
Option Load Interval
Strongly Disagree 1 1.00-1.79
Disagree Neutral Agree Strongly Agree
2 3 4 5
1.80-2.59 2.60-3.39 3.40-4.19 4.20-5.00
3. Results Results obtained from the study in line with the general aim and sub-aims are provided in this section. Table 3. Descriptive statistics of perceptions on teaching arts scale
Perceptions N Number of Statements
Minimum Maximum Mean SD
Total Scores on Perceptions
206
31
2.23
4.13
3.44
.34
Table 3 shows descriptive statistics on total scores of the participants on perceptions on teaching arts scale. As it can be seen from the table, mean of total scores is between “Agree” score range. Based on this result, it can be interpreted as perceptions of preservice special education teachers on teaching arts are positive at a moderate level.
Frequency and percentage values of responses and mean and standard deviations to each statement in the scale are shown in Table 4.
Table 4. Frequency and percentage values of responses to each statement in the scale
Strongly Agree
Agree Neutral Disagree Strongly Disagree
Mean SD Statements n % n % n % n % n %
1. I want teaching arts lecture to be
explained with different technics.
87 42.2 69 33.5 35 17.0 9 4.4 6 2.9 4.07 1.01
2. I do not want to use
expensive materials in
teaching arts lecture.
10 4.9 14 6.8 20 9.7 67 32.5 95 46.1 1.91 1.12
3. I want our lecturer to
benefit from technology in teaching arts
lecture.
88 42.7 81 39.3 24 11.7 5 2.4 8 3.9 4.14 .98

Journal for Educators, Teachers and Trainers JETT, Vol. 9 (2); ISSN: 1989-9572
92
4. I want our lecturer to be a professional in the related
field.
122 59.2 52 25.2 18 8.7 6 2.9 8 3.9 4.33 1.02
5. I want teaching arts lecture to be supported
with various TV programs.
67 32.5 76 36.9 45 21.8 13 6.3 5 2.4 3.90 1.01
6. I like teaching arts lecture very much.
55 26.7 74 35.9 50 24.3 16 7.8 11 5.3 3.70 1.12
7. I want teaching arts lectures to be
held in different art
studio.
105 51.0 59 28.6 31 15.0 10 4.9 1 .5 4.24 .92
8. I want teaching arts lecture to be
held in different places.
103 50.0 61 29.6 27 13.1 12 5.8 3 1.5 4.20 .98
9. I feel happy at teaching arts
lectures.
80 38.8 68 33.0 39 18.9 14 6.8 5 2.4 3.99 1.04
10. I want to have an interest in teaching arts in my leisure
times.
53 25.7 44 21.4 64 31.1 31 15.0 14 6.8 3.44 1.21
11. I do not want to carry
materials for teaching arts
lecture.
23 11.2 25 12.1 39 18.9 53 25.7 66 32.0 2.44 1.34
12. I’m really interested in teaching arts
lecture.
43 20.9 68 33.0 62 30.1 20 9.7 13 6.3 3.52 1.12
13. I prefer group work in some
topics in teaching arts
lecture.
71 34.5 67 32.5 38 18.4 15 7.3 15 7.3 3.79 1.21
14. I want to attend
museum and exhibition
opennings in teaching arts
lecture.
70 34.0 73 35.4 39 18.9 15 7.3 9 4.4 3.87 1.09
15. I do not want teaching arts lecture to be
evaluated based on grades.
17 8.3 22 10.7 51 24.8 38 18.4 78 37.9 2.33 1.31
16. I want my work to be
76 36.9 66 32.0 37 18.0 17 8.3 10 4.9 3.87 1.14

Journal for Educators, Teachers and Trainers JETT, Vol. 9 (2); ISSN: 1989-9572
93
exhibited at the end of the
term.
17. I’m not interested in sources on teacing arts
lecture.
39 18.9 54 26.2 55 26.7 31 15.0 27 13.1 3.22 1.28
18. I don’t think that teaching arts lecture is interesting.
41 19.9 48 23.3 43 20.9 43 20.9 31 15.0 3.12 1.35
19. I don’t want to miss any class of
teaching arts lecture.
13 6.3 25 12.1 63 30.6 64 33.1 41 19.9 2.54 1.13
20. I like projects on teaching arts lecture.
61 29.6 83 40.3 37 18.0 17 8.3 8 3.9 3.84 1.06
21. I feel bored when I
complete my work on
teaching arts lecture at
home.
48 23.3 58 28.2 58 28.2 22 10.7 20 9.7 3.45 1.23
22. Time hangs heavy at
teaching arts lectures.
36 17.5 57 27.7 54 26.2 33 16.0 26 12.6 3.21 1.26
23. I want to learn about artists in teaching arts lecture.
54 26.2 61 29.6 56 27.2 21 10.2 14 6.8 3.58 1.17
24. I will be happy if content of
teaching arts lecture are narrowed
down.
45 21.8 47 22.8 55 26.7 34 16.5 25 12.1 3.25 1.30
25. Teaching arts lecture is an
important lecture.
77 37.4 68 33.0 41 19.9 11 5.3 9 4.4 3.93 1.08
26. I don’t like when my work is criticized in teaching arts
lecture.
32 15.5 34 16.5 40 19.4 53 25.7 47 22.8 2.76 1.38
27. I think time for teaching arts
lecture is insufficient.
43 20.9 55 26.7 73 35.4 23 11.2 12 5.8 3.46 1.11
28. I don’t like using different
materials in teaching arts
lecture.
39 18.9 49 23.8 50 24.3 29 14.1 39 18.9 3.09 1.37
29. I’m not interested in
linear development
71 34.5 44 21.4 44 21.4 19 9.2 28 13.6 3.53 1.39

Journal for Educators, Teachers and Trainers JETT, Vol. 9 (2); ISSN: 1989-9572
94
of children.
30. I find teaching arts lecture
boring.
28 13.6 28 13.6 38 18.4 55 26.7 57 27.7 2.58 1.37
31. I would not take teaching arts lecture if
it was an elective course.
63 30.6 40 19.4 44 21.4 19 9.2 40 19.4 3.32 1.48
Mean and standard deviations for each statement in the scale is also demonstrated in Table 4. Mean of each statement could be interpreted based on score ranges. According to the results, preservice special education teachers responded as “Agree” to the following statements: “I want teaching arts lecture to be explained with different technics.”, “I want our lecturer to benefit from technology in teaching arts lecture.”, “I want teaching arts lecture to be supported with various TV programs.”, “I like teaching arts lecture very much.”, “I feel happy at teaching arts lectures.”, “I want to have an interest in teaching arts in my leisure times.”, “I’m really interested in teaching arts lecture.”, “I prefer group work in some topics in teaching arts lecture.”, “I want to attend museum and exhibition openings in teaching arts lecture.”, “I like projects on teaching arts lecture”, “I feel bored when I complete my work on teaching arts lecture at home”, “I want to learn about artists in teaching arts lecture”, “Teaching arts lecture is an important lecture.”, “I think time for teaching arts lecture is insufficient” and “I’m not interested in linear development of children”. Table 5. T-test results of perceptions on teaching arts based on gender and receiving a lecture on teaching arts or not
Perceptions on Teaching Arts
n Mean SS sd t p
Gender Male Female
114 92
3.40 3.51
.32
.35 204 2.47 .014
Received a lecture on teaching arts or not
Yes No
125 81
3.51 3.36
.31
.36 204 3.02 .003
p < .05
T-test analysis was applied to determine whether perceptions of participants show significant difference based on gender and receiving lecture on teaching arts or not. In Table 5, detailed information about t-test results of perceptions on teaching arts of preservice special education teachers based on gender and information on received a lecture on teaching arts or not are provided. As it can be seen from the table, perceptions of preservice special education teachers on teaching arts show significant difference based on gender (t (204) =-2.47, p < .05). It is seen that female participants scored higher than male participants in terms of their perceptions on teaching art. Furthermore, results revealed that perceptions of preservice special education teachers on teaching arts show significant difference based on whether they received a lecture on teaching arts before or not (t (206) =3.02, p < .05). As it can be seen, preservice special education teachers who received a lecture on teaching arts scored higher than participants who did not receive such a lecture before.

Journal for Educators, Teachers and Trainers JETT, Vol. 9 (2); ISSN: 1989-9572
95
Table 6. One-way ANOVA results of perceptions on teaching arts based on age and class level
Variable n Mean SS Sum of Squares
sd Mean Square
F p
Class Level
Age
1 2 3 4
19-21 22-25
26 and
above p < .05
11 95 69 31
89 97 20
3.32 3.38 3.52 3.50
3.41 3.46 3.52
.35 .36 .30 .39
.39
.29
.31
Between Groups
Within Groups
Between Groups
Within Groups
.98
22.53
.27
23.25
3
202 2
203
.329
.112
.138
.115
2.951
1.209
.034
2-3*
.301
One-way ANOVA analysis was applied to reveal whether perceptions of preservice special education teachers show significant difference class level and age. Results are shown in Table 6. As it can be seen, perceptions of the participants on teaching arts show significant difference based on their class levels (F=2.951; .034). It is seen that second-year students had the highest scores on perceptions on teaching arts. According to the results, perceptions on teaching arts do not show significant difference based on age of the participants (F=1.209; .301). Post Hoc test was applied in order to determine in which sub-groups show difference according to perceptions on teaching arts based on class level. Post Hoc test results are shown in Table 6. As it can be seen, there is a significant difference between second year students and third year students (p < .05). It can be inferred that third-year students have higher scores on perceptions on teaching arts. This might be based on the fact that lecture on teaching arts is involved in second year. Therefore, third year students might get higher scores in terms of perceptions on teaching arts since they have just taken a lecture on teaching arts during their second year of education. In addition, no statistically significant difference was observed between other groups. 3. Discussion In this research, it has been tried to determine the perceptions of preservice special education teachers regarding teaching arts. It has been determined that the perceptions of the preservice special education teachers participating in the research on the teaching arts are positive. It has been also determined that the most positive opinions of the teacher candidates regarding the art teaching course are gathered in order that the art education with technology support will be efficient. In addition, it has been determined that all candidates have a moderate level of perception that the subject media and various television programs will enrich the course. In parallel with the results of present study, Dolunay (2016) emphasizes that technology supports the visual arts course concretely and visually and that the learners can become enriched through the media and become entertained. Furthermore, it was determined that candidates have the lowest perceptions on the use grading method in evaluating the course. Mamur (2012) stated that art education is healthy through process evaluation rather than rational grading. For the first sub-aim of the study, it was determined that the perceptions of the preservice special education teachers regarding the application of the visual arts course to the special needs individuals were positive. Salderay (2012) found that the visual arts course had a positive effect on the individuals who need special education and their teachers. This finding supports

Journal for Educators, Teachers and Trainers JETT, Vol. 9 (2); ISSN: 1989-9572
96
the result of the research. In general, it was determined that teacher candidates had a perception that it was fun, open to group work, supported by technology and media, and structured in an out-of-school setting. In addition, it has also been found that teachers have the belief that individuals can have the chance to recognize world artists. Sahin (2015) has come to the conclusion that visual arts education has positive aspects such as appealing to many development and learning areas at the same time with different application variety, giving emotion and thought expressions, positive thinking and cultural learning. This finding also supports the result of the research. In the second sub-study of the research it was determined that perceptions of preservice special education teachers do not differ significantly based on the age variable. This suggests that positive perceptions of the teaching arts do not make a difference according to age. It can be interpreted that the age variable does not affect the perceptions of preservice special education teachers regarding teaching arts. In another dimension of the study, gender and perceptions of preservice special education teachers were examined. According to this result, it was determined that female preservice special education teachers have higher scores than male preservice special education teachers. This indicates that female preservice special education teachers’ perceptions of teaching arts are more positive. Yolcu and Subasi (2016) found that the creativity and aesthetic perceptions of women are higher than that of men and they have shown that they can make a difference in the attitude and perception of the lesson. This situation can be interpreted as a determinant in the perceptions of the female preservice special education teachers in the present research and their perceptions may be higher than that of the males. When the perceptions of the classes of the teacher candidates were examined, it was determined that there is a meaningful difference between the perceptions of the second year and the third-year preservice special education teachers. Furthermore, it was determined that the perceptions of the third-year preservice special education teachers were higher than all the classes. This situation can be interpreted as the educational experience of the students is increasing respectively and the perceptions of the subject may change positively. Preservice special education teachers who are trained in the class can be interpreted as having a more selective perception of different disciplines. According to this result, third grade preservice special education teachers may have had a positive impact on their perception as they have taken this course in the second semester. When the perceptions of preservice special education teachers for teaching arts were examined, it was determined that the scores of these preservice teachers were higher. This situation can be interpreted as the basis of the subject on the preservice special education teachers and the readiness levels will have a positive effect within the scope of the subject. It can be interpreted that this finding of the research is parallel to the finding related to the class level variable. 4. Conclusions and recommendations In conclusion, it was determined that the perceptions of the special education teachers about teaching arts were in the positive direction and this resulted in the fact that their perceptions might show differences according to the class level variable. In addition to this, preservice special education teachers’ perceptions on teaching arts also addressed that art education should be evaluated based on process not product, arts classes should be carried out in the natural environment and media and technology should be integrated in arts classes. In line with the results of the study, the following recommendations might be provided:
• The teaching hours of the art teaching courses in the special education teacher education programs can be increased.
• The exhibits of the products and materials that have emerged in the arts lessons can be provided to show the creativity of the teacher candidates.

Journal for Educators, Teachers and Trainers JETT, Vol. 9 (2); ISSN: 1989-9572
97
• Similar studies can also be applied to other teacher training programs. • It can be recommended that this study should also be carried out using different
research designs. • It can be recommended that the instructors who teach arts education use and
integrate technology to more active class environments. 5. References Baglama, B., & Demirok, M. (2016). Determination of preservice special education teachers’
views on early childhood intervention. Cypriot Journal of Educational Sciences, 11(4), 213-222.
Buyurgan, S., & Buyurgan, U. (2007). Sanat egitimi ve ogretimi. Ankara: Pegem Akademi Yayincilik.
Coladarci, T., Cobb, C. D., Minium, E. W., & Clarke, R. C. (2010). Fundamentals of statistical reasoning in education. John Wiley & Sons.
Cantimer, G. G., Sengul, S., & Akcin, N. (2017). Exploring the professional self-efficacy perceptions of the teachers of children in need of special education in terms of various variables. Journal of Human Sciences, 14(1), 694-716.
Caglayan, N. (2014). Zihinsel engelli bireylerin egitiminde gorsel sanatlar dersinin yeri ve onemi. Karabuk Universitesi Sosyal Bilimler Enstitusu Dergisi, 4(1), 91-101.
Diken, I. H. (2011). Ozel egitime gereksinimi olan ogrenciler ve ozel egitim. Ankara: Pegem Akademi.
Dolunay, A. (2016). Teknolojinin gorsel sanatlar ve sanat egitimine katkisi. Journal of International Social Research, 9(42), 1208-1213.
Dursin, A., & Pamuklu, A. (2015). Tactile communication design for visually impaired people: Tactile magazine page. Global Journal of Arts Education, 5(2), 61-66. doi: https://doi.org/10.18844/gjae.v5i2.247 .
Karasar, N. (2006). Bilimsel Arastirma Yontemleri. Ankara: Nobel Yayincilik. Kehnemuyi, Z. (1995). Cocugun gorsel sanatlar egitimi. Istanbul: Yapi Kredi Yayinlari. Kirisoglu, O. T. (2014). Sanat bir seruven. Ankara: Pegem Akademi. Kulaksizoglu, A. (2003). Farkli gelisen cocuklar. Istanbul: Epsilon Yayincilik Hizmetleri. Malley, S. M., & Silverstein, L. B. (2014). Examining the intersection of arts education and
special education. Arts Education Policy Review, 115(2), 39-43. Mamur, N. (2012). The effect of modern visual culture on children's drawings. Procedia-Social
and Behavioral Sciences, 47, 277-283. Mamur, N. (2015). Critical pedagogical approaches to visual culture in Turkish preservice
education. Studies in Art Education, 56(4), 355-368. Mercin, L. & Alakus, A. O. (2007). Birey ve toplum icin sanat egitiminin gerekliliği. DU Ziya
Gokalp Egitim Fakultesi Dergisi, 9, 14-20. Mitchell, C., O'Reilly-Scanlon, K., & Weber, S. (2013). Just who do we think we are?:
Methodologies for autobiography and self-study in education. Canada: Routledge. Ozdemir, S., & Calik, T. (2009). Turk egitim sistemi ve okul yonetimi. Nobel Yayin Dagitim. Ozyurek, M. (1991). Zihinsel engellilerin egitiminde tibbi ve egitsel yaklasimlar. Ankara
Universitesi Egitim Bilimleri Fakultesi Ozel Egitim Dergisi, 1(1), 17-20. Penketh, C. (2016). Special educational needs and art and design education: plural
perspectives on exclusion. Journal of Education Policy, 31(4), 432-442. Sahin, H. (2015). Gunumuz sanati ve pastis. Art-e Sanat Dergisi, 8(15), 110-126. Salderay, B. (2012). Evaluation of visual art works which made by handicapped persons by their
families and educational staff. Erzincan Universitesi Egitim Fakultesi Dergisi, 12(1), 219-229.
Uslu, O. (2016). The effects of visual perception experiences on academic success in fine arts. New Trends and Issues Proceedings on Humanities and Social Sciences, 2(1), 410-416. doi: 10.18844/gjhss.v2i1.325 .
Yavuzer, H. (2012). Resimleriyle cocuk. (16th ed.) Istanbul: Remzi Kitabevi. Yolcu, E., & Subasi, S. (2016). Cok alanli sanat egitimi yonteminin 7. sınıf ogrencilerinin
resimsel yaraticiligina katkilarinin cinsiyet degiskenine gore incelenmesi. Elektronik Sosyal Bilimler Dergisi, 15(56), 34-48.

Journal for Educators, Teachers and Trainers JETT, Vol. 9 (2); ISSN: 1989-9572
98
ISSN 1989 – 9572
Peer mediation teacher in-service training program for resolving student disputes Programa de capacitación en servicio para maestros de mediación entre pares para resolver disputas de estudiantes
Nuket Gunduz, Deniz Ozcan,
Near East University, Turkey
Journal for Educators, Teachers and Trainers, Vol. 9 (2)
http://www.ugr.es/~jett/index.php
Date of reception: 09 October 2018
Date of revision: 02 December 2018
Date of acceptance: 27 December 2018
Gunduz, N. & Ozcan, D. (2018). Peer mediation teacher in-service training program for resolving student disputes. Journal for Educators, Teachers and Trainers, Vol. 9(2), pp. 98 – 108.

Journal for Educators, Teachers and Trainers JETT, Vol. 9 (2); ISSN: 1989-9572
99
Journal for Educators, Teachers and Trainers, Vol. 9 (2) ISSN 1989 – 9572
http://www.ugr.es/~jett/index.php
Peer mediation teacher in-service training program for resolving student disputes
Programa de capacitación en servicio para maestros de mediación entre pares para resolver disputas de estudiantes Nuket Gunduz, [email protected] Deniz Ozcan, [email protected] Near East University, Turkey Abstract The aim of the study was to determine the effectiveness of the implemented peer mediation in-service teacher training program. Qualitative method was used to collect data about teacher opinions regarding the effectiveness of the applied 40 hours peer mediation in-service training program. The participants of the study consisted of randomly selected 40 elementary school teachers serving in 10 different elementary schools from five different regions of North Cyprus. The results reveal that teacher peer mediation beliefs together with social and professional developments have positively developed after the implemented peer mediation in-service training program. Resumen El objetivo del estudio fue determinar la efectividad del programa implementado de mediación entre compañeros en la capacitación de maestros en servicio. Se utilizó el método cualitativo para recopilar datos sobre las opiniones de los docentes sobre la efectividad del programa de capacitación en servicio de mediación entre pares de 40 horas. Los participantes del estudio consistieron en 40 maestros de escuelas primarias seleccionados al azar que prestan servicios en 10 escuelas primarias diferentes de cinco regiones diferentes del norte de Chipre. Los resultados revelan que las creencias de mediación entre pares entre profesores y los desarrollos sociales y profesionales se han desarrollado positivamente después del programa implementado de capacitación en servicio en mediación entre pares. Keywords In-service training program; Teacher training; Peer mediation Palabras clave Programa de formación en servicio; Formación docente; Mediación entre iguales.

Journal for Educators, Teachers and Trainers JETT, Vol. 9 (2); ISSN: 1989-9572
100
1. Introduction
The rapid changes of social issues in the latest century strikes the need to develop new generations in accordance with the world’s latest paradigms. Since the teachers are looked upon as the inventors of the future generations then the burden lies on teachers. Aristotle’s words “roots of education is bitter but the fruit is sweet” (Castelli, 2018) can clearly define the hard work of teachers in order to accomplish success in educating their students. Teacher development to fulfil and facilitate the requirements of their students can be obtained through in-service trainings. Considering that world has moved from the mind set of industrial world to post-industrial world which has caused a need for patterns of thinking and acting to change as well. Regarding the change present curriculum developed with knowledge and skills are thought to be for the good of the government, society and individuals too. However, instrumentalism has had a great effect on the content of the curriculum like key learning areas. Therefore, in-service training for teachers can be one of the options for increasing their performance and developing contemporary knowledge as well as renewing the existing (Garuba, 2004). Some studies reveal that (Acheampong, 2003; Harris & Sass, 2008; Caena, 2011; Shriki & Lavy, 2012) promoting prospective teachers is a key element in improving primary and secondary education. Thus, pre-service and in-service trainings are a way to change and develop the needed skills of the teachers regarding the development in their profession to be able to transfer academic knowledge and enhance students’ social skills (García Laborda, 2018). Students lack of social skills are seen to end up with classroom disruptions which generally hinder teaching and learning processes in classrooms (McCarthy, Lambert, O’Donnell, & Melendres, 2009; Daunic, Smith, Robinson, Miller, & Landry, 2000). Each person has a set of beliefs driven from building meanings. However, meaning making is not only individual it is also collective and the classroom is set up of students with individual and collective set of beliefs. Moving from this fact, schools are places where students can be developed in a constructive way in order to contribute positively to their own society. The need for connectedness instead of separation to co-exist is the main issue for the world we live in today. Students’ lack of social and affective skills paves the way to classroom disputes where teachers’ generally try to handle these issues with re-active methods like punishments. This kind of discipline method is a big discussion in education settings. There is a wording going around in many settings saying that “nothing has a right to continue if it is not functional” which really fits in with the re-active methods for school disputes. However, pro-active methods and skills generally have longer and are seen to be more constructive. Peer mediation programs are a method to accomplish pro-active attitudes, skills and beliefs towards student disputes. The need for school-based preventive programs (Da Silva, Ventura, & Garcia, 2016; Smith, Daunic, Miller, & Robinson, 2002) can be fulfilled by peer mediation programs. These programs not only help students to improve their competencies and attitudes in school; they also empower students to resolve disputes constructively in their future lives (Johnson & Johnson, 2004; Selfridge, 2004). Therefore, mediation skill development not solely enhances students’ mediation skills (Shamir & Tzuriel, 2004; Tzuriel & Caspi, 2017) it also facilitates the transfer of mediation strategies. In order to adopt and develop such skills and strategies students’ needs to be influenced by their role models. Teachers not only develop their students’ knowledge and skills with the academic instruction and practice they also act as role models for them. Students’ lack of such role models are likely to make them unable to challenge with the disputes they face and such cases might also affect their future lives in a negative way. In designing new schools and teacher trainings we are in need to consider these issues for the sake of the new generation. Peer mediation is a way to move from the past and walk to future, meaning that students dwell into their disputes solve in a positive way and open a new page for future relationships. Changing is not an easy job, especially in the government schools in implementing a new curriculum or a new subject. Change or re-developed curriculum takes a long time to be accepted and acknowledged by the authorities. Beliefs are fundamental assumptions that govern our set of actions, in other words they interpret how we see the world. More clearly, beliefs determine the priorities we build in our way of living which turns into our choices. Teacher beliefs are also very strong, rigid and hard to change and something new on
Journal for Educators, Teachers and Trainers JETT, Vol. 9 (2); ISSN: 1989-9572
101
the stage will light the fire. In other words, implementation of peer mediation into schools depends on teachers accepting and believing that it will be beneficial for them as well as for the students. Students’ wisdom relies on teachers’ way of conveying and explaining how and why they believe in what they believe and clearly explain to the students regarding the role of their beliefs in their daily routines. The importance of education depends mostly on developing beliefs, building values and performing constructive attitudes. Mission statements of the schools interpret their way of beliefs, values and visions for future generations’ education. Therefore, success of the implemented peer mediation program is in need of commitment which really depends on teachers, administrators and the other school staff (Bickmore, 2002). Furthermore, teachers’ philosophy in negotiating and mediating with skills in accordance with peer mediation within classroom and school are influential and effective (Thompson, Lewis, & Calkins, 2008). Teachers’ are the main role models of their students’ in the meaning that they inspire, and influence their student to build new skills and reach to their upmost potential (Azer, 2005). In order to expect students to resolve their disputes in a peaceful and constructive way there is a need to change teachers’ way of solving misbehaviour and classroom disturbances. Moving from this point, the peer mediation teacher in-service training program was implemented to enhance and empower teachers’ knowledge, beliefs and skills towards peer mediation. Empowering students, school administrators and school teachers with peer mediation will develop effective communication and build peaceful educational settings which will lead to community and nationwide change in a positive way (Adiguzel, 2015). The aim of the present study is to determine the effectiveness of the implemented peer mediation in-service teacher training program. More specifically, the study seeks to answer the following questions:
1- What are the changes in teachers’ beliefs towards peer mediation after the peer mediation in-service training program?
2- What are the teachers’ opinions about positive and negative sides of the peer mediation in-service training program?
3- What do the teachers think about the effects of scenario and activity based peer mediation training program regarding their profession?
2. Methodology The present study was undertaken to determine the effectiveness of the implemented peer mediation teacher training program. Qualitative method was used to collect data about teacher opinions regarding the effectiveness of the applied 40 hours peer mediation in-service training program. The participants of the study consisted of randomly selected 40 elementary school teachers serving in 10 different elementary schools from five different regions of North Cyprus. The data was collected by semi structured interview questions and content analysis method was used to analyse the data. 3. Procedure Peer mediation in-service training program was developed by the researchers. The developed program was based on social constructivism and the activities of the teaching–learning procedure were planned with scenarios for problem solving, cooperative learning and role playing. The 10 module program was applied twice a week which in total ended up with 40 hours training. The data was collected from 40 elementary school teachers after the implementation of 40 hour in-service training via recordings of the responds to semi structured interview questions. Seven questions was prepared for the interviews, however, during the interview session the interviewer forwarded extra questions either to clarify the respond or to enrich the data. The responds were transcribed and coded in relation with the aim of the research by two researchers in isolation.

Journal for Educators, Teachers and Trainers JETT, Vol. 9 (2); ISSN: 1989-9572
102
4. Findings The findings of the collected data of elementary school teachers after attending 40 hours peer mediation in-service training program are presented under three headlines in-parallel with the sub-aims of the study. 4.1. Changes in teacher beliefs regarding peer mediation Teacher opinions about the changes in their beliefs towards peer mediation were accepted as an important indicator for evaluating the effectiveness of the implemented peer mediation in-service training program. The findings of the teacher opinions regarding their peer mediation beliefs show teachers’ positive development. Teachers are seen to emphasize on becoming aware of injustice, dominant and advisory methods applied by them regarding students’ dispute cases. They stressed that they used these methods due to their lack of knowledge about peer mediation. Teachers’ way of handling disputes with classic discipline methods are seen to change by giving priority to individual emotions and feelings of their students. Moreover, teachers are seen to reflect on their inner instinct of democracy and justice. Having the opportunity to attend the in-service peer mediation training program their beliefs in handling disputes in a peaceful way is seen to be empowered. Even though, teachers’ beliefs were seen to be empowered by the in-service training program, teachers believed that still have a long journey ahead. Some of the related quotations are given below: “……..I’m trying to change ………………..yes, yes I’m changing”, “………………….instead of questioning why/how did it happen? I ask the disputants to express their feelings to each other………………… I forward questions like”what are your needs and priorities to solve this dispute?”.............................. (Recording: T13) ……………….”I used to believe that students could only be disciplined by the discipline rules…………..” I became aware of the importance of feelings, needs and individual requests during the in-service training”………………………..” to be honest it will take time to change our beliefs…………………” (Recording: T 20) “………………..I believed that I was fair, neutral and democratic…………………however, I became aware that I was putting forward my decisions, resolution options and advices during the dispute resolution procedures…………”I believe that this is due to my lack of knowledge about peer mediation and the lack of such programs in our education system………..(Recording: T 8) 4.2. Negative and positive sides of the peer mediation in-service training program The findings of the collected data about the opinions of teachers positive and negative sides of the implemented peer mediation in-service training program shows that the program was evaluated as positive. The positive and negative parts was looked upon as important due to evaluating the program and re-developing or implementing as a whole. Teachers’ opinions revealed that the content of the program and the activities as well as scenarios of the modules was constructive and attracted their interest. Teachers also stressed that the program was beneficial for individual and professional knowledge. Teachers stated that implementing peer mediation into school would affect the school environment in a positive way. In addition, they also stressed that the materials used in the activities were rather cheap and easily obtained because they were the kinds of things found at home and used in daily life like toothpaste and tooth brush in one of the activities. Therefore, the training program would not put a burden on the school budget which seems rather an important issue for the countries with poor budgets. Some important and related positive quotations are presented below. Creativity of the teachers regarding the dispute solutions can be the most desired change of the teachers taking part in this study. Anger control is another positive and important change and positive impact of the in-service training which is an important issue for burnt-out teachers. ………………”the content of the training, the instruction and the daily life scenarios enabled the sessions to be very interesting and effective”……………………….”especially the design and plan of the opening sessions were very constructive”………………… “we all had an opportunity

Journal for Educators, Teachers and Trainers JETT, Vol. 9 (2); ISSN: 1989-9572
103
to have a word at every opening to share our experiences about the disputes we faced and relate to our training knowledge”……………..” the discussions after each training sessions about the training content was very beneficial”…………………… (Recording: T 2) ………………..”the training was not only beneficial for my professional life it was also highly beneficial for my individual development as well”………………….”I think that if peer mediation program was implemented in my school it would have an important effect on the school environment”……………. (Recording: T 15) ………………..”according to me the training program was well designed and planned………………….”the materials used for the activities were easily accessed and rather cheap things”……………….”the effective communication activity materials like tooth paste and tooth brush used with A4 paper can be found in each and every house and students can obtain them very easily with no cost or with very little cost”…………………….. (Recording: T 29) ………………..”anger control, effective listening and problem solving materials were very basic and easily accessible as well as effective in a way it was related to specific dispute and its resolution”…………………………..” Creativity and value was added on to our individual knowledge”………………. (Recording: T 33). The negative opinions of the teachers were very important indicator like the positive opinions for the sake of the effectiveness of the in-service training program. The negative findings showed that the teachers wished that they had the opportunity to have peer mediation training at an early age, training program for some teachers serving in schools at distant regions, lack of peer mediation training in schools. This finding is looked upon as an important fact for future trainings in the meaning that teachers are seen to demand more opportunities in this context. A striking finding for the negative part of the training was put forward by participating teachers’, stating that some teachers are likely to have resistance regarding the implementation of the program. Some of the related quotations are as follows: ………………” the only negative thing is that I wish I had a peer mediation training at an earlier age”………………… (Recording: T19) ……………..” my school is located at a long distance from here……………………I had difficulties to come and go to my region”………………..”I had to skip my lunch to be able to make it”…………………… (Recording: T5) …………………..”I can’t find any negative part to comment on, however, when I think about implementing peer mediation program in my school I think there will be a resistance”………………..”I think peer mediation program should be implemented in every school and the lack of such programs is a big lost for our future”………………… 4.3. The effects of the peer mediation scenario and activity based in-service training program regarding teacher profession Opinions of the teachers regarding the implemented peer mediation in-service training program in terms of their professional development were important for the study. The opinions of the teachers towards this question aimed to determine the reflection and the degree of the contribution to their profession as well as evaluating the effectiveness of the implemented program on this issue. The analysis of the collected data revealed that teachers’ communication with the students was enhanced and their relation with colleagues was developed to a higher level. Furthermore, findings showed that teachers were in favour of the program to be implemented in their schools because they thought that it would improve teaching-learning processes at a long run resulting with higher academic achievements of the students. The findings also reveal that teachers pointed to the globalization of the world and mobilization of the individuals referring to the future generation needs of developing peaceful resolution attitudes, beliefs and skills. Teachers also stressed on the effectiveness of the program regarding resolving student-student, student-teacher and teacher-parent disputes where teachers spend too much time on such issues instead of spending on teaching-learning procedures.

Journal for Educators, Teachers and Trainers JETT, Vol. 9 (2); ISSN: 1989-9572
104
The analysis of the collected teacher opinions showed that the realized activities were defined as professional necessity and lifelong learning methods to be used. Teachers’ are seen to have benefited from the scenario and activity based in-service training program in the means of communicating with their students and colleagues and were willing to write their own scenarios from the real life dispute cases. Participant teachers’ also stated that they were willing and very enthusiastic to apply and practise these scenarios in their classes. Teachers thought that such practises are likely to empower social contribution and enhance social affective skills of their students. This finding is accepted as an important outcome of the training in teachers’ perspective of real life situations regarding disputes are mostly valued and accepted as meaningful. Another important finding commenting about positive criticizing manner during the in-service training program was very striking because teachers’ usually evaluated criticizing to be negative. Quotations regarding these findings are as follows. …………………..”if the in-service training was applied as theory by giving the standards and principles it would not have been as effective as being applied with scenarios and activities”…………………….”the real life scenarios and activities related to our profession and concerning general problems we are facing each were highly valued”………………”the applied activities and scenario themes concerning effective communication, anger control and effective listening skills gave an opportunity to evaluate our reactions”…………… “it also helped us to have awareness on such issues”…………………………”interestingly, I noticed the importance of positive criticism which gave me motivation”……………….. (Recording: T1) …………………”I became aware of the importance of problem solving, looking at disputes from different perspective, being aware that there are different options not only one, self-owned emotions, concentrating on cases not on individuals”……………………. “in-service training was beneficial”……………… (Recording: T33) ……………”according to me activities will not only enhance and empower dispute resolutions the in-service generally will develop lifelong skills which can be beneficial for future in daily life”…………………. (Recording: T3) ……………”we engage our students with activities in the teaching- learning processes from now on I will apply peer mediation activities into the content of my lessons at suitable parts”…………………. (Recording: T23) …………………..”this program should be implemented” ……………”highly beneficial”……………”interesting”…………….”especially the role plays and the activities were effective”…………………….”it was highly beneficial”……………. (Recording: T6 5. Conclusion and discussion The analysed opinions regarding teacher beliefs are seen to change after the implemented in-service peer mediation training in a way that applying strict methods and discipline rules and regulations in dispute incidents are dropped and effective communication, tolerance and empathy are adopted in parallel with the result that teachers lack of training makes the teachers act with indifference to problematic cases in schools (Irrirate et al., 2010). This gives a message that beliefs are refined and changes according individual experiences. Teachers usually copy or go after their idols like their former teachers in their student life or their colleagues in their professional life. Therefore, it is important to develop beliefs towards team work and pass it on to other stake holders in such programs like peer mediation. Generally, teachers are not aware of the strategies and methods that can be applied to prevent disputes turning worse (Stacy, 1996). Thus, teachers starting to put the learnt knowledge into practice reflect the positive development and effectiveness of the program. Personal change and change of others are possible with teachers facilitation (Ibarrola-García & and Iriarte, 2014). Teachers’ change of giving priority to students’ feelings, needs and encouraging them to express their own resolution options instead of giving punishment according to the degree of the disputes result indicates that there is a change. Therefore, training is necessary for belief formation in a sense that values and attitudes are developed in a positive way. Since students role for future is very looked upon as important then their set of beliefs and values need to be constructively built up. Moving from this statement, the entire fabric of education relies on the

Journal for Educators, Teachers and Trainers JETT, Vol. 9 (2); ISSN: 1989-9572
105
teachers’ professional development with enhancement of contemporary methods and innovative strategies. Student-teacher interactions play a big role on teacher beliefs (Koballa, Graber & Kemp, 2000). However, the result that changing beliefs is not easy can indicate that it will take some time, illustrating Prawat (1992), discusses that beliefs are strong and highly effective. Some studies also underline that teachers acceptance of peer mediation as a legitimate dispute resolution takes nearly 5 years (Cameron & Dupuis, 1991 ; Dowell, 1998) which is in parallel with the results of the present study that implementation of peer mediation program will be more beneficial and affective in the long run. Teacher opinion about the negative and positive sides of the implemented peer mediation in-service training results show that the program was evaluated as positive which indicates the effectiveness of the developed in-service training program. Teachers evaluated the program as constructive, interesting and beneficial for individual and professional development. Baskan (2001), study results as teachers’ in-service trainings enable their personal and professional development reflects the same result. Besides positive opinions rather minor negative opinions derived from the results which the distance of were the venue and questioning why this training was not implemented before which were not actually criticizing the program negatively but complaining about the opportunities. For understanding and fulfilling our potentials as social beings where these results indicate that teachers supported the implementation of the program. Scenario and activity based peer mediation in-service training results show that the applying peer mediation program into the schools are likely to contribute to students social skills development and reflect to teachers profession which will also contribute to the development of the community in future. Being creative and interactive in trainings are seen to be evaluated as more interesting than solely theoretical knowledge, teachers involvement in scenario writing and taking part in the interactive activities were seen to attract their attention and involvement. The latest century is demanding for changes to accomplish the needs of new era. Students are expected weave their own meanings about their world which will be formed by what they see and hear from their environment. Scenarios about real life situations can be interpreted as allowing a formal setting for students for having personal stories to weave their fabric accordingly. Therefore, Questioning, researching, problem solving and creative thinking skills of the individuals develops the community which also opens the way for national development, enhancement for new paradigms (Ozcan & Gunduz, 2015). Teachers’ responsibility for developing professionally according to contemporary changes and innovative methods of the latest generations are mostly appreciated and rewarded by the society. In other word, the education authorities and parents associations give credit and support in-service trainings. Furthermore, the participant teachers in this study were seen to be willing to practice peer mediation in-service program in a way that they was a full commitment to the program. The peer mediation activities and practice in scenario writing as well as role playing is seen to empower their skills and beliefs in peer mediations in the means of developing their attitudes towards peer mediation. George and Lubben (2002), argue that in-service trainings have positive changes in teachers’ social and professional lives. Seferoglu (2001) also discusses that sharing in-service experiences provides opportunity for elementary school teachers to develop their knowledge and skills for teaching. Quality in education is not evaluated just by looking at the useful things that the students have learnt. It is a matter of providing great teaching, fostering the magic of learning and building on to the students’ responsibilities. The world we live in today captures us into the web of meanings and the more international we become the more demanding the world becomes. Thus, there is an expectation that each student becomes and behaves like a good citizen, A good citizen is aware and are likely to know about options, take responsibility and fulfil their duties. Furthermore, great schools are aware of moral incarceration and plunges into educating their students about how they should become responsible citizens not only in their countries but in the whole universe. We can briefly state from the above facts about being a good citizen that peer mediation programs are highly valued for fulfilling these standards.

Journal for Educators, Teachers and Trainers JETT, Vol. 9 (2); ISSN: 1989-9572
106
In-service training of peer mediation program is new in developing countries and is also in need to be acknowledged more by the education authorities. Even though the present study reveals positive development of teachers and promises development regarding peer mediation practice there is still a long way to go to fulfil the necessary standards. Present study results of the implemented teachers’ in-service peer mediation program are believed to have a voice for future trainings. The results are considered to have positive impact on the professional development of the prospective teachers. The development of individuals starts informally at home and keeps developing with formal education in schools. Therefore, social and affective skills needed for students are mostly covered in the peer mediation programs. Furthermore, development of such beliefs, skills and attitudes should start at an early age, in a sense that parents and teachers should act as role models. Moving from this issue, teacher’s knowledge and skills for dealing with disputes in line with the parents’ knowledge and skills will develop students’ way of resolving disputes. Teaching and learning procedures are generally hindered by students’ unwanted behaviour and becomes hard to accomplish academic goals and objectives. Turnuklu, Kacmaz, Gurler, Turk, Kalender, Zengin and Sevkin (2010), study reveals that peer mediation trainings empower elementary school teachers’ dispute resolution skills, spares more time for the teaching-learning procedure and paves the way for academic success. The present study of the implemented in-service training is seen to have positive impact on teachers’ method of resolving disputes in teaching and learning procedures. The overall results indicate the need for such programs in developing social and affective skills which in the long run will enhance academic success. The lack of not reaching the targeted learning outcomes can be explained by the lack of such skills. Classroom settings are full of students unwanted disruptions and teachers classic discipline methods. However, the results of such incidents are not helping in any way to improve students neither social skills nor academic success. This also affects parents and teachers in a negative way. It can be stated that peer mediation training and practice in schools will turn this upside down in a sense that it will bring up the development of students both social and academic success. To summarize, teacher profession is not just transferring knowledge, it’s rather about dwelling into the significant side of the curriculum. To make it clearer it is about going into the depths of our aspirations. By doing this students’ are likely to form constructive and systematic set of beliefs and also develop social responsibilities. Therefore, we can say that in-service teacher training of peer mediation program will enhance teachers’ knowledge and skills and act as an agent for their student’s accomplishment on such issues. Moreover, students’ future development relies on developing a perspective about their world, constructing their own beliefs, acquiring contemporary and innovative knowledge and developing social skills. These can only be accomplished with prospective teachers, and this is an important reason for providing teachers’ with on-going trainings. The results revealed that teachers are demanding more opportunities for peer mediation trainings. It can be recommended for the National Education Board to implement either in-service programs or develop a curriculum for schools. Teachers’ regret of not attending such program at an early stage brings out another recommendation of implementing peer mediation programs as a fundamental course in the universities curriculum in the education faculties. This will be a good opportunity for future teacher candidates and future in depth studies will be able to indicate the advantages for the teaching-learning procedures in class room and school environments. It can also be recommended in future researches to have follow-up studies to evaluate the outcomes of the implemented program in the long run to determine the benefits for teachers’ professional development.

Journal for Educators, Teachers and Trainers JETT, Vol. 9 (2); ISSN: 1989-9572
107
6. References Acheampong, K. (2003). Teacher training in Ghana – does it count ? Multi- Site Teacher
Education Research Project. (MUSTER) Country Report One Sussex-UK. Adiguzel,I.B. (2015). Peer mediation in Schools. Procedia - Social and Behavioral Sciences 174
( 2015 ) 826 – 829 Azer, A. S. (2005). The qualities of a good teacher: how can they be acquired and sustained?
Journal of the Royal Society of Medicine. 98 (2), 67-69 Baskan, G. A. (2001). Öğretmenlik mesleği ve öğretmen yetiştirmede yeniden yapılanma.
Hacettepe Üniversitesi Eğitim Fakültesi Dergisi, 20(20) Bickmore, K., (2002). Peer mediation training and program implementation in elementary
schools: Research results. Conflict Resolution Quarterly, 20 (2). 137-160. Caena, F. (2011). Literature review quality in teachers’ continuing professional development.
European Commission, Director-General for Education and Culture. Cameron, J., & Dupuis, A. (1991). Lessons from New Zealand’s first school mediation service:
Hagley High School 1987–1989. Australian Dispute Resolution Journal, 2,84–92. Castelli, M.L. (2018). Aristotle: Metaphysics. Oxforf University Press: Oxford Da Silva, G., Ventura, M. M., & Garcia, M. D. P. Q. (2016). Emerging demands for public
policies in Rio de Janeiro: Educational prevention of social risks. Cypriot Journal of Educational Sciences, 11, 170–184
Daunic, A.P., Smith,W.S., Robinson, R.T., Miller, D.M., & Landry, L.K. (2000). School-wide Conflict Resolution and Mediation Programs: Experiences in Three middle schools. Intervention In School and Clinic. 36 (2), 94-100
Dowell, D. A. (1998). Guidelines for legislative language for state program evaluation. Retrieved January 15, 2018, from http://www.csulb.edu/~ddowell/guidelines.htm
García Laborda, J. (2018). 21st century Englısh prımary teachers and technology. Revısta Ibero-Amerıcana de Estudos em Educacao, 13(2), 741-747.
Garuba, A. (2004). Continuing education: An essential tool for teacher empowerment in an era of universal basic education in Nigeria. International Journal of Lifelong Education, 23 (2), 191-203
George, J., M & Lubben, F. (2002). Facilitating Teachers’ Proffesional Growth Through Their Involvement in Creating Context-Based Materials in Science. International Journal of Education Development. 22, (6), 659-672
Harris, D. N., & Sass, T. R. (2008). Teacher training, teacher quality and student achievement. Working paper 3. National Center for Analysis of Longitudinal Data in Education Research (CALDER)
Ibarrola-Garcia, S., & Iriarte, C. (2014). Socio-emotional empowering through mediation to resolve conflicts in a civic way. London Review of Education. 12, (3). 262-273
Iriarte, C., González-Torres, M., López de Dicastillo, N., and Sobrino, A. (2010) ‘Estudio de creencias, actitudesy actuaciones del profesorado en torno a la educación para la convivencia a través del cuestionario de “Competencia social para el profesorado”’. Revista de ciencias de la educación, 222 (2), 217–39
Koballa, T., Graber, W., Coleman, D. C. ve Kemp, A. C. (2000). Prospective gymnasium teachers’ conceptions of chemistry learning and teaching. International Journal of Science Education, 22, 209–224
McCarthy, C. J., Lambert, R. G., O’Donnell, M., & Melendres, L. T. (2009). The relation of elementary teachers’ experience, stress, and coping resources to burnout symptoms. The Elementary School Journal, 109, 282–300
Ozcan, D., & Gunduz, N. (2015) Evaluation of In-Service Training Programs of Associations. Procedia-Social and Behavioral Sciences. 191, 1028-1033
Prawat, R. S. (1992). Teachers’beliefs about teaching and learning: A constructive perspective. American Journal of Education, 100, 354–395
Seferoglu, S.S. (2001). Cagdas eğitim teknolojisi ve okulda etkin kullanımı. Yonetici adayları eğitim semineri: Ders notları, (73-96). Ankara: Hacettepe Üniversitesi, Eğitim Fakültesi
Shamir, A., & Tzuriel, D. (2004). Children's meditational teaching style as a function of intervention for cross-age peer mediation. School Psychology International, 25, 59–78

Journal for Educators, Teachers and Trainers JETT, Vol. 9 (2); ISSN: 1989-9572
108
Shriki A. & Lavy, I. (2012). Perceptions of Israeli mathematics teachers regarding their professional development needs. Professional Development in Education, 38(3), 411-433.
Stacey, H. (1996). Mediation into schools does go! An outline of the mediation process and how it can be used to promote positive relationships and effective conflict resolution in schools. Pastoral Care, 7-9
Thompson, R. A., Lewis, M. D., & Calkins, S. D. (2008). Reassessing emotion regulation. Child Development Perspectives, 2, 124–131
Turnuklu, A., Kacmaz, T., Gurler, S., Turk, T., Kalender, A., Zengin, F. ve Sevkin, B. (2010). The effects of conflict resolution and peer mediation training on Turkish elementary school students’ conflict resolution strategies. Journal of Peace Education. 7 (1), 33-45
Tzuriel, D., & Caspi, R. (2017). Intervention for peer-mediation and mother-child interaction: The effects on children's mediated learning strategies and cognitive modifiability. Contemporary Educational Psychology, 49, 302–323

Journal for Educators, Teachers and Trainers JETT, Vol. 9 (2); ISSN: 1989-9572
109
ISSN 1989 - 9572
Pre-service teachers' views on the use of social network sites
Opiniones de los profesores antes del servicio sobre el uso de los sitios de redes sociales
Semih Caliskan, Huseyin Uzunboylu,
Near East University, Turkey
Vasfi Tugun, University of Kyrenia, Turkey
Journal for Educators, Teachers and Trainers, Vol. 9 (2)
http://www.ugr.es/~jett/index.php
Date of reception: 09 October 2018
Date of revision: 02 December 2018
Date of acceptance: 28 December 2018
Caliskan, S., Uzunboylu, H. & Tugun, N. (2018). Pre-service teachers' views on the use of social network sites. Journal for Educators, Teachers and Trainers, Vol. 9(2), pp. 109 – 117.

Journal for Educators, Teachers and Trainers JETT, Vol. 9 (2); ISSN: 1989-9572
110
Journal for Educators, Teachers and Trainers, Vol. 9 (2) ISSN 1989 – 9572
http://www.ugr.es/~jett/index.php
Pre-service teachers' views on the use of social network sites Opiniones de los profesores antes del servicio sobre el uso de los sitios de redes sociales Semih Caliskan, Near, Near East University, Turkey, [email protected] Huseyin Uzunboylu, Near East University, Turkey, [email protected] Vasfi Tugun, University of Kyrenia, Turkey, [email protected] Abstract: The general purpose of the study is to determine pre-service teachers' views on the use of social networking sites. In line with the general purpose, answers to the research questions were sought. The answers to the following questions have been sought for to reach the general purpose. 1. Is there a significant difference in the intentions of pre-service teachers to use online social networks in their future professions between their departments? 2. Is there a significant difference in the effort expectancy of pre-service teachers for online social networks between their departments? The study was carried out in the spring term of 2016-2017. The study is conducted with a quantitative methodology and designed to determine pre-service teachers' intentions and effort expectancy on the use of online social networking sites for instructional purposes. In the study, Demir & Akbulut (2017) developed 5-point Likert type pre-service teachers' scale was used. A total of 108 volunteer pre-service teachers studying at the Faculty of Education participated in the study. The study was conducted during the spring term of 2016-2017. All students of the faculty of education participated in the study. The result of the study reveals that pre-service teachers' views on the use of social networking sites were high. It is also important to provide pre-service teachers with seminars on the use of technological platforms and smart devices; teachers should be supported by means of technology regarding the situations that may assist them in their daily lives and their education. Resumen: El propósito general del estudio es determinar las opiniones de los profesores antes del servicio sobre el uso de los sitios de redes sociales. En línea con el propósito general, se buscaron respuestas a las preguntas de investigación. Se han buscado las respuestas a las siguientes preguntas para alcanzar el propósito general. 1. ¿Hay una diferencia significativa en las intenciones de los maestros de pre-servicio para usar las redes sociales en línea en sus futuras profesiones entre sus departamentos? 2. ¿Existe una diferencia significativa en la expectativa de esfuerzo de los maestros de servicios previos para las redes sociales en línea entre sus departamentos? El estudio se llevó a cabo en el semestre de primavera 2016-2017. El estudio se lleva a cabo con una metodología cuantitativa y está diseñado para determinar las intenciones de los profesores antes del servicio y la expectativa de esfuerzo en el uso de los sitios de redes sociales en línea con fines educativos. En el estudio, Demir y Akbulut (2017) desarrollaron una escala de maestros de pre-servicio de 5 puntos tipo Likert. Un total de 108 profesores voluntarios de pre-servicio que estudian en la Facultad de Educación participaron en el estudio. El estudio se realizó durante el semestre de primavera de 2016-2017. Todos los alumnos de la facultad de educación participaron en el estudio. El resultado del estudio revela que las opiniones de los profesores antes del servicio sobre el uso de los sitios de redes sociales fueron altas. También es importante proporcionar a los profesores antes del servicio seminarios sobre el uso de plataformas tecnológicas y dispositivos inteligentes; Los maestros deben ser apoyados por medio de la tecnología en relación con las situaciones que pueden ayudarlos en su vida diaria y su educación. Keywords: Technology; Technology Acceptance; Pre-service Teachers; Technology Assisted Instruction; Social Networking Sites; Online Social Network Palabras clave: Tecnología; Aceptación de Tecnología; Maestros de Preservicio; Tecnología de Instrucción Asistida; Sitios de redes sociales; Red social online

Journal for Educators, Teachers and Trainers JETT, Vol. 9 (2); ISSN: 1989-9572
111
1. Introduction
Today, with the development of technology, information and communication technologies, online social networking sites are widely used (Özmen, Aküzüm, Sünkür & Baysal, 2011; Traxler, Barcena & Laborda, 2015; Ippakayala, El-Ocla, 2017). Along with the use of technology in daily life, the use of technologies that are preferred as models for instructional purposes by pre-service teachers increase every day (Garton, Haythornthwaite, & Wellman 1997; Magal Royo & García Laborda, 2017; García Laborda & Litzler, 2017). The benefits of social networking sites for pre-service teachers facilitate the process of transition from the era of information to the era of using information in education (Caliskan & Ozcan, 2017; Bicen & Uzunboylu, 2013; Tess, 2013). While internet applications are constantly updated online social networking sites sustain their most efficient period. Within this context, pre-service teachers communicate with their friends, view photos and posts, have a good time sending and receiving messages and access any desired information anytime (Greenhow & Askari, 2017; Abdugulova, 2017). Yavanoğlu & Sağıroğlu in their 2010 study define social networking sites as "means by which individuals use to communicate with people they can easily have rapport with at the same cultural level through internet communication methods and also means by which people can make social contacts in man-made virtual platforms through presenting symbolic actions that symbolize various gestures in normal social life". The use of social networking sites for instructional purposes and the transition process for technology in education, information communication and technology networks have brought different dimensions to the perspectives of pre-service teachers with regards to information (Solmaz, Tekin, Herzem & Demir, 2013; Aslan, 2016; Tur, Carpenter & Marin, 2017). Pre-service teachers who use networking sites for learning purposes have begun to place emphasis on social environments that are based on collaborative social environments in which they can have group work and use their opinions and skills (Salih & Hamarat, 2016; Baglama, Yikmis & Demirok, 2017). While technology provides these possibilities, Web 2.0 tools lead the pre-service teachers to carry socializing platforms and learn through updated communication technologies that can cater for their needs to the universe of internet (Uzunboylu, Hursen, Ozuturk & Demirok, 2015; Ozcan & Bicen, 2016; Lee, Baring, Maria & Reysen, 2017). Social networking sites are one of the platforms that emerged through the widespread use and advance of Web 2.0 technologies (Şen, 206). Web 2.0 tools that provide pre-service teachers with an efficient dimension to the education process with their easy-to-use structure, instructional interface and product range suitable for needs also calls for support for pre-service teachers to prepare materials themselves through combining information with technology and to implement them in education process (Atıcı & Yıldırım, 2010; Tugun, Uzunboylu & Ozdamli, 2017). In addition to these, social networks that are among the most effective dimensions of use for instructional purposes have great significance today and have become one of the indispensable resources of teachers in the education environment (Kaya & Yılayaz, 2013; Tezer & Ozcan, 2015; Tong & Bakan, 2016; Uzunboylu, Bicen & Vehapi, 2017). It is important that such topics are present in the literature so as to allow pre-service teachers who are described as future leaders and teachers to become more equipped, more open to learning and able to follow up innovations at all times. 1.1. Relevant studies In their study Özmen, Aküzüm, Sünkür & Baysal (2011) investigated the functionality of social networking sites in educational environments and pointed out to the necessity of extensive research for more effective use of social networking sites in the educational field through conducting necessary infrastructure works and encouraging teachers at every stage of education.

Journal for Educators, Teachers and Trainers JETT, Vol. 9 (2); ISSN: 1989-9572
112
In their study Ada, Çiçek, Gamze & Kaynakyeşil (2013) aimed to determine and analyze if the motivating factors to use online social networking sites differ with regards to demographic features. The results of the study reveal that motivating factors such as searching for information and connectivity differ by sex while factors such as searching for information, problem solving, content management and connectivity differ by the class levels of students. Other findings reveal that senior students of Business Department are more motivated to use social networking sites for the factors as searching for information, problem solving, content management and connectivity than university freshmen. In his study, Genç (2010) presents evaluations regarding the use of Web 2.0 technologies that are among the innovations of Web 2.0 technology in the field of education. For the application in the study; 3 undergraduate courses and 1 postgraduate course were selected. The results of the study reveal that the students have very positive thoughts about the application and have adopted Facebook as a learning tool as well as a social communication tool. In their study Ekici & Kıyıcı (2012) investigated the effects of social networks on learning through developing an application in Facebook social networking site. A total of 102 university students participated in the study. The students participated in the study are divided into two groups as experiment and control group. Achievement tests prepared by the researchers were employed. At the end of a 4-week application, the results revealed that the students in the experiment group are more successful academically than the students in the control group who received conventional instruction. 1.2. Purpose of the study The purpose of this study is to determine pre-service teachers' intentions and effort expectancy on the use of online social networking sites for instructional purposes. The answers to the following questions have been sought for to reach the general purpose.
1. Is there a significant difference in the intentions of pre-service teachers to use online social networks in their future professions between their departments?
2. Is there a significant difference in the effort expectancy of pre-service teachers for online social networks between their departments?
2. Methods This research is a single group and it is a quantitative study. While selecting the study group, simple sample selection was applied. All teacher candidates studying at a private university participated in the study. The study was applied to 108 pre-service teachers in 2016-2017 term. 2.1. Instruments “Online social networks for I-learning acceptance and use” scale: in order to get feedback from prospective teachers on determining the educational acceptance and use of online social networks of teacher candidates, a previously developed 5-scale Likert scale (Iron & Akbulut, 2017) was used. There are 4 dimensions on the scale developed by the authors. These are the use of online social networks for teaching purposes (10 articles), social impact (11 articles), intention to use (7 articles) and expectation of effort (8 articles). In the study, two dimensions from the relevant scale were used for the purpose. The dimensions used are the intention to use and the expectation of effort. The cronbach alpha value, which is the coefficient of validity reliability for the scale used is α =.93 is calculated by the authors who developed it. In the study, cronbach alpha value, which is the validity coefficient of the scale, is α=.Calculated as 96.

Journal for Educators, Teachers and Trainers JETT, Vol. 9 (2); ISSN: 1989-9572
113
2.2. Participants A total of 108 volunteer pre-service teachers studying at the Faculty of Education participated in the study. The study was conducted during the spring term of 2016-2017. All students of the faculty of education participated in the study. All teacher candidates who were enrolled in the study were selected by simple random sampling method and all teacher candidates who were enrolled in a private university were included in the study. The distribution of pre-service teachers by their departments is presented in Table 1. Table 1. The distribution of pre-service teachers by their departments
Department ƒ %
Psychological Counseling and Guidance 43 36.1
Special Education 29 24.4
Classroom Teaching 19 16.0
Computer Education and Educational Technologies 17 14.3
Total 108 100.0
As seen in Table 1, among the pre-service teachers in the study group; 36.1% (43 people) study at the department of Psychological Counseling and Guidance, 24.4% (29 people) study at the department of Special Education, 16.0% (19 people) study at the department of Classroom Teaching and 14.3% (17 people) study at the department of Computer Education and Educational Technologies. The distribution of pre-service teachers by sex is presented in Table 2. Table 2. The distribution of pre-service reachers by their sex
Sex ƒ %
Male 53 44.5
Female 55 46.2
Total 108 100.0
As seen in Table 2, the study group consists of 44.5% (53 people) male pre-service teachers and 46.2% (55 people) female pre-service teachers. The findings in the sex group reflect the real distribution of sexes.The distribution of pre-service teachers by age is presented in Table 3. Table 3. The distribution of pre-service teachers by their age
Age ƒ %
18-25 108 100
Total 108 100.0
As seen in Table 3, 100% (108 people) of the pre-service teachers in the study group are between the age group of 18 and 25. The findings in the age group reflect the real distribution of age. The distribution of pre-service teachers by their daily use of internet is presented in Table 4.

Journal for Educators, Teachers and Trainers JETT, Vol. 9 (2); ISSN: 1989-9572
114
Table 4. The distribution of pre-service teachers by their daily use of internet
Daily Use of Internet ƒ %
2-4 15 12.6
4-6 49 41.2
6-8 30 27.8
8 and More 14 11.8
Total 108 100.0
As seen in Table 4, among the pre-service teachers who participated in the study 12.6% (155 people) use the internet for 2-4 hours, 41.2% (49 people) use the internet for 4-6 hours, 27.8% (30 people) use the internet for 6-8 hours and 11.8% (14 people) use the internet for 8 hours and more daily. The distribution of pre-service teachers by their use of technological devices is presented in Table 5. Table 5. The distribution of pre-service teachers by their use of technological devices
Use of Technological Devices ƒ %
Smart Phone 51 45.0
Portable Computer 49 47.0
All 8 8.0
Total 108 100.0
As seen in Table 5, among the pre-service teachers who participated in the study 45.0% (51 people) use smart phones, 47.0% (49 people) use portable computers and 8.0% (8 people) use all of the technological devices. "Do you enjoy using technological devices?": The distribution of pre-service teachers by their answers to the question "Do you enjoy using technological devices?" is presented in Table 6. Table 6. The distribution of answers to the question "Do you enjoy using technological devices?”
Do you enjoy using technological devices? ƒ %
Yes 100 92.6
No 8 7.4
Total 108 100.0
As seen in Table 6, the distribution of pre-service teachers by their answers to the question "Do you enjoy using technological devices?" reveal that 92.6% (100 people) answered "Yes" and 7.4% (8 people) answered "No". This known that students benefit from technology for daily work, we can say that today's students enjoy the technology by looking at the table above. 3. Results In this section the results and discussion related to the findings to determine pre-service teachers' intentions and effort expectancy on the use of online social networking sites for instructional purposes are presented. One Way ANOVA Results Between Pre-service Teachers' Departments in Their Intentions to Use Online Social Networks in Their Future Professions

Journal for Educators, Teachers and Trainers JETT, Vol. 9 (2); ISSN: 1989-9572
115
In Table 7, One Way ANOVA conducted to determine the values with regards to the departments are presented in determination of the thoughts of pre-service teachers' intentions of using online social networks in their future professions. Table 7. One Way ANOVA results between pre-service teachers' departments in their intentions to use online social networks in their future professions
Department N Mean Rank SD X2
P
Psychological Counseling and Guidance 43 22.83 3 8.59 .818
29 22.78
ClassroomTeaching 19 21.79
Computer Education and Educational Technologies 17 22.73
As seen in Table 7, in the thoughts of pre-service teachers' intentions of using online social networks in their future professions there is no significant difference between the departments of pre-service teachers (χ2 (3) = 8.59; P=.818; P>0.05). The highest value between the departments in the thoughts of pre-service teachers' intentions of using online social networks in their future professions belong to the department of Psychological Counseling and Guidance while the lowest value belongs to the department of Classroom Teaching. The findings obtained reveal that there is no significant difference between the departments in the thoughts of pre-service teachers' intentions of using online social networks in their future professions and that the thoughts of pre-service teachers' intentions to use online social networks in their future professions are high. One Way ANOVA Results Between Pre-service Teachers' Departments in the Effort Expectancy of Pre-service Teachers for Online Social Networks In Table 8, One Way ANOVA conducted to determine the values with regards to the departments are presented in determination of the effort expectancy of pre-service teachers for online social networks Table 8. One Way ANOVA results between pre-service teachers' departments in effort expectancy of pre-service teachers for online social networks
Department N Mean Rank SD X2
P
Psychological Counseling and Guidance 43 26.04 3 44.600 .541
Special Education 29 23.55
Classroom Teaching 19 25.99
Computer Education and Educational Technologies
17 26.17
As seen in Table 8 there is no significant difference in the social effects of online social networks for pre-service teachers between the departments (χ2 (3)= 44.600; P=.541; P>0.05). The highest value in the social effects of online social networks for pre-service teachers between the departments belong to the department of Computer Education and Educational Technologies while the lowest value belongs to the department of Special Education. The findings obtained reveal that there is no significant difference between the departments in the social effects of online social networks for pre-service teachers and it may be inferred that the values for social effects of online social networks on pre-service teachers are high. 4. Conclusions The results of the study reveal that among the pre-service teachers who participated in the study 12.6% (155 people) use the internet for 2-4 hours, 41.2% (49 people) use the internet for

Journal for Educators, Teachers and Trainers JETT, Vol. 9 (2); ISSN: 1989-9572
116
4-6 hours, 27.8% (30 people) use the internet for 6-8 hours and 11.8% (14 people) use the internet for 8 hours and more daily. In light of the findings obtained the pre-service teachers mostly use the internet for 2-4 hours daily. Moreover 45.0% (51 people) of the pre-service teachers use smartphone, 47.0% (49 people) use portable computers and 8.0% (8 people) use all of the devices. The findings also reveal that the pre-service teachers mostly own smart phones. According to these values and findings it may be inferred that pre-service teachers mostly buy smart phones and mostly use internet for 2-4 hours during the day. In the light of the findings of the study while it is revealed that in the thoughts of pre-service teachers' intentions of using online social networks in their future professions there is no significant difference between the departments of pre-service teachers; the highest value between the departments in the thoughts of pre-service teachers' intentions of using online social networks in their future professions belong to the department of Psychological Counseling and Guidance and the lowest value belongs to the department of Classroom Teaching. The findings obtained reveal that there is no significant difference between the departments in the thoughts of pre-service teachers' intentions of using online social networks in their future professions and that the thoughts of pre-service teachers' intentions to use online social networks in their future professions are high. According to the results of the study and the answers given to the question "Do you enjoy using technological devices?", the distribution reveals that 92.6% (100 people) answered as "Yes" and 7.4% (8 people) answered as "No". In light of these findings it may be inferred that that pre-service teachers enjoy using technological devices and that they use these devices in their daily lives and that they are pleased. The highest value in the social effects of online social networks for pre-service teachers between the departments belong to the department of Computer Education and Educational Technologies while the lowest value belongs to the department of Special Education. The findings obtained reveal that there is no significant difference between the departments in the social effects of online social networks for pre-service teachers and it may be inferred that the values for social effects of online social networks on pre-service teachers are high. In line with the purpose of this study as to determine pre-service teachers' intentions and effort expectancy on the use of online social networking sites for instructional purposes, it is important that further research is conducted on the subject of "online social networking sites". It is also important to provide pre-service teachers with seminars on the use of technological platforms and smart devices; teachers should be supported by means of technology regarding the situations that may assist them in their daily lives and their education. 5. References Abdugulova Z. (2017). Allowing Schools Access to Affordable Computers. How Schools Can
Benefit From Switching to Inexpensive, Cloud-Based Computing Technologies. International Journal of Learning and Teaching, 9(3), 326-331. doi: https://doi.org/10.18844/ijlt.v9i3.507
Ada S, Çiçek B, Kaynakyeşil G. (2013). Çevrimiçi sosyalağ sitesi kullanımını etkileyen motive edici faktörler üzerine bir araştırma. In Academic Informatics Conference, Antalya.
Aslan S. (2016). The Views of University Students Regarding Internet Addiction. Contemporary Educational Researches Journal 6(3):88-94. doi: https://doi.org/10.18844/cerj.v6i3.992
Atıcı B. Ve Yıldırım S. (2010). Web 2.0 araçlarının e-öğrenmeyeetkisi. Akademik Bilişim 2010’da sunulan bildiri, Muğla Üniversitesi, Muğla, Türkiye.
Baglama B, Yikmis A, Demirok, MS. (2017). Special education teachers’views on using technology in teaching mathematics. European Journal of Special Education Research 2(5),120-134.
Bicen H, Uzunboylu H. (2013). The Use of Social Networking Sites in Education: A Case Study of Facebook. Journal of Universal Computer Science 19(5), 658-671.
Caliskan, S., & Ozcan, D. (2017). Determination of self- efficacy perceptions of special education teacher candidates towards computer course. Ponte, 73(6), 213-223.

Journal for Educators, Teachers and Trainers JETT, Vol. 9 (2); ISSN: 1989-9572
117
Ekici M, Kıyıcı M. (2012). Sosyal ağların eğitim bağlamında kullanımı. Retrieved on November 22, 2018 from https://www.researchgate.net/publication/305474168_Sosyal_Aglarin_Egitim_Baglaminda_Kullanimi_-_Using_Social_Networks_in_Educational_Context
García Esteban, S & García Laborda, J. (2018 Technology Based Reflective Practice in Primary ELT Teacher Education. Onomázein, 41, 78-94.
García Laborda, J. & Litzler, M.F. (2017). English for Business: Student Responses to Language Learning through Social Networking Tools. ESP Today5(1), 91-107.
Garton, L., Hayt hornth waite, C., & Wellman, B. (1997). Studying online social networks. Journal of computer-mediated communication, 3(1), JCMC313.
Genç Z. (2010). Web 2.0 yeniliklerinin eğitimde kullanımı: Bir Facebook. Eğitim uygulama örneği. Akademik Bilişim, 10:10-12.
Greenhow, C., & Askari, E. (2017). Learning and teaching with social network sites: A decade of research in K-12 related education. Education and information technologies, 22(2), 623-645.
Ippakayala VK, El-Ocla H. (2017). OLMS: Online learning management system fore-learning. World Journal on Educational Technology: Current Issues. 9(3):130-138
Kaya Z, ve Yılayaz Ö. (2013). Öğretmen eğitimine teknoloji entegrasyonu modelleri ve teknolojik pedagoji kalan bilgisi. Batı Anadolu. Eğitim Bilimleri Dergisi, 4(8):57-83.
Lee RB, Baring R, Maria MS, Reysen S. (2017). Attitude towards technology, social media usage and grade pointaverage as predictors of global citizen ship identification in Filipino University Students. International Journal of Psychology, 52(3): 213-219.
Magal-Royo, T. & Garcia Laborda, J. (2017). Multimodal Interactivity in Foreign Language Testing. In Deborah Dahl and Kazuyuki Ashimura (Ed.) Multimodal Interactionwith W3C Standards: Towards Natural User Interfaces to Everything. pp. 351-365. New York: Springer.
Ozcan D, Bicen H. (2016). Giftedness and Technology. Procedia Computer Science, 102: 630-634.
Özmen F, Aküzüm C, Sünkür M, Baysal N. (2011).. Sosyalağ sitelerinin eğitsel ortamlardaki işlevselliği. In 6th International Advanced Technologies Symposium (IATS’11) (pp. 16-18).
Salih USLU, Hamarat E. (2016). Sosyal bilgiler öğretmen adaylarının sosyalağları kullanım amaçlarının belirlenmesi. E-Kafkas Eğitim Araştırmaları Dergisi, 3(1): 26-35.
Şen, M. (2016). Teknolojik öğretim araçları ve özellikleri. Pegem Atıf İndeksi, 83-109. Solmaz B, Tekin G, Herzem Z, Demir M. (2013). İnternet ve sosyal medya kullanımı üzerine bir
uygulama. Selçuk Üniversitesi İletişim Fakültesi Akademik Dergisi, 7(4): 23-32. Tess, P. A. (2013). The role of social media in higher education classes (real and virtual)–A
literaturere view. Computers in Human Behavior, 29(5), A60-A68. Tezer M, Ozcan D. (2015). A Study of theValidity and Reliability of a Mathematics Lesson
Attitude Scale and Student Attitudes. Eurasia Journal of Mathematics, Science & Technology Education, 11(2):371-279.
Tong Y, Bakan M. (2016). A mobile visualization plat form for exploring social media data. Global Journal of Information Technology: Emerging Technologies, 6(1): doi: https://doi.org/10.18844/gjit.v6i1.386
Traxler, J., Barcena Madera, E & García Laborda, J. (2015).. Languagesonthemove. Journal of Universal ComputerScience 21(10), 1234-1247.
Tugun V, Uzunboylu H, Ozdamli F. (2017). CodingEducation in a Flipped Classroom. TEM Journal, 6(3): 599-606.
Tur G, Carpenter J, Marin VI. (2017). Comparing US and Spanish student teachers’ perceptions on social media. New Trends and Issues Proceedings on Humanities and Social Sciences, 4(1):538-543. doi: https://doi.org/10.18844/prosoc.v4i1.2297
Uzunboylu H, Bicen A, Vehapi S. (2017). The analysis of research problems regarding physical education lecture. Ponte, 73(5):244-259.
Uzunboylu H, Hursen C, Ozuturk G, Demirok M. (2015). Determination of Turkish University Students' Attitudesfor Mobile Integrated EFL Classrooms in North Cyprus and Scale Development: ELLMTAS. Journal of Universal Computer Science, 21(10):1283-1296.
Yavanoğlu U, Sağıroğlu Ş, Çolak İ. (2012). Sosyal ağlarda bilgi güvenliği tehditleri ve alınması gereken önlemler. Politeknik Dergisi, 15(1):1.

Journal for Educators, Teachers and Trainers JETT, Vol. 9 (2); ISSN: 1989-9572
118
ISSN 1989 - 9572
Training the creative competence of future teachers
Formando la competencia creativa de profesores de futuro
Amina Amirova, Abai Kazakh National Pedagogical University, Kazakhstan
Klara Buzaubakova, Zagira Kashkynbayeva,
Mirshat Yelubayeva, Taraz State Pedagogical Institute, Kazakhstan
Zhazira Kumisbekova, State Pedagogical Institute, North Cyprus
Uaidullakyzy Elmira, PhD Doctor, Almaty, Kazakhstan
Zeynep Genc,
State Pedagogical Institute, North Cyprus
Journal for Educators, Teachers and Trainers, Vol. 9 (2)
http://www.ugr.es/~jett/index.php
Date of reception: 09 October 2018
Date of revision: 04 December 2018
Date of acceptance: 28 December 2018
Amirova, A., Buzaubakova, K., Kashkynbayeva, Z., Yelubayeva, M., Kumisbekova, Z., Elmira, U. & Genc, Z. (2018). Training the creative competence of future teachers. Journal for Educators, Teachers and Trainers, Vol. 9(2), pp. 118 – 125.

Journal for Educators, Teachers and Trainers JETT, Vol. 9 (2); ISSN: 1989-9572
119
Journal for Educators, Teachers and Trainers, Vol. 9 (2) ISSN 1989 – 9572
http://www.ugr.es/~jett/index.php
Training the creative competence of future teachers Formando la competencia creativa de profesores de futuro Amina Amirova, Abai Kazakh National Pedagogical University, Kazakhstan
Klara Buzaubakova, Taraz State Pedagogical Institute, Kazakhstan Zagira Kashkynbayeva, Taraz State pedagogical Institute, Kazakhstan Mirshat Yelubayeva, Taraz State pedagogical Institute, Kazakhstan Zhazira Kumisbekova, State Pedagogical Institute, North Cyprus Uaidullakyzy Elmira, PhD Doctor, Almaty, Kazakhstan
Zeynep Genc, State Pedagogical Institute, North Cyprus
Abstract: The new realities of the world, of society and of the state make it necessary to reform the education system by taking into account newly emerging values. Kazakhstan has an objective necessity and a prerequisite for the further development of the national education system, the needs of the labor market and its integration into the world educational space. At the same time, the higher education system in Kazakhstan contains sufficient requirements for international education. The new approach to organizing the educational process into global practice is embodied in a competency-based teaching model. The need for its development in Kazakhstan in the context of profound organizational, structural and ideological transformations, updates the content of education, imposes increasing demands on the quality of training according to the stage of socio-economic and political development of the country. country and globalization. integration phenomena in the global educational space. A key figure in the field of education has always been and remains a teacher: - a competent specialist, who has all the arsenal of funds, a creative personality, who aspires to professional perfection and professional growth. The new conceptions of higher education are based on the targeted development of the creative potential of the future specialist. The most important social function of higher education is to train creative professionals capable of developing professional activities, to improve and not only to replicate the social experience in order to create new knowledge and values Resumen: Las nuevas realidades del mundo, de la sociedad y del estado hacen que sea necesario reformar el sistema educativo teniendo en cuenta los nuevos valores emergentes. Kazajstán tiene una necesidad objetiva y un requisito previo para un mayor desarrollo del sistema educativo nacional, las necesidades del mercado laboral y su integración en el espacio educativo mundial. Al mismo tiempo, el sistema de educación superior en Kazajstán contiene suficientes requisitos para la educación internacional. El nuevo enfoque para organizar el proceso educativo en la práctica global está incorporado en un modelo de enseñanza basado en competencias. La necesidad de su desarrollo en Kazajstán en el contexto de profundas transformaciones organizativas, estructurales e ideológicas, actualiza el contenido de la educación, impone demandas crecientes sobre la calidad de la capacitación según la etapa de desarrollo socioeconómico y político del país. País y globalización. Los fenómenos de integración en el espacio educativo global. Una figura clave en el campo de la educación siempre ha sido y sigue siendo un maestro: un especialista competente, que tiene todo el arsenal de fondos, una personalidad creativa, que aspira a la perfección profesional y al crecimiento profesional. Las nuevas concepciones de la educación superior se basan en el desarrollo específico del potencial creativo del futuro especialista. La función social más importante de la educación superior es formar profesionales creativos capaces de desarrollar actividades profesionales, mejorar y no solo replicar la experiencia social para crear nuevos conocimientos y valores Keywords: Innovation; Teacher preparation; Creativity; Innovative phenomenon; Pedagogical process Palabras clave: Innovación; Preparación docente; Creatividad; Fenómeno innovador; Proceso pedagógico
1 Corresponding authors.
Journal for Educators, Teachers and Trainers JETT, Vol. 9 (2); ISSN: 1989-9572
120
1. Introduction In the context of the transformation of Kazakhstan society due to the strategy of entering Kazakhstan in 50 most competitive countries in the world and demanding world labor market training becomes an actual problem of creative, professional mobile, competent professionals. An important requirement for the educational sphere in the society is to provide high quality education. In this aspect of education is defined as one of the key moments in the development strategy of Kazakhstan in the XXI century (Sulkarnayeva-Raphailova, 2017). Kazakhstani teachers, as their colleagues around the world, responding to the challenges of the XXI century, are actively searching for original approaches to the organization and development of the education system on a new methodological platform, the essence of which is to create conditions for students in the organizations “existing knowledge”, as knowledge, skills, experience, suitable for use in everyday life, in solving real problems of today (Tacman & Comunoglu, 2015; Beresova, 2016). Under the influence of the growing rate of changing ideas, ways of thinking, ways of life dramatically changed the place and role of education in society. International Commission on Education for the XXI Century, UNESCO pays special attention to four fundamental values of education: learning to live together, to acquire knowledge, learn how to work, and learn to live. We must learn to live together, developing knowledge of other countries and peoples, their history, traditions and way of thinking (Aerila, Ronkko & Gronman, 2016). On this basis, it is necessary to develop a new approach that is through awareness of the growing interdependence will lead to joint analysis of risks and challenges awaiting us in the future, and will enable us to carry out joint projects or come to a reasonable and peaceful solution to the inevitable conflicts (Demirok, Baglama & Besgul, 2015). XXI century will require learning to live, that is, greater independence and ability, combined with an increased personal responsibility within the framework of collective project. In learning should pay particular attention to the acquisition, updating and use of the knowledge gained. In this education must constantly adapt to changes in society, without neglecting the transfer achievements of human experience and knowledge (Ozcan & Katlav, 2016). The problem of increasing intellectual and creative potential of the country, improving the competitiveness of the nations more insistently pushed into the category of the most topical problems of modern Kazakh society. It is connected with the need to modernize of education in accordance with the new goals and objectives of the Development of Kazakhstan, as articulated in the Strategic Development Program “Kazakhstan – 2050”, “Concept of Education Development of Republic of Kazakhstan till 2015” and the “State Program of Education Development of Republic of Kazakhstan for 2011-2020 years”. Reliance on the education of society, the quality of human capital will allow Republic of Kazakhstan to take place on the world stage, enter the number of highly developed countries. In the Message to people of Kazakhstan "Kazakhstan's way-2050: The overarching goal, common interests, common future" President of Kazakhstan Nursultan Nazarbayev said:
"Our way of the future is linked to the creation of new opportunities for realizing the potential of Kazakhstan. Developed country in the XXI century is active, educated and healthy citizens. What we need to do for that? First, all developed countries have a unique quality educational system. We should work hard to improve the quality of all parts of national education".
One of the major problems is put forward improving education as a factor in the competitiveness of a nation in the world economic space. Therefore, the relevant problem of creation a national system of education, corresponding to modern requirements advanced market economies. Modern education in the age of information, relying more on the formation of creative personality with qualities that allow invent, make discoveries, originally to solve problems, to see

Journal for Educators, Teachers and Trainers JETT, Vol. 9 (2); ISSN: 1989-9572
121
the contradictions become the creator of your own life (Hosseini, 2016;). "Portrait" of the creative person is multifaceted; its characteristic features are:
Perception of the world as an open, multi-polar phenomenon, creative attitude to the world and themselves, openness to new experience (sphere outlook);
A variety of interests, desire for creativity, passion process of creative activity, creative activity (creative motivation);
The ability to associate, a sense of form, style and sense of humor, commitment to excellence, ability to improvise (creative aesthetic properties);
Emotional responsiveness, expressive emotionality (the ability to express the emotional content); empathy (the ability to emotionally spiritual attainment emotional world of another person), the richness of emotional experience (emotional and creative properties);
Ability to transformations, variability, thinking; ability to predict (intellectual and creative abilities);
Ability to produce images, integration of disparate elements into a single system image; spirituality real images and realistic unrealistic; going beyond the ordinary (departure from reality); ability to symbolize and visually imaginative presentation of ideas - the creation of the internal problems of the pictures (creative imagination);
Ability to work collaboratively in a creative activity (communicative and creative abilities).
Today in Kazakhstani society occurs the historical process of steady increasing the role of education. A key link of the modernization processes became high school education. The success of the reforms will depend, undoubtedly, the quality of teacher training rigor selection of personnel for teaching and the status of teacher. Therefore, the State Program of Education Development of Kazakhstan for 2011-2020 focuses on the process of preparation the teacher to satisfy needs of modern society. Occurring changes in educational system of Kazakhstan caused appearance of new ideas about the teacher of the modern school. Need a quality teacher for the new school: educator who not only give schoolchildren the new knowledge, but also teaches children to learn, organize the process and, most importantly, make knowledge itself interesting, attractive, and necessary throughout life (Danju & Uzunboylu, 2017). The meaning of modern higher pedagogical education is becoming a competent specialist capable to guide freely in complex socio-cultural circumstances, to act responsibly and professionally in rapidly changing conditions of science and education. competence model of teacher the new formation assumes the following important targets for the design of the educational process in high school:
- Student-oriented focus of the educational process; - Organic inclusion of the educational environment of the university in all kinds of life of
its subjects, leading to activation of the internal resources of the individual; - The development of the creative person professional development of students; - Focus on "competence" as "outcomes of education" with regard to market of
educational services and international trends; - Saturation of personal meaning and humanization of educational content.
The competence includes an individual's ability to independently find and use has already accumulated knowledge in different situations and walks of life, different from those in which they were acquired. In many investigations of creativity, the emphasis falls on the identification of psychological mechanisms of creative potential available to each personality but in different quantities and qualities. This problem occurs only in the difference in their level and degree of development and manifestation. In traditional psychology and pedagogy creativity was seen as a personal category, and disputes were largely about the clarifying of its interpretation, namely creativity as divergent

Journal for Educators, Teachers and Trainers JETT, Vol. 9 (2); ISSN: 1989-9572
122
thinking or intellectual activity or as an integrated personal quality (Uzunboylu & Kocakoyun, 2017). Each position of the scientist-reasoned and deserves more detailed recognition. However, in the professional pedagogy of higher school (Creative androgogics) insufficient to determine its qualitative indicators and basic levels of exposure. If creativity is understood only with one of the described positions then its problems is extremely impoverished and considered one-sided, especially it concerns Pedagogy of Higher Education, including the problems of education not only as a result-but also, and especially, as an organization to manage the creative process of training and education, during and the creativity in general. That's why today is so necessary to explore the possibility of developing personal of creativity as a category in the process of creative learning in education. From the above the conclusion is that by the end of the XX century - The beginning of XXI century the interest of researchers on the problem of creative associated with finding an answer to the question: Can creativity be massive and in what way? Besides the fact that creativity is studied as an activity, process or product, the greatest attention in science is paid for the creative abilities and their relation to intellectual. The problem of the relation of intellectual and creative abilities rises in a very large number of studies. These studies show that the intelligence and creativity have different bases and different functions in adaptation to the environment. An optimum variant is a combination thereof. This combination is the basis of creativity as a personal education. And the object should be the criterion and the development of creative abilities. They identified a large range of qualities that define the content of preparedness specialist for creative work, the conditions for its development. And while discussing the issue of readiness for professional creativity, all the authors proceed from the fact that it is the creative work is the highest measure of professionalism. Moreover, some of them trying to compensate the limitations of the procedural approach to this problem, introduced a special term - the professionalism of person. With its help the individual qualities are considered as an integral and carried out their professional activities. Before disclosing, the structure and content of creativity in the meaning that it will have in our work, we consider some of the approaches to the interpretation of the concept. According to Gilford’s point of view, the ability to create is multi dimensional and includes the ability to take risks, flexible thinking and quick thinking, imagination, perception of ambiguous things, high aesthetic values, and developed intuition (Mednick, 1962).Taylor as Gilford is risen creativity not as a single factor, but as an aggregate of different abilities, each of which can be represented in different degrees. These scientists are allocated 52 criterion of giftedness (Torrance, 1974; Ozcan & Genc, 2016). American psychologists: Torrance, Getzelts, Jakson conducted researches on children's creative abilities. For Torrance, the creativity is the ability to heightened perception deficiencies, gaps in knowledge, missing elements, disharmony, etc. Torrance proposed a model of creativity, which includes three factors: fluency (productivity), flexibility, originality. In this approach, the criterion of creativity is not the quality of the result, and the characteristics and processes that activate the creative productivity (Torrance, 1974). Renzulli has the same approach to understanding creativity. Creativity as the behavior of the person, expressed in the original ways to obtain the product, achievements and solve the problem, of new approaches to the problem from different perspectives. Mednick (1962) postulates that, in the basis of creativity is the ability to go beyond the stereotypical associations, work with a wide semantic field. He views creativity as a process redesign of elements in new combinations that meet the requirements of utility and some special requirements. This scientist developed a test outlying association reveals the ability of the test to the determination of appropriate associative connections (Mednick, 1962). In addition to theories that produce creativity as an independent phenomenon, there are views that deny the phenomena of creativity as such. Supporters of such approaches tend to look for explanations of the creative process or in high level of intelligence, or the difference between

Journal for Educators, Teachers and Trainers JETT, Vol. 9 (2); ISSN: 1989-9572
123
certain personality traits and especially motivation (Uzunboylu, Hursen, Ozuturk & Demirok, 2015). Indeed, it is impossible not to note the relationship of creativity with features of both cognitive and emotional sphere. Such a relationship exists. Referring to the research of cognitive components of creativity and creativity. So, many authors highlight the relationship of creativity with the peculiarities of perception. Barron, Dzhons, Kropley, Ligton etc. Considers perception mostly mental process governing creative activities. Identify the following features of perception characteristic of creatives: high sensitivity to stimuli subsensornym, the ability to perceive mistakes, deviations, unusual and unique properties of objects, the ability to notice the connection between the signs are not formally have this connection, the ability to perceive complex, is synthetic, noting importantly, the ability to see significant potential, not yet manifested, the ability to get rid of the fixed installation and constancy, have a "spontaneity of perception", to perceive yourself and impartially. It is noted that for the perception of the creative person have the greatest appeal vague, randomly-complex objects, from which the desired self-selected and meaningful, it is stressed that "perceptions in the material prepared for the future work of thinking and perception itself has all the primary characteristics of creativity" (García Esteban, & García Laborda, 2018; Garcia Laborda 2017). 2. Results Thus, in contrast to the rational, distinguishing the (a term other researchers more conscious, verbalized) holistic vision of the world and its direct perception largely determines the manifestation of creativity. Interconnection ways of perceiving and presenting the world with the creativity reflected in many studies. Closer in content leading research ideas submitted consideration creativity in four aspects:
The creative process,
Creative product,
Creative personality,
Creative environment (scope, structure, social context, shaping the product requirements of creativity).
In this regard, the theoretical analysis of Development Studies creativity reveals the following highlights: Creativity is the ability to adaptively respond to the need for new approaches and new products. This ability allows you to also be aware of the new into being, although the process can be both conscious and unconscious nature. Creating a new creative product depends largely on the personality of the creator and his strength of intrinsic motivation. Specific properties of the creative process, product and personality are their originality, consistency, validity, adequacy problem and another property, which can be called fitness - kinds of intelligence, it "corresponds with the shorter types of giftedness", and so, and creativity, as mean by intelligence view creative achievements. 3. Conclusions New views on higher education is the purposeful development of the creative competence of the future specialist. Today an important part of the educational process is the study of future teachers of creative activity, knowledge of its mechanisms and methodology, the formation of the skills necessary for it. In this regard, it requires the radical changes, both in the scheme of cognitive activity, as well as in the content, methods, and means of the learning environment, taking into account the psychological characteristics of the personality of each student. Therefore, it seems reasonable from the logical-historical positions to affirm the regular change of the traditional system to the personality-oriented education. It is based on the methodological
Journal for Educators, Teachers and Trainers JETT, Vol. 9 (2); ISSN: 1989-9572
124
principle that a student should become a subject of study. This means, it is necessary to take into account, first of all, his needs, motives, goals, abilities, activity, intelligence and other individual psychological features, as well as creative abilities. Personality-oriented education is based on the following principles:
1) Recognizes the priority of individuality, self-worth of the learner, which is initially a subject of the pedagogical process;
2) As much as possible directed towards the student’s need for self-realization, self-determination and self-development;
3) Higher education has a leading character, which is ensured by the formation of competence and the development of the creative qualities of the future teacher in the process of professional activity.
The priority of the higher education system of Kazakhstan is to achieve such a quality of specialist training, which will enable them to compete in the international labor market. From this point of view, the goal of training and education is the formation of creative competencies as an integral quality of a person, which will open up to a specialist the ability to generate new ways and types of activities, enter new professional fields for him, and in a short time will overestimate the direction of his work. Thus, the modern graduates of higher education should adapt to the conditions of a market economy, be flexible and mobile in their professional activities. He should be familiar with the latest technology, be able to use a computer, databases and data banks, summarizing all international experience. But most importantly, he must develop the features of a creative personality over the years of study at the university, develop the skills of an investigator, learn to think critically and find new ways to solve professional problems. The main task of higher education is to develop the ability to perceive and process new scientific ideas, analyze and apply them in conditions of independent professional activity. Higher education can remain effective in seeking the reserves of improvement in the very nature of knowledge, in methods of teaching and studying university courses of science. More than ever before, the tasks of vocational training come closer to the goals of personal development, the formation of the creative competence of the future teacher. 4. References Aerila, J. A., Rönkkö, M. L., & Grönman, S. (2016). Almost like us–getting familiar with another
historical period in a pre-school group. International Journal of Learning and Teaching, 8(3), 204-213.
Beresova, J. (2016). Teachers’ beliefs and students’ experiences regarding intercultural communicative competence teaching and learning. Global Journal of Foreign Language Teaching, 6(4), 177-186
Danju, I., & Uzunboylu, H. (2017). Analysis of gender stereotypes representations studies. Ponte, 73(6), 58-66.
Demirok, M. S., Baglama, B., & Besgul, M. (2015). A content analysis of the studies in special education area. Procedia-Social and Behavioral Sciences, 197, 2459-2467.
García Esteban, S & García Laborda, J. (2018). Technology Based Reflective Practice in Primary ELT Teacher Education. Onomázein. http://onomazein.letras.uc.cl/Articulos/N41/41_9-Garcia.pdf
García Laborda, J. (2017). 21st century English Primary teachers and technology. Revista Ensayos, 32(2), 1-7.
Hosseini, Z. (2016). The Potential of Directed Instruction to Teach Effectively Technology Usage. World Journal on Educational Technology: Current Issues, 8(3), 172-179.
Mednick, S. (1962). The associative basis of the creative process. Psychological review, 69(3), 220.

Journal for Educators, Teachers and Trainers JETT, Vol. 9 (2); ISSN: 1989-9572
125
Ozcan, D., & Genc, Z. (2016). Pedagogical Formation Education via Distance Education. Eurasia Journal of Mathematics, Science & Technology Education, 12(2).
Ozcan, D., & Katlav, S. (2016). Encountered problems by parents having children needing special education. Global Journal of Guidance and Counseling in Schools: Current Perspectives, 6(2), 30-34.
Tacman, M., & Comunoglu, N. (2015). Class Teachers' Expectations from Teacher Candidates from Three Points of Views. Cypriot Journal of Educational Sciences, 10(3), 282-293.
Torrance, E. P. (1974). The Torrance test of creativity thinking: Technical norm manual. Vol. III.–132 р.
Turalbayeva, A. T., Sultanbek, M., Utyupova, C. E., Aidarov, B. Z., Uaidullakyzy, E., Zhumash, Z., & Uzunboylu, H. (2017). The general preparation of the training of elementary school and the family and the education of gifted children school in cooperation principles. Ponte, 73(4), 239-251.
Utegenov, Y., Assanova, U., Kilybayev, K., Uaidullakyzy, E., Muzdybayev, B., & Danabekov, E. (2014). Formation of Information and Professional Competence of Primary School Teachers. Life Sci J, 11, 133-140.
Uzunboylu, H., & Kocakoyun, S. (2017). A content analysis of master and doctorate thesis in the area of gamification. International Journal Of Innovative Research In Education, 3(3), 143-154.
Uzunboylu, H., Hürsen, Ç., Özütürk, G., & Demirok, M. (2015). Determination of Turkish University Students' Attitudes for Mobile Integrated EFL Classrooms in North Cyprus and Scale Development: ELLMTAS. Journal of Universal Computer Science,, 21(10), 1283-1296.
Zulfija, M., Indira, O., & Elmira, U. (2013). The professional competence of teachers in inclusive education. Procedia-social and behavioral sciences, 89, 549-554.

Journal for Educators, Teachers and Trainers JETT, Vol. 9 (2); ISSN: 1989-9572
126
ISSN 1989 - 9572
The opinions of pedagogic formation students concerning the application of mobile devices and mobile communication applications in education Las opiniones de los estudiantes de formación pedagógica sobre la aplicación de dispositivos móviles y aplicaciones de comunicación móvil en la educación
Sezer Kanbul,
Near East University, Turkey
Journal for Educators, Teachers and Trainers, Vol. 9 (2)
http://www.ugr.es/~jett/index.php
Date of reception: 09 October 2018
Date of revision: 12 December 2018
Date of acceptance: 28 December 2018
Kanbul, S. (2018). The opinions of pedagogic formation students concerning the application of mobile devices and mobile communication applications in education. Journal for Educators, Teachers and Trainers, Vol. 9(2), pp. 126 – 137.

Journal for Educators, Teachers and Trainers JETT, Vol. 9 (2); ISSN: 1989-9572
127
Journal for Educators, Teachers and Trainers, Vol. 9 (2) ISSN 1989 – 9572
http://www.ugr.es/~jett/index.php
The opinions of pedagogic formation students concerning the application of mobile devices and mobile communication applications in education
Las opiniones de los estudiantes de formación pedagógica sobre la aplicación de dispositivos móviles y aplicaciones de comunicación móvil en la educación Sezer Kanbul, Near East University, Turkey [email protected] Abstract The purpose of this research is to examine the pedagogical formation students' views on the use of mobile devices and mobile communication applications for educational purposes. The universe of the study consists of all students who studies pedagogical formation at Education Faculty of Near East University in 2015-2016 academic year. The sample includes 391 students. The data were collected using “Educational Mobile Communication Applications Usage Scale” which was developed by Özçınar, Ekizoğlu & Kanbul. The study was conducted using relative screening model and employed Mann-Whitney U, t- test and Kruskal-Wallis test in determining the scores obtained by students from the entire scale and its sub-dimensions according to their age groups, mobile deice usage and employment of mobile communication applications in classes. In the end of the study, it was found out that students wanted to use mobile devices and mobile communication applications in classes, that their favorite application in daily life was WhatsApp application and that they chose “I agree” option in the entire scale and its sub-dimensions Resumen El propósito de esta investigación es examinar la opinión pedagógica de los estudiantes sobre el uso de dispositivos móviles y aplicaciones de comunicación móvil con fines educativos. El universo del estudio está formado por todos los estudiantes que estudian formación pedagógica en la Facultad de Educación de la Universidad del Cercano Oriente en el año académico 2015-2016. La muestra incluye 391 alumnos. Los datos se recopilaron utilizando la "Escala de uso de aplicaciones de comunicación móvil educativa", que fue desarrollado por Özçınar, Ekizoğlu & Kanbul. El estudio se realizó utilizando un modelo de detección relativo y empleó la prueba U de Mann-Whitney y la prueba de Kruskal-Wallis para determinar los puntajes obtenidos por los estudiantes de toda la escala y sus subdimensiones según sus grupos de edad, uso de dispositivos móviles y empleo. de aplicaciones de comunicación móvil en las clases. Al final del estudio, se descubrió que los estudiantes querían usar dispositivos móviles y aplicaciones de comunicación móvil en las clases, que su aplicación favorita en la vida diaria era la aplicación WhatsApp y que eligieron la opción "Estoy de acuerdo" en toda la escala y sus subdimensiones Keywords Mobile devices; mobile communication applications; WhatsApp; pedagogic formation Palabras clave Dispositivos móviles; aplicaciones de comunicación móvil; WhatsApp; formación pedagógica

Journal for Educators, Teachers and Trainers JETT, Vol. 9 (2); ISSN: 1989-9572
128
1. Introduction With the developing technology in the 21st-century societies are in need of individuals who can keep up with these developments, who can actively participate in this process and who can configure and adapt to these changes (Tezer, Ozden & Elci, 2016; Cinar, 2017; García Laborda, 2017). The American National Council for Accreditation for Teacher Education (NCATE, 2017), states that one standard that needs to be taken into consideration while training teacher candidates is to raise teachers who will be able to help support all students’ learning and learning taking place in schools. Fojtik (2017), also stated that use of mobile devices in education has increased in the world and there is a growing interest in the use of mobile devices for educational purposes. The demand for teachers in Northern Cyprus is met by the Teacher Training Academy (AOA, 2017) and from faculties of education in universities. Students receiving a pedagogical formation education will get their qualification after completing this programme (Ozcan & Bicen, 2016). It is expected that they include Information and Communication Technologies (ICT) in their classes in line with their students’ needs (Baglama, Yikmis & Demirok, 2017). ICT is the most important force affecting the rapid change in education (Prevalla, 2016; Uzunboylu & Karagozlu, 2017; Birkollu, Yucesoy, Baglama & Kanbul, 2017). The Pedagogical Formation Programme opened at Near East University is getting most of its applicants from Turkey. And this arises the necessity of mobile devices and mobile communication apps which can be used free of time and place constraints, whenever and wherever desired but also which are appropriate to students’ learning styles and strategies (Ozdamli & Tavukcu, 2016; Soykan & Ozdamli, 2016; Amor IAB., 2017; García Esteban & García Laborda, 2016). Nowadays, online communication is seen as the fastest growing and most rapidly spreading type of communication. The speed of development and the capacity of online communication has substantially affected communication in education. Educators who want to provide their students with a high-quality, well-supported, technologically rich environment are using mobile devices with improved accessibility and increasing apps (Uzunboylu, Hursen, Özütürk & Demirok, (2015), in education (Shunye 2014; Uzunboylu & Kocakoyun, 2017). Nowadays, instant messaging means have the features to move communication between people to a virtual environment. Mobile communication apps are a means of electronic communication which enable instant messaging as text or voice messages between two or more users in real-time via electronic devices. There are expressions such as “Instant Messaging (IM)”, “Mobile Messaging”, “Mobile IM”, “Mobile Chat”, “Messaging Apps”, “Mobile Messenger Apps” and “Mobile Communication Apps” in the literature. In this study, the expression “Mobile Communication Apps” was preferred as it covers all of the other expressions. Mobile communication apps which are compatible with many platforms and a variety of devices are used all over the world by millions of people because they enable real-time voice calls, face-to-face, and written communication free of charge (Bagriyanik, & Karahoca 2016; Statista, 2017; García Laborda, Magal Royo, Litzler, & Giménez López, 2014).
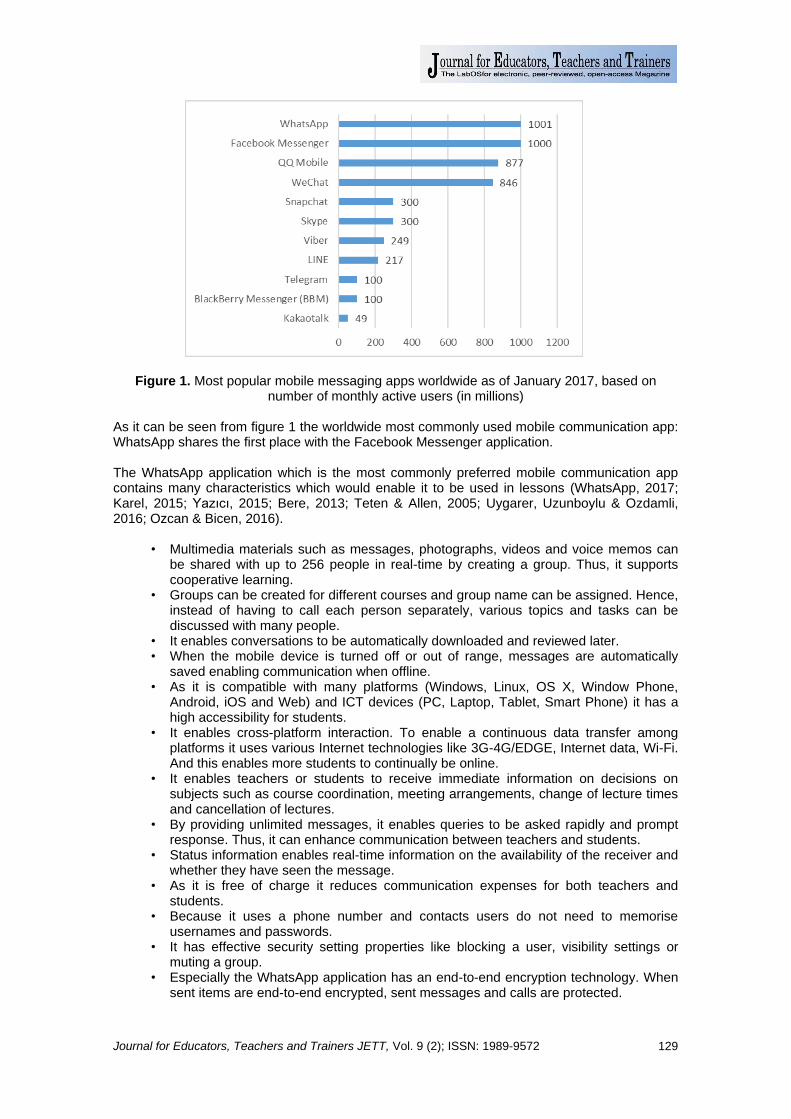
Journal for Educators, Teachers and Trainers JETT, Vol. 9 (2); ISSN: 1989-9572
129
Figure 1. Most popular mobile messaging apps worldwide as of January 2017, based on
number of monthly active users (in millions)
As it can be seen from figure 1 the worldwide most commonly used mobile communication app: WhatsApp shares the first place with the Facebook Messenger application. The WhatsApp application which is the most commonly preferred mobile communication app contains many characteristics which would enable it to be used in lessons (WhatsApp, 2017; Karel, 2015; Yazıcı, 2015; Bere, 2013; Teten & Allen, 2005; Uygarer, Uzunboylu & Ozdamli, 2016; Ozcan & Bicen, 2016).
• Multimedia materials such as messages, photographs, videos and voice memos can be shared with up to 256 people in real-time by creating a group. Thus, it supports cooperative learning.
• Groups can be created for different courses and group name can be assigned. Hence, instead of having to call each person separately, various topics and tasks can be discussed with many people.
• It enables conversations to be automatically downloaded and reviewed later. • When the mobile device is turned off or out of range, messages are automatically
saved enabling communication when offline. • As it is compatible with many platforms (Windows, Linux, OS X, Window Phone,
Android, iOS and Web) and ICT devices (PC, Laptop, Tablet, Smart Phone) it has a high accessibility for students.
• It enables cross-platform interaction. To enable a continuous data transfer among platforms it uses various Internet technologies like 3G-4G/EDGE, Internet data, Wi-Fi. And this enables more students to continually be online.
• It enables teachers or students to receive immediate information on decisions on subjects such as course coordination, meeting arrangements, change of lecture times and cancellation of lectures.
• By providing unlimited messages, it enables queries to be asked rapidly and prompt response. Thus, it can enhance communication between teachers and students.
• Status information enables real-time information on the availability of the receiver and whether they have seen the message.
• As it is free of charge it reduces communication expenses for both teachers and students.
• Because it uses a phone number and contacts users do not need to memorise usernames and passwords.
• It has effective security setting properties like blocking a user, visibility settings or muting a group.
• Especially the WhatsApp application has an end-to-end encryption technology. When sent items are end-to-end encrypted, sent messages and calls are protected.

Journal for Educators, Teachers and Trainers JETT, Vol. 9 (2); ISSN: 1989-9572
130
• It enables visually enhanced online interaction with voice and video calling properties. • With its e-mail and file sharing applications, it enables sending documents such as
PDFs, documents, e-tables and slideshows up to 100 MB without effort and these properties are continuously being updated.
Review of studies on mobile communication apps using WhatsApp: Bere (2012) in his study titled “Using mobile instant messaging to leverage learner participation and transform pedagogy at a South African University of Technology” conducted at a university in South Africa, students stated that they were able to communicate with their teachers and classmates easier and that this was a more fun environment. Plana and friends (2013) in their study “Improving learners, reading skills through instant short messages: A sample study using WhatsApp” conducted on students in Spain, determined that student motivation towards the target language increased and they were more willing to read in the target language. Similarly, Yaman (2016) in his study on the impact of using the WhatsApp application on course achievement in teaching Arabic as a foreign language in Turkey came to the conclusion that, WhatsApp was useful in language teaching in reading, writing, listening and speaking and especially while teaching vocabulary and sentences. However, Amry (2014) in his study “The impact of WhatsApp mobile social learning on the achievement and attitudes of female students compared with face-to-face learning in the classroom” compared the in-class face-to-face teaching model with the WhatsApp application. As a result, it was observed that the use of WhatsApp was effective. It is necessary that studies on the usage of mobile communication apps are emphasised and mobile communication app use in educational environments is varied according to the results obtained. Consequently, the problem statement of the study can be expressed as; what are pedagogical formation students’ views on using mobile devices and mobile communication apps for educational purposes? The sub-problem statements related to this main problem statement are as follows;
1. What is the distribution of pedagogical formation students’ according to their identifying features?
2. What is the distribution of pedagogical formation students’ according to their purposes for using mobile devices in their daily lives?
3. What is the distribution of pedagogical formation students’ according to their purposes for using mobile communication apps in their daily lives?
4. Is there a significant statistical difference according to pedagogical formation students’ overall and sub-dimension scale scores?
5. Is there a significant difference in the comparison of pedagogical formation students’ overall and the sub-dimension scale scores according to mobile device usage duration?
Is there a significant difference in the comparison of pedagogical formation students’ overall and the sub-dimension scale scores according to their mobile communication app use in courses? 2. Materials and method In this section, the model of the study, population and sampling, data collection tools, data collection and analysis will be discussed. 2.1. Research method This is a quantitative study designed by using a Survey Model which is one of the comparative investigation model. Survey Model is a research approach which aims to describe a past or present situation as it existed or exists Büyüköztürk (2014). Comparative investigation models are research models which aim to determine the existence of difference and the degree difference between two or more variables (Gall & Borg, 1999).

Journal for Educators, Teachers and Trainers JETT, Vol. 9 (2); ISSN: 1989-9572
131
2.2. Research sampling The sampling of the study consisted of 391 students studying pedagogical formation at the Faculty of Education at Near East University during the 2016-2017 academic year. 64,71% of the participants included in the sample of this research were female and 35,29% of them were male. 38,62% of the participants were 25 or under, 29,41% were between 26 and 29 years of age and 31,97% were 30 or above. 7,93% of the participants had been using a mobile device for 2 or fewer years, 9,72% of them for 3 to 4 years, 7,67% of them for 5 to 6 years, 11,00% of them for 6 to 7 years, 23,27% of them for 8 to 9 years and 40,41% of the participants had been using a mobile device for 10 years or more. When participants’ daily mobile device usage was examined it was identified that 5,63% used a mobile device for less than 1 hour, 36,57% used a mobile device 1 to 3 hours, 30,95% 4 to 6 hours and 26,85% used a mobile device more than 6 hours per day. 69,05% of the participants stated that they used mobile communication apps in their courses. Out of the participants who used mobile communication apps in their courses, 77,78% expressed they used mobile communication apps for communication purposes, 37,78% said they used them to ask their teachers questions and 64,81% stated that they used mobile communication apps to ask their classmates course related questions. 2.3. Data collection instruments The data for this study was obtained using the “Mobile Communication Apps for Educational Purposes Scale” developed by Özçınar, Ekizoğlu & Kanbul (2016). The scale has 33 items, and a 5-point Likert-type scale rating. The ranges are; “I strongly agree”, “I agree”, “I am undecided”, “I disagree” and “I strongly disagree”. The study has 4 dimensions which are: “Mobile Communication Apps”, “Use for Educational Purposes”, “Instant Communication” and “Instant Access to Information”. 2.4. Data analysis Data was collected online via a web-based survey management system called LimeSurvey (2017). The data obtained was analysed using SPSS 16.0 for Windows software. During the data analysis process; frequency (f), percentage (%), average (X) and standard deviation (SD) values were used as descriptive statistics. In order to determine which hypothesis tests would be used in the study, the dataset normal distribution consistency was examined with the Kolmogorov-Smirnov test and according to this test result, it was established that the dataset was not in consistency with a normal distribution. Hence, in the study, non-parametric hypothesis tests were used. In the comparison of the participants' scores received from the scale overall and from each sub-dimension depending on their mobile device usage and their usage of mobile communication apps in courses, the Mann-Whitney U test was used if the independent variable tick marks were two, and the Kruskal-Wallis test was used if it was more than two. 3. Results The study findings which support the objective and problem of the study, are explained in the related tables and figures.
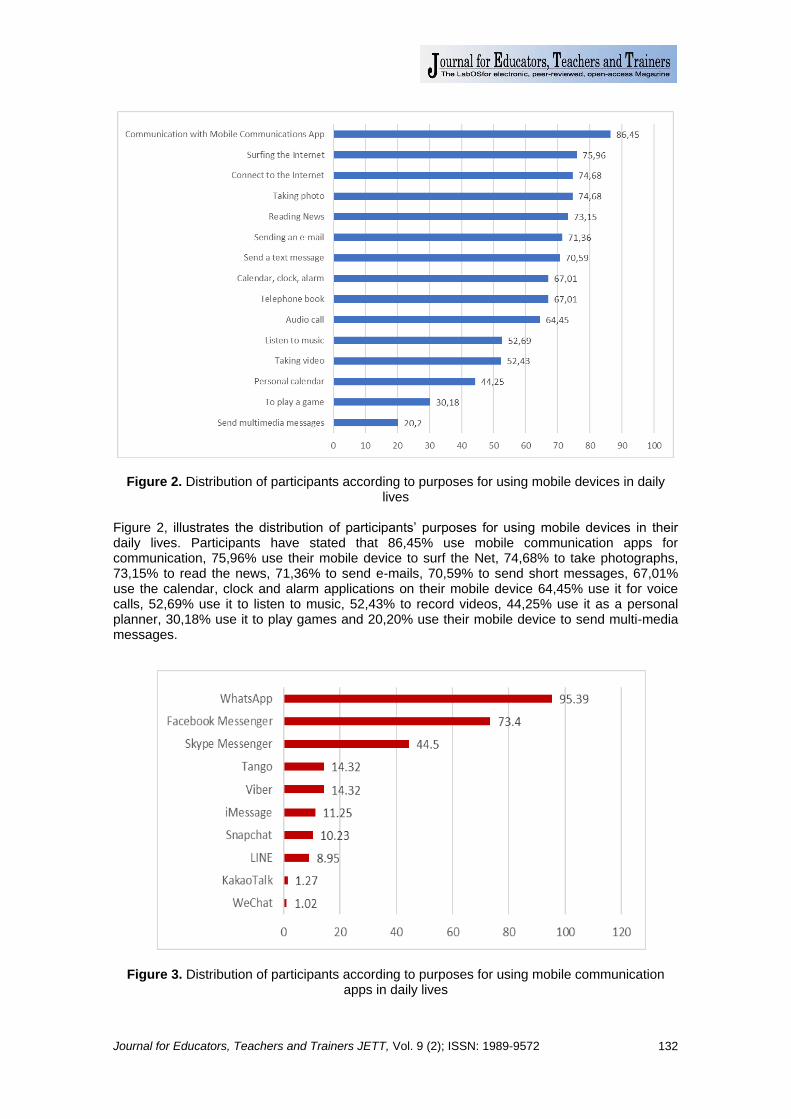
Journal for Educators, Teachers and Trainers JETT, Vol. 9 (2); ISSN: 1989-9572
132
Figure 2. Distribution of participants according to purposes for using mobile devices in daily lives
Figure 2, illustrates the distribution of participants’ purposes for using mobile devices in their daily lives. Participants have stated that 86,45% use mobile communication apps for communication, 75,96% use their mobile device to surf the Net, 74,68% to take photographs, 73,15% to read the news, 71,36% to send e-mails, 70,59% to send short messages, 67,01% use the calendar, clock and alarm applications on their mobile device 64,45% use it for voice calls, 52,69% use it to listen to music, 52,43% to record videos, 44,25% use it as a personal planner, 30,18% use it to play games and 20,20% use their mobile device to send multi-media messages.
Figure 3. Distribution of participants according to purposes for using mobile communication
apps in daily lives

Journal for Educators, Teachers and Trainers JETT, Vol. 9 (2); ISSN: 1989-9572
133
Figure 3, demonstrates the distribution of participants’ purposes for using mobile communication apps in their daily lives. 95,3% of the participants stated that they used WhatsApp, 73,4% Facebook Messenger, 44,5% Skype Messenger, 14,32% Tango, 14.32% Viber, 11,25% I Message, 10,23% Snapchat, 6,95% Line, 1,27% Kakao Talk and 1,02% of the participants stated that they used WeChat. Table 1. Descriptive Statistics of Overall and Sub-dimension Scale Scores
Sub-dimensions n Total Scores Item Scores
�̅� s Min Max �̅� s
Mobile Communication Apps 389 22,39 4,01 6 30 3,73 0,67
Use for Educational Purposes 390 16,29 3,41 4 20 4,07 0,85
Instant Communication 387 48,02 9,27 12 60 4,00 0,77
Instant Access to Information 391 45,73 8,97 11 55 4,16 0,82
Overall Scale 385 132,42 24,31 33 165 4,01 0,74
Students participating in the study generally replied as “I agree” scale wide to statements in the “mobile communication apps”, “use for educational purposes”, “instant communication” and “instant access to information” sub-dimensions, as seen in table 1. Table 2. Comparison of mobile device usage duration overall and sub-dimension scale scores
Sub-dimensions Mobile Device Usage Duration
n Median Mean Rank X2 p Difference
Mobile Communication
Apps
2 years or less 31 3,83 201,08 3,37 0,64
between 3-4 years 37 3,67 157,97
between 5-6 years 30 3,83 166,08
between 6-7 years 43 3,83 163,87
between 8-9 years 91 3,83 168,61
10 years or more 157 3,83 183,80
Use for Educational Purposes
2 years or less 31 4,00 178,85 13,58 0,02* 1-6
between 3-4 years 37 4,00 165,97 2-6
between 5-6 years 30 4,00 152,80 3-6
between 6-7 years 43 4,00 162,90 4-6
between 8-9 years 91 4,25 186,08
10 years or more 158 4,25 168,53
Instant Communication
2 years or less 31 4,00 168,27 11,38 0,04* 1-6
between 3-4 years 37 4,00 174,70 2-6
between 5-6 years 30 4,00 161,28 3-6
between 6-7 years 43 4,00 184,95 4-6
between 8-9 years 90 4,13 171,49
10 years or more 156 4,08 174,21
Instant Access to Information
2 years or less 31 4,09 167,08 18,91 0,00* 1-6
between 3-4 years 38 4,00 169,58 2-6
between 5-6 years 30 4,05 185,25 3-6
between 6-7 years 43 4,00 200,28 4-6
between 8-9 years 91 4,36 205,51
10 years or more 158 4,36 208,49
Overall Scale 2 years or less 31 4,00 201,71 13,76 0,02* 1-6
between 3-4 years 36 3,94 206,54 2-6
between 5-6 years 30 3,88 215,66 3-6
between 6-7 years 43 3,94 209,96 4-6
between 8-9 years 90 4,21 217,41
10 years or more 155 4,18 212,45

Journal for Educators, Teachers and Trainers JETT, Vol. 9 (2); ISSN: 1989-9572
134
It was determined that there was not a significant statistical difference (p>0,05) in participant scores obtained from the scale’s the sub-dimension “mobile communication apps” according to their mobile device usage duration, as seen in table 2. It was observed that there was a significant statistical difference (p<0,05) in participant score averages from overall scores and from the scale’s the sub-dimensions “use for educational purposes”, “instant communication” and “instant access to information” according to their mobile device usage duration. Participants who had been mobile device users for 10 or more years obtained higher scores from this sub-dimension compared to participants who had been mobile device users for 2 years or less, 3 to 4 years, 5 to 6 and 6 to 7 years. Table 3. Comparison of mobile communication app use in courses overall and sub-dimension scale scores
Sub-dimensions Using Mobile Devices in Courses
n Median Mean Rank Sum of Rank U p
Mobile Communication Apps
User 269 3,83 205,23 55208,00 13387,00 0,01*
Non-user 120 3,67 213,02 57515,50
Use for Educational Purposes
User 270 4,25 210,05 56083,00 11469,50 0,00*
Non-user 120 4,00 213,11 57538,50
Instant Communication
User 267 4,08 210,17 55906,00 11735,00 0,00*
Non-user 120 3,92 172,06 20647,00
Instant Access to Information
User 270 4,36 156,08 18729,50 11716,50 0,00*
Non-user 121 4,00 158,29 18995,00
Overall Scale User 266 4,21 157,83 19097,50 11259,00 0,00*
Non-user 119 3,94 154,61 18399,00
As shown in table 3 it was discovered that there was a significant statistical difference (p<0,05) in participant overall and sub-dimension scores obtained from “mobile communication apps”, “use for educational purposes”, “instant communication” and “instant access to information” according to their mobile communication app use in courses. Participants who use mobile communication apps in their courses obtained significantly higher scores than participants who did not use mobile communication apps in their courses. 4. Discussion and conclusion The aim of this study was to explore pedagogical formation students’ views on using mobile devices and mobile communication apps for educational purposes. Findings were discussed democratically including author interpretations and were explained in the light of the main ideas generated from these discussions. It was determined that out of the study participants 40,41% of them had been using mobile devices in their daily lives for 10 years or more. It was determined that the main usage of mobile devices were for using mobile communication apps, the Internet, reading the news, taking photographs, and sending messages. Moreover, participants stated that out of the mobile communication apps that they used WhatsApp application the most (95,3) and Facebook Messenger (73,4) followed this in second place. Similarly, in his study Yazıcı (2015) revealed that out of 129 students who used smartphones nearly all, 97,6% participants used the Whats app application, and Facebook Messenger followed in the second top place with 65,8% usage. It was established that 126 participants, used the Whats app application for a variety of purposes, and was regarded as a “simple communication” by 88%. Because the application is free of charge, with a 77,7% rate the “free messaging” feature came second. “Sharing photographs” came third with the rating of 76,9%, with 59,5% “group communication” and 55,5% for “chatting and fun” took the fourth and fifth place. The “giving and receiving information” feature was chosen by 44,4% of users.
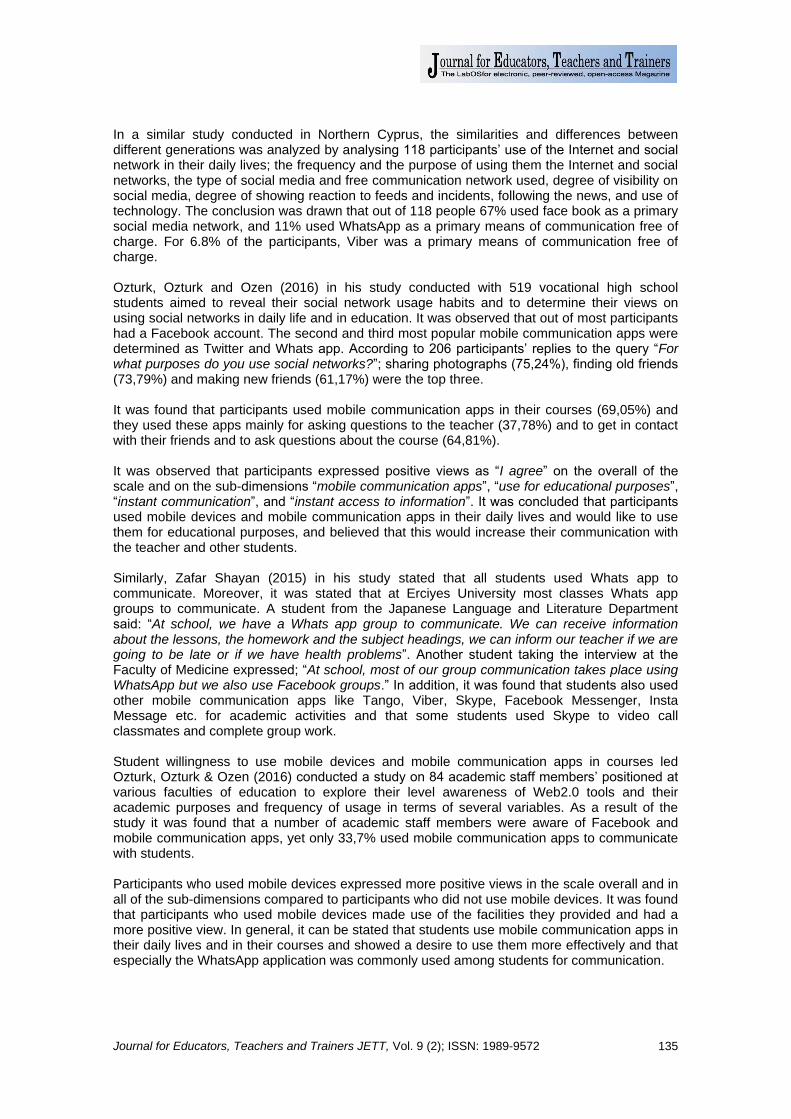
Journal for Educators, Teachers and Trainers JETT, Vol. 9 (2); ISSN: 1989-9572
135
In a similar study conducted in Northern Cyprus, the similarities and differences between different generations was analyzed by analysing 118 participants’ use of the Internet and social network in their daily lives; the frequency and the purpose of using them the Internet and social networks, the type of social media and free communication network used, degree of visibility on social media, degree of showing reaction to feeds and incidents, following the news, and use of technology. The conclusion was drawn that out of 118 people 67% used face book as a primary social media network, and 11% used WhatsApp as a primary means of communication free of charge. For 6.8% of the participants, Viber was a primary means of communication free of charge. Ozturk, Ozturk and Ozen (2016) in his study conducted with 519 vocational high school students aimed to reveal their social network usage habits and to determine their views on using social networks in daily life and in education. It was observed that out of most participants had a Facebook account. The second and third most popular mobile communication apps were determined as Twitter and Whats app. According to 206 participants’ replies to the query “For what purposes do you use social networks?”; sharing photographs (75,24%), finding old friends (73,79%) and making new friends (61,17%) were the top three. It was found that participants used mobile communication apps in their courses (69,05%) and they used these apps mainly for asking questions to the teacher (37,78%) and to get in contact with their friends and to ask questions about the course (64,81%). It was observed that participants expressed positive views as “I agree” on the overall of the scale and on the sub-dimensions “mobile communication apps”, “use for educational purposes”, “instant communication”, and “instant access to information”. It was concluded that participants used mobile devices and mobile communication apps in their daily lives and would like to use them for educational purposes, and believed that this would increase their communication with the teacher and other students. Similarly, Zafar Shayan (2015) in his study stated that all students used Whats app to communicate. Moreover, it was stated that at Erciyes University most classes Whats app groups to communicate. A student from the Japanese Language and Literature Department said: “At school, we have a Whats app group to communicate. We can receive information about the lessons, the homework and the subject headings, we can inform our teacher if we are going to be late or if we have health problems”. Another student taking the interview at the Faculty of Medicine expressed; “At school, most of our group communication takes place using WhatsApp but we also use Facebook groups.” In addition, it was found that students also used other mobile communication apps like Tango, Viber, Skype, Facebook Messenger, Insta Message etc. for academic activities and that some students used Skype to video call classmates and complete group work. Student willingness to use mobile devices and mobile communication apps in courses led Ozturk, Ozturk & Ozen (2016) conducted a study on 84 academic staff members’ positioned at various faculties of education to explore their level awareness of Web2.0 tools and their academic purposes and frequency of usage in terms of several variables. As a result of the study it was found that a number of academic staff members were aware of Facebook and mobile communication apps, yet only 33,7% used mobile communication apps to communicate with students. Participants who used mobile devices expressed more positive views in the scale overall and in all of the sub-dimensions compared to participants who did not use mobile devices. It was found that participants who used mobile devices made use of the facilities they provided and had a more positive view. In general, it can be stated that students use mobile communication apps in their daily lives and in their courses and showed a desire to use them more effectively and that especially the WhatsApp application was commonly used among students for communication.

Journal for Educators, Teachers and Trainers JETT, Vol. 9 (2); ISSN: 1989-9572
136
Below are some suggestions on study topics for further research which are believed to be a contribution to the literature:
• Courses in which mobile communication apps are used effectively and integrated into learning environments should be planned and scientific studies could be conducted.
• Information on teacher views on using mobile communication apps for educational purposes should be obtained and drawbacks of using these applications, if any, could be revealed.
• Content analysis studies could be conducted on studies about mobile communication app usage.
5. References Amor IAB. (2017) Email as a mode of communication among Tunisian postgraduate students.
International Journal of Learning and Teaching. 9(3):388-409. doi: https://doi.org/10.18844/ijlt.v9i3.2381.
Amry AB. (2014) The Impact of WhatsApp Mobile Social Learning on the Achievement and Attitudes of Female Students Compared with Face to Face Learning in the Classroom. European Scientific Journal. 10(22):116-136.
AOA. (2017) About the Academy. Retrieved from: http://www.aoa.edu.tr/page.aspx?id=124. Baglama B, Yikmis A. & Demirok, MS. (2017) Special education teachers’views on using
technology in teaching mathematics. European Journal of Special Education Research. 2(5):120-134.
Bagriyanik S. & Karahoca A. (2016) Personal learning environments: A Big Data perspective. Global Journal of Computer Sciences: Theory and Research. 6(2):36-46. doi: https://doi.org/10.18844/gjcs.v6i2.1474.
Bere A. (2012) A comparative study of student experiences of ubiquitous learning via mobile devices and learner management systems at a South African university. Proceedings of the 14th Annual Conference on World Wide Web Applications Durban. Retrieved from: www. zaw3.co.za.
Bere A. (2013) Using mobile instant messaging to leverage learner participation and transform pedagogy at a South African University of Technology. British Journal of Educational Technology. 44(4):544-561.
Birkollu SS, Yucesoy Y, Baglama B. & Kanbul S. (2017) Investigating the Attitudes of Pre-service Teachers Towards Technology Based on Various Variables. TEM Journal. 6(3):578-583.
Büyüköztürk Ş. (2014) The Data Analysis Handbook for Social Sciences’ Statistics, Research Method SPSS Applications and Interpretation (20. bs.). Ankara: Pegem Academy Press.
Cinar D. (2017) The Opinions of Teacher Candidates About the Use of Concept Cartoon in Science and Technology Teaching Courses. Contemporary Educational Researches Journal. 7(2):50-56. doi: https://doi.org/10.18844/cerj.v7i2.636.
Fojtik R. (2017) The Use of Mobile Devices in Education. New Trends and Issues Proceedings on Humanities and Social Sciences. 3(3):41-47. doi: https://doi.org/10.18844/gjhss.v3i3.1521.
Gall MD. & Borg WR. (1999) Appling educational research. New York: Longman. García Esteban, S. & García Laborda, J. (2016). Human communicative dialogic practices in
content and language-based educational interactions with technology. The Anthropologist, 25(3), 220-228.
García Laborda, J. (2017). 21st century English Primary teachers and technology. Revista Ensayos, 32(2), 1-7.
García Laborda, J., Magal Royo, T., Litzler, M.F. & Giménez López, J.L. (2014). Mobile phones for a University Entrance Examination language test in Spain. Educational Technology & Society, 17(2), 17-30. https://www.j-ets.net/ETS/journals/17_2/3.pdf
Karel. (2015) Instant messaging and status information. Retrieved from: http://www.karel.com.tr/sites/default/files/belge/doc/ucap/anlik_mesajlasma_durum_bilgisi_online.pdf

Journal for Educators, Teachers and Trainers JETT, Vol. 9 (2); ISSN: 1989-9572
137
LimeSurvey. (2017) Feature list. Retrieved from: https://www.limesurvey.org/about-limesurvey/features.
NCATE. (2017) About NCATE. Retrieved from: http://www.ncate.org/Public/AboutNCATE/tabid/179/Default.aspx.
Ozcan D. & Bicen H. (2016) Giftedness and Technology. Procedia Computer Science. 102:630-634.
Ozcan D. & Genc Z. (2016) Pedagogical Formation Education via Distance Education. Eurasia Journal of Mathematics, Science & Technology Education. 12(2):347-360.
Ozcinar Z, Ekizoglu, N. & Kanbul S. (2016) A study on developing a scale for determining the educational usage of mobile communication apps. Journal of Universal Computer Science. 22(1).
Ozdamli F. & Tavukcu T. (2016) Determination of secondary school students’ attitudes towards tablet PC supported education. Journal of Universal Computer Science. 22(1):4–15.
Ozturk SD, Ozturk F. & Ozen R. (2016) Teachers usage of social media tools for professional development. International Journal of Human Sciences. 13(1):7 – 21. doi:10.14687/ijhs.v13i1.3515.
Plana MGC, Escofet MIG, Figueras IT, Gimeno A, Appel C. & Hopkins J. (2013) Improving learners’ reading skills through instant short messages: A sample study using WhatsApp. 4th World-CALL Conference, Glasgow. 10-13.
Prevalla B. (2016) Ethical Perception of Information Technologies at Computer Science Faculties. Global Journal of Information Technology: Emerging Technologies. 6(2):129-135. doi: https://doi.org/10.18844/gjit.v6i2.886
Shunye W. (2014) A new m-learning system for higher education. Journal of Chemical and Pharmaceutical Research. 6(7):1301-1307.
Soykan E. & Ozdamli F. (2016) The Impact of M-Learning Activities on the IT Success and M-Learning Capabilities of the Special Education Teacher Candidates. World Journal on Educational Technology. 8(3). doi:http://dx.doi.org/10.18844/wjet.v8i3.1019.
Statista (2017) Most popular messaging apps Retrieved from: https://www.statista.com/statistics/258749/most-popular-global-mobile-messenger-apps/.
Teten D. & Allen S. (2005) The Virtual Handshake Opening Doors and Closing Deals Online. Retrieved from: http://www.thevirtualhandshake.com/free-book-download/ .
Tezer M, Ozden C. & Elci M. (2016) Examining the relationship between academic achievement and attitudes of the middle school students. Cypriot Journal of Educational Sciences. 11(4):203-212. doi: https://doi.org/10.18844/cjes.v11i4.1171.
Uygarer R, Uzunboylu H. & Ozdamli F. (2016) A piece of qualitative study about digital natives. Anthropologist. 24(2):623-629.
Uzunboylu H, Hursen C, Özütürk G. & Demirok M. (2015) Determination of Students’ Attitudes for Mobile Integrated EFL Classrooms in Higher Education Institutions and Scale Development. Journal of Universal Computer Science. 21(10):1283-1296.
Uzunboylu H. & Karagozlu D. (2017) The Emerging Trend of the Flipped Classroom: A Content Analysis of Published Articles between (2010) and (2015). RED. Revista de Educación a Distancia. 4(54):1-13.
Uzunboylu H. & Kocakoyun S. (2017) A content analysis of master and doctorate thesis in the area of gamification. International Journal of Innovative Research in Education. 3(3):143-154. doi: https://doi.org/10.18844/ijire.v3i3.1855.
WhatsApp. (2017) WhatsApp Features. Retrieved from: https://www.whatsapp.com/features/?l=tr
Yaman GS. (2016) The Use of ''Whatsapp'' in Teaching Arabic as Foreign Language. International Journal of Contemporary Educational Studies (IntJCES). 2(1): 37-47
Yazıcı T. (2015) Place of Interpersonal Communication in the Instant Messaging Application: A Study on College Students Relating to the Whatsapp Application. International Journal of Social Sciences and Education Research. 1(4):1334-1356.
Zafar Shayan Z. (2015) Students using the Internet in education: Erciyes University sample. Retrieved from: http://www.academia.edu/24512792/%C3%96%C4%9Frencilerin_%C3%96%C4%9Frenmede_%C4%B0nternet_Kullan%C4%B1m%C4%B1_Erciyes_%C3%9Cniversitesi_%C3%96rne%C4%9Fi
Journal for Educators, Teachers and Trainers JETT, Vol. 9 (2); ISSN: 1989-9572
138
ISSN 1989 - 9572
The opinions of teachers on primary school performance evaluation: case study in Nigeria, Benue State
Las opiniones de los maestros sobre la evaluación del desempeño de la escuela primaria: estudio de caso en Nigeria, Estado de Benue
Esen Sucuoğlu, Magdalene Hembadoon Peter,
Near East University, Turkey
Journal for Educators, Teachers and Trainers, Vol. 9 (2)
http://www.ugr.es/~jett/index.php
Date of reception: 09 October 2018
Date of revision: 24 December 2018
Date of acceptance: 27 December 2018
Sucuoğlu, E. & Peter, M. (2018). The opinions of teachers on primary school performance evaluation: case study in Nigeria, Benue State. Journal for Educators, Teachers and Trainers, Vol. 9(2), pp. 138 – 150.
Journal for Educators, Teachers and Trainers JETT, Vol. 9 (2); ISSN: 1989-9572
139
Journal for Educators, Teachers and Trainers, Vol. 9 (2) ISSN 1989 – 9572
http://www.ugr.es/~jett/index.php
The opinions of teachers on primary school performance evaluation: case study in Nigeria, Benue State Las opiniones de los maestros sobre la evaluación del desempeño de la escuela primaria: estudio de caso en Nigeria, Estado de Benue Esen Sucuoğlu, [email protected] Magdalene Hembadoon Peter, [email protected] Near East University, Turkey Abstract This current research examined the opinions of primary school teachers on the evaluation of primary school’s performance. A Quantitative analysis was used in the study. 200 questionnaires were administered to teachers from the selected primary schools using random sampling, but only 161 questionnaires were valid. The data collected were analysed using IBM SPSS version 21.0 and descriptive statistics to measure teachers’ opinions on performance in primary schools using four variables. The findings reveal that in assessing the performance of a child, the school should focus on gains or improvements in the child’s performance rather than simply attainment levels at a given point in time and that when a school adopt and implement a viable curriculum it enhances the performance of the school which means that the efficacy of the teacher is influenced by what to teach. And also making recommendation on how these problems can be solved Resumen Esta investigación actual examinó las opiniones de los maestros de escuela primaria sobre la evaluación del desempeño de la escuela primaria. Se utilizó un análisis cuantitativo en el estudio. Se administraron 200 cuestionarios a los maestros de las escuelas primarias seleccionadas utilizando un muestreo aleatorio, pero solo 161 cuestionarios fueron válidos. Los datos recopilados se analizaron utilizando IBM SPSS versión 21.0 y estadísticas descriptivas para medir las opiniones de los maestros sobre el desempeño en las escuelas primarias utilizando cuatro variables. Los hallazgos revelan que al evaluar el desempeño de un niño, la escuela debe enfocarse en los logros o mejoras en el desempeño del niño en lugar de simplemente alcanzar niveles en un momento dado y que cuando una escuela adopta e implementa un plan de estudios viable, mejora el desempeño. de la escuela, lo que significa que la eficacia del maestro está influenciada por lo que se debe enseñar. Y también hacer recomendaciones sobre cómo se pueden resolver estos problemas Keywords Teachers; Performance; Evaluation; Primary school; Students Palabras clave Profesores; Desempeño; Evaluación; Escuela primaria; Alumnos

Journal for Educators, Teachers and Trainers JETT, Vol. 9 (2); ISSN: 1989-9572
140
1. Introduction Recently the performance of many primary schools has not been promising. Diverse kinds of school management are being administered in Nigerian schools to ensure maximum performance in its educational system. In spite of the established methods put together to improve primary schools’ performance, it’s after effect has resulted in a down beat impression on its ability to be a tool for a nation’s development. This study seeks to examine the opinions of teachers on the evaluation of primary school’s performance bringing possible recommendation that will be used to solve its problems. Because of the expansion of primary school education in Nigeria, maintaining the standards of performance in primary schools has created more challenges in the educational sector. One of the effectiveness of evaluating performance in schools focuses on teachers’ opinions of the effect of performance in the school. Lustick and Sykes (2006) evaluation of the NBPTS established that if teachers that are involved in the certification process apply what they had learnt and believed in the classroom and their new-found enthusiasm for teaching and learning this will improve the performance in primary schools. 2. Related literature 2.1. The concept of teacher effectiveness Effective teaching lies in the value system of those who evaluate teaching and categorize it under good or bad. A good teacher should assist learners to do well in tests and examinations. In consonant with the foregoing, Akuezeuilo (1999) suggested that good teaching produces learning, that is, teachers can be evaluated by student performance. If students show signs of having learnt meaningfully, then the teacher can be said to be effective. In the words of Ezeocha (2001) the three domains in teaching- cognitive, affective, and technical components must be recognized by all teachers termed effective, so that learning can be presented through the use of a variety of activities. Wilson (2000) introduced the notion of “quality delivery” in teaching that has to do with a variety of objectives; whole class instruction, group activities and individual attention, and any teacher that is able to accomplish these objectives will be considered effective. There is a relationship between the teacher, the degree to which a teacher uses desirable skills in task performance and the level of student achievements in examinations. Teachers, in this respect, are seen as having innate tendencies for effective teaching which are further added to through training but a person who is born to be interested in working with people and who has personal characteristics such as patience, love for children, interest in helping others, a sense of humor, a pleasant personality, smartness, sympathy; alertness, good human relations, and emotional stability among others, will certainly be more effective as a teacher. Such attributes as skills in imparting knowledge, scholarliness, good judgment and professional ethics can be acquired through training. An effective teacher is thus born and made (Denga, 2002). Fordham (2003) recognizes two of categorized teacher tasks as instructional and managerial. The primary target of secondary schools is classroom teaching, with lecturing as its major characteristic, the use of which educationalists have criticized owing to its concentration on verbal presentation, not impacting the other senses and thereby not promoting meaningful learning. Teaching encompasses speaking and hearing for a better understanding. Alexander and George (2001) feels that many goals of teaching can be accomplished using a variety of methods, whole class instruction for basic skills, individualized instructions for individual responses, self-discipline and personal creativity, small group activities for group dynamics, learning to get along with others and enhancing citizenship and community spirit and individual attention to take care of student’s idiosyncrasies and to help them grasp topics covered in the curriculum contents.
Journal for Educators, Teachers and Trainers JETT, Vol. 9 (2); ISSN: 1989-9572
141
To assess student understanding, the use of continuous assessment and testing to evaluate students’ grasp of what has been learnt is very essential. These tests are varied and have various reasons for which they are conducted. Testing can be done orally, written or in laboratories to monitor student progress, to motivate or promote students, for guidance and counseling or to assess teaching. Orderliness in class helps the teacher discharge his teaching duties without hitches and in a calm atmosphere (Orseer, 2006). The bottom of all said about the duties of a teacher, is that an effective teacher is one who carries out these duties to the maximum and one whose students exhibit high learning outcomes in achievement tests. Various studies discovered that teacher effectiveness is related inborn features and those who lack these tendencies work hard to attain them for effective performance. 2.2. Performance evaluation Features or abilities of the student that are developed during a definite time of learning are termed as performance. The assessment of a student achievement reveals his\her involvement in accomplishing the institutional goals. An individual’s capacity can never be enhanced until he\she is provided with criticism for conduct. Responses have to be presented incessantly for curative actions and they must envelop equally positive and negative sides (Biswajeet, 2009). In an individual’s major development, education performs a significant part. It develops the effectiveness along with the output of each student so as to get a trained human resource that pilot the economy in the direction of a prolonged economic growth. The state of the educational structure is not encouraging in Nigeria like other growing countries. The pitiable performance of this segment can be foreseen as there is shortage of appropriate schooling supplies, small registration for membership at the primary level, insufficiency of qualified instructors, wide distinction amid areas and sexual category as well as pitiable groundwork. Every student performance in an institution is vital leading to the achievement of that institution. To realize an institutional objective, the assessment of capital is as well extremely significant. As major priceless and complex source of an institution is human resource, likewise it is central that the institution carries out a performance evaluation which is necessary and difficult (Toppo, 2012). In this present day to picture education without employing performance pointer is a means of organizing as well as developing the educational performance in schools. Performance evaluation pointers recognize styles as well as support modification. Various methods are employed by leaders to gather information on the implementation of educational structure. Present type of performance evaluation, has beginnings in consideration for poor performance in education in a progressively viable international economic situation (Ozga, 2003). The outcome illustrated in other levels of education, the classic techniques of performance evaluation do not work out well. So, the forms and techniques of the performance evaluation methods need to be enhanced towards the requirement and expectation of the institutional structure and ought to be pursued by introducing the method that agree to a procedure of methodical modification and conversion of the institution (Mapesela & Strydom, 2004). Sarwar (2010) stated that there were numerous issues likely to influence student performance particularly by untrained instructors. These issues are overload, indefinite profession sketch, be deficient of teaching knowledge, ability to sustain classroom control, severe assessment, learner analysis, appraise student effort, insufficiency of resources and slightest prospect for the teaching profession. Rasheed, Sarwar & Aslam (2011) carried out a study on performance evaluation of students in schools. The conclusion of the investigation recommended that through identifying, response, performance appraisal meetings and partaking in performance plan are some of the significant features that enhance the value of the structure and also its footprints on students. Results also

Journal for Educators, Teachers and Trainers JETT, Vol. 9 (2); ISSN: 1989-9572
142
show that administrators (teacher) role on the performance of students, gaining excellent outcome and enhancing their abilities is extremely significant. Consequently, the teacher ought to be an expert in performance appraisal so as to be able to perform performance appraisal to it standards. 2.3. The school administrative system Educational administration according to Odo (2006) is an aspect of broad spectrum of administration, seen as the mobilization of all the personnel and equipment in schools for the realization of educational objectives, Okoro (1991) identified the functions of administration as consisting of two major components – leadership and management. The educational leader is expected to supply initiative and direction to the school community in order to further the educational objectives of the school. Walton (1991), in expatriating on the functions of educational administration posited that it has to do with how school processes are run, such as recruitment of workers, planning of school funds, giving guide to the activities of all the workers in the school, and inspecting performance of schools. In consonance with the forgoing Odo (2006) see educational administration as a discipline that deals with the management of educational enterprise in communities, regions and nations. Nwaogu (1980) observed that the meaning of educational administration lies in how well existing factor resources are handled for the achievement of educational objectives, being that resources like personnel (manpower). Finance and capital equipment would ensure the effective administration of educational institutions and the achievement of the desired goals for the establishment of those institutions. Okoro (1991) posits that since school heads know the working conditions of their schools better than any person, they should participate actively in the choice of their staff. They should ensure that their workers receive upgrading services regularly, as well as enjoy favorable conditions of service. Heads of schools should be mindful of the qualities of workers selected for the successfully running of the school depends to a great extent on the caliber of workers selected by the principal. The principal also co-ordinates the activities of various units within the school, interrelating them to function for a common purpose, in what may be termed division of labour. Edem (1998) advices that head of schools have their own individual ways of regulating, curbing and checking the excesses of members of staff in order to accomplish set educational objectives. 2.4. Learning process and performance Educational attainment of student particularly at the basic school level is not merely an indicator to the efficiency or inefficiency of schools. The effect of education holds an observable fact that has drawn the attention of many, because these researchers are up and working vigorously to straighten out features that have an effect on the excellent performance in schools (Aremu & Sokan, 2002). Adeyemo (2001) believed that the foremost target of any school is to toil in the direction of achievement of educational distinction via the students. He also said that, schools could have various secondary goals but permanently highlight is positioned on the success of firm learning. Moreover, practically every person alarmed with education focused on the quality of educational attainment. Outstanding accomplishment by children over and over again is the hope of every parent. The major reason of teaching at all stage of education is to convey a basic transformation in the student (Tebabal & Kahssay, 2011). To smoothen the learning process, the application of suitable teaching technique that will be in line with the defined intent along with the result should be applied by the teachers. Findings on teaching with learning persistently aspire to assess the degree to which distinct teaching technique improves student learning. To a certain extent, surprisingly constant low-grade performance in academics by large number of students basically associated with the implementation of unproductive teaching technique by teachers in

Journal for Educators, Teachers and Trainers JETT, Vol. 9 (2); ISSN: 1989-9572
143
passing on information to students (Adunola, 2011). Considerable studies on the efficiency of teaching process point out that the value of teaching is frequently mirrored by the success of students. As stated by Ayeni (2011) teaching is a procedure that requires establishing profitable transformation in learners to enable to attain a particular end result. Adunola (2011) affirmed that for the teaching techniques to be effectual teachers are required to be acquainted with the several teaching tactics that identify the enormity of the involvement of the idea that needs to be considered. Bharadwaj& Pal (2011) maintained that teaching techniques work efficiently when they are best complimenting what is required by the learner because each learner understands and acts in response to issues in a distinctive way (Chang , 2002). In which case, positioning of teaching techniques with what is required by students and also the students preferred methods affect the learner’s educational achievement (Zeeb, 2004). 2.5. School curriculum and implementation Curriculum is either written or taught. The former is a document (or set of documents) known as a syllabus as well as accompanying instructions. The taught curriculum is used predominately to encircle the entire learning as well as teaching involvement, which includes the learning surroundings and conditions, education as well as appraisal strategy. The international baccalaureate at first instance embraced the assessed component, which is now known as the academic curriculum. Fiala (2006) drew special attention to the connections, and breach, surrounding what he calls the purposed, approved as well as effective curriculum. Whatsoever style that are used, the accomplishment or contrasting of each penned curriculum hinge on the way it is imparted as well as how it will be appraised, fundamentally, in what and by what method the children will be taught. The penned curriculum is one of the numerous “propellers” on what is taught, the methods used in teaching the children and how these children learn as well. Baker and Wiseman (2005: ix), stipulated that, regulations are frequently watered down by regulation executives or neglected by classroom teachers. Fullan (1991:117) stated that educational modification built upon the activities of the teacher, is so easy as well as complicated. This brings to light the outstanding role of enlightenment of the teacher and persisting in skill development. Alexander (2010) stated that the outcomes from curriculum styles are consistently motivated by political concerns instead of basing it on clear cut goals. He established that curriculum styles should begin with a clear goal and code so that guidelines and procedures can be agreeable with these; and that “educational goals”, notwithstanding personal manifest or influential they possibly will appear, exist in by their personality in the domains of standards along with assumptions. This final position makes reference to the necessity to train children mutually for the current as well as the prospect which is (essentially) incomprehensible. The goals of primary education are frequently perceived in straightforward language. Hitherto, Eaude (2012) stipulates that schooling have numerous objectives, by means of these, particularly in the prime years, extended- rather than immediate. Giving example, as the basis of primary education is often on hand as ascertaining the fundamentals, the majority of the control adopt the education of the entire child as well as characteristic such as individual privileges and nationality. Education is well planned on the foundation of the curriculum. The significance of the connection linking curriculum along with teaching ought to be underlined. The curriculum, as claimed by Denga (1993) that Curriculum has objectives along with three inquiries that go prior to initiating the curriculum; what should be learnt? What is supposed to be the classification to which it is made of? How learning is to be assessed? For that reason, the scope, extent and profundity of what the curriculum should contain along with-it regulations. The effectiveness of the teacher is subjective to what to teach. Aboho (2000) stated that all high-quality teaching is supposed to start with an all-inclusive and attainable curriculum

Journal for Educators, Teachers and Trainers JETT, Vol. 9 (2); ISSN: 1989-9572
144
objective. The main reason for the teaching ought to be stated out, taking all levels of education into consideration. The suggestion of a textbook, for example, in a subject like Mathematics, will not meet the requirements with no direction/ manual pointing out vital matters in the subject. Ada (2000) and Gbamanja (2002) stipulated that the significance of what a curriculum contains is supposed to be an additional point to consider. They stipulated that the course the theme of which is a sign of student’s surroundings, life encounters as well as prospect along with goals gives a highlight on students concern and sense to learn. Ada (2000) stated that learners might not interrupt teaching observing that attention-grabbing, applicable and useful. Nevertheless, it is possible that they interrupt a teaching when it is uninteresting and not easy to comprehend. Furthermore, Aboho (2000) accepted as true that fascinating and applicable curriculum smoothens the progress of teaching and trims down tediousness along with dissatisfaction for the learner and teacher. He added that an old-fashioned curriculum is inappropriate, unexciting and unconnected to learner’s ethnicity and expectations which create misconduct that interrupt teaching. More often the theme in the course book also reckons with that in the curriculum. The efficiency of the instructor rises when he is in touch with the course book together with an instructor’s book in addition to learner’s course book. In Nigeria, mainly in Benue State, schools experience shortage of materials to run experiment and coursework. The learner’s course book makes possible uninterrupted appraisal and research. For the most part, selection of books is carried out by people who are not academically sound, typically politicians. Such workbooks repeatedly lack the essential criteria measures (Ada 2000). The existence of a central instructional material is very significant. These are chalk, paper, pens, pictures, maps, charts, posters and illustrations, in the lack of which instructors teach the class not writing on the board. Some choose to give an undersized assessment that fall short of the course outline giving an explanation that there are no writing materials. Such limitations consistently decrease the instructor’s efficiency. In setting up the curriculum, the succession, the scope, or arranging of learning experiences ought to be cautiously measured. 3. Method Quantitative method was used to have validity and reliable data, which is acquired from a specimen rather than the whole population at a particular point in time which can take from one day to a few weeks. Questionnaires were administered using random sampling technique to find out the viewpoints as well as understanding regarding the matter. The researcher therefore, targeted 200 teachers since the larger the sample is the higher the reliability will be. To sample the research subjects to participate in the study, the researcher applied a random sampling technique to select a sample of 5 schools in the study area. The names of the respondent, targeted sample size, invalid sample size and the valid sample size of the various schools used for this study are shown in table 1 below Table 1. Distribution table of the teachers forming the exemplary according to their schools Names of school Target sample size Invalid sample size Valid sample size
Wisdom nursery and primary school
40 20 20
Miracle land school 40 13 27
Potter house nursery and primary school
40 10 30
Federal staff school makurdi
40 6 34
Police children school 40 12 28
Total 200 61 139

Journal for Educators, Teachers and Trainers JETT, Vol. 9 (2); ISSN: 1989-9572
145
Table 2 illustrate the teachers response in percentage to the evaluation of the school administrative system, it shows the teachers views on how the school administrative system affect the performance of the school. Table 2. Respondent percentage in teacher evaluation of the school administrative system
Questions SA %
A %
NS %
D %
SD %
Do you think that quality assurance tools are important in primary schools?
85 (61.2)
32 (23.0)
19 (13.7)
2 (1.4)
1 (.7)
Are there factors that affect the quality in your school?
67 (48.2)
50 (36.0)
19 (13.7)
3 (2.2)
Can development be monitored in your school? 68 48.9
39 28.1
29 20.9
2 1.4
1 .7
Are there performance motivators for teachers in your school?
62 44.6
37 26.6
26 18.7
13 9.4
1 .7
Do you think anything can be done to improve teacher motivation in your school?
73 52.5
33 23.7
23 16.5
6 4.3
4 2.9
Do you face problems as a teacher in your school? 65 46.8
39 28.1
27 19.4
6 4.3
2 1.4
Note: SA=Strongly Agree, A= Agree, NS=Not Sure, D=Disagree, SD=Strongly Disagree
The study shows that teachers strongly believe that the evaluation of the learning process and also the performance of the children in schools will influence the performance of schools as shown in Table 3 below. Table 3. Evaluation of the learning process and performance. Response in percentage
Questions SA %
A %
N %
D %
SD %
Do students possess good attitudes, motivation and interests in learning
55 (39.6)
49 (35.3)
21 (15.1)
10 (7.2)
4 (2.9)
Do you think students are able to effectively apply learning strategies and resources in their learning, thus attaining their learning goals?
51 (36.7)
56 (40.0)
19 (13.7)
9 (6.5)
4 (2.9)
Do you think students will be able to utilize feedback to improve their learning?
45 (32.4)
57 (41.0)
27 (19.4)
8 (5.8)
2 (1.4)
Do students successfully acquire and apply knowledge and skills?
47 (33.8)
56 (40.3)
24 (17.3)
9 (6.5)
3 (2.2)
Do students perform well in their learning activities and assignments?
43 (30.9)
58 (41.7)
28 (20.1)
10 (7.2)
Do they perform well in the aspect of generic skills? 41 (29.5)
58 (41.7)
23 (16.5)
15 (10.8)
2 (1.4)
Have students developed in their reading skills? 40 (28.8)
61 (43.9)
23 (16.5)
14 (10.1)
1 (.7)
Do you think teachers design their teaching content and adopt teaching strategies according to their teaching objectives and students’ abilities?
40 (28.8)
60 (43.2)
25 (18.0)
9 (6.5)
5 (3.6)
Are teacher’s communication skills effective in promoting student learning?
57 (41.0)
49 (35.3)
20 (14.4)
8 (5.8)
5 (3.6)

Journal for Educators, Teachers and Trainers JETT, Vol. 9 (2); ISSN: 1989-9572
146
Are teachers flexible in adjusting their teaching pace and strategies to promote student learning to cater for different learning needs?
54 (38.8)
55 (39.6)
22 (15.8)
5 (3.6)
3 (2.2)
Are teachers able to create a good classroom learning environment for students?
60 (43.2)
42 (30.2)
25 (18.0)
9 (6.5)
3 (2.2)
Are teachers able to create a good classroom learning environment
60 (43.2)
42 (30.2)
25 (18.0)
9 (6.5)
3 (2.2)
Is classroom management effective? 56 (40.3)
44 (31.7)
25 (18.0)
9 (6.5)
5 (3.5)
Are teachers able to provide various opportunities for students to participate and share experiences, with a view to promoting class interaction and enhancing learning effectiveness?
51 (36.7)
47 (33.8)
22 (15.8)
14 (10.1)
5 (3.6)
Are teachers equipped with subject knowledge and do they have a good teaching attitude?
55 (39.6)
44 (31.7)
26 (18.)
10 (7.2)
4 (2.9)
Do they pitch their expectations of students at an appropriate level?
54 (38.8)
47 (33.8)
29 (20.9)
6 (4.3)
3 (2.2)
Table 4 illustrates the extents to which the evaluation of the school’s curriculum influences the performance of pupils in primary schools; it shows the response of the teachers on their views on the evaluation of the curriculum their response which is in strongly agreed, Agreed, Not agreed, Disagreed, and strongly disagreed Table 4. Evaluation of the curriculum
Questions SA %
A %
N %
D %
SD %
Does your school align the planning of its curriculum with the trends in education development, the schools development goals and students learning needs?
55 (39.6)
44 (31.7)
32 (23.0)
4 (2.9)
4 (2.9)
Does your school map out a curriculum framework that is balanced and broad in coverage, so that students learning experiences can be enriched?
52 (37.4)
49 (35.3)
29 (20.9)
5 (3.6)
4 (2.9)
Do you think your school adjust its learning content and formulate its learning and teaching strategy to cater for students learning needs?
51 (36.7)
48 (34.5)
30 (21.6)
8 (5.8)
2 (1.4)
Do you think the school is strategic in implementing its school-based curriculum?
51 (36.7)
48 (34.5)
30 (21.6)
6 (4.3)
4 (2.9)
Are the various key learning Areas able to enhance the implementation of school-based curriculum through communication and collaboration?
54 (38.8)
45 (32.4)
27 (19.4)
10 (7.2)
3 (2.2)
Is the school effectively monitoring the implementation of its school-based curriculum?
53 (38.1)
46 (33.1)
18 (12.9)
7 (5.0)
5 (3.6)
Are there mechanisms in place for the school to evaluate the effectiveness of curriculum implementation?
64 (46.0)
45 (32.4)
18 (12.9)
7 (5.0)
5 (3.6)
Do you think the school make use of curriculum evaluation data to inform curriculum planning?
64 (46.0)
43 (30.9)
26 (18.7)
3 (2.2)
3 (2.2)
Table 5 illustrates the descriptive table which shows that the minimum depicts the smallest data in the sample while the maximum shows the largest data in the sample while the mean is representing the center of distribution of the data while the standard deviation is showing how the data are spread away from the mean.

Journal for Educators, Teachers and Trainers JETT, Vol. 9 (2); ISSN: 1989-9572
147
Table 5. Descriptive table
N Minimum Maximum Mean Std. Deviation
Name of school 139 1 5 3.17 1.344
Position of respondent 139 1 2 1.15 .359
Age 139 1 5 2.26 .912
Marital status 139 1 4 1.68 .605
Gender 139 1 4 1.68 .694
Highest qualification attained(please tick only one below)
139 1 5 2.72 .692
Type of school 139 1 3 1.55 .514
For how long have you worked in this school
139 1 4 2.39 .881
School administration system 139 1.00 4.00 1.7770 .76391
Learning process and performance 139 1.00 3.88 2.0324 .74835
School curriculum implementation 139 1.00 4.25 1.9739 .78127
Performance assessment 139 1.00 5.00 1.8867 .87136
Valid n (list wise) 139
4. Discussion and conclusions Based on the analysis we can therefore summarize that the teachers opinion collected based on the teacher’s evaluation of the schools administrative system presented on table 2 shows most of the respondents strongly agreed and agreed tools, the teachers evaluated the administrative system as one of the major tool that influences the performances of primary schools this is because the schools administrative system controls the entire environment which facilitates the teaching learning process while at the same time protecting the physical wellbeing of every occupants, while evaluating the learning process and performance in a school most of the teachers gave their opinion that learning process facilitates the performance of the school, all the process involves in learning that is teaching method, the use of instructional materials the performance of a school will be enhanced. Odo (2006) views the administrative system in education or schools as a part of an array of administration, perceived as the recruitment of all the workers and provision of materials and facilities in schools to help achieve educational objectives. In the same vein, Okoro (1991) recognizes leadership and management as key functions He emphasized that the function of a leader is to initiate new procedures for accomplishing the organizations goals and objectives. The teacher’s opinion on school curriculum and its implementation where chiefly strongly agreed this means that when a school adopt and implement a viable curriculum it enhances the performance of the school. The efficacy of the teacher is influenced by what to teach. Aboho (2000), believes that every good teaching should start with comprehensive and achievable curriculum goals for the teacher within a particular duration. What is to be taught and what is to be learned should be clearly spelt out in every subject. With the consideration of the level of education in mind. The content and objective of subjects should tally with the choice of curriculum materials.

Journal for Educators, Teachers and Trainers JETT, Vol. 9 (2); ISSN: 1989-9572
148
The teacher response mostly are agreed and strongly agreed showing that the school have a proper assessment policy making different sources of assessment which will enhance the effectiveness of students learning but it will also enhance the performance of the school. The descriptive table (5) shows that the minimum depicts the smallest data in the sample while the maximum shows the largest data in the sample while the mean is representing the center of distribution of the data while the standard deviation is showing how the data are spread away from the mean. The table illustrates that, the mean value of teacher’s evaluation of the school administration system 1.7770. This indicates that, majority of the teachers responded positively to the school administrative system. In addition the mean value of learning process and performance is 2.0324 this means that, there was positive response of teachers to the learning process and performance. Furthermore, the evaluation of the school curriculum and its implication has a mean of 1.9739, indicating the teacher’s positive response to the school curriculum and its implication. In conclusion, the teachers opinions on the performance evaluation of their respective schools had a positive outcome the aim of this study had being achieved knowing that based on the opinion of the five schools used in this study most of the responses collected and analyzed, where found out that the evaluation of learning process and performance, school’s curriculum and implementation are fundamental requirements for assessing primary schools performance. 5. Recommendations
1. Schools should adopt curriculum and implement it as an evidence-based, well-developed curriculum would promote academic growth in children. Primary school programs should employ a curriculum which is geared toward developing young children. A specific curriculum should be endorsed as evident through examples of statewide endorsement of published curricula. Furthermore, schools should be interested in measuring the additive contributions of particular school curricula on the developmental outcome of children.
2. To improve the performance of children schools should embrace a student-centered learning environment this seems to produce higher-level learning outcomes. teachers should create an atmosphere conducive to learning in order to enhance the development of students’ learning experiences.
3. The school administrative system should directly involve themselves in planning,
coordinating and evaluating the curriculum and teaching. should ensure that evaluation, inquiry and knowledge building activities are purposeful, systematic and coherent, interconnected at student, teacher, classroom and school levels let it be supported by the selection, design, this will build relational trust at all levels of the school community and support openness, collaboration and risk taking, as well as receptiveness to change and improvement.
4. For the school leadership to be effective it has to value parents and the wider
community and actively involve them in the life and work of the school, encouraging reciprocal, learning-centered relationships.
5. Teachers should also increase their knowledge of various instructional strategies in
order to keep students engaged and motivated throughout the learning process. 6. References Aboho, D. A. (2000). Curriculum: Concepts and Types. Makurdi: Onaivi Press. Ada, N. (2000). School Management Styles. Makurdi: Onaivi press.

Journal for Educators, Teachers and Trainers JETT, Vol. 9 (2); ISSN: 1989-9572
149
Adeyemo, D. A. (2001).Teachers’ job satisfaction, job involvement, career and organizational commitments as correlates of student-academic performance. Nigerian Journal of Applied Psychology, 6 (2), 126–135.
Adunola, O. (2011). The Impact of Teachers’ Teaching Methods on the Academic Performance of Primary School Pupils in Ijebu-Ode Local cut Area of Ogun State. Ogun State : Ego Booster Books.
Akuezeuilo, E. O. (1999). Who is an Effective Teacher? (A Theoretical Perspective) Awka; Nuel centi.
Alexander, R. (ed). (2010). Children, their World, their Education - final report and recommendations of the Cambridge Primary Review. Abingdon, UK: Routledge.
Alexander, V. M & Geroge, P. S. (2001). The Examplary Middle School. New York: Holt, Rinehart and Winston.
Aremu, A. O. & Sokan, B. O. (2002). Multi casual evaluation of academic performance of Nigerian learners: Issues and Implications for National Development. An unpublished
paper. Ayeni, A.J. (2011). Teachers professional development and quality assurance in Nigerian
Secondary Schools. World Journal of Education, 1(2), 43-149. Baker, D and Wiseman, AW, (2005). Global Trends in Education Policy. Amsterdam, Holland.
Elsevier. Bharadwaj, B.K. and S. Pal, (2011). Mining educational data to analyze student's performance.
International journal of Advanced Computer Science Applications., 2, 63-69. Biswajeet, P. (2009). Human Resource Management (PHI Learning Private). New Delhi, India:
Hall of India Pvt.Ltd. Chang, W. (2002). Interactive Teaching Approach in Year One University Physics in Taiwan:
Implementation and Evaluation, Asia-Pacific Forum on Science Learning and Teaching 3. Available on http://www.ied.edu.hk/apfslt/v3_issue1/changwj/index.htm
Denga D. I. (1993). Education at a Glance from Cradle to Tomb. Calabar: Rapid Educational Publishers Ltd.
Denga D. I. (2002). Educational and Social Psychology for Schools and Other Social Organizations. Calabar: Cleanliness publications.
Eaude, T. (2012). How do expert primary classroom teachers really work? - a critical guide for teachers, headteachers and teacher educators. London: Critical Publishing.
Edem, D. A. (1998). Introduction to Educational Administration in Nigeria. Ibadan: Spectrum Books.
Ezeocha, P. A. (2001). Concepts of Management and Administration in Nigeria. Onitsha: Ekene Press.
Fiala, R. (2006). “Educational Ideology and the School Curriculum”. In Benavot, A and Braslavsky, C (eds). School knowledge in comparative and historical perspectives: changing curricula in primary and secondary education. Pp. 15 – 34. Comparative Education Research Centre, Hong Kong: Springer.
Fordham A. M. (2003). The Context of teaching learning. London: Acer Hawthern. Fullan, M. (1991). The New Meaning of Educational Change. UK, London: Cassell. Gbamanja, S.P.T. (2002). Essentials of Curriculum and Instruction: Theory and Practice
PortHarcourt: Paragraphic (78), Ibadan: Spectrum Books. Lustick, D., & Sykes, G. (2006). National Board certification as professional development: What
are teachers learning? Education Policy Analysis Archives, 14(5). Retrieved from http://epaa.asu.edu/apaa/vl4n5/vl4n5.pdf
Mapesela, M.L.E. & Strydom, A.H. (2004). “Introductory perspectives on higher education performance management embedded in human resource management and development”. In A.C.Wilkinson, M.Fourie, A.H Strydom, L.J. van der Westhuizen & S.P. van Tonder (Eds). Performance management of academic staff in South African higher education: A developmental research project. Centre for Higher Education Studies and Development: University of the Free State.
Nwaogu, J. J. (1980). A Guide to Effective Supervision of Instruction in Nigeria Schools. Enugu: Fourth Dimension Publishers.
Odo, M. I. (2006). Administrative Factors Affecting Management of Technial Colleges in South – East of Nigeria. Unpublished Doctoral Dissertation Faculty of Education University of Nigeria Nsukka.

Journal for Educators, Teachers and Trainers JETT, Vol. 9 (2); ISSN: 1989-9572
150
Okoro, O. M (1991). Principles and Methods in Vocational and Technical Education. Enugu: ABIC Publishers.
Orseer, U. (2006). Teachers’ Percepttion of factors that Enhance Effective Teaching. A study of Government Secondary Schools in Benue State. un-Pulished M. ed. Thesis Faculty of Education Benue State University Makurdi.
Ozga, J. (2003). Measuring and managing performance in education Available on November 1, 2018 at http://www.leeds.ac.uk/educol/documents/163448.pdf
Rasheed MI, Sarwar S, Aslam HD. (2011). A critical analysis of performance appraisal system for teachers in public sector universities of Pakistan: A case study of the Islamia University of Bahawalpur. African Journal of Business Management, 5(9), 3735-3744.
Sarwar S, Aslam HD, Rasheed MI (2010). Hindering Factors of Beginning Teachers High Performance in Higher Education A Case Study of IUB The Islamia University of Bahawalpur. International Journal of Educational Management 26(1), 27-38.
Tebabal, A. & Kahssay, G. (2011). The effects of student-centered approach in improving students’ graphical interpretation skills and conceptual understanding of kinematical motion. Latin American Journal of Physical Education, 5(2), 374-381.
Toppo, M. L., & Prusty, D. T. (2012). From Performance Appraisal to Performance Management. IOSR Journal of Business and Management (IOSRJBM), 3(5):01-06.
Walton, J. (1991). Administration and Policy Making in Education. Baltimore:The John Hopkins Press.
Wilson J. D. (2000). Appraising Teaching Quality. London: Billing and Sons. Zeeb, M. S. (2004). Improving student success through matching learning and teaching styles.

Journal for Educators, Teachers and Trainers JETT, Vol. 9 (1); ISSN: 1989-9572
151
ISSN 1989 - 9572
Validity and reliability test of “School web site evaluation scale” in terms of contribution to school-family communication level in preschool period Prueba de validez y confiabilidad de la "Escala de evaluación del sitio web de la escuela" en términos de contribución al nivel de comunicación entre la escuela y la familia en el período preescolar
Aysegul Ozdemir Topaloglu, Biruni University, Turkey
Nadir Celikoz,
Yildiz Technical University, Turkey
Journal for Educators, Teachers and Trainers, Vol. 9 (2)
http://www.ugr.es/~jett/index.php
Date of reception: 09 October 2018
Date of revision: 12 December 2018
Date of acceptance: 26 December 2018
Topaloglu Ozdemir, A. & Celikoz, N. (2018). Validity and reliability test of “School web site evaluation scale” in terms of contribution to school-family communication level in preschool period. Journal for Educators, Teachers and Trainers, Vol. 9(2), pp. 151 – 163.

Journal for Educators, Teachers and Trainers JETT, Vol. 9 (1); ISSN: 1989-9572
152
Journal for Educators, Teachers and Trainers, Vol. 9 (2) ISSN 1989 – 9572
http://www.ugr.es/~jett/index.php
Validity and reliability test of “School web site evaluation scale” in terms of contribution to school-family communication level in preschool period
Prueba de validez y confiabilidad de la "Escala de evaluación del sitio web de la escuela" en términos de contribución al nivel de comunicación entre la escuela y la familia en el período preescolar
Aysegul Ozdemir Topaloglu, Biruni University, Turkey [email protected] Nadir Celikoz, Yildiz Technical University, Turkey [email protected] Abstract: This study was conducted to emphasize the importance of school-parent communication by developing a web-based model that was used and evaluated by both parents and teachers. The study was conducted in the Kesan District in Edirne Province with 32 teachers who work for the Ministry of Education’s independent kindergartens and 31 parents who provided feedback. A scale was developed in two forms—one for teachers and another for parents—to discover whether the internet-based web model positively affected school-parent communication. During the development of the scale, pre-interviews were held with teachers and parents who could be accessed. Then, which programs/software to be integrated into the web design that will include open-ended questions in order to improve the school-parent communication. A 35-question interview form was generated according to the results of the pre-interviews and the open-ended questions. In the light of expert opinion, the teacher form of the scale included eight questions that asked for personal information and 31 articles, 23 of which likert-type were, while the parent form included six questions requesting personal information and 29 articles, 23 of which were Likert-type. Factor and article loadings, averages, standard deviation, total article correlation, and correlation coefficients between subtests were calculated for both tests. The coefficient of reliability for the teacher form was found to be Cronbach a=.89 and Cronbach a=.97 for the parent form. After the results were obtained through analysis, factor analysis was applied to the 31-article teacher form and the 29-article parent form to determine the construction validity and a two-factor scale was obtained. The results of the study show that the scale is highly valid and reliable
Resumen: Este estudio se realizó para enfatizar la importancia de la comunicación entre la escuela y los padres mediante el desarrollo de un modelo web que fue utilizado y evaluado por los padres y los maestros. El estudio se realizó en el distrito de Kesan, en la provincia de Edirne, con 32 maestros que trabajan para los jardines de infancia independientes del Ministerio de Educación y 31 padres que proporcionaron sus comentarios. Se desarrolló una escala en dos formas, una para maestros y otra para padres, para descubrir si el modelo web basado en Internet afectó positivamente la comunicación entre la escuela y los padres. Durante el desarrollo de la escala, se realizaron entrevistas previas con maestros y padres a los que se podía acceder. Luego, qué programas / software se integrarán en el diseño web que incluirán preguntas abiertas para mejorar la comunicación entre la escuela y los padres. Se generó un formulario de entrevista de 35 preguntas según los resultados de las entrevistas previas y las preguntas abiertas. A la luz de la opinión de los expertos, la forma del maestro de la escala incluía ocho preguntas que pedían información personal y 31 artículos, 23 de los cuales eran de tipo similar, mientras que el formulario para padres incluía seis preguntas solicitando información personal y 29 artículos, 23 de los cuales fueron tipo Likert. Se calcularon las cargas de factor y artículo, los promedios, la desviación estándar, la correlación total del artículo y los coeficientes de correlación entre las subpruebas para ambas pruebas. Se encontró que el coeficiente de confiabilidad para la forma del maestro era Cronbach a = .89 y Cronbach a = .97 para la forma principal. Una vez que los resultados se obtuvieron a través del análisis, se aplicó un análisis factorial a la forma del maestro de 31 artículos y la forma padre de 29 artículos para determinar la validez de la construcción y se obtuvo una escala de dos factores. Los resultados del estudio muestran que la escala es altamente válida y confiable Keywords: School-parent communication; Web-based model; Scale; Factor analysis
Palabras clave: Comunicación escuela-padres; Modelo basado en web; Escala; Análisis factorial

Journal for Educators, Teachers and Trainers JETT, Vol. 9 (1); ISSN: 1989-9572
153
1. Introduction The pre-school period is the period of human life in which development of the individual is observed at its ultimate pace. For this reason, this period should be a time full of enriched experiences that support the development. The quality and type of those experiences depend what adults can provide (Baglama & Demirok, 2016a; Işık, 2007; Pektas, 2017). As the quality of the educational and developmental opportunities that a child is provided with increases, the quality of the education will also be enhanced increasing its effectiveness (Esteban & Laborda, 2018). Thus, parent participation is an important part of this period. Studies show that there is a connection between the development of skills in the pre-school period and later academic skills (Reeves, 2007). Development is rapid during 0-6 years and parents are the first teachers. What the parents teach and the experiences acquired from the immediate environment have a lasting effect on a child’s life (Haksiz, Baglama, Demirok & Yikmis, 2017) The most effective education can be provided through cooperation between parents and teachers (Uzunboylu & Kocakoyun, 2017; Ozcan, & Ugurel, 2017). For that reason, parent participation has become an important subject for children’s development (Şahin & Ünver, 2005), as the role of family is important in the development of personality, the acquirement of positive behavior, and the development of an individual who is psychologically and physically healthy, independent, and cares about the environment (Şahin, Kalburan & Cevher, 2009; Baglama & Demirok, 2016b). The attitudes of society towards children and families in our modern world are far different from the past. The idea that families should adopt modern perspectives rather than traditional ones is welcomed by many worldwide. Furthermore, parents today are seeking help to get to know their child better, support their development, and develop positive feelings about parenting (Şahin, Kalburan & Cevher, 2009; Ozcan & Merdan, 2016). School-parent cooperation is the effort made by the school staff and family members to develop educational activities for children to strengthen their development and prepare them for school (Cavkaytar, 2004). For that reason, families and schools are, in a way, responsible for working together to prepare, organize, and produce the necessary activities to reinforce the child’s social, academic, and physical development. The quality of pre-school education can be improved by the participation of parents in the education of the child. Family and parents should work together to get to know the child better and to develop new strategies to be used for his/her education to reinforce their education. As the transfer of school education to extra-scholastic life helps to make education permanent, the collaboration of parents and teachers and parents’ awareness of their responsibilities are important (Şahin, Kalburan & Cevher, 2009; Uzunboylu & Selçuk, 2016). 1.1. Difficulties in school-family communication Although it is generally accepted that cooperation between families and schools helps to improve the quality of education, a systematic approach has not been realized because of the unfavorable conditions in families and schools (Genc & Ozcan, 2017). The biggest obstruction is that families have hesitations about the bureaucracy present in schools. A study conducted in 1999 in Turkey by listed the most important difficulties preventing families from being involved in educational and school-related matters. These difficulties are as follows:
• The negative attitudes of management, according to families; • The indifference of families, according to management; • Lack of time; • Economic difficulties; and • Problems in communication (Ensari & Zembat, 1999).

Journal for Educators, Teachers and Trainers JETT, Vol. 9 (1); ISSN: 1989-9572
154
Even though levels of development between countries differ, when it comes to education, there are problems that all countries have in common. School- and family-related problems form the basis of difficulties in communication (Uygarer, Uzunboylu & Ozdamli, 2016; Magal-Royo & Laborda, 2017). Regardless of development levels and cultural, social, political, and economic differences, it is impossible to make education better without the partnership of families and schools. Gürşimşek (2003) examined parent engagement in terms of school-based, home-based, and parent-school collaboration-based involvement (Bell, 1993). The behaviors that aim to maintain some activities at home and school, which are an important indicator of the education of parents, remain limited (Abramauskiene & Kirliauskiene, 2017). The fact that children should learn only at school under the supervision of teachers according to traditional thinking is thought to be the main reason for a lack of home-based parent engagement (Aslanargun, Avcı, Avcu, Dönmez, İpek & Nair, 2004). The studied the reasons for lack of parent engagement in their study entitled “The Reasons for Parent Indifference to School”. They found that the main two reasons for parents’ lack of engagement were long working hours and work commitments parents face and that parents are not qualified enough in terms of education. Another reason for indifference is that a considerable number of parents think that school management and teachers are also indifferent to parents. Most of the parents who seek solutions for both their problems in communicating with their children and their lack of educational qualifications have a positive attitude toward school, as they think they can get help (Sorakin & Uzunboylu, 2017; Allahverdiyev & Yucesoy, 2017; Weiss, Caspe & Lopez, 2006). In general, misunderstandings and hesitations stemming from lack of communication between parents, teachers, and school management form the basis of the absence of parent engagement. Other research (Martin & Vincent, 1999; Coldron & Boulton, 1999) showed that although there is the traditional and universal idea that mothers are the primary caregivers who deal with school issues, most of the participating parents reported that this very attitude had to be left and that fathers should also have more responsibility in their children’s education. When the research findings are taken into account, the main reasons for family-school disconnection appear to be the misunderstandings stemming from lack of communication with school management and teachers, parents being busy most of the time, parents thinking that school management and teachers are somehow indifferent to them, and school bureaucracy. The school-parent relationship is of great importance to both children and parents. Considering the factors listed above, a web design, including programs aiming to remove the obstacles, was prepared to improve the quality of the school-parent relationship. 1.2. Research objectives Research in the field shows that there are certain factors that prevent parents from engaging in school matters. In order for students to be successful at school, the problems with families or schools themselves must be solved. The aim of this study is to examine the problems present in school-family relationships and their underlying reasons, and to introduce a web-based model in order to improve the quality and amount of school-parent communication. 1.3. Limitations The findings are limited to 31 parents who provided feedback and 32 pre-school teachers working for independent pre-schools and pre-schools within elementary schools in the Keşan District in Edirne Province. 2. Materials and method The development of the scale. The steps followed during the development of the scale are listed below (Karasar, 1995; Balcı, 2004; Erkus, Sanlı, Baglı & Guven, 2000):

Journal for Educators, Teachers and Trainers JETT, Vol. 9 (1); ISSN: 1989-9572
155
1. Item pool; 2. Expert opinion; 3. Factor analysis; and 4. Calculations of reliability
The stages can be summarized as follows: 2.1. Item pool First, the literature review was completed for the scale and the measurement tools used in other research were reviewed. Then, a 35-question interview form was given to 32 pre-school teachers working in independent kindergartens and kindergartens within the elementary schools within the Keşan District Directorate of National Education in Edirne Province in order to identify problems in the school-family relationship. Also, a 35-question form was given to 31 parents to identify problems in the family-school relationship. 2.2. Getting an expert opinion The success rate of a scale in estimating an individual’s behavior increases if it is reliable and valid (Büyüköztürk, 2004). Validity is a concept related to the extent to which the desired items are defined or measured correctly. The validity of a scale can be proved in many ways but, in this study, an expert opinion was received first to confirm the scope and profiling validity. Then, the most suitable statements from the item pool to validate the aim of the study were carefully chosen. Following this, those statements were organized according to the item writing rules and, following the restatement of the items, they were pre-selected by a group of experienced academics. The reorganized scale consisted of two forms, one of which was for the parents and the other for the teachers. There were two factor titles, convenience and sharing, under which the constructed forms were evaluated. As the meaning derived from the statements by each interviewee must be the same, the items were reviewed by an experienced academic. The initial number of the items in both forms, which was 27, was reduced to 23 in consideration of the feedback given by the experts. Also, one part of each statement was written in bold in parallel with the purpose of the study. The items of the scale/forms were graded as “completely agree=5”, “agree=4”, “not certain=3”, “disagree=2” and “completely disagree=1” giving each item five to one point(s) respectively. Thus, the minimum score on the scale was 24, while the highest score was 120. The data obtained were analyzed using the SPSS 20.0 statistical package. 2.3. Factor analysis After the expert opinion was obtained, the factor analysis technique was used to see which of the items in the scale were working. The distinctiveness of each of the items (item-total test correlations) was examined. “Item-total test correlation explains the relationship between the scores of the items and the score of the test as a whole” (Büyüköztürk, 2004). In other words, it shows that each item behaves similarly. Thus, item-total test correlation is expected to be positive and quite high and, if so, it shows that the measurement tool has internal consistency (Fraenkel, Wallen & Hyun, 2011). If the item-total score correlation is 0.30 or higher, it is thought to be good enough in distinguishing individuals in terms of the measured qualities. In this study, item-test correlations, the first item loads, and item averages were calculated, and 23 out of 27 items that were found to be meaningful (p<0.5) for item-test correlation and whose factor loads were higher than 0.30 in the first dimension of basic components analysis were

Journal for Educators, Teachers and Trainers JETT, Vol. 9 (1); ISSN: 1989-9572
156
chosen for the data in both teacher and parent forms. The item correlations of the chosen items, the basic component analysis of first item loads, and the averages of the items are presented in Table 1. 2.4. Calculating validity “The main objective of developing a scale is to construct a reliable and valid measurement tool” (Tavşancıl, 2000). Reliability is, in short, a quality of a measurement tool that helps to produce similar and consistent results in all cases (Bell, 1993). In other words, reliability is about the extent to which the obtained measurement scores of the desired behavior or qualities are consistent. “There are two basic features defining the reliability of a measurement tool; (a) the consistency between the scores (answers) obtained at different times” and (b) the consistency between the responses elicited at the same time (Büyüköztürk, 2004). Factor analysis is mostly used as a validity constructor for the development of scales used in the social sciences to collect data. This statistical technique is designed to gather the variables measuring the same structure or quality. The main objective of the likert-type scale is to ensure that “each of the items measures a certain attitude” (Bell, 1993). After the factor analysis, the factor analysis was done, the scale was put in its final form and the Cronbach alpha internal consistency coefficient was calculated to examine the internal consistency of the scale and prove the validity. The Cronbach alpha internal consistency coefficient was found to be 0.89 for the teacher form, while it was 0.97 for the parent form. 2.5. Research group The research group consisted of 31 parents who provided feedback and 32 pre-school teachers working for independent pre-schools and pre-schools within elementary schools in the Keşan District in Edirne Province.
3. Results and discussion 3.1. Item analysis and analysis of the factor structure in the scale 3.1.1. “The evaluation scale of the school web design to improve parent-school communication during the pre-school period (teacher form)” The teacher form of the scale included eight items for personal information and 23 likert-type questions, making a total of 31 questions. In order to verify the compliance of the data with the factor analysis, the Kaiser-Meyer-Olkin measure of sampling adequacy test (KMO) and Barlett’s test of sphericity (Barlett) were applied. The KMO sampling relevancy coefficient was found to be 0.78 and the x2 value for the Barlett test was found to be 1.583, p<0.001. The reliability of the scale was defined according to the internal consistency coefficient, and the split-half and Cronbach alpha reliability formula were applied. The coefficient of reliability for the teacher form was found to be Cronbach alfa .89. Table 1 shows the factor analysis results of the teacher form of the “School website evaluation scale in terms of its contribution level to school-parent communication”. The rates of total variance explained are displayed in Table 2. The average, standard deviation, and item total correlation results for the teacher form are shown in Table 3. The reliability results of the teacher form are shown in Table 4.

Journal for Educators, Teachers and Trainers JETT, Vol. 9 (1); ISSN: 1989-9572
157
Table 1. “School website evaluation scale” in terms of its contribution level to school-parent communication during the pre-school period teacher form: item and factor loads
Factors Items Factor Load
1st factor: Convenience i1 .59
i2 .46
i4 .36
i5 .49
i6 .30
i23 .54
i26 .68
Rate of explaining the total variance: 49.90
2nd
factor: Sharing i8 .47
i10 .34
i11 .43
i12 .43
i13 .38
i14 .36
i15 .40
i16 .63
i17 .55
i18 .64
i20 .71
i21 .69
i22 .84
i24 .48
i25 .49
i27 .35
The rate of explaining total variance: 48.51
The scale’s rate of explaining total variance: 50.76
Table 2. “School website evaluation scale” in terms of its contribution level to school-parent communication during the pre-school period teacher form: the rates of explaining total variance
Factors Contribution to the explained variance Total variance explained
1 31.83 31.83
2 18.93 50.76

Journal for Educators, Teachers and Trainers JETT, Vol. 9 (1); ISSN: 1989-9572
158
Table 3. “School website evaluation scale” in terms of its contribution level to school-parent communication during the pre-school period teacher form: results of averages, standard deviations, and item total correlations
Factors Items x ss Item total
correlation
1st factor: Convenience i1 4.44 .56 .54
i2 4.59 .50 .46
i4 4.50 .51 .64
i5 4.41 .71 .38
i6 4.56 .50 .44
i23 4.59 .56 .30
i26 4.56 .56 .72
i8 4.41 .67 .34
2nd
factor: Sharing i10 4.47 .57 .67
i11 4.59 .56 .48
i12 4.66 .55 .36
i13 4.44 .76 .38
i14 4.38 .55 .48
i15 4.50 .67 .44
i16 4.56 .50 .32
i17 4.41 .50 .35
i18 4.75 .44 .36
i20 4.28 .63 .62
i21 4.53 .62 .51
i22 4.47 .57 .63
i24 3.88 .91 .61
i25 4.47 .62 .66
i27 4.59 .50 .59
Table 4. “School website evaluation scale” in terms of its contribution level to school-parent communication during the pre-school period teacher form: results of validity
Scale/Factors Cronbach alpha Split-half
1.Convenience .74 .73
2.Sharing .86 .81
Scale total .89 .87
(**) p < 0.001
3.1.2. “The evaluation scale of the school web design to improve parent-school communication during the pre-school period (parent form)”
The parent form consisted of six items for personal information and 23 likert-type questions, making a total of 29 questions. The coefficient of reliability for the parent form was found to be Cronbach alpa .97. Table 5 shows the factor analysis results of the parent form of the “School website evaluation scale in terms of its contribution level to school-parent communication”. The rates of total

Journal for Educators, Teachers and Trainers JETT, Vol. 9 (1); ISSN: 1989-9572
159
variance explained are displayed in Table 6. The average, standard deviation, and item total correlation results for the teacher form are shown in Table 7. The reliability results of the teacher form are shown in Table 8 and Table 9 shows the correlation coefficients of inter-subtests for the parent form. Table 10 shows the results of the correlation between the teacher and parent forms.
Table 5. “School website evaluation scale” in terms of its contribution level to school-parent communication during the pre-school period parent form: item and factor loads
Factors Items Factor Loads
1st factor: Convenience i1 .91
i2 .59
i4 .76
i5 .56
i6 .59
i23 .77
i26 .42
Rate of explaining the total variance: 65.68
2nd
factor: Sharing i8 .48
i10 .68
i11 .59
i12 .55
i13 .69
i14 .66
i15 .41
i16 .44
i17 .55
i18 .65
i20 .56
i21 .56
i22 .33
i24 .37
i25 .35
i27 .48
The rate of explaining total variance: 58.02
The scale’s rate of explaining total variance: 62.53
Table 6. “School website evaluation scale” in terms of its contribution level to school-parent communication during the pre-school period parent form: the rates of explaining total variance
Factors Contribution to the explained variance Total variance explained
1 39.21 39.21
2 23.32 62.53

Journal for Educators, Teachers and Trainers JETT, Vol. 9 (1); ISSN: 1989-9572
160
Table 7. “School website evaluation scale” in terms of its contribution level to school-parent communication during the pre-school period parent form: results of averages, standard deviations, and item total correlations
Factors Items x ss Item total
correlation
1st factor: Convenience i1 4.26 .51 .77
i2 4.42 .50 .51
i4 4.29 .69 .65
i5 4.03 .92 .61
i6 4.32 .83 .66
i23 4.48 .51 .65
i26 4.23 .67 .45
i8 4.39 .56 .55
2nd
factor: Sharing i10 4.45 .57 .71
i11 4.13 .62 .60
i12 4.26 .58 .61
i13 4.32 .65 .73
i14 4.10 .79 .67
i15 4.19 .60 .41
i16 4.26 .44 .42
i17 3.45 .77 .62
i18 4.19 .54 .65
i20 4.42 .56 .61
i21 4.45 .62 .54
i22 3.94 .85 .44
i24 4.29 .74 .71
i25 3.90 .94 .76
i27 4.39 .56 .69
Table 8. “School website evaluation scale” in terms of its contribution level to school-parent communication during the pre-school period parent form: results of validity
Scale/Factors Cronbach alpha Split-half
1.Convenience .90 .87
2.Sharing .93 .92
Scale total .97 .90
Table 9. “School website evaluation scale” in terms of its contribution level to school-parent communication during the pre-school period parent form: inter-subtests correlation coefficients
Scale/Factors Sharing Convenience
1.Convenience .76**
2.Sharing .76**
(**) p < 0.001

Journal for Educators, Teachers and Trainers JETT, Vol. 9 (1); ISSN: 1989-9572
161
Table 10. The correlation between teacher and parent forms
Scale/Factors r
1. Convenience .52**
2. Sharing .66**
Scale total .68**
(**) p < 0.001
4. Conclusion and recommendations The findings of the reliability and validity evaluation process of the parent and teacher forms of the “School website evaluation scale in terms of its contribution level to school-parent communication”, which each include 24 items, showed that the teacher and parent forms of the scale were valid and reliable. In order to identify the factor structure of the school website evaluation scale, basic components factor analysis was applied. Four items (3, 7, 9, and 19), which were found to be inconsistent with the structure of the scale and loading more than one item, were removed from the teacher and parent forms that initially included 27 items. Of the 23 items left on both forms, they had a structure that had two sub-factors and whose eigenvalue was above one. There were seven items in the first sub-factors, while the second sub-factors had 16 items each. It was seen that the factors on the teacher form explained 50.76% of the variance in the scale and that the correlations between the sub-factor scores and total scale score varied from .32 to .72. It was seen that the factors on the parent form explained 62.53% of the variance in the scale and that the correlations between the sub-factor scores and total scale score varied from .33 to .91. The correlation between teacher and parent forms was .68. Thus, it can be said that this correlation between the two scales shows the validity of the measurement tool. When the findings of the study are considered as a whole, the validity and reliability of the scale can be attested. However, it is advised that the basic reliability and validity tests for the scale should be repeated with regard to technological, social, and cultural developments. • For the purpose of the study, a variety of software were developed and added to the website and a number of panels and links were included in the system to improve the relationship between the school and the parents, such as forum panels in which teachers and parents share their ideas, important links, news and announcements about the school informing the parents daily/weekly of answers to parents’ common questions (such as issues concerning social skills, nutrition, preparation or reading and writing, participating in activities, etc.), providing graphics and interpretations, and a photo-video gallery that displays the daily activities of the children. • There have been many studies and much research done to highlight the importance of the school-parent relationship during the pre-school period, but only traditional activities to improve interaction between schools and parents, such as home visits, leaflets on school boards, newsletters, and parent meetings that are restricted to certain subjects, are mentioned. It is an undeniable fact that computers and the internet have become an essential part of the educational system as well as the economic system, which have both been influenced by the developments and changes in science and technology. Such technology has been so fully integrated into daily life that it should also be a part of education (Caliskan & Bicen, 2017; Laborda, Magal Royo, Litzler & Giménez López, 2014). There is a consensus that pre-school education plays a vital role in children’s development and that during this period the active involvement of parents is of high importance.

Journal for Educators, Teachers and Trainers JETT, Vol. 9 (1); ISSN: 1989-9572
162
Based on these facts, a modern, active, practical, and useful web model was developed as an alternative to the traditional techniques in order to create a functional communication network. 5. References Abramauskiene, J., & Kirliauskiene, R. (2017). National values of students in Lithuania.
Contemporary Educational Researches Journal. 7(2):73-80. doi: https://doi.org/10.18844/cerj.v7i2.2033
Allahverdiyev, M., & Yucesoy, Y. (2017). Development stages and types of glass art from past to present. Ponte, 73(4), 224-238.
Aslanargun, E., Avcı, H., Avcu, A., Dönmez, S. A., İpek, K., & Nair, E. (2004). Velilerin Okula Yönelik İlgi Yetersizliklerinin Sebepleri, Bilecik: Pazaryeri İlçe Milli Eğt. Md. Yayınları.
Baglama, B., & Demirok, M. S. (2016a). Opinions of mothers of children with autism spectrum disorder towards special education support and services. International Journal of Educational Sciences, 15(1-2), 279-289.
Baglama, B., & Demirok, M.S. (2016b). Determination of Preservice Special Education Teachers' Views on Early Childhood Intervention. Cypriot Journal of Educational Sciences, 11, 213-222.
Balcı, A. (2004). Sosyal Bilimlerde Araştırma. Ankara: Pegema Yayıncılık. Bell, J. (1993). Doing Your Research Project. Buckingham, Philadelphia: Open. Büyüköztürk, Ş. (2004). Veri analizi el kitabı. Ankara: Pegema Yayıncılık. Caliskan, S., & Bicen, H. (2017). Determination the opinions of teacher candidates towards the
effects of smart phones on their social lives. Ponte. 73(9):292-297. Cavkaytar, A. (2004). “Okulöncesi Eğitimde Okul, Aile ve Çevre İşbirliği,” Okulöncesi Eğitimin
İlke ve Yöntemleri. Editör: Sefik Yasar. Eskişehir: Anadolu Üniversitesi Açikögretim Fakültesi Yayınları, ss. 133-144.
Coldron, J., & Boulton, P. (1999). A Case Study of a Parent’s Educational Practice. International Studies in Sociology of Education. 9(1):77-93.
Ensari, H., & Zembat, R. (1999). “Yönetim Stillerinin Ailenin Okul Öncesi Egitim Programlarina Katilimi Üzerinde Etkileri” Marmara Üniversitesi Anaokulu / Anasinifi Ögretmeni El Kitabi, Ya-Pa Yayinlari, Istanbul.
Erkus, A., Sanlı, N., Baglı, M. T., & Guven, K. (2000). Developing an attitude scale toward teaching as a profession. Educ. Sci, 25(116), 27-33.
Esteban, S.G. & Laborda, J.G. (2018). Technology Based Reflective Practice in Primary ELT Teacher Education. Onomázein. http://onomazein.letras.uc.cl/Articulos/N41/41_9-Garcia.pdf
Fraenkel, J. R., Wallen, N. E., & Hyun, H. H. (2011). How to design and evaluate research in education. New York: McGraw-Hill Humanities/Social Sciences/Languages.
Genc, Z., & Ozcan, D. (2017). The problems of special education teachers working in special education institutions. Ponte, 73(9), 333-343.
Gürşimşek, I. (2003). Okul öncesi eğitime aile katılımı ve psikososyal gelişim. Kuram ve Uygulamada Eğitim Bilimleri, 3(1), 125-144.
Haksiz, M., Baglama, B., Demirok, M.S., & Yikmis, A. (2017). An exploratory study on the views of special education teachers regarding problem behaviors in class in North Cyprus. Ponte, 73(7), 192-207.
Işık, H. (2007). Study of parent-school collabration activities which are ımplemented in preschool education ınstitutions on the base of parent opinions. Unpublished Master Thesis, Anadolu University, Educational Sciences Institute, Eskişehir.
Karasar, N. (1995). Bilimsel Araştırma Yöntemi. Ankara: 3A Eğitim Araştırma Danışmanlık Ltd. Laborda, J.G., Magal Royo, T., Litzler, M.F. & Giménez López, J.L. (2014). Mobile phones for a
University Entrance Examination language test in Spain. Educational Technology & Society, 17(2), 17-30.
Magal-Royo, T. & Laborda, J.G. (2017) Multimodal Interactivity in Foreign Language Testing. In Deborah Dahl and Kazuyuki Ashimura (Ed.) Multimodal Interaction with W3C Standards: Towards Natural User Interfaces to Everything. pp. 351-365. New York: Springer.
Martin, J., & Vincent, C. (1999). Parental voice: An exploration. International Studies in Sociology of Education, 9(2), 133-154.

Journal for Educators, Teachers and Trainers JETT, Vol. 9 (1); ISSN: 1989-9572
163
Ozcan, D., & Merdan F. (2016). Examination of Parents’ Anxiety About Their Gifted Children’s Education. Global Journal of Psychology Research: New Trends and Issues. 6(2):63-69. doi: https://doi.org/10.18844/gjpr.v6i2.638
Ozcan, D., & Ugurel, Y. (2017). Teachers attitude towards students with learning disability. Ponte, 73(8), 217-233.
Pektas D. (2017). Investigation of relations among preschool children and their parents' use of technological devices and reading habits (An example kindergarten in the Kirikkale). New Trends and Issues Proceedings on Humanities and Social Sciences. 3(1):409-416. doi: https://doi.org/10.18844/gjhss.v3i1.1795
Reeves, D.L. (2007). Parent Involvement in Early Childhood Settings. USA: Pace. Şahin, F.T., & Ünver, N. (2005). Parent involvement in preschool education programs.
Kastamonu Education Journal, 13(1), 23-30. Şahin, F.T., Kalburan, F., & Cevher, N. (2009). Parent Education Programs and Their
Effectiveness: What Type of Programs are Implemented in the World?. Pamukkale University Journal of Education, (25), 1-12.
Sorakin, Y., & Uzunboylu, H. (2017). Evaluation of content analysis of filial therapy studies. Ponte, 73(6), 334-344.
Tavşancıl, E. (2000). Tutumların Ölçülmesi ve SPSS ile Veri Analizi. Ankara: Nobel Yayınevi. Uygarer, R., Uzunboylu, H., & Ozdamli, F. (2016). A piece of qualitative study about digital
natives. The Anthropologist, 24(2), 623-629. Uzunboylu, H., & Kocakoyun, S. (2017). A content analysis of master and doctorate thesis in
the area of gamification. International Journal Of Innovative Research In Education, 3(3), 143-154.
Uzunboylu, H., & Selcuk, G. (2016). Lifelong learning competency perceptions of teacher candidates according to a teacher training program. The Anthropologist, 24(1), 119-125.
Weiss, H., Caspe, M., & Lopez, M. E. (2006). Family involvement in early childhood education. Family involvement makes a Difference, 1, 1-8.
Journal for Educators, Teachers and Trainers JETT, Vol. 9 (2); ISSN: 1989-9572
164
ISSN 1989 - 9572
Views of lecturers on effective teaching in agriculture departments Opiniones de los docentes sobre la enseñanza efectiva en los departamentos de agricultura
Avin Hamaaziz Allahkaram, Deniz Ozcan,
Ondokuz Mayıs University, Turkey
Journal for Educators, Teachers and Trainers, Vol. 9 (2)
http://www.ugr.es/~jett/index.php
Date of reception: 09 October de 2018
Date of revision: 04 December 2018
Date of acceptance: 26 December 2018
Allahkaram, A.H. & Ozcan, D. (2018). Título. Journal for Educators, Teachers and Trainers, Vol. 9(2), pp. 164 – 178.

Journal for Educators, Teachers and Trainers JETT, Vol. 9 (2); ISSN: 1989-9572
165
Journal for Educators, Teachers and Trainers, Vol. 9 (2) ISSN 1989 – 9572
http://www.ugr.es/~jett/index.php
Views of lecturers on effective teaching in agriculture departments Opiniones de los docentes sobre la enseñanza efectiva en los departamentos de agricultura Avin Hamaaziz Allahkaram Deniz Ozcan
Ondokuz Mayıs University, Turkey Abstract The aim of this study is to determine the lecturers’ views about effective teaching and teaching methods used in agricultural faculty of Sulaimani University in Iraq through the lecturers’ views. The quantitative research method was used in the research. The quantitative data was collected throughout the applied questionnaire that consists of 42 items in the faculty of agricultural science of Sulaimani University which has seven departments and more than 400 lecturers with different titles. The sample of the study consists of 121 lecturers. The data have been collected and categorized into two variables (gender and working experience). Moreover, to conduct statistics techniques, Microsoft Excel and SPSS software has been used. Concerning the view of teaching, finding suggest different views in many items between male and female lecturers however less experienced lecturer candidates view is varying only in terms of communications between lecturer and students and promoting conceptual changing in students from more experienced ones. Resumen El objetivo de este estudio es determinar los puntos de vista de los profesores sobre la enseñanza efectiva y los métodos de enseñanza utilizados en la facultad de agricultura de la Universidad Sulaimani en Irak a través de los puntos de vista de los profesores. El método de investigación cuantitativa fue utilizado en la investigación. Los datos cuantitativos se recopilaron a lo largo del cuestionario aplicado, que consta de 42 ítems en la facultad de ciencias agrícolas de la Universidad de Sulaimani, que tiene siete departamentos y más de 400 profesores con diferentes títulos. La muestra del estudio consta de 121 profesores. Los datos se han recopilado y categorizado en dos variables (género y experiencia laboral). Además, para realizar técnicas estadísticas, se ha utilizado el software Microsoft Excel y SPSS. En lo que respecta a la visión de la enseñanza, los hallazgos sugieren diferentes puntos de vista en muchos temas entre profesores y profesoras; sin embargo, la opinión de los candidatos con menos experiencia varía solo en términos de comunicación entre el profesor y los estudiantes y promueve cambios conceptuales en estudiantes de los más experimentados. Keywords Teaching; Teaching methods; Agricultural education; Sulaimani University Palabras clave Enseñando; Métodos de enseñanza; Educación agrícola; Sulaimani Universidad
1 Corresponding author

Journal for Educators, Teachers and Trainers JETT, Vol. 9 (2); ISSN: 1989-9572
166
1. Introduction Defining term of teaching could be complicated. However numerous definitions could be drawn by various scholars. Coe et al (2014) defined effective teaching as a main dimension which positively affects students’ academic achievement and yields future success in their life. It could be indicated that teaching and learning are the both sides of a coin and higher education plays a substantial role in society by creating new knowledge and then transmitting it to students and enhancing innovation (Eid,2014). Coe et al (2014) have listed main elements which are required for effective teaching. These elements could be summarized as follows; pedagogical content knowledge, quality of instruction, classroom climate, classroom management, teachers’ beliefs and professional behaviors (García Laborda, Magal Royo, Litzler & Giménez López, 2014). Onder & Karatas, 2016; Baglama & Demirok, 2016). Botkin et al (2014) defined the term of learning as a process of engaging new situations. Mclerney (2014) stresses fundamental mechanisms of the effective teaching and learning as a practice which values creativity and innovations with enriched research and learner orientations that play a key role to generate motivated learners which exhibits physical and psychological well-being. Therefore, understanding underlying factors which play crucial roles at learning process is also fundamental. According to Botkin et al (2014) family upbringing, peer groups and communication media are some of the primary factors which may affect learning process. Moreover, it is also argued that teaching style and learning style are related to each other. Thus, teachers should have personal knowledge and personal practices to facilitate student learning. It is suggested that personal knowledge refers to a knowledge about the students and the methodology to be followed and knowledge about the content while personal practices represents the provision of feedback and reports related creation of safe learning environment. Furthermore, it is also indicated that some of the main dimensions which play a key role on the teachers’ effectiveness could be suggested as showing enthusiasm, maintaining an academic focus and provision of opportunities to students in order to learn better through well-managed classrooms (Mclerney, 2014; Teurculet, 2016; García Laborda, & Litzler, 2015). Universities are educational institutions based on teaching different sciences regardless the nature the departments and faculties there is teaching and learning process in all faculties. On the other hand, teachers have different perspectives about the effective teaching styles. Many studies have been employed in agricultural education field over time. Despite the existence of several agricultural colleges in Iraq, only a few studies attempt the investigation of learning and teaching process and most of them conducted in Mosul University which is now unfortunately damaged by ISIS. Several studies concerning teaching and learning in agricultural education have been addressed in literature previously, in this study the sufficient number of them which are relevant to the objectives of this thesis has been reviewed. Agricultural knowledge systems play an essential role in developing and disseminating knowledge, information, and technologies relevant to developing global food security and environmental sustainability (Cigdem & Ozdemir, 2017). Agricultural education is one of the agricultural knowledge systems components. Acker (1999) assessed the quality of higher education of agriculture in his study whether there is need for reform or not, the result of the study exhibits the necessity for making substantial improvement in the quality of higher agricultural education globally. Earlier study conducted by Cano, Garton, and Raven (1992) by which investigated teaching, learning and personality of pre-service teachers of agricultural education, regarding teaching style. The result indicates that student-centered teaching preferred but different preferred learning styles have been revealed. Torres and Cano (1995) state that learning style provides significant insight into the way learners process information and knowledge to learn as well as how teachers teach and finally how both teachers and students interact. In their study Torres and Cano (1995) of which titled as learning style in agriculture found that independent learning style tend to be preferable to male students in contrary dependent learning style was preferred by female students. The reviewed studies have been employed in the US.

Journal for Educators, Teachers and Trainers JETT, Vol. 9 (2); ISSN: 1989-9572
167
Far away from the US, in the study of teaching styles in Agriculture College at Razi University in Iran Hamdhaidari, Agahi, and Papzan (2007) figured that the education in the agriculture college is based on theory more than practice and the faculty staff facing many challenges and they education system has not change for some decades. In other study Jamel (2006) about Teaching and Learning Styles,it was revealed that instructors chose less students’ involvement in active learning styles while independent learning styles were significantly acceptable by the students. The results also showed that third and fourth-year students prefered independent styles of learning comparing to first and second-year students. Similarly, Jamil (2012) deals with teaching clarity in College of Agriculture in Mosul University/Iraq, the result pointed that a big proportion of agri-science has low clarity from student’s perspective while students’ achievements were better for high clarity teachers than low clarity teachers. Again another research by Idris (2014) investigated the attitude of the staff of college of agriculture in Mosul University in Iraq to assess the students for their teaching, the result shows that the average has negative attitudes toward evaluating students for the teaching and there was a not significant difference for attitudes of faculty members to evaluate students regarding their teaching depending on (sex, qualification, years of service, scientific title) while the result showed significant difference based on scientific departments.
Robinson et al., (2012) examined the perceptions of teaching ability during teaching experience in agricultural education. The result shows that the emerging teacher view identified some areas needed for growth and development but also identified their progress toward becoming a professional. The Self–Assured Teacher view showed that highly comfort and confidence in their teaching ability, which extended to their perception on developing lessons and teaching across the agricultural education curriculum. The Determined Teacher view identified confidence but not comfortable with their teaching ability. Regarding accessibility of technology in agricultural education Coley et al., (2015) in the result of their study in Tennessee points out that Tennessee agricultural teachers are not necessarily adopt technologies for their classroom and many of the teachers didn’t access to technologies adequately.This study is attempted to figure out the effective teaching styles in the college of agriculture in Sulaimani University from teacher’s point of view. The aim of this study is to determine the teachers’ opinions about effective teaching and teaching methods used in agricultural faculty of Sulaimani University in Iraq. More specifically, the study seeks to answer the following questions.
1. How are the views of lecturers on teaching? Is there any significant difference
between the opinions of teachers about effective teaching according to; Their gender Working experience
2. Which teaching methods are used by the teachers frequently? Are there any
significant differences among the teaching methods used by the lecturers according to;
Their gender Working experience
1.1. Methodology This study followed survey methodology. The survey was conducted to investigate lecturer’s point of view about teaching, teaching methods, teaching tools and factors that hinder the teaching process. The design format of the presented study consists of quantitative data collection exploring the above aspects. 1.1.1. Study group More than 400 lecturers have been currently working in the faculty of agriculture in Sulaimani University. Approximately 150 hard copies of the study’s questionnaire were distributed among them, consequently 121 participants responded to the applied questionnaire. As it were mentioned before, the participants of this study were categorized by gender and working experience. The minimum age of the participants was 24 while the maximum is 65 years old. In
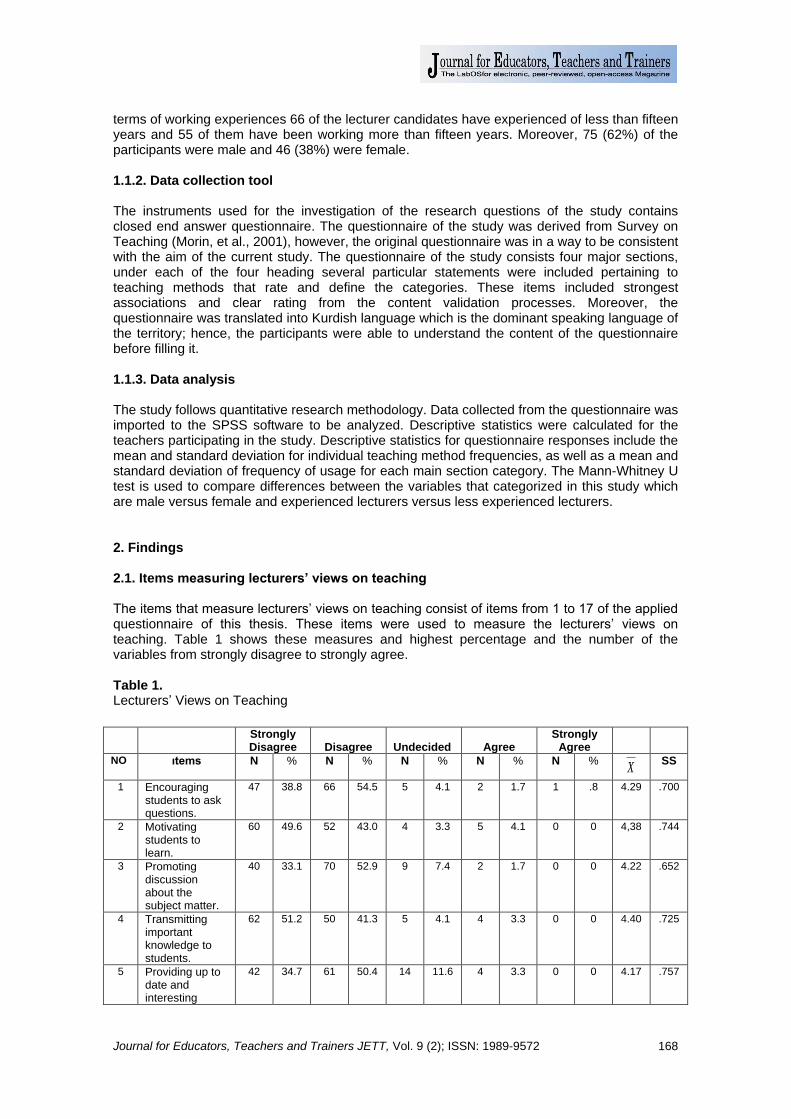
Journal for Educators, Teachers and Trainers JETT, Vol. 9 (2); ISSN: 1989-9572
168
terms of working experiences 66 of the lecturer candidates have experienced of less than fifteen years and 55 of them have been working more than fifteen years. Moreover, 75 (62%) of the participants were male and 46 (38%) were female. 1.1.2. Data collection tool The instruments used for the investigation of the research questions of the study contains closed end answer questionnaire. The questionnaire of the study was derived from Survey on Teaching (Morin, et al., 2001), however, the original questionnaire was in a way to be consistent with the aim of the current study. The questionnaire of the study consists four major sections, under each of the four heading several particular statements were included pertaining to teaching methods that rate and define the categories. These items included strongest associations and clear rating from the content validation processes. Moreover, the questionnaire was translated into Kurdish language which is the dominant speaking language of the territory; hence, the participants were able to understand the content of the questionnaire before filling it. 1.1.3. Data analysis The study follows quantitative research methodology. Data collected from the questionnaire was imported to the SPSS software to be analyzed. Descriptive statistics were calculated for the teachers participating in the study. Descriptive statistics for questionnaire responses include the mean and standard deviation for individual teaching method frequencies, as well as a mean and standard deviation of frequency of usage for each main section category. The Mann-Whitney U test is used to compare differences between the variables that categorized in this study which are male versus female and experienced lecturers versus less experienced lecturers. 2. Findings 2.1. Items measuring lecturers’ views on teaching The items that measure lecturers’ views on teaching consist of items from 1 to 17 of the applied questionnaire of this thesis. These items were used to measure the lecturers’ views on teaching. Table 1 shows these measures and highest percentage and the number of the variables from strongly disagree to strongly agree. Table 1. Lecturers’ Views on Teaching
Strongly Disagree
Disagree
Undecided
Agree
Strongly Agree
NO ıtems N % N % N % N % N % X
SS
1 Encouraging students to ask questions.
47 38.8 66 54.5 5 4.1 2 1.7 1 .8 4.29 .700
2 Motivating students to learn.
60 49.6 52 43.0 4 3.3 5 4.1 0 0 4,38 .744
3 Promoting discussion about the subject matter.
40 33.1 70 52.9 9 7.4 2 1.7 0 0 4.22 .652
4 Transmitting important knowledge to students.
62 51.2 50 41.3 5 4.1 4 3.3 0 0 4.40 .725
5 Providing up to date and interesting
42 34.7 61 50.4 14 11.6 4 3.3 0 0 4.17 .757

Journal for Educators, Teachers and Trainers JETT, Vol. 9 (2); ISSN: 1989-9572
169
As presented in the table 1, distributions of frequency, percentage, mean and standard deviation related with opinions of the lecturers about teaching process are provided. Considering the statements of 1 and 2 that teaching is encouraging students to ask questions and motivating students to learn the majority of the lecturers don’t agree. More than 90% of the lecturers think that teaching doesn’t transmit important knowledge to students. In contrary of expectations the lecturers believe that the communication between lecturers and students is not a part of teaching. However, the lecture candidates don’t reject that teaching is stimulating students to think critically. Moreover, 13.2% of the lecturers indicate that through teaching they
resource material for students.
6 Promoting conceptual changes in students.
25 20.7 64 52.9 24 19.8 8 6.6 0 0 3.88 .812
7 Setting challenging problems and assignment, and helping students to cope with them
30 24.8 60 49.6 25 20.7 6 5.0 0 0 3.94 .809
8 Communicatin g ideas between lecturer and students.
44 36.4 68 56.2 5 4.1 4 3.3 0 0 4.26 .690
9 Supporting and caring for students.
41 33.9 68 56.2 6 5.0 4 3.3 2 1.7 4.17 .803
10 Providing situations where students can learn from each other.
25 20.7 70 57.9 15 12.4 11 9.1 0 0 3.90 .831
11 Passing on lecturers experiences to students
36 29.8 59 48.8 10 8.3 16 13.2 0 0 3.95 .956
12 Giving interesting presentation, using instructional technology.
44 36.4 58 47.9 11 9.1 7 5.8 1 .8 4.13 .865
13 Stimulating Students to think a critical way.
39 32.2 47 38.8 21 17.4 14 11.6 0 0 3.92 .980
14 Producing independent learners
36 29.8 61 50.4 13 10.7 11 9.1 0 0 4.01 .880
15 Equipping students with independent skills for problem solving. 39 32,2 61 50,4 16 13,2 5 4,1 0 0 4,11 ,783
16 Helping students to understand important ideas. 39 32,2 72 59,5 5 4,1 5 4,1 0 0 4,2, ,703
17 Displaying enthusiasm for the subject matter. 45 37,2 65 53,7 7 5,8 4 3,3 0 0 4,25 ,710

Journal for Educators, Teachers and Trainers JETT, Vol. 9 (2); ISSN: 1989-9572
170
pass their experiences to students. Further, 4.27% of the lecturers think that teaching is supporting and caring for students. 2.2. Views of lecturers on teaching according to their gender Views of lecturers on teaching according to their gender take place in Table. 2. Mann-Whitney U test was conducted to determine the results. Table 2. Lecturers’ Views on teaching according to gender
Items N Mean Rank
Sum of
Ranks U P
1. Encouraging students to ask questions.
Male 75 57.87 4340.50 1490.500 .156
Female 46 66.10 3040.50
Total 121
2. Motivating students to learn.
Male 75 54.24 4068.00 1218.000 .002
Female 46 72.02 3313.00
Total 121
3. Promoting discussion about the subject matter.
Male 75 60.79 6559.50 1709.500 .925
Female 46 31.34 2821.50
Total 121
4. Transmitting important knowledge to students.
Male 75 56.45 4234.00 1384.000 .041
Female 46 68.41 3147.00
Total 121
5.Providing up to date and interesting resource material for students
Male 75 53.38 4003.50 1153.500 .001
Female 46 73.42 3377.50
Total 121
6. Promoting conceptual changes in students.
Male 75 56.85 4263.50 1413.500 .069
Female 46 66.77 3117.50
Total 121
7. Setting challenging problems and assignment, and helping students to cope with them.
Male 75 55.87 4190.00 1340.000 .026
Female 46 69.37 3191.00
Total 121
8. Communicating ideas between lecturer and students.
Male 75 56.40 4230.00 1380.000 .036
Female 46 68.50 3151.00

Journal for Educators, Teachers and Trainers JETT, Vol. 9 (2); ISSN: 1989-9572
171
Total 121
9. Supporting and caring for students.
Male 75 55.50 4162.50 1312.500 .013
Female 46 69.67 3218.50
Total 121
10. Providing situations where students can learn from each other.
Male 75 57.65 4323.50 1473.500 .132
Female 46 66.47 3057.50
Total 121
11. Passing on lecturers experiences to students.
Male 75 56.29 4222.00 1372.000 .041
Female 46 68.67 3159.00
Total 121
12. Giving interesting presentation, using instructional technology.
Male 75 59.12 4434.00 1584.000 .412
Female 46 64.07 2947.00
Total 121
13. Stimulating Students to think a critical way.
Male 75 58.17 4362.50 1512.500 .232
Female 46 65.62 3018.50
Total 121
14. Producing independent learners
Male 75 58.09 4357.00 1507.000 .205
Female 46 65.74 3024.00
Total 121
15. Equipping students with. Independent skills for problem solving.
Male 75 59.92 4492.00 1642.000 .628
Female 46 64.39 2889.00
Total 121
16. Helping students to understand important ideas.
Male 75 58.92 4419.00 1569.000 .338
Female 46 64.39 2962.00
Total 121
17. Displaying enthusiasm for the subject matter.
Male 75 58.92 4255.00 1405.000 .055
Female 46 64.39 3126.00
Total 121
According to the Table 2 which reflects Mann-Whitney U test results, there is a significant difference between the views of lecturers according to their gender in the item “Motivating

Journal for Educators, Teachers and Trainers JETT, Vol. 9 (2); ISSN: 1989-9572
172
students to learn”. Female lecturers motivate their students to learn more than male lecturers (U=1218.000, P<0.05). Also, significant difference is seen in the item “Transmitting important knowledge to students”, female lecturers have more positive view about transmitting important knowledge to students more than male (U=1384.000, P<0.05). Moreover, in the item “Providing up to date and interesting resource material for students” there is a significant difference between the views of lecturers. Female lecturers have more positive views about providing up to date and interesting resource material for students than male lecturers (U=1153.500, P<0.05). Furthermore, there is also significant difference between the views of lecturers in the item “Setting challenging problems and assignment and helping students to cope with them” female lecturers have more positive view about setting challenging problems and assignment and helping students to cope with them (U=1340.000, P<0.05). In addition to this, ın the item “Communicating ideas between lecturer and students”, there is a significant difference between the lecturers according to their gender. Female lecturers have more positive views about it than male lecturers (U=1380.000, P<0.05). Also, there is a significant difference between the views of lecturers in terms of their gender about “Supporting and caring for students”. Female lecturers have more positive views about it more than male lecturers (U=1312.500, P<0.05). Finally, there is also a significant difference between the views of lecturers according to their gender in terms of “passing on lecturer’s experiences to students”. Female lecturers have more positive views about it then male lecturers (U=1372.000, P<0.05). There are no significant differences between the lecturer’s views according to lecturers’ genders in the other items about views on teaching. 2.3. Views of lecturers on teaching according to their work experiences Views of lecturers on teaching according to their work experience take place in Table. 2. Mann-Whitney U test was conducted to determine the results. Table 3. Lecturers’ views on teaching according to work experience
Items Experience N Mean Rank
Sum of
Ranks
U P
1. Encouraging students to ask questions.
1-15 15-above
Total
66 55 121
64.32 57.02
4245.00 3136.00
1596.000 .197
2. Motivating students to learn. 1-15 15-above
Total
66 55 121
62.38 59.35
4117.00 3264.00
1724.000 .596
3. Promoting discussion about the subject matter.
1-15 15-above
Total
66 55 121
61.01 60.99
4026.50 3354.50
1814.500 .998
4. Transmitting important knowledge to students.
1-15 15-above
Total
66 55 121
64.92 56.29
4285.00 3096.00
1556.000 .130
5.Providing up to date and interesting resource material for students
1-15 15-above Total
66 55 121
63.83 57.60
4213.00 3168.00
1628.000 .285

Journal for Educators, Teachers and Trainers JETT, Vol. 9 (2); ISSN: 1989-9572
173
6. Promoting conceptual changes in students.
1-15 15-above
Total
66 55 121
60.47 61.64
3991.00 3390.00
1780.000 .842
7. Setting challenging problems and assignment, and helping students to
cope with them.
1-15 15-above Total
66 55 121
65.61 55.46
4330.50 3050.50
1510.500 .086
8. Communicating ideas between lecturer and students.
1-15 15-above Total
66 55 121
69.80 50.44
4607.00 2774.00
1234.000 .001
9. Supporting and caring for students.
1-15 15-above
Total
66 55 121
60.06 62.13
3964.00 3417.00
1773.000 .715
10. Providing situations where students can learn from each other.
1-15 15-above Total
66 55 121
64.38 56.95
4249.00 3132.00
1592.000 .193
11. Passing on lecturers’ experiences to students.
1-15 15-above
Total
66 55 121
58.30 64.25
3847.50 3533.50
1636.500 .315
12. Giving interesting presentation, using instructional technology.
1-15 15-above Total
66 55 121
64.03 57.36
4226.00 3155.00
1615.000 .256
13. Stimulating Students to think a critical way.
1-15 15-above
Total
66 55 121
57.64 65.03
3804.50 3576.50
1593.500 .225
14. Producing independent learners
1-15 15-above
Total
66 55 121
59.09 63.29
3900.00 3481.00
1689.000 .475
15. Equipping students with independent skills for problem solving.
1-15 15-above Total
66 55 121
60.43 64.39
3988.50 3392.50
1777.500 .831
16. Helping students to understand important ideas.
1-15 15-above Total
66 55 121
58.06 64.53
3832.00 3549.00
1621.000 .245
17. Displaying enthusiasm for the subject matter.
1-15 15-above
Total
66 55 121
61.11 60.87
4033.00 3348.00
1808.000 .967
In respect to view of the candidate lecturers distinguished with their work experiences, the analysis output of Mann-Whitney U test is presented in Table 3. Although most of the findings are not significant but differences can still be observed. The working experience in this study is categorized in two categories, first lecturers with 1-15 years experiences and lecturers with more than 15 years experiences. More experienced lecturers are less positive about the statement of transmitting important knowledge to students. Furthermore, less experienced lecturers’ views significantly vary from other that agree with the item of Setting challenging

Journal for Educators, Teachers and Trainers JETT, Vol. 9 (2); ISSN: 1989-9572
174
problems and assignment and helping students to cope with them (U=1510.500, P<0.10). Also, there is a significant difference between the views of lecturers in terms of their experience about “communicating ideas between lecturers and students”. Less experienced lecturers have more positive views about it than more experienced lecturers (U=1234.000, P<0.05). The experienced lecturers are more positive in terms of the item states that teaching encourages students to think in a critical way more than less experienced lecturers. Likewise, the experienced lecturers are supporting item that argues teaching is helping students to understand important ideas more than less experienced lecturers. 2.4. Teaching methods used by lecturers Views of lecturers on frequency of using teaching methods. Table 4 represents the results about teaching methods used by lecturers. Table 4. Teaching methods used by lecturers
Never Seldom Occasionally Often Very often
NO Items N % N % N % N % N %
SS
1 Lecture 2 1,7 2 1,7 6 5,0 46 38,0 65 53,7 4,40 ,802
method
2 Seminar 6 5,0 16 13,2 33 27,3 44 36,4 22 18,2 3,50 1,089
method.
3 Problem-
based learning.
6 5,0 23 19,0 34 28,1 38 31,4 20 16,5 3,36 1,117
4 Project-based 8 6,6 23 19,0 36 29,8 40 33,1 14 11,6 3,24 1,096
learning.
5 Case methods. 16 13,
2 20 16,5 35 28,9 32 26,4 17 14,0 3,12 1,238
6 Experiential 3 2,5 7 5,8 22 18,2 56 46,3 32 26,4 3,89 ,951
method.
7 Collaborative/
Cooperative learning.
6 5,0 15 12,4 25 20,7 50 41,3 25 20,7 3,60 1,099
8 Peer teaching. 12 9,9 19 15,7 36 29,8 38 31,4 14 11,6 3,19 1,152
Table 4 presents the analysis of the findings of second section of our questionnaire which reflect the answer of the second objective of the study. It can be observed that the methods that proposed to the participants are been used by the lecturers generally as they respond positively

Journal for Educators, Teachers and Trainers JETT, Vol. 9 (2); ISSN: 1989-9572
175
to them. From the finding it was discovered large percentage of the lecturer candidates benefiting from using lecture methods, this finding outlined with (Sajjad, 2010; Morin et al., 2001). According to the responses given to the statement of using seminar method as a teaching method, 36.4% of lecturer candidates reported that they are using it often and 27.3% are occasionally. Moreover, regarding the problem based and project-based methods, the lecturers state that they are using them often by 31.4% and 33.1% respectively. Considering the case methods 26.4 % of lecturer candidates indicated that they are using it often but 28.9% of them responded occasionally. Experiential method seems to be preferable in Agriculture College as 46.3% of the lecturers are using it often and 26.4% are using it very often. The candidate lecturers pay a big attention to collaborative/ cooperative learning as 42.3% of them using it often and 20.7% are using it very often. Finally, peer teaching method is used by the lecturer candidates in 20.7% often however 29.8% of them state that they are occasionally about using it. 2.5. Used teaching methods according to gender Views of lecturers on used teaching methods according to their gender take place in Table 5. Mann-Whitney U test was conducted to determine the results. Table 5. Used teaching methods according to lecturers’ gender
Items N Mean Rank
Sum of Ranks
U P
1. Lecture Method Male Female Total
75 46 121
59.89 62.82
4491.50 2889.50
1641.500 .616
2.Seminar Method Male FemaleTotal
75 46 121
62.36 58.78
4677.00 2704.00
1623.000 .571
3.Problem based Learning
Male Female Total
75 46 121
59.44 63.54
4458.00 2923.00
1608.500 .518
4.Project based Learning Male Female Total
75 46 121
55.52 69.93
4164.00 3217.00
1314.000 .023
5.Case Method Male Female Total
75 46 121
56.57 66.82
4186.50 3073.50
1411.500 .107
6.Experimental method
Male Female Total
75 46 121
55.14 69.43
4135.50 3124.50
1285.500 .020
7. Collaborative learning Male Female Total
75 46 121
55.94 69.25
4195.50 3185.50
1345.500 .034
8.Peer Teaching Male Female Total
75 46 121
56.79 65.09
4146.00 2994.00
1445.500 .186
Mann-Whitney U test provides the variation between male and females lecturers about the teaching methods. It can be seen from table 5 that in respect to project-based learning male lecturers are using the method more than the female lecturers more (U=1314.000, P<0.05). Likewise, Experimental method is more preferable by male lecturers more than female lecturers (U=1285.500, P<0.05). Concerning the collaborative learning, there is a significant difference between the male and female lecturers’ views, male lecturers are using it more and significantly than female lecturers (U=1345.500, P<0.05).

Journal for Educators, Teachers and Trainers JETT, Vol. 9 (2); ISSN: 1989-9572
176
2.6. Views of lecturers on teaching according to lecturers’ work experiences Views of lecturers on used teaching methods according to their work experience take place in Table 6. Mann-Whitney U test was conducted to determine the results. Table 6. Lecturers’ views on used teaching mehods according to work experience
Items Experience N Mean Rank
Sum of Ranks
U P
1. Lecture Method 1-15 15-above Total
66 55 121
59.21 63.15
3908.00 3473.00
1697.000 .490
2. Seminar Method 1-15 15-above Total
66 55 121
60.42 61.69
3988.00 3393.00
1777.000 .837
3. Problem based Learning 1-15 15-above Total
66 55 121
62.19 59.57
4104.50 3276.50
1736.500 .673
4. Project based Learning 1-15 15-above Total
66 55 121
64.98 56.23
4288.50 3092.50
1552.500 .156
5. Case Method 1-15 15-above Total
66 55 121
61.72 59.05
4012.00 3248.00
1708.000 .667
6. Experimental method 1-15 15-above Total
66 55 121
61.07 59.83
3969.50 3290.50
1750.500 .835
7. Collaborative learning 1-15 15-above Total
66 55 121
63.27 5828
4175.50 3205.50
1665.500 .415
8. Peer Teaching 1-15 15-above Total
66 55 121
59.49 60.59
3807.00 3332.00
1727.500 .858
When we categorized the lecturers based on experience years, as it can be seen in Table 6, there is no significant difference between the views of less experienced and more experienced lecturers meaning that the both categories have the same opinion on the usage of given teaching methods. This can be interpreted as used teaching methods does not depend on lecturers’ work experiences. 2. Conclusion and recommendation Regarding the lecturers view about teaching the finding suggests that the majority of the lecturers are disagree with the statement of (teaching is encouraging students to ask questions and motivating students to learn). More than 90% of the lecturers think that teaching doesn’t transmit important knowledge to students. In contrary of expectations the lecturers believe that the communication between lecturers and students is not a part of teaching. However, the lecture candidates don’t reject that teaching is stimulating students to think critically. Moreover, 13.2% of the lecturers indicate that through teaching they pass their experiences to students. Further, 4.27% of the lecturers think that teaching is supporting and caring for students.

Journal for Educators, Teachers and Trainers JETT, Vol. 9 (2); ISSN: 1989-9572
177
In the section of view of the lecturers on teaching, the view of the lecturers is significantly different in terms of gender. The female lecturers are more positive and agree with respect of the items of the “Motivating students to learn, Transmitting important knowledge to students, providing up to date and interesting resource material for students, promoting conceptual changes in students, setting challenging problems and assignment, and helping students to cope with them, communicating ideas between lecturer and students, Supporting and caring for students, passing on lecturers’ experiences to students, Displaying enthusiasm for the subject matter”. Also, there is a significant difference between the views of lecturers in terms of their experience in a way that the less experienced lecturers more agree with the statements about “communicating ideas between lecturers and students and Setting challenging problems and assignment and helping students to cope with them”. Considering the teaching methods, findings report that the lecturer candidates are highly benefiting from using lecture methods and other teaching methods that are proposed to them which are seminar method, problem-based method, project-based method, case method, collaborative/cooperative learning and peer teaching. Furthermore, it can be seen that in respect to project based learning and collaborative learning male lecturers are using the method more than the female lecturers, these differences are statistically significant. However, there is no significant difference between the views of the lecturer candidates with respect of the working experiences. From the findings, we recommend that the university should provide more technology in teaching tools. In contrary of our expectations, the lecture candidates were very disappointed about the teaching process that on average they believe that teaching will not encourage students to learn and more than 90% of the lecturers think that teaching does not transmit important knowledge to students on the other hand a few of the lecturer candidate were agree with the statement that teaching is supporting and caring for students and through teaching they pass their experiences to the students. Finally, further researches can be employed in different levels of the educational institutions, different colleges and different universities by using more variables or different variables. Other methodology can be used to investigate the same field of this thesis such as qualitative research.
3. References
Acker, D. G. (1999). Improving the quality of higher education in agriculture globally in the 21st
century: Constraints and opportunities. Journal of International Agricultural and Extension Education, 6(2), 47-53.
Botkin, J. W., Elmandjra, M., & Malitza, M. (2014). No Limits to Learning: Bridging the Human Gap: The Report to the Club of Rome. Elsevier.
Cano, J., Garton, B. L., & Raven, M. R. (1992). Learning styles, teaching styles and personality styles of preservice teachers of agricultural education.Journal of Agricultural Education, 33(1), 46-52.
Coe, R., Aloisi, C., Higgins, S., & Major, L. E. (2014). What makes great teaching? Review of the underpinning research.
Coley, M. D., Warner, W. J., Stair, K. S., Flowers, J. L., & Croom, D. B. (2015). Technology Usage of Tennessee Agriculture Teachers. Journal of Agricultural Education, 56(3), 35-51.
Eid, F. H. (2014). Research, higher education and the quality of teaching: Inquiry in a Japanese academic context. Research in Higher Education Journal, 24, 1.
Idris, L. M. (2014). Attitudes of Teaching staff of the College of Agriculture and Forestry University of Mosul to Aowards Assessing the Students for Their Teaching. Journal of Tikrit University For Agriculture Sciences, 13(2), 204-209.
Jamel, Y.M. (2006). Teaching and Learning Styles in a College of Agriculture – Mosul University, Journal of Iraqi agricultural Rafidain. 34(3), 10-14.
Jamil Y.M. (2012). Teaching Clarity at the College of Agriculture Mosul University. Journal of Iraqi agricultural Rafidain, 40(3), 16-22.

Journal for Educators, Teachers and Trainers JETT, Vol. 9 (2); ISSN: 1989-9572
178
García Laborda, J.& Litzler, M.F. (2015). Current approaches in teaching English for Specific Purposes. Revista Onomázein, 31, 38-51.
García Laborda, J., Magal Royo, T., Litzler, M.F. & Giménez López, J.L. (2014). Mobile phones for a University Entrance Examination language test in Spain. Educational Technology & Society, 17(2), 17-30.
McInerney D 2014. Educational Psychology Constructing Learning. Australia: Pearson Higher Educational.
Morin, A., Nedzela, M. & Quon, T. (2001). Summary of the results of the survey on teaching. http://simulium.bio.uottawa.ca/questionnaire/Teaching.eng.pdf retrieved from 27.05.2015. Review of the underpinning research.
Robinson, J. S., Montgomery, D., & Edwards, M. C. (2012). Perceptions of teaching ability during the student teaching experience in agricultural education. Aligning Kolb’s Experiential Learning Theory with a Comprehensive Agricultural Education Model, 53(4), 29-40.
Sajjad, S. (2010). Effective teaching methods at higher education level. Available from Internet: http://www. wfate. org. Reterived at 11.10.2015.
Torres, R. M., & Cano, J. (1994). Learning styles of students in a college of agriculture. Journal of Agricultural Education, 35(4), 61-66.

Journal for Educators, Teachers and Trainers JETT, Vol. 9 (2); ISSN: 1989-9572
179
ISSN 1989 - 9572
Opinions of special education students on distance education certificate programs Opiniones de los estudiantes de educación especial en programas de certificado de educación a distancia
Pelin Gür, Zöhre Serttaş,
Huseyin Bicen,
Near East University, Turkey
Journal for Educators, Teachers and Trainers, Vol. 9 (2) http://www.ugr.es/~jett/index.php
Date of reception: 9 October 2018
Date of revision: 26 December 2018
Date of acceptance: 31 December 2018
Gür, P., Serttaş, Z., & Bicen, H. (2018). Opinions of special education students on distance education certificate programs. Journal for Educators, Teachers and Trainers, Vol. 9(2). 179 – 189.

Journal for Educators, Teachers and Trainers JETT, Vol. 9 (2); ISSN: 1989-9572
180
Journal for Educators, Teachers and Trainers, Vol. 9 (2) ISSN 1989 – 9572
http://www.ugr.es/~jett/index.php
Opinions of special education students on distance education certificate programs Opiniones de los estudiantes de educación especial en programas de certificado de educación a distancia Pelin Gür, [email protected] Zöhre Serttaş, [email protected] Huseyin Bicen. [email protected] Near East University, Turkey Abstract: In this study, the opinions of the undergraduate, graduate and PhD students were taken who study in the special education department about the certificate programs opened by distance education for the individuals with physical, visual and hearing impairment. The Qualitative research method was used in the research. In this context, the researchers prepared the interview questions used in the research. 40 volunteer students from the Department of teaching who were mentally handicapped, MA and PHD programs for the special education have attended the research at the Near East University during 2015-2016-fall semester. The answers given by the students to the questions within the scope of the research were re-examined with the expert opinion and the results were later interpreted by using the induction technique. According to the results of this research, the provided education by distance education method with 24 hour access without time and space limitation gives great advantage to disabled individuals. The distance education certificate programs have also resulted in the employment opportunities for the people with hearing, sight and physical inability as enabling them to continue life without being isolated from the society. Certificate programs about surveyor training, e-marketing and working as an operator in call centers are given for the physically handicapped people. For the visually impaired people certificates are given in order to enable them to work as an operator in call centers, as translators, as online trainers. Lastly, certificates about training for sign language, graphic design, web design and programming are given to the people with hearing impairment Resumen: En este estudio, se tomaron las opiniones de los estudiantes de grado, posgrado y doctorado que estudian en el departamento de educación especial sobre los programas de certificación abiertos por la educación a distancia para las personas con discapacidades físicas, visuales y auditivas. Método de investigación cualitativa se utilizó en la investigación. En este contexto, las preguntas de la entrevista utilizadas en la investigación fueron preparadas por los investigadores. 40 estudiantes voluntarios del Departamento de enseñanza para discapacitados mentales, programas de maestría y doctorado para la educación especial han asistido a la investigación en la Universidad de Oriente Próximo durante el semestre de otoño 2015-2016. Las respuestas dadas por los estudiantes a las preguntas dentro del alcance de la investigación fueron reexaminadas con la opinión de expertos y los resultados se interpretaron posteriormente mediante el uso de la técnica de inducción. De acuerdo con los resultados de esta investigación, proporcionar educación a través del método de educación a distancia con acceso las 24 horas sin limitación de tiempo y espacio brinda una gran ventaja a las personas discapacitadas. Los programas de certificación de educación a distancia también han dado como resultado oportunidades de empleo para las personas con audición, vista e incapacidad física que les permiten continuar la vida sin estar aislados de la sociedad. Los programas de certificación sobre capacitación de topógrafos, e-marketing y trabajo como operador en centros de llamadas se otorgan a las personas con discapacidades físicas. Para las personas con discapacidad visual, los certificados se otorgan para permitirles trabajar como operadores en centros de llamadas, como traductores como capacitadores en línea. Por último, los certificados de capacitación en lenguaje de señas, diseño gráfico, diseño web y programación se entregan a las personas con discapacidad auditiva Keywords: Special education; Distance education; E-learning; Certificate Palabras clave: Educación especial; Educación a distancia; E-aprendizaje; Certificado

Journal for Educators, Teachers and Trainers JETT, Vol. 9 (2); ISSN: 1989-9572
181
1. Introduction With the rapid growth of technology, the use of technology in education has now become widespread. Moreover, traditional education is being replaced by student-centered education with the use of educational technologies. The technological and scientific world is developing at such a remarkable pace that traditional teaching methods and techniques of information sharing and transferring are inadequate (Kayaduman, Sarikaya & Seferoglu, 2011; Birkollu, Yucesoy, Baglama & Kanbul, 2017). Individuals with disabilities have different characteristics in terms of their level of development. Well-programmed computer-aided teaching software enables people with disabilities to progress according to their needs. The presentation of the information and the desired responses can be arranged separately for each individual. The individual determines their working hours independently according to their needs regardless of time and place (Demirhan, 2008). The Internet has become one of the vital ways to make available resources in learning area for both teachers and students to share and acquire information (Richard and Haya 2009). This emphasizes the importance of the necessary educational training programs and strategies that use technological tools and materials (Cabı & Ergun, 2016). It is inevitable that the developments in technology will affect every part of life, including the learning-teaching processes. The expectation of modern schools is that they should be capable of educating individuals who are equipped with the skills to access and effectively use information (Uzunboylu & Tugun 2016; Yılmaz, Uredi & Akbaşlı, 2015; Baglama, Yikmis & Demirok, 2017). The widespread use of technological support in traditional educational settings has led to the implementation of technology in special education. The use of technology in education is provided in all areas including special education, providing convenience to many field instructors and students (Elicin & Tunali, 2016). The new and more effective technological materials are being developed and used in the field of education, as the contribution of technology to education and training continually increases. The inclusion of these materials into the education process reduces the time spent on accessing information (Bal & Bicen, 2016). The rapid development of modern technology also plays an important role in the education of people with disabilities (Goker, Ozaydin & Tekedere, 2016; Yilmaz & Naci, 2017). The educational environment is particularly important for students with visual, hearing and physical disabilities. In the same manner as their social lives and the educational lives of people with disabilities are also limited by certain obstacles. The educational needs of these individuals can vary according to their disability. The occurrence of these difficulties stems from the lack of suitable learning environments for students with inadequacies. In this context, when assistive technologies are effectively used for individuals with various disabilities, it enables independent special education individuals to receive training independently, without any assistance (Lee & Templeton, 2008). The inability to hear causes individuals to not to perceive the word warning from the environment, and this situation leads to the lack of understanding and comprehension of vocabulary (Kaya, 2002). Along with the rapid development of technology and the increase of new technological devices for individuals with disabilities, the use of technology in the education of individuals with various inadequacies has increased (Sagirani, Ferdiana & Kumara, 2013). The most important benefit for visually impaired students is the use of auditory and verbal concepts (Kuzu, Odabasi & Girgin, 2011). It has been found that hearing-impaired learners learn more vocabulary from storybooks they read in digital multimedia than from traditional printed books (Donne & Briley, 2015). As education and training are conducted with the support of process technology, technology is used effectively and adapted to the digital medium of organizing and sharing pedagogical information (Hu, 2012). In parallel with this rapid progress in the digital platform, it has become inevitable that the term distance education has emerged as a result of the increase of the individual's philosophy of independent and lifelong learning, it is the philosophy without the necessity to adhere to a certain time or place in the education and training process (Ozkanal &

Journal for Educators, Teachers and Trainers JETT, Vol. 9 (2); ISSN: 1989-9572
182
Ozgur, 2017). Audio-visual environments are very important for the permanence of learning. The more sensory organs are mobilized during instruction, the more effective learning is. Training technologies shorten the teaching time, keep interest alive, embody abstract concepts, provide realistic experiences and create more learning will (Çakir, Çetin & Abidin, 2013). Distance education is an educational model in which education and training are implemented by using digital course materials, along with various visual and auditory instruments in a manner that is not dependent on time or place in accordance with determined targets and plans (Alkan,1987). The aim of distance education is to provide lifelong learning and to ensure that education and teaching can be provided students without requiring them to physically attend the school or to adhere to a fixed timetable. In this respect, it emphasizes the importance of the students who continue their education in the contexts in order to carry out their teaching activities afterwards (Ekici, 2003). Distance education is realized by the sharing of information between educator and the student in the virtual environment. This form of education is not only important in terms of general education school but it is also relevant to certification programs and has increased in popularity. Distance education and certification programs are realized through online training sessions (Natarajan, 2015). Distance Education Certificate Programs use teaching management systems, such as e-educator, diverse blogs, live diaries, discussion groups, videos, chat forums and virtual classroom activities and these have acquired a different educational dimension. Distance education certificate programs are implemented as online training programs conducted by Distance Education Center units from various universities in Turkey (Fidan, 2016; Ozturk, Eyikara & Baykara, 2017). Certification programs, which are realized with distance education, adopt the philosophy of learning by all individuals and living individually (Gulbahar & Karatas, 2016; Yalcinkaya, 2012) According to Tao et al. (2006), this new environment for learning that is centered on electronic networks, has allowed learners to receive individualized support and also to have learning schedules that is more suitable to them as well as separate from other learners. E-learning in students which is characterized by the use of multimedia constructs, made the process of learning more active, interesting and enjoyable (Arkorful & Abaidoo, 2015). By using the opportunities provided by information technologies, learning environments and learning materials that are suitable for the needs of hearing-impaired individuals can be arranged and their disadvantaged situations can be minimized according to their normally developed peers (Kuzu, Odabaş & Girgin 2011). In this context, integrating the education to the technology has played an important role in strengthening students’ learning so that it enables them to discover their abilities (Bicen & Uzunboylu, 2013; Laborda, Uzunboylu & Ross, 2016). The training given within the scope of the distance education certificate programs is designed by preparing training programs with the aim that applied and institutional information can be learned from a distance. After completing the program successfully, individuals can find job opportunities in their desired professions (Erguney, 2015; Yuzer, Firat & Dincer, 2016). When integrating technology with special education, it is necessary to set educational targets for the needs of individuals with disabilities, also to create online training programs, to monitor and apply rapidly changing technology, and to provide opportunities for every student to have equal access to technological resources (Eliçin & Tunalı, 2016). Visually impaired individuals should be able to live together with the society, to be educated on an equal basis as everyone, and to use technology to create jobs in many different areas. With the help of computer technology, the visually impaired person can read his own book without the need for another person, can use the internet to prepare his own notes, or even she or he can be a computer programmer (Emiroğlu, 2008). As a result, information technology has become a highly important sector in terms of employment. In this area, barriers can be overcome through allowing individuals with disabilities to be employed in these areas (Catalano, 2014; Baglama & Demirok, 2016). Steps have been taken to improve the education of visually impaired individuals and students, such as the creation of audio libraries with technology (Aydın, 2012). People who use tablets with
Journal for Educators, Teachers and Trainers JETT, Vol. 9 (2); ISSN: 1989-9572
183
auditory stimuli have increased levels of learning. In particular, the development of voice services has improved accessibility for visually impaired individuals. Furthermore, it is important that the graphical interface has improved. With the touch and swipe technique, it is possible for these students to follow the vibrations and to access the desired resources by entering their handwriting (Emiroglu, 2008). Individuals with hearing impairment are at a disadvantage compared to other individuals due to their inadequate oral and written communication (Karal & Ciftci, 2008). Consequently, researchers have shown increased interest in recent years regarding how technology can be used effectively in the education of individuals with special needs. This research aims to determine the opinions of prospective teachers regarding the use of distance education systems in the education of individuals with visual, hearing and physical disabilities. 1.1. Purpose of the research The purpose of this study is to determine the views of undergraduate, graduate and doctoral-level special education students on the use of distance education systems for individuals with hearing, vision and physical disabilities. Answers to the following questions are sought in order to achieve this aim:
1. Distance education systems for individuals with hearing, vision, and physical disabilities; a) What are the advantages? b) What are the disadvantages?
2. Do distance learning certificate programs provide employment opportunities for individuals with hearing, vision and physical disabilities?
3. What distance education certificate programs can be offered for people with hearing, vision, and physical disabilities?
2. Materials and methods 2.1. Model of the research Three qualitative interview questionnaires were created and conducted. The research is based on an interview-based inductive analysis model for qualitative research. 2.2. Working group The study group of this research was composed of 40 volunteer students studying at the graduate and doctoral level in the field of special education at Near East University. In total, 35 of these students were undergraduate students and 5 of them were doctoral students. Although the interview questions given for the study were distributed equally to undergraduate, graduate and doctorate level students, the number of interviews obtained was 40 and understandable. 2.3. Development of data collection tools An opinion form prepared by the researcher was used. This form consists of demographic information, and 3 open-ended questions. Expert opinion was taken to ensure the validity of the data collection tool and the final form was thus established. 2.4. Analysis of data The answers given by the students to the interview questions developed by the researcher were examined by taking expert opinion and the obtained results were interpreted by using the
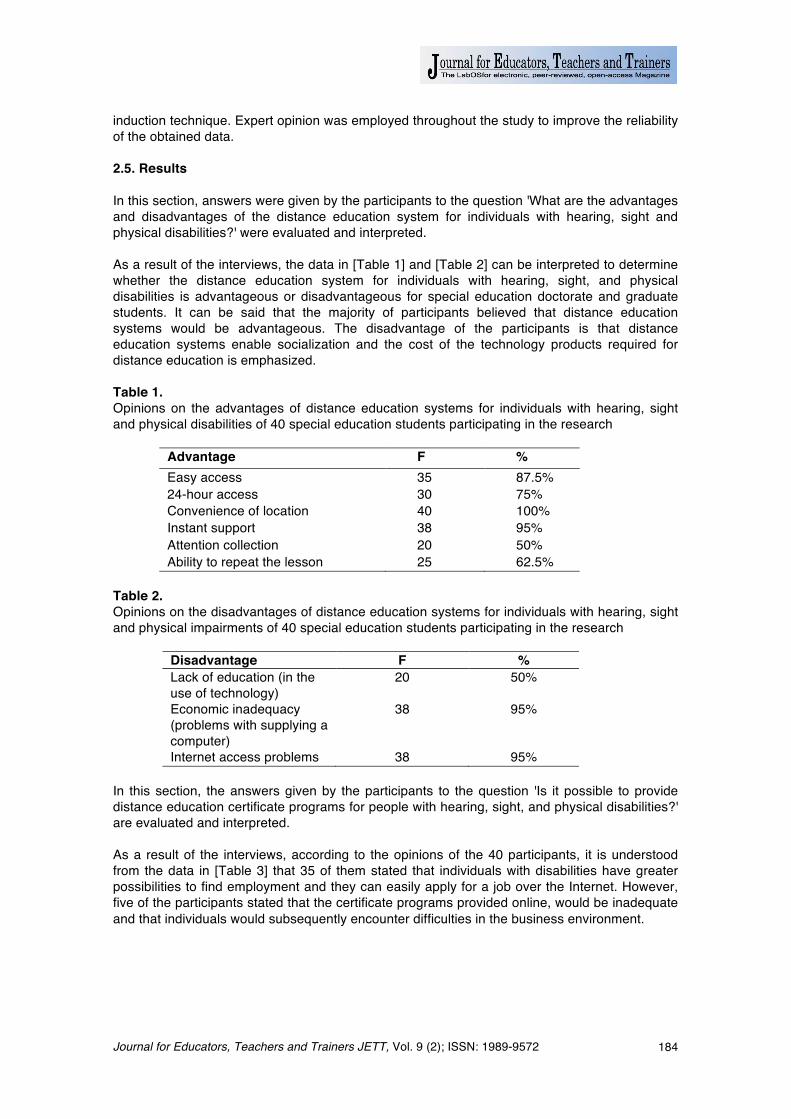
Journal for Educators, Teachers and Trainers JETT, Vol. 9 (2); ISSN: 1989-9572
184
induction technique. Expert opinion was employed throughout the study to improve the reliability of the obtained data. 2.5. Results In this section, answers were given by the participants to the question 'What are the advantages and disadvantages of the distance education system for individuals with hearing, sight and physical disabilities?' were evaluated and interpreted. As a result of the interviews, the data in [Table 1] and [Table 2] can be interpreted to determine whether the distance education system for individuals with hearing, sight, and physical disabilities is advantageous or disadvantageous for special education doctorate and graduate students. It can be said that the majority of participants believed that distance education systems would be advantageous. The disadvantage of the participants is that distance education systems enable socialization and the cost of the technology products required for distance education is emphasized. Table 1. Opinions on the advantages of distance education systems for individuals with hearing, sight and physical disabilities of 40 special education students participating in the research
Advantage F % Easy access 35 87.5% 24-hour access 30 75% Convenience of location 40 100% Instant support 38 95% Attention collection 20 50% Ability to repeat the lesson 25 62.5%
Table 2. Opinions on the disadvantages of distance education systems for individuals with hearing, sight and physical impairments of 40 special education students participating in the research
Disadvantage F % Lack of education (in the use of technology)
20 50%
Economic inadequacy (problems with supplying a computer)
38 95%
Internet access problems 38 95% In this section, the answers given by the participants to the question 'Is it possible to provide distance education certificate programs for people with hearing, sight, and physical disabilities?' are evaluated and interpreted. As a result of the interviews, according to the opinions of the 40 participants, it is understood from the data in [Table 3] that 35 of them stated that individuals with disabilities have greater possibilities to find employment and they can easily apply for a job over the Internet. However, five of the participants stated that the certificate programs provided online, would be inadequate and that individuals would subsequently encounter difficulties in the business environment.

Journal for Educators, Teachers and Trainers JETT, Vol. 9 (2); ISSN: 1989-9572
185
Table 3. Opinions of 40 special education students who participated in the research on providing employment opportunities to individuals with hearing, sight, and physical disabilities through distance education systems
Can job opportunities be provided?
F %
Yes 35 87.5% No 5 12.5%
Providing education through the Internet for individuals who experience mobility problems and providing them with employment opportunities, can be particularly beneficial. Distance education reduces the problems that individuals with disabilities face in their daily lives, which also increases their self-confidence. In this section, the answers given by participants to the question 'Which distance education certificate programs can be opened for individuals with hearing, sight and physical disabilities?' are assessed and interpreted. Table 4. Certificate programs for individuals with Hearing Disabilities, Vision Disabilities and Physical Disabilities
3. Conclusion and future studies In the present study, research was conducted on the advantages, disadvantages, and also the benefits of the use of distance education in the teaching of visually, hearing and physically disabled individuals according to students on special education teaching programs. This is particularly important when it is considered that technology is thought to facilitate the learning and daily lives of individuals in need of special education (Brodin & Lindstr, 2003). In the computer aided teaching method, individualized educational materials are offered to students to learn according to their abilities and speed. Students with disabilities can learn
Individuals with hearing impairment
F % Individuals with visual disability
F % Individuals with physical
disability
F %
Sign language instructor
38 95% Online Instructor
38 95% Training of trainers
25 62.5%
Sign language interpreter
30 75% Interpreter-ship
35 87.5% Graphic design 35 87.5%
Online Instructor
15 37.5% Computer operator
26 65% Marketing 30 75%
Microsoft Office programs
36 90% Call center operator training
38 95% Call center operator training
40 100%
Graphic design 30 75%
Diction and effective speaking
30 75% SPSS Trainer 10 25%
Web design and programming
35 87.5% Web design and programming
15 37.5%
Interpreter-ship 20 50% Interviewer training
20 50%

Journal for Educators, Teachers and Trainers JETT, Vol. 9 (2); ISSN: 1989-9572
186
according to individual learning pace in specially organized computer-aided learning environments (Çiftçi, 2009). In the context of this study, according to the special education teacher candidates; the participants identified a disadvantage that some individuals may not be adequate in using the technology materials, while claiming that transportation was an advantage, in response to the question: What are the advantages and disadvantages of distance education for individuals with special needs?. We received a special group from a private group with distance education that can be taken 24 hours a day and can be connected from home with great advantage for disabled people. In this way, foreign education certificate increases the possibility of finding a job for disabled individuals. Programs that can be taken with distance education include certificates, online trainer, web design and programming, sign language education. (Süzen & Taşdelen, 2013). Furthermore, the teacher candidates expressed the view that 24-hour information accessibility, lack of dependence on time or location, educational support and opportunities to repeat lessons continuously were the benefits. Zeng, Miao & Weber (2015) stated that assistant technology facilitated the life of the individuals with special needs by providing them with increased employment opportunities. Çolak, Yüksel, Sunguray & Gümüş (2013), in their study of motion-based technologies, said that using such technologies in the education of individuals with special needs; the learning process of these individuals can be facilitated and the permanence of the learners can be achieved. They also stated that by joining 'distance education’ and ‘certificate programs' from any location of their choice, they would be able to find future employment with the certificates obtained from these programs without adhering to a specific place and they could also easily apply for employment opportunities through the Internet. Some participants stated that the certificate programs designed to be conducted on the Internet would be inadequate and the individuals would experience difficulties when entering to the business environment. Providing education on the Internet for individuals who have transportation difficulties and creating employment opportunities, is a significant benefit. Distance education reduces the problems that individuals with disabilities face in their daily lives. This, on the contrary, increases the individual’s self-confidence (Süzen & Taşdelen 2013). While these settings are in use, it is necessary to determine the degree of learning and how to evaluate the disabled individuals and also the individual differences should be taken into account according to the degree of deprivation and the degree of disability (Halimi, 2017; Menzi-Cetin, Alemdag, Tuzun & Yildiz, 2017). As a result of the answers to the research questions given by the study participants, it is evident that certificate programs can be opened based on these findings. The rapid growth in technology, both in the educational environment and in the business environment, has become one of the most important aspects of modern life. The use of technology in our lives plays a significant role in adapting to the problems faced in society (Şemseddin & Odabaşı, 2004) Distance education, which provides education without the limitation of time and space for individuals with various inadequacies, offers job opportunities by taking training in the field which they want (Tanyeri & Tüfekçi 2010). We can say from this study that we have resulted that the individuals who have hearing and physical disability can easily benefit from these certificate programs which are given with distance education without being adhering to a certain place and that employment opportunities with these certificates can increase. Distance education, which provides education to individuals with various disabilities without the limitations imposed by time and space, creates employment opportunities by enabling these individuals to receive training in their chosen field (Gurbulak & Esgin, 2016). The results of this study indicate

Journal for Educators, Teachers and Trainers JETT, Vol. 9 (2); ISSN: 1989-9572
187
that individuals who have hearing or physical disabilities can easily benefit from these kinds of certificate programs that are given through distance education and that employment opportunities based on this certification can increase. Education targets should be determined based on the needs of individuals with disabilities, online education should be established, new technologies must be observed and implemented, and moreover every student and individual should have equal access to technological resources (Gurbulak & Esgin, 2016). Based on the findings of this study, certification programs based on the interests of these individuals and the professions in which they can be employed; can be opened by providing the necessary technological support based on the needs of individuals with physical, visual and hearing impairments. According to the related literature, it can be suggested that the studies on the education of individuals with visual disturbance and hearing loss by distance education should be increased. 4. References Alkan (1987). Acikogretim: Examination as a Comparison of Distance Education Systems.
Ankara University Faculty of Education Sciences Publications 15, Ankara. Arkorful & Abaidoo (2015). The role of e-learning, advantages and disadvantages of its adoption
in higher education. International Journal of Instructional Technology and Distance Learning, 12(1), 29-42.
Aydın (2012). A Research on Information Access Problems of Visually Impaired University Students. The World of Knowledge. 13(1), 93-116.
Baglama & Demirok (2016). Determination of preservice special education teachers’ views on early childhood intervention. Cypriot Journal of Educational Sciences. 11(4), 213-222. doi: 10.18844/cjes.v11i4.1297
Baglama, Yikmis & Demirok (2017). Special education teachers view on using technology in teaching mathematics. European Journal of Special Education Research. 2(5), 120-134.
Bal, E., & Bicen, H. (2016). Computer Hardware Course Application through Augmented Reality and QR Code Integration: Achievement Levels and Views of Students. Procedia Computer Science,102, 267-272. doi: 10.1016/j.procs.2016.09.400
Bicen & Uzunboylu (2013). The Use of Social Networking Sites in Education: A Case Study of Facebook. J. Ucs. 19 (5), 658-671.
Birkollu, Yucesoy, Baglama & Kanbul (2017). Investigating the Attitudes of Pre-service Teachers Towards Technology Based on Various Variables. TEM Journal. 6(3), 578-583.
Brodin & Lindstr (2003). What About ICT in Special Education? Special Educators Evaluate Information and Communication Technology as A Learning Tool. European Journal of Special Needs Education. 18(1), 71-87.
Cabı & Ergün (2016). The Effect of Instructional Technology and Material Design Course on the Concerns of Teacher Candidates for Using Technology in Education. Capital Universities Journal of Education. 3(1).
Catalano (2014). Improving Distance Education for Students with Special Needs: A Qualitative Study of Students' Experiences with An Online Library Research Course. Journal of Library & Information Services in Distance Learning. 8(1-2), 17-31.
Çakır, Çetin & Abidin (2013). İşitme Engellilere Yönelik Dinamik Web Sayfasının Geliştirilmesi. Bilişim Teknolojileri Dergisi, 6(2), 1.
Çiftçi (2009). İşitme Engelli Öğrenciler İçin Hazırlanan Bilgisayar Destekli Yazılı Anlatım Becerisi Geliştirme Materyalinin Tasarımı, Uygulanması ve Değerlendirilmesi, Yüksek Lisans Tezi, Karadeniz Teknik Üniversitesi, Fen Bilimleri Enstitüsü, 2009.
Çolak, Yüksel, Sunguray & Gümüş (2013). Uzaktan Kontrollü Insan Makine Arayüz Uygulamasıyla Yeni Bir Eğitim Platformu. SDU Teknik Bilimler Dergisi. 3(5), 15.
Demirhan (2008). Bilişim teknolojilerinin işitme engellilerin eğitimine etkisinin incelenmesi (Master's thesis).

Journal for Educators, Teachers and Trainers JETT, Vol. 9 (2); ISSN: 1989-9572
188
Donne and Briley (2015). Multimedia Storybooks: Supporting Vocabulary for Students Who Are Deaf/Hard-Of-Hearing. International Journal of Special Education. 30(2), 94-106.
Ekici (2003). Uzaktan Eğitim Ortamlarının Seçiminde Öğrencilerin Öğrenme Stillerinin Önemi. Hacettepe Üniversitesi Eğitim Fakültesi Dergisi. 24(24).
Elicin and Tunali (2016). The Effectiveness of Tablet Computer Use in Achievement of Schedule-Following Skills by Children with Autism Using Graduated Guidance. Egitim ve Bilim. 41(183).
Emiroglu (2008). Üniversitelerde Görme Engelli Öğrenciler Için Bilişim. X. Akademik Bilişim Konferansı, (30Ocak-1Şubat, 2008), Çanakkale Onsekiz Mart Üniversitesi, Çanakkale.
Erguney (2015). Uzaktan Eğitimin Geleceği: MOOC (Massive Open Online Course). Eğitim ve Öğretim Araştırmaları Dergisi. 4(4), 15-22.
Fidan (2016). Uzaktan Eğitim Öğrencilerinin Uzaktan Eğitime Yönelik Tutumları Ve Epistemolojik Inançları. Hacettepe Üniversitesi Eğitim Fakültesi Dergisi [Hacettepe University Journal of Education]. 31(3), 536-550.
Goker, Ozaydin & Tekedere (2016). The Effectiveness and Usability of The Educational Software on Concept Education for Young Children with Impaired Hearing. Eurasia Journal of Mathematics, Science & Technology Education. 12(1), 109-124.
Gulbahar & Karatas (2016). Uzaktan Öğretimi Uzaktan Eğitim Yöntemi İle Öğrenmek: E-Eğitmen Sertifika Programı. Kastamonu Eğitim Dergisi. 24(4).
Gurbulak & Esgin (2016). Özel Eğitimde Hareket Tabanlı Teknolojilerin Kullanımı. Retrieved from https://www.researchgate.net/publication/305700699_Ozel_Egitimde_Hareket_Tabanli_Teknolojilerin_Kullanimi_The_Use_of_Motion-Based_Technologies_in_Special_Education
Halimi (2017). The architecture of the mental lexicon and the selection of lexical nodes. Contemporary Educational Researches Journal. 6(4), 189-196. doi: 10.18844/cerj.v6i4.591.
Hu & Potter (2012). Designing Effective Online Learning Environment. SouthEast Education Network.
Karal & Çiftçi (2008). İşitme Engelli Bireylerin Eğitim Sürecinde Bilgisayar Destekli Animasyonlardan Yararlanma. In 8th International Educational Technology Conference, Online Papers: http://Ietc2008.home.anadolu.edu.tr/Ietc2008/86.doc.30(08)
Kaya (2002). Doğal İşitsel Sözel Yaklaşımla Eğitim Gören İşitme Engellilerde İnternet Destekli Öğretim Etkinliği ve Anadolu Üniversitesinde Bir Uygulama, Master Thesis, Anadolu Üniversitesi, Fen Bilimleri Enstitüsü, 2002.
Kayaduman, Sarıkaya & Seferoğlu (2011). Examination of The FATIH Project In Education in Terms of Teachers' Competence Status. Academic Informatics Conference, February 2-4 / Inonu University, Malatya. It Was Downloaded from www.Ab.Org.Tr/Ab11/Bildiri/136.doc on May 10, 2017.
Kuzu, Odabaşı & Girgin (2011). Click to Support Mobile Technologies for Hearing-Impaired Students: An Example from Turkey. Educational Technology Theory and Practice. 1(2), 52-82.
Laborda, Uzunboylu & Ross (2016). Future Trends in Computing Technology Education J. Ucs Special Issue. Journal of Universal Computer Science. 22 (1), 1-3.
Lee & Templeton (2008). Ensuring Equal Access to Technology: Providing Assistive Technology for Students with Disabilities. Theory into Practice. 47 (3):12-219.
Menzi-Çetin, N., Alemdağ, E., Tüzün, H., & Yıldız, M. (2015). Evaluation of a university website’s usability for visually impaired students. Universal Access in the Information Society,16(1), 151-160. doi:10.1007/s10209-015-0430-3
Natarajan (2015). Innovative Teaching Techniques for Distance Education. Communications of the IIMA. 5(4), 10.
Ozkanal & Ozgur (2017). Evaluations on Communication Education with Open and Remote Learning Method in Higher Education in Turkey. Selçuk University Faculty of Communication, Academic Journal. 9(4), 5-24.

Journal for Educators, Teachers and Trainers JETT, Vol. 9 (2); ISSN: 1989-9572
189
Ozturk, D., Eyikara, E., & Baykara, Z. G. (2017). The opinions of nursing students regarding the first implementation of distance education. World Journal on Educational Technology: Current Issues,9(2). doi:10.18844/wjet.v9i2.1362
Richard & Haya (2009). Examining student decision to adopt web 2.0 technologies: theory and empirical tests. Journal of computing in higher education, 21(3), 183-198.
Sagirani, Ferdiana & Kumara (2013). The Framework of Learning Media Development for The Children with Special Needs. In Proceedings of Innovation and Technology in Education, IEEE International Conference In MOOC.180-184. IEEE.
Şemseddin & Odabaşı (2004) Teacher Candidates in The Age of Information Teaching Technology in Education and Material Development Lesson. The Turkish Online Journal of Educational Technology. 3(1).
Süzen & Taşdelen (2013). Home Automation for The Handicapped Using Kinect Technology. SDU International Technologic Science. 5(2), 1-10.
Tanyeri & Tüfekçi (2010). Evaluation of A Distance Education Program in Terms of Use of Visual Impairments: A Sample of GÜUEP (In Turkish). International Conference on New Trends in Education and Their Implications. Antalya, Turkey.
Tao, Yeh & Sun (2006). Improving training needs assessment processes via the Internet: system design and qualitative study. Internet Research, 16 (4), 427–49
Uzunboylu & Tugun (2016). Validity and Reliability of Tablet Supported Education Attitude and Usability Scale. J. UCS. 22 (1), 82-93.
Yilmaz & Naci (2017). Eğitimde tablet bilgisayar ve akıllı tahta kullanımına ilişkin öğretmen görüşleri. International Journal of Innovative Research in Education. 4(1), 17-27. doi: 10.18844/ijire.v4i1.1255.
Yılmaz, Üredi & Akbaşlı (2015). Determination of The Perceptions of Computer Teacher Candidates' Perceptions of Computer Competence Levels and The Use of Technology in Education. International Journal of Humanities and Administration. 1(1), 105-121.
Yuzer, Firat & Dincer (2016). Use of Social Networks in Open and Distance Education: What Sociology Students share? New Trends and Issues Proceedings on Humanities and Social Sciences. 2(3), 39-44. doi: 10.18844/gjhss.v2i3.1052.
Zeng, Miao & Weber (2015). Interactive Audio-Haptic Map Explorer on a Tactile Display. Interacting with Computers. 27(4), 413-429.

ISSN 1989 – 9572
STANDARDS OF PUBLICATION AND EDITORIAL PROCESS
1- Papers submitted should not have been previously published nor submitted for current consideration elsewhere at the moment of submission to JETT.
2- Papers can be presented in Spanish, English, Portuguese, and French.
3- Papers must be related to education in its wide sense, training, and professionalization. JETT publishes research papers but also includes theoretical reflections, international literature reviews and interviews with relevant authors and book reviews of interest for the scientific community.
4- All participants are expected to adhere the Research Code of Conduct. If required, authors must certify their papers ethic committee approval.
5- JETT doesn’t take the responsibility of the contents, judgments, and the expressed opinions in the published papers. Neither it is responsible about possible authorship derivatives conflicts of the published papers in the magazine. These responsibilities have to be taken exclusively by the authors of the published papers. The responsibility for the content provided in the articles published and the opinions expressed are exclusively of the author(s) concerned. JETT is not responsible for errors in the contents or any consequences arising from the use of the information contained in it. The opinions expressed in the research papers/articles in this journal do not necessarily represent the views of the of the Journal.
6- Paper and articles must follow APA style.
7- The authors must read, accept and fulfill the established commitments in the license DIGIBUG (Spanish license, English license).
8- The papers and the DIGIBUG license (signed and filled) will be uploaded in the platform, exactly in the Step 4. “uploading supplementary files”.
9- Papers Features:
Extension: approximately 6000 words. Title: 2 languages (English and other). Authors: authors complete name, e-mail, department/knowledge area, and
position Abstract: 200-250 words in two languages (English and other). Key words: 3 to 6 descriptors in two languages (English and other). Fonts: Arial, 12. File format: .doc, .odt

ISSN 1989 – 9572
EDITORIAL PROCESS
1- Once the paper is received at the JETT OJS platform, the editorial board will make a first evaluation to check the paper meets the established standards and fits the magazine thematic. Moreover, the board will check that the license DIGIBUG has been fulfilled.
2- The papers overcoming the first evaluation will be submitted to an evaluation by double blind peer review.
3- Between the paper reception and the final evaluation result, should not exceed 5 months.

ISSN 1989 – 9572
STANDARDS FOR EVALUATORS
1- Articles will be evaluated using a double blind peer review by accredited specialists. Anonymity is assured.
2- Before starting the blind peer review process, the editorial board will make a first evaluation to check the article meets the required standards by the journal.
3- Articles overcoming the first review will be evaluated in two ways: the first one-internal (member of the editorial board), the other one-external. In case of discrepancy between the two processes, a third evaluation will be required.
4- Evaluators will apply the evaluation criteria established by JETT with complete independence and freedom. If there could be a conflict of interest in assessing an article, the reviewer must notify JETT, declining to perform the requested evaluation.
5- In order to review the articles, the evaluators will use the template available in Spanish, French, Portuguese and English.
6- Evaluators will have five options for the article global assessment, (in all cases the decision should be justified in the commentaries section):
Acceptable. Acceptable pending minor revision. Acceptable pending deep revision. Unacceptable but can be recommended to other journal. Unacceptable.
7- To avoid plagiarism conflicts, the evaluators should use the anti-plagiarism
application (Grammarly), and also the (Google and Google Scholar seekers).
8- Evaluators will send the evaluation report (filling in the template) to the JETT OJS platform no later than 20 days after the reception of the template.
9- For further information please contact [email protected]