Spatio-seasonal modeling of the incidence rate of malaria in Mozambique
11
BioMed Central Page 1 of 11 (page number not for citation purposes) Malaria Journal Open Access Research Spatio-seasonal modeling of the incidence rate of malaria in Mozambique Rosa Abellana* 1 , Carlos Ascaso 1,2 , John Aponte 2,3 , Francisco Saute 3 , Delino Nhalungo 3 , Ariel Nhacolo 3 and Pedro Alonso 2,3 Address: 1 Bioestadistica. Departament de Salut Publica, Universitat de Barcelona, Casanova 143, 08036, Barcelona, Spain, 2 Centro de Salud Internacional, Institut d'Investigacions Biomediques Agust Pi i Sunyer. IDIBAPS, Barcelona, Spain and 3 Centro de Investigaao em Saude da Manhiça (CISM), Ministério de Saúde, Manhiça, Maputo, Moçambique Email: Rosa Abellana* - [email protected]; Carlos Ascaso - [email protected]; John Aponte - [email protected]; Francisco Saute - [email protected]; Delino Nhalungo - [email protected]; Ariel Nhacolo - [email protected]; Pedro Alonso - [email protected] * Corresponding author Abstract Background: The objective was to study the seasonal effect on the spatial distribution of the incidence of malaria in children under 10 years old living in the Manhiça district, Mozambique. Methods: The data of the clinical malaria incidence were obtained from a study of two cohorts of children followed from December 1996 to July 1999. The cases were obtained by the active detection method. Hierarchical Bayesian models were used to model the incidence of malaria, including spatial correlation nested to climatic season. The models were compared with the deviance information criterion. The age and gender of the children were also taken into account. Results: The incidence of malaria is associated with age, period and climate season. The incidence presents a clear spatial pattern, with a higher incidence in the neighbourhoods situated in the north and northeast of the Manhiça area. The transmission of malaria is highest during the wet season but the spatial pattern of malaria does not differ from that during the dry season. Conclusion: The incidence of malaria in Manhiça presents a spatial pattern which is independent of the seasonal climatic conditions. The climate modifies the incidence of malaria in the entire region but does not change the spatial pattern of the incidence of this disease. These findings may be useful for the planning of malaria control activities. These activities can be performed taking account that the neighbourhoods with more incidence of malaria do not change over the annual climate seasons. Background Malaria has been and still is the cause of much human morbidity and mortality. Although the disease has been eradicated in most temperate zones, it continues to be endemic in most of the countries of sub-Saharan Africa and particularly, in the area of Mozambique where this study was performed. The study of malaria incidence con- ducted by Saute et al [1] in the area of Mozambique sup- ports the hypothesis of the existence of zones with higher levels of malaria risk. The Mapping Malaria Risk in Africa Published: 31 October 2008 Malaria Journal 2008, 7:228 doi:10.1186/1475-2875-7-228 Received: 21 May 2008 Accepted: 31 October 2008 This article is available from: http://www.malariajournal.com/content/7/1/228 © 2008 Abellana et al; licensee BioMed Central Ltd. This is an Open Access article distributed under the terms of the Creative Commons Attribution License (http://creativecommons.org/licenses/by/2.0 ), which permits unrestricted use, distribution, and reproduction in any medium, provided the original work is properly cited.
-
Upload
independent -
Category
Documents
-
view
5 -
download
0
Transcript of Spatio-seasonal modeling of the incidence rate of malaria in Mozambique

BioMed CentralMalaria Journal
ss
Open AcceResearchSpatio-seasonal modeling of the incidence rate of malaria in MozambiqueRosa Abellana*1, Carlos Ascaso1,2, John Aponte2,3, Francisco Saute3, Delino Nhalungo3, Ariel Nhacolo3 and Pedro Alonso2,3Address: 1Bioestadistica. Departament de Salut Publica, Universitat de Barcelona, Casanova 143, 08036, Barcelona, Spain, 2Centro de Salud Internacional, Institut d'Investigacions Biomediques Agust Pi i Sunyer. IDIBAPS, Barcelona, Spain and 3Centro de Investigaao em Saude da Manhiça (CISM), Ministério de Saúde, Manhiça, Maputo, Moçambique
Email: Rosa Abellana* - [email protected]; Carlos Ascaso - [email protected]; John Aponte - [email protected]; Francisco Saute - [email protected]; Delino Nhalungo - [email protected]; Ariel Nhacolo - [email protected]; Pedro Alonso - [email protected]
* Corresponding author
AbstractBackground: The objective was to study the seasonal effect on the spatial distribution of theincidence of malaria in children under 10 years old living in the Manhiça district, Mozambique.
Methods: The data of the clinical malaria incidence were obtained from a study of two cohorts ofchildren followed from December 1996 to July 1999. The cases were obtained by the activedetection method. Hierarchical Bayesian models were used to model the incidence of malaria,including spatial correlation nested to climatic season. The models were compared with thedeviance information criterion. The age and gender of the children were also taken into account.
Results: The incidence of malaria is associated with age, period and climate season. The incidencepresents a clear spatial pattern, with a higher incidence in the neighbourhoods situated in the northand northeast of the Manhiça area. The transmission of malaria is highest during the wet season butthe spatial pattern of malaria does not differ from that during the dry season.
Conclusion: The incidence of malaria in Manhiça presents a spatial pattern which is independentof the seasonal climatic conditions. The climate modifies the incidence of malaria in the entireregion but does not change the spatial pattern of the incidence of this disease. These findings maybe useful for the planning of malaria control activities. These activities can be performed takingaccount that the neighbourhoods with more incidence of malaria do not change over the annualclimate seasons.
BackgroundMalaria has been and still is the cause of much humanmorbidity and mortality. Although the disease has beeneradicated in most temperate zones, it continues to beendemic in most of the countries of sub-Saharan Africa
and particularly, in the area of Mozambique where thisstudy was performed. The study of malaria incidence con-ducted by Saute et al [1] in the area of Mozambique sup-ports the hypothesis of the existence of zones with higherlevels of malaria risk. The Mapping Malaria Risk in Africa
Published: 31 October 2008
Malaria Journal 2008, 7:228 doi:10.1186/1475-2875-7-228
Received: 21 May 2008Accepted: 31 October 2008
This article is available from: http://www.malariajournal.com/content/7/1/228
© 2008 Abellana et al; licensee BioMed Central Ltd. This is an Open Access article distributed under the terms of the Creative Commons Attribution License (http://creativecommons.org/licenses/by/2.0), which permits unrestricted use, distribution, and reproduction in any medium, provided the original work is properly cited.
Page 1 of 11(page number not for citation purposes)

Malaria Journal 2008, 7:228 http://www.malariajournal.com/content/7/1/228
(MARA) collaboration [2] located the Manhiça area as azone with seasonal and endemic malaria risk, with trans-mission being maximum between November and April.
There are natural and social factors affecting the dynamicsof the transmission of infection. Temperature and rainfallare considered major natural risk factors that affect thecycle's life and the breeding of the mosquitoes that trans-mit the malaria (Anopheles). In this area of study the mainspecies is Anopheles funestus (about 72.3% of the anophe-line population [3]). The eggs of the mosquito can surviveunder certain climatologic conditions, mainly humidityand warm temperature [4]. A reasonable amount of rain-fall can create additional breeding sites for mosquitoes,increasing their population, and extending the radius ofinfection. Temperature may affect the life expectancy ofthe mosquito and the behaviour of the human host. Thus,the variation in seasonal climatic conditions can changethe spatial distribution of the incidence of malaria. Tostudy the spatial distribution of the disease, Besag [5] pro-posed the conditionally autoregressive model thataccounts for spatial similarities among nearby regions.Later, Besag, York and Mollié [6] proposed a model forseparating the spatial effects from the overall heterogene-ity in the rates. To incorporate the effect of the climaticseason over the spatial variability of the rates around theneighbourhoods, the spatio-temporal model described byWaller et al [7] is used, changing the temporal concept forthe seasonal concept. This allowed us to define nested ran-dom effects, wherein the spatial effects are nested withinthe climatic season. In this way, the impact of the climaticseasons on the spatial patterns of the incidence of malariacould be evaluated. The conditionally autoregressivemodel is used with observations at regions of space (i.e.the analysis of aggregate count data per region in the con-text of disease mapping [8]) and the spatial correlation isusually defined among regions which are geographicallyclosed. However, geostatistical methods most often workwith observations at points of space with the objective ofmaking a statistical interpolation to a field or continuoussurface assumed to extend across the whole study area. Inthese methods the spatial correlation is based on the dis-tance or combination the distance and the location [9].
The main aim of this study was to evaluate whether thespatial patterns of the incidence of malaria in childrenunder the age of 10 years living in an endemic area of theManhiça district (in southern Mozambique) vary betweenthe wet and dry seasons. The variables of age and sex werealso considered in the analysis.
MethodsStudy area and populationThe study was performed in the Manhiça district (Prov-ince of Maputo) in Southern Mozambique where the Cen-tro de Investigaçao Saúde de Manhiça (CISM) is located.
The village of Manhiça, 25° 24'S and 32° 48'E, is situatedin an area of flat bush costal savannah along the coast ofMozambique, 80 km north of the capital Maputo. The vil-lage has an approximate extension of 120 km2. It islocated in a well-drained sandy elevate plane, surroundedby the Incomati River meanders (Figure 1). The lower riverfloodplain supports anopheline larval breeding all year.Houses are typically constructed with reeds and havethatched or corrugated roofs. Most of the populationinhabits the elevated area, and the lower plane is used forcrops. The climate is subtropical with two principal sea-sons, one warm and rainy lasting from November to April,defined as transmission malaria season by the MARAproject [2], and one cold and dry over the remainingmonths [1]. The annual rainfall was about 1,500 mm dur-ing the study period. The average temperature was about23°C, whereas the mean temperature for June and July isaround 19°C and for January between 26 and 27°C (Fig-ure 2). The temperature and the rainfall were recorded bythe climatology station located near CISM.
The area was subdivided using its political-administrativedivision and 115 neighbourhoods were obtained. Thisarea is under demography surveillance since 1996 [10].The population of this area is commonly peri-rural orrural, and most of the families make a living working incooperatives of sugar, bananas and rice. This area has onehospital, the Manhiça Health Centre with 80 beds.Finally, this area has a main road and a railway whichcrosses the area from south to north.
The source of maps of the area was the Direcção Nacionalde Geografia e Cadastro of Mozambique (Numbers of ref-erence: SG-36/I-I-NE page 1169 2532, SG-36/J-I-NO page1170 2533A1, SE-26/V-III-SO page 1178 2532B3, SG-36/I-IV-SO page 1179 2532B4). The maps were scanned andgeoreferenced the limit of the neighbourhoods by CISM.
Study subjects and covariate dataData on the incidence of clinical malaria episodes wereobtained from a study performed by the CISM in this area[1]. Two cohorts of children were studied. The first cohortwas a random sample stratified by age of children lessthan 10 years old followed from December 1996 to July1999. The second cohort, which complemented the first,was composed of the children born in each year of thestudy. The children under study had to reside in the studyarea for at least three months, and in the case of new-borns, the parents had to have lived there for three or
Page 2 of 11(page number not for citation purposes)

Malaria Journal 2008, 7:228 http://www.malariajournal.com/content/7/1/228
Page 3 of 11(page number not for citation purposes)
Geographic distribution of crude malaria incidence rate in the Manhiça study area (Province of Maputo, Mozambique)Figure 1Geographic distribution of crude malaria incidence rate in the Manhiça study area (Province of Maputo, Mozambique). The study area is divided into 115 administrative neighbourhoods (map of the right side). This map shows the crude malaria incidence for each neighbourhood. The incidence density is expressed as 1000 children week at risk (PWR).

Malaria Journal 2008, 7:228 http://www.malariajournal.com/content/7/1/228
more months. Both cohorts were identically followed andeach child was visited at home once a week by a trainedfieldworker.
Each child visit was counted as one-person week at risk(PWAR). Clinical malaria was defined as fever (with anauxiliary temperature greater than or equal to 37.5C°)with a positive blood slide (with one or more asexual Plas-modium falciparum parasites). The children diagnosed withmalaria were treated and excluded from the followingperiod of 28 days. This study falls within the National Eth-ical Clearance granted to the malaria epidemiologicalstudies of the CISM/National Institute of Health 1996.
Covariate dataThe climate seasons are defined according to the rainfalland the temperature of the region during the period ofstudy. Two seasons have been clearly distinguished: thewet season with high transmission of malaria fromNovember to April and the dry season with low transmis-sion of malaria between May and October. Three periodswere created: the first from December 1996 to October1997, the second from November 1997 to October 1998and the third from November 1998 to July 1999. The sex
and the age of the children were also divided into threegroups: less than one year, from two to five years andabove five years.
Statistical analysisThe incidence rates of malaria were calculated as thenumber of new malaria episodes divided by the numberof children week at risk. The incidence density of malariawas expressed as number of case per 1,000 children-weeksat risk (PWAR). The confidence intervals of the incidencedensity were calculated assuming that the number of newmalaria episodes are Poisson distributed. A preliminaryPoisson regression analysis was carried out to assess therelationship between the incidence of malaria and thecovariates: sex, age groups, period, and climate season.The association between the covariables and the incidencewas evaluated using the log-likelihood ratio test. Thisbivariate Poisson regression was fitted in the SAS pro-gramme with the GENMOD procedure [11]. The depend-ent variable is the count of new malaria cases detected perweek in each neighbourhood, period, climate season, sexand age group and the offset of the Poisson regression isdefined as the sum of week at risk per child. The incidenceof malaria was then fitted according to the associated cov-
Meteorological dataFigure 2Meteorological data. Monthly rainfall (bars) and monthly mean temperatures.
Page 4 of 11(page number not for citation purposes)
Malaria Journal 2008, 7:228 http://www.malariajournal.com/content/7/1/228
ariates in the preliminary regressions. The exponential ofthe coefficients of the covariates are equal to the incidencedensity ratio. This model is referred to as the non-spatialmodel. Thereafter, an exploratory data analysis was madeto check the hypothesis of the existence of spatial associa-tion. The Moran's I test was used as an exploratory meas-ure of spatial association [12]. The p-value associated withthe Moran's I test was calculated by a Monte Carlo sampleof 1,000 permutations.
The inclusion of regional random effects with a condi-tional autoregressive structure in the model for fitting thedata would be called the spatial model [5]. The regionalrandom effects were used at a neighbourhood level to takeinto account the spatial correlation present in the data.The spatial correlation was defined among neighbour-hoods that had a common border. This regional randomeffect is a neighbourhood-specific random effect andassumes dependence on incidence density of the neigh-bourhoods and, concretely, induces 'local' smoothing bycomplete borrowing of strength from the neighbours. Theexponential of the regional random effects is the neigh-bourhood-specific adjusted relative risk.
Next, this model was extended to include other regionalrandom effects without spatial structure. This assumesindependence on incidence density of the neighbour-hoods and induces 'global' smoothing. With this spatial +non structured model, it is possible to check if part of thevariability is not spatial [6]. Finally, seasonal randomeffects are considered. In this model the spatial correlationis nested within climate season, being a spatial seasonalmodel. Basically, the spatial effects nested within the cli-
mate season allow the spatial patterns at each season to becompletely different [7].
The details of the models applied are explained in Addi-tional file 1.
The parameters of the regression were estimated by theBayesian methods using Gibbs Sampling (WinBUGS soft-ware, version 1.4 [13]) and three chains were run fromdispersed starting values. Non informative prior distribu-tions for the parameters were used. The convergence of thechains was assessed by the Gelman and Rubin statistic[14]. After convergence, a final sample of 5,000 interac-tions was collected to obtain summaries of the posteriordistributions of the parameters. The models were com-pared using the deviance information criterion (DIC) sug-gested by Spiegelhalter et al [15]. The credibility intervalsfor the parameters estimated were calculated directly fromthe posterior distributions with a probability of 95%.
ResultsA total of 2,006 children were followed from December1996 to July 1999. The average incidence density was sixcases per 1,000 PWAR. The average seasonal rainfall andmonthly mean temperature were of 1328.67 mm (SD:374.59 mm per season) and 25.33°C (SD: 0.68°C) dur-ing the wet season and 372.10 mm (SD: 85.27 mm perseason) and 20.80°C (SD: 0.58°C), respectively, in thedry season.
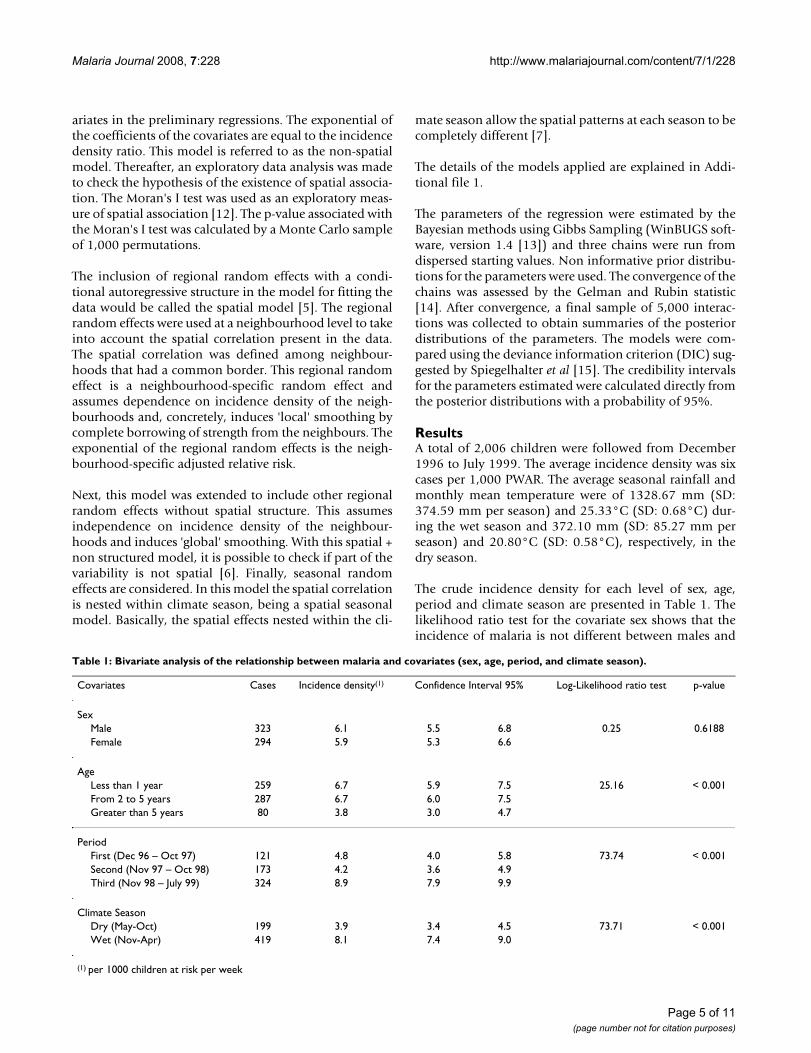
The crude incidence density for each level of sex, age,period and climate season are presented in Table 1. Thelikelihood ratio test for the covariate sex shows that theincidence of malaria is not different between males and
Table 1: Bivariate analysis of the relationship between malaria and covariates (sex, age, period, and climate season).
Covariates Cases Incidence density(1) Confidence Interval 95% Log-Likelihood ratio test p-value
SexMale 323 6.1 5.5 6.8 0.25 0.6188Female 294 5.9 5.3 6.6
AgeLess than 1 year 259 6.7 5.9 7.5 25.16 < 0.001From 2 to 5 years 287 6.7 6.0 7.5Greater than 5 years 80 3.8 3.0 4.7
PeriodFirst (Dec 96 – Oct 97) 121 4.8 4.0 5.8 73.74 < 0.001Second (Nov 97 – Oct 98) 173 4.2 3.6 4.9Third (Nov 98 – July 99) 324 8.9 7.9 9.9
Climate SeasonDry (May-Oct) 199 3.9 3.4 4.5 73.71 < 0.001Wet (Nov-Apr) 419 8.1 7.4 9.0
(1) per 1000 children at risk per week
Page 5 of 11(page number not for citation purposes)

Malaria Journal 2008, 7:228 http://www.malariajournal.com/content/7/1/228
females. In contrast, there is an association between theincidence and the group of age, period and climate sea-son.
Figure 3 shows the confidence intervals of the incidencedensity of malaria according to the climate season andperiod. It can be observed that in the second and thirdperiods the incidence density of the wet season may begreater than that of the dry season, and the magnitude ofthe differences between climate seasons may not be the
same. This potential effect was introduced in the Poissonregression including an interaction effect of the periodand climate season variables.
The incidence density for each neighbourhood is plottedin Figure 1. During the follow-up there were no cases in 19neighbourhoods (16.5% of neighbourhoods) and themaximum incidence was 53.1 cases per 1,000 PWAR.
Crude incidence density of malaria (and 95% confidence interval) according to climate season and periodFigure 3Crude incidence density of malaria (and 95% confidence interval) according to climate season and period. The incidence density of malaria is expressed as 1,000 children week at risk. Dashed line is the dry climate season and solid line is the wet climate season.
Page 6 of 11(page number not for citation purposes)

Malaria Journal 2008, 7:228 http://www.malariajournal.com/content/7/1/228
According to the exploratory data analysis with theMoran's I test (value = 0.214 p-value = 0.01), the hypoth-esis of the existence of spatial association is compatiblewith our data.
The estimate and the credibility intervals for the parame-ters of the non spatial model, spatial model, spatial+nonstructured model and spatial seasonal model are pre-sented in table 2. In all the models the incidence ofmalaria is associated with age, period interval and theinteraction between the climate seasons and the period.Figures 4 and 5 plot the neighbourhood-specific adjustedrelative risk obtained in the spatial seasonal model for thedry and wet climate seasons, respectively. Although in thedry climate season some neighbourhoods in the centre ofthe region have a greater incidence of malaria, in both sea-sons, a similar spatial pattern is observed. The posteriorprobability that the regional random effects were differentbetween the dry and wet seasons was also calculated, andit was found that only two neighbourhoods presented sig-nificant differences (data not shown). Apart from the ran-dom effects, the spatial variance of the dry season (spatialvariance = 1.674; CI 95%: [1.178, 2.279]) did not presentstatistical differences with the wet season (spatial variance1.222; CI 95%: [0.929, 1.570]). Indicating that the spatialvariability of malaria incidence does not vary according tothe climate season.
Model comparison showed that the spatial model had asmall DIC value and is, therefore, the model that best fitthe data. The spatial seasonal model, that incorporatesregional random effects nested within climate seasons,had only a slightly higher DIC value. Similarly, when thespatial model is extended with non-structured randomeffects, the DIC value is also slightly higher. The spatialvariance of this extended model (1.26, CI 95%: [0.97,1.59]) is very similar to the variance of the spatial model(1.29, CI 95%: [0.68, 1.93]) and the non-structured vari-ation is very close to 0 (0.18, CI 95%: [0.06; 0.39]. Thus,the extended model is not a better model than the spatialmodel and the main source of variability of these data istheir spatial correlation.
According to the results under the spatial model, themalaria incidence in children of less than one year of ageand those between one and five years of age is higher thanthat of children above five years of age (incidence densityratio = 1.648; CI 95%: [1.275; 2.113] and incidence den-sity ratio = 1.828; CI 95% [1.415; 2.352], respectively).
During the first period the incidence of malaria in the wetseason is not different to that of the dry season (incidencedensity ratio = 1.099 CI 95% [0.752; 1.566]). However,the incidences in the following two period intervals aregreater in the wet than in the dry season. In the second
period interval the density ratio is 1.775 (CI 95%: 1.298;2.380) being slightly higher in the third period: incidencedensity ratio = 2.481 (CI 95%: 1.784; 3.346).
To illustrate the spatial distribution of the incidence ofmalaria, Figure 6 maps the neighbourhood-specificadjusted relative risks, and Figure 7 maps the posteriorprobability that the neighbourhood-specific adjusted rel-ative risk was different to one. This posterior probabilitywas monitored with WinBUGS as the proportion of inter-actions of the final sample of 5,000 interactions, with aneighbourhood-specific adjusted relative risk was supe-rior or inferior to 1. Thus, the regions with a posterior
Neighbourhood-specific adjusted relative risk during dry cli-mate season estimated by the spatio-seasonal modelFigure 4Neighbourhood-specific adjusted relative risk during dry climate season estimated by the spatio-seasonal model.
Page 7 of 11(page number not for citation purposes)

Malaria Journal 2008, 7:228 http://www.malariajournal.com/content/7/1/228
probability higher than 0.95 means that the adjusted rel-ative risk was superior to one, while the regions with aposterior probability lower than 0.05, indicates that theadjusted relative risk was lower than one, and in othercases the adjusted risk relative is not different to one. Itcan be seen that the neighbourhoods with a higher inci-dence of malaria were in the North and Northeast, and theneighbourhoods with a lower incidence were in the centerof the study area.
DiscussionThe objective of this study was to determine the variationthat seasonal effects can produce on the spatial distribu-tion of malaria in children under the age of 10 years living
in an area of the Manhiça district. The results of this studyconfirm that the incidence of malaria in Manhiça has aclear spatial pattern, with a high incidence in the neigh-bourhoods situated in the north and northeast. The varia-tion in climate season influences the incidence in malariabut does not modify the spatial patterns.
In this study, the incidence of malaria was obtained by aweekly follow up of a cohort of children in each neigh-bourhood. This method reinforces the reliability of theestimation of the incidence rates for each neighbourhoodand eliminates the uncertainty involved in trials studyingcases detected by passive detection methods.
There was no difference in the incidence of malariabetween the dry and wet seasons in the first period (Dec96 – Oct 97). In contrast, in the second (Nov 97 – Oct 98)and third (Nov 98 – July 99) periods there was a greaterincidence in the wet season. The results of this first periodmay have been the consequence of this serial data sincethe standard effect is for the incidence to be higher in thewet season. The interaction between period and climateseason shows that the climate season varies along years. Inaddition to the climate season and period, our modelincorporated the demographic characteristics of the chil-dren. Hence, this model was able to obtain the associa-tions between the incidence in malaria and the seasons,adjusting for confounding demographic effects. In rela-tion to demographic factors, young children up to fiveyears of age are at the highest risk of malaria infection,probably they have not yet developed sufficient immu-nity, making these early years particularly susceptible.
The covariates age group, period, and climate seasons, donot explain all the variability in the data, because there isa part of variability (overdispersion) that is captured bythe regional random effects. It should also be taken intoaccount that this overdispersion can be caused by theoccurrence of more zero observations than expected by aPoisson distribution. To discard an excess of zeros in thedata a zero inflated Poisson regression is also used [16].However, this model has a higher DIC (2301.27) than thefinal model selected (DIC = 2060.160 l).
In contrast to the spatial-temporal studies performed inZimbabwe [17], the spatial-seasonal model fitted used inthis study allowed the analysis of the geographical distri-bution of malaria incidence during the climate seasonsand comparison of the effects. In the study of the inci-dence in Zimbabwe the spatial distribution of the inci-dence was not associated with the time. Moreover, theseauthors studied whether the trend of the incidencechanges in all the individual regions in the country.
Neighbourhood-specific adjusted relative risk during wet cli-mate season estimated by the spatio-seasonal modelFigure 5Neighbourhood-specific adjusted relative risk during wet climate season estimated by the spatio-seasonal model.
Page 8 of 11(page number not for citation purposes)

Malaria Journal 2008, 7:228 http://www.malariajournal.com/content/7/1/228
According to these results, the neighbourhoods in thenorth and north-east, which had a higher risk of malaria,were located close to the Incomati River, concretely, onthe edge of the swampy area of the river which is normallyflooded during the wet season and seldom dries up afterprevious rainy season. In the study by Aranda et al [3], thisarea of high incidence coincided with the most abundantsites of mosquito breeding and with the greatest numberof anopheline mosquitoes collected in the houses locatedtherein. Among anophelines, anopholes funestus Gilesrepresented 72.3%, being the most abundant species dur-ing all seasons. Saute et al [18] found that P. falciparumproduced 90% of the cases of malaria in the region andthe prevalence of infection by P. falciparum was higher inthe north and northeast. The capacity of flight dispersion
of the An. funestus (about 1 km – 2 km) [19] agreed withor justified that neighbourhoods that limited the swampyarea presented higher incidences. Therefore, all these find-ings suggest that the risk of malaria could be related toproximity to the ecosystem vector of the P. falciparum.
ConclusionThe incidence of malaria in Manhiça area presents a spa-tial pattern which is independent of the seasonal climaticconditions. The climate modifies the incidence of malariain the entire region but does not change the spatial patternof the incidence of this disease. Children under five yearsof age are at the highest risk of malaria infection.
Table 2: Posterior estimates of regression coefficients and the variances related to random effects obtained by the different models
Coefficients Non-Spatial Model Spatial Model Spatial Model + Non-structured random effects Spatial-seasonal model
Age
< = 1 year old 0.49 (0.22,0.73) 0.49 (0.22, 0.76) 0.49 (0.24, 0.77) 0.49 (0.24, 0.75)
(1 and 5 years) 0.59 (0.35, 0.75) 0.59 (0.35, 0.85) 0.56 (0.35, 0.86) 0.60 (0.34, 0.86)
Over 5 years baseline baseline baseline baseline
Season
Wet 0.10 (-0.26, 0.45) 0.07 (-0.30, 0.42) 0.06 (-0.31, 0.42) 0.29 (-0.13, 0.73)
Dry baseline baseline baseline baseline
Period
First -0.39 (-0.71, -0.07) -0.37 (-0.69, -0.05) -0.37 (-0.70, -0.04) -0.35 (-0.66, -0.02)
Second -0.03 (-0.40, 0.33) -0.04 (-0.42, 0.33) -0.04 (-0.41, 0.32) -0.03 (-0.42, 0.35)
Third baseline baseline baseline baseline
Season × Period
Wet & Second 0.49 (0.02, 0.98) 0.49 (0.03,0.96) 0.49 (0.03, 0.98) 0.462 (-0.02, 0.94)
Wet & Second 0.76 (0.30, 1.25) 0.82 (0.33, 1.32) 0.82 (0.35, 1.30) 0.792 (0.32, 1.28)
Random effects
Spatial variation - 1.29 (0.68, 0.93) 1.26 (0.97, 1.59) 1.67 (1.18, 2.28)1
1.22 (0.93, 1.57)2
Non-structured variation - - 0.18 (0.06,0.39) -
DIC3 2333.65 2060.16 2061.59 2070.090
1spatial variance for the dry season, 2 spatial variance for the wet season, 3 DIC: Deviance Information Criterion. The smaller DIC value indicates a better fitting model. Credibility intervals at 95% in brackets
Page 9 of 11(page number not for citation purposes)

Malaria Journal 2008, 7:228 http://www.malariajournal.com/content/7/1/228
These findings may be useful for the planning of malariacontrol activities. These activities can be performed takingaccount that the neighbourhoods with more incidence ofmalaria do not change over the annual climate seasons.Thus, these results suggest the need to plan interventionswhich continue over time in the areas with the highestincidence to control the transmission and thereby maxi-mize the reduction in incidence.
Competing interestsThe authors declare that they have no competing interests.
Authors' contributionsRA and CA were responsible for statistical analysis and thepreparation of the manuscript. JA, FS and PA conceivedand designed the study. FS, DN and AN were responsiblefor fieldwork and the geographical information system ofManhiça. JA was responsible for data cleaning and manu-script preparation.
Neighbourhood-specific adjusted relative risk estimated by the spatial model for the neighbourboods of the district of ManhiçaFigure 6Neighbourhood-specific adjusted relative risk esti-mated by the spatial model for the neighbourboods of the district of Manhiça.
Posterior probability of the neighbourhood-specific adjusted relative risk to be different than one estimated by the spatial modelFigure 7Posterior probability of the neighbourhood-specific adjusted relative risk to be different than one esti-mated by the spatial model. Orange colour: adjusted rel-ative risk higher than one, grey colour: adjusted relative risk not different than one and yellow: adjusted relative risk lower than one.
Page 10 of 11(page number not for citation purposes)

Malaria Journal 2008, 7:228 http://www.malariajournal.com/content/7/1/228
Publish with BioMed Central and every scientist can read your work free of charge
"BioMed Central will be the most significant development for disseminating the results of biomedical research in our lifetime."
Sir Paul Nurse, Cancer Research UK
Your research papers will be:
available free of charge to the entire biomedical community
peer reviewed and published immediately upon acceptance
cited in PubMed and archived on PubMed Central
yours — you keep the copyright
Submit your manuscript here:http://www.biomedcentral.com/info/publishing_adv.asp
BioMedcentral
Additional material
AcknowledgementsThis study was supported by grant 99/0240 from the Fondo Investigación Sanitaria (Spain). The author thanks two anonymous referees for their comments and constructive suggestions.
References1. Saute F, Aponte J, Almeda J, Ascaso C, Vaz N, Dgedge M, Alonso P:
Malaria in southern Mozambique: incidence of clinicalmalaria in children living in a rural community in Manhiçadistrict. Trans R Soc Trop Med Hyg 2003, 97:655-660.
2. Towards an Atlas of Malaria Risk in Africa. First technical report of theMARA/ARMA collaborations. MARA/ARMA, 771 Umbillo Road, Congella,Durban, South Africa 1998.
3. Aranda C, Aponte JJ, Saute F, Asimiro S, Pinto J, Sousa C, Rosario V,Petrarca V, Dgedge M, Alonso P: Entomological characteristicsof malaria transmisión in Manhiça, a rural area in southernMozambique. J Med Entomol 2005, 42:180-186.
4. Nobre AA, Schmindt A, Lopes HF: Spatio-temporal models formapping the incidence of malaria in Pará. Environmetrics 2005,16:291-304.
5. Besag J: Spatial interaction and the statistical analysis of lat-tice systems. J R Stat Soc B 1974, 36:192-236.
6. Besag J, York J, Mollié A: Bayesian image restoration, with appli-cations in spatial statistics. Ann I Stat Math 1991, 43:1-59.
7. Waller LA, Carlin BP, Xia H, Gelfand AE: Hierarchical spatio-tem-poral mapping of disease rates. J Am Stat Assoc 1997, 92:607-617.
8. Elliott P, Wakefield JC, Best NG, Briggs DJ: Spatial Epidemiology.Methods and Applications. Oxford University Press: UnitedStates of America; 2000.
9. Silué KD, Raso G, Yapi A, Vounatsou P, Tanner M, N'Goran EK,Utzinger J: Spatially-explicit risk profiling of Plasmodium falci-parum infections a small scale: a geostatistical modellingapproach. Malar J 2008, 7:111.
10. Alonso PL, Saúte F, Aponte JJ, Gómez-Olivé GO, Nhacolo A, Thom-son R, Macete E, Abacassamo F, Ventura PJ, Bosch X, Menendez C,Dgedge : Manhiçá DSS, Mozambique. In 'Population, Health andSurvival' at INDEPTH sites First edition. International DevelopmentResearch Centre, Ottawa; 2001:189-195.
11. SAS Institute Inc: SAS. 9.1 SAS Institute Inc., Cary, NC, USA; 2002. 12. Banerjee S, Carlin B, Gelfrand AE: Hierarchical modelling and analysis for
spatial data Chapman and Hall/CRC: United States of America; 2004. 13. WinBUGS software version 1.4.2 Imperial College & Medical Research
Council, London, UK; 2007. 14. Gelman A, Rubin DB: Inference from iterative simulation using
multiple sequences. Stat Sci 1992, 7:457-472.15. Spiegelhalter DJ, Best NG, Carlin BP, Vander LA: Bayesian meas-
ures of model complexity and fit. J R Stat Soc 2002, 64:583-639.16. Lambert D: Zero-inflated Poisson regression, with an applica-
tion to defects in manufacturing. Technometrics 1992, 34:1-14.17. Mabaso MLH, Vounatsou P, Midzi S, Da Silva J, Smith T: Spatio-tem-
poral analysis of the role of climate in inter-annual variationof malaria incidence in Zimbabwe. Int J Health Geog 2006,5:20-29.
18. Saute F, Aponte J, Almeda J, Ascaso C, Abellana R, Vaz N, Dgedge M,Alonso P: Malaria in southern Mozambique: Malariometricindicators and malaria case definition in Manhiça district.Trans R Soc Trop Med Hyg 2003, 97:661-666.
19. Midega Jt, Mbogo CM, Mwambi H, Wilson MD, Ojwang G, MwangangiJM, Nzovy J, Githure JI, Yan G, Beier JC: Estimating dispersal andsurvival of Anopheles gambiae and Anopheles funestus along
the Kenyan coast using mark-release-recapture methods. JMed Entomol 2007, 44:923-929.
Additional file 1Description of the model formulation in terms of the malaria data set.Click here for file[http://www.biomedcentral.com/content/supplementary/1475-2875-7-228-S1.pdf]
Page 11 of 11(page number not for citation purposes)