Spatial variation of transit service quality preferences in Dar-es-Salaam
10
Spatial variation of transit service quality preferences in Dar-es-Salaam Alphonse Nkurunziza ⇑ , Mark Zuidgeest, Mark Brussel, Frans Van den Bosch Department of Urban and Regional Planning and Geo-Information Management, Faculty of Geo-Information Science and Earth Observation, University of Twente, P.O. Box 217, 7500 AE Enschede, The Netherlands article info Keywords: Spatial modelling Preference Service quality Public transit Dar-es-Salaam abstract Commuter preferences for transit service quality are of great importance to transit service providers and regulatory agencies. The point of view of potential passengers is fundamental for evaluating transit service quality as they are envisaged to be the real consumers of the planned services and can therefore be considered the most suitable judges. A stated preference survey of daily commuters to the central business district (CBD) in the city of Dar-es-Salaam, Tanzania, was carried out to elicit preferences towards the proposed Dar Rapid Transit (DART) service. Preferences towards the proposed DART service are considered to vary based on the residential location of the potential users. These preferences are evaluated on the attributes travel time, fare and comfort. A binary logit model was applied to establish utility functions that were analysed spatially in a GIS, where a utility value was computed for each spatial unit. This paper accordingly analyses spatial variation of transit service quality preferences for the proposed DART service using geo-spatial techniques. The study uses a scenario-based approach to evaluate the effect of the proposed DART service by comparing the ‘without DART’ scenario, a case representing the existing public transport (daladala), and a ‘DART’ scenario, representing the future proposed DART system. The results indicate that the proposed DART attributes considered in the study have a significant effect on DART service quality. The results further reveal that utility values are significantly varying spatially, particularly dependent upon distance to CBD. Comfort is the most impor- tant attribute in zones up to 5 km from the CBD, travel fare is more important in zones between 5 and 15 km from the CBD, while travel time is more important in zones beyond 15 km distance from the CBD. The overall results indicate that the DART is likely to be more attractive than the existing public transport system. Ó 2012 Elsevier Ltd. All rights reserved. 1. Introduction Most cities in the developing world are experiencing rapid urbanisation, population growth and dispersal of amenities and activities. These have caused increased demand for and depen- dence on personal motorised transportation leading to problems such as congestion, accidents, environmental degradation, parking, pollution, stress, noise, and urban sprawl (Zhao, 2010; Abane, 2011; Salon and Aligula, 2012). More recently, however, planners, engineers and decision makers, worldwide, have started to give more and more attention to the development and promotion of more affordable, space and resource-efficient transport systems to alleviate those aforementioned problems (Menckhoff, 2002; Mavoa et al., 2012; Davison and Knowles, 2006). The development of sustainable transport options such as Bus Rapid Transit (BRT) systems has witnessed tremendous growth, most notably cities in developing countries. These large, city-wide transportation pro- jects are often central to larger urban revitalisation plans intending to foster economic growth and sustainable development. Crucial to the success of such ambitions is a system that provides equitable access to all residents and one that provides access to a large num- ber of urban opportunities (Delmelle and Casas, 2012). Improving access to opportunities and provision of different mobility options (e.g. accessible public transit) are key policy responses to the problem of low participation rates in urban activities, particularly for those who are transportation disadvantaged (Hine, 2003; Kamruzzaman et al., 2011; Tiwari and Jain, 2012). The city of Dar-es-Salaam in Tanzania, like many others in the developing world, is urbanising at a faster rate than its infrastruc- ture is able to cope with. The city being the largest in Tanzania with an estimated population of around 4 million in 2010 has experienced a major transportation crisis. Transport in the city is characterised by extreme traffic congestion, rapid population growth, environmental deterioration, increased automobile own- ership, high accident rates, inefficient road space allocation, as well as an excessive and obsolete transit fleet (Olvera et al., 2003; Nku- runziza et al., 2012b). The pattern of urban mobility also reflects 0966-6923/$ - see front matter Ó 2012 Elsevier Ltd. All rights reserved. http://dx.doi.org/10.1016/j.jtrangeo.2012.06.001 ⇑ Corresponding author. Tel.: +31 (0)53 4874 241/455/497; fax: +31 (0)53 4874 575. E-mail addresses: [email protected] (A. Nkurunziza), [email protected] (M. Zuidgeest), [email protected] (M. Brussel). Journal of Transport Geography 24 (2012) 12–21 Contents lists available at SciVerse ScienceDirect Journal of Transport Geography journal homepage: www.elsevier.com/locate/jtrangeo
Transcript of Spatial variation of transit service quality preferences in Dar-es-Salaam
Journal of Transport Geography 24 (2012) 12–21
Contents lists available at SciVerse ScienceDirect
Journal of Transport Geography
journal homepage: www.elsevier .com/locate / j t rangeo
Spatial variation of transit service quality preferences in Dar-es-Salaam
Alphonse Nkurunziza ⇑, Mark Zuidgeest, Mark Brussel, Frans Van den BoschDepartment of Urban and Regional Planning and Geo-Information Management, Faculty of Geo-Information Science and Earth Observation, University of Twente, P.O. Box 217,7500 AE Enschede, The Netherlands
a r t i c l e i n f o
Keywords:Spatial modellingPreferenceService qualityPublic transitDar-es-Salaam
0966-6923/$ - see front matter � 2012 Elsevier Ltd. Ahttp://dx.doi.org/10.1016/j.jtrangeo.2012.06.001
⇑ Corresponding author. Tel.: +31 (0)53 4874 241/4575.
E-mail addresses: [email protected] (A. N(M. Zuidgeest), [email protected] (M. Brussel).
a b s t r a c t
Commuter preferences for transit service quality are of great importance to transit service providersand regulatory agencies. The point of view of potential passengers is fundamental for evaluating transitservice quality as they are envisaged to be the real consumers of the planned services and can thereforebe considered the most suitable judges. A stated preference survey of daily commuters to the centralbusiness district (CBD) in the city of Dar-es-Salaam, Tanzania, was carried out to elicit preferencestowards the proposed Dar Rapid Transit (DART) service. Preferences towards the proposed DART serviceare considered to vary based on the residential location of the potential users. These preferences areevaluated on the attributes travel time, fare and comfort. A binary logit model was applied to establishutility functions that were analysed spatially in a GIS, where a utility value was computed for eachspatial unit. This paper accordingly analyses spatial variation of transit service quality preferencesfor the proposed DART service using geo-spatial techniques. The study uses a scenario-based approachto evaluate the effect of the proposed DART service by comparing the ‘without DART’ scenario, a caserepresenting the existing public transport (daladala), and a ‘DART’ scenario, representing the futureproposed DART system. The results indicate that the proposed DART attributes considered in the studyhave a significant effect on DART service quality. The results further reveal that utility values aresignificantly varying spatially, particularly dependent upon distance to CBD. Comfort is the most impor-tant attribute in zones up to 5 km from the CBD, travel fare is more important in zones between 5 and15 km from the CBD, while travel time is more important in zones beyond 15 km distance from theCBD. The overall results indicate that the DART is likely to be more attractive than the existing publictransport system.
� 2012 Elsevier Ltd. All rights reserved.
1. Introduction
Most cities in the developing world are experiencing rapidurbanisation, population growth and dispersal of amenities andactivities. These have caused increased demand for and depen-dence on personal motorised transportation leading to problemssuch as congestion, accidents, environmental degradation, parking,pollution, stress, noise, and urban sprawl (Zhao, 2010; Abane,2011; Salon and Aligula, 2012). More recently, however, planners,engineers and decision makers, worldwide, have started to givemore and more attention to the development and promotion ofmore affordable, space and resource-efficient transport systemsto alleviate those aforementioned problems (Menckhoff, 2002;Mavoa et al., 2012; Davison and Knowles, 2006). The developmentof sustainable transport options such as Bus Rapid Transit (BRT)systems has witnessed tremendous growth, most notably cities
ll rights reserved.
55/497; fax: +31 (0)53 4874
kurunziza), [email protected]
in developing countries. These large, city-wide transportation pro-jects are often central to larger urban revitalisation plans intendingto foster economic growth and sustainable development. Crucial tothe success of such ambitions is a system that provides equitableaccess to all residents and one that provides access to a large num-ber of urban opportunities (Delmelle and Casas, 2012). Improvingaccess to opportunities and provision of different mobility options(e.g. accessible public transit) are key policy responses to theproblem of low participation rates in urban activities, particularlyfor those who are transportation disadvantaged (Hine, 2003;Kamruzzaman et al., 2011; Tiwari and Jain, 2012).
The city of Dar-es-Salaam in Tanzania, like many others in thedeveloping world, is urbanising at a faster rate than its infrastruc-ture is able to cope with. The city being the largest in Tanzaniawith an estimated population of around 4 million in 2010 hasexperienced a major transportation crisis. Transport in the city ischaracterised by extreme traffic congestion, rapid populationgrowth, environmental deterioration, increased automobile own-ership, high accident rates, inefficient road space allocation, as wellas an excessive and obsolete transit fleet (Olvera et al., 2003; Nku-runziza et al., 2012b). The pattern of urban mobility also reflects
A. Nkurunziza et al. / Journal of Transport Geography 24 (2012) 12–21 13
the social exclusion existing in the city. The majority of the Dar-es-Salaam population does not own and use private vehicles. In orderto save on the costs of transportation, the urban population(mainly the poor) end up landlocked in marginal peripheral areas,without adequate access to urban facilities in the city (Olvera et al.,2008). The current public transport service is provided by obsolete,polluting and unsafe para-transit, mainly dominated by smallminibuses called ‘daladala’. The daladala service is characterisedby the poor state of the majority of buses, untrained bus driversand conductors driven by the pursuit of daily revenue targets pay-able to the bus owners, non-adherence to traffic rules and regula-tions and lack of an organised public transport system (Sohail et al.,2004; Kanyama et al., 2004). In response to those existing publictransport challenges, the Dar-es-Salaam city proposed to introducea bus rapid transit system ‘‘The Dar Rapid Transit (DART)’’ aiming atproviding quality and affordable mass transit service for the cityresidents, which is planned to reduce emissions, enable povertyreduction, lead to sustainable economic growth and act as a pio-neer of private and public investment partnership in the City (Lo-git, 2007; JICA, 2008).
1.1. The Dar Rapid Transit (DART) system
The city of Dar-es-Salaam is among the very few Sub-SaharaAfrican cities that decided to adopt a bus rapid transit (BRT) systembranded ‘‘Dar Rapid Transit (DART)’’. Other cities that have consid-ered/or are in the process of introducing BRT systems are: Lagos,Accra, Addis Ababa, Kampala and Nairobi (Deng and Nelson,2011; UN-Habitat, 2011). Following the apparent success of Bogo-ta’s Transmilenio that was implemented in the year 2000 inColombia, the BRT in Dar-es-Salaam ‘DART’ is developed along sim-ilar lines (Gilbert, 2008; Munoz-Raskin, 2010; Logit, 2007). Like theTransmilenio, DART is designed to work with a trunk-feeder set-upsystem. The DART trunk lines will be implemented on the four ma-jor road corridors in the city. It is planned that along those corri-dors the current minibuses are no longer able to operate. TheDART promises to run with high-capacity articulated buses (mini-mum 140 passengers) operating on designated infrastructure at anaverage speed of over 22 km/h. The proposed DART ticket will costa flat fare of approx. US$ 0.32 while a daladala ticket (one way)costs between approx. US$ 0.16 and US$ 0.19. The DART systemwill be implemented in six phases with the first phase – earlierplanned to start in 2009 – is currently under construction since2011. The last phase is planned to be completed in 2035 (Logit,2007; JICA, 2008).
Bus Rapid Transit’s popularity has increased worldwide, due toits promise for delivering a relatively low cost, rapidly imple-mented, flexible and high quality service solution to developingcities’ transportation needs (Wright and Hook, 2007; Deng andNelson, 2011). Despite the increased popularity, implementing aBRT inevitably encounters some challenging technical, operationaland institutional issues (Deng and Nelson, 2011). The success ofBRT systems elsewhere cannot be taken for granted, as each cityhas certain inherent characteristics and thus successful BRT expe-riences from elsewhere need proper modification to be applied inother contexts (Deng and Nelson, 2011). Moreover, the success ofsuch systems will be dependent upon the ability of the operatorto provide the level and quality of services expected by the usersagainst a tariff that is affordable. The fundamental issue addressedin this paper therefore is whether the proposed DART system willdeliver quality service expected by its potential riders. Also, whilemost studies on public transit service quality are based on qualita-tive measures of user perceived quality and satisfaction ratings,very few or hardly any studies exist that integrate behaviouralmodels with geo-spatial models in the evaluation of public transitservice quality. Hence, three underlying questions exist: How do
potential users value the proposed DART service quality? How tointegrate behavioural models into GIS for spatial analysis of theproposed DART service quality? Where is the proposed DART ser-vice highly or less valued compared to the commuting service ren-dered by the existing public transport? When a planning authorityfinds answers to these questions, it can compare the spatial distri-bution of potential user satisfaction derived from DART service tothat of the existing public transport and devise means of providinga service desirable to its potential users. The main objective of thisstudy is to answer these questions by deriving behavioural modelsfrom commuter stated preferences and integrating them into a GISfor spatial evaluation of the proposed DART system service quality.
The remainder of the paper is organised as follows. The nextsection discusses earlier studies on transit service quality evalua-tion and how this study relates to similar theoretical frameworks.The third section describes the applied integrated methods to eval-uate public transit service quality. The fourth section concentrateson the modelling and discussion of results, followed by conclusionsand some planning implications in Section 5.
2. Earlier empirical research on transit service quality
Evaluation of public transit service quality is a challenging re-search theme and of great importance to transit service providersand regulatory agencies (Hensher et al., 2003). From the serviceproviders’ perspective, it is essential to identify the most importantattributes of service quality that are desired by current and poten-tial users. Moreover, it is also important to allocate resources fortransit improvements in directions most consistent with consumerperceptions (Prioni and Hensher, 2000). Measuring which serviceattributes are important to customers may be more meaningfulto managers than measuring customer service expectations. Forexample, Landrum and Prybutok (2004) indicate that comparingservice performance against what customers consider importantmay be just as useful to managers as comparing performanceagainst what customers expect. However, the challenge in serviceprovision involves gaining a realistic view on service quality deliv-ered in the first place together with a sound understanding of pub-lic satisfaction and expectations with respect to public transportservices (Mfinanga and Ochieng, 2006). Many researchers considerthe customer’s point of view the most relevant for evaluating tran-sit performance, for example; Berry et al. (1990) pointed out that‘Customers are the sole judge of service quality’.
Service quality can be evaluated by considering customer per-ceptions and expectations, which can be used for measuring theability of the transit agency to offer services that meet customerexpectations (Morpace International Inc., 1999; Deng and Nelson,2012; Gilbert, 2008). Passenger’s perceptions are qualitative mea-sures of transit service quality generally derived from the well-known customer satisfaction surveys, which help transit operatorsto identify which service quality factors are considered the mostimportant by their customers. Customer satisfaction surveys canalso be used to prioritise future quality of service improvement ini-tiatives and to track changes in service quality over time (Eboli andMazzulla, 2011; Currie, 2006; Cain et al., 2009). Traditional re-search on perceived quality provides operating companies withknowledge on the impact their decisions have on their customers,while studies on desired quality gives them in-depth informationabout their customers and what customers want from their serviceso they can develop more acceptable policies (Dell’Olio et al., 2011;Currie and Wallis, 2008).
Extensive literature is available on the attitudes towards transitservices and on service quality as important determinants of traveldemand. Some studies have focused on evaluation of public transitservice quality from the perspective of ratings of user satisfaction.
14 A. Nkurunziza et al. / Journal of Transport Geography 24 (2012) 12–21
For example, Ji and Gao (2010) identified significant factors fromratings of people’s satisfaction with public transportation as wellas accessibility factors and personal attributes using a multi-levellogistic regression model. Dell’Olio et al. (2010) used ordered pro-bit models to evaluate how bus users perceive the quality of theirpublic transit service. Stradling et al. (2007) characterised thedimensions of bus service acceptability by examining what bususers disliked and liked about travelling by bus in Edinburgh usingfactor analysis. Tyrinopoulos and Antoniou (2008) combined factoranalysis and ordered logit modelling to assess the quality implica-tions of the variability of the user’s perceived satisfaction acrosspublic transit systems. Too and Earl (2010) developed and used aSERVQUAL framework to measure public transport services. Theirfindings revealed a wide gap between community expectationsof public transport services and the actual service quality provided.
An alternative approach for capturing customer judgments interms of expectations and perceptions, or importance and satisfac-tion ratings, is based on the use of choice analysis which indirectlycaptures the service attributes that are important and satisfactoryto customers. Choice data are collected from experiments based onstated preference techniques, in which the interviewed users makea choice among some alternative services characterised by someservice quality attributes varying on two or more levels. For exam-ple, in Prioni and Hensher (2000) a stated preference experimentwas proposed to the passengers of some private bus operators inNew South Wales (Australia). In this experiment, the interviewedusers made a choice between some alternative services character-ised by some service quality attributes, varying on three levels. Thechoice data were used to calibrate a multinomial logit (MNL) mod-el and by model estimation, the importance of each service attri-bute on the overall service quality was evaluated. In Eboli andMazzulla (2008), a stated preference experiment was proposed tothe passengers of an urban bus service in Conseza (Italy) withthe main purpose of exploring the optimal design of a stated choiceexperiment for measuring service quality in public transport. InMarcucci and Gatta (2007) stated preference methods andchoice-based conjoint analysis were used for passengers’ evalua-tion of a transit service in some geographical areas of Marche incentral Italy. The data were used to calibrate a nested logit modelfor considering the differences of the geographical segments and tocalculate an index of service quality.
On the other hand, some studies have concentrated on the fea-tures that are supposed to reflect the appropriateness of publictransit systems in view of access and accessibility to public transit(Murray et al., 1998; Murray, 2001; Rastogi and Rao, 2003a; Rast-ogi and Rao, 2003b; Munoz-Raskin, 2010; Jiang et al., 2012) andaccessibility to key nodes of employment, housing, leisure andother social activities (Handy and Niemeier, 1997; Geurs and Rit-sema, 2001; Lau and Chiu, 2004; Zhu and Liu, 2004; Delmelleand Casas, 2012). Although accessibility studies shed light on thespatial distribution of availability and reach-ability of opportuni-ties, they do not tell us how public transit service offered has sat-isfied the users and to what extent is the degree of satisfaction.Other studies use the benefits-driven approach based on the max-imisation of either the user’s or location’s benefit (Miller, 1999).Such research deals with network analysis and spatial design of aspecific transit system or a single route (Matisziw et al., 2006; Ha-das and Ranjitkar, 2012).
While this study draws on all of the aforementioned lines of re-search, it evaluates public transit service quality from an under-ex-plored perspective, i.e. the integration of behavioural models withgeo-spatial models in the evaluation of public transit service qual-ity. Research on user perceptions of different transit service aspectshas been performed before, but very few studies deal with analysisof spatial variation of people’s preferences in transit service qualityevaluation. It could be criticised as the subjective evaluations from
the perspective of satisfaction and spatial evaluation of the physi-cal environment are hardly integrated. The integration would be abig step forward for stipulating service quality improvement andspatial intervention strategies. Linking preferences of (potential)transit riders through stated choice modelling to spatial analysisof transit performance is important in order to allow a transit oper-ation agency to evaluate its service provision in meeting user travelneeds and expectations. The objective of this study is to integratebehavioural models derived from stated choice analysis into GISto evaluate transit service quality with a central focus and applica-tion to the proposed BRT system (DART) in Dar-es-Salaam. The pa-per is aimed at finding out how potential users value the proposedDART service. In other words, how important are the proposedDART service attributes to potential customers? Where is the DARTservice likely to generate satisfaction and to what extent is the le-vel of satisfaction expected?
3. Methodology and data
The evaluation of the proposed DART service quality describedin this study involves two steps. The first step is to analyse com-muters’ preferences towards the proposed DART service in orderto identify how the proposed service attributes are important topotential riders. Based on this information, the next step examinesthe magnitude and spatial variation of the satisfaction (or utility)levels derived from the DART service. Methodologies proposed inthis study for the two steps take advantages of stated choice anal-ysis with random utility models and the spatial analysis and visu-alisation capability of GIS. The integration of behavioural modelswith a geo-spatial model allows for spatial evaluation of the com-muter preferences variation in relation to the satisfaction derivedfrom the proposed DART service.
3.1. Survey instrument and data collection
Stated preference (SP) surveys have been widely used in trans-portation studies given their potential to measure how peoplechoose not-yet-existing travel modes or how people take actionsin case of introducing new policies, in this case a new bus transitsystem (Hensher, 1994). SP experiments examine individual re-sponses to a series of experimentally designed choice alternativeswhich are described in terms of combinations of attributes withseveral pre-defined levels (Hensher et al., 2005). Since people inDar-es-Salaam have not yet experienced the proposed DART sys-tem, nor experienced any BRT like system, it was necessary touse stated choice techniques to elicit commuters’ preferences. Thiswas aimed at finding out whether the proposed DART service is so-cially and spatially desirable from the point of view of the potentialusers.
Therefore, a stated preference survey was conducted in Dar-es-Salaam in September, 2007. Details of the survey development andadministration have been described in (Nkurunziza et al., 2012a).In brief, survey samples were obtained from individual commutersat the age of 15 years and above who travelled on a regular basis tothe central business district for main activities such as: work,school, business and recreation. The regular commuters were as-sumed to be a right target group with the potential of using andbeing able to afford the DART system service, whereas people be-low 15 years were assumed to not be able to respond to the surveyquestions independently. The results in this paper are based on asurvey questionnaire that comprised three main types of ques-tions. The first part collected information about individual travelbehaviour characteristics. The second and main part of the surveycontained a set of stated choice questions, i.e. a series of binary buschoices (the subject of this paper). The third part collected infor-
Table 1Summary of the general characteristics of the respondents (N = 684).
Characteristics Statistics
1. Gender Male (53.7%), Female (46.3%)2. Age 15–25 (30.3%), 26–64 (68.1%), >64 years (1.6%)3. Employment
StatusFull time (21.2%), Part time (12.9%), Self-employed (44.7%),Student (11.8%), Other (9.4%)
4. EducationLevel
No education (1.3%), Primary (32.3%), Secondary school(44.9%), Higher (21.2%), Missing data (0.3%)
5. Main travelmode
Daladala (public transport) (87.9%), Private car (8.9%),Walking (1.8%), Bicycle (0.3%), Other (1.1%)
6. Main travelpurpose
Work (28.5%), School (9.5%), Business (49%), Other (12.9%),Missing data (0.1%)
A. Nkurunziza et al. / Journal of Transport Geography 24 (2012) 12–21 15
mation related to socio-economic and demographic questions. Thesummary details of the raw survey data characterisation based onthe first and third part of the questionnaire are reported in Table 1.
The survey samples were collected from the available pre-de-fined residential Traffic Analysis Zones (TAZs) of the city. TAZsare partitioned according to variables that are most pertinent totravel choices and are as homogeneous as possible within eachspatial unit and heterogeneous between the units with regards totravel choice and factors (Yao, 2007; Ortúzar and Willumsen,2001). The final selection of the residential TAZs for surveyingwas based on the distance of the TAZs from the Central BusinessDistrict (CBD), their locational distance from the proposed DARTline stops and the residential density of the TAZs. As Dar-es-Salaamis more of a mono-centric city, where the CBD is the major tripattraction zone, we adopted the concentric zonal survey approachfrom Goudie (2002). The CBD accommodates most of the publicand private activities and it is the destination of most commutingtrips in the city (JICA, 2008). The concentric zonal survey allowssampling respondents based on radial distance from the CBD.Using the zonal survey approach, the study area was divided intofour buffer rings, where the CBD was taken as a reference point.The four buffer rings are residential TAZs within 5 km, 10 km,15 km and more than 15 km radial distance from the CBD. The buf-fer rings were purposely constructed to detect spatial variation ofcommuter preferences towards the proposed DART service withrespect to residential location and distance from the CBD. Fig. 1shows the residential TAZs, where the survey samples werecollected.
A total sample of 740 commuter respondents was interviewedrandomly in residential TAZs within the different buffer rings,while only 684 well completed questionnaires were taken for anal-ysis. As each respondent was presented with nine choice scenarios(see Nkurunziza et al., 2012a), the potential total number of obser-vations (pseudo-individuals) was 6156, a reasonable sample sizefor choice modelling. Normally, 500–1000 sample observationsare more than adequate to give good estimations (Hensher et al.,2005). For a more detailed discussion on design of stated prefer-ence surveys and stated choice analysis, see (Louviere et al.,2000; Ortúzar and Willumsen, 2001; Hensher et al., 2005; Polakand Jones, 1997).
3.2. The stated choice model structure and variable specification
The variables used in the choice experiment were based on theproposed DART service quality attributes derived from the DARTdesign reports of Logit (2007) which were obtained from DARTagency and Dar-es-Salaam City Council (DCC). Three attributes:travel time, travel fare and (in-bus) comfort were selected and con-sidered for the study (see, Nkurunziza et al., 2012a for more detailson the DART attributes). The selection of these attributes and theirlevel values were based on work sessions held with DCC and DARTagency local staff and the information collected from a pilot survey
among a section of current public transport regular commuters tothe Central Business District (CBD). This way we managed to in-crease the realism of the hypothetical choice context to a plausiblemaximum by bridging the gap between reality and the statedintentions.
The study uses logit modelling based on random utility theoryto analyse the choice data which is by far the most used approachfor processing stated preference data in transportation research(Ben-Akiva and Lerman, 1985; Louviere et al., 2000). Random util-ity theory assumes that individuals choose the travel alternativethat maximises the individual’s utility (MacFadden, 1974). A ran-dom utility model in form of binary logit was considered and esti-mated using maximum likelihood method. The specified randomutility model estimated for this study is expressed as:
Ubn ¼ Vbn þ ebn;
Vbn ¼X
k
bbkXbknð1Þ
where n is an index for individuals, b is an index for the unlabeled‘DART’ type (either 1 or 2, because each scenario comprises of twoalternative buses); Ubn is the total utility of the DART gained by anindividual; Vbn is the systematic utility component of the DART; therandom error component ebn is the non-observable utility compo-nent of the DART, which is assumed to be identically and indepen-dently standard Gumbel distributed across alternatives andobservations. It represents individual idiosyncrasies and tastes, aswell as any measurement or observational errors made by the mod-eller. The systematic part of utility Vbn depends on the bus attri-butes considered in the study. Parameter bbk is the random utilitycoefficient associated with attribute Xbkn of the DART; Xbkn repre-sents a vector of explanatory variables specific to individual n andDART type b; k is the kth attribute of the DART.
The systematic utility function of the bus alternatives is definedas a linear combination of the DART service quality attribute vari-ables and is expressed as follows:
ViDART ¼ bTTrTTi
DART þ bFARErFAREiDART þ bCFTrCFTi
DART ð2Þ
where: VDART is the systematic utility component of the DART;TTDART is the one way total travel time of DART; FAREDART is theone-way total travel fare of DART; CFTDART is the level of comfortof DART; bTT is coefficient associated with travel time; bfare is thecoefficient associated with travel fare; bCFT is the coefficient associ-ated with comfort; i = residential TAZ; and r = the buffer ring. Thesystematic utility is accordingly augmented with the random errorcomponent to get the total utility of the DART service (UDART) fol-lowing Eq. (1).
As this was an unlabelled experiment, the intercept has notbeen considered when designing the models and no socio-eco-nomic variables have been introduced (Hensher et al., 2005). Itwas decided to work with categories of commuters (potentialusers) defined by radial distance from the CBD.
3.3. Spatial modelling and scenario development process
To model the commuter preferences towards transit servicequality, a geo-spatial multi-modal network was constructed usingArcGIS Spatial Analyst tool. The GIS network data layers includedthe DART phase 1 corridor network and feeder system, the daladalanetwork and the current Dar-es-Salaam city road network. Thesedifferent road network data layers were built together into a spa-tial multi-modal network model. With the overlay of other spatialdata layers such as; residential TAZs, the CBD zones and the popu-lation data, it was possible to conduct spatial analysis. However,the multi-modal network only considers the DART phase 1 corridorand its feeder network and not all the six DART phases since the
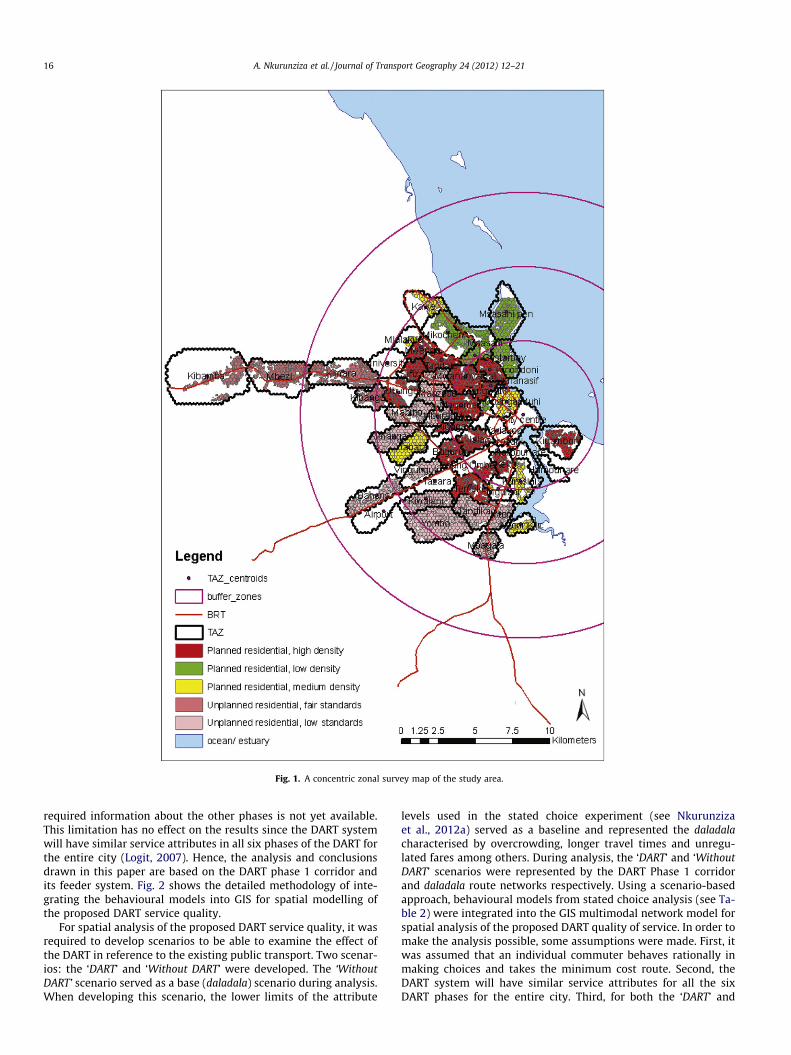
Fig. 1. A concentric zonal survey map of the study area.
16 A. Nkurunziza et al. / Journal of Transport Geography 24 (2012) 12–21
required information about the other phases is not yet available.This limitation has no effect on the results since the DART systemwill have similar service attributes in all six phases of the DART forthe entire city (Logit, 2007). Hence, the analysis and conclusionsdrawn in this paper are based on the DART phase 1 corridor andits feeder system. Fig. 2 shows the detailed methodology of inte-grating the behavioural models into GIS for spatial modelling ofthe proposed DART service quality.
For spatial analysis of the proposed DART service quality, it wasrequired to develop scenarios to be able to examine the effect ofthe DART in reference to the existing public transport. Two scenar-ios: the ‘DART’ and ‘Without DART’ were developed. The ‘WithoutDART’ scenario served as a base (daladala) scenario during analysis.When developing this scenario, the lower limits of the attribute
levels used in the stated choice experiment (see Nkurunzizaet al., 2012a) served as a baseline and represented the daladalacharacterised by overcrowding, longer travel times and unregu-lated fares among others. During analysis, the ‘DART’ and ‘WithoutDART’ scenarios were represented by the DART Phase 1 corridorand daladala route networks respectively. Using a scenario-basedapproach, behavioural models from stated choice analysis (see Ta-ble 2) were integrated into the GIS multimodal network model forspatial analysis of the proposed DART quality of service. In order tomake the analysis possible, some assumptions were made. First, itwas assumed that an individual commuter behaves rationally inmaking choices and takes the minimum cost route. Second, theDART system will have similar service attributes for all the sixDART phases for the entire city. Third, for both the ‘DART’ and
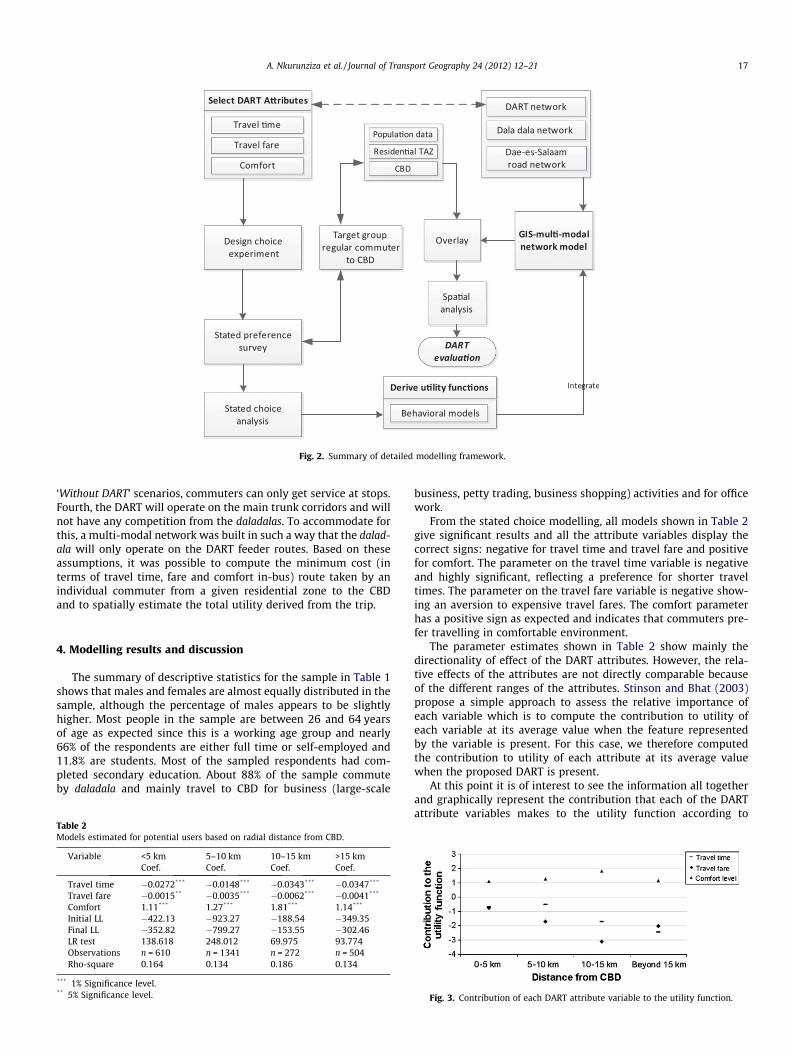
Fig. 2. Summary of detailed modelling framework.
A. Nkurunziza et al. / Journal of Transport Geography 24 (2012) 12–21 17
‘Without DART’ scenarios, commuters can only get service at stops.Fourth, the DART will operate on the main trunk corridors and willnot have any competition from the daladalas. To accommodate forthis, a multi-modal network was built in such a way that the dalad-ala will only operate on the DART feeder routes. Based on theseassumptions, it was possible to compute the minimum cost (interms of travel time, fare and comfort in-bus) route taken by anindividual commuter from a given residential zone to the CBDand to spatially estimate the total utility derived from the trip.
4. Modelling results and discussion
The summary of descriptive statistics for the sample in Table 1shows that males and females are almost equally distributed in thesample, although the percentage of males appears to be slightlyhigher. Most people in the sample are between 26 and 64 yearsof age as expected since this is a working age group and nearly66% of the respondents are either full time or self-employed and11.8% are students. Most of the sampled respondents had com-pleted secondary education. About 88% of the sample commuteby daladala and mainly travel to CBD for business (large-scale
Table 2Models estimated for potential users based on radial distance from CBD.
Variable <5 km 5–10 km 10–15 km >15 kmCoef. Coef. Coef. Coef.
Travel time �0.0272*** �0.0148*** �0.0343*** �0.0347***
Travel fare �0.0015** �0.0035*** �0.0062*** �0.0041***
Comfort 1.11*** 1.27*** 1.81*** 1.14***
Initial LL �422.13 �923.27 �188.54 �349.35Final LL �352.82 �799.27 �153.55 �302.46LR test 138.618 248.012 69.975 93.774Observations n = 610 n = 1341 n = 272 n = 504Rho-square 0.164 0.134 0.186 0.134
*** 1% Significance level.** 5% Significance level.
business, petty trading, business shopping) activities and for officework.
From the stated choice modelling, all models shown in Table 2give significant results and all the attribute variables display thecorrect signs: negative for travel time and travel fare and positivefor comfort. The parameter on the travel time variable is negativeand highly significant, reflecting a preference for shorter traveltimes. The parameter on the travel fare variable is negative show-ing an aversion to expensive travel fares. The comfort parameterhas a positive sign as expected and indicates that commuters pre-fer travelling in comfortable environment.
The parameter estimates shown in Table 2 show mainly thedirectionality of effect of the DART attributes. However, the rela-tive effects of the attributes are not directly comparable becauseof the different ranges of the attributes. Stinson and Bhat (2003)propose a simple approach to assess the relative importance ofeach variable which is to compute the contribution to utility ofeach variable at its average value when the feature representedby the variable is present. For this case, we therefore computedthe contribution to utility of each attribute at its average valuewhen the proposed DART is present.
At this point it is of interest to see the information all togetherand graphically represent the contribution that each of the DARTattribute variables makes to the utility function according to
Fig. 3. Contribution of each DART attribute variable to the utility function.
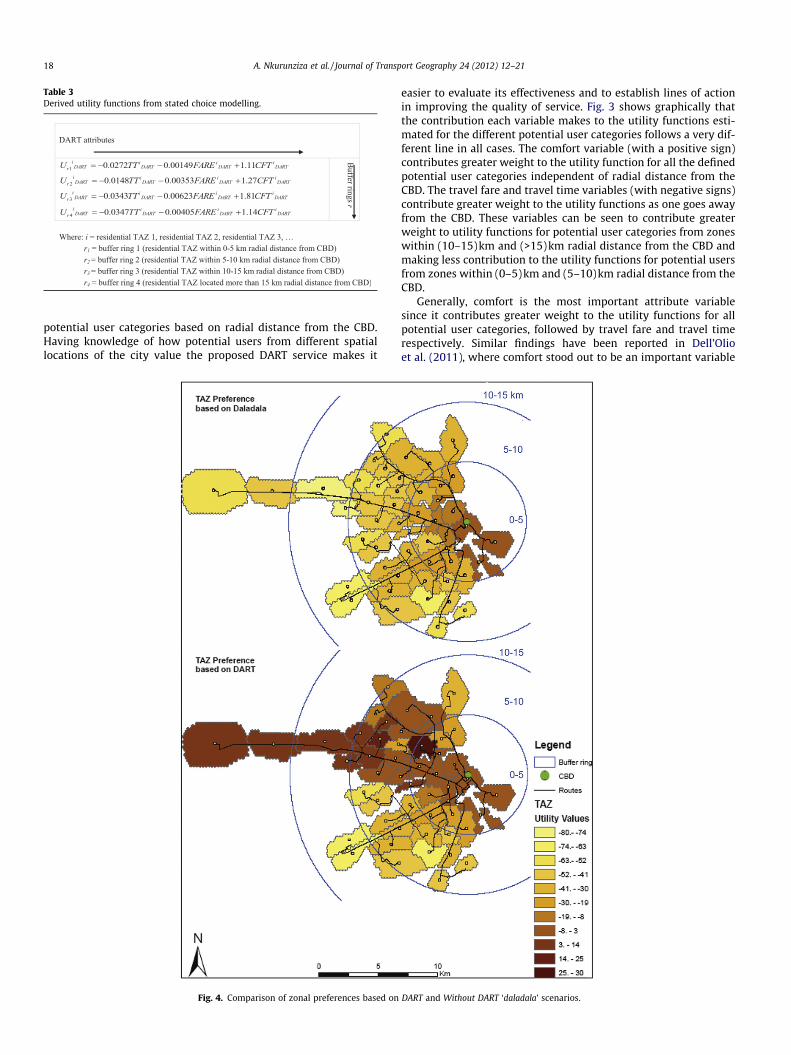
Table 3Derived utility functions from stated choice modelling.
18 A. Nkurunziza et al. / Journal of Transport Geography 24 (2012) 12–21
potential user categories based on radial distance from the CBD.Having knowledge of how potential users from different spatiallocations of the city value the proposed DART service makes it
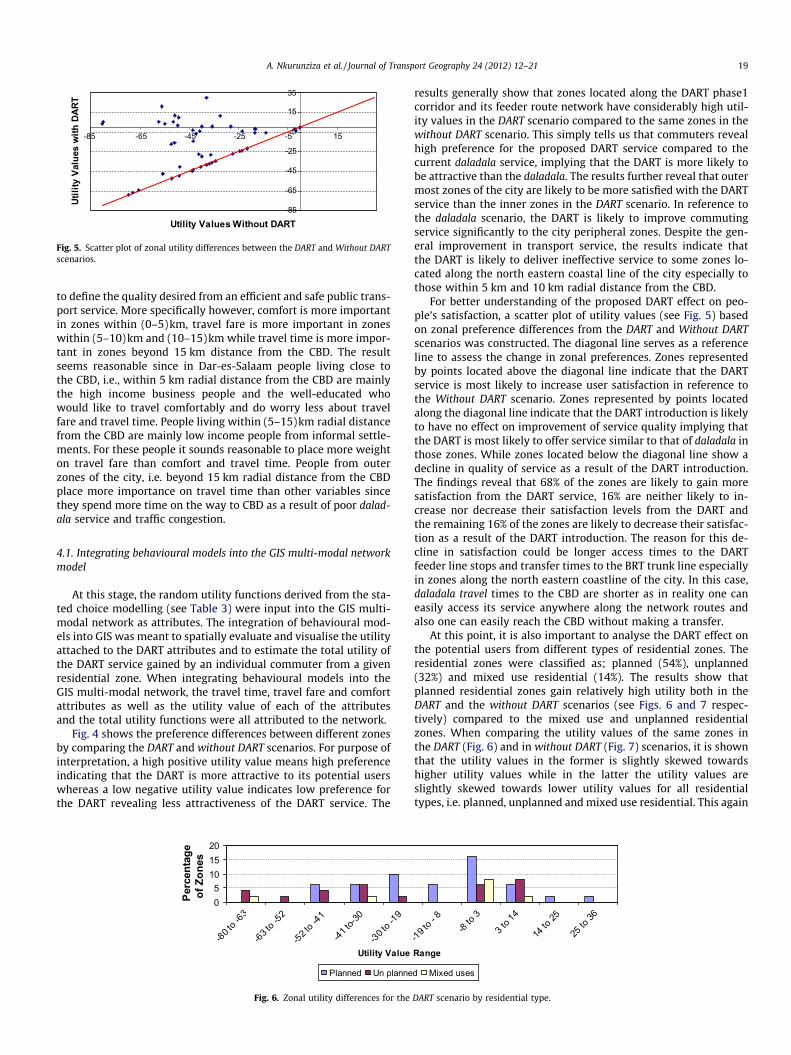
Fig. 4. Comparison of zonal preferences based on
easier to evaluate its effectiveness and to establish lines of actionin improving the quality of service. Fig. 3 shows graphically thatthe contribution each variable makes to the utility functions esti-mated for the different potential user categories follows a very dif-ferent line in all cases. The comfort variable (with a positive sign)contributes greater weight to the utility function for all the definedpotential user categories independent of radial distance from theCBD. The travel fare and travel time variables (with negative signs)contribute greater weight to the utility functions as one goes awayfrom the CBD. These variables can be seen to contribute greaterweight to utility functions for potential user categories from zoneswithin (10–15)km and (>15)km radial distance from the CBD andmaking less contribution to the utility functions for potential usersfrom zones within (0–5)km and (5–10)km radial distance from theCBD.
Generally, comfort is the most important attribute variablesince it contributes greater weight to the utility functions for allpotential user categories, followed by travel fare and travel timerespectively. Similar findings have been reported in Dell’Olioet al. (2011), where comfort stood out to be an important variable
DART and Without DART ‘daladala’ scenarios.
-85
-65
-45
-25
-5
15
35
-85 -65 -45 -25 -5 15
Utility Values Without DART
Utili
ty V
alue
s w
ith D
ART
Fig. 5. Scatter plot of zonal utility differences between the DART and Without DARTscenarios.
A. Nkurunziza et al. / Journal of Transport Geography 24 (2012) 12–21 19
to define the quality desired from an efficient and safe public trans-port service. More specifically however, comfort is more importantin zones within (0–5)km, travel fare is more important in zoneswithin (5–10)km and (10–15)km while travel time is more impor-tant in zones beyond 15 km distance from the CBD. The resultseems reasonable since in Dar-es-Salaam people living close tothe CBD, i.e., within 5 km radial distance from the CBD are mainlythe high income business people and the well-educated whowould like to travel comfortably and do worry less about travelfare and travel time. People living within (5–15)km radial distancefrom the CBD are mainly low income people from informal settle-ments. For these people it sounds reasonable to place more weighton travel fare than comfort and travel time. People from outerzones of the city, i.e. beyond 15 km radial distance from the CBDplace more importance on travel time than other variables sincethey spend more time on the way to CBD as a result of poor dalad-ala service and traffic congestion.
4.1. Integrating behavioural models into the GIS multi-modal networkmodel
At this stage, the random utility functions derived from the sta-ted choice modelling (see Table 3) were input into the GIS multi-modal network as attributes. The integration of behavioural mod-els into GIS was meant to spatially evaluate and visualise the utilityattached to the DART attributes and to estimate the total utility ofthe DART service gained by an individual commuter from a givenresidential zone. When integrating behavioural models into theGIS multi-modal network, the travel time, travel fare and comfortattributes as well as the utility value of each of the attributesand the total utility functions were all attributed to the network.
Fig. 4 shows the preference differences between different zonesby comparing the DART and without DART scenarios. For purpose ofinterpretation, a high positive utility value means high preferenceindicating that the DART is more attractive to its potential userswhereas a low negative utility value indicates low preference forthe DART revealing less attractiveness of the DART service. The
05
101520
-80 to -
63
-63 to -
52
-52 to -
41
-41 to-3
0
-30 to -
19
Utility Value
Perc
enta
ge
of Z
ones
Planned Un planne
Fig. 6. Zonal utility differences for the
results generally show that zones located along the DART phase1corridor and its feeder route network have considerably high util-ity values in the DART scenario compared to the same zones in thewithout DART scenario. This simply tells us that commuters revealhigh preference for the proposed DART service compared to thecurrent daladala service, implying that the DART is more likely tobe attractive than the daladala. The results further reveal that outermost zones of the city are likely to be more satisfied with the DARTservice than the inner zones in the DART scenario. In reference tothe daladala scenario, the DART is likely to improve commutingservice significantly to the city peripheral zones. Despite the gen-eral improvement in transport service, the results indicate thatthe DART is likely to deliver ineffective service to some zones lo-cated along the north eastern coastal line of the city especially tothose within 5 km and 10 km radial distance from the CBD.
For better understanding of the proposed DART effect on peo-ple’s satisfaction, a scatter plot of utility values (see Fig. 5) basedon zonal preference differences from the DART and Without DARTscenarios was constructed. The diagonal line serves as a referenceline to assess the change in zonal preferences. Zones representedby points located above the diagonal line indicate that the DARTservice is most likely to increase user satisfaction in reference tothe Without DART scenario. Zones represented by points locatedalong the diagonal line indicate that the DART introduction is likelyto have no effect on improvement of service quality implying thatthe DART is most likely to offer service similar to that of daladala inthose zones. While zones located below the diagonal line show adecline in quality of service as a result of the DART introduction.The findings reveal that 68% of the zones are likely to gain moresatisfaction from the DART service, 16% are neither likely to in-crease nor decrease their satisfaction levels from the DART andthe remaining 16% of the zones are likely to decrease their satisfac-tion as a result of the DART introduction. The reason for this de-cline in satisfaction could be longer access times to the DARTfeeder line stops and transfer times to the BRT trunk line especiallyin zones along the north eastern coastline of the city. In this case,daladala travel times to the CBD are shorter as in reality one caneasily access its service anywhere along the network routes andalso one can easily reach the CBD without making a transfer.
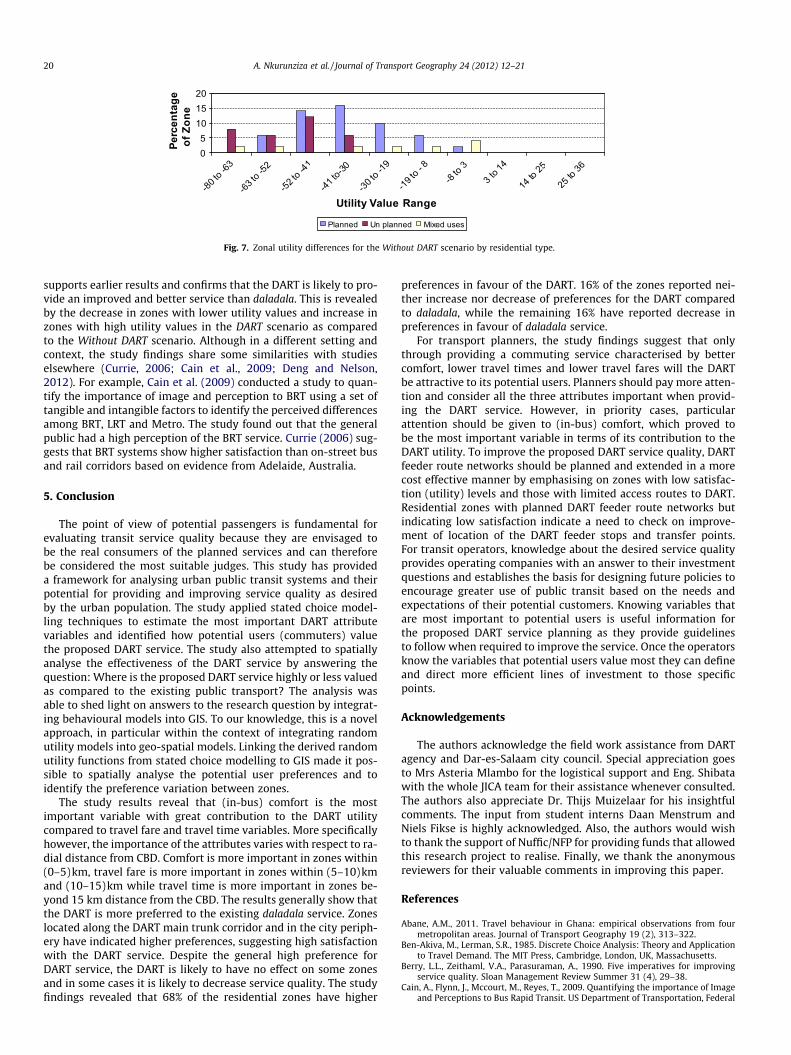
At this point, it is also important to analyse the DART effect onthe potential users from different types of residential zones. Theresidential zones were classified as; planned (54%), unplanned(32%) and mixed use residential (14%). The results show thatplanned residential zones gain relatively high utility both in theDART and the without DART scenarios (see Figs. 6 and 7 respec-tively) compared to the mixed use and unplanned residentialzones. When comparing the utility values of the same zones inthe DART (Fig. 6) and in without DART (Fig. 7) scenarios, it is shownthat the utility values in the former is slightly skewed towardshigher utility values while in the latter the utility values areslightly skewed towards lower utility values for all residentialtypes, i.e. planned, unplanned and mixed use residential. This again
-19 to -
8-8 to
3
3 to 1
4
14 to
25
25 to
36
Range
d Mixed uses
DART scenario by residential type.
05
101520
-80 to
-63
-63 to
-52
-52 to
-41
-41 to
-30
-30 to
-19
-19 to
- 8-8
to 3
3 to 1
4
14 to
25
25 to
36
Utility Value Range
Perc
enta
ge
of Z
one
Planned Un planned Mixed uses
Fig. 7. Zonal utility differences for the Without DART scenario by residential type.
20 A. Nkurunziza et al. / Journal of Transport Geography 24 (2012) 12–21
supports earlier results and confirms that the DART is likely to pro-vide an improved and better service than daladala. This is revealedby the decrease in zones with lower utility values and increase inzones with high utility values in the DART scenario as comparedto the Without DART scenario. Although in a different setting andcontext, the study findings share some similarities with studieselsewhere (Currie, 2006; Cain et al., 2009; Deng and Nelson,2012). For example, Cain et al. (2009) conducted a study to quan-tify the importance of image and perception to BRT using a set oftangible and intangible factors to identify the perceived differencesamong BRT, LRT and Metro. The study found out that the generalpublic had a high perception of the BRT service. Currie (2006) sug-gests that BRT systems show higher satisfaction than on-street busand rail corridors based on evidence from Adelaide, Australia.
5. Conclusion
The point of view of potential passengers is fundamental forevaluating transit service quality because they are envisaged tobe the real consumers of the planned services and can thereforebe considered the most suitable judges. This study has provideda framework for analysing urban public transit systems and theirpotential for providing and improving service quality as desiredby the urban population. The study applied stated choice model-ling techniques to estimate the most important DART attributevariables and identified how potential users (commuters) valuethe proposed DART service. The study also attempted to spatiallyanalyse the effectiveness of the DART service by answering thequestion: Where is the proposed DART service highly or less valuedas compared to the existing public transport? The analysis wasable to shed light on answers to the research question by integrat-ing behavioural models into GIS. To our knowledge, this is a novelapproach, in particular within the context of integrating randomutility models into geo-spatial models. Linking the derived randomutility functions from stated choice modelling to GIS made it pos-sible to spatially analyse the potential user preferences and toidentify the preference variation between zones.
The study results reveal that (in-bus) comfort is the mostimportant variable with great contribution to the DART utilitycompared to travel fare and travel time variables. More specificallyhowever, the importance of the attributes varies with respect to ra-dial distance from CBD. Comfort is more important in zones within(0–5)km, travel fare is more important in zones within (5–10)kmand (10–15)km while travel time is more important in zones be-yond 15 km distance from the CBD. The results generally show thatthe DART is more preferred to the existing daladala service. Zoneslocated along the DART main trunk corridor and in the city periph-ery have indicated higher preferences, suggesting high satisfactionwith the DART service. Despite the general high preference forDART service, the DART is likely to have no effect on some zonesand in some cases it is likely to decrease service quality. The studyfindings revealed that 68% of the residential zones have higher
preferences in favour of the DART. 16% of the zones reported nei-ther increase nor decrease of preferences for the DART comparedto daladala, while the remaining 16% have reported decrease inpreferences in favour of daladala service.
For transport planners, the study findings suggest that onlythrough providing a commuting service characterised by bettercomfort, lower travel times and lower travel fares will the DARTbe attractive to its potential users. Planners should pay more atten-tion and consider all the three attributes important when provid-ing the DART service. However, in priority cases, particularattention should be given to (in-bus) comfort, which proved tobe the most important variable in terms of its contribution to theDART utility. To improve the proposed DART service quality, DARTfeeder route networks should be planned and extended in a morecost effective manner by emphasising on zones with low satisfac-tion (utility) levels and those with limited access routes to DART.Residential zones with planned DART feeder route networks butindicating low satisfaction indicate a need to check on improve-ment of location of the DART feeder stops and transfer points.For transit operators, knowledge about the desired service qualityprovides operating companies with an answer to their investmentquestions and establishes the basis for designing future policies toencourage greater use of public transit based on the needs andexpectations of their potential customers. Knowing variables thatare most important to potential users is useful information forthe proposed DART service planning as they provide guidelinesto follow when required to improve the service. Once the operatorsknow the variables that potential users value most they can defineand direct more efficient lines of investment to those specificpoints.
Acknowledgements
The authors acknowledge the field work assistance from DARTagency and Dar-es-Salaam city council. Special appreciation goesto Mrs Asteria Mlambo for the logistical support and Eng. Shibatawith the whole JICA team for their assistance whenever consulted.The authors also appreciate Dr. Thijs Muizelaar for his insightfulcomments. The input from student interns Daan Menstrum andNiels Fikse is highly acknowledged. Also, the authors would wishto thank the support of Nuffic/NFP for providing funds that allowedthis research project to realise. Finally, we thank the anonymousreviewers for their valuable comments in improving this paper.
References
Abane, A.M., 2011. Travel behaviour in Ghana: empirical observations from fourmetropolitan areas. Journal of Transport Geography 19 (2), 313–322.
Ben-Akiva, M., Lerman, S.R., 1985. Discrete Choice Analysis: Theory and Applicationto Travel Demand. The MIT Press, Cambridge, London, UK, Massachusetts.
Berry, L.L., Zeithaml, V.A., Parasuraman, A., 1990. Five imperatives for improvingservice quality. Sloan Management Review Summer 31 (4), 29–38.
Cain, A., Flynn, J., Mccourt, M., Reyes, T., 2009. Quantifying the importance of Imageand Perceptions to Bus Rapid Transit. US Department of Transportation, Federal
A. Nkurunziza et al. / Journal of Transport Geography 24 (2012) 12–21 21
Transit Administration, Office of Research, Demonstration and Innovation-TRI,Washington, DC.
Currie, G., 2006. Bus transit oriented development – strengths and challengesrelative to rail. Journal of Public Transportation 9 (4), 1–22.
Currie, G., Wallis, I., 2008. Effective ways to grow urban bus markets – a synthesis ofevidence. Journal of Transport Geography 16 (6), 419–429.
Davison, L.J., Knowles, R.D., 2006. Bus quality partnerships, modal shift and trafficdecongestion. Journal of Transport Geography 14 (3), 177–194.
Dell’olio, L., Ibeas, A., Cecin, P., 2011. The quality of service desired by publictransport users. Transport Policy 18 (1), 217–227.
Dell’olio, L., Ibeas, A., Cecín, P., 2010. Modelling user perception of bus transitquality. Transport Policy 17 (6), 388–397.
Delmelle, E.C., Casas, I., 2012. Evaluating the spatial equity of bus rapid transit-based accessibility patterns in a developing country: the case of Cali, Colombia.Transport Policy 20, 36–46.
Deng, T., Nelson, J.D., 2011. Recent developments in Bus Rapid Transit: a review ofthe literature. Transport Reviews 31 (1), 69–96.
Deng, T., Nelson, J.D., 2012. The perception of Bus Rapid Transit: a passenger surveyfrom Beijing Southern Axis BRT line1. Transportation Planning and Technology35 (2), 201–219.
Eboli, L., Mazzulla, G., 2008. A stated preference experiment for measuring servicequality in public transport. Transportation Planning and Technology 31 (5),509–523.
Eboli, L., Mazzulla, G., 2011. A methodology for evaluating transit service qualitybased on subjective and objective measures from the passenger’s point of view.Transport Policy 18 (1), 172–181.
Geurs, K.T., Ritsema, V.E., 2001. Accessibility Measures, Review and Applications,Bilthoven, Rijksinstituut voor Volksgezondheid en Milieu (RIVM).
Gilbert, A., 2008. Bus Rapid Transit: Is Transmilenio a Miracle Cure? TransportReviews 28 (4), 439–467.
Goudie, D., 2002. Zonal method for urban travel surveys: sustainability and sampledistance from the CBD. Journal of Transport Geography 10 (4), 287–301.
Hadas, Y., Ranjitkar, P., 2012. Modeling public-transit connectivity with spatialquality-of-transfer measurements. Journal of Transport Geography 22, 137–147.
Handy, S.L., Niemeier, D.A., 1997. Measuring accessibility: an exploration of issuesand alternatives. Environment and Planning A 29 (7), 1175–1194.
Hensher, D., Rose, J.M., Greene, W.H., 2005. Applied Choice Analysis: A Primer.Cambridge University Press, Cambridge.
Hensher, D.A., 1994. Stated preference analysis of travel choices: the state ofpractice. Transportation 21 (2), 107–133.
Hensher, D.A., Stopher, P.R., Bullock, P., 2003. Service quality – developing a servicequality index in the provision of commercial bus contracts. TransportationResearch Part A 37 (6), 499–517.
Hine, J., 2003. Social exclusion and transport systems. Transport Policy 10 (4), 263.Ji, J., Gao, X., 2010. Analysis of people’s satisfaction with public transportation in
Beijing. Habitat International 34 (4), 464–470.Jiang, Y., Zegras, P.C., Mehndiratta, S., 2012. Walk the line: station context, corridor
type and bus rapid transit walk access in Jinan, China. Journal of TransportGeography 20 (1), 1–14.
Jica, 2008. Dar es Salaam Transport policy and System Development Master Plan.Final report. Dar es Salaam City Council, Dar es Salaam, Tanzania.
Kamruzzaman, M., Hine, J., Gunay, B., Blair, N., 2011. Using GIS to visualise andevaluate student travel behaviour. Journal of Transport Geography 19 (1), 13–32.
Kanyama, A., Kanyama, A.C., Lindén, A.L., Lupala, J., 2004. Public Transport in Dar esSalaam. Institutional Challenges and Opportunities for a Sustainable TransportSystem Stockholm, Environmental Strategies Research Department, FOI,Stockholm, Tanzania.
Landrum, H., Prybutok, V.R., 2004. A service quality and success model for theinformation service industry. European Journal of Operational Research 156 (3),628–642.
Lau, J., Chiu, C., 2004. Accessibility of workers in a compact city: the case of HongKong. Habitat International 28 (1), 89–102.
Logit, 2007. Project Review Seminar: Dar es Salaam BRT Planning and Design FinalReport, DART Dar es Salaam, Logit Inter-consult Limited.
Louviere, J.J., Hensher, A.D., Swait, J.D., 2000. Stated Choice Methods: Analysis andApplication, Cambridge, UK.
Macfadden, D., 1974. The measurement of urban travel demand. Journal of PublicEconomics 3 (4), 303–328.
Marcucci, E., Gatta, V., 2007. Quality and public transport service contracts.European Transport 36, 92–106.
Matisziw, T.C., Murray, A.T., Kim, C., 2006. Strategic route extension in transitnetworks. European Journal of Operational Research 171 (2), 661–673.
Mavoa, S., Witten, K., Mccreanor, T., O’sullivan, D., 2012. GIS based destinationaccessibility via public transit and walking in Auckland, New Zealand. Journal ofTransport Geography 20 (1), 15–22.
Menckhoff, G., 2002. Mass transit planning in cities of developing countries. In:TIWARI, G. (Ed.), Urban Transport for Growing Cities: High Capacity BusSystems. Macmillan India Ltd., New Delhi, India.
Mfinanga, D.A., Ochieng, M.O.-A., 2006. Development of a model for assessing urbanpublic transport level of service in cities of developing nations. African Journalof Science and Technology 7, 35–53.
Miller, H.J., 1999. Measuring space-time accessibility benefits within transportationnetworks: basic theory and computational procedures. Georgraphical Analysis31 (1), 1–26.
Morpace International Inc., 1999. A Handbook for Measuring Customer Satisfactionand Service Quality. Transit Cooperative Research Program Report 47. NRCouncil, Transportation Research Board, Washington, DC.
Munoz-Raskin, R., 2010. Walking accessibility to bus rapid transit: Does it affectproperty values? The case of Bogotá, Colombia. Transport Policy 17 (2), 72–84.
Murray, A.T., 2001. Strategic analysis of public transport coverage. Socio-EconomicPlanning Sciences 35 (3), 175–188.
Murray, A., Davis, R., Stimson, R., Ferreira, L., 1998. Public transportation access.Transportation Research Part B 3 (5), 319–328.
Nkurunziza, A., Zuidgeest, M., Brussel, M., Van Maarseveen, M., 2012a. Modellingcommuter preferences for the proposed bus rapid transit in Dar-es-Salaam.Journal of Public Transportation 15 (2), in press.
Nkurunziza, A., Zuidgeest, M., Van Maarseveen, M., 2012b. Identifying potentialcycling market segments in Dar-es-Salaam, Tanzania. Habitat International 36(1), 78–84.
Olvera, L.D., Plat, D., Pochet, P., 2003. Transportation conditions and access toservices in a context of urban sprawl and deregulation. The case of Dar esSalaam. Transport Policy 10 (4), 287–298.
Olvera, L.D., Plat, L., Pochet, P., 2008. Household transport expenditure in sub-saharan african cities: measurement and analysis. Journal of TransportGeography 16 (1), 1–13.
Ortúzar, J.D., Willumsen, L.G., 2001. Modelling Transport. John Wiley & Sons,Chicester,UK.
Polak, J., Jones, P., 1997. Using stated preference methods to examine travellerpreferences and responses. In: Stopher, P., Lee-Gosselin, M. (Eds.),Understanding Travel Behaviour in an Era of change. Oxford Pergamon, pp.177–207.
Prioni, P., Hensher, D.A., 2000. Measuring service quality in scheduled bus services.Journal of Public Transportation 3 (3), 51–74.
Rastogi, R., Rao, K., 2003a. Defining transit accessibility with environmental inputs.Transportation Research Part D 8 (5), 383–396.
Rastogi, R., Rao, K., 2003b. Travel characteristics of commuters accessing transit:Casestudy. Journal of Transportation Engineering 129 (6), 684–694.
Salon, D., Aligula, E.M., 2012. Urban travel in Nairobi, Kenya: analysis, insights, andopportunities. Journal of Transport Geography 22, 65–76.
Sohail, M., Maunder, D.A., Miles, D.W.J., 2004. Managing public transport indeveloping countries: stakeholder perspectives in Dar es Salaam andFaisalabad. International Journal of Transport Management 2 (3–4), 149–160.
Stinson, M.A., Bhat, C.R., 2003. An analysis of commuter bicyclist route choice usinga stated preference survey. Transportation Research Record 1828, 107–115.
Stradling, S., Carreno, M., Rye, T., Noble, A., 2007. Passenger perceptions and theideal urban bus journey experience. Transport Policy 14 (4), 283–292.
Tiwari, G., Jain, D., 2012. Accessibility and safety indicators for all road users: casestudy Delhi BRT. Journal of Transport Geography 22, 87–95.
Too, L., Earl, G., 2010. Public transport service quality and sustainable development:a community stakeholder perspective. Sustainable Development 18 (1), 51–61.
Tyrinopoulos, Y., Antoniou, C., 2008. Public transit user satisfaction: variability andpolicy implications. Transport Policy 15 (4), 260–272.
Un-Habitat, 2011. Promoting sustainable transport solutions for East African Cities(Sustran East Afica): Summary Report on Project Inception Meetings. Nairobi:UN-Habitat.
Wright, L., Hook, W., 2007. Bus Rapid Transit Planning Guide. Institute forTransportation and Development Policy, New York.
Yao, X., 2007. Where are public transit needed – examining potential demand forpublic transit for commuting trips. Computers, Environment and UrbanSystems 31 (5), 535–550.
Zhao, P., 2010. Sustainable urban expansion and transportation in a growing megacity: consequences of urban sprawl for mobility on the Urban fringe of Beijing.Habitat International 34 (2), 236–243.
Zhu, X., Liu, S., 2004. Analysis of the impact of the MRT system on accessibility inSingapore using an integrated GIS tool. Journal of Transport Geography 12 (2),89–101.