Spatial Patterns of Spread of Dengue with Human and Vector Mobility
16
Spatial Patterns of Spread of Dengue with Human and Vector Mobility Murali Krishna Enduri *1 and Shivakumar Jolad † 1 1 Indian Institute of Technology Gandhinagar Chandkheda, Ahmedabad 380005, INDIA September 8, 2014 Abstract Background : Dengue is a vector borne dis- ease transmitted to humans by Aedes Aegypti mosquitoes carrying Dengue virus of different serotypes. Primarily an urban epidemic, Dengue exhibits complex spatial and temporal dynamics, influenced by many biological, human and envi- ronmental factors. However, most of the existing models neglect the spatial factors influencing the spread of Dengue. This work sheds light on how Dengue parameters and human mobility changes the spatial spread of the infection and size of the epidemic. Methodology/Principal findings: We model the Dengue as a stochastic Cellular Automata (CA) process following Susceptible, Exposed, Infected, Recovered (SEIR) -Susceptible, Exposed, Infected (SEI)- for human and vector dynamics respectively in each cell, and analyze the spatial and tempo- ral spreading disease using parameters from field studies. We use the data on mosquito density from Ahmedabad city of India as input to our model to predict the dynamics of Dengue incidence and com- pare it to the reported data on the prevalence of the disease from 2006-2012. We find that for cer- tain infection rates, CA model closely reproduces observed peaks and intensity. We used data based statistical models of human mobility such as expo- nential step length and super diffusive L´ evy flight to study mobility effects on Dengue spreading within the city. We find an interesting result that inclusion of human mobility in many cases can decrease the incidence of Dengue, and may suppress the infec- tion completely. The scale and intensity of reduc- tion depend on the relative strengths of infection * [email protected] † [email protected] transmission rate and mobility step length. The primarily reason for decline can be attributed to the significant fraction of the susceptible and ex- posed population moving to the regions where ma- jority have already recovered and can no longer be infected. Conclusions/Significance: The current study is aimed at more realistic model of spatial spread of Dengue and understand how human mobility fac- tors in the spread of vector borne diseases. It high- lights certain counter intuitive results such as sup- pression of Dengue spreading when we include sta- tistical patterns of human mobility. In supplemen- tary information, we show that even for L´ evy flight broadly same conclusions hold hood. The random mobility pattern produces large peak initially, but suppresses Dengue completely within a short pe- riod of time even for large infection rate, deviating largely from the observed pattern. Keywords: Dengue, Epidemics, Spa- tial Epidemiology, Cellular Automata, Vector Borne Diseases, L´ evy Flight, Human Mobility, Reaction-diffusion 1 Introduction Dengue fever (DF) is a vector borne disease widely prevalent in tropical and subtropical re- gions in about 100 countries worldwide. The World Health Organization (WHO) estimates that currently over 2.5 billion people (40% of the world population) are at the risk for Dengue, with close to a million cases reported 2007 alone [23]. Dengue is transmitted to humans mainly through Aedes Aegypti female 1 arXiv:1409.0965v1 [q-bio.PE] 3 Sep 2014
Transcript of Spatial Patterns of Spread of Dengue with Human and Vector Mobility

Spatial Patterns of Spread of Dengue with Human and Vector
Mobility
Murali Krishna Enduri ∗1 and Shivakumar Jolad†1
1Indian Institute of Technology Gandhinagar Chandkheda, Ahmedabad 380005, INDIA
September 8, 2014
Abstract
Background : Dengue is a vector borne dis-ease transmitted to humans by Aedes Aegyptimosquitoes carrying Dengue virus of differentserotypes. Primarily an urban epidemic, Dengueexhibits complex spatial and temporal dynamics,influenced by many biological, human and envi-ronmental factors. However, most of the existingmodels neglect the spatial factors influencing thespread of Dengue. This work sheds light on howDengue parameters and human mobility changesthe spatial spread of the infection and size of theepidemic.
Methodology/Principal findings: We modelthe Dengue as a stochastic Cellular Automata (CA)process following Susceptible, Exposed, Infected,Recovered (SEIR) -Susceptible, Exposed, Infected(SEI)- for human and vector dynamics respectivelyin each cell, and analyze the spatial and tempo-ral spreading disease using parameters from fieldstudies. We use the data on mosquito density fromAhmedabad city of India as input to our model topredict the dynamics of Dengue incidence and com-pare it to the reported data on the prevalence ofthe disease from 2006-2012. We find that for cer-tain infection rates, CA model closely reproducesobserved peaks and intensity. We used data basedstatistical models of human mobility such as expo-nential step length and super diffusive Levy flight tostudy mobility effects on Dengue spreading withinthe city. We find an interesting result that inclusionof human mobility in many cases can decrease theincidence of Dengue, and may suppress the infec-tion completely. The scale and intensity of reduc-tion depend on the relative strengths of infection
∗[email protected]†[email protected]
transmission rate and mobility step length. Theprimarily reason for decline can be attributed tothe significant fraction of the susceptible and ex-posed population moving to the regions where ma-jority have already recovered and can no longer beinfected.
Conclusions/Significance: The current study
is aimed at more realistic model of spatial spread of
Dengue and understand how human mobility fac-
tors in the spread of vector borne diseases. It high-
lights certain counter intuitive results such as sup-
pression of Dengue spreading when we include sta-
tistical patterns of human mobility. In supplemen-
tary information, we show that even for Levy flight
broadly same conclusions hold hood. The random
mobility pattern produces large peak initially, but
suppresses Dengue completely within a short pe-
riod of time even for large infection rate, deviating
largely from the observed pattern.
Keywords: Dengue, Epidemics, Spa-tial Epidemiology, Cellular Automata, VectorBorne Diseases, Levy Flight, Human Mobility,Reaction-diffusion
1 Introduction
Dengue fever (DF) is a vector borne diseasewidely prevalent in tropical and subtropical re-gions in about 100 countries worldwide. TheWorld Health Organization (WHO) estimatesthat currently over 2.5 billion people (40%of the world population) are at the risk forDengue, with close to a million cases reported2007 alone [23]. Dengue is transmitted tohumans mainly through Aedes Aegypti female
1
arX
iv:1
409.
0965
v1 [
q-bi
o.PE
] 3
Sep
201
4

mosquito bites carrying Dengue virus [16].Dengue fever (DF), Dengue hemorrhagic fever(DHF) and Dengue shock syndrome (DSS) aredifferent forms of Dengue infection, causedby four serotypes of Dengue virus (DENV:1-4) [23]. The people who recover from oneserotype can become permanently immune toit, but may not be immune to other serotypes.Dengue is becoming a major public health con-cern in various South Asian and Latin Ameri-can countries. In India, Dengue epidemic hasspread to almost all the states and is pos-ing a serious public health problem. In 2010alone, 28000 confirmed cases were reported(seeFig.1). At present there is no effective vacci-nation or treatment for dengue. It is believedthat any future dengue vaccination is imper-fect, [2] and may not offer protection againstall serotypes. Many Dengue infections maynot produce severe symptoms, thereby evadingearly detection. At present, known effectiveway to prevent dengue outbreak is to devisevector control strategies and minimize vector-human transmission. A sound understandingof the spatial and temporal dynamics of theDengue can help in devising strategies for con-taining the spread urban populations.
Numerous human, biological, social and en-vironmental factors affect the transmission ofDengue. Several mathematical models havebeen proposed (see [16, 8, 1] for reviews) forstudying the Dengue. Many of these are thecompartmental ordinary differential equation(ODE) models, which divide the human popu-lation into Susceptible, Exposed, Infected, andRecovered (SEIR) groups; and vectors intoSusceptible, Exposed, Infected (SEI) groups,and studying their temporal dynamics. TheseODE models are essentially mean field mod-els, which neglect the spatial patterns of thespread of Dengue. Attempts at spatial model-ing of Dengue includes those based on spatialdata mapping and statistical analysis [3, 4, 18],reaction-diffusion partial differential equation(PDE) with vector or larval mobility [22, 14],and Cellular Automata with vector and sim-plified models of human mobility [7, 20]. Inthis work, we first report results of SEIR-SIRreaction-diffusion PDE model with data driven
Figure 1: Dengue cases in different states ofIndia 2010. Data taken from National VectorBorne Disease Control Programme [15].
inputs as a reference to our full scale studyof spatio-temporal dynamics through CellularAutomata.
Human mobility, especially of the infectedindividuals can create multiple Dengue wavesresulting in substantial deviation from meanfield results. However, the current approachesto modeling human mobility have been re-stricted to simple methods such as movementwith fixed step size or introducing a globalfield altering transition probabilities [7, 20].In this work we use stochastic Cellular Au-tomata (CA) approach (closely following [7]),with realistic models of human mobility pat-terns derived from statistical studies of hu-man movements observed through the circula-tion of currency notes, tracking of phone callsthrough Cellular towers, and location based so-cial networks such as Foursquare. These workshave shown varied patterns such as Levy flight(Brockman et al.[6, 5]), truncated Levy flight(Gonsalez et al. [9]), exponential distributionin intra urban movements ( Liang et al. [13]
2

and Noulas et al. [17]). The differences arisepossibly due to the difference in scale and reso-lution of study (large distance, intra city move-ments, mobile tower coverage etc.) and themethodology used. Since Dengue is primarilyan urban disease,we focus on the spread withinan urban area and use exponential tail [13] dis-tribution for studying human mobility affectson spread of Dengue. A comparative studywith Levy flight, exponential and uniform dis-tribution of step length of human mobility onvector borne disease is described in the supple-mentary information.
We model the spatial dynamics of Dengueusing the CA formalism by placing human andvector “agents” on two overlapping lattices anddifferent disease states of these agents. We im-pose transition probabilities between the dis-ease states based on field studies. For vectorswe impose diffusive pattern, and for humans weuse the exponential distribution of step lengthas described before. As inputs to the model,we use the data from a Ahmedabad city in themid-western part of India with a population ofabout 6 million people (In Fig.2, we show theDengue cases at ward level in Ahmedabad in2010 ). We compare the results of simulationDengue incidence with the recorded cases inAhmedabad from 2006-2012.
Our paper is organized as below. Section 1 isthe current introduction. In Section 2, we dis-cuss compartmental structure (SEIR-SEI) ofour Reaction-Diffusion (RD) and Cellular Au-tomata models. For the RD model, we alsodiscuss main results in this section. CA modelhas sub sections describing vector and humanlattice and their interaction. For vectors, wediscuss how we model their population basedon the available data, and assumptions on theirmortality and mobility. For Humans, we de-scribe distribution of people on the lattice, andmobility patterns derived from statistical dis-tribution. Human-vector interactions we de-scribe how infection gets transmitted from vec-tor to human lattice and vice versa. In Sec-tion 3, we describe the results from CA sim-ulations. We divide this section into two sub-sections describing the Dengue spread with andwithout human mobility. In Section 3.1, we de-
Figure 2: Dengue cases in Ahmedabad 2010(data from Ahmedabad Municipal Corpora-tion)
scribe the spatio patterns of the disease spreadwithout human mobility for different infectionrates over a span of 76 months from the startof the disease. We compare the temporal re-sults so obtained with the actual Dengue casesin Ahmedabad from 2006-2012. In Section 3.2,we move on to describe spatial patterns includ-ing human mobility. We will describe differentmodels of human mobility, and explain the ra-tionale behind using exponential distributionfor our model. We also compare the spatio-temporal patterns with and without mobilityand describe the counter intuitive and con-trasting results caused by human mobility (Insupplementary information we provide a com-parison of the other two models of human mo-bility viz: Levy flight and Random step lengthdistribution with that of immobile humans).In the last section we conclude by summariz-ing the main features and results of our model.
2 Model Formulation
In this study, we use the standard com-partmental model to divide the humans intoSEIR and vector population into SEI groups.Only infected vectors and infected humanscan transmit the dengue virus to susceptiblepopulation (See Fig.3 for illustration). Ex-posed population is infected with the vectorbut not infectious (i.e. they cannot transmit
3

Figure 3: SEIR-SEI model of human-vector in-teractions
the Dengue virus). In Fig.3, we show theflow diagram of SEIR-SEI model. The corre-sponding ordinary differential equations (non-spatial) describing temporal evolution of Hu-man and vector population are given below inEqs. 1 and 2) (see [16, 1] for review):Disease dynamics in humans:
dShdt
= µhNh − βvhShIv − µhShdEhdt
= βvhShIv − αhEh − µhEhdIhdt
= αhEh − rIh − µhIhdRhdt
= rIh − µhRh, (1)
Disease dynamics in vectors:
dSvdt
= µvNv − βhvShIv − µvSvdEvdt
= βhvSvIh − αvEv − µvEvdIvdt
= αvEv − rIh − µvIv. (2)
Here µh, µv represent human and vector mor-tality (death rates); βvh, βhv represent the vec-tor to human and human to vector infectionrates; αh, αv are the transition rates from ex-posed to infected states in humans and vectors;r is the recovery rate. The above equations as-sume that the total population of humans and
vectors is conserved. The death rate for hu-mans (about 1/(75yrs))is much lower than thatof vectors (about 1/(50 days)), hence the dy-namical time scales vary widely. The temporalevolution of these equations, stationary statesand stability conditions have been investigatedand reported in many works[16, 19], and willnot be discussed in this work. We focus on thespatial approaches to modeling Dengue basedon reaction diffusion equations in the next sec-tion.
2.1 Reaction-diffusion approach
In the ODE models described above assumesmixing of population and hence no spatial in-formation is encoded in it. Spatial approachesare needed to analyze local and global dynam-ics, and present more realistic picture of thedisease propagation. In vector borne diseases,spatial spreading is possible only when theremobility of vectors, humans or both. Vectors,especially A. Aegepti rarely fly long distancesby itself, and their mobility can be modeleda diffusion process [22, 14]. The ODEs willbe modified to Partial Differential Equations(PDE), where the diffusion terms will be addedonly to the vector equations. Human mobilityis more complex and harder integrate into thePDE paradigm, requiring use of non-local frac-tional derivatives [5]. We will consider humanmobility patterns in the Cellular Automata ap-proach.
The modified PDE equations for humans instages {S,E, I,R} with spatial (x, y) and tem-poral dependence are:
∂Sh∂t
= µhNh − F 2βvhShIv − µhSh∂Eh∂t
= F 2βvhShIv − αhEh − µhEh∂Ih∂t
= αhEh − rIh − µhIh∂Rh∂t
= rIh − µhRh. (3)
For the vectors, the modified equations withthe diffusion term and flight range F are :
∂Sv∂t
= D∇2Sv + µvNv − F 2βhvShIv − µvSv
4

∂Ev∂t
= D∇2Ev + F 2βhvSvIh − αvEv − µvEv∂Iv∂t
= D∇2Iv + αvEv − rIh − µvIv, (4)
where ∇2 = ∂2
∂x2+ ∂2
∂y2is the Laplacian opera-
tor.The parameter values are shown in Table 1.The flight range F = 7 indicates the maximumnumber of cells, vectors can hop in at a time.
The results of our simulation on a 500× 500mesh grid, running for 580 days are shownat various intervals in Fig.4. The top (bot-tom) row shows the density of humans (vec-tors) in various stages of the disease. Ini-tially (at t=0), all humans are susceptible andall vectors, except the ones at the center aresusceptible. Only the central cell vectors areinitially infected with Dengue. The coloringscheme follows Fig.3 with the following rules:If the susceptible (recovered) density exceeds0.5, the cell color is blue(green), or if theinfected(exposed) density exceeds 0.25, it ispainted red(orange).
The overall pattern of the Dengue spread ap-pears like a circular wave spreading outwards.This is due to the assumption of homogeneousand isotropic distribution of population anddiffusion constants being same in all directions.We observe that Infection in the vector gridspreads faster than the Human grid. We shouldnote that the death rate of vectors is muchhigher than that of humans, but the incuba-tion period is longer in vectors than humans(αh > αv). Hence we can clearly observe theexposed (in orange) population in vectors thanhumans.
The corresponding temporal variations ofhumans and vectors in different disease states(extended upto 1200 days) is shown in Fig.5. Itexhibits typical SIR behavior upto 27 months.the decline in infected population afterwords ismainly due to boundary effect. Infections can-not spread beyond that and only possibility isrecovery of the infected.
2.2 Cellular Automata
In Cellular Automata, space is divided into dis-crete grid and a finite state machine is assumedto operate at each grid point. Time is discrete,
and at every step each cell is in one of a finiteset of possible states. The transition probabil-ities depend only on the present state of thecell and its neighbors [21].
In this work, we choose a two layer stochas-tic Cellular Automata model where each cellcan have multiple agents and their number andstates change with time [7]. It consists of twooverlapping square lattices H and M of thesame size (see Fig.6) representing the spaceoccupied by humans and mosquitoes respec-tively. Each cell H(i, j) of human layer canhave multiple agents (Humans) in different dis-ease states {S,E,I,R}, which can change withtime. For example consider a cell H23 with5 humans with {3S, 2E, 0I, 0R}. In the nexttime step, it can be {3S, 1E, 1I, 0R}. Simi-larly, in Vector cell, mosquitoes can have states{S,E,I}, which can change with time. In Table.2, we summarize the main parameters used inour CA simulations.
2.2.1 Vector population and mobility
In each cell of the vector lattice V (i, j),mosquitoes are distributed according to thePoisson distribution P(λv), where λv is theaverage density of the A.Aegepti mosquitoesin the cell. We use the periodic (monthly)data, denoted by { Nm1 , Nm2 , . . . Nm72}, onthe Aedes vector density available for Ahmed-abad city in India from 2006-2012, plotted inFig.7, for simulations. At the start of the sim-ulation, in each cell the mean occupation isassumed to be λv = Nm the measured aver-age per room density of mosquitoes. To inter-polate between the monthly data, we assumean exponential growth n(t) = n(t0)er(t−t0) be-tween month mk and mk+1, with growth rater = 1
30 ln(Nmk+1/Nmk), n(t0) = Nmk and
t0 ≤ t < t0 + 30. We denote the population ineach cell from simulations be ns(t) and assignnew births/deaths depending whether δn =n(t) − ns(t) is positive or negative. If δn > 0,we generate new susceptible mosquitoes withPoisson distribution P(δn). If δn < 0, we cal-culate the a random number m = P(−δn) andkill them in that cell.
5

Table 1: Table of parameters for the ODE and Reaction and Diffusion Equation equations [19]Parameter Description Value
µh Death rate of humans 0.0000391 per day
µv Death rate of vectors 0.07142 per day
βhv Infection rate from human to vector 0.00008
βvh Infection rate from vector to human 0.00005
rh Recovery rate of human population 0.07142 per day
αh Rate at which exposed human change to be infected human 0.2 per day
αv Rate at which exposed vector change to be infected vector 0.1 per day
F Flight range 7
D Diffusion Coefficient 0.2
Months: (a)1
Human lattice
Vector lattice
(b)7 (c)12 (d)18 (e)24 (f)32
1
Figure 4: PDE model with vector mobility with grid size is 500×500. The upper row correspondsto human grid and the bottom row to vector grid.
0 10 20 30 400
2
4
6
8
10
12
14x 10
5
Time(Months)
Po
pu
lati
on
of
hu
man
s
Sh
Ih
Rh
0 10 20 30 400
2
4
6
8
10
12
x 105
Time(Months)
Po
pu
lati
on
vec
tors
Sv
Iv
0 10 20 30 400
0.5
1
1.5
2
2.5
3x 10
5
Time(Months)
Po
pu
lati
on
hu
man
s an
d v
ecto
rs
Ih
Iv
(a) (b) (c)
1
Figure 5: Temporal dynamics of Reaction Diffusion series - (a) SIR for humans, (b) S-I forvectors (c) Infected Humans and Vectors.
Vector Mortality: A. Aegepti life span isshort (average 45 days) and its death rate isnot significantly affected by whether it is car-
rying the Dengue virus or not. We model themosquito as dying with constant rate µv.
6

Figure 6: Human and Vector lattice.
0 10 20 30 40 50 60 70 800
0.5
1
1.5
2
2.5x 10
6
Time (months)
A.A
egep
ti po
pula
tion
Ahmedabad: 2006−2012
Figure 7: A. Aegepti mosquito populationin Ahmedabad from 2006-2012 estimated fromAhmedabad Municipal Corporation data.
Vector Mobility: We model the vector mo-bility by hopping of mosquitoes between cells.At each time step, 50% of the mosquitoes de-cide to move out of the cell. The probabil-ity of hopping to a Moore neighborhood 1 ofrange r is 1/2r r = 1, 2, . . . ,∞. Within thisrange, the probability of choosing any cell isuniform p = 1/((2r + 1)2 − 1). If we take ato be the width of each cell, the average dis-tance along sides is a
∑∞r=1 r/2
r = 2a (max-imum flight range fr = 25m), and along the
1It consists of cells in a square neighborhood at anedge cell distance of r from the center. There are (2r+1)2 cells in such a ring [21].
diagonal is 2a√
2.
2.2.2 Humans Lattice and Mobility
In each cell, human occupation is chosen tobe Poisson distribution P(λ) with the mean,λ = 5. The average population of our modelwith grid size 500 × 500 is about 1.25 mil-lion. The birth rate in the cell is balancedwith the death rate to keep the populationconstant. Human mortality rate (1/70yrs) ismuch smaller to compared to the vector anddoes not account for significant deaths duringthe simulation time. We also assume that thedeath rate due to Dengue is negligible com-pared to the actual cases.
Human mobility is primarily responsible forcarrying communicable diseases to large dis-tances, both within the city and across thecities. In vector borne diseases, disease canbe spread by both human and vector mobility.Typically human mobility cause the virus tocarry across different regions in much shortertime period than the vectors. Mobility of in-fected humans or vectors create multiple wavesof diseases at different locations. Mobility canalso lead to depletion of infected in a particularregion and hence local reduction in the trans-mission rates. Such competing forces call fora careful study of the mobility effects on thespread of vector borne diseases.
Many factors influence mobility within a city-population density, transportation networksand traffic patterns, economic activity in dif-ferent parts etc (home, work, school, shops,hospitals, transportation networks etc.). Whatis clear is that mobility patterns are not dif-fusive. Modeling spatial human mobility incities (especially in India) in the absence ofcredible data is a daunting task. Several in-genious methods have been used in the past tostudy the statistical patterns of human mobil-ity. Tracking of currency notes yielded a scalefree Levy flight pattern[6] P (∆r) ∼ (∆r)−(1+β)
across large scale. Later, a study based onthe trajectory of 100,000 annonymized mobilephone users [9] in US showed that the steplength distribution behaves like a truncatedLevy flight P (δr) = A
(δr+δr0)βexp(−δr/κ).
7

The advantage of these methods is that sta-tistical patterns are robust and does not crit-ically depend on the variations in transporta-tion networks or population density. Dengueis primarily an urban disease, where mobilitywithin the city is more important than across.Study of intra-urban mobility received specialattention in the recent years. Recently Lianget al. have produced a strong evidence of expo-nential distribution in Intra-urban movements[13]. This work is supported by a recent studyby Noulas et al., when explored at intra citylevel [17]) using location data by social net-working Foursquare. In this work, we chooseexponential step length model:
P (∆r) = λe−λ∆r, (5)
where 1/λ is the average step length( whichin general is not universal). Liang et al. foundthis exponent to vary from 0.08 km−1 (Los An-geles) to 0.22 km−1 (Beijing, and London). Wechoose λ = 0.2km−1 as a representative param-eter for our study. In supplementary materi-als, we provide a detailed comparison of resultsfrom different models of human mobility.
In this work, we restrict the mobility to S,E and R population. Infected are immobileas they are at rest/hospitalized. With a 50%probability of S, E or R type people movefrom their current cell following above distri-bution. Once a person decides to move, a ran-dom number following exponential distribution(as in Eq. 5) is drawn and step length is de-termined. The angle is from uniform distribu-tion U(0, 2π). The cell which contains the loca-tion (δr, θ) from the current point is chosen asthe destination cell. If the range is outside theCA boundary, periodic boundary conditions tobring the person back into the CA world. Thiskind of ensures that net migration (in and outof CA) is zero.
2.2.3 Interactions between humans andvectors
Human-vector and vector-human interactionhappens mainly through mosquito biting. Wehave set the maximum biting rate of two andassumed that the probability of {0, 1, or 2}
bites are {1/4, 1/2, 1/4 } respectively. In eachcell, an A. Aegepti mosquito (of any type S,Eor I) randomly selects a human to bite andafter each bite, the vector stays in the samecell or follows the vector mobility pattern de-scribed before. The Dengue virus is transmit-ted from human to vector (or vice-versa)whenan infected vector Iv bites a human in a sus-ceptible state (Sh) or an infected human Ihgets bitten by a susceptible mosquito Sv withrate βhv(βvh) of 0.4/bite (see Table 2). Spatialspread across the cells happens due to vectoror human mobility as described before.
3 Results
We have chosen CA grid size to be L × L =500×500 and an average human occupancy of 5agents per cell. This gives us a large grid popu-lation of 1.25 million, suitable to emulate a typ-ical large city in India. If we assume each cell torepresents an area a2 = 10m × 10m = 100m2,(where a is the width of each cell), we getthe model world size to be 25km2. Our fo-cus is to compare the spatio-temporal patternsof Dengue with and without human mobilityand test how closely it can explain observedDengue dynamics in Ahmedabad city (locatedin the middle-western part of the country) forwhich Dengue cases and mosquito density hasbeen is available from 2006-2012.
3.1 Mobile vectors and immobile hu-mans
In Fig.8 we show panels of spatio-temporalspread of Dengue on human layer. The pa-rameters are chosen from Table 2 with diffusivevector mobility (Section 2.2.1), and four differ-ent values of βhv and βvh viz. : 0.15, 0.4, 0.6,0.9. We choose the following color code: Blackrepresents no human (vector) occupation in thecell. The cell is colored blue at least one per-son is susceptible. It is colored orange or reddepending on whether more than 25% of thepopulation is exposed or infected. In case ofconflict, infected color red gets priority. If allpersons have recovered, then the cell is coloredgreen.
8

Table 2: Value of ParametersParameter Description Values
τhEThe duration for exposed humanto become Infected
Uniform distribution:4-7 days [11]
τvEInfected vectors incubation pe-riod
Uniform distribution: 8to 12 days [23, 10]
fr Maximum flight range of vectors 25 m [12]
Br Biting rate of vectors 0 to 2/day [7]
βhν , βνhHuman to vector and vector tohuman transmission rates
{ 0.15, 0.4, 0.6, 0.9}
Months
βhv
(a)1 (b)16 (c)32 (d)48 (e)60 (f)76
0.15
0.40
0.60
0.90
1
Figure 8: Cellular Automata model with immobile humans. The parameters values are listedin Table 2. Grid size is taken to be 500× 500.
We start the disease dynamics by setting allvectors in the central cell to be infected. Basedon these figures, we make the following obser-vations:
• At βhv (0.15) infection levels are very lowand spatial patterns cannot observed . InFig.10, we see that infections persist atvery low levels even after 72 months. Butwe cannot ascertain distance from the cen-
ter to which disease goes extinct from thefigure.
• For higher βhv ≥ 0.4, disease enters the en-demic state and spreads outwards precisecalculation of transition point in is beyondthe scope of this work.
• The Dengue spreads on the human andmosquito lattice in a circular wave pat-
9
tern. Vector wave leads the infection (notshown).
• In the initial phase, the Infected humansare present throughout the inner circle.Later the infected are mainly in the pe-riphery. In the core infected humans re-cover (green) over time, passing throughincubation period.
• People in the core who were not infectedpreviously are at the risk of infectiondue to secondary regeneration of vectors.These periodic outbreaks have high corre-lation with the temporal variation of vec-tor density (not shown). They occur withdifferent intensity and scale show highcorrelation with the rainfall pattern(crosscorrelations not shown in this work).
• In the absence of human mobility, Denguetakes long time to spread to the boundary.Speed of propagation increases with theinfection rate.
The temporal patterns of human and vectorpopulation, infected human and infected vec-tor and SEI groups of humans are shown inFig.9. Here we observe that at any time, thefraction of infected is quite small comparableto susceptibles (Panel a). But, over time largefraction of the population will be infected andmove to recovery phase ( as expected from SIRor SEIR dynamics R is monotonically increas-ing in active phase if there no deaths). Sim-ilar trend can be seen in for vectors also inpanel b. On a closer look, (in panel c), wesee that both infected human and infected vec-tors show substantial variations in time and arecorrelated with annual periodicity of monsoon-rainfall and other harmonics (not shown).
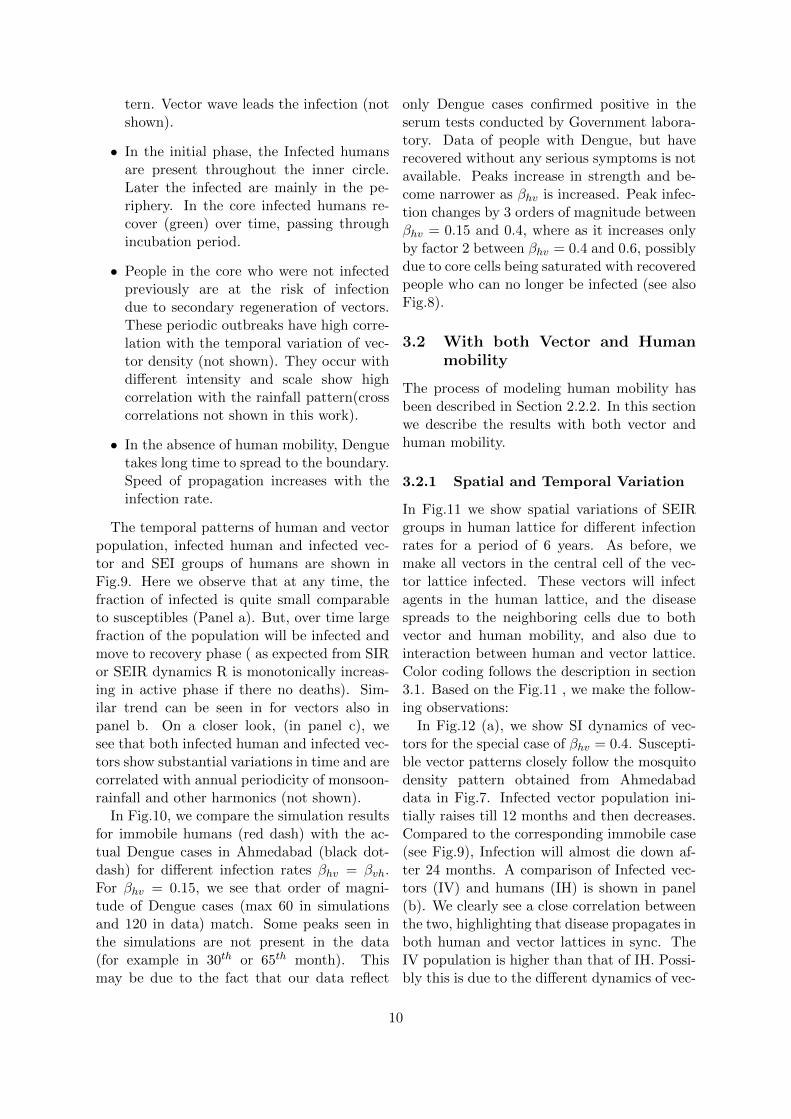
In Fig.10, we compare the simulation resultsfor immobile humans (red dash) with the ac-tual Dengue cases in Ahmedabad (black dot-dash) for different infection rates βhv = βvh.For βhv = 0.15, we see that order of magni-tude of Dengue cases (max 60 in simulationsand 120 in data) match. Some peaks seen inthe simulations are not present in the data(for example in 30th or 65th month). Thismay be due to the fact that our data reflect
only Dengue cases confirmed positive in theserum tests conducted by Government labora-tory. Data of people with Dengue, but haverecovered without any serious symptoms is notavailable. Peaks increase in strength and be-come narrower as βhv is increased. Peak infec-tion changes by 3 orders of magnitude betweenβhv = 0.15 and 0.4, where as it increases onlyby factor 2 between βhv = 0.4 and 0.6, possiblydue to core cells being saturated with recoveredpeople who can no longer be infected (see alsoFig.8).
3.2 With both Vector and Humanmobility
The process of modeling human mobility hasbeen described in Section 2.2.2. In this sectionwe describe the results with both vector andhuman mobility.
3.2.1 Spatial and Temporal Variation
In Fig.11 we show spatial variations of SEIRgroups in human lattice for different infectionrates for a period of 6 years. As before, wemake all vectors in the central cell of the vec-tor lattice infected. These vectors will infectagents in the human lattice, and the diseasespreads to the neighboring cells due to bothvector and human mobility, and also due tointeraction between human and vector lattice.Color coding follows the description in section3.1. Based on the Fig.11 , we make the follow-ing observations:
In Fig.12 (a), we show SI dynamics of vec-tors for the special case of βhv = 0.4. Suscepti-ble vector patterns closely follow the mosquitodensity pattern obtained from Ahmedabaddata in Fig.7. Infected vector population ini-tially raises till 12 months and then decreases.Compared to the corresponding immobile case(see Fig.9), Infection will almost die down af-ter 24 months. A comparison of Infected vec-tors (IV) and humans (IH) is shown in panel(b). We clearly see a close correlation betweenthe two, highlighting that disease propagates inboth human and vector lattices in sync. TheIV population is higher than that of IH. Possi-bly this is due to the different dynamics of vec-
10

0 10 20 30 40 50 60 700
2
4
6
8
10
x 105
Time(Months)
Po
pu
lati
on
of
hu
man
s
Sh
Ih
Rh
0 10 20 30 40 50 60 700
0.5
1
1.5
2
x 106
Time(Months)
Po
pu
lati
on
vec
tors
Sv
Iv
0 10 20 30 40 50 60 700
1
2
3
4
5
6
7
8
9x 10
4
Time(Months)
Po
pu
lati
on
hu
man
s an
d v
ecto
rs
Ih
Iv
(a) (b) (c)
1
Figure 9: Temporal dynamics of Dengue (βhv = 0.4) (a) Susceptible,Infected and RecoveredHumans (b) susceptible and Infected vectors (c)Infected humans and Infected Vectors.
0 10 20 30 40 50 60 700
20
40
60
80
100
120
140
Den
gu
e ca
ses
fro
m r
eal d
ata
Time(Months)
0 10 20 30 40 50 60 700
10
20
30
40
50
60
70Dengue cases from real dataDengue cases from simulationβ
HV=0.15
βVH
=0.15
0 10 20 30 40 50 60 700
50
100
150
Time(Months)
0 10 20 30 40 50 60 700
1
2
3x 10
4
Den
gu
e ca
ses
fro
m s
imu
lati
on
Dengue cases from real dataDengue cases from simulationβ
HV=0.4
βVH
=0.4
Without Human Mobility(a) (b)
0 10 20 30 40 50 60 700
20
40
60
80
100
120
140
Den
gu
e ca
ses
fro
m r
eal d
ata
Time(Months)
0 10 20 30 40 50 60 700
0.5
1
1.5
2
2.5
3
3.5x 10
4
Dengue cases from real dataDengue cases from simulationβ
HV=0.6
βVH
=0.6
0 10 20 30 40 50 60 700
50
100
150
Time(Months)
0 10 20 30 40 50 60 700
2
4
6x 10
4
Den
gu
e ca
ses
fro
m s
imu
lati
on
Dengue cases from real dataDengue cases from simulationβ
HV=0.9
βVH
=0.9
(c) (d)
1
Figure 10: Comparison of Dengue cases from our simulation with recorded cases from Ahmed-abad city from 2006-2012 neglecting mobility of humans. (a)βhv = 0.15 (b)βhv = 0.4(c)βhv = 0.6 (d)βhv = 0.9.(Note the difference in scale in all panels).
tors: SEI compared to SEIR. Infectious state isthe last state for vectors, which in the absence
of mortality should raise to the initial numberof susceptibles. However competing dynamics
11

Months
βhv
(a)1 (b)16 (c)32 (d)48 (e)60 (f)76
0.15
0.40
0.60
0.90
1
Figure 11: Spatial temporal maps of Cellular Automata model with vector and exponentialhuman mobility for different infection rates ( βhv from 0.15-0.9)
of birth rates following observed data and highmortality rate, we observe higher vector popu-lation than humans. It also keeps the vectorsfrom completely going into absorbing state.
3.2.2 Comparison with and without hu-man mobility
In Fig.13, we explicitly compare infected hu-man population with and without human mo-bility for different infection rates. Based on thethis figure and the spatial spread in Fig.11 wemake the following observations.
• For βhv = 0.15 infection initially rises to amaximum of 12 (see Panel a) and is com-pletely suppressed in a short span of 11-12 months time, highlighting that the dy-namics goes to an absorbing state. Whereas for the immobile case, infections arestill active, even though the magnitude issmall. Spatial spread (Fig.11 a) cannot
be observed as the infection level does notexceed 25% threshold in most cells.
• For βhv = 0.4 (Panel b), infected popu-lation rises initially and reaches a peakin less than year and is completely sup-pressed after 20 months. In the latermonths we see some statistical fluctua-tions. In the immobile humans case, thedisease is in an active state throughout.These observations highlight that humanmobility has suppressed infection contraryto intuitive understanding.
• At βhv = 0.6 (Panel c), we see Infectionlevels two orders of magnitude higher thatof βhv = 0.4 (signaling active phase). Thescale of infection with and without hu-man mobility are roughly same, and alsothe relative position of peaks in infections.However, mobility is causing higher infec-tions in the beginning compared to the
12

0 10 20 30 40 50 60 700
2
x 106
Su
scep
tib
le V
ecto
rs
Time(Months)
0 10 20 30 40 50 60 700
100
200
300
400
500
600
700
Infe
cted
Vec
tors
Sv
Iv
0 10 20 30 40 50 60 70 800
50
100
150
200
250
300
350
Time(Months)
Po
pu
lati
on
hu
man
s an
d v
ecto
rs
IhIv
(a) (b)
1
Figure 12: SIR dynamics of humans and vectors with exponential human mobility model withβhv = 0.4. (a) Susceptible and Infected vectors (b) Infected humans and Infected Vectors.
0 10 20 30 40 50 60 700
10
20
Infe
cted
Hu
man
s w
ith
mo
bili
ty
Time(Months)
0 10 20 30 40 50 60 700
50
100
infe
cted
Hu
man
s w
ith
ou
t m
ob
ility
Infected Humans with mobilityInfected Humans with out mobilityβ
HV=0.15
βVH
=0.15
0 10 20 30 40 50 60 700
100
200
Infe
cted
Hu
man
s w
ith
mo
bili
ty
Time(Months)
0 10 20 30 40 50 60 700
2
4x 10
4
infe
cted
Hu
man
s w
ith
ou
t m
ob
ility
Infected Humans with mobilityInfected Humans with out mobility
βHV
=0.4β
VH=0.4
Comparison of infected Humans with and with out mobility(a) (b)
0 10 20 30 40 50 60 700
1
2
3
4x 10
4
Infe
cted
Hu
man
s w
ith
mo
bili
ty
Time(Months)
0 10 20 30 40 50 60 700
1
2
3
4x 10
4
Infected Humans with mobilityInfected Humans with out mobilityβ
HV=0.6
βVH
=0.6
0 10 20 30 40 50 60 700
1
2
3
4
5x 10
4
Infe
cted
Hu
man
s w
ith
mo
bili
ty
Time(Months)
0 10 20 30 40 50 60 700
1
2
3
4
5x 10
4
infe
cted
Hu
man
s w
ith
ou
t m
ob
ility
Infected Humans with mobilityInfected Humans with out mobilityβ
HV=0.9
βVH
=0.9
(c) (d)
1
Figure 13: Comparison of Dengue cases with exponential human mobility and with out humanmobility (a)βhv = 0.15 (b)βhv = 0.4 (c)βhv = 0.6 (d)βhv = 0.9.(Note the difference in scale).
immobile case. There is still suppressionof infections due to mobility. The spatialmaps for (βhv = 0.6 in Fig.11) shows theinfection does not spread like a circularwave in contrast to immobile. Mobilityhas diffused the infections. By 60 monthsmost people have recovered and spreading
has slowed down drastically.
• The pattern for βhv = 0.9 (Panel d) ismuch more similar to the case withouthuman mobility, with position of infec-tion peaks matching upto 60 months andkeeping order of magnitude same. Spatial
13
patterns show circular wavy spread in theupto 32 months and later hit the bound-ary lattice. Infection in still active due tohigh βhv. After 70 months, people havefully recovered to spread any infection.
In all the above cases, we clearly see thatinfection levels with human mobility is lessthan that immobile case. We remind read-ers that we have chosen S, E, and R individ-uals mobile, keeping infected immobile. Weobserve that exposed population have inducedsignificant secondary waves, but also depletethe original region where they were spreadingthe infection. When the exposed people moveto cells which have completely recovered, it islikely that the corresponding vector cells arealso filled with susceptible mosquitoes. Thisis due to high correlations in the dynamics ofIh, Iv, and makes it is unlikely to spread theinfection there. Susceptibles can get infectedwhen they move to cells where the vectors inthe neighborhood cells are infected. Mobilityof recovered people will not affect the infectiondynamics. A combination of the above factorshave ensured that mobility has reduced or fullysuppressed the infection levels in all the caseswe have studied.
We however caution the reader that thespatio-temporal patterns are not universal.In the supplementary information, we studyspread of Dengue with two other models ofhuman mobility (Levy Flight (LF) and Ran-dom movement (RM) ) and compare it withthe immobile case. We observe different spatio-temporal patterns for LM and EM models, butboth suppress the infection levels. It is only incase of largely unrealistic RM model that wesee enhancement of infection levels in the earlyphase, but it gets completely suppressed in ashort time at all infection rates.
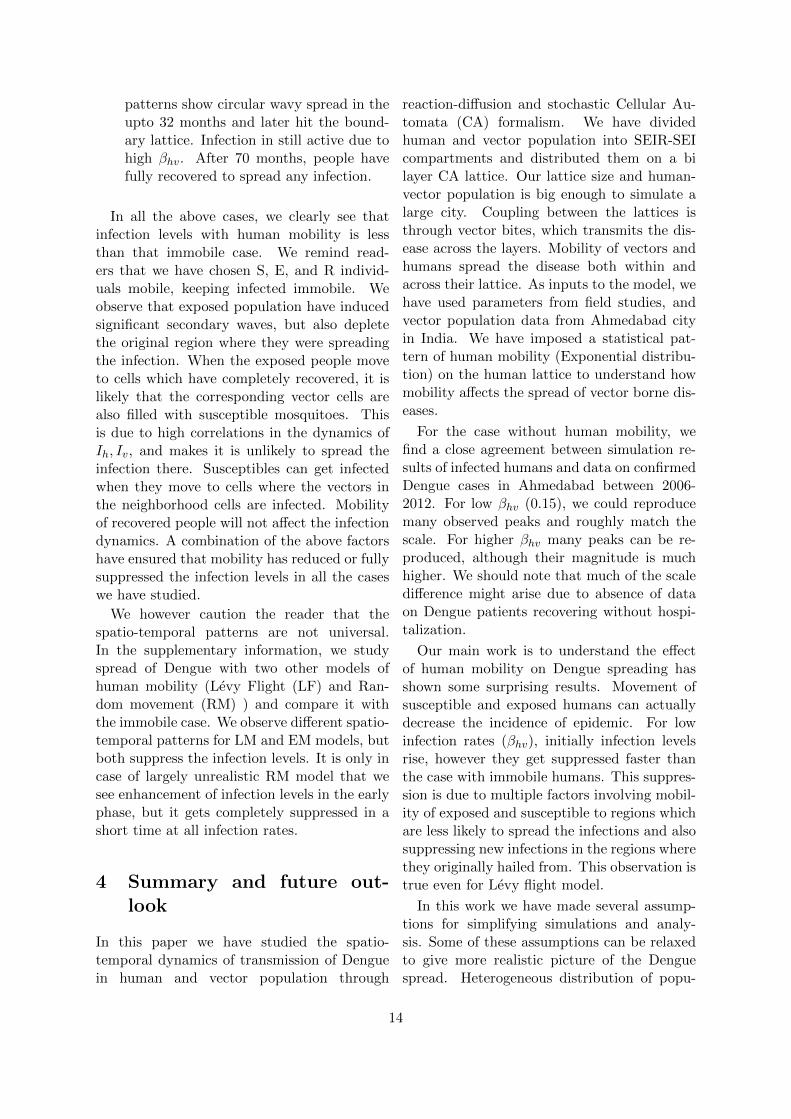
4 Summary and future out-look
In this paper we have studied the spatio-temporal dynamics of transmission of Denguein human and vector population through
reaction-diffusion and stochastic Cellular Au-tomata (CA) formalism. We have dividedhuman and vector population into SEIR-SEIcompartments and distributed them on a bilayer CA lattice. Our lattice size and human-vector population is big enough to simulate alarge city. Coupling between the lattices isthrough vector bites, which transmits the dis-ease across the layers. Mobility of vectors andhumans spread the disease both within andacross their lattice. As inputs to the model, wehave used parameters from field studies, andvector population data from Ahmedabad cityin India. We have imposed a statistical pat-tern of human mobility (Exponential distribu-tion) on the human lattice to understand howmobility affects the spread of vector borne dis-eases.
For the case without human mobility, wefind a close agreement between simulation re-sults of infected humans and data on confirmedDengue cases in Ahmedabad between 2006-2012. For low βhv (0.15), we could reproducemany observed peaks and roughly match thescale. For higher βhv many peaks can be re-produced, although their magnitude is muchhigher. We should note that much of the scaledifference might arise due to absence of dataon Dengue patients recovering without hospi-talization.
Our main work is to understand the effectof human mobility on Dengue spreading hasshown some surprising results. Movement ofsusceptible and exposed humans can actuallydecrease the incidence of epidemic. For lowinfection rates (βhv), initially infection levelsrise, however they get suppressed faster thanthe case with immobile humans. This suppres-sion is due to multiple factors involving mobil-ity of exposed and susceptible to regions whichare less likely to spread the infections and alsosuppressing new infections in the regions wherethey originally hailed from. This observation istrue even for Levy flight model.
In this work we have made several assump-tions for simplifying simulations and analy-sis. Some of these assumptions can be relaxedto give more realistic picture of the Denguespread. Heterogeneous distribution of popu-
14

lation by changing human occupation in lat-tices based on ward level population densitydata and excluding regions like rivers and greenareas. Exclusion of regions acts as a barrierand prevents secondary epidemic waves emerg-ing from that part. Inclusion of environmen-tal variables such as rainfall patterns can serveas proxy water clogging which acts as breed-ing sites for vectors. In this work, statisti-cal patterns of human mobility has been takenfrom studies in US, UK and China. It is notclear (due to lack of literature), whether thesame patterns hold good in developing coun-tries such as India, where the current studyfocuses on. Mobility patterns are closely likedto transportation networks and traffic density.Inclusion of these factors, along with popula-tion density can give us more specific insightsinto how mobility affects spread of vector bornediseases in cities. We hope that the presentwork will motivate researchers to take up suchstudies in the future.
Acknowledgment
The authors would like to thank Vinod Reddy,Richard Koblenu, and Profs. Malavika Sub-ramnyam, Bireswar Das, and Ravindra Am-ritkar for insightful discussions and sugges-tions. We specially thank Dr. V K Kohli,Assistant Entomologist Ahmedabad Munici-pal Corporation for providing us with data onDengue incidences and mosquitoes in Ahmed-abad city.
References
[1] Mathieu Andraud, Niel Hens, ChristiaanMarais, and Philippe Beutels. Dynamicepidemiological models for dengue trans-mission: a systematic review of structuralapproaches. PloS one, 7(11):e49085, Jan-uary 2012.
[2] N Bhamarapravati and Yoksan Sutee.Live attenuated tetravalent dengue vac-cine. Vaccine, 18:44–47, 2000.
[3] Krishna Prasad Bhandari, PLN Raju, andB. S. Sokhi. Application of gis model-ing for dengue fever prone area based onsocio-cultural and environmental factors–a case study of delhi city zone. Int ArchPhotogramm Remote Sens Spat Inf Sci,37:165–170, 2008.
[4] Aplana Bohra and Haja Andrianasolo.Application of GIS in Modelling of DengueRisk based on Socio-Cultural Data: Caseof Jalor, Rajasthan, India. In Conferencefor Remote Imaging, Sensing and Process-ing, NUS, number November, pages 5–9,2001.
[5] D. Brockmann and L. Hufnagel. FrontPropagation in Reaction-SuperdiffusionDynamics: Taming Levy Flights withFluctuations. Physical Review Letters,98(17):178301, April 2007.
[6] D Brockmann, L Hufnagel, and T Geisel.The scaling laws of human travel. Nature,439(7075):462–5, January 2006.
[7] Lıliam Cesar de Castro Medeiros, Ce-sar Augusto Rodrigues Castilho, CynthiaBraga, Wayner Vieira de Souza, LedaRegis, and Antonio Miguel Vieira Mon-teiro. Modeling the dynamic transmissionof dengue fever: investigating disease per-sistence. PLOS neglected tropical diseases,5(1):e942, 2011.
[8] M Derouich and A Boutayeb. Denguefever: Mathematical modelling and com-puter simulation. Applied Mathematicsand Computation, 177(2):528–544, 2006.
[9] Marta C Gonzalez, Cesar a Hidalgo, andAlbert-Laszlo Barabasi. Understandingindividual human mobility patterns. Na-ture, 453(7196):779–82, June 2008.
[10] Duane J Gubler, Paul Reiter, Kristie LEbi, Wendy Yap, Roger Nasci, andJonathan A Patz. Climate variability andchange in the united states: potentialimpacts on vector-and rodent-borne dis-eases. Environmental health perspectives,109(Suppl 2):223, 2001.
15

[11] Scott B Halstead. Dengue virus-mosquitointeractions. Annu. Rev. Entomol.,53:273–291, 2008.
[12] Goro Kuno. Review of the factors modu-lating dengue transmission. Epidemiologicreviews, 17(2):321–335, 1995.
[13] Xiao Liang, Jichang Zhao, Li Dong, andKe Xu. Unraveling the origin of expo-nential law in intra-urban human mobil-ity. Scientific reports, 3, 2013.
[14] Norberto Anıbal Maidana and Hyun MoYang. Describing the geographic spreadof dengue disease by traveling waves.Mathematical biosciences, 215(1):64–77,September 2008.
[15] NCVRB. Data from national vector bornediseases control program director generalof health services, 2013.
[16] Hiroshi Nishiura. Mathematical and Sta-tistical Analyses of the Spread of Dengue.Dengue Bulletin, 30:51–67, 2006.
[17] Anastasios Noulas, Salvatore Scellato, Re-naud Lambiotte, Massimiliano Pontil, andCecilia Mascolo. A tale of many cities:universal patterns in human urban mobil-ity. PloS one, 7(5):e37027, 2012.
[18] A Townsend Peterson, Carmen Martınez-Campos, Yoshinori Nakazawa, and En-rique Martınez-Meyer. Time-specific eco-logical niche modeling predicts spatialdynamics of vector insects and humandengue cases. Transactions of the RoyalSociety of Tropical Medicine and Hygiene,99(9):647–655, 2005.
[19] P Pongsumpun, D Garcia Lopez,C Favier, L Torres, J Llosa, and M aDubois. Dynamics of dengue epidemicsin urban contexts. Tropical medicine& international health : TM & IH,13(9):1180–7, September 2008.
[20] LBL Santos, MC Costa, STR Pinho, RFSAndrade, FR Barreto, MG Teixeira, and
ML Barreto. Periodic forcing in a three-level cellular automata model for a vector-transmitted disease. Physical Review E,80(1):016102, 2009.
[21] Palash Sarkar. A brief history of cellu-lar automata. ACM Computing Surveys(CSUR), 32(1):80–107, 2000.
[22] Annelise Tran and Marcel Raffy. On thedynamics of dengue epidemics from large-scale information. Theoretical populationbiology, 69(1):3–12, February 2006.
[23] WHO. Dengue: guidelines for diagnosis,treatment, prevention and control. WorldHealth Organization, 2009.
16