Sediment-Water Interaction and Early Diagenesis in the Laurentian Trough
Article
Volume 12, Number 3
23 March 2011
Q0A008, doi:10.1029/2010GC003335
ISSN: 1525‐2027
Spatial and temporal evolution of the megasplay faultin the Nankai Trough
Gaku KimuraDepartment of Earth and Planetary Science, Graduate School of Science, University of Tokyo,7‐3‐1 Hongo, Bunkyo‐ku, Tokyo 113‐0033, Japan ([email protected]‐tokyo.ac.jp)
Gregory F. MooreDepartment of Geology and Geophysics, University of Hawaii at Mānoa, 1680 East‐West Road,Post 813, Honolulu, Hawaii 96822, USA ([email protected])
Michael StrasserResearch Center Ocean Margins, University of Bremen, Leobenerstrasse, MARUM Building,Room 1220, D‐28359 Bremen, Germany (mstrasser@uni‐bremen.de)
Elizabeth ScreatonDepartment of Geological Science, University of Florida, 241 Williamson Hall, PO Box 112120,Gainesville, Florida 32611, USA ([email protected])
Daniel CurewitzHeroy Geology Laboratory, Syracuse University, Syracuse, New York 13244‐1070, USA([email protected])
Carolyn Streiff and Harold TobinDepartment of Geoscience, University of Wisconsin‐Madison, 1215 W. Dayton Street, Madison,Wisconsin 53706, USA ([email protected]; [email protected])
[1] The temporal and spatial evolution of a seismogenic megasplay fault in the Kumano area, NankaiTrough (southwest Japan), is revealed by detailed investigation of the three‐dimensional structure of theshallow portions of the fault, combined with the results of drilling and dating of cores from IntegratedOcean Drilling Program (IODP) Expedition 316. The ENE striking eastern portion of the splay fault hasremained active since the inception of faulting at ∼1.95 Ma. The recent shortening rate is ∼1 m/kyr, whichrepresents ∼1.5%–2.5% of the total plate convergence rate of ∼40–65 m/kyr. The NE striking westernportion of the splay fault exhibits a different mode of activity. Early stage activity (before 1.55 Ma)was similar to the eastern portion, but the fault was inactive between 1.55 and 1.24 Ma. The fault wasreactivated for a short time at ∼1.24 Ma but again ceased activity after formation of the secondary branchand has been inactive since 1.24 Ma. Cessation of splay fault activity in the western domain after 1.55 Mamay be due to collision with a seamount and resulting bending of the accretionary prism in the splay faultfootwall. Continuous activity of the eastern domain of the splay fault after 1.24 Ma may be related to geo-metrical favorability due to reorientation of the fault after the seamount passed beneath the imbricate thrustzone, leading to initiation of slightly oblique subduction.
Copyright 2011 by the American Geophysical Union 1 of 23

Components: 11,900 words, 13 figures.
Keywords: splay fault; Nankai Trough; earthquake; tsunami; accrerionary prism; IODP.
Index Terms: 8170 Tectonophysics: Subduction zone processes (1031, 3060, 3613, 8413); 8010 Structural Geology:Fractures and faults; 7240 Seismology: Subduction zones (1207, 1219, 1240).
Received 23 August 2010; Revised 21 January 2011; Accepted 28 January 2011; Published 23 March 2011.
Kimura, G., G. F. Moore, M. Strasser, E. Screaton, D. Curewitz, C. Streiff, and H. Tobin (2011), Spatial and temporalevolution of the megasplay fault in the Nankai Trough, Geochem. Geophys. Geosyst., 12, Q0A008,doi:10.1029/2010GC003335.
Theme: Mechanics, Deformation, and Hydrologic Processes at Subduction Complexes,With Emphasis on the Nankai Trough Seismogenic Zone Experiment (NanTroSEIZE)Drilling TransectGuest Editors: D. Saffer, P. Henry, and H. Tobin
1. Introduction
[2] Great earthquakes and tsunamis along subduc-tion zones are generated when large areas of theplate boundary megathrust rupture, and slip alongfaults rapidly propagates close to the ocean floor.Tsunamis can be also generated when catastrophicsubmarine landslides are produced due to unstableslope collapse (e.g., New Guinea) [Matsumoto andTappin, 2003]. Many studies have inferred thatcoseismic slip along splay faults that branch fromthe plate boundary megathrust may provide amechanism bywhich earthquakes generate tsunamis[Fukao, 1979; Plafker, 1972; Baba et al., 2006;Tanioka and Satake, 2001]. Therefore, understand-ing the 3‐D geometry, quantifying the physicalproperties and stress conditions, and documentingthe history of splay faults are all essential towardassessing their role in the plate boundary andcoseismic slip.
[3] The character of the ocean floor and the geo-logic structure of splay faults at shallow depthsprovide important information about their geometry,mechanics, and tsunamigenic processes. Detailedgeomorphological and geological investigations are,however, difficult because of the deep submarineoccurrence of the faults. In addition, characteristicsof subseafloor faults are expected to differ fromwell‐studied active faults on land because the seabedis primarily within depositional regimes whileon‐land active fault exposures are commonly situ-ated in erosive regimes. On‐land fault exposuresare easily eroded by water, whereas submarine faultscarps are situated under slow ocean bottom cur-rents and rather stable conditions, even whereexposed on the seabed. Such seabed exposures
yield an advantage for investigation of recent tec-tonic activities. Active sediment deposition on theseafloor is especially significant because dating offault activities is possible from the sedimentaryrecord. Thus fine‐scale observation of both theseabed and the internal geologic structure canprovide a key to understanding the recent activityof subseafloor splay faults.
[4] At the Nankai Trough, where the Philippine Seaplate is subducting below southwest Japan at a rateof 4–6.5 cm/yr at an azimuth of ∼300°–315° [Senoet al., 1993; Miyazaki and Heki, 2001; Zang et al.,2002], destructive earthquakes and tsunamis repeat-edly occur [Ando, 1975]. Reflection seismic imageshave identified a splay fault as a first‐order margin‐dominating structure that extends more than 120 kmalong strike [Park et al., 2002b;Moore et al., 2007,2009; Kimura et al., 2007; Bangs et al., 2009].Mechanical arguments [Wang and Hu, 2006; Kameet al., 2003], seismic and tsunami waveform inver-sions [Kikuchi et al., 2003; Baba et al., 2006;Tanioka and Satake, 2001], and seismic reflectiondata strongly suggest that this fault, termed the“megasplay” by Tobin and Kinoshita [2006], is oneof the primary coseismic faults that may have con-tributed to generating devastating historic earth-quakes and tsunamis. In the Kumano Basin area, themegasplay fault branches from the plate boundarythrust ∼50 km landward of the trench (Figures 1band 2).
[5] Stage 1 of the Integrated Ocean Drilling Pro-gram’s (IODP) Nankai Trough Seismogenic ZoneExperiment (NantroSEIZE) was conducted fromSeptember 2007 to February 2008 and successfullyacquired geological and physical properties data,including age dating of cores from the shallow
GeochemistryGeophysicsGeosystems G3G3 KUMURA ET AL.: SPACE‐TIME EVOLUTION OF THE SPLAY FAULT 10.1029/2010GC003335
2 of 23

portion of the megasplay fault [Kimura et al., 2008;Kinoshita et al., 2009]. Substantial long‐term slipof the splay fault is documented by sequenceboundaries and progressive landward tilting ofstrata in the fore‐arc basin and by drilling into the
shallow portion of the splay fault [Kinoshita et al.,2009; Strasser et al., 2009]. Prior to drilling (April‐May 2006), a joint Japanese‐U.S. group contracteda commercial 3‐D seismic survey to enhance ourunderstanding of the structural and stratigraphic
Figure 1. (a) Regional bathymetry of northern Shikoku Basin and Nankai Trough region showing previous DSDP/ODP and current IODP drilling transects. FAB, forearc basin. Inset is tectonic map showing plate tectonic setting ofthe region. IBT, Izu‐Bonin Trench; KPR, Kyushu‐Palau Ridge; FSC, fossil spreading center; PSP, Philippine Seaplate. (b) Multibeam bathymetry of the Kumano Basin region. Solid line indicates 3‐D seismic survey; circles indicateNanTroSEIZE Stage 1 drill sites. Details of bathymetry data acquisition and processing are summarized by Ike et al.[2008]. Figures are modified from Moore et al. [2009].
Figure 2. Interpretation of composite seismic line [Moore et al., 2009] extracted from 3‐D seismic volume. The linecrosses through (or near) all NantroSEIZE Stage 1 drill sites (location shown in Figure 1b).Only a few representativefaults are shown. Dashed lines indicate less certain fault locations. Morphotectonic zones are shown between the twosections. KBEFZ, Kumano Basin edge fault zone; PTZ, protothrust zone; BSR, bottom‐simulating reflector; VE,vertical exaggeration.
GeochemistryGeophysicsGeosystems G3G3 KUMURA ET AL.: SPACE‐TIME EVOLUTION OF THE SPLAY FAULT 10.1029/2010GC003335
3 of 23

setting of the proposed drill sites (see Moore et al.[2009] for details). Petroleum Geoservices (PGS)acquired a 12 × 56 km 3‐D data volume using twoarrays of 28 Sodera G‐guns, each totaling 3090 in3
(51 L) fired alternately at 37.5 m intervals, withseismic signals received by four 4500 m longhydrophone cables, each with 360 receiver groupsat 12.5 m spacing. Data processing included 3‐Dprestack depth migration (PSDM) that providessharp images of the shallow part of the accretionaryprism, allowing us to map details of the splay faultstructure and associated sediment deformationthroughout the region.
[6] In this paper, we present the 3‐D history andrecent activities of the splay fault based on thecombination of detailed analysis of 3‐D seismicdata from the shallow parts of the splay fault,seabed topography, and geological and structuraldata from core and boreholes. We further discussfactors that control the fault activity at shallowdepths that are intimately linked with coseismictsunami generation along this margin.
2. Regional Setting of the KumanoTransect in the Nankai Trough
[7] The Nankai Trough, as the type example of asubduction zone accreting a thick terrigenous sed-iment section, has been a site of intense study,including Deep Sea Drilling Project (DSDP) andOcean Drilling Program (ODP) drilling [Kariget al., 1975; Taira et al., 1991; Moore et al., 2001],numerous two‐dimensional (2‐D) and three‐dimensional (3‐D) seismic reflection surveys andocean bottom seismometer wide‐angle seismicsurveys [e.g., Aoki et al., 1982; Moore et al., 1990;Park et al., 2002a, 2002b; Kodaira et al., 2006;Nakanishi et al., 2008], and heat flow and sub-mersible surveys [e.g., Ashi et al., 2002]. TheNanTroSEIZE project is an ongoing multidisci-plinary scientific investigation of seismogenicprocesses in the Nankai Trough, focused on theKumano Transect south of the Kii Peninsula,Honshu, Japan (Figure 1). The Kumano transect iswithin the region that ruptured during the 1944 and1946 earthquakes [Baba and Cummins, 2005], andthis portion of the seismogenic zone is the target ofIODP drilling [Tobin and Kinoshita, 2006].
[8] Figures 1b and 2 illustrate the main regionalmorphotectonic zones in the Kumano Transect onthe basis of a high‐resolution multibeam bathy-metric data set, 2‐D seismic reflection studies, andthe 3‐D volume that includes NantroSEIZE Stage 1
drill sites [Moore et al., 2009]. Outboard of thetrench on this transect, (Figure 2), a ∼1.3 km thickwedge of trench sediments overlies ∼1.1 km ofShikoku Basin deposits, which consist of regionalhemipelagic sediments, and the Philippine Seaplate igneous basement. All of the trench depositsand at least half of the Shikoku Basin deposits areaccreted to form a wide accretionary prism in thisregion, with a frontal thrust zone at the toe of theprism and a landward imbricate thrust zone (ITZ)(Figures 1b and 2) [Park et al., 2002b; Mooreet al., 2009]. Beneath the trench upper slope andKumano Basin, the megasplay fault cuts across theolder part of the accretionary prism. The megasplayfault can be traced from deep below the accre-tionary wedge at ∼10 km, where it lies ∼1 kmabove the top of the subducting crust (Figure 2). Itcuts discontinuously up through the accretionarywedge along several branches [Moore et al., 2007,2009]. Deep segments of the splay fault are con-tinuous along strike across the entire 12 km 3‐Dsurvey width, with shallower segments continuingtypically 3–5 km along strike. Many segmentsalong the splay fault system have reversed polarityreflections relative to the seafloor and high ampli-tudes relative to adjacent stratigraphic horizons[Streiff et al., 2009].
[9] The Kumano fore‐arc basin is bounded on thesoutheast by a topographic valley situated atopthe break between the basin and the upper part of thetrench slope (Figure 2). Beneath this valley is theKumano Basin edge fault zone (KBEFZ) that mayhave a combination of normal and strike‐slip faults[Martin et al., 2010].
3. Topography and Stratigraphy Aroundthe Shallow Tip of the Megasplay Fault
[10] In this section, we describe the high‐resolutiontopography and stratigraphy obtained by IODPExpedition 316 drilling around the megasplay faulttip in the 3‐D box.
3.1. Seabed Topography
[11] High‐resolution seabed topography derivedfrom the 3‐D seismic data shows variations per-pendicular to, and along strike of, the regionalslope. Seaward of the KBEFZ, which is charac-terized by NE trending to ENE trending ridgesshallower than 2000 m, stepwise slopes are clearlydeveloped (Figure 3). At ∼2100–2200 m, a gentleslope constituting an upper slope basin is almostparallel to the KBEFZ (Figure 3). The midslope,
GeochemistryGeophysicsGeosystems G3G3 KUMURA ET AL.: SPACE‐TIME EVOLUTION OF THE SPLAY FAULT 10.1029/2010GC003335
4 of 23
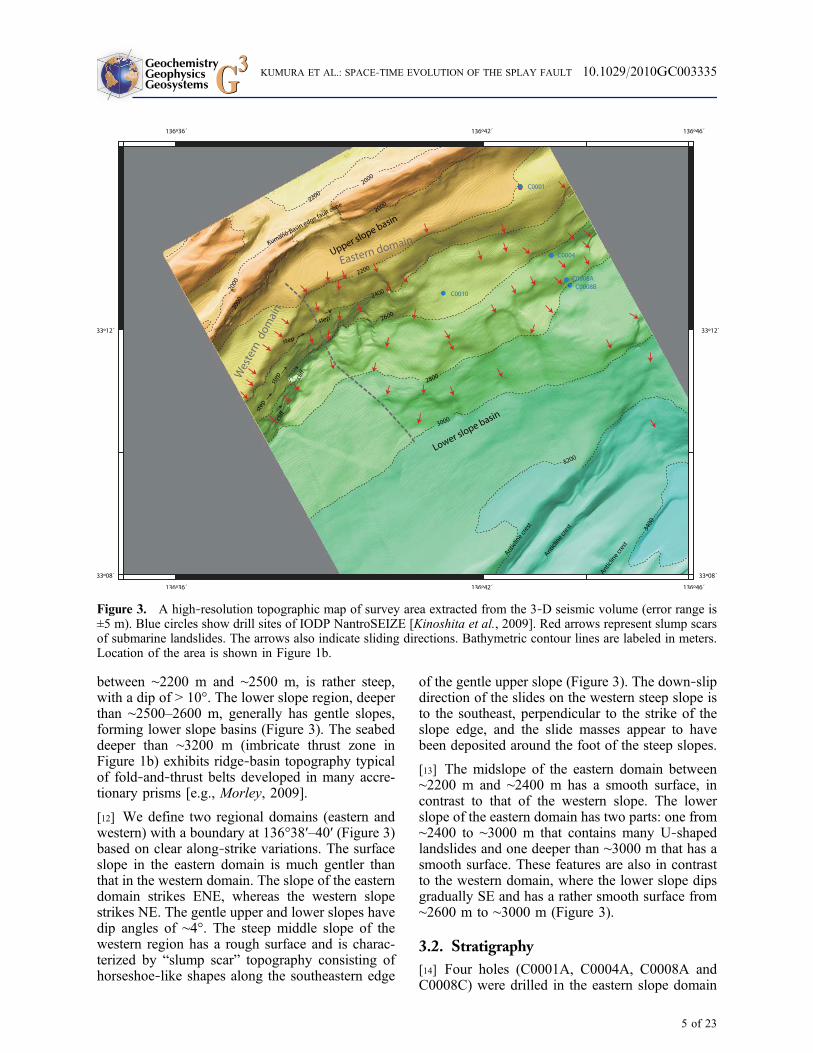
between ∼2200 m and ∼2500 m, is rather steep,with a dip of > 10°. The lower slope region, deeperthan ∼2500–2600 m, generally has gentle slopes,forming lower slope basins (Figure 3). The seabeddeeper than ∼3200 m (imbricate thrust zone inFigure 1b) exhibits ridge‐basin topography typicalof fold‐and‐thrust belts developed in many accre-tionary prisms [e.g., Morley, 2009].
[12] We define two regional domains (eastern andwestern) with a boundary at 136°38′–40′ (Figure 3)based on clear along‐strike variations. The surfaceslope in the eastern domain is much gentler thanthat in the western domain. The slope of the easterndomain strikes ENE, whereas the western slopestrikes NE. The gentle upper and lower slopes havedip angles of ∼4°. The steep middle slope of thewestern region has a rough surface and is charac-terized by “slump scar” topography consisting ofhorseshoe‐like shapes along the southeastern edge
of the gentle upper slope (Figure 3). The down‐slipdirection of the slides on the western steep slope isto the southeast, perpendicular to the strike of theslope edge, and the slide masses appear to havebeen deposited around the foot of the steep slopes.
[13] The midslope of the eastern domain between∼2200 m and ∼2400 m has a smooth surface, incontrast to that of the western slope. The lowerslope of the eastern domain has two parts: one from∼2400 to ∼3000 m that contains many U‐shapedlandslides and one deeper than ∼3000 m that has asmooth surface. These features are also in contrastto the western domain, where the lower slope dipsgradually SE and has a rather smooth surface from∼2600 m to ∼3000 m (Figure 3).
3.2. Stratigraphy
[14] Four holes (C0001A, C0004A, C0008A andC0008C) were drilled in the eastern slope domain
Figure 3. A high‐resolution topographic map of survey area extracted from the 3‐D seismic volume (error range is±5 m). Blue circles show drill sites of IODP NantroSEIZE [Kinoshita et al., 2009]. Red arrows represent slump scarsof submarine landslides. The arrows also indicate sliding directions. Bathymetric contour lines are labeled in meters.Location of the area is shown in Figure 1b.
GeochemistryGeophysicsGeosystems G3G3 KUMURA ET AL.: SPACE‐TIME EVOLUTION OF THE SPLAY FAULT 10.1029/2010GC003335
5 of 23
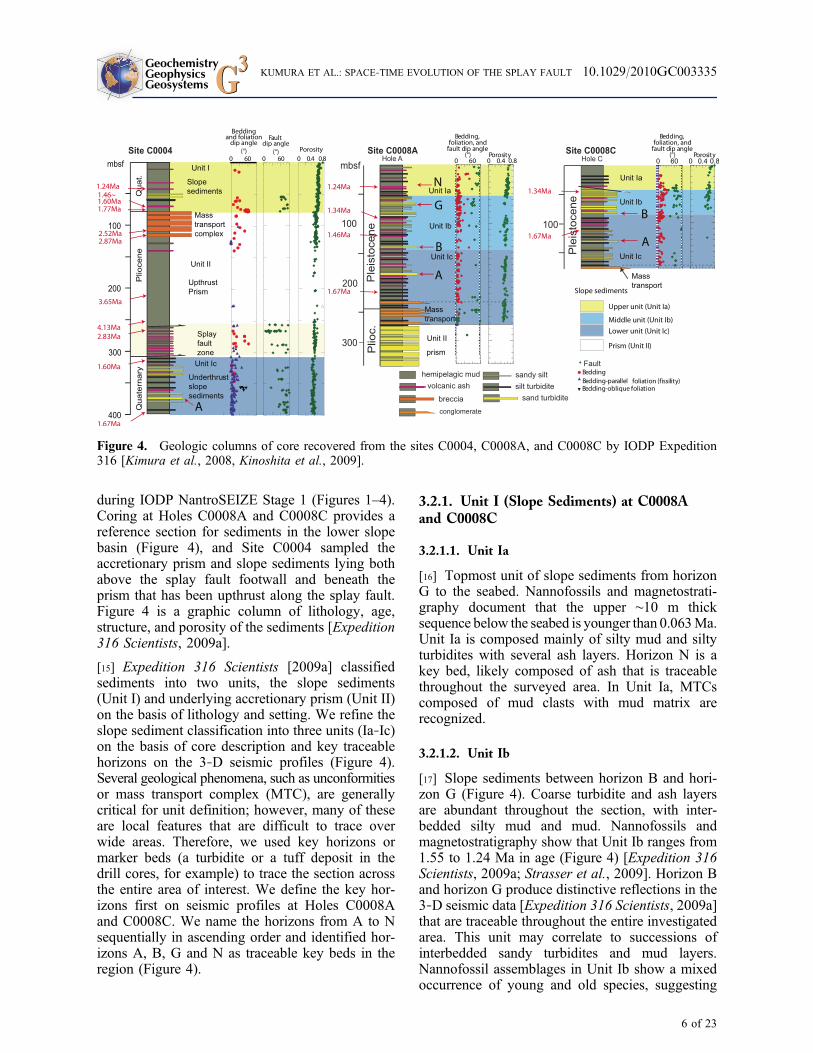
during IODP NantroSEIZE Stage 1 (Figures 1–4).Coring at Holes C0008A and C0008C provides areference section for sediments in the lower slopebasin (Figure 4), and Site C0004 sampled theaccretionary prism and slope sediments lying bothabove the splay fault footwall and beneath theprism that has been upthrust along the splay fault.Figure 4 is a graphic column of lithology, age,structure, and porosity of the sediments [Expedition316 Scientists, 2009a].
[15] Expedition 316 Scientists [2009a] classifiedsediments into two units, the slope sediments(Unit I) and underlying accretionary prism (Unit II)on the basis of lithology and setting. We refine theslope sediment classification into three units (Ia‐Ic)on the basis of core description and key traceablehorizons on the 3‐D seismic profiles (Figure 4).Several geological phenomena, such as unconformitiesor mass transport complex (MTC), are generallycritical for unit definition; however, many of theseare local features that are difficult to trace overwide areas. Therefore, we used key horizons ormarker beds (a turbidite or a tuff deposit in thedrill cores, for example) to trace the section acrossthe entire area of interest. We define the key hor-izons first on seismic profiles at Holes C0008Aand C0008C. We name the horizons from A to Nsequentially in ascending order and identified hor-izons A, B, G and N as traceable key beds in theregion (Figure 4).
3.2.1. Unit I (Slope Sediments) at C0008Aand C0008C
3.2.1.1. Unit Ia
[16] Topmost unit of slope sediments from horizonG to the seabed. Nannofossils and magnetostrati-graphy document that the upper ∼10 m thicksequence below the seabed is younger than 0.063Ma.Unit Ia is composed mainly of silty mud and siltyturbidites with several ash layers. Horizon N is akey bed, likely composed of ash that is traceablethroughout the surveyed area. In Unit Ia, MTCscomposed of mud clasts with mud matrix arerecognized.
3.2.1.2. Unit Ib
[17] Slope sediments between horizon B and hori-zon G (Figure 4). Coarse turbidite and ash layersare abundant throughout the section, with inter-bedded silty mud and mud. Nannofossils andmagnetostratigraphy show that Unit Ib ranges from1.55 to 1.24 Ma in age (Figure 4) [Expedition 316Scientists, 2009a; Strasser et al., 2009]. Horizon Band horizon G produce distinctive reflections in the3‐D seismic data [Expedition 316 Scientists, 2009a]that are traceable throughout the entire investigatedarea. This unit may correlate to successions ofinterbedded sandy turbidites and mud layers.Nannofossil assemblages in Unit Ib show a mixedoccurrence of young and old species, suggesting
Figure 4. Geologic columns of core recovered from the sites C0004, C0008A, and C0008C by IODP Expedition316 [Kimura et al., 2008, Kinoshita et al., 2009].
GeochemistryGeophysicsGeosystems G3G3 KUMURA ET AL.: SPACE‐TIME EVOLUTION OF THE SPLAY FAULT 10.1029/2010GC003335
6 of 23

reworking and possibly indicating upslope col-lapse as the sediment source [Strasser et al.,2009].
3.2.1.3. Unit Ic
[18] Slope sediments beneath horizon B and abovethe unconformity on the prism, consisting of tur-biditic sand (Figure 4). Cores at Sites C0008A andC0008C generally consist of greenish‐gray siltyclay with beds of sand, sandy silt, silt, and volcanicash layers (Figure 4). At 234.55–272.46 m belowseafloor (mbsf) in Hole C0008A and 170.9–176.20 mbsf in Hole C0008C, Expedition 316Scientists [2009a] interpreted a latest Pliocene‐lower Pleistocene sequence as a mass transportcomplex (MTC) that accumulated in the lowerslope basin, possibly during an early stage of basinformation [Strasser et al., 2009]. The unconformitybetween the underlying prism and the MTC occursbetween 1.95 and 2.4 Ma based on nannofossilchronology and magnetostratigraphy [Kinoshitaet al., 2009; Strasser et al., 2009]. The top of themass transport complex ranges in age from 1.65 to1.8 Ma (Figure 4). Horizon A is a key bed in themiddle part of Unit Ic (Figure 4) and correlates to acoarse ∼3.5 m thick sand.
[19] Dips of bedding planes of Units Ia–Ic in HolesC0008A and C0008C are dominantly to the southand are gentle in general but in places dip a few tensof degrees. Sediments at Hole C0008C are deformedprimarily by normal faulting (Figure 4). A highconcentration of normal faults is found between35 and 80 mbsf near a discontinuity in beddingdip identified on seismic reflection profiles.
3.2.2. Unit I (Slope Sediments) at C0004
[20] Slope sediments at Site C0004 are separatedinto two units, one above the upthrust prism andanother below the splay fault (Figure 4). Coversediments above the prism are composed of graysilt, silty and sandy turbidites, and several ashlayers. Their ages range from ∼1.46–1.77 Ma topresent (Figure 4). The total thickness of the slopesediments is 78.06 m at Site C0004, thinner thanthe comparable sequence at Hole C0008A. The ageof the sediments overlaps with those at HolesC0008A and C0008C (Figure 5), but key horizons B,G and N are not recognized either in core or inseismic profiles. Therefore, unit subdivision andcorrelation with the subunits identified at Site C0008is difficult. At the top of the prism section are 2.06–2.52 Ma mass transport deposits.
[21] Sediments underlying the splay fault consist oflower Pleistocene dark olive‐gray silty clay withcommon thin sand and silt beds. These sedimentscan be correlated to the upper half of slope sedimentsin Unit Ic recovered at Site C0008A (Figures 3and 4). The age of the sediments ranges from 1.67to 1.60 Ma. The underthrust slope basin sedimentsexhibit horizontal to gently dipping bedding. Keyhorizon A composed of sand dominated layers iseasily traced on the seismic profile to Hole C0008A.
3.2.3. Unit II: Accretionary Prism
[22] At Site C0004, the accretionary prism thrustover the Unit Ic slope sediment is composeddominantly of Pliocene hemipelagic mud withintercalated ash layers, several of which areprominent in the lower part of the splay fault zone(Figure 4) [Expedition 316 Scientists, 2009b]. Corerecovery of the accretionary prism at Site C0004was very poor but the result of logging whiledrilling during Expedition 314 [Expedition 314Scientists, 2009] suggests a mudstone‐dominatedlithology. Lithology and age constraints suggestthat these sediments are lower Shikoku Basindeposits recognized widely in the Shikoku Basinof the Philippine Sea plate [Ike et al., 2008].
[23] Seismic reflection profile IL2675 (Figures 5and 6) indicates that the projected depth of thesplay fault at Site C0004 is around 290 mbsf.Structural observations of cores document an∼60 m thick fractured and brecciated zone between256 and 315 mbsf. The occurrence of breccia withpolished and slickensided surfaces below 256 mbsfmarks the upper boundary of the fault zone. Adocumented (nannofossil and paleomagnetic) agereversal from 4.13 Ma to 2.83 Ma is observed at theupper boundary of the fault zone. The lowerboundary of this zone was defined at 315 mbsf, andan age reversal from 2.83 Ma to 1.60 Ma isobserved across the lower boundary.
[24] The accretionary prism at Site C0008 islocated unconformably beneath the slope sediment.Core recovery from the site was very poor butreflection character suggests sandstone‐dominatedlithology. Their age is unknown but Pliocene issuggested [Expedition 316 Scientists, 2009b].
4. Activity and Structure of ShallowPortion of the Splay Fault
[25] The history of splay fault activity and relatedgeologic structures can be inferred from the seismic
GeochemistryGeophysicsGeosystems G3G3 KUMURA ET AL.: SPACE‐TIME EVOLUTION OF THE SPLAY FAULT 10.1029/2010GC003335
7 of 23

data by recognizing the direct link between faultactivity and sedimentation and bymapping deformedrocks in the hanging wall and footwall. We presentselected type profiles (locations shown on Figure 5)that exhibit clear examples and relations betweenidentified units, key horizons, and structures. Abovewe subdivided the region into eastern and westerndomains. The history of splay fault activity appearsdifferent in each domain. The ENE striking portion inthe eastern domain appears currently active, whileactivity in the NE trending part in the western domainappears to have ceased. In sections 4.1.1 to 4.1.4,we describe the activity from the selected seismicprofiles.
4.1. Splay Fault Activity in the EasternDomain of Slope
[26] In the eastern domain, five NW trending inlineprofiles depict the splay fault activity and defor-
mation surrounding the fault. First, we discuss theprofile through the drilling sites and then expandthe discussion to the east and west in the easterndomain.
4.1.1. Inline 2675
[27] Inline 2675 (Figure 6) is located along aprofile connecting drilling Sites C0004 and C0008(Figure 4). Units Ib and Ic occur as a wedge‐shapedpackage of syntectonic slope basin deposits over-lying the accretionary prism.
4.1.1.1. Direct Interaction Between the Faulting
and Sedimentation
[28] Thrusts (red lines) cut Units Ib and Ic, and arein turn overlain by the upper part of Units Ib and Ia(Figure 6). Sediments covering the upthrust prismare labeled as Unit Ia on this profile, however,
Figure 5. A geological map of the surveyed area. The area is classified into two parts, an erosive area shown byexposures of older bedded sediments and depositional area covered by modern slope sediments. Exposures are sub-divided into two, slope sediment exposures and prism outcrops. Most of the exposures are located along steep slopes.Geologic structures on the map of the lower slope basin are reconstructed from 3‐D profiles shown in Figures 6 to 11.
GeochemistryGeophysicsGeosystems G3G3 KUMURA ET AL.: SPACE‐TIME EVOLUTION OF THE SPLAY FAULT 10.1029/2010GC003335
8 of 23
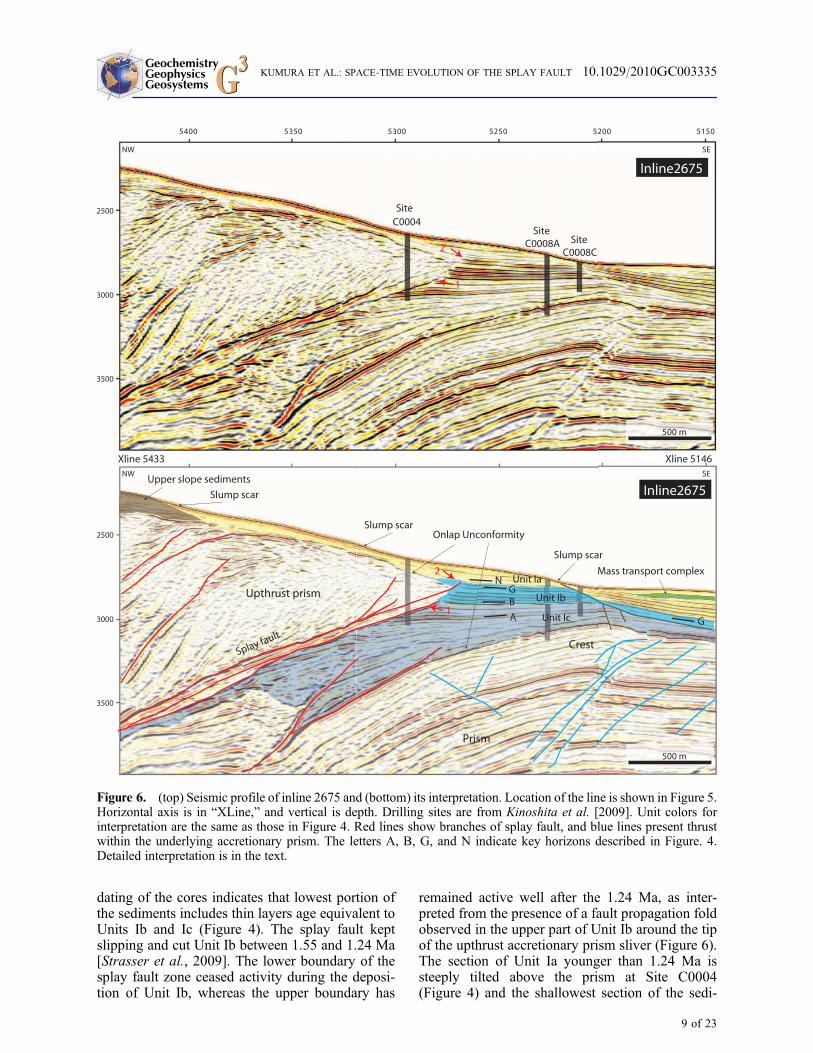
dating of the cores indicates that lowest portion ofthe sediments includes thin layers age equivalent toUnits Ib and Ic (Figure 4). The splay fault keptslipping and cut Unit Ib between 1.55 and 1.24 Ma[Strasser et al., 2009]. The lower boundary of thesplay fault zone ceased activity during the deposi-tion of Unit Ib, whereas the upper boundary has
remained active well after the 1.24 Ma, as inter-preted from the presence of a fault propagation foldobserved in the upper part of Unit Ib around the tipof the upthrust accretionary prism sliver (Figure 6).The section of Unit Ia younger than 1.24 Ma issteeply tilted above the prism at Site C0004(Figure 4) and the shallowest section of the sedi-
Figure 6. (top) Seismic profile of inline 2675 and (bottom) its interpretation. Location of the line is shown in Figure 5.Horizontal axis is in “XLine,” and vertical is depth. Drilling sites are from Kinoshita et al. [2009]. Unit colors forinterpretation are the same as those in Figure 4. Red lines show branches of splay fault, and blue lines present thrustwithin the underlying accretionary prism. The letters A, B, G, and N indicate key horizons described in Figure. 4.Detailed interpretation is in the text.
GeochemistryGeophysicsGeosystems G3G3 KUMURA ET AL.: SPACE‐TIME EVOLUTION OF THE SPLAY FAULT 10.1029/2010GC003335
9 of 23

ments are dated as being a few thousand to∼70 years old (A. Sakaguchi et al., personal com-munication). The youngest sediments are com-posed of mud clast breccias in mud‐silt matrixdominated chaotic deposits caused by shaking andslumping. Such deposits are consistent with theoccurrence of several slump scars in this area(Figures 2 and 6).
4.1.1.2. Deformation of Footwall
[29] One of the characteristic geologic features onthis profile is a low‐angle detachment (possiblyassociated with slumping of shallow, recent slopebasin sediments and onlap unconformity) observedto the southeast of Site C0008 (Figure 6). SiteC0008C penetrates the shallow portion of thisdetachment and documents the presence of normaldisplacement across the feature [Expedition 316Scientists, 2009b] (Figures 4 and 6). The detach-ment is actually a slip zone with a younger onlapunconformity. Unit Ia thickens beyond this dis-continuity (Figure 6), suggesting that slip contin-ued during deposition of Unit Ia.
4.1.2. Inline 2731
[30] Inline 2731 (Figure 7) is located to the east ofinline 2675 (Figure 5). The profile shows synde-positional activity of the splay fault and surround-ing deformation.
4.1.2.1. Direct Interaction Between Faulting
and Sedimentation
[31] Similar to inline 2765, the wedge‐shapedpackages of Units Ib and Ic indicate that theirsedimentation took place concurrently with splayfault displacement and formation of the fault tipanticline. The fault propagation fold developed insedimentary Unit Ia is clearer on this profile(Figures 7c and 7d) than that on inline 2765. Thetip of the splay fault dies out in the upper part ofUnit Ib around horizon G and grades into anasymmetric fault propagation anticline that bendsUnit Ia upward (Figures 7c and 7d).
4.1.2.2. Deformation of Hanging Wall and Footwall
[32] The following features are especially signifi-cant to understanding splay fault activity along thisprofile. Landslide development affects the sedi-mentation of Unit Ia and seabed topography. Upperslope sediments deposited on the upthrust prismrocks range in age from ∼2 Ma to present (315 Sci-
ence Party in the study by Kinoshita et al. [2009]).They are truncated by a slump scar at the southernedge of the upper slope (Figures 7a and 7b). Thesediments displaced by slumping cover upthrustaccretionary prism rocks constituting the hangingwall of the splay fault. Two steps characterizingslump scars are recognized on the slope (Figures 7a–7d). Truncation of shallow‐level stratification isrecognized on the seismic profile, indicating recentslumping activity.
[33] Accretionary prism rocks beneath the splayfault and the slope sediments are deformed into ananticline. Both Units Ib and Ic are thinnest over thecrest of anticline and increase in thickness towardthe limbs (Figures 7a and 7b). Unit Ia is thicker onthe downslope limb of this anticline (Figures 7eand 7f) and onlap is observed around its crest(Figures 7e and 7f). Slump scars are recognizedjust above the crest of this anticline (Figures 7a, 7b,7e, and 7f). A low‐angle detachment and high‐angle normal faults are developed around the crestof the anticline (Figures 7e and 7f). These arerestricted in vertical extent, and are found onlywithin the slope sediments and prism rocks directlyin and above the crest of this anticline (Figures 7eand 7f). All these features strongly suggest con-temporaneous and ongoing anticline formation,faulting, uplift and sedimentation.
4.1.3. Inlines 2635, 2625, and 2475
[34] Inlines 2635 (Figures 8a and 8b), 2525(Figures 8c and 8d) and 2475 (Figures 8e and 8f)are located to the west of inline 2675 in this order(Figure 5). These profiles mainly show anticline‐related deformation outboard of the splay fault. Aseabed slump scar, a low‐angle detachment with anunconformity, a high‐angle normal fault, and minorreverse faults occur around the crest of the anticline.
[35] The seabed slump scar is connected with theunderlying low‐angle detachment, as well as with achange in thickness of slope sediments. On inline2525, the seabed slump scar is much gentler thanon other inlines, and the change in thickness ofUnit Ia beyond the scar appears to be mainly in thelower half of the unit below key horizon N. Thelow‐angle detachment cuts most of Units Ib and Icand reaches the unconformity boundary betweenthe slope sediments and underlying prism (Figures 8cand 8d). An unconformity is recognized withinUnit Ic (Figures 8e and 8f), suggesting an earlierstage of anticline development before ∼1.60 Ma(equivalent to horizon A). Another unconformity isalso recognized in Unit Ia above key horizon N
GeochemistryGeophysicsGeosystems G3G3 KUMURA ET AL.: SPACE‐TIME EVOLUTION OF THE SPLAY FAULT 10.1029/2010GC003335
10 of 23

(Figures 8a, 8b, 8e, and 8f), which indicates an ageyounger than 1.24 Ma.
[36] High‐angle normal faults trending NNW andNW are well‐developed mainly in the slope sedi-ments of Units Ib and Ic that are located in thefootwall of the detachment. Southward vergentsmall reverse faults are developed within the foldedprism. Their pattern is consistent with the inferredstress field within the crest of an asymmetric anti-cline, however they do not appear to penetrate intothe overlying slope sediments (Figures 8b, 8d, and8f). The development of both normal and reversefaults associated with the anticline suggests that theneutral surface of the stress field, dividing the localextension in the outside of the fold from com-pression in the inside of the fold, is located near thetop of the anticline in accretionary prism rocks. The
extension on the outside of the fold might enhancegravitational collapse of the slope sediments.
[37] On the westernmost profile in the easterndomain of the slope (inline 2475), the splay faultdisplaces Unit Ic and the lower part of Unit Ib, andtransforms to a fault tip anticline in the upper partof Unit Ib (Figures 8e and 8f). Unit Ia (above theanticline) does not appear to be folded in the faulttip anticline, rather it appears to lap onto or drapeover the limbs of the anticline (Figures 8e and 8f).No change in the slope of the seafloor is observedabove the splay fault. A gentle slump scar islocated further up slope, above the upthrust prism(Figures 8e and 8f). These structural features sug-gest that the splay fault in this region either ceasedactivity earlier or has not experienced the samedegree of displacement over the same time span asfurther to the east.
Figure 7. (a, c, e) Seismic profile of inline 2731 and (b, d, f) its interpretation. Location of the line is shown inFigure 5. Red lines show branches of splay fault, and blue lines present thrust within the underlying accretionaryprism. The letters A, B, G, and N indicate key horizons described in Figure 4. Horizontal axis is in “XLine” andvertical is depth. Detailed interpretation is in the text.
GeochemistryGeophysicsGeosystems G3G3 KUMURA ET AL.: SPACE‐TIME EVOLUTION OF THE SPLAY FAULT 10.1029/2010GC003335
11 of 23

4.2. Splay Fault Activity in the WesternDomain of Slope
[38] Four profiles from east to west (inlines 2290,2235, 2195 and 2165), are selected to evaluate theactivity of the splay fault in the western slopedomain (Figure 5). Direct interaction betweenfaulting and sedimentation, and deformation ofhost rocks of the hanging wall and footwall areused as criteria. The history of splay fault activity isdivided into three phases in this domain; the ear-liest active phase is documented by activity duringdeposition of Unit Ic; a second phase shows inac-tivity mainly by onlap sedimentation of Unit Ib,and the third phase shows reactivation of the faultas indicated by the fault cutting Unit Ib and theoverall southward tilting. There is no recent activityafter the third phase. These phases are documentedfrom each profile in the following.
4.2.1. Inline 2290
[39] Inline 2290 is located in the easternmost por-tion of the western domain (Figure 5). Figure 9shows a profile of the splay fault and the struc-ture of the lower slope basin.
4.2.1.1. Direct Interaction Between Faulting
and Sedimentation
[40] Three branches of the splay fault are recognizedon the profile (branch A, B, and C in Figure 9). Theseaward branch (A) cuts most of Unit Ic and foldsthe uppermost part of Unit Ic, but is covered byUnit Ib without any later deformation. This obser-vation suggests that activity on branch A ceasedbefore the deposition of Unit Ib (ca. 1.55 Ma)(Figure 9d). The middle branch B of the splay faultthrusts up the prism and offsets the lower half of
Figure 8. (a, c, e) Seismic profiles of inlines 2475, 2525, and 2635 and (b, d, f) their interpretations showing ananticline of underlying prism and low angle detachment with normal faults mainly in the slope sediments. Locationsof the lines are shown in Figure 5. Red lines show branches of splay fault and blue lines present thrust within theunderlying accretionary prism. The letters A, B, G, and N indicate key horizons described in Figure 4. Horizontal axisis in “XLine” and vertical is depth. Detailed interpretation is in the text.
GeochemistryGeophysicsGeosystems G3G3 KUMURA ET AL.: SPACE‐TIME EVOLUTION OF THE SPLAY FAULT 10.1029/2010GC003335
12 of 23
Unit Ic but is overlain by the upper part of Unit Icwithout any deformation (Figure 9d). The age ofkey horizon A (ca. 1.60 Ma) suggests that theactivity of branch B stopped before that time, andthus prior to cessation of slip on the lower branch(A). The landward fault branch (C) cuts Unit Ic andkey horizon B in the lowest portion of Unit Ib(Figure 9d). No fault bend fold is observed in UnitIb, which onlaps the upthrust prism. This obser-vation suggests that the activity on the upperbranch ceased just after 1.55 Ma.
4.2.1.2. Deformation of Hanging Wall and Footwall
[41] Most anticline crests identified in the accre-tionary prism are simply covered by slope sedi-ments with gentle warping (Figure 9b). One slumpscar within Unit Ia is observed on the seabed butneither faults nor folds are recognized beneath that.The timing of the activity of the branches of thesplay fault and deformation of the slope sedimentssuggests no recent displacement or related defor-mation after ca.1.55 Ma in this area.
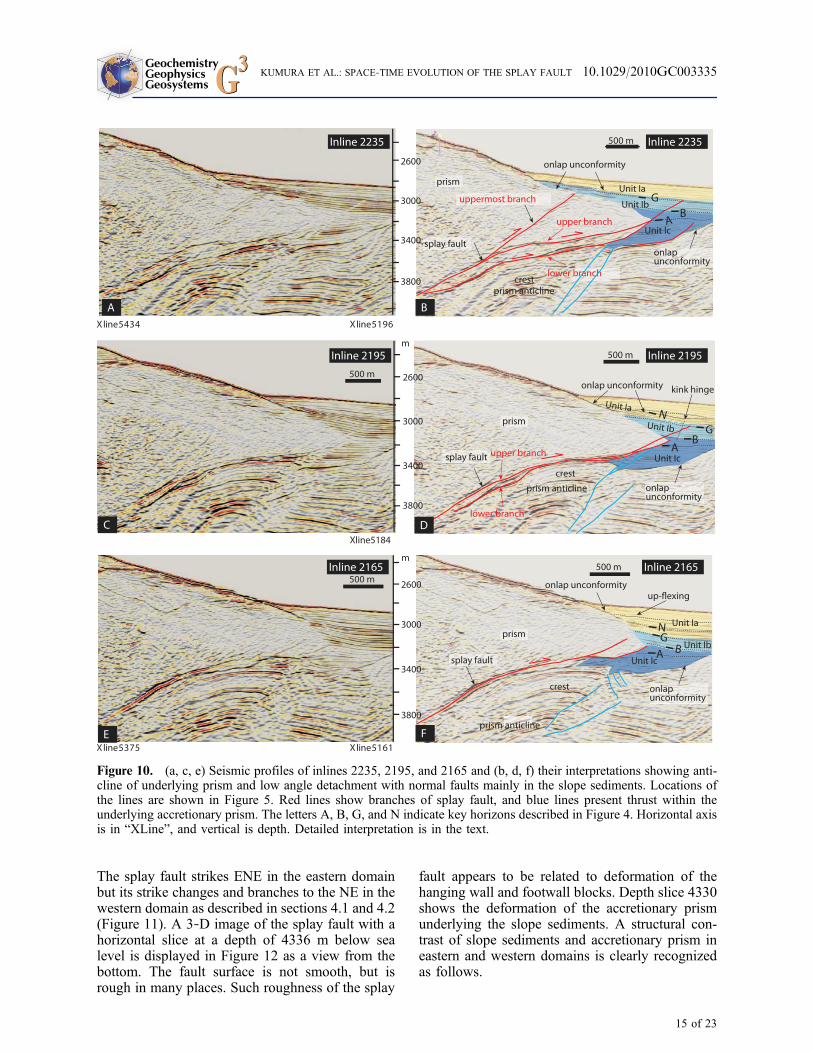
4.2.2. Inline 2235
[42] Inline 2235 is located 687.5 m to the west ofinline 2290 (Figure 5). The profile (Figures 10a and10b) exhibits syndepositional deformation differentfrom that of inline 2290.
[43] The splay fault is composed of upper andlower branches, and a branch‐and‐merge structureis recognized (Figures 10a and 10b). Both theupper and lower branches are bent upward andanother fault branches upward from the downwardend of the bend (Figures 10a and 10b). The lowerbranch appears to offset the top of the prism anti-cline and thrusts these up on to Unit Ic (Figures 10aand 10b). The shallowest portion of the splay faultcuts Units Ic and Ib but is overlain by Unit Ia. Nogrowth structures (such as progressive changes inthickness) beyond the fault or fault bend foldstructure are recognized within Unit Ib. This sug-gests that the splay fault was reactivated after thedeposition of Unit Ib, at ∼1.24 Ma. Dips of Units Iaappear to increase with aging of the stratigraphichorizon (Figures 10a and 10b), and this occurs inconcert with a progressive onlap unconformity overthe upthrust prism rocks. The uppermost branchappears to slightly deform Unit Ib and the lowerportion of Unit Ia (Figures 10a and 10b). Thus, themost recent activity of the splay fault took placealong the uppermost branch. Another featurerelated to splay fault activity is the deformation of
Unit Ic. The wedge shaped package of Unit Icoverlying the footwall prism is folded by a thrustalong the base of the sediments (Figures 10a and10b). The fold is confined within Unit Ic and isoverlain by Unit Ib. This indicates that activity onthis fault ceased before 1.55 Ma.
[44] These deformation features suggest threephases of activity of the splay fault in this region;an early phase before 1.55 Ma, a second ratherquiet phase during the deposition of Unit Ib, and athird phase cutting Unit Ib just after 1.24 Ma. Thelast phase of activity of uppermost branch of thesplay fault was accompanied by trenchward tiltingof the entire hanging wall prism.
4.2.3. Inline 2195
[45] Inline 2195 is located 500 m to the west ofinline 2235 (Figure 5). The splay fault on thisprofile is composed of upper and lower branchessimilar to that identified on inline 2235, howeverthe fault zone is not as thick as in inline 2235(Figures 10c and 10d). The splay fault is bentupward as well. The bent fault is parallel withstratification of the underlying prism. The upperbranch of the splay fault offsets and folds Unit Ib.Kink‐like bending is not limited to Unit Ib but alsoappears to control the geometry of the lower part ofUnit Ia just below key horizon N on this profile(Figures 10c and 10d). Sediments above key hori-zon N exhibit an onlap unconformity. The thick-ness of the sedimentary package beyond the kinkand thrust does not change and stratal dip anglesare constant, suggesting that thrusting and kinkingoccurred just after deposition. The history of thesplay fault on this profile is reconstructed as fol-lows: earliest thrusting coincident with depositionof Unit Ic, quiescence during the deposition of UnitIb, reactivation of thrusting just after the depositionof Unit Ib and the lower part of Unit Ia. Bending ofthe splay fault appears to have taken place togetherwith the growth of the anticline observed in theunderlying accretionary prism.
4.2.4. Inline 2165
[46] Inline 2165 is located 375 m to the west ofinline 2195 (Figure 4). This profile resembles inline2195 in general, but is slightly different in detail.The splay fault zone is thinner than that on inline2195 and branches only near the tip of the fault.The displacement along the splay fault is limited tothe period of Unit Ic deposition (Figures 10e and10f). Unit Ib and the lower part of Unit Ia below
GeochemistryGeophysicsGeosystems G3G3 KUMURA ET AL.: SPACE‐TIME EVOLUTION OF THE SPLAY FAULT 10.1029/2010GC003335
13 of 23

key horizon N exhibit trenchward tilting to a finaldip angle steeper than that on inline 2195. Units Iband Ia onlap the upthrust prism. A slight bending isrecognized in the lower portion of Unit Ia abovethe prism. Inferred tectonic activity on this profileis almost the same as that on inline 2195 exceptthat 2165 does not include reactivation after thedeposition of Unit Ib.
4.3. Structural Variation and SurfaceGeology
[47] Figure 11 presents a horizontal depth slice at2910 m below sea level (see Figure 4 for location).This slice reveals the geologic structure of thelower slope basin very well on the basis of tracingkey horizons A to N and Unit Ia to Ic (Figure 11).
Figure 9. (a) Seismic profile of inline 2290 and (b) its interpretation. (c, d) A close‐up profile and its interpretationaround the tip of the splay fault, respectively. Location of the line is shown in Figure 5. Red lines show branches ofsplay fault and blue lines present thrust within the underlying accretionary prism. The letters A, B, G, and N indicatekey horizons described in Figure 4. Horizontal axis is in “XLine,” and vertical is depth. Detailed interpretation is inthe text.
GeochemistryGeophysicsGeosystems G3G3 KUMURA ET AL.: SPACE‐TIME EVOLUTION OF THE SPLAY FAULT 10.1029/2010GC003335
14 of 23
The splay fault strikes ENE in the eastern domainbut its strike changes and branches to the NE in thewestern domain as described in sections 4.1 and 4.2(Figure 11). A 3‐D image of the splay fault with ahorizontal slice at a depth of 4336 m below sealevel is displayed in Figure 12 as a view from thebottom. The fault surface is not smooth, but isrough in many places. Such roughness of the splay
fault appears to be related to deformation of thehanging wall and footwall blocks. Depth slice 4330shows the deformation of the accretionary prismunderlying the slope sediments. A structural con-trast of slope sediments and accretionary prism ineastern and western domains is clearly recognizedas follows.
Figure 10. (a, c, e) Seismic profiles of inlines 2235, 2195, and 2165 and (b, d, f) their interpretations showing anti-cline of underlying prism and low angle detachment with normal faults mainly in the slope sediments. Locations ofthe lines are shown in Figure 5. Red lines show branches of splay fault, and blue lines present thrust within theunderlying accretionary prism. The letters A, B, G, and N indicate key horizons described in Figure 4. Horizontal axisis in “XLine”, and vertical is depth. Detailed interpretation is in the text.
GeochemistryGeophysicsGeosystems G3G3 KUMURA ET AL.: SPACE‐TIME EVOLUTION OF THE SPLAY FAULT 10.1029/2010GC003335
15 of 23
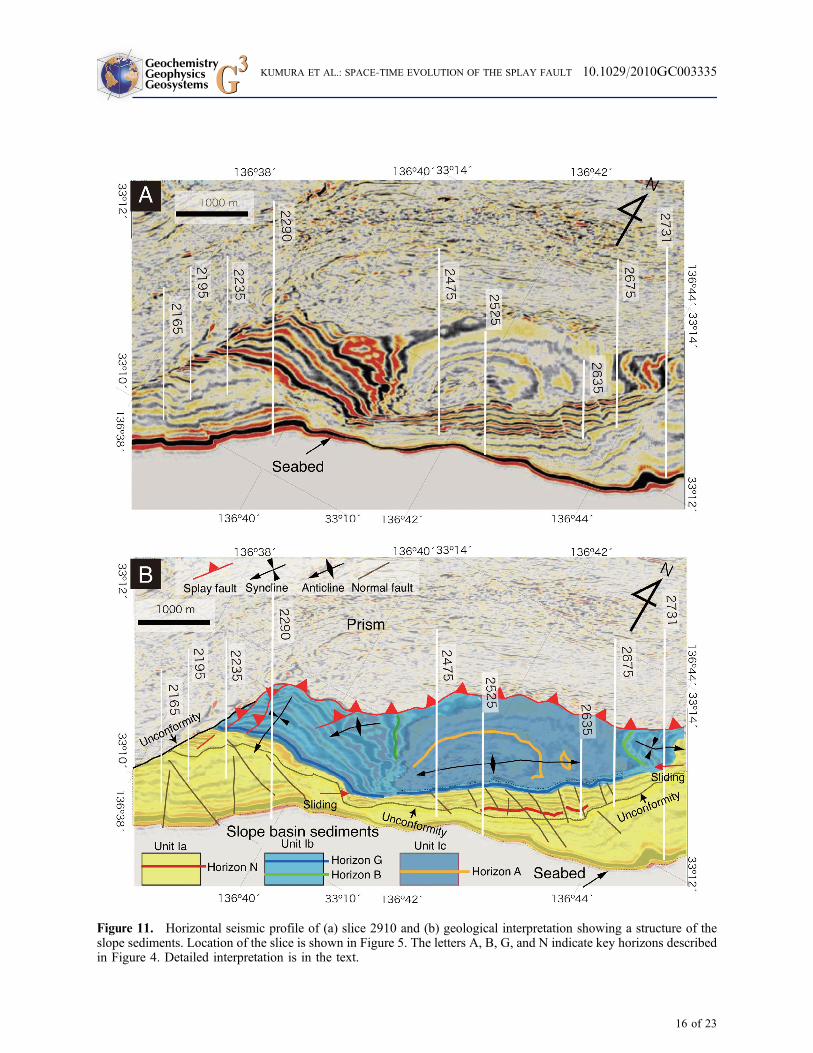
Figure 11. Horizontal seismic profile of (a) slice 2910 and (b) geological interpretation showing a structure of theslope sediments. Location of the slice is shown in Figure 5. The letters A, B, G, and N indicate key horizons describedin Figure 4. Detailed interpretation is in the text.
GeochemistryGeophysicsGeosystems G3G3 KUMURA ET AL.: SPACE‐TIME EVOLUTION OF THE SPLAY FAULT 10.1029/2010GC003335
16 of 23

4.3.1. Structure of the Slope Sedimentsand Surface Geology
[48] Deformation of slope sediments in the easterndomain is characterized by an ENE elongate,dome‐like anticline (Figures 11a and 11b). Thenorthern wing of the anticline has a gentler dip thanthe southern limb and is thrust up by the splayfault. The southern limb of the anticline undergoesa gradual decrease in dip toward the south, awayfrom the axis of the anticline. A syncline with itsaxis parallel to the ENE strike of the splay fault isobserved in the easternmost part of the slope basin(Figure 11). A southward dipping monocline isidentified in the western domain of the slope basin.A gentle N‐S trending syncline and a NE trendinganticline are observed near the splay fault aroundthe border of the eastern and western domains. Theuppermost part of Unit Ia in the slope sedimentsgently dips to the SSE and is cut by NW and NNWtrending high‐angle faults (Figure 11). These areinterpreted to be primarily normal faults with aslight strike‐slip component which are consistentwith present stress field observed from boreholebreakouts, fractures in cores, and anelastic strainrecovery of the cores [Byrne et al., 2009]. The NWand NNW trending faults are primarily confined toUnit Ia. A regional unconformity is recognizedwithin Unit Ia above key horizon N (Figure 11b).The age of this unconformity appears to be youngerthan 1 Ma based on magnetostratigraphy [Strasseret al., 2009]. These structures of the slope sedi-ments are clearly reflected in the surface topogra-phy and geology (Figure 4). Landslide heads in theeastern domain trend ENE along the crest of thedome‐like anticline (Figure 4) indicate their recent
activity. The topographic variation between theeastern and western domains is the result of thedeformation of the slope sediments.
4.3.2. Deformation of the Accretionary Prism
[49] Inline profiles described previously (section 4.1)show syndepositional growth of an anticlinebeneath the slope basin sediments. The horizontalslice at 4330 m depth, together with the profiles,demonstrates the 3‐D features of the anticlinetogether with fine deformational aspects of theaccretionary prism (Figure 12). Axes of threedome‐like anticlines are parallel to the strike ofthe splay fault. Domes are separately formed inboth eastern and western domains (Figure 12).These folds appear to control the deformation andsedimentation of the slope basin above the accre-tionary prism. Thus, the splay fault movement,deformation of the hanging wall of the accretionaryprism, and slope basin development are all linkedto each other.
4.4. Summary of Activity of the Splay Faultand Surrounding Deformation
[50] Detailed investigation of the three dimensionalstructure of the shallow portions of the splay faultand associated deformation of sediments definingthe lower slope basin reveal the temporally andspatially dependent variations in fault slip and faultevolution. The ENE striking, eastern portion of thesplay fault has remained active since the inceptionof faulting at ∼1.95 Ma [Strasser et al., 2009].Early activity is interpreted to represent in‐sequencethrusting that evolved to out‐of‐sequence (splay
Figure 12. Horizontal seismic slice at 4336 m with the splay fault surface. Traces of crests of anticlines of accre-tionary prism underlying in the footwall of the splay fault are also shown.
GeochemistryGeophysicsGeosystems G3G3 KUMURA ET AL.: SPACE‐TIME EVOLUTION OF THE SPLAY FAULT 10.1029/2010GC003335
17 of 23

fault) thrusting [Strasser et al., 2009]. Rapid syn-sedimentary uplift of the prism rocks in the hangingwall of the splay fault is recorded from 1.55 and1.24 Ma. After 1.24 Ma, activity of the splay faultis recorded not only by stratal ages and architec-ture, but also in the erosion and redeposition ofslope sediments by successive oversteepening,mass transport, formation of slump scars, andaccumulation of mass transport deposits overlyingthe fault. The active strand of the splay fault zoneidentified in inline 2675 shifted to the upper branchat ∼1.55 Ma [Expedition 316 Scientists, 2009a;Strasser et al., 2009]. This activity is expressedalong the splay fault itself (as inferred from offsetsedimentary units), and by broader and distributeddeformation, especially deformation of the lowerslope basin. An ENE striking, elongated anticline isdeveloped in the accretionary prism together withfolding of slope sediments in the footwall of thesplay fault. A low‐angle detachment located nearthe crest of the anticline forms the slip surfacealong which slumping occurs, as shown by thelocation of seafloor slump scars, incipient headwallscarps, and the distribution of abundant masstransport deposits in the slope basin. NW trendingand WNW trending normal faults cut the crest ofthe anticline and folded slope basin sediments.These features indicate that the folding is currentlyactive and is related to the splay fault activity.Coseismic slip along the splay fault may inducecollapse along the limbs of this anticline due toseabed shaking and enhanced gravitational insta-bility of a wide area around the splay fault.
[51] The strike of the western portion of the splayfault changes to the NE and exhibits a differentmode of activity. Early stage activity before 1.55Mamay have been similar to that described for theeastern portion. For the period between 1.55 and1.24 Ma, we infer relative quiescence based on theconstant thickness of Unit Ib in the area. Duringthis period, the splay fault itself may have beenbent together with the footwall accretionary prism.The modification of the splay fault dip angle mayhave prevented slip. This change in original faultgeometry may have precipitated the formation of asecondary branch of the splay fault cutting throughthe previously developed fault propagation anti-cline and into younger slope sediments (the shal-lower portions of Unit Ib), as observed in inline2235. Splay fault activity again ceased after for-mation of the secondary branch, as suggested byunconformable onlapping of Unit Ia sediments overthe faulted and folded sediments of Unit Ib, blan-keting of faults and scarps by recent sediments, and
regional low‐intensity tilting without displacement.We suggest that this portion of the splay fault hasbeen inactive over the last 1.24 Ma, and that the NEstriking portion of the splay fault has undergoneregional uplift or tilting, perhaps related to dragduring slip along faults identified further landwardas suggested by Moore et al. [2007].
[52] Comparison of offset and other deformationfeatures along the fault and in the affected slopebasins suggests a gradual decrease in slip rate from1.55 Ma to Recent [Strasser et al., 2009]. Althoughthe average slip rate along the splay fault appears todecrease, this does not require that the deeperportion of the splay fault underwent a similarchange in slip rate, rather, we infer that slip alongthe deeper sections of the splay fault was accom-modated by formation of fault propagation anti-clines and more distributed deformation in theslope basin.
5. Discussion
[53] We discuss three points in sections 5.1 to 5.3:synsedimentary activity of the splay fault, parti-tioning of plate convergence slip, and the space‐timeevolution of the splay fault in a regional tectonicframework with special emphasis on seamountcollision.
5.1. Synsedimentary Activity of the SplayFault
[54] Seismic profiles described in sections 4.1 and 4.2show that, rather than a simple intersection betweenthe fault tip and the seafloor, there is a complexinteraction between fault propagation folding, sea-floor slumping and sliding, faulting and deforma-tion of shallow strata, and widespread deposition ofmass transport deposits and debris slides. Thesefeatures are distinct from those of seismically activethrust faults on land in general, but are very sig-nificant indicators of the style and degree ofactivity of this submarine thrust fault system, par-ticularly with respect to similar systems in othersubduction zones.
[55] Landslides, slumps, andmass transport depositsaround the splay fault are observed and welldocumented, especially along the eastern portion ofthe splay fault as described above. The slope angleadjacent to the slide is ∼4°and the slump scars dip∼6°–8°. This suggests that the slope is at or near thecritical angle and slight tilting and/or shaking couldtrigger sliding or slumping events. In the case of
GeochemistryGeophysicsGeosystems G3G3 KUMURA ET AL.: SPACE‐TIME EVOLUTION OF THE SPLAY FAULT 10.1029/2010GC003335
18 of 23
muddy, soft, highly porous and uncompactedsediments, the same critical angle is well observedand documented in the Gulf of Mexico [e.g.,Sawyer et al., 2009]. The rather gentle angle of theslump scars appears to be related to the strength orangle of internal friction of the muddy sediments.Most of the mechanical data available for thesematerials with as much as ∼60%–70% porosity,however, would suggest that the coefficient offriction is too high to fail at such low angles.Therefore, high pore fluid pressure and/or groundshaking are necessary to trigger the landslides.
[56] Nannofossil populations of Units Ia and Ibexhibit significant mixing of older and youngerfossil assemblages, probably related to debris flowdeposits (Expedition 316 Scientists in the study byKinoshita et al. [2009]), suggesting that muddydeposits on the footwall side of the fault propaga-tion anticline may be composed mainly of masstransport deposits containing reworked materialfrom upslope. We suggest that these slump featuresare an inherent reflection of the distributed defor-mation related to slip along the splay fault, as slip isaccommodated by formation of the anticline andsoft, recent sediments are oversteepened and/orshaken by periodic earthquakes. One of the targetsof NantroSEIZE stage 2 drilling is to document thefactors that control the landslides [Henry et al.,2010].
5.2. Slip Partition of Plate Convergence
[57] Syndepositional activity is inferred in terms ofthe balance between the vertical throw rate of thesplay fault and measured or inferred local sedi-mentation rates. Inline 2731 (Figure 7d) shows thatmost of Unit Ib is displaced by the splay fault,however the uppermost part of Unit Ib and all ofUnit Ia are folded into a gentle anticline, rather thanbeing offset along the fault. The amount of bendinggradually decreases upward and grades into agentle step on the seabed formed by a slump scar.A layer dated at ∼1.30 Ma in the uppermost part ofUnit Ib is bent and the vertical throw due to thisbending is ∼50 m (Figure 7d), therefore the aver-aged vertical throw rate is ∼0.04 m/kyr. On theother hand, the combined thickness of the upper-most part of Unit Ib and Unit Ia is ∼100 m,requiring a sedimentation rate of ∼0.08 m/kyr,twice the vertical throw rate (Figure 7d). Thisvertical throw rate is converted to a horizontalshortening rate of ∼1 m/kyr because the dip angleof the splay fault is ∼20° (Figure 7d). The hori-zontal shortening rate is ∼1.5%–2.5% of the total
plate convergence of ∼40–65 m/kyr. Thus thepartitioning of plate convergence along the splayfault is very small on average. Other parts of thetotal slip might consist of internal deformation ofthe accretionary prism and slip along the basaldécollement itself. Screaton et al. [2009] estimatedthat the shortening due to slip along to the frontalthrust reaches 13% to 34% of the plate convergenceduring activity between ∼0.436 and 0.78 Ma andthe present. They could not estimate the partition-ing of convergence along the imbricate thrust zoneor other portions of the frontal thrust zone becausethere is no age control. It is, however, obvious thatsignificant amount of shortening exists within thesezones and contributes to the plate convergencemuch larger than that along the described branchof the megasplay fault. Sakaguchi et al. [2011]reported that fault gouges and their surroundinghosts from the splay fault (C0004) and frontal thrust(C0007, Figure 1) show frictional heating, suggest-ing high‐velocity slip. Low‐frequency earthquakesdocument activity along the splay fault and thrustswithin the imbricate thrust zone in the NankaiTrough [Obana and Kodaira, 2009]. These factsand broadly observed deformation challenge thecommonly accepted idea that megasplay fault (orout‐of‐sequence thrust) bounding inner and outerwedges acts as the primary plate boundary andaccommodates all coseismic slip; the outer wedgethen slips and deforms in response to this duringthe postseismic period [Wang and Hu, 2006]. Theouter wedge is deformed not only during thepost seismic period but may also be deformedcoseismically together with the slip along the splayfault and may contribute to tsunamigenesis. Furtherresearch is necessary, however, to quantify spatialand temporal variation in slip partitioning.
5.3. Splay Fault Activity With Respectto a Seamount Collision
[58] The difference in activity between the easternand western domains of the splay fault mightextend to a more regional‐scale interpretation.Figures 1b and 13 show the regional‐scale topog-raphy of the fore‐arc and accretionary prism. Tothe southeast of the investigated area, there areregions of imbricate and frontal thrust zones(Figure 2). Axial traces of anticlines and strikes ofthrusts in the imbricate thrust zone trend NE, whichis almost normal to the relative plate convergencedirection, whereas those in the younger frontalthrust zone trend ENE and oblique to the plateconvergence (Figures 2 and 13). The reason for thechange in the orientation from NE to ENE may be
GeochemistryGeophysicsGeosystems G3G3 KUMURA ET AL.: SPACE‐TIME EVOLUTION OF THE SPLAY FAULT 10.1029/2010GC003335
19 of 23

explained by a change in relative convergencedirection, and/or a modification of the prismarchitecture caused by collision of obstacles (suchas seamounts), and/or initiation of oblique sub-duction during the period between the imbricatethrust and the frontal thrust zones.
[59] As the splay fault was initially a frontal thrustat 1.95 Ma [Strasser et al., 2009], all of theaccretionary prism outboard of the splay faultmight be younger than that age. Relative plateconvergence between the Philippine Sea plate andsouthwest Japan is inferred to have changed dras-tically at ∼3–5 Ma on the basis of onland geologicphenomena [Kimura et al., 2005; Takahashi, 2006]and beginning of tearing of the Philippine Sea plate[Ide et al., 2010], but no significant change hasbeen inferred since that time. Therefore, the changein strikes of the thrusts from NE in the imbricatethrust zone to ENE in the frontal thrust zone cannotbe ascribed to a change in relative plate convergence.
[60] To the east of the investigated area, a topo-graphic high (Figure 13) is inferred to reflect asubducted seamount associated with fossil inden-tation to the south [Kington and Tobin, 2009]. Thefossil indentation and associated development of
landslides are observed only in the imbricate thrustzone (Figure 13). This suggests that the collisionmight have started during the development of theimbricate thrust zone and may have finished beforethe development of present frontal thrust zone(Figure 13). Reconstructing the seamount back toits position prior to 1 Ma on the basis of the presentminimum convergence rate of ∼4 cm/yr, shows thatit was located outboard of the imbricate thrust zone(Figure 13), was subducted beneath the imbricatethrust zone after that time, and is now located to thenorth of the splay fault and KBEFZ (Figure 13).The architecture of the accretionary prism waslikely modified by a seamount collision and sub-duction, similar to that observed in the Nankaitrough off the Muroto Peninsula [e.g., Moore et al.,2007]. The splay fault activity in the early phasestopped in the western domain after 1.55 Ma. Thesplay fault bent together with continuous growth offootwall accretionary prism in the imbricate thrustas described in section 4.2. Such geometricalmodification of the splay fault may have preventedits activity and enhanced regional uplift. Before theformation of the frontal thrust zone, a thick, seis-mically transparent layer was underplated beneaththe imbricate thrust zone [Park et al., 2010]. All
Figure 13. A cartoon showing a tectonics process of seamount collision and deformation of the forearc at ∼1.55–1.0 Ma, 0.5 Ma, and present. Previous locations of the seamount are also shown based on the minimum plate con-vergent rate (∼4.0 cm/yr) and its direction.
GeochemistryGeophysicsGeosystems G3G3 KUMURA ET AL.: SPACE‐TIME EVOLUTION OF THE SPLAY FAULT 10.1029/2010GC003335
20 of 23
these events appear to have taken place togetherwith the seamount collision.
[61] Old large landslides in the imbricate thrustzone are cut by the young ENE trending splay faultand KBEFZ (Figure 13) to the south of the buriedseamounts [Kington and Tobin, 2009]. KBEFZ iscomposed mainly of normal faults and dextralstrike‐slip faults behind the megasplay fault[Martin et al., 2010]. The KBFEZ and the splayfault strike almost parallel to the frontal thrustzone and to the present deformation front, whichis modified by indentation due to recent collisionof rather small seamounts [Moore et al., 2009](Figure 13). Deformation of the frontal thrust zone,active splay fault, and KBEFZ with a dextral strike‐slip component, suggests that oblique subductionmay have been enhanced after the indentation ofthe large seamount in the imbricate thrust zone. TheENE trending splay fault in the eastern domain ofthe surveyed area is located at the western end ofthe segment to the south of the buried seamount(Figure 13) and remains active in contrast to that inthe western domain. Continuous activity of theeastern domain of the splay fault after 1.24 Ma maybe related to geometrical adjustment due to reori-entation of the fault after the seamount passedbeneath the imbricate thrust zone. Recentenhancement of oblique subduction may be linkedto increased activity in KBEFZ and the splay faultthat decouples the outer wedge from the innerwedge beneath the Kumano fore‐arc basin andmuch larger‐scale activity as shown in rapidmountain building and active faulting on land after∼1 Ma [Research Group for Active Faults, 1991;Ikeda et al., 2009] and recent clear tearing of thePhilippine Sea plate [Ide et al., 2010]. Manystudies have inferred that coseismic slip along splayfaults that branch from the plate boundary mega-thrust may provide a mechanism by which earth-quakes generate tsunamis [Fukao, 1979; Plafker,1972; Baba et al., 2006; Tanioka and Satake,2001]. A complicated evolving process of thesplay fault in the Nankai trough shown in this papermay give a clue to reveal individual characteristicsof the splay faults and evaluate their activities ineach subduction zone.
6. Conclusion
[62] We investigated the three‐dimensional struc-ture of the shallow portions of the splay faultcombined with the results of drilling and dating ofIODP core during the NantroSEIZE project todefine the spatial and temporal evolution of the
splay fault in the Kumano area, Nankai Trough, offsouthwest Japan. In the investigated area, the splayfault and surface topography is divided into easternand western domains. The differences betweendomains: geometry, activity and surface manifes-tations, result from differences in evolving pro-cesses, which may depend on a slight difference ofdistance from the location of a collided and sub-ducted seamount and interaction between fault slipand sedimentation. Complicated and evolvingprocesses of the accretionary prism determined thelocation of the splay fault as the boundary betweenthe inner and outer wedges. The megasplay startedto function as a seismogenic fault during largeearthquakes along this margin, but the slip partitionof the shallow portion of the fault is only ∼1.5%–2.5% of the total plate convergence. This factsuggests that branches of the megasplay fault andouter wedge may slip and deform coseismically.The investigated and drilled area is limited, but theclarified details of the evolving process may applyto the entire splay fault system in the Nankai troughand other margins. The orientation and geometry ofthe splay fault are keys to evaluate the activity ingeneral that may contribute to assessment of seis-mic and tsunami hazards in the future.
Acknowledgments
[63] The authors thank the ship and drilling personnel, staff,and technicians aboard the D/V Chikyu and the Center forDeep Earth Exploration (CDEX) for their work that allowedthe overall success of the expedition. The authors also thankNantroSEIZE scientists of Expedition 316 (F. Chester, O. Fabbri,C. Fergusson, F. Girault, D. Goldsby, R. Harris, F. Inagaki,T. Jiang, Y. Kitamura, M. Knuth, C.‐F. Li, L. ClaessonLiljedahl, L. Louis, K. Milliken, U. Nicholson, N. Riedinger,A.Sakaguchi, E.Solomon, X. Su, A. Tsutsumi, K. Ujiie,A. Yamaguchi, and X. Zhao). Comments by Demian Safferand two anonymous reviewers greatly improved this paper.This research used samples and data provided by the IntegratedOcean Drilling Program (IODP) and is supported by grant‐in‐aid by MEXT‐KAKENHI 21107005 and NSF grantOCE‐0451790. We thank Paradigm for providing the seismicinterpretation software used in this study.
References
Ando, M. (1975), Source mechanisms and tectonic signifi-cance of historical earthquakes along the Nankai trough,Japan, Tectonophysics, 27, 119–140, doi:10.1016/0040-1951(75)90102-X.
Aoki, Y., T. Tamano, and S. Kato (1982), Detailed structure ofthe Nankai Trough from migrated seismic sections, in Stud-ies in Continental Margin Geology, edited by J. S. Watkinsand C. L. Drake, AAPG Mem., 34 309–322.
GeochemistryGeophysicsGeosystems G3G3 KUMURA ET AL.: SPACE‐TIME EVOLUTION OF THE SPLAY FAULT 10.1029/2010GC003335
21 of 23

Ashi, J., et al. (2002), Structure and cold seep of the Nankaiaccretionary prism off Kumano—Outline of the off Kumanosurvey during YK01‐04 Leg 2 Cruise, JAMSTEC J. DeepSea Res., 20, 1–8.
Baba, T., and P. R. Cummins (2005), Contiguous ruptureareas of two Nankai Trough earthquakes revealed by high‐resolution tsunami waveform inversion, Geophys. Res. Lett.,32, L08305, doi:10.1029/2004GL022320.
Baba, T., P. R. Cummins, T. Hori, and Y. Kaneda (2006),High precision slip distribution of the 1944 Tonankai earth-quake inferred from tsunami waveforms: Possible slip on asplay fault, Tectonophysics, 426, 119–134, doi:10.1016/j.tecto.2006.02.015.
Bangs, N. L. B., G. F. Moore, S. P. S. Gulick, E. M. Pangborn,and H. Tobin (2009), Broad, weak regions of the NankaiMegathrust and implications for shallow coseismic slip,Earth Planet. Sci. Lett., 284 , 44–49, doi:10.1016/j.epsl.2009.04.026.
Byrne, T. B., W. Lin, A. Tsutsumi, Y. Yamamoto, J. C. Lewis,K. Kanagawa, Y. Kitamura, A. Yamaguchi, and G. Kimura(2009), Anelastic strain recovery reveals extension acrossSW Japan subduction zone, Geophys. Res. Lett., 36,L23310, doi:10.1029/2009GL040749.
Expedition 314 Scientists (2009), Expedition 314 Site C0004,in NanTroSEIZE Stage 1: Investigations of Seismogenesis,Nankai Trough, Japan, Proc. Integr. Ocean Drill. Program,314/315/316, doi:10.2204/iodp.proc.314315316.116.2009.
Expedition 316 Scientists (2009a), Expedition 316 Site C0008,in NanTroSEIZE Stage 1: Investigations of Seismogenesis,Nankai Trough, Japan, Proc. Integr. Ocean Drill. Program,314/315/316, doi:10.2204/iodp.proc.314315316.136.2009.
Expedition 316 Scientists (2009b), Expedition 316 Site C0004,in NanTroSEIZE Stage 1: Investigations of Seismogenesis,Nankai Trough, Japan, Proc. Integr. Ocean Drill. Program,314/315/316, doi:10.2204/iodp.proc.314315316.133.2009.
Fukao, Y. (1979), Tsunami earthquakes and subductionprocesses near deep‐sea trenches, J. Geophys. Res., 84,2303–2314, doi:10.1029/JB084iB05p02303.
Henry, P., T. Kanamatsu, and M. Kyaw Thu (2010),NanTroSEIZE Stage 2: Subduction inputs 2 and heat flow,Integr. Ocean Drill. Program Sci. Prospectus., 333,doi:10.2204/iodp.sp.333.2010.
Ide, S., K. Shiomi, K. Mochizuki, T. Tonegawa, and G. Kimura(2010), Split Philippine Sea plate beneath Japan,Geophys. Res.Lett., 37, L21304, doi:10.1029/2010GL044585.
Ike, T., G. F. Moore, S. Kuramoto, J. O. Park, Y. Kaneda, andA. Taira (2008), Variations in sediment thickness and typealong the northern Philippine Sea plate at the NankaiTrough, Isl. Arc, 17, 342–357, doi:10.1111/j.1440-1738.2008.00624.x.
Ikeda, M., S. Toda, S. Kobayashi, Y. Ohno, N. Nishizawa, andI. Ohno (2009), Tectonic model and fault segmentation ofthe Median Tectonic Line active fault system on Shikoku,Japan, Tectonics, 28, TC5006, doi:10.1029/2008TC002349.
Kame, N., J. R. Rice, and R. Dmowska (2003), Effects of pre-stress state and rupture velocity on dynamic fault branching,J. Geophys. Res., 108(B5), 2265, doi:10.1029/2002JB002189.
Karig, D. E., et al. (1975), Initial Reports of the Deep Sea Dril-ling Project, 31, U.S. Govt. Print. Off., Washington, D. C.,doi:10.2973/dsdp.proc.31.1975.
Kikuchi, M., M. Nakamura, and K. Yoshikawa (2003), Sourcerupture processes of the 1944 Tonankai earthquake and the1945 Mikawa earthquake derived from low‐gain seismo-grams, Earth Planets Space, 55, 159–172.
Kimura, J., R. J. Stern, and T. Yoshida (2005), Reinitiation ofsubduction and magmatic responses in SW Japan duringNeogene time, Geol. Soc. Am. Bull., 117, 969–986,doi:10.1130/B25565.1.
Kimura, G., Y. Kitamura, Y. Hashimoto, A. Yamaguchi,T. Shibata, K. Ujiie, and S. Okamoto (2007), Transition ofaccretionary wedge structures around the up‐dip limit ofthe seismogenic subduction zone, Earth Planet. Sci. Lett.,255, 471–484, doi:10.1016/j.epsl.2007.01.005.
Kimura, G., E. Screaton, and D. Curewitz, and the Expe-dition 316 Scientists (2008), NanTroSEIZE Stage 1A:NanTroSEIZE shallow megasplay and frontal thrust, Integr.Ocean Drill. Program Prelim. Rep., 316, doi:10.2204/iodp.pr.316.2008.
Kington, J. B., and H. Tobin (2009), Implications of faultingstyles in the outer wedge of the Nankai accretionary prism,Japan, Eos Trans. AGU, 90(52), Fall Meet. Suppl., AbstractT21C‐1827.
Kinoshita, M., H. Tobin, J. Ashi, G. Kimura, S. Lallement,E. J. Screaton, D. Curewitz, H. Masago, and K. T. Moe, andthe Expedition 314/315/316 Scientists (2009), NanTroSEIZEStage 1: Investigations of Seismogenesis, Nankai Trough,Japan, Proc. Integr. Ocean Drill. Program, 314/315/316,doi:10.2204/iodp.proc.314315316.2009.
Kodaira, S., T. Hori, A. Ito, S. Miura, G. Fujie, J.‐O. Park,T. Baba, H. Sakaguchi, and Y. Kaneda (2006), A cause ofrupture segmentation and synchronization in the Nankaitrough revealed by seismic imaging and numerical simulation,J. Geophys. Res., 111, B09301, doi:10.1029/2005JB004030.
Martin, K. M., S. P. S. Gulick, N. L. B. Bangs, G. F. Moore,J. Ashi, J. O. Park, S. Kuramoto, and A. Taira (2010), Possiblestrain partitioning structure between the Kumano fore‐arcbasin and the slope of the Nankai Trough accretionary prism,Geochem. Geophys. Geosyst., 11, Q0AD02, doi:10.1029/2009GC002668.
Matsumoto, T., and D. R. Tappin (2003), Possible coseismiclarge‐scale landslide off the northern coast of Papua NewGuinea in July 1998: Geophysical and geological resultsfrom SOS cruises, Pure Appl. Geophys., 160, 1923–1943,doi:10.1007/s00024-003-2414-0.
Miyazaki, S., and K. Heki (2001), Crustal velocity field of south-west Japan: Subduction and arc‐arc collision, J. Geophys. Res.,106, 4305–4326, doi:10.1029/2000JB900312.
Moore, G. F., T. H. Shipley, P. L. Stoffa, D. E. Karig, A. Taira,S. Kuramoto, H. Tokuyama, and K. Suyehiro (1990), Structureof the Nankai Trough accretionary zone from multichannelseismic reflection data, J. Geophys. Res., 95, 8753–8765,doi:10.1029/JB095iB06p08753.
Moore, G. F., et al. (2001), New insights into deformation andfluid flow processes in the Nankai Trough accretionary prism:Results of Ocean Drilling Program Leg 190, Geochem. Geo-phys. Geosyst., 2, 1058, doi:10.1029/2001GC000166.
Moore, G. F., N. L. Bangs, A. Taira, S. Kuramoto, E. Pangborn,and H. Tobin (2007), Three‐dimensional splay fault geome-try and implications for tsunami generation, Science, 318,1128–1131, doi:10.1126/science.1147195.
Moore, G. F., et al. (2009), Structural and seismic strati-graphic framework of the NanTroSEIZE State 1 transect,in NanTroSEIZE Stage 1: Investigations of Seismogenesis,Nankai Trough, Japan, Proc. Integr. Ocean Drill. Program,314/315/316, doi:10.2204/iodp.proc.314315316.102.2009.
Morley, C. K. (2009), Growth of folds in a deep‐water setting,Geosphere, 5, 59–89, doi:10.1130/GES00186.1.
Nakanishi, A., S. Kodaira, S. Miura, A. Ito, T. Sato, J. O. Park,Y. Kido, and Y. Kaneda (2008), Detailed structural image
GeochemistryGeophysicsGeosystems G3G3 KUMURA ET AL.: SPACE‐TIME EVOLUTION OF THE SPLAY FAULT 10.1029/2010GC003335
22 of 23

around splay‐fault branching in the Nankai subductionseismogenic zone: Results from a high‐density ocean bottomseismic survey, J. Geophys. Res., 113, B03105, doi:10.1029/2007JB004974.
Obana, K., and S. Kodaira (2009), Low‐frequency tremorsassociated with reverse faults in a shallow accretionaryprism, Earth Planet. Sci. Lett., 287, 168–174, doi:10.1016/j.epsl.2009.08.005.
Park, J. O., T. Tsuru, N. Takahashi, T. Hori, S. Kodaira,A. Nakanishi, S. Miura, and Y. Kaneda (2002a), A deepstrong reflector in the Nankai accretionary wedge frommultichannel seismic data: Implications for underplating andinterseismic shear stress release, J. Geophys. Res., 107(B4),2061, doi:10.1029/2001JB000262.
Park, J. O., T. Tsuru, S. Kodaira, P. R. Cummins, andY. Kaneda (2002b), Splay fault branching along the Nankaisubduction zone, Science, 297, 1157–1160, doi:10.1126/science.1074111.
Park, J. O., L. Wijerathne, T. Hori, S. Kodaira, Y. Fukao,G. F. Moore, N. L. Bangs, S. Kuramoto, and A. Taira (2010),A low‐velocity zone with weak reflectivity along the Nankaisubduction zone,Geology, 38, 283–286, doi:10.1130/G30205.1.
Plafker, G. (1972), Alaskan Earthquake of 1964 and ChileanEarthquake of 1960: Implications for Arc Tectonics,J.Geophys. Res., 77, 901–925, doi:10.1029/JB077i005p00901.
Research Group for Active Faults (1991), Active fault inJapan, sheet maps and inventories (in Japanese with Englishabstract), 2nd ed., 437 pp., Univ. of Tokyo Press, Tokyo.
Sakaguchi, A., et al. (2011), Seismic slip propagation tothe up‐dip end of plate boundary subduction interfacefaults: Vitrinite reflectance geothermometry on IODPNanTroSEIZE cores, Geology, 39, in press.
Sawyer, D. E., P. B. Flemings, B. Dugan, and T. Germaine(2009), Retrogressive failures recorded in mass transportdeposits in the Ursa Basin, Northern Gulf of Mexico, J. Geo-phys. Res., 114, B10102, doi:10.1029/2008JB006159.
Screaton, E., et al. (2009), Interactions between deformation andfluids in the frontal thrust region of the NanTroSEIZE transect
offshore the Kii Peninsula, Japan: Results from IODP Expedi-tion 316 Sites C0006 and C0007, Geochem. Geophys. Geo-syst., 10, Q0AD01, doi:10.1029/2009GC002713.
Seno, T., S. Stein, and A. E. Gripp (1993), A model for themotion of the Philippine Sea plate consistent with Nuvel‐1and geological data, J. Geophys. Res., 98, 17,941–17,948,doi:10.1029/93JB00782.
Strasser, M., et al. (2009), Origin and evolution of a splay faultin the Nankai accretionary wedge, Nat. Geosci., 2, 648–652,doi:10.1038/ngeo609.
Streiff, C, H. Tobin, and G. Moore (2009), Detailed 3‐D archi-tecture of a Thrust fault system and associated folding:Nankai Trough accretionary wedge, Eos Trans. AGU, 89(53),Fall Meet. Suppl., Abstract T31A‐1982.
Taira, A., et al. (1991), Proceedings of the Ocean Drilling Pro-gram, Initial Reports, 131, Ocean Drill. Program, CollegeStation, Tex., doi:10.2973/odp.proc.ir.131.1991.
Takahashi, M. (2006), Tectonic development of JapaneseIslands controlled by Philippine Sea plate motion (in Japanesewith English abstract), J. Geogr., 115, 116–123.
Tanioka, Y., and K. Satake (2001), Detailed coseismic slip dis-tribution of the 1944 Tonankai earthquake estimated fromtsunami waveforms, Geophys. Res. Lett., 28, 1075–1078,doi:10.1029/2000GL012284.
Tobin, H. J., and M. Kinoshita (2006), NanTroSEIZE: TheIDOP Nankai Trough seismogenic zone experiment, Sci.Drill., 2, 23–27, doi:10.2204/iodp.sd.2.06.2006.
Wang, K., and Y. Hu (2006), Accretionary prisms in subduc-tion earthquake cycles: The theory of dynamic Coulombwedge, J. Geophys. Res., 111, B06410, doi:10.1029/2005JB004094.
Zang, S. X., Q. Y. Chen, J. Y. Ning, Z. K. Shen, and Y. G. Liu(2002), Motion of the Philippine Sea plate consistent withthe NUVEL‐1A model, Geophys. J. Int., 150, 809–819,doi:10.1046/j.1365-246X.2002.01744.x.
GeochemistryGeophysicsGeosystems G3G3 KUMURA ET AL.: SPACE‐TIME EVOLUTION OF THE SPLAY FAULT 10.1029/2010GC003335
23 of 23
Copyright © 2022 FDOKUMEN