MODIFICATION OF COLLABORATIVE ONLINE LEARNING FOR SCIENTIFIC WRITING SKILLS ENHANCEMENT

SPASS: A Scientific Paper Writing Support System
Michal Ptaszynski and Fumito Masui
Department of Computer Science, Kitami Institute of Technology
165 Koen-cho, Kitami, 090-8507, Japan
{ptaszynski,f-masui}@cs.kitami-it.ac.jp
ABSTRACT
We present a system for the support of research and
writing of scientific papers. People involved in the
process of research need to perform at least two
general kinds of tasks. Firstly, laboriously analyze
the given data, perform evaluation experiments and
from the experiment results prepare materials for
writing a scientific paper, such as tables, graphs, or
descriptions of the results. The second task is to
provide a creative discussion for the results. To ease
the researchers, and allow them to focus more on the
creative part, we propose a system which helps
performing the laborious part of research. The
system prepares the data for the experiments,
automatically performs the experiments and from the
results calculates the scores of Precision, Recall, F-
score, Accuracy, Specificity and phi-coefficient. It
also creates tables in LaTex template containing all
the results, draws graphs depicting and informatively
comparing each groups of results and generates
descriptions of those results using sentence templates.
KEYWORDS
Paper writing support; Research support; Pattern
extraction; Graph generation; Summarization
generation
1 INTRODUCTION
It is often said ironically about economists: “If
you are so smart, why aren't you rich?” A similar
remark can be said about NLP researchers: “If
you have so many language analysis and
generation techniques, why don't you use them
do the research for you and generate a paper and
presentation slides in the end?” Unfortunately,
there has been astonishingly little research on
scientific paper generation, presentation slides
generation or even on support of the research
process itself. One of the reasons for this is the
fact that many stages of the research process
require creative skills, for which effective
computational models still do not exist. Parts of
the research which require creativity include for
example, preparing descriptions of research
background, literature review, and especially,
discussion and detailed analysis of the results of
experiments.
However, apart from these creative elements
of research, a wide range of activities involved
in the process is of a different, non-creative
nature. Preparing data for experiments,
conducting the experiments, step-by-step
manual changing of feature sets to train and test
machine learning classifiers are only some of the
examples. Moreover, thorough calculation of
final scores of the evaluated tools, generating
tables for the description of experiment results in
technical reports and scientific papers,
generating graphs from those results, and finally,
description and analysis of the results - all those
tasks do not require creative thinking. On the
contrary, they are non-creative part of everyday
research drill. However, despite being non-
creative such activities are laborious since they
require the most of researcher's focus and
precision. This could influence the motivation
toward research and in practice consumes time,
which could be used more efficiently for creative
tasks, such as writing a detailed and convincing
discussion of the results. This problem becomes
especially severe when the scientific paper is
written shortly before the deadline.
To help the researchers perform their research
in a more convenient and efficient way we
decided to develop a system for the support of
ISBN:978-0-9891305-8-5 ©2014 SDIWC 1

research activities and writing technical reports
and scientific papers. The system is released as
an Open Source set of libraries. After being
initialized by one short command, the whole
process including preparation of data for the
experiment, conducting the experiment and
generating materials helpful in writing a
scientific paper is conducted automatically.
The paper outline is as follows. Firstly, we
introduce a number of research similar to ours.
Next, we describe the whole system. We present
in detail each of the parts responsible for data
preparation, experiment conduction and
generation of supporting materials. Next we
present the evaluation process, which verifies
the practical usability of the system. Finally, we
conclude the paper and propose other features
we plan to implement in the near future.
2 BACKGROUND
The research on supporting the process of
research itself is rare. The authors found only a
few pieces of literature that could be considered
as related to the presented system.
One of the most usable and helpful
environments developed so far is the Weka
environment1. Weka provides a wide range of
machine learning algorithms useful in data
mining tasks. It can be used as a stand-alone
software, or can be called from a custom Java
code to analyze data on the fly. Weka allows data
preprocessing, classification or clustering. It also
provides simple visualizations of results. Weka
is widely used in the research society, especially
in natural language processing (NLP) and
computational linguistics (CL) fields.
Unfortunately, Weka needs especially prepared
files with measurements in appropriate columns
and cannot deal with plain unprocessed data
(unprocessed collections of sentences, etc.). It
also does not provide graphs in the format easily
applicable in a research paper, nor does it
provide natural language descriptions of the
analysis of results.
1 http://www.cs.waikato.ac.nz/ml/weka/
In a different kind of research, Nanba et al.
(2000) [1] focus on automatic generation of
literature review. They assumed that in research
papers researchers include short passages which
can be considered as a kind of summary
describing the essence of a paper and the
differences between the current and previous
research. Their research was very promising, as
Nanba et al. [1] dealt with the creative part of
research. Unfortunately, after the initial paper
which presents interesting preliminary results,
the method has not been developed further. This
could suggest that the creative part of research
they attempted to support, namely description of
background and previous research, could still be
too difficult to perform fully automatically.
Shibata and Kurohashi (2005) [2] focused on
a slightly different task, namely, on
automatically generating summary slides from
texts. This is not exactly the same task as
creating presentation slides from a scientific
paper, which we consider as one of our future
tasks, however, the method they proposed, after
several modifications, could be applied in our
research as well. They generated slides by
itemizing topic and non-topic parts extracted
from syntactically analyzed text. In our method
the parts created by the system are grouped
automatically, which could help in the
itemization process.
Apart from the research described above, an
interesting, although not quite scientific
experiment was done by anonymous researchers
involved in a campaign against dubious
conferences 2 . In their attempt they generated
scientific papers by picking up random parts of
actual papers and submitted those fake-papers to
specific conferences to verify the review process
of those questionable conferences. They
succeeded in their task and were accepted to the
conferences, which in general proved that the
process of review of some conferences is not of
the highest quality. Therefore, if there is a
similar attempt in the future, although desirably
more ambitious (non-random scientific paper
2 https://sites.google.com/site/dumpconf/
ISBN:978-0-9891305-8-5 ©2014 SDIWC 2

generation), it should be noticed to submit the
artificially created papers to conferences of
proved and well known reputation.
3 SYSTEM DESCRIPTION
SPASS, or Scientific Paper Writing Support
System performs three tasks. Firstly, prepare the
data for the experiment, secondly, conduct the
experiment under the conditions selected by the
user, and thirdly, summarize the results and
prepare the materials for a technical report or a
scientific paper. We describe each part of the
process in the sections below. The general
overview of the system is represented in Figure
1.
3.1 User Input
The system performs the laborious and non-
creative tasks from the process of research
automatically “with one click”. It is developed
to help in text classification and analysis tasks.
At present the system handles up to two datasets
(binary classification), preferably of opposite
features, such as “positive” and “negative”,
although the applicability of the system is not
limited to sentiment analysis. The user needs to
prepare two separate files for the two corpora.
They are contrasted to each other in the text
classification task in the process of automatic
evaluation. If the input consists of only one
corpus the system will simply produce the most
frequent patterns3 for the corpus.
Dataset Preprocessing
The provided sentences can be in an unprocessed
form. In such situation processed elements will
consists of words (sentence tokens). However,
SPASS allows any preprocessing of the sentence
contents, thus making possible any kind of
generalization the user might wish to apply. The
experiments can be repeated with different kinds
of preprocessing to check how the preprocessing
3 In this paper we use the words “pattern” and “n-
gram” interchangeably.
influences the results. The examples of
preprocessing are represented in Table 1. In
those examples a sentence in Japanese is
preprocessed in the three following ways:
Tokenization: All words, punctuation marks,
etc. are separated by spaces.
Parts of speech (POS): Words are replaced
with their representative parts of speech.
Tokens with POS: Both words and POS
information is included in one element.
In theory, the more generalized a sentence is, the
less unique patterns (n-grams) it will produce,
but the produced patterns will be more frequent.
This can be explained by comparing tokenized
sentence with its POS representation. For
example, in the sentence from Table 1 we can
see that a simple phrase kimochi ii (“feeling
good/pleasant”) can be represented by a POS
pattern N ADJ. We can easily assume that there
will be more N ADJ patterns than kimochi ii,
because many word combinations can be
represented by this morphological pattern. In
other terms, there are more words in the
dictionary than POS labels. Therefore POS
patterns will come in less variety but with higher
occurrence frequency. By comparing the result
of classification using different preprocessing
methods we can find out whether it is better to
represent sentences as more generalized or as
more specific.
Table 1 Three examples of preprocessing of a
sentence in Japanese; N = noun, TOP = topic marker,
ADV = adverbial particle, ADJ = adjective, COP =
copula, INT = interjection, EXCL = exclamative mark.
Sentence: 今日はなんて気持ちいい日なんだ!
Transliteration: Kyōwanantekimochiiihinanda! Meaning: Today TOP what pleasant day COP
EXCL Translation: What a pleasant day it is today!
Preprocessing examples
1. Words: Kyō wa nante kimochi ii hi nanda ! 2. POS: N TOP ADV N ADJ N COP EXCL 3.Words+POS: Kyō[N] wa[TOP] nante[ADV]
kimochi[N] ii[ADJ] hi[N] nanda[COP] ![EXCL]
ISBN:978-0-9891305-8-5 ©2014 SDIWC 3

3.2 Experiment Setup Preparation Module
The initial phase in the system consists of
preparation of data for the experiments. In this
phase the datasets are prepared for an n-fold
cross-validation test. This setting assumes that
the provided data sets are first divided into n
parts. Next, n-1 parts are used for training and
the remaining one for testing. This procedure is
performed n times so every part could be used in
both training and testing. The number of folds in
n-fold cross-validation can be selected by the
user with one simple parameter. For example,
assuming the system is launched as
$ bash main.sh
The user can perform a 5-fold cross validation
by adding a parameter 5, like below. $ bash main.sh 5
The default experiment setup is 10-fold cross-
validation. Setting the parameter to 1 will
perform a test in which test data is the same as
training data. A special additional parameter is
-loo in which the test is performed under the
“leave-one-out” (LOO) condition. In this setting
all instances except one are used for training.
The one left is used as a test data. The test is
performed as many times as the number of all
instances in the data set. For example, LOO
Figure 1 General overview of SPASS divided into research support and paper writing support parts.
ISBN:978-0-9891305-8-5 ©2014 SDIWC 4
cross validation test on a set of 35 sentences will
perform the test 35 times. To speed up the
process of validation, all tests are performed in
parallel.
3.3 Pattern List Generation Module
The next step consists of generation of all
patterns from both provided corpora. It is
possible to extract patterns of all lengths.
However, an informal maximum length of n-
grams used in the literature is either 5-grams
(applied in Google N-gram Corpus English
version4), or 7-grams (applied in Google N-gram
Corpus Japanese version5). This length limit was
set experimentally with an assumption that
longer n-grams do not yield sufficiently high
frequencies. The difference between English and
Japanese comes from the fact that Japanese
sentences contain more grammatical particles,
which means that extracting an n-gram of the
same length for both languages will come with
less amount of meaning for Japanese. In our
system we set the default as 6-grams, although
the setting can be modified freely by the users.
Based on the above assumptions the system
automatically extracts frequent sentence patterns
distinguishable for a corpus. Firstly, all possible
n-grams are generated from all elements of a
sentence. All generated patterns only those
which appear in each corpus more than once are
retained as frequent patterns appearing in a given
corpus. Those appearing only once are
considered as not useful and rejected as pseudo-
patterns. The occurrences of patterns O are used
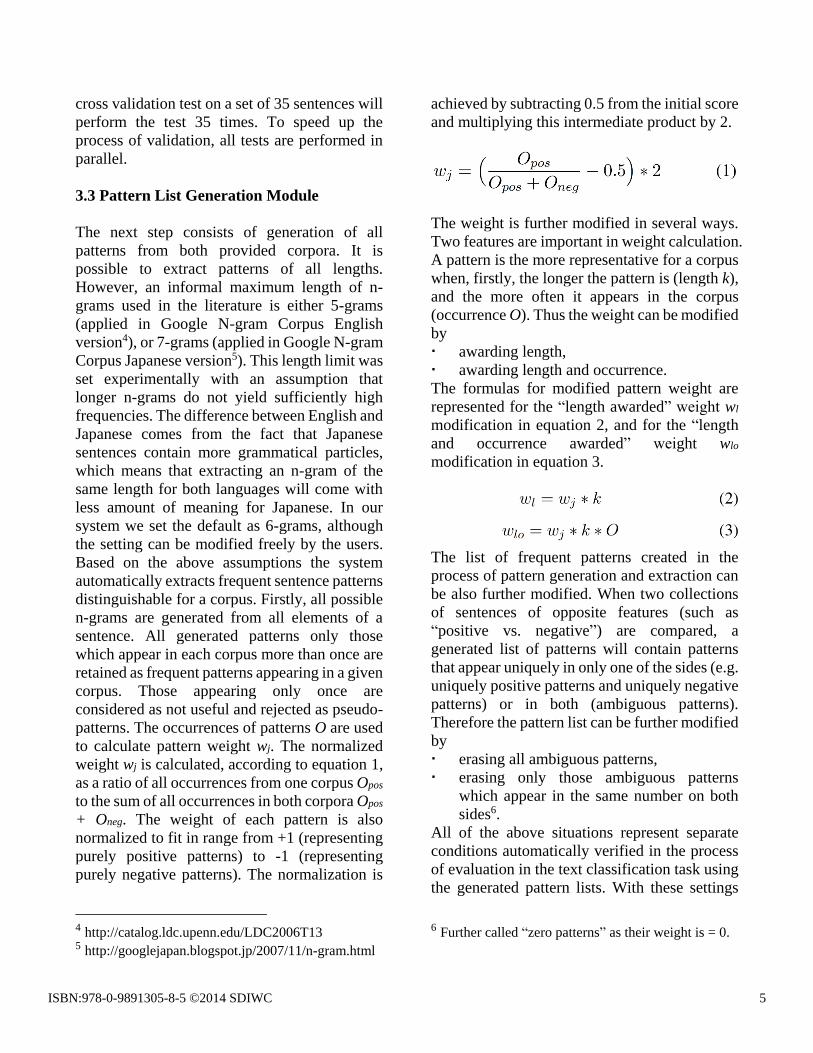
to calculate pattern weight wj. The normalized
weight wj is calculated, according to equation 1,
as a ratio of all occurrences from one corpus Opos
to the sum of all occurrences in both corpora Opos
+ Oneg. The weight of each pattern is also
normalized to fit in range from +1 (representing
purely positive patterns) to -1 (representing
purely negative patterns). The normalization is
4 http://catalog.ldc.upenn.edu/LDC2006T13 5 http://googlejapan.blogspot.jp/2007/11/n-gram.html
achieved by subtracting 0.5 from the initial score
and multiplying this intermediate product by 2.
The weight is further modified in several ways.
Two features are important in weight calculation.
A pattern is the more representative for a corpus
when, firstly, the longer the pattern is (length k),
and the more often it appears in the corpus
(occurrence O). Thus the weight can be modified
by
awarding length,
awarding length and occurrence.
The formulas for modified pattern weight are
represented for the “length awarded” weight wl
modification in equation 2, and for the “length
and occurrence awarded” weight wlo
modification in equation 3.
The list of frequent patterns created in the
process of pattern generation and extraction can
be also further modified. When two collections
of sentences of opposite features (such as
“positive vs. negative”) are compared, a
generated list of patterns will contain patterns
that appear uniquely in only one of the sides (e.g.
uniquely positive patterns and uniquely negative
patterns) or in both (ambiguous patterns).
Therefore the pattern list can be further modified
by
erasing all ambiguous patterns,
erasing only those ambiguous patterns
which appear in the same number on both
sides6.
All of the above situations represent separate
conditions automatically verified in the process
of evaluation in the text classification task using
the generated pattern lists. With these settings
6 Further called “zero patterns” as their weight is = 0.
ISBN:978-0-9891305-8-5 ©2014 SDIWC 5

there is over a dozen of conditions for each of
which the n-fold cross validation test is
performed.
3.4 Text Classification Module
In the text classification experiment each
analyzed item (a sentence) is given a score. The
score is calculated using the pattern list
generated in the Experiment Setup Preparation
Module. There is a wide variety of algorithms
applicable in text classification with which the
calculation of scores can be performed.
However, in the initial settings of SPASS we
prepared for the demonstration we used simple
settings, which will be upgraded along the
development of the system. Namely, the score of
a sentence is calculated as a sum of weights of
all patterns matched for a certain sentence, like
in the equation 4.
In the future we plan to increase the number of
applied classification algorithms, including all
of the standard algorithms such as Neural
Networks and Support Vector Machines. The
use of the simple algorithm allowed us to
thoroughly test other parts of the system.
Next, the calculated score is automatically
evaluated using sliding of threshold window. For
example, under the condition that above
threshold 0 all sentences are considered positive,
a sentence which got a score of 0.5 will be
classified as positive. However, If the initial
collection of sentences was biased toward one of
the sides (e.g., more sentences of one kind, or the
sentences were longer, etc.), there will be more
patterns of a certain sort. Thus to avoid bias in
the results, instead of applying a rule of thumb,
threshold is automatically optimized and all
settings are automatically verified to choose the
best model.
7 http://www.gnuplot.info/
3.5 Contingency Table Generation Module
After the scores are calculated for all sentences
the system calculates the contingency table.
Depending on whether the sentence actually was
positive or negative (all tested sentences
represent Gold Standard) the score becomes
either True Positive (TP), False Positive (FP),
True Negative (TN) or False Negative (FN). By
calculating this for all sentences we get the
contingency table for one test set (one threshold).
The calculation is performed automatically for
all thresholds, by sliding the threshold window
by 0.1. From the contingency tables we calculate
final scores using five measures. These are
Precision, Recall, balanced F-score, Accuracy,
Specificity and phi-coefficient. Finally, the
scores are averaged for all folds from n-fold
cross validation. The average scores are a basis
for further post processing.
3.6 LaTex Table Generation Module
From all scores we generate a table in LaTex
format using a custom Perl script. The table is
provided in a form already usable in a scientific
paper. It consist all scores for all the five
measures within the whole threshold span, for
experiments performed under all possible
conditions (pattern list modifications and weight
calculations). The table containing all
information is a product of one whole single
experiment and usually covers one page of an A4
or Letter type document in LaTex format.
3.7 Graph Generation Module
All scores are stored in .dat files readable by
Gnuplot7, a standard tool for generation of high
quality graphs available under most operating
systems. We applied a custom perl script to
automatically generate graphs in Gnuplot for
comparison of different groups of results. One
graph is generated for one kind of measure
(Precision, Recall, F-score, etc.) for one
ISBN:978-0-9891305-8-5 ©2014 SDIWC 6

compared group of results. Below we explain the
compared groups of results.
The graph for comparison of different weight
calculations (normalized weight, length
awarding, length and occurrence awarding) is
drawn for:
basic settings (all patterns, length awarded
all patterns, length and occurrence awarded
all patterns),
zero deleted (zero deleted, length awarded
zero deleted),
ambiguous deleted (ambiguous deleted,
length awarded ambiguous deleted).
The graph for comparison of different pattern
modification lists (all patterns, zero-patterns
deleted, ambiguous patterns deleted) is drawn
for:
basic settings (all patterns, zero deleted,
ambiguous deleted),
length awarded (length awarded all patterns,
length awarded zero deleted, length
awarded ambiguous deleted).
Additionally, for all the above conditions
separately, the script draws graphs containing
both Precision and Recall together in one graph.
This allows comparison of Break-Even Points
(BEP) for all results. Also, a graph containing all
results together for one measure is drawn to
compare the results in a wider context.
3.8 Result Analysis and Sentence Template
Generation Module
The calculated scores are automatically analyzed
according to simple instructions. This module
looks at the scores and compares them across the
whole threshold span. It verifies the following
items:
Which modification of the algorithm was
better for most threshold span (for all five
scores),
Which version obtained the highest BEP (in
case of more than one BEP in one version
the highest one is used; calculated for
Precision and Recall),
Which version achieved the highest possible
score (for all scores),
Which version was more balanced (an
algorithm which achieved high score only
for one threshold is considered as generally
worse than an algorithm which achieved
slightly worse scores, but generally high on
the whole threshold span).
Next, the results of this verification are imported
into simple sentence templates, such as
“The highest [Precision / Recall / F-score]
of all was achieved by the [zero\_deleted
/ ambiguous\_deleted / ...] version of the
algorithm”,
or
“When it comes to [weight calculations /
pattern list modifications / ...], the highest
[BEP / balanced F-score / Accuray / ...]
was achieved by [zero\_deleted /
ambiguous\_deleted / ...]”.
3.9 Most Useful Pattern Extraction Module
One of the disadvantages of using standard
classification algorithms, such as SVM, or
Neural Networks, making them inapplicable in
traditional linguistic and corpus linguistic
studies, is the fact that the analyzed sentences are
converted into a set of vectors. This hinders
detailed analysis of the data. Therefore we added
a module allowing extraction of the most useful
patterns for further linguistic analysis.
During each fold in each cross validation
experiment most useful patterns are extracted in
the pattern matching and sentence scoring
procedure. All patterns from all experiments are
collected together and the patterns which
appeared more than once are retained. This
provides a general filtered list of patterns which
where most useful during all experiments. This
function has already proved to be useful by [3].
In their research on extracting emotive patterns
from sentences they showed that patterns
included in such list contained many items from
their previously handcrafted lexicon of
exclamations and interjections. This suggests
that it could be possible to automatically
bootstrap generation of lexicons with this
ISBN:978-0-9891305-8-5 ©2014 SDIWC 7

module. Moreover, [6] showed that such most
often used pattern lists reveal not only known,
but also new linguistic knowledge. In their work
on statistical analysis of conversations, they
compared most frequent patterns from different
groups of conversations between people of
different age, gender, social distance and status.
They found out that apart from known
expressions typical for male or female
interlocutors, the lists contained previously
unknown patterns revealing social distance.
Such patterns were not bound by any previously
known linguistic rules, but in practice were used
only by one group in specific conditions (e.g.,
only in conversations between friends, or only
between people who first met).
4 EVALUATION
Due to the lack of literature on research closely
related to ours, no standards have been
previously proposed regarding the means of
evaluation of systems like the one described here.
Therefore we needed to propose our own
evaluation means. One of the popular evaluation
means usable in many kinds of research is a
usability questionnaire. Since the system is
launched by one command in a command line
and the whole computation process takes place
in the background, we could not ask our users
questions about features such as “usability”
(whether the system is easy to use), or GUI
intelligibility. Instead we asked about other
features or functions that might be useful to
implement in the system. In the second means of
evaluation we were guided by similar words to
the ones opening the Introduction to this paper.
Namely, “If the system is so helpful, what would
be the acceptance rate for papers written with the
use of it?” We understand that it is not the most
objective way to evaluate the system due to
many factors being involved, such as writing
skills of the authors, acceptance rate of the
conference, etc. However, we decided to apply it
as this is the most practical and ultimate way of
evaluation.
As for the first evaluation mean, we
performed free conversations with present users
of the system (twelve people, students and
researchers of different age and career status).
From those conversations we extracted the
following remarks. Having so many experiment
results produced by the system it is laborious to
perform statistical significance tests. One of the
reasons we did not implement this feature in the
initial version of the system is that there is a large
number of different significance tests,
depending on the type of data applied in the
research. Therefore in the future we plan to
either allow users to choose their test, or, which
would be more desired, find a method for
automatic selection of a statistical significance
test depending on the data. Another useful
function would be to generate presentation slides,
at least partially. This could be easily
implemented as the system generates all
materials in a LaTex template. Third function
worth implementation would be email
notification when the whole process is finished.
Depending on the amount of data, the whole
process could take a few seconds, an hour, or
even a day or more, especially, when the user
tries to analyse BigData. It could be tiresome to
wait for the results. Thus an email notification
would be a useful feature. However, this would
require additional settings (ensuring the server
has appropriate generic software to send a
simple email message), while initially we meant
the system to work “out of the box”.
As for the second mean of evaluation, at the
time of writing, there have been five papers
accepted to different conferences written with
the use of SPASS. First three of them analyze
emotional and non-emotional sentences [3, 4, 5].
In this research our system helped confirm that
completely automatic approach to extraction of
emotional patterns from sentences can give
similarly good results to tools developed
manually. In the second publication [6], the
system was applied in a conversation analysis
task to find similarities in conversations between
interlocutors of different age, gender, social
distance and status. Interestingly, the system
ISBN:978-0-9891305-8-5 ©2014 SDIWC 8

extracted several linguistic rules (confirmed
statistically) which were previously unknown. In
other recent publication [7] the system was
applied in analysis of future related expressions
for the task of future prediction from trend
information. The experiments performed by the
system helped prove that sentences referring to
the future contain frequent patterns, while
patterns in other sentences (non-future related,
such as present, past or not time related) are
sparse and scattered. This proved that ``future-
referring sentences" can be treated and analysed
as one separate kind of sentences. This discovery
helped Nakajima et. al [7] choose appropriate
methods for further analysis of their data (e.g.,
grounded in linguistics rather than in
information extraction, or data mining).
5 CONCLULSIONS
Research is a process requiring two kinds of
abilities - creativity and precision. The tasks
requiring creativity include preparing detailed
analysis of experiment results or writing a
convincing discussion. The tasks which are not
creative, but requiring focus and precision
include laborious preparation of data for
experiments, performing the experiments and
preparing materials for writing a scientific paper,
such as tables or graphs. Computers are poor at
creative tasks, but good at laborious non-creative
tasks. People on the other hand are experts when
it comes to creativity, but the passion to research
could be severely impaired by the laborious
tasks included in the everyday research drill.
Therefore to ease the researchers, and allow
them focus on the creative part of research, we
developed SPASS - a system which helps
performing the laborious part of the research.
SPASS is a system for the support of research
and writing of scientific papers. The system
prepares the data for the experiments,
automatically performs the experiments and
from the results calculates the scores according
to five different kinds of measures (Precision,
8 http://www.amazon.com/
Recall, etc.). It also creates tables in LaTex
template containing all the results, draws graphs
informatively comparing each groups of results
and generates descriptions of those results using
sentence templates. And what is the most
important, it does all that with a single command.
6 FUTURE WORK
In the near future we plan to upgrade the system
and implement additional functions. Firstly, we
will add various classification algorithms for
more thorough evaluation. We also plan to
include automatic calculation of statistical
significance of results. We also plan to perform
n-fold cross validation multiple times to further
improve the objectivity of the results. A useful
function would be an e-mail notification about
the finalization of the experiment so the
researchers did not have to wait for the results.
The descriptions of experiment results are now
generated as generic sentences. In future we will
perform automatic summarization of sentence
templates to increase the readability and
informativeness of the descriptions. This would
move the research from paper writing support
one step toward an actual automatic paper
generation. We also plan to perform generation
of presentation slides in LaTex template from
the results description, similarly to Shitaba and
Kurohashi [2]. At present the system handles
only two types of labels (two corpora differing
in a certain feature). In future we plan to handle
multi-label data as well, with classes either
related to each other, or unrelated. This could
help deal with not only binary classification-like
corpora comparison (such as sentiment analysis),
but also wider scale analysis, such as extracting
expressions specific for certain emotion types
(fear, sadness, joy, etc.), or gradual sentiment
(for example product reviews on Amazon8). This
will help extract pragmatic generalizations from
corpora, similarly to Potts and Schwarz [8], and
could contribute greatly to the emerging field of
computational pragmatics.
ISBN:978-0-9891305-8-5 ©2014 SDIWC 9
REFERENCES [1] Hidetsugu Nanba, Noriko Kando and Manabu
Okumura. 2000. Classification of research papers using citation links and citation types: Towards automatic review article generation. In Proceedings of 11th ASIS SIG/CR Classification Research Workshop, pp. 117-134.
[2] Tomohide Shibata and Sadao Kurohashi. 2005. Automatic slide generation based on discourse structure analysis. In Proceedings of IJCNLP 2005. Springer Berlin Heidelberg, pp. 754-766.
[3] Michal Ptaszynski, Fumito Masui, Rafal Rzepka, Kenji Araki. 2014. Automatic Extraction of Emotive and Non-emotive Sentence Patterns, In Proceedings of The Twentieth Annual Meeting of The Association for Natural Language Processing (NLP2014), pp. 868-871, Sapporo, Japan, March 17-21.
[4] Michal Ptaszynski, Fumito Masui, Rafal Rzepka, Kenji Araki. 2014. Emotive or Nonemotive: That is The Question, In Proceedings of 5th Workhsop on Computational Approaches to Subjectivity, Sentiment & Social Media Analysis (WASSA 2014), pp. 59-65, held in conjunction with The 52nd Annual Meeting of the Association for Computational Linguistics (ACL 2014), Baltimore, USA, June 22-27.
[5] Michal Ptaszynski, Fumito Masui, Rafal Rzepka, Kenji Araki. 2014. Detecting emotive sentences with pattern-based language modelling. In Proceedings of the 18th International Conference on Knowledge-Based and Intelligent Information & Engineering Systems - KES2014, Gdynia, Poland, 15-17 September, 2014. (to appear)
[6] Michal Ptaszynski, Dai Hasegawa, Fumito Masui, Hiroshi Sakuta, Eijiro Adachi. 2014. How Differently Do We Talk? A Study of Sentence Patterns in Groups of Different Age, Gender and Social Status. In Proceedings of The Twentieth Annual Meeting of The Association for Natural Language Processing (NLP2014), pp. 3-6, Sapporo, Japan, March 17-21.
[7] Yoko Nakajima, Michal Ptaszynski, Hirotoshi Honma, Fumito Masui. 2014. Investigation of Future Reference Expressions in Trend Information. In Proceedings of the 2014 AAAI Spring Symposium Series, “Big data becomes personal: knowledge into meaning – For better health, wellness and well-being –”, pp. 31-38, Stanford, USA, March 24-26, 2014.
[8] Christopher Potts and Florian Schwarz. 2008. Exclamatives and heightened emotion: Extracting pragmatic generalizations from large corpora. Ms., UMass Amherst, 2008.
ISBN:978-0-9891305-8-5 ©2014 SDIWC 10
Copyright © 2022 FDOKUMEN