SPARE THE AIR• - Bay Area Air Quality Management District
264
DRAFT 2017 CLEAN AIR PLAN SPARE THE AIR • COOL THE CLIMATE A BLUEPRINT FOR CLEAN AIR AND CLIMATE PROTECTION IN THE BAY AREA JANUARY 10, 2017
-
Upload
khangminh22 -
Category
Documents
-
view
1 -
download
0
Transcript of SPARE THE AIR• - Bay Area Air Quality Management District

DRAFT 2017 CLEAN AIR PLAN
SPARE THE AIR•
COOL THE CLIMATEA BLUEPRINT FOR CLEAN AIR AND CLIMATE PROTECTION IN THE BAY AREA
JANUARY 10, 2017

Bay area air Quality ManageMent District | Clean air Plan 2017 i
Table of ConTenTs
Page
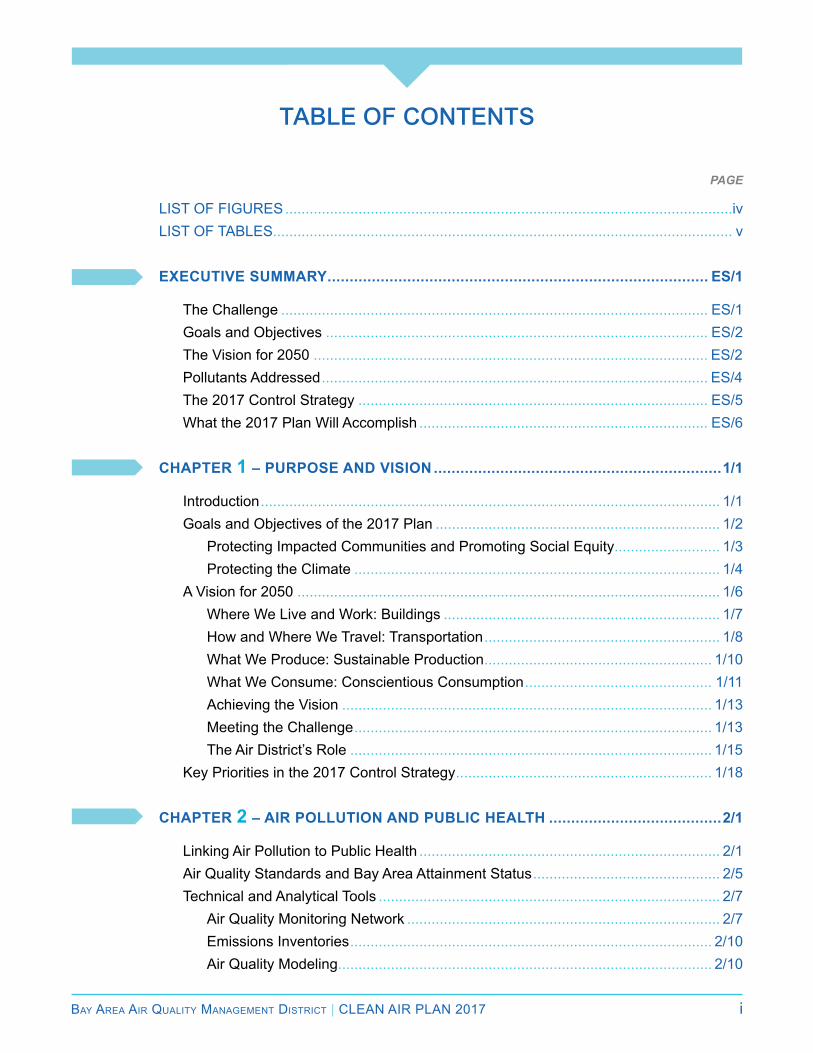
list of figures ..............................................................................................................ivlist of tables................................................................................................................. v
ExEcutivE Summary ...................................................................................... ES/1 the Challenge ......................................................................................................... es/1 goals and objectives .............................................................................................. es/2 the Vision for 2050 ................................................................................................. es/2 Pollutants addressed ............................................................................................... es/4 the 2017 Control strategy ...................................................................................... es/5 What the 2017 Plan Will accomplish ....................................................................... es/6
chaptEr 1 – purpoSE and viSion .................................................................1/1 introduction ................................................................................................................. 1/1 goals and objectives of the 2017 Plan ...................................................................... 1/2 Protecting impacted Communities and Promoting social equity.......................... 1/3 Protecting the Climate .......................................................................................... 1/4 a Vision for 2050 ........................................................................................................ 1/6 Where We live and Work: buildings .................................................................... 1/7 How and Where We travel: transportation .......................................................... 1/8 What We Produce: sustainable Production ........................................................ 1/10 What We Consume: Conscientious Consumption .............................................. 1/11 achieving the Vision ........................................................................................... 1/13 Meeting the Challenge ........................................................................................ 1/13 the air District’s role ......................................................................................... 1/15 Key Priorities in the 2017 Control strategy ............................................................... 1/18
chaptEr 2 – air pollution and public hEalth .......................................2/1 linking air Pollution to Public Health .......................................................................... 2/1 air Quality standards and bay area attainment status .............................................. 2/5 technical and analytical tools .................................................................................... 2/7 air Quality Monitoring network ............................................................................. 2/7 emissions inventories ......................................................................................... 2/10 air Quality Modeling ............................................................................................ 2/10
TABLE OF CONTENTS (continued)
ii Bay area air Quality ManageMent District | Clean air Plan 2017
Multi-Pollutant evaluation Method ......................................................................2/10 ProfilesofKeyPollutants ..........................................................................................2/10 ozone .................................................................................................................2/10 Particulate Matter ................................................................................................2/15 toxic air Contaminants .......................................................................................2/20 Progress in improving air Quality and Protecting Public Health ...............................2/22 Progress in improving air Quality .......................................................................2/23 Progress in Protecting Public Health ..................................................................2/26 chaptEr 3 – GrEEnhouSE GaSES and climatE chanGE impactS .........3/1 the Climate is Changing ............................................................................................3/1 Climate Change impacts on the bay area and California ..........................................3/2 Climate Change is affecting bay area air Quality and Public Health .....................3/7 Climate Change Will Have non-air Quality impacts on bay area Public Health ....3/9 Vulnerable Populations Will be Hit Harder ......................................................... 3/11 building bay area resilience ..............................................................................3/12 greenhouse gases addressed in this Plan ..............................................................3/12 global Warming Potential and atmospheric lifespan .........................................3/12 the importance of reducing super-gHgs .........................................................3/15 bay area gHg emissions by source .......................................................................3/16 Historical and Projected bay area gHg emission trends .......................................3/19 gHg Monitoring network ....................................................................................3/21 Consumption-based gHg emissions inventory .......................................................3/25 summary ..................................................................................................................3/29
chaptEr 4 – planninG contExt ...................................................................4/1
implementation of the 2010 Clean air Plan ................................................................4/1 stationary source Measures ................................................................................4/2 Mobile sources Measures ....................................................................................4/3 transportation Control Measures .........................................................................4/4 land use and local impacts Measures ...............................................................4/4 energy and Climate Measures .............................................................................4/5 further study Measures .......................................................................................4/5 air District Programs that Provide foundation for the 2017 Plan ...............................4/6 Protecting Public Health .......................................................................................4/6 Protecting the Climate ........................................................................................4/15 external Policies, Plans and Programs that Complement the 2017 Plan .................4/17 state Policies, Plans and Programs ...................................................................4/17
TABLE OF CONTENTS (continued)
Bay area air Quality ManageMent District | Clean air Plan 2017 iii
regional Plans and Programs ............................................................................4/22 local Plans .........................................................................................................4/25
chaptEr 5 – climatE and air pollution control StratEGy ...............5/1 tools and resources ..................................................................................................5/2 Control strategy by economic sector .........................................................................5/2 stationary sources ...............................................................................................5/3 transportation .......................................................................................................5/9 energy ................................................................................................................5/14 buildings .............................................................................................................5/17 agriculture ...........................................................................................................5/20 natural and Working lands ................................................................................5/21 Waste Management ............................................................................................5/22 Water ..................................................................................................................5/24 super-gHgs .......................................................................................................5/25 further study Measures .....................................................................................5/28 What the 2017 Plan will accomplish .........................................................................5/30 Protecting Public Health .....................................................................................5/30 Protecting the Climate ........................................................................................5/32 implementation – Key Priorities ................................................................................5/35 reduce Criteria air Pollutants and taCs ............................................................5/36 reduce emission of super-gHgs ......................................................................5/36 reduce Demand for fossil fuels .......................................................................5/36 Decarbonize our energy system .......................................................................5/37 Conclusion ................................................................................................................5/40
aCronyMs anD terMs ..................................................................................................a
appEndicES
aPPenDiX a – state air Quality Planning reQuireMents ........................... a/1aPPenDiX b – PubliC outreaCH............................................................................. b-1aPPenDiX c – air Pollution HealtH burDen .................................................... c/1aPPenDiX d – air Quality MoDeling .................................................................... d-1aPPenDiX E – Progress toWarD attainMent of oZone stanDarDs .........E/1aPPenDiX F – iMPleMentation status of 2010 Control Measures ...........F/1aPPenDiX G – eValuation of Control Measures ........................................... G/1aPPenDiX h – eMission iMPaCts of Control strategy ................................ h/1
Bay area air Quality ManageMent District | Clean air Plan 2017 iv
LIST OF FIGURES
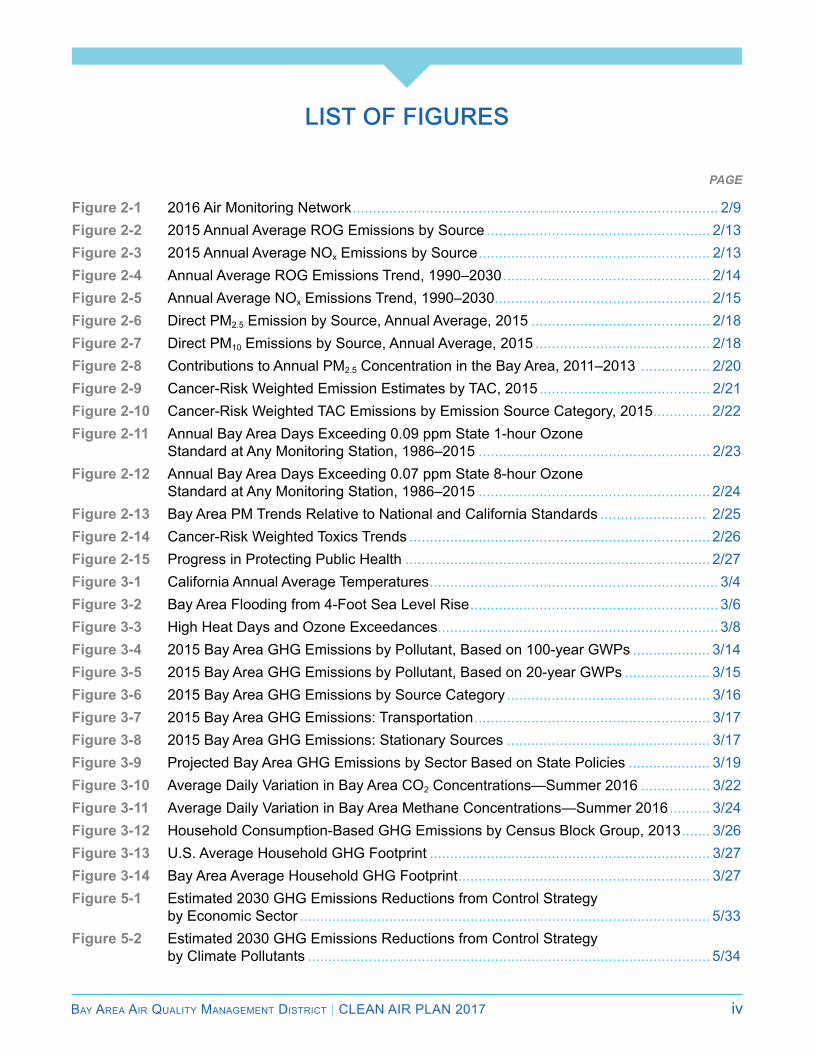
Figure 2-1 2016 air Monitoring network .......................................................................................... 2/9Figure 2-2 2015 annual average rog emissions by source ....................................................... 2/13Figure 2-3 2015 annual average nox emissions by source ......................................................... 2/13Figure 2-4 annual average rog emissions trend, 1990–2030 ................................................... 2/14Figure 2-5 annual average nox emissions trend, 1990–2030 ..................................................... 2/15Figure 2-6 Direct PM2.5 emission by source, annual average, 2015 ............................................ 2/18Figure 2-7 Direct PM10 emissions by source, annual average, 2015 ........................................... 2/18Figure 2-8 Contributions to annual PM2.5 Concentration in the bay area, 2011–2013 ................. 2/20Figure 2-9 Cancer-risk Weighted emission estimates by taC, 2015 .......................................... 2/21Figure 2-10 Cancer-risk Weighted taC emissions by emission source Category, 2015 .............. 2/22Figure 2-11 annual bay area Days exceeding 0.09 ppm state 1-hour ozone standard at any Monitoring station, 1986–2015 ......................................................... 2/23Figure 2-12 annual bay area Days exceeding 0.07 ppm state 8-hour ozone standard at any Monitoring station, 1986–2015 ......................................................... 2/24Figure 2-13 bay area PM trends relative to national and California standards .......................... 2/25Figure 2-14 Cancer-risk Weighted toxics trends .......................................................................... 2/26Figure 2-15 Progress in Protecting Public Health ........................................................................... 2/27Figure 3-1 California annual average temperatures ....................................................................... 3/4Figure 3-2 bay area flooding from 4-foot sea level rise ............................................................. 3/6Figure 3-3 High Heat Days and ozone exceedances ..................................................................... 3/8Figure 3-4 2015 bay area gHg emissions by Pollutant, based on 100-year gWPs ................... 3/14Figure 3-5 2015 bay area gHg emissions by Pollutant, based on 20-year gWPs ..................... 3/15Figure 3-6 2015 bay area gHg emissions by source Category .................................................. 3/16Figure 3-7 2015 bay area gHg emissions: transportation .......................................................... 3/17Figure 3-8 2015 bay area gHg emissions: stationary sources .................................................. 3/17Figure 3-9 Projected bay area gHg emissions by sector based on state Policies .................... 3/19Figure 3-10 average Daily Variation in bay area Co2 Concentrations—summer 2016 ................. 3/22Figure 3-11 average Daily Variation in bay area Methane Concentrations—summer 2016 .......... 3/24Figure 3-12 Household Consumption-based gHg emissions by Census block group, 2013 ....... 3/26Figure 3-13 u.s. average Household gHg footprint ..................................................................... 3/27Figure 3-14 bay area average Household gHg footprint .............................................................. 3/27Figure 5-1 estimated 2030 gHg emissions reductions from Control strategy by economic sector ..................................................................................................... 5/33Figure 5-2 estimated 2030 gHg emissions reductions from Control strategy by Climate Pollutants ................................................................................................... 5/34
Page
Bay area air Quality ManageMent District | Clean air Plan 2017 v
LIST OF TabLES
Page
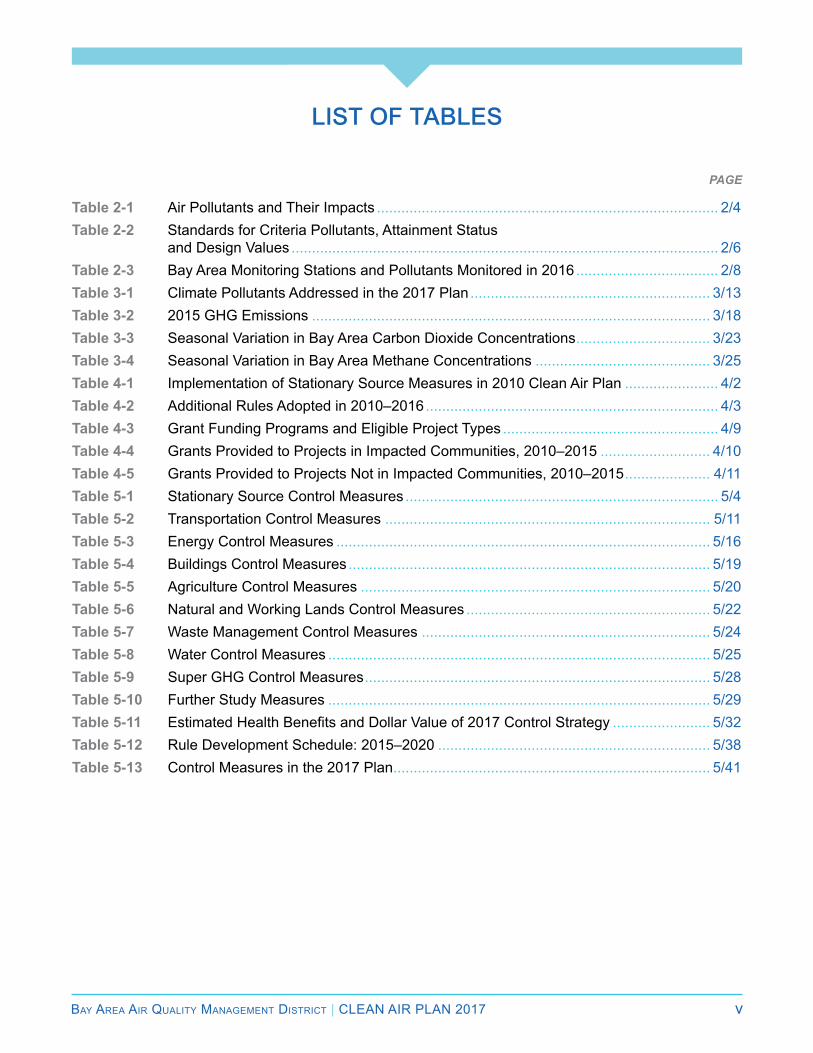
table 2-1 air Pollutants and their impacts .................................................................................... 2/4table 2-2 standards for Criteria Pollutants, attainment status and Design Values ......................................................................................................... 2/6table 2-3 bay area Monitoring stations and Pollutants Monitored in 2016 ................................... 2/8table 3-1 Climate Pollutants addressed in the 2017 Plan ........................................................... 3/13table 3-2 2015 gHg emissions .................................................................................................. 3/18table 3-3 seasonal Variation in bay area Carbon Dioxide Concentrations ................................. 3/23table 3-4 seasonal Variation in bay area Methane Concentrations ........................................... 3/25table 4-1 implementation of stationary source Measures in 2010 Clean air Plan ....................... 4/2table 4-2 additional rules adopted in 2010–2016 ........................................................................ 4/3table 4-3 grant funding Programs and eligible Project types ..................................................... 4/9table 4-4 grants Provided to Projects in impacted Communities, 2010–2015 ........................... 4/10table 4-5 grants Provided to Projects not in impacted Communities, 2010–2015 ..................... 4/11table 5-1 stationary source Control Measures ............................................................................. 5/4table 5-2 transportation Control Measures ................................................................................ 5/11table 5-3 energy Control Measures ............................................................................................ 5/16table 5-4 buildings Control Measures ......................................................................................... 5/19table 5-5 agriculture Control Measures ...................................................................................... 5/20table 5-6 natural and Working lands Control Measures ............................................................ 5/22table 5-7 Waste Management Control Measures ....................................................................... 5/24table 5-8 Water Control Measures .............................................................................................. 5/25table 5-9 super gHg Control Measures ..................................................................................... 5/28table 5-10 further study Measures .............................................................................................. 5/29table 5-11 EstimatedHealthBenefitsandDollarValueof2017ControlStrategy ........................ 5/32table 5-12 rule Development schedule: 2015–2020 ................................................................... 5/38table 5-13 Control Measures in the 2017 Plan .............................................................................. 5/41

Bay area air Quality ManageMent District | Clean air Plan 2017 eS/1
ExEcutivE summary
Since its formation in 1955 as the first regional air quality agency in the nation, the Bay area air Quality Management
District (air District) has led the effort to reduce air pollution and protect public health in the region. Over the past 60 years, we have made tremendous progress in improving air quality throughout the San Francisco Bay area, while the population and economic output of the region have increased tremendously. Population exposure to unhealthy levels of ozone and particulate matter, and cancer risk from exposure to toxic air contaminants, have all been greatly reduced.
But further progress is needed. as science has im-proved and progressed, we continue to learn more
The Challenge about the harmful impacts of air pollution. Some Bay area communities and populations are dispro-portionately impacted by air pollution. and climate change—which has already begun to impact the region, state and world—threatens to degrade air quality and to potentially jeopardize the health and well-being of Bay area residents, especially in the most vulnerable communities. To protect public health and stabilize the climate, we must take ag-gressive action to eliminate fossil fuel combustion and transition to a post-carbon economy.
Transitioning to a post-carbon economy presents a daunting challenge. But this challenge provides a tremendous opportunity for the region to devel-op new technologies, solutions, and ideas that will help California continue to lead the nation and en-sure our continued viability and prosperity as a re-gion. By so doing, we can protect the environment and the climate that make the Bay area a great
ExEcutivE Summary
eS/2 Bay area air Quality ManageMent District | Clean air Plan 2017
place to live, while leading the way toward the in-novative policies and technologies that will drive economic change and promote social equity in the 21st century.
Climate change is a global problem. no single re-gion or agency can solve the climate challenge on its own. But in the face of uncertainty at the nation-al level, it is imperative that Bay area residents, businesses, and institutions step up to the chal-lenge and provide leadership. This region-wide ac-tion will provide an example of metropolitan-scale solutions to improve air quality and protect the cli-mate; an example that can be replicated through-out California, the United States and beyond.
To help accomplish the long-range vision de-scribed in this plan, the air District will deploy all its tools and resources to continue reducing emissions of air pollutants and greenhouse gas-es (GHGs) in the Bay area. But recognizing that climate change represents a profound and long-term challenge, the air District will also step up to expand its role by fostering research and inno-vation, developing new partnerships, convening stakeholders, educating Bay area residents about how they can reduce GHG emissions, and provid-ing leadership as part of the overall regional effort to protect the climate.
Goals and Objectives
The 2017 Clean air Plan, Spare the Air, Cool the Climate (2017 Plan), focuses on two closely-related goals: protecting public
health and protecting the climate. Consistent with the GHG reduction targets adopted by the state of California, the plan lays the groundwork for a long-term effort to reduce Bay area GHG emissions 40 percent below 1990 levels by 2030 and 80 percent below 1990 levels by 2050.
To help describe what it will take to achieve the ambitious GHG reduction target for 2050, the Plan offers a long-range vision of how the Bay area could look and function in a year 2050 post-carbon economy, and describes a comprehensive control strategy that the air District will implement over the
next three to five years to protect public health and protect the climate, while setting the region on a pathway to achieve the 2050 vision.
The 2017 Plan updates the most recent Bay area ozone plan, the 2010 Clean Air Plan, pursuant to air quality planning requirements defined in the California Health & Safety Code.1 To fulfill state ozone planning requirements, the 2017 control strategy includes all feasible measures to reduce emissions of ozone precursors—reactive organ-ic gases (rOG) and nitrogen oxides (nOx)—and reduce transport of ozone and its precursors to neighboring air basins.
The Vision for 2050
By visualizing what the Bay area may look like in a post-carbon year 2050—where we will live, how we will travel, what we will produce,
and what we will consume—we can better discern the policies and actions that we, as a region, need to take in the near- to mid-term to embark on the transformation. The Plan describes a vision for a thriving region with clean air, a stable climate, a robust natural environment, and a prosperous and sustainable economy. The vision for 2050 can be briefly summarized as follows.
ExEcutivE Summary
Bay area air Quality ManageMent District | Clean air Plan 2017 eS/3
Where We Live and Work: Buildings
By 2050 the buildings in which we live, work, learn, shop and socialize will be energy efficient, and they will be heated, cooled, and powered by re-newable energy.
To eliminate the use of fossil fuels in buildings, we will need to:
● Maximize energy efficiency in both new and existing buildings. Stringent standards already apply to new buildings. However, efforts to ret-rofit existing commercial and residential build-ings will need to be greatly expanded.
● increase production of on-site renewable ener-gy such as rooftop solar.
● Develop and deploy technologies for on-site energy storage.
● Switch from natural gas to clean electricity, or other renewable energy, for space and water heating, clothes drying, cooking, and other do-mestic uses.
To reduce emissions of particulate matter (PM) and black carbon, we will also need to eliminate wood burning.
How and Where We Travel: Transportation
By 2050 the transportation sector will be trans-formed. We will travel by a combination of electric vehicles, both shared and privately-owned; auton-omous public transit fleets offering both fixed-route and flexible-route service; with a large share of trips by bicycling, walking and transit.
● new development will need to offer safe and convenient access to jobs, shopping, and ser-vices by transit, bicycle and walking.
● Nearly 90 percent of the motor vehicle fleet will need to be zero emission. Heavy-duty vehicles will need to be powered by electricity, or by re-newable forms of diesel or other low-carbon liquid fuels.
● The majority of trips will need to be made by walking, bicycling, riding transit or sharing vehicles.
● new technologies and services will reduce the need for personal vehicle ownership. Car-sharing services, transportation net-work companies, and autonomous electric- powered vehicles will greatly reduce emis-sions of air pollutants and greenhouse gases from transportation.
What We Produce: Sustainable Production
By 2050 the Bay Area economy will be powered by clean, renewable electricity. The region will be a leading incubator and producer of clean energy technologies, and Bay Area industry will lead the world in the carbon-efficiency of our products.
● a smart grid interconnecting renewable ener-gy sources will be needed in order to provide nearly 100 percent renewable electricity.
● Bay area industries will need to be powered by carbon-free electricity and biofuels.
● The carbon-intensity of products—the amount of carbon it takes to make a given product—manufactured in the region will need to be greatly reduced.
● The Bay area will need to become a hub for the development and production of innovative renewable energy technologies, creating solid jobs requiring diverse education and skills.
What We Consume: “Conscientious Consumption”
By 2050, Bay Area residents will need to develop a low-carbon lifestyle. We will greatly reduce our personal GHG consumption (our “GHG footprint”) by driving electric vehicles, living in zero net- energy homes, eating low-carbon foods, and pur-chasing goods and services with low carbon con-tent. Waste will be greatly reduced, any waste products will be re-used or recycled, and all organic waste will be composted and put to productive use.
● The air District and partner agencies will devel-op information campaigns to help Bay area res-idents understand the active role they can play in reducing GHG emissions. This will include
ExEcutivE Summary
eS/4 Bay area air Quality ManageMent District | Clean air Plan 2017
providing information on the factors that influ-ence their GHG footprint and resources to help make effective choices to reduce their personal GHG footprint.
● Bay area residents will need to reduce their consumption of carbon-intensive foods and adopt a low-carbon diet for at least some por-tion of their meals.
● Food waste will need to be greatly reduced and all organic matter will need to be diverted from the waste stream and put to productive use.
Pollutants addressed
The 2017 plan describes a multi-pollutant strategy to simultaneously reduce emissions and ambient concentrations of ozone, fine
particulate matter, toxic air contaminants, as well as greenhouse gases that contribute to climate change. Each category of pollutant is briefly de-scribed below.
Ozone: Ozone (O3), often called smog, is formed by photochemical reactions of precursor chem-icals known as reactive organic compounds and oxides of nitrogen in the presence of sun-light. exposure to ozone can damage the lungs and aggravate respiratory conditions such as asthma, bronchitis and emphysema. Motor ve-hicles and industrial sources are the largest sources of ozone precursors in the Bay area.
emissions of ozone precursors have been greatly reduced in recent decades. as a result, Bay area ozone levels and population exposure to harmful levels of smog have decreased substantially. De-spite this progress, the Bay area does not yet fully attain state and national ozone standards. This is primarily due to the progressively tightened na-tional ozone standard, but also to the amount of population and economic growth occurring within the Bay area. Therefore, we need to further reduce emissions of ozone precursors. This is especially important because rising temperatures associated with climate change are expected to increase emis-sions of ozone precursors and smog formation.
Particulate matter: Fine particulate matter (PM2.5), a diverse mixture of suspended particles and liquid droplets (aerosols), is the air pollutant most harmful to the health of Bay area residents. Exposure to fine PM, on either a short-term or long-term basis, can cause a wide range of respi-ratory and cardiovascular health effects, includ-ing strokes, heart attacks and premature deaths. Combustion of fossil fuels and wood (primarily residential wood-burning) are the primary sources of PM2.5 in the Bay area. emissions and ambient concentrations of PM have both been greatly re-duced in recent years. as a result, the Bay area currently meets national and state standards for both daily and annual average levels of PM2.5. Despite this progress, some Bay area communi-ties are still impacted by localized concentrations of PM. In addition, health studies find negative health impacts from exposure to PM even below the current standards. Therefore, we need to con-tinue our efforts to further reduce PM emissions.
Toxic Air Contaminants: Toxic air contaminants (TaCs) are a class of pollutants that includes hun-dreds of chemicals hazardous to human health. long-term exposure to TaCs may cause more se-vere health effects such as neurological damage, hormone disruption, developmental defects and cancer. Because TaC emissions are highly local-ized, exposure to TaCs is a key criterion that the air District uses to identify communities that are disproportionately impacted by air pollution. The average cancer risk from TaCs in the Bay area has been reduced by 80 percent since 1990. The air District will continue working to reduce TaCs with the goal of eliminating disparities in health risks from TaCs among Bay area communities.
Greenhouse Gases: The principal greenhouse gases that contribute to global warming and cli-mate change include carbon dioxide (CO2), meth-ane (CH4), nitrous oxide (n2O), black carbon, and fluorinated gases (F-gases): hydrofluorocarbons (HFCs), perfluorocarbons (PFCs) and sulfur hexa-fluoride (SF6). after increasing rapidly in past de-cades, GHG emissions throughout California and the Bay area have leveled off. However, in or-der to prevent the most dangerous climate change scenarios, we must reduce GHG emissions great-ly. it is especially important to rapidly reduce
ExEcutivE Summary
Bay area air Quality ManageMent District | Clean air Plan 2017 eS/5
emissions of those GHGs with very high global warming potential, such as methane, black carbon, and F-gases, which we refer to as “super-GHGs” in this document. (The air resources Board refers to these compounds as short-lived climate pollut-ants or SlCPs.) To provide a roadmap, the 2017 Plan describes an ambitious strategy to reduce GHG emissions in order to protect the climate.
The 2017 Control Strategy
The 2017 Plan defines an integrated, multi- pollutant control strategy to reduce emis-sions of particulate matter, TaCs, ozone
precursors and greenhouse gases. The proposed control strategy is designed to complement efforts to improve air quality and protect the climate that are being implemented by partner agencies at the state, regional and local scale. The control strate-gy encompasses 85 individual control measures that describe specific actions to reduce emissions of air and climate pollutants from the full range of emission sources. The control measures are cat-egorized based upon the economic sector frame-work used by the air resources Board for the aB 32 Scoping Plan Update. The sectors include:
Stationary (industrial) Sources Transportation energy Buildings agriculturenatural and Working landsWaste ManagementWaterSuper-GHG Pollutants
in addition to fostering consistency with climate planning efforts at the state level, the economic sector framework also ensures that the control strategy addresses all facets of the economy.
The proposed control strategy is based on four key priorities:
● reduce emissions of criteria air pollutants and toxic air contaminants from all key sources.
● reduce emissions of “super-GHGs” such as methane, black carbon and fluorinated gases.
● Decrease demand for fossil fuels (gasoline, diesel and natural gas).
▪ Increase efficiency of our energy and trans-portation systems.
▪ reduce demand for vehicle travel, and high-carbon goods and services.
● Decarbonize our energy system.
▪ Make the electricity supply carbon-free.
▪ electrify the transportation and building sectors.
Key elements in the control strategy are briefly de-scribed below.
Stationary sources:
● Decrease emissions of GHGs and criteria air pollutants through a region-wide strategy to im-prove combustion efficiency at industrial facil-ities, beginning with the three largest sources of emissions: oil refineries, power plants and cements plants.
● Reduce methane emissions from landfills, and oil and natural gas production and distribution.
● reduce emissions of toxic air contaminants by adopting more stringent thresholds and meth-ods for evaluating toxic risks at existing and new facilities.
Transportation:
● reduce motor vehicle travel by promoting tran-sit, bicycling, walking and ridesharing.
● implement pricing measures to reduce travel demand.
● Direct new development to areas that are well-served by transit, and conducive to bicycling and walking.
● accelerate the widespread adoption of electric vehicles.
● Promote the use of clean fuels and low- or zero- carbon technologies in trucks and heavy-duty vehicles.
ExEcutivE Summary
eS/6 Bay area air Quality ManageMent District | Clean air Plan 2017
Buildings and energy:
● expand the production of low-carbon, renew-able energy by promoting on-site technologies such as rooftop solar, wind and ground-source heat pumps.
● Support the expansion of community choice en-ergy programs throughout the Bay area.
● Promote energy and water efficiency in both new and existing buildings.
● Promote the switch from natural gas to elec-tricity for space and water heating in Bay area buildings.
The Air District’s Tools and Resources
To implement the 2017 control strategy, the air District will draw upon all the tools and resources at its disposal, including:
● Rulemaking: Use its regulatory and permitting authority to adopt and enforce rules to reduce emissions of air and climate pollutants.
● Funding: Provide funds and incentives through its grant and incentive programs and other sources.
● Best Practices: Promote the use of best prac-tices by public agencies and other entities by means of model ordinances, guidance docu-ments, informational campaigns, etc.
● Informational resources: Conduct marketing or media campaigns, disseminate educational materials, engage with community groups and other organizations.
● Advocacy: Support legislative action at the fed-eral or state level and advocate for funding to support implementation of the measures in the 2017 control strategy.
● Partnerships: Work actively within the region and the state to develop partnerships that can enable business, local government and resi-dents to work and learn together to develop vi-able air pollution and GHG reduction strategies.
What the 2017 Plan Will accomplish
The 2017 Plan focuses on protecting public health and protecting the climate.
Protecting public health: The proposed control strategy will reduce emissions of the air pollutants that pose the greatest health risk to Bay area resi-dents. The strategy will decrease population expo-sure to PM and TaCs in the communities that are most impacted by air pollution, and reinforce the air District’s commitment to protect public health in these communities, with a goal of eliminating dis-parities in exposure to air pollution between com-munities. The Plan will ensure that the Bay area continues to meet fine PM standards, while con-tinuing progress toward attaining state and nation-al ozone standards.
The proposed control measures are estimated to reduce emissions of rOG by approximately 12 tons per day, nOx by 8.8 tons per day, and PM2.5
by 2.8 tons per day. These emission reductions are expected to decrease illness and premature mortality. The estimated dollar value of the avoid-ed costs related to health care, lost productivity, and premature death is on the order of $700 mil-lion per year.
Protecting the climate: The proposed control measures will reduce emissions of greenhouse gases by approximately 4.4 million metric tons
ExEcutivE Summary
Bay area air Quality ManageMent District | Clean air Plan 2017 eS/7
FOOTnOTeS
1 The 2017 Plan responds to planning requirements pursuant to state law only. The Plan does not address federal air quality planning requirements, nor is it part of a State implementation Plan for federal air quality planning purposes.
of GHGs on a CO2-equivalent basis per year by 2030, based on 100-year global warming poten-tial factors, and set us on a course for deeper GHG reductions that will be needed to achieve the 2050 target. Using a value of $62 per metric ton of CO2-equivalent to estimate the avoided social and economic costs related to the antic-ipated impacts of climate change, the GHG re-ductions from the 2017 Plan control strategy will have an estimated value of approximately $275 million per year.
Moving Forward
The 2017 Plan provides a comprehensive strat-egy to improve air quality, protect public health, and protect the climate, utilizing all the tools and resources available to the air District. in addition to reducing emissions of air pollutants and green-house gases in the Bay area over the near term,
the 2017 Plan is intended to set us on the pathway for the long-term transformation to a post-carbon future. To implement the Plan, the air District will collaborate with government agencies, environ-mental and community groups and other non-prof-its, the business sector, academic institutions and Bay area residents.
By taking aggressive action to protect the climate, we can ensure that the Bay area continues to lead in the development of social and technological inno-vations that will transform our economy in the com-ing decades and create a sustainable Bay area as described in the 2050 vision presented in Chapter 1.
We believe the 2017 Plan can inspire action else- where by providing an example of metropolitan-scale solutions to improve air quality and protect the climate that can be replicated throughout California, the nation and the world.

Bay area air Quality ManageMent District | Clean air Plan 2017 1/1
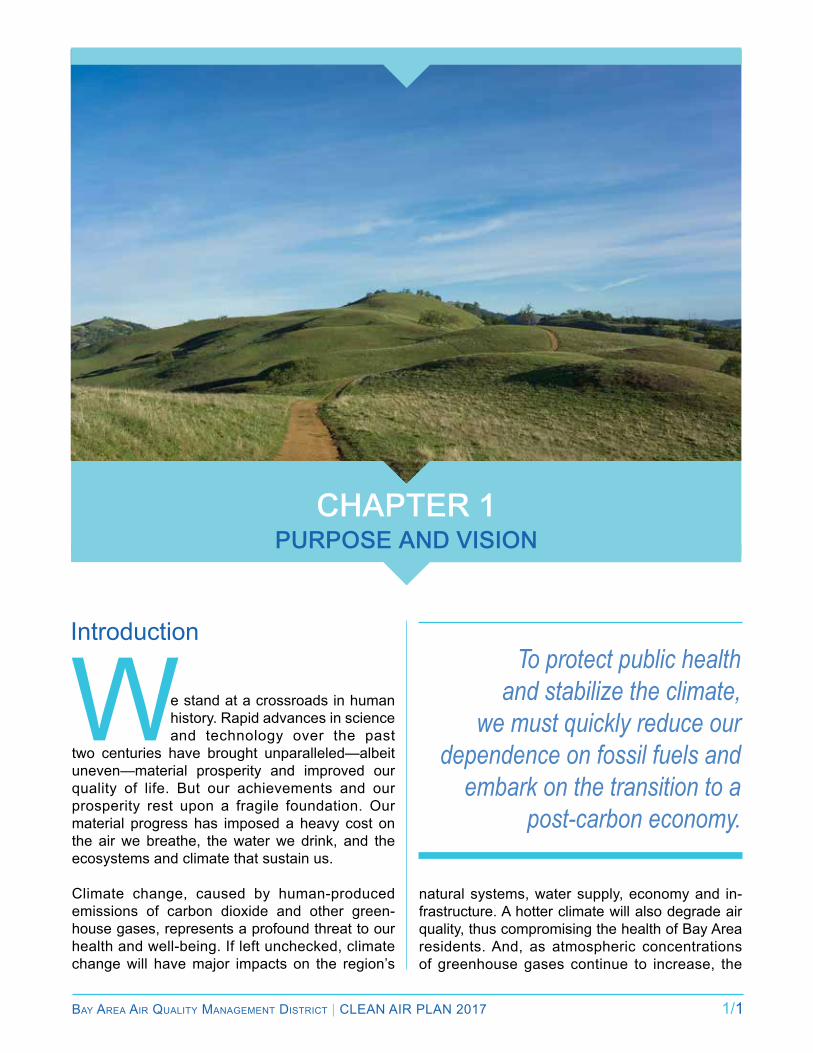
Chapter 1purpose and Vision
We stand at a crossroads in human history. rapid advances in science and technology over the past
two centuries have brought unparalleled—albeit uneven—material prosperity and improved our quality of life. But our achievements and our prosperity rest upon a fragile foundation. Our material progress has imposed a heavy cost on the air we breathe, the water we drink, and the ecosystems and climate that sustain us.
Climate change, caused by human-produced emissions of carbon dioxide and other green-house gases, represents a profound threat to our health and well-being. if left unchecked, climate change will have major impacts on the region’s
introductionTo protect public health
and stabilize the climate, we must quickly reduce our
dependence on fossil fuels and embark on the transition to a
post-carbon economy.
natural systems, water supply, economy and in-frastructure. a hotter climate will also degrade air quality, thus compromising the health of Bay area residents. and, as atmospheric concentrations of greenhouse gases continue to increase, the

Chapter 1 purpose and Vision
1/2 Bay area air Quality ManageMent District | Clean air Plan 2017
negative impacts of climate change are expected to deepen and accelerate.
economic progress in the modern era has been powered by cheap and abundant energy from fossil fuels, the combustion of which is the prima-ry source of air pollution and of the greenhouse gas that change the climate. To protect public health and stabilize the climate, we must move quickly to eliminate fossil fuel combustion and embark on the transition to a post-carbon econo-my. in fact, researchers have concluded that we need to leave three-quarters of remaining fossil fuels in the ground in order to avoid catastrophic impacts from climate change.1 However, as long as there is a market for coal, oil and natural gas, there will always be strong economic incentive to exploit these fossil fuel reserves. Therefore, we can only stabilize the climate by slashing demand for fossil fuels.
The transition to a post-carbon economy presents a daunting challenge, but it also provides a tre-mendous opportunity that we must seize to ensure our continued viability and prosperity as a region. With its world-class academic institutions, inno-vative business sector, educated and progressive residents, and strong environmental ethos, the Bay area is uniquely positioned to embrace this challenge and opportunity. By so doing, we can protect the environment and the climate that make the Bay area a great place to live, while leading the way toward the innovative policies and tech-nologies that will drive economic change and pro-mote social equity in the 21st century.
Climate change is a global-scale problem. no sin-gle region or agency can solve the climate chal-lenge on its own. But in the face of uncertainty and limited action at the national level, it is more imperative than ever that Bay area residents, businesses and institutions step up to the chal-lenge. To that end, the air District will deploy the full range of its tools and resources to reduce emissions of air pollutants and greenhouse gases in the Bay area, while providing an example of metropolitan-scale action to protect air quality and the climate that can be replicated throughout Cal-ifornia, the United States and beyond.
after summarizing the goals and objectives for the 2017 Plan, this chapter offers a long-range vision as to how the Bay area could look and function in a year 2050 post-carbon economy. The chap-ter concludes by introducing the proposed 2017 control strategy, a strategy which describes mea-sures that the air District will implement over the next three to five years to protect public health and protect the climate, while setting the region on a pathway to achieve the 2050 vision.
Goals and Objectives of the 2017 Plan
Consistent with the mission of the air Dis-trict, the 2017 Plan focuses on two para-mount goals:
Protect Air Quality and Health at the Regional and Local Scale:
● attain all state and national air quality stan-dards
● eliminate disparities among Bay area com-munities in cancer health risk from toxic air contaminants
Protect the Climate:
● reduce Bay area GHG emissions 40 per-cent below 1990 levels by 2030, and 80 per-cent below 1990 levels by 2050.2
These goals are complementary. Despite sub-stantial progress in improving air quality, air pol-lution still has negative impacts on public health
Chapter 1 purpose and Vision
Bay area air Quality ManageMent District | Clean air Plan 2017 1/3
Updating the Bay area’s state OzOne plan
propose a control strategy to reduce emissions of ozone precursors—reactive organic gases (ROG) and nitrogen oxides (NOx)—and reduce transport of ozone and its precursors to neighboring air basins. The control strategy must either reduce emissions 5 percent or more per year, or include “all feasible control measures”. Because reducing emissions of ozone precursors by 5 percent per year is not achievable, the control strategy for the 2017 Plan is based on the “all feasible measures” approach. The Health & Safety Code ozone planning requirements are described in more detail in Appendix A.
Ground level ozone—often called “smog”—harms public health and ecosystems. As discussed in Chapter 2, Bay Area ozone
levels have been greatly reduced in recent years, but the region still does not fully attain state and national ozone standards. The California Clean Air Act, as codified in the California Health & Safety Code, requires regional air districts that do not attain state ozone standards to prepare ozone plans. To that end, the 2017 Plan serves to update the most recent Bay Area ozone plan, the 2010 Clean Air Plan. The Health & Safety Code requires that ozone plans
Protecting Impacted Communities and Promoting Social Equity
To protect public health and promote social equi-ty, the 2017 Plan focuses on reducing population exposure to air pollutants throughout the region. The plan places a special emphasis on protecting communities and populations that are most vul-nerable to the effects of air pollution, with a long-range goal to eliminate disparities in exposure to air pollution across communities. The air District initiated its Community air risk evaluation (Care) program in 2004 to identify and assist communities and populations that are most impacted by air pol-lution. Communities with higher air pollution levels and worse health outcomes, for diseases affected by air pollution, are identified as impacted. The
The Air District initiated its Community Air Risk Evaluation
(CARE) program in 2004 to identify and assist communities
and populations that are most impacted by air pollution.
here and now. With the Bay area projected to add two million new residents over the next several decades, it will be more important than ever to continue reducing air pollution and improving air quality. Climate change, which is already affecting the Bay area, represents a profound threat to our health and well-being over the long-term. Since pollutants that impact the air and the climate are often emitted by the same sources, emission con-trol programs will provide co-benefits in reducing both types of pollutants.
in pursuit of these goals, the 2017 Plan has sever-al complementary objectives:
● Update the Bay area ozone plan (i.e., the Bay area 2010 Clean air Plan) pursuant to the requirements of the California Health and Safety Code;
● reduce population exposure to harmful air pollutants, especially in vulnerable communi-ties and populations; and
● Protect the climate through a comprehensive regional climate protection strategy.
Chapter 1 purpose and Vision
1/4 Bay area air Quality ManageMent District | Clean air Plan 2017
air District has worked to reduce health risks by targeting its regulatory and enforcement efforts in these communities, providing funding for projects to reduce emissions within these communities, and developing partnerships with local community groups, as described in Chapter 4. in implement-ing the 2017 Plan, the air District will build upon these efforts with the goal of eliminating disparities among Bay area communities in health risks from toxic air contaminants.
The air District will also work to ensure that the transition to a post-carbon economy provides eq-uitable outcomes for all Bay area communities and that all socioeconomic groups share in the econom-ic opportunities and environmental benefits of this transformation. For example, the air District has been working to ensure that impacted communities in the Bay Area benefit from efforts to reduce GHG emissions and receive an equitable share of fund-ing from programs such as the state’s Greenhouse Gas reduction Fund, as discussed on page 1-14.
Protecting the Climate
The air District has been working for more than a decade to reduce GHG emissions and protect the climate, demonstrating leadership in showing how a regional air quality agency can take meaningful action to address climate change. With the 2017 Plan, the air District is taking its climate protection program to a new level. There are compelling rea-sons, both practical and ethical, for the air District to take aggressive action to reduce emissions of greenhouse gases and protect the climate.
Climate change is real: There is an overwhelm-ing scientific consensus that the climate is chang-ing due to human-produced emissions of carbon dioxide and other greenhouse gases. every week brings new reports about the increasing speed and severity of climate change, and the widening range of its impacts.
Climate change will affect air quality and en-danger public health: The two key goals of this plan—protecting public health and protecting the climate—are closely related. Climate change will directly affect air quality, as described in Chapter 3. in addition, it will cause a wide range of effects
…the greenhouse gas footprint— the amount of GHGs embedded
in the goods, services and activities that we consume in our
daily lives—of the average Bay Area resident is much higher
than the global average.
on the environment and ecosystems that sustain us—including water supply, sea level and biologi-cal diversity—which will also impact public health. Therefore, it is essential to protect the climate in order to protect public health.
Vulnerable populations will suffer the most, both in the Bay Area and at the global scale: The negative public health effects from climate change will fall most heavily on the Bay area communities and populations that are already most heavily impacted by air pollution. We must address climate change to protect our most vul-nerable communities and promote social equity.
Climate change poses great risks to the Bay Area: its coastal location and benign Mediterra-nean climate make the Bay area a great place to live. But they also make the region highly vulner-able to the impacts of climate change, such as sea level rise (flooding) and changes in precipita-tion patterns (drought, decreasing water supply). These vulnerabilities will endanger key transpor-tation infrastructure (highways, airports, seaports) and power distribution systems, imposing signifi-cant economic costs on the region.
We are part of the problem: The Bay area is rel-atively affluent. As a result, the greenhouse gas footprint—the amount of GHGs embedded in the goods, services and activities that we consume in our daily lives—of the average Bay area resident is much higher than the global average. Since
Chapter 1 purpose and Vision
Bay area air Quality ManageMent District | Clean air Plan 2017 1/5
CUltivating FUtUre Climate leaders
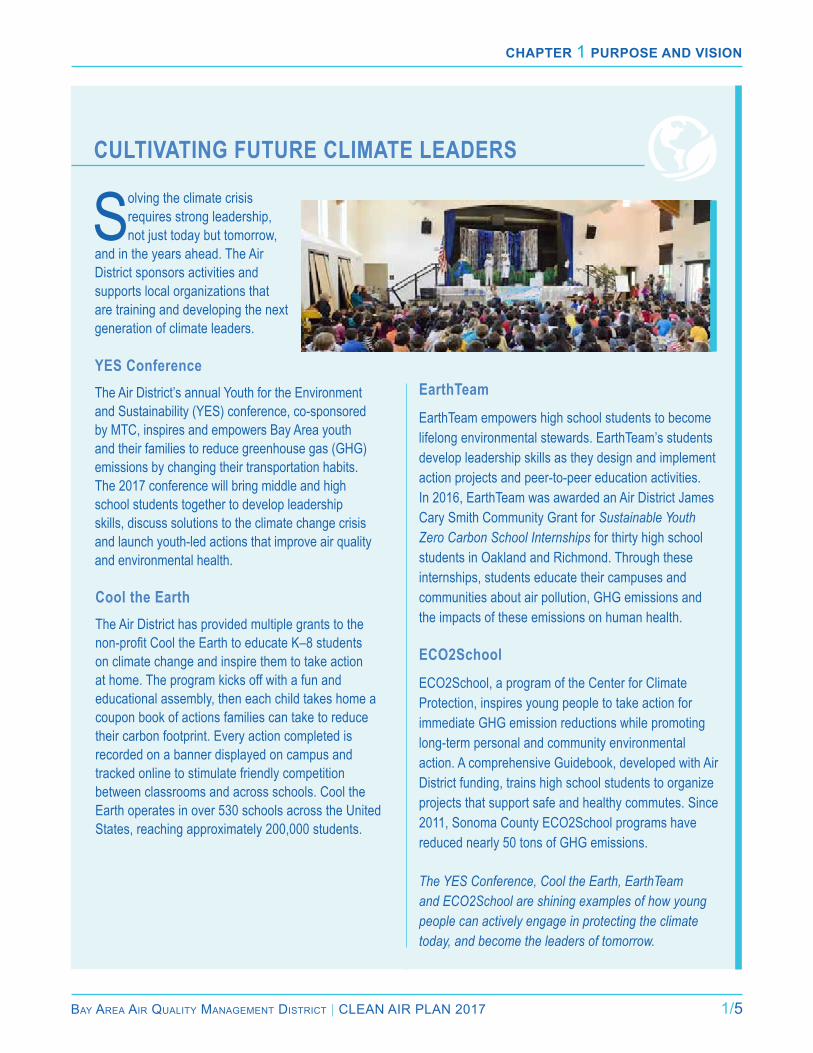
earthteamEarthTeam empowers high school students to become lifelong environmental stewards. EarthTeam’s students develop leadership skills as they design and implement action projects and peer-to-peer education activities. In 2016, EarthTeam was awarded an Air District James Cary Smith Community Grant for Sustainable Youth Zero Carbon School Internships for thirty high school students in Oakland and Richmond. Through these internships, students educate their campuses and communities about air pollution, GHG emissions and the impacts of these emissions on human health.
eCO2schoolECO2School, a program of the Center for Climate Protection, inspires young people to take action for immediate GHG emission reductions while promoting long-term personal and community environmental action. A comprehensive Guidebook, developed with Air District funding, trains high school students to organize projects that support safe and healthy commutes. Since 2011, Sonoma County ECO2School programs have reduced nearly 50 tons of GHG emissions.
The YES Conference, Cool the Earth, EarthTeam and ECO2School are shining examples of how young people can actively engage in protecting the climate today, and become the leaders of tomorrow.
Solving the climate crisis requires strong leadership, not just today but tomorrow,
and in the years ahead. The Air District sponsors activities and supports local organizations that are training and developing the next generation of climate leaders.
yes ConferenceThe Air District’s annual Youth for the Environment and Sustainability (YES) conference, co-sponsored by MTC, inspires and empowers Bay Area youth and their families to reduce greenhouse gas (GHG) emissions by changing their transportation habits. The 2017 conference will bring middle and high school students together to develop leadership skills, discuss solutions to the climate change crisis and launch youth-led actions that improve air quality and environmental health.
Cool the earthThe Air District has provided multiple grants to the non-profit Cool the Earth to educate K–8 students on climate change and inspire them to take action at home. The program kicks off with a fun and educational assembly, then each child takes home a coupon book of actions families can take to reduce their carbon footprint. Every action completed is recorded on a banner displayed on campus and tracked online to stimulate friendly competition between classrooms and across schools. Cool the Earth operates in over 530 schools across the United States, reaching approximately 200,000 students.

Chapter 1 purpose and Vision
1/6 Bay area air Quality ManageMent District | Clean air Plan 2017
we emit a disproportionate amount of global GHG emissions, we bear a clear responsibili-ty to take action to reduce these emissions. in a cruel irony, people and populations who are least responsible for contributing to this problem will be most vulnerable to the impacts of climate change. in addition, we have a moral obligation to act now in order to protect our children and future generations.
Bay Area residents support and expect tangi-ble action to protect the climate: a recent poll found that a solid majority of Bay area residents believe that climate change is a serious threat to California’s future and that 75 percent of Bay area residents want governmental action to pro-tect the climate.3
Our actions can make a difference: although climate change is already occurring, the course that it will take is not predetermined. By acting now, we can reduce global warming and mitigate the impacts of climate change, in the near and long term.
The Bay Area can provide leadership: The Bay area has a long and rich tradition of environmen-tal stewardship, technical innovation and policy leadership. although we cannot solve the climate change challenge on our own, we can provide leadership. By fostering and incubating innova-tive policies, programs and technologies, we can provide an example and inspire action across the nation and around the world.
a Vision for 2050
Confronting climate change will require pro-found changes in the way we live, work, and travel. if we can see the goal, by visualizing
what the Bay area may look like in a post-carbon year 2050, we can better discern the policies and actions that we need to take in the near to mid-term to embark on the transformation. The 2050 vision for the Bay area sketched below envisions a thriving region with clean air, a stable climate, a robust natural environment, and a prosperous and sustainable economy.
To achieve the deep emission reductions needed to protect public health and the climate, we must address fundamental causes and focus on the core activities we engage in—as a region and in-dividually. These core activities include where and how we live, how we travel, what we produce, and how and what we consume. although we cannot predict the future, the section below attempts to describe how the Bay area will need to look and to function in year 2050 in order to achieve our long-term climate protection and clean air goals.
We must ensure that the transition to a post-car-bon economy provides equitable outcomes for all Bay area communities and residents. any costs or burdens should be shared equitably. But, more importantly, we must also ensure that all Bay area residents share in the benefits and promise of the new energy economy, as manifested in cleaner air, improved public health, good jobs and an en-hanced quality of life.
Chapter 1 purpose and Vision
Bay area air Quality ManageMent District | Clean air Plan 2017 1/7
Where We Live and Work: Buildings
By 2050 the buildings in which we live, work, learn, shop, and socialize will be energy efficient, and they will be heated, cooled, and powered by re-newable energy.
The buildings that serve as our homes, offices, schools, stores and other institutions are a major source of greenhouse gas emissions and other air pollutants. This includes both direct emissions, when natural gas is burned in furnaces and water heaters, and indirect emissions when electricity is used for lighting, appliances, heating or cool-ing. Wood burning in buildings is a major source of harmful particulate matter and black carbon. Buildings also indirectly contribute to emissions from the transportation sector when they are lo-cated far away from services and transit options, thus accessible only by driving.
in order to reach our climate protection and clean air goals, we must greatly reduce both direct and indirect emissions from buildings by changing how our buildings function and how they are powered:
● Buildings will need to be energy efficient and powered by clean energy
● Wood burning will need to have been eliminated
Eliminate the Use of Fossil Fuels in Buildings
Greenhouse gas emissions from all buildings, both existing and new, will need to be near zero by 2050. in order to achieve this ambitious goal,
The buildings that serve as our homes, offices, schools, stores, and other institutions
are a major source of greenhouse gas emissions
and other air pollutants.
a complete energy system approach to building construction and operation must be pursued, including:
● Maximize energy efficiency—California law (SB 350, 2015) requires a doubling of energy efficiency in all existing buildings in California by 2030. Most older buildings do not meet cur-rent energy standards, so retrofits to maximize the energy efficiency to reduce the energy con-sumption of every building is an important first step. lower income households spend a large portion of their income to power their homes. Increasing energy efficiency in existing build-ings, particularly multi-family buildings, is a key strategy for increasing the disposable income and enhancing the well-being of low-income households in the Bay area.
● ensure low- or zero-carbon electricity— Producing electricity from renewable ener-gy or very low-carbon sources is requisite for large-scale fuel switching from natural gas to electricity. This will be accomplished in part by decreasing the carbon content of grid- delivered electricity (see more on this in “What We Produce” below), and also by increasing the portion of our energy needs that are met by on-site renewable energy such as rooftop solar.
● Develop energy storage technologies—Be-cause of the intermittent nature of renewable power sources like solar and wind, developing advanced battery technology or other energy storage technologies that allows for significant onsite electricity storage is critical to decarbon-izing the buildings sector.
● Switch from natural gas to electricity and re-newable energy—We need to switch from nat-ural gas to low-carbon electricity or renewable energy for space and water heating, clothes drying and cooking. in addition to grid-based electricity, these end uses can also be pow-ered by onsite renewable energy such as ground source heat pumps, solar photovoltaic and solar thermal. Biogas can be used as a replacement for natural gas in buildings and in commercial and industrial processes.
To achieve the 2050 vision, the entire building stock will need to be as low-carbon as possi-ble. This is easier for new construction than for
Chapter 1 purpose and Vision
1/8 Bay area air Quality ManageMent District | Clean air Plan 2017
existing buildings, since it is less expensive to construct buildings with on-site renewable ener-gy and cutting-edge energy efficiency technology than it is to retrofit existing buildings to the same energy performance level. Because it will be very difficult to achieve near-zero carbon emis-sions from existing buildings, all new construction should be zero-net carbon. This vision is consis-tent with state goals that all new residential con-struction in California should be zero net energy by 2020, and all new commercial construction in California should be zero net energy by 2030.4
Eliminate Wood Burning
During the winter, smoke from residential wood burning is the leading source of fine particulate matter (PM2.5), the most harmful air pollutant in the Bay area. Wood smoke is also a major source of black carbon, contributing to climate change. res-idential wood burning has been reduced by nearly 60 percent since the air District adopted rule 6-3 and implemented its mandatory winter Spare the air program in 2008. However, to protect public health and the climate, we need to eliminate all wood burning.
How and Where We Travel: Transportation
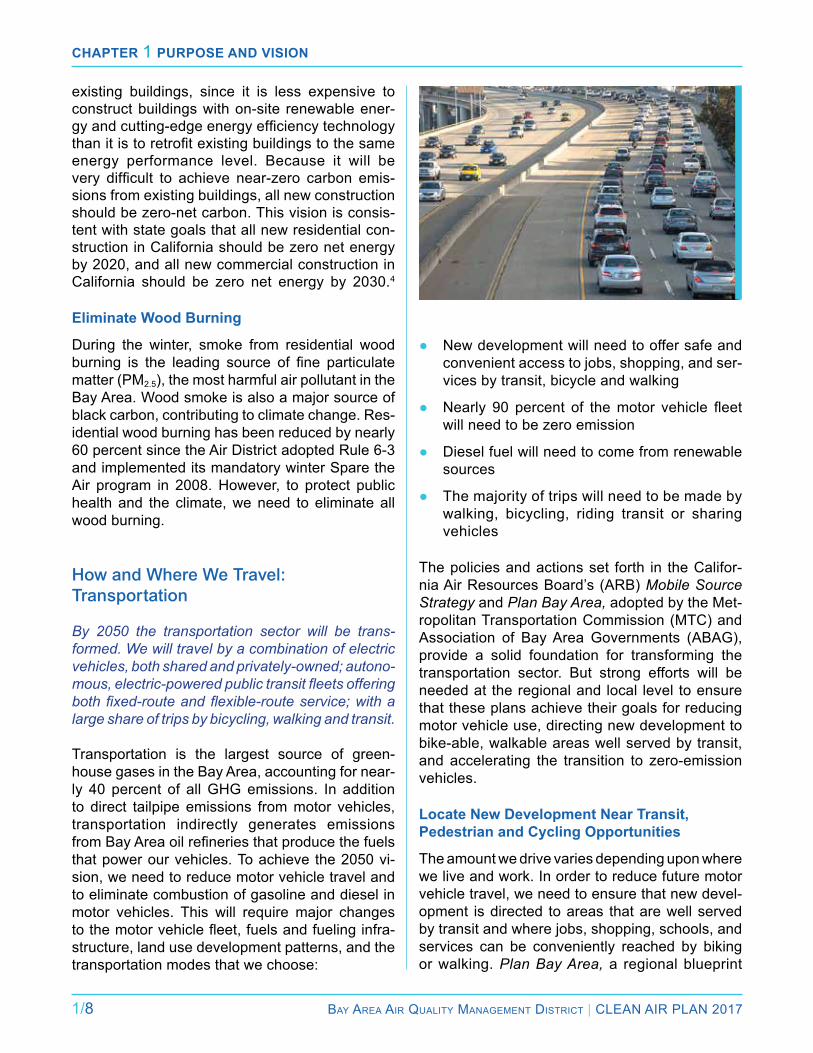
By 2050 the transportation sector will be trans-formed. We will travel by a combination of electric vehicles, both shared and privately-owned; autono-mous, electric-powered public transit fleets offering both fixed-route and flexible-route service; with a large share of trips by bicycling, walking and transit.
Transportation is the largest source of green-house gases in the Bay area, accounting for near-ly 40 percent of all GHG emissions. in addition to direct tailpipe emissions from motor vehicles, transportation indirectly generates emissions from Bay Area oil refineries that produce the fuels that power our vehicles. To achieve the 2050 vi-sion, we need to reduce motor vehicle travel and to eliminate combustion of gasoline and diesel in motor vehicles. This will require major changes to the motor vehicle fleet, fuels and fueling infra-structure, land use development patterns, and the transportation modes that we choose:
● new development will need to offer safe and convenient access to jobs, shopping, and ser-vices by transit, bicycle and walking
● Nearly 90 percent of the motor vehicle fleet will need to be zero emission
● Diesel fuel will need to come from renewable sources
● The majority of trips will need to be made by walking, bicycling, riding transit or sharing vehicles
The policies and actions set forth in the Califor-nia air resources Board’s (arB) Mobile Source Strategy and Plan Bay Area, adopted by the Met-ropolitan Transportation Commission (MTC) and association of Bay area Governments (aBaG), provide a solid foundation for transforming the transportation sector. But strong efforts will be needed at the regional and local level to ensure that these plans achieve their goals for reducing motor vehicle use, directing new development to bike-able, walkable areas well served by transit, and accelerating the transition to zero-emission vehicles.
Locate New Development Near Transit, Pedestrian and Cycling Opportunities
The amount we drive varies depending upon where we live and work. in order to reduce future motor vehicle travel, we need to ensure that new devel-opment is directed to areas that are well served by transit and where jobs, shopping, schools, and services can be conveniently reached by biking or walking. Plan Bay Area, a regional blueprint

Chapter 1 purpose and Vision
Bay area air Quality ManageMent District | Clean air Plan 2017 1/9
for how the Bay area could develop over the next twenty-five years, focuses 70 percent of all new housing in “priority development areas” near tran-sit in order to reduce vehicle trips in favor of public transit, biking and walking.5 Further progress will be needed to achieve long range goals. By 2050, all new development will need to occur in locations that offer safe and convenient transit, pedestrian and cycling opportunities in order to minimize the need for auto travel. in addition, we will need to retrofit existing neighborhoods to ensure that all Bay area residents have safe access to cycling, walking and transit.
Reduce Motor Vehicle Travel
Plan Bay Area lays out a comprehensive strate-gy to reduce motor vehicle travel on a per cap-ita basis by improving the region’s public transit network; promoting bicycling, walking, and ride- sharing; and directing new development to areas well served by transit. However, as regional popu-lation and employment grows over the next several decades, it is likely that we will need to strengthen these efforts. a mix of land use, parking, transit and transportation demand management strategies implemented by regional agencies and local com-munities, such as Safe routes to School and Tran-sit, “last-mile” connector services, parking pricing policies, and more are needed on a large scale.
Major change is already reshaping the transpor-tation system, with bigger disruption looming on
In order to reduce future motor vehicle travel, we need to
ensure that new development is directed to areas that are well
served by transit and where jobs, shopping, schools, and services can be conveniently reached by biking or walking.
the horizon. new services, products, and technol-ogies such as car-sharing, transportation network companies (e.g., Uber and lyft), and self-driving vehicles are likely to transform the way we travel in the coming decades. How these developments will affect travel demand and vehicle emissions is not yet clear. However, it will be imperative for public agencies to guide these efforts so as to en-sure that they benefit the environment as well as enhance personal mobility.
Commute trips account for a large share of motor vehicle travel (and traffic congestion) so reducing commute trips will be key to decreasing total trav-el demand. Demographic, social, and technologi-cal changes will affect how and where we work in 2050. economic growth, plus the likelihood that people will work longer as average lifespan in-creases, may increase the Bay area workforce. However, as advances in communication tech-nologies enhance connectivity and lessen the need for direct contact in the workplace, Bay area employers and employees are likely to embrace a more flexible work culture and structure. Com-mute travel in 2050 may decrease as more Bay area residents work from home, or walk or bike to co-work spaces in their neighborhood, instead of driving to a more distant office on a daily basis.
Promote Zero-Emission Vehicles and Renewable Fuels
The state’s Mobile Source Strategy provides an ambitious approach for reducing air pollutants and GHGs from cars and trucks by electrifying the fleet and promoting the use of renewable fuels, as well as advocating for more stringent federal emission limits on ships and locomotives. To achieve the 2050 GHG goal, the air resources Board projects that 87 percent of the light-duty vehicle fleet in California will need to be zero emission. The air District’s extensive grant and incentive program for plug-in electric and hydrogen fuel cell vehicles will help move the region toward this goal. Public agencies can lead the way in this effort by con-verting 90 percent of their fleets to zero-emission vehicles by 2050.
We will also need to apply the innovations and progress achieved to date in our light-duty fleet throughout the transportation system—to trucks,
Chapter 1 purpose and Vision
1/10 Bay area air Quality ManageMent District | Clean air Plan 2017
off-road vehicles and railroads. all rail lines, both passenger and freight, will need to be electrified by 2050. This shift toward electrification of the transportation sector will require significant public and private investment, as well as new technolo-gies to improve battery efficiency and to develop renewable forms of diesel and other liquid fuels.
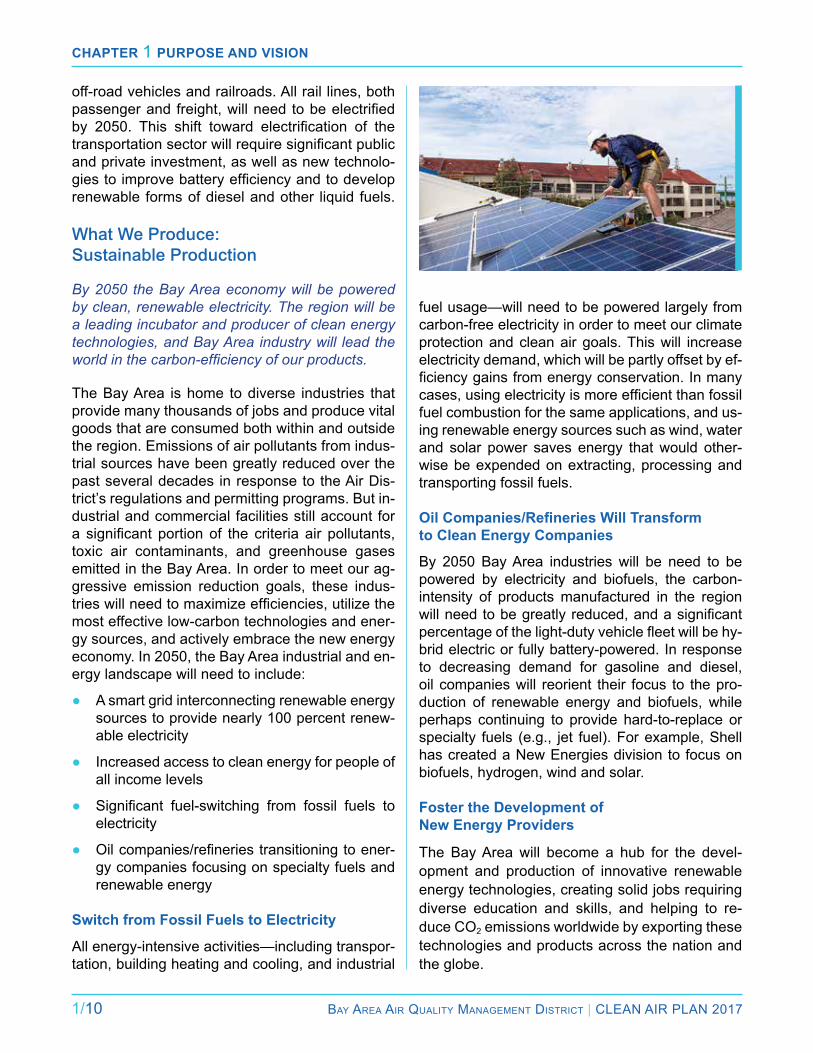
What We Produce: Sustainable Production
By 2050 the Bay Area economy will be powered by clean, renewable electricity. The region will be a leading incubator and producer of clean energy technologies, and Bay Area industry will lead the world in the carbon-efficiency of our products.
The Bay area is home to diverse industries that provide many thousands of jobs and produce vital goods that are consumed both within and outside the region. emissions of air pollutants from indus-trial sources have been greatly reduced over the past several decades in response to the air Dis-trict’s regulations and permitting programs. But in-dustrial and commercial facilities still account for a significant portion of the criteria air pollutants, toxic air contaminants, and greenhouse gases emitted in the Bay area. in order to meet our ag-gressive emission reduction goals, these indus-tries will need to maximize efficiencies, utilize the most effective low-carbon technologies and ener-gy sources, and actively embrace the new energy economy. in 2050, the Bay area industrial and en-ergy landscape will need to include:
● a smart grid interconnecting renewable energy sources to provide nearly 100 percent renew-able electricity
● increased access to clean energy for people of all income levels
● Significant fuel-switching from fossil fuels to electricity
● Oil companies/refineries transitioning to ener-gy companies focusing on specialty fuels and renewable energy
Switch from Fossil Fuels to Electricity
all energy-intensive activities—including transpor-tation, building heating and cooling, and industrial
fuel usage—will need to be powered largely from carbon-free electricity in order to meet our climate protection and clean air goals. This will increase electricity demand, which will be partly offset by ef-ficiency gains from energy conservation. In many cases, using electricity is more efficient than fossil fuel combustion for the same applications, and us-ing renewable energy sources such as wind, water and solar power saves energy that would other-wise be expended on extracting, processing and transporting fossil fuels.
Oil Companies/Refineries Will Transform to Clean Energy Companies
By 2050 Bay area industries will be need to be powered by electricity and biofuels, the carbon- intensity of products manufactured in the region will need to be greatly reduced, and a significant percentage of the light-duty vehicle fleet will be hy-brid electric or fully battery-powered. in response to decreasing demand for gasoline and diesel, oil companies will reorient their focus to the pro-duction of renewable energy and biofuels, while perhaps continuing to provide hard-to-replace or specialty fuels (e.g., jet fuel). For example, Shell has created a new energies division to focus on biofuels, hydrogen, wind and solar.
Foster the Development of New Energy Providers
The Bay area will become a hub for the devel-opment and production of innovative renewable energy technologies, creating solid jobs requiring diverse education and skills, and helping to re-duce CO2 emissions worldwide by exporting these technologies and products across the nation and the globe.
Chapter 1 purpose and Vision
Bay area air Quality ManageMent District | Clean air Plan 2017 1/11
100 Percent Renewable Power Supply
Studies have found that achieving high levels of renewable-based electricity (80–100 percent) by 2050 is economically and technologically fea-sible for the U.S. and California.6 achieving a stable power supply with 100 percent renewable resources by 2050 will require advanced technol-ogies such as demand-response management (a “smart grid” to integrate diverse sources of re-newable energy), electricity storage (batteries), or using excess electricity for hydrogen production. These technologies are not yet advanced enough to support a transition to 100 percent renewable energy today. However, with directed investment, continued research and development of battery and other technologies, and supportive policy in-terventions such as carbon pricing, the Bay area could have carbon-free electricity by 2050.
Smart Grid
The development of a “smart grid” will allow for efficient integration of new low-carbon power sources, as well as help to reduce energy de-mand by allowing for “real-time” pricing based upon the relationship between electricity supply and demand.
Increased Access to Clean Energy
Transitioning away from fossil fuel-based energy will reduce exposure to harmful air pollutants as-sociated with power generation and oil refining. access to clean energy will need to be available to all Bay area residents, not just those who can afford to buy an electric car or put solar panels on their roofs. Programs like community choice en-ergy and utility-sponsored clean energy offerings are proliferating in the Bay area and will play a major role in helping the region achieve a 100 per-cent clean energy supply by 2050. The programs can also build the local economy by developing local sources of renewable energy, creating local jobs and stimulating local investment.
What We Consume: Conscientious Consumption
By 2050 Bay Area residents will need to develop a low-carbon lifestyle. We will greatly reduce our per-
sonal GHG consumption (our “GHG footprint”) by driving electric vehicles, living in zero net-energy homes, eating low-carbon foods, and purchas-ing goods and services with low carbon content. Waste will be greatly reduced, any waste products will be re-used or recycled, and all organic waste will be composted and put to productive use.
Bay area residents must play a critical role in achieving our air quality and GHG reduction tar-gets. The decisions we make as individual con-sumers—about which goods and services we pur-chase, how and where we travel, and what foods we eat—have a great impact on our “GHG foot-print”, both at the household and regional scale.7
The air District has developed a consump-tion-based GHG inventory (see Chapter 3) to help people understand the most effective choic-es they can make to reduce their carbon foot-print.8 The production and consumption of food provides a good example of how we can take simple steps as “conscientious consumers” to reduce GHG emissions on a daily basis. large amounts of GHGs are emitted in the production, processing, and distribution of the food that we eat. Therefore, we need to consider all aspects of food production, consumption and disposal in choosing what we eat with “conscientious con-sumption,” and by 2050:
The decisions we make as individual consumers—about which goods and services we purchase, how and where we travel, and what foods we eat —have a great impact on our
“GHG footprint”, both at the household and regional scale.
Chapter 1 purpose and Vision
1/12 Bay area air Quality ManageMent District | Clean air Plan 2017
● Bay area residents will reduce their consump-tion of carbon-intensive foods and adopt a low-carbon diet for at least some portion of their meals
● Food waste will need to be reduced by 75 percent
● all organic matter will need to be diverted from the waste stream and put to productive use
Low-GHG Diet
reducing the energy and GHG intensity of diets begins at the point of food production, at Bay area farms, dairies, etc. We can reduce emissions of carbon dioxide and other pollutants from the ag-riculture sector by replacing diesel-fueled equip-ment (e.g., pumps, tractors, trucks) with cleaner and more efficient alternatives, such as electricity and biofuels.
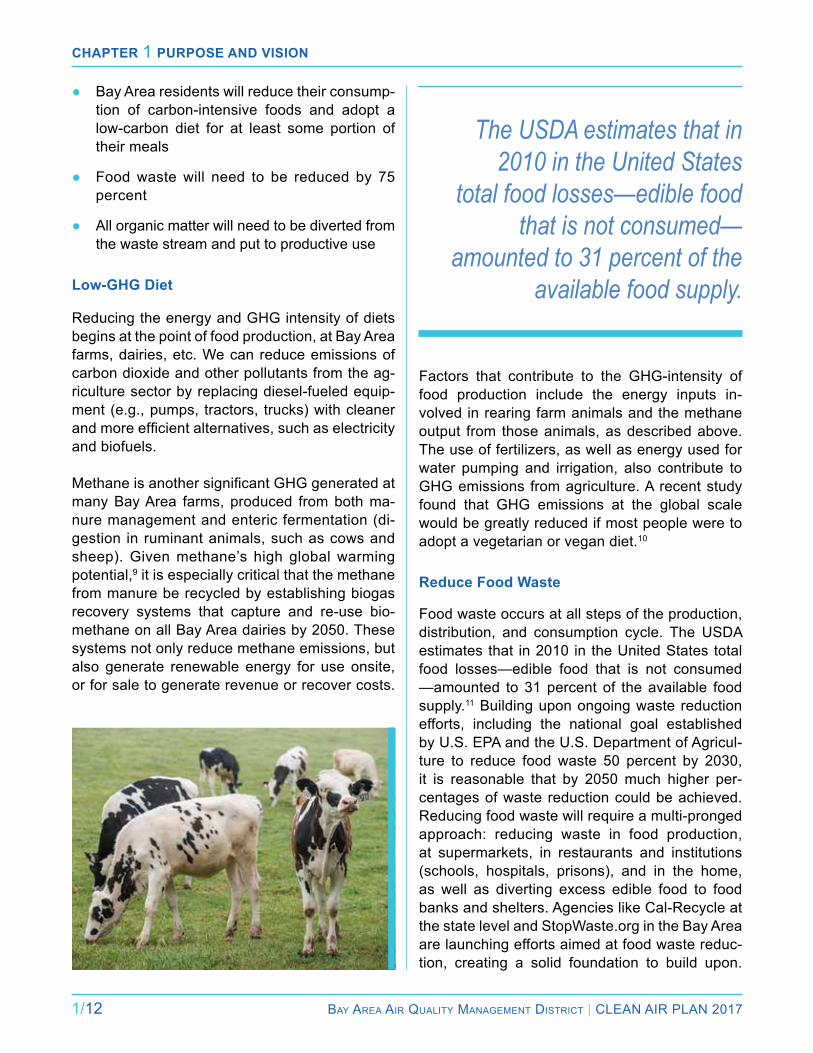
Methane is another significant GHG generated at many Bay area farms, produced from both ma-nure management and enteric fermentation (di-gestion in ruminant animals, such as cows and sheep). Given methane’s high global warming potential,9 it is especially critical that the methane from manure be recycled by establishing biogas recovery systems that capture and re-use bio-methane on all Bay area dairies by 2050. These systems not only reduce methane emissions, but also generate renewable energy for use onsite, or for sale to generate revenue or recover costs.
Factors that contribute to the GHG-intensity of food production include the energy inputs in-volved in rearing farm animals and the methane output from those animals, as described above. The use of fertilizers, as well as energy used for water pumping and irrigation, also contribute to GHG emissions from agriculture. a recent study found that GHG emissions at the global scale would be greatly reduced if most people were to adopt a vegetarian or vegan diet.10
Reduce Food Waste
Food waste occurs at all steps of the production, distribution, and consumption cycle. The USDa estimates that in 2010 in the United States total food losses—edible food that is not consumed —amounted to 31 percent of the available food supply.11 Building upon ongoing waste reduction efforts, including the national goal established by U.S. ePa and the U.S. Department of agricul-ture to reduce food waste 50 percent by 2030, it is reasonable that by 2050 much higher per-centages of waste reduction could be achieved. reducing food waste will require a multi-pronged approach: reducing waste in food production, at supermarkets, in restaurants and institutions (schools, hospitals, prisons), and in the home, as well as diverting excess edible food to food banks and shelters. agencies like Cal-recycle at the state level and StopWaste.org in the Bay area are launching efforts aimed at food waste reduc-tion, creating a solid foundation to build upon.
The USDA estimates that in 2010 in the United States
total food losses—edible food that is not consumed—
amounted to 31 percent of the available food supply.
Chapter 1 purpose and Vision
Bay area air Quality ManageMent District | Clean air Plan 2017 1/13
Putting Organic Materials to Productive Use
in 2050, any and all food waste that cannot be put to edible use will need to be composted or oth-erwise put to productive use. in addition to pre-venting methane emissions at landfills, composted waste will be available for use as a soil amend-ment at a local or larger scale. Many farms also generate vegetative material as a by-product of food production. in current practices, some of this material is left in place to decay, some is sent to landfills, and some is burned—resulting in GHG emissions. This waste material can be redirected to create compost for use as a soil amendment in agricultural and rangelands, augmenting the car-bon sequestration abilities of these lands.
Achieving the Vision
The text above outlines an ambitious and opti-mistic vision for achieving a transformation to a post-carbon Bay area in 2050. in addition to improving air quality and reducing emissions of greenhouse gases, this vision would provide a wide range of co-benefits in terms of economic development, enhanced mobility, improved diet and health, etc. The air District and its partner agencies cannot achieve this vision on their own, of course. a transformation of this magnitude will require a concerted effort by all Bay area insti-tutions—including the business community, the financial sector, educational institutions—and by Bay area residents.
Government: Government agencies, includ-ing the air District, should play a key role by es-tablishing targets, defining the legal and policy framework, and helping to support and fund the development of new technologies and the infra-structure needed to support the vision. Collabo-ration among government agencies, each play-ing an appropriate role commensurate with its authority and expertise, will be essential. One important function that government could per-form would be to set a price on carbon by imple-menting a carbon tax or fee (as described in the text box below). Government also must work to ensure that the transition to a carbon-free future promotes social equity.
Educational institutions: Schools and universi-ties will need to engage in scientific and techni-cal research, collaborate with the private sector to drive technological innovation, and provide the Bay area workforce with the training and skills that will be required by emerging industries.
Business and finance: The transformation to a post-carbon economy will require major tech-nological innovation, large-scale investments to bring new technologies and products to market, and marketing to consumers. investment must be directed toward renewable energy, energy ef-ficiency technologies, and zero-emission vehicles to achieve the 2050 vision.
Bay Area residents: The choices that we make in terms of where we live, how we travel, what we eat, and what goods and services we consume all have a direct effect on our individual GHG footprint, as discussed in the 2050 vision above. To achieve the transformation to a low-carbon economy, Bay area residents will have to em-brace new technologies, new neighborhood de-signs, new ways of traveling, and consider the GHG impacts of the choices that we make as consumers.
Meeting the Challenge
The transformation needed to achieve the 2050 vision of a post-carbon economy provides a great opportunity to protect our quality of life and expand the Bay area economy. But it also rep-resents a formidable challenge. We have made great progress in improving air quality over the past several decades, even while the Bay area’s population and economy have grown significant-ly. However, the foundation of our recent prog-ress—cleaner fuels and pollution control devices on tailpipes and smokestacks—did not require fundamental changes in our energy sources or economy. reducing greenhouse gas emissions is a bigger challenge, requiring fundamental solu-tions to reduce demand for fossil fuels and de-velop new energy sources. as we move forward to implement the 2050 vision, we need to ensure that our response to this challenge benefits all Bay area communities, particularly disadvan-taged communities.
Chapter 1 purpose and Vision
1/14 Bay area air Quality ManageMent District | Clean air Plan 2017
pUtting a priCe On CarBOn
a significant revenue stream to fund projects and programs that will reduce GHG emissions in the near term, as well as research and development of new technologies needed to accelerate the replacement of fossil fuels. Putting a price on carbon could also help to stimulate investment in clean technologies by reducing volatility in the price of fossil fuels, thus providing a more stable climate for investment in alternative fuels and new energy technologies.
The state of California has implemented a carbon pricing mechanism, known as the “Cap-and-Trade” program, which is designed to reduce CO2 emissions from key sources. The impact of Cap-and-Trade on Bay Area GHG emissions is discussed in Chapter 4. In its December 2016 Discussion Draft 2030 Target Scoping Plan Update, the Air Resources Board discusses the potential effectiveness of several scenarios, including Cap-and-Trade and a carbon tax, to help achieve the state’s 2030 GHG reduction targets. As ARB continues to investigate various carbon pricing mechanisms, the Air District will closely follow, and seek to build upon, resulting state pricing initiatives.
Pricing is a powerful tool in our market-based economy. Most economists agree that implementing a broad-based price on carbon
would be the most efficient way to reduce GHG emissions. A carbon tax or fee can be structured to reflect the amount of GHG emissions embedded in the production of the goods and services we consume.
A carbon fee can encourage producers to reduce the carbon content of their products, while also encouraging consumers to make low-carbon choices. A well-designed carbon-pricing system can also promote social equity. A carbon fee could have a progressive impact from a tax-policy standpoint, since the average household GHG footprint is highly correlated with household income; e.g., low-income households generally have a relatively small carbon footprint. The revenues from a carbon tax could be used to fully offset costs for low-income households, as well as to fund clean energy or clean vehicle projects in low-income communities.
In addition to using the power of the market to reduce GHG emissions, carbon pricing can provide
Fossil fuels offer high-energy density at a low cost to the consumer, and they are relatively easy to produce, deliver and store. and, as recent po-litical developments at the national scale demon-strate, there is enormous economic and political power vested in the current energy system. Cli-mate leadership from California and the Bay area is thus more important than ever. Several of the key challenges we face in critical sectors include:
New energy technologies: Despite great prog-ress in recent years in developing new ener-gy technologies and in driving down their pro-
duction and installation costs, we still need big breakthroughs in the production and storage of energy from renewable sources to advance to a post-carbon energy system. The development of new energy technologies requires significant cap-ital investment and time. Government-sponsored research can play a critical role in incubating new technologies; however, attracting private sector financing to move from basic R&D to commer-cial scale production is a challenge. Government agencies, such as the air District, may be able to play a catalytic role by funding joint research with industry and implementing pilot projects that demonstrate new technologies at scale.
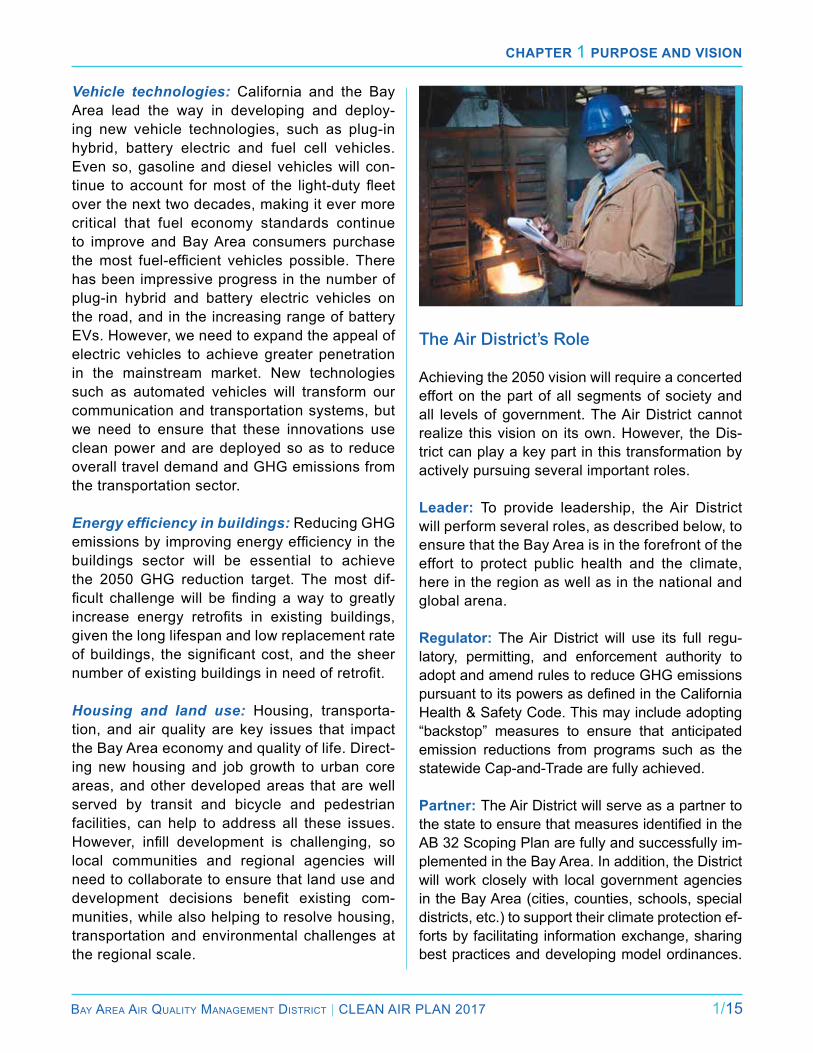
Chapter 1 purpose and Vision
Bay area air Quality ManageMent District | Clean air Plan 2017 1/15
Vehicle technologies: California and the Bay area lead the way in developing and deploy-ing new vehicle technologies, such as plug-in hybrid, battery electric and fuel cell vehicles. even so, gasoline and diesel vehicles will con-tinue to account for most of the light-duty fleet over the next two decades, making it ever more critical that fuel economy standards continue to improve and Bay area consumers purchase the most fuel-efficient vehicles possible. There has been impressive progress in the number of plug-in hybrid and battery electric vehicles on the road, and in the increasing range of battery eVs. However, we need to expand the appeal of electric vehicles to achieve greater penetration in the mainstream market. new technologies such as automated vehicles will transform our communication and transportation systems, but we need to ensure that these innovations use clean power and are deployed so as to reduce overall travel demand and GHG emissions from the transportation sector.
Energy efficiency in buildings: reducing GHG emissions by improving energy efficiency in the buildings sector will be essential to achieve the 2050 GHG reduction target. The most dif-ficult challenge will be finding a way to greatly increase energy retrofits in existing buildings, given the long lifespan and low replacement rate of buildings, the significant cost, and the sheer number of existing buildings in need of retrofit.
Housing and land use: Housing, transporta-tion, and air quality are key issues that impact the Bay area economy and quality of life. Direct-ing new housing and job growth to urban core areas, and other developed areas that are well served by transit and bicycle and pedestrian facilities, can help to address all these issues. However, infill development is challenging, so local communities and regional agencies will need to collaborate to ensure that land use and development decisions benefit existing com-munities, while also helping to resolve housing, transportation and environmental challenges at the regional scale.
The Air District’s Role
achieving the 2050 vision will require a concerted effort on the part of all segments of society and all levels of government. The air District cannot realize this vision on its own. However, the Dis-trict can play a key part in this transformation by actively pursuing several important roles.
Leader: To provide leadership, the air District will perform several roles, as described below, to ensure that the Bay area is in the forefront of the effort to protect public health and the climate, here in the region as well as in the national and global arena.
Regulator: The air District will use its full regu-latory, permitting, and enforcement authority to adopt and amend rules to reduce GHG emissions pursuant to its powers as defined in the California Health & Safety Code. This may include adopting “backstop” measures to ensure that anticipated emission reductions from programs such as the statewide Cap-and-Trade are fully achieved.
Partner: The air District will serve as a partner to the state to ensure that measures identified in the aB 32 Scoping Plan are fully and successfully im-plemented in the Bay area. in addition, the District will work closely with local government agencies in the Bay area (cities, counties, schools, special districts, etc.) to support their climate protection ef-forts by facilitating information exchange, sharing best practices and developing model ordinances.

Chapter 1 purpose and Vision
1/16 Bay area air Quality ManageMent District | Clean air Plan 2017
Health steward: The air District will continue to focus on protecting public health in communities that are most impacted by air pollution through its regulatory and permitting programs, air-quali-ty monitoring, funding, and other programs, with a goal of eliminating disparities in health risks among Bay area communities.
Educator: The air District will serve as an infor-mation source and educator. in this role, the Dis-trict will monitor Bay area atmospheric concentra-tions of key GHGs, and refine its GHG emissions inventory; provide information and guidance to local cities and counties to inform their climate action efforts; and educate Bay area residents about effective steps that they can take to reduce their GHG footprint.
Funder: Over the past five years, the air Dis-trict has provided nearly $250 million in funding through its grant programs for clean transpor-tation projects in the Bay area, thus reducing emissions and expanding markets for emerging technologies. The air District will continue to provide funding to accelerate the deployment of advanced technologies that improve ener-
gy efficiency, reduce demand for fossil fuels, increase the production of renewable energy, and promote low or zero-emission motor vehi-cles. Over the period 2017 through 2024, staff projects that the air District will provide approx-imately $288 million for additional projects to reduce emissions of air pollutants and GHGs in the Bay area through grant programs that it directly administers. in addition, the region may receive a significant amount of funding from the California Cap-and-Trade Program, assum-ing that the program is extended beyond 2020. Cap-and-Trade funds could provide significant capital to spur the innovation and growth in clean technology needed to achieve the 2050 vision for a post-carbon Bay area.
Advocate: The air District will play an advocacy role by encouraging partner agencies to pursue ambitious GHG reduction programs, encourag-ing the Bay area business community to devel-op and adopt transformative technologies, and supporting legislation to ensure that the air Dis-trict and its partner agencies have the necessary tools and authority to achieve the 2050 GHG re-duction targets.
advOCating tO ensUre that Bay area impaCted COmmUnities QUaliFy FOr Climate FUnding
tool that the state is currently using to identify disadvantaged communities (CalEnviroScreen) fails to include key Bay Area communities that the Air District has defined as impacted communities via its Community Air Risk Evaluation (CARE) program. To address this issue, the Air District has been engaging with the legislature, appropriate state agencies, regional agency partners, and community groups to advocate for revisions needed to ensure that all Bay Area impacted communities are eligible for GGRF revenues and receive an equitable share of funds through other state programs that are adopting disadvantaged community funding criteria.
The Air District is working to ensure that the effort to reduce GHG emissions and protect the climate will promote social equity and benefit all Bay
Area residents, especially in the communities most impacted by air pollution. Therefore, the Air District seeks to ensure that impacted communities in the Bay Area receive sufficient and equitable resources related to climate protection. For example, the Air District supports the intent of California law which requires that at least 25 percent of the funds from the state’s Greenhouse Gas Reduction Fund (GGRF) be distributed for projects within disadvantaged communities throughout California. However, the

Chapter 1 purpose and Vision
Bay area air Quality ManageMent District | Clean air Plan 2017 1/17
COntrOl strategy Based On a mUlti-pOllUtant apprOaCh
There is a sound scientific rationale for multi-pollutant planning. Air pollutants share common emission sources, and in many cases, common mitigation solutions. In addition, people inhale a combination of air pollutants in the same breath, and the combined effect of exposure to multiple pollutants may have a greater impact on health than exposure to an individual pollutant.
Multi-pollutant planning can maximize reductions across all air pollutants and climate pollutants, while minimizing any potential emission trade-offs. By analyzing air pollutants on the basis of their relative harm to public health, as well as their potency in heating the climate, multi-pollutant planning also provides a means to maximize public health and climate protection benefits. In addition, multi-pollutant planning can help to ensure that our efforts to improve air quality focus on reducing the most harmful air pollution in the communities that are most impacted by air pollution.
The Air District took a major step forward in its air quality planning by employing an integrated, multi-pollutant approach for the Bay Area 2010
Clean Air Plan that focused on reducing emissions of the air pollutants that are most harmful to public health. The control strategy in the 2017 Plan again uses a multi-pollutant approach to reduce emissions of the most important air pollutants and climate pollutants:
● Ground-level ozone and ozone precursors: ROG and NOx
● Particulate matter: both directly-emitted PM and secondary PM
● Key air toxics, such as diesel PM and benzene, and
● Key greenhouse gases
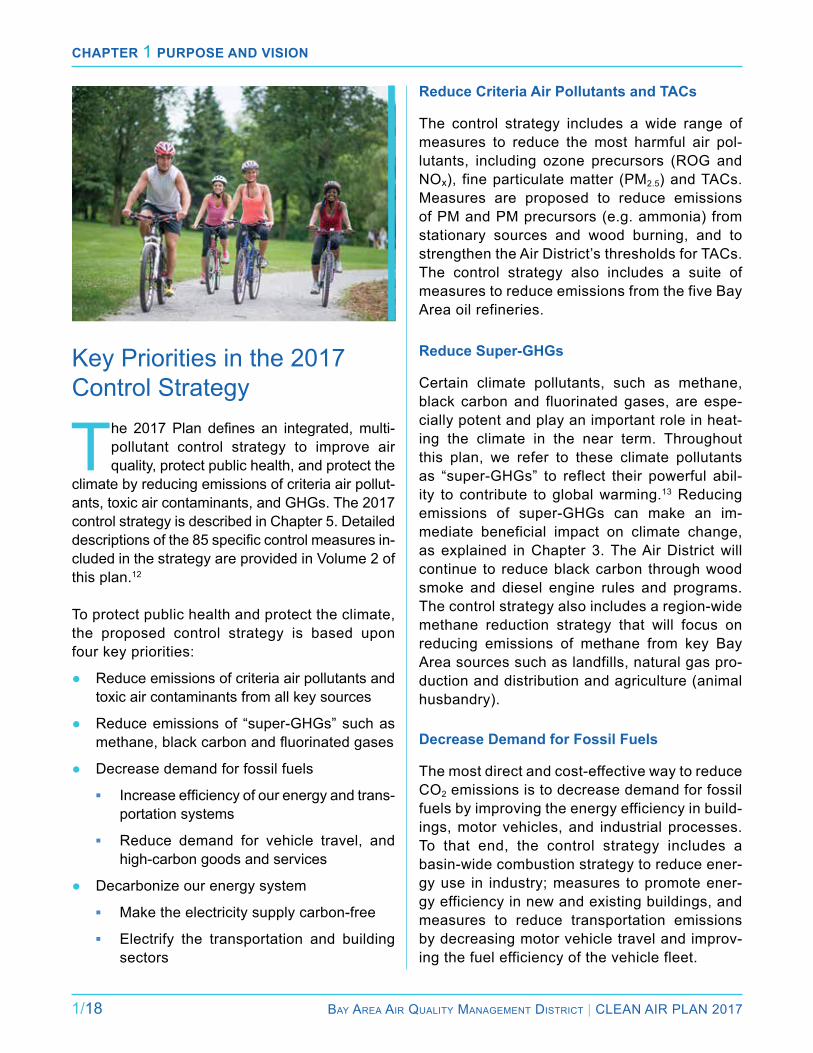
Chapter 1 purpose and Vision
1/18 Bay area air Quality ManageMent District | Clean air Plan 2017
Key Priorities in the 2017 Control Strategy
The 2017 Plan defines an integrated, multi- pollutant control strategy to improve air quality, protect public health, and protect the
climate by reducing emissions of criteria air pollut-ants, toxic air contaminants, and GHGs. The 2017 control strategy is described in Chapter 5. Detailed descriptions of the 85 specific control measures in-cluded in the strategy are provided in Volume 2 of this plan.12
To protect public health and protect the climate, the proposed control strategy is based upon four key priorities:
● reduce emissions of criteria air pollutants and toxic air contaminants from all key sources
● reduce emissions of “super-GHGs” such as methane, black carbon and fluorinated gases
● Decrease demand for fossil fuels
▪ Increase efficiency of our energy and trans-portation systems
▪ reduce demand for vehicle travel, and high-carbon goods and services
● Decarbonize our energy system
▪ Make the electricity supply carbon-free
▪ electrify the transportation and building sectors
Reduce Criteria Air Pollutants and TACs
The control strategy includes a wide range of measures to reduce the most harmful air pol-lutants, including ozone precursors (rOG and nOx), fine particulate matter (PM2.5) and TaCs. Measures are proposed to reduce emissions of PM and PM precursors (e.g. ammonia) from stationary sources and wood burning, and to strengthen the air District’s thresholds for TaCs. The control strategy also includes a suite of measures to reduce emissions from the five Bay area oil refineries.
Reduce Super-GHGs
Certain climate pollutants, such as methane, black carbon and fluorinated gases, are espe-cially potent and play an important role in heat-ing the climate in the near term. Throughout this plan, we refer to these climate pollutants as “super-GHGs” to reflect their powerful abil-ity to contribute to global warming.13 reducing emissions of super-GHGs can make an im-mediate beneficial impact on climate change, as explained in Chapter 3. The air District will continue to reduce black carbon through wood smoke and diesel engine rules and programs. The control strategy also includes a region-wide methane reduction strategy that will focus on reducing emissions of methane from key Bay area sources such as landfills, natural gas pro-duction and distribution and agriculture (animal husbandry).
Decrease Demand for Fossil Fuels
The most direct and cost-effective way to reduce CO2 emissions is to decrease demand for fossil fuels by improving the energy efficiency in build-ings, motor vehicles, and industrial processes. To that end, the control strategy includes a basin-wide combustion strategy to reduce ener-gy use in industry; measures to promote ener-gy efficiency in new and existing buildings, and measures to reduce transportation emissions by decreasing motor vehicle travel and improv-ing the fuel efficiency of the vehicle fleet.
Chapter 1 purpose and Vision
Bay area air Quality ManageMent District | Clean air Plan 2017 1/19
Decarbonize the Energy System
To protect and stabilize the climate over the long-haul, we must learn to live without fossil fuels. The proposed control strategy includes many measures to accelerate the critical transi-tion to a cleaner, “decarbonized” energy system. This requires a two-pronged effort to reduce the carbon intensity of electricity, in combination with switching from natural gas to electricity to power our buildings and replacing gasoline and diesel-powered vehicles with zero-emissions cars and trucks powered by clean electricity or other renewable fuels.
Call to Action
The transition to a post-carbon economy will re-quire concerted action from all sectors of society and a commitment to ensure that our response to this challenge benefits all Bay area commu-
nities, particularly disadvantaged communities. its diversity of resources makes the Bay area an unparalleled incubator for the innovation in new technologies and public policies needed to drive this transition. engaging these diverse resources to work towards a common goal will be essential to the successful implementation of the 2017 Plan.
The air District, with limited authorities and re-sources, cannot achieve this transition alone. However, by creating a model for how a major metropolitan region can transition to a post- carbon economy, by harnessing its vast array of resources and through collaboration, the im-pact of the Bay area’s vision and accomplish-ments will reach far beyond its regional borders. By creating not only a sustainable vision, but a model for how that vision can be achieved, the Bay area will contribute on the global stage to solving the planet’s most pressing challenge.
FOOTNOTES
1 Christophe McGlade & Paul Ekins, The Geographical Distribution of Fossil Fuels Unused When Limiting Global Warming to 2o C. nature, 8 Jan. 2015. http://www.nature.com/nature/journal/v517/n7533/full/nature14016.html
2 The air District’s 2030 GHG target is consistent with the state of California’s GHG 2030 reduction target, per SB 32 (Pavley, 2016). The air District’s 2050 target is consistent with the state’s 2050 GHG reduction target per executive Order S-3-05.
3 See the July 2015 survey performed by the Public Policy institute of California: http://www.ppic.org/main/publication_show.asp?i=1172
4 See: http://www.californiaznehomes.com/about
5 For information on Plan Bay Area, see: http://mtc.ca.gov/whats-happening/news/special-features/plan-bay-area-2040-final-preferred-scenario-approved. For information on priority development areas, see: http://abag.ca.gov/priority/development/.
6 Hand, M.M. et al. (2012) renewable electricity Futures Study. eds. 4 vols. nrel/TP-6a20-52409. Golden, CO: national renewable energy laboratory. available at: http://www.nrel.gov/analysis/re_futures/
7 See the UC Berkeley “Cool Climate” household GHG calculator: http://coolclimate.berkeley.edu/calculator
8 See the Bay area consumption-based GHG inventory: http://www.baaqmd.gov/research-and-data/emission-inventory/consumption-based-ghg-emissions-inventory
9 Global warming potential (GWP) is a measure of how much heat a specific greenhouse gas traps in the atmosphere relative to CO2. as discussed in Chapter 3, reducing emissions of methane and other high-GWP gases must be a crucial element of a comprehensive strategy to protect the climate.
10 Climate Central, 2016, Healthy Diet May reduce Gas,
Greenhouse Gas That is: http://www.climatecentral.org/news/diet-may-reduce-gas-greenhouse-gas-that-is-20160, March 21, 2016
11 USDa, economic research Service, Food availability (Per Capita) Data System—loss-adjusted Food availability Documentation: http://www.ers.usda.gov/data-products/food-availability-(per-capita)-data-system/loss-adjusted-food-availability-documentation.aspx, accessed September 28, 2016.
12 Volume 2 of the 2017 Plan: http://www.baaqmd.gov/plans-and-climate/air-quality-plans/plans-under-development.
13 The air resources Board refers to these compounds as “short-lived climate pollutants” or SlCPs.


Bay area air Quality ManageMent District | Clean air Plan 2017 2/1
Chapter 2air pollution and publiC health
The air District is committed to reducing air pollutants throughout the region, with special emphasis on reducing human
exposure to the most harmful pollutants, and reducing health impacts in the Bay area com-munities and populations that are most heavily impacted by air pollution.
The 2017 Plan addresses ozone, particulate mat-ter (PM), and toxic air contaminants (TaCs), the air pollutants of greatest concern for the purpose of protecting public health. This chapter briefly describes how air pollution impacts public health, the Bay area’s air quality status in relation to state and national standards, and key tools and analyt-ical methods used in air quality planning. in ad-dition, this chapter provides a profile of each of these three key pollutants, their primary health
effects, the major sources of emissions, and trends in emissions and concentrations for each pollut-ant. The final section of this chapter summarizes progress achieved in recent decades in providing cleaner air for Bay area residents.
Climate pollutants, and the impacts of climate change on air quality, the environment, and public health, are discussed in Chapter 3.
linking air Pollution to Public Health
There is a vast body of literature that docu-ments the negative impact of air pollution on public health. researchers use a variety of
methods, including epidemiological studies and clinical studies, to analyze the health effects of

Chapter 2 air pollution and publiC health
2/2 Bay area air Quality ManageMent District | Clean air Plan 2017
specific air pollutants and the biological mecha-nisms or pathways as to how pollutants harm the body. On-going research continually improves our understanding of the range of health effects. The respiratory effects of exposure to air pollution such as disease or damage to lungs in the form of asthma, bronchitis and emphysema, have been documented for decades. However, as the science advances, researchers are finding new evidence that links air pollution to a much wider variety of health effects, including cardiovascular disease (heart attacks and strokes), diabetes and dementia.
The major air quality improvements achieved over the past several decades have greatly ben-efited public health in the Bay Area as described in appendix C. nonetheless, air pollution still has negative impacts on public health. Vulnerable populations, such as children, pregnant women, seniors, and people with existing cardiovascular or respiratory conditions, are most at risk.
Emissions AmbientConcentrations
Population Exposure
Dosage Health Effects
The relationship between air pollution and public health can be expressed as:
Emissions: Many different sources emit a wide variety of air pollutants, including PM, TaCs, and precursor chemicals that react in the atmosphere to form ozone. emission sourc-es include stationary sources
including factories, refineries, foundries, gas sta-tions, and dry cleaners and mobile sources such as cars, trucks, locomotives, marine vessels, and farm and construction equipment. identifying the key emission sources and developing strategies to reduce emissions of harmful pollutants, or their
chemical precursors, is the first step in developing measures to reduce air pollution and improve air quality. The air District develops emissions inven-tories to characterize and quantify emissions of key pollutants by source category.
Ambient Concentrations: This term refers to the level of pol-lutants that are measured in the air. The relationship be-tween emissions and ambient concentrations is complex and depends upon many factors,
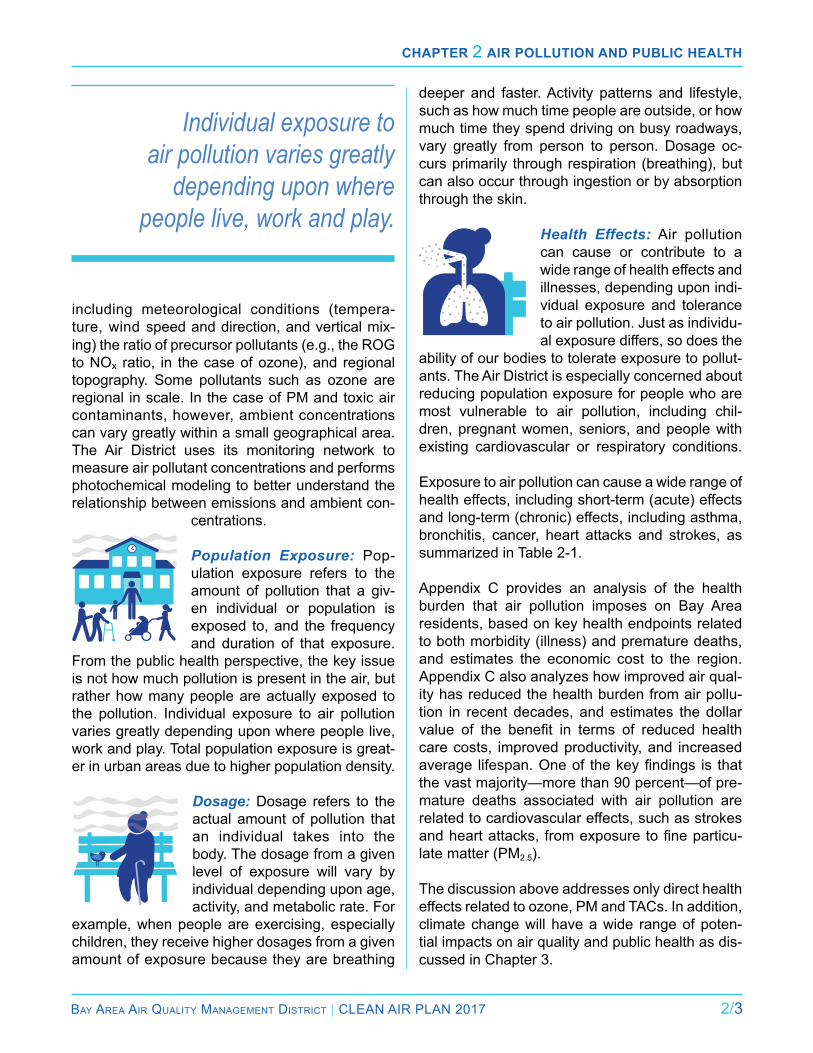
Chapter 2 air pollution and publiC health
Bay area air Quality ManageMent District | Clean air Plan 2017 2/3
including meteorological conditions (tempera-ture, wind speed and direction, and vertical mix-ing) the ratio of precursor pollutants (e.g., the rOG to nOx ratio, in the case of ozone), and regional topography. Some pollutants such as ozone are regional in scale. in the case of PM and toxic air contaminants, however, ambient concentrations can vary greatly within a small geographical area. The air District uses its monitoring network to measure air pollutant concentrations and performs photochemical modeling to better understand the relationship between emissions and ambient con-
centrations.
Population Exposure: Pop-ulation exposure refers to the amount of pollution that a giv-en individual or population is exposed to, and the frequency and duration of that exposure.
From the public health perspective, the key issue is not how much pollution is present in the air, but rather how many people are actually exposed to the pollution. individual exposure to air pollution varies greatly depending upon where people live, work and play. Total population exposure is great-er in urban areas due to higher population density.
Dosage: Dosage refers to the actual amount of pollution that an individual takes into the body. The dosage from a given level of exposure will vary by individual depending upon age, activity, and metabolic rate. For
example, when people are exercising, especially children, they receive higher dosages from a given amount of exposure because they are breathing
Individual exposure to air pollution varies greatly
depending upon where people live, work and play.
deeper and faster. activity patterns and lifestyle, such as how much time people are outside, or how much time they spend driving on busy roadways, vary greatly from person to person. Dosage oc-curs primarily through respiration (breathing), but can also occur through ingestion or by absorption through the skin.
Health Effects: air pollution can cause or contribute to a wide range of health effects and illnesses, depending upon indi-vidual exposure and tolerance to air pollution. Just as individu-al exposure differs, so does the
ability of our bodies to tolerate exposure to pollut-ants. The air District is especially concerned about reducing population exposure for people who are most vulnerable to air pollution, including chil-dren, pregnant women, seniors, and people with existing cardiovascular or respiratory conditions.
exposure to air pollution can cause a wide range of health effects, including short-term (acute) effects and long-term (chronic) effects, including asthma, bronchitis, cancer, heart attacks and strokes, as summarized in Table 2-1.
appendix C provides an analysis of the health burden that air pollution imposes on Bay area residents, based on key health endpoints related to both morbidity (illness) and premature deaths, and estimates the economic cost to the region. appendix C also analyzes how improved air qual-ity has reduced the health burden from air pollu-tion in recent decades, and estimates the dollar value of the benefit in terms of reduced health care costs, improved productivity, and increased average lifespan. One of the key findings is that the vast majority—more than 90 percent—of pre-mature deaths associated with air pollution are related to cardiovascular effects, such as strokes and heart attacks, from exposure to fine particu-late matter (PM2.5).
The discussion above addresses only direct health effects related to ozone, PM and TaCs. in addition, climate change will have a wide range of poten-tial impacts on air quality and public health as dis-cussed in Chapter 3.
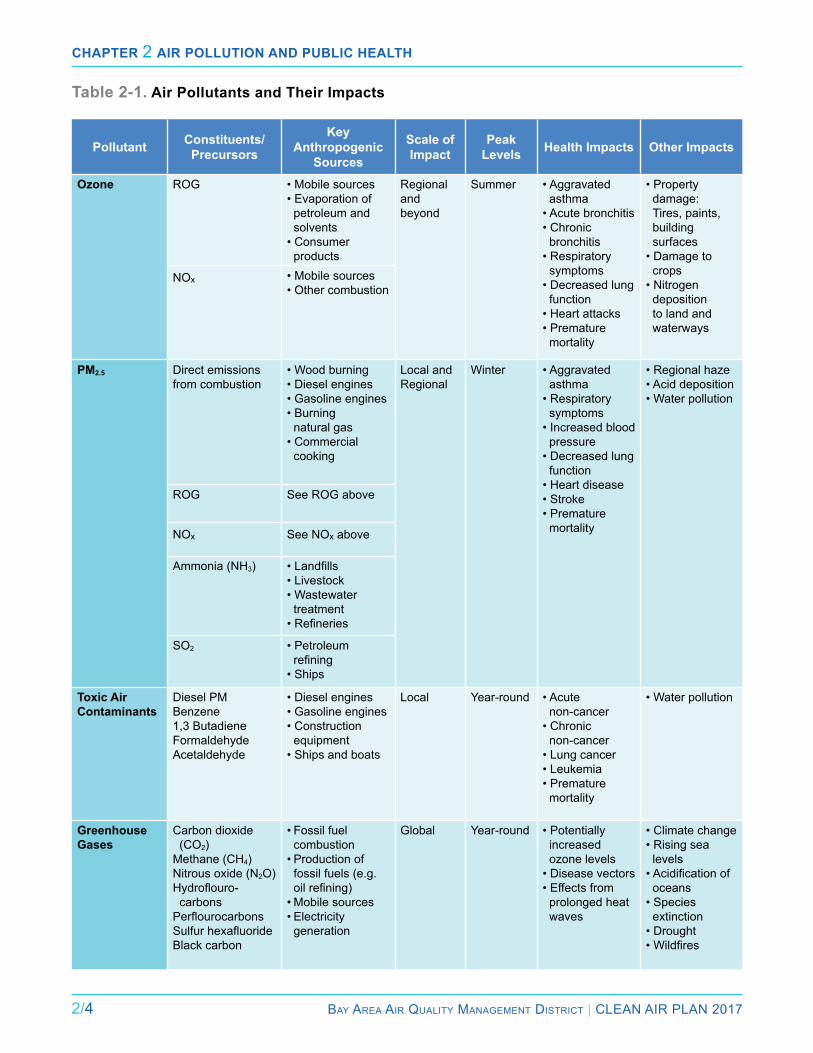
Chapter 2 air pollution and publiC health
2/4 Bay area air Quality ManageMent District | Clean air Plan 2017
Pollutant Constituents/Precursors
KeyAnthropogenic
Sources
Scale ofImpact
Peak Levels Health Impacts Other Impacts
Ozone rOG • Mobile sources• Evaporation of petroleum and solvents
• Consumer products
regional and beyond
Summer • Aggravated asthma
• Acute bronchitis• Chronic bronchitis
• Respiratory symptoms
• Decreased lung function
• Heart attacks• Premature mortality
• Property damage: Tires, paints, building surfaces
• Damage to crops
• Nitrogen deposition to land and waterways
nOx • Mobile sources• Other combustion
PM2.5 Direct emissions from combustion
• Wood burning• Diesel engines• Gasoline engines• Burning natural gas
• Commercial cooking
local and regional
Winter • Aggravated asthma
• Respiratory symptoms
• Increased blood pressure
• Decreased lung function
• Heart disease• Stroke• Premature mortality
• Regional haze• Acid deposition• Water pollution
rOG See rOG above
nOx See nOx above
ammonia (nH3) • Landfills• Livestock• Wastewater treatment
• Refineries
SO2 • Petroleum refining
• Ships
Toxic Air Contaminants
Diesel PMBenzene1,3 ButadieneFormaldehydeacetaldehyde
• Diesel engines• Gasoline engines• Construction equipment
• Ships and boats
local Year-round • Acute non-cancer
• Chronic non-cancer
• Lung cancer• Leukemia• Premature mortality
• Water pollution
Greenhouse Gases
Carbon dioxide (CO2)
Methane (CH4)nitrous oxide (n2O)Hydroflouro-carbons
PerflourocarbonsSulfur hexafluorideBlack carbon
• Fossil fuel combustion
• Production of fossil fuels (e.g. oil refining)
• Mobile sources• Electricity generation
Global Year-round • Potentially increased ozone levels
• Disease vectors• Effects from prolonged heat waves
• Climate change• Rising sea levels
• Acidification of oceans
• Species extinction
• Drought• Wildfires
Table 2-1. Air Pollutants and Their Impacts
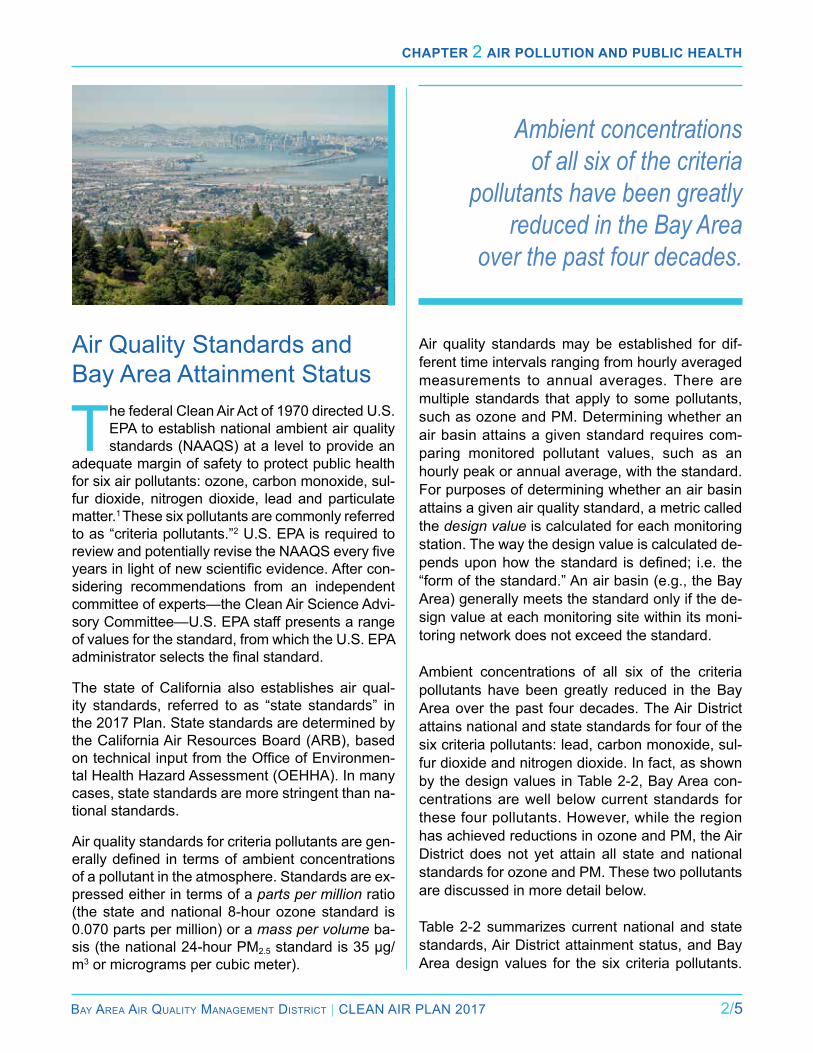
Chapter 2 air pollution and publiC health
Bay area air Quality ManageMent District | Clean air Plan 2017 2/5
air Quality Standards and Bay area attainment Status
The federal Clean air act of 1970 directed U.S. ePa to establish national ambient air quality standards (naaQS) at a level to provide an
adequate margin of safety to protect public health for six air pollutants: ozone, carbon monoxide, sul-fur dioxide, nitrogen dioxide, lead and particulate matter.1 These six pollutants are commonly referred to as “criteria pollutants.”2 U.S. ePa is required to review and potentially revise the NAAQS every five years in light of new scientific evidence. After con-sidering recommendations from an independent committee of experts—the Clean air Science advi-sory Committee—U.S. ePa staff presents a range of values for the standard, from which the U.S. ePa administrator selects the final standard.
The state of California also establishes air qual-ity standards, referred to as “state standards” in the 2017 Plan. State standards are determined by the California air resources Board (arB), based on technical input from the Office of Environmen-tal Health Hazard assessment (OeHHa). in many cases, state standards are more stringent than na-tional standards.
air quality standards for criteria pollutants are gen-erally defined in terms of ambient concentrations of a pollutant in the atmosphere. Standards are ex-pressed either in terms of a parts per million ratio (the state and national 8-hour ozone standard is 0.070 parts per million) or a mass per volume ba-sis (the national 24-hour PM2.5 standard is 35 μg/m3 or micrograms per cubic meter).
air quality standards may be established for dif-ferent time intervals ranging from hourly averaged measurements to annual averages. There are multiple standards that apply to some pollutants, such as ozone and PM. Determining whether an air basin attains a given standard requires com-paring monitored pollutant values, such as an hourly peak or annual average, with the standard. For purposes of determining whether an air basin attains a given air quality standard, a metric called the design value is calculated for each monitoring station. The way the design value is calculated de-pends upon how the standard is defined; i.e. the “form of the standard.” an air basin (e.g., the Bay area) generally meets the standard only if the de-sign value at each monitoring site within its moni-toring network does not exceed the standard.
ambient concentrations of all six of the criteria pollutants have been greatly reduced in the Bay area over the past four decades. The air District attains national and state standards for four of the six criteria pollutants: lead, carbon monoxide, sul-fur dioxide and nitrogen dioxide. in fact, as shown by the design values in Table 2-2, Bay area con-centrations are well below current standards for these four pollutants. However, while the region has achieved reductions in ozone and PM, the air District does not yet attain all state and national standards for ozone and PM. These two pollutants are discussed in more detail below.
Table 2-2 summarizes current national and state standards, air District attainment status, and Bay area design values for the six criteria pollutants.
Ambient concentrations of all six of the criteria
pollutants have been greatly reduced in the Bay Area
over the past four decades.
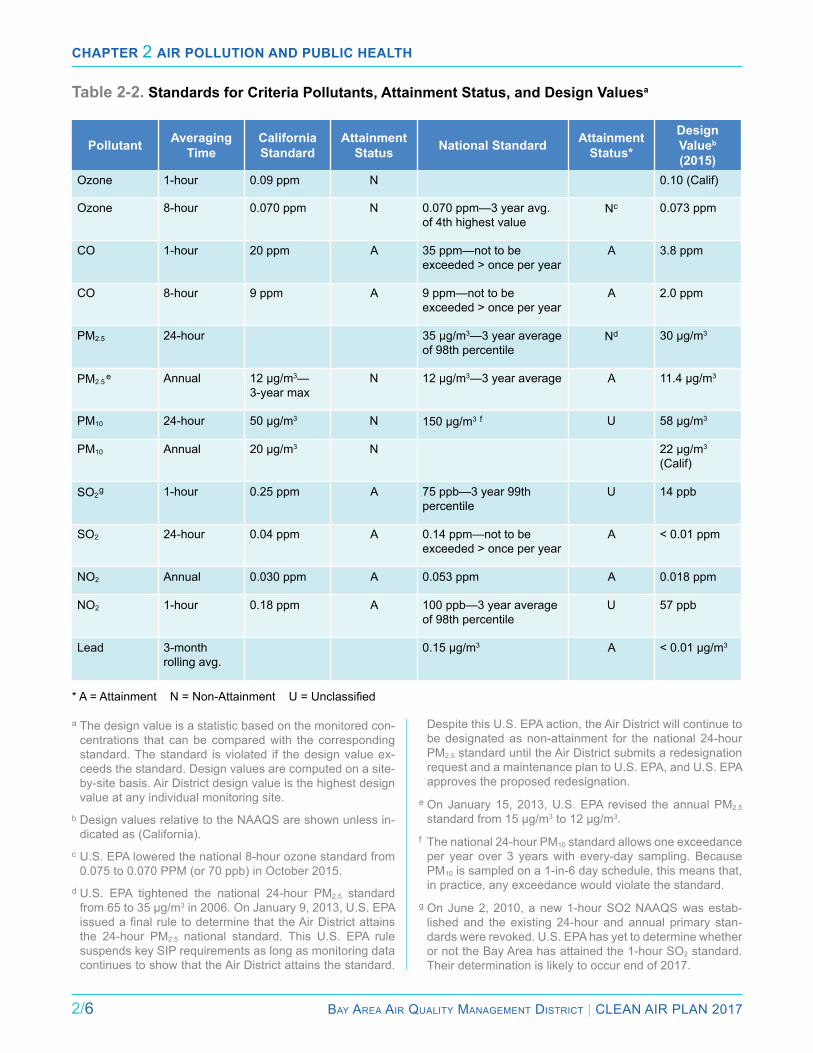
Chapter 2 air pollution and publiC health
2/6 Bay area air Quality ManageMent District | Clean air Plan 2017
Table 2-2. Standards for Criteria Pollutants, Attainment Status, and Design Valuesa
a The design value is a statistic based on the monitored con-centrations that can be compared with the corresponding standard. The standard is violated if the design value ex-ceeds the standard. Design values are computed on a site-by-site basis. air District design value is the highest design value at any individual monitoring site.
b Design values relative to the naaQS are shown unless in-dicated as (California).
c U.S. ePa lowered the national 8-hour ozone standard from 0.075 to 0.070 PPM (or 70 ppb) in October 2015.
d U.S. ePa tightened the national 24-hour PM2.5 standard from 65 to 35 μg/m3 in 2006. On January 9, 2013, U.S. ePa issued a final rule to determine that the Air District attains the 24-hour PM2.5 national standard. This U.S. ePa rule suspends key SiP requirements as long as monitoring data continues to show that the air District attains the standard.
Despite this U.S. ePa action, the air District will continue to be designated as non-attainment for the national 24-hour PM2.5 standard until the air District submits a redesignation request and a maintenance plan to U.S. ePa, and U.S. ePa approves the proposed redesignation.
e On January 15, 2013, U.S. ePa revised the annual PM2.5
standard from 15 μg/m3 to 12 μg/m3.f The national 24-hour PM10 standard allows one exceedance
per year over 3 years with every-day sampling. Because PM10 is sampled on a 1-in-6 day schedule, this means that, in practice, any exceedance would violate the standard.
g On June 2, 2010, a new 1-hour SO2 naaQS was estab-lished and the existing 24-hour and annual primary stan-dards were revoked. U.S. ePa has yet to determine whether or not the Bay area has attained the 1-hour SO2 standard. Their determination is likely to occur end of 2017.
Pollutant AveragingTime
California Standard
Attainment Status National Standard Attainment
Status*
Design Valueb (2015)
Ozone 1-hour 0.09 ppm n 0.10 (Calif)
Ozone 8-hour 0.070 ppm n 0.070 ppm—3 year avg. of 4th highest value
nc 0.073 ppm
CO 1-hour 20 ppm a 35 ppm—not to be exceeded > once per year
a 3.8 ppm
CO 8-hour 9 ppm a 9 ppm—not to be exceeded > once per year
a 2.0 ppm
PM2.5 24-hour 35 μg/m3—3 year average of 98th percentile
nd 30 μg/m3
PM2.5 e annual 12 μg/m3— 3-year max
n 12 μg/m3—3 year average a 11.4 μg/m3
PM10 24-hour 50 μg/m3 n 150 μg/m3 f U 58 μg/m3
PM10 annual 20 μg/m3 n 22 μg/m3
(Calif)
SO2g 1-hour 0.25 ppm a 75 ppb—3 year 99th
percentileU 14 ppb
SO2 24-hour 0.04 ppm a 0.14 ppm—not to be exceeded > once per year
a < 0.01 ppm
nO2 annual 0.030 ppm a 0.053 ppm a 0.018 ppm
nO2 1-hour 0.18 ppm a 100 ppb—3 year average of 98th percentile
U 57 ppb
lead 3-month rolling avg.
0.15 μg/m3 a < 0.01 μg/m3
* A = Attainment N = Non-Attainment U = Unclassified
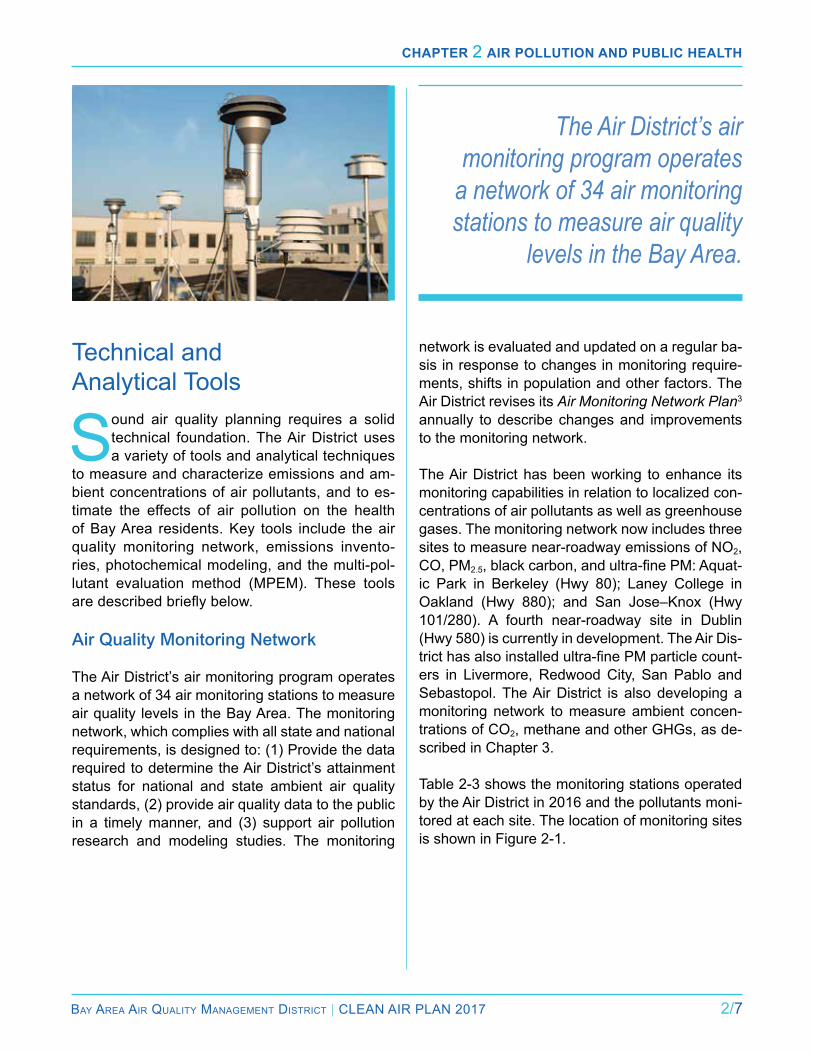
Chapter 2 air pollution and publiC health
Bay area air Quality ManageMent District | Clean air Plan 2017 2/7
Technical and analytical Tools
Sound air quality planning requires a solid technical foundation. The air District uses a variety of tools and analytical techniques
to measure and characterize emissions and am-bient concentrations of air pollutants, and to es-timate the effects of air pollution on the health of Bay area residents. Key tools include the air quality monitoring network, emissions invento-ries, photochemical modeling, and the multi-pol-lutant evaluation method (MPeM). These tools are described briefly below.
Air Quality Monitoring Network
The air District’s air monitoring program operates a network of 34 air monitoring stations to measure air quality levels in the Bay area. The monitoring network, which complies with all state and national requirements, is designed to: (1) Provide the data required to determine the air District’s attainment status for national and state ambient air quality standards, (2) provide air quality data to the public in a timely manner, and (3) support air pollution research and modeling studies. The monitoring
network is evaluated and updated on a regular ba-sis in response to changes in monitoring require-ments, shifts in population and other factors. The air District revises its Air Monitoring Network Plan3
annually to describe changes and improvements to the monitoring network.
The air District has been working to enhance its monitoring capabilities in relation to localized con-centrations of air pollutants as well as greenhouse gases. The monitoring network now includes three sites to measure near-roadway emissions of nO2, CO, PM2.5, black carbon, and ultra-fine PM: Aquat-ic Park in Berkeley (Hwy 80); Laney College in Oakland (Hwy 880); and San Jose–Knox (Hwy 101/280). a fourth near-roadway site in Dublin (Hwy 580) is currently in development. The air Dis-trict has also installed ultra-fine PM particle count-ers in livermore, redwood City, San Pablo and Sebastopol. The air District is also developing a monitoring network to measure ambient concen-trations of CO2, methane and other GHGs, as de-scribed in Chapter 3.
Table 2-3 shows the monitoring stations operated by the air District in 2016 and the pollutants moni-tored at each site. The location of monitoring sites is shown in Figure 2-1.
The Air District’s air monitoring program operates
a network of 34 air monitoring stations to measure air quality
levels in the Bay Area.
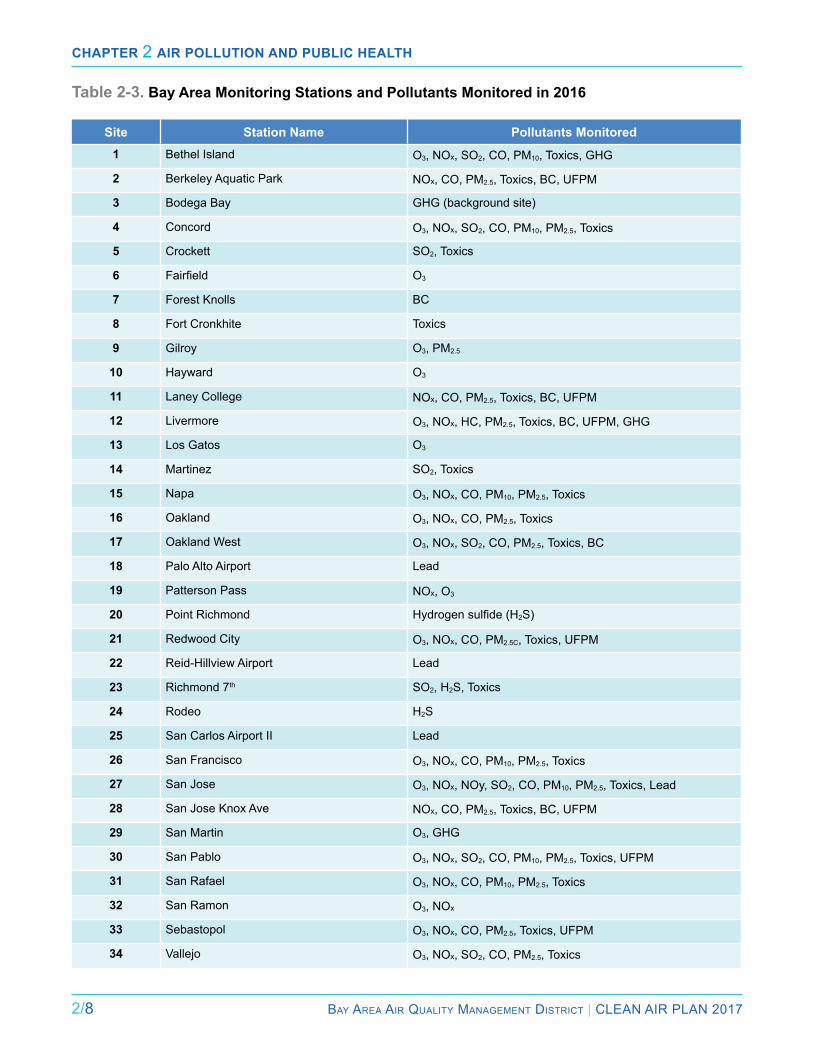
Chapter 2 air pollution and publiC health
2/8 Bay area air Quality ManageMent District | Clean air Plan 2017
Table 2-3. Bay Area Monitoring Stations and Pollutants Monitored in 2016
Site Station Name Pollutants Monitored1 Bethel island O3, nOx, SO2, CO, PM10, Toxics, GHG
2 Berkeley aquatic Park nOx, CO, PM2.5, Toxics, BC, UFPM
3 Bodega Bay GHG (background site)
4 Concord O3, nOx, SO2, CO, PM10, PM2.5, Toxics
5 Crockett SO2, Toxics
6 Fairfield O3
7 Forest Knolls BC
8 Fort Cronkhite Toxics
9 Gilroy O3, PM2.5
10 Hayward O3
11 laney College nOx, CO, PM2.5, Toxics, BC, UFPM
12 livermore O3, nOx, HC, PM2.5, Toxics, BC, UFPM, GHG
13 los Gatos O3
14 Martinez SO2, Toxics
15 napa O3, nOx, CO, PM10, PM2.5, Toxics
16 Oakland O3, nOx, CO, PM2.5, Toxics
17 Oakland West O3, nOx, SO2, CO, PM2.5, Toxics, BC
18 Palo alto airport lead
19 Patterson Pass nOx, O3
20 Point richmond Hydrogen sulfide (H2S)
21 redwood City O3, nOx, CO, PM2.5C, Toxics, UFPM
22 reid-Hillview airport lead
23 richmond 7th SO2, H2S, Toxics
24 rodeo H2S
25 San Carlos airport ii lead
26 San Francisco O3, nOx, CO, PM10, PM2.5, Toxics
27 San Jose O3, nOx, nOy, SO2, CO, PM10, PM2.5, Toxics, lead
28 San Jose Knox ave nOx, CO, PM2.5, Toxics, BC, UFPM
29 San Martin O3, GHG
30 San Pablo O3, nOx, SO2, CO, PM10, PM2.5, Toxics, UFPM
31 San rafael O3, nOx, CO, PM10, PM2.5, Toxics
32 San ramon O3, nOx
33 Sebastopol O3, nOx, CO, PM2.5, Toxics, UFPM
34 Vallejo O3, nOx, SO2, CO, PM2.5, Toxics
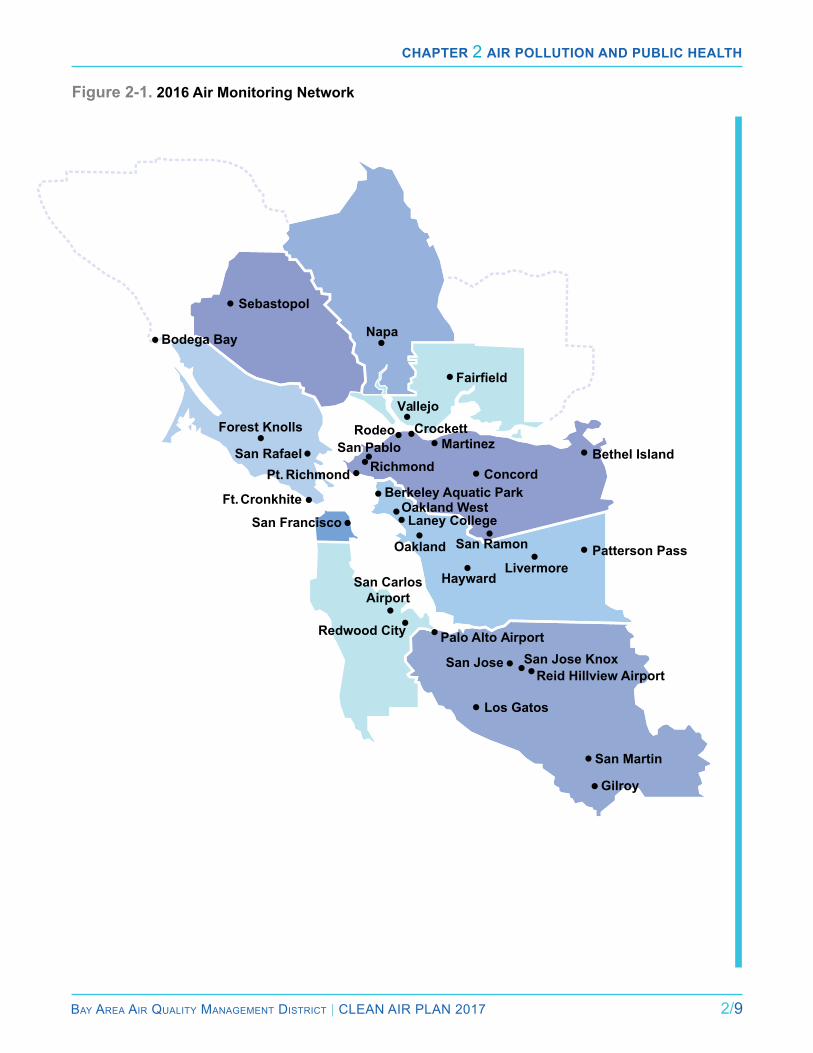
Chapter 2 air pollution and publiC health
Bay area air Quality ManageMent District | Clean air Plan 2017 2/9
Figure 2-1. 2016 Air Monitoring Network
San Carlos Airport
Gilroy
San Jose San Jose KnoxReid Hillview Airport
Sebastopol
Napa
Fairfield
VallejoCrockett
Martinez
Concord
Hayward
San Martin
Los Gatos
Bethel Island
Patterson PassLivermore
Redwood City Palo Alto Airport
Ft. Cronkhite
San Francisco
RodeoSan Pablo
Oakland San Ramon
Richmond
Forest Knolls
San RafaelPt. Richmond
Oakland WestLaney College
Berkeley Aquatic Park
Bodega Bay
Chapter 2 air pollution and publiC health
2/10 Bay area air Quality ManageMent District | Clean air Plan 2017
Air quality modeling is an important tool for analyzing
the formation, transport, and dispersal of air pollutants, and
for estimating how exposure to air pollution affects the
health of Bay Area residents.
Emissions Inventoriesemissions inventories are essential tools for air quality planning. inventories identify source cat-egories and provide estimates of emissions from each “anthropogenic” source.4 emissions invento-ries are used to perform air quality modeling, to identify source categories where there may be op-portunities for additional emission reductions, and to estimate potential emission reductions for con-trol measures under consideration.
The air District develops and maintains emissions inventories for a variety of pollutants including rOG, nOx, PM2.5 and PM10.5 The inventories pro-vide detailed estimates of emissions from a wide variety of sources. The air District has also de-veloped a TaC inventory, as well as an ammonia inventory, since ammonia is a key precursor to secondary formation of PM. emissions invento-ries are periodically revised to reflect changes in emission factors, such as turnover in the vehicle fleet, economic and demographic trends, and reg-ulatory activity such as more stringent limits on emissions sources.
Air Quality Modelingair quality modeling is an important tool for ana-lyzing the formation, transport, and dispersal of air pollutants, and for estimating how exposure to air pollution affects the health of Bay area res-idents. Modeling is also useful for predicting how an increase or decrease in emissions will affect
ambient concentrations of a given pollutant. The air District has robust in-house modeling capabil-ities. The air District applies air quality models to simulate ozone, PM, TaCs and other air pollutants which can be used to inform the efficacy of poten-tial control measures, support rule development, and upgrade the Multi-Pollutant evaluation Meth-od described below. appendix D provides a sum-mary of the air District’s recent air quality modeling projects and the results of those efforts.
Multi-Pollutant Evaluation Methodreducing emissions of criteria air pollutants, TaCs and GHGs will provide a variety of social and economic benefits. The Air District developed a multi-pollutant evaluation method (MPeM) as an analytical tool for the multi-pollutant Bay area 2010 Clean air Plan. The MPeM provides a means to quantify the estimated benefits of individual con-trol measures and the control strategy as a whole in protecting public health, extending the average lifespan of Bay area residents and protecting the climate. This information can be used to compare the estimated costs and benefits of individual con-trol measures, to help prioritize implementation of control measures in the 2017 Plan, and to esti-mate the magnitude of benefits to the region from the control strategy as a whole. MPeM input val-ues have been updated for use of the method in the 2017 Plan. a more detailed description of the MPeM is provided in appendix C.
Profiles of Key Pollutants
Brief profiles of the air pollutants that have the greatest direct impact on public health—ozone, particulate matte, and toxic air con-
taminants—are provided below.
OzoneOzone (O3), often called smog, is harmful to public health at high concentrations near ground level.6
Ozone can damage the tissues of the lungs and respiratory tract. High concentrations of ozone irritate the nose, throat, and respiratory system and constrict the airways. Ozone also can aggra-vate other respiratory conditions such as asthma, bronchitis and emphysema, causing increased
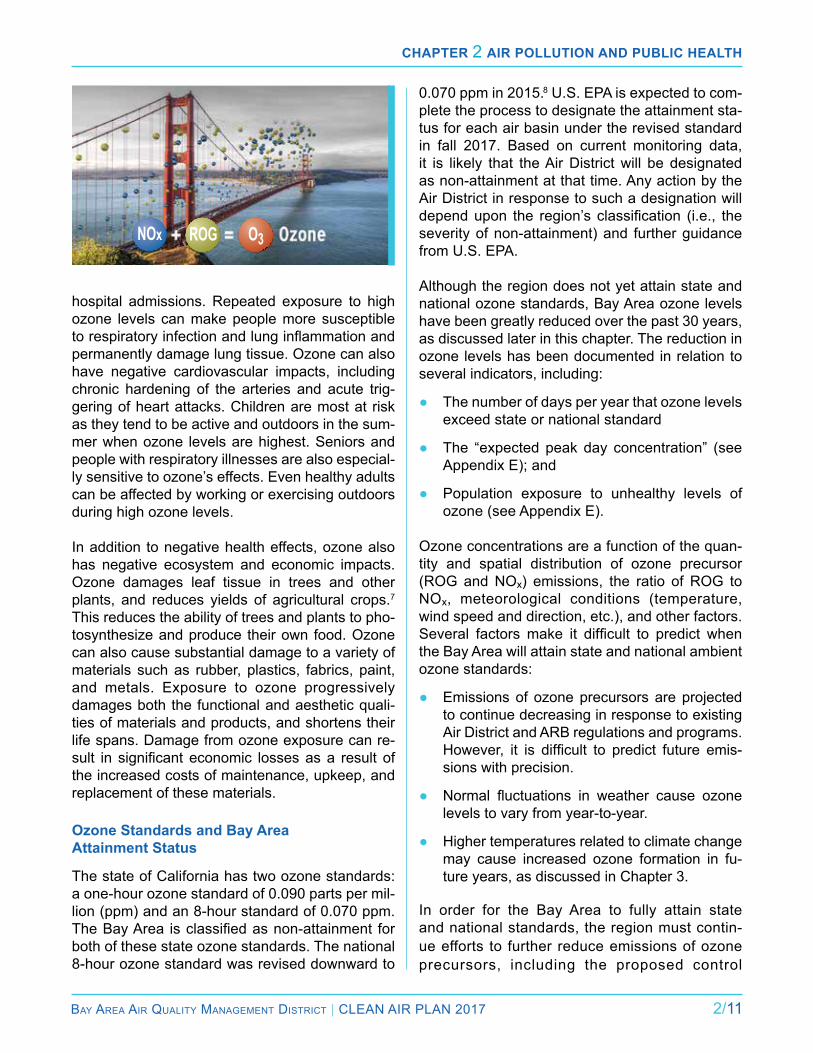
Chapter 2 air pollution and publiC health
Bay area air Quality ManageMent District | Clean air Plan 2017 2/11
hospital admissions. repeated exposure to high ozone levels can make people more susceptible to respiratory infection and lung inflammation and permanently damage lung tissue. Ozone can also have negative cardiovascular impacts, including chronic hardening of the arteries and acute trig-gering of heart attacks. Children are most at risk as they tend to be active and outdoors in the sum-mer when ozone levels are highest. Seniors and people with respiratory illnesses are also especial-ly sensitive to ozone’s effects. even healthy adults can be affected by working or exercising outdoors during high ozone levels.
in addition to negative health effects, ozone also has negative ecosystem and economic impacts. Ozone damages leaf tissue in trees and other plants, and reduces yields of agricultural crops.7
This reduces the ability of trees and plants to pho-tosynthesize and produce their own food. Ozone can also cause substantial damage to a variety of materials such as rubber, plastics, fabrics, paint, and metals. exposure to ozone progressively damages both the functional and aesthetic quali-ties of materials and products, and shortens their life spans. Damage from ozone exposure can re-sult in significant economic losses as a result of the increased costs of maintenance, upkeep, and replacement of these materials.
Ozone Standards and Bay Area Attainment Status
The state of California has two ozone standards: a one-hour ozone standard of 0.090 parts per mil-lion (ppm) and an 8-hour standard of 0.070 ppm. The Bay Area is classified as non-attainment for both of these state ozone standards. The national 8-hour ozone standard was revised downward to
0.070 ppm in 2015.8 U.S. ePa is expected to com-plete the process to designate the attainment sta-tus for each air basin under the revised standard in fall 2017. Based on current monitoring data, it is likely that the air District will be designated as non-attainment at that time. any action by the air District in response to such a designation will depend upon the region’s classification (i.e., the severity of non-attainment) and further guidance from U.S. ePa.
although the region does not yet attain state and national ozone standards, Bay area ozone levels have been greatly reduced over the past 30 years, as discussed later in this chapter. The reduction in ozone levels has been documented in relation to several indicators, including:
● The number of days per year that ozone levels exceed state or national standard
● The “expected peak day concentration” (see Appendix E); and
● Population exposure to unhealthy levels of ozone (see appendix e).
Ozone concentrations are a function of the quan-tity and spatial distribution of ozone precursor (rOG and nOx) emissions, the ratio of rOG to nOx, meteorological conditions (temperature, wind speed and direction, etc.), and other factors. Several factors make it difficult to predict when the Bay area will attain state and national ambient ozone standards:
● emissions of ozone precursors are projected to continue decreasing in response to existing air District and arB regulations and programs. However, it is difficult to predict future emis-sions with precision.
● Normal fluctuations in weather cause ozone levels to vary from year-to-year.
● Higher temperatures related to climate change may cause increased ozone formation in fu-ture years, as discussed in Chapter 3.
in order for the Bay area to fully attain state and national standards, the region must contin-ue efforts to further reduce emissions of ozone precursors, including the proposed control
NOx ROG O3
Chapter 2 air pollution and publiC health
2/12 Bay area air Quality ManageMent District | Clean air Plan 2017
measures that will reduce emissions of rOG and nOx, as described in the control strategy summary in Chapter 5. nonetheless, it should be emphasized that great progress has been made in reducing ozone concentrations in recent de-cades. Peak concentrations of ozone have been significantly reduced9 and population exposure to unhealthy levels of ozone has decreased dra-matically. For example, per capita exposure to ozone levels above the state 1-hour ozone stan-dard (90 parts per billion) has been reduced by 99 percent over the past 30 years, as discussed in appendix e.
Ozone Dynamics
Ozone is not emitted directly from pollution sources. instead, ozone is formed in the at-mosphere in the presence of sunlight through complex chemical reactions between two types of precursor chemicals: reactive organic gases (rOG) and nitrogen oxides (nOx). as the air temperature rises, ground-level ozone forms at an accelerated rate. Ozone levels are usually highest on hot, windless summer afternoons, especially in inland valleys. exceedances of state or national ozone standards in the Bay area only occur on hot, relatively stagnant days. Because weather conditions have a strong im-pact on ozone formation, ozone levels can vary significantly from day-to-day or from one sum-mer to the next. Climate change may increase ozone levels in fu-ture years. longer and more severe heat waves expected as a result of climate change may cause more ozone formation, resulting in more frequent exceedances of ozone standards. as discussed in Chapter 3, climate change could erode decades of progress in reducing ozone levels.
Ozone is a regional pollutant. emissions of rOG and nOx throughout the Bay area contribute to ozone formation in downwind areas. Therefore, reductions in emissions of rOG and nOx are needed throughout the region in order to decrease ozone levels.
The rOG to nOx ratio strongly affects the ozone formation rate. The air District’s ozone model-ing indicates that the Bay area is “rOG-limited” for ozone formation. This suggests that reducing rOG emissions will be more productive in reduc-ing ozone, at least in the near term. However, modeling also indicates that large reductions in nOx emissions will be needed over the long term to achieve the reduction in ozone concentrations required to attain state and national ozone stan-dards which have become progressively more stringent in recent decades. additional discussion of ozone dynamics is provided in appendix e, and results of the air District’s ozone modeling are pro-vided in appendix D.
Key Sources of Ozone Precursors
There are literally millions of discrete sources of ozone precursor emissions in the Bay area, both man-made and natural. emissions produced by human activity are called “anthropogenic.” emis-sions produced by natural sources, such as plants and animals, are called “biogenic.” in the Bay area, emissions from anthropogenic sources are greater than from biogenic sources. The main sources of rOG emissions in the Bay area are motor vehicles and other mobile sources, as well as evaporation of petroleum and solvents, as shown in Figure 2-2. The main sources of nOx emissions in the region are motor vehicles and other mobile sources, as well as combustion at industrial and other facilities, as shown in Figure 2-3.
Longer and more severe heat waves expected as a result of
climate change may cause more ozone formation, resulting in
more frequent exceedances of ozone standards.

Chapter 2 air pollution and publiC health
Bay area air Quality ManageMent District | Clean air Plan 2017 2/13
Figure 2-2. 2015 Annual Average ROG Emissions by Source, (259 tons/day)
Figure 2-3. 2015 Annual Average NOx Emissions by Source, (298 tons/day)
Other Sources21%
Combustion5%
Combustion15%
Industrial & Commercial6%
Industrial & Commercial1%
Other Mobile Sources
19%
On-Road Motor Vehicles
23%
On-Road Motor Vehicles
43%
Petroleum & Solvent
Evaporation26%
Other Mobile Sources
41%
Other Sources0.4%
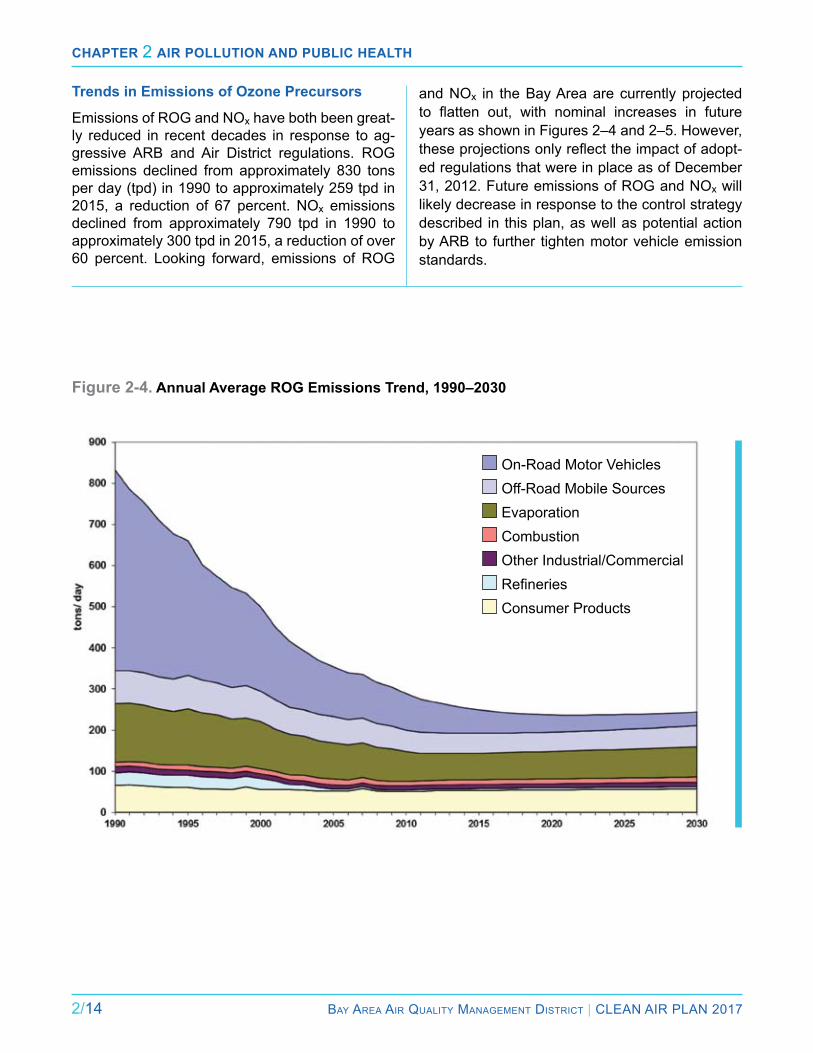
Chapter 2 air pollution and publiC health
2/14 Bay area air Quality ManageMent District | Clean air Plan 2017
Trends in Emissions of Ozone Precursors
emissions of rOG and nOx have both been great-ly reduced in recent decades in response to ag-gressive arB and air District regulations. rOG emissions declined from approximately 830 tons per day (tpd) in 1990 to approximately 259 tpd in 2015, a reduction of 67 percent. nOx emissions declined from approximately 790 tpd in 1990 to approximately 300 tpd in 2015, a reduction of over 60 percent. looking forward, emissions of rOG
and nOx in the Bay area are currently projected to flatten out, with nominal increases in future years as shown in Figures 2–4 and 2–5. However, these projections only reflect the impact of adopt-ed regulations that were in place as of December 31, 2012. Future emissions of rOG and nOx will likely decrease in response to the control strategy described in this plan, as well as potential action by arB to further tighten motor vehicle emission standards.
Figure 2-4. Annual Average ROG Emissions Trend, 1990–2030
■ On-road Motor Vehicles■ Off-road Mobile Sources■ evaporation■ Combustion■ Other industrial/Commercial■ Refineries■ Consumer Products

Chapter 2 air pollution and publiC health
Bay area air Quality ManageMent District | Clean air Plan 2017 2/15
Figure 2-5. Annual Average NOx Emissions Trend, 1990–2030
The reduction in emissions of ozone precursors has resulted in substantial decrease in ozone con-centrations and exposure of Bay area residents to unhealthy ozone levels, as discussed in the “Prog-ress in improving air Quality and Protecting Public Health” section below.
Particulate Matter
Particulate matter is a diverse mixture of sus-pended particles and liquid droplets (aerosols). PM includes elements such as carbon and met-als; compounds such as nitrates, organics, and sulfates; and complex mixtures such as diesel exhaust, wood smoke and soil. Unlike the other criteria pollutants which are individual chemical compounds, PM includes all particles that are suspended in the air. PM is both directly emit-ted (referred to as direct PM or primary PM) and also formed in the atmosphere through reactions among different pollutants (referred to as indirect or secondary PM).
PM is generally characterized on the basis of par-ticle size. Ultra-fine PM includes particles less than one micron in diameter. Fine PM (PM2.5) consists of particles 2.5 microns or less in diameter. PM10
consists of particles 10 microns or less in diam-eter. Total suspended particulates (TSP) includes suspended particles of any size.
Compelling evidence suggests that fine PM is the air pollutant most harmful to the health of Bay area residents, as discussed below as well as in the health burden analysis presented in appendix C. in view of the impact of PM on public health, the air District issued a detailed report entitled Un-derstanding Particulate Matter: Protecting Public Health in the San Francisco Bay Area in novem-ber 2012.10 readers are encouraged to review that report for an in-depth discussion of the effects of PM on public health, ecosystems, and the cli-mate; population exposure to PM; PM emissions sources in the Bay Area; and the Air District’s PM control program.
■ On-road Motor Vehicles■ Off-road Mobile Sources■ Combustion■ Other industrial/Commercial■ Refineries■ Wildfires
Chapter 2 air pollution and publiC health
2/16 Bay area air Quality ManageMent District | Clean air Plan 2017
researchers continue to study the relative risk associated with the many types and sources of particles that comprise PM. The evidence that is currently available suggests that all types of fine particles are harmful, irrespective of size, source, or chemical composition. in general, however, smaller particles have more adverse health effects because they can penetrate more deeply into the lungs, bloodstream, organs and cells.
A large and growing body of scientific evidence indicates that both short-term and long-term ex-posure to fine particles can cause a wide range of health effects, including aggravated asthma and bronchitis; hospital visits for respiratory and cardiovascular symptoms; and strokes and heart attacks, some of which result in premature deaths. The evidence shows that reducing PM emissions can reduce mortality and increase average life span. For example, a 2009 study of nationwide scope found that reducing fine PM results in sig-nificant and measurable improvements in human health and life expectancy.11
although epidemiological evidence demonstrates a strong correlation between elevated PM levels and negative public health effects, scientists are still working to understand the precise biological mechanisms through which PM damages our health. a 2009 study suggests that PM may harm our bodies by a combination of 1) increasing blood pressure, and 2) triggering a response which caus-es inflammation that can stiffen and damage blood vessels.12 Studies also indicate that exposure to PM may damage cells or tissue via oxidative stress13 and contribute to diabetes.14 Oxidative stress re-fers to the body’s inability to protect itself against elevated levels of free radicals (e.g. hydroxyl, nitric acid) or non-radicals (e.g. hydrogen peroxide, lipid peroxide), thereby causing tissue damage. a Dan-ish study found that participants who rode bicycles in traffic in Copenhagen, and were therefore ex-posed to elevated levels of PM and ultrafine PM, sustained damage to their Dna.15
in addition to its negative health effects, PM is also a prime cause of regional haze. PM emissions
also impact the climate. PM aerosols that scatter sunlight can help to reduce or mask the warming effect of solar radiation. However, black carbon (soot), a component of PM, has been determined to be a potent agent of climate change, as dis-cussed in Chapter 3. Therefore, reducing emis-sions of black carbon from sources such as diesel engines and wood burning can help to both protect public health and protect the climate.
PM Standards and Bay Area Attainment Status
There are national and state ambient air quality standards for both PM2.5 and PM10. The 24-hour standards are intended to prevent short-term (acute) health effects; the annual average stan-dards address long-term (chronic) health effects. in response to new evidence about the health ef-fects of PM, national and state PM standards have been tightened since 2000. However, researchers have not yet been able to identify a clear threshold below which there are no health effects from ex-posure to fine PM. This suggests that PM2.5 stan-dards may be further tightened in the future.
The Bay area’s attainment status relative to na-tional and state PM standards is shown in Table 2-2. The Bay area attains the national 24-hour PM10 standard and the national annual PM2.5 stan-dard. On January 9, 2013, U.S. EPA issued a fi-nal rule that the Bay area meets the 24-hour PM2.5
national standard. This U.S. ePa action suspends key State implementation Plan (SiP) requirements as long as monitoring data continues to show that the air District meets the standard. Despite this U.S. ePa action, the air District will continue to be
The evidence shows that reducing PM emissions
can reduce mortality and increase average life span.
Chapter 2 air pollution and publiC health
Bay area air Quality ManageMent District | Clean air Plan 2017 2/17
formally designated as non-attainment for the na-tional 24-hour PM2.5 standard until the air District submits and U.S. ePa approves a redesignation request including a maintenance plan.
in 2002, the state of California adopted an annual PM2.5 standard, but the state has yet to adopt a short-term 24-hour PM2.5 standard. recent moni-toring data indicates that the Bay area violates the state annual PM2.5 standard, as well as the state annual and 24-hour standards for PM10.
PM Dynamics
PM chemistry and formation is complex and vari-able. PM concentrations vary considerably in composition and in spatial distribution both on a day-to-day basis and on a seasonal basis in re-sponse to changes in weather and emissions. The Bay area generally experiences its highest PM concentrations in the winter. exceedances of the 24-hour national PM2.5 standard almost always occur between november and February. High PM2.5 episodes are typically regional in scale, im-pacting multiple Bay area locations. During other seasons, by contrast, Bay area PM2.5 tends to be low due to the area’s natural ventilation system. Thus, on an annual average basis, the Bay ar-ea’s PM2.5 levels are among the lowest measured in major U.S. metropolitan areas. During summer and fall, Bay area PM levels occasionally spike in response to wildfires that occur either within the region or in adjacent regions.
Consecutive stagnant and clear winter days are typically prerequisites for development of PM2.5
episodes. The lower levels of solar radiation (sunlight) in the winter lead to stronger tempera-ture inversions. These inversions are conducive to the buildup of PM in ambient air near ground level, especially ultrafine particles, which can remain airborne for a number of days. Winter is also when the most residential wood burning oc-curs; in some parts of the Bay Area, wood smoke accounts for the majority of airborne PM2.5 during high PM episodes.
Secondary PM2.5 levels are likewise elevated during the winter months. Cool weather is condu-cive to the formation of ammonium nitrate. ammo-nium nitrate is the main type of secondary PM2.5 in winter months, contributing an average of about 35 percent of total PM2.5 under peak PM conditions. This semi-volatile PM2.5 component is stable in its solid form only during the cooler winter months. although the contribution of ammonium sulfate is relatively low (averaging 1-2 µg/m3) it accounts for approximately 10 percent of total PM2.5 on an an-nual average basis.
PM Emissions Sources
Combustion of fossil fuels and biomass, primar-ily wood, from various sources are the primary contributors of directly-emitted Bay area PM2.5 in all seasons, as shown in Figure 2-6. Biomass combustion emissions are about 3–4 times high-er in winter than during the other seasons, and its contribution to peak PM2.5 is greater, as con-firmed by isotopic carbon (C14) analysis. The in-creased winter biomass combustion emissions reflect increased residential wood burning during the winter season. residential wood burning can degrade local air quality, especially in communities such as the San Geronimo Valley in Marin County, where wood smoke is trapped by local topography. Therefore, to address the health impacts of wood burning at both the local and regional scale and to avoid exceedances of PM standards, the air Dis-trict adopted and continues to strengthen its winter “Spare the air” wood smoke control program and Regulation 6, Rule 3: Wood Burning Devices, as described in Chapter 4.
Consecutive stagnant and clear winter days are typically prerequisites for development
of PM2.5 episodes.
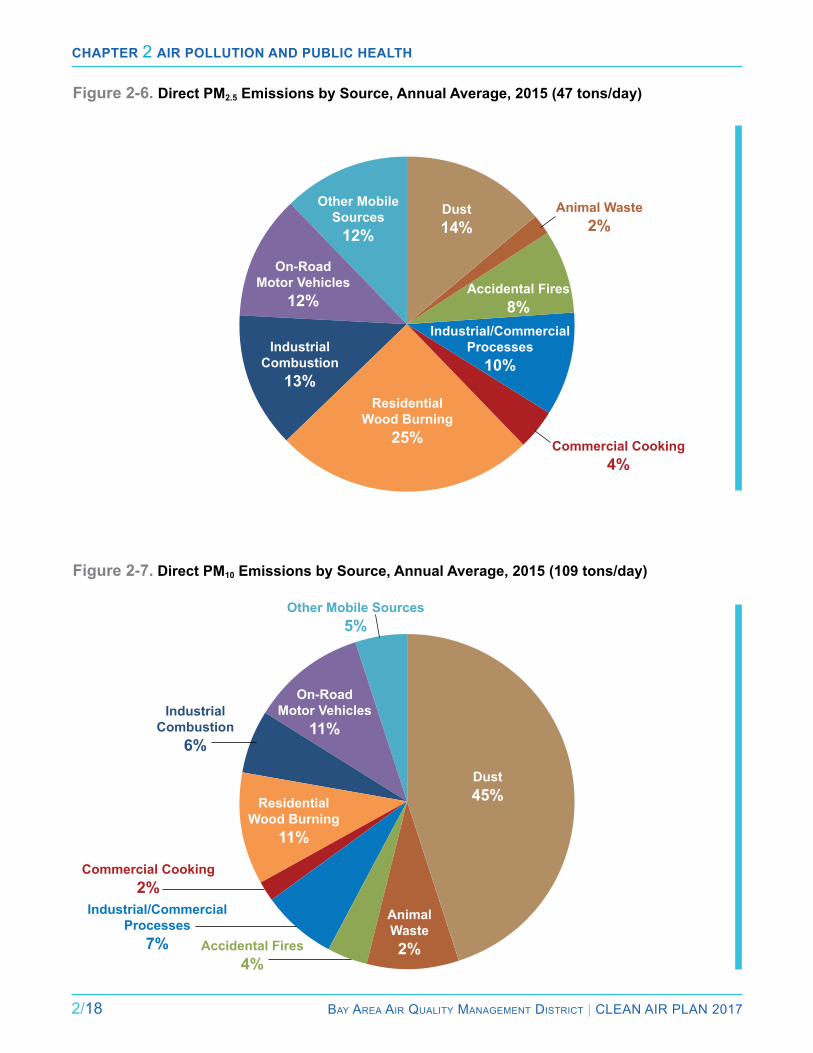
Chapter 2 air pollution and publiC health
2/18 Bay area air Quality ManageMent District | Clean air Plan 2017
Figure 2-6. Direct PM2.5 Emissions by Source, Annual Average, 2015 (47 tons/day)
Figure 2-7. Direct PM10 Emissions by Source, Annual Average, 2015 (109 tons/day)
On-Road Motor Vehicles
12%
Other Mobile Sources
12%Dust14%
Other Mobile Sources5%
Industrial Combustion
13%
On-Road Motor Vehicles
11%
Residential Wood Burning
25%
Residential Wood Burning
11%
Commercial Cooking4%
Animal Waste2%
Industrial/Commercial Processes
10%
Industrial/Commercial Processes
7%
Accidental Fires8%
Commercial Cooking2%
Accidental Fires4%
Industrial Combustion
6%
Dust45%
Animal Waste2%
Chapter 2 air pollution and publiC health
Bay area air Quality ManageMent District | Clean air Plan 2017 2/19
Figure 2-7 shows key sources of directly-emitted PM10 in the Bay Area. Whereas dust contributes only modestly to Bay area PM2.5 concentrations, it accounts for a significant portion of PM10, as shown by comparing Figure 2-6 with Figure 2-7.
The reduction in directly-emitted PM, as well as emissions of precursors to secondary PM, has resulted in substantial decrease in PM concen-trations and exposure of Bay area residents to unhealthy PM levels, as discussed in the “Prog-ress in improving air Quality and Protecting Public Health” section below.
Source Contributions to Ambient PM Concentrations
ambient PM2.5 derives both from direct emissions and secondary compounds created in the atmo-sphere. Determining the relative contributions of various sources of direct PM2.5 emissions and PM2.5 precursors to total PM concentrations is complex. To estimate the overall contribution of various sources, the air District combines emis-sions inventory data with the results of chemical mass balance (CMB) analysis, the latter provid-ing information on the relative contributions from source categories contributing to primary and sec-ondary PM.
in analyzing PM sources there may be discrepan-cies between the estimated PM emissions invento-ry and ambient PM concentrations estimated from CMB analysis. For example, the emissions inven-tory lists road and windblown dust as significant sources, whereas chemical mass balance analy-sis shows such dust to be a very small contribu-tor on ambient filters. There are several likely rea-sons, a primary one being that what gets emitted does not necessarily stay airborne to be sampled. Thus, larger PM2.5 particles—those nearly 2.5mi-crons in diameter such as the bulk of geological dust—tend to settle out relatively quickly, where-as smaller particles—those less than 1 micron in diameter including combustion-related PM2.5—can stay airborne for days.
in addition to directly emitted PM, emissions of PM precursors such as nOx, ammonia and sulfur dioxide contribute to the formation of secondary PM. Combustion of fossil fuels produces nOx, which combines with ammonia in the atmosphere to form ammonium nitrate and sulfur dioxide (SO2), which combines with ammonia to form ammonium sulfate. These secondary compounds constitute one-third of Bay area PM2.5 on an annual basis and approximately 40–45 percent during winter peak periods.
Figure 2-8 shows estimated contributions to both primary and secondary annual average PM2.5 by source. The contributions in Figure 2-8 differ from those in Figure 2-6 in a number of respects: Sea salt constitutes about 9 percent of Bay area PM2.5, but is not included in the emissions inventory. emissions of nOx from motor vehicles contribute significantly to secondary PM2.5, namely ammoni-um nitrate. Because of this, the overall contribution of motor vehicles to PM2.5 concentrations is con-siderably larger than their direct emissions alone. Similarly, refineries emit significant amounts of SO2, so that their contribution to ammonium sulfate is significant. Also, animals, fertilizers and landfills emit ammonia, which contributes to the formation of ammonium nitrate and sulfate. nevertheless, most Bay area anthropogenic PM2.5 derives from combustion—either wood (biomass) burning, or combustion of fossil fuels.
...most Bay Area anthropogenic PM2.5 derives from combustion –
either wood (biomass) burning, or combustion of fossil fuels.

Chapter 2 air pollution and publiC health
2/20 Bay area air Quality ManageMent District | Clean air Plan 2017
Figure 2-8. Contributions to Annual PM2.5 Concentrations in the Bay Area, 2011–2013
On-Road Motor Vehicles
14%
On-Road Off-Road Motor Vehicles
6%
Biomass Burning*30%
Cooking9%Planes, Trains, Ships
5%
Refining5%
Power Generation4%
Biogenic10%
Sea Salt9%
Other8%
* These estimates derive from combining the source category contribution estimates from 4 sites: livermore, San Jose, Vallejo, and West Oakland for 2009–2011, with detailed emissions estimates from the Air District’s emissions inventory.
Toxic Air Contaminants
Toxic air contaminants are a class of pollutants that includes hundreds of individual airborne chemical species hazardous to human health. Many TaCs are commonly present in urban environments. re-ducing emissions of TaCs and population expo-sure to these pollutants is a key priority for the air District.
TaCs can cause or contribute to a wide range of health effects. acute (short-term) health effects may include eye and throat irritation. Chronic (long-term) exposure to TaCs may cause more severe effects such as neurological damage, hormone disruption, developmental defects and cancer. ARB has identified roughly 200 TACs, in-cluding diesel particulate matter (diesel PM) and environmental tobacco smoke.
Unlike criteria pollutants which are subject to am-bient air quality standards, TaCs are primarily regulated at the individual emissions source level based on risk assessment. Human outdoor ex-posure risk associated with an individual air toxic species is calculated as its ground-level concen-tration multiplied by an established unit risk factor for that air toxic species. Total risk due to TaCs is the sum of the individual risks associated with each air toxic species.
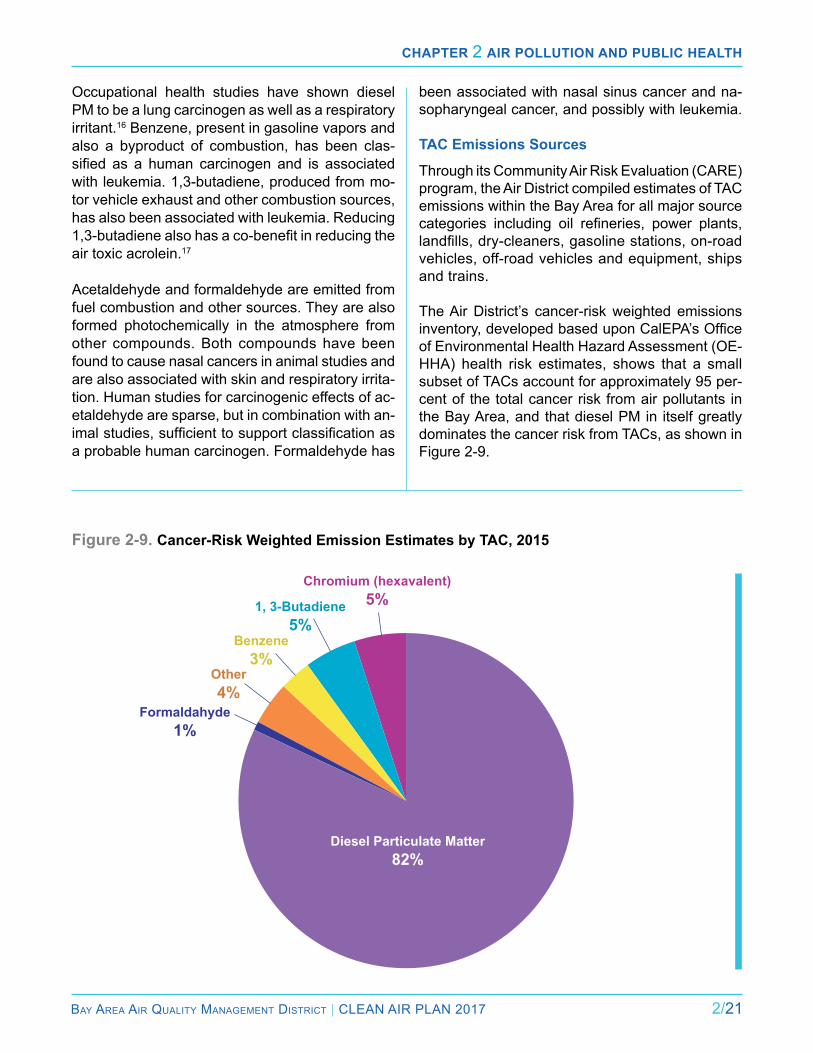
Chapter 2 air pollution and publiC health
Bay area air Quality ManageMent District | Clean air Plan 2017 2/21
Occupational health studies have shown diesel PM to be a lung carcinogen as well as a respiratory irritant.16 Benzene, present in gasoline vapors and also a byproduct of combustion, has been clas-sified as a human carcinogen and is associated with leukemia. 1,3-butadiene, produced from mo-tor vehicle exhaust and other combustion sources, has also been associated with leukemia. reducing 1,3-butadiene also has a co-benefit in reducing the air toxic acrolein.17
acetaldehyde and formaldehyde are emitted from fuel combustion and other sources. They are also formed photochemically in the atmosphere from other compounds. Both compounds have been found to cause nasal cancers in animal studies and are also associated with skin and respiratory irrita-tion. Human studies for carcinogenic effects of ac-etaldehyde are sparse, but in combination with an-imal studies, sufficient to support classification as a probable human carcinogen. Formaldehyde has
been associated with nasal sinus cancer and na-sopharyngeal cancer, and possibly with leukemia.
TAC Emissions Sources
Through its Community air risk evaluation (Care) program, the air District compiled estimates of TaC emissions within the Bay area for all major source categories including oil refineries, power plants, landfills, dry-cleaners, gasoline stations, on-road vehicles, off-road vehicles and equipment, ships and trains. The air District’s cancer-risk weighted emissions inventory, developed based upon CalEPA’s Office of environmental Health Hazard assessment (Oe-HHa) health risk estimates, shows that a small subset of TaCs account for approximately 95 per-cent of the total cancer risk from air pollutants in the Bay area, and that diesel PM in itself greatly dominates the cancer risk from TaCs, as shown in Figure 2-9.
Figure 2-9. Cancer-Risk Weighted Emission Estimates by TAC, 2015On-Road
Chromium (hexavalent)5%
Diesel Particulate Matter82%
1, 3-Butadiene5%
Benzene3%
Other4%
Formaldahyde1%
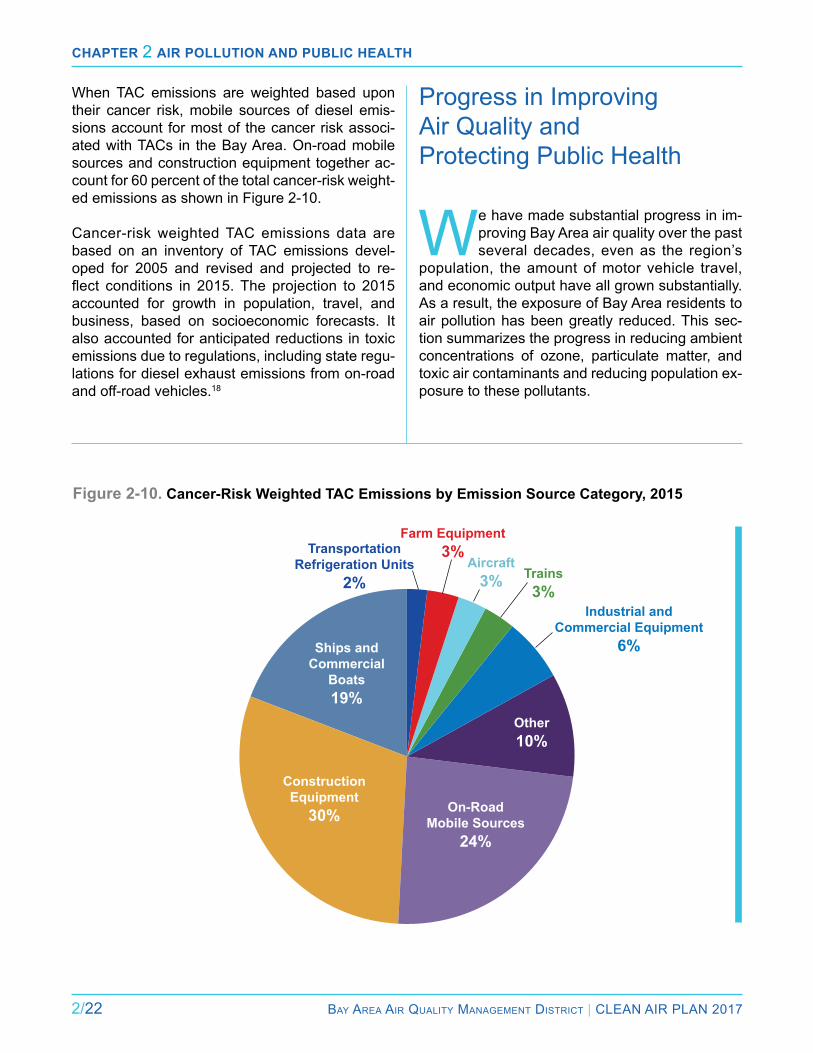
Chapter 2 air pollution and publiC health
2/22 Bay area air Quality ManageMent District | Clean air Plan 2017
When TAC emissions are weighted based upon their cancer risk, mobile sources of diesel emis-sions account for most of the cancer risk associ-ated with TaCs in the Bay area. On-road mobile sources and construction equipment together ac-count for 60 percent of the total cancer-risk weight-ed emissions as shown in Figure 2-10.
Cancer-risk weighted TaC emissions data are based on an inventory of TaC emissions devel-oped for 2005 and revised and projected to re-flect conditions in 2015. The projection to 2015 accounted for growth in population, travel, and business, based on socioeconomic forecasts. it also accounted for anticipated reductions in toxic emissions due to regulations, including state regu-lations for diesel exhaust emissions from on-road and off-road vehicles.18
Figure 2-10. Cancer-Risk Weighted TAC Emissions by Emission Source Category, 2015
On-Road Mobile Sources
24%
ConstructionEquipment
30%
Other10%
Ships and Commercial
Boats19%
Industrial and Commercial Equipment
6%
Trains3%
Aircraft3%
Farm Equipment3%Transportation
Refrigeration Units2%
Progress in improving air Quality and Protecting Public Health
We have made substantial progress in im-proving Bay area air quality over the past several decades, even as the region’s
population, the amount of motor vehicle travel, and economic output have all grown substantially. as a result, the exposure of Bay area residents to air pollution has been greatly reduced. This sec-tion summarizes the progress in reducing ambient concentrations of ozone, particulate matter, and toxic air contaminants and reducing population ex-posure to these pollutants.
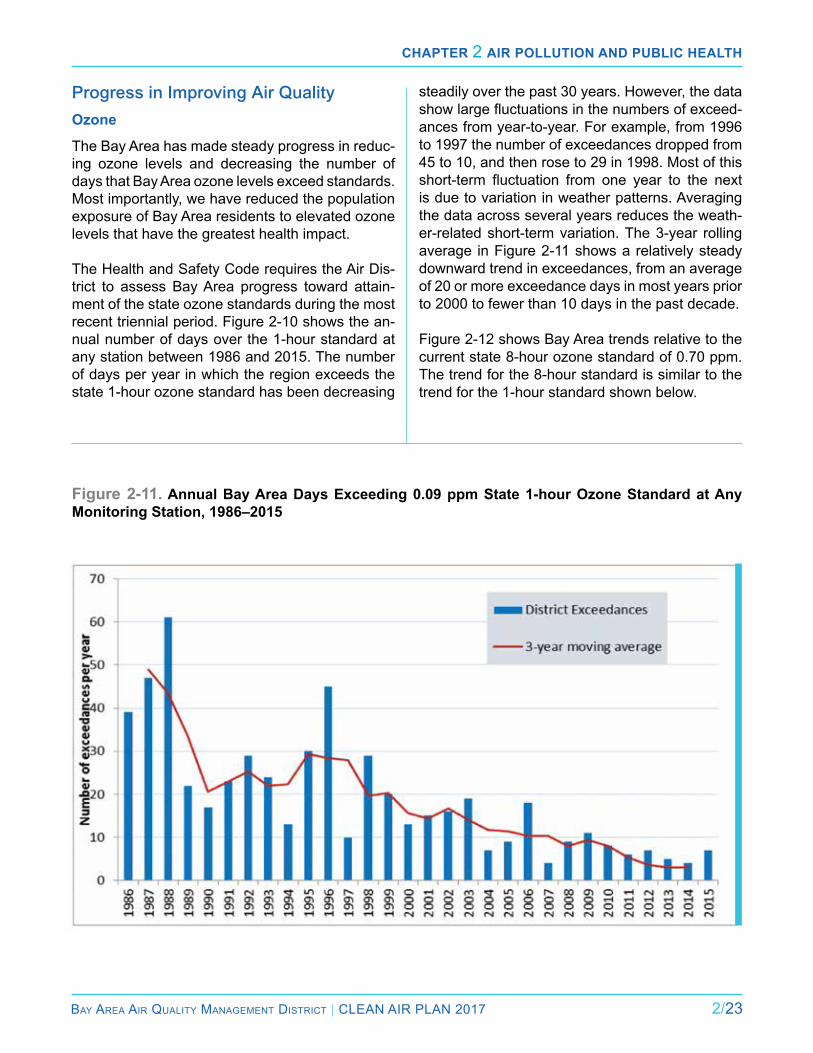
Chapter 2 air pollution and publiC health
Bay area air Quality ManageMent District | Clean air Plan 2017 2/23
steadily over the past 30 years. However, the data show large fluctuations in the numbers of exceed-ances from year-to-year. For example, from 1996 to 1997 the number of exceedances dropped from 45 to 10, and then rose to 29 in 1998. Most of this short-term fluctuation from one year to the next is due to variation in weather patterns. averaging the data across several years reduces the weath-er-related short-term variation. The 3-year rolling average in Figure 2-11 shows a relatively steady downward trend in exceedances, from an average of 20 or more exceedance days in most years prior to 2000 to fewer than 10 days in the past decade.
Figure 2-12 shows Bay area trends relative to the current state 8-hour ozone standard of 0.70 ppm. The trend for the 8-hour standard is similar to the trend for the 1-hour standard shown below.
Figure 2-11. Annual Bay Area Days Exceeding 0.09 ppm State 1-hour Ozone Standard at Any Monitoring Station, 1986–2015
Progress in Improving Air QualityOzone
The Bay area has made steady progress in reduc-ing ozone levels and decreasing the number of days that Bay area ozone levels exceed standards. Most importantly, we have reduced the population exposure of Bay area residents to elevated ozone levels that have the greatest health impact.
The Health and Safety Code requires the air Dis-trict to assess Bay area progress toward attain-ment of the state ozone standards during the most recent triennial period. Figure 2-10 shows the an-nual number of days over the 1-hour standard at any station between 1986 and 2015. The number of days per year in which the region exceeds the state 1-hour ozone standard has been decreasing
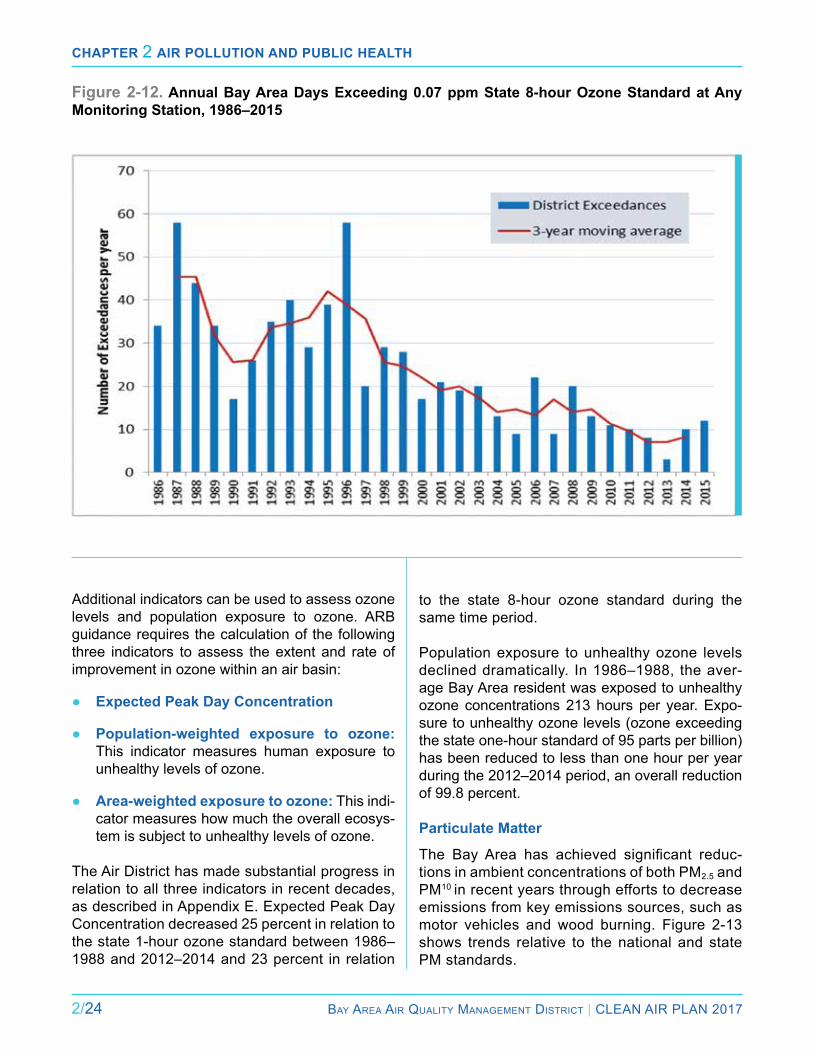
Chapter 2 air pollution and publiC health
2/24 Bay area air Quality ManageMent District | Clean air Plan 2017
additional indicators can be used to assess ozone levels and population exposure to ozone. arB guidance requires the calculation of the following three indicators to assess the extent and rate of improvement in ozone within an air basin:
● Expected Peak Day Concentration
● Population-weighted exposure to ozone: This indicator measures human exposure to unhealthy levels of ozone.
● Area-weighted exposure to ozone: This indi-cator measures how much the overall ecosys-tem is subject to unhealthy levels of ozone.
The air District has made substantial progress in relation to all three indicators in recent decades, as described in appendix e. expected Peak Day Concentration decreased 25 percent in relation to the state 1-hour ozone standard between 1986–1988 and 2012–2014 and 23 percent in relation
Figure 2-12. Annual Bay Area Days Exceeding 0.07 ppm State 8-hour Ozone Standard at Any Monitoring Station, 1986–2015
to the state 8-hour ozone standard during the same time period.
Population exposure to unhealthy ozone levels declined dramatically. In 1986–1988, the aver-age Bay area resident was exposed to unhealthy ozone concentrations 213 hours per year. expo-sure to unhealthy ozone levels (ozone exceeding the state one-hour standard of 95 parts per billion) has been reduced to less than one hour per year during the 2012–2014 period, an overall reduction of 99.8 percent.
Particulate Matter
The Bay Area has achieved significant reduc-tions in ambient concentrations of both PM2.5 and PM10 in recent years through efforts to decrease emissions from key emissions sources, such as motor vehicles and wood burning. Figure 2-13 shows trends relative to the national and state PM standards.
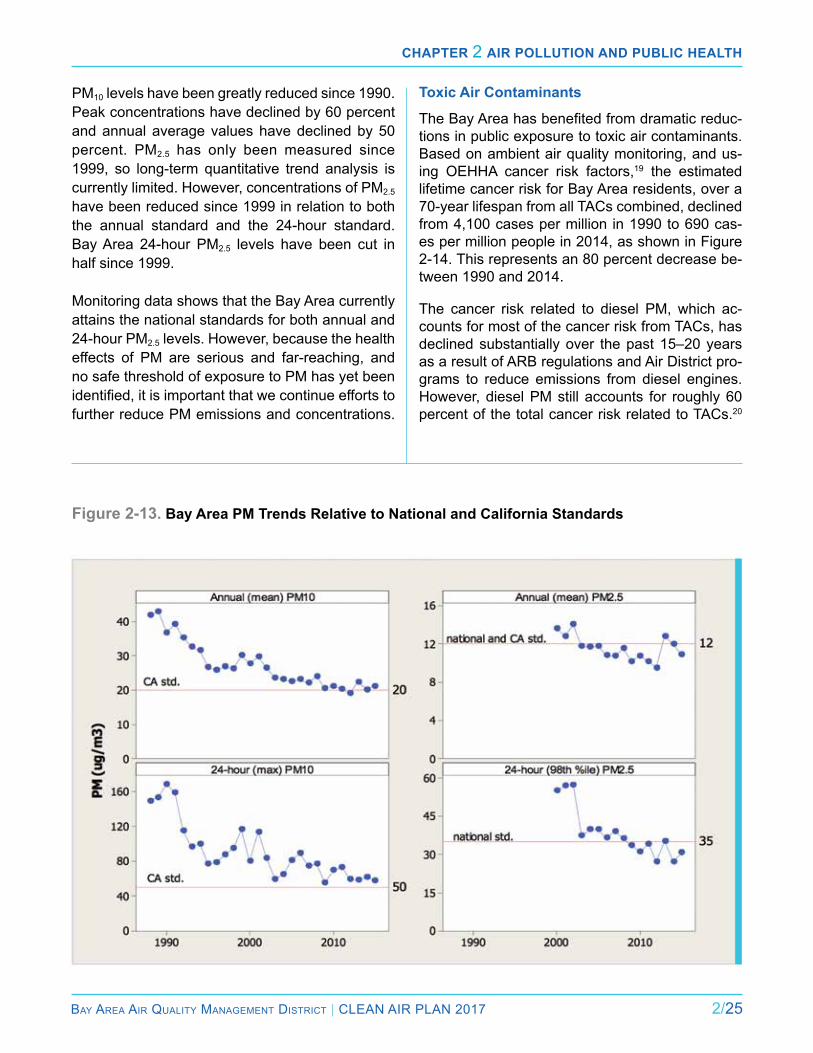
Chapter 2 air pollution and publiC health
Bay area air Quality ManageMent District | Clean air Plan 2017 2/25
Figure 2-13. Bay Area PM Trends Relative to National and California Standards
Toxic Air Contaminants
The Bay Area has benefited from dramatic reduc-tions in public exposure to toxic air contaminants. Based on ambient air quality monitoring, and us-ing OeHHa cancer risk factors,19 the estimated lifetime cancer risk for Bay area residents, over a 70-year lifespan from all TaCs combined, declined from 4,100 cases per million in 1990 to 690 cas-es per million people in 2014, as shown in Figure 2-14. This represents an 80 percent decrease be-tween 1990 and 2014.
The cancer risk related to diesel PM, which ac-counts for most of the cancer risk from TaCs, has declined substantially over the past 15–20 years as a result of arB regulations and air District pro-grams to reduce emissions from diesel engines. However, diesel PM still accounts for roughly 60 percent of the total cancer risk related to TaCs.20
PM10 levels have been greatly reduced since 1990. Peak concentrations have declined by 60 percent and annual average values have declined by 50 percent. PM2.5 has only been measured since 1999, so long-term quantitative trend analysis is currently limited. However, concentrations of PM2.5 have been reduced since 1999 in relation to both the annual standard and the 24-hour standard. Bay area 24-hour PM2.5 levels have been cut in half since 1999.
Monitoring data shows that the Bay area currently attains the national standards for both annual and 24-hour PM2.5 levels. However, because the health effects of PM are serious and far-reaching, and no safe threshold of exposure to PM has yet been identified, it is important that we continue efforts to further reduce PM emissions and concentrations.
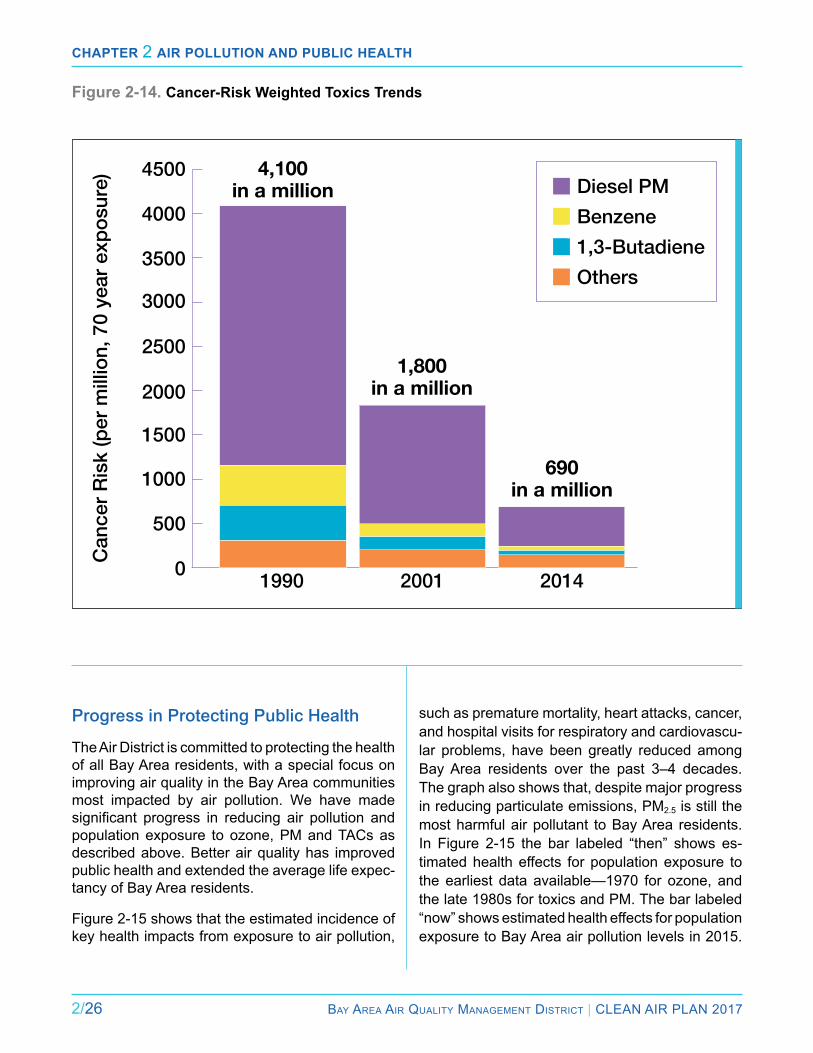
Chapter 2 air pollution and publiC health
2/26 Bay area air Quality ManageMent District | Clean air Plan 2017
Figure 2-14. Cancer-Risk Weighted Toxics Trends
Progress in Protecting Public Health The air District is committed to protecting the health of all Bay area residents, with a special focus on improving air quality in the Bay area communities most impacted by air pollution. We have made significant progress in reducing air pollution and population exposure to ozone, PM and TaCs as described above. Better air quality has improved public health and extended the average life expec-tancy of Bay area residents.
Figure 2-15 shows that the estimated incidence of key health impacts from exposure to air pollution,
such as premature mortality, heart attacks, cancer, and hospital visits for respiratory and cardiovascu-lar problems, have been greatly reduced among Bay Area residents over the past 3–4 decades. The graph also shows that, despite major progress in reducing particulate emissions, PM2.5 is still the most harmful air pollutant to Bay area residents. in Figure 2-15 the bar labeled “then” shows es-timated health effects for population exposure to the earliest data available—1970 for ozone, and the late 1980s for toxics and PM. The bar labeled “now” shows estimated health effects for population exposure to Bay area air pollution levels in 2015.
0
1000
500
1500
2000
2500
3000
3500
4000
4500
201420011990
Diesel PM Benzene 1,3-Butadiene Others
Can
cer R
isk
(per
mill
ion,
70
year
exp
osur
e)
4,100in a million
1,800in a million
690in a million
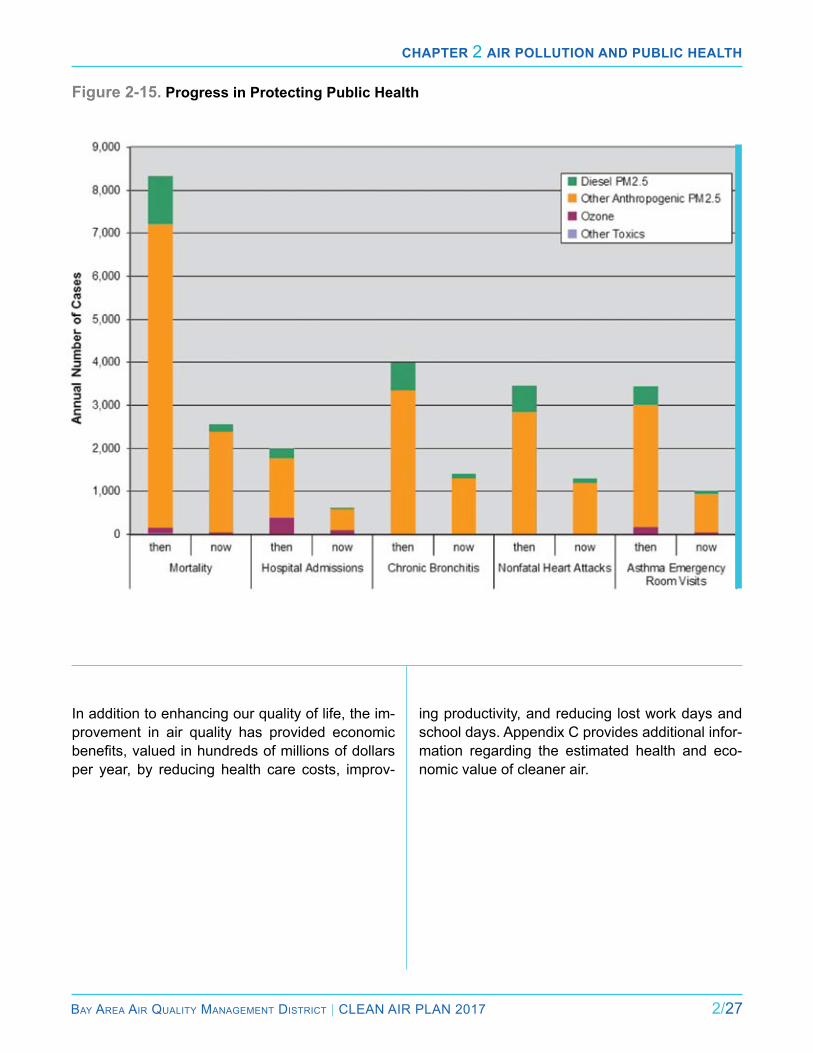
Chapter 2 air pollution and publiC health
Bay area air Quality ManageMent District | Clean air Plan 2017 2/27
Figure 2-15. Progress in Protecting Public Health
in addition to enhancing our quality of life, the im-provement in air quality has provided economic benefits, valued in hundreds of millions of dollars per year, by reducing health care costs, improv-
ing productivity, and reducing lost work days and school days. appendix C provides additional infor-mation regarding the estimated health and eco-nomic value of cleaner air.
Chapter 2 air pollution and publiC health
2/28 Bay area air Quality ManageMent District | Clean air Plan 2017
FooTnoTEs
1 There are no national or state ambient air quality standards for toxic air contaminants (with the exception of lead) or for greenhouse gases, such as carbon dioxide.
2 The term “criteria pollutant” refers to the fact that, in setting the naaQS, U.S. ePa develops a “Criteria Document” that summarizes the scientific evidence on the sources, concentrations, atmospheric dynamics, and health effects of a pollutant.
3 http://www.baaqmd.gov/~/media/files/technical-services/2014_network_plan.pdf?la=en
4 in addition to anthropogenic sources, there are also natural or “biogenic” sources of some pollutants. For example, some species of trees and vegetation emit volatile organic compounds (VOC) that contribute to formation of ozone in the atmosphere.
5 The emissions inventories are available at www.baaqmd.gov/research-and-data/emission-inventory.
6 While ground-level ozone is a harmful air pollutant, ozone in the upper atmosphere is beneficial because it blocks the sun’s harmful ultraviolet rays. The 2017 Clean air Plan addresses ground-level ozone only.
7 The need to reduce damage to orchards in the Santa Clara Valley was a major factor in the creation of the air District in 1955, when agriculture was a much larger part of the economy in the South Bay.
8 The state and national 8-hour standards are currently set at the same numerical value (0.070 ppm). However, attaining the state standard is more difficult because a region is considered to violate the state standard if the standard is exceeded even once at any monitoring site. By contrast, the determination as to whether a region attains the national standard is determined based upon the 3-year average of the annual 4th-highest daily maximum concentration at the monitoring site with the highest ozone levels.
9 as discussed in appendix F, for the state 1-hour ozone standard, the expected peak day concentration decreased an average of 0.9 percent per year across all Bay Area sites between 1986–1988 and 2012–2014, for a total reduction of 25 percent over that period. For the state 8-hour ozone standard, the expected peak day concentration decreased an average, of 0.8 percent per year over that period, with an overall reduction of 23 percent over that period. During the period from 2008 through 2013, the reduction was 1.6 percent per year in 1-hour ozone and 0.5 percent per year in 8-hour ozone, indicating that progress has continued in recent years.
10 additional information on PM health effects can be found in the november 2012 BaaQMD report entitled Understanding Particulate Matter. http://www.baaqmd.gov/~/media/Files/Planning%20and%20research/Plans/PM%20Planning/ParticulatesMatter_nov%207.ashx?la=en
11 Pope, C. arden iii et al. “Fine Particulate air Pollution and life expectancy in the United States.” new england Journal of Medicine, January 22, 2009. Volume 360:376-386. no. 4.
12 robert Brook et al. “insights into the Mechanism and Mediators of the effects of air Pollution exposure on Blood Pressure and Vascular Function in Healthy Humans.” Hypertension: Journal of the american Heart association, July 29, 2009.
13 Oxidative stress-induced DNA damage by particulate air pollution, risom, l, et al. December 30 2005.
14 O’Donnell et al. Particulate Matter and Acute Ischemic Stroke, epidemiology, Volume 22, number 3, May 2011.
15 Personal Exposure to Ultrafine Particles and Oxidative DNA Damage, Vinzents, Peter S., et al. May 31 2005. (it should be noted that drivers and pedestrians may well be subject to similar effects from exposure to PM from motor vehicles.)
16 “Health risk assessment for Diesel exhaust,” Chapter 6.2. Office of Environmental Health Hazard Assessment, California environmental Protection agency, May 1998.
17 acrolein, which is emitted directly in combustion processes and chemically produced from 1,3-butadiene in the atmosphere, has been associated with both chronic and acute health effects, including respiratory aliments, decreased respiratory function and eye irritation.
18 More details of 2015 TaC emissions estimates are provided in an online report: Preparation of future-year emissions inventories of toxic air contaminants for the San Francisco Bay area, april 23, 2010, Sonoma Technology, inc., Contract no. 2009-127. http://www.baaqmd.gov/plans-and-climate/community-air-risk-evaluation-care-program/documents.
19 On March 6, 2015, OeHHa adopted a revised air Toxics Hot Spots Program Guidance Manual for the Preparation of Health risk assessments to replace the 2003 air Toxic Hot Spots Guidance Manual. OeHHa’s 2015 Hra Guidelines reflect both children’s greater sensitivity to toxic air contaminants and more refined data related to childhood and adult exposure to air toxics. OeHHa’s 2015 Hra Guidelines affect how risk assessments are
Chapter 2 air pollution and publiC health
Bay area air Quality ManageMent District | Clean air Plan 2017 2/29
conducted. On July 23, 2015, California air resources Board (CarB) adopted the CarB/CaPCOa risk Management Guidance for Stationary Sources of air Toxics. This document provides guidance on managing potential cancer and non-cancer health risks from sources subject to air Toxics new Source review Permitting and air Toxics Hot Spots Programs. This document includes additional recommendations that affect how risk is calculated for certain types of risk assessments. The cancer risk estimates shown in Figure 2-13 are higher than the estimates provided in documents such as the Bay area 2010 Clean air Plan and the april 2014 Care
report entitled Improving Air Quality and Health in Bay Area Communities. it should be emphasized that the higher risk estimates shown in Figure 2-13 are due solely to changes in the methodology used to estimate cancer risk, and not to any actual increase in TaC emissions or population exposure to TaCs.
20 Unlike most other TaCs, diesel PM cannot be measured directly because no accepted measurement method currently exists. Therefore, the concentration estimates for diesel PM have been made using elemental carbon measurements.

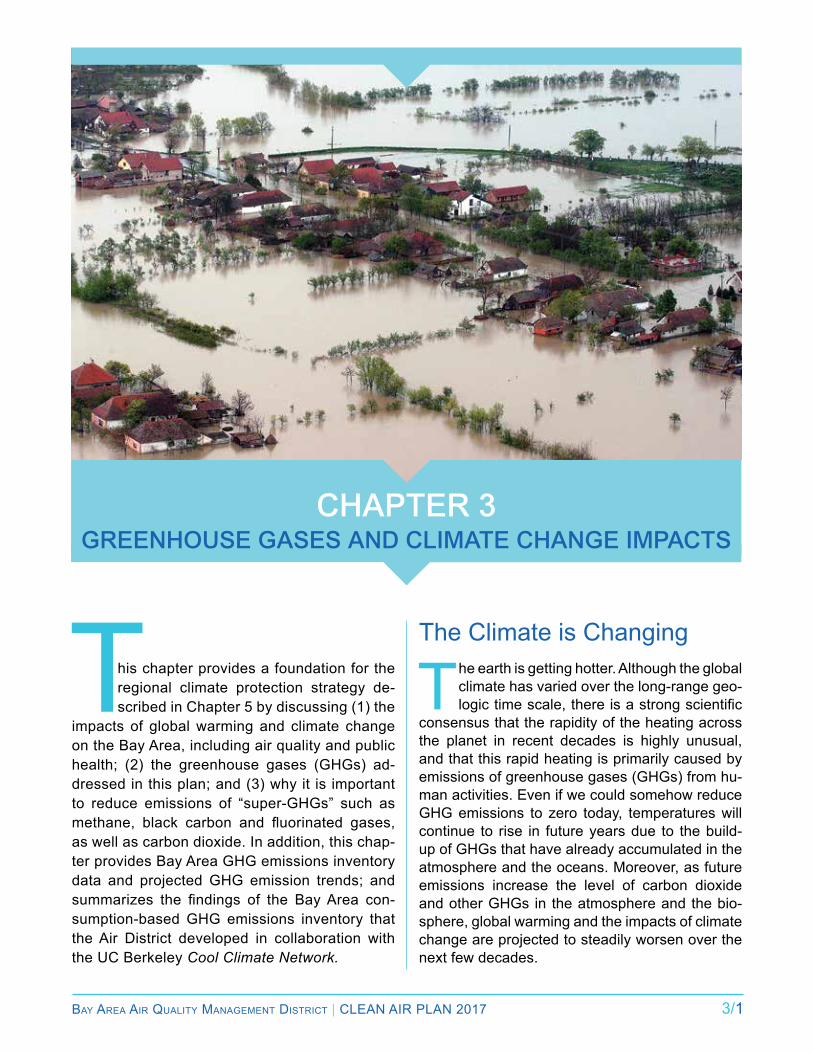
Bay area air Quality ManageMent District | Clean air Plan 2017 3/1
Chapter 3Greenhouse Gases and Climate ChanGe impaCts
This chapter provides a foundation for the regional climate protection strategy de-scribed in Chapter 5 by discussing (1) the
impacts of global warming and climate change on the Bay area, including air quality and public health; (2) the greenhouse gases (GHGs) ad-dressed in this plan; and (3) why it is important to reduce emissions of “super-GHGs” such as methane, black carbon and fluorinated gases, as well as carbon dioxide. in addition, this chap-ter provides Bay area GHG emissions inventory data and projected GHG emission trends; and summarizes the findings of the Bay Area con-sumption-based GHG emissions inventory that the air District developed in collaboration with the UC Berkeley Cool Climate Network.
The Climate is Changing
The earth is getting hotter. although the global climate has varied over the long-range geo-logic time scale, there is a strong scientific
consensus that the rapidity of the heating across the planet in recent decades is highly unusual, and that this rapid heating is primarily caused by emissions of greenhouse gases (GHGs) from hu-man activities. even if we could somehow reduce GHG emissions to zero today, temperatures will continue to rise in future years due to the build-up of GHGs that have already accumulated in the atmosphere and the oceans. Moreover, as future emissions increase the level of carbon dioxide and other GHGs in the atmosphere and the bio-sphere, global warming and the impacts of climate change are projected to steadily worsen over the next few decades.
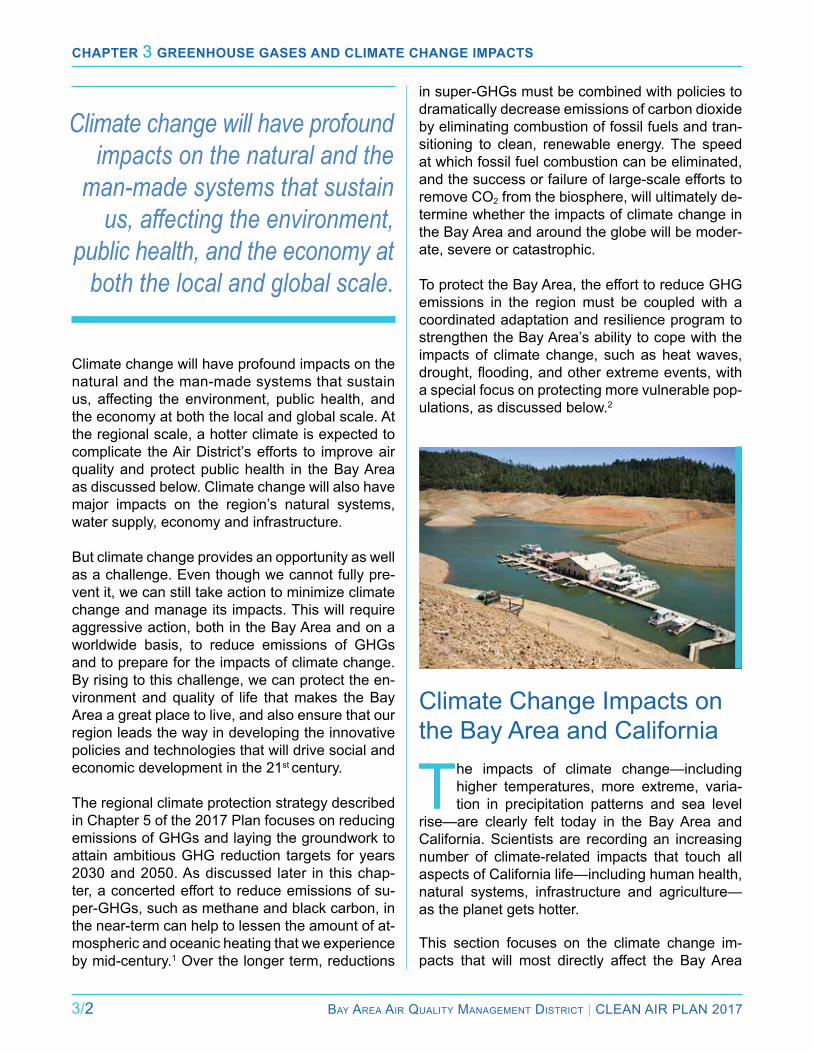
Chapter 3 Greenhouse Gases and Climate ChanGe impaCts
3/2 Bay area air Quality ManageMent District | Clean air Plan 2017
Climate change will have profound impacts on the natural and the man-made systems that sustain us, affecting the environment, public health, and the economy at both the local and global scale. at the regional scale, a hotter climate is expected to complicate the air District’s efforts to improve air quality and protect public health in the Bay area as discussed below. Climate change will also have major impacts on the region’s natural systems, water supply, economy and infrastructure.
But climate change provides an opportunity as well as a challenge. even though we cannot fully pre-vent it, we can still take action to minimize climate change and manage its impacts. This will require aggressive action, both in the Bay area and on a worldwide basis, to reduce emissions of GHGs and to prepare for the impacts of climate change. By rising to this challenge, we can protect the en-vironment and quality of life that makes the Bay area a great place to live, and also ensure that our region leads the way in developing the innovative policies and technologies that will drive social and economic development in the 21st century.
The regional climate protection strategy described in Chapter 5 of the 2017 Plan focuses on reducing emissions of GHGs and laying the groundwork to attain ambitious GHG reduction targets for years 2030 and 2050. as discussed later in this chap-ter, a concerted effort to reduce emissions of su-per-GHGs, such as methane and black carbon, in the near-term can help to lessen the amount of at-mospheric and oceanic heating that we experience by mid-century.1 Over the longer term, reductions
Climate change will have profound impacts on the natural and the
man-made systems that sustain us, affecting the environment,
public health, and the economy at both the local and global scale.
in super-GHGs must be combined with policies to dramatically decrease emissions of carbon dioxide by eliminating combustion of fossil fuels and tran-sitioning to clean, renewable energy. The speed at which fossil fuel combustion can be eliminated, and the success or failure of large-scale efforts to remove CO2 from the biosphere, will ultimately de-termine whether the impacts of climate change in the Bay area and around the globe will be moder-ate, severe or catastrophic.
To protect the Bay area, the effort to reduce GHG emissions in the region must be coupled with a coordinated adaptation and resilience program to strengthen the Bay area’s ability to cope with the impacts of climate change, such as heat waves, drought, flooding, and other extreme events, with a special focus on protecting more vulnerable pop-ulations, as discussed below.2
Climate Change impacts on the Bay area and California
The impacts of climate change—including higher temperatures, more extreme, varia-tion in precipitation patterns and sea level
rise—are clearly felt today in the Bay area and California. Scientists are recording an increasing number of climate-related impacts that touch all aspects of California life—including human health, natural systems, infrastructure and agriculture—as the planet gets hotter.
This section focuses on the climate change im-pacts that will most directly affect the Bay area

Chapter 3 Greenhouse Gases and Climate ChanGe impaCts
Bay area air Quality ManageMent District | Clean air Plan 2017 3/3
and California. However, the changes in our region must be viewed in the context of a global shift that is occurring on every continent as temperatures rise. The severity and the speed of global warm-ing and its impacts on climate are not uniformly distributed. in particular, due to several process-es described in the text box on page 3-3, the po-lar regions in both hemispheres are experiencing much more rapid warming than temperate and tropical regions.3 Melting of ice caps in areas like Greenland and the West antarctic Peninsula, in combination with the fact that water expands as it gets warmer, cause the sea level to rise, threat-ening coastal areas around the world. in addition
Climate FeedbaCk loops
In addition to increasing average global temperatures, the build-up of GHGs in the atmosphere and the oceans also affects the earth in various ways that can
further increase the rate of climate change. Examples of processes that can accelerate climate change include:
increase in water vapor: Water vapor in the atmosphere acts as a potent greenhouse gas. Higher temperatures caused by man-made emissions of GHGs cause more evaporation, thus increasing the amount of water vapor in the atmosphere. This increase in water vapor, in turn, causes more warming, which leads to more evaporation, in a feedback loop.
melting of ice and snow: Because ice and snow are white, they reflect sunlight, and thus help to cool the earth. But as the earth gets hotter, ice and snow have been melting on a massive scale in polar regions, and glaciers have been retreating across the globe. The loss of ice and snow uncovers darker land and water underneath, resulting in increased absorption of solar radiation, thus increasing global warming which leads to more melting and then more heating.
melting of permafrost: Permafrost in arctic regions holds enormous quantities of locked-in methane, a potent greenhouse gas. When permafrost melts in response to higher temperatures, the release of the previously locked methane leads to more global warming, which in turn leads to more melting of permafrost and release of additional methane, resulting in a cyclical effect.
Warming of oceans: The oceans act as huge sponges, absorbing carbon dioxide, thus dampening the process of global warming. Oceans have absorbed roughly half the CO2 emitted since the beginning of the Industrial Revolution. But absorption of CO2 is causing the oceans to acidify, which seriously imperils aquatic ecosystems such as coral reefs. In addition, as oceans become warmer and more acidic, their ability to absorb more CO2 is reduced. As the ability of oceans to absorb CO2 diminishes, the concentration of CO2 in the atmosphere will rise more rapidly, and in turn accelerate global warming.
To avoid these effects that accelerate climate change, we need to act quickly and aggressively to reduce GHG emissions, especially methane and super-GHGs.
to direct impacts at the regional scale that are de-scribed below, the Bay area will also be affected by changes in climate across the planet through impacts on our food, water, energy, and industrial networks; international migration patterns; and po-tential global instability related to climate change.
in the last 5 years, California has experienced some of the most extreme climate events in its recorded history—a severe 4-year drought, a dramatic reduction in the Sierra nevada winter snowpack, five of the state’s 20 largest forest fires since 1932 (when accurate record-keeping be-gan),4 and two years back-to-back of the hottest average temperatures.5
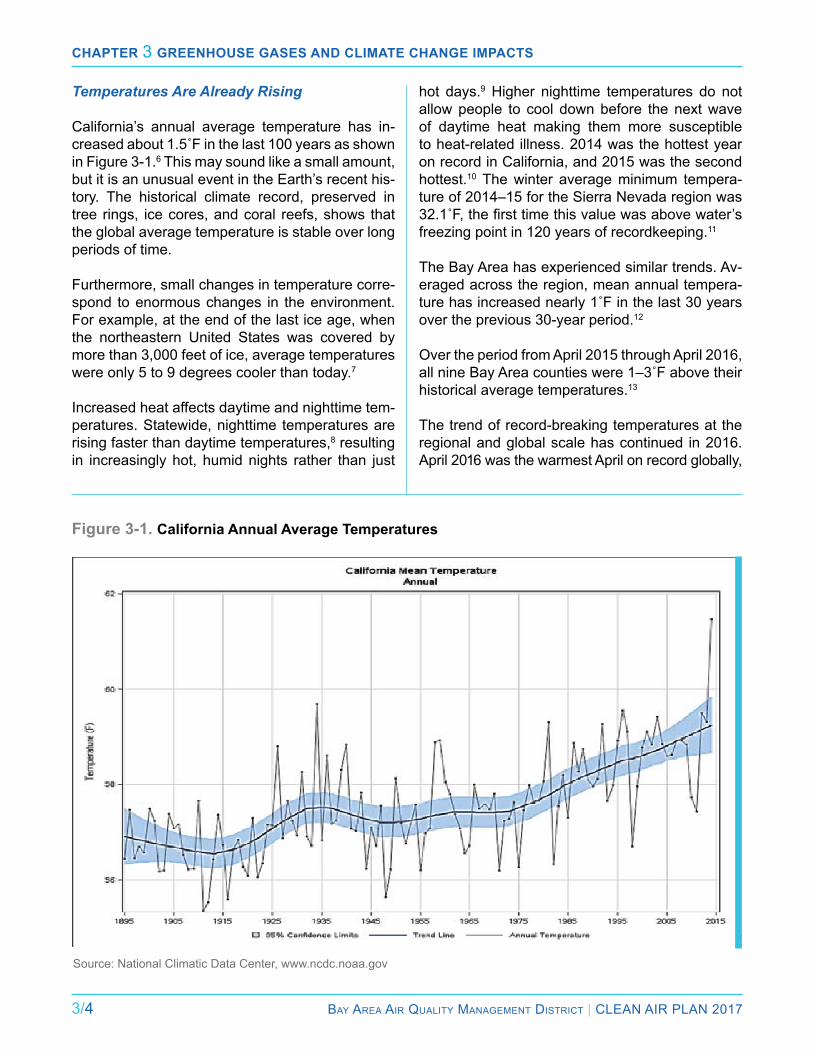
Chapter 3 Greenhouse Gases and Climate ChanGe impaCts
3/4 Bay area air Quality ManageMent District | Clean air Plan 2017
Temperatures Are Already Rising
California’s annual average temperature has in-creased about 1.5˚F in the last 100 years as shown in Figure 3-1.6 This may sound like a small amount, but it is an unusual event in the earth’s recent his-tory. The historical climate record, preserved in tree rings, ice cores, and coral reefs, shows that the global average temperature is stable over long periods of time.
Furthermore, small changes in temperature corre-spond to enormous changes in the environment. For example, at the end of the last ice age, when the northeastern United States was covered by more than 3,000 feet of ice, average temperatures were only 5 to 9 degrees cooler than today.7
increased heat affects daytime and nighttime tem-peratures. Statewide, nighttime temperatures are rising faster than daytime temperatures,8 resulting in increasingly hot, humid nights rather than just
hot days.9 Higher nighttime temperatures do not allow people to cool down before the next wave of daytime heat making them more susceptible to heat-related illness. 2014 was the hottest year on record in California, and 2015 was the second hottest.10 The winter average minimum tempera-ture of 2014–15 for the Sierra nevada region was 32.1˚F, the first time this value was above water’s freezing point in 120 years of recordkeeping.11
The Bay area has experienced similar trends. av-eraged across the region, mean annual tempera-ture has increased nearly 1˚F in the last 30 years over the previous 30-year period.12
Over the period from april 2015 through april 2016, all nine Bay Area counties were 1–3˚F above their historical average temperatures.13
The trend of record-breaking temperatures at the regional and global scale has continued in 2016. april 2016 was the warmest april on record globally,
!Source: national Climatic Data Center, www.ncdc.noaa.gov
Figure 3-1. California Annual Average Temperatures
Chapter 3 Greenhouse Gases and Climate ChanGe impaCts
Bay area air Quality ManageMent District | Clean air Plan 2017 3/5
and is the 12th consecutive month that a monthly global record temperature has been broken, the lon-gest such streak in 137 years of record-keeping.14
Temperatures Are Projected to Rise Substantially and More Extreme Hot Days Will Occur
By 2050, Bay area annual average temperatures are projected to increase by an additional 2.7˚F, without additional actions to reduce GHG emis-sions.15 Post-2050, projections show a wide range of substantial increases, between 3.6˚F–10.8˚F, depending upon how much we can cut emis-sions.16 Most importantly, the number of very hot days and severe heat waves are projected to increase significantly across the region by mid- century. Currently the Bay area averages 12 days per year with temperatures of 95˚F or more. If we continue on our current emissions path, the Bay area will likely experience 16 to 20 such days in the near term, 20 to 29 days by mid-century, and 32 to 65 days—more than two months—each year by century’s end.17
More Precipitation Extremes and More Rain, Less Snow
California and the Bay area are seeing more pre-cipitation extremes. extremes are increasing at both ends of the water spectrum in the Sierra ne-vada where, over the last 35 years, the region has experienced some of the wettest and the driest years in more than 100 years of record keeping.18
Stanford scientists recently reported that atmo-spheric patterns associated with droughts in Cali-fornia have occurred more frequently in recent de-cades. The scientists also reported that California is having fewer ‘average’ years, and instead are seeing more extremes of both wet and dry years.19
in the Sierra nevada, the source of much of the Bay area’s water supply, warmer temperatures in recent decades have resulted in more precipita-tion falling as rain instead of snow.20 This poses a growing challenge for our water storage and dis-tribution systems and results in drier, longer fire seasons as there is less water ‘banked’ in snow-melt to last through the summer months.21 While it is unclear whether California will have more total precipitation or less, projections indicate that the “more rain/less snow” trend in the Sierra nevada is likely to continue and accelerate. as a result, the Sierra snowpack is projected to decrease very sig-nificantly by mid-century.22
a recent naSa study has found that a mega- drought of three decades would be “extremely likely” in the second half of the 21st century in the Southwest and California if emissions continue at the current pace.23 even if precipitation for the Bay area does not decline in future years, higher tem-peratures will produce water deficits, decrease soil moisture, dry out vegetation, and increase evapo-ration from reservoirs.24
Sea Level is Already Rising and is Projected to Rise Substantially in Coming Decades
Sea level at the Golden Gate Bridge has risen 8 inches over the last 100 years.25 The frequency of extreme high water events (e.g., above the 99.99th percentile) has increased 20 times since 1915. This has important implications for coastal flood-ing, erosion and related damages, such as main-tenance of shipping channels and clearance under bridges.26
The national research Council projects an addi-tional 2-12 inches locally by 2030 (2000 baseline), 5–24 inches by 2050, and 17–66 inches by 2100.The likely projections are 6 inches by 2030, 11 inches by 2050, and 36 inches by 2100.27 Howev-er, there are great uncertainties concerning these
Stanford scientists recently reported that atmospheric
patterns associated with droughts in California have occurred more frequently in
recent decades.
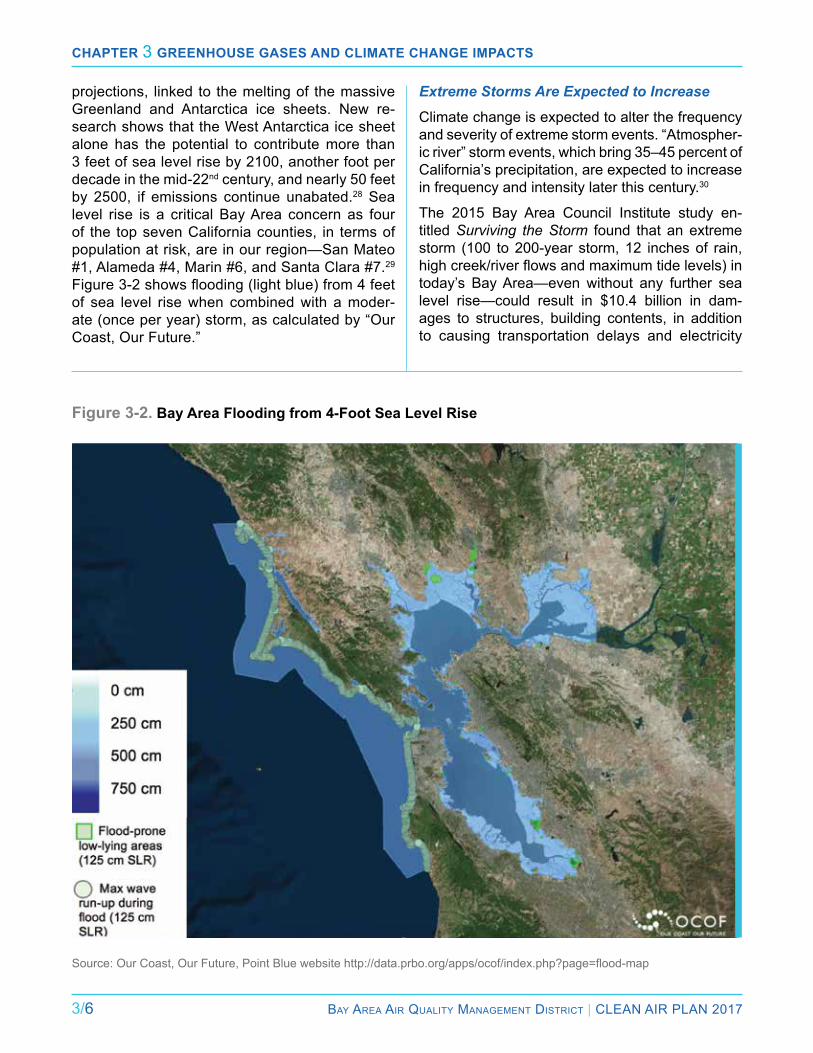
Chapter 3 Greenhouse Gases and Climate ChanGe impaCts
3/6 Bay area air Quality ManageMent District | Clean air Plan 2017
projections, linked to the melting of the massive Greenland and antarctica ice sheets. new re-search shows that the West antarctica ice sheet alone has the potential to contribute more than 3 feet of sea level rise by 2100, another foot per decade in the mid-22nd century, and nearly 50 feet by 2500, if emissions continue unabated.28 Sea level rise is a critical Bay area concern as four of the top seven California counties, in terms of population at risk, are in our region—San Mateo #1, alameda #4, Marin #6, and Santa Clara #7.29 Figure 3-2 shows flooding (light blue) from 4 feet of sea level rise when combined with a moder-ate (once per year) storm, as calculated by “Our Coast, Our Future.”
Extreme Storms Are Expected to Increase
Climate change is expected to alter the frequency and severity of extreme storm events. “atmospher-ic river” storm events, which bring 35–45 percent of California’s precipitation, are expected to increase in frequency and intensity later this century.30
The 2015 Bay area Council institute study en-titled Surviving the Storm found that an extreme storm (100 to 200-year storm, 12 inches of rain, high creek/river flows and maximum tide levels) in today’s Bay area—even without any further sea level rise—could result in $10.4 billion in dam-ages to structures, building contents, in addition to causing transportation delays and electricity
Figure 3-2. Bay Area Flooding from 4-Foot Sea Level Rise
Source: Our Coast, Our Future, Point Blue website http://data.prbo.org/apps/ocof/index.php?page=flood-map
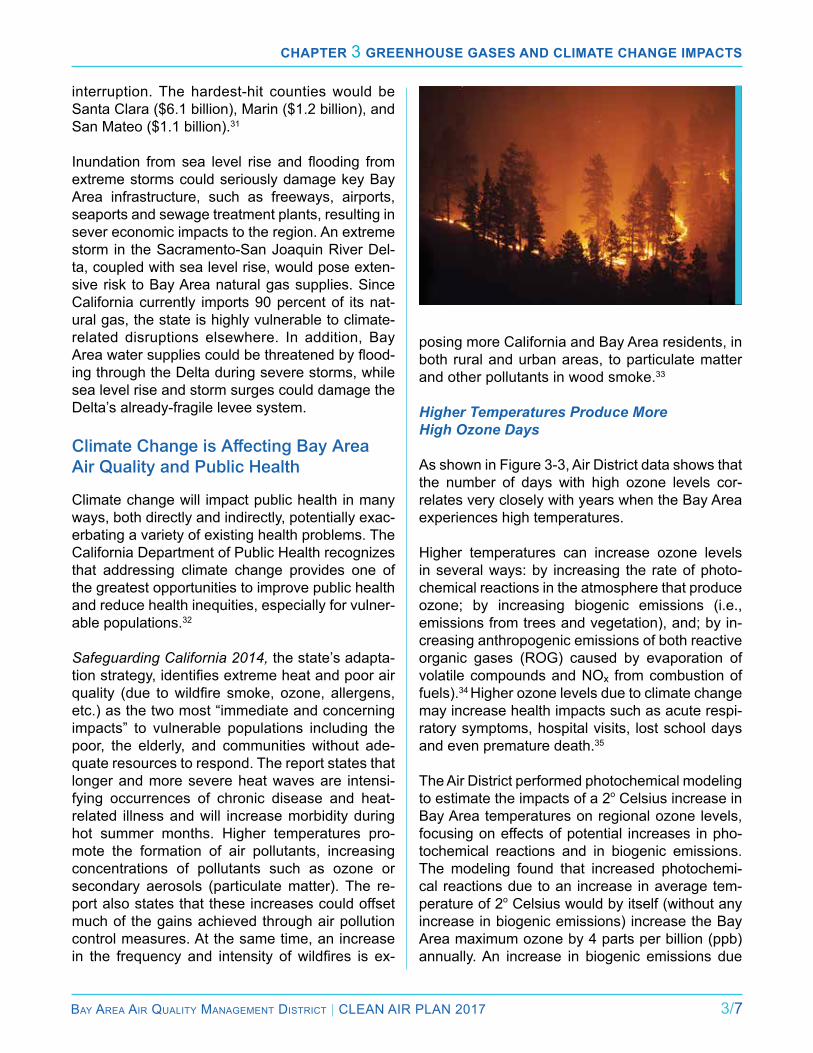
Chapter 3 Greenhouse Gases and Climate ChanGe impaCts
Bay area air Quality ManageMent District | Clean air Plan 2017 3/7
interruption. The hardest-hit counties would be Santa Clara ($6.1 billion), Marin ($1.2 billion), and San Mateo ($1.1 billion).31
Inundation from sea level rise and flooding from extreme storms could seriously damage key Bay area infrastructure, such as freeways, airports, seaports and sewage treatment plants, resulting in sever economic impacts to the region. an extreme storm in the Sacramento-San Joaquin river Del-ta, coupled with sea level rise, would pose exten-sive risk to Bay area natural gas supplies. Since California currently imports 90 percent of its nat-ural gas, the state is highly vulnerable to climate- related disruptions elsewhere. in addition, Bay Area water supplies could be threatened by flood-ing through the Delta during severe storms, while sea level rise and storm surges could damage the Delta’s already-fragile levee system.
Climate Change is Affecting Bay Area Air Quality and Public Health
Climate change will impact public health in many ways, both directly and indirectly, potentially exac-erbating a variety of existing health problems. The California Department of Public Health recognizes that addressing climate change provides one of the greatest opportunities to improve public health and reduce health inequities, especially for vulner-able populations.32
Safeguarding California 2014, the state’s adapta-tion strategy, identifies extreme heat and poor air quality (due to wildfire smoke, ozone, allergens, etc.) as the two most “immediate and concerning impacts” to vulnerable populations including the poor, the elderly, and communities without ade-quate resources to respond. The report states that longer and more severe heat waves are intensi-fying occurrences of chronic disease and heat- related illness and will increase morbidity during hot summer months. Higher temperatures pro-mote the formation of air pollutants, increasing concentrations of pollutants such as ozone or secondary aerosols (particulate matter). The re-port also states that these increases could offset much of the gains achieved through air pollution control measures. at the same time, an increase in the frequency and intensity of wildfires is ex-
posing more California and Bay area residents, in both rural and urban areas, to particulate matter and other pollutants in wood smoke.33 Higher Temperatures Produce More High Ozone Days
As shown in Figure 3-3, Air District data shows that the number of days with high ozone levels cor-relates very closely with years when the Bay area experiences high temperatures.
Higher temperatures can increase ozone levels in several ways: by increasing the rate of photo-chemical reactions in the atmosphere that produce ozone; by increasing biogenic emissions (i.e., emissions from trees and vegetation), and; by in-creasing anthropogenic emissions of both reactive organic gases (rOG) caused by evaporation of volatile compounds and nOx from combustion of fuels).34 Higher ozone levels due to climate change may increase health impacts such as acute respi-ratory symptoms, hospital visits, lost school days and even premature death.35
The air District performed photochemical modeling to estimate the impacts of a 2o Celsius increase in Bay area temperatures on regional ozone levels, focusing on effects of potential increases in pho-tochemical reactions and in biogenic emissions. The modeling found that increased photochemi-cal reactions due to an increase in average tem-perature of 2o Celsius would by itself (without any increase in biogenic emissions) increase the Bay area maximum ozone by 4 parts per billion (ppb) annually. an increase in biogenic emissions due
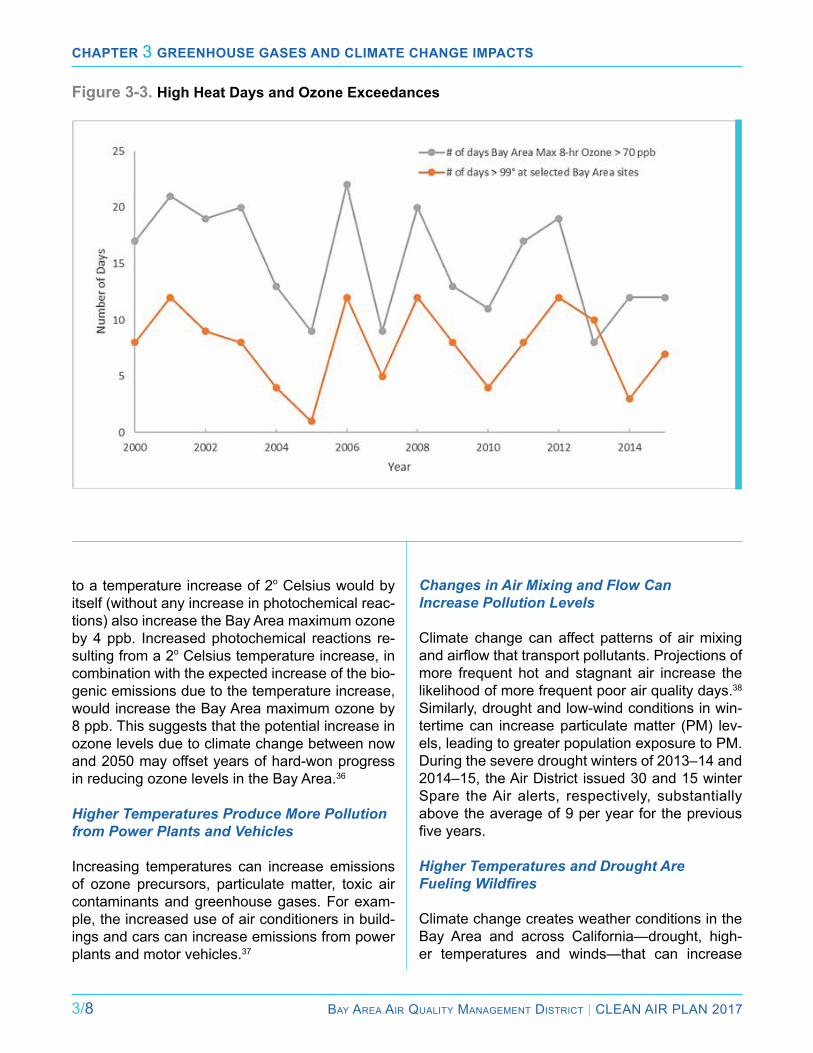
Chapter 3 Greenhouse Gases and Climate ChanGe impaCts
3/8 Bay area air Quality ManageMent District | Clean air Plan 2017
to a temperature increase of 2o Celsius would by itself (without any increase in photochemical reac-tions) also increase the Bay area maximum ozone by 4 ppb. increased photochemical reactions re-sulting from a 2o Celsius temperature increase, in combination with the expected increase of the bio-genic emissions due to the temperature increase, would increase the Bay area maximum ozone by 8 ppb. This suggests that the potential increase in ozone levels due to climate change between now and 2050 may offset years of hard-won progress in reducing ozone levels in the Bay area.36
Higher Temperatures Produce More Pollution from Power Plants and Vehicles
increasing temperatures can increase emissions of ozone precursors, particulate matter, toxic air contaminants and greenhouse gases. For exam-ple, the increased use of air conditioners in build-ings and cars can increase emissions from power plants and motor vehicles.37
Figure 3-3. High Heat Days and Ozone Exceedances
Changes in Air Mixing and Flow Can Increase Pollution Levels
Climate change can affect patterns of air mixing and airflow that transport pollutants. Projections of more frequent hot and stagnant air increase the likelihood of more frequent poor air quality days.38
Similarly, drought and low-wind conditions in win-tertime can increase particulate matter (PM) lev-els, leading to greater population exposure to PM. During the severe drought winters of 2013–14 and 2014–15, the air District issued 30 and 15 winter Spare the air alerts, respectively, substantially above the average of 9 per year for the previous five years.
Higher Temperatures and Drought Are Fueling Wildfires Climate change creates weather conditions in the Bay area and across California—drought, high-er temperatures and winds—that can increase
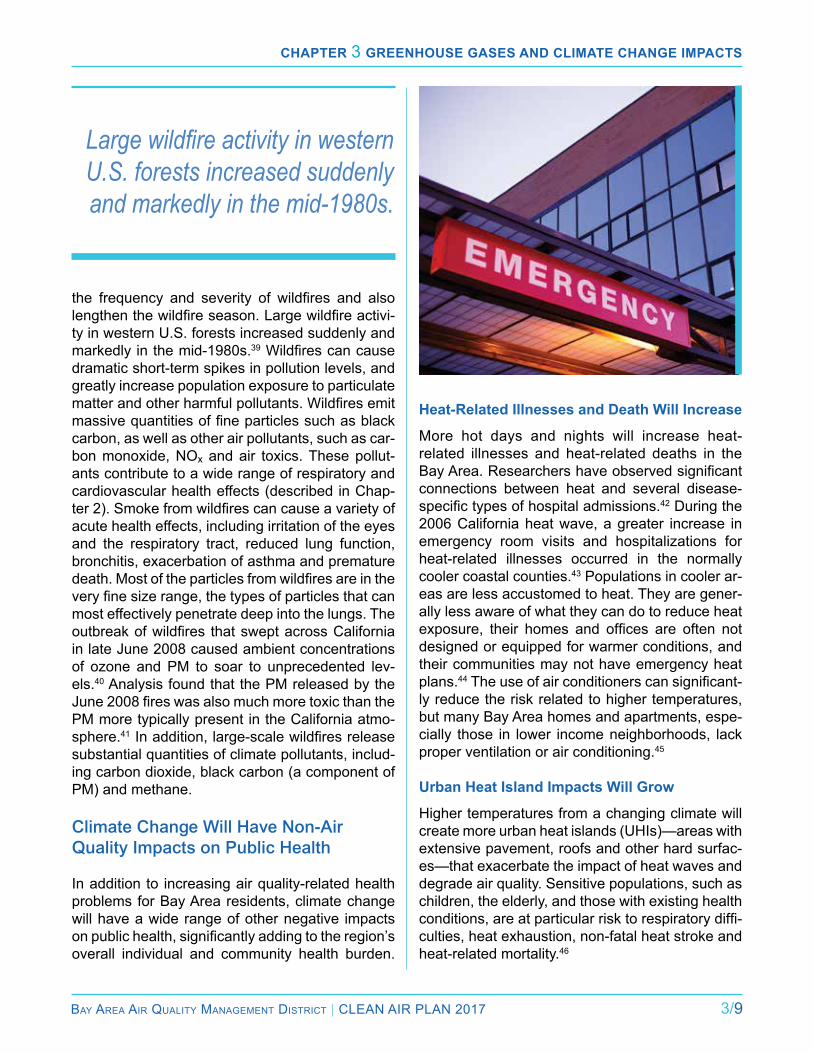
Chapter 3 Greenhouse Gases and Climate ChanGe impaCts
Bay area air Quality ManageMent District | Clean air Plan 2017 3/9
the frequency and severity of wildfires and also lengthen the wildfire season. Large wildfire activi-ty in western U.S. forests increased suddenly and markedly in the mid-1980s.39 Wildfires can cause dramatic short-term spikes in pollution levels, and greatly increase population exposure to particulate matter and other harmful pollutants. Wildfires emit massive quantities of fine particles such as black carbon, as well as other air pollutants, such as car-bon monoxide, nOx and air toxics. These pollut-ants contribute to a wide range of respiratory and cardiovascular health effects (described in Chap-ter 2). Smoke from wildfires can cause a variety of acute health effects, including irritation of the eyes and the respiratory tract, reduced lung function, bronchitis, exacerbation of asthma and premature death. Most of the particles from wildfires are in the very fine size range, the types of particles that can most effectively penetrate deep into the lungs. The outbreak of wildfires that swept across California in late June 2008 caused ambient concentrations of ozone and PM to soar to unprecedented lev-els.40 analysis found that the PM released by the June 2008 fires was also much more toxic than the PM more typically present in the California atmo-sphere.41 In addition, large-scale wildfires release substantial quantities of climate pollutants, includ-ing carbon dioxide, black carbon (a component of PM) and methane.
Climate Change Will Have Non-Air Quality Impacts on Public Health
in addition to increasing air quality-related health problems for Bay area residents, climate change will have a wide range of other negative impacts on public health, significantly adding to the region’s overall individual and community health burden.
Large wildfire activity in western U.S. forests increased suddenly and markedly in the mid-1980s.
Heat-Related Illnesses and Death Will Increase
More hot days and nights will increase heat- related illnesses and heat-related deaths in the Bay Area. Researchers have observed significant connections between heat and several disease- specific types of hospital admissions.42 During the 2006 California heat wave, a greater increase in emergency room visits and hospitalizations for heat-related illnesses occurred in the normally cooler coastal counties.43 Populations in cooler ar-eas are less accustomed to heat. They are gener-ally less aware of what they can do to reduce heat exposure, their homes and offices are often not designed or equipped for warmer conditions, and their communities may not have emergency heat plans.44 The use of air conditioners can significant-ly reduce the risk related to higher temperatures, but many Bay area homes and apartments, espe-cially those in lower income neighborhoods, lack proper ventilation or air conditioning.45
Urban Heat Island Impacts Will Grow
Higher temperatures from a changing climate will create more urban heat islands (UHis)—areas with extensive pavement, roofs and other hard surfac-es—that exacerbate the impact of heat waves and degrade air quality. Sensitive populations, such as children, the elderly, and those with existing health conditions, are at particular risk to respiratory diffi-culties, heat exhaustion, non-fatal heat stroke and heat-related mortality.46
Chapter 3 Greenhouse Gases and Climate ChanGe impaCts
3/10 Bay area air Quality ManageMent District | Clean air Plan 2017
The UHi effect on higher nighttime temperatures limits the ability of people to cool down and recov-er before the heat of the next day, thereby adding to the risk of illness and fatalities. Cities on aver-age have temperatures that are 1.8–5.4˚F hotter during the day than rural areas, and as high as 22˚F hotter at night, due to heat that is stored in paved surfaces and the built environment and re-leased after sundown.47
The air District’s advisory Council studied the im-pacts of UHis and issued a report in June 2015 which summarized relevant information and pro-vided recommendations on potential UHi mitiga-tion measures relating to cool roofs, cool paving, and urban tree-planting.48 Key recommendations from this report include the following:
● additional research is needed to determine where (in which climate zones) UHi mitiga-tions measures should be focused and which measures would be most effective.
● The air District should provide technical sup-port to local governments to incorporate air quality criteria into their street tree-selection processes, including carbon sequestration capacity, VOC emissions, and potential for PM capture.
● The air District should collaborate with local governments in warmer climates to incorpo-rate cool roof requirements into their local building codes. The air District should com-municate benefits of urban cooling measures as part of geographically-targeted public edu-cation campaigns.
The UHI effect on higher nighttime temperatures limits
the ability of people to cool down and recover before the
heat of the next day...
The advisory Council’s recommendations provide the basis for proposed control measure Bl-4 in the building sector.
Higher Temperatures Will Increase Vector-Borne Diseases
Climate change will affect transmission and in-fection patterns of vector-borne diseases. Higher temperatures cause changes in the geographic distribution of mosquitoes and ticks that carry dis-eases such West nile virus, lyme, dengue, Zika and malaria. West nile virus has been found in several Bay area counties since 2012.49 The types of mosquitoes that can carry Zika and dengue have been identified in the last few years for the first time in San Mateo County.50
Other Potential Impacts on Public Health
Higher temperatures will produce more plant pol-len and lengthen allergy seasons,51 aggravating asthma and other respiratory and cardiovascular diseases.52 Toxic materials stored in flood zones can contaminate housing, parks and other areas during flood events.53 and if the Bay area experi-ences extreme weather events related to climate change, this could result in mental health impacts, including post-traumatic stress disorder (PTSD), depression and general anxiety.54
Potential Impacts to Systems on Which Our Health Depends
in addition to direct impacts on health, extreme weather events related to climate change may disrupt critical infrastructure—such as power, wa-ter, transportation and communications—that are essential to medical and emergency services. ex-treme weather (e.g., drought, heat, storms) in local and distant food-producing areas could increase prices, produce shortages of important basic food items and disrupt distribution systems. Biodiver-sity and ecosystem degradation could also affect public health. Disruptions to natural ecosystems could increase the population of rodents and other vectors that pose health risks. in addition, an in-flux of climate refugees from regions and countries severely impacted by climate change could place an increased burden on Bay area housing, social services and other systems.

Chapter 3 Greenhouse Gases and Climate ChanGe impaCts
Bay area air Quality ManageMent District | Clean air Plan 2017 3/11
Vulnerable Populations Will Be Hit Harder
Certain Bay area populations and communities will be affected by climate change more than oth-ers. The degree to which individuals are impacted by climate change often depends upon a person’s age, race, income, language, educational attain-ment, housing conditions and pre-existing physical conditions, such as diabetes and mobility restric-tions.55 Drought, flooding, fires, and heat waves all pose health, economic, and logistical challenges to disadvantaged communities that may lack the financial and organizational resources to respond to and recover from a disaster.56
For example, not everyone is equally vulnerable to heat risks. Some groups—including those with pre-existing health conditions, the elderly, infants and children, socially isolated individuals, non- english speakers and the poor—are more sensi-tive to environmental stressors than others, and/or may lack the ability to cope or prepare for such impacts.57 The most intense urban heat island effects are often seen in neighborhoods where dense land use and paved surfaces are predom-inant and trees, vegetation and parks are less common.58 Studies in the Bay Area find minority and poorer populations have significantly lower access to common heat adaptation options, such as tree canopy for shading or car ownership to go to public cooling centers, than other segments of the population.59 an analysis of four major Califor-nia cities—San Francisco, Los Angeles, San Di-ego and Sacramento—found a direct relationship
between household income and land cover; e.g., neighborhoods with higher poverty rates have a higher percentage of paved surfaces and less tree coverage than wealthier neighborhoods.60 elderly people, who have a higher incidence of pre-existing chronic health conditions, will expe-rience the most difficulty in adapting to changing temperatures.61 Human vulnerability to future ex-treme heat events will increase due to California’s aging population. By 2050, the number of Califor-nia residents age 65 and older will more than dou-ble, and the number of residents age 85 and older will triple.62
extreme temperatures and poor air quality could also result in reduced productivity or job losses among outdoor workers in agriculture, construction, warehousing, delivery and ser-vice work.63 Climate-related loss of jobs could increase food insecurity, cause some individu-als to lose their homes, and produce other life- and health-changing situations, particularly for low-income individuals.
Finally, climate change poses immense chal-lenges for efforts to reduce Bay area health and economic inequities. low-income communities al-ready experience higher rates of chronic disease and lower life expectancy; these communities also have fewer resources to prepare for and re-spond to the impacts of climate change.64 More-over, increased governmental spending on cli-mate change infrastructure protection could affect low-income communities by diverting funds from education, social programs, public transportation and other critical sectors.65
The most intense urban heat island effects are often seen in
neighborhoods where dense land use and paved surfaces
are predominant...
Chapter 3 Greenhouse Gases and Climate ChanGe impaCts
3/12 Bay area air Quality ManageMent District | Clean air Plan 2017
Building Bay Area Resilience
although the Bay area climate impacts described above are daunting, action can be taken now to prepare, respond and recover from drought, flood-ing, extreme heat, new disease vectors, and oth-er impacts of a hotter planet. achieving a resilient Bay area that can cope with the impacts of climate change requires a coordinated and comprehen-sive approach that brings together all levels of government with the private, non-profit, academ-ic and community-based sectors. Fortunately, the work to build Bay area climate resilience has al-ready begun. Cities, counties, regional agencies and private asset owners are conducting local vul-nerability assessments for sea level rise. experts from Bay Area universities and scientific organiza-tions are implementing pilot projects to test new approaches to coastal and bayside flooding. State, regional and local authorities are exploring new policies to promote climate-appropriate develop-ment for a prosperous 21st century Bay area. local and state health departments are improving their plans to safeguard vulnerable populations during heat waves. These efforts should help the Bay area to respond to the impacts of climate change.
Greenhouse Gases addressed in this Plan
There are dozens of GHGs, but a small sub-set of these gases are the primary agents of climate change. For purposes of the 2017
Plan, we focus primarily on anthropogenic sources of the “Kyoto Six” GHGs, plus black carbon (BC).66
Achieving a resilient Bay Area that can cope with the
impacts of climate change requires a coordinated and comprehensive approach...
Carbon Dioxide (CO2) is released into the at-mosphere when fossil fuels (oil, gasoline, diesel, natural gas, coal), solid waste, and wood or wood products are burned.
Methane (CH4) is emitted during the production and transport of coal, natural gas and oil. Meth-ane emissions also result from the decomposition of organic waste in municipal solid waste landfills and the raising of livestock.
Nitrous oxide (n2O) is emitted during agricultural and industrial activities, as well as during combus-tion of solid waste and fossil fuels.
Hydrofluorocarbons (HFCs), perfluorocarbons (PFCs), and sulfur hexafluoride (SF6), are gen-erated by a variety of industrial processes. emis-sions of these fluorinated gases (F-gases) are small on a mass basis, but they are potent agents of climate change on a per unit basis.
Black carbon (BC): BC is a key component of fine particulate matter and has been identified as a potent agent of climate change. BC is the third largest GHG in the Bay area on a CO2-equivalent basis. Diesel engines and wood burning are key sources of BC in the Bay area. Since exposure to fine PM has a wide range of health impacts, as dis-cussed in Chapter 2, reducing emissions of BC will also provide important public health co-benefits. Global Warming Potential and Atmospheric Lifespan
The various greenhouse gases differ in terms of their atmospheric lifespan, as well as their potency in heating the climate. Both of these factors are used to calculate the global warming potential (GWP) of the various GHGs. GWP factors are critical for climate planning because they provide a means to express all the GHGs in terms of a single met-ric: CO2-equivalent (CO2e). The CO2e for a given quantity of any GHG is calculated by multiplying the mass of emissions by the appropriate GWP value.
GWP values are typically expressed based upon how much a given GHG will contribute to global warming over a 100-year time frame. The 100-year time frame is appropriate for CO2 and other gases
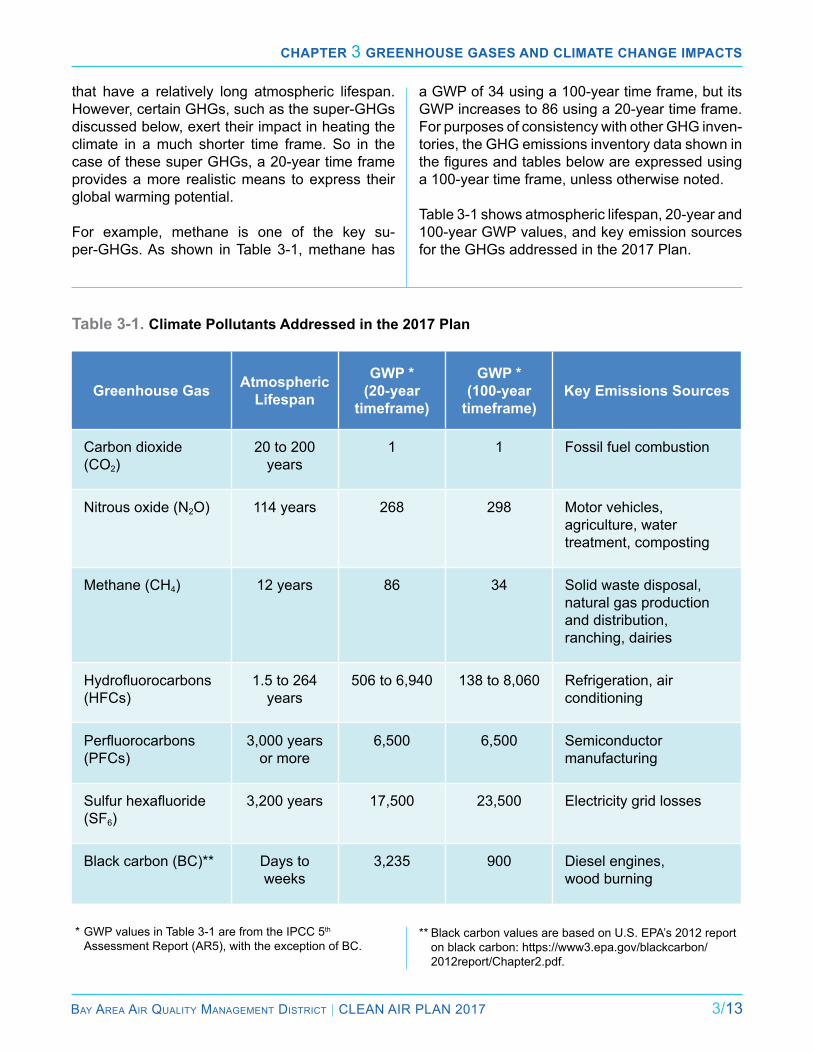
Chapter 3 Greenhouse Gases and Climate ChanGe impaCts
Bay area air Quality ManageMent District | Clean air Plan 2017 3/13
that have a relatively long atmospheric lifespan. However, certain GHGs, such as the super-GHGs discussed below, exert their impact in heating the climate in a much shorter time frame. So in the case of these super GHGs, a 20-year time frame provides a more realistic means to express their global warming potential.
For example, methane is one of the key su-per-GHGs. as shown in Table 3-1, methane has
Table 3-1. Climate Pollutants Addressed in the 2017 Plan
a GWP of 34 using a 100-year time frame, but its GWP increases to 86 using a 20-year time frame. For purposes of consistency with other GHG inven-tories, the GHG emissions inventory data shown in the figures and tables below are expressed using a 100-year time frame, unless otherwise noted.
Table 3-1 shows atmospheric lifespan, 20-year and 100-year GWP values, and key emission sources for the GHGs addressed in the 2017 Plan.
Greenhouse Gas AtmosphericLifespan
GWP *(20-year
timeframe)
GWP *(100-year
timeframe)Key Emissions Sources
Carbon dioxide (CO2)
20 to 200 years
1 1 Fossil fuel combustion
nitrous oxide (n2O) 114 years 268 298 Motor vehicles, agriculture, water treatment, composting
Methane (CH4) 12 years 86 34 Solid waste disposal, natural gas production and distribution, ranching, dairies
Hydrofluorocarbons (HFCs)
1.5 to 264 years
506 to 6,940 138 to 8,060 refrigeration, air conditioning
Perfluorocarbons (PFCs)
3,000 years or more
6,500 6,500 Semiconductor manufacturing
Sulfur hexafluoride (SF6)
3,200 years 17,500 23,500 electricity grid losses
Black carbon (BC)** Days to weeks
3,235 900 Diesel engines, wood burning
* GWP values in Table 3-1 are from the iPCC 5th assessment report (ar5), with the exception of BC.
** Black carbon values are based on U.S. ePa’s 2012 report on black carbon: https://www3.epa.gov/blackcarbon/ 2012report/Chapter2.pdf.
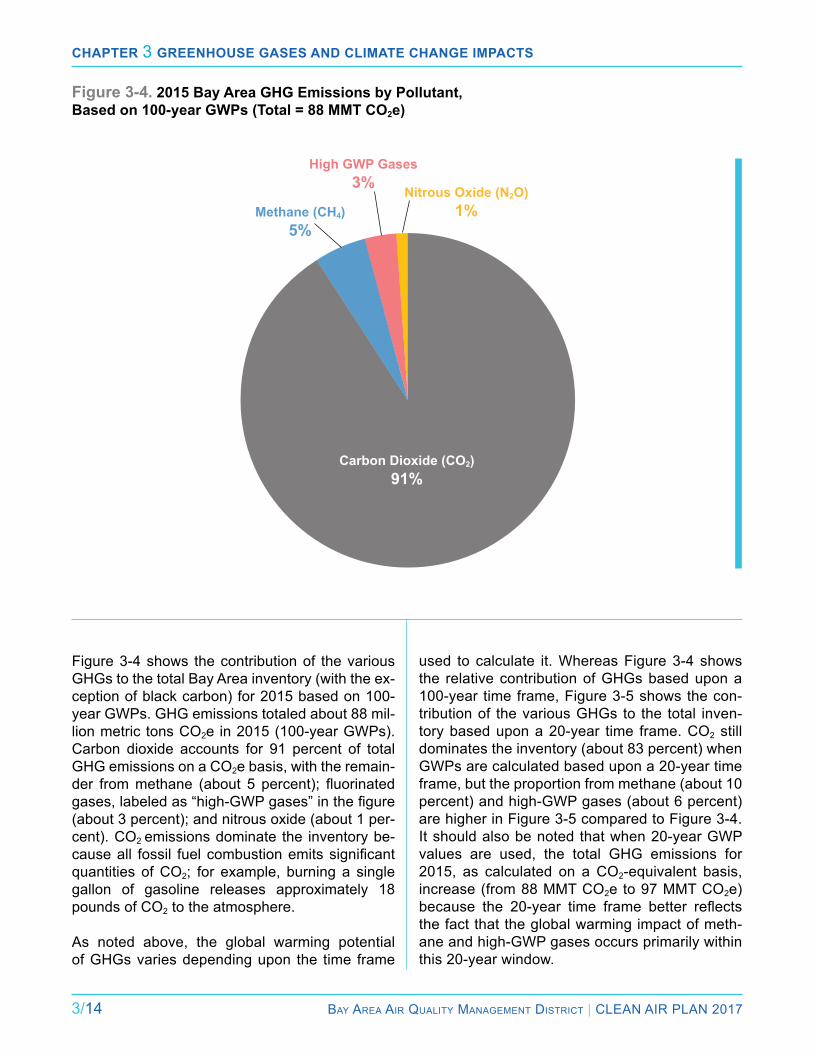
Chapter 3 Greenhouse Gases and Climate ChanGe impaCts
3/14 Bay area air Quality ManageMent District | Clean air Plan 2017
Figure 3-4 shows the contribution of the various GHGs to the total Bay area inventory (with the ex-ception of black carbon) for 2015 based on 100-year GWPs. GHG emissions totaled about 88 mil-lion metric tons CO2e in 2015 (100-year GWPs). Carbon dioxide accounts for 91 percent of total GHG emissions on a CO2e basis, with the remain-der from methane (about 5 percent); fluorinated gases, labeled as “high-GWP gases” in the figure (about 3 percent); and nitrous oxide (about 1 per-cent). CO2 emissions dominate the inventory be-cause all fossil fuel combustion emits significant quantities of CO2; for example, burning a single gallon of gasoline releases approximately 18 pounds of CO2 to the atmosphere.
as noted above, the global warming potential of GHGs varies depending upon the time frame
used to calculate it. Whereas Figure 3-4 shows the relative contribution of GHGs based upon a 100-year time frame, Figure 3-5 shows the con-tribution of the various GHGs to the total inven-tory based upon a 20-year time frame. CO2 still dominates the inventory (about 83 percent) when GWPs are calculated based upon a 20-year time frame, but the proportion from methane (about 10 percent) and high-GWP gases (about 6 percent) are higher in Figure 3-5 compared to Figure 3-4. it should also be noted that when 20-year GWP values are used, the total GHG emissions for 2015, as calculated on a CO2-equivalent basis, increase (from 88 MMT CO2e to 97 MMT CO2e) because the 20-year time frame better reflects the fact that the global warming impact of meth-ane and high-GWP gases occurs primarily within this 20-year window.
Figure 3-4. 2015 Bay Area GHG Emissions by Pollutant, Based on 100-year GWPs (Total = 88 MMT CO2e)
Methane (CH4)5%
High GWP Gases3% Nitrous Oxide (N2O)
1%
Carbon Dioxide (CO2)91%
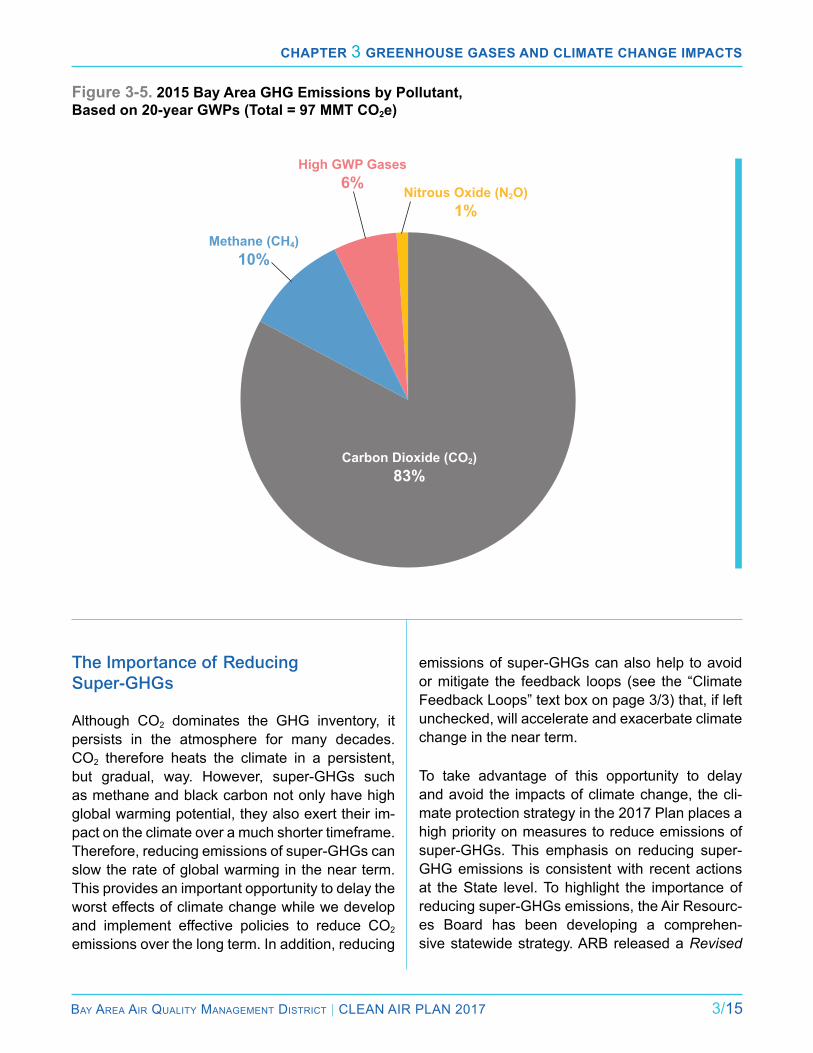
Chapter 3 Greenhouse Gases and Climate ChanGe impaCts
Bay area air Quality ManageMent District | Clean air Plan 2017 3/15
Figure 3-5. 2015 Bay Area GHG Emissions by Pollutant, Based on 20-year GWPs (Total = 97 MMT CO2e)
The Importance of Reducing Super-GHGs
although CO2 dominates the GHG inventory, it persists in the atmosphere for many decades. CO2 therefore heats the climate in a persistent, but gradual, way. However, super-GHGs such as methane and black carbon not only have high global warming potential, they also exert their im-pact on the climate over a much shorter timeframe. Therefore, reducing emissions of super-GHGs can slow the rate of global warming in the near term. This provides an important opportunity to delay the worst effects of climate change while we develop and implement effective policies to reduce CO2
emissions over the long term. in addition, reducing
emissions of super-GHGs can also help to avoid or mitigate the feedback loops (see the “Climate Feedback Loops” text box on page 3/3) that, if left unchecked, will accelerate and exacerbate climate change in the near term.
To take advantage of this opportunity to delay and avoid the impacts of climate change, the cli-mate protection strategy in the 2017 Plan places a high priority on measures to reduce emissions of super-GHGs. This emphasis on reducing super- GHG emissions is consistent with recent actions at the State level. To highlight the importance of reducing super-GHGs emissions, the air resourc-es Board has been developing a comprehen-sive statewide strategy. arB released a Revised
Methane (CH4)10%
High GWP Gases6% Nitrous Oxide (N2O)
1%
Carbon Dioxide (CO2)83%
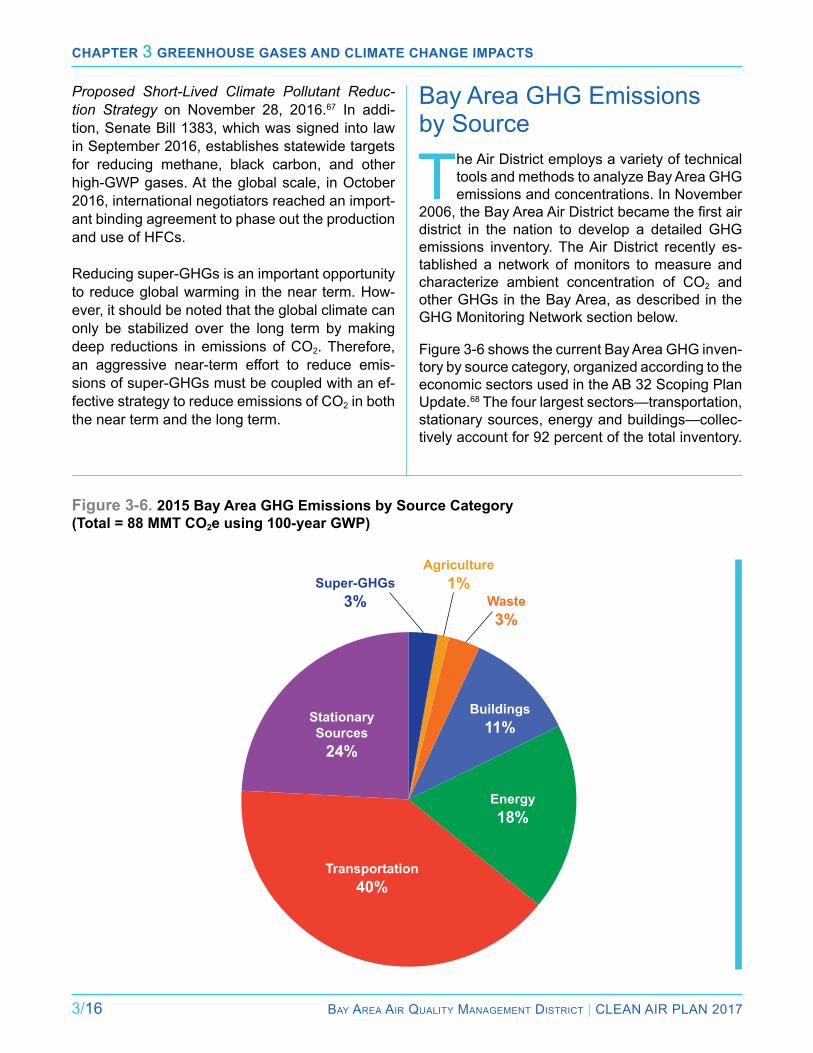
Chapter 3 Greenhouse Gases and Climate ChanGe impaCts
3/16 Bay area air Quality ManageMent District | Clean air Plan 2017
Proposed Short-Lived Climate Pollutant Reduc-tion Strategy on november 28, 2016.67 in addi-tion, Senate Bill 1383, which was signed into law in September 2016, establishes statewide targets for reducing methane, black carbon, and other high-GWP gases. at the global scale, in October 2016, international negotiators reached an import-ant binding agreement to phase out the production and use of HFCs.
reducing super-GHGs is an important opportunity to reduce global warming in the near term. How-ever, it should be noted that the global climate can only be stabilized over the long term by making deep reductions in emissions of CO2. Therefore, an aggressive near-term effort to reduce emis-sions of super-GHGs must be coupled with an ef-fective strategy to reduce emissions of CO2 in both the near term and the long term.
Bay area GHG emissions by Source
The air District employs a variety of technical tools and methods to analyze Bay area GHG emissions and concentrations. in november
2006, the Bay Area Air District became the first air district in the nation to develop a detailed GHG emissions inventory. The air District recently es-tablished a network of monitors to measure and characterize ambient concentration of CO2 and other GHGs in the Bay area, as described in the GHG Monitoring network section below.
Figure 3-6 shows the current Bay Area GHG inven-tory by source category, organized according to the economic sectors used in the aB 32 Scoping Plan Update.68 The four largest sectors—transportation, stationary sources, energy and buildings—collec-tively account for 92 percent of the total inventory.
Figure 3-6. 2015 Bay Area GHG Emissions by Source Category (Total = 88 MMT CO2e using 100-year GWP)
Super-GHGs3%
Agriculture1%
Waste3%
Energy18%
Transportation40%
Stationary Sources
24%
Buildings11%
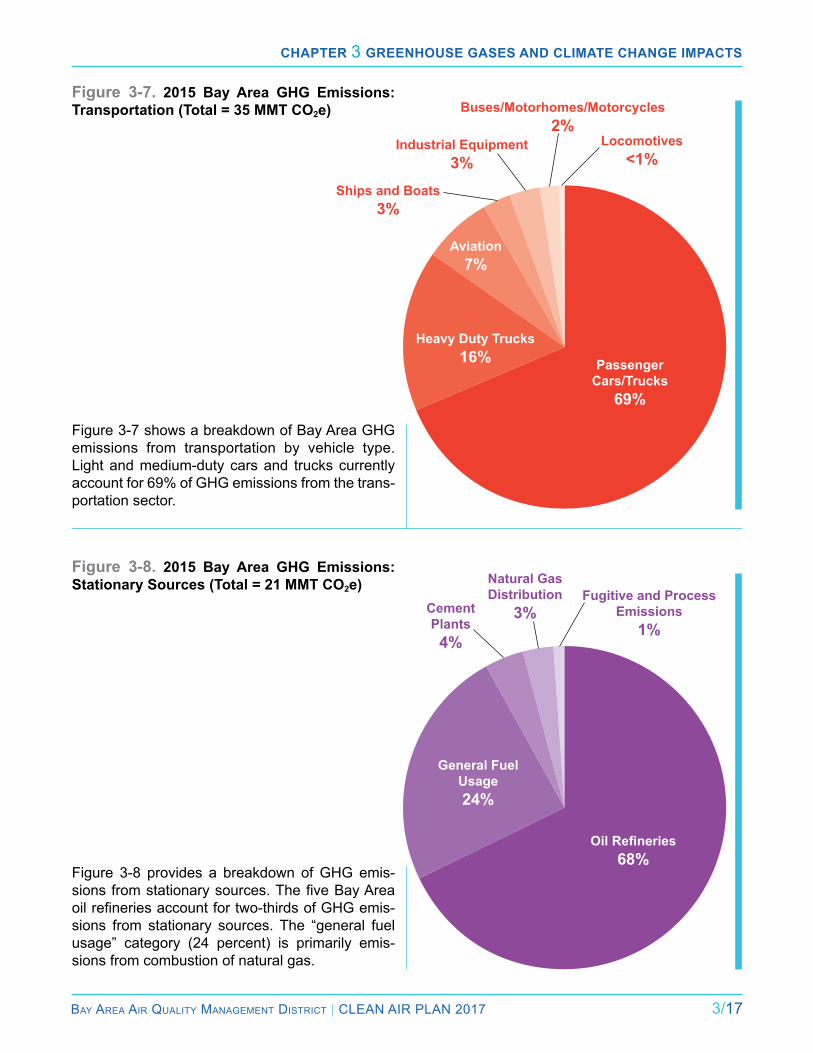
Chapter 3 Greenhouse Gases and Climate ChanGe impaCts
Bay area air Quality ManageMent District | Clean air Plan 2017 3/17
Figure 3-7 shows a breakdown of Bay Area GHG emissions from transportation by vehicle type. light and medium-duty cars and trucks currently account for 69% of GHG emissions from the trans-portation sector.
Figure 3-7. 2015 Bay Area GHG Emissions: Transportation (Total = 35 MMT CO2e)
Figure 3-8 provides a breakdown of GHG emis-sions from stationary sources. The five Bay Area oil refineries account for two-thirds of GHG emis-sions from stationary sources. The “general fuel usage” category (24 percent) is primarily emis-sions from combustion of natural gas.
Figure 3-8. 2015 Bay Area GHG Emissions: Stationary Sources (Total = 21 MMT CO2e)
Oil Refineries68%
PassengerCars/Trucks
69%
Ships and Boats3%
Industrial Equipment3%
Buses/Motorhomes/Motorcycles2%
Locomotives<1%
Cement Plants4%
Heavy Duty Trucks16%
Aviation7%
General Fuel Usage24%
Natural Gas Distribution
3%Fugitive and Process
Emissions1%
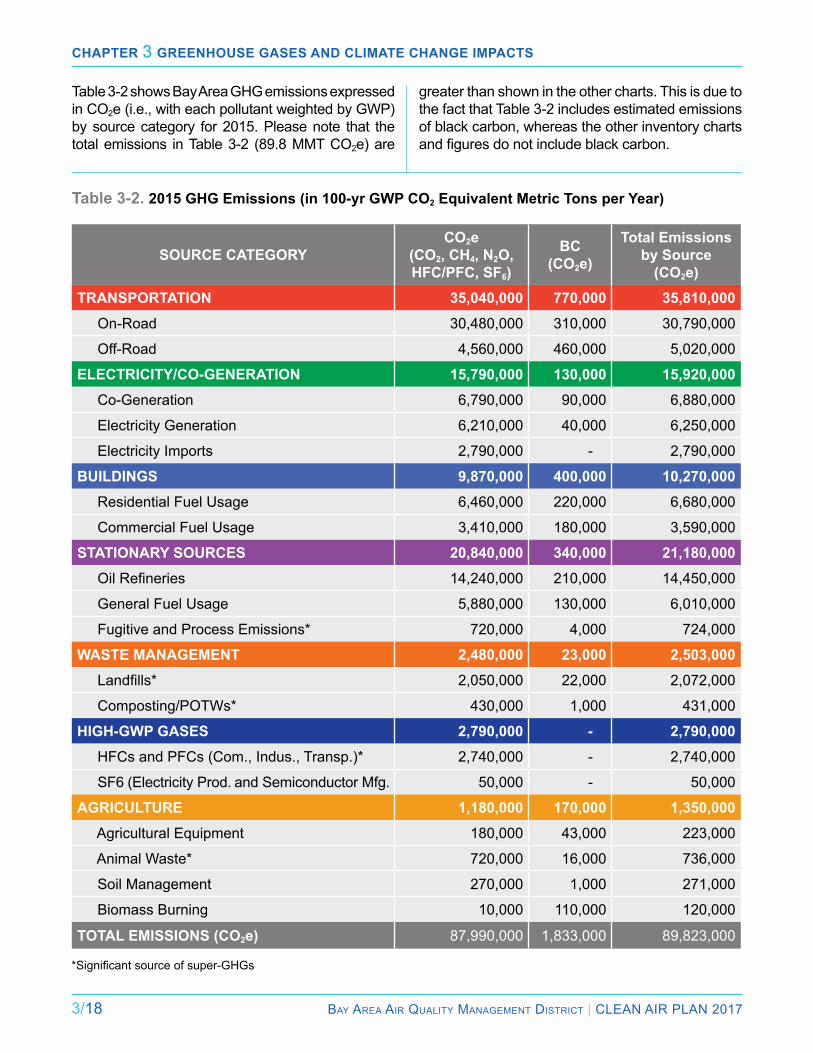
Chapter 3 Greenhouse Gases and Climate ChanGe impaCts
3/18 Bay area air Quality ManageMent District | Clean air Plan 2017
Table 3-2 shows Bay area GHG emissions expressed in CO2e (i.e., with each pollutant weighted by GWP) by source category for 2015. Please note that the total emissions in Table 3-2 (89.8 MMT CO2e) are
Table 3-2. 2015 GHG Emissions (in 100-yr GWP CO2 Equivalent Metric Tons per Year)
greater than shown in the other charts. This is due to the fact that Table 3-2 includes estimated emissions of black carbon, whereas the other inventory charts and figures do not include black carbon.
SOURCE CATEGORYCO2e
(CO2, CH4, N2O,HFC/PFC, SF6)
BC(CO2e)
Total Emissionsby Source
(CO2e)TRANSPORTATION 35,040,000 770,000 35,810,000 On-road 30,480,000 310,000 30,790,000
Off-road 4,560,000 460,000 5,020,000
ELECTRICITY/CO-GENERATION 15,790,000 130,000 15,920,000 Co-Generation 6,790,000 90,000 6,880,000
electricity Generation 6,210,000 40,000 6,250,000
electricity imports 2,790,000 - 2,790,000
BUILDINGS 9,870,000 400,000 10,270,000 Residential Fuel Usage 6,460,000 220,000 6,680,000
Commercial Fuel Usage 3,410,000 180,000 3,590,000
STATIONARY SOURCES 20,840,000 340,000 21,180,000 Oil Refineries 14,240,000 210,000 14,450,000
General Fuel Usage 5,880,000 130,000 6,010,000
Fugitive and Process Emissions* 720,000 4,000 724,000
WASTE MANAGEMENT 2,480,000 23,000 2,503,000 Landfills* 2,050,000 22,000 2,072,000
Composting/POTWs* 430,000 1,000 431,000
HIGH-GWP GASES 2,790,000 - 2,790,000 HFCs and PFCs (Com., Indus., Transp.)* 2,740,000 - 2,740,000
SF6 (Electricity Prod. and Semiconductor Mfg. 50,000 - 50,000
AGRICULTURE 1,180,000 170,000 1,350,000 agricultural equipment 180,000 43,000 223,000
animal Waste* 720,000 16,000 736,000
Soil Management 270,000 1,000 271,000
Biomass Burning 10,000 110,000 120,000
TOTAL EMISSIONS (CO2e) 87,990,000 1,833,000 89,823,000
*Significant source of super-GHGs

Chapter 3 Greenhouse Gases and Climate ChanGe impaCts
Bay area air Quality ManageMent District | Clean air Plan 2017 3/19
Historical and Projected Bay area GHG emission Trends
Projecting future GHG emissions is a chal-lenging exercise. Future emissions will be influenced by a wide range of factors that
are difficult to predict with precision, such as pop-ulation and economic growth, changes in land use policies and patterns, the nature and rate of tech-nological innovation, changes in business invest-ment and consumer demand, the effectiveness of existing policies and programs in reducing GHG emissions over the long term, as well as the poten-tial for new regulations or policies at the national, state, regional and local level.
Figure 3-9 shows estimated changes in Bay Area GHG emissions since 1990 and projected emis-sions through 2050. The projections represent the air District’s best estimate of future GHG emis-sions, taking into account state policies and reg-
ulations already adopted, as well as those that are likely to be adopted and implemented over the next 10 to 15 years, as briefly described below. It should be emphasized that the state will need co-operation and assistance from regional and local agencies to successfully implement many of these policies and regulations.
Bay area GHG emissions under the scenario shown in Figure 3-9 are predicted to drop between 2015 and 2030, level off between 2030 and 2040 and rise slightly after 2040. The assumptions embed-ded in Figure 3-9 were based upon the regulatory landscape as of September 2016. The forthcom-ing update to the aB 32 Scoping Plan, scheduled for spring 2017, is expected to identify addition-al state actions to further reduce GHG emissions toward the long-term targets. However, potential emission reductions from additional state actions that may be included in the Scoping Plan update are not reflected in Figure 3-9. Air District staff will update the projected Bay area GHG emissions once the revised Scoping Plan has been adopted.
Figure 3-9. Projected Bay Area GHG Emissions by Sector Based on State Policies (100-year GWP)
Chapter 3 Greenhouse Gases and Climate ChanGe impaCts
3/20 Bay area air Quality ManageMent District | Clean air Plan 2017
Projections for each sector in Figure 3-9 in-clude the following key technical and policy as-sumptions:
Transportation: assumes only direct, “tailpipe” emissions,69 and impacts from policies such as SB 375 sustainable communities strategies to reduce motor vehicle travel, the “Pavley” Clean Car Standards, the renewable Portfolio Standard (RPS), the Low-Carbon Fuel Standard, and the Zero emission Vehicle mandate.
Stationary Sources: The projection in Figure 3-9 assumes that the state’s Cap-and-Trade pro-gram will continue beyond 2020, with the same allowances and cap reduction formula as the cur-rent program. Based on arB’s PaTHWaYS pro-jections, GHG emissions from stationary sourc-es in the Bay area’s industrial sector will remain relatively constant in future years. Oil refineries currently account for two-thirds of the GHG emis-sions from stationary sources in the Bay area. in-state demand for fuels produced by Bay area refineries is expected to decrease in future years. However, consistent with the findings from ARB’s PaTHWaYS projections, GHG emissions from oil refining in California (and, by inference, the Bay area) are projected to remain the same from 2015-2050. (The PaTHWaYS model does not report on export of refinery products to out-of-state consum-ers. But this scenario suggests that Bay area and California refineries are expected to export more product to consumers outside of California in fu-ture years to offset the expected decrease in de-mand by in-state consumers.)
Energy: GHG emissions from the energy sector include all electric generation within the Bay area as well as electricity imported into the region. The projection in Figure 3-9 assumes that the state’s renewal Portfolio Standard will increase from 33 percent in 2020 to 37 percent by 2030.
Buildings: The projection in Figure 3-9 assumes that 100 percent of new residential and new com-
mercial construction will be zero net energy (Zne) by 2020, with solar photovoltaic power offsetting any emissions from electricity and natural gas use. For existing buildings, the projection as-sumes that 50 percent of commercial buildings will be retrofit to ZNE by 2030, and 100 percent of commercial buildings will be retrofit to ZNE in-creasing by 2050. The projection assumes that no existing residential building are retrofits to ZNE.
Super-GHGs: HFCs, PFCs, and SF6 are the main GHG emissions contributing to the super-GHG sector as shown in Figure 3-9.70 assumptions are consistent with arB’s SlCP reduction Strategy, including an assumed 5 percent reduction in HFC usage by 2020; a 50 percent reduction by 2035; and near complete elimination by 2050.
Agriculture and Waste: The projection in Figure 3-9 assumes minor reductions from agriculture, but major reductions from recycling and waste management, including achieving a 75 percent waste diversion rate by 2020, and diverting 100 percent of organic waste out of landfills by 2035.
More details of methods used and policies includ-ed in Table 3-2 and in Figure 3-9 can be found in the air District’s report Greenhouse Gas Emission Estimates and Draft Forecasts – Update and Work in Progress.71
GHG emissions from the energy sector include all
electric generation within the Bay Area as well as electricity
imported into the region.
Chapter 3 Greenhouse Gases and Climate ChanGe impaCts
Bay area air Quality ManageMent District | Clean air Plan 2017 3/21
GHG Monitoring Network
The air District is implementing a GHG monitoring program to inform its climate protection strategy. This effort includes a fixed-site network to mon-itor ambient concentrations of carbon dioxide (CO2) and methane (CH4), as well as a research van serving as a mobile GHG measurement plat-form. The GHG monitoring data provided by this effort will be used to improve the air District’s GHG emission inventory, to identify GHG emis-sion ‘hotspots,’ to measure trends in ambient con-centrations of GHGs, and to help evaluate the ef-fectiveness of air District and state measures to reduce GHG emissions.
The fixed-site network includes four sites, consis-tent with protocols of international atmospheric monitoring networks. One site, located upwind of the urban core at Bodega Bay (online as of Oc-tober 2015) along the Pacific Coast, serves as a regional background site, measuring GHG lev-els in air coming into the region from the Pacific Ocean. The other three sites are strategically lo-cated at exit points for Bay area air plumes that presumably contain GHG enhancements from Bay area sources. These stations are in San Mar-tin (online as of May 2015), which is located south and generally downwind of the San Jose metro-politan area; in Bethel island (online as of October 2015) at the mouth of the Sacramento-San Joa-quin river Delta; and in livermore (online as of December 2016) near the eastern edge of the air District’s boundary. at all sites, CO2 and CH4 are measured continuously, along with combustion tracer CO and other air pollutants.
The mobile van, which began source-specific in-vestigations in fall 2016, is equipped with instru-
ments to measure CO2, CH4, nitrous oxide (n2O) and other compounds to identify and attribute emissions to specific GHG sourc-es. The van measures GHG concentrations close to emission sources such as oil refin-eries, landfills, wastewater treatment plants, dairies, natural gas co-generation plants, gas pipelines, etc. The measured estimates of GHGs from local sources will allow ver-ification and validation of the Air District’s GHG emissions inventory for the Bay area.
Preliminary findings from the first year of operation of the fixed site network (through summer 2016) are summarized below.
Carbon dioxide: As shown in Figure 3-10, CO2 concentrations vary over the course of the day at the (downwind) Bethel island and San Martin sites in response to changes in meteorology in combination with local emis-sions of CO2. During a typical day, CO2 con-centrations are lowest in the afternoon when vegetation is most effective at absorbing CO2 and local CO2 emissions are well mixed vertically within the lower atmosphere. Hence, daily mean low CO2 levels are sim-ilar at all three sites during the summer. However, the daily mean peak CO2 concen-trations at both Bethel island and San Mar-tin, that occur during nighttime as emissions accumulate in a stable atmosphere with little vertical mixing, are significantly elevated as compared to the background levels at Bo-dega Bay. This suggests the presence of strong regional emission sources of CO2 in the urban core of the Bay area upwind of the downwind sites.
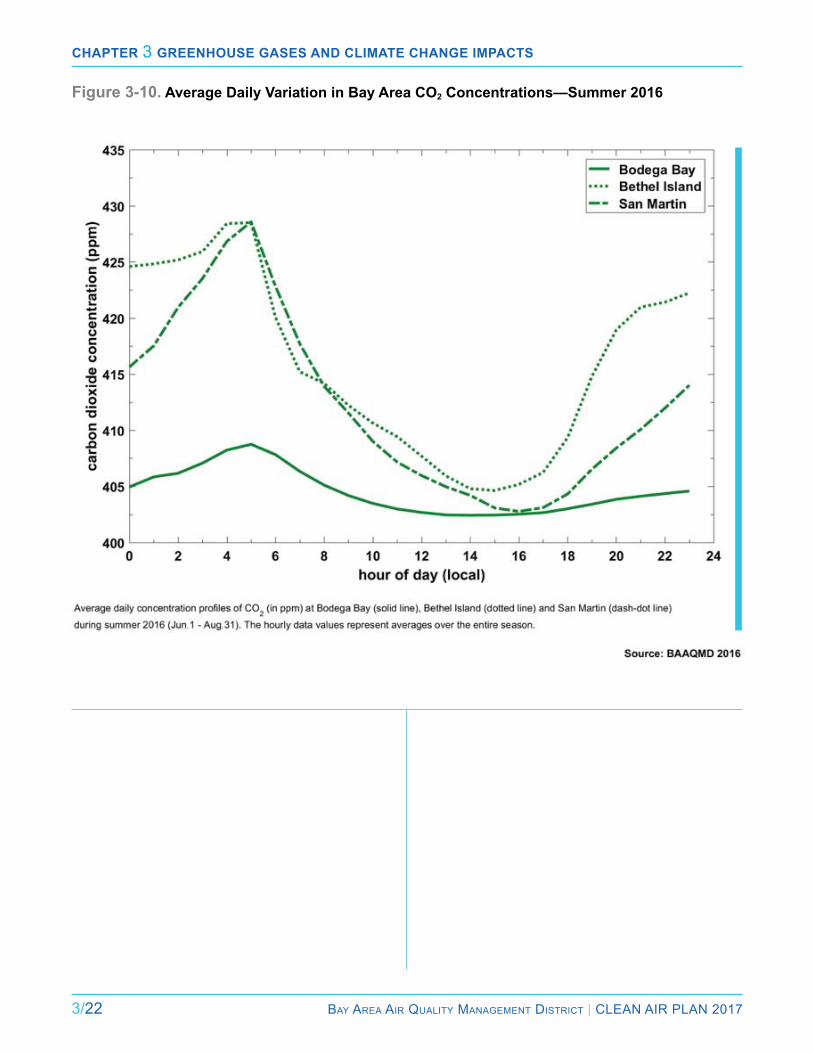
Chapter 3 Greenhouse Gases and Climate ChanGe impaCts
3/22 Bay area air Quality ManageMent District | Clean air Plan 2017
. .
Figure 3-10. Average Daily Variation in Bay Area CO2 Concentrations—Summer 2016
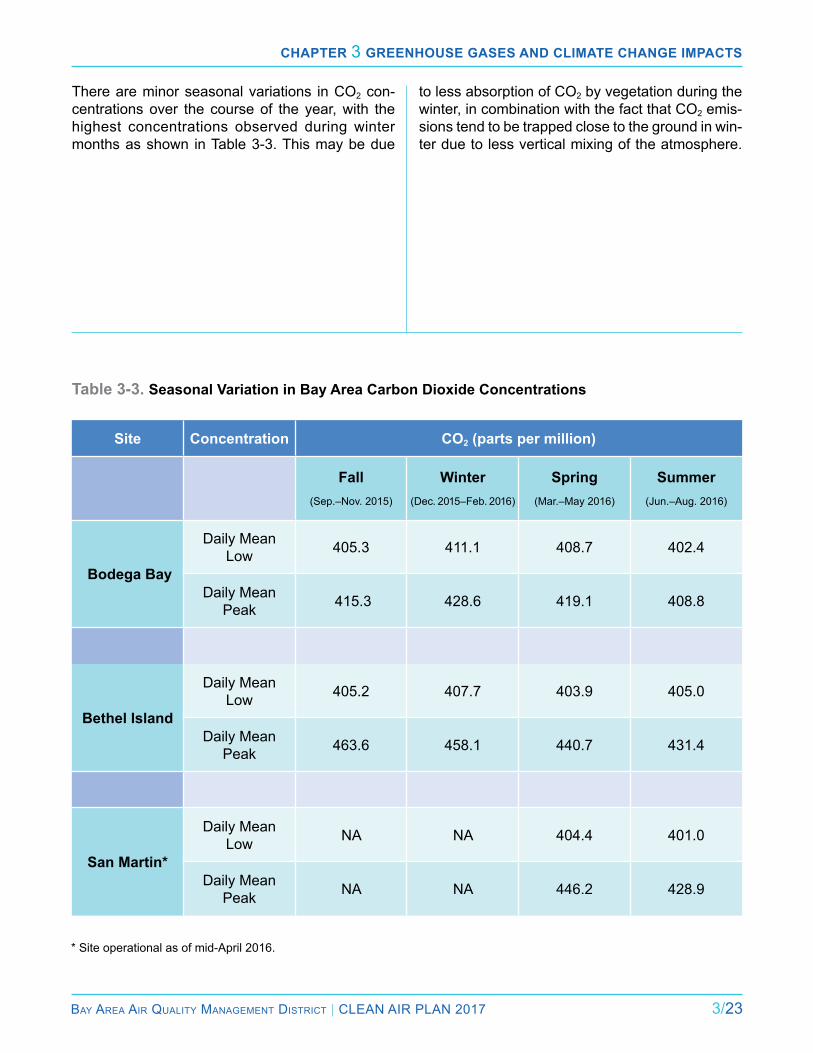
Chapter 3 Greenhouse Gases and Climate ChanGe impaCts
Bay area air Quality ManageMent District | Clean air Plan 2017 3/23
There are minor seasonal variations in CO2 con-centrations over the course of the year, with the highest concentrations observed during winter months as shown in Table 3-3. This may be due
Table 3-3. Seasonal Variation in Bay Area Carbon Dioxide Concentrations
Site Concentration CO2 (parts per million)
Fall
(Sep.–nov. 2015)
Winter(Dec. 2015–Feb. 2016)
Spring(Mar.–May 2016)
Summer(Jun.–aug. 2016)
Bodega Bay
Daily Mean low 405.3 411.1 408.7 402.4
Daily Mean Peak 415.3 428.6 419.1 408.8
Bethel Island
Daily Mean low 405.2 407.7 403.9 405.0
Daily Mean Peak 463.6 458.1 440.7 431.4
San Martin*
Daily Mean low na na 404.4 401.0
Daily Mean Peak na na 446.2 428.9
* Site operational as of mid-april 2016.
to less absorption of CO2 by vegetation during the winter, in combination with the fact that CO2 emis-sions tend to be trapped close to the ground in win-ter due to less vertical mixing of the atmosphere.
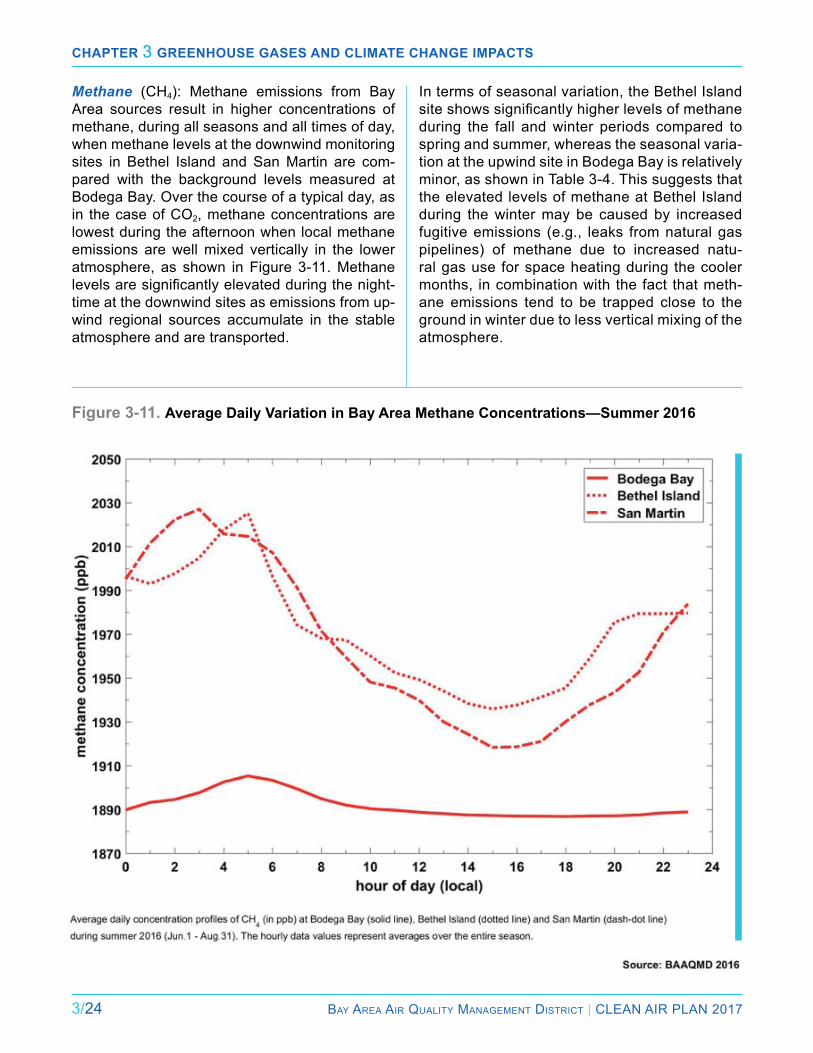
Chapter 3 Greenhouse Gases and Climate ChanGe impaCts
3/24 Bay area air Quality ManageMent District | Clean air Plan 2017
Methane (CH4): Methane emissions from Bay area sources result in higher concentrations of methane, during all seasons and all times of day, when methane levels at the downwind monitoring sites in Bethel island and San Martin are com-pared with the background levels measured at Bodega Bay. Over the course of a typical day, as in the case of CO2, methane concentrations are lowest during the afternoon when local methane emissions are well mixed vertically in the lower atmosphere, as shown in Figure 3-11. Methane levels are significantly elevated during the night-time at the downwind sites as emissions from up-wind regional sources accumulate in the stable atmosphere and are transported.
in terms of seasonal variation, the Bethel island site shows significantly higher levels of methane during the fall and winter periods compared to spring and summer, whereas the seasonal varia-tion at the upwind site in Bodega Bay is relatively minor, as shown in Table 3-4. This suggests that the elevated levels of methane at Bethel island during the winter may be caused by increased fugitive emissions (e.g., leaks from natural gas pipelines) of methane due to increased natu-ral gas use for space heating during the cooler months, in combination with the fact that meth-ane emissions tend to be trapped close to the ground in winter due to less vertical mixing of the atmosphere.
Figure 3-11. Average Daily Variation in Bay Area Methane Concentrations—Summer 2016
. .
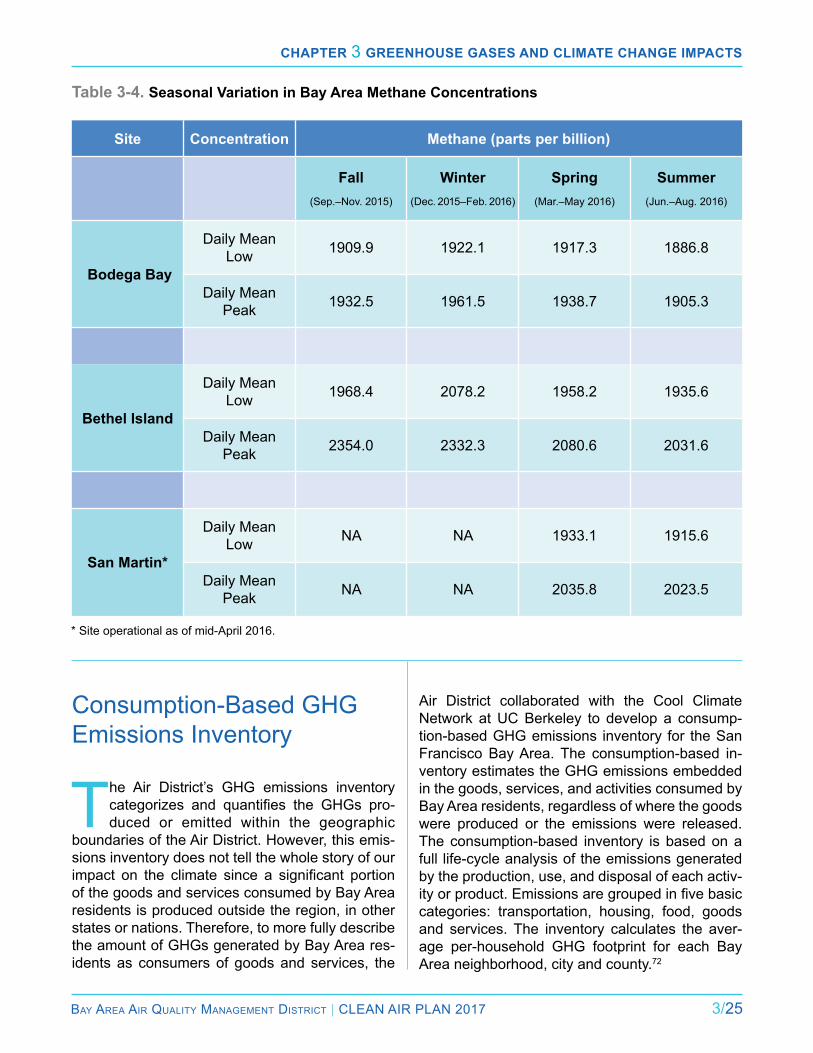
Chapter 3 Greenhouse Gases and Climate ChanGe impaCts
Bay area air Quality ManageMent District | Clean air Plan 2017 3/25
Table 3-4. Seasonal Variation in Bay Area Methane Concentrations
Site Concentration Methane (parts per billion)
Fall
(Sep.–nov. 2015)
Winter(Dec. 2015–Feb. 2016)
Spring(Mar.–May 2016)
Summer(Jun.–aug. 2016)
Bodega Bay
Daily Mean low 1909.9 1922.1 1917.3 1886.8
Daily Mean Peak 1932.5 1961.5 1938.7 1905.3
Bethel Island
Daily Mean low 1968.4 2078.2 1958.2 1935.6
Daily Mean Peak 2354.0 2332.3 2080.6 2031.6
San Martin*
Daily Mean low na na 1933.1 1915.6
Daily Mean Peak na na 2035.8 2023.5
* Site operational as of mid-april 2016.
Consumption-Based GHG emissions inventory
The air District’s GHG emissions inventory categorizes and quantifies the GHGs pro-duced or emitted within the geographic
boundaries of the air District. However, this emis-sions inventory does not tell the whole story of our impact on the climate since a significant portion of the goods and services consumed by Bay area residents is produced outside the region, in other states or nations. Therefore, to more fully describe the amount of GHGs generated by Bay area res-idents as consumers of goods and services, the
air District collaborated with the Cool Climate network at UC Berkeley to develop a consump-tion-based GHG emissions inventory for the San Francisco Bay Area. The consumption-based in-ventory estimates the GHG emissions embedded in the goods, services, and activities consumed by Bay area residents, regardless of where the goods were produced or the emissions were released. The consumption-based inventory is based on a full life-cycle analysis of the emissions generated by the production, use, and disposal of each activ-ity or product. Emissions are grouped in five basic categories: transportation, housing, food, goods and services. The inventory calculates the aver-age per-household GHG footprint for each Bay area neighborhood, city and county.72
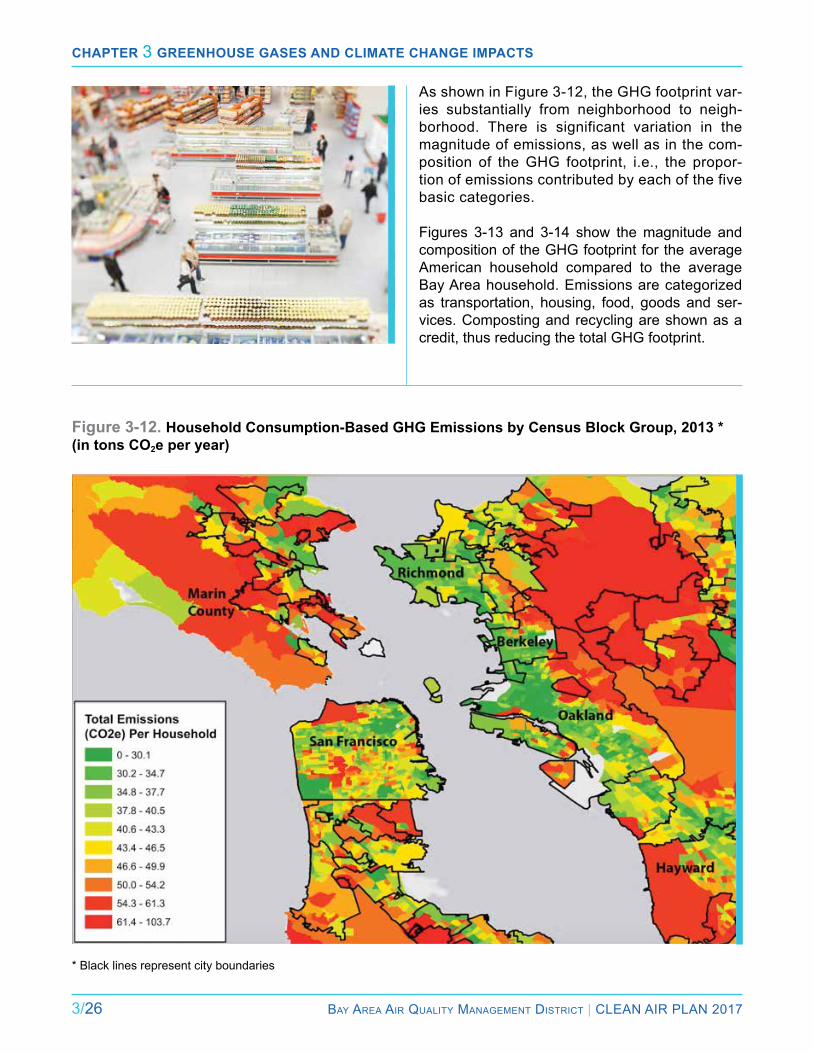
Chapter 3 Greenhouse Gases and Climate ChanGe impaCts
3/26 Bay area air Quality ManageMent District | Clean air Plan 2017
As shown in Figure 3-12, the GHG footprint var-ies substantially from neighborhood to neigh-borhood. There is significant variation in the magnitude of emissions, as well as in the com-position of the GHG footprint, i.e., the propor-tion of emissions contributed by each of the five basic categories.
Figures 3-13 and 3-14 show the magnitude and composition of the GHG footprint for the average american household compared to the average Bay area household. emissions are categorized as transportation, housing, food, goods and ser-vices. Composting and recycling are shown as a credit, thus reducing the total GHG footprint.
Figure 3-12. Household Consumption-Based GHG Emissions by Census Block Group, 2013 *(in tons CO2e per year)
* Black lines represent city boundaries
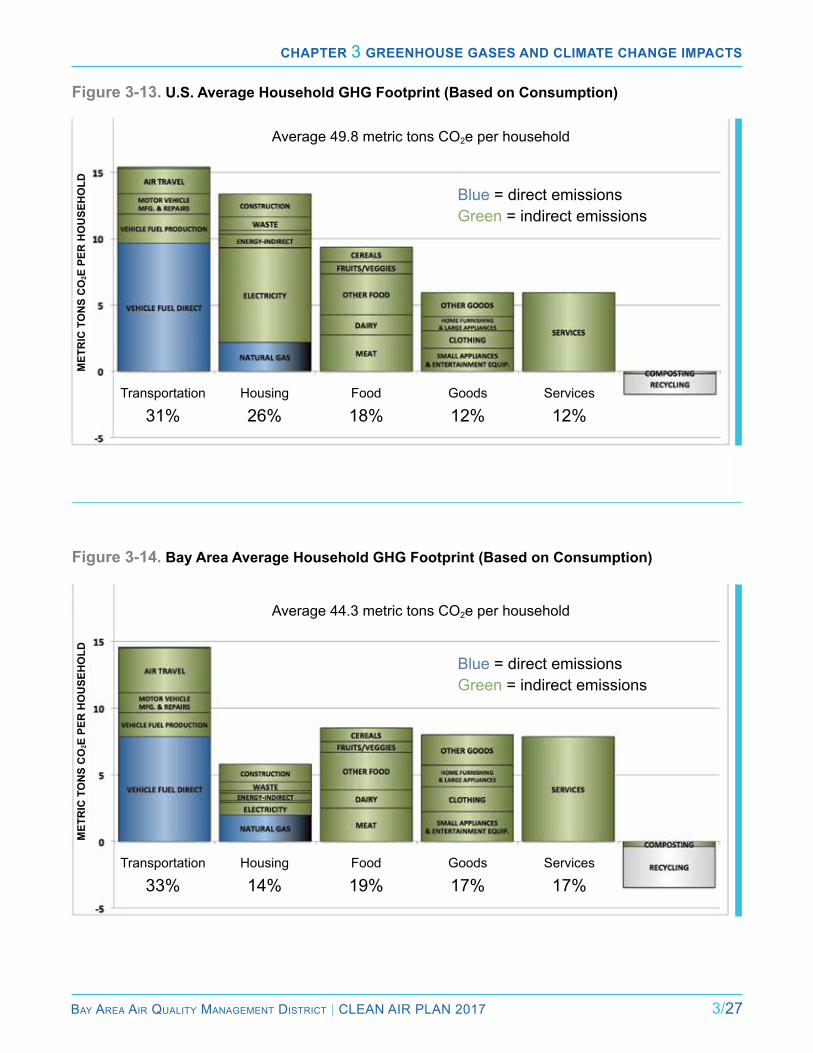
Chapter 3 Greenhouse Gases and Climate ChanGe impaCts
Bay area air Quality ManageMent District | Clean air Plan 2017 3/27
Figure 3-14. Bay Area Average Household GHG Footprint (Based on Consumption)
average 44.3 metric tons CO2e per household
Blue = direct emissionsGreen = indirect emissions
Transportation
33%Housing
14%Food
19%Goods
17%Services
17%
MET
RIC
TO
NS
CO
2E P
ER H
OU
SEH
OLD
Figure 3-13. U.S. Average Household GHG Footprint (Based on Consumption)
average 49.8 metric tons CO2e per household
Blue = direct emissionsGreen = indirect emissions
Transportation
31%Housing
26%Food
18%Goods
12%Services
12%
MET
RIC
TO
NS
CO
2E P
ER H
OU
SEH
OLD

Chapter 3 Greenhouse Gases and Climate ChanGe impaCts
3/28 Bay area air Quality ManageMent District | Clean air Plan 2017
a comparison of national and Bay area emissions yields the following observations.
Bay Area GHG emissions are lower than the U.S. average on a per household basis: GHG emissions for the average Bay area household (44.3 metric tons per year) are less than the av-erage american household (49.8 metric tons per year), even though Bay area residents have sig-nificantly higher income than the national average.
The composition of the GHG footprint differs: The share of the GHG footprint from transportation and from food is similar for the Bay area and the nation as a whole. However, the housing sector accounts for a much smaller share of the Bay area footprint (14%) compared to the national average (26%). Conversely, goods and services, at 17 per-cent each, account for a larger share of Bay area emissions than for the average american GHG footprint, where goods and services each account for 12 percent of the overall footprint.
Clean electricity is a big advantage: a major reason for the relatively low GHG footprint of the average Bay area household, especially in terms of the housing sector, is that GHG emissions from residential electricity consumption in the Bay area are well below the national average, roughly one metric ton per year for the average Bay area household, compared to 7 tons per year as the na-tional average. There are several reasons for this. To be sure, the region’s moderate climate helps to reduce the need for home heating and cooling in the Bay area. But forward-thinking public policies account for most of the difference. The electricity consumed in the Bay area has a lower carbon in-tensity as a result of well-established state policies such as the renewable Portfolio Standard (rPS) to promote renewable energy sources and phase out coal-fired power plants, in combination with lo-cal efforts in many cities to promote clean electric-ity through community choice energy (CCe) pro-
grams. State building codes and energy efficiency standards for appliances also help to reduce de-mand for electricity in the Bay area and statewide. as a result of these policies, the low carbon inten-sity of our electricity creates a great opportunity to further reduce our GHG emissions by switching to electricity to power our cars and trucks, as well as for space-heating and water-heating in our homes and other buildings.
The consumption-based GHG inventory provides an additional perspective on Bay area GHG emis-sions, helping us to better understand the GHG emissions associated with the goods and services that we import to the region, and calling attention to activity categories that are not typically captured in a production-based inventory. Several of the insights that can be drawn from the consumption-based GHG inventory are briefly described below. Government cannot do it alone: Transportation and housing together account for 47 percent of the total GHG emissions in the Bay area from a consumption-based perspective, as shown in Figure 3-14. Governmental policies can have an impact in reducing emissions from these two sec-tors. However, in the case of the food, goods and services sectors, which collectively account for 53 percent of total GHG emissions in the Bay area, emissions are primarily driven by consumer choice and lifestyle. This suggests that governmental ac-tion cannot by itself achieve the necessary reduc-tions in GHG emissions. Support and action from consumers and the business sector will be critical.
Bay Area residents have a key role to play: The consumption-based inventory shows that there is significant variation in the magnitude and the composition of the GHG footprint among Bay area households, and that individual consumer choices can have a significant effect on each household’s GHG footprint. as discussed in the 2050 vision in Chapter 1, in order to achieve the ambitious GHG reduction target for year 2050, it will be critical to help Bay area residents understand that they must play an active role as “conscientious consumers” in reducing GHG emissions. The air District will use the consumption-based inventory to help Bay area residents understand the factors that influence their GHG footprint and to provide them with information and resources so to make appropriate and effective choices to reduce their personal GHG footprint.73
...individual consumer choices can have a significant effect on
each household’s GHG footprint.
Chapter 3 Greenhouse Gases and Climate ChanGe impaCts
Bay area air Quality ManageMent District | Clean air Plan 2017 3/29
Food is a major source of GHG emissions: One of the most interesting findings from the consumption-based inventory is that food accounts for nearly 20 percent of the GHG footprint in the average Bay area household. GHGs embedded in food include carbon dioxide from combustion of fossil fuels used to produce, process, and dis-tribute food products, nitrous oxide from fertilizers, and methane emitted in the production of dairy and meat products. Food waste also contributes to methane emissions from landfills. As discussed in the section a Vision for 2050 in Chapter 1, GHG emissions from the food sector can be reduced by decreasing food waste in markets and restaurants and in the home. Bay area residents can also re-duce their GHG footprint by decreasing consump-tion of processed foods, meat and dairy products. eating less meat and dairy would also provide health benefits for many people.
We still have a long way to go: The state and the air District have adopted targets to reduce GHG emissions 80 percent below 1990 levels by 2050. if we assume that consumption-based emissions per Bay area household were similar in 2013 and in 1990, then a reduction of this magnitude means that we need to reduce Bay area GHG emissions from 44.3 metric tons (MT) per year to less than 9 MT per year on a per-household basis. Factoring in anticipated population growth, emissions would need to be reduced even further, to approximately 7 MT per household per year in order to achieve the 2050 target. it will be a major challenge to achieve emission reductions of this magnitude, while maintaining the standard of living to which we are accustomed.
Summary
Climate change is already occurring, and the Bay area is experiencing a wide range of climate impacts. although these impacts
are expected to intensify in the future and neg-atively affect air quality and public health in the Bay area, aggressive near-term efforts to reduce emissions of super-GHGs—including methane, black carbon and F-gases—can help decrease the speed and severity of climate change over the next several decades. Concurrently, GHG mitiga-tion efforts must also be coupled with coordinated adaptation and resilience programs to strengthen the Bay area’s ability to cope with the impacts of climate change.
The long-term solution to protect the climate re-quires a comprehensive strategy to replace fossil fuels with renewable, low-carbon forms of energy. Since current regional, state, and national policies are insufficient to meet the necessarily ambitious GHG emission targets adopted by the state and the air District for 2030 and 2050, additional reg-ulations, policies and transformative technologies are needed.
The air District and its partners in the Bay area—including the Metropolitan Transportation Commis-sion, the association of Bay area Governments, the Bay Conservation and Development Commis-sion, local governments and many other stake-holders—all have a critical role to play in achiev-ing GHG reduction targets for 2030 and 2050 and preparing the region to cope with the impacts of climate change.
FOOTNOTES
1 California air resources Board http://www.arb.ca.gov/cc/shortlived/shortlived.htm.
2 adaptation and resilience efforts will require coordination and cooperation on the part of a wide range of State and local agencies such as the association of Bay area Governments, the Bay Conservation and Development Commission, Caltrans, local cities, county health departments, and others.
3 For example, see the “2016 Arctic Report Card” issued by the national Oceanic and atmospheric administration: http://arctic.noaa.gov/report-Card/report-Card-2016
4 http://www.fire.ca.gov/communications/downloads/fact_sheets/20laCreS.pdf
5 Safeguarding California Implementation Action Plans 2015, California natural resources agency pg. 8
6 Indicators of Climate Change in California 2013, CalePa, pg. 37.
7 http://climate.nasa.gov/effects/.
8 Indicators of Climate Change in California 2013, CalePa, pg. 38.
Chapter 3 Greenhouse Gases and Climate ChanGe impaCts
3/30 Bay area air Quality ManageMent District | Clean air Plan 2017
24 High Resolution Climate-Hydrology Scenarios for the San Francisco Bay Area 2013, Terrestrial Biodiversity Climate Change Collaborative.
25 Indicators of Climate Change in California 2013, CalePa, pg. 88.
26 Climate Change Projections of Sea Level Extremes in California, Cayan et al. 2008, page S-58.
27 Sea Level Rise for the Coasts of California, Oregon and Washington, national research Council, 2012, pg. 96.
28 Contribution of Antarctica to Past and Present Sea Level Rise, DeConto, Pollard, 2016, nature. March 30, 2016 pg.1.
29 Safeguarding California Implementation Action Plans 2015, California natural resources agency, pg. 101.
30 Climate Change Impacts, Vulnerabilities and Adaptations in the San Francisco Bay Area 2012, ekstrom & Moser, pg 23.
31 Surviving the Storm, Bay area Council economic institute,
2015, pg. 34.
32 California Department of Public Health, http://www.cdph.ca.gov/programs/Documents/CDPH_CC-and-Health-equity-issue-Brief.pdf.
33 California natural resources agency, pg. 114–15.
34 California natural resources agency, pg. 34.
35 Impacts of Climate Change on Human Health in the United States, U.S Global Change research Program, 2016, pg. 11.
36 The expected Peak Day Concentration for the state 1-hour ozone standard declined from 103 ppb in 1986–1988 to 77 ppb in 2012–2014, a decrease of 26 ppb in 26 years, or 1 ppb per year on average. Based on this rate of change, an 8 ppb increase in ozone concentrations would offset approximately 8 years of progress in reducing ePDC of ozone in the Bay area.
37 California Adaptation Strategy 2009, California natural resources agency, pg. 34.
38 California Adaptation Strategy 2009, California natural resources agency, pg. 34.
39 Indicators of Climate Change in California 2009, CalePa, pg. 131.
40 During the final week of June 2008, PM2.5 levels increased
between five- and ten-fold compared to normal readings at several Bay area monitoring stations.
9 California Climate Extremes Workshop Report 2011, Scripps institution of Oceanography, pg. 7.
10 https://ww2.kqed.org/science/2016/01/20/2015-was-the-warmest-year-on-record-globally-but-not-in-california/.
11 Safeguarding California Implementation Action Plans 2015, California natural resources agency, pg. 69.
12 High Resolution Climate-Hydrology Scenarios for the San Francisco Bay Area 2013, Terrestrial Biodiversity Climate Change Collaborative, pg. 3.
13 Western regional Climate Center, California Climate Data archive, www.calclim.dri.edu.
14 https://www.ncdc.noaa.gov/sotc/global/201604.
15 Climate Change Impacts, Vulnerabilities and Adaptations in the San Francisco Bay Area 2012, ekstrom & Moser, pg 19. a temperature increase of this magnitude can potentially be avoided by aggressive near-term actions to reduce emissions of short-lived climate pollutants, as discussed later in this chapter.
16 Climate Change Impacts, Vulnerabilities and Adaptations in the San Francisco Bay Area 2012, ekstrom & Moser, pg 19.
17 From Boom to Bust: Climate Change in the Golden State 2015, risky Business Project, pg. 26-27.
18 Indicators of Climate Change in California 2013, CalePa, pg. 66.
19 Trends in Atmospheric Patterns Conducive to Precipitation
and Temperature Extremes in California, Swain et al., Science advances, 2016; 2:e150134. also see http://news.stanford.edu/press-releases/2016/04/01/pr-drought-patterns-change-040116/.
20 Indicators of Climate Change in California 2009, CalePa, pg. 100.
21 Safeguarding California Implementation Action Plans 2015, California natural resources agency, pg. 69.
22 Knowles and Cayan. Potential Effects of Global Warming on the Sacramento/San Joaquin Watershed and the San Francisco Estuary. Geophysical research letters 29, no. 18 (2002).
23 Unprecedented Drought Risk in the American Southwest and Central Plains, Cook et al., Science Advances 12 Feb 2015: Vol. 1, no. 1, e1400082.
Chapter 3 Greenhouse Gases and Climate ChanGe impaCts
Bay area air Quality ManageMent District | Clean air Plan 2017 3/31
41 Wegesser et al. California Wildfires of 2008: Coarse and Fine Particulate Matter Toxicity. environmental Health Perspectives, Vol. 117, June 2009.
42 Climate Change Impacts, Vulnerabilities and Adaptations in the San Francisco Bay Area 2012, ekstrom & Moser, pg 46.
43 Preparing California for Extreme Heat, California Department of Public Health, 2013, pg. 4.
44 Safeguarding California 2014, California natural resources agency, pg. 194.
45 Climate Change Impacts, Vulnerabilities and Adaptations in the San Francisco Bay Area 2012, ekstrom & Moser, pg 46.
46 U.S. ePa: https://www.epa.gov/heat-islands/heat-island-impacts.
47 Safeguarding California Implementation Action Plans 2015, California natural resources agency, pg. 119.
48 See agenda item #4: http://www.baaqmd.gov/~/media/files/board-of-directors/advisory-council/2015/ac_agenda_051315.pdf?la=en.
49 San Francisco Climate & Health Profile, 2015, San Francisco Department of Public Health, pg. 14.
50 San Mateo Department of Public Health, http://www.smcmvcd.org/invasive-aedes-aegypti-san-mateo-county.
51 San Francisco Climate & Health Profile, 2015, San Francisco Department of Public Health, pg. 13.
52 Safeguarding California 2014, California natural resources agency, pg. 195.
53 impacts of Climate Change on Human Health in the United States, U.S. Global Change research Program, 2016, pg. 16.
54 Impacts of Climate Change on Human Health in the United States, U.S. Global Change research Program, 2016, pg. 21.
55 San Francisco Climate & Health Profile, 2015, San Francisco Department of Public Health, pg. iv.
56 Safeguarding California Implementation Action Plans 2015, California natural resources agency, pg. 9.
57 Climate Change Impacts, Vulnerabilities and Adaptations in the San Francisco Bay Area 2012, ekstrom & Moser, pg 11.
58 Preparing California for Extreme Heat, California Department of Public Health, pg. 5.
59 Our Changing Climate 2012, California Climate Change Center, pg. 4.
60 Mapping Climate Change Exposures, Vulnerabilities and Adaptation to Public Health Risks in the San Francisco and Fresno Regions, Jerrett et al, 2012, pg. 11-12.
61 Preparing California for Extreme Heat, California Department of Public Health, 2013, pg. 8.
62 Safeguarding California Implementation Action Plans 2015, California natural resources agency, pg. 115.
63 Preparing California for Extreme Heat, California Department of Public Health, 2013, pg. 8.
64 Safeguarding California 2014, California natural resources agency, pg. 193.
65 Environmental Health and Equity Impacts from Climate Change and Mitigation Policies in California, Shonkoff et al, 2009.
66 The “Kyoto Six” gases were recognized as the leading GHGs in the Kyoto Protocol of 1997. They are considered the primary GHGs by many national and international institutions, including U.S. ePa and the intergovernmental Panel on Climate Change (iPCC).
67 arB uses the term “short-lived climate pollutants” or SlCPs to describe the super-GHGs. See: https://www.arb.ca.gov/cc/shortlived/shortlived.htm.
68 The air District’s greenhouse gas inventory includes GHGs that are emitted within the Bay area, as well as GHGs emitted in the production of electricity that is imported to the region. The emissions inventory does not include GHGs generated in the production of goods or services that are produced outside the Bay area and then imported for consumption within the region. To estimate and categorize the GHG emissions embedded in all goods and services consumed within the Bay area, the air District has developed a consumption-based GHG emissions inventory, described later in this chapter.
69 leakage of refrigerants from mobile sources is accounted for in the ‘SlCP’ sector.
70 Methane emissions are included in other sectors in Figure 3-9.
71 [link to be added in final draft]
72 For additional information, including links to detailed tables and maps, see: www.baaqmd.gov/research-and-data/emission-inventory/consumption-based-ghg-emissions-inventory
73 additional tools to help consumers evaluate their GHG emissions are available on the Cool Climate network website. See http://coolclimate.berkeley.edu/calculator.

Bay area air Quality ManageMent District | Clean air Plan 2017 4/1
Chapter 4planning Context
The 2017 Plan builds on many other plans, policies and programs, including existing and new air District initiatives,
as well as plans developed and implemented by other agencies. This chapter describes the policy and planning context for the 2017 Plan, including:
● Progress in implementing the Bay area 2010 Clean air Plan,
● Key air District programs and initiatives that support and complement the 2017 Plan, and
● Federal, state, regional, and local policies, plans and programs that complement the 2017 Plan.
implementation of the 2010 Clean air Plan
The 2017 Plan is an update to the air Dis-trict’s most recent state ozone plan, the 2010 Clean air Plan. The 2010 Clean air
Plan laid out a comprehensive strategy to reduce emissions of ozone precursors, particulate matter (PM), greenhouse gases (GHG) and toxic air con-taminants (TaCs). The plan included 18 Station-ary Source Measures (SSMs), 10 Mobile Source Measures (MSMs), 17 Transportation Control Measures (TCMs), six land Use and local impact Measures (lUMs), and four energy and Climate Measures (eCMs). The air District and its part-ner agencies have taken action to implement the control measures in the 2010 Clean air Plan, as summarized below. Stationary source measures have been implemented through the air District’s
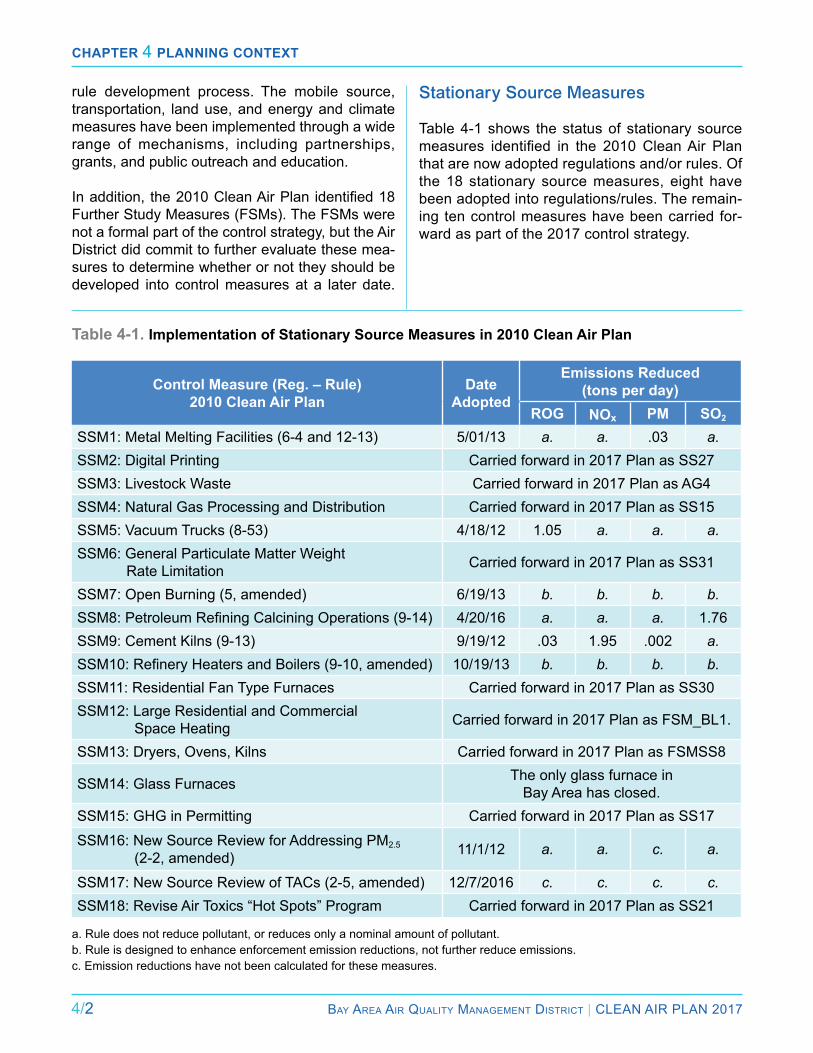
Chapter 4 planning Context
4/2 Bay area air Quality ManageMent District | Clean air Plan 2017
rule development process. The mobile source, transportation, land use, and energy and climate measures have been implemented through a wide range of mechanisms, including partnerships, grants, and public outreach and education.
In addition, the 2010 Clean Air Plan identified 18 Further Study Measures (FSMs). The FSMs were not a formal part of the control strategy, but the air District did commit to further evaluate these mea-sures to determine whether or not they should be developed into control measures at a later date.
Stationary Source Measures
Table 4-1 shows the status of stationary source measures identified in the 2010 Clean Air Plan that are now adopted regulations and/or rules. Of the 18 stationary source measures, eight have been adopted into regulations/rules. The remain-ing ten control measures have been carried for-ward as part of the 2017 control strategy.
Table 4-1. Implementation of Stationary Source Measures in 2010 Clean Air Plan
Control Measure (Reg. – Rule)2010 Clean Air Plan
DateAdopted
Emissions Reduced(tons per day)
ROG NOx PM SO2
SSM1: Metal Melting Facilities (6-4 and 12-13) 5/01/13 a. a. .03 a.SSM2: Digital Printing Carried forward in 2017 Plan as SS27SSM3: livestock Waste Carried forward in 2017 Plan as aG4SSM4: natural Gas Processing and Distribution Carried forward in 2017 Plan as SS15SSM5: Vacuum Trucks (8-53) 4/18/12 1.05 a. a. a.SSM6: General Particulate Matter Weight
rate limitation Carried forward in 2017 Plan as SS31
SSM7: Open Burning (5, amended) 6/19/13 b. b. b. b.SSM8: Petroleum Refining Calcining Operations (9-14) 4/20/16 a. a. a. 1.76SSM9: Cement Kilns (9-13) 9/19/12 .03 1.95 .002 a.SSM10: Refinery Heaters and Boilers (9-10, amended) 10/19/13 b. b. b. b.SSM11: residential Fan Type Furnaces Carried forward in 2017 Plan as SS30SSM12: large residential and Commercial
Space Heating Carried forward in 2017 Plan as FSM_Bl1.
SSM13: Dryers, Ovens, Kilns Carried forward in 2017 Plan as FSMSS8
SSM14: Glass Furnaces The only glass furnace in Bay area has closed.
SSM15: GHG in Permitting Carried forward in 2017 Plan as SS17
SSM16: new Source review for addressing PM2.5 (2-2, amended) 11/1/12 a. a. c. a.
SSM17: new Source review of TaCs (2-5, amended) 12/7/2016 c. c. c. c.SSM18: revise air Toxics “Hot Spots” Program Carried forward in 2017 Plan as SS21
a. rule does not reduce pollutant, or reduces only a nominal amount of pollutant.b. rule is designed to enhance enforcement emission reductions, not further reduce emissions.c. emission reductions have not been calculated for these measures.
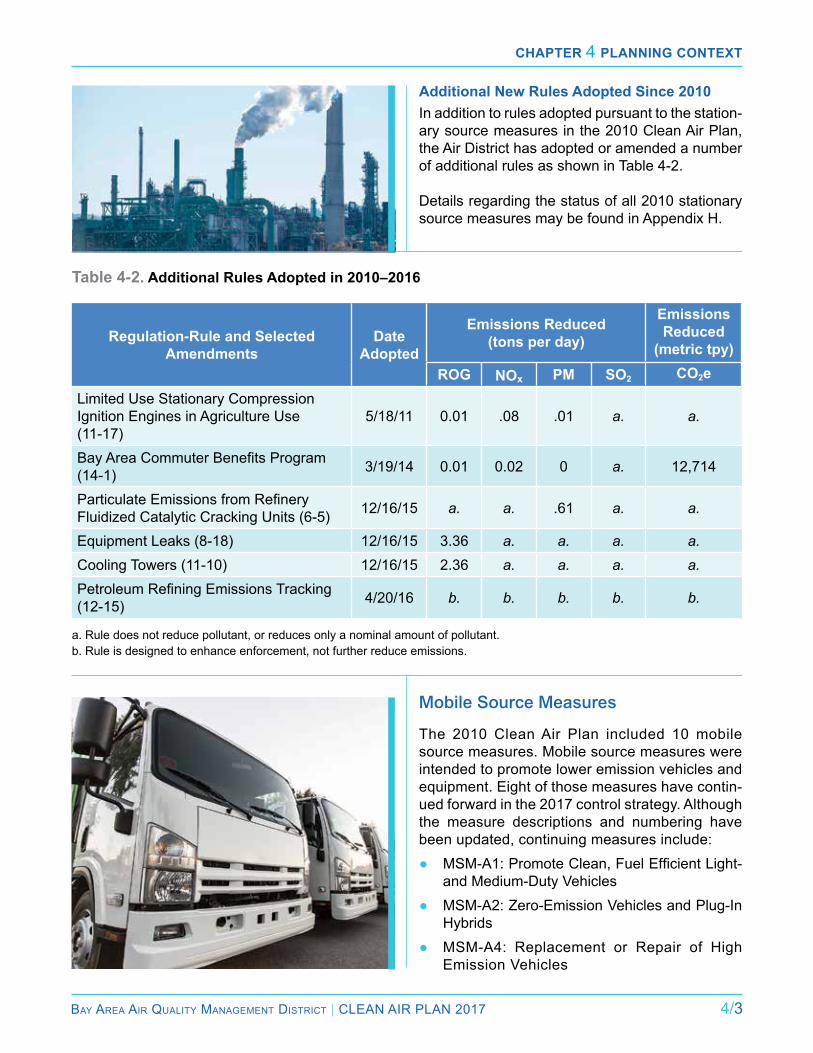
Chapter 4 planning Context
Bay area air Quality ManageMent District | Clean air Plan 2017 4/3
Table 4-2. Additional Rules Adopted in 2010–2016
Regulation-Rule and Selected Amendments
DateAdopted
Emissions Reduced(tons per day)
Emissions Reduced
(metric tpy)ROG NOx PM SO2 CO2e
limited Use Stationary Compression ignition engines in agriculture Use (11-17)
5/18/11 0.01 .08 .01 a. a.
Bay Area Commuter Benefits Program (14-1) 3/19/14 0.01 0.02 0 a. 12,714
Particulate Emissions from Refinery Fluidized Catalytic Cracking Units (6-5) 12/16/15 a. a. .61 a. a.
equipment leaks (8-18) 12/16/15 3.36 a. a. a. a.Cooling Towers (11-10) 12/16/15 2.36 a. a. a. a.Petroleum Refining Emissions Tracking (12-15) 4/20/16 b. b. b. b. b.
a. rule does not reduce pollutant, or reduces only a nominal amount of pollutant.b. rule is designed to enhance enforcement, not further reduce emissions.
Mobile Source Measures
The 2010 Clean air Plan included 10 mobile source measures. Mobile source measures were intended to promote lower emission vehicles and equipment. eight of those measures have contin-ued forward in the 2017 control strategy. although the measure descriptions and numbering have been updated, continuing measures include:● MSM-A1: Promote Clean, Fuel Efficient Light-
and Medium-Duty Vehicles ● MSM-a2: Zero-emission Vehicles and Plug-in
Hybrids ● MSM-a4: replacement or repair of High
emission Vehicles
Additional New Rules Adopted Since 2010in addition to rules adopted pursuant to the station-ary source measures in the 2010 Clean air Plan, the air District has adopted or amended a number of additional rules as shown in Table 4-2.
Details regarding the status of all 2010 stationary source measures may be found in appendix H.

Chapter 4 planning Context
4/4 Bay area air Quality ManageMent District | Clean air Plan 2017
● MSM-B1: Fleet Modernization for Medium- and Heavy-Duty On-road Vehicles
● MSM-B2: low nOx Retrofits in Heavy-Duty, On-road Vehicles
● MSM-B3: Efficient Drive Trains
● MSM-C1: Construction and Farming equipment
● MSM-C2: lawn and Garden equipment
Mobile source measures a1, a2, and a4 ad-dressed replacing traditional cars and light trucks that have internal combustion engines with either hybrid or zero emission electric engines. These efforts are ongoing and will continue in the 2017 Plan via marketing, planning and funding for both electric vehicles (eVs) and eV infrastructure.
Mobile source measures B1, B2, and B3 addressed various funding programs and projects to acceler-ate compliance with arB regulations to reduce emissions from medium and heavy-duty trucks. These measures are in the 2017 control strategy as Tr19: Medium- and Heavy-Duty Trucks.
Green Fleets and recreational Watercraft (MSM-a3 and MSM-C3) are not carried forward into the 2017 control strategy. The air District has incorporated GHG reduction criteria into its various grant pro-grams. Further work to direct incentives toward eVs is carried forward in the 2017 control strategy in Tr14: Cars and light Trucks. an incentive pro-gram to replace older, two-stroke marine outboard engines with low-emission, four-stroke engines will be revisited when funding becomes available.
Details regarding implementation activities on each of the 2010 mobile source measures during 2010 through 2016 may be found in appendix H.
Transportation Control Measures
The 2010 Clean air Plan included 17 transportation control measures. The measures were designed to encourage walking, bicycling, and transit use, im-prove transit service, improve efficiency of the re-gional roadway system, support infill development, and develop pricing strategies. Virtually all of the 2010 transportation measures are carried forward
into the 2017 control strategy, although the measure descriptions and numbering have been updated. Details regarding implementation activities on each of the 2010 transportation control measures during 2010 through 2016 may be found in ap-pendix H.
Land Use and Local Impacts Measures
The 2010 Clean air Plan included a new category of control measures, land Use and local impacts. There were six measures in this category de-signed to promote mixed-use, infill development to reduce motor vehicle travel and emissions, as well as to protect people from exposure to air pollution from stationary and mobile sources of emissions, especially in communities most heavily impacted by air pollution. all six of these measures continue forward in the 2017 control strategy as follows:
● lUM1: Goods Movement as Tr18
● lUM2: indirect Source review rule as Tr16
Chapter 4 planning Context
Bay area air Quality ManageMent District | Clean air Plan 2017 4/5
● lUM6: enhanced air Quality Monitoring as SS38
● lUM3: Updated CeQa Guidelines and en-hanced CeQa review, lUM4: land Use Guid-ance, and lUM5: Monitor Health risks in local Communities were combined into Tr10: land Use Strategies.
Details regarding implementation activities on each of the 2010 land use and local impacts con-trol measures during 2010 through 2016 may be found in appendix H.
Energy and Climate Measures
The 2010 Clean air Plan included a new category of measures designed to reduce criteria pollutants and GHG emissions, known as energy & Climate Measures (eCMs). The eCMs were designed to promote energy conservation and efficiency in new homes, schools, and commercial buildings. These measures were also designed to promote renewable energy, reduce the urban heat island ef-fect, and promote planting of tree species with low emissions of volatile organic compounds (VOCs).
Since 2010, air District staff has facilitated infor-mation-sharing among local governments devel-oping climate action plans and implementing GHG reduction strategies. air District staff worked with staff at lawrence Berkeley national laboratory (LBNL) to develop and promote the benefits of re-flective pavement for local government planners and public works staff, cement and asphalt com-
panies and researchers. air District staff participat-ed in an lBnl working group to develop a “cool schoolyards” program for cool paving. Further de-tails regarding additional implementation activities on each of the 2010 energy and climate control measures during 2010 through 2016 may be found in appendix H. all four eCMs in the 2010 Plan are carried forward in the 2017 Plan, as described in appendix H.
Further Study Measures
Eighteen further study measures were identified for the 2010 Clean air Plan. These measures ap-peared to have sufficient merit to warrant further research, but were not yet ready to be proposed as formal control measures. Many of the 2010 fur-ther study measures (10 of the 18) are now in the 2017 control strategy as formal control measures. Three measures are continuing in the 2017 con-trol strategy as further study measures. Four mea-sures, emissions from Cooling Towers, equipment leaks, SO2 from Refinery Processes and Wood Smoke (FSM4, FSM5, FSM7 and FSM12) have been adopted as new air District regulations—see Table 4-2. Three of these (FSM4, FSM5 and FSM12) will have further regulatory components and therefore are carried forward in the 2017 con-trol strategy.
Three 2010 further study measures, FSM6: Waste-water from Coke Cutting, FSM11: Magnet Source rule and FSM17: Ferry System expansion, are not carried forward into the 2017 Clean air Plan. For FMS6, air District staff analyzed emission reduc-tion opportunities for coke cutting operations and determined that facilities were already operating in such as way the emissions were minimized to the extent technically feasible. The concepts in FSM11 are incorporated in the transportation sector con-trol measure Tr16: indirect Source rule. issues raised in the Ferry System expansion further study measure continue to be addressed in the 2017 measure Tr21: Commercial Harbor Craft, which includes air District programs to ensure new fer-ries meet arB’s stringent engine standards.
Details regarding additional implementation activ-ities on each of the 2010 further study measures may be found in appendix H.
Chapter 4 planning Context
4/6 Bay area air Quality ManageMent District | Clean air Plan 2017
air District Programs that Provide Foundation for the 2017 Plan
The 2017 Plan builds upon well-established air District programs, including regulation, permitting and enforcement of stationary
sources, air quality monitoring, public outreach and education, work with local governments, and grants and incentives. in addition to these core programs, the air District has developed new pro-grams and initiatives in recent years to respond to the challenges of protecting public health and pro-tecting our climate. The section below summariz-es the air District’s recent efforts to protect public health and protect the climate.
Protecting Public Health
Protecting public health, at the regional scale and in the communities most impacted by air pollution, is the air District’s most fundamental mission and one of the key goals of the 2017 Plan. The air Dis-trict’s efforts to protect the communities and popu-lations most impacted by air pollution include:
● The Community air risk evaluation (Care) program to identify and support communities with higher pollution exposure and health vul-nerabilities;
● Multi-pollutant control strategy to reduce air pollution and related health impacts, regionally and locally
● The Bay Area refinery emission reduction strategy;
● Grants and incentives programs to reduce emissions from key sectors such as seaports and goods movement;
● The Mobile Source Compliance Plan to en-force arB regulations to reduce emissions from diesel engines in impacted Bay area communities;
● The Wood Burning rule that bans burning when a Winter Spare the air is in effect; and
● The Planning Healthy Places guidance docu-ment, a resource to ensure that local land use planning and new development are designed so as to protect public health.
Community Air Risk Evaluation Program
in 2004, the air District initiated the Community air risk evaluation (Care) program to evaluate and reduce health risks associated with local ex-posures to toxic air contaminants in the Bay area.1 Subsequently, the Care program’s focus expand-ed to include exposure to fine particles and ozone. The program analyzes emissions of TaC, PM and ozone precursors from point sources, area sourc-es and on-road and off-road mobile sources, with an emphasis on reducing population exposure to diesel exhaust. Care combines technical analy-ses, outreach to impacted communities, and pol-icy mechanisms to reduce emissions and health risks in those communities. The technical anal-yses portion of the Care program includes an assessment of the sources of air toxics and oth-er pollutant emissions, modeling and monitoring to estimate concentrations of air toxics and other pollutant emissions, and an assessment of expo-sures and health risks and mapping of the most impacted communities. information derived from the technical analyses is used to focus emission reduction strategies in areas with high air pollution exposures and high density of sensitive popula-tions. The main policy goals of the program are to:
● Utilize the air District’s wide range of tools and resources, including regulations and guidance, air quality monitoring, public outreach and community dialogue, targeted grant funding, enforcement of diesel air toxics control mea-sures, and collaboration with county health de-partments and other local agencies to address health impacts from air pollution,
● identify locations within the Bay area where air pollution is most contributing to health impacts and where populations are most vulnerable to air pollution impacts,
● Design and focus effective mitigation mea-sures in areas with highest impacts, and
● engage communities and stakeholder groups in the program and develop productive
Chapter 4 planning Context
Bay area air Quality ManageMent District | Clean air Plan 2017 4/7
relationships with local agencies to craft miti-gation that extend beyond what the air District could do alone.
For additional information on the Care program, see the report entitled Improving Air Quality and Health in Bay Area Communities.2 Maps of com-munities impacted by air pollution, generated through the Care program, are being integrat-ed into many of the air District’s programs. The maps, along with information about pollutants and their sources that lead to the impacts, help prioritize a broad array of actions designed to fos-ter healthy communities.
Programs to Reduce Emissions from Stationary Sources
Key elements of the air District’s program to re-duce emissions from stationary sources are briefly described below.
● Rule Development: The air District develops regulations to improve air quality, protect public health, and protect the climate based on con-trol measures identified in the Clean Air Plan. in developing or amending rules to reduce emissions from stationary sources, air District staff perform technical research, analyze cost effectiveness, engage with affected stakehold-ers, hold public meetings to solicit input from interested parties such as industries and com-munities, and prepare environmental (CeQa) and socioeconomic analyses for each newly proposed rule. Once adopted by the Board of Directors, new or amended rules are enforced via the air District’s Permit and Compliance and enforcement programs.
● Compliance and Enforcement: The air Dis-trict routinely inspects and audits various facil-ities and operations to ensure compliance with air quality laws and regulations. The air Dis-trict may inspect refineries, chemical plants, semiconductor manufacturing facilities, dry cleaners, ink and coating operations, gaso-line dispensing facilities, asbestos demolition and renovation, and any operation or activity that can result in air pollution. The air District also investigates residents’ complaints about
air pollution. inspectors determine whether the pollutant source is operating in compliance with relevant rules and regulations.
● New Source Review: The air District’s new Source review (nSr) program is a compre-hensive air permitting program that applies to a wide-range of stationary source facilities within the air District’s regulatory jurisdiction. The program requires a facility to obtain a per-mit and implement state-of-the-art air pollution control technology whenever a facility installs a new source of air emissions or makes a mod-ification to an existing source. The Air District’s nSr program is set out in regulation 2, rule 2 and regulation 2, rule 5. regulation 2, rule 2 is the air District’s fundamental permitting re-quirement for regulating criteria pollutant emis-sions. it requires facilities to obtain an nSr permit for any new or “modified” source of air emissions, and to satisfy a number of air pollu-tion control requirements in order to be eligible for the permit.
regulation 2, rule 5, outlines permitting re-quirements for regulating toxic air contam-inants. Rule 2-5 requires new or modified emissions sources to perform health risk screening analysis for TaCs and to utilize Best available Control Technology to reduce emissions of TaCs. The air District amended rule 2-5 in December 2016 to incorporate new and revised TaC emission rate trigger levels and other elements in its health risk assessment (Hra) requirements pursuant to revised Hra guidelines issued by CalePa’s Office of Environmental Health Hazard As-sessment (OeHHa). The revised rule will in-crease the stringency of the air District’s nSr Program to reduce health risks from TaCs.3
● TACs Hot Spots Program: The air Toxics “Hot Spots” information and assessment act (aB 2588) is a State program implemented by regional air districts in California. Pursuant to assembly Bill 2588 (1987) and Senate Bill 1731 (1992), facilities are required to provide information about their TaC emissions, and fa-cilities that pose a significant risk are required to develop and implement site-specific risk re-duction plans and audits.
Chapter 4 planning Context
4/8 Bay area air Quality ManageMent District | Clean air Plan 2017
● Draft Rule 11-18: as noted above, in Decem-ber 2016 the air District amended rule 2-5 to apply the revised, more stringent OeHHa guidelines for the purpose of assessing TaC risk from new or modified emissions sources. To enhance its program to reduce health risks from emissions of TaCs at existing sources, the air District is developing a new rule, rule 11-18. The proposed draft rule, to be consid-ered by the air District Board of Directors in spring 2017, would apply the revised OeHHa guidelines for the purpose of assessing risk from TaCs from existing sources. For addition-al information, see proposed control measure SS20 in Chapter 5.
Bay Area Refinery Emissions Reduction Strategy
The San Francisco Bay Area has five major oil re-fineries that produce air pollution and GHGs. Oil refineries are subject to more than 20 specific Air District regulations and programs. emissions of most pollutants from refineries have been steadily decreasing over the past several decades. Despite this progress, the refineries are major sources of criteria air pollutants, TaCs and GHGs.
in October 2014, the air District Board of Directors adopted a Refinery Emissions Reduction Resolu-tion, which established a goal of reducing refinery criteria air pollutant emissions by 20 percent or as much as feasible by 2020. in response to that di-rective, the air District has developed a Bay area Refinery Emissions Reduction Strategy. The Re-finery Strategy ensures that refineries are taking the strongest feasible steps to reduce emissions and minimize their health impacts on neighboring residents and the region as a whole.
The Refinery Strategy involves five components:
1. Overall Goals: achieve a 20 percent reduction in criteria air pollutants from refineries by 2020, as well as a 20 percent reduction in health risk to local communities.
2. Reduction of Criteria Pollutants: Under a fo-cused Best Available Retrofit Control Technol-ogy program, investigate significant sources at refineries and pursue a variety of additional pollution controls at these sources.
3. Reduction of Health Risks from Toxic Air Pollution: explore requirements and adopt rules that reduce toxic emissions from key re-finery sources. Include site-wide Health Risk Assessments and the identification of sources for further emission controls, using health ben-efits as an important evaluative tool in future rulemaking.
4. Evaluation of GHG emissions: Track emis-sion reductions at refineries incurred as a re-sult of the Cap-and-Trade system under aB 32.
5. Continuous improvement: To ensure con-tinuous improvement in emission reductions, refineries could be required to periodically evaluate the sources of the majority of their emissions in order to determine if additional pollution controls are needed.
Progress on the Refinery Strategy includes the adoption of five rules, and one that is currently be-ing developed. Three rules were adopted in De-cember 2015, Particulate Emissions from Refinery Fluidized Catalytic Cracking Units (reg. 6, rule 5), equipment leaks (reg. 8, rule 18) and Cool-ing Towers (reg. 11, rule 10). Two rules were ad-opted in April 2016. The Petroleum Refining Emis-sions Tracking rule (reg. 12, rule 15) mandates improved reporting of emissions inventories, track-ing of crude slate changes, and improved real-time monitoring of emissions at refinery fencelines in order to protect local communities. The Petroleum Coke Calcining Operations rule (reg. 9, rule 14) will reduce emissions of sulfur dioxide from coke calcining. Other rules under development to re-duce refinery emissions are summarized in the 2017 control strategy, as described in Chapter 5.
Emissions of most pollutants from refineries have been
steadily decreasing over the past several decades.
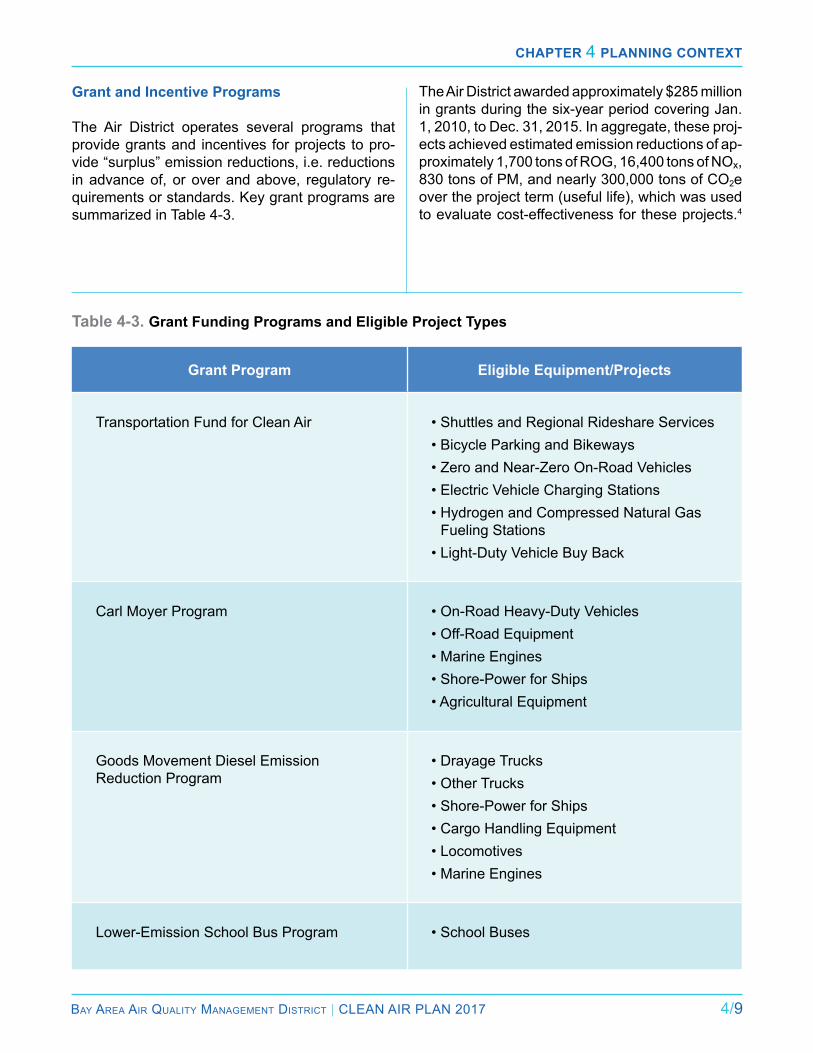
Chapter 4 planning Context
Bay area air Quality ManageMent District | Clean air Plan 2017 4/9
Grant and Incentive Programs
The air District operates several programs that provide grants and incentives for projects to pro-vide “surplus” emission reductions, i.e. reductions in advance of, or over and above, regulatory re-quirements or standards. Key grant programs are summarized in Table 4-3.
Table 4-3. Grant Funding Programs and Eligible Project Types
Grant Program Eligible Equipment/Projects
Transportation Fund for Clean air • Shuttles and Regional Rideshare Services• Bicycle Parking and Bikeways• Zero and Near-Zero On-Road Vehicles• Electric Vehicle Charging Stations• Hydrogen and Compressed Natural Gas
Fueling Stations• Light-Duty Vehicle Buy Back
Carl Moyer Program • On-Road Heavy-Duty Vehicles• Off-Road Equipment• Marine Engines• Shore-Power for Ships • Agricultural Equipment
Goods Movement Diesel emission reduction Program
• Drayage Trucks• Other Trucks• Shore-Power for Ships• Cargo Handling Equipment• Locomotives• Marine Engines
lower-emission School Bus Program • School Buses
The air District awarded approximately $285 million in grants during the six-year period covering Jan. 1, 2010, to Dec. 31, 2015. in aggregate, these proj-ects achieved estimated emission reductions of ap-proximately 1,700 tons of rOG, 16,400 tons of nOx, 830 tons of PM, and nearly 300,000 tons of CO2e over the project term (useful life), which was used to evaluate cost-effectiveness for these projects.4

Chapter 4 planning Context
4/10 Bay area air Quality ManageMent District | Clean air Plan 2017
One of the most direct, effective, and tangible ways to reduce emissions and population exposure in communities that are disproportionately impacted by air pollution is to replace or retrofit dirty engines and vehicles that operate in these communities. The air District has made a commitment to focus its grant funds on projects in impacted communities. Over the last six years, approximately 60 percent of the air District’s grant funds have been directed to impacted communities. Table 4-4 summarizes the funding awarded to projects in impacted com-
munities over the past six funding cycles and the emissions reduced over each project’s useful life. as discussed in more detail in the “reducing emis-sions from Seaports and Goods Movement” sec-tion below, the grants provided to reduce emissions from trucks and ships in Bay area ports have been highly effective in reducing population exposure to air pollution in the adjacent communities. Table 4-5 summarizes the funding awarded for projects in other, less heavily-impacted communities and the emission reductions for the same time period.
Table 4-4. Grants Provided to Projects in Impacted Communities, 2010–2015
Project Type ROG Reduceda
NOx Reduced
PM Reduced
CO2 Reduced
Funding Amount
light-Duty Vehicles 2.1 1.7 0.4 240.2 $1,728,255
Vehicle Buy Back 932.5 1,061.8 9.4 b. $18,927,931
Shuttle and rideshare Services 151.3 148.5 129.1 140,620.7 $18,375,785
Bicycle Parking and Bikeways 6.7 5.6 4.2 1,125.6 $2,589,929
On-road Trucks and Buses 6.7 3,525.1 108.2 b. $40,929,800
On-road Trucks (Ports) b. 3,411.4 177.2 b. $37,841,975
Off-road/aG 16.8 118.2 5.6 b. $3,740,381
locomotive 17.5 377.0 4.4 b. $3,015,850
Marine 18.2 1,521.3 48.2 b. $14,246,623
Shore Power 18.6 4,243.9 180.9 b. $26,630,048
School Buses b b. b. b. $10,835,004
Total 1,170 14,415 668 141,986 $178,861,582
a. emission reductions are total tons reduced over the “lifetime” of a project. lifetime means the useful life, which is used to evaluate cost-effectiveness for those projects and the term varies by project type, i.e. it can be one year for a shuttle project, and 10 or 15 years for a bicycle project.
b. Projects where emission reductions were achieved but not calculated due to lack of data.
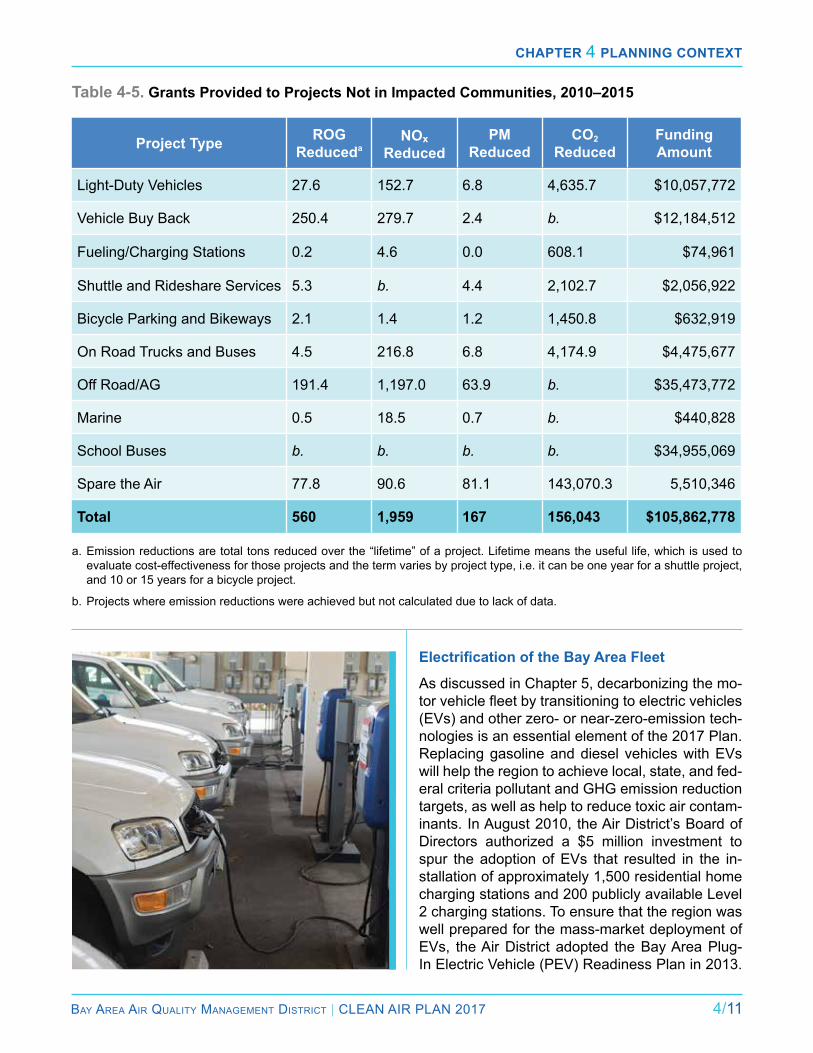
Chapter 4 planning Context
Bay area air Quality ManageMent District | Clean air Plan 2017 4/11
Table 4-5. Grants Provided to Projects Not in Impacted Communities, 2010–2015
Project Type ROG Reduceda
NOx Reduced
PM Reduced
CO2 Reduced
Funding Amount
light-Duty Vehicles 27.6 152.7 6.8 4,635.7 $10,057,772
Vehicle Buy Back 250.4 279.7 2.4 b. $12,184,512
Fueling/Charging Stations 0.2 4.6 0.0 608.1 $74,961
Shuttle and rideshare Services 5.3 b. 4.4 2,102.7 $2,056,922
Bicycle Parking and Bikeways 2.1 1.4 1.2 1,450.8 $632,919
On road Trucks and Buses 4.5 216.8 6.8 4,174.9 $4,475,677
Off road/aG 191.4 1,197.0 63.9 b. $35,473,772
Marine 0.5 18.5 0.7 b. $440,828
School Buses b. b. b. b. $34,955,069
Spare the air 77.8 90.6 81.1 143,070.3 5,510,346
Total 560 1,959 167 156,043 $105,862,778
a. emission reductions are total tons reduced over the “lifetime” of a project. lifetime means the useful life, which is used to evaluate cost-effectiveness for those projects and the term varies by project type, i.e. it can be one year for a shuttle project, and 10 or 15 years for a bicycle project.
b. Projects where emission reductions were achieved but not calculated due to lack of data.
Electrification of the Bay Area Fleet
as discussed in Chapter 5, decarbonizing the mo-tor vehicle fleet by transitioning to electric vehicles (eVs) and other zero- or near-zero-emission tech-nologies is an essential element of the 2017 Plan. replacing gasoline and diesel vehicles with eVs will help the region to achieve local, state, and fed-eral criteria pollutant and GHG emission reduction targets, as well as help to reduce toxic air contam-inants. in august 2010, the air District’s Board of Directors authorized a $5 million investment to spur the adoption of eVs that resulted in the in-stallation of approximately 1,500 residential home charging stations and 200 publicly available level 2 charging stations. To ensure that the region was well prepared for the mass-market deployment of eVs, the air District adopted the Bay area Plug-in electric Vehicle (PeV) readiness Plan in 2013.
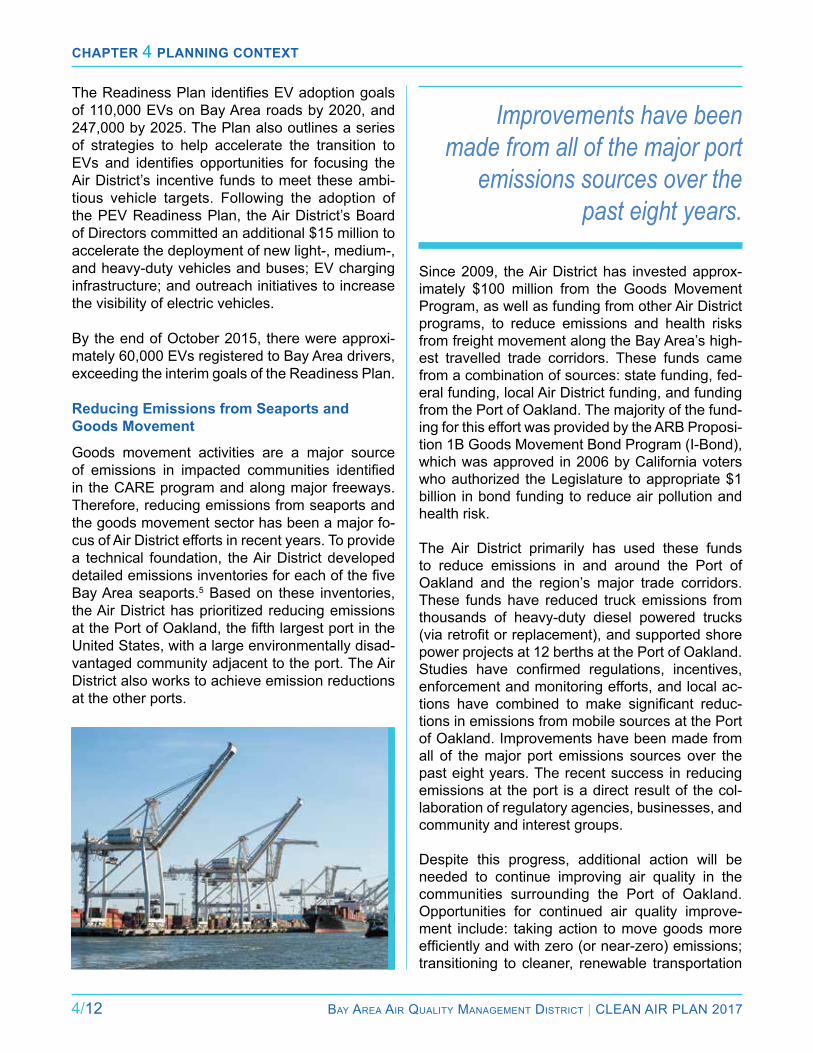
Chapter 4 planning Context
4/12 Bay area air Quality ManageMent District | Clean air Plan 2017
The Readiness Plan identifies EV adoption goals of 110,000 eVs on Bay area roads by 2020, and 247,000 by 2025. The Plan also outlines a series of strategies to help accelerate the transition to EVs and identifies opportunities for focusing the air District’s incentive funds to meet these ambi-tious vehicle targets. Following the adoption of the PeV readiness Plan, the air District’s Board of Directors committed an additional $15 million to accelerate the deployment of new light-, medium-, and heavy-duty vehicles and buses; eV charging infrastructure; and outreach initiatives to increase the visibility of electric vehicles.
By the end of October 2015, there were approxi-mately 60,000 eVs registered to Bay area drivers, exceeding the interim goals of the readiness Plan.
Reducing Emissions from Seaports and Goods Movement
Goods movement activities are a major source of emissions in impacted communities identified in the Care program and along major freeways. Therefore, reducing emissions from seaports and the goods movement sector has been a major fo-cus of air District efforts in recent years. To provide a technical foundation, the air District developed detailed emissions inventories for each of the five Bay area seaports.5 Based on these inventories, the air District has prioritized reducing emissions at the Port of Oakland, the fifth largest port in the United States, with a large environmentally disad-vantaged community adjacent to the port. The air District also works to achieve emission reductions at the other ports.
Since 2009, the air District has invested approx-imately $100 million from the Goods Movement Program, as well as funding from other air District programs, to reduce emissions and health risks from freight movement along the Bay area’s high-est travelled trade corridors. These funds came from a combination of sources: state funding, fed-eral funding, local air District funding, and funding from the Port of Oakland. The majority of the fund-ing for this effort was provided by the arB Proposi-tion 1B Goods Movement Bond Program (i-Bond), which was approved in 2006 by California voters who authorized the legislature to appropriate $1 billion in bond funding to reduce air pollution and health risk.
The air District primarily has used these funds to reduce emissions in and around the Port of Oakland and the region’s major trade corridors. These funds have reduced truck emissions from thousands of heavy-duty diesel powered trucks (via retrofit or replacement), and supported shore power projects at 12 berths at the Port of Oakland. Studies have confirmed regulations, incentives, enforcement and monitoring efforts, and local ac-tions have combined to make significant reduc-tions in emissions from mobile sources at the Port of Oakland. improvements have been made from all of the major port emissions sources over the past eight years. The recent success in reducing emissions at the port is a direct result of the col-laboration of regulatory agencies, businesses, and community and interest groups.
Despite this progress, additional action will be needed to continue improving air quality in the communities surrounding the Port of Oakland. Opportunities for continued air quality improve-ment include: taking action to move goods more efficiently and with zero (or near-zero) emissions; transitioning to cleaner, renewable transportation
Improvements have been made from all of the major port
emissions sources over the past eight years.
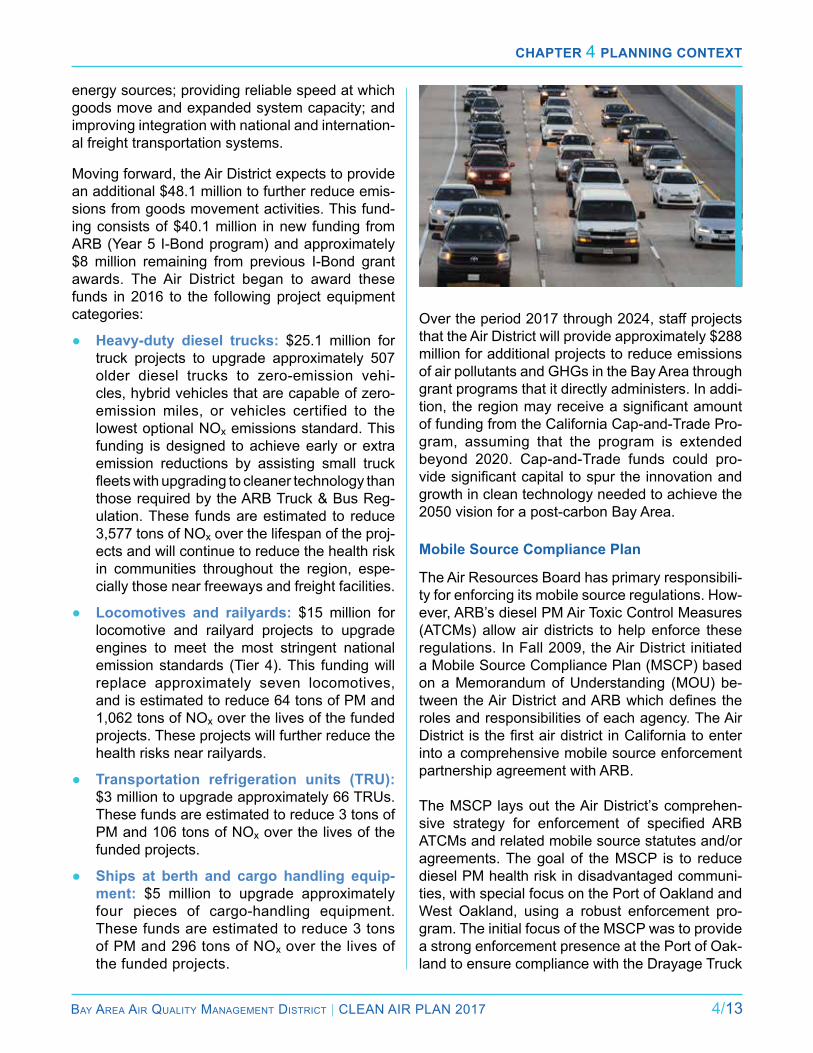
Chapter 4 planning Context
Bay area air Quality ManageMent District | Clean air Plan 2017 4/13
energy sources; providing reliable speed at which goods move and expanded system capacity; and improving integration with national and internation-al freight transportation systems.
Moving forward, the air District expects to provide an additional $48.1 million to further reduce emis-sions from goods movement activities. This fund-ing consists of $40.1 million in new funding from arB (Year 5 i-Bond program) and approximately $8 million remaining from previous i-Bond grant awards. The air District began to award these funds in 2016 to the following project equipment categories:
● Heavy-duty diesel trucks: $25.1 million for truck projects to upgrade approximately 507 older diesel trucks to zero-emission vehi-cles, hybrid vehicles that are capable of zero- emission miles, or vehicles certified to the lowest optional nOx emissions standard. This funding is designed to achieve early or extra emission reductions by assisting small truck fleets with upgrading to cleaner technology than those required by the arB Truck & Bus reg-ulation. These funds are estimated to reduce 3,577 tons of nOx over the lifespan of the proj-ects and will continue to reduce the health risk in communities throughout the region, espe-cially those near freeways and freight facilities.
● Locomotives and railyards: $15 million for locomotive and railyard projects to upgrade engines to meet the most stringent national emission standards (Tier 4). This funding will replace approximately seven locomotives, and is estimated to reduce 64 tons of PM and 1,062 tons of nOx over the lives of the funded projects. These projects will further reduce the health risks near railyards.
● Transportation refrigeration units (TRU): $3 million to upgrade approximately 66 TrUs. These funds are estimated to reduce 3 tons of PM and 106 tons of nOx over the lives of the funded projects.
● Ships at berth and cargo handling equip-ment: $5 million to upgrade approximately four pieces of cargo-handling equipment. These funds are estimated to reduce 3 tons of PM and 296 tons of nOx over the lives of the funded projects.
Over the period 2017 through 2024, staff projects that the air District will provide approximately $288 million for additional projects to reduce emissions of air pollutants and GHGs in the Bay area through grant programs that it directly administers. in addi-tion, the region may receive a significant amount of funding from the California Cap-and-Trade Pro-gram, assuming that the program is extended beyond 2020. Cap-and-Trade funds could pro-vide significant capital to spur the innovation and growth in clean technology needed to achieve the 2050 vision for a post-carbon Bay area.
Mobile Source Compliance Plan
The air resources Board has primary responsibili-ty for enforcing its mobile source regulations. How-ever, arB’s diesel PM air Toxic Control Measures (aTCMs) allow air districts to help enforce these regulations. in Fall 2009, the air District initiated a Mobile Source Compliance Plan (MSCP) based on a Memorandum of Understanding (MOU) be-tween the Air District and ARB which defines the roles and responsibilities of each agency. The air District is the first air district in California to enter into a comprehensive mobile source enforcement partnership agreement with arB.
The MSCP lays out the air District’s comprehen-sive strategy for enforcement of specified ARB aTCMs and related mobile source statutes and/or agreements. The goal of the MSCP is to reduce diesel PM health risk in disadvantaged communi-ties, with special focus on the Port of Oakland and West Oakland, using a robust enforcement pro-gram. The initial focus of the MSCP was to provide a strong enforcement presence at the Port of Oak-land to ensure compliance with the Drayage Truck
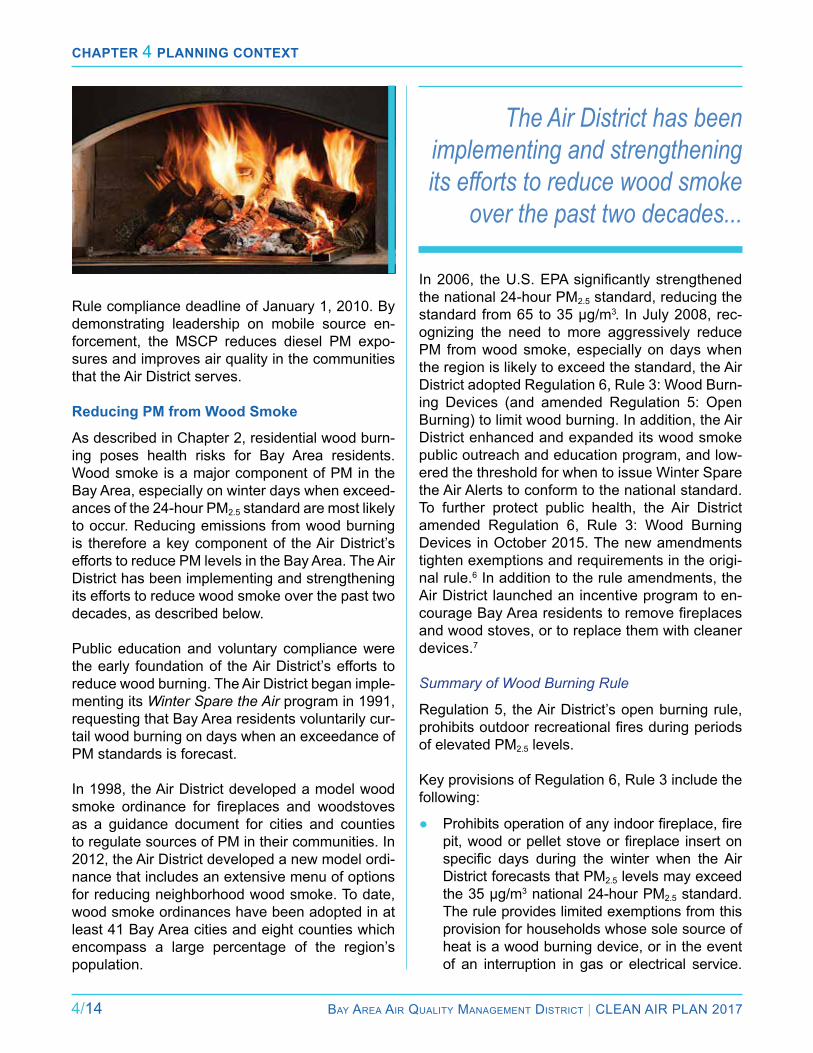
Chapter 4 planning Context
4/14 Bay area air Quality ManageMent District | Clean air Plan 2017
rule compliance deadline of January 1, 2010. By demonstrating leadership on mobile source en-forcement, the MSCP reduces diesel PM expo-sures and improves air quality in the communities that the air District serves.
Reducing PM from Wood Smoke as described in Chapter 2, residential wood burn-ing poses health risks for Bay area residents. Wood smoke is a major component of PM in the Bay area, especially on winter days when exceed-ances of the 24-hour PM2.5 standard are most likely to occur. reducing emissions from wood burning is therefore a key component of the air District’s efforts to reduce PM levels in the Bay area. The air District has been implementing and strengthening its efforts to reduce wood smoke over the past two decades, as described below.
Public education and voluntary compliance were the early foundation of the air District’s efforts to reduce wood burning. The air District began imple-menting its Winter Spare the Air program in 1991, requesting that Bay area residents voluntarily cur-tail wood burning on days when an exceedance of PM standards is forecast.
in 1998, the air District developed a model wood smoke ordinance for fireplaces and woodstoves as a guidance document for cities and counties to regulate sources of PM in their communities. in 2012, the air District developed a new model ordi-nance that includes an extensive menu of options for reducing neighborhood wood smoke. To date, wood smoke ordinances have been adopted in at least 41 Bay area cities and eight counties which encompass a large percentage of the region’s population.
In 2006, the U.S. EPA significantly strengthened the national 24-hour PM2.5 standard, reducing the standard from 65 to 35 μg/m3. in July 2008, rec-ognizing the need to more aggressively reduce PM from wood smoke, especially on days when the region is likely to exceed the standard, the air District adopted regulation 6, rule 3: Wood Burn-ing Devices (and amended regulation 5: Open Burning) to limit wood burning. in addition, the air District enhanced and expanded its wood smoke public outreach and education program, and low-ered the threshold for when to issue Winter Spare the air alerts to conform to the national standard. To further protect public health, the air District amended regulation 6, rule 3: Wood Burning Devices in October 2015. The new amendments tighten exemptions and requirements in the origi-nal rule.6 in addition to the rule amendments, the air District launched an incentive program to en-courage Bay Area residents to remove fireplaces and wood stoves, or to replace them with cleaner devices.7
Summary of Wood Burning Rule
regulation 5, the air District’s open burning rule, prohibits outdoor recreational fires during periods of elevated PM2.5 levels.
Key provisions of regulation 6, rule 3 include the following:
● Prohibits operation of any indoor fireplace, fire pit, wood or pellet stove or fireplace insert on specific days during the winter when the Air District forecasts that PM2.5 levels may exceed the 35 μg/m3 national 24-hour PM2.5 standard. The rule provides limited exemptions from this provision for households whose sole source of heat is a wood burning device, or in the event of an interruption in gas or electrical service.
The Air District has been implementing and strengthening its efforts to reduce wood smoke
over the past two decades...
Chapter 4 planning Context
Bay area air Quality ManageMent District | Clean air Plan 2017 4/15
● requires cleaner burning technology when wood burning devices are sold or resold or installed.
● Prohibits the burning of garbage, non- seasoned wood, plastics, and other inappro-priate types of materials.
● requires labeling and disclosure of the mois-ture content in wood sold for use within the boundaries of the air District.
● requires a label on packages of wood and oth-er solid fuels (such as compressed logs and pellets) instructing the user to check local air quality status before burning these products.
Key amendments effective november 1, 2016:
● no wood burning devices may be installed in new building construction.
● Households applying for a Sole Source Heat exemption must replace their wood burning de-vice to an EPA-certified wood burning device.
Key amendments effective november 1, 2018:
● rental properties in areas with natural gas ser-vice will be required to install a source of heat that does not burn wood.
● rental properties in areas with natural gas ser-vice may no longer qualify for a Sole Source Heat exemption.
Wood Smoke Reduction Incentive Program: in august 2016, the air District launched a Wood Smoke reduction incentive Program. The pro-gram allocates $3 million in funding to help Bay area homeowners and landlords replace their wood burning fireplaces and wood stoves with cleaner heating options. To promote social equity and ensure that families at all income levels can participate in this program, “highly impacted resi-dents” can qualify for larger incentives based upon financial need as well as the level of wood smoke in their community.
Protecting the Climate
in 2005, the air District launched its Climate Pro-tection Program. Since then, we have experienced many “firsts”: we developed the first GHG inven-
tory for a major metropolitan region; we adopted the first GHG fee on industrial and commercial sources; and we became one of the largest cli-mate funders in the nation when we implement-ed a $3 million climate protection grant program in 2007. a reinvigoration of the program in 2013 included adopting an aggressive goal of reducing greenhouse gas emissions in the Bay area 80 per-cent below 1990 levels by 2050, and launched the regional climate protection strategy work reflected in this Plan. Key air District climate protection pro-grams and activities are described below.
Demonstrating Climate Leadership for the Region and State
Since establishing a Climate Protection Program in June 2005, the air District has worked to integrate climate protection into all its core functions and initi-ated innovative climate protection efforts. Through its regulatory functions, in 2008 the air District be-came the first local air district in the nation to im-pose a cost-recovery fee on stationary sources of GHGs, to defray the costs of the air District’s climate protection work related to these sources. industri-al facilities and businesses currently subject to air District permit requirements pay a fee of $0.096 per metric ton of GHG emissions. as a regional planning agency, the air District also developed the first recommended thresholds of significance for GHG emissions under the California environ-mental Quality act. and as a science-based institu-tion, the Air District is becoming the first regulatory agency to establish a fixed-site network for moni-toring regional GHG emissions on the West Coast.
Chapter 4 planning Context
4/16 Bay area air Quality ManageMent District | Clean air Plan 2017
Issuing Grants and Incentives
Through the Climate Protection Program, the air District has issued the following grants and incentives:
● investing approximately $240 million to reduce GHGs and air pollutants through mobile source grants and incentives.
● awarding $3 million in grants to 53 local proj-ects to reduce GHG emissions. The innova-tive grant program funded the development of local climate action plans, and also provided seed funding for municipal energy officers, renewable energy programs and youth-based projects.
● launching the Greenhouse Gas reduction Grant Program in 2009, using $4.4 million in funds generated by a settlement between the California Attorney General’s Office and Cono-coPhillips, for projects that reduce GHG emis-sions in the communities nearest the Cono-coPhillips refinery: Rodeo, Crockett, Hercules and Pinole. The proceeds from the settlement were used to fund energy efficiency, cool roofs and onsite renewable energy projects at public facilities.
● Providing seed funding to jump-start game- changing initiatives including the first Commu-nity Choice energy (CCe) program in Califor-nia, Marin Clean Energy; and the first Proper-ty-assessed Clean energy (PaCe) program, BerkeleyFirst.
Developing a Regional GHG Emissions Inventory
In 2006, the Air District became the first local air district in the nation to develop a detailed regional GHG emissions inventory. The inventory is updat-ed regularly with new methodologies and sources. in addition, the air District worked with UC Berke-ley’s Cool Climate Program to develop a con-sumption-based GHG emissions inventory for the Bay area.
Providing Technical Assistance to Local Governments
local governments play a critical role in enacting on-the-ground policies and programs that reduce GHG emissions, and are thus key partners in im-plementing the air District’s Climate Protection Program. The air District provides extensive tech-nical assistance to local governments in develop-ing community-wide GHG inventories and local climate action plans and programs. The air District also provides a variety of assistance to help local governments implement their climate action plans.
● Guidance and training to assist with commu-nity-wide GHG inventories and developing cli-mate action plans,
● review and feedback on draft inventories and climate action plans,
● Tools and data to increase knowledge of lo-cal GHG emissions and impacts from local policies,
● regional and sub-regional events to share best practices and case studies, and
● Connections between state and federal agen-cies and local governments to facilitate policy development and funding.
The air District has developed a tool, in collabora-tion with MTC, to deliver motor vehicle travel data directly to local governments for use in community GHG emissions inventories.
Serving as Regional Convener for Climate Action
in november 2006, the air District convened a Bay area-wide summit on climate protection. The event was attended by over 500 local leaders from government, education, youth, business, research and the non-profit community and set the stage for wide-spread collaboration and action. another summit was convened in May 2009 for over 400 local government planners and elected officials. Most recently, in October, 2016, the air District convened a regional summit on climate innovation and leadership entitled Climate Forward Bay Area:
Chapter 4 planning Context
Bay area air Quality ManageMent District | Clean air Plan 2017 4/17
A Leadership Forum. The forum brought together leaders from technology, business, environmental and community groups, and public agencies to share ideas and approaches on reducing Bay area GHG emissions while advancing economic devel-opment. The air District has also organized multi-ple smaller-scale events, partnering with state agencies, local governments and other air districts.
in addition, the air District works closely with its re-gional agency partners—MTC, the association of Bay area Governments (aBaG) and the Bay Con-servation and Development Commission (BCDC)— along with local governments, business groups, community organizations, and other stakeholders to reduce emissions of GHGs in the Bay area.
external Policies, Plans and Programs that Complement the 2017 Plan
numerous state, regional and local policies, plans and programs complement and rein-force the 2017 Plan. Working together, these
plans provide an integrated air quality and climate protection framework for the Bay area. Key state policies and programs are described below.
State Policies, Plans and Programs
State Climate Protection Legislation
in September 2006, Governor Schwarzenegger signed assembly Bill 32, the Global Warming Solutions act, establishing a statewide target of reducing GHG emissions to 1990 levels by 2020. This act required arB to prepare a “scoping plan” to lay out how the state will achieve these reduc-tions. Since then, additional legislation has been enacted to authorize and guide the state’s climate protection efforts. These bills include:
● Senate Bill 605 (2014) directed the air resourc-es Board to develop a statewide Short-lived Climate Pollutant (SlCP) reduction strategy.8
● Senate Bill 350 (2015) increased the require-ment for utilities to procure electricity from re-newable sources to 50 percent by 2030.
● Senate Bill 32 (2016) established a new target to reduce GHG emissions 40 percent below 1990 levels by 2030.
● Senate Bill 1383 (2016) established targets to reduce emissions of super-GHGs, with a target of reducing methane and hydrofluorocarbon emissions 40% below 2013 levels by 2030 and reducing black carbon emissions 50 percent below 2013 levels by 2030.
● assembly Bill 197 (2016) requires the air re-sources Board to make available an annual report of GHG, criteria pollutant and toxic air contaminants emissions for each facility that is required to report these emissions.
● assembly Bill 2722 (2016) requires the Stra-tegic Growth Council to award competitive grants to eligible entities for the development and implementation of neighborhood-level transformative climate community plans that provide local economic, environmental, and health benefits to disadvantaged communities.
Assembly Bill 32 Scoping Plan
The aB 32 Scoping Plan, adopted by the arB Board in December 2008, set forth the main strat-egies California would pursue to meet the 2020 climate protection goal.
The first update to the Scoping Plan was approved by arB in May 2014. it highlights California’s prog-ress toward meeting the “near-term” 2020 GHG emission reduction goal defined in the initial Scop-ing Plan, and defines ARB’s climate change pri-orities through 2030. The 2014 update also lays the groundwork to reach long-term goals set forth in executive Orders S-3-05 and B-16-2012.9 The
Chapter 4 planning Context
4/18 Bay area air Quality ManageMent District | Clean air Plan 2017
Scoping Plan Update uses a framework that as-sesses policy opportunities across major economic sectors and recommends specific GHG emission reduction strategies for each sector. The sectors include energy, transportation, agriculture, water, waste management, natural and working lands, short-lived climate pollutants, green buildings, and the Cap-and-Trade Program. The air District is us-ing the same economic sector framework for the purpose of defining the control strategy in the 2017 Plan. arB is currently in the process of preparing a second update to the Scoping Plan to address the requirements of SB 32 and the target of reducing GHG emissions by 40 percent below 1990 levels by 2030. arB is expected to issue a draft of the re-vised Scoping Plan for public review in early 2017. air District staff is monitoring the Scoping Plan up-date and will make any necessary revisions to this plan at the appropriate time.
Senate Bill 375
Transportation accounts for some 40 percent of GHG emissions in California, with cars and light-duty trucks accounting for almost three- quarters of those emissions, with similar percent-ages in the Bay area. SB 375 (Steinberg, 2008), directed arB to set regional targets for the reduc-tion of GHG emissions from cars and light-duty trucks. The legislation also calls for the state’s 18 major metropolitan planning organizations to develop strategies to meet these goals in their long-term transportation plans via a new element of the plan, called the “Sustainable Communities Strategy (SCS).” in addition, SB 375 requires that
Transportation accounts for some 40 percent of GHG
emissions in California, with cars and light-duty trucks
accounting for almost three-quarters of those emissions...
regions house all of their projected population, by income level, without displacing current low- income residents.
in 2011, arB set GHG reduction targets for each of the state’s major metropolitan regions. arB called for the Bay area to reduce per-capita CO2 emissions from cars and light-duty trucks by 7 percent by 2020 and by 15 percent by 2035. as discussed in the section on Plan Bay Area below, in april 2014, arB determined that the Plan Bay Area Sustainable Communities Strategy adopted by MTC and aBaG in 2013 will achieve the Bay area’s SB 375 target.
Regional Housing Needs Allocation
The regional Housing needs allocation (rHna) is a state-mandated program to identify the total number of housing units, by household income level, that each jurisdiction must plan for to meet state housing goals. Since the adoption of SB 375, rHna also plays a key role in meeting regional GHG targets. aBaG is responsible for developing a methodology to allocate the housing need to lo-cal cities and counties, taking into account project-ed job and population growth, access to transit and existing development. The allocation method must be consistent with the long-term development pat-tern described in the SCS.
Mobile Source Regulations
Mobile source emissions are regulated by U.S. ePa and arB using three basic approaches:
● establishing emission standards for new vehi-cles, engines and equipment,
● regulating the content of gasoline, diesel and other fuels, and
● in-use performance standards, such as the inspection and Maintenance “Smog Check” program.
Emission Standards
Under a provision of the federal Clean air act, arB is authorized to adopt standards and regula-tions to control emissions from motor vehicles and
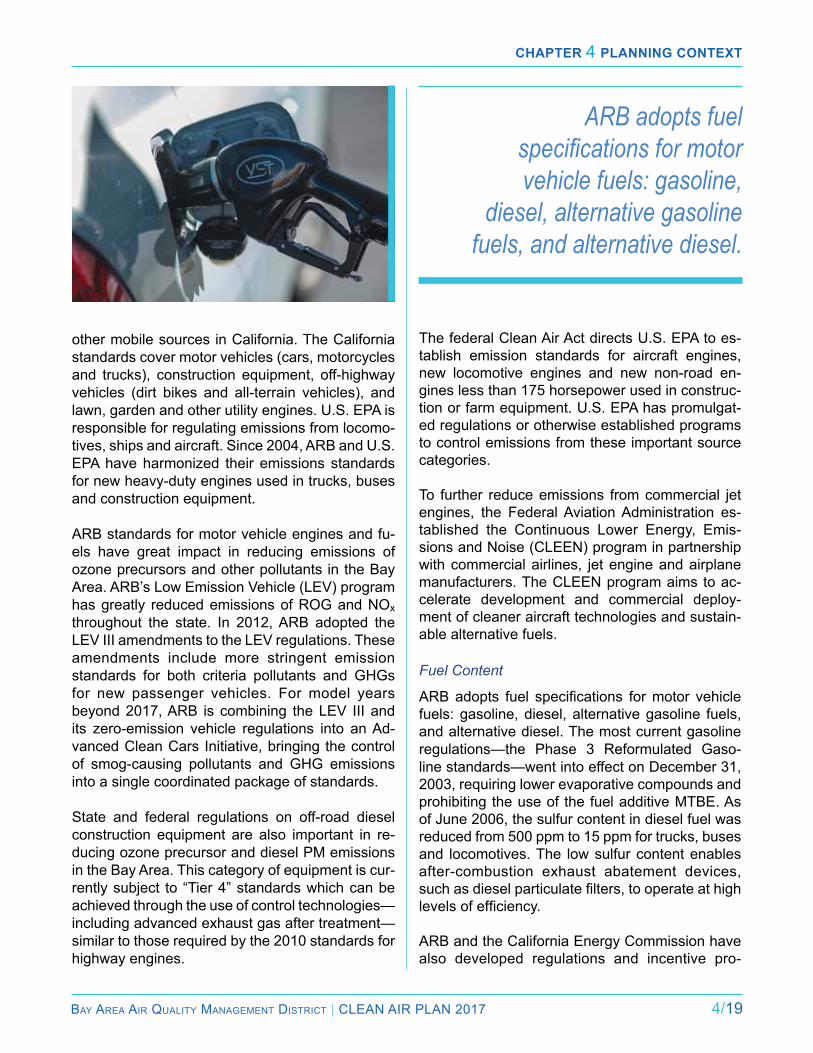
Chapter 4 planning Context
Bay area air Quality ManageMent District | Clean air Plan 2017 4/19
ARB adopts fuel specifications for motor vehicle fuels: gasoline,
diesel, alternative gasoline fuels, and alternative diesel.
other mobile sources in California. The California standards cover motor vehicles (cars, motorcycles and trucks), construction equipment, off-highway vehicles (dirt bikes and all-terrain vehicles), and lawn, garden and other utility engines. U.S. ePa is responsible for regulating emissions from locomo-tives, ships and aircraft. Since 2004, arB and U.S. ePa have harmonized their emissions standards for new heavy-duty engines used in trucks, buses and construction equipment. arB standards for motor vehicle engines and fu-els have great impact in reducing emissions of ozone precursors and other pollutants in the Bay area. arB’s low emission Vehicle (leV) program has greatly reduced emissions of rOG and nOx throughout the state. in 2012, arB adopted the leV iii amendments to the leV regulations. These amendments include more stringent emission standards for both criteria pollutants and GHGs for new passenger vehicles. For model years beyond 2017, arB is combining the leV iii and its zero-emission vehicle regulations into an ad-vanced Clean Cars initiative, bringing the control of smog-causing pollutants and GHG emissions into a single coordinated package of standards.
State and federal regulations on off-road diesel construction equipment are also important in re-ducing ozone precursor and diesel PM emissions in the Bay area. This category of equipment is cur-rently subject to “Tier 4” standards which can be achieved through the use of control technologies— including advanced exhaust gas after treatment—similar to those required by the 2010 standards for highway engines.
The federal Clean air act directs U.S. ePa to es-tablish emission standards for aircraft engines, new locomotive engines and new non-road en-gines less than 175 horsepower used in construc-tion or farm equipment. U.S. ePa has promulgat-ed regulations or otherwise established programs to control emissions from these important source categories.
To further reduce emissions from commercial jet engines, the Federal aviation administration es-tablished the Continuous lower energy, emis-sions and noise (Cleen) program in partnership with commercial airlines, jet engine and airplane manufacturers. The Cleen program aims to ac-celerate development and commercial deploy-ment of cleaner aircraft technologies and sustain-able alternative fuels.
Fuel Content
ARB adopts fuel specifications for motor vehicle fuels: gasoline, diesel, alternative gasoline fuels, and alternative diesel. The most current gasoline regulations—the Phase 3 reformulated Gaso-line standards—went into effect on December 31, 2003, requiring lower evaporative compounds and prohibiting the use of the fuel additive MTBe. as of June 2006, the sulfur content in diesel fuel was reduced from 500 ppm to 15 ppm for trucks, buses and locomotives. The low sulfur content enables after-combustion exhaust abatement devices, such as diesel particulate filters, to operate at high levels of efficiency. arB and the California energy Commission have also developed regulations and incentive pro-
Chapter 4 planning Context
4/20 Bay area air Quality ManageMent District | Clean air Plan 2017
grams to lower the carbon content of fuels and to transition California to renewable substitutes for gasoline and diesel in order to reduce emissions of GHGs from mobiles sources. The centerpiece of this effort is the low Carbon Fuel Standard (lCFS) Program adopted by arB in april 2009 pursuant to aB 32 and the Governor’s executive Order S-01-07. The lCFS, which went into effect in 2011, requires a minimum 10 percent decrease by 2020 in the carbon content of California’s transporta-tion fuels. arB adopted additional revisions to the lCFS regulation in 2015. The revisions included provisions designed to foster investments in the production of low-carbon fuels, provide additional flexibility to regulated parties, simplify and stream-line program operations, and enhance enforce-ment of the lCFS through 2020. in the coming years, arB is also expected to consider extending the lCFS with more aggressive targets for 2030 in a future rulemaking.
In-Use Performance
Motor vehicle emissions are also controlled through in-use performance standards to ensure that the systems continue to operate properly. The state of California’s inspection and Mainte-nance (i&M) program operated by the California Bureau of automotive repair (Bar) since 1984, tests light-duty on-road gasoline powered vehicles every other year. an enhanced program which re-quires the use of a dynamometer to test the vehi-cle’s emissions simulating on-road conditions be-gan in the Bay area in October 2003.
State Programs to Reduce Emissions from Stationary Sources
State programs to reduce emissions of GHGs and other air pollutants from stationary sources include the Cap-and-Trade Program to reduce emissions from major industrial sources, the renewable Portfolio Standard to reduce emissions from the energy sector, Title 24 to reduce emissions from buildings and the air Toxics Program.
Cap-and-Trade
The Cap-and-Trade (CaT) Program is a market- based regulation to reduce GHG emissions from major stationary sources by setting a declining cap
on GHG emissions from these sources. The cap establishes tradable emission allowances that can either be allocated to covered sources or auctioned for use by other facilities; this system establishes a price signal to drive long-term GHG reductions.
The CaT Program began in 2013, initially cover-ing electric utilities and large industrial facilities that emit more than 25,000 MT CO2e per year. The second compliance period began in January 2015, when the program expanded to include fuel distributors (e.g., natural gas, propane and trans-portation fuel providers). The CaT Program is ex-pected to reduce overall GHG emissions from reg-ulated facilities 17 percent below 2013 levels by 2020.10 The CaT Program covers approximately 450 major stationary sources of GHG emissions statewide. Some 40 of these sources are located within the air District. in 2011, these sources were responsible for approximately 25 MMT CO2e of GHG emissions in the Bay area.
arB is also currently drafting a regulation to es-tablish GHG emission standards for crude oil and natural gas facilities.11 This regulation would affect onshore and offshore crude oil and natural gas production, processing, and storage; natural gas underground storage; and natural gas transmis-sion compressor stations. The regulation would address fugitive and vented methane emissions from new and existing operations.
Energy Sector: Renewable Portfolio Standard
California’s renewable Portfolio Standard (rPS), jointly implemented by the California Public Utilities Commission (CPUC) and the California energy
Chapter 4 planning Context
Bay area air Quality ManageMent District | Clean air Plan 2017 4/21
Commission (CeC), is one of the most ambitious renewable energy standards in the country.12 The rPS program requires investor-owned utilities, electric service providers, and community choice energy programs to increase procurement from eligible renewable energy resources to 33 percent of total procurement by 2020. Passage of SB 350 in September 2015 increased the procurement re-quirement from renewable sources to 50 percent by 2030. The rPS program has spurred invest-ment in renewable resources, particularly solar and wind in the Bay area, and played a key role in increasing the use of renewable energy sources in our power supply.13
Energy Efficiency in New Buildings: Title 24
The California Building Code, otherwise known as Title 24, has had a profound effect on energy consumption in the state since it was first adopt-ed in 1978. Whereas most of the U.S. has seen increasing energy consumption on a per capita basis, California has remained relatively stable since building energy efficiency standards were implemented. The average Californian consumes about 40 percent less energy than the average american, whereas in 1960 these consumption levels were nearly identical. California’s energy ef-ficiency standards have saved residents and busi-nesses billions of dollars in energy expenses and eliminated over 250 million tons of GHG emissions since its implementation.
Building energy efficiency standards are updat-ed approximately every three years. The 2013 standards improve upon the 2008 standards for new construction of, and additions and alterations to, residential and nonresidential buildings. The 2013 standards went into effect July 1, 2014. The 2016 revisions to Title 24 energy efficiency stan-dards which take effect on January 1, 2017, will reduce emissions by an additional 25 percent for residential buildings and 30 percent for commer-cial buildings over the 2013 standards, decreasing statewide GHG emissions by 170,500 MTCO2e annually. The standards include energy-saving strategies for residential uses such as advanced lighting technology, high performance walls and attics, and tankless water heating. Measures for non-residential buildings include revisions to build-ing envelopes; updating lighting standards; more
efficient elevators and escalators; and connecting door and window sensors to HVaC systems.
in addition, Green Building Standards (CalGreen) in Title 24, Part 11 define more stringent voluntary standards to establish a path to zero-net-energy buildings. CalGreen provides voluntary options, known as tiers, which local governments can elect to adopt as mandatory standards.
Energy Efficiency in Existing Buildings
Title 24, Part 6 only addresses existing buildings when undergoing additions or alterations. Howev-er, more than half of California’s 13 million residen-tial buildings and more than 40 percent of com-mercial buildings were built prior to 1978; almost 70 percent of the Bay area housing stock was built prior to 1980. Because these buildings do not meet the latest Title 24 standards, assembly Bill 758 (2009) required the CeC and the CPUC to de-velop a comprehensive program to reduce energy consumption in existing buildings. The CeC re-cently released the final Existing Buildings Energy Efficiency (EBEE) Action Plan that provides a 10-year framework for key stakeholders to focus on achieving much greater energy efficiency in exist-ing buildings, including single-family, multi-family, commercial and public buildings sectors.
Air Toxics
There are both national and state programs to regulate TaCs. U.S. ePa regulates TaCs using the term hazardous air pollutants pursuant to Ti-tle iii, Section 112(b) of the 1990 Clean air act
Assembly Bill 758 (2009) required the CEC and
the CPUC to develop a comprehensive program to
reduce energy consumption in existing buildings.
Chapter 4 planning Context
4/22 Bay area air Quality ManageMent District | Clean air Plan 2017
amendments.14 California’s program to reduce exposure to TaCs was established by the Toxic Air Contaminant Identification and Control Act via aB 1807 in 1983, and the TaCs “Hot Spots” infor-mation and assessment act via aB 2588 in 1987. Under aB 1807, arB and OeHHa determine if a substance should be formally identified as a toxic air contaminant in California. arB assesses the potential for human exposure to a substance and OeHHa evaluates the health effects.
The aB 1807 program was amended in 1993 by aB 2728, which required arB to identify the 189 federal hazardous air pollutants as TaCs. aB 2588 supplements the aB 1807 program, by requiring a statewide TACs inventory, notification of people exposed to a significant health risk, and facility plans to reduce these risks. in 1992, the air Toxics “Hot Spots” information and assessment act (aB 2588) was amended by Senate Bill 1731, which required facilities that pose a significant health risk to the community to reduce their risk through a risk management plan.
The air District works to reduce TaC emissions and population exposure to TaCs through a variety of rules and programs, including the Care program, its new Source review pro-gram (rule 2-5), its TaC Hot Spots program to address TaC emissions from existing sources, a proposed new rule (rule 11-18) to strength-en the analysis of TaC health risks from exist-ing sources, as well as its grant and incentive programs. These efforts have greatly reduced the cancer risk from exposure to TaCs, as de-scribed in Chapter 2.
arB’s statewide comprehensive air toxics pro-gram was established in 1983 with the Toxic air Contaminant Identification and Control Act (Tanner act). The Tanner act is intended to reduce expo-sure to toxic air contaminants (TaCs). Under the act, arB is required to use certain criteria in the prioritization for the identification and control of air toxics. The air Toxic “Hot Spots” information and assessment act supplements the Tanner act by requiring a statewide air toxics inventory, notifica-tion of people exposed to significant health risk, and facility plans to reduce these risks.
In August 1998, ARB identified diesel particulate matter (DPM) from diesel-fueled engines as TaCs. in September 2000, arB approved a compre-hensive Diesel risk reduction Plan, which rec-ommends control measures to reduce the risks associated with DPM from both new and existing diesel-fueled engines and vehicles. The goal of the plan is to reduce DPM emissions 75 percent by 2010 and by 85 percent by 2020.
Other State Plans
in addition to the policies, programs and plans de-scribed above, the Bay area 2017 Plan also draws upon other plans produced by various state agen-cies to address GHGs and climate protection. For example, arB’s Mobile Source Strategy, released in May 2016, lays out a comprehensive strategy to reduce motor vehicle emissions to meet feder-al and state ambient air quality standards, reduce GHG emissions towards long-range targets, re-duce risk from vehicle emissions, and reduce pe-troleum use. The strategy emphasizes replacing today’s cars and trucks with zero-emission models fueled by renewable grid electricity or with hydro-gen. Other state plans that the 2017 Plan draws upon include:
● the state SiP Strategy,
● the aB 32 Scoping Plan Update,
● arB’s Short-lived Climate Pollutant reduc-tion Strategy,
● CEC’s Existing Buildings Energy Efficiency Ac-tion Plan,
● Cnra and CalePa’s State Forest Carbon Plan, and
● arB’s Sustainable Freight Strategy.
Regional Plans and Programs
Plan Bay Area
The Bay Area’s first Sustainable Communities Strategy – known as Plan Bay Area – was adopted by MTC and aBaG in 2013. Plan Bay Area serves as

Chapter 4 planning Context
Bay area air Quality ManageMent District | Clean air Plan 2017 4/23
the region’s integrated land use and transportation plan. The plan provides a long-term transportation funding strategy, allocates housing construction, and defines a strategy to meet the GHG reduction goals for cars and light trucks established by arB pursuant to SB 375 (discussed above). The plan pursues the region’s goals through a strategy to di-rect 80 percent of the region’s future housing needs to Priority Development areas (PDas), while pro-tecting open space, scenic areas, and agricultural lands that face near-term development pressure through Priority Conservation areas (PCas). PDas and PCas complement one another, because pro-moting development within PDas takes develop-ment pressure off the region’s open space.
The GHG reduction target set by arB as required by SB 375 called for a per capita reduction in GHG emissions from cars and light-duty trucks by 7 percent by 2020 and by 15 percent by 2035. in april 2014, arB issued an executive Order which confirmed that the land use policies and transpor-tation projects and investments included in Plan Bay Area are expected to reduce per capita GHG
emissions from on-road motor vehicles in the Bay area by 10 percent by 2020 and by 16 percent by 2035 compared to the 2005 baseline.15
For the transportation component of the plan, Plan Bay Area specifies how $292 billion in anticipated federal, state and local funds will be spent through
Planning HealtHy Places
bestpracticesthatcanbeimplementedtoreduceemissionsof,andpopulationexposureto,localairpollutants.Planning Healthy Placesincludesaweb-basedmappingtoolthatshowslocationsthroughouttheregionwithelevatedlevelsofairpollution(basedonconservativescreening-levelmodeling),wheretheAirDistrictrecommendsimplementingbestpracticestoaddressairquality.ThepurposeofPlanning Healthy Placesistoensurethatweprotectpublichealthwhilepromotingandfacilitatinginfilldevelopmentthatwillreducemotorvehicletravel.Formoreinformation,seewww.baaqmd.gov/planninghealthy.places.
Directingnewdevelopmenttoareasthatarewellservedbytransitandprovidegoodaccesstojobsandservicesisanessentialstrategy
toreducemotorvehicletravelandGHGemissions,asdiscussedabove.However,locatingnewdevelopmentnearmajorsourcesofairpollutioncouldresultinincreasedlocalexposuretounhealthylevelsofairpollutants,unlessstepsaretakentominimizeexposureandreduceemissions.Toassistlocalgovernmentsinaddressingandminimizingpotentialairqualityissues,theAirDistrictreleasedaguidancedocumentinMay2016entitledPlanning Healthy Places.Thisdocumentprovidesrecommended
Chapter 4 planning Context
4/24 Bay area air Quality ManageMent District | Clean air Plan 2017
2040. Federal, state and local funds or revenue in-cludes fuel taxes, public transit fares, bridge tolls, property taxes and dedicated sales taxes. accord-ing to the plan, nearly 87 percent ($253 billion) will be used to maintain and operate the existing trans-portation network.
in addition to changes in land use and transporta-tion investments, Plan Bay area includes a number of complementary policies and programs designed to provide additional reductions in vehicle travel and GHG emissions from on-road vehicles. The Climate initiatives Program adopted in conjunction with Plan Bay area included $67 million to fund GHG reduc-tion pilot projects, public education and outreach, Safe routes to Schools, and program evaluation. Projects funded via the Climate initiatives Pro-gram include a regional electric vehicle charging program; incentives for the purchase of electric cars; incentives to encourage the purchase of fuel- efficient vehicles; expansion of carsharing pro-grams; a “smart-driving” initiative; implementation of a regional commuter benefit program; and ex-pansion of vanpool and employer shuttle programs. MTC issued a report summarizing the results of these projects; findings in this report will help to determine which projects will be funded in future cycles of the Climate initiatives Grants program.16
MTC and aBaG are currently updating Plan Bay Area. The update is scheduled for completion in Summer 2017.
Plan Bay Area directs most future development to Priority Development areas (PDas), based
Plan Bay Area includes a number of complementary policies and programs designed to provide
additional reductions in vehicle travel and GHG emissions
from on-road vehicles.
upon the concept of transit-oriented development. PDas are neighborhoods with frequent transit ser-vice and a variety of housing options, that offer services and amenities such as shopping, restau-rants, libraries, and community centers. PDas can also include focused employment growth.
The PDa concept provides a mechanism to link local community development aspirations with re-gional land use and transportation planning objec-tives. Local jurisdictions have defined the charac-ter of their PDas according to existing conditions and future expectations. PDas range from region-al centers like downtown San Jose to suburban centers like Walnut Creek’s West Downtown area, and smaller town centers such as the Suisun City Waterfront.
Plan Bay Area also includes Priority Conserva-tion areas, or PCas. PCas are open spaces that provide agricultural, natural resource, scenic, rec-reational, and/or ecological values and ecosys-tem functions. These areas are identified through consensus by local jurisdictions and park/open space districts as lands in need of protection due to pressure from urban development or other fac-tors. PCas are categorized by four designations: natural landscapes, agricultural lands, Urban Greening and regional recreation.
Regional Goods Movement Planning
MTC and the alameda County Transportation Commission (aCTC) are leading a Bay area-wide Goods Movement Collaborative, bringing together partners, community members and stakeholders to
Both plans outline a long-range strategy for how to move
goods efficiently, reliably, and sustainably within, to, from and
through the county and the entire region.
Chapter 4 planning Context
Bay area air Quality ManageMent District | Clean air Plan 2017 4/25
identify, prioritize and advocate for short- and long-term strategies for both improved infrastructure and better community health.17 as part of this col-laboration, MTC has updated its regional Goods Movement Plan, while aCTC adopted a county- specific plan. Both plans outline a long-range strategy for how to move goods efficiently, reliably, and sustainably within, to, from and through the county and the entire region. MTC is also devel-oping a Freight Emission Reduction Action Plan which will recommend strategies for implement-ing zero-emission technologies for moving goods by rail and truck. The Action Plan will be incor-porated in the forthcoming Plan Bay Area 2040.
Congestion Management Programs
in 1990, California enacted the Congestion Man-agement Program (CMP) to implement Proposition 111, which defines a network of state highways and arterials, level of service standards and re-lated procedures, a process for mitigation of the impacts of new development on the transporta-tion system, and technical justification for the ap-proach. The CMP designates Congestion Man- agement agencies (CMas), which are county- wide bodies charged with coordinating land use, air quality, and transportation planning in CMPs to monitor levels of congestion on major roads and analyze the impacts that a proposed devel-opment will have on future traffic congestion. The policies and technical information contained in a CMP are subject to ongoing review with updates required every two years, at a minimum.
San Francisco Bay Plan Amendments
BCDC administers the San Francisco Bay Plan, which guides development on and around the shoreline of the Bay area. in October 2011, BCDC unanimously approved an amendment to the San Francisco Bay Plan to address climate change, and the expected impacts to the Bay from sea level rise. These findings and policies have been incorporated into the Bay Plan. The 2011 amendments direct development away from low-lying shoreline areas vulnerable to flooding and support the region’s PDa development and PCa conservation strategy by ensuring the region does not develop in ways that increase threats to public safety from flooding. The amendments
also outline a process for developing a region-al adaptation strategy for areas vulnerable to sea level rise. in response to this, BCDC has launched the adapting to rising Tides (arT) Pro-gram. arT is a program that leads and supports multi-sector, cross-jurisdictional projects that build local and regional capacity in the San Fran-cisco Bay area to plan for and implement compre-hensive adaptation responses to sea level rise.
Bay Area Regional Collaborative (Formerly Joint Policy Committee) State law created the Bay area regional Collab-orative (BarC) – originally called the Joint Policy Committee - to help coordinate the development of major plans and initiatives by the air District, MTC, aBaG and BCDC. These plans and initia-tives include: the regional transportation plan/sustainable communities strategy (Plan Bay Area), the regional housing needs assessment, air quality plans, adaptation planning and more. BarC helps to coordinate climate protection and adaptation efforts among the agencies, such as the following:
● resilient Shorelines Partnership (aBaG, air District, BCDC, MTC),
● regional Climate Protection Strategy (air District),
● resilience Program (aBaG), and
● regional adaptation Planning/adapting to rising Tides (BCDC).
Local Plans
General Plans and Area Plans
in California, local governments have primary au-thority and responsibility for land use planning. State law requires all cities and counties to pre-pare a comprehensive, long-term general plan as a guide “for the physical development of the county or city, and any land outside its boundaries which bears relation to its planning” (Government Code §65300). The general plan must contain a minimum of seven state-mandated elements,
Chapter 4 planning Context
4/26 Bay area air Quality ManageMent District | Clean air Plan 2017
including: land Use, Open Space, Conserva-tion, Housing, Circulation, noise and Safety. The plan may also contain any other elements that a county or city wishes to adopt. Common addi-tional elements include: environment, Climate, and/or Health.
in addition to the general plan, cities and coun-ties also frequently develop area, neighborhood, or station area (transit station) plans. area plans cover only a small portion of a city or county. Typ-ically, the planning area is a specific neighbor-hood that is being planned for new development, or an area where the city or county would like to change land use designations, densities or other features, such as roadway width, building heights or parking requirements.
although local plans may seem predominant-ly concerned with uses and zoning, in actuality, land use plans and policies touch on every as-pect of local government concern. land use in-volves multi-layered issues that affect air quality, water quality, access to transportation options, economic vitality, access to affordable housing, environmental justice, and other significant qual-ity of life issues. Cities and counties, in develop-ing their plans, must also consider regional and global issues that may affect their community’s viability and growth potential, such as the region-al economy, regional transportation investments, state affordable housing requirements and in-creasingly, their role in reducing GHGs to slow global climate change.
State and regional agencies also look to local use plans as the primary tool for implementing a re-gional Sustainable Communities Strategy to sig-nificantly reduce GHGs and air pollution from the transportation sector, and to meet state affordable housing goals. research demonstrates that land use decisions exert a strong influence on travel demand and travel behavior. People who live in areas with higher densities, a mix of residential, retail and office uses, with well-designed pedes-trian, bicycle and transit infrastructure take more trips by transit, bicycle and walking, which results in reduced driving. land use and zoning, there-fore, are powerful tools which local governments can use to reduce vehicle use and emissions.
Local agencies can take action to reduce GHG
emissions and to prepare their communities to adapt
to climate change...
Local Climate Action Plans
Cities and counties have a key role to play in re-ducing GHG emissions. local agencies can take action to reduce GHG emissions and to prepare their communities to adapt to climate change, by using their broad authority and their funding in re-lation to land use, transportation, building and en-ergy standards and other issues. They also have a critical role to play in educating local business-es and residents about how they can reduce their own GHG emissions.
a climate action plan may take the form of a stand-alone plan, a component of a general plan, or a set of climate action policies, ordinances and pro-grams that have been adopted by a local jurisdic-tion. local climate action plans typically include a community-wide GHG emission inventory, GHG emission reduction targets consistent with the state’s reduction targets, and specific measures to reduce GHG emissions. Many plans also include climate adaptation strategies to address the ad-verse impacts of climate change.
at least 65 cities and counties in the Bay area have adopted some type of local climate action plan. These plans collectively contain almost 2,400 emission reduction measures aimed at a wide range of activities. in addition to reducing GHG emissions, many of these measures also provide desirable co-benefits such as decreasing air pollutant emissions, increasing the livability of a community, improving property values, reducing utility bills and preserving water and other natural resources for future generations.
Chapter 4 planning Context
Bay area air Quality ManageMent District | Clean air Plan 2017 4/27
Because local government agencies are critical partners in its climate protection efforts, the air District provides technical and policy assistance to support local climate planning. Many of the GHG reduction measures in the 2017 Plan include ac-
tions to support local efforts, such as developing model ordinances, sharing best practices, etc. The air District will continue to work closely with local agencies to coordinate and integrate our climate protection efforts.
Footnotes
1 Technical information on TaCs is provided in Chapter 2.
2 http://www.baaqmd.gov/~/media/Files/Planning%20and%20research/Care%20Program/Documents/Care_retrospective_april2014.ashx?la=en.
3 http://www.baaqmd.gov/rules-and-compliance/rule-development/regulatory-workshops.
4 Greenhouse gas emissions were only calculated for 127 of the 21 TFCa projects awarded during this period. GHG emissions were not calculated for the remaining TFCa projects or for projects that received funding from the state, such as the Carl Moyer Program, Goods Movement Program, and lower emission School Bus Program, due to lack of data.
5 Bay area seaports include the ports of Oakland, richmond, redwood City, Benicia and San Francisco.
6 For additional information, see http://www.baaqmd.gov/rules-and-compliance/wood-smoke.
7 See http://www.baaqmd.gov/grant-funding/residents/
wood-smoke-rebate.
8 in this plan, we refer to SlCPs as “super-GHGs.”
9 executive Order S-3-05 establishes California’s GHG reduction targets, which are to reduce GHG emissions to 1990 levels by 2020, and to 80 percent below 1990 levels by 2050. executive Order B-16-2012 establishes benchmarks for the rapid commercialization of zero-emission vehicles (ZeVs) and GHG reduction goals for the transportation sector, which include 1.5 million ZeVs to be in use by 2025 and an 80 percent decrease in GHG emissions from the transportation sector from 1990 levels by 2050.
10 Center for Climate and energy Solutions, California Cap-and-Trade Program Summary, http://www.c2es.org/us-states-regions/key-legislation/california-cap-trade, June 4, 2015.
11 arB, Oil & natural Gas Production, Processing, and Storage measure, http://www.arb.ca.gov/cc/oil-gas/oil-gas.htm, May 28, 2015.
12 California Public Utilities Commission, California renewables Portfolio Standard (rPS), http://www.cpuc.ca.gov/PUC/energy/renewables/.
13 according to CeC data for year 2014, nearly 60 percent of the power-generating facilities located in the Bay area operate on renewable energy. Collectively, these facilities generate over 20 percent of the total electricity-generation capacity located within in the Bay area.
14 For more details on the 1990 Caaa, see http://www.epa.gov/air/caa/.
15 The anticipated reductions in per capita GHG emissions attributed to Plan Bay Area are based on per capita reductions in vehicle miles traveled. They do not include projected GHG reductions due to state programs to promote cleaner, more efficient vehicles and fuels, such as the advanced Clean Car initiative or the low Carbon Fuel Standard.
16 See MTC’s Climate Initiatives Program: Evaluation Summary Report (July 2015): http://mtc.ca.gov/sites/default/files/CIP%20Evaluation%20Summary%20report_7-13-15_Final.pdf
17 See http://mtc.ca.gov/our-work/plans-projects/economic-vitality/san-francisco-bay-area-goods-movement-plan.


Bay area air Quality ManageMent District | Clean air Plan 2017 5/1
Chapter 5Climate and air pollution Control Strategy
The 2017 Plan is a multi-pollutant plan focused on protecting public health and the climate. The control strategy described
in this chapter, which serves as the backbone of the 2017 Plan, builds upon existing regional, state and national programs described in Chapter 4 that have successfully reduced air pollution and improved public health over the past several de-cades. The control strategy includes an integrated set of control measures designed to:
● Reduce ozone precursors, in order to fulfillHealth & Safety Code ozone planning re-quirements
● Protect public health by reducing emissions of ozone precursors, particulate matter (PM) and toxic air contaminants (TaCs)
● Serve as a regional climate protection strat-egy by reducing emissions of greenhouse gases (GHGs) across the full range of eco-nomic sectors
To comply with California Health & Safety Code ozone planning requirements, the 2017 Plan must include “all feasible measures” as discussed in appendix a.
The control strategy includes 85 control measures, listed in Table 5-13 at the end of this chapter. De-tailed descriptions of individual control measures are provided in Volume 2.1 Some measures focus on reducing a single type of air pollutant. Many of the measures, however, reduce multiple pollut-ants and serve both to protect public health and to protect the climate. The process used to evalu-ate and develop potential control measures is de-scribed in appendix G. in addition to the proposed

Chapter 5 Climate and air pollution Control Strategy
5/2 Bay area air Quality ManageMent District | Clean air Plan 2017
control measures described below, the air Dis-tricthasalsoidentifiedanumberoffurtherstudymeasures that will undergo further analysis to determine if they should be pursued as control measures.
The proposed control strategy is based on four key priorities, which are described more fully in Chapter 1:
● reduce emissions of criteria air pollutants and toxic air contaminants from all key sources
● reduce emissions of super-GHG pollutants such as methane
● Decrease demand for fossil fuels
▪ Increase efficiency of energy, buildingsand transportation sectors
▪ reduce demand for vehicle travel, and high-carbon goods and services
● Decarbonize our energy system
▪ Make the electricity supply carbon-free
▪ electrify the transportation and building sectors
Tools and resources
To implement the 2017 Plan control strategy, the air District will employ a wide range of tools and resources including its regulatory,
permitting, and enforcement authority; grants and incentives; partnerships; collaboration with local governments via best practices, model ordinances and other local programs; air quality monitoring and research; public outreach and education; and advocacy. The “Primary implementation Tools” in Table 5-13 can be described as follows:
Rulemaking: employ the air District’s regulatory authority to develop new or amend existing rules to reduce emissions.
Funding: Provide grants and incentives through air District grant programs, Plan Bay Area, or oth-er sources. Over the period 2017 through 2024,
staff projects that the air District will provide ap-proximately $288 million for additional projects to reduce emissions of air pollutants and GHGs in the Bay area through grant programs that it direct-ly administers. in addition, the region may receive asignificantamountoffundingfromtheCaliforniaCap-and-Trade Program, assuming that the pro-gram is extended beyond 2020. Cap-and-Trade fundscouldprovidesignificantcapitaltospurtheinnovation and growth in clean technology needed to achieve the 2050 vision for a post-carbon Bay area described in Chapter 1.
Partnerships and Best Practices: Work in part-nership with public agencies and other entities by providing technical support and funding, collabo-rating on research, evaluating pilot programs, and promoting the use of best practices through model ordinances and guidance documents.
Outreach and Education: Conduct marketing or media campaigns; disseminate information and educational materials; engage with community groups, businesses and other organizations.
Advocacy: Support legislative action at the federal or state level and advocate for funding to support implementation of the measures in the 2017 con-trol strategy.
individual control measures will use the tools and resources that are most relevant and effective for thespecificemissionsource inquestion. Imple-mentation actions for each control measure are brieflysummarized in the individualsector tablesbelow, and are described in greater detail in Vol-ume 2 of the 2017 Plan.2
Control Strategy by economic Sector
For purposes of consistency with climate plan-ning efforts at the state level, the control strategy in this plan is based upon the same
economic sector framework used by the air re-sources Board for its 2014 update to the aB 32 Scoping Plan. The sectors are as follows:
Chapter 5 Climate and air pollution Control Strategy
Bay area air Quality ManageMent District | Clean air Plan 2017 5/3
● Stationary Sources● Transportation● energy● Buildings● agriculture● natural and Working lands● Waste Management● Water● Super-GHG Pollutants
like the economy as a whole, these sectors are interconnected. For example, motor vehicles (transportation sector) require gasoline and diesel; the demand for these products leads to emissions fromoilrefineries(stationarysourcesector).Con-versely, as the number of electric vehicles (eV) in theBayAreafleet increases, thiswillhelp to re-duce emissions from motor vehicles (transporta-tion sector) and oil refineries (stationary sourcesector), but it may increase emissions from the energy sector by creating additional demand for electricity to charge eV batteries.
To inform the development of the control strate-gy, the air District analyzed each economic sector to: identify key emission sources and the project-ed emissions trend for each sector; analyze rele-vant policies and programs at the federal, state, and local level; clarify the air District’s authority and available tools relevant to the sector; and to identify potential criteria pollutant, TaC and GHG emission reduction measures.
Stationary Sources
Stationary sources include oil refineries, cementplants, natural gas distribution facilities, crude oil and natural gas production facilities, gas stations, dry cleaners, metal fabricators, chemical and phar-
maceutical production facilities, diesel generators, and large boilers used in commercial and indus-trial facilities. The air District regulates emissions from stationary sources through its rulemaking, permitting and enforcement programs.
The 40 proposed stationary source measures in the2017Planarebrieflydescribed inTable5-1.eleven of the proposed measures focus primari-ly on reducing GHG emissions. The remainder of the stationary source measures primarily focus on protecting public health by reducing emissions of criteriapollutantsandTACsfromoilrefineriesandother sources.
Oil refineriesare the largestsourceofBayAreaGHG emissions from the stationary source sector, accounting for 68 percent in 2015. The air District has developed a Refinery Emissions ReductionStrategy to reduce criteria air pollutant emissions by20percentfromoilrefineriesandtoreduceex-posure, described in more detail in Chapter 4. Sev-eral control measures in the 2017 Plan propose regulatory action in support of the 20 percent re-fineryemissionsreductiongoal(SS1–SS8).Inad-dition, three of the proposed measures in the Plan support and expand the climate component of the RefineryStrategyworkbyrequiringimprovedre-fineryemissionsinventories,fencelinemonitoringand feedstock data (SS10), and by limiting GHG emissions from these facilities (SS11 and SS12).
in developing measures to reduce GHG emissions from the stationary source sector, the air District has placed high priority on reducing emissions of methane and other super-GHGs with high global warming potential. in the stationary source sector, these efforts include reducing fugitive emissions of
Like the economy as a whole, these sectors
are interconnected.
Oil refineries are the largest source of Bay Area
GHG emissions from the stationary source sector.

Chapter 5 Climate and air pollution Control Strategy
5/4 Bay area air Quality ManageMent District | Clean air Plan 2017
methane from oil and gas wells (SS13 and SS14), natural gas pipelines and processing operations (SS15), and major leaks of organic gases (SS2), all part of a concerted basin-wide methane strate-gy (SS16).
There are multiple proposed measures in the 2017 Plan that apply to a wide range of station-ary source facilities. Measure SS17 would estab-lish a more stringent threshold for the purpose of determining which facilities must implement Best available Control Technology (BaCT) to reduce GHG emissions through its new Source review program. Measure SS18 would limit combustion of fossil fuels at stationary sources by applying a “basin-wide combustion strategy” that will pri-oritize sources based on the magnitude of their emissions,analyze theefficiencyof combustionprocesses,andoptimizeenergy-efficiencyintheproduction process. Several proposed measures target specific criteria pollutants such as partic-ulatematter (e.g.,measuresSS33–SS38), or a
Table 5-1. Stationary Source Control Measures
Number Name Pollutant Description
SS1 Fluid Catalytic Cracking in Refineries
PM establish emission limits to reduce secondary PM emis-sions at FCCUs. Work with FCCU operators to provide sampling ports that will allow a source-test program us-ing ePa Method 202 to quantify total FCCU PM emis-sions, including condensable PM. evaluate progress in ammonia optimization, as well as the results of Method 202 testing, to determine appropriate further actions.
SS2 equipment leaks
rOG, GHG
reduce fugitive emissions of organic gases, including methane, fromrefineries,chemicalplants,bulkplantsand bulk terminals. Develop an implementation plan for rule 8-18 to require future monitoring of equipment in heavy liquid service, require facilities to identify the causes of background readings greater than 50 parts per million volume (ppmv), etc.
SS3 Cooling Towers
rOG, TaCs
establish hydrocarbon limits for cooling towers.
(continued)
particular industrial process or sector such as ce-ment plants (e.g., SS19).
all the proposed stationary source control mea-sures will protect public health by reducing emis-sions, capping or monitoring air pollutants. How-ever, as discussed in Chapter 4, the air District hasidentifiedanumberofBayAreacommunitiesthat are disproportionately impacted by air pollu-tion and has made a commitment to prioritize ac-tions to protect these communities. To that end, twomeasuresspecifically focuson reducing riskfrom exposure to toxic air contaminants from both existing facilities (SS20) and new facilities (SS21). in addition, the measures to reduce emissions fromoilrefineries,aswellasthecontrolmeasuresthat will reduce emissions of particulate matter and TaCs from a wide variety of sources, will also help to protect impacted communities.
Proposedstationarysourcemeasuresarebrieflydescribed in Table 5-1.

Chapter 5 Climate and air pollution Control Strategy
Bay area air Quality ManageMent District | Clean air Plan 2017 5/5
(continued)
Number Name Pollutant Description
SS4 RefineryFlares
rOG, SO2, PM
ReviewtheresultsofrefineryflaremonitoringRule12-11andflarereductionRule12-12ateachofthefivere-fineriesintheBayAreatoidentifyamendmentsthatmaymake the rules more effective at reducing emissions.
SS5 Sulfur recovery Units
SO2 Consider amendments to air District rule 9-1 to achieve the lowest SO2 emissions feasible at sulfur recovery units without the addition of caustic scrubbing.
SS6 RefineryFuelGas
SO2 Consider amendments to rule 9-1 that would reduce the sulfur limits for rFG and determine the appropriate av-eraging periods.
SS7 Sulfuric acid Plants
SO2 Consider amendments to rule 9-1 that would limit SO2 emissions from acid plants associated with petroleum refining.
SS8 Coke Calcining
PM, SO2 limit SO2 emissions from petroleum coke calcining op-erations equivalent to meet a mass emissions limit of 1,050 TPY and an hourly limit of 320 pounds per hour.
SS9 enhanced nSr enforcement for Changes in Crude Slate
all Pollutants
Requirearefinerytoobtainapermitforanysignificantchange in crude slate. requiring a review of all such sig-nificantcrudeslatechangeswillallowtheAirDistricttoevaluate such changes in detail and ensure that they will comply with applicable nSr permitting requirements.
SS10 Petroleum Refiningemissions Tracking
all Pollutants
implement a newly adopted rule (rule 12-15) which will: 1) improve petroleum refinery emissions invento-ries of criteria pollutants, toxic air contaminants (TaCs) and greenhouses gases (GHGs), 2) collect volume and composition data on crude oil and other feedstocks pro-cessed by refineries, 3) expand refinery fenceline airmonitoring and community air monitoring, and 4) collect information about equipment and operational practices where refineryenergyutilizationcouldbe improvedsothat GHG emissions could be reduced.
SS11 Petroleum RefiningFacility-Wide emission limits
GHG, PM, nOX, SO2
Consider limiting facility-wide emissions of GHG and three criteria air pollutants—PM, nOX and SO2—from Bay area petroleum refineries through air District rule 12-16.
Table 5-1. Stationary Source Control Measures (continued)
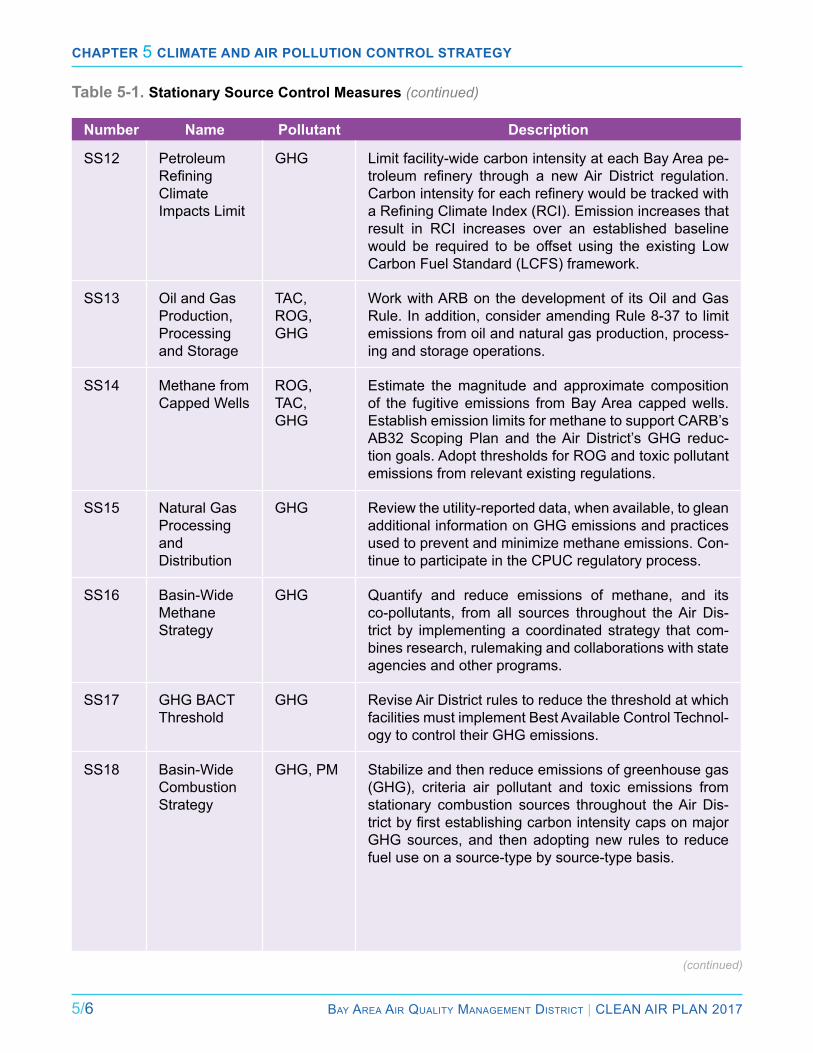
Chapter 5 Climate and air pollution Control Strategy
5/6 Bay area air Quality ManageMent District | Clean air Plan 2017
Number Name Pollutant Description
SS12 Petroleum RefiningClimate impacts limit
GHG limit facility-wide carbon intensity at each Bay area pe-troleum refinery through a newAir District regulation.CarbonintensityforeachrefinerywouldbetrackedwithaRefiningClimateIndex(RCI).Emissionincreasesthatresult in rCi increases over an established baseline would be required to be offset using the existing low Carbon Fuel Standard (lCFS) framework.
SS13 Oil and Gas Production, Processing and Storage
TaC, rOG, GHG
Work with arB on the development of its Oil and Gas rule. in addition, consider amending rule 8-37 to limit emissions from oil and natural gas production, process-ing and storage operations.
SS14 Methane from Capped Wells
rOG, TaC, GHG
estimate the magnitude and approximate composition of the fugitive emissions from Bay area capped wells. establish emission limits for methane to support CarB’s aB32 Scoping Plan and the air District’s GHG reduc-tion goals. adopt thresholds for rOG and toxic pollutant emissions from relevant existing regulations.
SS15 natural Gas Processing and Distribution
GHG review the utility-reported data, when available, to glean additional information on GHG emissions and practices used to prevent and minimize methane emissions. Con-tinue to participate in the CPUC regulatory process.
SS16 Basin-Wide Methane Strategy
GHG Quantify and reduce emissions of methane, and its co-pollutants, from all sources throughout the air Dis-trict by implementing a coordinated strategy that com-bines research, rulemaking and collaborations with state agencies and other programs.
SS17 GHG BaCT Threshold
GHG revise air District rules to reduce the threshold at which facilities must implement Best available Control Technol-ogy to control their GHG emissions.
SS18 Basin-Wide Combustion Strategy
GHG, PM Stabilize and then reduce emissions of greenhouse gas (GHG), criteria air pollutant and toxic emissions from stationary combustion sources throughout the air Dis-trictbyfirstestablishingcarbonintensitycapsonmajorGHG sources, and then adopting new rules to reduce fuel use on a source-type by source-type basis.
Table 5-1. Stationary Source Control Measures (continued)
(continued)
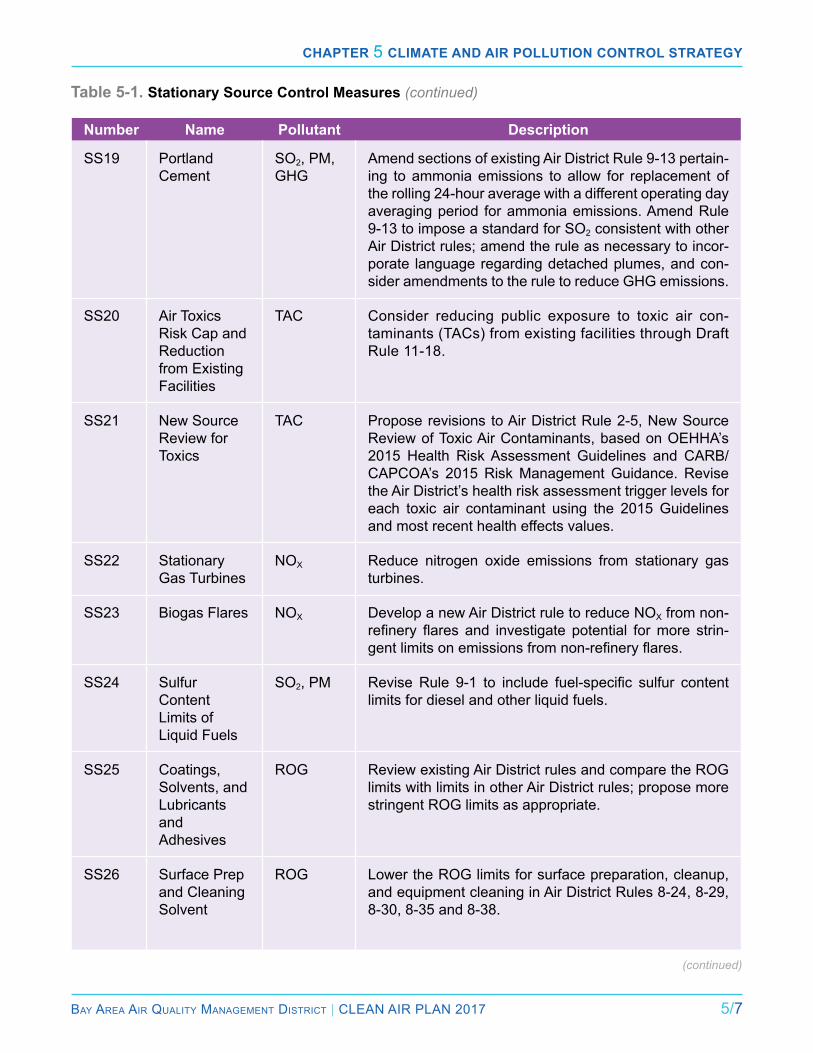
Chapter 5 Climate and air pollution Control Strategy
Bay area air Quality ManageMent District | Clean air Plan 2017 5/7
Number Name Pollutant Description
SS19 Portland Cement
SO2, PM, GHG
amend sections of existing air District rule 9-13 pertain-ing to ammonia emissions to allow for replacement of the rolling 24-hour average with a different operating day averaging period for ammonia emissions. amend rule 9-13 to impose a standard for SO2 consistent with other air District rules; amend the rule as necessary to incor-porate language regarding detached plumes, and con-sider amendments to the rule to reduce GHG emissions.
SS20 air Toxics risk Cap and reduction from existing Facilities
TaC Consider reducing public exposure to toxic air con-taminants (TaCs) from existing facilities through Draft rule 11-18.
SS21 new Source review for Toxics
TaC Propose revisions to air District rule 2-5, new Source review of Toxic air Contaminants, based on OeHHa’s 2015 Health risk assessment Guidelines and CarB/CaPCOa’s 2015 risk Management Guidance. revise the air District’s health risk assessment trigger levels for each toxic air contaminant using the 2015 Guidelines and most recent health effects values.
SS22 Stationary Gas Turbines
nOX reduce nitrogen oxide emissions from stationary gas turbines.
SS23 Biogas Flares nOX Develop a new air District rule to reduce nOX from non- refinery flares and investigate potential formore strin-gentlimitsonemissionsfromnon-refineryflares.
SS24 Sulfur Content limits of liquid Fuels
SO2, PM ReviseRule 9-1 to include fuel-specific sulfur contentlimits for diesel and other liquid fuels.
SS25 Coatings, Solvents, and lubricants and adhesives
rOG review existing air District rules and compare the rOG limits with limits in other air District rules; propose more stringent rOG limits as appropriate.
SS26 Surface Prep and Cleaning Solvent
rOG lower the rOG limits for surface preparation, cleanup, and equipment cleaning in air District rules 8-24, 8-29, 8-30, 8-35 and 8-38.
Table 5-1. Stationary Source Control Measures (continued)
(continued)
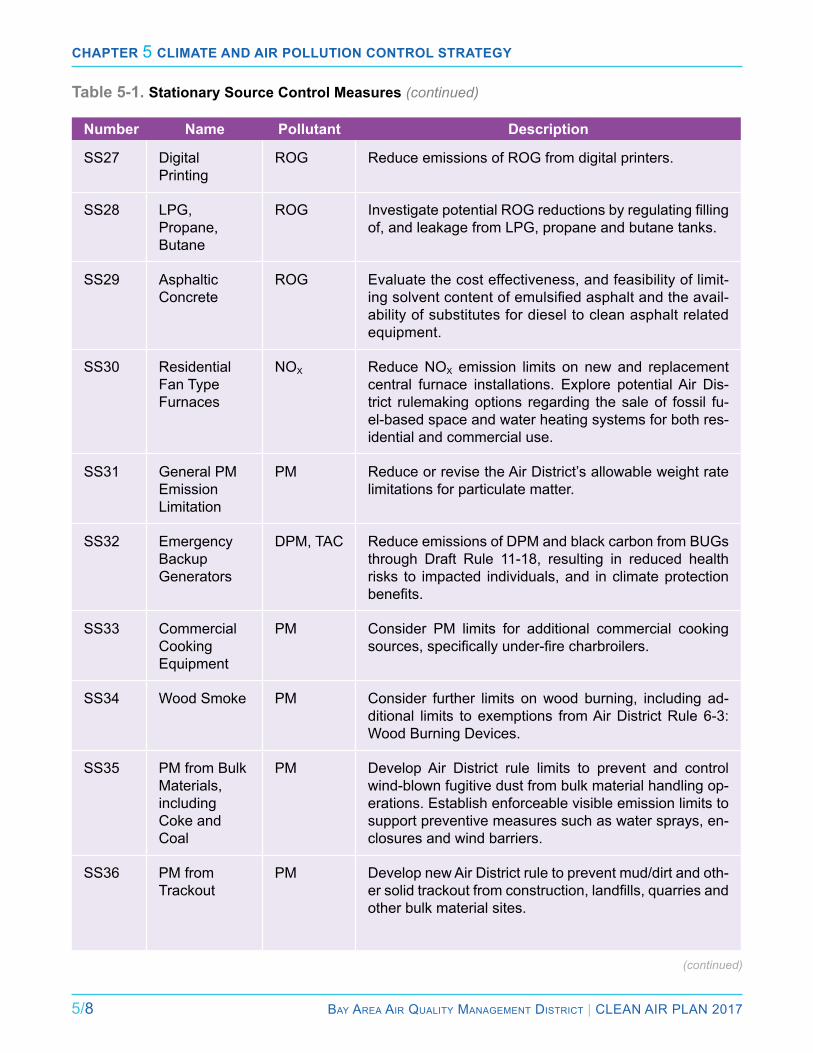
Chapter 5 Climate and air pollution Control Strategy
5/8 Bay area air Quality ManageMent District | Clean air Plan 2017
Number Name Pollutant Description
SS27 Digital Printing
rOG reduce emissions of rOG from digital printers.
SS28 lPG, Propane, Butane
rOG InvestigatepotentialROGreductionsbyregulatingfillingof, and leakage from lPG, propane and butane tanks.
SS29 asphaltic Concrete
rOG evaluate the cost effectiveness, and feasibility of limit-ingsolventcontentofemulsifiedasphaltandtheavail-ability of substitutes for diesel to clean asphalt related equipment.
SS30 residential Fan Type Furnaces
nOX reduce nOX emission limits on new and replacement central furnace installations. explore potential air Dis-trict rulemaking options regarding the sale of fossil fu-el-based space and water heating systems for both res-idential and commercial use.
SS31 General PM emission limitation
PM reduce or revise the air District’s allowable weight rate limitations for particulate matter.
SS32 emergency Backup Generators
DPM, TaC reduce emissions of DPM and black carbon from BUGs through Draft rule 11-18, resulting in reduced health risks to impacted individuals, and in climate protection benefits.
SS33 Commercial Cooking equipment
PM Consider PM limits for additional commercial cooking sources,specificallyunder-firecharbroilers.
SS34 Wood Smoke PM Consider further limits on wood burning, including ad-ditional limits to exemptions from air District rule 6-3: Wood Burning Devices.
SS35 PM from Bulk Materials, including Coke and Coal
PM Develop air District rule limits to prevent and control wind-blown fugitive dust from bulk material handling op-erations. establish enforceable visible emission limits to support preventive measures such as water sprays, en-closures and wind barriers.
SS36 PM from Trackout
PM Develop new air District rule to prevent mud/dirt and oth-ersolidtrackoutfromconstruction,landfills,quarriesandother bulk material sites.
Table 5-1. Stationary Source Control Measures (continued)
(continued)

Chapter 5 Climate and air pollution Control Strategy
Bay area air Quality ManageMent District | Clean air Plan 2017 5/9
Number Name Pollutant Description
SS37 PM from asphalt Operations
PM Develop an air District rule to require abatement/control of blue smoke emissions related to asphalt delivery to roadway paving projects.
SS38 Fugitive Dust PM Consider applying the air District’s proposed fugitive dust visible emissions limits to a wider array of sources.
SS39 enhanced air Quality Monitoring
all Pollutants
ensure representative air quality data is being collect-ed in impacted communities. Partner with county Health Departments to identify areas of poor air quality and col-laborate with the community on ways to potentially mea-sure and reduce exposure and emissions from local and regional sources. Require petroleum refineries to pre-pare and submit to the air District an air monitoring plan for establishing an air monitoring system. implement the Community Monitoring Program.
SS40 Odors Odors Propose amendments to regulation 7 to strengthen odor standards and enhance enforceability. an evaluation of newer air monitoring technologies will be aimed at in-creasing enforceability of the rule with respect to a wider range of odorous compounds and sources.
Table 5-1. Stationary Source Control Measures (continued)
Transportation
The transportation sector includes on-road motor vehicles, categorized by weight class, such as light-duty automobiles or heavy-duty trucks; off-road vehicles, including airplanes, locomotives, ships and boats; and off-road equipment, such as airport ground-support equipment, construction equipment and farm equipment.3 Due to the fact that California has the most stringent standards in the world to control emissions from vehicle fuels and vehicle engines, emissions of most air pollut-ants from transportation sources have declined significantly in recent decades, even as theBayArea vehicle fleet and total vehicle travel havegrown substantially. in response to regulations and grant programs implemented by arB and the air District, emissions of criteria pollutants, ozone precursors and diesel PM—the TaC that poses the greatest cancer risk—have been greatly reduced.
Multiple state and regional programs have also re-duced GHG emissions in the transportation sector. Despite progress in reducing vehicle emissions and emission rates, the transportation sector re-mains the largest source of GHGs, ozone precur-sors (rOG and nOX), and TaCs in the Bay area, aswellasamajorsourceoffineparticulatematter.
Chapter 5 Climate and air pollution Control Strategy
5/10 Bay area air Quality ManageMent District | Clean air Plan 2017
Many of the transportation measures in this con-trol strategy support and complement critical land use and transportation strategies outlined in Plan Bay Area. in part due to the strategies included in Plan Bay Area, GHG emissions from the Bay area transportation sector are currently projected to decline over the 2015 to 2035 period. Howev-er, these emissions are projected to gradually increase from 2035 through 2050. The projected trend falls considerably short of the emissions re-duction that would be required to achieve both the governor’s interim target of reducing GHG emis-sions to 40 percent below 1990 by 2030 and the long-range target of reducing GHG emissions to 80 percent below 1990 by 2050. The projected GHGemissiontrendvariessignificantlyamongthedifferent components of the transportation sector. GHG emissions from heavy-duty vehicles, off-road equipment, aviation, ships and locomotives are currently projected to increase. GHG emissions from light-duty vehicles, by contrast, are projected to decline substantially; however, they will still ac-count for the majority of total GHG emissions from the transportation sector. For more information on GHG emissions data for each of the transportation sub-sectors see Figure 3-7 in Chapter 3.
The transportation measures proposed in the 2017 Plan will decrease emissions of criteria pol-lutants, TaCs, and GHGs by reducing demand for motor vehicle travel, promoting efficient vehiclesand transit service, decarbonizing transportation fuels, and electrifying motor vehicles and equip-ment. as noted above, the air District has identi-fiedanumberofBayAreacommunities thataredisproportionately impacted by air pollution and made a commitment to prioritize actions to protect these communities. exposure to diesel particulate
matterisanimportantfactorindefiningthecom-munities that are most impacted by air pollution. although diesel PM emissions have already been greatly reduced, as discussed in Chapter 4, mea-sures to further reduce emissions of diesel PM will be especially effective in further protecting public health in these communities.
Key elements of the strategy to reduce transporta-tion emissions include the following:
● Collaborate with MTC and other partners to re-duce motor vehicle travel, by promoting alter-native means of transportation, and partnering withemployerstoexpandcommuterbenefits.
● Collaborate with MTC, aBaG and local gov-ernments to direct future development to mixed-use neighborhoods that are well-served by transit and provide safe and convenient bi-cycle and pedestrian access to shopping and services.
● Continue to work with Bay area ports and the neighboring communities to reduce emissions from the freight sector, including heavy-duty trucks, ships and locomotives.
● accelerate the retirement of older, high-emit-ting vehicles.
● rapidly expand the number and the percent-age of zero-emission vehicles (battery electric andfuelcell)intheBayAreafleetandprovidethe charging/fueling infrastructure needed to support them.
● Promote the use of advanced technology, zero- or near-zero emission vehicles in all ve-hicle types and applications.
● Collaborate with arB to enforce regulations on key sources of transportation sector emis-sions, such as diesel engines, in the most im-pacted and vulnerable communities.
● advocate with state and federal governments to adopt more stringent vehicle tailpipe emis-sion standards and fuel economy standards forallcomponentsofthevehiclefleet.
Proposedtransportationmeasuresarebrieflyde-scribed in Table 5-2 .
The transportation measures proposed in the 2017 Plan will decrease emissions of
criteria pollutants.

Chapter 5 Climate and air pollution Control Strategy
Bay area air Quality ManageMent District | Clean air Plan 2017 5/11
Table 5-2. Transportation Control Measures
Number Name Pollutant DescriptionTr1 Clean air
Teleworking initiative
all Pollutants
Develop teleworking best practices for employers and develop additional strategies to promote telecommuting. Promote teleworking on Spare the air Days.
Tr2 Trip reduction Programs
all Pollutants
Implement the regional Commuter Benefits Program(rule 14-1) that requires employers with 50 or more Bay Areaemployeestoprovidecommuterbenefits.Encour-age trip reduction policies and programs in local plans, e.g.generalandspecificplanswhileprovidinggrantstosupport trip reduction efforts. encourage local govern-ments to require mitigation of vehicle travel as part of newdevelopmentapproval,toadopttransitbenefitsor-dinances in order to reduce transit costs to employees, and to develop innovative ways to encourage rideshare, transit, cycling, and walking for work trips. Fund various employer-based trip reduction programs.
Tr3 local and regional Bus Service
all Pollutants
Fund local and regional bus projects.
Tr4 local and regional rail Service
all Pollutants
Fund local and regional rail service projects.
Tr5 Transit Efficiency and Use
all Pollutants
Improvetransitefficiencyandmaketransitmoreconve-nient for riders through continued operation of 511 Tran-sit, full implementation of Clipper® fare payment system and the Transit Hub Signage Program.
Tr6 Freeway and arterial Operations
all Pollutants
Improvetheperformanceandefficiencyoffreewayandarterial systems through operational improvements, such as implementing the Freeway Performance initia-tive, the Freeway Service Patrol and the arterial Man-agement Program.
Tr7 Safe routes to Schools and Safe routes to Transit
all Pollutants
Provide funds for the regional Safe routes to School and Safe routes to Transit Programs.
Tr8 ridesharing, last-Mile Connection
all Pollutants
Promote carpooling and vanpooling by providing funding to continue regional and local ridesharing programs, and support the expansion of carsharing programs. Provide incentive funding for pilot projects to evaluate the fea-sibility and cost-effectiveness of innovative ridesharing and other last-mile solution trip reduction strategies. encourage employers to promote ridesharing and carsharing to their employees.
(continued)
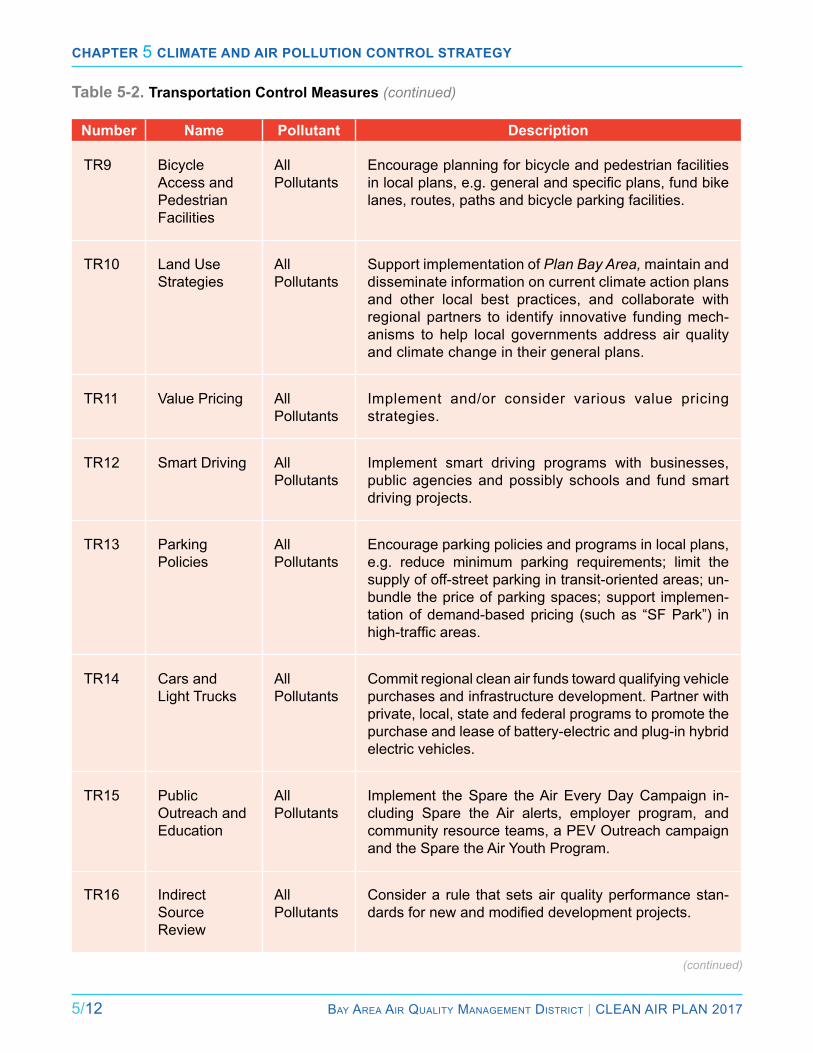
Chapter 5 Climate and air pollution Control Strategy
5/12 Bay area air Quality ManageMent District | Clean air Plan 2017
Table 5-2. Transportation Control Measures (continued)
Number Name Pollutant Description
Tr9 Bicycle access and Pedestrian Facilities
all Pollutants
encourage planning for bicycle and pedestrian facilities inlocalplans,e.g.generalandspecificplans,fundbikelanes, routes, paths and bicycle parking facilities.
Tr10 land Use Strategies
all Pollutants
Support implementation of Plan Bay Area, maintain and disseminate information on current climate action plans and other local best practices, and collaborate with regional partners to identify innovative funding mech-anisms to help local governments address air quality and climate change in their general plans.
Tr11 Value Pricing all Pollutants
implement and/or consider various value pricing strategies.
Tr12 Smart Driving all Pollutants
implement smart driving programs with businesses, public agencies and possibly schools and fund smart driving projects.
Tr13 Parking Policies
all Pollutants
encourage parking policies and programs in local plans, e.g. reduce minimum parking requirements; limit the supply of off-street parking in transit-oriented areas; un-bundle the price of parking spaces; support implemen-tation of demand-based pricing (such as “SF Park”) in high-trafficareas.
Tr14 Cars and light Trucks
all Pollutants
Commit regional clean air funds toward qualifying vehicle purchases and infrastructure development. Partner with private, local, state and federal programs to promote the purchase and lease of battery-electric and plug-in hybrid electric vehicles.
Tr15 Public Outreach and education
all Pollutants
implement the Spare the air every Day Campaign in-cluding Spare the air alerts, employer program, and community resource teams, a PeV Outreach campaign and the Spare the air Youth Program.
Tr16 indirect Source review
all Pollutants
Consider a rule that sets air quality performance stan-dardsfornewandmodifieddevelopmentprojects.
(continued)
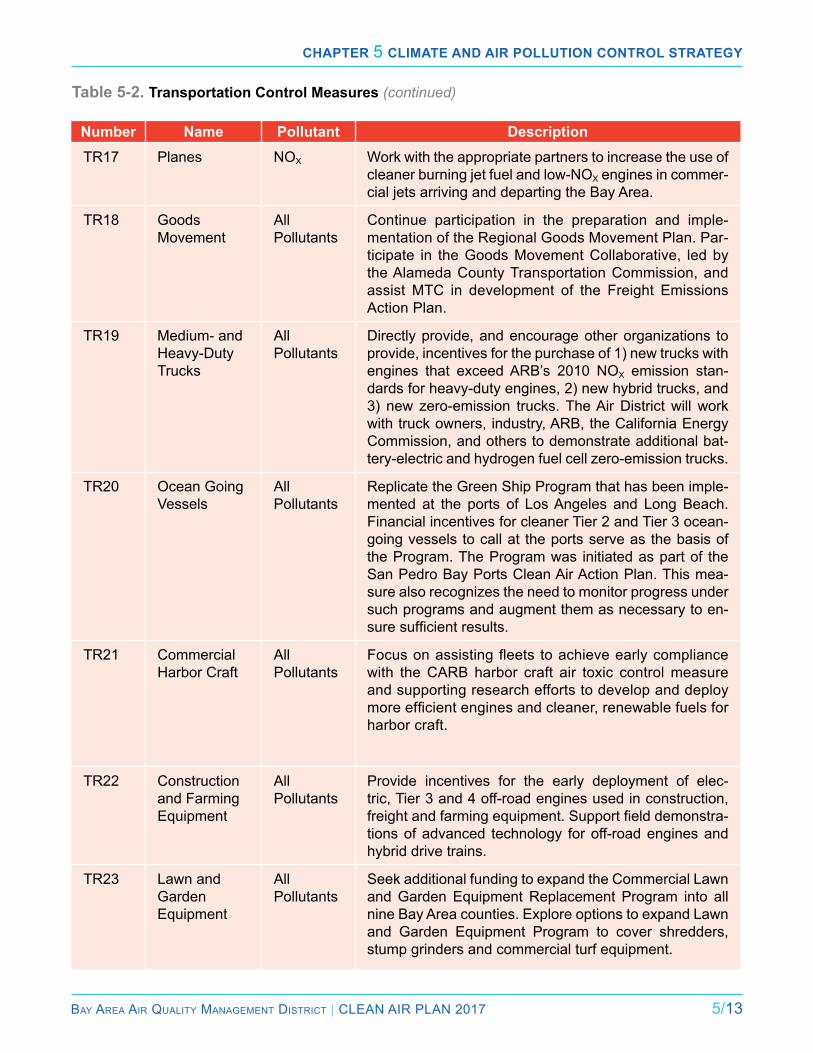
Chapter 5 Climate and air pollution Control Strategy
Bay area air Quality ManageMent District | Clean air Plan 2017 5/13
Table 5-2. Transportation Control Measures (continued)
Number Name Pollutant DescriptionTr17 Planes nOX Work with the appropriate partners to increase the use of
cleaner burning jet fuel and low-nOX engines in commer-cial jets arriving and departing the Bay area.
Tr18 Goods Movement
all Pollutants
Continue participation in the preparation and imple-mentation of the regional Goods Movement Plan. Par-ticipate in the Goods Movement Collaborative, led by the alameda County Transportation Commission, and assist MTC in development of the Freight emissions action Plan.
Tr19 Medium- and Heavy-Duty Trucks
all Pollutants
Directly provide, and encourage other organizations to provide, incentives for the purchase of 1) new trucks with engines that exceed arB’s 2010 nOX emission stan-dards for heavy-duty engines, 2) new hybrid trucks, and 3) new zero-emission trucks. The air District will work with truck owners, industry, arB, the California energy Commission, and others to demonstrate additional bat-tery-electric and hydrogen fuel cell zero-emission trucks.
Tr20 Ocean Going Vessels
all Pollutants
replicate the Green Ship Program that has been imple-mented at the ports of los angeles and long Beach. Financial incentives for cleaner Tier 2 and Tier 3 ocean- going vessels to call at the ports serve as the basis of the Program. The Program was initiated as part of the San Pedro Bay Ports Clean air action Plan. This mea-sure also recognizes the need to monitor progress under such programs and augment them as necessary to en-suresufficientresults.
Tr21 Commercial Harbor Craft
all Pollutants
Focusonassistingfleets toachieveearlycompliancewith the CarB harbor craft air toxic control measure and supporting research efforts to develop and deploy moreefficientenginesandcleaner,renewablefuelsforharbor craft.
Tr22 Construction and Farming equipment
all Pollutants
Provide incentives for the early deployment of elec-tric, Tier 3 and 4 off-road engines used in construction, freightandfarmingequipment.Supportfielddemonstra-tions of advanced technology for off-road engines and hybrid drive trains.
Tr23 lawn and Garden equipment
all Pollutants
Seek additional funding to expand the Commercial lawn and Garden equipment replacement Program into all nine Bay area counties. explore options to expand lawn and Garden equipment Program to cover shredders, stump grinders and commercial turf equipment.
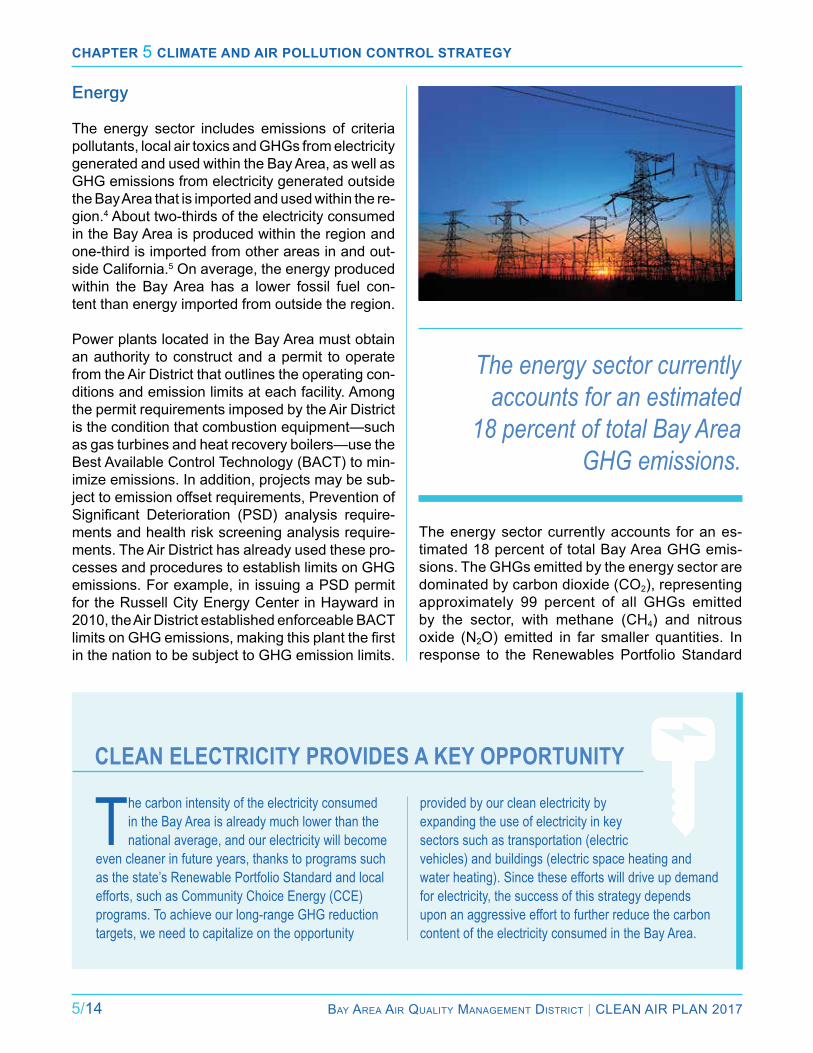
Chapter 5 Climate and air pollution Control Strategy
5/14 Bay area air Quality ManageMent District | Clean air Plan 2017
Energy
The energy sector includes emissions of criteria pollutants, local air toxics and GHGs from electricity generated and used within the Bay area, as well as GHG emissions from electricity generated outside the Bay area that is imported and used within the re-gion.4 about two-thirds of the electricity consumed in the Bay area is produced within the region and one-third is imported from other areas in and out-side California.5 On average, the energy produced within the Bay area has a lower fossil fuel con-tent than energy imported from outside the region.
Power plants located in the Bay area must obtain an authority to construct and a permit to operate from the air District that outlines the operating con-ditions and emission limits at each facility. among the permit requirements imposed by the air District is the condition that combustion equipment—such as gas turbines and heat recovery boilers—use the Best available Control Technology (BaCT) to min-imize emissions. in addition, projects may be sub-ject to emission offset requirements, Prevention of Significant Deterioration (PSD) analysis require-ments and health risk screening analysis require-ments. The air District has already used these pro-cesses and procedures to establish limits on GHG emissions. For example, in issuing a PSD permit for the russell City energy Center in Hayward in 2010, the air District established enforceable BaCT limitsonGHGemissions,makingthisplantthefirstin the nation to be subject to GHG emission limits.
Clean eleCtriCity Provides a Key oPPortunity
provided by our clean electricity by expanding the use of electricity in key sectors such as transportation (electric vehicles) and buildings (electric space heating and water heating). Since these efforts will drive up demand for electricity, the success of this strategy depends upon an aggressive effort to further reduce the carbon content of the electricity consumed in the Bay Area.
The carbon intensity of the electricity consumed in the Bay Area is already much lower than the national average, and our electricity will become
even cleaner in future years, thanks to programs such as the state’s Renewable Portfolio Standard and local efforts, such as Community Choice Energy (CCE) programs. To achieve our long-range GHG reduction targets, we need to capitalize on the opportunity
The energy sector currently accounts for an es-timated 18 percent of total Bay area GHG emis-sions. The GHGs emitted by the energy sector are dominated by carbon dioxide (CO2), representing approximately 99 percent of all GHGs emitted by the sector, with methane (CH4) and nitrous oxide (n2O) emitted in far smaller quantities. in response to the renewables Portfolio Standard
The energy sector currently accounts for an estimated
18 percent of total Bay Area GHG emissions.
Chapter 5 Climate and air pollution Control Strategy
Bay area air Quality ManageMent District | Clean air Plan 2017 5/15
andotherpoliciesbrieflydescribedbelow,GHGemissions from the energy sector are projected to decrease over the next several decades. Howev-er, the projected rate of decrease falls short of the rate needed to achieve GHG reduction targets for 2030 and 2050.
California and the Bay area have already made great strides in reducing GHG emissions from the energy sector through efforts to reduce the fos-sil fuel content of electricity, which also reduces emissions of criteria pollutants and TaCs. Califor-nia'sRenewablesPortfolioStandard(RPS),firstestablished in 2002, is one of the most ambitious renewable energy standards in the country.6 The rPS program requires investor-owned utilities, electric service providers, and community choice aggregators to increase procurement from eligible renewable energy resources to 33 percent of total procurement by 2020, and 50 percent by 2030. in addition, large electric utilities are subject to the statewide GHG Cap-and-Trade (CaT) Program. across California, these efforts are expected to reduce GHG emissions from regulated facilities 17 percent below 2013 levels by 2020.7 also, pur-suant to SB 1368 (2006), the state adopted the
Community ChoiCe energy (CCe)
for their electricity. One provides electricity generated with 50 percent renewable energy, the other with 100 percent renewable energy. The CCE concept has been adopted in many Bay Area cities and counties. Sonoma Clean Power began operation in 2014, San Francisco launched CleanPower SF in 2016, and Peninsula Clean Energy launched in San Mateo County in October 2016. Silicon Valley Clean Energy and Alameda County are planning to begin implementing CCE programs in 2017, and additional counties are currently exploring CCE options.
California law allows cities and counties to aggregate the buying power of individual consumers in order to secure alternative energy
supply contracts on a community-wide basis. As such, local governments serve as the electric power purchaser for their communities. The first community choice energy program in the Bay Area—Marin Clean Energy—was launched in 2008 with a grant from the Air District. Marin Clean Energy provides residents and businesses in Marin County, unincorporated Napa County and the cities of Benicia, El Cerrito, Richmond, San Pablo, Lafayette and Walnut Creek two choices
world’sfirstGHGemissionperformancestandardfor power-plant investments.8
electricity in the Bay area is produced, import-ed and delivered by a combination of an inves-tor-owned utility (PG&e), several municipally- owned utilities, and four community choice energy programs (with additional CCes in development). Three state agencies regulate the investor-owned utility (municipal utilities are not regulated by the state): the California Public Utilities Commission (CPUC), California energy Commission (CeC and the California independent System Operator (Ca iSO). in addition, the Federal energy reg-ulatory Commission (FerC) regulates some hy-dropower projects and interstate electricity trans-mission. The CPUC has developed rules for the implementation of CCes. electricity production and delivery in California is a complex and heav-ily regulated industry. nonetheless, there may be opportunities for the air District to help reduce GHG emissions, both within the electricity supply chain and through consumer practices, by work-ing to support and complement emission reduc-tion activities at the state, utility and local power program levels.
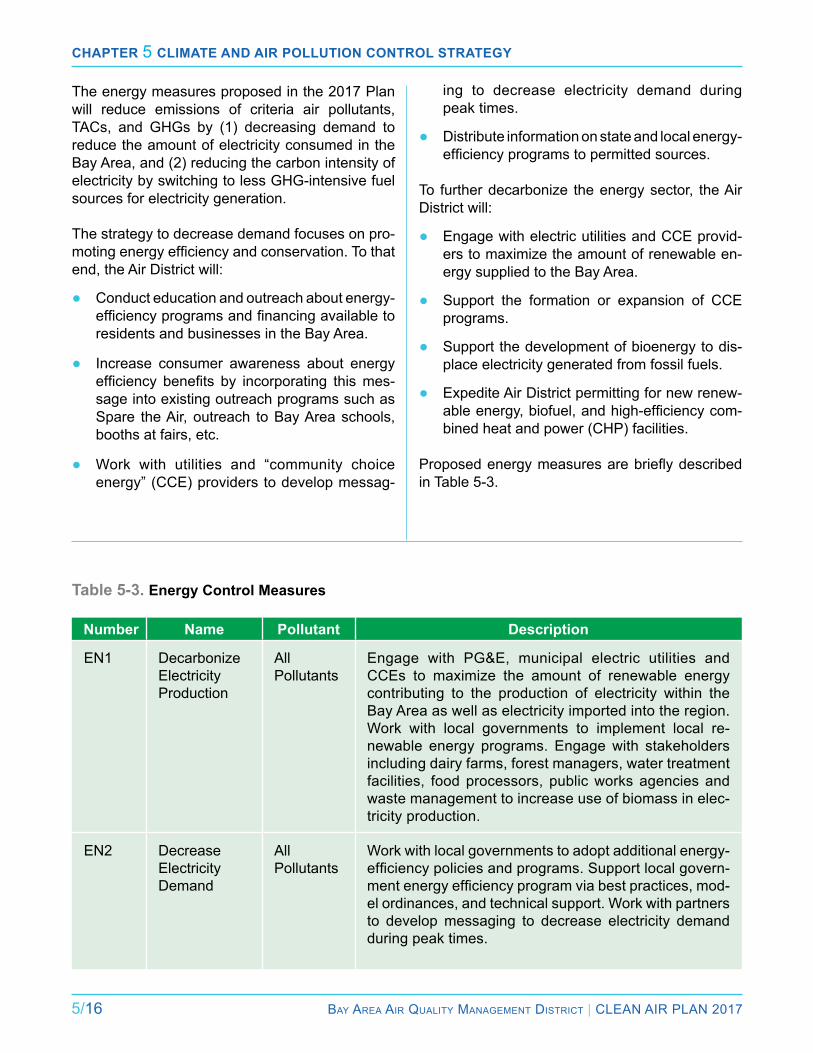
Chapter 5 Climate and air pollution Control Strategy
5/16 Bay area air Quality ManageMent District | Clean air Plan 2017
The energy measures proposed in the 2017 Plan will reduce emissions of criteria air pollutants, TaCs, and GHGs by (1) decreasing demand to reduce the amount of electricity consumed in the Bay area, and (2) reducing the carbon intensity of electricity by switching to less GHG-intensive fuel sources for electricity generation.
The strategy to decrease demand focuses on pro-motingenergyefficiencyandconservation.Tothatend, the air District will:
● Conduct education and outreach about energy- efficiencyprogramsandfinancingavailabletoresidents and businesses in the Bay area.
● increase consumer awareness about energy efficiency benefits by incorporating thismes-sage into existing outreach programs such as Spare the air, outreach to Bay area schools, booths at fairs, etc.
● Work with utilities and “community choice energy” (CCe) providers to develop messag-
ing to decrease electricity demand during peak times.
● Distribute information on state and local energy- efficiencyprogramstopermittedsources.
To further decarbonize the energy sector, the air District will:
● engage with electric utilities and CCe provid-ers to maximize the amount of renewable en-ergy supplied to the Bay area.
● Support the formation or expansion of CCe programs.
● Support the development of bioenergy to dis-place electricity generated from fossil fuels.
● expedite air District permitting for new renew-ableenergy,biofuel,andhigh-efficiencycom-bined heat and power (CHP) facilities.
Proposedenergymeasuresarebrieflydescribedin Table 5-3.
Table 5-3. Energy Control Measures
Number Name Pollutant Description
en1 Decarbonize electricity Production
all Pollutants
engage with PG&e, municipal electric utilities and CCes to maximize the amount of renewable energy contributing to the production of electricity within the Bay area as well as electricity imported into the region. Work with local governments to implement local re-newable energy programs. engage with stakeholders including dairy farms, forest managers, water treatment facilities, food processors, public works agencies and waste management to increase use of biomass in elec-tricity production.
en2 Decrease electricity Demand
all Pollutants
Work with local governments to adopt additional energy- efficiencypoliciesandprograms.Supportlocalgovern-mentenergyefficiencyprogramviabestpractices,mod-el ordinances, and technical support. Work with partners to develop messaging to decrease electricity demand during peak times.
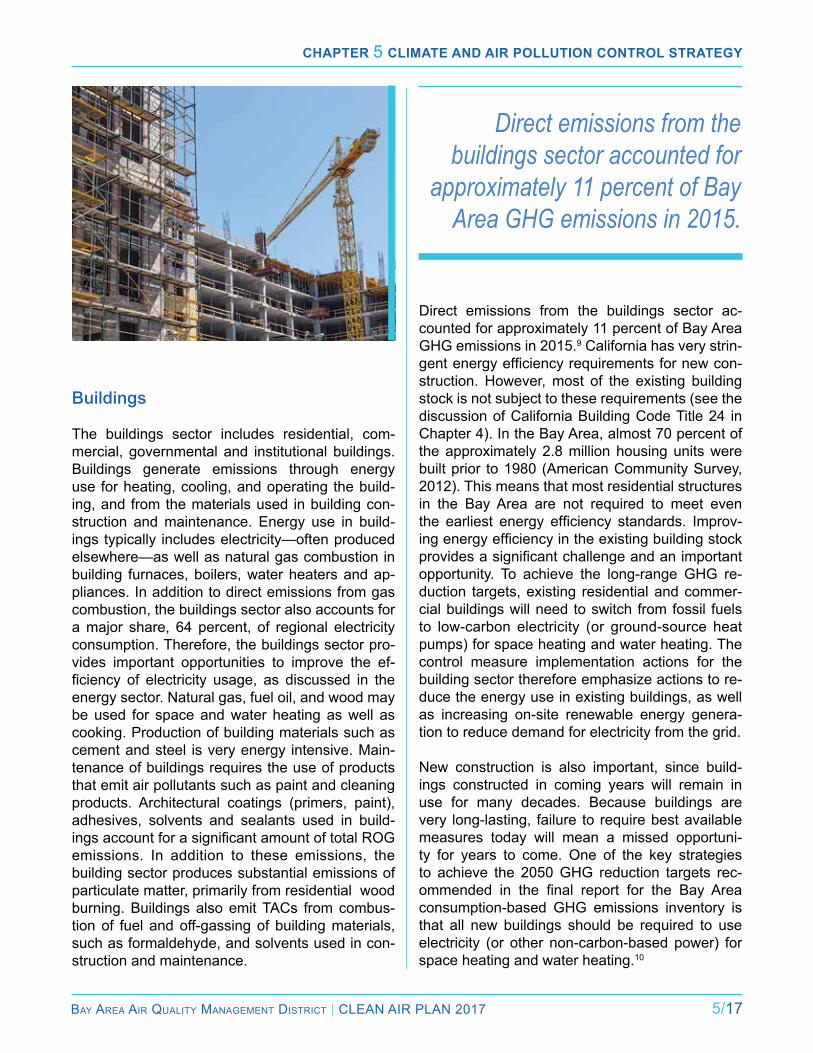
Chapter 5 Climate and air pollution Control Strategy
Bay area air Quality ManageMent District | Clean air Plan 2017 5/17
Buildings
The buildings sector includes residential, com-mercial, governmental and institutional buildings. Buildings generate emissions through energy use for heating, cooling, and operating the build-ing, and from the materials used in building con-struction and maintenance. energy use in build-ings typically includes electricity—often produced elsewhere—as well as natural gas combustion in building furnaces, boilers, water heaters and ap-pliances. in addition to direct emissions from gas combustion, the buildings sector also accounts for a major share, 64 percent, of regional electricity consumption. Therefore, the buildings sector pro-vides important opportunities to improve the ef-ficiency of electricity usage, as discussed in theenergy sector. natural gas, fuel oil, and wood may be used for space and water heating as well as cooking. Production of building materials such as cement and steel is very energy intensive. Main-tenance of buildings requires the use of products that emit air pollutants such as paint and cleaning products. architectural coatings (primers, paint), adhesives, solvents and sealants used in build-ingsaccountforasignificantamountoftotalROGemissions. in addition to these emissions, the building sector produces substantial emissions of particulate matter, primarily from residential wood burning. Buildings also emit TaCs from combus-tion of fuel and off-gassing of building materials, such as formaldehyde, and solvents used in con-struction and maintenance.
Direct emissions from the buildings sector accounted for
approximately 11 percent of Bay Area GHG emissions in 2015.
Direct emissions from the buildings sector ac-counted for approximately 11 percent of Bay area GHG emissions in 2015.9 California has very strin-gentenergyefficiencyrequirementsfornewcon-struction. However, most of the existing building stock is not subject to these requirements (see the discussion of California Building Code Title 24 in Chapter 4). in the Bay area, almost 70 percent of the approximately 2.8 million housing units were built prior to 1980 (american Community Survey, 2012). This means that most residential structures in the Bay area are not required to meet even the earliest energy efficiency standards. Improv-ingenergyefficiencyintheexistingbuildingstockprovidesasignificantchallengeandanimportantopportunity. To achieve the long-range GHG re-duction targets, existing residential and commer-cial buildings will need to switch from fossil fuels to low-carbon electricity (or ground-source heat pumps) for space heating and water heating. The control measure implementation actions for the building sector therefore emphasize actions to re-duce the energy use in existing buildings, as well as increasing on-site renewable energy genera-tion to reduce demand for electricity from the grid.
new construction is also important, since build-ings constructed in coming years will remain in use for many decades. Because buildings are very long-lasting, failure to require best available measures today will mean a missed opportuni-ty for years to come. One of the key strategies to achieve the 2050 GHG reduction targets rec-ommended in the final report for the Bay Areaconsumption-based GHG emissions inventory is that all new buildings should be required to use electricity (or other non-carbon-based power) for space heating and water heating.10
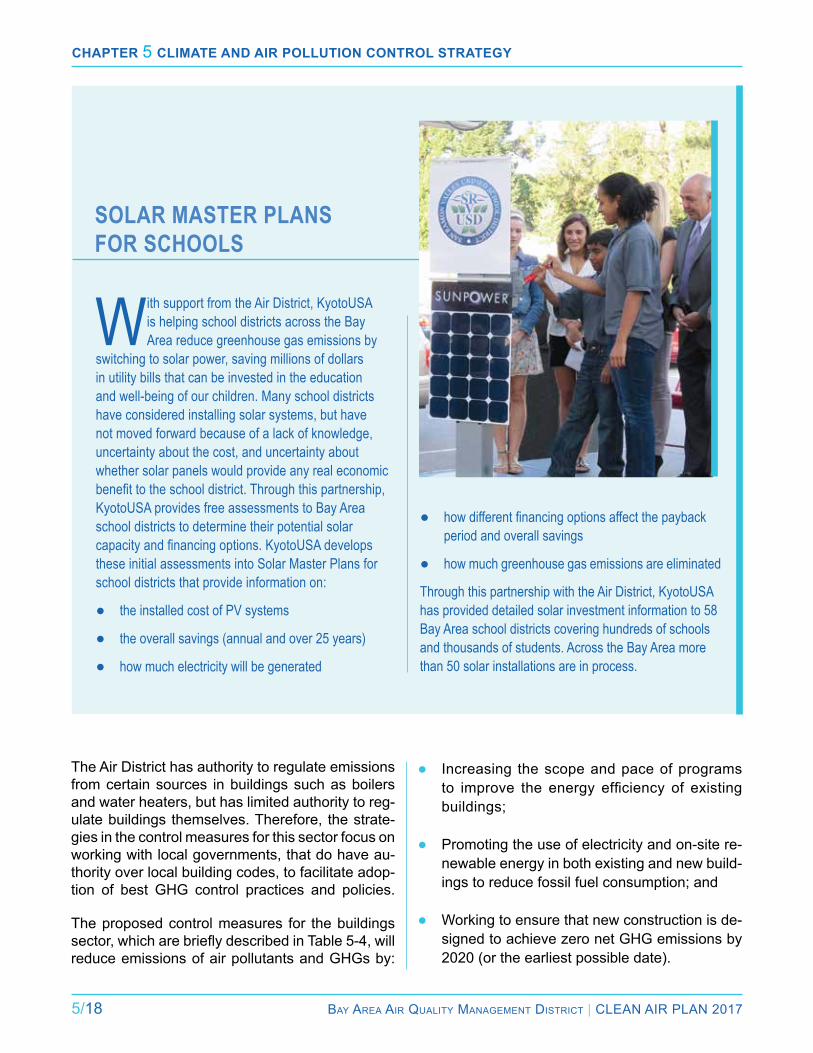
Chapter 5 Climate and air pollution Control Strategy
5/18 Bay area air Quality ManageMent District | Clean air Plan 2017
The air District has authority to regulate emissions from certain sources in buildings such as boilers and water heaters, but has limited authority to reg-ulate buildings themselves. Therefore, the strate-gies in the control measures for this sector focus on working with local governments, that do have au-thority over local building codes, to facilitate adop-tion of best GHG control practices and policies.
The proposed control measures for the buildings sector,whicharebrieflydescribedinTable5-4,willreduce emissions of air pollutants and GHGs by:
solar master Plans for sChools
● how different financing options affect the payback period and overall savings
● how much greenhouse gas emissions are eliminated
Through this partnership with the Air District, KyotoUSA has provided detailed solar investment information to 58 Bay Area school districts covering hundreds of schools and thousands of students. Across the Bay Area more than 50 solar installations are in process.
With support from the Air District, KyotoUSA is helping school districts across the Bay Area reduce greenhouse gas emissions by
switching to solar power, saving millions of dollars in utility bills that can be invested in the education and well-being of our children. Many school districts have considered installing solar systems, but have not moved forward because of a lack of knowledge, uncertainty about the cost, and uncertainty about whether solar panels would provide any real economic benefit to the school district. Through this partnership, KyotoUSA provides free assessments to Bay Area school districts to determine their potential solar capacity and financing options. KyotoUSA develops these initial assessments into Solar Master Plans for school districts that provide information on:
● the installed cost of PV systems
● the overall savings (annual and over 25 years)
● how much electricity will be generated
● increasing the scope and pace of programs to improve the energy efficiency of existingbuildings;
● Promoting the use of electricity and on-site re-newable energy in both existing and new build-ings to reduce fossil fuel consumption; and
● Working to ensure that new construction is de-signed to achieve zero net GHG emissions by 2020 (or the earliest possible date).
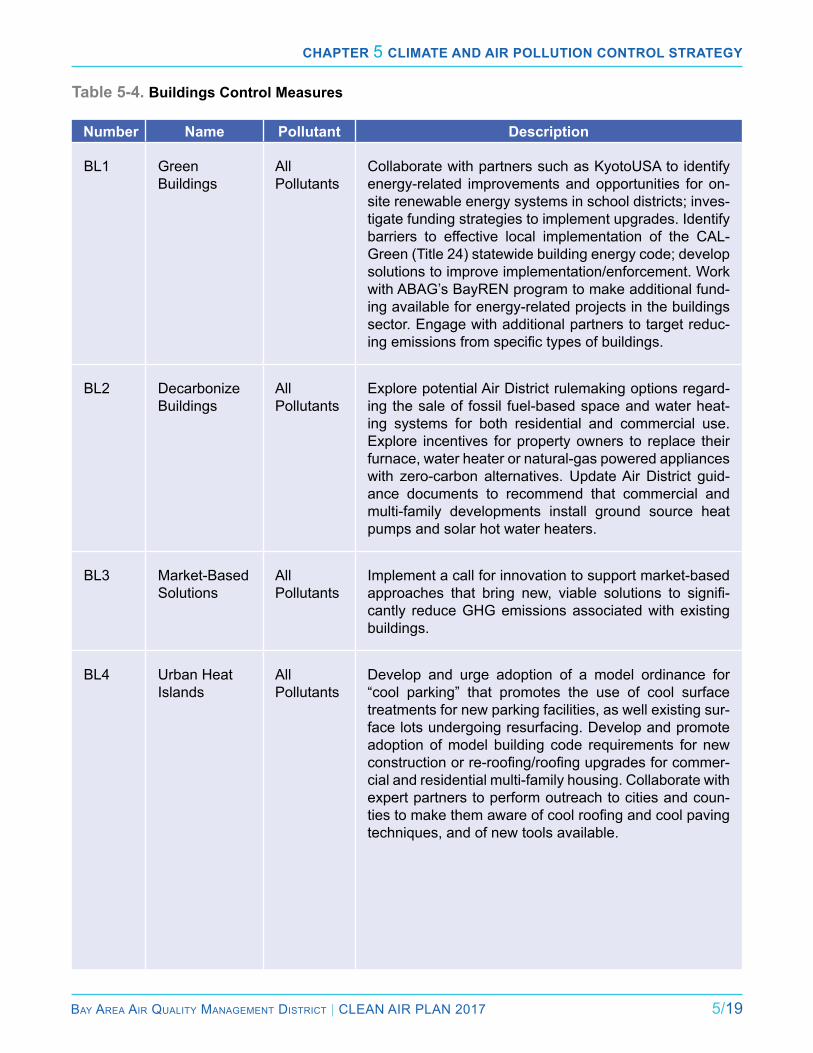
Chapter 5 Climate and air pollution Control Strategy
Bay area air Quality ManageMent District | Clean air Plan 2017 5/19
Table 5-4. Buildings Control Measures
Number Name Pollutant Description
Bl1 Green Buildings
all Pollutants
Collaborate with partners such as KyotoUSa to identify energy-related improvements and opportunities for on-site renewable energy systems in school districts; inves-tigate funding strategies to implement upgrades. identify barriers to effective local implementation of the Cal-Green (Title 24) statewide building energy code; develop solutions to improve implementation/enforcement. Work with aBaG’s Bayren program to make additional fund-ing available for energy-related projects in the buildings sector. engage with additional partners to target reduc-ingemissionsfromspecifictypesofbuildings.
Bl2 Decarbonize Buildings
all Pollutants
explore potential air District rulemaking options regard-ing the sale of fossil fuel-based space and water heat-ing systems for both residential and commercial use. explore incentives for property owners to replace their furnace, water heater or natural-gas powered appliances with zero-carbon alternatives. Update air District guid-ance documents to recommend that commercial and multi-family developments install ground source heat pumps and solar hot water heaters.
Bl3 Market-Based Solutions
all Pollutants
implement a call for innovation to support market-based approaches that bring new, viable solutions to signifi-cantly reduce GHG emissions associated with existing buildings.
Bl4 Urban Heat islands
all Pollutants
Develop and urge adoption of a model ordinance for “cool parking” that promotes the use of cool surface treatments for new parking facilities, as well existing sur-face lots undergoing resurfacing. Develop and promote adoption of model building code requirements for new constructionorre-roofing/roofingupgradesforcommer-cial and residential multi-family housing. Collaborate with expert partners to perform outreach to cities and coun-tiestomakethemawareofcoolroofingandcoolpavingtechniques, and of new tools available.
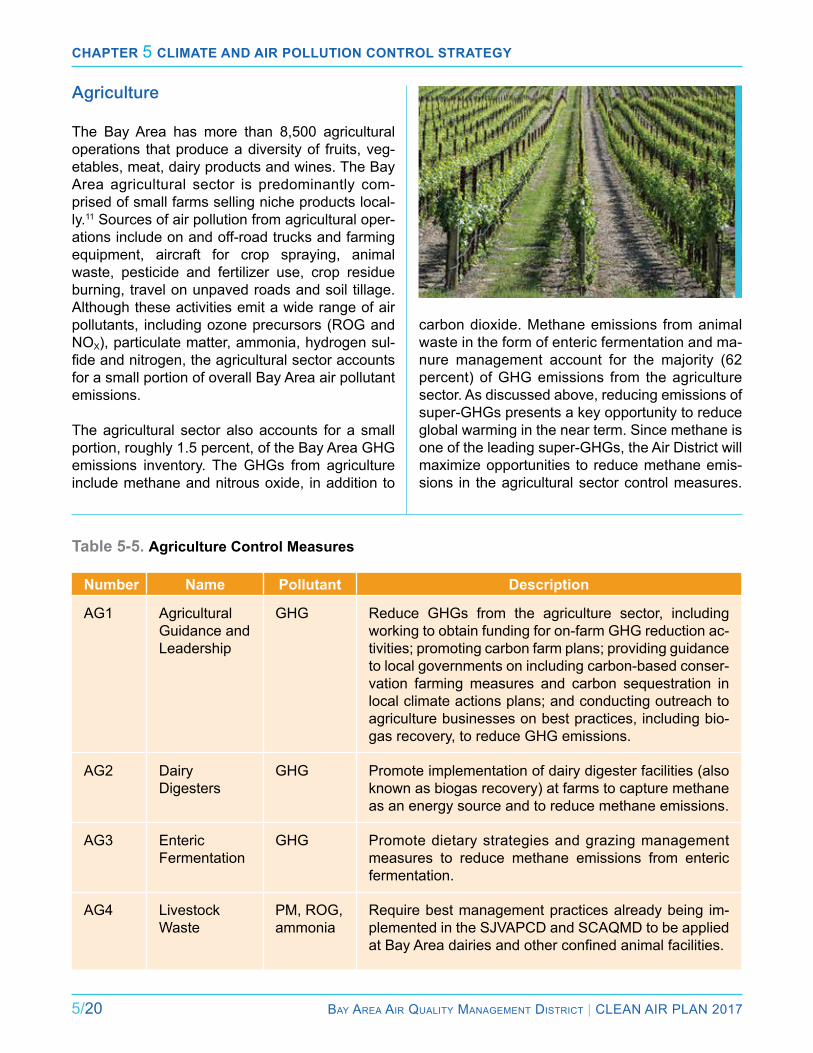
Chapter 5 Climate and air pollution Control Strategy
5/20 Bay area air Quality ManageMent District | Clean air Plan 2017
Agriculture The Bay area has more than 8,500 agricultural operations that produce a diversity of fruits, veg-etables, meat, dairy products and wines. The Bay area agricultural sector is predominantly com-prised of small farms selling niche products local-ly.11 Sources of air pollution from agricultural oper-ations include on and off-road trucks and farming equipment, aircraft for crop spraying, animal waste, pesticide and fertilizer use, crop residue burning, travel on unpaved roads and soil tillage. although these activities emit a wide range of air pollutants, including ozone precursors (rOG and nOX), particulate matter, ammonia, hydrogen sul-fideandnitrogen,theagriculturalsectoraccountsfor a small portion of overall Bay area air pollutant emissions.
The agricultural sector also accounts for a small portion, roughly 1.5 percent, of the Bay area GHG emissions inventory. The GHGs from agriculture include methane and nitrous oxide, in addition to
carbon dioxide. Methane emissions from animal waste in the form of enteric fermentation and ma-nure management account for the majority (62 percent) of GHG emissions from the agriculture sector. as discussed above, reducing emissions of super-GHGs presents a key opportunity to reduce global warming in the near term. Since methane is one of the leading super-GHGs, the air District will maximize opportunities to reduce methane emis-sions in the agricultural sector control measures.
Number Name Pollutant Description
aG1 agricultural Guidance and leadership
GHG reduce GHGs from the agriculture sector, including working to obtain funding for on-farm GHG reduction ac-tivities; promoting carbon farm plans; providing guidance to local governments on including carbon-based conser-vation farming measures and carbon sequestration in local climate actions plans; and conducting outreach to agriculture businesses on best practices, including bio-gas recovery, to reduce GHG emissions.
aG2 Dairy Digesters
GHG Promote implementation of dairy digester facilities (also known as biogas recovery) at farms to capture methane as an energy source and to reduce methane emissions.
aG3 enteric Fermentation
GHG Promote dietary strategies and grazing management measures to reduce methane emissions from enteric fermentation.
aG4 livestock Waste
PM, rOG, ammonia
require best management practices already being im-plemented in the SJVaPCD and SCaQMD to be applied atBayAreadairiesandotherconfinedanimalfacilities.
Table 5-5. Agriculture Control Measures
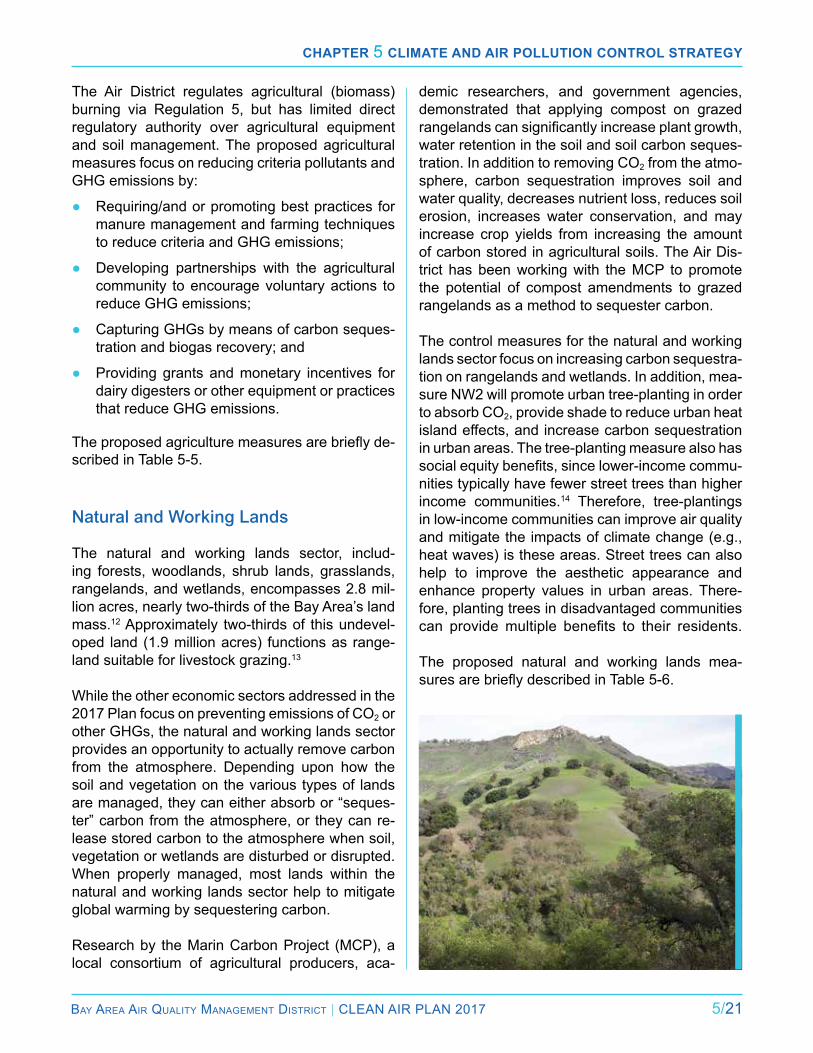
Chapter 5 Climate and air pollution Control Strategy
Bay area air Quality ManageMent District | Clean air Plan 2017 5/21
The air District regulates agricultural (biomass) burning via regulation 5, but has limited direct regulatory authority over agricultural equipment and soil management. The proposed agricultural measures focus on reducing criteria pollutants and GHG emissions by:
● requiring/and or promoting best practices for manure management and farming techniques to reduce criteria and GHG emissions;
● Developing partnerships with the agricultural community to encourage voluntary actions to reduce GHG emissions;
● Capturing GHGs by means of carbon seques-tration and biogas recovery; and
● Providing grants and monetary incentives for dairy digesters or other equipment or practices that reduce GHG emissions.
Theproposedagriculturemeasuresarebrieflyde-scribed in Table 5-5.
Natural and Working Lands
The natural and working lands sector, includ-ing forests, woodlands, shrub lands, grasslands, rangelands, and wetlands, encompasses 2.8 mil-lion acres, nearly two-thirds of the Bay area’s land mass.12 approximately two-thirds of this undevel-oped land (1.9 million acres) functions as range-land suitable for livestock grazing.13
While the other economic sectors addressed in the 2017 Plan focus on preventing emissions of CO2 or other GHGs, the natural and working lands sector provides an opportunity to actually remove carbon from the atmosphere. Depending upon how the soil and vegetation on the various types of lands are managed, they can either absorb or “seques-ter” carbon from the atmosphere, or they can re-lease stored carbon to the atmosphere when soil, vegetation or wetlands are disturbed or disrupted. When properly managed, most lands within the natural and working lands sector help to mitigate global warming by sequestering carbon.
research by the Marin Carbon Project (MCP), a local consortium of agricultural producers, aca-
demic researchers, and government agencies, demonstrated that applying compost on grazed rangelandscansignificantlyincreaseplantgrowth,water retention in the soil and soil carbon seques-tration. in addition to removing CO2 from the atmo-sphere, carbon sequestration improves soil and water quality, decreases nutrient loss, reduces soil erosion, increases water conservation, and may increase crop yields from increasing the amount of carbon stored in agricultural soils. The air Dis-trict has been working with the MCP to promote the potential of compost amendments to grazed rangelands as a method to sequester carbon.
The control measures for the natural and working lands sector focus on increasing carbon sequestra-tion on rangelands and wetlands. in addition, mea-sure nW2 will promote urban tree-planting in order to absorb CO2, provide shade to reduce urban heat island effects, and increase carbon sequestration in urban areas. The tree-planting measure also has socialequitybenefits,sincelower-incomecommu-nities typically have fewer street trees than higher income communities.14 Therefore, tree-plantings in low-income communities can improve air quality and mitigate the impacts of climate change (e.g., heat waves) is these areas. Street trees can also help to improve the aesthetic appearance and enhance property values in urban areas. There-fore, planting trees in disadvantaged communities can providemultiple benefits to their residents.
The proposed natural and working lands mea-suresarebrieflydescribedinTable5-6.
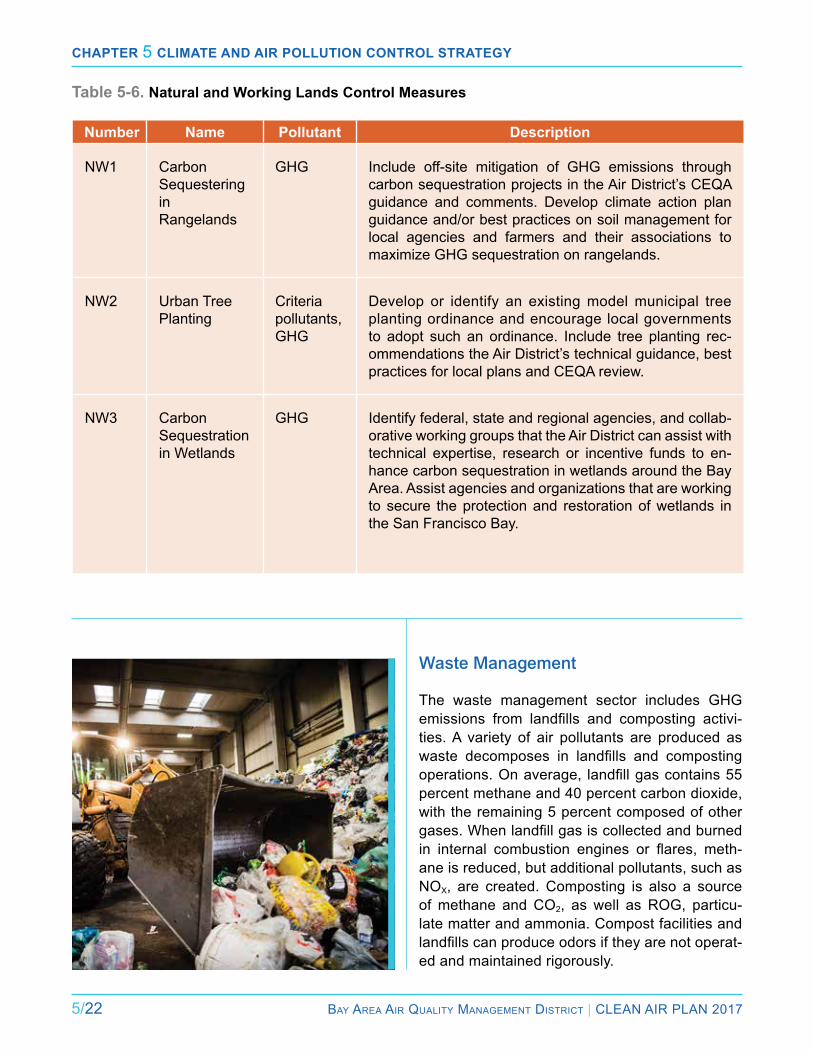
Chapter 5 Climate and air pollution Control Strategy
5/22 Bay area air Quality ManageMent District | Clean air Plan 2017
Number Name Pollutant Description
nW1 Carbon Sequestering in rangelands
GHG include off-site mitigation of GHG emissions through carbon sequestration projects in the air District’s CeQa guidance and comments. Develop climate action plan guidance and/or best practices on soil management for local agencies and farmers and their associations to maximize GHG sequestration on rangelands.
nW2 Urban Tree Planting
Criteria pollutants, GHG
Develop or identify an existing model municipal tree planting ordinance and encourage local governments to adopt such an ordinance. include tree planting rec-ommendations the air District’s technical guidance, best practices for local plans and CeQa review.
nW3 Carbon Sequestration in Wetlands
GHG identify federal, state and regional agencies, and collab-orative working groups that the air District can assist with technical expertise, research or incentive funds to en-hance carbon sequestration in wetlands around the Bay area. assist agencies and organizations that are working to secure the protection and restoration of wetlands in the San Francisco Bay.
Table 5-6. Natural and Working Lands Control Measures
Waste Management
The waste management sector includes GHG emissions from landfills and composting activi-ties. a variety of air pollutants are produced as waste decomposes in landfills and compostingoperations.Onaverage, landfillgascontains55percent methane and 40 percent carbon dioxide, with the remaining 5 percent composed of other gases.Whenlandfillgasiscollectedandburnedin internal combustion engines or flares, meth-ane is reduced, but additional pollutants, such as nOX, are created. Composting is also a source of methane and CO2, as well as rOG, particu-late matter and ammonia. Compost facilities and landfillscanproduceodorsiftheyarenotoperat-ed and maintained rigorously.
Chapter 5 Climate and air pollution Control Strategy
Bay area air Quality ManageMent District | Clean air Plan 2017 5/23
The waste management sector has achieved sig-nificant emission reductions in the past severaldecades thanks to new laws and regulations limit-ing emissions from waste facilities, as well as vol-untary waste diversion programs that seek to re-duce the amount of refuse material going into the waste stream. Key contributors to this trend have beenthesignificantincreaseinrecyclingandoth-er waste stream diversion programs implemented at the local level since 1990, as well as regula-tions adopted by the air resources Board and AirDistricttocontrolemissionsfromlandfillsandcomposting facilities. The air District’s regulation 8, rule 34 regulates emissions of methane and non-methane compounds at solid waste disposal sites. Currently, there is no air District rule regulat-ing GHG emissions from compost facilities. How-ever, through its permitting program, the air District does impose conditions on composting facilities to address emissions of other air pollutants; these conditions can also reduce GHG emissions.15
In the BayArea, GHG emissions from landfillshave been declining, and are projected to con-tinue todecrease.Nonetheless, landfills remainthe largest source of GHGs from the waste man-agement sector, due to methane from the un-
reduCing food Waste
digestion facilities that use best management practices to contain emissions and odors. Besides producing methane that can be used as fuel, composting organic waste provides a valuable resource that can sequester carbon and greatly improve soil conditions in gardens, farms and rangelands.
Food scraps and other organic waste do not belong in landfills. Yet, the Bay Area still throws away more than 1 million tons of food each year.
Reducing food waste and facilitating donations of unused food to food banks should be the first priority. Any food that cannot be consumed, however, should be directed to centralized compost and anaerobic
controlled decomposition of organic materials, aswellas the fact that landfillsaremuch largerin scale than composting facilities. in addition to reducing GHG emissions, composting organic waste,ratherthansendingittolandfills,providesother benefits.16 applying compost to gardens andurbanlandscapesreducestheneedforartifi-cial fertilizers and pesticides.17 applying compost to rangeland can also increase carbon seques-tration, as described in the natural and Working lands section. in addition, compost reduces the amount of water needed in agricultural operations and landscaping.
This plan emphasizes the need for early and ag-gressive action to reduce emissions of methane and other super-GHGs. To this end, the proposed waste management sector measures focus on reducing or capturing methane emissions from landfills and composting facilities, diverting or-ganicmaterialsawayfromlandfills,andincreas-ing waste diversion rates through efforts to reuse, reduce and recycle.
Table 5-7 provides a brief description of the pro-posed waste management measures.

Chapter 5 Climate and air pollution Control Strategy
5/24 Bay area air Quality ManageMent District | Clean air Plan 2017
Number Name Pollutant Description
Wa1 Landfills GHG, rOG, TaCs
Propose amendments to air District rule 8-34 to in-crease stringency of emission limits, including fugitive leak standards, and improve consistency with federal rules.
Wa2 Composting and anaerobic Digestion
GHG, rOG, PM
Develop an air District rule that includes emission limits based on best practices in other areas of the state.
Wa3 Green Waste Diversion
all Pollutants
Develop model policies to facilitate local adoption of or-dinances and programs to reduce the amount of green wastegoingtolandfills.
Wa4 recycling and Waste reduction
GHG Develop or identify and promote model ordinances on community-wide zero waste goals and recycling of con-struction and demolition materials in commercial and public construction projects.
Table 5-7. Waste Management Control Measures
Water
Over 400 billion gallons of water are used in the Bay area each year to support residential, com-mercial, agricultural and industrial activities.18 Wa-ter use results in criteria air pollutant and toxic air contaminants emissions, as well as GHG emis-sions. Greenhouse gases are emitted from the
water sector directly and indirectly. Sixty percent of GHGs in this sector (primarily methane) are directly emitted from the treatment of water and wastewater at publicly owned treatment works (POTWs). Forty percent of the GHG emissions as-sociated with water use (primarily carbon dioxide) are generated indirectly, as a result of the ener-gy used to pump, convey, recycle, and treat water and wastewater throughout the Bay area.
Combustion of fossil fuels and digester gas for the operation of engines, boilers and turbines at POTWs emits criteria pollutants and TaCs. The air District regulates these sources through its per-mitting process and requires the implementation of Best available Control Technology (BaCT) to control these emissions. in addition, POTWs must comply with state water regulations that have re-duced emissions of toxics, such as mercury and silver in recent decades. The expansion of anaer-obic digester systems at POTWs in recent years helps to reduce GHG emissions, but may increase emissions of criteria pollutants and TaCs.

Chapter 5 Climate and air pollution Control Strategy
Bay area air Quality ManageMent District | Clean air Plan 2017 5/25
The water sector accounts for a small portion, approximately 1 percent, of Bay area GHG emissions. GHG emissions from the water sec-tor are currently projected to slightly increase through 2030. However, the state is implement-ingpoliciestoimprovewateruseefficiencyandincrease conservation that may achieve overall GHG emission reductions in the water sector when fully implemented.
Number Name Pollutant Description
Wr1 limit GHGs from POTWs
GHG, rOG, TaCs
initiate a process to better understand and quantify GHG emissions at POTWs. explore rulemaking to reduce GHGs emitted directly within POTWs. Promote the use of biogas recovery systems at POTWs.
Wr2 Support Water Conservation
GHG Develop a list of best practices that reduce water con-sumption and increase on-site water recycling in new and existing buildings; incorporate into local planning guidance.
Table 5-8. Water Control Measures
The proposed control measures to reduce emis-sions from the water sector will reduce emis-sions of criteria pollutants, TaCs, and GHGs by encouraging water conservation, limiting GHG emissions from POTWs, and promoting the use of biogas recovery systems.
Table 5-8 provides a brief description of the water sector measures.
Super-GHGs Super-GHGs include methane, black carbon and fluorinatedgases(F-gases).Thecompoundsaresometimes referred to as short-lived climate pol-lutants (SlCPs) because their lifetime in the atmo-sphere is generally fairly short. However, for the purpose of climate planning, their principal charac-teristic is that they have very high global warming potential on a per-unit basis, in comparison to CO2. reducing emissions of super-GHGs is a key prior-ity for this control strategy, because this approach represents our best opportunity to slow the rate of global warming in the near term, as discussed in Chapter 3.
Methane: Methane accounts for the second larg-est share, after CO2, of the Bay area GHG in-ventory. Three source categories in the Bay area
GHG inventory are estimated to account for 90 percent of totalmethane emissions: landfills (50percent), animal waste (27 percent), and natural gas production and distribution (13 percent). re-cent research suggests that methane emissions fromsomesourcecategoriesmaybesignificantly
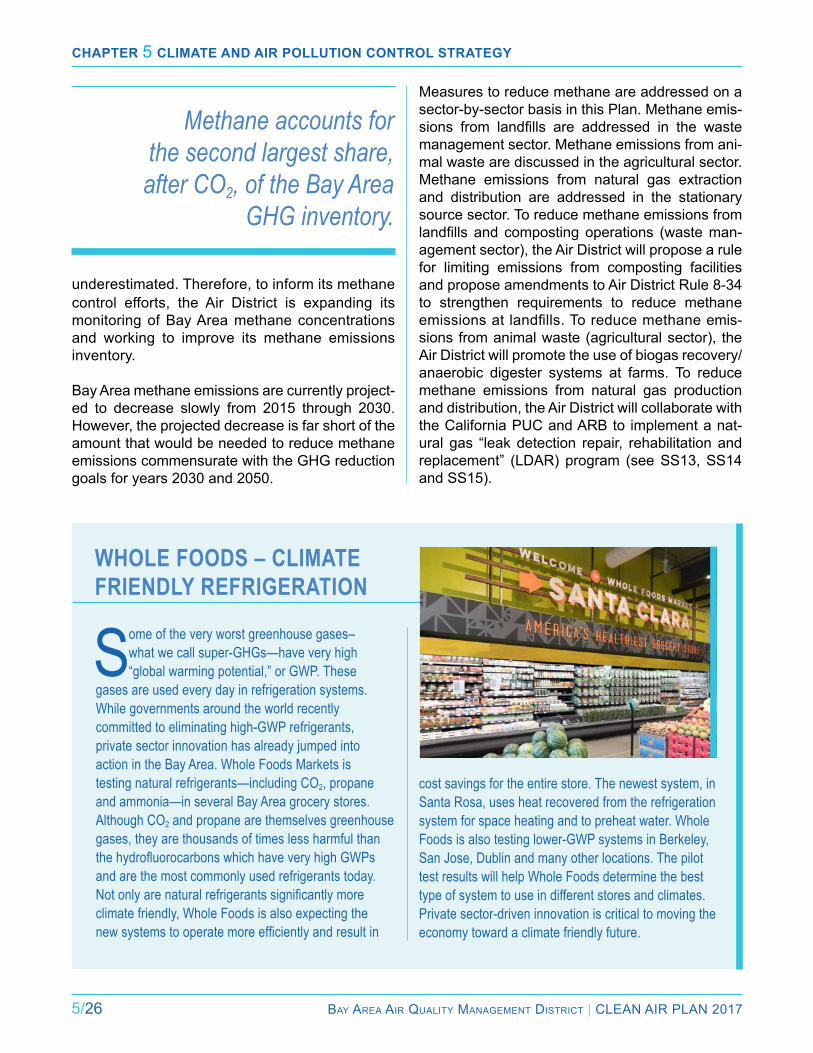
Chapter 5 Climate and air pollution Control Strategy
5/26 Bay area air Quality ManageMent District | Clean air Plan 2017
Whole foods – Climate friendly refrigeration
cost savings for the entire store. The newest system, in Santa Rosa, uses heat recovered from the refrigeration system for space heating and to preheat water. Whole Foods is also testing lower-GWP systems in Berkeley, San Jose, Dublin and many other locations. The pilot test results will help Whole Foods determine the best type of system to use in different stores and climates. Private sector-driven innovation is critical to moving the economy toward a climate friendly future.
Some of the very worst greenhouse gases– what we call super-GHGs—have very high “global warming potential,” or GWP. These
gases are used every day in refrigeration systems. While governments around the world recently committed to eliminating high-GWP refrigerants, private sector innovation has already jumped into action in the Bay Area. Whole Foods Markets is testing natural refrigerants—including CO2, propane and ammonia—in several Bay Area grocery stores. Although CO2 and propane are themselves greenhouse gases, they are thousands of times less harmful than the hydrofluorocarbons which have very high GWPs and are the most commonly used refrigerants today. Not only are natural refrigerants significantly more climate friendly, Whole Foods is also expecting the new systems to operate more efficiently and result in
Methane accounts for the second largest share, after CO2, of the Bay Area
GHG inventory.
underestimated. Therefore, to inform its methane control efforts, the air District is expanding its monitoring of Bay area methane concentrations and working to improve its methane emissions inventory.
Bay area methane emissions are currently project-ed to decrease slowly from 2015 through 2030. However, the projected decrease is far short of the amount that would be needed to reduce methane emissions commensurate with the GHG reduction goals for years 2030 and 2050.
Measures to reduce methane are addressed on a sector-by-sector basis in this Plan. Methane emis-sions from landfills are addressed in the wastemanagement sector. Methane emissions from ani-mal waste are discussed in the agricultural sector. Methane emissions from natural gas extraction and distribution are addressed in the stationary source sector. To reduce methane emissions from landfills and compostingoperations (wasteman-agement sector), the air District will propose a rule for limiting emissions from composting facilities and propose amendments to air District rule 8-34 to strengthen requirements to reduce methane emissionsatlandfills.Toreducemethaneemis-sions from animal waste (agricultural sector), the air District will promote the use of biogas recovery/anaerobic digester systems at farms. To reduce methane emissions from natural gas production and distribution, the air District will collaborate with the California PUC and arB to implement a nat-ural gas “leak detection repair, rehabilitation and replacement” (lDar) program (see SS13, SS14 and SS15).
Chapter 5 Climate and air pollution Control Strategy
Bay area air Quality ManageMent District | Clean air Plan 2017 5/27
Black Carbon (BC): BC is a climate pollutant and a component of particulate matter that also harms public health. Diesel engines and wood burning devices (fireplaces and stoves) are the leadingsources of BC in the Bay area. BC emissions in the Bay area decreased by 54 percent from 1990 through 2015 as a result of efforts by arB and the air District to reduce emissions from heavy- duty diesel engines, and the air District’s efforts to reduce wood burning during winter months. Bay area BC emissions are projected to continue de-creasing through 2020. However, in the absence of additional control measures, BC emissions are projected to increase beyond 2020 as Bay area population increases and the number of diesel en-gines in service grows.
To further reduce emissions of black carbon, the air District will propose amendments to its general PM requirements (rule 6-1) to place more strin-gent limits on PM emissions from stationary sourc-es; continue to enforce arB regulations to reduce PM emissions from diesel engines in the Bay area communities most impacted by PM emissions; continue and enhance its program to reduce res-idential wood burning; and provide grants and in-centives to reduce emissions of particulate matter and BC from heavy-duty vehicles.
Fluorinated gases: F-gases include a variety of man-made compounds, most of which have a global warming potential (GWP) thousands of times greater than CO2 on a per-unit basis. The 2017Planaddresseshydrofluorocarbons(HFCs),perfluorocarbons (PFCs),andsulfurhexafluoride(SF6), which are generated by a variety of indus-trial processes and do not exist in nature. HFCs were introduced to replace chlorofluorocarbons(CFCs) and hydrochlorofluorocarbons (HCFCs),which were targeted for phase-out under the Mon-treal Protocol due to their ozone-depleting char-acteristics. Statewide, total F-gas emissions were reduced by 57 percent from 1990 through 2013, as CFCs and HCFCs began to be phased out to pro-tect the stratospheric ozone layer. However, emis-sions of HFCs, which were introduced to replace CFCs and HCFCs in many refrigeration and air
conditioning applications, have increased great-ly over the past 20 years. To reduce future HFC emissions, in October 2016, international nego-tiators reached an important binding agreement, amending the 1987 Montreal Protocol, to phase out the production and use of HFCs. in addition, some 50 nations, including the U.S. and 50-plus partner organizations, have joined the Climate and Clean air Coalition to reduce Short-lived Climate Pollutants.
To reduce F-gas emissions, the air District will continue to support regulations that restrict the production, purchase and sale of high-GWP refrig-erants as new low-GWP refrigerants are brought to market. Current regulations for existing com-mercial and industrial refrigeration systems also need to be enforced and strengthened to further reduce leaks of F-gases. To that end, the air Dis-trict will continue to enforce arB regulations to control HFC emissions from commercial refrigera-tion systems in the Bay area.
incentivizing early adoption of low-GWP refriger-antsinnewequipmentandretrofitsusedincom-mercial, industrial and residential sectors can also play an important role. To eliminate high-GWP refrigerants in motor vehicle air conditioning sys-tems, the air District promotes measures such as accelerating the turnover of older vehicles through its vehicle buy back program. low-GWP refriger-ants for automobiles are available now and will be required in new cars sold in the U.S. starting in 2021. The air District also encourages better re-covery, reclamation and recycling of refrigerants from all mobile and stationary refrigeration and air conditioning systems. in addition, the air District will provide technical assistance to encourage lo-cal agencies to include appropriate measures to reduce super-GHG emissions in their climate ac-tion plans.
Table 5-9 provides a brief description of the pro-posed super-GHG measures. Measures to reduce super-GHG emissions are also included in Table 5-1 (stationary source sector), Table 5-5 (agriculture sector), and Table 5-7 (waste management sector).
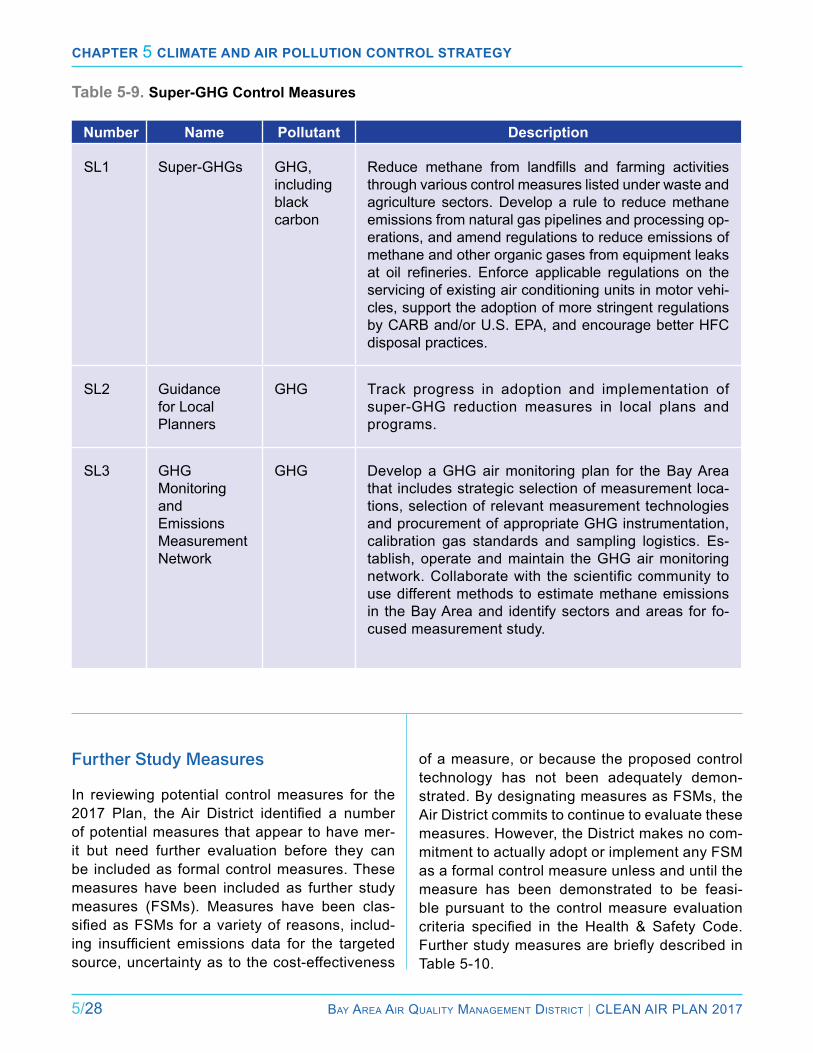
Chapter 5 Climate and air pollution Control Strategy
5/28 Bay area air Quality ManageMent District | Clean air Plan 2017
Number Name Pollutant Description
Sl1 Super-GHGs GHG, including black carbon
Reduce methane from landfills and farming activitiesthrough various control measures listed under waste and agriculture sectors. Develop a rule to reduce methane emissions from natural gas pipelines and processing op-erations, and amend regulations to reduce emissions of methane and other organic gases from equipment leaks at oil refineries. Enforce applicable regulations on theservicing of existing air conditioning units in motor vehi-cles, support the adoption of more stringent regulations by CarB and/or U.S. ePa, and encourage better HFC disposal practices.
Sl2 Guidance for local Planners
GHG Track progress in adoption and implementation of super-GHG reduction measures in local plans and programs.
Sl3 GHG Monitoring and emissions Measurement network
GHG Develop a GHG air monitoring plan for the Bay area that includes strategic selection of measurement loca-tions, selection of relevant measurement technologies and procurement of appropriate GHG instrumentation, calibration gas standards and sampling logistics. es-tablish, operate and maintain the GHG air monitoring network.Collaboratewith thescientificcommunity touse different methods to estimate methane emissions in the Bay area and identify sectors and areas for fo-cused measurement study.
Table 5-9. Super-GHG Control Measures
Further Study Measures
in reviewing potential control measures for the 2017 Plan, theAir District identified a numberof potential measures that appear to have mer-it but need further evaluation before they can be included as formal control measures. These measures have been included as further study measures (FSMs). Measures have been clas-sifiedasFSMsforavarietyof reasons, includ-ing insufficient emissions data for the targetedsource, uncertainty as to the cost-effectiveness
of a measure, or because the proposed control technology has not been adequately demon-strated. By designating measures as FSMs, the air District commits to continue to evaluate these measures. However, the District makes no com-mitment to actually adopt or implement any FSM as a formal control measure unless and until the measure has been demonstrated to be feasi-ble pursuant to the control measure evaluation criteria specified in the Health & Safety Code.FurtherstudymeasuresarebrieflydescribedinTable 5-10.
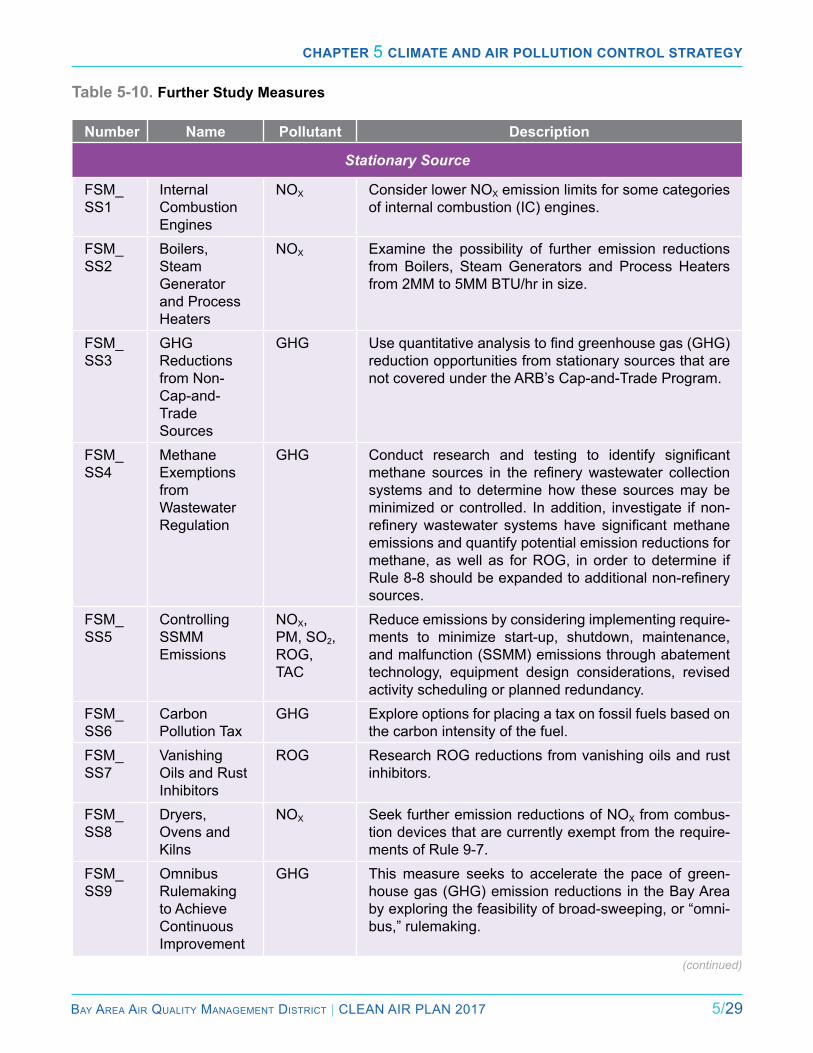
Chapter 5 Climate and air pollution Control Strategy
Bay area air Quality ManageMent District | Clean air Plan 2017 5/29
Table 5-10. Further Study Measures
Number Name Pollutant Description
Stationary Source
FSM_SS1
internal Combustion engines
nOX Consider lower nOX emission limits for some categories of internal combustion (iC) engines.
FSM_SS2
Boilers, Steam Generator and Process Heaters
nOX examine the possibility of further emission reductions from Boilers, Steam Generators and Process Heaters from 2MM to 5MM BTU/hr in size.
FSM_SS3
GHG reductions from non-Cap-and-Trade Sources
GHG Usequantitativeanalysistofindgreenhousegas(GHG)reduction opportunities from stationary sources that are not covered under the arB’s Cap-and-Trade Program.
FSM_SS4
Methane exemptions from Wastewater regulation
GHG Conduct research and testing to identify significantmethane sources in the refinerywastewater collectionsystems and to determine how these sources may be minimized or controlled. in addition, investigate if non- refinerywastewater systems have significantmethaneemissions and quantify potential emission reductions for methane, as well as for rOG, in order to determine if Rule8-8shouldbeexpandedtoadditionalnon-refinerysources.
FSM_SS5
Controlling SSMM emissions
nOX, PM, SO2, rOG, TaC
reduce emissions by considering implementing require-ments to minimize start-up, shutdown, maintenance, and malfunction (SSMM) emissions through abatement technology, equipment design considerations, revised activity scheduling or planned redundancy.
FSM_SS6
Carbon Pollution Tax
GHG explore options for placing a tax on fossil fuels based on the carbon intensity of the fuel.
FSM_SS7
Vanishing Oils and rust inhibitors
rOG research rOG reductions from vanishing oils and rust inhibitors.
FSM_SS8
Dryers, Ovens and Kilns
nOX Seek further emission reductions of nOX from combus-tion devices that are currently exempt from the require-ments of rule 9-7.
FSM_SS9
Omnibus rulemaking to achieve Continuous improvement
GHG This measure seeks to accelerate the pace of green-house gas (GHG) emission reductions in the Bay area by exploring the feasibility of broad-sweeping, or “omni-bus,” rulemaking.
(continued)
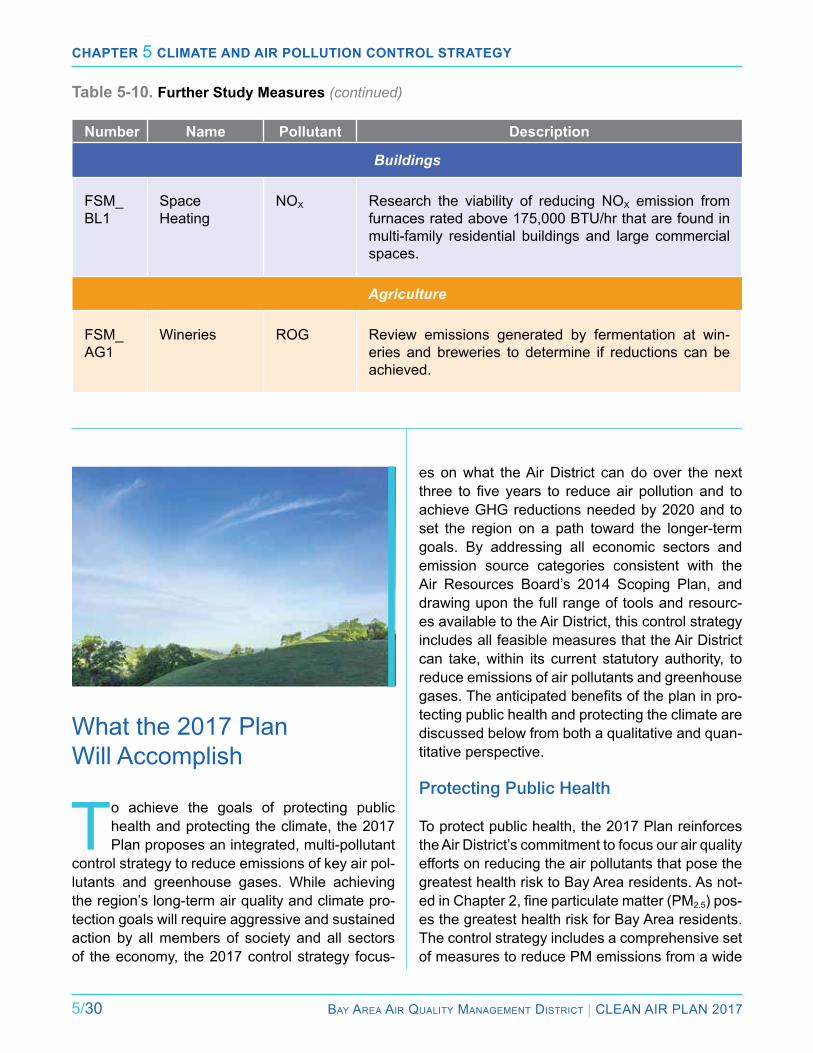
Chapter 5 Climate and air pollution Control Strategy
5/30 Bay area air Quality ManageMent District | Clean air Plan 2017
Number Name Pollutant Description
Buildings
FSM_Bl1
Space Heating
nOX research the viability of reducing nOX emission from furnaces rated above 175,000 BTU/hr that are found in multi-family residential buildings and large commercial spaces.
Agriculture
FSM_aG1
Wineries rOG review emissions generated by fermentation at win-eries and breweries to determine if reductions can be achieved.
Table 5-10. Further Study Measures (continued)
What the 2017 Plan Will accomplish
To achieve the goals of protecting public health and protecting the climate, the 2017 Plan proposes an integrated, multi-pollutant
control strategy to reduce emissions of key air pol-lutants and greenhouse gases. While achieving the region’s long-term air quality and climate pro-tection goals will require aggressive and sustained action by all members of society and all sectors of the economy, the 2017 control strategy focus-
es on what the air District can do over the next three to five years to reduceair pollutionand toachieve GHG reductions needed by 2020 and to set the region on a path toward the longer-term goals. By addressing all economic sectors and emission source categories consistent with the air resources Board’s 2014 Scoping Plan, and drawing upon the full range of tools and resourc-es available to the air District, this control strategy includes all feasible measures that the air District can take, within its current statutory authority, to reduce emissions of air pollutants and greenhouse gases.Theanticipatedbenefitsoftheplaninpro-tecting public health and protecting the climate are discussed below from both a qualitative and quan-titative perspective.
Protecting Public Health
To protect public health, the 2017 Plan reinforces the air District’s commitment to focus our air quality efforts on reducing the air pollutants that pose the greatest health risk to Bay area residents. as not-edinChapter2,fineparticulatematter(PM2.5) pos-es the greatest health risk for Bay area residents. The control strategy includes a comprehensive set of measures to reduce PM emissions from a wide
Chapter 5 Climate and air pollution Control Strategy
Bay area air Quality ManageMent District | Clean air Plan 2017 5/31
The 2017 Plan also represents a concerted effort to reduce
multiple pollutants from the Bay Area’s five oil refineries.
range of emission sources. For stationary sources alone, the control strategy includes the following measures that will help to reduce emissions of PM and/or PM precursors: SS1, SS4, SS7, SS8, SS11, SS18, SS19, SS24, SS31, SS32, SS33, SS34, SS35, SS36, SS37 and SS38.
The control strategy also focuses on reducing emissions and population exposure in the Bay area communities that are most impacted by air pollution. For example, the proposed control measures to further reduce emissions of partic-ulate matter and toxic air contaminants from key sources,suchasoilrefineries(seemeasuresSS1through SS12), diesel engines (see measures SS32, Tr18 and Tr19), and wood burning (see measure SS34), will all help to reduce population exposure to the most harmful air pollutants in the impacted communities. To protect these commu-nities, the air District will also prioritize implemen-tation of measures to reduce toxics from new and existing facilities (SS20 and SS21). in addition to reducing disparities in health risks between com-munities, the control strategy also aims to advance equity in a broader sense. For example, as dis-cussed above, by promoting urban tree-planting, control measure nW2 can help to clean the air, mitigate local heat island effects, and improve the overall quality of life in impacted communities. The 2017 Plan also represents a concerted effort to reduce multiple pollutants from the Bay area’s fiveoilrefineries.Atleast12controlmeasuresinthisplanaredesignedtoreducerefineryemissions
of particulate matter, ozone precursors, toxic air contaminants and GHGs. in addition to directly re-ducingemissions,theAirDistrict’sRefineryEmis-sions reduction Strategy also addresses these emissions through monitoring, best practices and health risk assessments. Building upon previous refineryregulations,thissetofmeasures,takenasa whole, constitutes one of the most aggressive strategies to reduceoil refineryemissions in thecountry.
emissions of rOG, nOX and PM2.5 have been de-creasing steadily over the past several decades, in response to existing regulations and policies, and turnoverinthemotorvehiclefleet.The2017con-trol strategy will provide additional emission reduc-tions, over and above any built-in emission reduc-tions from the existing control program in future years. in aggregate, the proposed control mea-sures are expected to reduce emissions of rOG by 12 tons per day, nOX by 8.8 tons per day, and PM2.5 by 2.8 tons per day in 2030. (actual emission reductions are expected to be higher, because air District staff has not yet been able to estimate the emission reduction for a number of measures.) Theestimatedhealthbenefitsofthereductionsinemissions of ozone precursors, particulate matter, and toxic air contaminants from the proposed con-trol strategy as a whole, based on the multi-pol-lutant evaluation method (MPeM) described in appendix C, are shown in the “Cases avoided” column in Table 5-11. The table also provides the estimated dollar value of the health costs and pre-mature mortality that will be avoided as a result of the reduction in emissions, based on the valua-tions described in appendix C. The total estimated benefitintermsofreducedincidenceofillnessandpremature mortality is on the order of $702 million per year. Because there is a high cost associat-edwithprematuremortality,andexposuretofineparticulate matter (PM2.5) accounts for nearly all the premature mortality, reductions in emissions of PM2.5 and PM precursors (such as ammonia and sulfur dioxide) account for the majority of the esti-matedvalueofthehealthbenefits.
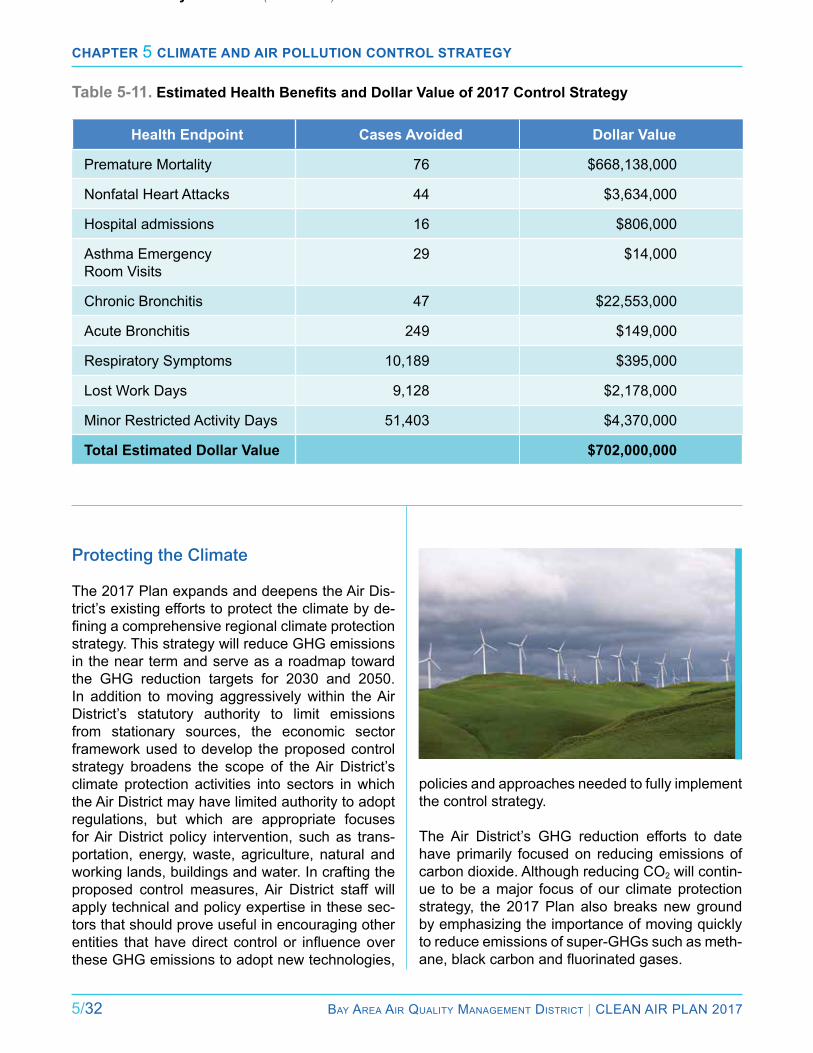
Chapter 5 Climate and air pollution Control Strategy
5/32 Bay area air Quality ManageMent District | Clean air Plan 2017
Table 5-10. Further Study Measures (continued)
Table 5-11. Estimated Health Benefits and Dollar Value of 2017 Control Strategy
Health Endpoint Cases Avoided Dollar Value
Premature Mortality 76 $668,138,000
nonfatal Heart attacks 44 $3,634,000
Hospital admissions 16 $806,000
asthma emergency room Visits
29 $14,000
Chronic Bronchitis 47 $22,553,000
acute Bronchitis 249 $149,000
respiratory Symptoms 10,189 $395,000
lost Work Days 9,128 $2,178,000
Minor restricted activity Days 51,403 $4,370,000
Total Estimated Dollar Value $702,000,000
Protecting the Climate
The 2017 Plan expands and deepens the air Dis-trict’s existing efforts to protect the climate by de-finingacomprehensiveregionalclimateprotectionstrategy. This strategy will reduce GHG emissions in the near term and serve as a roadmap toward the GHG reduction targets for 2030 and 2050. in addition to moving aggressively within the air District’s statutory authority to limit emissions from stationary sources, the economic sector framework used to develop the proposed control strategy broadens the scope of the air District’s climate protection activities into sectors in which the air District may have limited authority to adopt regulations, but which are appropriate focuses for air District policy intervention, such as trans-portation, energy, waste, agriculture, natural and working lands, buildings and water. in crafting the proposed control measures, air District staff will apply technical and policy expertise in these sec-tors that should prove useful in encouraging other entities thathavedirectcontrolor influenceoverthese GHG emissions to adopt new technologies,
policies and approaches needed to fully implement the control strategy.
The air District’s GHG reduction efforts to date have primarily focused on reducing emissions of carbon dioxide. although reducing CO2 will contin-ue to be a major focus of our climate protection strategy, the 2017 Plan also breaks new ground by emphasizing the importance of moving quickly to reduce emissions of super-GHGs such as meth-ane,blackcarbonandfluorinatedgases.
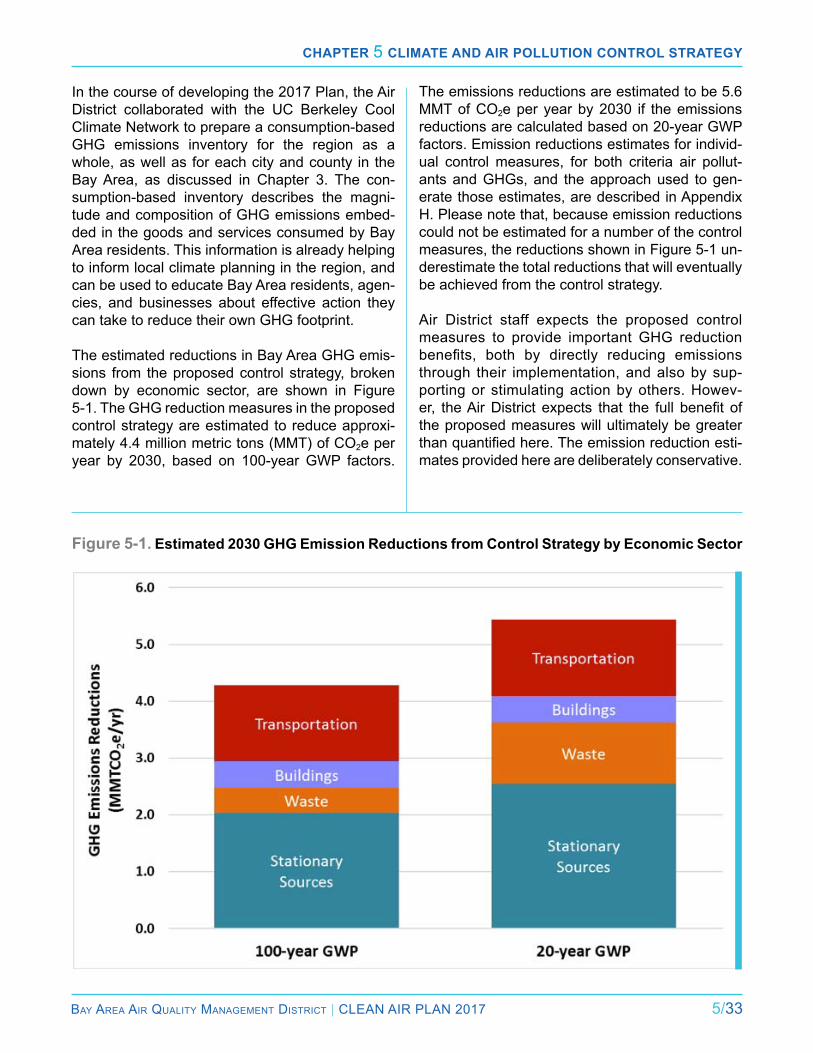
Chapter 5 Climate and air pollution Control Strategy
Bay area air Quality ManageMent District | Clean air Plan 2017 5/33
in the course of developing the 2017 Plan, the air District collaborated with the UC Berkeley Cool Climate network to prepare a consumption-based GHG emissions inventory for the region as a whole, as well as for each city and county in the Bay area, as discussed in Chapter 3. The con-sumption-based inventory describes the magni-tude and composition of GHG emissions embed-ded in the goods and services consumed by Bay area residents. This information is already helping to inform local climate planning in the region, and can be used to educate Bay area residents, agen-cies, and businesses about effective action they can take to reduce their own GHG footprint.
The estimated reductions in Bay area GHG emis-sions from the proposed control strategy, broken down by economic sector, are shown in Figure 5-1. The GHG reduction measures in the proposed control strategy are estimated to reduce approxi-mately 4.4 million metric tons (MMT) of CO2e per year by 2030, based on 100-year GWP factors.
The emissions reductions are estimated to be 5.6 MMT of CO2e per year by 2030 if the emissions reductions are calculated based on 20-year GWP factors. emission reductions estimates for individ-ual control measures, for both criteria air pollut-ants and GHGs, and the approach used to gen-erate those estimates, are described in appendix H. Please note that, because emission reductions could not be estimated for a number of the control measures, the reductions shown in Figure 5-1 un-derestimate the total reductions that will eventually be achieved from the control strategy.
air District staff expects the proposed control measures to provide important GHG reduction benefits, both by directly reducing emissionsthrough their implementation, and also by sup-porting or stimulating action by others. Howev-er, theAirDistrict expects that the full benefit ofthe proposed measures will ultimately be greater thanquantifiedhere.Theemissionreductionesti-mates provided here are deliberately conservative.
Figure 5-1. Estimated 2030 GHG Emission Reductions from Control Strategy by Economic Sector
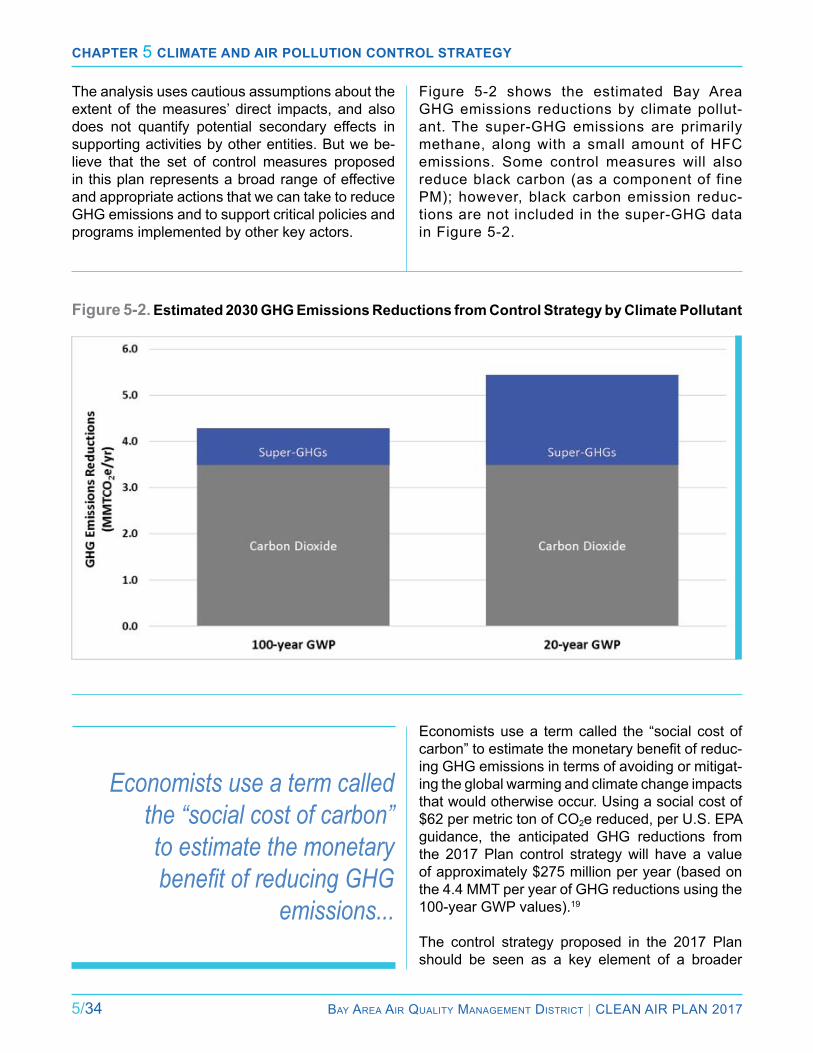
Chapter 5 Climate and air pollution Control Strategy
5/34 Bay area air Quality ManageMent District | Clean air Plan 2017
Figure 5-2 shows the estimated Bay area GHG emissions reductions by climate pollut-ant. The super-GHG emissions are primarily methane, along with a small amount of HFC emissions. Some control measures will also reduce black carbon (as a component of fine PM); however, black carbon emission reduc-tions are not included in the super-GHG data in Figure 5-2.
Figure 5-2. Estimated 2030 GHG Emissions Reductions from Control Strategy by Climate Pollutant
The analysis uses cautious assumptions about the extent of the measures’ direct impacts, and also does not quantify potential secondary effects in supporting activities by other entities. But we be-lieve that the set of control measures proposed in this plan represents a broad range of effective and appropriate actions that we can take to reduce GHG emissions and to support critical policies and programs implemented by other key actors.
Economists use a term called the “social cost of carbon” to estimate the monetary benefit of reducing GHG
emissions...
economists use a term called the “social cost of carbon”toestimatethemonetarybenefitofreduc-ing GHG emissions in terms of avoiding or mitigat-ing the global warming and climate change impacts that would otherwise occur. Using a social cost of $62 per metric ton of CO2e reduced, per U.S. ePa guidance, the anticipated GHG reductions from the 2017 Plan control strategy will have a value of approximately $275 million per year (based on the 4.4 MMT per year of GHG reductions using the 100-year GWP values).19
The control strategy proposed in the 2017 Plan should be seen as a key element of a broader
Chapter 5 Climate and air pollution Control Strategy
Bay area air Quality ManageMent District | Clean air Plan 2017 5/35
region-wide effort on the part of public agencies, academic institutions, the business community, and environmental and community groups, and the public to reduce Bay area GHG emissions and protect the climate. as noted in Chapter 4, the Plan Bay Area: Sustainable Communities Strate-gy, which was adopted by MTC and aBaG in 2013 and is currently being updated, will play an import-ant role in integrating land use and transportation planning so as to reduce motor vehicle travel. in addition, the local climate action plans that have been adopted by more than 60 cities and counties throughout the Bay area are another critical ele-ment of the overall regional effort to reduce GHG emissions and protect the climate. The control measures described in this plan, in combination with the state, regional, and local efforts summarized in Chapter 4, will help to move the Bay area closer to the trajectory need-ed to achieve the long-range GHG reduction tar-gets for years 2030 and 2050. The air resourc-es Board is also in the process of updating the aB 32 Scoping Plan and estimating the antici-pated emissions reductions from that plan. The air District will continue to work with arB and other key partners in evaluating the impacts of climate protection programs.
The control strategy described in the 2017 Plan should serve as a solid foundation to guide our efforts to reduce emissions of air pollutants and GHGsover thenextfive to tenyears.However,achieving the long-range GHG reduction targets will require a collaborative effort on the part of government agencies, the business communi-ty, and Bay area residents to make fundamental changes to our economy and energy systems, as described in the Vision for 2050 that introduces this document.
implementation— Key Priorities
To implement the control measures in the 2017 Plan, the air District will use the full range of its tools and resources. For the pur-
pose of prioritizing the implementation of the con-
trol measures in the 2017 Plan, the air District will consider the potential of each measure to:
● improve air quality in impacted communities.
● reduce GHG emissions, especially in the near term (e.g. measures to reduce super-GHG emissions).
● reduce multiple pollutants on a cost-effective basis (see Table H-1 in appendix H).
● Serve as a model or example that can be rep-licated in other regions.
Based upon these criteria, the air District will pri-oritize the implementation of control measures so as to maximize progress toward four key themes:
● reduce emissions of criteria air pollutants and toxic air contaminants from all key sources.
● reduce emissions of super-GHGs with high global warming potential, such as methane.
● reduce demand for fossil fuels.
▪ Increaseefficiencyofenergy,buildings,and transportation sectors.
▪ reduce demand for vehicle travel, and high-carbon goods and services.
● Decarbonize our energy system.
▪ Make the electricity supply carbon-free.
▪ electrify the transportation and building sectors.
Chapter 5 Climate and air pollution Control Strategy
5/36 Bay area air Quality ManageMent District | Clean air Plan 2017
Reduce Criteria Air Pollutants and TACs
as indicated in the above section Protecting Public Health, the 2017 Plan includes a comprehensive set of measures to reduce criteria pollutants, par-ticulate matter and toxic air contaminants. a dozen measuresfocusspecificallyontheBayArea’sfiveoilrefineriesandsupportingoperations.Therefin-ery measures are part of a regional effort to reduce both criteria pollutants and health risks to local communities from TaCs by 20 percent by 2020. To that end, over the next few years, the air District will be prioritizing rules to reduce emissions at re-fineriesandsupportingoperations.Theseincludenew rules on sulfur recovery units (SS5), sulfuric acidplants(SS7),refineryfuelgas(SS6)andfluidcatalytic cracking units (SS1).
reducing particulate matter, including diesel PM, will be prioritized through measures to reduce emissions from diesel engines (SS32, Tr18 and Tr19), measures that further limit and control a variety of sources of PM, including the handling of coke and coal (SS31, SS35, SS36 and SS37) and through further limits on wood burning (SS34). These measures will reduce population exposure to the most harmful air pollutants in the Bay area’s most impacted communities.
additionally, over the next two years, two inno-vative measures in the control strategy will be implemented to target existing and new sources of TaCs. These measures will ensure that exist-ing facilities that emit TaCs do not pose an unac-ceptable health risk to nearby residents, workers, and/or students (SS20) and that the air District isusingthemostup-to-datescientificinformationand procedures to assess health impacts for new projects (SS21).
Reduce Emissions of Super-GHGs
as discussed in Chapter 3, reducing emissions of super-GHG with high global warming potential, includingmethane, black carbon and fluorinatedgases (F-gases), provides an effective way to de-crease GHG emissions and slow the rate of global warming in the near term. Methane is the second largest climate pollutant in the regional GHG inventory. Key sources of
methaneintheBayAreaincludelandfills,thepro-duction and distribution of oil and natural gas and agriculture (animal husbandry). The air District will prioritize implementation of control measures that address methane in stationary sources, including:
● Control measure SS16: ‘Basin-Wide Methane Strategy,’ which would serve as a stop-gap measure to prohibit methane leaks previously excluded as a regulated pollutant; and
● Control measure SS15: ‘natural Gas Process-ing and Distribution,’ which involves working with the California Public Utilities Commission (CPUC) to reduce methane emissions from the natural gas processing, storage and distribu-tion network in the Bay area.
in addition, the air District will target methane emissions from waste and agriculture by:
● Tightening rules on landfills and compostingfacilities (Wa1, Wa2);
● Working with local governments to limit organ-icmaterialsfromlandfills(WA3);and
● Working with wastewater treatment facilities (Wr1) and dairy farmers (aG2, aG4).
Black carbon, another potent climate pollutant, is a component of PM. Diesel engines and wood smoke are key sources of black carbon in the Bay area. The air District has been working hard over the past 10 to 15 years to reduce emissions of die-sel PM and wood smoke through a combination of regulation, public education and incentives. The control strategy in this plan will enhance these ef-forts through a variety of control measures to further reduce PM emissions, such as SS33 and SS34. To reduce emissions of F-gases, the air District will continue to enforce statewide regulations limiting emissions of F-gases as discussed in Chapter 4.
Reduce Demand for Fossil Fuels
The most direct and cost-effective way to reduce fossil fueluse is to increasetheefficiencyofourenergy, transportation and distribution systems, and to reduce demand for vehicle travel, and high-carbon goods and services.
Chapter 5 Climate and air pollution Control Strategy
Bay area air Quality ManageMent District | Clean air Plan 2017 5/37
Control measure SS18 will limit combustion of fos-sil fuels at stationary sources (refineries, powerplants, cement plants and other industries) by ap-plying a “basin-wide combustion strategy” that will prioritize sources based on the magnitude of their emissions, analyze the efficiency of combustionprocesses, and optimize energy-efficiency in theproduction process. in addition, control measure SS12 is intended to prevent any future increases in GHG emissions fromBayAreaoilrefineriesbycappingGHGemis-sions for each facility based upon the GHG emis-sions from its current level of production.
To reduce fossil fuel emissions from electricity production, the air District will work with local gov-ernments topromoteenergyefficiencyprogramsvia best practices, model ordinances and techni-cal support, as well as support efforts to decrease electricity use during periods of peak demand, as described in control measure en2.
The transportation measures in this plan describe a comprehensive strategy to decrease motor vehi-cle use by promoting the use of alternative modes of travel, including transit, bicycling, walking, ride-sharing and carsharing; reducing emissions from heavy-duty vehicles such as freight trucks; and en-couraging “smart driving” to improve fuel econo-my. These measures complement and support the Plan Bay Area: Sustainable Communities Strate-gy, adopted by MTC and aBaG, which lays out the region’s planning framework to reduce motor vehi-cle miles traveled (see Chapter 4). in addition to reducing direct tailpipe emissions of CO2, the measures to decrease motor vehicle travel will also reduce upstream emissions of cri-teriaairpollutants,TACs,andGHGsfromoilrefin-ing by reducing demand for gasoline and diesel. Therefore, the transportation measures can both directly and indirectly reduce population exposure to air pollutants in the Bay area’s most vulnerable communities.
The air District’s consumption-based GHG inven-tory(describedinChapter3)alsoidentifiesoppor-tunities to reduce GHG emissions by decreasing demand for GHG-intensive goods and services.
For example, food production is a GHG-intensive sector, generating emissions of carbon dioxide, methane and nitrous oxides. Through its public education efforts, the air District can encourage Bay area residents to increase their consumption of low-carbon foods and reduce food waste, and work with local governments to ensure that all food wasteisdivertedfromlandfillstocompostorotherproductive uses.
Decarbonize Our Energy System
To achieve long-range GHG reduction targets, it will be essential to decarbonize our energy sys-tems by intensifying existing programs and poli-cies to reduce the carbon content of our electricity supply. This, in turn, facilitates the transition from fossil fuels to low-carbon electricity for purposes of powering our vehicles and heating our homes.
The air District will primarily focus on advanc-ing decarbonization efforts through the following methods:
● Support switching fossil fuel end-uses to ener-gyefficiencyandrenewableelectricityinexist-ing buildings.
● incentivize electric vehicles and infrastructure.
Low-Carbon Electricity: To further reduce the carbon content of our electricity supply, the air Dis-trict will collaborate with energy providers to maxi-mize the amount of renewable energy in the elec-tricity produced and consumed in the Bay area, as described in measure en1.
Decarbonize Buildings: To achieve the long-range GHG reduction targets, existing residential and commercial buildings will need to switch from fossil fuels to low-carbon electricity (or ground-source heat pumps) for space heating and wa-ter heating. The air District will help to accelerate this transition by implementing control measures Bl1: Green Buildings, and Bl2: Decarbonize Buildings,which prioritize energy efficiency andrenewable energy sources through a combi-nation of incentives and technical assistance to local governments, such as providing model ordinances, best practices and technical guid-ance. additionally, the air District will continue its
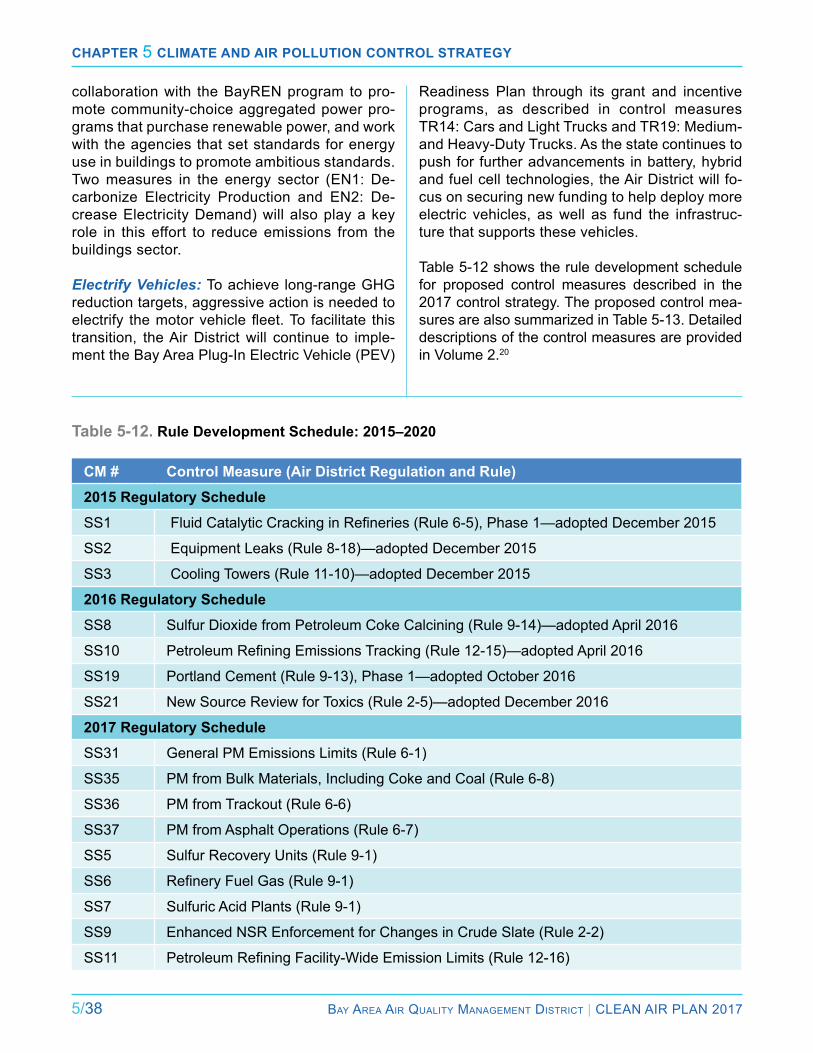
Chapter 5 Climate and air pollution Control Strategy
5/38 Bay area air Quality ManageMent District | Clean air Plan 2017
collaboration with the Bayren program to pro-mote community-choice aggregated power pro-grams that purchase renewable power, and work with the agencies that set standards for energy use in buildings to promote ambitious standards. Two measures in the energy sector (en1: De-carbonize electricity Production and en2: De-crease electricity Demand) will also play a key role in this effort to reduce emissions from the buildings sector.
Electrify Vehicles: To achieve long-range GHG reduction targets, aggressive action is needed to electrify themotorvehiclefleet.To facilitate thistransition, the air District will continue to imple-ment the Bay area Plug-in electric Vehicle (PeV)
readiness Plan through its grant and incentive programs, as described in control measures Tr14: Cars and light Trucks and Tr19: Medium- and Heavy-Duty Trucks. as the state continues to push for further advancements in battery, hybrid and fuel cell technologies, the air District will fo-cus on securing new funding to help deploy more electric vehicles, as well as fund the infrastruc-ture that supports these vehicles. Table 5-12 shows the rule development schedule for proposed control measures described in the 2017 control strategy. The proposed control mea-sures are also summarized in Table 5-13. Detailed descriptions of the control measures are provided in Volume 2.20
CM # Control Measure (Air District Regulation and Rule)
2015 Regulatory Schedule
SS1 FluidCatalyticCrackinginRefineries(Rule6-5),Phase1—adoptedDecember2015
SS2 equipment leaks (rule 8-18)—adopted December 2015
SS3 Cooling Towers (rule 11-10)—adopted December 2015
2016 Regulatory Schedule
SS8 Sulfur Dioxide from Petroleum Coke Calcining (rule 9-14)—adopted april 2016
SS10 PetroleumRefiningEmissionsTracking(Rule12-15)—adoptedApril2016
SS19 Portland Cement (rule 9-13), Phase 1—adopted October 2016
SS21 new Source review for Toxics (rule 2-5)—adopted December 2016
2017 Regulatory Schedule
SS31 General PM emissions limits (rule 6-1)
SS35 PM from Bulk Materials, including Coke and Coal (rule 6-8)
SS36 PM from Trackout (rule 6-6)
SS37 PM from asphalt Operations (rule 6-7)
SS5 Sulfur recovery Units (rule 9-1)
SS6 RefineryFuelGas(Rule9-1)
SS7 Sulfuric acid Plants (rule 9-1)
SS9 enhanced nSr enforcement for Changes in Crude Slate (rule 2-2)
SS11 PetroleumRefiningFacility-WideEmissionLimits(Rule12-16)
Table 5-12. Rule Development Schedule: 2015–2020
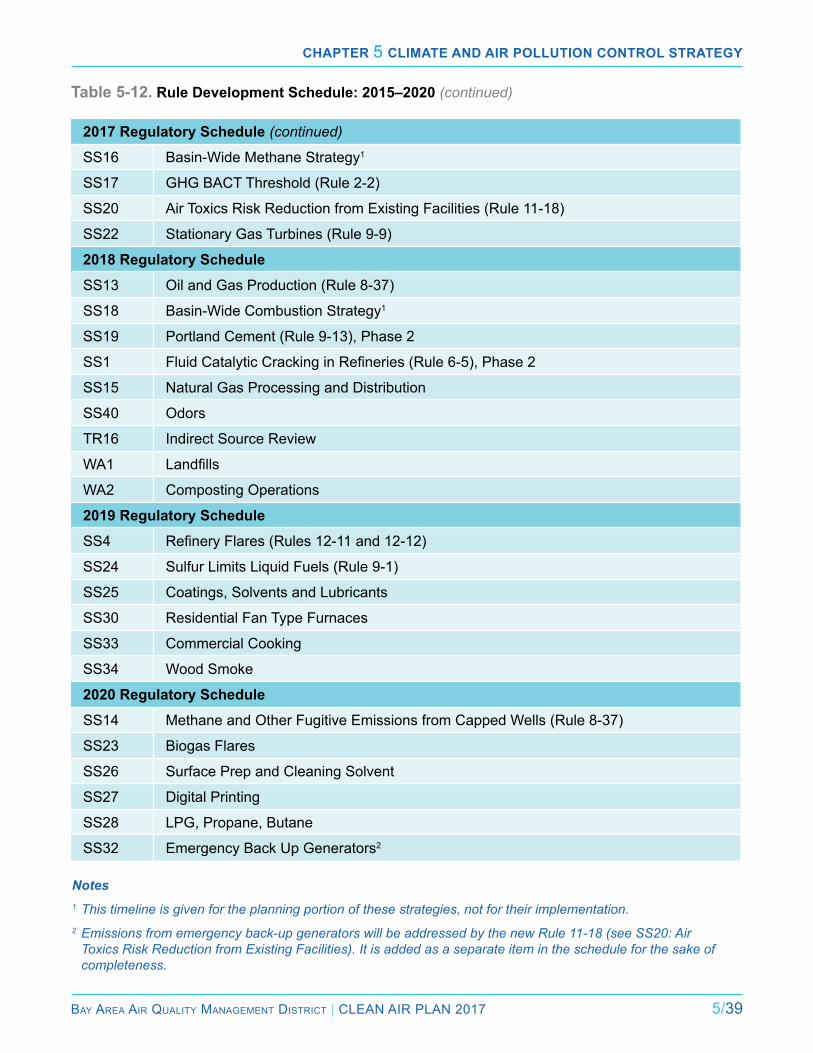
Chapter 5 Climate and air pollution Control Strategy
Bay area air Quality ManageMent District | Clean air Plan 2017 5/39
Table 5-12. Rule Development Schedule: 2015–2020 (continued)
2017 Regulatory Schedule (continued)
SS16 Basin-Wide Methane Strategy1
SS17 GHG BaCT Threshold (rule 2-2)
SS20 air Toxics risk reduction from existing Facilities (rule 11-18)
SS22 Stationary Gas Turbines (rule 9-9)
2018 Regulatory Schedule
SS13 Oil and Gas Production (rule 8-37)
SS18 Basin-Wide Combustion Strategy1
SS19 Portland Cement (rule 9-13), Phase 2
SS1 FluidCatalyticCrackinginRefineries(Rule6-5),Phase2
SS15 natural Gas Processing and Distribution
SS40 Odors
Tr16 indirect Source review
Wa1 Landfills
Wa2 Composting Operations
2019 Regulatory Schedule
SS4 RefineryFlares(Rules12-11and12-12)
SS24 Sulfur limits liquid Fuels (rule 9-1)
SS25 Coatings, Solvents and lubricants
SS30 residential Fan Type Furnaces
SS33 Commercial Cooking
SS34 Wood Smoke
2020 Regulatory Schedule
SS14 Methane and Other Fugitive emissions from Capped Wells (rule 8-37)
SS23 Biogas Flares
SS26 Surface Prep and Cleaning Solvent
SS27 Digital Printing
SS28 lPG, Propane, Butane
SS32 emergency Back Up Generators2
Notes1 This timeline is given for the planning portion of these strategies, not for their implementation.2 Emissions from emergency back-up generators will be addressed by the new Rule 11-18 (see SS20: Air
Toxics Risk Reduction from Existing Facilities). It is added as a separate item in the schedule for the sake of completeness.
Chapter 5 Climate and air pollution Control Strategy
5/40 Bay area air Quality ManageMent District | Clean air Plan 2017
Conclusion
We have made great progress in improv-ing Bay area air quality in recent de-cades, but more work is needed. air
pollution still has negative effects on public health, there are still disparities in health risk from air pol-lution among Bay area communities, and climate change represents a major threat to air quality and to the health and well-being of Bay area residents. To address these challenges, the 2017 Plan de-scribes a comprehensive multi-pollutant control strategy to protect public health and to protect the climate by reducing emissions of criteria air pol-lutants, TaCs, and GHGs in all economic sectors. The control strategy builds on the success of air District’s existing regulatory, incentive and pub-lic outreach programs, and makes use of the full range of the air District’s tools and resources. The Plan will continue to reduce emissions and ambi-ent concentrations of ozone and PM, and to de-crease population exposure to the most harmful airpollutants, suchasfinePMandTACs, in im-pacted communities.
recognizing that the Bay area is highly vulnerable to the impacts of climate change, the 2017 Plan describes a comprehensive strategy to reduce GHG emissions in the near term, and a vision of how a “post-carbon” Bay area may look in 2050 to guide our actions over the longer term. The 2017 Plan represents the air District’s best effort
to use its tools and resources to directly reduce Bay area GHG emissions, while also working to support and enhance the GHG reduction efforts that are being implemented by partner agencies at the state, regional and local levels. We hope that the impactof thisplancanbemagnifiedbyproviding a model that will inspire action in other regions and metropolitan areas across the nation and around the world.
no single agency or plan can solve the global warming problem on its own. achieving the criti-cal transformation to a post-carbon economy will require a collaborative effort on the part of gov-ernmental agencies at all levels, business and in-dustry, community and environmental groups, ed-ucational institutions and Bay area residents. The Bay area has all the necessary attributes that we need to tackle the climate challenge. We are one of the most socially and technologically innovative regions in the world, with a strong environmental ethos, world-class academic institutions, and pro-gressive leadership in business and government. By rising to the challenge, we can not only pro-tect the environment and quality of life that makes the Bay area a great place to live, but also ensure that the Bay area leads the way in developing and adopting the new technologies and innovations needed to address the climate challenge.
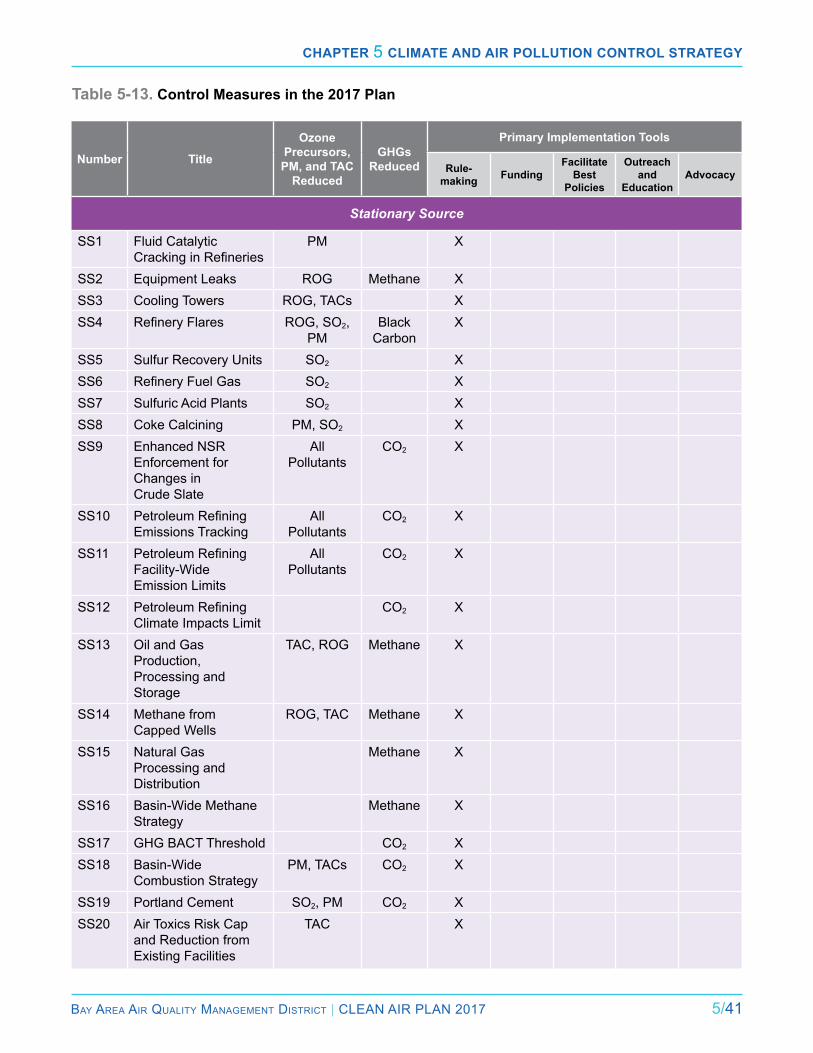
Chapter 5 Climate and air pollution Control Strategy
Bay area air Quality ManageMent District | Clean air Plan 2017 5/41
Table 5-13. Control Measures in the 2017 Plan
Number Title
Ozone Precursors, PM, and TAC
Reduced
GHGs Reduced
Primary Implementation Tools
Rule- making Funding
Facilitate Best
Policies
Outreach and
EducationAdvocacy
Stationary Source
SS1 Fluid Catalytic CrackinginRefineries
PM X
SS2 equipment leaks rOG Methane XSS3 Cooling Towers rOG, TaCs XSS4 RefineryFlares rOG, SO2,
PMBlack
CarbonX
SS5 Sulfur recovery Units SO2 XSS6 RefineryFuelGas SO2 XSS7 Sulfuric acid Plants SO2 XSS8 Coke Calcining PM, SO2 XSS9 enhanced nSr
enforcement for Changes in Crude Slate
all Pollutants
CO2 X
SS10 PetroleumRefiningemissions Tracking
all Pollutants
CO2 X
SS11 PetroleumRefiningFacility-Wide emission limits
all Pollutants
CO2 X
SS12 PetroleumRefiningClimate impacts limit
CO2 X
SS13 Oil and Gas Production, Processing and Storage
TaC, rOG Methane X
SS14 Methane from Capped Wells
rOG, TaC Methane X
SS15 natural Gas Processing and Distribution
Methane X
SS16 Basin-Wide Methane Strategy
Methane X
SS17 GHG BaCT Threshold CO2 XSS18 Basin-Wide
Combustion StrategyPM, TaCs CO2 X
SS19 Portland Cement SO2, PM CO2 XSS20 air Toxics risk Cap
and reduction from existing Facilities
TaC X
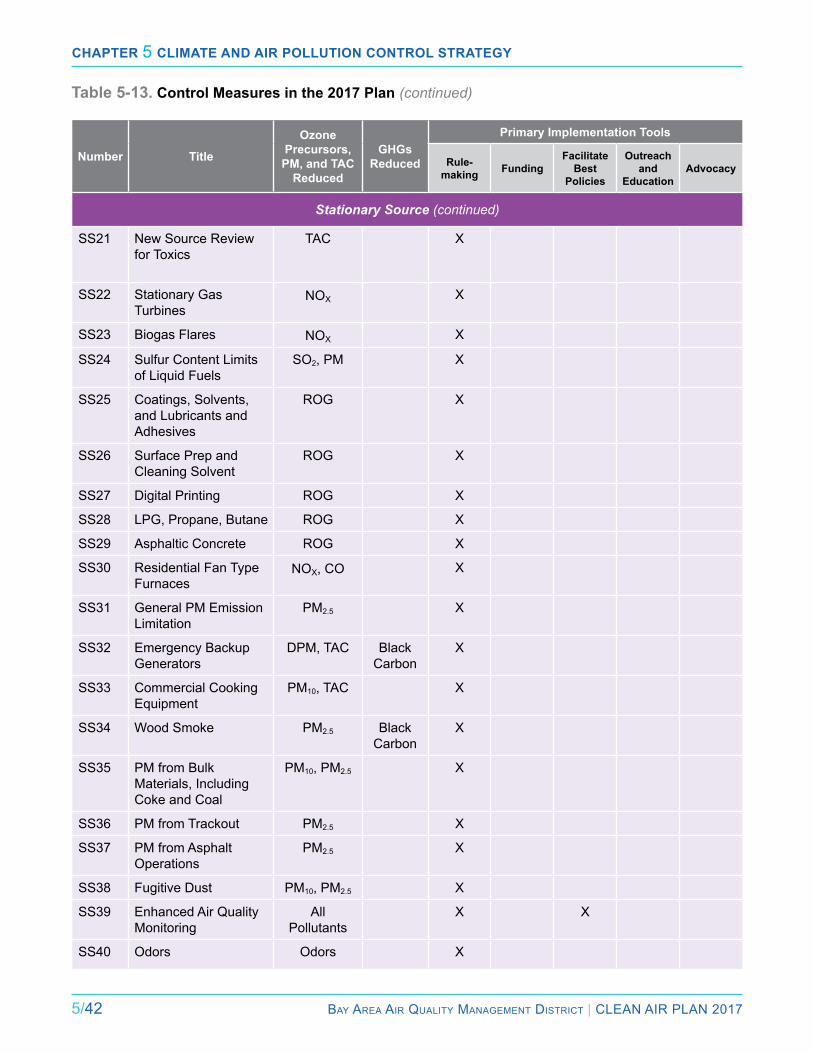
Chapter 5 Climate and air pollution Control Strategy
5/42 Bay area air Quality ManageMent District | Clean air Plan 2017
Number Title
Ozone Precursors, PM, and TAC
Reduced
GHGs Reduced
Primary Implementation Tools
Rule-making Funding
Facilitate Best
Policies
Outreach and
EducationAdvocacy
Stationary Source (continued)
SS21 new Source review for Toxics
TaC X
SS22 Stationary Gas Turbines
nOX X
SS23 Biogas Flares nOX X
SS24 Sulfur Content limits of liquid Fuels
SO2, PM X
SS25 Coatings, Solvents, and lubricants and adhesives
rOG X
SS26 Surface Prep and Cleaning Solvent
rOG X
SS27 Digital Printing rOG X
SS28 lPG, Propane, Butane rOG X
SS29 asphaltic Concrete rOG X
SS30 residential Fan Type Furnaces
nOX, CO X
SS31 General PM emission limitation
PM2.5 X
SS32 emergency Backup Generators
DPM, TaC Black Carbon
X
SS33 Commercial Cooking equipment
PM10, TaC X
SS34 Wood Smoke PM2.5 Black Carbon
X
SS35 PM from Bulk Materials, including Coke and Coal
PM10, PM2.5 X
SS36 PM from Trackout PM2.5 X
SS37 PM from asphalt Operations
PM2.5 X
SS38 Fugitive Dust PM10, PM2.5 X
SS39 enhanced air Quality Monitoring
all Pollutants
X X
SS40 Odors Odors X
Table 5-13. Control Measures in the 2017 Plan (continued)
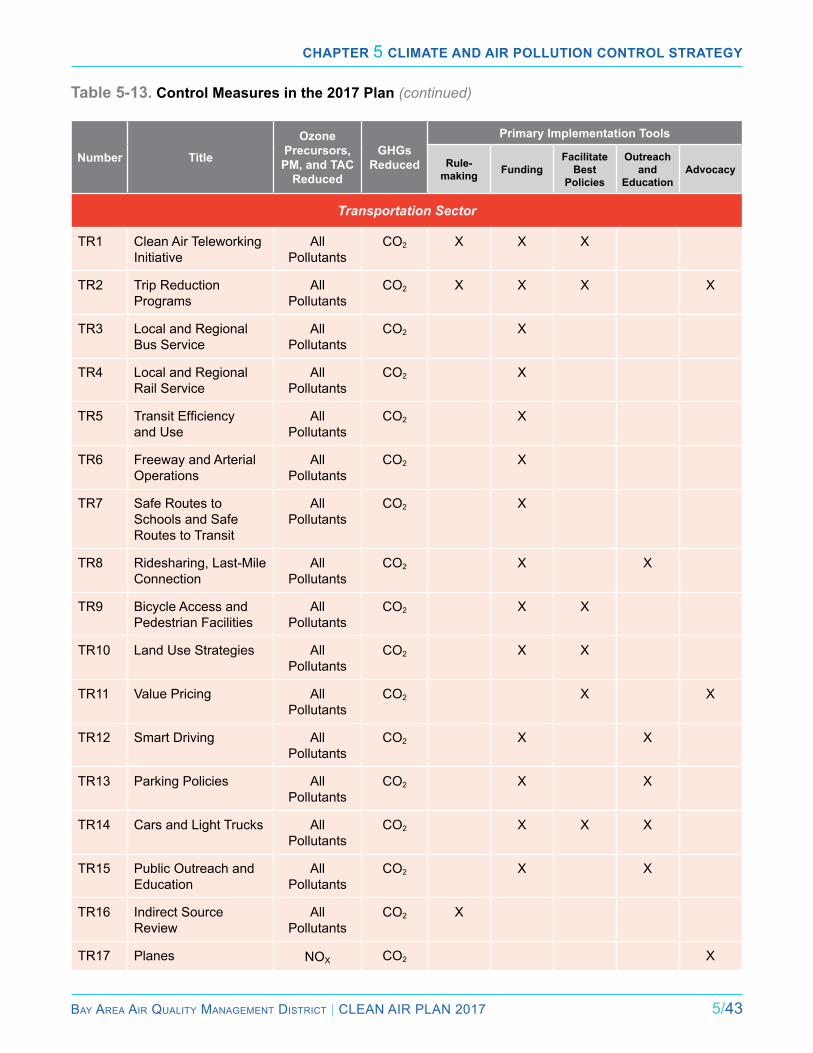
Chapter 5 Climate and air pollution Control Strategy
Bay area air Quality ManageMent District | Clean air Plan 2017 5/43
Number Title
Ozone Precursors, PM, and TAC
Reduced
GHGs Reduced
Primary Implementation Tools
Rule-making Funding
Facilitate Best
Policies
Outreach and
EducationAdvocacy
Transportation Sector
Tr1 Clean air Teleworking initiative
all Pollutants
CO2 X X X
Tr2 Trip reduction Programs
all Pollutants
CO2 X X X X
Tr3 local and regional Bus Service
all Pollutants
CO2 X
Tr4 local and regional rail Service
all Pollutants
CO2 X
Tr5 TransitEfficiency and Use
all Pollutants
CO2 X
Tr6 Freeway and arterial Operations
all Pollutants
CO2 X
Tr7 Safe routes to Schools and Safe routes to Transit
all Pollutants
CO2 X
Tr8 ridesharing, last-Mile Connection
all Pollutants
CO2 X X
Tr9 Bicycle access and Pedestrian Facilities
all Pollutants
CO2 X X
Tr10 land Use Strategies all Pollutants
CO2 X X
Tr11 Value Pricing all Pollutants
CO2 X X
Tr12 Smart Driving all Pollutants
CO2 X X
Tr13 Parking Policies all Pollutants
CO2 X X
Tr14 Cars and light Trucks all Pollutants
CO2 X X X
Tr15 Public Outreach and education
all Pollutants
CO2 X X
Tr16 indirect Source review
all Pollutants
CO2 X
Tr17 Planes nOX CO2 X
Table 5-13. Control Measures in the 2017 Plan (continued)
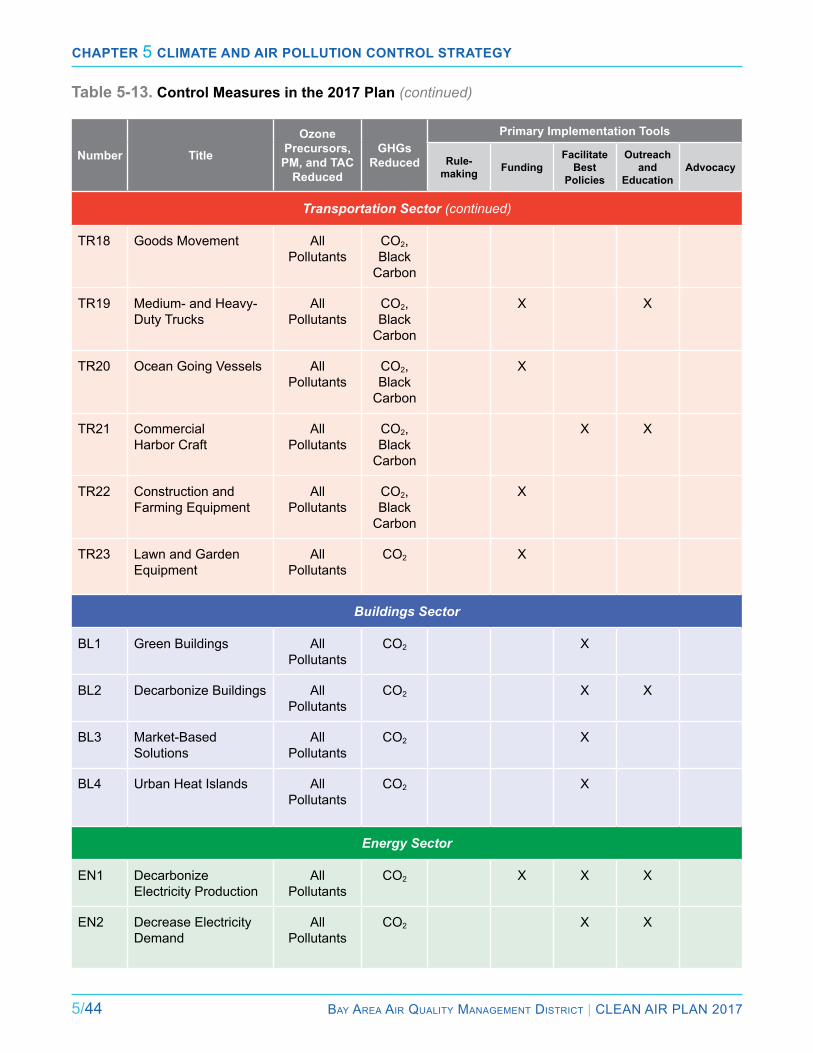
Chapter 5 Climate and air pollution Control Strategy
5/44 Bay area air Quality ManageMent District | Clean air Plan 2017
Number Title
Ozone Precursors, PM, and TAC
Reduced
GHGs Reduced
Primary Implementation Tools
Rule-making Funding
Facilitate Best
Policies
Outreach and
EducationAdvocacy
Transportation Sector (continued)
Tr18 Goods Movement all Pollutants
CO2, Black
Carbon
Tr19 Medium- and Heavy-Duty Trucks
all Pollutants
CO2, Black
Carbon
X X
Tr20 Ocean Going Vessels all Pollutants
CO2, Black
Carbon
X
Tr21 Commercial Harbor Craft
all Pollutants
CO2, Black
Carbon
X X
Tr22 Construction and Farming equipment
all Pollutants
CO2, Black
Carbon
X
Tr23 lawn and Garden equipment
all Pollutants
CO2 X
Buildings Sector
Bl1 Green Buildings all Pollutants
CO2 X
Bl2 Decarbonize Buildings all Pollutants
CO2 X X
Bl3 Market-Based Solutions
all Pollutants
CO2 X
Bl4 Urban Heat islands all Pollutants
CO2 X
Energy Sector
en1 Decarbonize electricity Production
all Pollutants
CO2 X X X
en2 Decrease electricity Demand
all Pollutants
CO2 X X
Table 5-13. Control Measures in the 2017 Plan (continued)
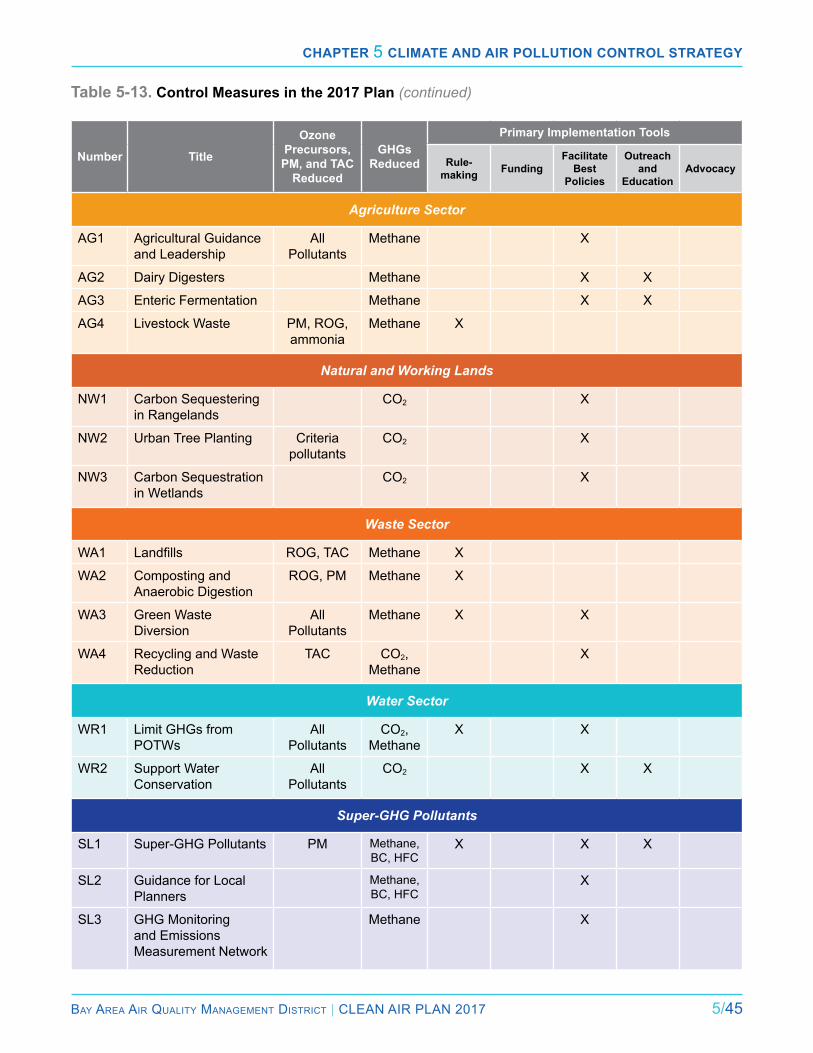
Chapter 5 Climate and air pollution Control Strategy
Bay area air Quality ManageMent District | Clean air Plan 2017 5/45
Number Title
Ozone Precursors, PM, and TAC
Reduced
GHGs Reduced
Primary Implementation Tools
Rule-making Funding
Facilitate Best
Policies
Outreach and
EducationAdvocacy
Agriculture Sector
aG1 agricultural Guidance and leadership
all Pollutants
Methane X
aG2 Dairy Digesters Methane X X
aG3 enteric Fermentation Methane X X
aG4 livestock Waste PM, rOG, ammonia
Methane X
Natural and Working Lands
nW1 Carbon Sequestering in rangelands
CO2 X
nW2 Urban Tree Planting Criteria pollutants
CO2 X
nW3 Carbon Sequestration in Wetlands
CO2 X
Waste Sector
Wa1 Landfills rOG, TaC Methane X
Wa2 Composting and anaerobic Digestion
rOG, PM Methane X
Wa3 Green Waste Diversion
all Pollutants
Methane X X
Wa4 recycling and Waste reduction
TaC CO2, Methane
X
Water Sector
Wr1 limit GHGs from POTWs
all Pollutants
CO2, Methane
X X
Wr2 Support Water Conservation
all Pollutants
CO2 X X
Super-GHG Pollutants
Sl1 Super-GHG Pollutants PM Methane, BC, HFC
X X X
Sl2 Guidance for local Planners
Methane, BC, HFC
X
Sl3 GHG Monitoring and emissions Measurement network
Methane X
Table 5-13. Control Measures in the 2017 Plan (continued)

Chapter 5 Climate and air pollution Control Strategy
5/46 Bay area air Quality ManageMent District | Clean air Plan 2017
FooTNoTES
1 Volume 2 of the 2017 Plan: http://www.baaqmd.gov/plans-and-climate/air-quality-plans/plans-under-development
2 Volume 2 of the 2017 Plan: http://www.baaqmd.gov/plans-and-climate/air-quality-plans/plans-under-development.
3 The air District does not normally include off-road equipment in the transportation sector for the Bay area emissions inventory. However, we do so here to be consistent with the way off-road equipment is categorized in the arB Scoping Plan.
4 GHG emissions from Bay area plants are addressed in the energy sector (rather than stationary sources) for purposes of this analysis. GHG emissions from electricity are attributed to the energy sector, rather than the end users in sectors such as buildings, stationary sources, transportation and water. However, natural gas production, transmission or distribution are addressed in the stationary source sector rather than the energy sector.
5 BaaQMD, 2015, Bay Area Emissions Inventory Summary
Report: Greenhouse Gases Base Year 2011.
6 California Public Utilities Commission, California renewables Portfolio Standard (rPS): http://www.cpuc.ca.gov/PUC/energy/renewables/
7 Center for Climate and energy Solutions, California Cap-and-Trade Program Summary: http://www.c2es.org/us-states-regions/key-legislation/california-cap-trade, June 4, 2015.
8 Thisstandardrequiresthatanynewlong-termfinancial
investment in “baseload” generation resources - the workhorse power plants that supply electricity around the clock - made on behalf of California customers must be in clean energy sources that meet the standard of 1,100 lbs CO2/MWh. http://www.energy.ca.gov/emission_standards/.
9 The “Commercial & residential” slice of the pie chart showninFigure5-1reflectsonlythedirectGHGemissionsrelated to combustion of natural gas and other fuels for space heating, water heating and cooking. This buildings sector portion of the GHG inventory would be larger if emissions were included from indirect sources such as building materials and from power plants that generate the electricity consumed in buildings. See the Building Sector analysis in Volume 4 for additional discussion.
10 https://escholarship.org/uc/item/2sn7m83z
11 http://www.sagecenter.org/wp-content/uploads/2009/05/sustaining-our-agricultural-bounty-an-assessment-of-agriculture-in-the-sf-bay-area_march-20111.pdf
12 Bay area Open Space Council. 2014. The Conservation Lands Network 1.0 Progress Report. Berkeley, Ca.
13 estimate from California rangeland Trust as indicated in Bay area Open Space Council (2014).
14 “ecosystem services and urban heat riskscape moderation: water, green spaces, and social inequality in Phoenix, USa,” by G. Darrel Jenerette, Sharon l. Harlan, William l. Stefanov, and Chris a. Martin. ecological applications, Vol. 21 no. 7, October 2011.
15 For example, requiring the use of aerated static piles for the composting method in order to limit particulate matter, odors, and organic compounds that are ozone precursorswillhavetheco-benefitofreducingmethaneemissions as well.
16 Brown et al. Greenhouse Gas Balance for Composting Operations.J.Environ.Qual.37:1396–1410.2008.
17 lifecycle emissions are not included in this sector’s quantitative analysis, but the potential to use the resulting compostforvariouslocalpurposesisaclearbenefitoverimporting other products from outside the region (e.g., artificialfertilizersmadefromhydrocarbonssuchas natural gas).
18 http://bairwmp.org/docs/2013-bairwm-plan-update/2013-final-plan/San%20Francisco%20Bay%20Area%20IRWMP%20Final_September%202013.pdf/view
19 The social cost of carbon attempts to capture the full range of future impacts from climate change, including direct and indirect impacts to public health, and to express those costs or savings in current dollars. estimating the social cost of carbon is a complex endeavor, with a wide range of uncertainty. Because the methodology cannot fully capture all the potential impacts of climate change, it is likely that the $62 per metric ton of CO2e used in our estimate underestimatestheactualsocialbenefitsofreducingGHGemissions. For additional information: https://www3.epa.gov/climatechange/Downloads/ePaactivities/social-cost-carbon.pdf
20 Volume 2 of the 2017 Plan: http://www.baaqmd.gov/plans-and-climate/air-quality-plans/plans-under-development.


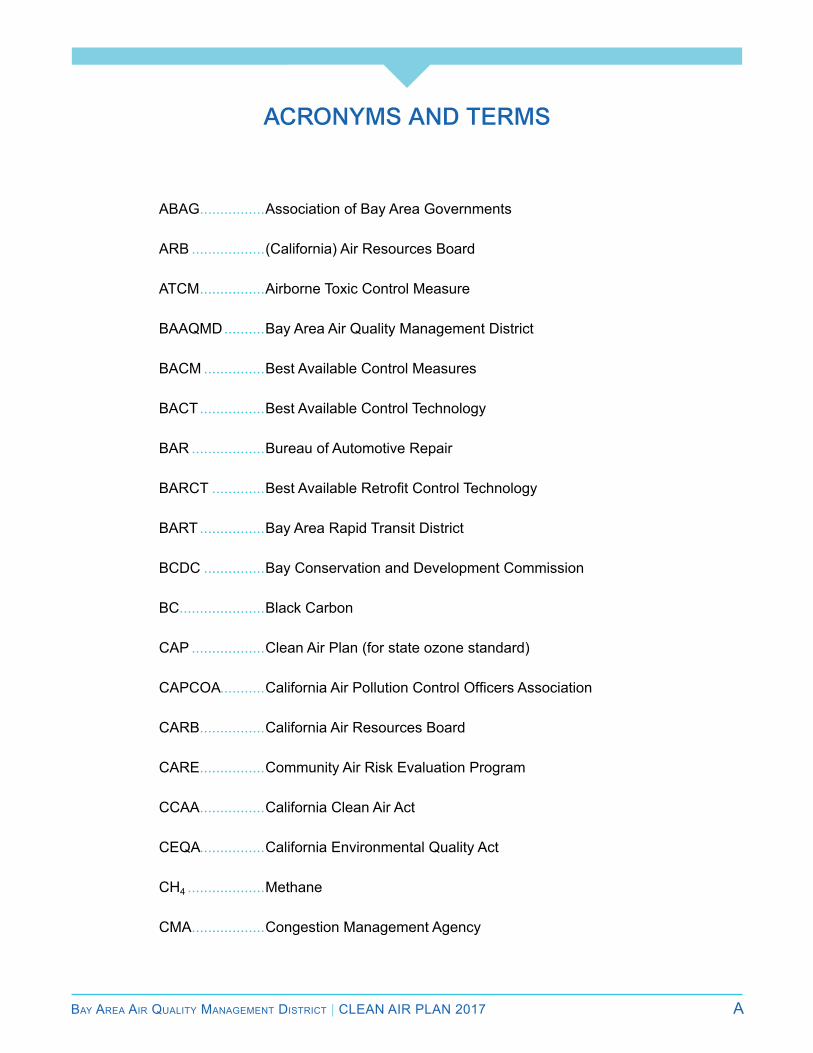
Bay area air Quality ManageMent District | Clean air Plan 2017 a
Acronyms And Terms
aBaG................association of Bay area Governments
arB ..................(California) air resources Board
aTCM ................airborne Toxic Control Measure
BaaQMD ..........Bay area air Quality Management District
BaCM ...............Best available Control Measures
BaCT ................Best available Control Technology
Bar ..................Bureau of automotive repair
BarCT .............Best Available Retrofit Control Technology
BarT ................Bay area rapid Transit District
BCDC ...............Bay Conservation and Development Commission
BC.....................Black Carbon
CaP ..................Clean air Plan (for state ozone standard)
CaPCOa...........California Air Pollution Control Officers Association
CarB................California air resources Board
Care................Community air risk evaluation Program
CCaa ................California Clean air act
CeQa................California environmental Quality act
CH4 ...................Methane
CMa ..................Congestion Management agency
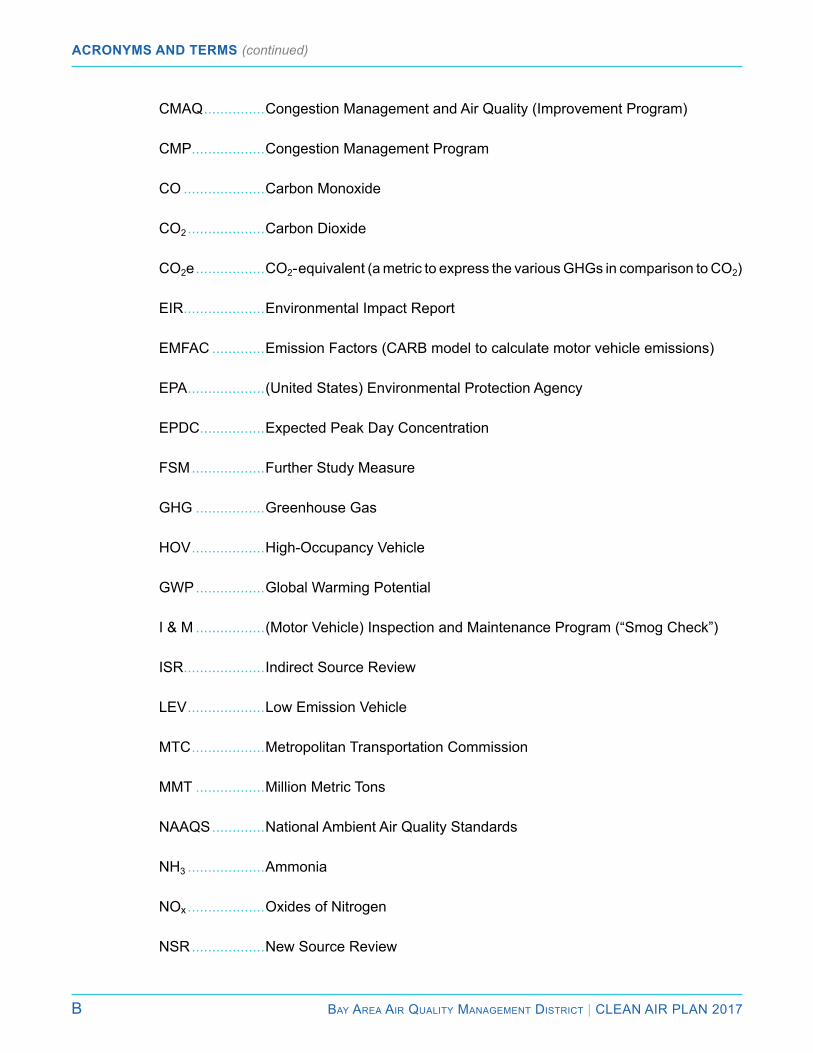
Acronyms And Terms (continued)
B Bay area air Quality ManageMent District | Clean air Plan 2017
CMaQ ...............Congestion Management and air Quality (improvement Program)
CMP ..................Congestion Management Program
CO ....................Carbon Monoxide
CO2 ...................Carbon Dioxide
CO2e .................CO2-equivalent (a metric to express the various GHGs in comparison to CO2)
eir....................environmental impact report
eMFaC .............emission Factors (CarB model to calculate motor vehicle emissions)
ePa ...................(United States) environmental Protection agency
ePDC................expected Peak Day Concentration
FSM ..................Further Study Measure
GHG .................Greenhouse Gas
HOV ..................High-Occupancy Vehicle
GWP .................Global Warming Potential
i & M .................(Motor Vehicle) inspection and Maintenance Program (“Smog Check”)
iSr....................indirect Source review
leV ...................low emission Vehicle
MTC ..................Metropolitan Transportation Commission
MMT .................Million Metric Tons
naaQS .............national ambient air Quality Standards
nH3 ...................ammonia
nOx ...................Oxides of nitrogen
nSr ..................new Source review
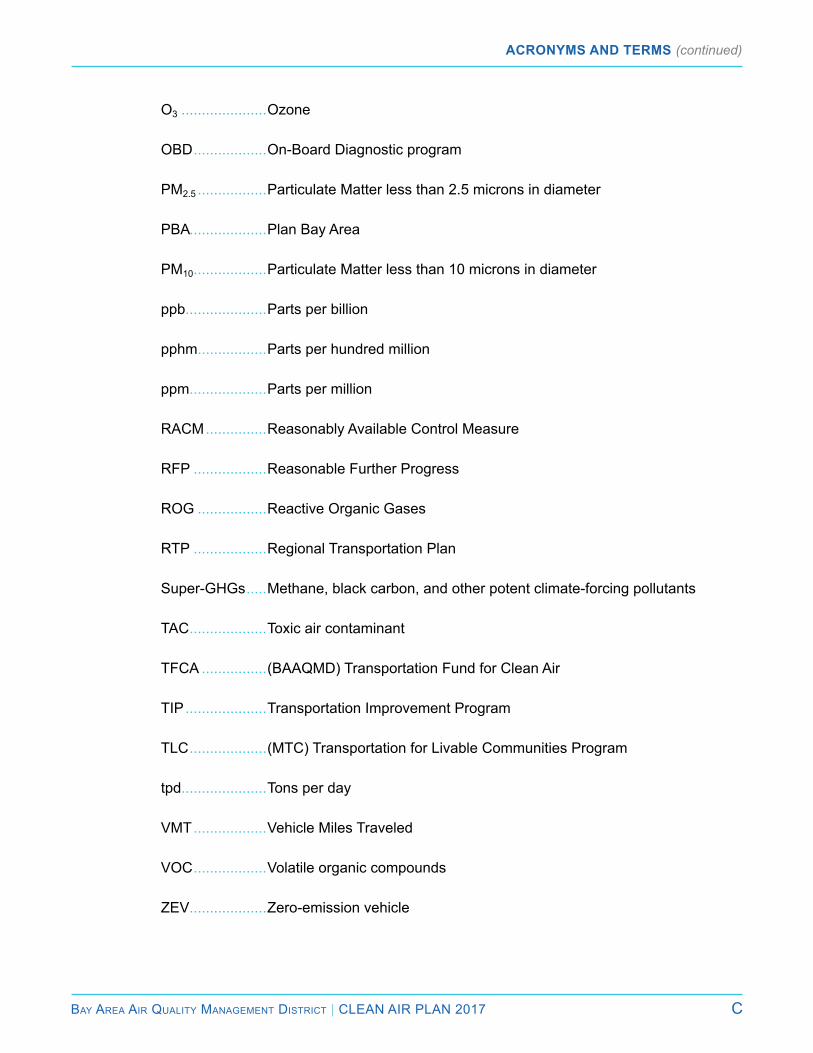
Acronyms And Terms (continued)
Bay area air Quality ManageMent District | Clean air Plan 2017 C
O3 .....................Ozone
OBD ..................On-Board Diagnostic program
PM2.5 .................Particulate Matter less than 2.5 microns in diameter
PBa...................Plan Bay area
PM10 ..................Particulate Matter less than 10 microns in diameter
ppb....................Parts per billion
pphm.................Parts per hundred million
ppm...................Parts per million
raCM ...............reasonably available Control Measure
rFP ..................reasonable Further Progress
rOG .................reactive Organic Gases
rTP ..................regional Transportation Plan
Super-GHGs .....Methane, black carbon, and other potent climate-forcing pollutants
TaC ...................Toxic air contaminant
TFCa ................(BaaQMD) Transportation Fund for Clean air
TiP ....................Transportation improvement Program
TlC ...................(MTC) Transportation for livable Communities Program
tpd.....................Tons per day
VMT ..................Vehicle Miles Traveled
VOC ..................Volatile organic compounds
ZeV...................Zero-emission vehicle

Bay area air Quality ManageMent District | Clean air Plan 2017 a/1
State air Quality Planning reQuirementS
aPPendix a
For the past 28 years, the 1988 California Clean air act (CCaa), along with sub-sequent amendments, as codified in the
California Health & Safety Code, has guided ef-forts throughout California to achieve state ambi-ent air quality standards. This appendix describes CCaa air quality planning requirements and how the 2017 Plan fulfills all requirements.
The basic goal of the CCaa is to achieve health-based state ambient air quality standards by the earliest practicable date. The CCaa requires re-gions that violate the state ozone standard to prepare attainment plans that identify a strategy to attain the standard. California classifies ozone nonattainment areas based on their “expected peak day concentration.” an analysis of Bay area “expected peak day concentration” values is pro-vided in appendix F. legal requirements vary ac-cording to the severity of a region’s ozone problem. The air District is subject to CCaa requirements for “serious” areas [Secs. 40921.5(a)(2), 40919].1
regional air quality plans are required to achieve a reduction in district-wide emissions of 5 percent per year for ozone precursors (California Health & Safety Code Section 40914). However, if an air district is unable to achieve a 5 percent annual reduction, then the air district is required to adopt a control strategy to implement “all feasible mea-sures” on an expeditious basis [Sec. 40914(b)(2)].
All Feasible Measures
no non-attainment area in the state has been able to demonstrate a 5 percent reduction in ozone precur-sor pollutants each year. Consequently, air districts throughout the state, including the Bay area, have opted to adopt “all feasible measures” as expedi-tiously as possible to meet the requirements of the CCAA. The CCAA does not define “feasible,” but the Health and Safety Code provides some direction to assist the air District in making this determination. Section 40406 defines a related term, Best Avail-able Retrofit Control Technology (BARCT), as “an emission limitation that is based on the maximum degree of reduction achievable, taking into account environmental, energy and economic impacts by each class or category of source.” The California Air Resources Board (ARB) defines “all feasible measures” in the Transport Mitigation regulation, Section 70600 et seq, Title 17 California Code of regulations, as “air pollution control measures, in-cluding but not limited to emissions standards and limitations, applicable to all air pollution source cat-egories under a district’s authority that are based on the maximum degree of reductions achievable for emissions of ozone precursors, taking into ac-count technological, social, environmental, ener-gy and economic factors, including cost-effective-ness.” Section 40922(a) requires an assessment of the cost-effectiveness of each proposed control measure, including a ranking of measures from the least cost-effective to the most cost-effective. Section 40922(b) lists additional criteria that air
Appendix A – StAte Air QuAlity plAnning reQuirementS
a/2 Bay area air Quality ManageMent District | Clean air Plan 2017
districts should consider in reviewing potential control measures, including technological feasibil-ity, total emission reduction potential, the rate of reductions, public acceptability and enforceability.
The process that the air District used to review and evaluate potential control measures in relation to these criteria is described in appendix H. an over-view of the 2017 Plan control strategy is provided in Volume i, Chapter 5; detailed descriptions of control measures are provided in Volume ii of the 2017 Plan.
Transport Mitigation Requirements
The CCaa requires arB to periodically assess transport of ozone and ozone precursors from up-wind to downwind regions and to establish mitigation requirements for upwind districts (Sec. 39610). The CCaa also requires air districts to address transport mitigation requirements in their clean air plans to include strategies to assist downwind air districts in achieving the State ozone standard (Sec. 40912).
ARB first adopted transport mitigation require-ments in 1990, amended them in 1993, and further strengthened them in 2003. arB’s 2003 amended Transport Mitigation requirements are in Title 17, California Code of regulations, Sections 70600 and 70601. The requirements for transport mitiga-tion state that upwind districts “shall include suffi-cient emission control measures in their attainment plans for ozone…to mitigate the impact of pollution sources within their jurisdictions on ozone concen-trations in downwind areas commensurate with the level of contribution.” Specifically, the Air District is required to:
1) adopt and implement all feasible measures as expeditiously as practicable;
2) adopt and implement Best Available Retrofit Control Technology (BarCT) on all existing sta-tionary sources of ozone precursor emissions as expeditiously as practicable;
3) maintain a stationary source permitting pro-gram designed to achieve no net increase in the emissions of ozone precursors from new or modified stationary sources that emit or have
the potential to emit 10 tons or greater per year of an ozone precursor; and
4) include measures sufficient to attain the State ambient air quality standard for ozone by the earliest practicable date within the north Cen-tral Coast air Basin, that portion of Solano County within the Broader Sacramento area, that portion of Sonoma County within the north Coast air Basin, and that portion of Stanislaus County west of Highway 33 during air pollution episodes, provided that:
a) the areas are likely to violate the State ozone standard,
b) the areas are dominated by transport from the Bay area, and,
c) the areas are not affected by emissions of ozone precursors within their borders.
The 2017 Plan addresses all of the above require-ments. The control strategy defined in the 2017 Plan, together with the air District rule development and permitting processes, addresses the require-ment to adopt all feasible measures, including mea-sures sufficient to attain the state ozone standard in specified transport areas, and to implement BARCT on all existing stationary sources. With respect to the “no net increase” requirement, the air District adopted a 10 ton per year no net increase require-ment for ozone precursors in regulation 2, rule 2: new Source review on December 21, 2004. in addition, the air District is required to consult with downwind districts on development of the 2017 Plan, review the list of control measures in the most recently approved attainment plan (in this case, the Bay Area 2010 Clean Air Plan), make a finding as to whether the proposed list of control measures meets the requirements of Section 70600 (b), and include the finding in the proposed 2017 Plan. To fulfill these consultation requirements, the Air District hosted a conference call with downwind air districts in January 2017 to update them on the implementation of the 2010 Clean air Plan and to solicit comments and suggestions on the 2017 Plan draft control strategy.
Appendix A – StAte Air QuAlity plAnning reQuirementS
Bay area air Quality ManageMent District | Clean air Plan 2017 a/3
Other Requirements
in addition to requirements concerning all feasible measures and transport mitigation, the CCaa re-quires that strategies to attain the State ozone stan-dard contain other elements, including the following:
Emissions inventory system [Sec. 40918(a)(5)]: The air District maintains an emissions inventory system. The emission inventory is included in the “Sources of air Pollution—emission inventory” sec-tion of the 2017 Plan.
A permitting program [Sec. 40919(a)(2)] designed to achieve no net increase in emissions from per-mitted sources with a potential to emit greater than 10 tons per year of a non-attainment pollutant or their precursors and to require the use of Best avail-able Control Technology (BaCT) on new and mod-ified sources with a potential to emit greater than 10 pounds per day: The air District’s permitting pro-gram, as spelled out in regulation 2, rule 2: new Source review, complies with the requirements of Health and Safety Code Section 40919(a)(2). Suffi-cient offsets have been provided for all permits that have been issued by the air District. Furthermore, the Small Facility Banking account has sufficient credits to sustain withdrawals into the foreseeable future at the current withdrawal rate. The air Dis-trict’s no net increase threshold was reduced to 10 tons per year to comply with transport mitigation re-quirements in December, 2004.
Best Available Retrofit Control Technology (BARCT) on all existing permitted stationary sources [Sec. 40919(a)(3)]: BarCT is implemented through the air District’s rule development, enforce-ment and permit review programs. air District staff performs an assessment of BarCT requirements when proposing new rules or rule amendments and arB reviews air District rules and proposed rule amendments to insure that BarCT standards are implemented. additionally, the air District evaluates existing sources during the annual permit review process to ensure BarCT requirements are being met. Finally, the air District issues facility adviso-ries, and implements compliance assistance and enforcement programs help to ensure compliance with BarCT standards in rules.
Measures to achieve use of a significant num-ber of low-emission vehicles in motor vehicle fleets [Sec. 40919(a)(4)]: Transportation control measures Tr14 and Tr19 promote the use of low-emission vehicles and trucks to reduce motor vehicle fleet emissions. The Air District’s Trans-portation Fund for Clean air, Carl Moyer and low emission School Bus programs provide funding for projects to promote the purchase and use of low-emission vehicles.
Transportation Control Measures (TCMs) to substantially reduce the rate of increase in passen-ger vehicle trips and miles traveled per trip [Sec. 40918(a)(3)]: Pursuant to Sections 40233 and 40717, each transportation control measure must include the following:
● a schedule for implementation
● Identification of potential implementing agencies
● Procedures for monitoring the effectiveness of and compliance with the measures in the plan; and
in addition, Section 40233 directs the air District to estimate the quantity of emission reductions from transportation sources necessary to attain and maintain state and national ambient air quality standards. Section 40233 requires the Metropolitan Transportation Commission (MTC) to prepare and adopt a TCM plan to achieve the specified quan-tity of emission reductions. The TCM plan is then incorporated into the overall strategy for achieving the state ozone standard. The statute also requires MTC to develop and adopt a revised TCM plan whenever the air District revises the emission re-duction target.
The air District and MTC complied with the require-ments of Section 40233 when preparing the 1991 Clean Air Plan, the Air District’s first plan for the state ozone standard, by adopting a TCM emission reduction target and plan in 1990. Section 40233 allows the air District’s discretion as to whether and when to revise the emission reduction target for transportation sources set in 1990. This update to the strategy to attain the state ozone standard does not include a revised emission reduction tar-get for transportation sources, and therefore does
Appendix A – StAte Air QuAlity plAnning reQuirementS
a/4 Bay area air Quality ManageMent District | Clean air Plan 2017
not trigger a TCM plan revision. The air District and MTC have, however, comprehensively reviewed and augmented the TCMs during preparation of the 2017 Plan to maximize their effectiveness.
Indirect source and area source programs [Sec-tion 40918(a)(4)]: Several measures in the 2017 Plan are intended to reduce emissions from indi-rect sources. Tr16 calls for the air District to de-velop an indirect source review regulation pursuant to Section 40716. Tr10 describes updated CeQa guidelines that should also help to reduce emis-sions from new indirect sources of emissions. Tr10 also includes actions by the air District and partner agencies to promote infill development that should also reduce emissions from indirect sources. Man-agement of area source emissions is addressed through existing air District regulations for rOG in regulation 8 and nOX in regulation 9. in addition, PM is addressed by regulation 6, including the air District’s wood smoke rule (reg. 6, rule 3, adopted in July 2008) and complementary wood smoke pub-lic education program.
Regional public education programs [Section 40918(a)(6)]: The air District administers several public education programs that encourage the pub-lic to reduce air pollution both year round and on an episodic basis. The air District’s Spare the Air pub-lic education program, described in Tr15, is aimed at curbing emissions from motor vehicles and oth-er ozone precursor sources on days when weath-er conditions are conducive to high ozone levels. The Winter Spare the Air program complements the regulatory wood burning program that reduces emissions of particulate matter from wood burn-ing. Other ongoing educational programs include grassroots resource teams located throughout the
Bay area, a Smoking Vehicle assistance Program, outreach and presence at public events throughout the year, a suite of youth education programs in-cluding the Spare the air Youth and Protect Your Climate Curriculum, and a Speakers Bureau that delivers talks on air quality to a variety of audiences throughout the region.
An assessment of cost-effectiveness of pro-posed control measures (Section 40922): infor-mation regarding the cost-effectiveness of pro-posed control measures is provided in Chapter 5 of the 2017 Plan.
Periodic requirements of the CCaa include the following:
An annual regulatory schedule (Section 40923): The air District produces a regulatory schedule each December, listing regulatory measures that may be scheduled for adoption or amendment during the following year. a proposed regulatory schedule for years 2017 through 2019 is provided in Chapter 5 of the 2017 Plan.
An annual progress report on control measure im-plementation and, every third year, an assessment of the overall effectiveness of the program (Section 40924): The latest assessment is provided in Chap-ter 4, as well as appendix G of the 2017 Plan.
A review and update of the plan every three years to correct for deficiencies and to incorpo-rate new data and projections (Section 40925): The 2017 Plan incorporates new data and pro-jections and updates the 2010 Clean air Plan control strategy.
Footnotes
1 all references to Section numbers are for the California Health and Safety Code unless otherwise noted.
Bay area air Quality ManageMent District | Clean air Plan 2017 B/1
Public Outreach
aPPendix b
air District staff reached out to inform and engage the general public, as well as key stakeholders, about the 2017
Plan throughout the plan development process. at the outset of the process, staff designed a public outreach strategy to foster sustained engagement and dialogue with a wide range of stakeholders in developing the plan. Staff identified the following goals to guide public outreach and engagement:
● Inform a wide range of stakeholders and mem-bers of the public about the scope and sched-ule of the plan and opportunities for comment.
● Provide opportunities for members of the public and stakeholders to offer input on the plan and outreach process.
● Educate the public about air quality and why the air District and the 2017 Plan are relevant, and why greenhouse gases and climate protec-tion have become an integral part of the plan.
● Engage impacted communities and multi-lingual communities in developing the plan.
● Promote transparency throughout the strate-gy and plan development process.
● Foster buy-in, ownership, and acceptance of the plan.
Public outreach for the 2017 Plan took place in three phases: introduction to the 2017 Plan and
the planning process, development of the control measures and climate strategies, and presenta-tion of the draft and final plan. Primary outreach mechanisms utilized include the 2017 Plan web-site; notices sent to the plan e-mail list serve; and Plan public workshops, open houses, community meetings and the associated materials that staff prepared. additionally, in the interests of imple-menting the goals above, staff developed materials and outreach mechanisms to support education and outreach to air District constituents for whom english is not the primary language, with a focus on Chinese, Vietnamese and Spanish speakers. additional outreach took place for the environmen-tal review process and consultation with other air districts. a description of the full range of outreach mechanisms employed over the course of the 2017 Plan development process is provided below. Open Air Forum: The air District recently launched a new online civic engagement tool, Open air Fo-rum. Open air Forum is an online resource that offers the public a new opportunity to interact with the Air District and provide feedback on specific Air District topics. Open air Forum was used for public discussion on the 2017 Plan. The forum gave visi-tors access to draft control measures and informa-tional material distributed at each open house—to review and provide comment at their leisure. Open air Forum can be accessed through the air Dis-trict website homepage at www.baaqmd.gov or directly at http://www.baaqmd.gov/in-your-com-munity/open-air.
B/2 Bay area air Quality ManageMent District | Clean air Plan 2017
Appendix B – public OutreAch
Web pages: The 2017 Plan webpage on the air District’s website features a description of the Plan goals and purpose, regulatory framework, meeting schedule, meeting notices and materials and key technical documents. The website has been used primarily to alert the public to meet-ings and workshops and to post meeting materi-als and Plan documents for public review prior to each workshop. The main 2017 Plan web page is located on the air District’s website, in the air quality plans section: http://www.baaqmd.gov/plans-and-climate/air-quality-plans.
E-mail and paper mail database: an email da-tabase was compiled from an existing outreach database, updated to reflect the most current in-formation for contacts, augmented with additional health, non-government organizations and regu-latory agency contacts, and converted to the ex-tent possible from U.S. mail addresses to e-mail in keeping with the air District’s interest in reducing waste. The database consists of approximately 1,650 e-mail contacts with an additional 185 U.S. mail contacts, representing regional and state regulatory agencies, staff from other air districts, transportation agencies, environmental and health advocates and professionals, community mem-bers, representatives from regulated industries, lo-cal governments and others. The list is refreshed and added to by meeting attendance lists and re-quests received via e-mail and the 2017 Plan web-site. The database was used to notify the public of meetings dates and locations, and to alert the pub-lic to meeting materials and planning and CeQa documents posted on the 2017 Plan website.
Outreach to multilingual communities: air Dis-trict staff held six open houses on the 2017 Plan. information regarding these open houses was translated into Spanish, Chinese, Vietnamese
and Tagalog languages, and posted on the 2017 Plan website. at the open houses, Spanish and Chinese interpreters were available to translate questions and answers and printed material re-garding the open houses was available.
Public workshops and community meetings: The air District held public workshops, open houses and other meetings at locations through-out the Bay area during the planning process to facilitate dialogue and collect input on the pro-posed control measures and climate strategies. all meetings were held at accessible locations and in close proximity to transit whenever possi-ble. notice of public workshops and open hous-es was provided at least three weeks in advance on the air District website and by e-mail to the Plan contact database. as of July 2016, 31 public workshops, open houses, community meetings, and stakeholder meetings were held at key inter-vals throughout the planning process. a summary of these meetings is provided in Table B-1.
Sector-based working groups: early in the 2017 Plan planning process, the air District con-vened small groups of experts in each economic sector. These experts were convened to discuss GHG emission inventories and projected trends in GHG emissions. air District staff also solicit-ed suggestions for potential measures to reduce emissions of GHGs and other air pollutants. The air District later expanded the initial group of technical experts into multi-stakeholder working groups to further inform the 2017 Plan develop-ment. The working groups focused on specific economic sectors; members were asked to pro-vide input, based on their expertise in a particular economic sector, on potential control measures and actions the air District could take to reduce emissions.
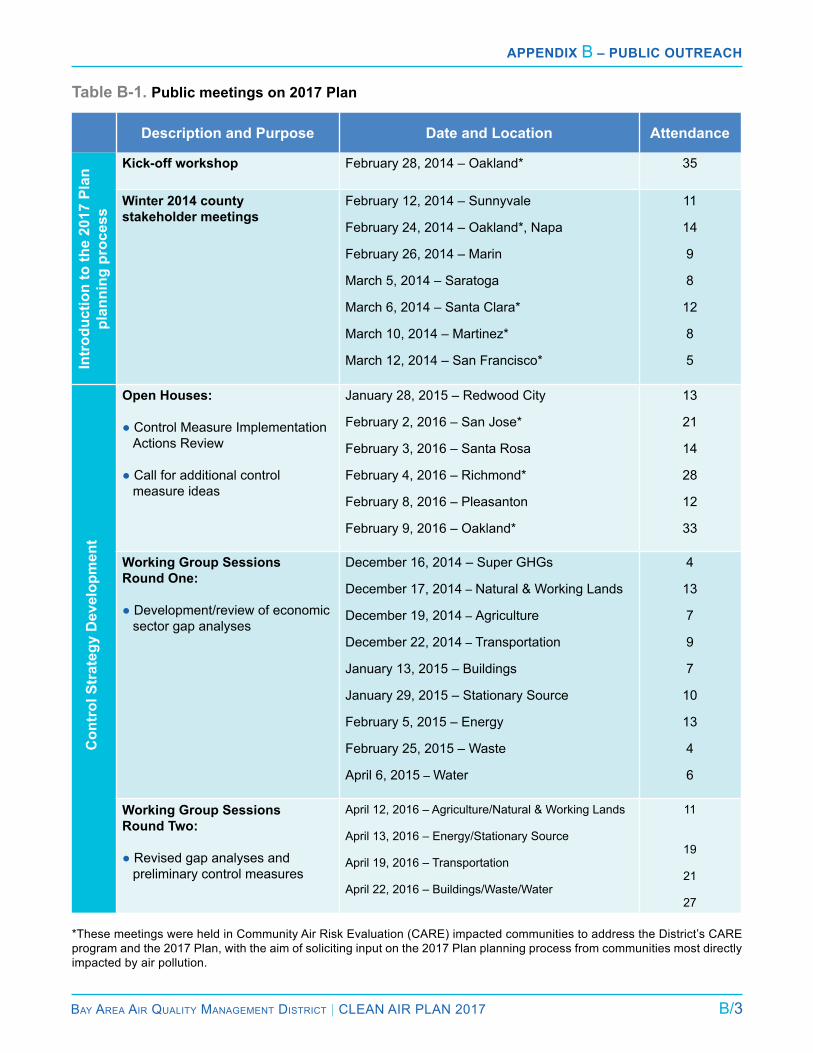
Bay area air Quality ManageMent District | Clean air Plan 2017 B/3
Appendix B – public OutreAch
Description and Purpose Date and Location Attendance
Kick-off workshop February 28, 2014 – Oakland* 35
Winter 2014 county stakeholder meetings
February 12, 2014 – Sunnyvale
February 24, 2014 – Oakland*, napa
February 26, 2014 – Marin
March 5, 2014 – Saratoga
March 6, 2014 – Santa Clara*
March 10, 2014 – Martinez*
March 12, 2014 – San Francisco*
11
14
9
8
12
8
5
Open Houses:
● Control Measure implementation actions review
● Call for additional control measure ideas
January 28, 2015 – redwood City
February 2, 2016 – San Jose*
February 3, 2016 – Santa rosa
February 4, 2016 – richmond*
February 8, 2016 – Pleasanton
February 9, 2016 – Oakland*
13
21
14
28
12
33
Working Group Sessions Round One:
● Development/review of economic sector gap analyses
December 16, 2014 – Super GHGs
December 17, 2014 – natural & Working lands
December 19, 2014 – agriculture
December 22, 2014 – Transportation
January 13, 2015 – Buildings
January 29, 2015 – Stationary Source
February 5, 2015 – energy
February 25, 2015 – Waste
april 6, 2015 – Water
4
13
7
9
7
10
13
4
6
Working Group Sessions Round Two:
● revised gap analyses and preliminary control measures
april 12, 2016 – agriculture/natural & Working lands
april 13, 2016 – energy/Stationary Source
april 19, 2016 – Transportation
april 22, 2016 – Buildings/Waste/Water
11
19
21
27
*These meetings were held in Community air risk evaluation (Care) impacted communities to address the District’s Care program and the 2017 Plan, with the aim of soliciting input on the 2017 Plan planning process from communities most directly impacted by air pollution.
Con
trol
Str
ateg
y D
evel
opm
ent
Table B-1. Public meetings on 2017 PlanIn
trod
uctio
n to
the
2017
Pla
n pl
anni
ng p
roce
ss

B/4 Bay area air Quality ManageMent District | Clean air Plan 2017
Appendix B – public OutreAch
additional open houses and/or public workshops will be held after the release of the draft 2017 Plan.
in addition to formal workshops and community meetings, staff made presentations about the Plan to interested stakeholders to solicit feedback on various aspects of the Plan. These included:
● april 2016, Contra Costa County industrial as-sociation
● Bayren, March 2016
● Clean air Professionals (lung association), January 2016
● California Air Pollution Control Officers Associa-tion, December 2015
● California Climate Planning Conference, au-gust 2015
● California Council for environmental and eco-nomic Balance, July 2015, February 2016, July 2016
● air and Waste Management association, June 2016, June 2014
Consultation with neighboring air districts: air District staff held a conference call with downwind air districts on January 11, 2017, to discuss the im-plementation of 2010 Clean air Plan control mea-sures and to receive input on proposed 2017 Plan control measures.
Collaboration with regional agencies: The 2017 Plan was developed in collaboration and consul-tation with the air District’s regional agency part-ners, the Metropolitan Transportation Commission (MTC), association of Bay area Governments (aBaG), and the Bay Conservation and Develop-
ment Commission (BCDC). MTC and aBaG staff provided important input to the transportation sec-tor measures, and MTC staff played a key role in developing emission reduction and cost estimates for the transportation measures. in addition, the 2017 Plan was informed by regional agency plans, including Plan Bay Area.
air District Staff made presentations about the 2017 Plan at the following regional agency meeting:
● Bay area regional Collaborative, July 17, 2015
Reports to Air District Board of Directors and Board Committees: District staff provided sever-al briefings to the Board of Directors and Board Committees in the course of developing the draft 2017 Plan.
● BaaQMD advisory Council, October, 3, 2016
● BaaQMD executive Committee, March 2, 2016
● BaaQMD Climate Protection Committee, Sep-tember 15, 2016
● BaaQMD Climate Protection Committee, March 16, 2016
● BaaQMD Board of Directors, July 29, 2015
● BaaQMD Climate Protection Committee, Sep-tember 29, 2014
CEQA Review: Pursuant to the California en-vironmental Quality act (CeQa), air District staff prepared and released a notice of Preparation and initial Study on June 15, 2016, for a 30-day public review period. air District staff anticipate releasing a Draft Programmatic environmental impact report for a 45-day review period in mid- January 2017.
Bay area air Quality ManageMent District | Clean air Plan 2017 C/1
Air Pollution HeAltH Burden
APPendix C
reducing emissions of criteria air pol-lutants, toxic air contaminants (TaCs) and greenhouse gases (GHGs) will
provide public health, environmental and econom-ic benefits. The Air District developed a multi-pol-lutant evaluation method (MPeM) as an analytical tool that was initially used in developing the Bay Area 2010 Clean Air Plan. The MPEM provides a means to quantify the estimated benefits of indi-vidual control measures and the control strategy as a whole in protecting public health, extending the average lifespan of Bay area residents and protecting the climate. This information can be used to compare the estimated costs and benefits of individual control measures, to help prioritize implementation of control measures in the 2017 Plan, and to estimate the magnitude of benefits to the region from the control strategy as a whole. MPeM input values have been updated for use of the method in the 2017 Plan. The MPEM was a key tool used in preparing the Health Burden anal-ysis, as described below.
The MPEM estimates the benefits from reduc-tions in pollutant emissions that result from a giv-en control measure. For estimated reductions in PM2.5 and ozone, a range of health benefits are estimated—ranging from fewer school absenc-es and work loss days to fewer deaths; and for a set of carcinogens (benzene, 1,3-butadiene, formaldehyde and acetaldehyde), the reduction in cancer incidence and mortality are estimated.
Monetary values are estimated for all these, as well as the social benefit of GHG reductions. (See Valuation of Health effects and Valuation of GHG reductions below.)
The MPEM consists of four basic steps:
1. Estimating the change in pollutant concetra-tions from changes in emissions: For a given control measure, the resulting daily mass emis-sions reductions in various pollutants are input to MPEM. The pollutants include both direct emis-sions of PM2.5, toxics and GHGs, but also ozone and PM2.5 precursors—VOCs, nOX, SO2 and am-monia. MPEM takes these changes and estimates the change in pollutant concentrations for a four sq. km grid covering the Bay Area. This includes estimating the changes of ozone and PM2.5 con-centrations resulting from changes in precursors.
2. Estimating the change in population exposure: MPeM multiplies the change in pollutant concen-tration times the population and computes a popu-lation-weighted average for each grid square.
3. Estimating the change in various health end-points: MPeM then applies a set of concentra-tion-response functions that estimate the change in health endpoints for a given change in pollut-ant concentration, multiplying by the size of the susceptible population. For example, a reduc-tion in PM2.5 of 1 μg/m3 has been found to reduce
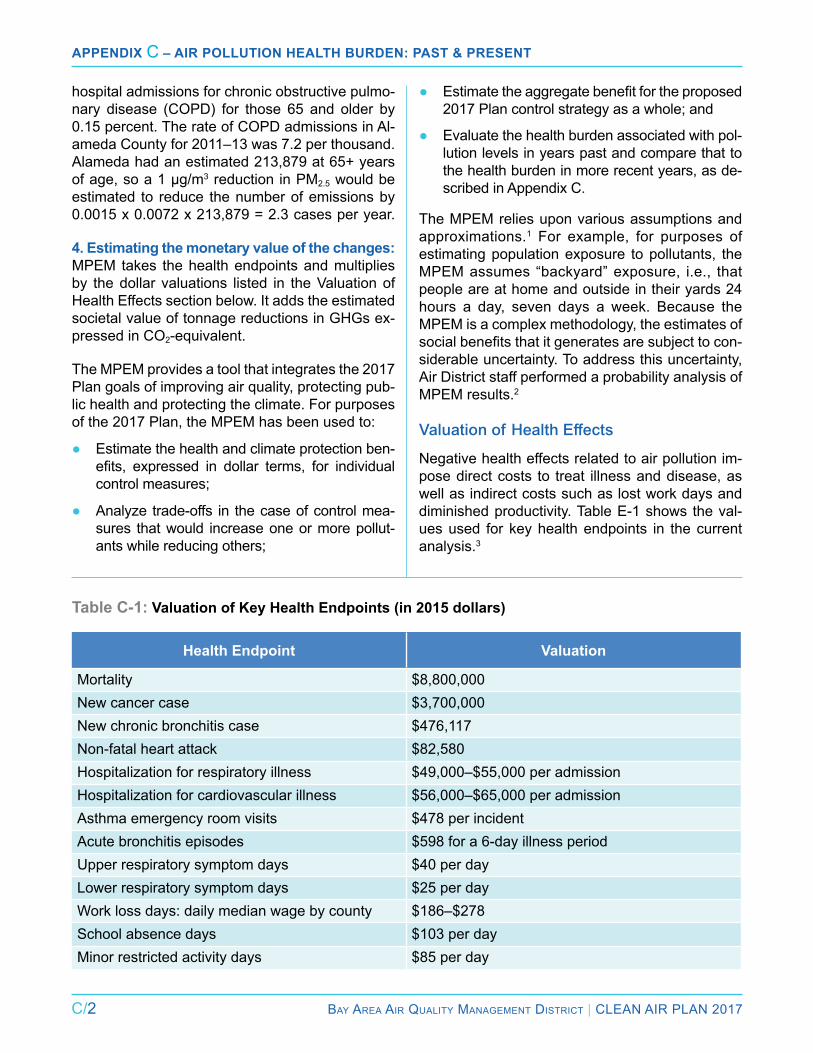
C/2 Bay area air Quality ManageMent District | Clean air Plan 2017
Appendix C – Air pollution HeAltH Burden: pAst & present
hospital admissions for chronic obstructive pulmo-nary disease (COPD) for those 65 and older by 0.15 percent. The rate of COPD admissions in Al-ameda County for 2011–13 was 7.2 per thousand. Alameda had an estimated 213,879 at 65+ years of age, so a 1 μg/m3 reduction in PM2.5 would be estimated to reduce the number of emissions by 0.0015 x 0.0072 x 213,879 = 2.3 cases per year.
4. Estimating the monetary value of the changes: MPeM takes the health endpoints and multiplies by the dollar valuations listed in the Valuation of Health Effects section below. It adds the estimated societal value of tonnage reductions in GHGs ex-pressed in CO2-equivalent.
The MPeM provides a tool that integrates the 2017 Plan goals of improving air quality, protecting pub-lic health and protecting the climate. For purposes of the 2017 Plan, the MPeM has been used to:
● estimate the health and climate protection ben-efits, expressed in dollar terms, for individual control measures;
● analyze trade-offs in the case of control mea-sures that would increase one or more pollut-ants while reducing others;
● Estimate the aggregate benefit for the proposed 2017 Plan control strategy as a whole; and
● evaluate the health burden associated with pol-lution levels in years past and compare that to the health burden in more recent years, as de-scribed in Appendix C.
The MPeM relies upon various assumptions and approximations.1 For example, for purposes of estimating population exposure to pollutants, the MPEM assumes “backyard” exposure, i.e., that people are at home and outside in their yards 24 hours a day, seven days a week. Because the MPeM is a complex methodology, the estimates of social benefits that it generates are subject to con-siderable uncertainty. To address this uncertainty, Air District staff performed a probability analysis of MPEM results.2
Valuation of Health Effects
negative health effects related to air pollution im-pose direct costs to treat illness and disease, as well as indirect costs such as lost work days and diminished productivity. Table E-1 shows the val-ues used for key health endpoints in the current analysis.3
Health Endpoint Valuation
Mortality $8,800,000new cancer case $3,700,000new chronic bronchitis case $476,117non-fatal heart attack $82,580Hospitalization for respiratory illness $49,000–$55,000 per admissionHospitalization for cardiovascular illness $56,000–$65,000 per admissionasthma emergency room visits $478 per incidentacute bronchitis episodes $598 for a 6-day illness periodUpper respiratory symptom days $40 per daylower respiratory symptom days $25 per dayWork loss days: daily median wage by county $186–$278 School absence days $103 per dayMinor restricted activity days $85 per day
Table C-1: Valuation of Key Health Endpoints (in 2015 dollars)
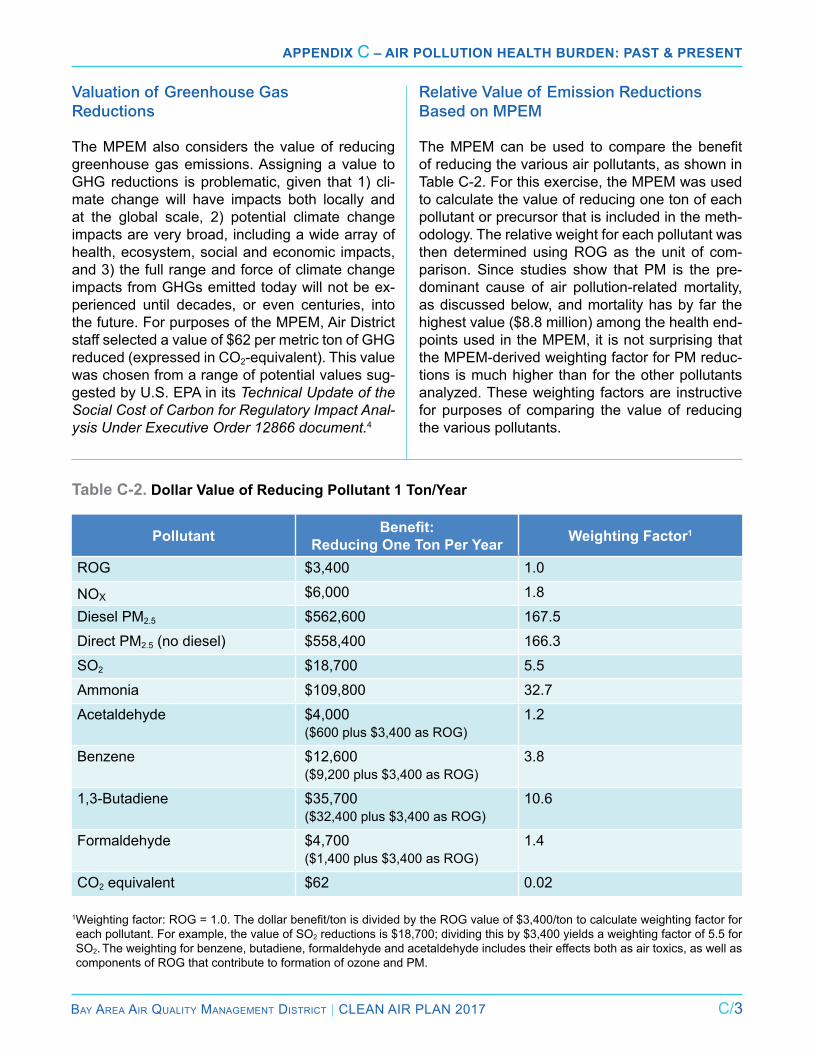
Bay area air Quality ManageMent District | Clean air Plan 2017 C/3
Appendix C – Air pollution HeAltH Burden: pAst & present
Valuation of Greenhouse Gas Reductions
The MPeM also considers the value of reducing greenhouse gas emissions. Assigning a value to GHG reductions is problematic, given that 1) cli-mate change will have impacts both locally and at the global scale, 2) potential climate change impacts are very broad, including a wide array of health, ecosystem, social and economic impacts, and 3) the full range and force of climate change impacts from GHGs emitted today will not be ex-perienced until decades, or even centuries, into the future. For purposes of the MPEM, Air District staff selected a value of $62 per metric ton of GHG reduced (expressed in CO2-equivalent). This value was chosen from a range of potential values sug-gested by U.S. EPA in its Technical Update of the Social Cost of Carbon for Regulatory Impact Anal-ysis Under Executive Order 12866 document.4
Relative Value of Emission Reductions Based on MPEM
The MPEM can be used to compare the benefit of reducing the various air pollutants, as shown in Table C-2. For this exercise, the MPEM was used to calculate the value of reducing one ton of each pollutant or precursor that is included in the meth-odology. The relative weight for each pollutant was then determined using rOG as the unit of com-parison. Since studies show that PM is the pre-dominant cause of air pollution-related mortality, as discussed below, and mortality has by far the highest value ($8.8 million) among the health end-points used in the MPeM, it is not surprising that the MPeM-derived weighting factor for PM reduc-tions is much higher than for the other pollutants analyzed. These weighting factors are instructive for purposes of comparing the value of reducing the various pollutants.
Pollutant Benefit: Reducing One Ton Per Year Weighting Factor1
rOG $3,400 1.0
nOX $6,000 1.8
Diesel PM2.5 $562,600 167.5
Direct PM2.5 (no diesel) $558,400 166.3
SO2 $18,700 5.5
ammonia $109,800 32.7
acetaldehyde $4,000 ($600 plus $3,400 as ROG)
1.2
Benzene $12,600 ($9,200 plus $3,400 as rOG)
3.8
1,3-Butadiene $35,700 ($32,400 plus $3,400 as rOG)
10.6
Formaldehyde $4,700 ($1,400 plus $3,400 as rOG)
1.4
CO2 equivalent $62 0.02
Table C-2. Dollar Value of Reducing Pollutant 1 Ton/Year
1Weighting factor: ROG = 1.0. The dollar benefit/ton is divided by the ROG value of $3,400/ton to calculate weighting factor for each pollutant. For example, the value of SO2 reductions is $18,700; dividing this by $3,400 yields a weighting factor of 5.5 for SO2. The weighting for benzene, butadiene, formaldehyde and acetaldehyde includes their effects both as air toxics, as well as components of ROG that contribute to formation of ozone and PM.

C/4 Bay area air Quality ManageMent District | Clean air Plan 2017
Appendix C – Air pollution HeAltH Burden: pAst & present
Health Burden analysis
The Air District analyzed the health burden from air pollution for the Bay area 2010 Clean Air Plan. That analysis has been up-
dated in this appendix based upon air quality data for year 2015 and valuations of health endpoints expressed in 2015 dollars.
analysis of trends in monitoring data shows that in recent decades, Bay area air quality has improved dramatically. This has been accomplished even as regional population, the number of motor vehi-cles and miles driven, and the value of the region’s economic production have grown significantly. Our progress in improving air quality is due to compre-hensive federal, state and local programs to re-duce emissions from both stationary and mobile sources of air pollutants.
The purpose of this analysis is to estimate the health and social impacts of air pollution in the Bay area today compared with the earliest peri-od for which reliable ambient air quality measure-ments are available. To facilitate comparison be-tween earlier years and today, we have calculated the benefit of pollutant reductions based upon the current Bay Area population. That is, the health burden is analyzed as if today’s population were exposed to the pollution levels that prevailed in earlier years, and then compared to the health burden associated with current air pollution levels.
The good news is that exposure to unhealthy con-centrations of local air pollutants in the Bay area—ozone, particulate matter (PM), and air toxics—and hence their health effects, have been reduced by more than half since the 1970 Clean air act was enacted. Despite this progress, a variety of health effects, including premature deaths, are still asso-ciated with exposure to air pollution. These health effects result in direct and indirect economic im-pacts to the region that are valued in billions of dollars per year.
Methodology
The analysis presented here is based upon the Multi-Pollutant Evaluation Method. The MPEM, which draws upon U.S. EPA’s BenMAP method-
ology,5 is based upon various assumptions and approximations described in the MPEM Technical Document.6
Air Toxics
The air toxic health effects considered in this ap-pendix are limited to cancer. The Air District and arB began regular air toxics monitoring in the late 1980s. However, some toxics such as form-aldehyde and acetaldehyde were not monitored until several years later. Except for diesel PM, esti-mates were made of the annual mean for the ear-liest year available and for 2015.
Diesel PM, the air toxic with the greatest health impact, cannot presently be measured directly. In-direct estimates were made for recent years using elemental carbon (eC) measurements for various Air District sites. For earlier years, estimates were made using Coefficient of Haze measurements7, along with PM10 and its constituents.
Ozone
The Air District has monitored ozone since the 1950s, and since 1968 has had a spatially dense set of ozone measurements. These measure-ments were used to estimate population exposure for 2015 and what the exposure would have been if the ozone levels had not been reduced since 1970. For purposes of this analysis, we estimat-ed the health impact of population exposure to the anthropogenic (man-made) portion of ozone, i.e., ozone in excess of natural background levels. The average background level of ozone in the Bay Area is on the order of 45 parts per billion (ppb), so the analysis focused on estimating the health effects related to exposure to hourly ozone con-centrations above 45 ppb.8
PM2.5
PM2.5 consists of many components, some an-thropogenic (man-made), some biogenic (natu-rally occurring). The health burden of PM2.5 was based on the amount of anthropogenic PM2.5, subtracting natural background PM2.5 (sea salt, windblown dust, etc.) which is estimated to aver-age about 3 micrograms per cubic meter (μg/m3).
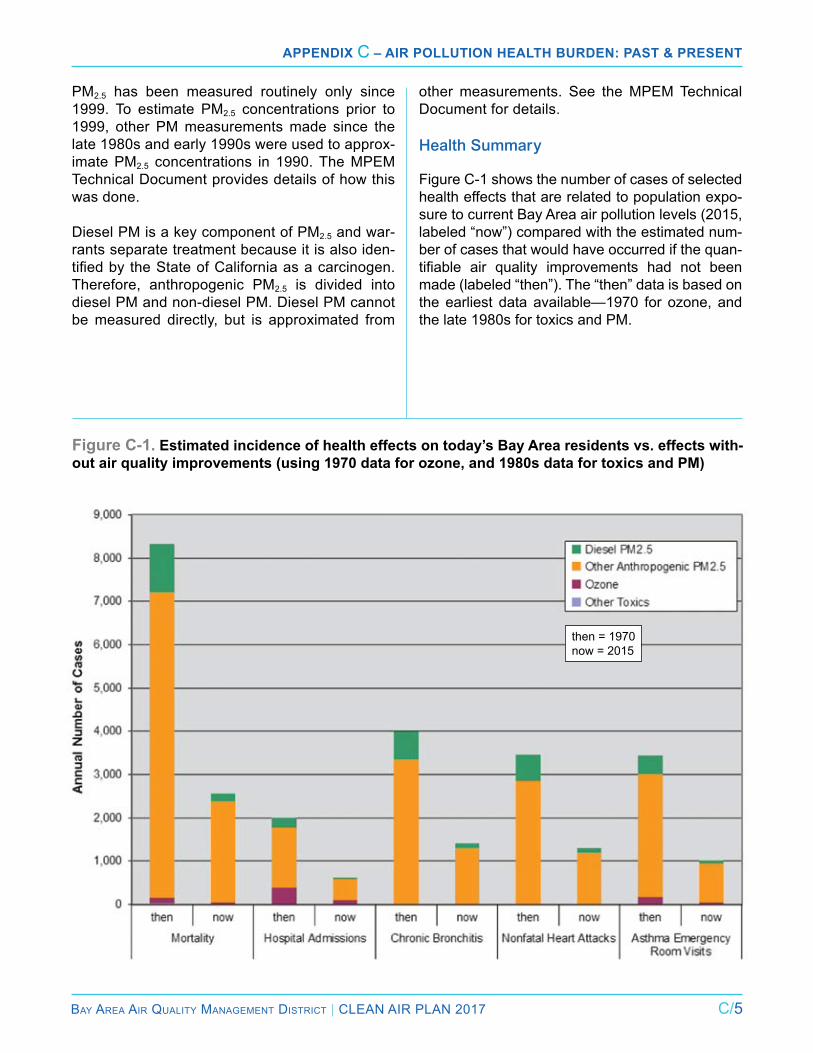
Bay area air Quality ManageMent District | Clean air Plan 2017 C/5
Appendix C – Air pollution HeAltH Burden: pAst & present
PM2.5 has been measured routinely only since 1999. To estimate PM2.5 concentrations prior to 1999, other PM measurements made since the late 1980s and early 1990s were used to approx-imate PM2.5 concentrations in 1990. The MPEM Technical Document provides details of how this was done.
Diesel PM is a key component of PM2.5 and war-rants separate treatment because it is also iden-tified by the State of California as a carcinogen. Therefore, anthropogenic PM2.5 is divided into diesel PM and non-diesel PM. Diesel PM cannot be measured directly, but is approximated from
other measurements. See the MPEM Technical Document for details.
Health Summary
Figure C-1 shows the number of cases of selected health effects that are related to population expo-sure to current Bay Area air pollution levels (2015, labeled “now”) compared with the estimated num-ber of cases that would have occurred if the quan-tifiable air quality improvements had not been made (labeled “then”). The “then” data is based on the earliest data available—1970 for ozone, and the late 1980s for toxics and PM.
Figure C-1. Estimated incidence of health effects on today’s Bay Area residents vs. effects with-out air quality improvements (using 1970 data for ozone, and 1980s data for toxics and PM)
then = 1970now = 2015
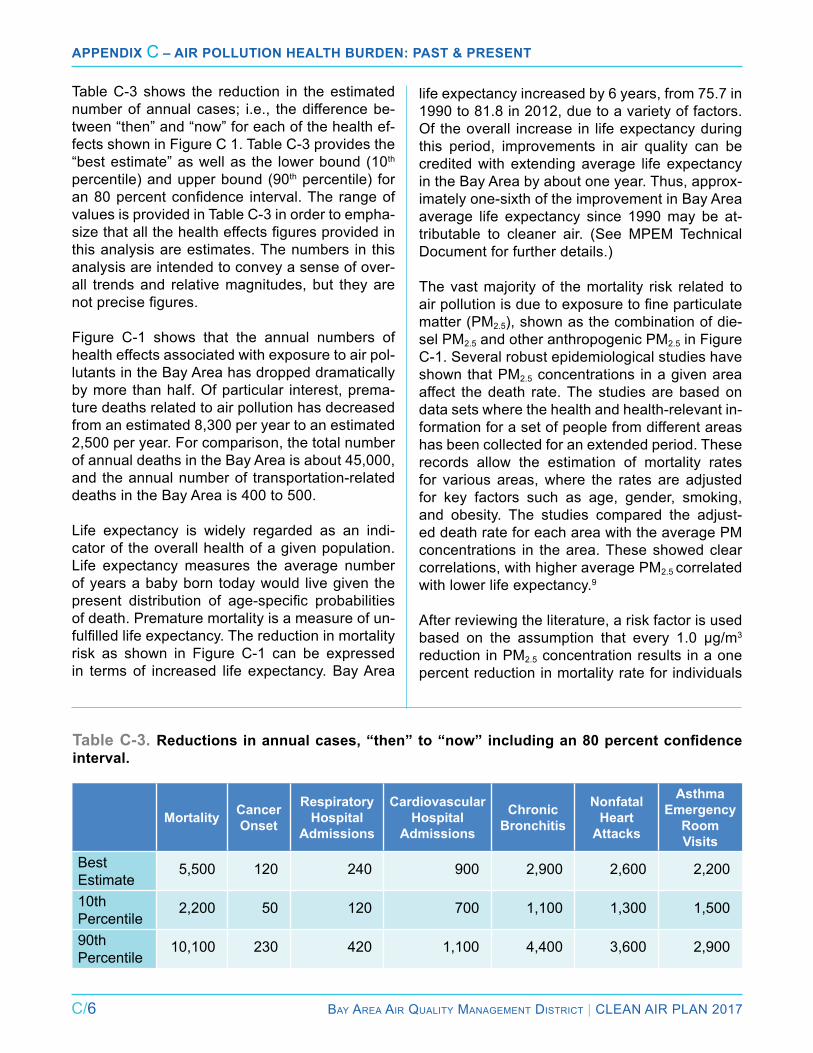
C/6 Bay area air Quality ManageMent District | Clean air Plan 2017
Appendix C – Air pollution HeAltH Burden: pAst & present
Table C-3 shows the reduction in the estimated number of annual cases; i.e., the difference be-tween “then” and “now” for each of the health ef-fects shown in Figure C 1. Table C-3 provides the “best estimate” as well as the lower bound (10th percentile) and upper bound (90th percentile) for an 80 percent confidence interval. The range of values is provided in Table C-3 in order to empha-size that all the health effects figures provided in this analysis are estimates. The numbers in this analysis are intended to convey a sense of over-all trends and relative magnitudes, but they are not precise figures. Figure C-1 shows that the annual numbers of health effects associated with exposure to air pol-lutants in the Bay area has dropped dramatically by more than half. Of particular interest, prema-ture deaths related to air pollution has decreased from an estimated 8,300 per year to an estimated 2,500 per year. For comparison, the total number of annual deaths in the Bay Area is about 45,000, and the annual number of transportation-related deaths in the Bay Area is 400 to 500.
life expectancy is widely regarded as an indi-cator of the overall health of a given population. life expectancy measures the average number of years a baby born today would live given the present distribution of age-specific probabilities of death. Premature mortality is a measure of un-fulfilled life expectancy. The reduction in mortality risk as shown in Figure C-1 can be expressed in terms of increased life expectancy. Bay Area
Table C-3. Reductions in annual cases, “then” to “now” including an 80 percent confidence interval.
Mortality Cancer Onset
Respiratory Hospital
Admissions
Cardiovascular Hospital
Admissions
Chronic Bronchitis
Nonfatal Heart
Attacks
Asthma Emergency
Room Visits
Best estimate
5,500 120 240 900 2,900 2,600 2,200
10th Percentile
2,200 50 120 700 1,100 1,300 1,500
90th Percentile
10,100 230 420 1,100 4,400 3,600 2,900
life expectancy increased by 6 years, from 75.7 in 1990 to 81.8 in 2012, due to a variety of factors. Of the overall increase in life expectancy during this period, improvements in air quality can be credited with extending average life expectancy in the Bay Area by about one year. Thus, approx-imately one-sixth of the improvement in Bay area average life expectancy since 1990 may be at-tributable to cleaner air. (See MPEM Technical Document for further details.)
The vast majority of the mortality risk related to air pollution is due to exposure to fine particulate matter (PM2.5), shown as the combination of die-sel PM2.5 and other anthropogenic PM2.5 in Figure C-1. Several robust epidemiological studies have shown that PM2.5 concentrations in a given area affect the death rate. The studies are based on data sets where the health and health-relevant in-formation for a set of people from different areas has been collected for an extended period. These records allow the estimation of mortality rates for various areas, where the rates are adjusted for key factors such as age, gender, smoking, and obesity. The studies compared the adjust-ed death rate for each area with the average PM concentrations in the area. These showed clear correlations, with higher average PM2.5 correlated with lower life expectancy.9
after reviewing the literature, a risk factor is used based on the assumption that every 1.0 μg/m3
reduction in PM2.5 concentration results in a one percent reduction in mortality rate for individuals
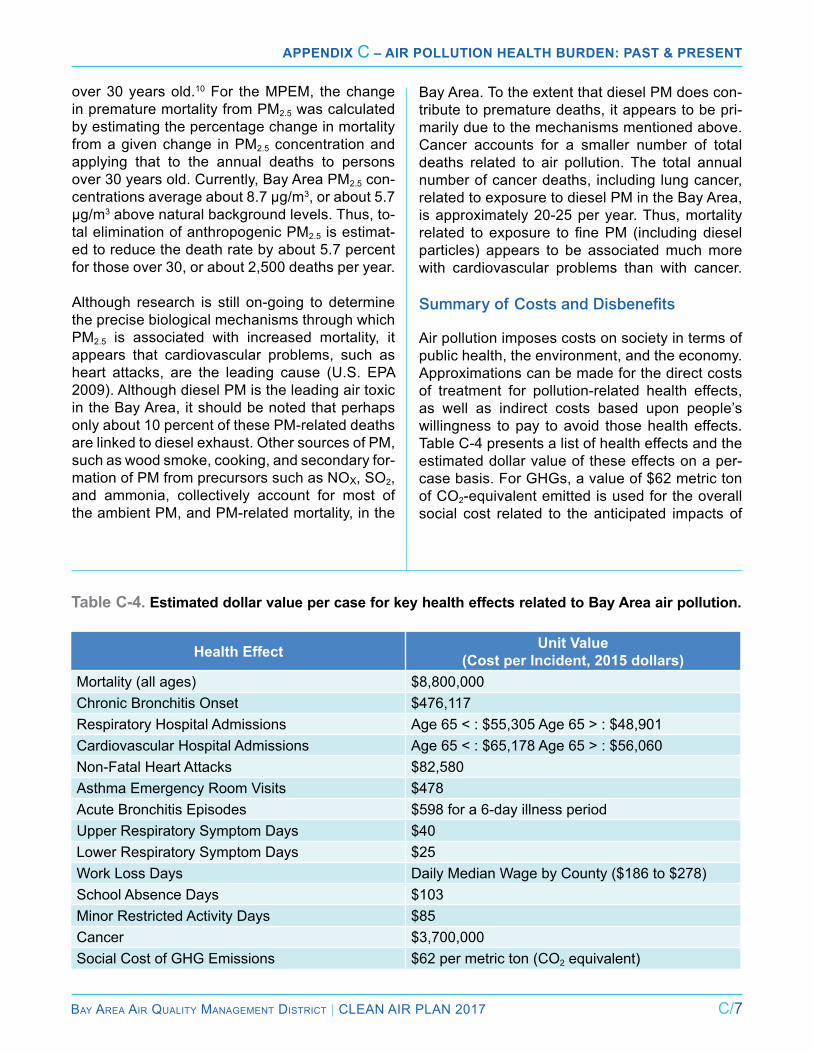
Bay area air Quality ManageMent District | Clean air Plan 2017 C/7
Appendix C – Air pollution HeAltH Burden: pAst & present
over 30 years old.10 For the MPEM, the change in premature mortality from PM2.5 was calculated by estimating the percentage change in mortality from a given change in PM2.5 concentration and applying that to the annual deaths to persons over 30 years old. Currently, Bay Area PM2.5 con-centrations average about 8.7 μg/m3, or about 5.7 μg/m3 above natural background levels. Thus, to-tal elimination of anthropogenic PM2.5 is estimat-ed to reduce the death rate by about 5.7 percent for those over 30, or about 2,500 deaths per year.
although research is still on-going to determine the precise biological mechanisms through which PM2.5 is associated with increased mortality, it appears that cardiovascular problems, such as heart attacks, are the leading cause (U.S. EPA 2009). Although diesel PM is the leading air toxic in the Bay area, it should be noted that perhaps only about 10 percent of these PM-related deaths are linked to diesel exhaust. Other sources of PM, such as wood smoke, cooking, and secondary for-mation of PM from precursors such as nOX, SO2, and ammonia, collectively account for most of the ambient PM, and PM-related mortality, in the
Bay Area. To the extent that diesel PM does con-tribute to premature deaths, it appears to be pri-marily due to the mechanisms mentioned above. Cancer accounts for a smaller number of total deaths related to air pollution. The total annual number of cancer deaths, including lung cancer, related to exposure to diesel PM in the Bay area, is approximately 20-25 per year. Thus, mortality related to exposure to fine PM (including diesel particles) appears to be associated much more with cardiovascular problems than with cancer.
Summary of Costs and Disbenefits
air pollution imposes costs on society in terms of public health, the environment, and the economy. approximations can be made for the direct costs of treatment for pollution-related health effects, as well as indirect costs based upon people’s willingness to pay to avoid those health effects. Table C-4 presents a list of health effects and the estimated dollar value of these effects on a per-case basis. For GHGs, a value of $62 metric ton of CO2-equivalent emitted is used for the overall social cost related to the anticipated impacts of
Table C-4. Estimated dollar value per case for key health effects related to Bay Area air pollution.
Health Effect Unit Value (Cost per Incident, 2015 dollars)
Mortality (all ages) $8,800,000Chronic Bronchitis Onset $476,117respiratory Hospital admissions Age 65 < : $55,305 Age 65 > : $48,901Cardiovascular Hospital admissions Age 65 < : $65,178 Age 65 > : $56,060Non-Fatal Heart Attacks $82,580asthma emergency room Visits $478 acute Bronchitis episodes $598 for a 6-day illness periodUpper Respiratory Symptom Days $40Lower Respiratory Symptom Days $25Work Loss Days Daily Median Wage by County ($186 to $278)School Absence Days $103 Minor Restricted Activity Days $85Cancer $3,700,000Social Cost of GHG Emissions $62 per metric ton (CO2 equivalent)
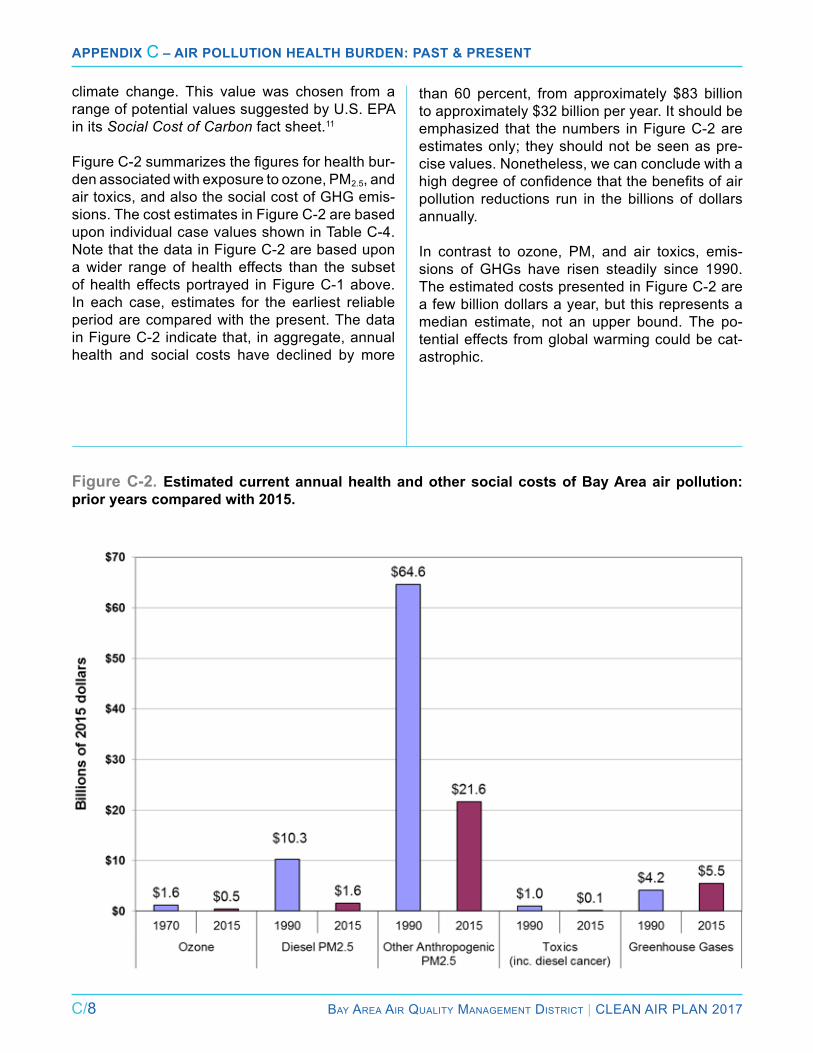
C/8 Bay area air Quality ManageMent District | Clean air Plan 2017
Appendix C – Air pollution HeAltH Burden: pAst & present
climate change. This value was chosen from a range of potential values suggested by U.S. EPA in its Social Cost of Carbon fact sheet.11
Figure C-2 summarizes the figures for health bur-den associated with exposure to ozone, PM2.5, and air toxics, and also the social cost of GHG emis-sions. The cost estimates in Figure C-2 are based upon individual case values shown in Table C-4. Note that the data in Figure C-2 are based upon a wider range of health effects than the subset of health effects portrayed in Figure C-1 above. in each case, estimates for the earliest reliable period are compared with the present. The data in Figure C-2 indicate that, in aggregate, annual health and social costs have declined by more
than 60 percent, from approximately $83 billion to approximately $32 billion per year. It should be emphasized that the numbers in Figure C-2 are estimates only; they should not be seen as pre-cise values. Nonetheless, we can conclude with a high degree of confidence that the benefits of air pollution reductions run in the billions of dollars annually.
in contrast to ozone, PM, and air toxics, emis-sions of GHGs have risen steadily since 1990. The estimated costs presented in Figure C-2 are a few billion dollars a year, but this represents a median estimate, not an upper bound. The po-tential effects from global warming could be cat-astrophic.
Figure C-2. Estimated current annual health and other social costs of Bay Area air pollution: prior years compared with 2015.
Bay area air Quality ManageMent District | Clean air Plan 2017 C/9
Appendix C – Air pollution HeAltH Burden: pAst & present
Summary of Key Findings
The analysis described in this appendix indicates that due to improved air quality in the Bay area, annual health effects, and the related social and economic cost of these health effects, have de-clined by more than 60 percent over the past sev-eral decades. The estimated number of premature deaths related to air pollution in the Bay area de-creased from approximately 8,300 per year in 1990 to about 2,500 per year in 2015. The reduction in
premature deaths related to air pollution over the past two and a half decades has contributed to an increase in average life expectancy. Improved air quality is estimated to have extended average life expectancy on the order of one year per Bay area resident. Despite this substantial progress, Bay Area residents continue to experience significant health effects from exposure to air pollution. These health effects impose on-going costs to the indi-viduals who experience these impacts and to the region as a whole.
Footnotes
1 The various assumptions and approximations embedded in the method are described in the MPeM Technical Document, available on the Air District’s website.
2 District staff performed an uncertainty analysis using the Monte Carlo method to evaluate the MPeM calculations for each control measure.
3 Valuations of health effects are explained in Section 5 in the MPEM Technical Document: http://www.baaqmd.gov/research-and-data/research-and-modeling.
4 https://www.whitehouse.gov/sites/default/files/omb/inforeg/scc-tsd-final-july-2015.pdf
5 https://www.epa.gov/benmap
6 MPEM Technical Document: http://www.baaqmd.gov/research-and-data/research-and-modeling.
7 Coefficient of Haze (COH) is a measurement of PM that is highly correlated with elemental carbon (EC).
8 For further discussion of this approach, see The Health
Benefits of Reduced Tropospheric Ozone in California, by Bart Ostro, Tran Hien, and Jonathan i levy, JaWMa July 2006.
9 See Pope et al. Particulate Air Pollution as a Predictor of Mortality in a Prospective Study of U.S. Adults, american Journal of Respiratory and Critical Care Medicine, Vol. 151, No. 3_pt_1 (1995), pp. 669-674. Also see Krewski et al. Extended Follow-Up and Spatial Analysis of the American Cancer Society Study Linking Particulate Air Pollution and Mortality. Health Effects Institute, Number 140, May 2009.
10 The key study serving as the basis of our estimate is the Expanded expert judgment assessment of the concentration-response relationship between PM2.5 exposure and mortality, prepared for OAQPS-EPA by Industrial Economics Inc, September 21, 2006. A summary of this study is provided in Roman et al. 2008.
11 https://www3.epa.gov/climatechange/Downloads/EPAactivities/social-cost-carbon.pdf.
C/10 Bay area air Quality ManageMent District | Clean air Plan 2017
Appendix C – Air pollution HeAltH Burden: pAst & present
ReFeRences
Arias, E., 2002: United States Life Tables: Nation-al Vital Statistics Reports; Vol. 51, No. 3. Hyatts-ville, Maryland: National Center for Health Statis-tics. Accessed June 19, 2015. http://www.cdc.gov/nchs/data/nvsr/nvsr51/nvsr51_03.pdf.
BAAQMD, Multi-Pollutant Evaluation Method Technical Document, November 2016
Krewski, D., Jerrett, M., Burnett, R.T., Ma, R., Hughes, E., Shi, .Y, Turner, M.C., Pope, CA III, Thurston, G., Calle, E.E., Thun, M.J., 2009: Ex-tended Follow-Up and Spatial Analysis of the American Cancer Society Study Linking Particu-late Air Pollution and Mortality. Health Effects In-stitute, Number 140, May 2009. Available at http://ephtracking.cdc.gov/docs/RR140-Krewski.pdf.
Ostro, Bart; Tran, Hien; Levy, Jonathan, 2006: The health benefits of reduced tropospheric ozone in California. Journal of air & Waste Management Assn., 56: 1007–1021.
Pope, C.A. III, Thun, M.J., Namboodiri, M.M., Dockery, D.W., Evans, J.S., Speizer, F.E., Heath, C.W., 1995: Particulate air pollution as a predictor of mortality in a prospective study of U.S. adults. Am J Respir Crit Care Med, 151:669–674.
Roman, H.A., Walker, K.D., Walsh, T.L., Conner, L., Richmond, H.M., et al., 2008: Expert judgment assessment of the mortality impact of changes in ambient fine particulate matter in the US. Environ Sci Technol., 42:2268–2274.
United States Environmental Protection Agency, 2006: Expanded expert judgment assessment of the concentration-response relationship between PM2.5 exposure and mortality, prepared for Oa-QPS-EPA by Industrial Economics Inc. September 21, 2006.
United States Environmental Protection Agency, 2009: Integrated Science Assessment for Particu-late Matter, December 2009. EPA/600/R-08/139F.
Bay area air Quality ManageMent District | Clean air Plan 2017 D/1
Air QuAlity Modeling
Appendix d
although there is no regulatory require-ment to perform air quality modeling for the 2017 Plan, results of recent
modeling help to inform the air District’s air quality planning. This appendix describes the air District’s recent air quality modeling work.
BAAQMD Modeling History and Scope
From 1989 to 2006, the air District’s air quality modeling effort primarily focused on ozone. PM and toxic air contaminants (TaCs) have since been added to the modeling program. Because of the Bay area’s relatively low current PM and ozone levels, the air District is not required to use air quality models to demonstrate attainment of federal air quality standards. nor does the Health & Safety Code require the use of air quality models in meeting state air quality standards. However, the air District is committed to continue working with neighboring districts and arB to study regional ozone and PM formation and transport through air quality modeling and data analysis.
in summary, the goals of modeling at the air Dis-trict include:
● better understanding of ozone and particulate matter formation in the Bay area;
● assessing the benefits of various proposedand adopted emissions control measures;
● weighing alternative emissions control strate-gies for future planning;
● estimating human exposure to pollutants and associated health impacts;
● analyzing potential impacts of land use and development; and
● providing modeling support to air District pro-grams and functions such as planning, per-mit evaluation, rule development, grants and incentives, climate protection, and the Care Program.
The air District also participates in collaborative regional air quality studies such as the Central California Ozone Study (CCOS) and the California regional Particulate air Quality Study (CrPaQS). Collaborators include the U.S. ePa, arB, the na-tional Oceanic and atmospheric administration (nOaa), the national aeronautics and Space ad-ministration (naSa), universities and neighboring districts, especially the San Joaquin Valley air Pol-lution Control District and the Sacramento Metro-politan air Quality Management District.
Modeling Methodology
an air quality model estimates pollutant concen-trations by accounting for pollutant emission, transport, mixing, chemical transformation in the atmosphere, and removal through deposition to the ground. The air District uses two state-of-the-science air quality models that are publicly
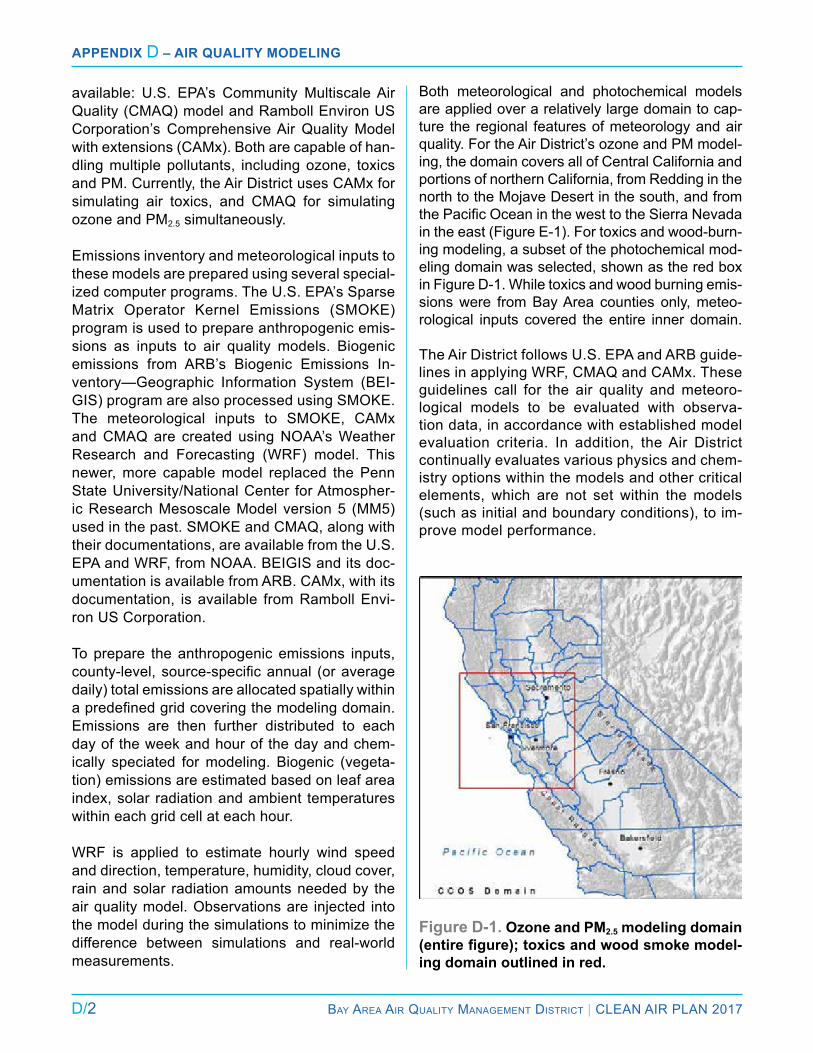
D/2 Bay area air Quality ManageMent District | Clean air Plan 2017
Appendix D – Air QuAlity Modeling
available: U.S. ePa’s Community Multiscale air Quality (CMaQ) model and ramboll environ US Corporation’s Comprehensive air Quality Model with extensions (CaMx). Both are capable of han-dling multiple pollutants, including ozone, toxics and PM. Currently, the air District uses CaMx for simulating air toxics, and CMaQ for simulating ozone and PM2.5 simultaneously.
emissions inventory and meteorological inputs to these models are prepared using several special-ized computer programs. The U.S. ePa’s Sparse Matrix Operator Kernel emissions (SMOKe) program is used to prepare anthropogenic emis-sions as inputs to air quality models. Biogenic emissions from arB’s Biogenic emissions in-ventory—Geographic information System (Bei-GiS) program are also processed using SMOKe. The meteorological inputs to SMOKe, CaMx and CMaQ are created using nOaa’s Weather research and Forecasting (WrF) model. This newer, more capable model replaced the Penn State University/national Center for atmospher-ic research Mesoscale Model version 5 (MM5) used in the past. SMOKe and CMaQ, along with their documentations, are available from the U.S. ePa and WrF, from nOaa. BeiGiS and its doc-umentation is available from arB. CaMx, with its documentation, is available from ramboll envi-ron US Corporation.
To prepare the anthropogenic emissions inputs, county-level,source-specificannual (oraveragedaily) total emissions are allocated spatially within apredefinedgridcoveringthemodelingdomain.emissions are then further distributed to each day of the week and hour of the day and chem-ically speciated for modeling. Biogenic (vegeta-tion) emissions are estimated based on leaf area index, solar radiation and ambient temperatures within each grid cell at each hour.
WrF is applied to estimate hourly wind speed and direction, temperature, humidity, cloud cover, rain and solar radiation amounts needed by the air quality model. Observations are injected into the model during the simulations to minimize the difference between simulations and real-world measurements.
Both meteorological and photochemical models are applied over a relatively large domain to cap-ture the regional features of meteorology and air quality. For the air District’s ozone and PM model-ing, the domain covers all of Central California and portions of northern California, from redding in the north to the Mojave Desert in the south, and from thePacificOceaninthewesttotheSierraNevadain the east (Figure e-1). For toxics and wood-burn-ing modeling, a subset of the photochemical mod-eling domain was selected, shown as the red box in Figure D-1. While toxics and wood burning emis-sions were from Bay area counties only, meteo-rological inputs covered the entire inner domain.
The air District follows U.S. ePa and arB guide-lines in applying WrF, CMaQ and CaMx. These guidelines call for the air quality and meteoro-logical models to be evaluated with observa-tion data, in accordance with established model evaluation criteria. in addition, the air District continually evaluates various physics and chem-istry options within the models and other critical elements, which are not set within the models (such as initial and boundary conditions), to im-prove model performance.
Figure D-1. Ozone and PM2.5 modeling domain (entire figure); toxics and wood smoke model-ing domain outlined in red.
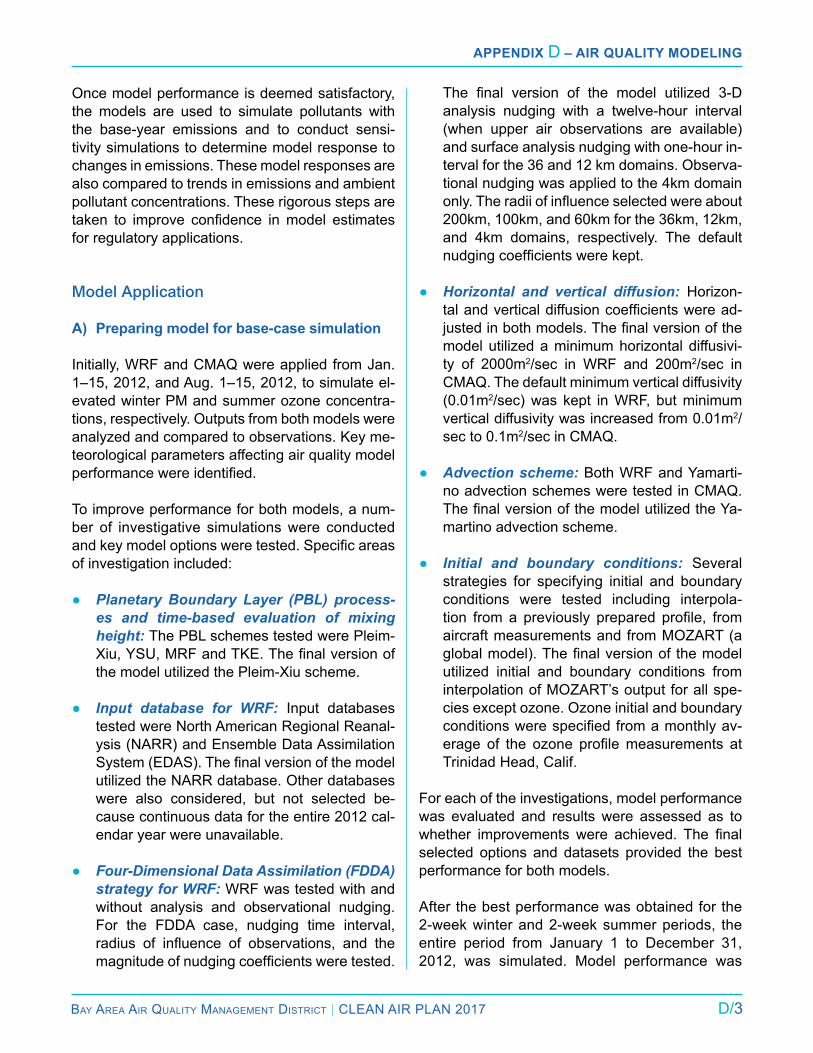
Bay area air Quality ManageMent District | Clean air Plan 2017 D/3
Appendix D – Air QuAlity Modeling
Once model performance is deemed satisfactory, the models are used to simulate pollutants with the base-year emissions and to conduct sensi-tivity simulations to determine model response to changes in emissions. These model responses are also compared to trends in emissions and ambient pollutant concentrations. These rigorous steps are taken to improve confidence inmodel estimatesfor regulatory applications.
Model Application
A) Preparing model for base-case simulation
initially, WrF and CMaQ were applied from Jan. 1–15, 2012, and aug. 1–15, 2012, to simulate el-evated winter PM and summer ozone concentra-tions, respectively. Outputs from both models were analyzed and compared to observations. Key me-teorological parameters affecting air quality model performancewereidentified.
To improve performance for both models, a num-ber of investigative simulations were conducted andkeymodeloptionsweretested.Specificareasof investigation included:
● Planetary Boundary Layer (PBL) process-es and time-based evaluation of mixing height: The PBl schemes tested were Pleim-Xiu,YSU,MRFandTKE.Thefinalversionofthe model utilized the Pleim-Xiu scheme.
● Input database for WRF: input databases tested were north american regional reanal-ysis (narr) and ensemble Data assimilation System(EDAS).Thefinalversionofthemodelutilized the narr database. Other databases were also considered, but not selected be-cause continuous data for the entire 2012 cal-endar year were unavailable.
● Four-Dimensional Data Assimilation (FDDA) strategy for WRF: WrF was tested with and without analysis and observational nudging. For the FDDa case, nudging time interval, radius of influence of observations, and themagnitudeofnudgingcoefficientsweretested.
The final version of the model utilized 3-Danalysis nudging with a twelve-hour interval (when upper air observations are available) and surface analysis nudging with one-hour in-terval for the 36 and 12 km domains. Observa-tional nudging was applied to the 4km domain only.Theradiiofinfluenceselectedwereabout200km, 100km, and 60km for the 36km, 12km, and 4km domains, respectively. The default nudgingcoefficientswerekept.
● Horizontal and vertical diffusion: Horizon-talandverticaldiffusioncoefficientsweread-justedinbothmodels.Thefinalversionofthemodel utilized a minimum horizontal diffusivi-ty of 2000m2/sec in WrF and 200m2/sec in CMaQ. The default minimum vertical diffusivity (0.01m2/sec) was kept in WrF, but minimum vertical diffusivity was increased from 0.01m2/sec to 0.1m2/sec in CMaQ.
● Advection scheme: Both WrF and Yamarti-no advection schemes were tested in CMaQ. ThefinalversionofthemodelutilizedtheYa-martino advection scheme.
● Initial and boundary conditions: Several strategies for specifying initial and boundary conditions were tested including interpola-tion from a previously prepared profile, fromaircraft measurements and from MOZarT (a globalmodel).Thefinalversionofthemodelutilized initial and boundary conditions from interpolation of MOZarT’s output for all spe-cies except ozone. Ozone initial and boundary conditionswerespecifiedfromamonthlyav-erage of the ozone profilemeasurements atTrinidad Head, Calif.
For each of the investigations, model performance was evaluated and results were assessed as to whether improvements were achieved. The finalselected options and datasets provided the best performance for both models.
after the best performance was obtained for the 2-week winter and 2-week summer periods, the entire period from January 1 to December 31, 2012, was simulated. Model performance was
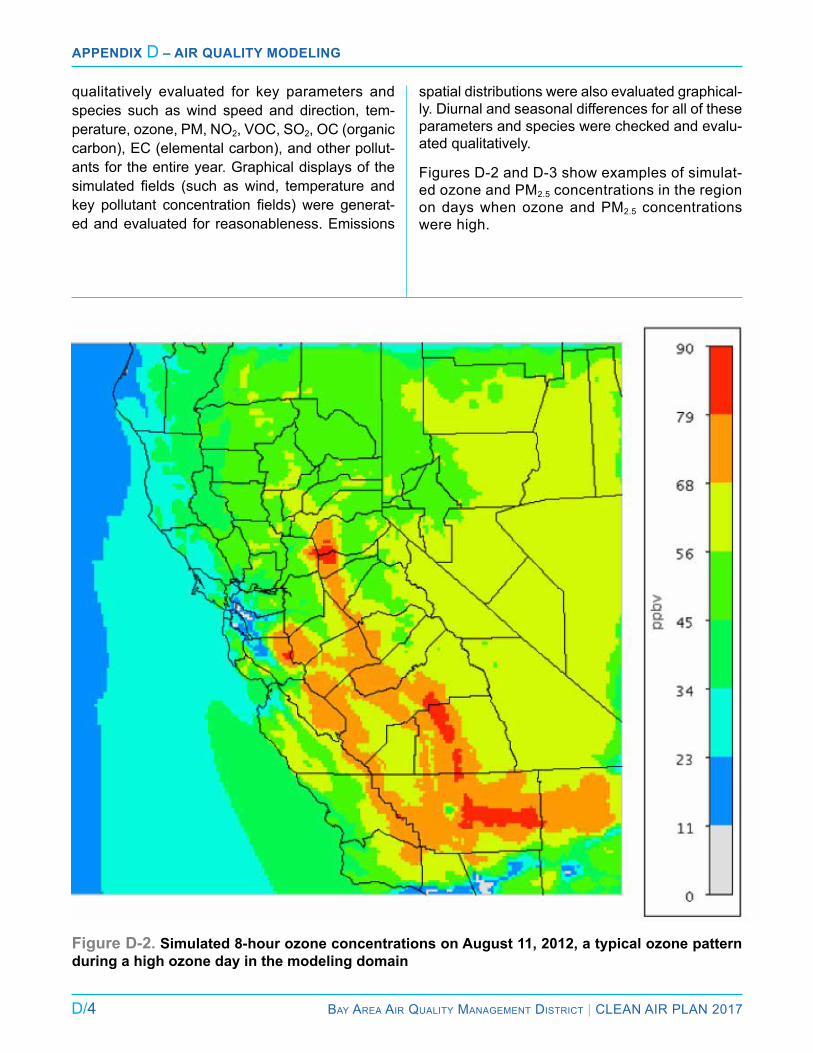
D/4 Bay area air Quality ManageMent District | Clean air Plan 2017
Appendix D – Air QuAlity Modeling
qualitatively evaluated for key parameters and species such as wind speed and direction, tem-perature, ozone, PM, nO2, VOC, SO2, OC (organic carbon), eC (elemental carbon), and other pollut-ants for the entire year. Graphical displays of the simulated fields (such aswind, temperature andkey pollutant concentration fields)were generat-ed and evaluated for reasonableness. emissions
Figure D-2. Simulated 8-hour ozone concentrations on August 11, 2012, a typical ozone pattern during a high ozone day in the modeling domain
spatial distributions were also evaluated graphical-ly. Diurnal and seasonal differences for all of these parameters and species were checked and evalu-ated qualitatively.
Figures D-2 and D-3 show examples of simulat-ed ozone and PM2.5 concentrations in the region on days when ozone and PM2.5 concentrations were high.
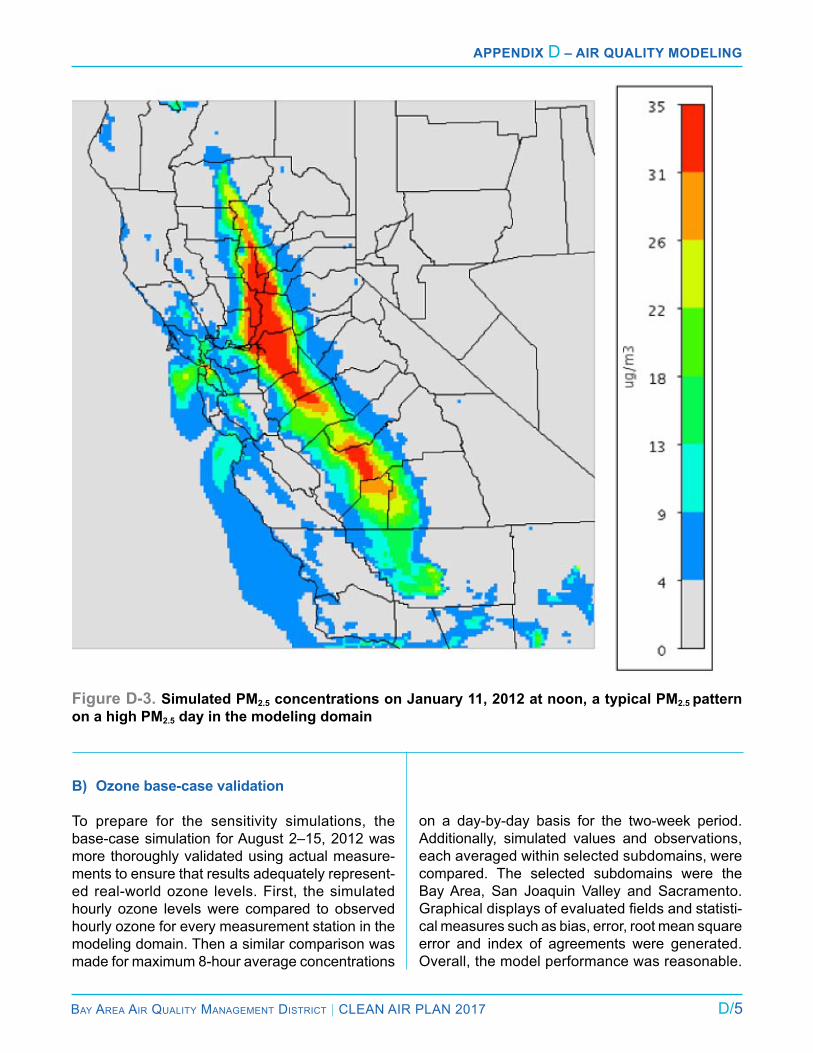
Bay area air Quality ManageMent District | Clean air Plan 2017 D/5
Appendix D – Air QuAlity Modeling
Figure D-3. Simulated PM2.5 concentrations on January 11, 2012 at noon, a typical PM2.5 pattern on a high PM2.5 day in the modeling domain
B) Ozone base-case validation
To prepare for the sensitivity simulations, the base-case simulation for august 2–15, 2012 was more thoroughly validated using actual measure-ments to ensure that results adequately represent-ed real-world ozone levels. First, the simulated hourly ozone levels were compared to observed hourly ozone for every measurement station in the modeling domain. Then a similar comparison was made for maximum 8-hour average concentrations
on a day-by-day basis for the two-week period. additionally, simulated values and observations, each averaged within selected subdomains, were compared. The selected subdomains were the Bay area, San Joaquin Valley and Sacramento. Graphicaldisplaysofevaluatedfieldsandstatisti-cal measures such as bias, error, root mean square error and index of agreements were generated. Overall, the model performance was reasonable.
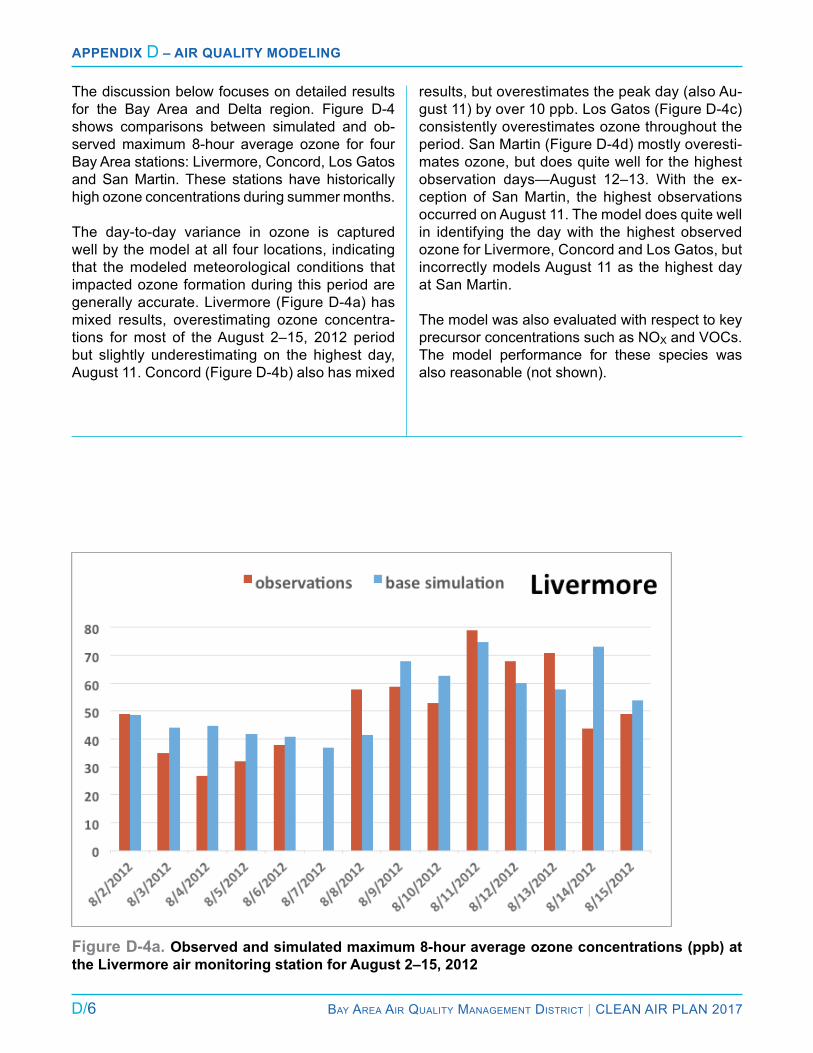
D/6 Bay area air Quality ManageMent District | Clean air Plan 2017
Appendix D – Air QuAlity Modeling
The discussion below focuses on detailed results for the Bay area and Delta region. Figure D-4 shows comparisons between simulated and ob-served maximum 8-hour average ozone for four Bay area stations: livermore, Concord, los Gatos and San Martin. These stations have historically high ozone concentrations during summer months.
The day-to-day variance in ozone is captured well by the model at all four locations, indicating that the modeled meteorological conditions that impacted ozone formation during this period are generally accurate. livermore (Figure D-4a) has mixed results, overestimating ozone concentra-tions for most of the august 2–15, 2012 period but slightly underestimating on the highest day, august 11. Concord (Figure D-4b) also has mixed
Figure D-4a. Observed and simulated maximum 8-hour average ozone concentrations (ppb) at the Livermore air monitoring station for August 2–15, 2012
results, but overestimates the peak day (also au-gust 11) by over 10 ppb. los Gatos (Figure D-4c) consistently overestimates ozone throughout the period. San Martin (Figure D-4d) mostly overesti-mates ozone, but does quite well for the highest observation days—august 12–13. With the ex-ception of San Martin, the highest observations occurred on august 11. The model does quite well in identifying the day with the highest observed ozone for livermore, Concord and los Gatos, but incorrectly models august 11 as the highest day at San Martin.
The model was also evaluated with respect to key precursor concentrations such as nOX and VOCs. The model performance for these species was also reasonable (not shown).

Bay area air Quality ManageMent District | Clean air Plan 2017 D/7
Appendix D – Air QuAlity Modeling
Figure D-4b. Observed and simulated maximum 8-hour average ozone concentrations (ppb) at the Concord air monitoring station for August 2–15, 2012
Figure D-4c. Observed and simulated maximum 8-hour average ozone concentrations (ppb) at the Los Gatos air monitoring station for August 2–15, 2012
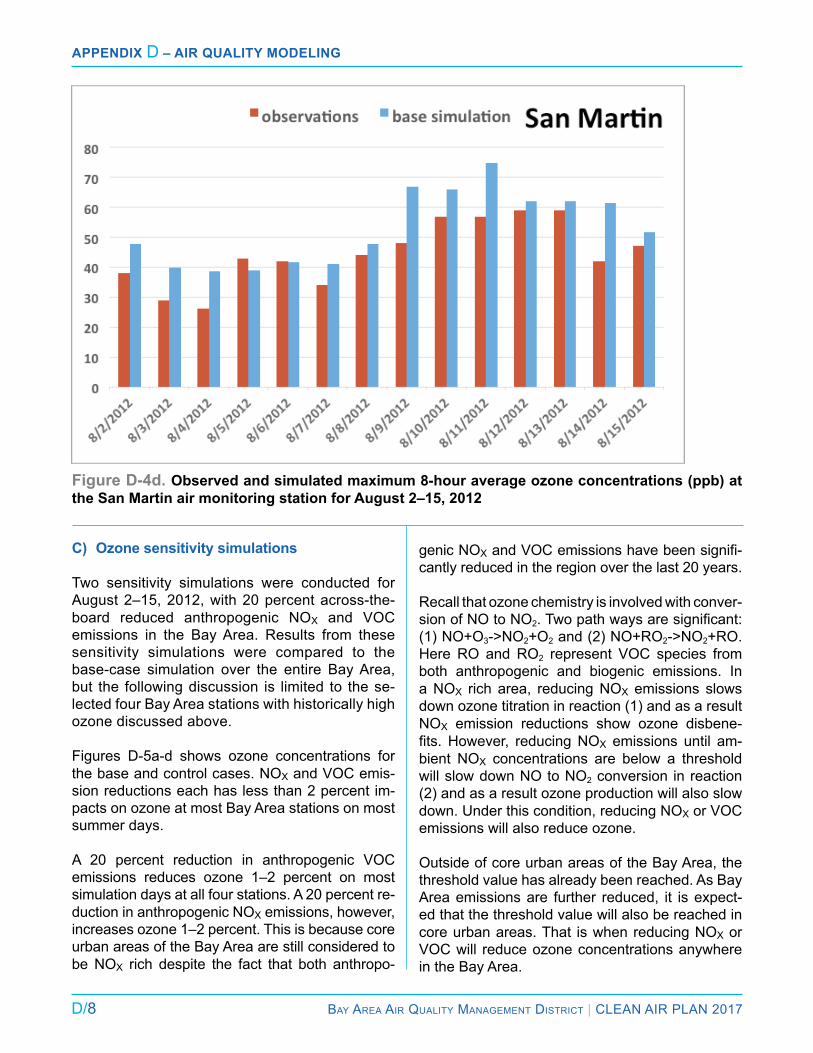
D/8 Bay area air Quality ManageMent District | Clean air Plan 2017
Appendix D – Air QuAlity Modeling
Figure D-4d. Observed and simulated maximum 8-hour average ozone concentrations (ppb) at the San Martin air monitoring station for August 2–15, 2012
C) Ozone sensitivity simulations
Two sensitivity simulations were conducted for august 2–15, 2012, with 20 percent across-the-board reduced anthropogenic nOX and VOC emissions in the Bay area. results from these sensitivity simulations were compared to the base-case simulation over the entire Bay area, but the following discussion is limited to the se-lected four Bay area stations with historically high ozone discussed above.
Figures D-5a-d shows ozone concentrations for the base and control cases. nOX and VOC emis-sion reductions each has less than 2 percent im-pacts on ozone at most Bay area stations on most summer days.
a 20 percent reduction in anthropogenic VOC emissions reduces ozone 1–2 percent on most simulation days at all four stations. a 20 percent re-duction in anthropogenic nOX emissions, however, increases ozone 1–2 percent. This is because core urban areas of the Bay area are still considered to be nOX rich despite the fact that both anthropo-
genic nOXandVOCemissionshavebeensignifi-cantly reduced in the region over the last 20 years.
recall that ozone chemistry is involved with conver-sion of nO to nO2.Twopathwaysaresignificant:(1) nO+O3->nO2+O2 and (2) nO+rO2->nO2+rO. Here rO and rO2 represent VOC species from both anthropogenic and biogenic emissions. in a nOX rich area, reducing nOX emissions slows down ozone titration in reaction (1) and as a result nOX emission reductions show ozone disbene-fits.However, reducingNOX emissions until am-bient nOX concentrations are below a threshold will slow down nO to nO2 conversion in reaction (2) and as a result ozone production will also slow down. Under this condition, reducing nOX or VOC emissions will also reduce ozone.
Outside of core urban areas of the Bay area, the threshold value has already been reached. as Bay area emissions are further reduced, it is expect-ed that the threshold value will also be reached in core urban areas. That is when reducing nOX or VOC will reduce ozone concentrations anywhere in the Bay area.
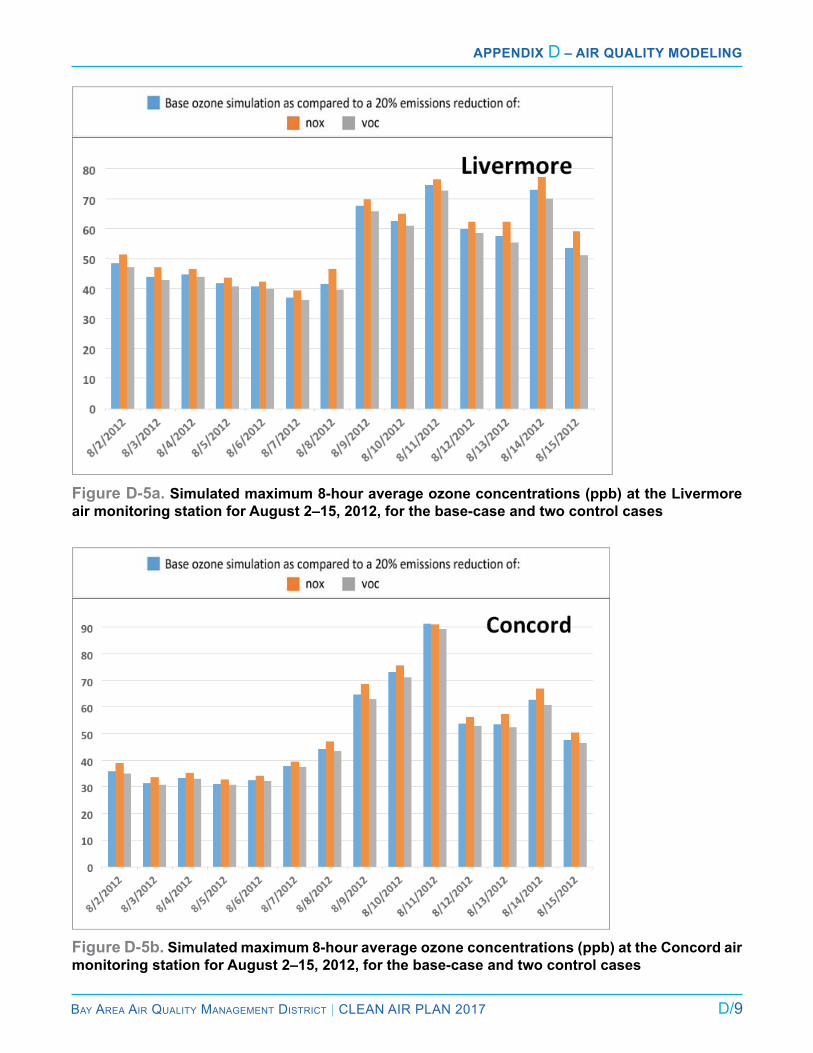
Bay area air Quality ManageMent District | Clean air Plan 2017 D/9
Appendix D – Air QuAlity Modeling
Figure D-5a. Simulated maximum 8-hour average ozone concentrations (ppb) at the Livermore air monitoring station for August 2–15, 2012, for the base-case and two control cases
Figure D-5b. Simulated maximum 8-hour average ozone concentrations (ppb) at the Concord air monitoring station for August 2–15, 2012, for the base-case and two control cases
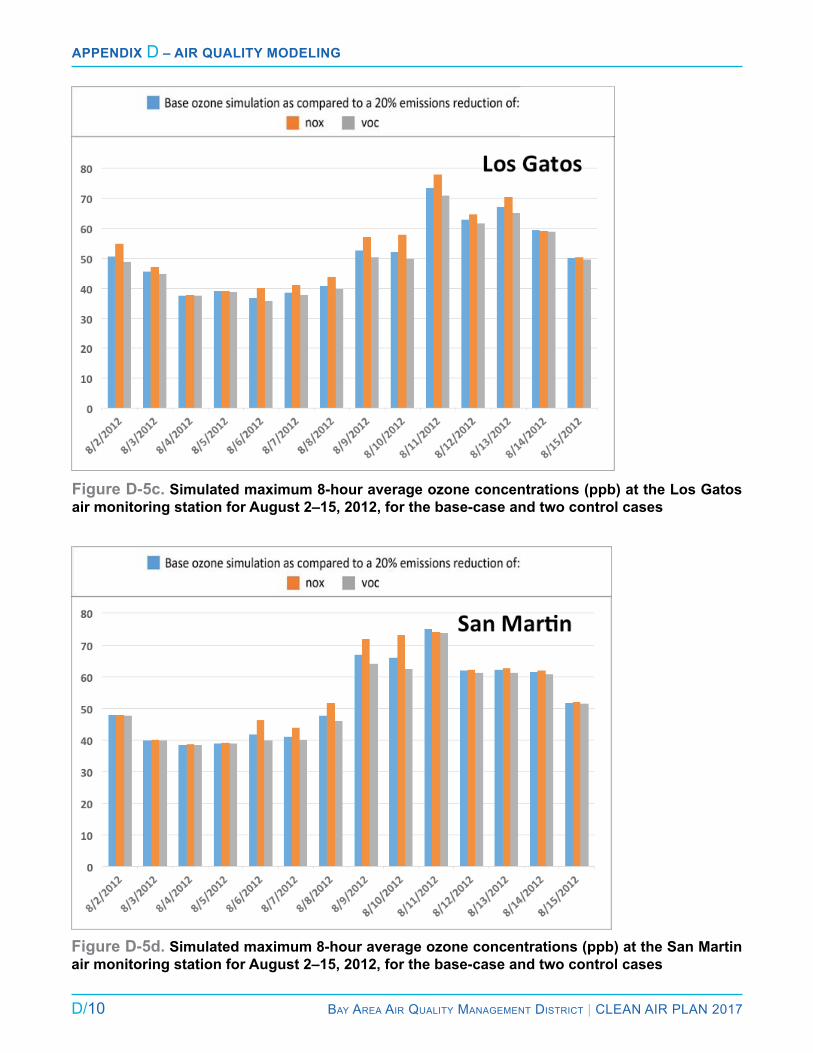
D/10 Bay area air Quality ManageMent District | Clean air Plan 2017
Appendix D – Air QuAlity Modeling
Figure D-5c. Simulated maximum 8-hour average ozone concentrations (ppb) at the Los Gatos air monitoring station for August 2–15, 2012, for the base-case and two control cases
Figure D-5d. Simulated maximum 8-hour average ozone concentrations (ppb) at the San Martin air monitoring station for August 2–15, 2012, for the base-case and two control cases

Bay area air Quality ManageMent District | Clean air Plan 2017 D/11
Appendix D – Air QuAlity Modeling
D) PM2.5 base-case validation
as with ozone, the PM2.5 base-case simulation was validated using measurements to ensure that results adequately represented observed levels. Simulated 24-hour average PM2.5 levels were compared against observed 24-hour av-erage PM2.5 at every observation station in the modeling domain, day by day, for January 2–15, 2012. Once again the average of simulated val-ues at observation station locations for selected subdomains such as the Bay area, San Joaquin Valley and Sacramento were compared to the av-erage of observations for the respective subdo-mains. Finally, the simulated annual average was compared to the observed annual average for the stations within each subdomain. Graphical dis-playsofevaluatedfieldsandstatisticalmeasuressuch as bias, error, root mean square error and index of agreements were generated.
Generally, model performance is reasonable. again, special attention is given to the Bay area and Delta region. Station-by-station comparisons are shown in Figures D-6a-d for four selected Bay
area stations: San Jose, San Francisco, Oakland and Vallejo for January 2–15, 2012. These stations historically experience high PM2.5 concentrations during winter months.
The observed day-to-day variance in PM was effectively simulated by the model at all four lo-cations, indicating that the meteorological con-ditions that impacted PM formation during this period were generally captured well. The magni-tudes of peak simulated PM2.5 were close to peak observations at San Jose and Vallejo, but were overestimated in San Francisco and underesti-mated in Oakland during the January 9–12 ep-isode. This could be due to the inherent uncer-tainty in comparing a point measurement to a 4x4 km grid volume estimate at urban locations with complex emission patterns.
The model was also evaluated using observed concentrations of key precursors such as nOX, VOCs, ammonia, organic and inorganic PM spe-cies and SOX. The performance of the model for these species was also reasonable (not shown).
Figure D-6a. Simulated and observed 24-hour average PM2.5 concentrations (µg/m3) at the San Jose air monitoring station for January 2–15, 2012
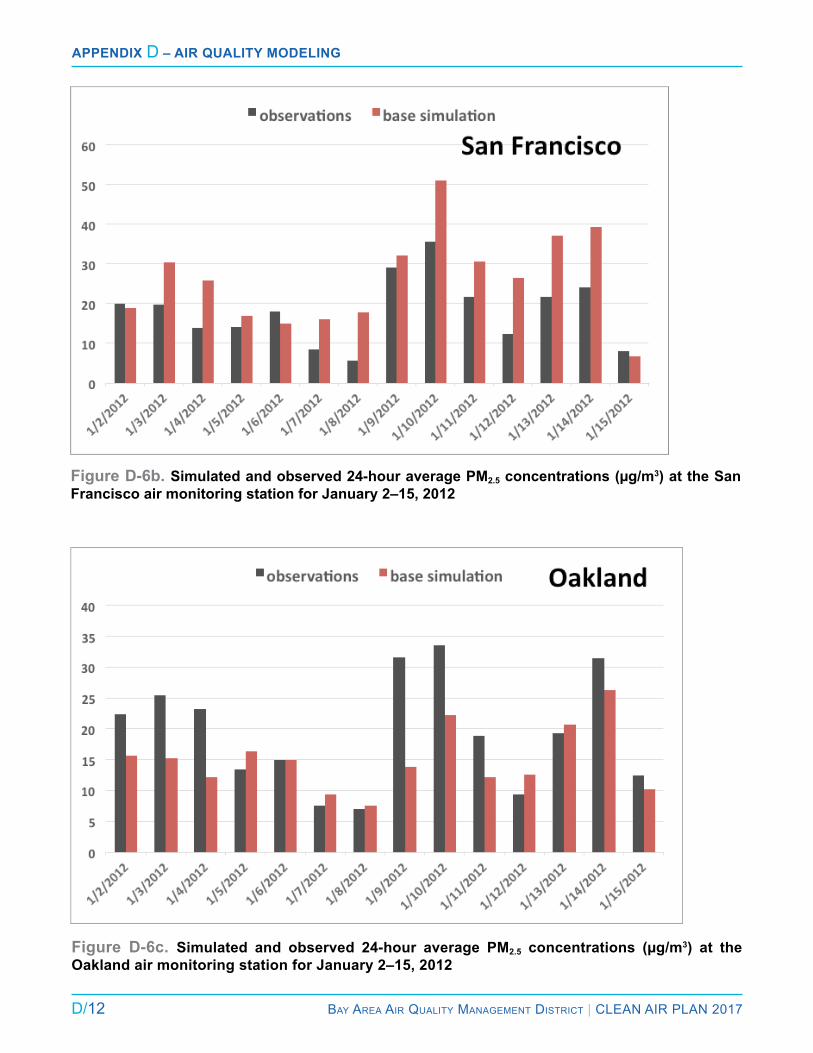
D/12 Bay area air Quality ManageMent District | Clean air Plan 2017
Appendix D – Air QuAlity Modeling
Figure D-6b. Simulated and observed 24-hour average PM2.5 concentrations (µg/m3) at the San Francisco air monitoring station for January 2–15, 2012
Figure D-6c. Simulated and observed 24-hour average PM2.5 concentrations (µg/m3) at the Oakland air monitoring station for January 2–15, 2012
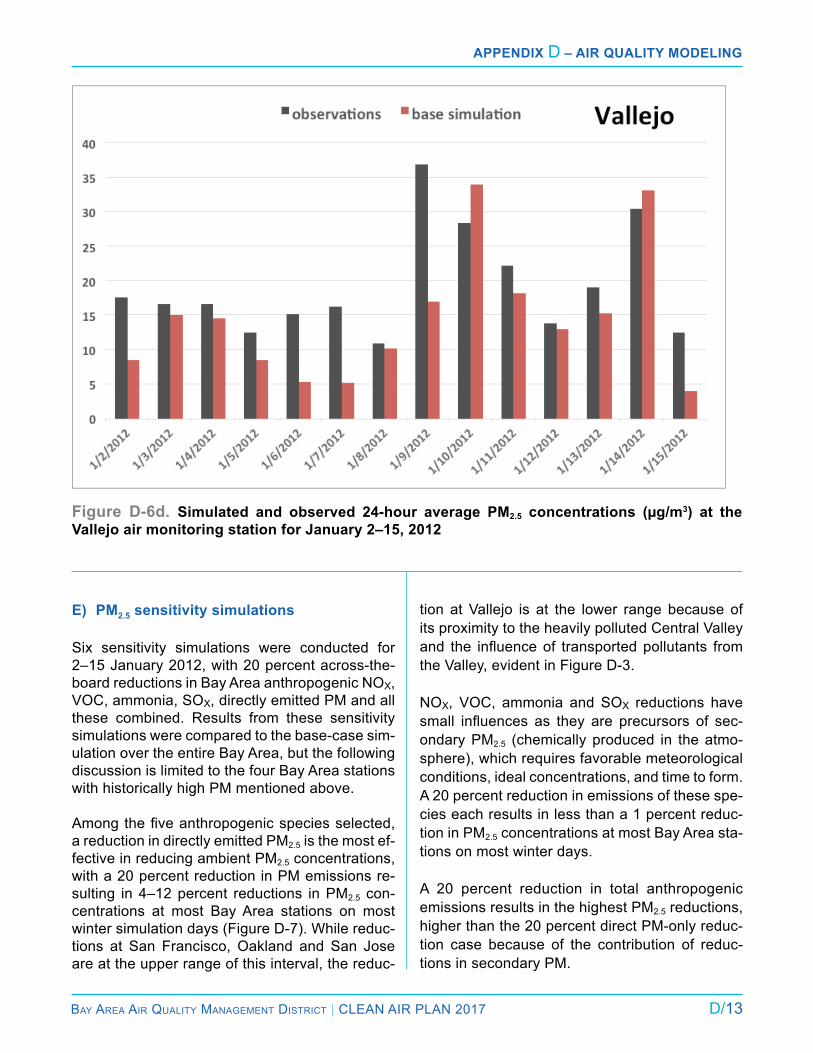
Bay area air Quality ManageMent District | Clean air Plan 2017 D/13
Appendix D – Air QuAlity Modeling
Figure D-6d. Simulated and observed 24-hour average PM2.5 concentrations (µg/m3) at the Vallejo air monitoring station for January 2–15, 2012
E) PM2.5 sensitivity simulations
Six sensitivity simulations were conducted for 2–15 January 2012, with 20 percent across-the-board reductions in Bay area anthropogenic nOX, VOC, ammonia, SOX, directly emitted PM and all these combined. results from these sensitivity simulations were compared to the base-case sim-ulation over the entire Bay area, but the following discussion is limited to the four Bay area stations with historically high PM mentioned above.
Amongthefiveanthropogenicspeciesselected,a reduction in directly emitted PM2.5 is the most ef-fective in reducing ambient PM2.5 concentrations, with a 20 percent reduction in PM emissions re-sulting in 4–12 percent reductions in PM2.5 con-centrations at most Bay area stations on most winter simulation days (Figure D-7). While reduc-tions at San Francisco, Oakland and San Jose are at the upper range of this interval, the reduc-
tion at Vallejo is at the lower range because of its proximity to the heavily polluted Central Valley and the influenceof transportedpollutants fromthe Valley, evident in Figure D-3.
nOX, VOC, ammonia and SOX reductions have small influences as they are precursors of sec-ondary PM2.5 (chemically produced in the atmo-sphere), which requires favorable meteorological conditions, ideal concentrations, and time to form. a 20 percent reduction in emissions of these spe-cies each results in less than a 1 percent reduc-tion in PM2.5 concentrations at most Bay area sta-tions on most winter days.
a 20 percent reduction in total anthropogenic emissions results in the highest PM2.5 reductions, higher than the 20 percent direct PM-only reduc-tion case because of the contribution of reduc-tions in secondary PM.
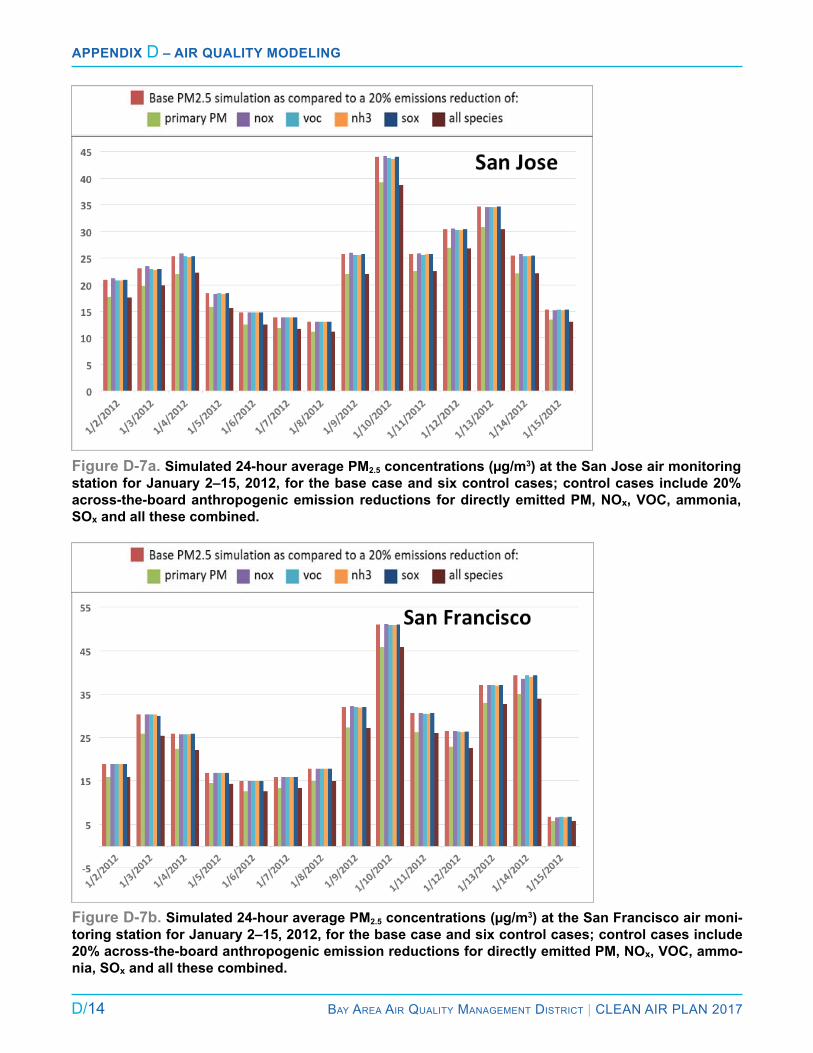
D/14 Bay area air Quality ManageMent District | Clean air Plan 2017
Appendix D – Air QuAlity Modeling
Figure D-7a. Simulated 24-hour average PM2.5 concentrations (µg/m3) at the San Jose air monitoring station for January 2–15, 2012, for the base case and six control cases; control cases include 20% across-the-board anthropogenic emission reductions for directly emitted PM, NOx, VOC, ammonia, SOx and all these combined.
Figure D-7b. Simulated 24-hour average PM2.5 concentrations (µg/m3) at the San Francisco air moni-toring station for January 2–15, 2012, for the base case and six control cases; control cases include 20% across-the-board anthropogenic emission reductions for directly emitted PM, NOx, VOC, ammo-nia, SOx and all these combined.
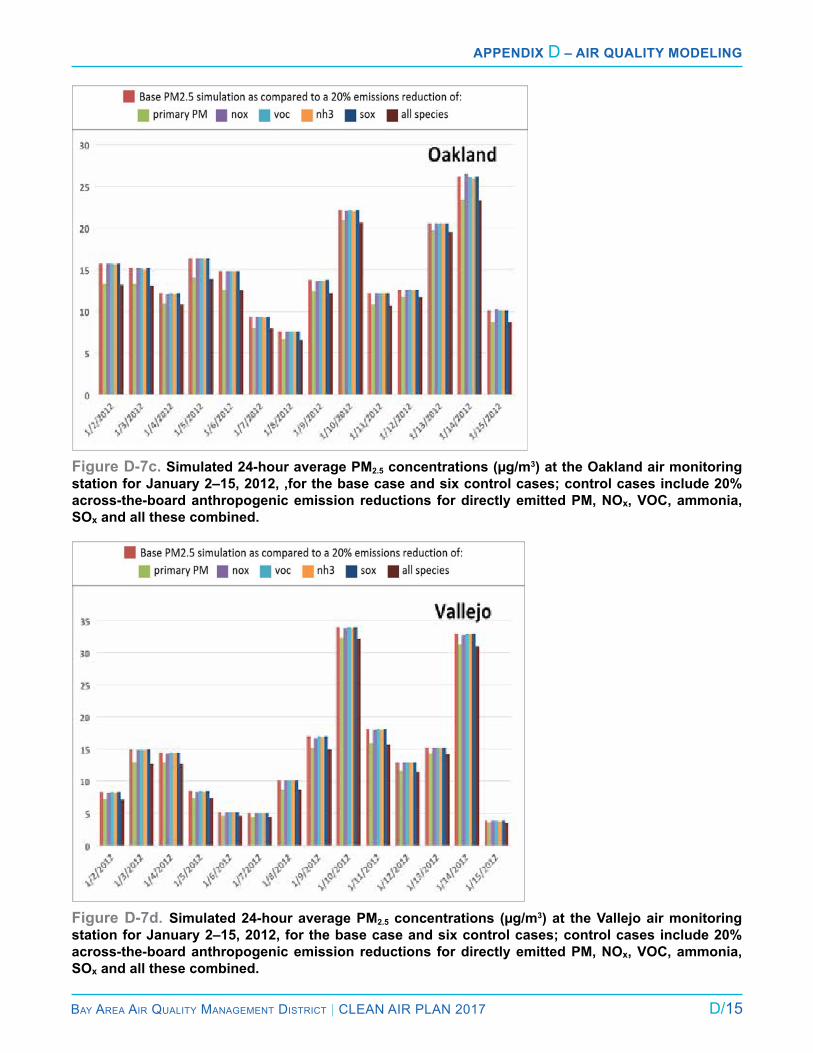
Bay area air Quality ManageMent District | Clean air Plan 2017 D/15
Appendix D – Air QuAlity Modeling
Figure D-7c. Simulated 24-hour average PM2.5 concentrations (µg/m3) at the Oakland air monitoring station for January 2–15, 2012, ,for the base case and six control cases; control cases include 20% across-the-board anthropogenic emission reductions for directly emitted PM, NOx, VOC, ammonia, SOx and all these combined.
Figure D-7d. Simulated 24-hour average PM2.5 concentrations (µg/m3) at the Vallejo air monitoring station for January 2–15, 2012, for the base case and six control cases; control cases include 20% across-the-board anthropogenic emission reductions for directly emitted PM, NOx, VOC, ammonia, SOx and all these combined.
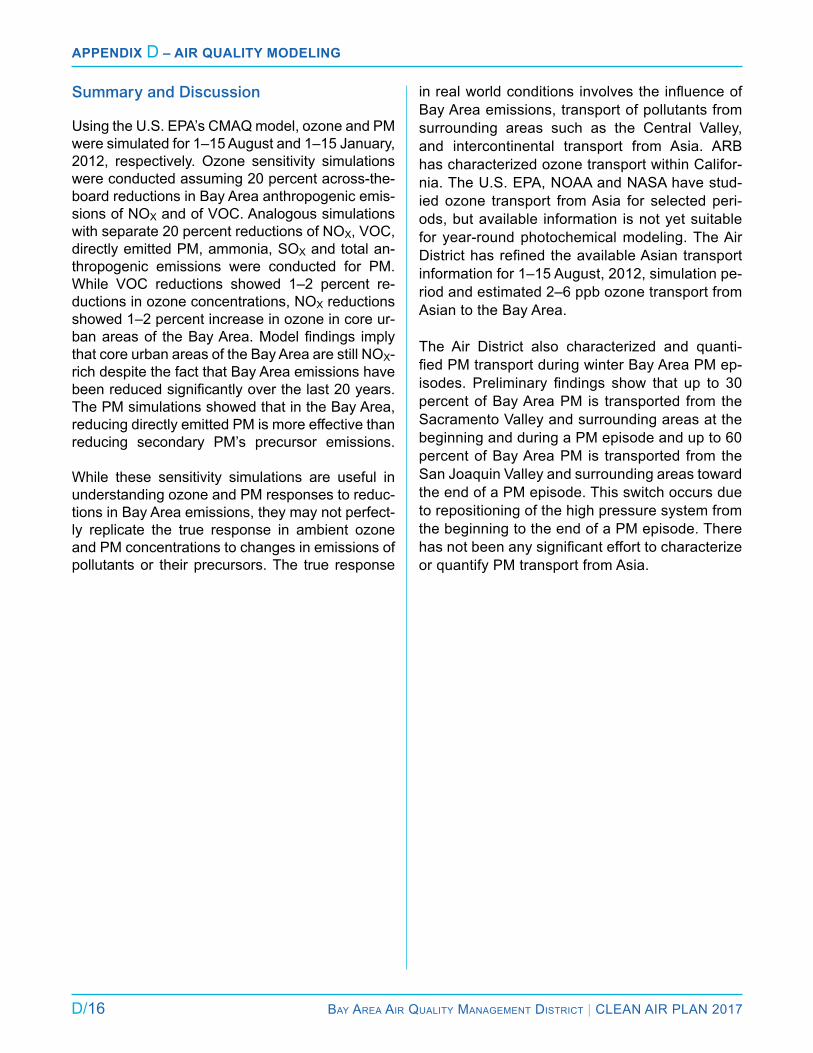
D/16 Bay area air Quality ManageMent District | Clean air Plan 2017
Appendix D – Air QuAlity Modeling
Summary and Discussion
Using the U.S. ePa’s CMaQ model, ozone and PM were simulated for 1–15 august and 1–15 January, 2012, respectively. Ozone sensitivity simulations were conducted assuming 20 percent across-the-board reductions in Bay area anthropogenic emis-sions of nOX and of VOC. analogous simulations with separate 20 percent reductions of nOX, VOC, directly emitted PM, ammonia, SOX and total an-thropogenic emissions were conducted for PM. While VOC reductions showed 1–2 percent re-ductions in ozone concentrations, nOX reductions showed 1–2 percent increase in ozone in core ur-banareasof theBayArea.Modelfindings implythat core urban areas of the Bay area are still nOX-rich despite the fact that Bay area emissions have beenreducedsignificantlyoverthelast20years.The PM simulations showed that in the Bay area, reducing directly emitted PM is more effective than reducing secondary PM’s precursor emissions.
While these sensitivity simulations are useful in understanding ozone and PM responses to reduc-tions in Bay area emissions, they may not perfect-ly replicate the true response in ambient ozone and PM concentrations to changes in emissions of pollutants or their precursors. The true response
inrealworldconditionsinvolvestheinfluenceofBay area emissions, transport of pollutants from surrounding areas such as the Central Valley, and intercontinental transport from asia. arB has characterized ozone transport within Califor-nia. The U.S. ePa, nOaa and naSa have stud-ied ozone transport from asia for selected peri-ods, but available information is not yet suitable for year-round photochemical modeling. The air DistricthasrefinedtheavailableAsiantransportinformation for 1–15 august, 2012, simulation pe-riod and estimated 2–6 ppb ozone transport from asian to the Bay area.
The air District also characterized and quanti-fiedPMtransportduringwinterBayAreaPMep-isodes. Preliminary findings show that up to 30percent of Bay area PM is transported from the Sacramento Valley and surrounding areas at the beginning and during a PM episode and up to 60 percent of Bay area PM is transported from the San Joaquin Valley and surrounding areas toward the end of a PM episode. This switch occurs due to repositioning of the high pressure system from the beginning to the end of a PM episode. There hasnotbeenanysignificantefforttocharacterizeor quantify PM transport from asia.
Bay area air Quality ManageMent District | Clean air Plan 2017 e/1
Progress Toward aTTainmenT of ozone sTandards
aPPendix e
This appendix provides additional informa-tion regarding ozone dynamics and trends in ambient ozone concentrations and pop-
ulation exposure to ozone to supplement the dis-cussion of ozone in Chapter 2 of the 2017 Plan.
Ozone Dynamics
Ozone is not emitted directly from pollution sourc-es. instead, ozone is formed in the atmosphere through complex chemical reactions in the pres-ence of sunlight between two types of precursor chemicals: reactive organic gases (rOG), and ni-trogen oxides (nOX).
Weather conditions have a strong impact on ozone formation. Due to variations in weather, ozone lev-els can vary dramatically day to day and from one summer to the next. as the air temperature rises, ground-level ozone forms at an accelerated rate. Ozone levels are usually highest on hot, windless summer afternoons, especially in inland valleys. exceedances of state or national ozone standards in the Bay area typically occur on hot, relatively stagnant days.
Climate change may increase ozone levels in fu-ture years. longer and more severe heat waves expected as a result of climate change may cause more ozone formation, resulting in more frequent exceedances of ozone standards. Climate change could erode decades of progress in reducing ozone
levels, as described in greater detail in Chapter 3.Ozone is a regional pollutant. emissions of rOG and nOX throughout the Bay area contribute to ozone formation. Because emissions in one part of the region can impact air quality miles away, efforts to reduce ozone levels focus on reducing emissions of rOG and nOX throughout the region.
The relative amounts of the precursor pollutants, or the rOG to nOX ratio, strongly affects the ozone formation rate. The air District’s ozone modeling indicates that the Bay area is “rOG-limited” for ozone formation. This means that reducing rOG emissions will be more productive in reducing ozone, at least in the near term. However, mod-eling also suggests that large reductions in nOX emissions will be needed to achieve the reduction in ozone concentrations required to attain state and national ozone standards which have become progressively more stringent in recent decades.
a certain amount of ozone formation occurs natu-rally, even in the absence of anthropogenic emis-sions of rOG and nOX. This natural ozone is referred to as the background level. locally, back-ground ozone appears to have increased, perhaps due to reductions in other pollutants. However, there are instances when some air pollutants re-act with and eliminate ozone, therefore reducing ambient concentrations.1 increasing emissions of methane at the global scale may be increas-ing background levels of ozone. in the recent past, ozone standards were roughly three times higher than background levels. Because ozone
e/2 Bay area air Quality ManageMent District | Clean air Plan 2017
Appendix E – progress TowArd ATTAinmenT of ozone sTAndArds
standards have been tightened, the standards are now less than twice the estimated background level, and may be reduced to even more stringent levels in the future. Ozone formation in the Bay Area is strongly influenced by the location and strength of the Eastern Pacific High Pressure Sys-tem. During the summer months, this system nor-mally develops over the Pacific Ocean and travels towards the east. From time to time, depending upon its strength and route of travel, it blocks westerly airflow exiting the Bay Area into the Cen-tral Valley and develops meteorological conditions conducive to ozone production: light winds, high temperatures, sunny and clear sky conditions and a shallow mixing layer. When these condi-tions occur in mid-summer, typically airflow from the core Bay area penetrates into the livermore Valley through the interstate 680 corridor from the north and various gaps along the east Bay ridge from the west, carrying polluted air and causing increased ozone levels. at other times, especial-ly in early or late summer, airflow with a weaker westerly push that is unable to cross the east Bay ridge flows southward, causing increased ozone levels in the Santa Clara Valley. San Martin is fre-quently the exceedance site in the Santa Clara Valley under these conditions.
See the air quality modeling discussion in Appen-dix D for additional information regarding ozone formation and ozone dynamics.
Peak Ozone Concentrations and Exposure
For the purpose of complying with Health & Safe-ty Code ozone planning requirements, arB guid-ance requires the calculation of three air quality indicators to assess the extent of air quality im-provements within an air basin: (1) expected Peak Day Concentration (ePDC), which is an estimate of the ozone concentration that would be exceeded once per year on average, (2) population-weight-ed exposure to ozone levels that exceed the state standard, and (3) area-weighted exposure to lev-els that exceed the state standard.
Expected Peak Day Ozone Concentrations
The ePDC for the state 1-hour ozone standard at Bay area monitoring sites are listed in Table e-1 for 1986–1988, 2006–2008 and 2012–2014. also shown are annual percentage reductions. Table e-2 presents these data for the 8-hour ozone stan-dard. There was an average annual reduction in 1-hour ozone of 0.9 percent per year across all Bay area sites between 1986–1988 and 2012–2014, and a reduction of 0.8 percent per year for the 8-hour ozone standard, with total reductions of 25 percent and 23 percent respectively. no site shows an increase in ozone over this period, in-dicating that progress is region-wide. During the period from 2008 through 2013, the reduction was 1.6 percent per year in 1-hour ozone and 0.5 per-cent per year in 8-hour ozone, indicating that prog-ress has continued in recent years.
The progress has not been uniform, however. as the tables show, there were substantial reductions in the southern areas, including Los Gatos and San Jose, monitoring sites that once registered some of the air District’s highest values. in the central area, the progress is mixed, but at locations where there has been little reduction since late 2008, ozone values actually meet the standard. in the northern and eastern areas there have also been reductions, but long-term progress has been slow-er than in the south. at the air District’s design val-ue site in livermore, reductions have averaged 0.8 percent per year, which is on the order of 1 ppb per year, since the late 1990s.
ePDC values are, effectively, the design values for the California standards. Thus, a site whose 1-hour ePDC is less than 95 ppb meets the 1-hour standard, and a site whose 8-hour ePDC is less than 71 ppb meets the state 8-hour standard. Be-tween 1986–1988 and 2012–2014, the number of long-running sites meeting the 1-hour standard in-creased from 5 to 18, and the number meeting the 8-hour standard increased from 3 to 10.
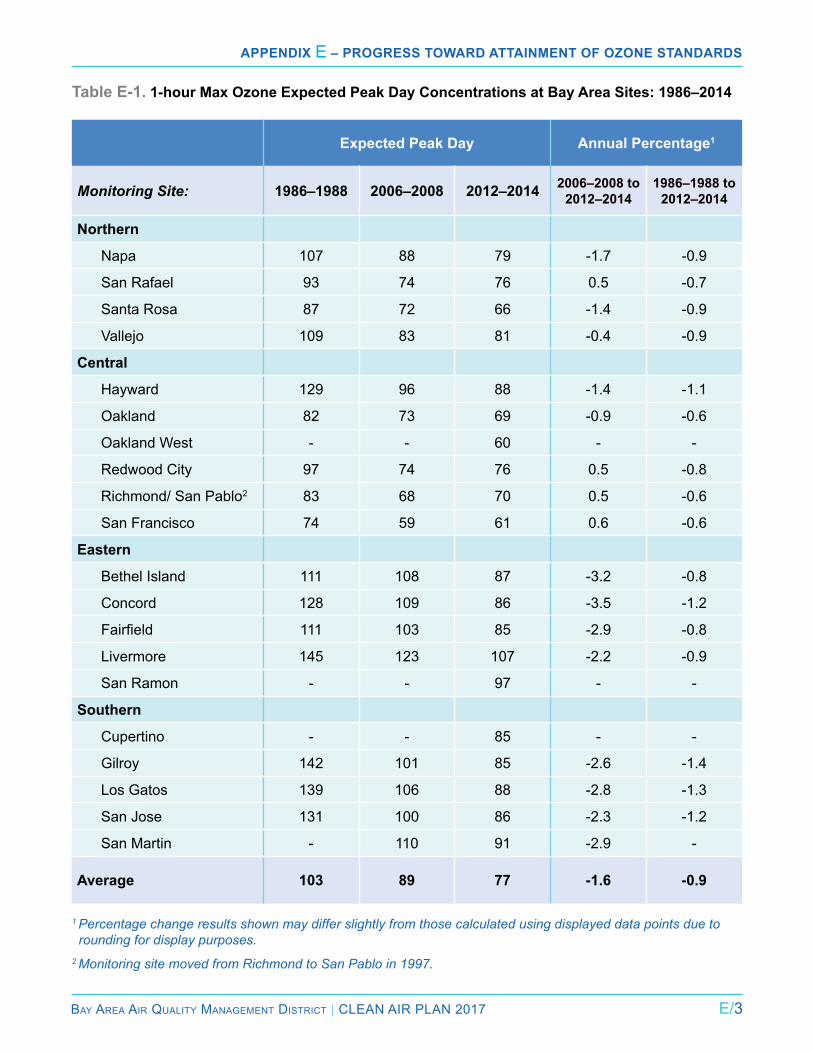
Bay area air Quality ManageMent District | Clean air Plan 2017 e/3
Appendix E – progress TowArd ATTAinmenT of ozone sTAndArds
Expected Peak Day Annual Percentage1
Monitoring Site: 1986–1988 2006–2008 2012–2014 2006–2008 to 2012–2014
1986–1988 to 2012–2014
Northern
napa 107 88 79 -1.7 -0.9
San Rafael 93 74 76 0.5 -0.7
Santa Rosa 87 72 66 -1.4 -0.9
Vallejo 109 83 81 -0.4 -0.9
Central
Hayward 129 96 88 -1.4 -1.1
Oakland 82 73 69 -0.9 -0.6
Oakland West - - 60 - -
redwood City 97 74 76 0.5 -0.8
Richmond/ San Pablo2 83 68 70 0.5 -0.6
San Francisco 74 59 61 0.6 -0.6
Eastern
Bethel island 111 108 87 -3.2 -0.8
Concord 128 109 86 -3.5 -1.2
Fairfield 111 103 85 -2.9 -0.8
livermore 145 123 107 -2.2 -0.9
San Ramon - - 97 - -
Southern
Cupertino - - 85 - -
Gilroy 142 101 85 -2.6 -1.4
los Gatos 139 106 88 -2.8 -1.3
San Jose 131 100 86 -2.3 -1.2
San Martin - 110 91 -2.9 -
Average 103 89 77 -1.6 -0.9
1 Percentage change results shown may differ slightly from those calculated using displayed data points due to rounding for display purposes.
2 Monitoring site moved from Richmond to San Pablo in 1997.
Table E-1. 1-hour Max Ozone Expected Peak Day Concentrations at Bay Area Sites: 1986–2014
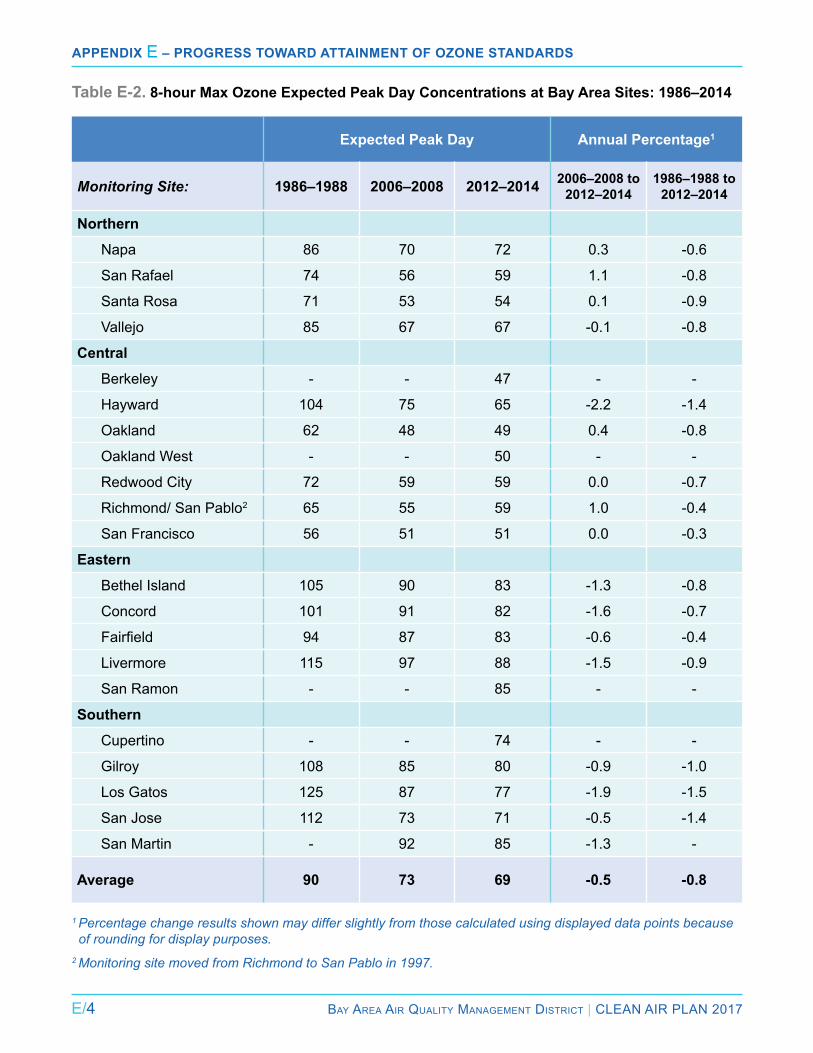
e/4 Bay area air Quality ManageMent District | Clean air Plan 2017
Appendix E – progress TowArd ATTAinmenT of ozone sTAndArds
Table E-2. 8-hour Max Ozone Expected Peak Day Concentrations at Bay Area Sites: 1986–2014
Expected Peak Day Annual Percentage1
Monitoring Site: 1986–1988 2006–2008 2012–2014 2006–2008 to 2012–2014
1986–1988 to 2012–2014
Northern
napa 86 70 72 0.3 -0.6
San Rafael 74 56 59 1.1 -0.8
Santa Rosa 71 53 54 0.1 -0.9
Vallejo 85 67 67 -0.1 -0.8
Central
Berkeley - - 47 - -
Hayward 104 75 65 -2.2 -1.4
Oakland 62 48 49 0.4 -0.8
Oakland West - - 50 - -
redwood City 72 59 59 0.0 -0.7
Richmond/ San Pablo2 65 55 59 1.0 -0.4
San Francisco 56 51 51 0.0 -0.3
Eastern
Bethel island 105 90 83 -1.3 -0.8
Concord 101 91 82 -1.6 -0.7
Fairfield 94 87 83 -0.6 -0.4
livermore 115 97 88 -1.5 -0.9
San Ramon - - 85 - -
Southern
Cupertino - - 74 - -
Gilroy 108 85 80 -0.9 -1.0
los Gatos 125 87 77 -1.9 -1.5
San Jose 112 73 71 -0.5 -1.4
San Martin - 92 85 -1.3 -
Average 90 73 69 -0.5 -0.8
1 Percentage change results shown may differ slightly from those calculated using displayed data points because of rounding for display purposes.
2 Monitoring site moved from Richmond to San Pablo in 1997.
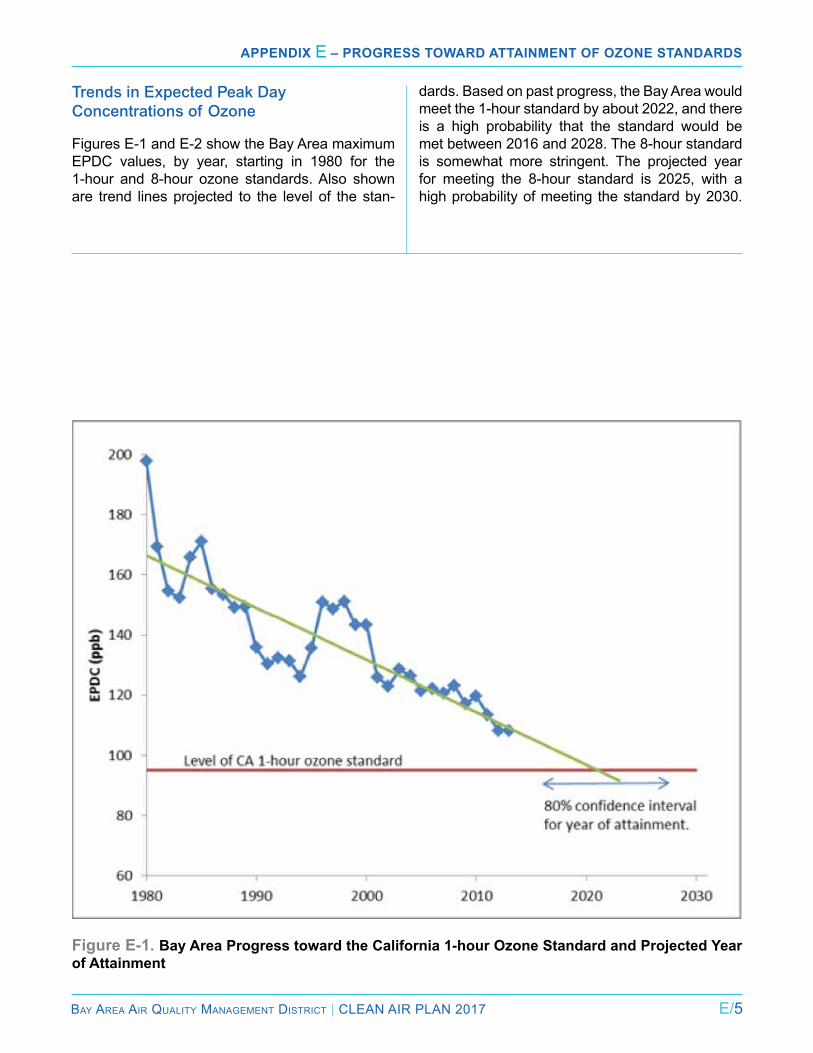
Bay area air Quality ManageMent District | Clean air Plan 2017 e/5
Appendix E – progress TowArd ATTAinmenT of ozone sTAndArds
Trends in Expected Peak Day Concentrations of Ozone
Figures e-1 and e-2 show the Bay area maximum ePDC values, by year, starting in 1980 for the 1-hour and 8-hour ozone standards. also shown are trend lines projected to the level of the stan-
Figure E-1. Bay Area Progress toward the California 1-hour Ozone Standard and Projected Year of Attainment
dards. Based on past progress, the Bay area would meet the 1-hour standard by about 2022, and there is a high probability that the standard would be met between 2016 and 2028. The 8-hour standard is somewhat more stringent. The projected year for meeting the 8-hour standard is 2025, with a high probability of meeting the standard by 2030.
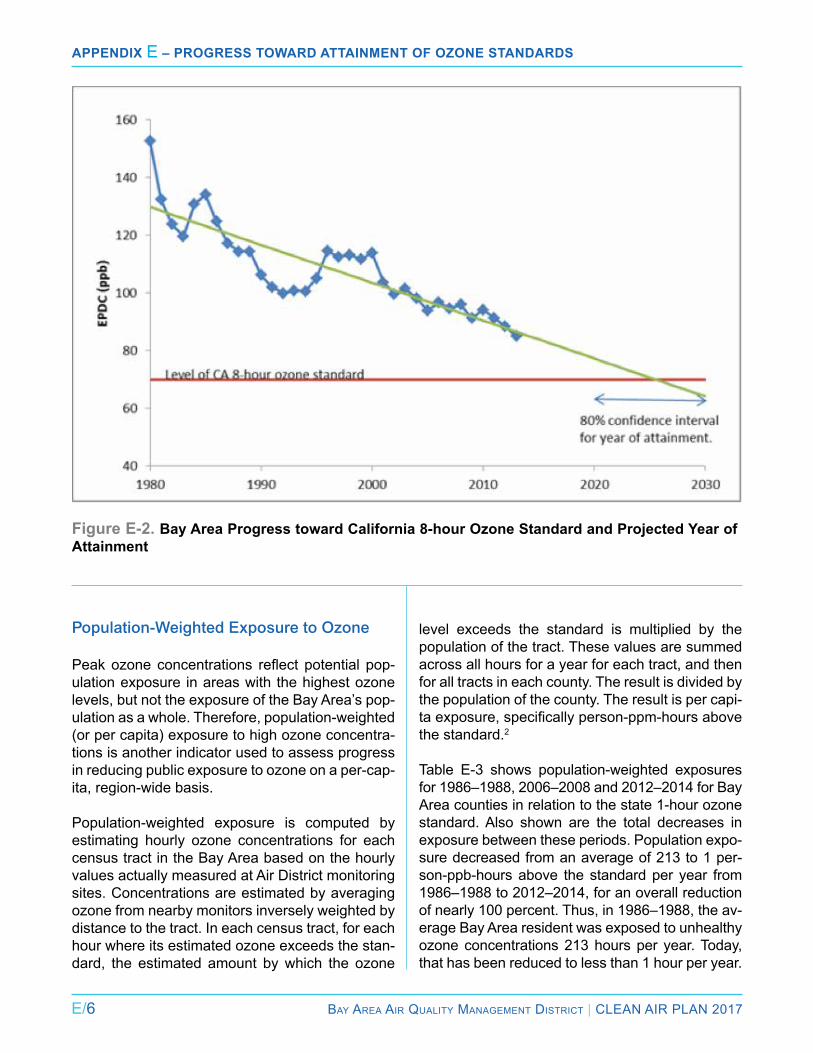
e/6 Bay area air Quality ManageMent District | Clean air Plan 2017
Appendix E – progress TowArd ATTAinmenT of ozone sTAndArds
Figure E-2. Bay Area Progress toward California 8-hour Ozone Standard and Projected Year of Attainment
Population-Weighted Exposure to Ozone
Peak ozone concentrations reflect potential pop-ulation exposure in areas with the highest ozone levels, but not the exposure of the Bay area’s pop-ulation as a whole. Therefore, population-weighted (or per capita) exposure to high ozone concentra-tions is another indicator used to assess progress in reducing public exposure to ozone on a per-cap-ita, region-wide basis.
Population-weighted exposure is computed by estimating hourly ozone concentrations for each census tract in the Bay area based on the hourly values actually measured at air District monitoring sites. Concentrations are estimated by averaging ozone from nearby monitors inversely weighted by distance to the tract. in each census tract, for each hour where its estimated ozone exceeds the stan-dard, the estimated amount by which the ozone
level exceeds the standard is multiplied by the population of the tract. These values are summed across all hours for a year for each tract, and then for all tracts in each county. The result is divided by the population of the county. The result is per capi-ta exposure, specifically person-ppm-hours above the standard.2
Table e-3 shows population-weighted exposures for 1986–1988, 2006–2008 and 2012–2014 for Bay area counties in relation to the state 1-hour ozone standard. also shown are the total decreases in exposure between these periods. Population expo-sure decreased from an average of 213 to 1 per-son-ppb-hours above the standard per year from 1986–1988 to 2012–2014, for an overall reduction of nearly 100 percent. Thus, in 1986–1988, the av-erage Bay area resident was exposed to unhealthy ozone concentrations 213 hours per year. Today, that has been reduced to less than 1 hour per year.
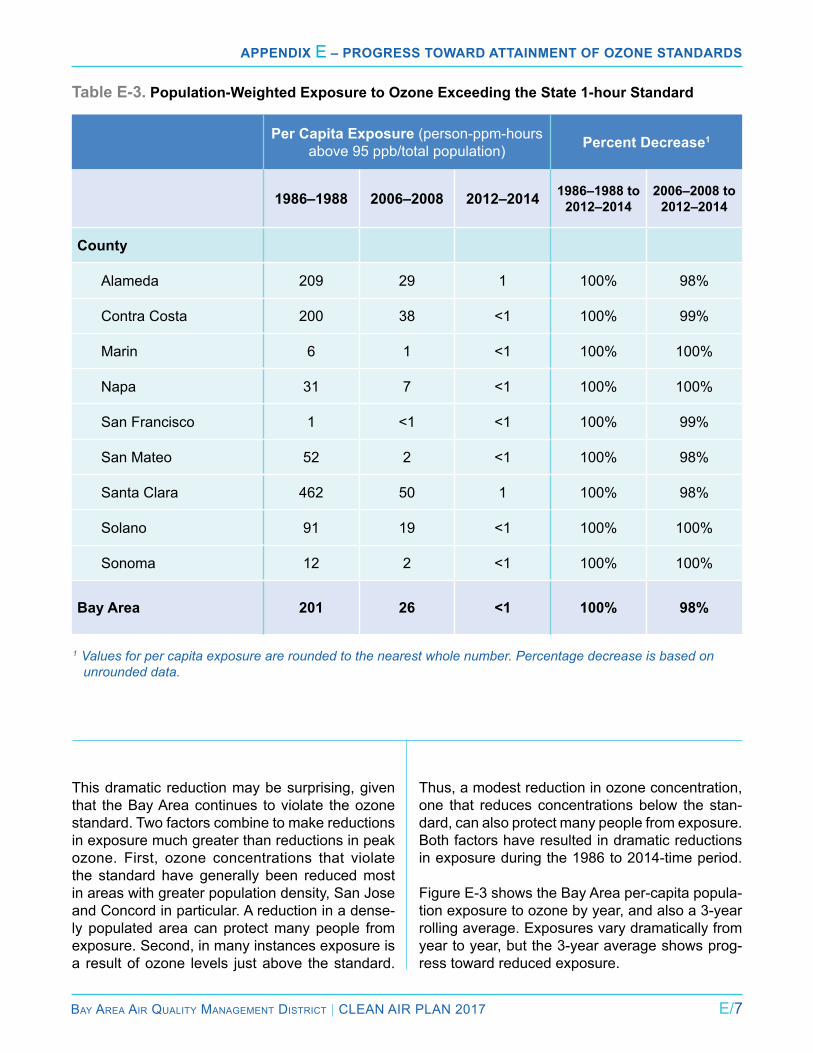
Bay area air Quality ManageMent District | Clean air Plan 2017 e/7
Appendix E – progress TowArd ATTAinmenT of ozone sTAndArds
Table E-3. Population-Weighted Exposure to Ozone Exceeding the State 1-hour Standard
Per Capita Exposure (person-ppm-hours above 95 ppb/total population) Percent Decrease1
1986–1988 2006–2008 2012–2014 1986–1988 to 2012–2014
2006–2008 to 2012–2014
County
alameda 209 29 1 100% 98%
Contra Costa 200 38 <1 100% 99%
Marin 6 1 <1 100% 100%
napa 31 7 <1 100% 100%
San Francisco 1 <1 <1 100% 99%
San Mateo 52 2 <1 100% 98%
Santa Clara 462 50 1 100% 98%
Solano 91 19 <1 100% 100%
Sonoma 12 2 <1 100% 100%
Bay Area 201 26 <1 100% 98%
This dramatic reduction may be surprising, given that the Bay area continues to violate the ozone standard. Two factors combine to make reductions in exposure much greater than reductions in peak ozone. First, ozone concentrations that violate the standard have generally been reduced most in areas with greater population density, San Jose and Concord in particular. a reduction in a dense-ly populated area can protect many people from exposure. Second, in many instances exposure is a result of ozone levels just above the standard.
Thus, a modest reduction in ozone concentration, one that reduces concentrations below the stan-dard, can also protect many people from exposure. Both factors have resulted in dramatic reductions in exposure during the 1986 to 2014-time period.
Figure e-3 shows the Bay area per-capita popula-tion exposure to ozone by year, and also a 3-year rolling average. exposures vary dramatically from year to year, but the 3-year average shows prog-ress toward reduced exposure.
1 Values for per capita exposure are rounded to the nearest whole number. Percentage decrease is based on unrounded data.
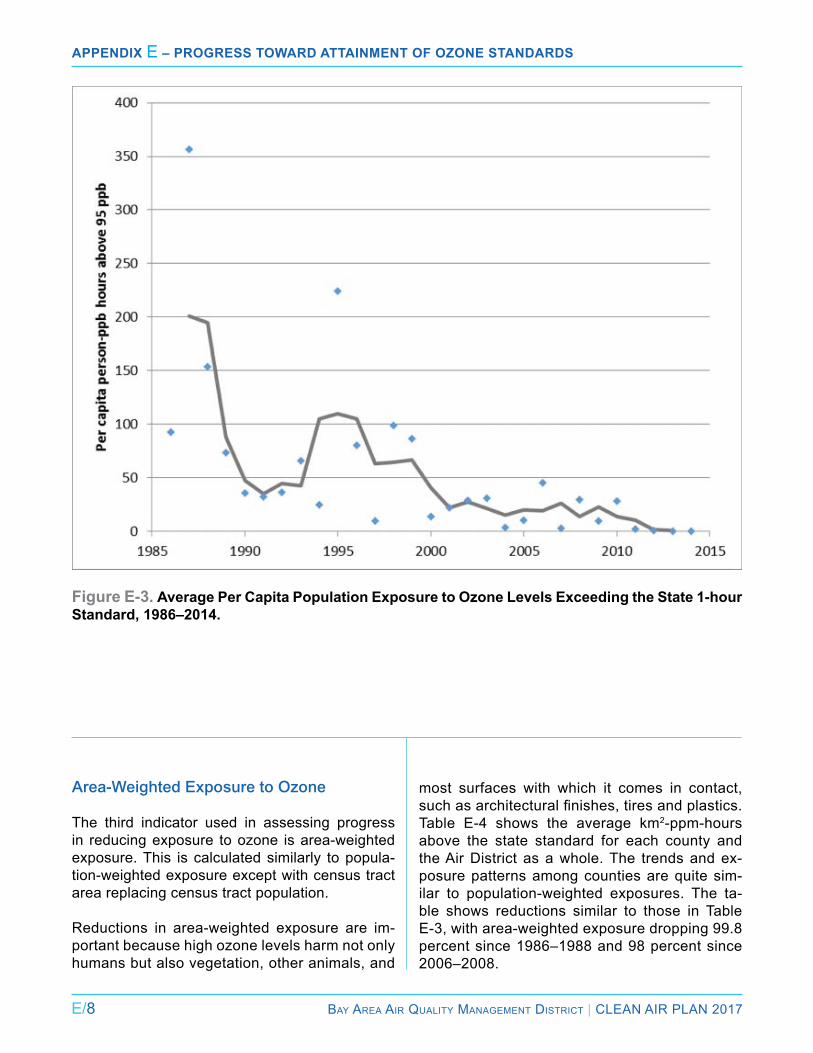
e/8 Bay area air Quality ManageMent District | Clean air Plan 2017
Appendix E – progress TowArd ATTAinmenT of ozone sTAndArds
Figure E-3. Average Per Capita Population Exposure to Ozone Levels Exceeding the State 1-hour Standard, 1986–2014.
Area-Weighted Exposure to Ozone
The third indicator used in assessing progress in reducing exposure to ozone is area-weighted exposure. This is calculated similarly to popula-tion-weighted exposure except with census tract area replacing census tract population.
reductions in area-weighted exposure are im-portant because high ozone levels harm not only humans but also vegetation, other animals, and
most surfaces with which it comes in contact, such as architectural finishes, tires and plastics. Table e-4 shows the average km2-ppm-hours above the state standard for each county and the air District as a whole. The trends and ex-posure patterns among counties are quite sim-ilar to population-weighted exposures. The ta-ble shows reductions similar to those in Table e-3, with area-weighted exposure dropping 99.8 percent since 1986–1988 and 98 percent since 2006–2008.
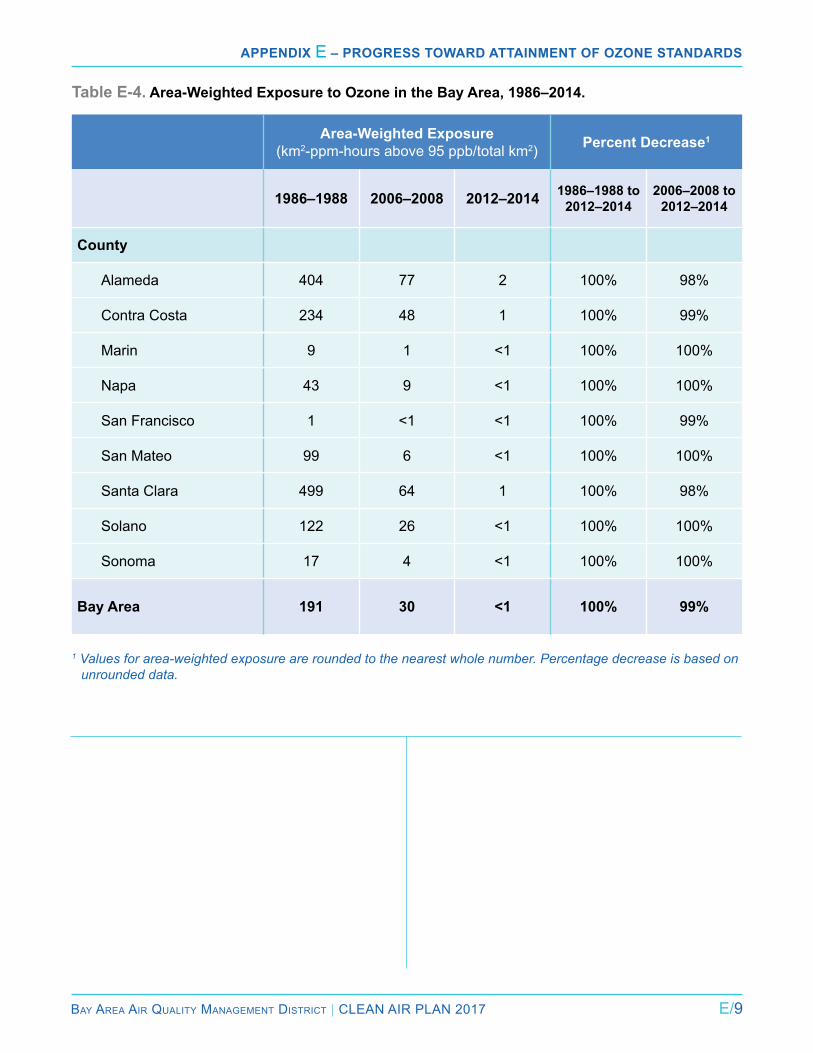
Bay area air Quality ManageMent District | Clean air Plan 2017 e/9
Appendix E – progress TowArd ATTAinmenT of ozone sTAndArds
Table E-4. Area-Weighted Exposure to Ozone in the Bay Area, 1986–2014.
Area-Weighted Exposure (km2-ppm-hours above 95 ppb/total km2) Percent Decrease1
1986–1988 2006–2008 2012–2014 1986–1988 to 2012–2014
2006–2008 to 2012–2014
County
alameda 404 77 2 100% 98%
Contra Costa 234 48 1 100% 99%
Marin 9 1 <1 100% 100%
napa 43 9 <1 100% 100%
San Francisco 1 <1 <1 100% 99%
San Mateo 99 6 <1 100% 100%
Santa Clara 499 64 1 100% 98%
Solano 122 26 <1 100% 100%
Sonoma 17 4 <1 100% 100%
Bay Area 191 30 <1 100% 99%
1 Values for area-weighted exposure are rounded to the nearest whole number. Percentage decrease is based on unrounded data.

e/10 Bay area air Quality ManageMent District | Clean air Plan 2017
Appendix E – progress TowArd ATTAinmenT of ozone sTAndArds
FootnoteS
1 For example, nO combines with O3 (ozone) to produce nO2 and O2.
2 This is sometimes termed backyard exposure because it assumes that everyone is at home and outside every hour that ozone exceeds the standard. While there are obvious limitations to this measure, it may be reasonable for children, who are often at or near home and frequently outside, at times when ozone exceeds the standard.
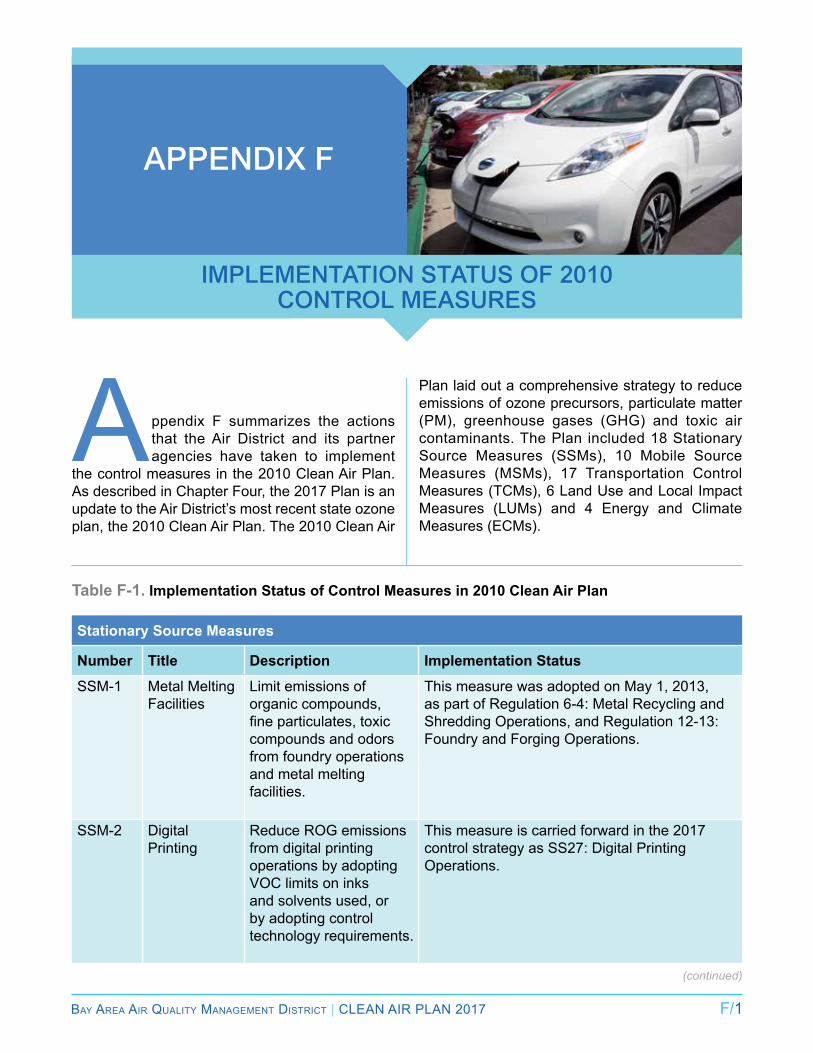
Bay area air Quality ManageMent District | Clean air Plan 2017 F/1
Appendix F
implementAtion StAtuS oF 2010 Control meASureS
appendix F summarizes the actions that the air District and its partner agencies have taken to implement
the control measures in the 2010 Clean air Plan. as described in Chapter Four, the 2017 Plan is an update to the air District’s most recent state ozone plan, the 2010 Clean air Plan. The 2010 Clean air
Plan laid out a comprehensive strategy to reduce emissions of ozone precursors, particulate matter (PM), greenhouse gases (GHG) and toxic air contaminants. The Plan included 18 Stationary Source Measures (SSMs), 10 Mobile Source Measures (MSMs), 17 Transportation Control Measures (TCMs), 6 land Use and local impact Measures (lUMs) and 4 energy and Climate Measures (eCMs).
Table F-1. Implementation Status of Control Measures in 2010 Clean Air Plan
Stationary Source Measures
Number Title Description Implementation Status
SSM-1 Metal Melting Facilities
limit emissions of organic compounds, fine particulates, toxic compounds and odors from foundry operations and metal melting facilities.
This measure was adopted on May 1, 2013, as part of regulation 6-4: Metal recycling and Shredding Operations, and regulation 12-13: Foundry and Forging Operations.
SSM-2 Digital Printing
reduce rOG emissions from digital printing operations by adopting VOC limits on inks and solvents used, or by adopting control technology requirements.
This measure is carried forward in the 2017 control strategy as SS27: Digital Printing Operations.
(continued)
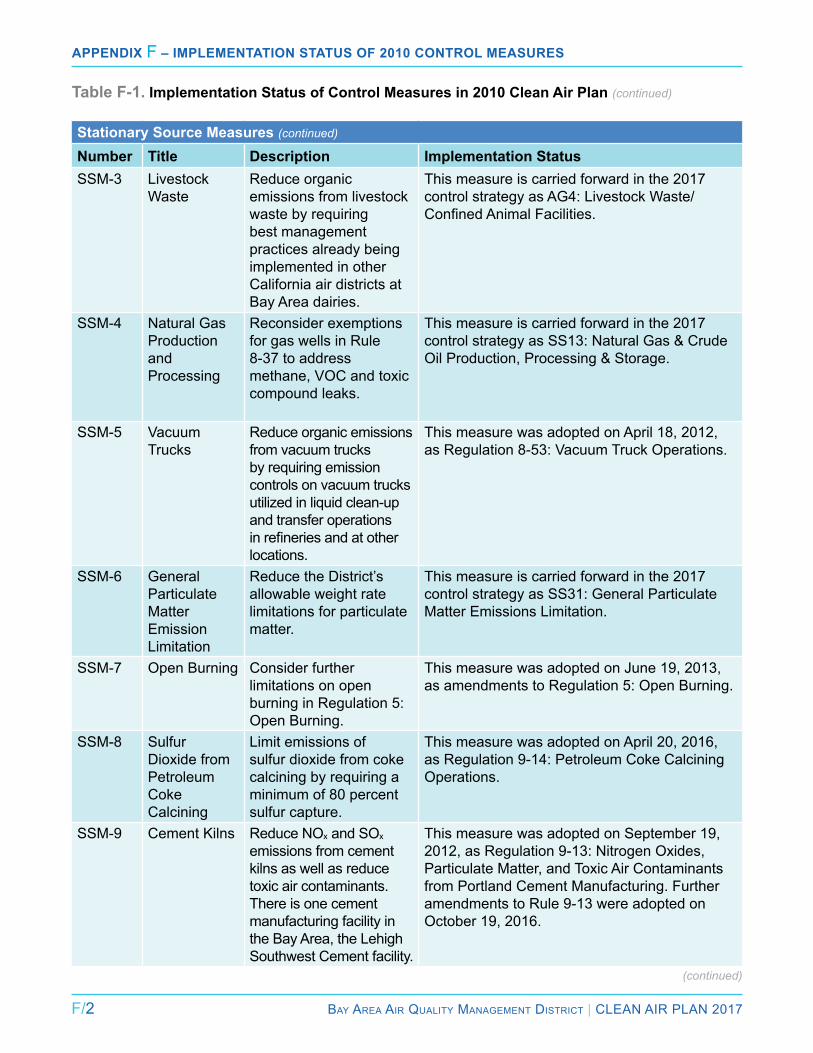
F/2 Bay area air Quality ManageMent District | Clean air Plan 2017
Appendix F – implementAtion StAtuS of 2010 Control meASureS
Stationary Source Measures (continued)
Number Title Description Implementation StatusSSM-3 livestock
Wastereduce organic emissions from livestock waste by requiring best management practices already being implemented in other California air districts at Bay area dairies.
This measure is carried forward in the 2017 control strategy as aG4: livestock Waste/Confined Animal Facilities.
SSM-4 natural Gas Production and Processing
reconsider exemptions for gas wells in rule 8-37 to address methane, VOC and toxic compound leaks.
This measure is carried forward in the 2017 control strategy as SS13: natural Gas & Crude Oil Production, Processing & Storage.
SSM-5 Vacuum Trucks
reduce organic emissions from vacuum trucks by requiring emission controls on vacuum trucks utilized in liquid clean-up and transfer operations in refineries and at other locations.
This measure was adopted on april 18, 2012, as regulation 8-53: Vacuum Truck Operations.
SSM-6 General Particulate Matter emission limitation
reduce the District’s allowable weight rate limitations for particulate matter.
This measure is carried forward in the 2017 control strategy as SS31: General Particulate Matter emissions limitation.
SSM-7 Open Burning Consider further limitations on open burning in regulation 5: Open Burning.
This measure was adopted on June 19, 2013, as amendments to regulation 5: Open Burning.
SSM-8 Sulfur Dioxide from Petroleum Coke Calcining
limit emissions of sulfur dioxide from coke calcining by requiring a minimum of 80 percent sulfur capture.
This measure was adopted on april 20, 2016, as regulation 9-14: Petroleum Coke Calcining Operations.
SSM-9 Cement Kilns reduce nOx and SOx emissions from cement kilns as well as reduce toxic air contaminants. There is one cement manufacturing facility in the Bay area, the lehigh Southwest Cement facility.
This measure was adopted on September 19, 2012, as regulation 9-13: nitrogen Oxides, Particulate Matter, and Toxic air Contaminants from Portland Cement Manufacturing. Further amendments to rule 9-13 were adopted on October 19, 2016.
Table F-1. Implementation Status of Control Measures in 2010 Clean Air Plan (continued)
(continued)
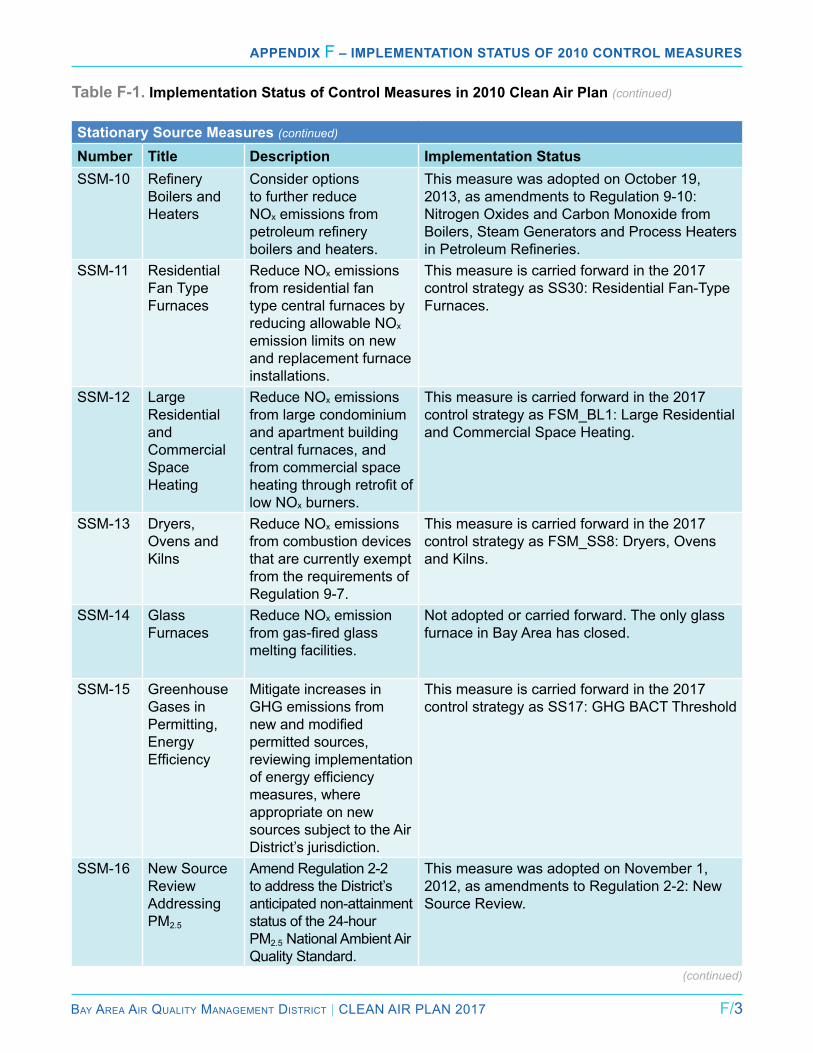
Bay area air Quality ManageMent District | Clean air Plan 2017 F/3
Appendix F – implementAtion StAtuS of 2010 Control meASureS
Table F-1. Implementation Status of Control Measures in 2010 Clean Air Plan (continued)
Stationary Source Measures (continued)
Number Title Description Implementation StatusSSM-10 Refinery
Boilers and Heaters
Consider options to further reduce nOx emissions from petroleum refinery boilers and heaters.
This measure was adopted on October 19, 2013, as amendments to regulation 9-10: nitrogen Oxides and Carbon Monoxide from Boilers, Steam Generators and Process Heaters in Petroleum Refineries.
SSM-11 residential Fan Type Furnaces
reduce nOx emissions from residential fan type central furnaces by reducing allowable nOx emission limits on new and replacement furnace installations.
This measure is carried forward in the 2017 control strategy as SS30: residential Fan-Type Furnaces.
SSM-12 large residential and Commercial Space Heating
reduce nOx emissions from large condominium and apartment building central furnaces, and from commercial space heating through retrofit of low nOx burners.
This measure is carried forward in the 2017 control strategy as FSM_Bl1: large residential and Commercial Space Heating.
SSM-13 Dryers, Ovens and Kilns
reduce nOx emissions from combustion devices that are currently exempt from the requirements of regulation 9-7.
This measure is carried forward in the 2017 control strategy as FSM_SS8: Dryers, Ovens and Kilns.
SSM-14 Glass Furnaces
reduce nOx emission from gas-fired glass melting facilities.
not adopted or carried forward. The only glass furnace in Bay area has closed.
SSM-15 Greenhouse Gases in Permitting, energy Efficiency
Mitigate increases in GHG emissions from new and modified permitted sources, reviewing implementation of energy efficiency measures, where appropriate on new sources subject to the air District’s jurisdiction.
This measure is carried forward in the 2017 control strategy as SS17: GHG BaCT Threshold
SSM-16 new Source review addressing PM2.5
amend regulation 2-2 to address the District’s anticipated non-attainment status of the 24-hour PM2.5 national ambient air Quality Standard.
This measure was adopted on november 1, 2012, as amendments to regulation 2-2: new Source review.
(continued)
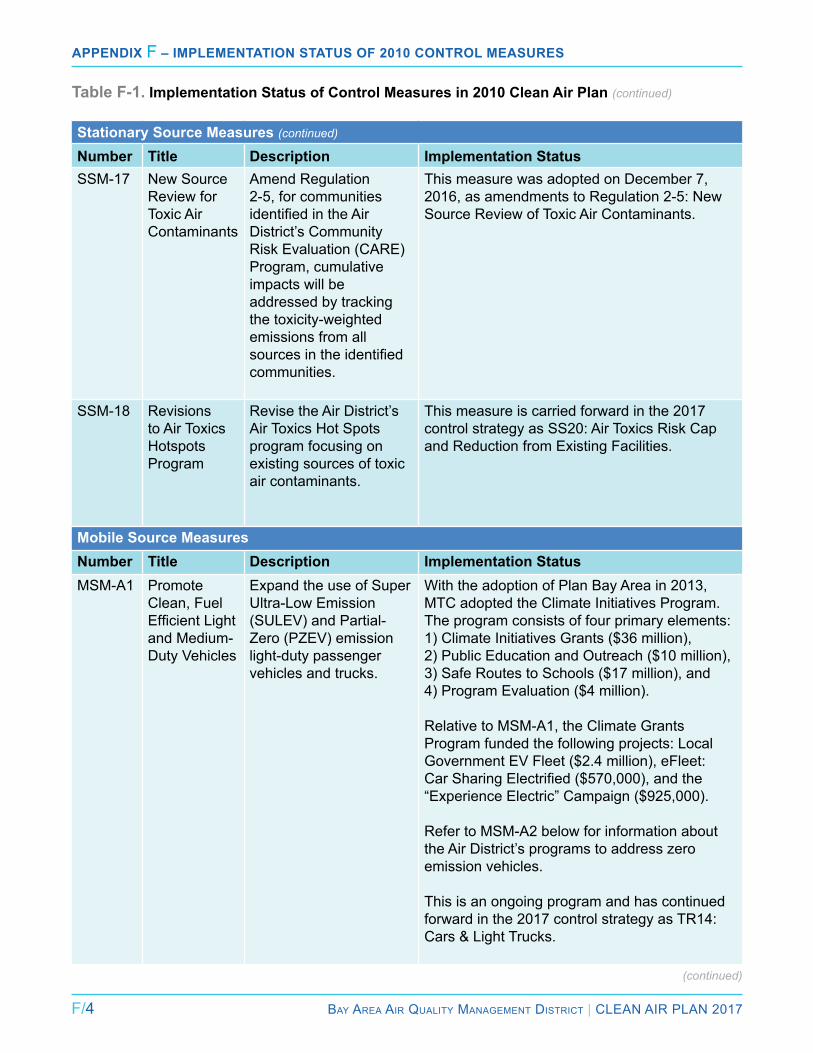
F/4 Bay area air Quality ManageMent District | Clean air Plan 2017
Appendix F – implementAtion StAtuS of 2010 Control meASureS
Table F-1. Implementation Status of Control Measures in 2010 Clean Air Plan (continued)
Stationary Source Measures (continued)
Number Title Description Implementation StatusSSM-17 new Source
review for Toxic air Contaminants
amend regulation 2-5, for communities identified in the Air District’s Community risk evaluation (Care) Program, cumulative impacts will be addressed by tracking the toxicity-weighted emissions from all sources in the identified communities.
This measure was adopted on December 7, 2016, as amendments to regulation 2-5: new Source review of Toxic air Contaminants.
SSM-18 revisions to air Toxics Hotspots Program
revise the air District’s air Toxics Hot Spots program focusing on existing sources of toxic air contaminants.
This measure is carried forward in the 2017 control strategy as SS20: air Toxics risk Cap and reduction from existing Facilities.
Mobile Source MeasuresNumber Title Description Implementation StatusMSM-a1 Promote
Clean, Fuel Efficient Light and Medium-Duty Vehicles
expand the use of Super Ultra-low emission (SUleV) and Partial-Zero (PZeV) emission light-duty passenger vehicles and trucks.
With the adoption of Plan Bay area in 2013, MTC adopted the Climate initiatives Program. The program consists of four primary elements: 1) Climate initiatives Grants ($36 million), 2) Public education and Outreach ($10 million), 3) Safe routes to Schools ($17 million), and 4) Program evaluation ($4 million).
relative to MSM-a1, the Climate Grants Program funded the following projects: local Government eV Fleet ($2.4 million), eFleet: Car Sharing Electrified ($570,000), and the “experience electric” Campaign ($925,000).
refer to MSM-a2 below for information about the air District’s programs to address zero emission vehicles.
This is an ongoing program and has continued forward in the 2017 control strategy as Tr14: Cars & light Trucks.
(continued)
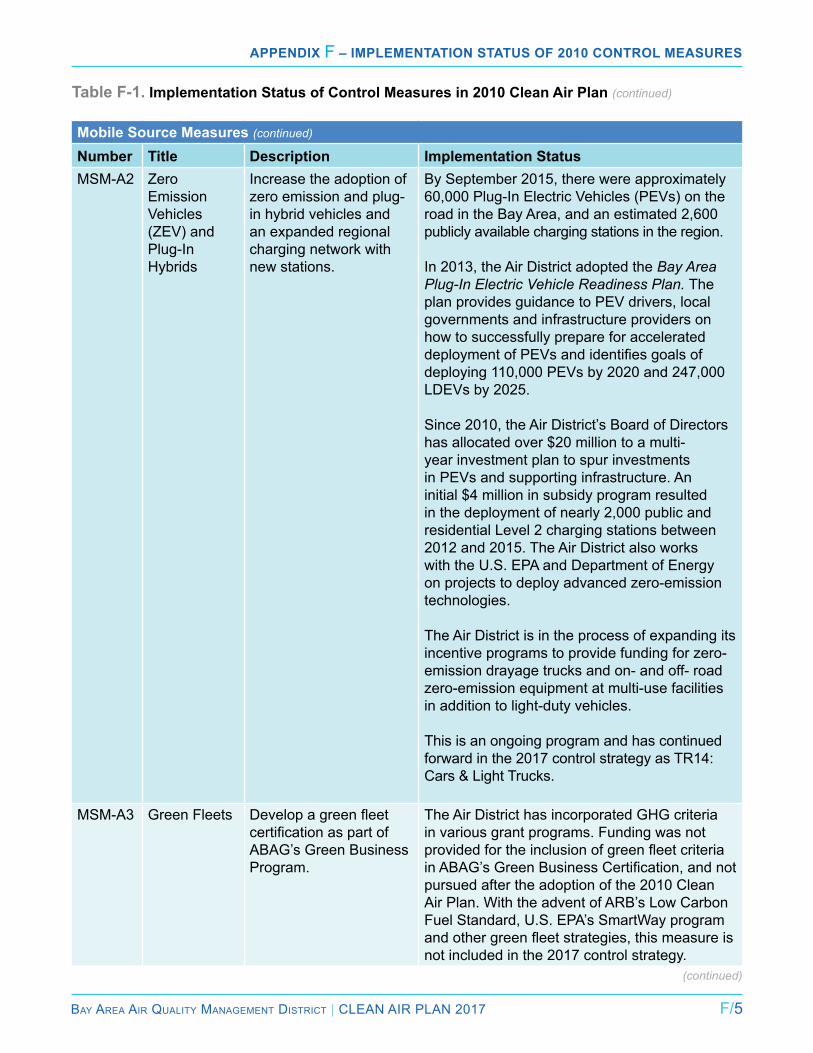
Bay area air Quality ManageMent District | Clean air Plan 2017 F/5
Appendix F – implementAtion StAtuS of 2010 Control meASureS
Table F-1. Implementation Status of Control Measures in 2010 Clean Air Plan (continued)
Mobile Source Measures (continued)
Number Title Description Implementation StatusMSM-a2 Zero
emission Vehicles (ZeV) and Plug-in Hybrids
increase the adoption of zero emission and plug-in hybrid vehicles and an expanded regional charging network with new stations.
By September 2015, there were approximately 60,000 Plug-in electric Vehicles (PeVs) on the road in the Bay area, and an estimated 2,600 publicly available charging stations in the region.
in 2013, the air District adopted the Bay Area Plug-In Electric Vehicle Readiness Plan. The plan provides guidance to PeV drivers, local governments and infrastructure providers on how to successfully prepare for accelerated deployment of PEVs and identifies goals of deploying 110,000 PeVs by 2020 and 247,000 lDeVs by 2025.
Since 2010, the air District’s Board of Directors has allocated over $20 million to a multi-year investment plan to spur investments in PeVs and supporting infrastructure. an initial $4 million in subsidy program resulted in the deployment of nearly 2,000 public and residential level 2 charging stations between 2012 and 2015. The air District also works with the U.S. ePa and Department of energy on projects to deploy advanced zero-emission technologies.
The air District is in the process of expanding its incentive programs to provide funding for zero-emission drayage trucks and on- and off- road zero-emission equipment at multi-use facilities in addition to light-duty vehicles.
This is an ongoing program and has continued forward in the 2017 control strategy as Tr14: Cars & light Trucks.
MSM-a3 Green Fleets Develop a green fleet certification as part of aBaG’s Green Business Program.
The air District has incorporated GHG criteria in various grant programs. Funding was not provided for the inclusion of green fleet criteria in ABAG’s Green Business Certification, and not pursued after the adoption of the 2010 Clean air Plan. With the advent of arB’s low Carbon Fuel Standard, U.S. ePa’s SmartWay program and other green fleet strategies, this measure is not included in the 2017 control strategy.
(continued)
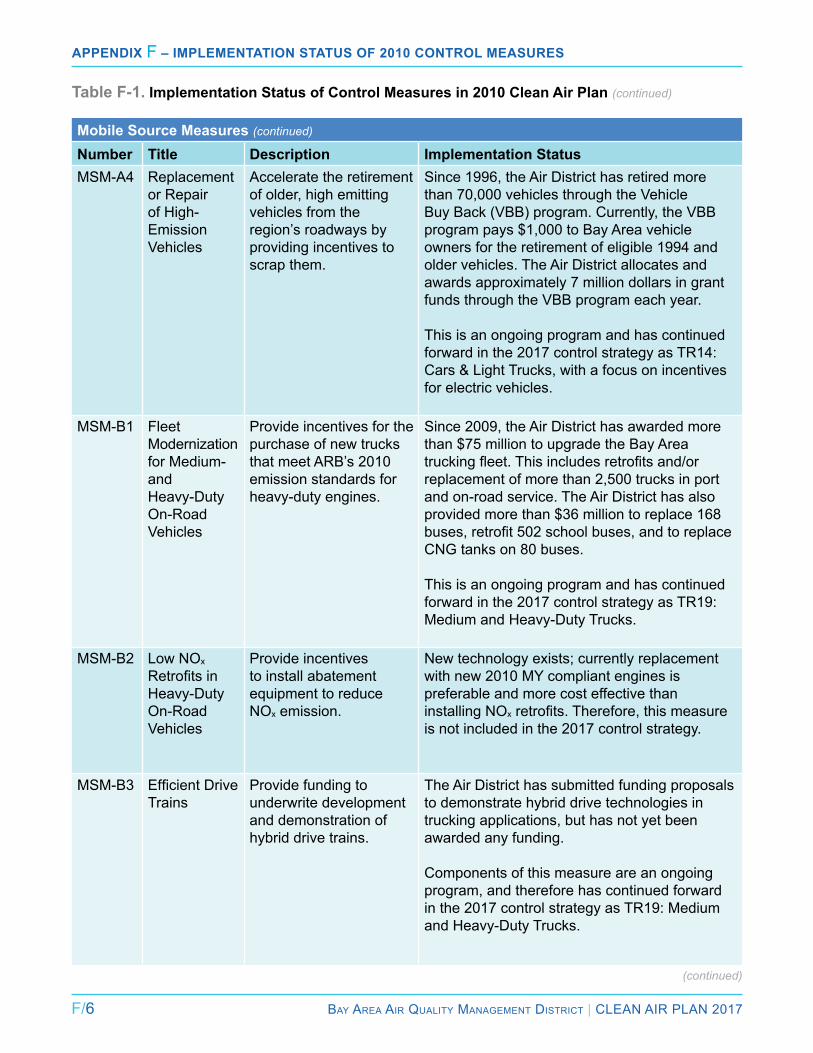
F/6 Bay area air Quality ManageMent District | Clean air Plan 2017
Appendix F – implementAtion StAtuS of 2010 Control meASureS
Table F-1. Implementation Status of Control Measures in 2010 Clean Air Plan (continued)
Mobile Source Measures (continued)
Number Title Description Implementation StatusMSM-a4 replacement
or repair of High-emission Vehicles
accelerate the retirement of older, high emitting vehicles from the region’s roadways by providing incentives to scrap them.
Since 1996, the air District has retired more than 70,000 vehicles through the Vehicle Buy Back (VBB) program. Currently, the VBB program pays $1,000 to Bay area vehicle owners for the retirement of eligible 1994 and older vehicles. The air District allocates and awards approximately 7 million dollars in grant funds through the VBB program each year.
This is an ongoing program and has continued forward in the 2017 control strategy as Tr14: Cars & light Trucks, with a focus on incentives for electric vehicles.
MSM-B1 Fleet Modernization for Medium- and Heavy-Duty On-road Vehicles
Provide incentives for the purchase of new trucks that meet arB’s 2010 emission standards for heavy-duty engines.
Since 2009, the air District has awarded more than $75 million to upgrade the Bay area trucking fleet. This includes retrofits and/or replacement of more than 2,500 trucks in port and on-road service. The air District has also provided more than $36 million to replace 168 buses, retrofit 502 school buses, and to replace CnG tanks on 80 buses.
This is an ongoing program and has continued forward in the 2017 control strategy as Tr19: Medium and Heavy-Duty Trucks.
MSM-B2 low nOx Retrofits in Heavy-Duty On-road Vehicles
Provide incentives to install abatement equipment to reduce nOx emission.
new technology exists; currently replacement with new 2010 MY compliant engines is preferable and more cost effective than installing nOx retrofits. Therefore, this measure is not included in the 2017 control strategy.
MSM-B3 Efficient Drive Trains
Provide funding to underwrite development and demonstration of hybrid drive trains.
The air District has submitted funding proposals to demonstrate hybrid drive technologies in trucking applications, but has not yet been awarded any funding.
Components of this measure are an ongoing program, and therefore has continued forward in the 2017 control strategy as Tr19: Medium and Heavy-Duty Trucks.
(continued)

Bay area air Quality ManageMent District | Clean air Plan 2017 F/7
Appendix F – implementAtion StAtuS of 2010 Control meASureS
Table F-1. Implementation Status of Control Measures in 2010 Clean Air Plan (continued)
Mobile Source Measures (continued)
Number Title Description Implementation StatusMSM-C1 Construction
and Farming equipment
Use various strategies to reduce emissions from construction and farming equipment, e.g. incentives for equipment upgrades and/or encourage the use of renewable electricity and fuels.
Since 2009, the air District has provided more than $38 million to replace and/or upgrade hundreds of pieces of equipment used in construction, cargo-handling and agricultural operations. Projects typically involve replacing older, often uncontrolled equipment with newer units that have engines certified to the cleanest available standards.
This is an ongoing program and has continued forward in the 2017 control strategy as Tr22: Construction, Freight and Farming equipment.
MSM-C2 lawn and Garden equipment
Provide incentives toward exchange programs targeting older lawn mowers and leaf blowers with two-stroke engines.
Currently, there are two lawn Mower exchange programs. The residential program serves the entire Bay area. The commercial program serves public agencies within alameda and Contra Costa counties. These programs offer funding for new, battery-powered, zero-emission electric lawn and garden equipment in exchange for scrapping operable gasoline-powered lawn and garden equipment. Between 2010 and 2015, the air District allocated $834,050 to implement this measure.
The air District is exploring funding opportunities to continue and expand the Commercial lawn & Garden equipment exchange Program to make it available to all areas within the air District’s jurisdiction. likewise, the air District intends to continue the residential lawn Mower exchange program.
This is an ongoing program and has continued forward in the 2017 control strategy as Tr23: lawn Care equipment.
MSM-C3 recreational Watercraft
establish voluntary exchange program to retire gasoline-powered four-stroke and two-stroke outboard engines used in small recreational watercrafts.
an incentive program to replace older, two-stroke marine outboard engines with low-emission, four-stroke engines currently lacks funding.
(continued)
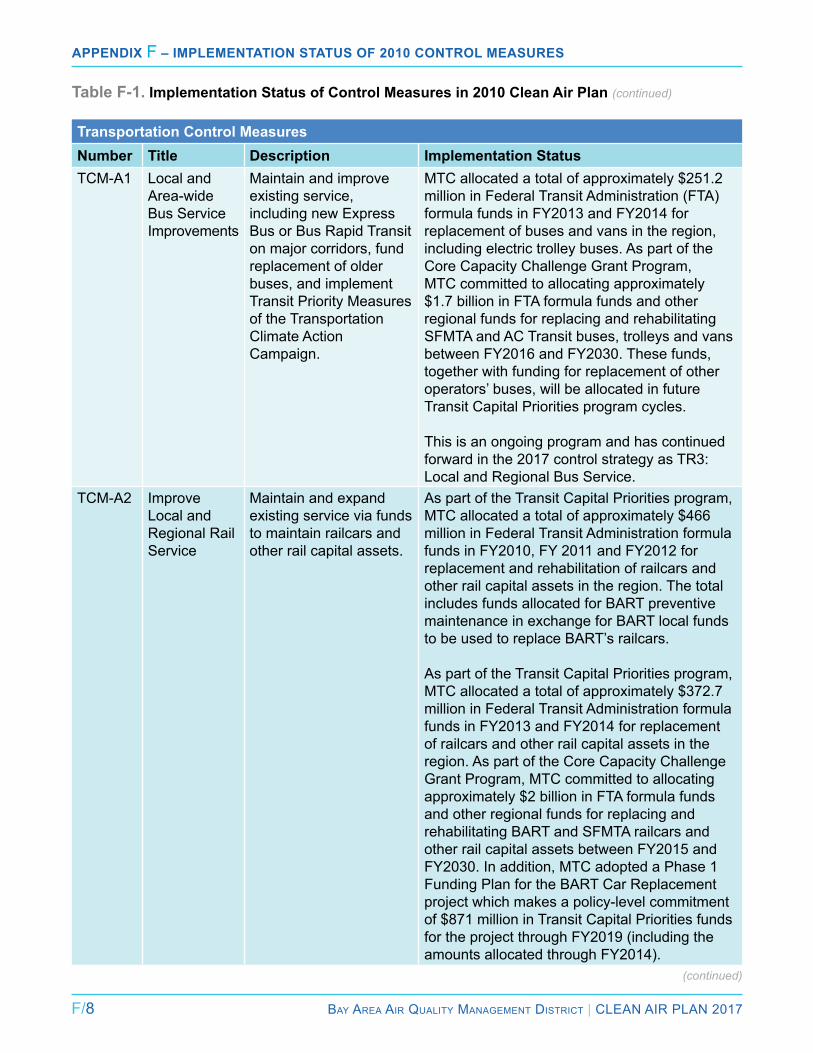
F/8 Bay area air Quality ManageMent District | Clean air Plan 2017
Appendix F – implementAtion StAtuS of 2010 Control meASureS
Table F-1. Implementation Status of Control Measures in 2010 Clean Air Plan (continued)
Transportation Control MeasuresNumber Title Description Implementation StatusTCM-a1 local and
area-wide Bus Service improvements
Maintain and improve existing service, including new express Bus or Bus rapid Transit on major corridors, fund replacement of older buses, and implement Transit Priority Measures of the Transportation Climate action Campaign.
MTC allocated a total of approximately $251.2 million in Federal Transit administration (FTa) formula funds in FY2013 and FY2014 for replacement of buses and vans in the region, including electric trolley buses. as part of the Core Capacity Challenge Grant Program, MTC committed to allocating approximately $1.7 billion in FTa formula funds and other regional funds for replacing and rehabilitating SFMTa and aC Transit buses, trolleys and vans between FY2016 and FY2030. These funds, together with funding for replacement of other operators’ buses, will be allocated in future Transit Capital Priorities program cycles.
This is an ongoing program and has continued forward in the 2017 control strategy as Tr3: local and regional Bus Service.
TCM-a2 improve local and regional rail Service
Maintain and expand existing service via funds to maintain railcars and other rail capital assets.
as part of the Transit Capital Priorities program, MTC allocated a total of approximately $466 million in Federal Transit administration formula funds in FY2010, FY 2011 and FY2012 for replacement and rehabilitation of railcars and other rail capital assets in the region. The total includes funds allocated for BarT preventive maintenance in exchange for BarT local funds to be used to replace BarT’s railcars.
as part of the Transit Capital Priorities program, MTC allocated a total of approximately $372.7 million in Federal Transit administration formula funds in FY2013 and FY2014 for replacement of railcars and other rail capital assets in the region. as part of the Core Capacity Challenge Grant Program, MTC committed to allocating approximately $2 billion in FTa formula funds and other regional funds for replacing and rehabilitating BarT and SFMTa railcars and other rail capital assets between FY2015 and FY2030. in addition, MTC adopted a Phase 1 Funding Plan for the BarT Car replacement project which makes a policy-level commitment of $871 million in Transit Capital Priorities funds for the project through FY2019 (including the amounts allocated through FY2014).
(continued)
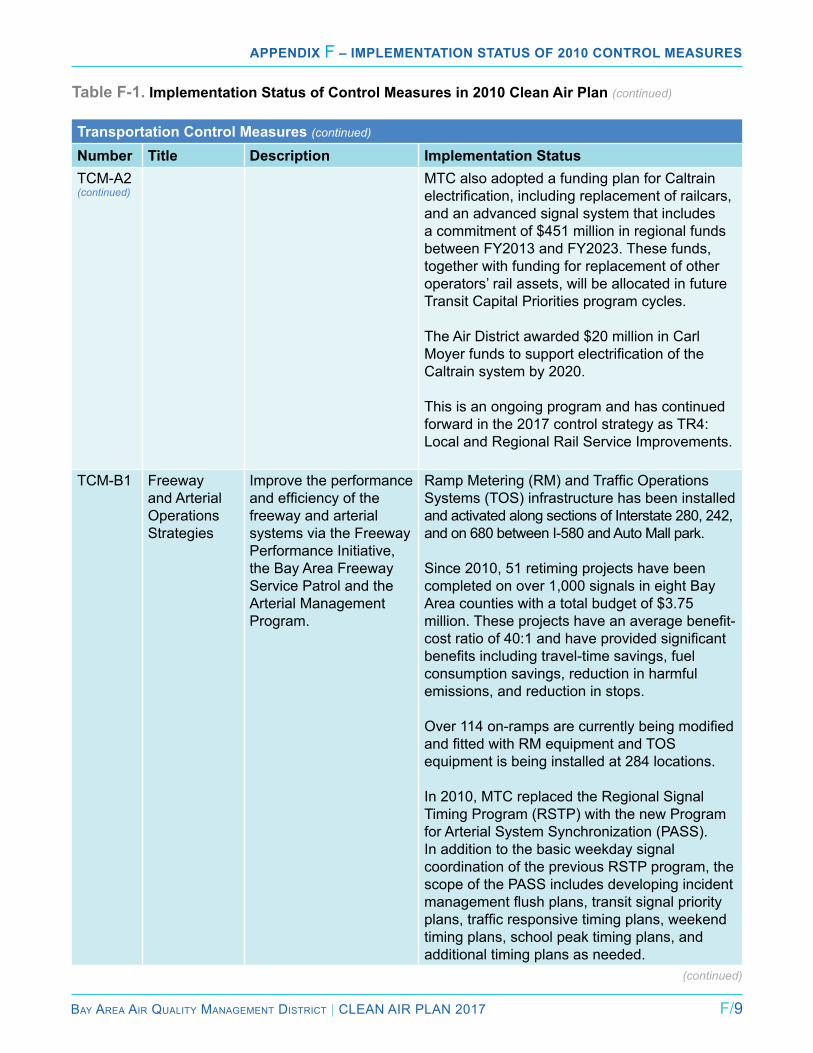
Bay area air Quality ManageMent District | Clean air Plan 2017 F/9
Appendix F – implementAtion StAtuS of 2010 Control meASureS
Table F-1. Implementation Status of Control Measures in 2010 Clean Air Plan (continued)
Transportation Control Measures (continued)
Number Title Description Implementation StatusTCM-a2(continued)
MTC also adopted a funding plan for Caltrain electrification, including replacement of railcars, and an advanced signal system that includes a commitment of $451 million in regional funds between FY2013 and FY2023. These funds, together with funding for replacement of other operators’ rail assets, will be allocated in future Transit Capital Priorities program cycles.
The air District awarded $20 million in Carl Moyer funds to support electrification of the Caltrain system by 2020.
This is an ongoing program and has continued forward in the 2017 control strategy as Tr4: local and regional rail Service improvements.
TCM-B1 Freeway and arterial Operations Strategies
improve the performance and efficiency of the freeway and arterial systems via the Freeway Performance initiative, the Bay area Freeway Service Patrol and the arterial Management Program.
Ramp Metering (RM) and Traffic Operations Systems (TOS) infrastructure has been installed and activated along sections of interstate 280, 242, and on 680 between i-580 and auto Mall park.
Since 2010, 51 retiming projects have been completed on over 1,000 signals in eight Bay area counties with a total budget of $3.75 million. These projects have an average benefit-cost ratio of 40:1 and have provided significant benefits including travel-time savings, fuel consumption savings, reduction in harmful emissions, and reduction in stops.
Over 114 on-ramps are currently being modified and fitted with RM equipment and TOS equipment is being installed at 284 locations.
in 2010, MTC replaced the regional Signal Timing Program (rSTP) with the new Program for arterial System Synchronization (PaSS). in addition to the basic weekday signal coordination of the previous rSTP program, the scope of the PaSS includes developing incident management flush plans, transit signal priority plans, traffic responsive timing plans, weekend timing plans, school peak timing plans, and additional timing plans as needed.
(continued)
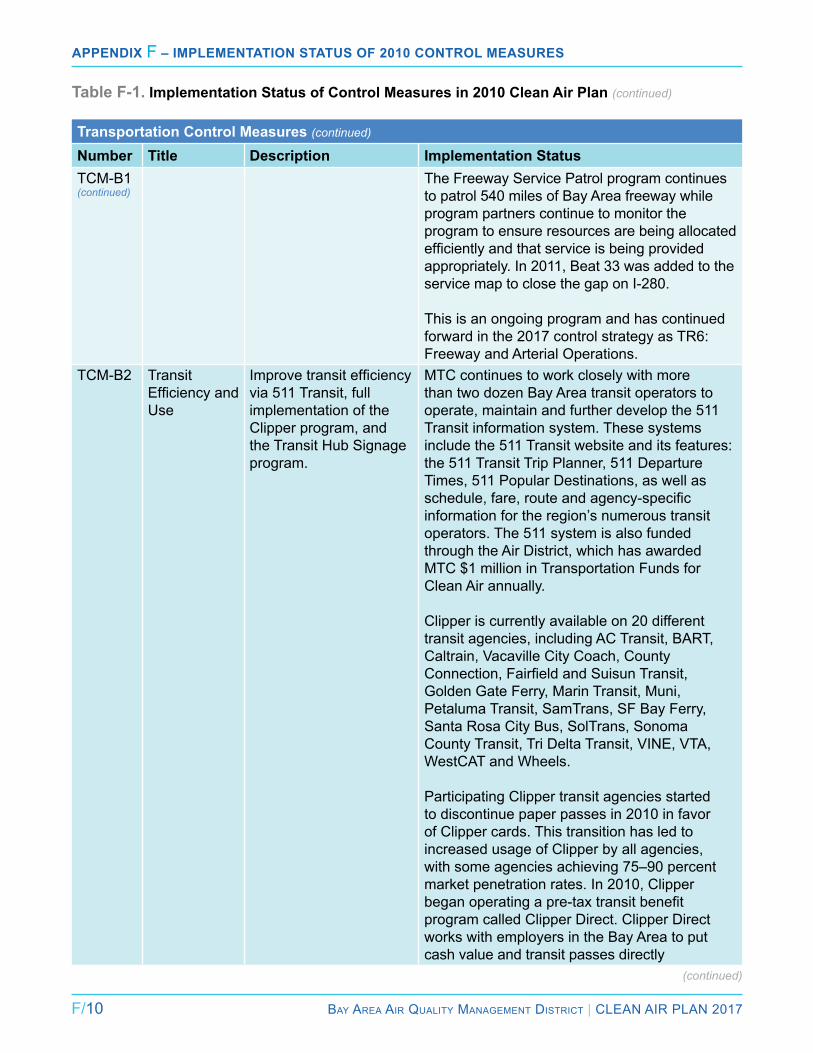
F/10 Bay area air Quality ManageMent District | Clean air Plan 2017
Appendix F – implementAtion StAtuS of 2010 Control meASureS
Table F-1. Implementation Status of Control Measures in 2010 Clean Air Plan (continued)
Transportation Control Measures (continued)
Number Title Description Implementation StatusTCM-B1(continued)
The Freeway Service Patrol program continues to patrol 540 miles of Bay area freeway while program partners continue to monitor the program to ensure resources are being allocated efficiently and that service is being provided appropriately. in 2011, Beat 33 was added to the service map to close the gap on i-280.
This is an ongoing program and has continued forward in the 2017 control strategy as Tr6: Freeway and arterial Operations.
TCM-B2 Transit Efficiency and Use
Improve transit efficiency via 511 Transit, full implementation of the Clipper program, and the Transit Hub Signage program.
MTC continues to work closely with more than two dozen Bay area transit operators to operate, maintain and further develop the 511 Transit information system. These systems include the 511 Transit website and its features: the 511 Transit Trip Planner, 511 Departure Times, 511 Popular Destinations, as well as schedule, fare, route and agency-specific information for the region’s numerous transit operators. The 511 system is also funded through the air District, which has awarded MTC $1 million in Transportation Funds for Clean air annually.
Clipper is currently available on 20 different transit agencies, including aC Transit, BarT, Caltrain, Vacaville City Coach, County Connection, Fairfield and Suisun Transit, Golden Gate Ferry, Marin Transit, Muni, Petaluma Transit, SamTrans, SF Bay Ferry, Santa rosa City Bus, SolTrans, Sonoma County Transit, Tri Delta Transit, Vine, VTa, WestCaT and Wheels.
Participating Clipper transit agencies started to discontinue paper passes in 2010 in favor of Clipper cards. This transition has led to increased usage of Clipper by all agencies, with some agencies achieving 75–90 percent market penetration rates. in 2010, Clipper began operating a pre-tax transit benefit program called Clipper Direct. Clipper Direct works with employers in the Bay area to put cash value and transit passes directly
(continued)
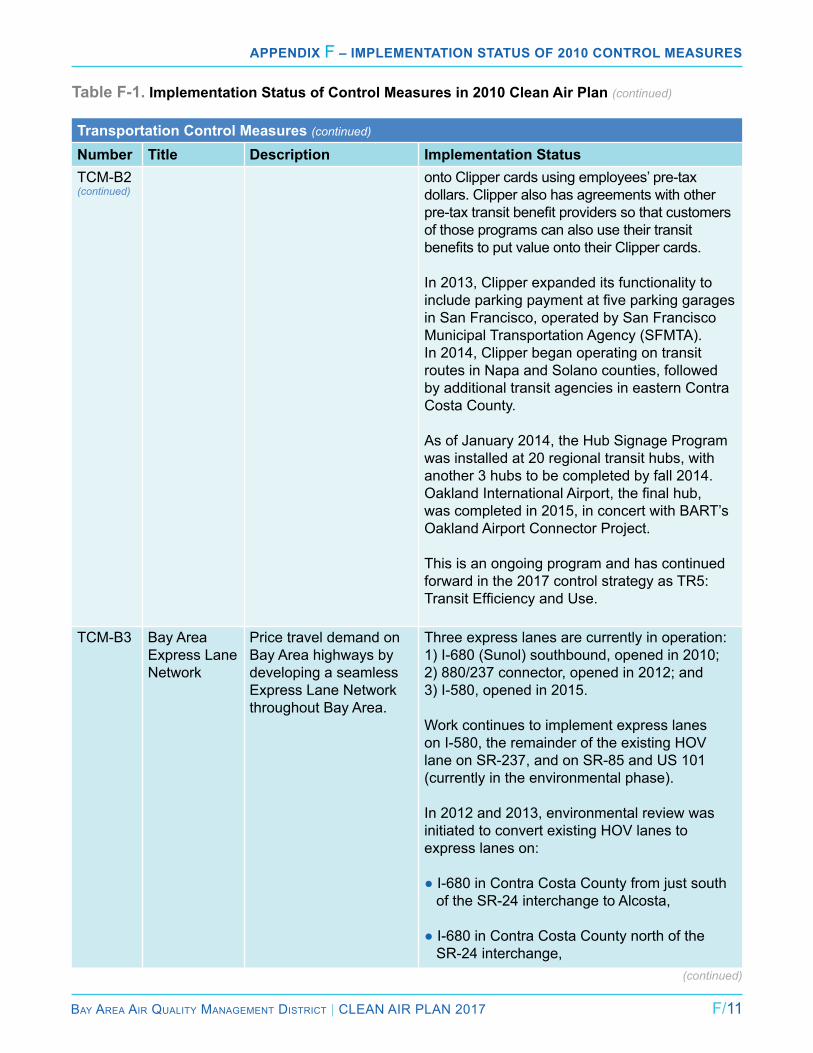
Bay area air Quality ManageMent District | Clean air Plan 2017 F/11
Appendix F – implementAtion StAtuS of 2010 Control meASureS
Table F-1. Implementation Status of Control Measures in 2010 Clean Air Plan (continued)
Transportation Control Measures (continued)
Number Title Description Implementation StatusTCM-B2(continued)
onto Clipper cards using employees’ pre-tax dollars. Clipper also has agreements with other pre-tax transit benefit providers so that customers of those programs can also use their transit benefits to put value onto their Clipper cards.
in 2013, Clipper expanded its functionality to include parking payment at five parking garages in San Francisco, operated by San Francisco Municipal Transportation agency (SFMTa). in 2014, Clipper began operating on transit routes in napa and Solano counties, followed by additional transit agencies in eastern Contra Costa County.
as of January 2014, the Hub Signage Program was installed at 20 regional transit hubs, with another 3 hubs to be completed by fall 2014. Oakland International Airport, the final hub, was completed in 2015, in concert with BarT’s Oakland airport Connector Project.
This is an ongoing program and has continued forward in the 2017 control strategy as Tr5: Transit Efficiency and Use.
TCM-B3 Bay area express lane network
Price travel demand on Bay area highways by developing a seamless express lane network throughout Bay area.
Three express lanes are currently in operation: 1) i-680 (Sunol) southbound, opened in 2010; 2) 880/237 connector, opened in 2012; and 3) i-580, opened in 2015.
Work continues to implement express lanes on i-580, the remainder of the existing HOV lane on Sr-237, and on Sr-85 and US 101 (currently in the environmental phase).
in 2012 and 2013, environmental review was initiated to convert existing HOV lanes to express lanes on:
● i-680 in Contra Costa County from just south of the Sr-24 interchange to alcosta,
● i-680 in Contra Costa County north of the Sr-24 interchange,
(continued)
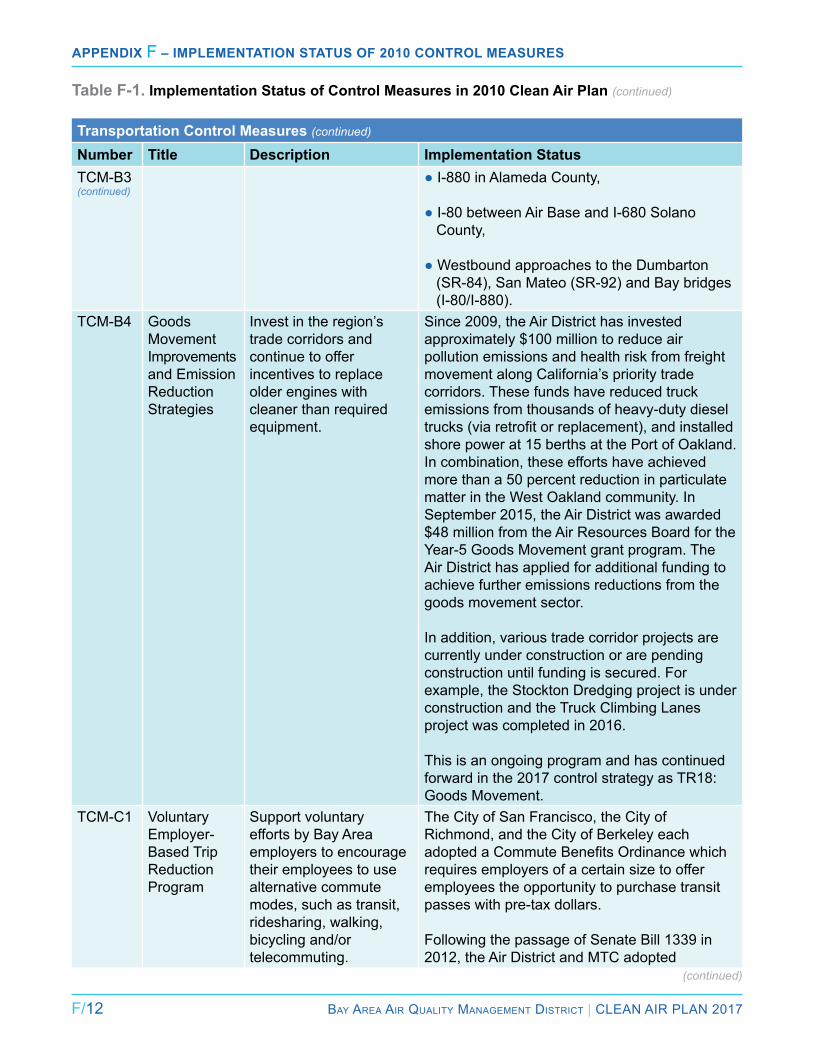
F/12 Bay area air Quality ManageMent District | Clean air Plan 2017
Appendix F – implementAtion StAtuS of 2010 Control meASureS
Table F-1. Implementation Status of Control Measures in 2010 Clean Air Plan (continued)
(continued)
Transportation Control Measures (continued)
Number Title Description Implementation StatusTCM-B3(continued)
● i-880 in alameda County,
● i-80 between air Base and i-680 Solano County,
● Westbound approaches to the Dumbarton (Sr-84), San Mateo (Sr-92) and Bay bridges (i-80/i-880).
TCM-B4 Goods Movement improvements and emission reduction Strategies
invest in the region’s trade corridors and continue to offer incentives to replace older engines with cleaner than required equipment.
Since 2009, the air District has invested approximately $100 million to reduce air pollution emissions and health risk from freight movement along California’s priority trade corridors. These funds have reduced truck emissions from thousands of heavy-duty diesel trucks (via retrofit or replacement), and installed shore power at 15 berths at the Port of Oakland. in combination, these efforts have achieved more than a 50 percent reduction in particulate matter in the West Oakland community. in September 2015, the air District was awarded $48 million from the air resources Board for the Year-5 Goods Movement grant program. The air District has applied for additional funding to achieve further emissions reductions from the goods movement sector.
in addition, various trade corridor projects are currently under construction or are pending construction until funding is secured. For example, the Stockton Dredging project is under construction and the Truck Climbing lanes project was completed in 2016.
This is an ongoing program and has continued forward in the 2017 control strategy as Tr18: Goods Movement.
TCM-C1 Voluntary employer-Based Trip reduction Program
Support voluntary efforts by Bay area employers to encourage their employees to use alternative commute modes, such as transit, ridesharing, walking, bicycling and/or telecommuting.
The City of San Francisco, the City of richmond, and the City of Berkeley each adopted a Commute Benefits Ordinance which requires employers of a certain size to offer employees the opportunity to purchase transit passes with pre-tax dollars.
Following the passage of Senate Bill 1339 in 2012, the air District and MTC adopted
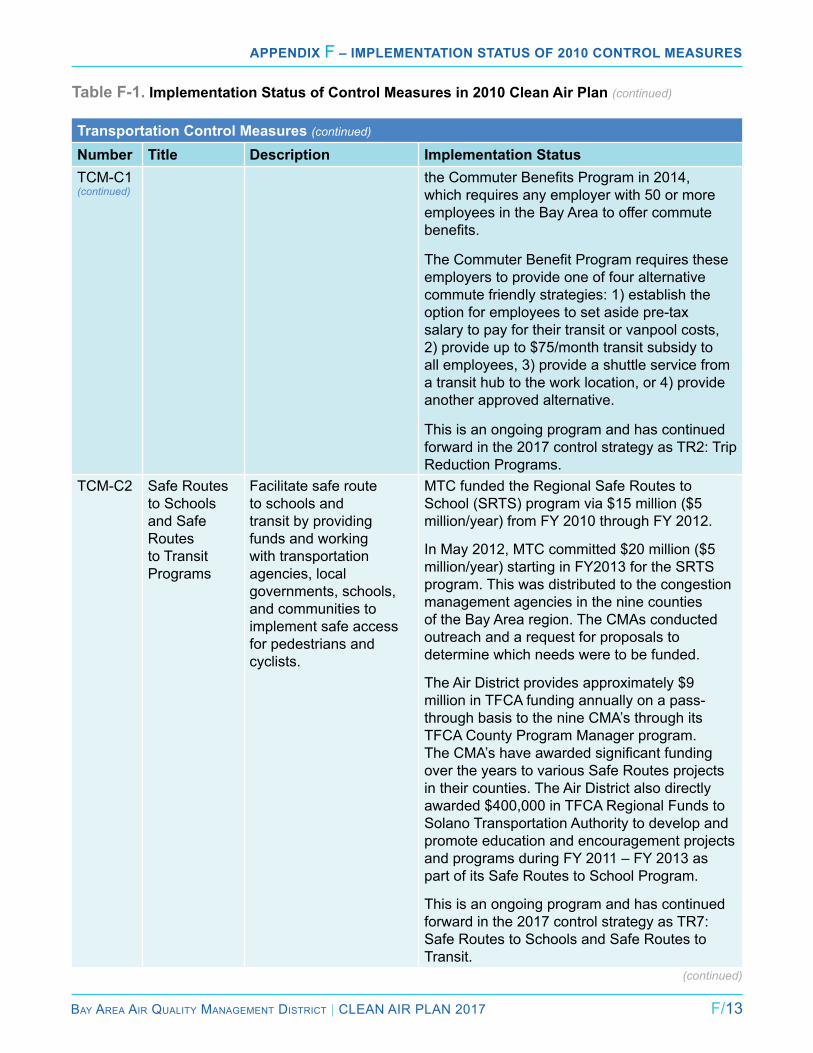
Bay area air Quality ManageMent District | Clean air Plan 2017 F/13
Appendix F – implementAtion StAtuS of 2010 Control meASureS
Table F-1. Implementation Status of Control Measures in 2010 Clean Air Plan (continued)
(continued)
Transportation Control Measures (continued)
Number Title Description Implementation StatusTCM-C1(continued)
the Commuter Benefits Program in 2014, which requires any employer with 50 or more employees in the Bay area to offer commute benefits.
The Commuter Benefit Program requires these employers to provide one of four alternative commute friendly strategies: 1) establish the option for employees to set aside pre-tax salary to pay for their transit or vanpool costs, 2) provide up to $75/month transit subsidy to all employees, 3) provide a shuttle service from a transit hub to the work location, or 4) provide another approved alternative.
This is an ongoing program and has continued forward in the 2017 control strategy as Tr2: Trip reduction Programs.
TCM-C2 Safe routes to Schools and Safe routes to Transit Programs
Facilitate safe route to schools and transit by providing funds and working with transportation agencies, local governments, schools, and communities to implement safe access for pedestrians and cyclists.
MTC funded the regional Safe routes to School (SrTS) program via $15 million ($5 million/year) from FY 2010 through FY 2012.
in May 2012, MTC committed $20 million ($5 million/year) starting in FY2013 for the SrTS program. This was distributed to the congestion management agencies in the nine counties of the Bay area region. The CMas conducted outreach and a request for proposals to determine which needs were to be funded.
The air District provides approximately $9 million in TFCa funding annually on a pass-through basis to the nine CMa’s through its TFCa County Program Manager program. The CMA’s have awarded significant funding over the years to various Safe routes projects in their counties. The air District also directly awarded $400,000 in TFCa regional Funds to Solano Transportation authority to develop and promote education and encouragement projects and programs during FY 2011 – FY 2013 as part of its Safe routes to School Program.
This is an ongoing program and has continued forward in the 2017 control strategy as Tr7: Safe routes to Schools and Safe routes to Transit.
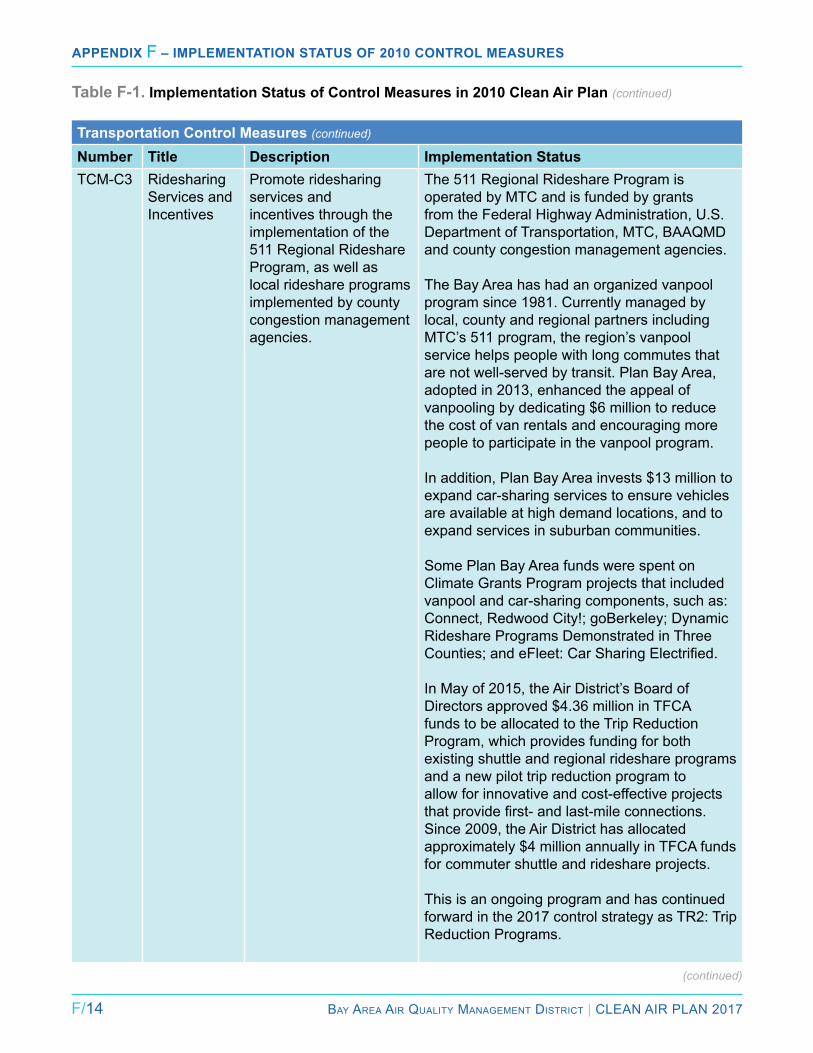
F/14 Bay area air Quality ManageMent District | Clean air Plan 2017
Appendix F – implementAtion StAtuS of 2010 Control meASureS
Table F-1. Implementation Status of Control Measures in 2010 Clean Air Plan (continued)
(continued)
Transportation Control Measures (continued)
Number Title Description Implementation StatusTCM-C3 ridesharing
Services and incentives
Promote ridesharing services and incentives through the implementation of the 511 regional rideshare Program, as well as local rideshare programs implemented by county congestion management agencies.
The 511 regional rideshare Program is operated by MTC and is funded by grants from the Federal Highway administration, U.S. Department of Transportation, MTC, BaaQMD and county congestion management agencies.
The Bay area has had an organized vanpool program since 1981. Currently managed by local, county and regional partners including MTC’s 511 program, the region’s vanpool service helps people with long commutes that are not well-served by transit. Plan Bay area, adopted in 2013, enhanced the appeal of vanpooling by dedicating $6 million to reduce the cost of van rentals and encouraging more people to participate in the vanpool program.
in addition, Plan Bay area invests $13 million to expand car-sharing services to ensure vehicles are available at high demand locations, and to expand services in suburban communities.
Some Plan Bay area funds were spent on Climate Grants Program projects that included vanpool and car-sharing components, such as: Connect, redwood City!; goBerkeley; Dynamic rideshare Programs Demonstrated in Three Counties; and eFleet: Car Sharing Electrified.
in May of 2015, the air District’s Board of Directors approved $4.36 million in TFCa funds to be allocated to the Trip reduction Program, which provides funding for both existing shuttle and regional rideshare programs and a new pilot trip reduction program to allow for innovative and cost-effective projects that provide first- and last-mile connections. Since 2009, the air District has allocated approximately $4 million annually in TFCa funds for commuter shuttle and rideshare projects.
This is an ongoing program and has continued forward in the 2017 control strategy as Tr2: Trip reduction Programs.

Bay area air Quality ManageMent District | Clean air Plan 2017 F/15
Appendix F – implementAtion StAtuS of 2010 Control meASureS
Table F-1. Implementation Status of Control Measures in 2010 Clean Air Plan (continued)
(continued)
Transportation Control Measures (continued)
Number Title Description Implementation StatusTCM-C4 Conduct
Public Outreach & education
encourage Bay area residents to make choices that benefit air quality by educating the public about the health effects of air pollution and encouraging the use of alternative travel modes.
The Spare the air (STa) every Day Program is the backbone of the air District’s efforts to encourage the public to take direct action to reduce emissions and improve air quality. STa every Day includes the following components: Outreach Program, employer Program, Community resource Teams, Winter Spare the air and Youth Programs.
This is an ongoing program and has continued forward in the 2017 control strategy as Tr15: Public Outreach.
MTC implemented an electrical Vehicle (eV) promotional campaign. The eV promotional campaign was aimed at building awareness, action and demand for electric vehicles in the Bay area in order to enable the region to reduce its GHG emissions.
TCM-C5 Smart Driving Focus on public education to encourage drivers to observe posted speed limits and adopt other fuel efficient driving practices, supplemented by speed enforcement.
MTC funded two smart driving pilots: 1) $400k to test in-use fuel saving devices that will be installed into participants’ vehicles. real-time information will be recorded during vehicle acceleration and deceleration to educate drivers about how driving behavior affects miles-per-gallon rate; and 2) $114k to test in-vehicle apps.
This is an ongoing program and has continued forward in the 2017 control strategy as Tr12: Smart Driving.
TCM-D1 Bicycle access and Facilities improvements
expand bicycle facilities serving employment sites, educational and cultural facilities, residential areas, shopping districts and other activity centers.
launched on august 29, 2013, the Bay area Bike Share (BABS) program is the first bike share system to launch in California and in the United States as a unified regional system. Bike sharing allows both residents and visitors to make short trips by bike and provides an easy and cost-effective “last mile” solution, linking public transit with riders’ final destinations. The BaBS system operates 24-hours a day, seven-days a week in five cities along the Caltrain commuter rail corridor—San Francisco, redwood City, Palo alto, Mountain View and San Jose. The Bay area’s system consists of 70 stations and a fleet of 700 bikes and is
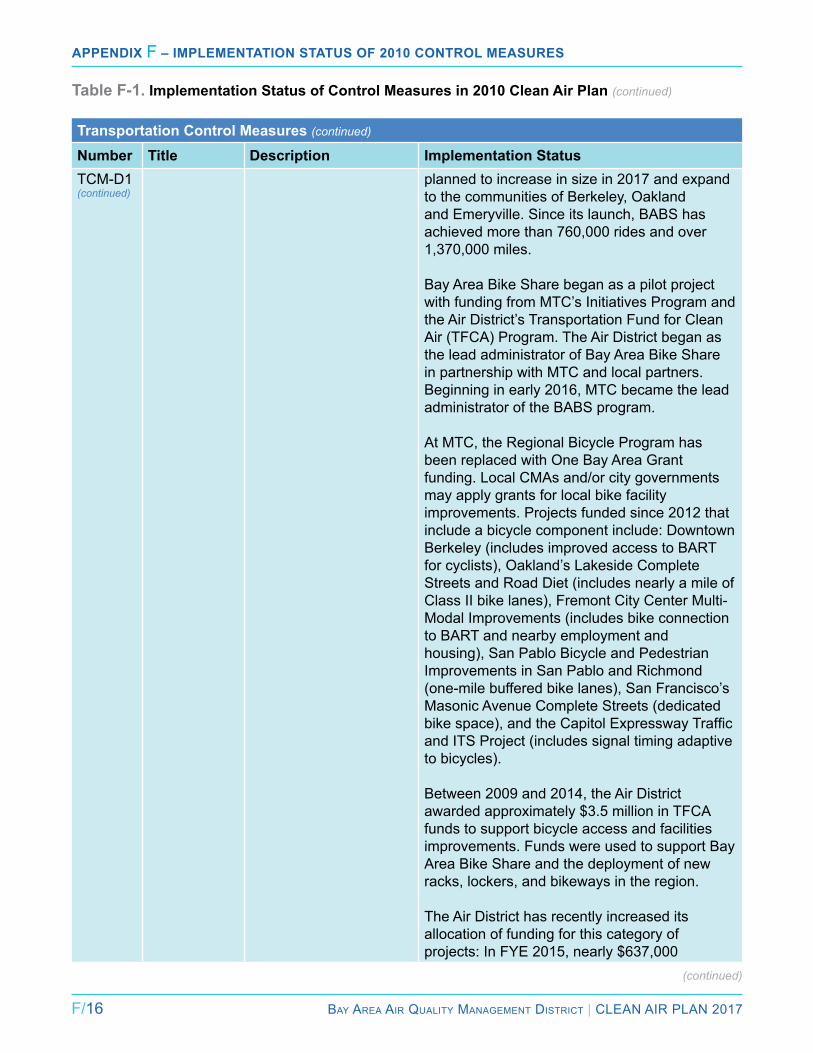
F/16 Bay area air Quality ManageMent District | Clean air Plan 2017
Appendix F – implementAtion StAtuS of 2010 Control meASureS
Transportation Control Measures (continued)
Number Title Description Implementation StatusTCM-D1(continued)
planned to increase in size in 2017 and expand to the communities of Berkeley, Oakland and emeryville. Since its launch, BaBS has achieved more than 760,000 rides and over 1,370,000 miles.
Bay area Bike Share began as a pilot project with funding from MTC’s initiatives Program and the air District’s Transportation Fund for Clean air (TFCa) Program. The air District began as the lead administrator of Bay area Bike Share in partnership with MTC and local partners. Beginning in early 2016, MTC became the lead administrator of the BaBS program.
at MTC, the regional Bicycle Program has been replaced with One Bay area Grant funding. local CMas and/or city governments may apply grants for local bike facility improvements. Projects funded since 2012 that include a bicycle component include: Downtown Berkeley (includes improved access to BarT for cyclists), Oakland’s lakeside Complete Streets and road Diet (includes nearly a mile of Class ii bike lanes), Fremont City Center Multi-Modal improvements (includes bike connection to BarT and nearby employment and housing), San Pablo Bicycle and Pedestrian improvements in San Pablo and richmond (one-mile buffered bike lanes), San Francisco’s Masonic avenue Complete Streets (dedicated bike space), and the Capitol Expressway Traffic and iTS Project (includes signal timing adaptive to bicycles).
Between 2009 and 2014, the air District awarded approximately $3.5 million in TFCa funds to support bicycle access and facilities improvements. Funds were used to support Bay area Bike Share and the deployment of new racks, lockers, and bikeways in the region.
The air District has recently increased its allocation of funding for this category of projects: in FYe 2015, nearly $637,000
Table F-1. Implementation Status of Control Measures in 2010 Clean Air Plan (continued)
(continued)

Bay area air Quality ManageMent District | Clean air Plan 2017 F/17
Appendix F – implementAtion StAtuS of 2010 Control meASureS
Table F-1. Implementation Status of Control Measures in 2010 Clean Air Plan (continued)
(continued)
Transportation Control Measures (continued)
Number Title Description Implementation StatusTCM-D1(continued)
in TFCa funds were awarded to support the installation of 2,200 new bicycle rack parking spaces and 220 new electronic lockers; for FYe 2016, the air District has allocated $3.84 million in TFCa funds for bicycle access and facilities improvements projects.
This is an ongoing program and has continued forward in the 2017 control strategy as Tr9: Bicycle and Pedestrian access and Facilities.
TCM-D2 Pedestrian access and Facilities improvements
improve pedestrian facilities and encourage walking by funding projects that improve pedestrian access to transit, employment and major activity centers.
MTC’s One Bay area Grant funds pedestrian projects. Projects funded since 2012 that include a pedestrian component include: Downtown Berkeley (includes improved access to BarT for pedestrians), Oakland’s lakeside Complete Streets and road Diet (includes 1.3 miles of new and improved pedestrian pathways), Fremont City Center Multi-Modal improvements (includes pedestrian connection to BarT and nearby employment and housing), San Pablo Bicycle and Pedestrian improvements in San Pablo and richmond (includes improvements to address pedestrian safety), San Francisco’s Masonic avenue Complete Streets (pedestrian enhancements), and the Capitol Expressway Traffic and ITS Project (includes signal timing adaptive to pedestrians).
MTC’s Climate Grants Program funded the following projects with pedestrian components: regional Safe routes to School, Green Ways to School, and the Safe routes to School (SrTS) education and encouragement School route Maps.
This measure has continued forward in 2017 control strategy as Tr9: Bicycle and Pedestrian access and Facilities.
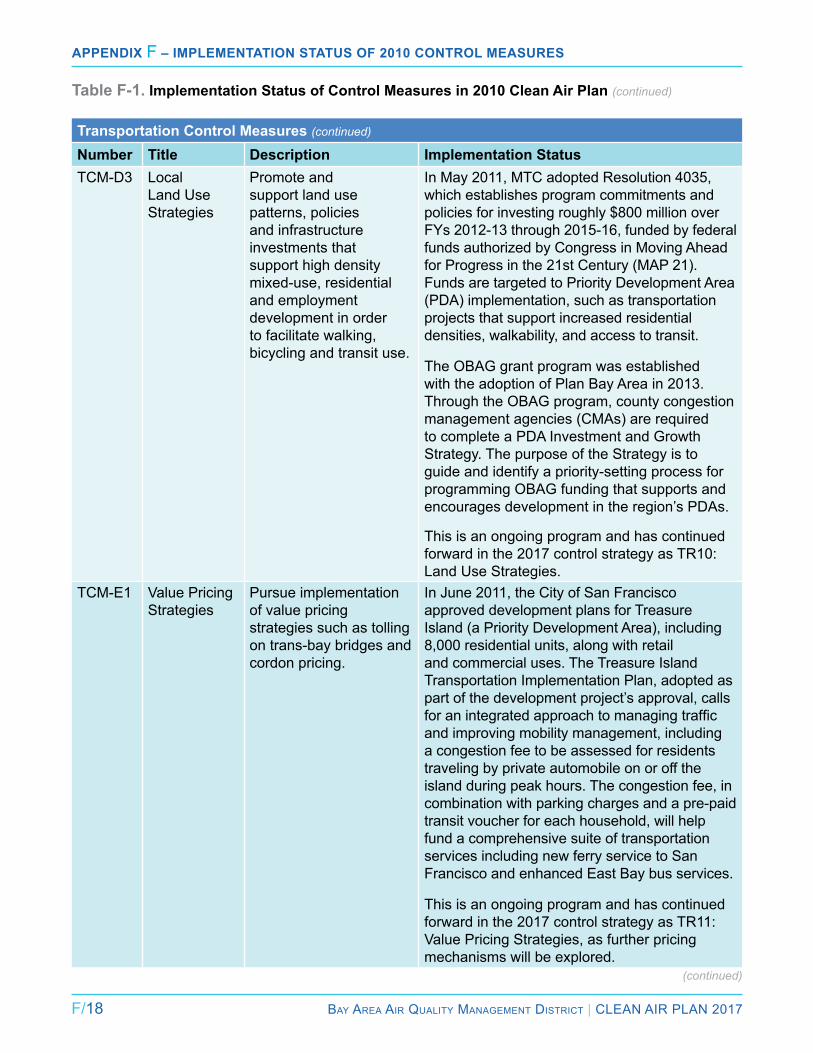
F/18 Bay area air Quality ManageMent District | Clean air Plan 2017
Appendix F – implementAtion StAtuS of 2010 Control meASureS
Table F-1. Implementation Status of Control Measures in 2010 Clean Air Plan (continued)
(continued)
Transportation Control Measures (continued)
Number Title Description Implementation StatusTCM-D3 local
land Use Strategies
Promote and support land use patterns, policies and infrastructure investments that support high density mixed-use, residential and employment development in order to facilitate walking, bicycling and transit use.
in May 2011, MTC adopted resolution 4035, which establishes program commitments and policies for investing roughly $800 million over FYs 2012-13 through 2015-16, funded by federal funds authorized by Congress in Moving ahead for Progress in the 21st Century (MaP 21). Funds are targeted to Priority Development area (PDa) implementation, such as transportation projects that support increased residential densities, walkability, and access to transit.
The OBaG grant program was established with the adoption of Plan Bay area in 2013. Through the OBaG program, county congestion management agencies (CMas) are required to complete a PDa investment and Growth Strategy. The purpose of the Strategy is to guide and identify a priority-setting process for programming OBaG funding that supports and encourages development in the region’s PDas.
This is an ongoing program and has continued forward in the 2017 control strategy as Tr10: land Use Strategies.
TCM-e1 Value Pricing Strategies
Pursue implementation of value pricing strategies such as tolling on trans-bay bridges and cordon pricing.
in June 2011, the City of San Francisco approved development plans for Treasure island (a Priority Development area), including 8,000 residential units, along with retail and commercial uses. The Treasure island Transportation implementation Plan, adopted as part of the development project’s approval, calls for an integrated approach to managing traffic and improving mobility management, including a congestion fee to be assessed for residents traveling by private automobile on or off the island during peak hours. The congestion fee, in combination with parking charges and a pre-paid transit voucher for each household, will help fund a comprehensive suite of transportation services including new ferry service to San Francisco and enhanced east Bay bus services.
This is an ongoing program and has continued forward in the 2017 control strategy as Tr11: Value Pricing Strategies, as further pricing mechanisms will be explored.
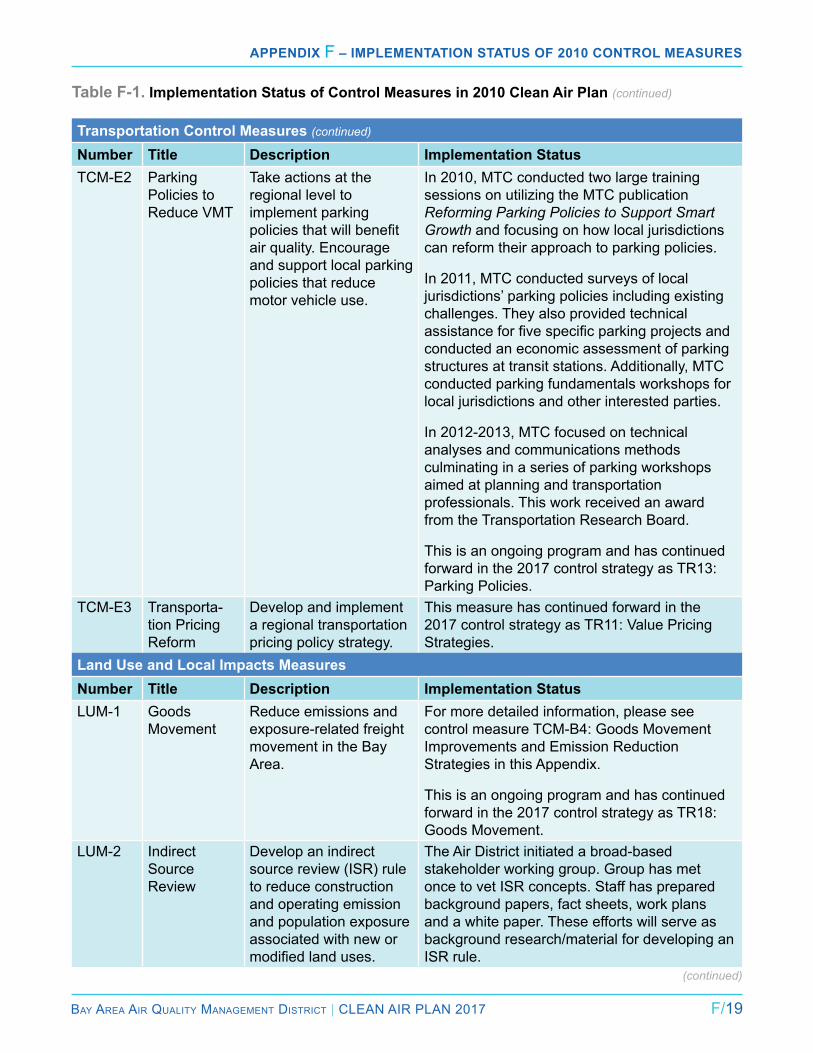
Bay area air Quality ManageMent District | Clean air Plan 2017 F/19
Appendix F – implementAtion StAtuS of 2010 Control meASureS
Table F-1. Implementation Status of Control Measures in 2010 Clean Air Plan (continued)
(continued)
Transportation Control Measures (continued)
Number Title Description Implementation StatusTCM-e2 Parking
Policies to reduce VMT
Take actions at the regional level to implement parking policies that will benefit air quality. encourage and support local parking policies that reduce motor vehicle use.
in 2010, MTC conducted two large training sessions on utilizing the MTC publication Reforming Parking Policies to Support Smart Growth and focusing on how local jurisdictions can reform their approach to parking policies.
in 2011, MTC conducted surveys of local jurisdictions’ parking policies including existing challenges. They also provided technical assistance for five specific parking projects and conducted an economic assessment of parking structures at transit stations. additionally, MTC conducted parking fundamentals workshops for local jurisdictions and other interested parties.
in 2012-2013, MTC focused on technical analyses and communications methods culminating in a series of parking workshops aimed at planning and transportation professionals. This work received an award from the Transportation research Board.
This is an ongoing program and has continued forward in the 2017 control strategy as Tr13: Parking Policies.
TCM-e3 Transporta-tion Pricing reform
Develop and implement a regional transportation pricing policy strategy.
This measure has continued forward in the 2017 control strategy as Tr11: Value Pricing Strategies.
Land Use and Local Impacts MeasuresNumber Title Description Implementation StatuslUM-1 Goods
Movementreduce emissions and exposure-related freight movement in the Bay area.
For more detailed information, please see control measure TCM-B4: Goods Movement improvements and emission reduction Strategies in this appendix.
This is an ongoing program and has continued forward in the 2017 control strategy as Tr18: Goods Movement.
lUM-2 indirect Source review
Develop an indirect source review (iSr) rule to reduce construction and operating emission and population exposure associated with new or modified land uses.
The air District initiated a broad-based stakeholder working group. Group has met once to vet iSr concepts. Staff has prepared background papers, fact sheets, work plans and a white paper. These efforts will serve as background research/material for developing an iSr rule.

F/20 Bay area air Quality ManageMent District | Clean air Plan 2017
Appendix F – implementAtion StAtuS of 2010 Control meASureS
Table F-1. Implementation Status of Control Measures in 2010 Clean Air Plan (continued)
(continued)
Land Use and Local Impacts Measures (continued)
Number Title Description Implementation StatuslUM-2(continued)
This control measure has been carried forward in the 2017 control strategy as Tr16: indirect Source review.
lUM-3 Updated CeQa Guidelines and enhanced CeQa review
Strengthen existing CeQa program by increasing the number of CeQa documents staff reviews and by quantifying estimated reductions in emissions of criteria pollutants, air toxics, and GHGs from the CeQa program.
air District staff regularly assists local governments in the toxics analysis of their land use plans, especially Station area Plans. Staff also assists local governments in accessing pollution data for sources via the air District’s permit database and roadway data. air District staff continues to write comment letters on CeQa documents. Comments pertain to the use of CEQA thresholds, as identified and adopted by the lead agency, and adequacy of air quality analysis on local land use plans and development projects.
This is an ongoing program and has continued forward in the 2017 control strategy, as Tr10: land Use Strategies.
lUM-4 land Use Guidance
assist local governments in the inclusion of smart growth principles and climate protection elements in their general plans.
air District staff worked closely with MTC Station area Planning grantees to identify any sources of toxic air contaminants in their local planning areas.
in 2012 and 2013, air District staff worked with MTC on the air quality analysis for the Plan Bay area draft eir.
air District staff assists local governments in the development of their local Climate action Plans and in the review of those plans for CeQa purposes.
air District staff developed the Planning Healthy Places guidance document and maps to help local governments identify areas estimated to have elevated levels of fine particulates and/or toxic air contaminants.
This is an ongoing program and has continued forward in the 2017 control strategy as Tr10: land Use Strategies .
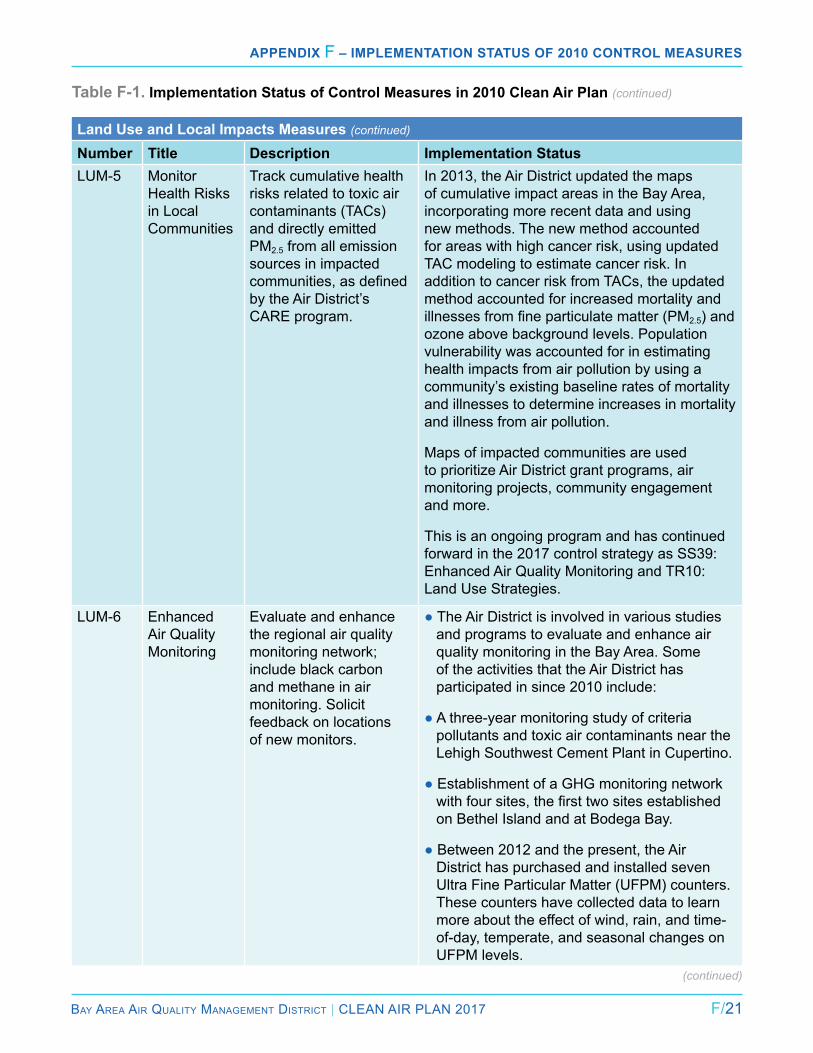
Bay area air Quality ManageMent District | Clean air Plan 2017 F/21
Appendix F – implementAtion StAtuS of 2010 Control meASureS
Table F-1. Implementation Status of Control Measures in 2010 Clean Air Plan (continued)
(continued)
Land Use and Local Impacts Measures (continued)
Number Title Description Implementation StatuslUM-5 Monitor
Health risks in local Communities
Track cumulative health risks related to toxic air contaminants (TaCs) and directly emitted PM2.5 from all emission sources in impacted communities, as defined by the air District’s Care program.
in 2013, the air District updated the maps of cumulative impact areas in the Bay area, incorporating more recent data and using new methods. The new method accounted for areas with high cancer risk, using updated TaC modeling to estimate cancer risk. in addition to cancer risk from TaCs, the updated method accounted for increased mortality and illnesses from fine particulate matter (PM2.5) and ozone above background levels. Population vulnerability was accounted for in estimating health impacts from air pollution by using a community’s existing baseline rates of mortality and illnesses to determine increases in mortality and illness from air pollution.
Maps of impacted communities are used to prioritize air District grant programs, air monitoring projects, community engagement and more.
This is an ongoing program and has continued forward in the 2017 control strategy as SS39: enhanced air Quality Monitoring and Tr10: land Use Strategies.
lUM-6 enhanced air Quality Monitoring
evaluate and enhance the regional air quality monitoring network; include black carbon and methane in air monitoring. Solicit feedback on locations of new monitors.
● The air District is involved in various studies and programs to evaluate and enhance air quality monitoring in the Bay area. Some of the activities that the air District has participated in since 2010 include:
● a three-year monitoring study of criteria pollutants and toxic air contaminants near the lehigh Southwest Cement Plant in Cupertino.
● establishment of a GHG monitoring network with four sites, the first two sites established on Bethel island and at Bodega Bay.
● Between 2012 and the present, the air District has purchased and installed seven Ultra Fine Particular Matter (UFPM) counters. These counters have collected data to learn more about the effect of wind, rain, and time-of-day, temperate, and seasonal changes on UFPM levels.
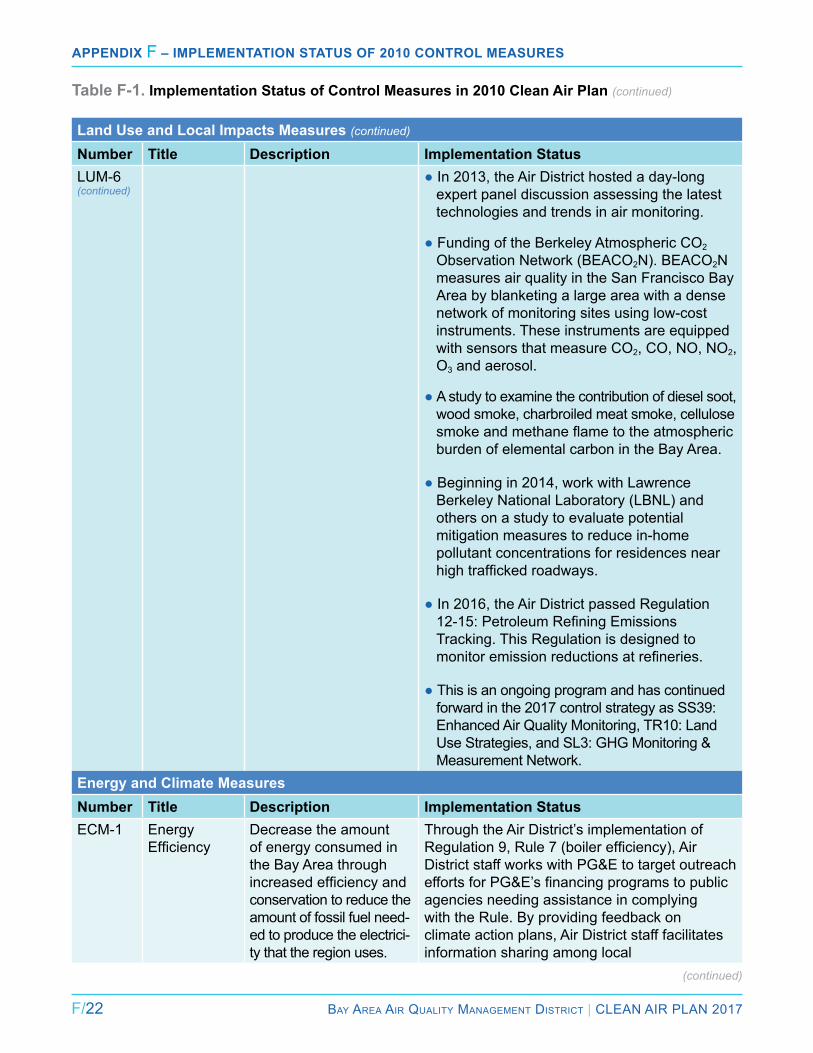
F/22 Bay area air Quality ManageMent District | Clean air Plan 2017
Appendix F – implementAtion StAtuS of 2010 Control meASureS
Table F-1. Implementation Status of Control Measures in 2010 Clean Air Plan (continued)
(continued)
Land Use and Local Impacts Measures (continued)
Number Title Description Implementation StatuslUM-6(continued)
● in 2013, the air District hosted a day-long expert panel discussion assessing the latest technologies and trends in air monitoring.
● Funding of the Berkeley atmospheric CO2 Observation network (BeaCO2n). BeaCO2n measures air quality in the San Francisco Bay area by blanketing a large area with a dense network of monitoring sites using low-cost instruments. These instruments are equipped with sensors that measure CO2, CO, nO, nO2, O3 and aerosol.
● a study to examine the contribution of diesel soot, wood smoke, charbroiled meat smoke, cellulose smoke and methane flame to the atmospheric burden of elemental carbon in the Bay area.
● Beginning in 2014, work with lawrence Berkeley national laboratory (lBnl) and others on a study to evaluate potential mitigation measures to reduce in-home pollutant concentrations for residences near high trafficked roadways.
● in 2016, the air District passed regulation 12-15: Petroleum Refining Emissions Tracking. This regulation is designed to monitor emission reductions at refineries.
● This is an ongoing program and has continued forward in the 2017 control strategy as SS39: enhanced air Quality Monitoring, Tr10: land Use Strategies, and Sl3: GHG Monitoring & Measurement network.
Energy and Climate MeasuresNumber Title Description Implementation StatuseCM-1 energy
EfficiencyDecrease the amount of energy consumed in the Bay area through increased efficiency and conservation to reduce the amount of fossil fuel need-ed to produce the electrici-ty that the region uses.
Through the air District’s implementation of Regulation 9, Rule 7 (boiler efficiency), Air District staff works with PG&e to target outreach efforts for PG&E’s financing programs to public agencies needing assistance in complying with the rule. By providing feedback on climate action plans, air District staff facilitates information sharing among local
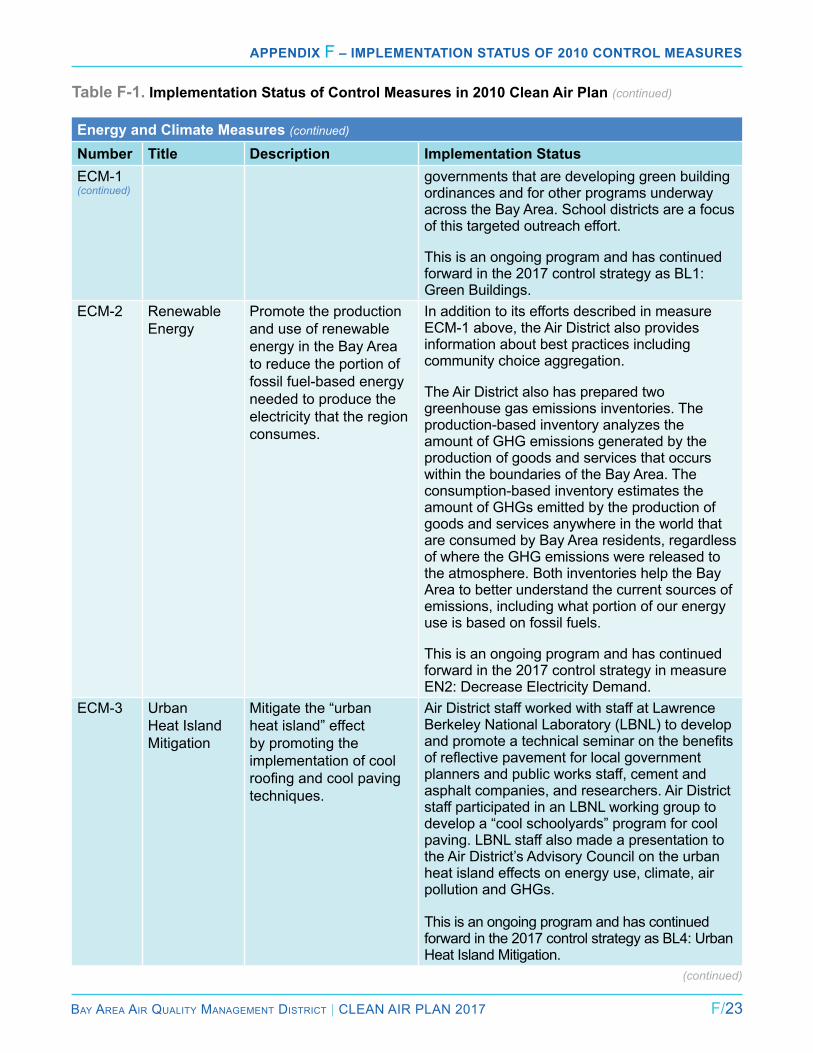
Bay area air Quality ManageMent District | Clean air Plan 2017 F/23
Appendix F – implementAtion StAtuS of 2010 Control meASureS
Table F-1. Implementation Status of Control Measures in 2010 Clean Air Plan (continued)
(continued)
Energy and Climate Measures (continued)
Number Title Description Implementation StatuseCM-1(continued)
governments that are developing green building ordinances and for other programs underway across the Bay area. School districts are a focus of this targeted outreach effort.
This is an ongoing program and has continued forward in the 2017 control strategy as Bl1: Green Buildings.
eCM-2 renewable energy
Promote the production and use of renewable energy in the Bay area to reduce the portion of fossil fuel-based energy needed to produce the electricity that the region consumes.
in addition to its efforts described in measure eCM-1 above, the air District also provides information about best practices including community choice aggregation.
The air District also has prepared two greenhouse gas emissions inventories. The production-based inventory analyzes the amount of GHG emissions generated by the production of goods and services that occurs within the boundaries of the Bay area. The consumption-based inventory estimates the amount of GHGs emitted by the production of goods and services anywhere in the world that are consumed by Bay area residents, regardless of where the GHG emissions were released to the atmosphere. Both inventories help the Bay area to better understand the current sources of emissions, including what portion of our energy use is based on fossil fuels.
This is an ongoing program and has continued forward in the 2017 control strategy in measure en2: Decrease electricity Demand.
eCM-3 Urban Heat island Mitigation
Mitigate the “urban heat island” effect by promoting the implementation of cool roofing and cool paving techniques.
air District staff worked with staff at lawrence Berkeley national laboratory (lBnl) to develop and promote a technical seminar on the benefits of reflective pavement for local government planners and public works staff, cement and asphalt companies, and researchers. air District staff participated in an lBnl working group to develop a “cool schoolyards” program for cool paving. lBnl staff also made a presentation to the air District’s advisory Council on the urban heat island effects on energy use, climate, air pollution and GHGs.
This is an ongoing program and has continued forward in the 2017 control strategy as Bl4: Urban Heat island Mitigation.
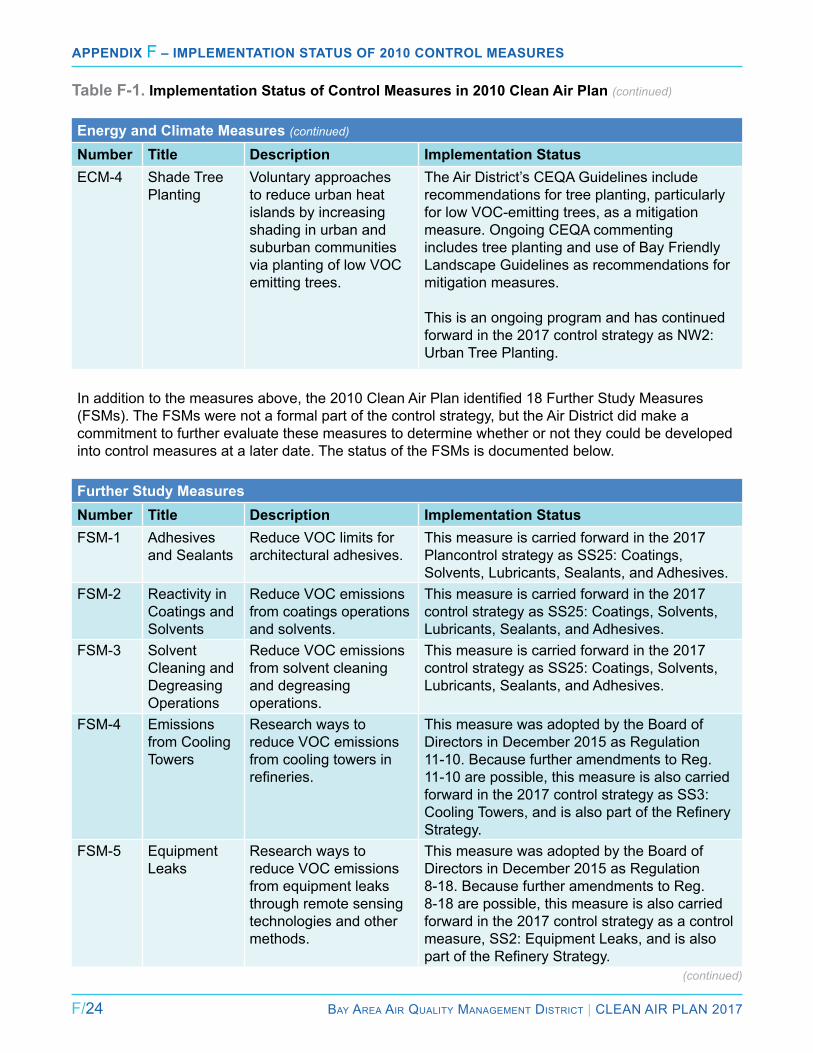
F/24 Bay area air Quality ManageMent District | Clean air Plan 2017
Appendix F – implementAtion StAtuS of 2010 Control meASureS
Table F-1. Implementation Status of Control Measures in 2010 Clean Air Plan (continued)
(continued)
Energy and Climate Measures (continued)
Number Title Description Implementation StatuseCM-4 Shade Tree
PlantingVoluntary approaches to reduce urban heat islands by increasing shading in urban and suburban communities via planting of low VOC emitting trees.
The air District’s CeQa Guidelines include recommendations for tree planting, particularly for low VOC-emitting trees, as a mitigation measure. Ongoing CeQa commenting includes tree planting and use of Bay Friendly landscape Guidelines as recommendations for mitigation measures.
This is an ongoing program and has continued forward in the 2017 control strategy as nW2: Urban Tree Planting.
In addition to the measures above, the 2010 Clean Air Plan identified 18 Further Study Measures (FSMs). The FSMs were not a formal part of the control strategy, but the air District did make a commitment to further evaluate these measures to determine whether or not they could be developed into control measures at a later date. The status of the FSMs is documented below.
Further Study MeasuresNumber Title Description Implementation StatusFSM-1 adhesives
and Sealants reduce VOC limits for architectural adhesives.
This measure is carried forward in the 2017 Plancontrol strategy as SS25: Coatings, Solvents, lubricants, Sealants, and adhesives.
FSM-2 reactivity in Coatings and Solvents
reduce VOC emissions from coatings operations and solvents.
This measure is carried forward in the 2017 control strategy as SS25: Coatings, Solvents, lubricants, Sealants, and adhesives.
FSM-3 Solvent Cleaning and Degreasing Operations
reduce VOC emissions from solvent cleaning and degreasing operations.
This measure is carried forward in the 2017 control strategy as SS25: Coatings, Solvents, lubricants, Sealants, and adhesives.
FSM-4 emissions from Cooling Towers
research ways to reduce VOC emissions from cooling towers in refineries.
This measure was adopted by the Board of Directors in December 2015 as regulation 11-10. Because further amendments to reg. 11-10 are possible, this measure is also carried forward in the 2017 control strategy as SS3: Cooling Towers, and is also part of the Refinery Strategy.
FSM-5 equipment leaks
research ways to reduce VOC emissions from equipment leaks through remote sensing technologies and other methods.
This measure was adopted by the Board of Directors in December 2015 as regulation 8-18. Because further amendments to reg. 8-18 are possible, this measure is also carried forward in the 2017 control strategy as a control measure, SS2: equipment leaks, and is also part of the Refinery Strategy.

Bay area air Quality ManageMent District | Clean air Plan 2017 F/25
Appendix F – implementAtion StAtuS of 2010 Control meASureS
Table F-1. Implementation Status of Control Measures in 2010 Clean Air Plan (continued)
(continued)
Further Study Measures (continued)
Number Title Description Implementation StatusFSM-6 Wastewater
from Coke Cutting
review coke cutting operations to determine if emissions reductions can be achieved from the resulting wastewater.
The air District has determined that coke cutting operations are already operating to minimize emissions to the extent technically feasible. This measure has not been carried forward to the 2017 control strategy.
FSM-7 SO2 from Refinery Processes
Review refinery processes to identify opportunities to reduce SO2 emissions.
This measure is carried forward in the 2017 control strategy; measure is now a control measure, SS5: Sulfur recovery Units.
FSM-8 reduce emissions from lPG, Propane, Butane, and other Pressurized Gases
reduce emissions from lPG, propane, butane and other pressurized gases by requiring tanks and relief values to be gas tight, prohibiting venting during tank filling, and establishing a leakage allowance for hoses.
This measure is carried forward in the 2017 Plancontrol strategy; measure is now a control measure, SS28: lPG, Propane, Butane.
FSM-9 Greenhouse Gas Mitigation in BaCT and BaCT Deter-minations
Consider flexibility in BaCT/TBaCT determinations in order to reduce secondary greenhouse gas emissions from abatement devices.
This measure is carried forward in the 2017 control strategy as SS17: GHG BaCT Threshold.
FSM-10 Further reductions from Commercial Cooking equipment
reduce emissions from commercial cooking, and solid fueled cooking devices such as wood-fired pizza ovens.
This measure is carried forward in the 2017 control strategy as SS33: Commercial Cooking equipment.
FSM-11 Magnet Source rule
reduce mobile source emissions from new and existing facilities that attract or generate a high volume of activity, including airports, regional shopping malls and distribution centers.
This measure is carried forward in the 2017 control strategy. it has been combined with Tr16: indirect Source review.
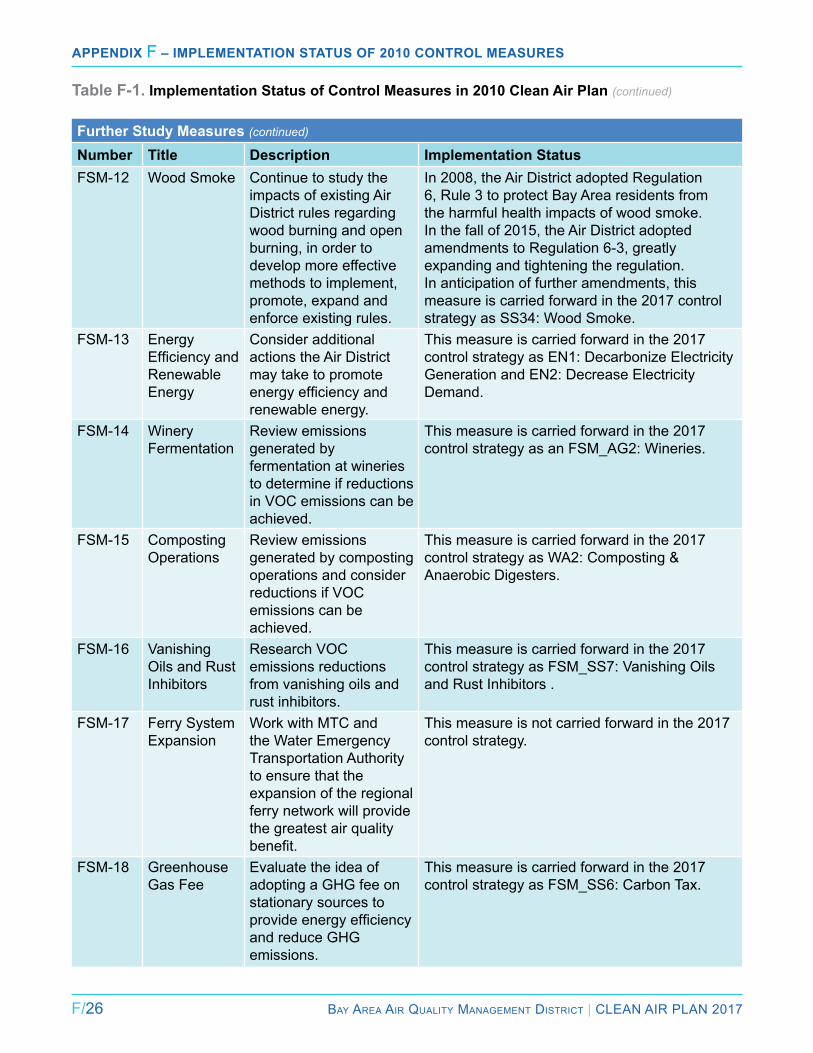
F/26 Bay area air Quality ManageMent District | Clean air Plan 2017
Appendix F – implementAtion StAtuS of 2010 Control meASureS
Further Study Measures (continued)
Number Title Description Implementation StatusFSM-12 Wood Smoke Continue to study the
impacts of existing air District rules regarding wood burning and open burning, in order to develop more effective methods to implement, promote, expand and enforce existing rules.
in 2008, the air District adopted regulation 6, rule 3 to protect Bay area residents from the harmful health impacts of wood smoke. in the fall of 2015, the air District adopted amendments to regulation 6-3, greatly expanding and tightening the regulation. in anticipation of further amendments, this measure is carried forward in the 2017 control strategy as SS34: Wood Smoke.
FSM-13 energy Efficiency and renewable energy
Consider additional actions the air District may take to promote energy efficiency and renewable energy.
This measure is carried forward in the 2017 control strategy as en1: Decarbonize electricity Generation and en2: Decrease electricity Demand.
FSM-14 Winery Fermentation
review emissions generated by fermentation at wineries to determine if reductions in VOC emissions can be achieved.
This measure is carried forward in the 2017 control strategy as an FSM_aG2: Wineries.
FSM-15 Composting Operations
review emissions generated by composting operations and consider reductions if VOC emissions can be achieved.
This measure is carried forward in the 2017 control strategy as Wa2: Composting & anaerobic Digesters.
FSM-16 Vanishing Oils and rust inhibitors
research VOC emissions reductions from vanishing oils and rust inhibitors.
This measure is carried forward in the 2017 control strategy as FSM_SS7: Vanishing Oils and rust inhibitors .
FSM-17 Ferry System expansion
Work with MTC and the Water emergency Transportation authority to ensure that the expansion of the regional ferry network will provide the greatest air quality benefit.
This measure is not carried forward in the 2017 control strategy.
FSM-18 Greenhouse Gas Fee
evaluate the idea of adopting a GHG fee on stationary sources to provide energy efficiency and reduce GHG emissions.
This measure is carried forward in the 2017 control strategy as FSM_SS6: Carbon Tax.
Table F-1. Implementation Status of Control Measures in 2010 Clean Air Plan (continued)
Bay area air Quality ManageMent District | Clean air Plan 2017 G/1
Evaluation of Control MEasurEs
appEndix G
This appendix summarizes the review of po-tential control measures for the Bay area 2017 Plan performed by air District staff.
Background
Pursuant to California Health & Safety Code Sec-tion 40914, the 2017 Plan is required to include all feasible control measures to reduce region-wide emissions for each nonattainment pollutant (e.g., ozone precursors). To identify feasible measures for the 2017 Plan, air District staff reviewed and evaluated 366 potential control measures com-piled from a variety of sources.1 air District staff sought ideas for new control measures, as well as ways to strengthen existing rules and programs. Sources of potential measures included ideas submitted by the public and air District staff, other California air district control measures contained in recently-adopted air quality plans, and air quality plans from metropolitan areas outside of Califor-nia. in addition, staff reviewed measures that had previously been considered and rejected during preparation of the 2010 Clean air Plan to see if any elements of those measures may be appropri-ate for the 2017 Plan. Some of the 366 measures reviewed were repeated by multiple sources and include the following:
● 216 measures from recently-adopted air quality attainment plans or other plans
● 64 measures from the 2010 Clean air Plan
● 118 measures suggested by the public
● 17 measures suggested by air District staff
Staff reviewed stationary source, area source, mo-bile source, and transportation control measures and climate strategies from the following plans:
California Air Quality Attainment and Other Plans
● Proposed Short-lived Climate Pollutant reduction Strategy, april 2016, air resources Board
● 2016 State Strategy for the State implementation Plan for Federal Ozone and PM2.5 Standards, air resources Board
● South Coast 2007 air Quality Management Plan, South Coast air Quality Management District
● South Coast 2012 air Quality Management Plan, South Coast air Quality Management District
● South Coast air Toxics Control Plan for the next Ten Years, South Coast air Quality Management District
● Draft Vision for Clean air: a Framework for air Quality and Climate Planning, 2012, South Coast air Quality Management District
G/2 Bay area air Quality ManageMent District | Clean air Plan 2017
Appendix G – evAluAtion of Control MeAsures
● 2009 Triennial report and Plan revision, Sacramento air Quality Management District
● Sacramento regional 8-Hour Ozone attainment and reasonable Further Progress Plan, Sacramento Metropolitan air Quality Management District
● 2010 PM10 implementation/Maintenance Plan and redesignation request, Sacramento Metropolitan air Quality Management District
● San Joaquin Valley 2016 Ozone Plan for 2008 8-hour Ozone Standard, June 2016
● San Joaquin Valley 2007 Ozone Plan, San Joaquin Valley Unified Air Pollution Control District
● San Joaquin Valley 2012 PM2.5 Plan, San Joaquin Valley Unified Air Pollution Control District
● San Joaquin Valley 2008 PM2.5 Plan, San Joaquin Valley Unified Air Pollution Control District
● San Joaquin Valley 2013 Plan for the revoked 1-Hour Ozone Standard
● 2007 air Quality Management Plan, Ventura air Pollution Control District
● 2009 8-Hour Ozone Modified Air Quality Management Plan, imperial County
● 2009 State implementation Plan for Particulate Matter, imperial County
● 2009 regional air Quality Strategy revision, San Diego County
● Santa Barbara 2007 Clean air Plan: Santa Barbara County’s Plan to Maintain the Federal 8-Hour Ozone Standard and attain the State 1-Hour Ozone Standard, Santa Barbara County air Pollution Control District
● Santa Barbara Clean air Plan: 2004 Triennial State Ozone, Santa Barbara County air Pollution Control District
● Climate action Plan, 2009, City of Berkeley
● energy and Climate action Plan, 2012, City of Oakland
● Climate action Plan, 2012, City of Pleasanton
● Climate action Plan, 2012, City of Santa rosa
● Final Staff report: SB656 assessment and Control Measure evaluation, 2005, Sacramento air Quality Management District
● northern Sacramento Valley Planning area: 2009 Triennial air Quality attainment Plan, Butte County air Quality Management District
● 2012 Triennial Progress report, Placer County air Pollution Control District
● 2004 Update to the Triennial report, Monterey Bay Unified Air Pollution Control District
● 2005 report on attainment of the California Particulate Matter Standards, Monterey Bay Unified Air Pollution Control District
● 2008 air Quality Management Plan, Monterey Bay Unified Air Pollution Control District
● redesignation request and Maintenance Plan for the 1997 annual and 2006 24-Hour PM2.5 naaQS, 2013, San Diego County air Pollution Control District
● Ventura County 2004 Triennial (air Quality Management Plan revision), 2004, Ventura County air Pollution Control District
● Final 2016 Owens Valley Planning area PM10 State implementation Plan
Out-of-State Air Quality Attainment and Other Plans
● Baltimore Serious attainment area 0.08 ppm 8-Hour Ozone State implementation Plan, 2013, Maryland Department of the environment
Bay area air Quality ManageMent District | Clean air Plan 2017 G/3
Appendix G – evAluAtion of Control MeAsures
● 8-Hour Ozone State implementation Plan, 2013, Cecil County Maryland
● Chicago Climate action Plan, 2010, City of Chicago
● Climate action Plan, 2009, City of albuquerque
● Carbon Footprint report, 2009, City of new Orleans
● 2012 Five Percent Plan for PM10, State of arizona, Pinal County Township
● austin Climate Protection Plan and action items, 2008, Texas Commission on the environment
● revision to Connecticut’s State implementation Plan, 2008, Connecticut Department of energy and the environment
● Crittenden County State implementation Plan, 2006, allegheny County Health Department
● Dallas-Fort Worth attainment Demonstration SiP revision, 2011, Texas Commission on the environment
● Delaware State implementation Plan for attainment of the 8-Hour Ozone naaQS, 2007, Wilmington area Planning Council
● Denver Metro area & north Front range Ozone Plan, 2008, Colorado air Quality Council
● Dona ana County, new Mexico natural events action Plan reevaluation, 2005, State of new Mexico
● emissions reduction Plan, 2008, City of Houston
● Final Massachusetts State implementation Plan revision: 8-Hour Ozone attainment, 2008, Massachusetts Department of environmental Protection, energy and natural resources
● State implementation Plan for the Chattanooga PM2.5 nonattainment area, 2009, Georgia Department of natural resources
● State implementation Plan for the Chattanooga Ozone nonattainment area, 2012, Georgia Department of natural resources
● Proposed Georgia’s State implementation Plan for the atlanta 8-Hour Ozone nonattainment area, 2012, Georgia Department of natural resources
● interim roadmap to 2020: Keep Oregon Cool, 2010, Oregon Global Warming Commission
● Collin County attainment Demonstration SiP revision, 2012, Texas Commission on environmental Quality
● louisiana State implementation Plan, 2004, louisiana Department of environmental Quality
● Maryland’s Greenhouse Gas reduction Plan, 2013, Maryland Department of the environment
● Maryland’s re-Designation request & Maintenance Plan for Fine Particulate Matter (PM2.5), 2012, Maryland Department of the environment
● national Capital region Climate Change report, 2008, Metropolitan Washington air Quality Committee
● new Jersey State implementation Plan revision, 2007, new Jersey Department of environmental Protection
● new York State implementation Plan for Ozone, 2008, new Jersey Department of environmental Protection
● Ozone advance action Plan, 2013, Fredricksburg area Metropolitan Planning Organization
● Plan nYC: Climate Change Chapter, 2013, City of new York

G/4 Bay area air Quality ManageMent District | Clean air Plan 2017
Appendix G – evAluAtion of Control MeAsures
● Plan to improve air Quality in the Washington, DC-MD-Va region, 2008, Metropolitan Washington air Quality Committee
● 2009 Proposed revision to Michigan’s State implementation Plan for achieving the Ozone national ambient air Quality Standard, Michigan Department of environmental Quality
● redesignation request and Maintenance Plan for the 1997 annual and 2006 24-Hour PM2.5 naaQS: new York–northern new Jersey–long island, nY–nJ–CT nonattainment area, 2013, new York Department of environmental Conservation
● Sherveport-Bossier City Metropolitan Statistical area early action Compact air Quality improvement Plan, 2004, louisiana Department of environmental Quality
● State implementation Plan revision for the Thurston County, Washington Second 10-Year limited Maintenance Plan for PM10, 2013, State of Washington Department of ecology
● Texas 2010 HGB attainment Demonstration SiP revision for the 1997 8-Hour Ozone Standard, 2010, Texas Commission on environmental Quality
● Upper Green river Basin air Quality Citizens advisory Task Force recommendations to the Wyoming Department of environmental Quality, 2012, Wyoming Department of environmental Quality
Control Measure Framework and Evaluation Criteria
Potential control measures were reviewed and evaluated, as described below and summarized in Table G-1. Potential measures were initially screened to identify and eliminate measures that have been either implemented and completed by the air District, or implemented within the air District’s jurisdiction by the air resources Board, U.S. ePa or another agency.
remaining measures were evaluated according to the following criteria specified in California Health & Safety Code Section 40922:
● Cost-effectiveness● Technological feasibility● Total emission reduction potential● rate of reduction● Public acceptability● enforceability
in applying the California Health & Safety Code criteria, staff evaluated potential control measures based upon their potential to reduce emissions of multiple air pollutants, including particulate matter, toxic air contaminants and greenhouse gases, in addition to ozone precursors. Staff also looked for opportunities to reduce population exposure to air pollutants, especially in the “impacted communi-ties” identified in the Air District’s CARE program. For example, control measures SS20, which pro-poses to increase the stringency of the air District’s air Toxics Hotspot program, and SS21, which pro-poses to revise Health risk assessment Guide-lines for the air District’s new Source review pro-gram, will both help to reduce population exposure emissions to toxic air contaminants in impacted communities. SS39 proposes to enhance the air District’s air quality monitoring so as to better in-form its efforts to improve air quality and reduce population exposure in impacted communities.
in reviewing measures based on the evaluation criteria described above, some measures were eliminated for the reasons shown in Table G-1.
Measures that are recommended for inclusion in the 2017 Plan fall into two categories:
● Measures incorporated in one of nine control measure categories:
▪ Stationary Source ▪ Transportation ▪ energy ▪ agriculture ▪ Water ▪ Waste ▪ Buildings ▪ natural and Working lands ▪ Super-GHG Pollutants
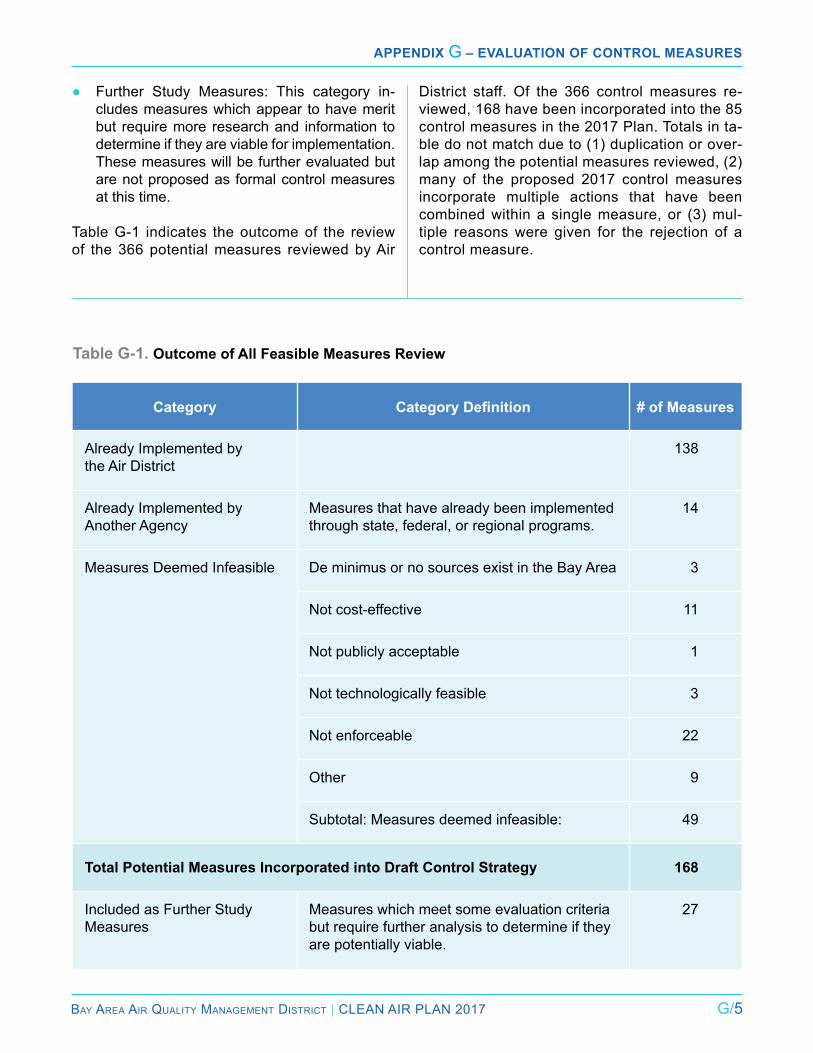
Bay area air Quality ManageMent District | Clean air Plan 2017 G/5
Appendix G – evAluAtion of Control MeAsures
Table G-1. Outcome of All Feasible Measures Review
Category Category Definition # of Measures
already implemented by the air District
138
already implemented by another agency
Measures that have already been implemented through state, federal, or regional programs.
14
Measures Deemed infeasible De minimus or no sources exist in the Bay area 3
not cost-effective 11
not publicly acceptable 1
not technologically feasible 3
not enforceable 22
Other 9
Subtotal: Measures deemed infeasible: 49
Total Potential Measures Incorporated into Draft Control Strategy 168
included as Further Study Measures
Measures which meet some evaluation criteria but require further analysis to determine if they are potentially viable.
27
● Further Study Measures: This category in-cludes measures which appear to have merit but require more research and information to determine if they are viable for implementation. These measures will be further evaluated but are not proposed as formal control measures at this time.
Table G-1 indicates the outcome of the review of the 366 potential measures reviewed by air
District staff. Of the 366 control measures re-viewed, 168 have been incorporated into the 85 control measures in the 2017 Plan. Totals in ta-ble do not match due to (1) duplication or over-lap among the potential measures reviewed, (2) many of the proposed 2017 control measures incorporate multiple actions that have been combined within a single measure, or (3) mul-tiple reasons were given for the rejection of a control measure.
G/6 Bay area air Quality ManageMent District | Clean air Plan 2017
Appendix G – evAluAtion of Control MeAsures
Footnotes
1 air District staff and staff of the Metropolitan Transportation Commission collaborated in evaluating transportation control measures for the 2017 Plan.
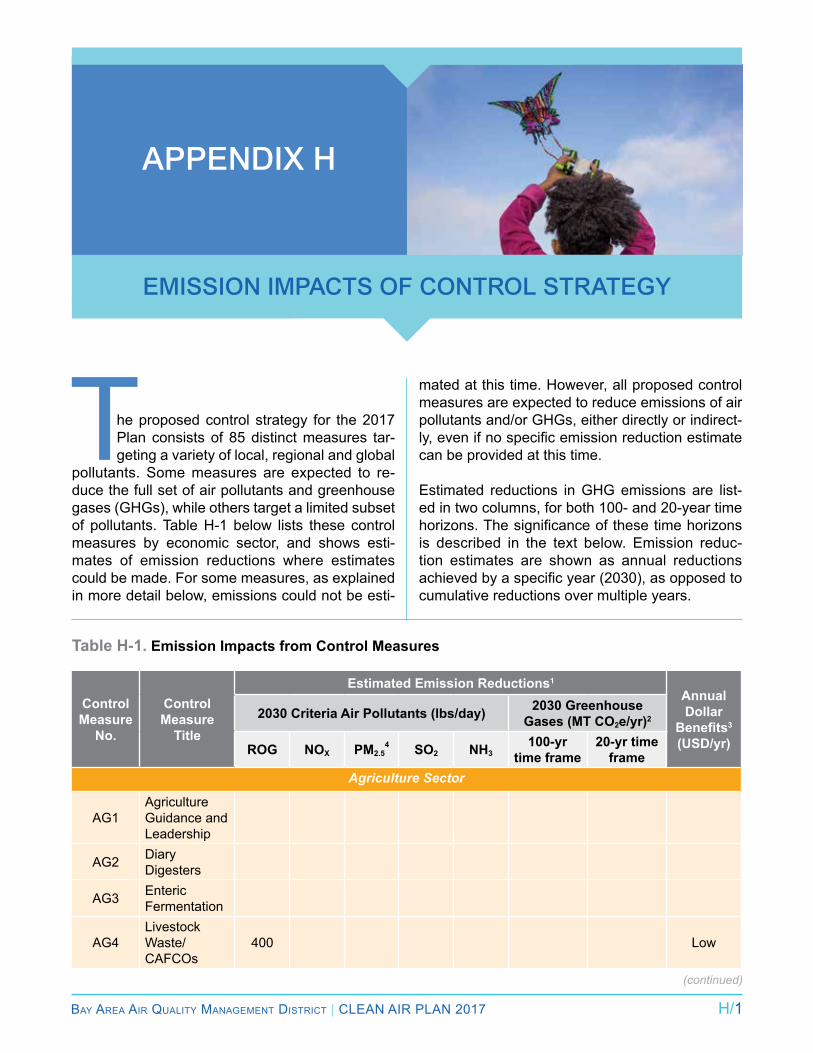
Bay area air Quality ManageMent District | Clean air Plan 2017 H/1
Emission impacts of control stratEgy
appEndix H
The proposed control strategy for the 2017 Plan consists of 85 distinct measures tar-geting a variety of local, regional and global
pollutants. Some measures are expected to re-duce the full set of air pollutants and greenhouse gases (GHGs), while others target a limited subset of pollutants. Table H-1 below lists these control measures by economic sector, and shows esti-mates of emission reductions where estimates could be made. For some measures, as explained in more detail below, emissions could not be esti-
Table H-1. Emission Impacts from Control Measures
mated at this time. However, all proposed control measures are expected to reduce emissions of air pollutants and/or GHGs, either directly or indirect-ly, even if no specific emission reduction estimate can be provided at this time.
estimated reductions in GHG emissions are list-ed in two columns, for both 100- and 20-year time horizons. The significance of these time horizons is described in the text below. emission reduc-tion estimates are shown as annual reductions achieved by a specific year (2030), as opposed to cumulative reductions over multiple years.
Control Measure
No.
Control Measure
Title
Estimated Emission Reductions1
Annual Dollar
Benefits3 (USD/yr)
2030 Criteria Air Pollutants (lbs/day) 2030 Greenhouse Gases (MT CO2e/yr)2
ROG NOX PM2.54 SO2 NH3
100-yr time frame
20-yr time frame
Agriculture Sector
aG1agriculture Guidance and leadership
aG2 Diary Digesters
AG3 enteric Fermentation
aG4livestock Waste/CaFCOs
400 low
(continued)
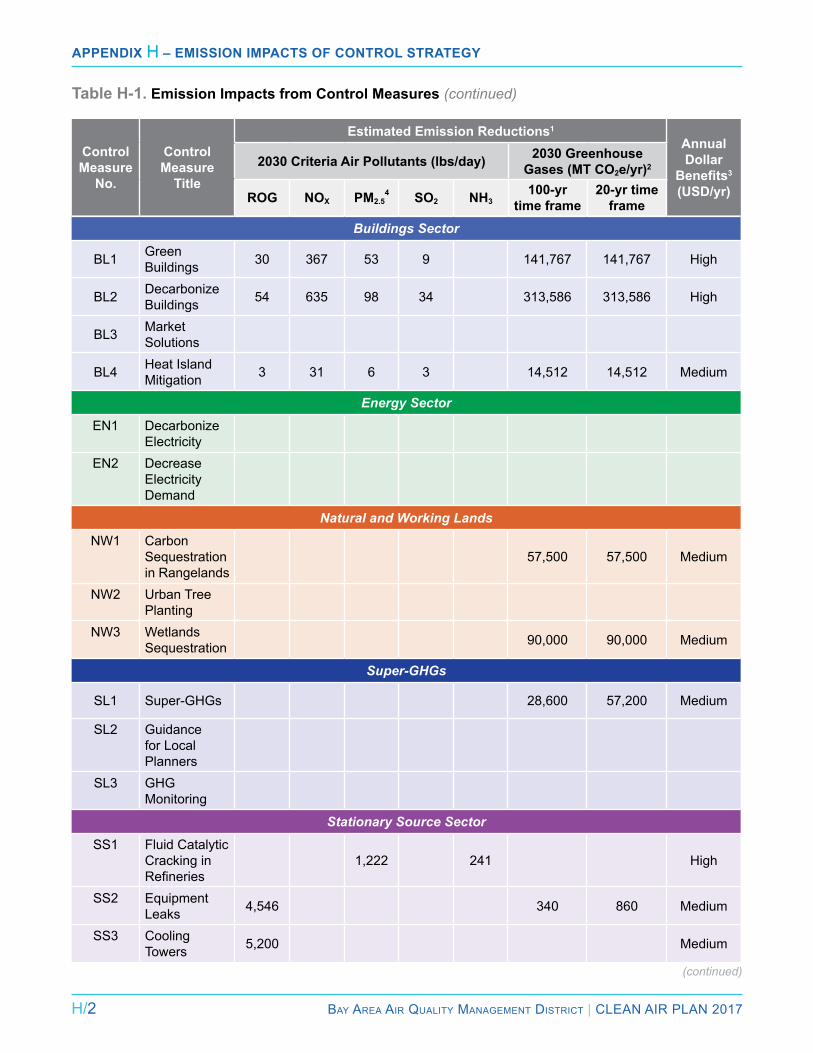
H/2 Bay area air Quality ManageMent District | Clean air Plan 2017
Appendix H – emission impActs of control strAtegy
Control Measure
No.
Control Measure
Title
Estimated Emission Reductions1
Annual Dollar
Benefits3 (USD/yr)
2030 Criteria Air Pollutants (lbs/day) 2030 Greenhouse Gases (MT CO2e/yr)2
ROG NOX PM2.54 SO2 NH3
100-yr time frame
20-yr time frame
Buildings Sector
Bl1 Green Buildings 30 367 53 9 141,767 141,767 High
Bl2 Decarbonize Buildings 54 635 98 34 313,586 313,586 High
BL3 Market Solutions
Bl4 Heat island Mitigation 3 31 6 3 14,512 14,512 Medium
Energy Sectoren1 Decarbonize
electricity
en2 Decrease electricity Demand
Natural and Working LandsnW1 Carbon
Sequestration in rangelands
57,500 57,500 Medium
nW2 Urban Tree Planting
NW3 Wetlands Sequestration 90,000 90,000 Medium
Super-GHGs
Sl1 Super-GHGs 28,600 57,200 Medium
Sl2 Guidance for local Planners
SL3 GHG Monitoring
Stationary Source SectorSS1 Fluid Catalytic
Cracking in Refineries
1,222 241 High
SS2 equipment leaks 4,546 340 860 Medium
SS3 Cooling Towers 5,200 Medium
Table H-1. Emission Impacts from Control Measures (continued)
(continued)
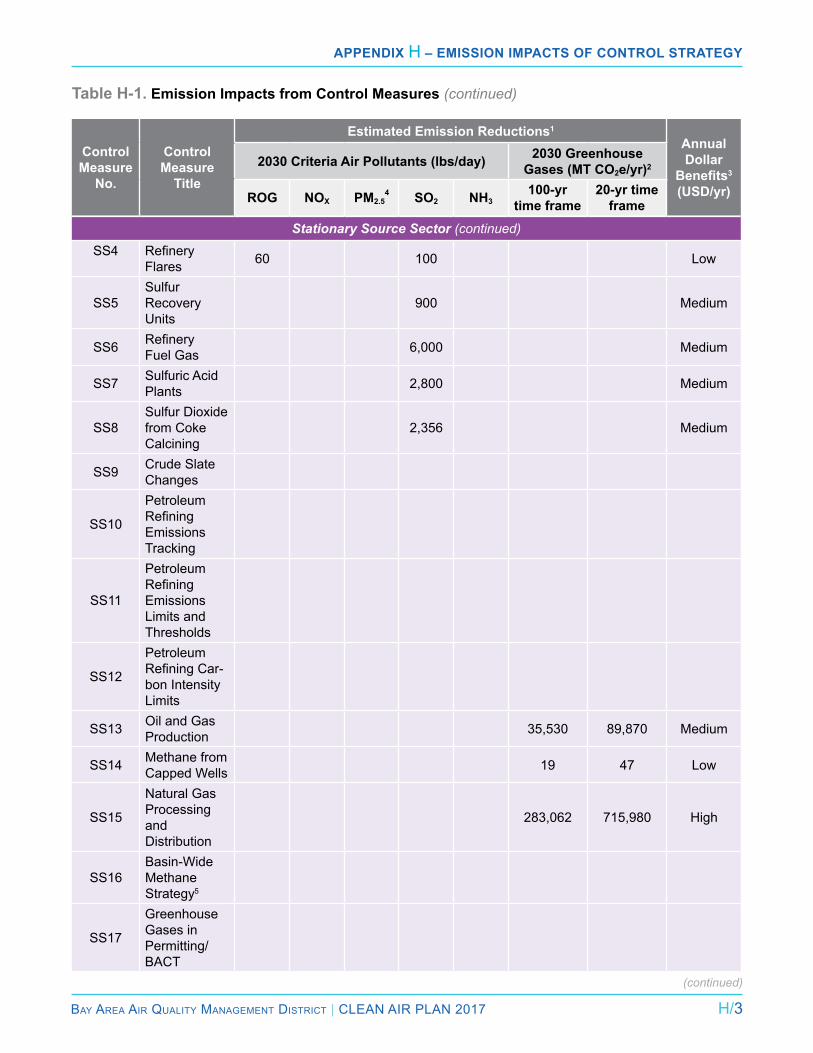
Bay area air Quality ManageMent District | Clean air Plan 2017 H/3
Appendix H – emission impActs of control strAtegy
Control Measure
No.
Control Measure
Title
Estimated Emission Reductions1
Annual Dollar
Benefits3 (USD/yr)
2030 Criteria Air Pollutants (lbs/day) 2030 Greenhouse Gases (MT CO2e/yr)2
ROG NOX PM2.54 SO2 NH3
100-yr time frame
20-yr time frame
Stationary Source Sector (continued)
SS4 Refinery Flares 60 100 low
SS5Sulfur recovery Units
900 Medium
SS6 Refinery Fuel Gas 6,000 Medium
SS7 Sulfuric acid Plants 2,800 Medium
SS8Sulfur Dioxide from Coke Calcining
2,356 Medium
SS9 Crude Slate Changes
SS10
Petroleum Refining emissions Tracking
SS11
Petroleum Refining emissions limits and Thresholds
SS12
Petroleum Refining Car-bon intensity limits
SS13 Oil and Gas Production 35,530 89,870 Medium
SS14 Methane from Capped Wells 19 47 low
SS15
natural Gas Processing and Distribution
283,062 715,980 High
SS16Basin-Wide Methane Strategy5
SS17
Greenhouse Gases in Permitting/BaCT
Table H-1. Emission Impacts from Control Measures (continued)
(continued)
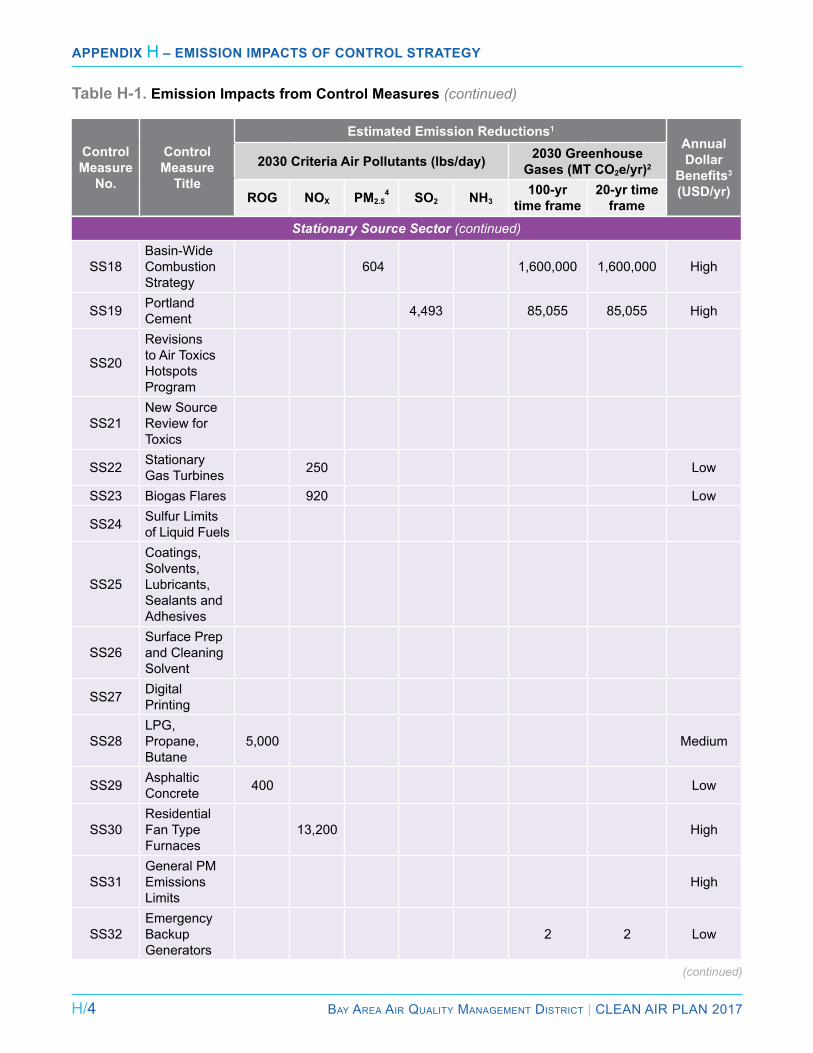
H/4 Bay area air Quality ManageMent District | Clean air Plan 2017
Appendix H – emission impActs of control strAtegy
Stationary Source Sector (continued)
SS18Basin-Wide Combustion Strategy
604 1,600,000 1,600,000 High
SS19 Portland Cement 4,493 85,055 85,055 High
SS20
revisions to air Toxics Hotspots Program
SS21new Source review for Toxics
SS22 Stationary Gas Turbines 250 low
SS23 Biogas Flares 920 low
SS24 Sulfur limits of liquid Fuels
SS25
Coatings, Solvents, lubricants, Sealants and adhesives
SS26Surface Prep and Cleaning Solvent
SS27 Digital Printing
SS28lPG, Propane, Butane
5,000 Medium
SS29 asphaltic Concrete 400 low
SS30residential Fan Type Furnaces
13,200 High
SS31General PM emissions limits
High
SS32emergency Backup Generators
2 2 low
Table H-1. Emission Impacts from Control Measures (continued)
(continued)
Control Measure
No.
Control Measure
Title
Estimated Emission Reductions1
Annual Dollar
Benefits3 (USD/yr)
2030 Criteria Air Pollutants (lbs/day) 2030 Greenhouse Gases (MT CO2e/yr)2
ROG NOX PM2.54 SO2 NH3
100-yr time frame
20-yr time frame
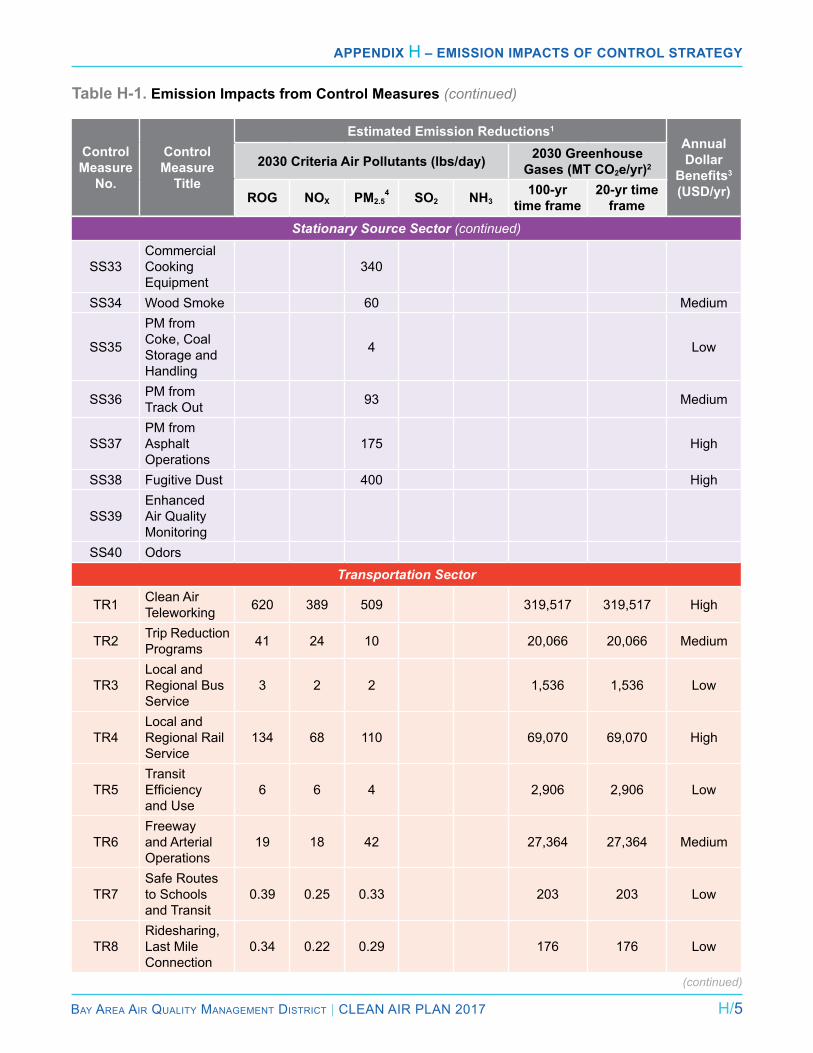
Bay area air Quality ManageMent District | Clean air Plan 2017 H/5
Appendix H – emission impActs of control strAtegy
Stationary Source Sector (continued)
SS33Commercial Cooking equipment
340
SS34 Wood Smoke 60 Medium
SS35
PM from Coke, Coal Storage and Handling
4 low
SS36 PM from Track Out 93 Medium
SS37PM from asphalt Operations
175 High
SS38 Fugitive Dust 400 High
SS39enhanced air Quality Monitoring
SS40 Odors
Transportation Sector
Tr1 Clean air Teleworking 620 389 509 319,517 319,517 High
Tr2 Trip reduction Programs 41 24 10 20,066 20,066 Medium
TR3local and regional Bus Service
3 2 2 1,536 1,536 low
Tr4local and regional rail Service
134 68 110 69,070 69,070 High
Tr5Transit Efficiency and Use
6 6 4 2,906 2,906 low
TR6Freeway and arterial Operations
19 18 42 27,364 27,364 Medium
Tr7Safe routes to Schools and Transit
0.39 0.25 0.33 203 203 low
Tr8ridesharing, last Mile Connection
0.34 0.22 0.29 176 176 low
Table H-1. Emission Impacts from Control Measures (continued)
(continued)
Control Measure
No.
Control Measure
Title
Estimated Emission Reductions1
Annual Dollar
Benefits3 (USD/yr)
2030 Criteria Air Pollutants (lbs/day) 2030 Greenhouse Gases (MT CO2e/yr)2
ROG NOX PM2.54 SO2 NH3
100-yr time frame
20-yr time frame
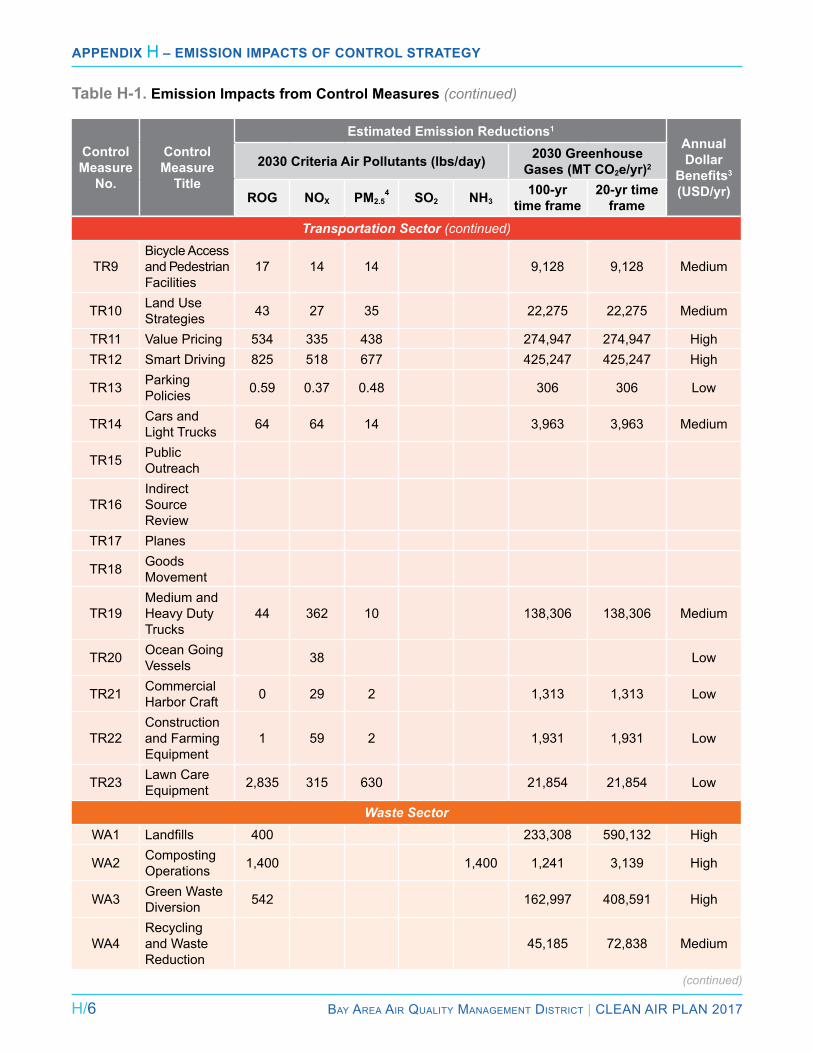
H/6 Bay area air Quality ManageMent District | Clean air Plan 2017
Appendix H – emission impActs of control strAtegy
Table H-1. Emission Impacts from Control Measures (continued)
Transportation Sector (continued)
Tr9Bicycle access and Pedestrian Facilities
17 14 14 9,128 9,128 Medium
Tr10 land Use Strategies 43 27 35 22,275 22,275 Medium
Tr11 Value Pricing 534 335 438 274,947 274,947 HighTr12 Smart Driving 825 518 677 425,247 425,247 High
TR13 Parking Policies 0.59 0.37 0.48 306 306 low
Tr14 Cars and light Trucks 64 64 14 3,963 3,963 Medium
Tr15 Public Outreach
TR16indirect Source review
Tr17 Planes
Tr18 Goods Movement
Tr19Medium and Heavy Duty Trucks
44 362 10 138,306 138,306 Medium
Tr20 Ocean Going Vessels 38 low
Tr21 Commercial Harbor Craft 0 29 2 1,313 1,313 low
Tr22Construction and Farming equipment
1 59 2 1,931 1,931 low
TR23 lawn Care equipment 2,835 315 630 21,854 21,854 low
Waste SectorWa1 Landfills 400 233,308 590,132 High
Wa2 Composting Operations 1,400 1,400 1,241 3,139 High
WA3 Green Waste Diversion 542 162,997 408,591 High
Wa4recycling and Waste reduction
45,185 72,838 Medium
(continued)
Control Measure
No.
Control Measure
Title
Estimated Emission Reductions1
Annual Dollar
Benefits3 (USD/yr)
2030 Criteria Air Pollutants (lbs/day) 2030 Greenhouse Gases (MT CO2e/yr)2
ROG NOX PM2.54 SO2 NH3
100-yr time frame
20-yr time frame

Bay area air Quality ManageMent District | Clean air Plan 2017 H/7
Appendix H – emission impActs of control strAtegy
Table H-1. Emission Impacts from Control Measures (continued)
Water Sector
Wr1
limit GHGs from POTWs and Support implemen- tation
Wr2Support Water Conservation
Total Estimated Emissions Reductions 23,224 17,671 5,895 16,695 1,641 4,433,144 5,581,187
Control Measure
No.
Control Measure
Title
Estimated Emission Reductions1
Annual Dollar
Benefits3 (USD/yr)
2030 Criteria Air Pollutants (lbs/day) 2030 Greenhouse Gases (MT CO2e/yr)2
ROG NOX PM2.54 SO2 NH3
100-yr time frame
20-yr time frame
1 Blank values in this table do not necessarily imply that there are no emission reductions associated with a given control measure. For a variety of reasons, it may not be possible to estimate reductions at this time. See the discussion in the text below for more details.
2 This table presents GHG emission reductions estimated using both a 100-year and a 20-year timeframe. See the discussion in the text below for more details.
3 The Annual Dollar Benefits column shows the estimated annual dollar value in a three tiered scale of avoided costs related to key health impacts (non-fatal heart attacks, asthma-related hospital visits, etc.), premature mortality, and the social cost of reducing greenhouse gases. Low is less than $1,000,000; Medium is between $1,000,000 and $10,000,000; High is greater than $10,000,000.
4 In the Transportation Sector, PM2.5 includes diesel and non-diesel fine particulate matter.
5 No GHG emission reductions are included for the measure SS16: Basin-Wide Methane Strategy to avoid double-counting. This measure proposes amending a general rule to serve as a stopgap for large methane leaks, while sector-specific regulations are developed. These sector-specific rules, which target the same GHG emissions, are assumed to be adopted and implemented by 2020. Please see short-term GHG reductions expected from this measure in the control measure text.
H/8 Bay area air Quality ManageMent District | Clean air Plan 2017
Appendix H – emission impActs of control strAtegy
Approach to Quantification
air District staff estimated emission reductions for control measures wherever possible, with the exception of many transportation measures, which were estimated by MTC staff. estimating the emissions impacts of the control strategy is a challenging task, complicated by the fact that various control measures affect numerous emis-sion sources, and a wide variety of implementa-tion actions are employed. in addition, the out-come of certain implementation actions—such as pursuing partnerships and collaborations, promoting adoption of model ordinance and best practices by local agencies, legislative advoca-cy, and public outreach and education—are diffi-cult to quantify. Because of these challenges, air District staff opted to use conservative assump-tions in estimating potential emission reductions.
in some cases, emission reductions could not be estimated, for different reasons, including:
● emissions reductions could not be estimated for certain control measures or implementa-tion actions because emissions factors and/or methodologies have not yet been developed.
● in the case of some regulatory measures, additional technical information and analysis is required and will occur during the rule de-velopment process.
● The level of uncertainty is too high to make realistic assumptions. For example, in the case of energy measure en1 (Decarbonize electricity Production) the potential emission reductions depend on many factors, such as how PG&e and other electricity providers will respond if the state adopts more ambitious renewable energy requirements, changes in rainfall patterns, etc.
● Many of the control measures in the 2017 Plan will help to support implementation of the state’s AB 32 Scoping Plan, and have already been accounted for in the assumptions behind the GHG projections in Figure 3-9 in chapter 3. In order to avoid potential double-counting, no emission reductions have been claimed for measures that support the implementation of state policies or regulations unless additional (surplus) emission reductions can be clearly identified and attributed to Air District actions.
100-year vs. 20-year Time Horizons for GHGs
The concept of global warming potential (GWP) was developed by the intergovernmental Panel on Climate Change (iPCC) as an index to evaluate the ability of individual greenhouse gases to trap heat in the atmosphere relative to CO2 over a given time period. As stated in Chapter 3, this metric fa-cilitates the comparison of global warming impacts from different GHGs by providing a means to ex-press emissions from all GHGs in the same unit, CO2-equivalent (CO2e). To be consistent with cur-rent scientific practice, the Air District used a 100-year time horizon to develop GHG emissions inven-tory and projections, emission reduction estimates and corresponding graphs in the 2017 Plan. This time period works well for most of the proposed control measures in the 2017 Plan, where CO2 is the primary climate pollutant of concern and is giv-en a GWP value of 1. However, for some measures, it is more relevant and appropriate to use a shorter time horizon, such as when evaluating the impacts of measures that will reduce emissions of methane or other super-GHGs in the near-term. in these in-stances (e.g., SS15: natural Gas Processing and Distribution), emission reductions have also been expressed using a 20-year time frame to highlight the much greater near-term benefit of actions to ad-dress super-GHGs that have a high GWP.

Bay Area Air Quality Management District
375 Beale Street, Suite 600
San Francisco, CA 94105
415.749.4900
www.baaqmd.gov
Connect with us: