Sonification for Network-Security Monitoring
271
Sonification for Network-Security Monitoring Louise Axon Wolfson College University of Oxford A thesis submitted for the degree of Doctor of Philosophy Trinity 2018
-
Upload
khangminh22 -
Category
Documents
-
view
2 -
download
0
Transcript of Sonification for Network-Security Monitoring

Sonification for Network-SecurityMonitoring
Louise Axon
Wolfson College
University of Oxford
A thesis submitted for the degree of
Doctor of Philosophy
Trinity 2018

Abstract
In the face of increasingly frequent, sophisticated and varied cyber-attacks, organisa-tions must continuously adapt and improve their network defences. In many organ-isations, maintaining network security is the role of the security operations centre(SOC), in which security practitioners work, aided by security-monitoring tools, todetect and mitigate cyber-attacks. There is a need for effective tools to help secu-rity practitioners to engage with and understand the data communicated over thenetwork, and the outputs of automated attack-detection methods. Over the last fewyears, a number of novel approaches have been examined, with the aim of aidingin various aspects of the network-security monitoring work of security practitioners.This thesis explores one of these approaches in particular: sonification.
Sonification is the representation of data as sound; more specifically, it is widely ac-cepted to be “the use of non-speech audio to convey information”. Sonification hasbeen shown to have advantages for presenting data to humans in other fields, such asmedicine and astronomy, for monitoring data and for anomaly detection. In theory,some of the known properties of sonification make it a promising data-presentationapproach for SOCs. It has been shown that sound can be comprehended periph-erally, enabling monitoring as a non-primary task, which may aid busy securitypractitioners, for example. Prior literature indicates the potential of network-trafficsonification systems for signalling network-security information, but does not eval-uate its utility or explore its application in SOCs. The aim of this research is toexplore the utility of sonification systems to the security-monitoring tasks carriedout in SOCs.
In order to address this aim, we proposed a model to underpin approaches to soni-fication design for network-security data. We tested the ability of humans to detectnetwork attacks and understand network-security events by listening to a sonifica-tion prototype, and found that the approach was effective in an experimental setting,indicating the viability of sonification as an approach to conveying network-securityinformation. In order to understand the design requirements and potential contextsof use for sonification in SOCs, we surveyed and interviewed security practitionersworking in SOCs. Finally, we explored the utility of sonification, by studying theuse of a sonification system by security practitioners in a set of SOC tasks, in anexperimental setting.
We found that using sonification systems could complement existing monitoringpractice in SOCs (particularly in contexts in which it is advantageous to be ableto monitor network security peripherally), subject to a range of challenges relatedto the integration of such systems into the SOC environment. While our findingsindicate that sonification may be a useful technology for security practitioners, it isimportant to recognise that our results were obtained in experimental settings. Tovalidate these findings, future longitudinal studies in which sonification systems aredeployed in operational SOCs will be key to understanding their true utility and theseverity of the challenges posed to integration.

Statement of Originality
This thesis is written in accordance with the regulations for the degree of Doctor ofPhilosophy. The thesis has been composed by myself and has not been submitted inany previous application for any degree. The work presented in this thesis has beenundertaken by myself, except where otherwise stated (see Table 1.1). Parts of thisthesis have been published previously as follows.
The literature review presented in Chapter 3 was published as part of a conferencepaper [12]. The sonification model in Chapter 5 was published as a journal extensionof that paper [13]. The results of the interviews with security practitioners reportedin Chapter 7 were published in a workshop paper [11]. Two journal articles arecurrently under review: the first on the research reported in Chapter 6; the secondon the research reported in Chapters 8 and 9.

Acknowledgements
I would like to thank my supervisors, Professor Sadie Creese and Professor MichaelGoldsmith, for their guidance, kindness and inspiration. I thank my lucky stars thatI have been able to study for my doctorate under their supervision. I feel extremelyhonoured to have been supervised by two such brilliant academics. The fact thatthey also happen to be such lovely people has made the whole experience a joy.
Thank you to Ivan Flechais and Paul Vickers, for agreeing to be my examiners forthis thesis. Thanks also to David De Roure and Kasper Rasmussen for their valuablecomments during the interviews for Transfer and Confirmation of Status, and to theother academics, security professionals, and everyone else who shared their expertiseand ideas related to this research. I am also very grateful for the financial supportprovided for my studies by the EPSRC.
During the course of this research I have had the privilege of meeting a number ofsecurity practitioners, who participated in the studies and helped me to understandpractice in security operations centres. To all these security practitioners, I wouldlike to express my sincere gratitude for their patience and willingness to share theirexpertise.
I have been lucky to be part of a wonderful research group. Jason, Jo, Jass, Arnau,Mered, Ajay, Alastair, Mariam, Ari, Mary, Marcel, Rodrigo, Liz, Faisal, Hugo, BadTom, Dimitri, Sadie, Michael, Lorna, Louise W, Maria, Caro, Matt, Sarah, Eva, Eva,Taylor, Lara and Katherine, thank you for being so much fun, and making the officesuch a great place to be. To the postdocs especially, thank you for your support, andfor offering so much guidance. Thank you to Alastair for helping me, and teachingme, to code!
I would also like to thank the CDT in Cybersecurity for giving me this opportunity.Being in the CDT has been the perfect way of doing this doctorate. Thanks tothe other CDT students — CDT14 especially — for a very enjoyable few years.Special thanks to Andrew Martin for directing this brilliant centre, and to Davidand Maureen for being wonderful, making it so much fun while at the same timeseeming to make problems just disappear!
These years wouldn’t have been half as happy without a few very important friends.To all my friends and especially those from Wallingford, Cardiff, Paris, and Oxford,thank you so much for the great times and moral support.
Most importantly, thank you to my family: parents, brothers, grandparents, aunts,uncles, cousins and puppies. Mum, Dad, Jamie and George, I don’t know what Iwould do without your love and support. Thank you for everything.

Contents
1 Introduction 11.1 Motivation . . . . . . . . . . . . . . . . . . . . . . . . . . . . . . . . . . . . . . . 11.2 Problem Statement and Research Aims . . . . . . . . . . . . . . . . . . . . . . . 41.3 Research Scope . . . . . . . . . . . . . . . . . . . . . . . . . . . . . . . . . . . . . 81.4 Thesis Structure . . . . . . . . . . . . . . . . . . . . . . . . . . . . . . . . . . . . 91.5 Publications . . . . . . . . . . . . . . . . . . . . . . . . . . . . . . . . . . . . . . . 10
2 Background 122.1 Monitoring Network Traffic . . . . . . . . . . . . . . . . . . . . . . . . . . . . . . 122.2 Network-Security Monitoring in SOCs . . . . . . . . . . . . . . . . . . . . . . . . 14
2.2.1 Automated Detection Tools . . . . . . . . . . . . . . . . . . . . . . . . . . 152.2.2 Data-Presentation Approaches and SIEM Tools . . . . . . . . . . . . . . . 16
2.3 Sonification: a Background . . . . . . . . . . . . . . . . . . . . . . . . . . . . . . 182.3.1 Sonification Approaches, Models and Guidance . . . . . . . . . . . . . . . 192.3.2 Prior Applications of Sonification . . . . . . . . . . . . . . . . . . . . . . . 212.3.3 Aesthetic Sonification and Musification . . . . . . . . . . . . . . . . . . . 222.3.4 Auditory Perception and Psychological Factors . . . . . . . . . . . . . . . 242.3.5 Data-Sound Mappings . . . . . . . . . . . . . . . . . . . . . . . . . . . . . 26
2.4 Human-Computer Interaction (HCI) . . . . . . . . . . . . . . . . . . . . . . . . . 272.4.1 User-Centred Systems Design (UCSD) . . . . . . . . . . . . . . . . . . . . 272.4.2 HCI Work in Sonification . . . . . . . . . . . . . . . . . . . . . . . . . . . 282.4.3 HCI Studies in SOCs . . . . . . . . . . . . . . . . . . . . . . . . . . . . . . 29
2.5 Summary . . . . . . . . . . . . . . . . . . . . . . . . . . . . . . . . . . . . . . . . 30
3 Related Work: Applications of Sonification to Network-Security Monitoring 313.1 Approach 1 : Sonifying Network Data Directly . . . . . . . . . . . . . . . . . . . . 323.2 Approach 2 : Sonifying the Output of Detection Systems . . . . . . . . . . . . . . 453.3 Outstanding Challenges Based on Literature Review and Background . . . . . . 46
3.3.1 Designing Sonification Systems for Network-Security Monitoring . . . . . 463.3.2 User Studies and the Utility of Sonification for SOCs . . . . . . . . . . . . 48
3.4 Summary . . . . . . . . . . . . . . . . . . . . . . . . . . . . . . . . . . . . . . . . 50
4 Methodology 514.1 Research Methodology Overview . . . . . . . . . . . . . . . . . . . . . . . . . . . 514.2 Research Methods . . . . . . . . . . . . . . . . . . . . . . . . . . . . . . . . . . . 58
4.2.1 Running Studies and Ethical Procedures . . . . . . . . . . . . . . . . . . . 584.2.2 Collection of Participant Demographics . . . . . . . . . . . . . . . . . . . 594.2.3 Measuring Accuracy of Network-Event Detection: Precision, Recall and
F-Scores . . . . . . . . . . . . . . . . . . . . . . . . . . . . . . . . . . . . . 594.2.4 Interview Analysis: Transcription and Coding . . . . . . . . . . . . . . . . 59
4.3 Summary . . . . . . . . . . . . . . . . . . . . . . . . . . . . . . . . . . . . . . . . 60
i

5 Data Requirements and Sonification Model 625.1 Methodology . . . . . . . . . . . . . . . . . . . . . . . . . . . . . . . . . . . . . . 62
5.1.1 Scoping of Network Model and Attacks . . . . . . . . . . . . . . . . . . . 635.1.2 Characterisation of Network Attacks and Selection of Data Features . . . 635.1.3 Development of Sonification Model and Application to Prototype Devel-
opment . . . . . . . . . . . . . . . . . . . . . . . . . . . . . . . . . . . . . 635.2 Network and Attack Scope . . . . . . . . . . . . . . . . . . . . . . . . . . . . . . . 63
5.2.1 Network-Monitoring Scope . . . . . . . . . . . . . . . . . . . . . . . . . . 645.2.2 Attack Scope . . . . . . . . . . . . . . . . . . . . . . . . . . . . . . . . . . 64
5.3 Attack Characterisation and Data Requirements . . . . . . . . . . . . . . . . . . 675.4 Requirements of the Sonification Model . . . . . . . . . . . . . . . . . . . . . . . 685.5 Formalised Model for the Sonification of Network-Security Data . . . . . . . . . . 69
5.5.1 Formalised Sonification Model . . . . . . . . . . . . . . . . . . . . . . . . 695.5.2 Addressing Prior-Art Approaches Using the Sonification Model . . . . . . 71
5.6 Application of the Model to Facilitate Prototype Design . . . . . . . . . . . . . . 725.6.1 Data Requirements: Network-Attack Characterisation . . . . . . . . . . . 735.6.2 Applying the Sonification Model . . . . . . . . . . . . . . . . . . . . . . . 765.6.3 Implementing the Sonification Prototype . . . . . . . . . . . . . . . . . . . 79
5.7 Summary . . . . . . . . . . . . . . . . . . . . . . . . . . . . . . . . . . . . . . . . 81
6 Assessing the Viability of Presenting Network-Security Information as Soundin a Prototype Effectiveness Study 826.1 Aims and Hypotheses . . . . . . . . . . . . . . . . . . . . . . . . . . . . . . . . . 826.2 Methodology . . . . . . . . . . . . . . . . . . . . . . . . . . . . . . . . . . . . . . 84
6.2.1 Network-Attack Datasets . . . . . . . . . . . . . . . . . . . . . . . . . . . 846.2.2 Study Process . . . . . . . . . . . . . . . . . . . . . . . . . . . . . . . . . . 866.2.3 Analysis . . . . . . . . . . . . . . . . . . . . . . . . . . . . . . . . . . . . . 896.2.4 Reliability . . . . . . . . . . . . . . . . . . . . . . . . . . . . . . . . . . . . 89
6.3 Results . . . . . . . . . . . . . . . . . . . . . . . . . . . . . . . . . . . . . . . . . . 906.4 Discussion . . . . . . . . . . . . . . . . . . . . . . . . . . . . . . . . . . . . . . . . 96
6.4.1 Hypotheses . . . . . . . . . . . . . . . . . . . . . . . . . . . . . . . . . . . 966.4.2 Sonification design . . . . . . . . . . . . . . . . . . . . . . . . . . . . . . . 986.4.3 Study design: observations and limitations . . . . . . . . . . . . . . . . . . 99
6.5 Summary . . . . . . . . . . . . . . . . . . . . . . . . . . . . . . . . . . . . . . . . 102
7 Identifying Contexts of Use and Analysing Requirements for Sonification inSOCs 1037.1 Methodology . . . . . . . . . . . . . . . . . . . . . . . . . . . . . . . . . . . . . . 104
7.1.1 Research Approach . . . . . . . . . . . . . . . . . . . . . . . . . . . . . . . 1047.1.2 Developing Tentative Use Cases . . . . . . . . . . . . . . . . . . . . . . . . 1057.1.3 Semi-Structured Interviews . . . . . . . . . . . . . . . . . . . . . . . . . . 1057.1.4 Data Analysis . . . . . . . . . . . . . . . . . . . . . . . . . . . . . . . . . . 1057.1.5 Development of Approaches to Meeting Requirements . . . . . . . . . . . 106
7.2 Tentative Use Case Development . . . . . . . . . . . . . . . . . . . . . . . . . . . 1067.2.1 Developing Ideas Using Existing Literature . . . . . . . . . . . . . . . . . 1067.2.2 Exploring Ideas Using an Online Survey . . . . . . . . . . . . . . . . . . . 1077.2.3 Tentative Use-Cases . . . . . . . . . . . . . . . . . . . . . . . . . . . . . . 108
7.3 Interview Results . . . . . . . . . . . . . . . . . . . . . . . . . . . . . . . . . . . . 1087.3.1 Participants . . . . . . . . . . . . . . . . . . . . . . . . . . . . . . . . . . . 108
7.4 Perspectives on Use Case Utility . . . . . . . . . . . . . . . . . . . . . . . . . . . 1087.4.1 Use Case 1: Detecting Anomalies in the Network Traffic . . . . . . . . . . 1097.4.2 Use Case 2: Monitoring as a Non-Primary Task . . . . . . . . . . . . . . . 109
ii

7.4.3 Use Case 3: Monitoring Data Presented Across Multiple Screens . . . . . 1107.4.4 Use Case 4: Alleviating Fatigue from Monitoring Screens . . . . . . . . . 1117.4.5 Use Case 5: Enabling Monitoring While Outside the SOC . . . . . . . . . 1117.4.6 Use Case Ratings . . . . . . . . . . . . . . . . . . . . . . . . . . . . . . . . 1127.4.7 Other Use Cases Suggested by Participants . . . . . . . . . . . . . . . . . 113
7.5 Perspectives on Integrating Sonification . . . . . . . . . . . . . . . . . . . . . . . 1147.6 Perspectives on Sonification Design . . . . . . . . . . . . . . . . . . . . . . . . . . 1167.7 Refined Contexts of Use . . . . . . . . . . . . . . . . . . . . . . . . . . . . . . . . 1187.8 Approaches to Addressing Sonification Design Requirements . . . . . . . . . . . . 119
7.8.1 Configurability . . . . . . . . . . . . . . . . . . . . . . . . . . . . . . . . . 1217.8.2 Tool Features . . . . . . . . . . . . . . . . . . . . . . . . . . . . . . . . . . 1217.8.3 Sonification of Alerts . . . . . . . . . . . . . . . . . . . . . . . . . . . . . . 122
7.9 Summary . . . . . . . . . . . . . . . . . . . . . . . . . . . . . . . . . . . . . . . . 124
8 Exploring the Use of a Sonification System by Security Practitioners: StudyDesign 1258.1 Study Scope . . . . . . . . . . . . . . . . . . . . . . . . . . . . . . . . . . . . . . . 1258.2 Development of Tools for the Study . . . . . . . . . . . . . . . . . . . . . . . . . 127
8.2.1 SIEM Tool . . . . . . . . . . . . . . . . . . . . . . . . . . . . . . . . . . . 1288.2.2 Sonification SIEM Tool . . . . . . . . . . . . . . . . . . . . . . . . . . . . 130
8.3 Aims and Hypotheses . . . . . . . . . . . . . . . . . . . . . . . . . . . . . . . . . 1338.4 Methodology . . . . . . . . . . . . . . . . . . . . . . . . . . . . . . . . . . . . . . 136
8.4.1 Study Preparation . . . . . . . . . . . . . . . . . . . . . . . . . . . . . . . 1378.4.2 Study Process . . . . . . . . . . . . . . . . . . . . . . . . . . . . . . . . . . 1398.4.3 Analysis . . . . . . . . . . . . . . . . . . . . . . . . . . . . . . . . . . . . . 144
8.5 Summary . . . . . . . . . . . . . . . . . . . . . . . . . . . . . . . . . . . . . . . . 149
9 Exploring the Use of a Sonification System by Security Practitioners: StudyResults 1509.1 Participants’ Demographics and Performance in the Study Tasks . . . . . . . . . 150
9.1.1 Participants and Demographics . . . . . . . . . . . . . . . . . . . . . . . . 1509.1.2 Detection and Identification of the FTP Brute-Force Attack (Hypotheses
A and C) . . . . . . . . . . . . . . . . . . . . . . . . . . . . . . . . . . . . 1519.1.3 Detection and Identification of Snort IDS Alerts (Hypotheses B and D) . 1549.1.4 Anomalous Traffic Deviations: Network-Traffic Awareness . . . . . . . . . 1569.1.5 The Effect of Musical Experience on Monitoring Performance (Hypothesis
E) . . . . . . . . . . . . . . . . . . . . . . . . . . . . . . . . . . . . . . . . 1599.1.6 Usability Questionnaires . . . . . . . . . . . . . . . . . . . . . . . . . . . . 161
9.2 Interviews . . . . . . . . . . . . . . . . . . . . . . . . . . . . . . . . . . . . . . . . 1619.2.1 SOCs: Setup and Working Practice . . . . . . . . . . . . . . . . . . . . . . 1629.2.2 Descriptions of Experience in the Study . . . . . . . . . . . . . . . . . . . 1649.2.3 Integrating Sonification into SOCs: Utility and Practicalities . . . . . . . 1709.2.4 Sonification Design Requirements and Suggestions . . . . . . . . . . . . . 1759.2.5 Study Design and Realisticness . . . . . . . . . . . . . . . . . . . . . . . . 178
9.3 Discussion . . . . . . . . . . . . . . . . . . . . . . . . . . . . . . . . . . . . . . . . 1829.3.1 Hypotheses and the Performance of Participants in the Study . . . . . . . 1829.3.2 Study Design: Limitations and Lessons Learned . . . . . . . . . . . . . . . 1869.3.3 Using Sonification in SOCs: Utility, Practicalities and Requirements . . . 189
9.4 Summary . . . . . . . . . . . . . . . . . . . . . . . . . . . . . . . . . . . . . . . . 191
iii

10 Conclusion 19310.1 Reflection on the Research Aims Addressed, and Critique . . . . . . . . . . . . . 19310.2 Summary of Research Contributions . . . . . . . . . . . . . . . . . . . . . . . . . 197
10.2.1 Sonification Design . . . . . . . . . . . . . . . . . . . . . . . . . . . . . . . 19710.2.2 Contexts of Use and Requirements for Sonification in SOCs . . . . . . . . 19710.2.3 Assessments of Network-Security Monitoring Performance Using Sonifi-
cation . . . . . . . . . . . . . . . . . . . . . . . . . . . . . . . . . . . . . . 19810.3 Directions for Future Work . . . . . . . . . . . . . . . . . . . . . . . . . . . . . . 198
A Collection of Participant Demographics 201
B Semi-Structured Interviews: Guiding Questions 203B.1 Prototype Effectiveness Study (Chapter 6) . . . . . . . . . . . . . . . . . . . . . . 203B.2 Initial Interviews with Security Practitioners (Chapter 7) . . . . . . . . . . . . . 203B.3 Interviews with Security Practitioners Following Use of Sonification in Network-
Security Monitoring Tasks (Chapters 8 and 9) . . . . . . . . . . . . . . . . . . . . 204
C Usability Questionnaires: SUS and BUZZ 206C.1 System Usability Scale (SUS) . . . . . . . . . . . . . . . . . . . . . . . . . . . . . 206C.2 Auditory Interface User Experience Scale (BUZZ) . . . . . . . . . . . . . . . . . 206
D Coding Tables Produced for the Interviews with Security Practitioners (Chap-ters 7, 8 and 9) 208
E Sonification Mappings and Scaling: Magnitude Estimation Study 223E.1 Background . . . . . . . . . . . . . . . . . . . . . . . . . . . . . . . . . . . . . . . 224
E.1.1 Magnitude Estimation . . . . . . . . . . . . . . . . . . . . . . . . . . . . . 224E.1.2 Online and User Interface-Based Experiments . . . . . . . . . . . . . . . . 225
E.2 Development of Data-Sound Mappings for Assessment . . . . . . . . . . . . . . . 225E.2.1 Data Parameters . . . . . . . . . . . . . . . . . . . . . . . . . . . . . . . . 225E.2.2 Sound Parameters . . . . . . . . . . . . . . . . . . . . . . . . . . . . . . . 226E.2.3 Existing Knowledge on the Selected Data-Sound Mappings . . . . . . . . 227
E.3 Methodology . . . . . . . . . . . . . . . . . . . . . . . . . . . . . . . . . . . . . . 228E.3.1 Recruitment and Introduction . . . . . . . . . . . . . . . . . . . . . . . . . 228E.3.2 Study Process . . . . . . . . . . . . . . . . . . . . . . . . . . . . . . . . . . 229E.3.3 Online Interface . . . . . . . . . . . . . . . . . . . . . . . . . . . . . . . . 229E.3.4 Sound Stimuli . . . . . . . . . . . . . . . . . . . . . . . . . . . . . . . . . . 230E.3.5 Reliability . . . . . . . . . . . . . . . . . . . . . . . . . . . . . . . . . . . . 231E.3.6 Analysis . . . . . . . . . . . . . . . . . . . . . . . . . . . . . . . . . . . . . 231
E.4 Results . . . . . . . . . . . . . . . . . . . . . . . . . . . . . . . . . . . . . . . . . . 234E.4.1 Mapping Effectiveness . . . . . . . . . . . . . . . . . . . . . . . . . . . . . 237E.4.2 Preliminary Observations on the Effect of Musical Experience and Gender 238
E.5 Discussion . . . . . . . . . . . . . . . . . . . . . . . . . . . . . . . . . . . . . . . . 241E.5.1 Implications of the Findings for Sonification Design . . . . . . . . . . . . 241E.5.2 Reuse of the Methodology: Limitations and Improvements . . . . . . . . . 242
E.6 Summary . . . . . . . . . . . . . . . . . . . . . . . . . . . . . . . . . . . . . . . . 243
iv

List of Figures
1.1 A summary of the existing relationship between traditional monitoring techniquesand their potential relationship with sonification systems in SOCs . . . . . . . . 4
1.2 Map of research questions . . . . . . . . . . . . . . . . . . . . . . . . . . . . . . . 6
2.1 Monitoring network traffic on a local area network (LAN) . . . . . . . . . . . . . 132.2 A SOC (United States Air Force photo) [5] . . . . . . . . . . . . . . . . . . . . . 142.3 Sample McAfee SIEM dashboard (as presented in an online article [53]) . . . . . 182.4 Requirements analysis process [127] . . . . . . . . . . . . . . . . . . . . . . . . . . 28
3.1 A summary of the data types used in previous approaches to sonifying networkdata . . . . . . . . . . . . . . . . . . . . . . . . . . . . . . . . . . . . . . . . . . . 31
4.1 Proposed approach to designing and assessing the utility of sonification systemsfor network-security monitoring in SOCs . . . . . . . . . . . . . . . . . . . . . . . 52
4.2 Overview of DPhil research methodology . . . . . . . . . . . . . . . . . . . . . . . 534.3 Stages of research approach (as presented in Figure 4.1) addressed in Chapter 5 . 544.4 Stages of research approach (as presented in Figure 4.1) addressed in Chapter 6 . 554.5 Stages of research approach (as presented in Figure 4.1) addressed in Chapter 7 . 564.6 Stages of research approach (as presented in Figure 4.1) addressed in Chapters 8
and 9 . . . . . . . . . . . . . . . . . . . . . . . . . . . . . . . . . . . . . . . . . . 57
5.1 Developing a sonification model: overview of methodology . . . . . . . . . . . . . 635.2 Network scope . . . . . . . . . . . . . . . . . . . . . . . . . . . . . . . . . . . . . 645.3 Data-sound mappings space of the model . . . . . . . . . . . . . . . . . . . . . . 715.4 Data-sound mappings space: sonification prototype . . . . . . . . . . . . . . . . . 775.5 Sonification system implementation . . . . . . . . . . . . . . . . . . . . . . . . . . 79
6.1 Representations of network attacks in the sonification system . . . . . . . . . . . 866.2 Participant setup . . . . . . . . . . . . . . . . . . . . . . . . . . . . . . . . . . . . 876.3 Sonification system diagram . . . . . . . . . . . . . . . . . . . . . . . . . . . . . . 886.4 Participant click times in pre-training task . . . . . . . . . . . . . . . . . . . . . . 916.5 Participant click times in post-training task . . . . . . . . . . . . . . . . . . . . . 916.6 Click times in post-training task: participants with musical experience . . . . . . 946.7 Click times in post-training task: participants without musical experience. . . . . 946.8 Possible approaches to completing the study task. . . . . . . . . . . . . . . . . . 100
7.1 Requirements analysis process . . . . . . . . . . . . . . . . . . . . . . . . . . . . . 1047.2 Approach to enabling selection of data-sound mappings by users . . . . . . . . . 1217.3 Sonification-visual linking plot . . . . . . . . . . . . . . . . . . . . . . . . . . . . 1227.4 Data-sound mappings space: alerts . . . . . . . . . . . . . . . . . . . . . . . . . . 123
8.1 Scoping the contexts of use and sonification developments to focus on in the study1268.2 SIEM dashboard created for the study . . . . . . . . . . . . . . . . . . . . . . . 129
v

8.3 Data-sound mappings space: combined sonification . . . . . . . . . . . . . . . . . 1318.4 Sonification SIEM dashboard created for the study . . . . . . . . . . . . . . . 1328.5 Replaying and recapturing traffic, and representing traffic and alerts in the SIEM
and Sonification SIEM . . . . . . . . . . . . . . . . . . . . . . . . . . . . . . . 1398.6 Study process: overview . . . . . . . . . . . . . . . . . . . . . . . . . . . . . . . . 1408.7 Comparisons made in the analysis. . . . . . . . . . . . . . . . . . . . . . . . . . . 145
9.1 Dataset 1 network-traffic awareness: true-positive detections (top); false-positiveand unidentified detections (middle); ground truth (bottom) . . . . . . . . . . . . 158
9.2 Dataset 2 network-traffic awareness: true-positive detections (top); false-positiveand unidentified detections (middle); ground truth (bottom) . . . . . . . . . . . . 158
10.1 Chapters in which we have addressed the research questions . . . . . . . . . . . . 194
E.1 Example chord for degrees of consonance calculation: C, D#, F, A#. . . . . . . . 227E.2 Magnitude estimation experiment: overview of methodology . . . . . . . . . . . . 229E.3 Web interface used by participants . . . . . . . . . . . . . . . . . . . . . . . . . . 230E.4 Pitches used as stimuli for the pitch sound parameter. Left to right shows stimuli
1-10: G1, D2, A2, E3, B3, F4, C5, G5, D6, A6. . . . . . . . . . . . . . . . . . . . 230E.5 Chords used as stimuli for degrees of consonance sound parameter. Left-to-right
shows stimuli 1-10, with degrees of consonance 2, 4, 6, 8, 10, 12, 14, 16, 19, 21,respectively. . . . . . . . . . . . . . . . . . . . . . . . . . . . . . . . . . . . . . . . 231
E.6 Analysis process for each data-sound mapping . . . . . . . . . . . . . . . . . . . . 231E.7 Positive and negative power functions over log-log plots of the data parameters (x-
axis values) to sound parameters (y axis values). Values that are part of positivefunctions are represented by dots; values that are part of negative functions arerepresented by crosses. . . . . . . . . . . . . . . . . . . . . . . . . . . . . . . . . . 235
vi

List of Tables
1.1 Publications, submissions, and contributions of authors . . . . . . . . . . . . . . 11
3.1 Review of approaches to and user testing in existing sonification systems fornetwork-security monitoring, ordered by year. . . . . . . . . . . . . . . . . . . . . 33
3.1 Review of approaches to and user testing in existing sonification systems fornetwork-security monitoring, ordered by year (continued). . . . . . . . . . . . . . 34
3.1 Review of approaches to and user testing in existing sonification systems fornetwork-security monitoring, ordered by year (continued). . . . . . . . . . . . . . 35
3.1 Review of approaches to and user testing in existing sonification systems fornetwork-security monitoring, ordered by year (continued). . . . . . . . . . . . . . 36
3.1 Review of approaches to and user testing in existing sonification systems fornetwork-security monitoring, ordered by year (continued). . . . . . . . . . . . . . 37
3.1 Review of approaches to and user testing in existing sonification systems fornetwork-security monitoring, ordered by year (continued). . . . . . . . . . . . . . 38
3.2 Attack detection and network data-feature representation in previous sonificationsystems that take Approach 1 . . . . . . . . . . . . . . . . . . . . . . . . . . . . . 42
3.2 Attack detection and network data-feature representation in previous sonificationsystems that take Approach 1 (continued) . . . . . . . . . . . . . . . . . . . . . . 43
3.2 Attack detection and network data-feature representation in previous sonificationsystems that take Approach 1 (continued) . . . . . . . . . . . . . . . . . . . . . . 44
4.1 Overview of the studies presented in this thesis . . . . . . . . . . . . . . . . . . . 584.2 Collection of participant demographics during the studies presented in this thesis 60
5.1 Data-representation requirements . . . . . . . . . . . . . . . . . . . . . . . . . . . 675.2 Description and formal notation of model components . . . . . . . . . . . . . . . 705.3 Description and formal notation of model relations . . . . . . . . . . . . . . . . . 705.4 Applying the formalisation to capture previous musical parameter-mapping sys-
tems for the sonification of low-level network data: components . . . . . . . . . . 725.5 Applying the formalisation to capture previous musical parameter-mapping sys-
tems for the sonification of low-level network data: relations . . . . . . . . . . . . 735.6 Network-attack characterisation examples and data-presentation requirements . . 755.7 Sonification prototype: design and basis in the sonification model. Dark grey
bands indicate the relation between data channels and sound channels (betweenCD and CS ), and data dimensions and sound dimensions (between DD andDS ). Light grey bands indicate the breakdown of data and sound dimensionsinto continuous and discrete dimensions. White bands indicate the data channelsand dimensions, and sound channels and dimensions, we selected to create thissonification prototype. . . . . . . . . . . . . . . . . . . . . . . . . . . . . . . . . . 78
5.8 Implementation of the sonification prototype . . . . . . . . . . . . . . . . . . . . 80
6.1 Packet-capture header fields . . . . . . . . . . . . . . . . . . . . . . . . . . . . . . 85
vii

6.2 Hypotheses tested at each stage of the study . . . . . . . . . . . . . . . . . . . . 876.3 Data-sound parameter mappings . . . . . . . . . . . . . . . . . . . . . . . . . . . 886.4 Measuring performance in the study . . . . . . . . . . . . . . . . . . . . . . . . . 906.5 Proportion of participants who accurately detected each attack type pre- and
post-training . . . . . . . . . . . . . . . . . . . . . . . . . . . . . . . . . . . . . . 916.6 Precision, recall and F-score for pre-training, training and post-training datasets 926.7 post-training, efficiency of attack detection (seconds) . . . . . . . . . . . . . . . . 926.8 Single-factor ANOVA analysis of mean detection times for DDoS, port scan and
data exfiltration . . . . . . . . . . . . . . . . . . . . . . . . . . . . . . . . . . . . . 926.9 Post-training accuracy of attack identification . . . . . . . . . . . . . . . . . . . . 936.10 Combined attack results . . . . . . . . . . . . . . . . . . . . . . . . . . . . . . . . 936.11 Pre-training efficiency of attack detection (seconds) . . . . . . . . . . . . . . . . . 946.12 Accuracy of attack detection, pre- and post-training musical experience comparison 956.13 Post-training efficiency of attack detection: musical experience comparison . . . . 956.14 t-test (two-sample assuming equal variances): attack-detection efficiency for par-
ticipants with and without musical experience (alpha=0.05) . . . . . . . . . . . . 956.15 Post-training accuracy of attack identification: musical experience comparison . . 966.16 Efficiency of attack detection: dataset comparison . . . . . . . . . . . . . . . . . . 966.17 Participants’ ratings for the ease of each of the study task components (Likert
scale, 1: very easy – 5: very difficult) . . . . . . . . . . . . . . . . . . . . . . . . . 97
7.1 Online Survey Results: Responses to Assertions (Resp., ordered from “Stronglydisagree” (=1) – “Strongly agree” (=5)): Mode, Median (Med.), and Comparisonof Non-Neutral Scores – Disagree (1-2): Agree (4-5) (CNNS: D:A) . . . . . . . . . 107
7.2 Interview participant (P) demographics . . . . . . . . . . . . . . . . . . . . . . . 1097.3 Mode, and number of ratings given to each use case by participants . . . . . . . . 113
8.1 Selection of SIEM dashboard elements based on existing commercial SIEMs . . . 1298.2 Quantitative comparisons made in the study analysis . . . . . . . . . . . . . . . . 1458.3 Measuring performance in the study: detection accuracy and efficiency, and iden-
tification accuracy . . . . . . . . . . . . . . . . . . . . . . . . . . . . . . . . . . . 147
9.1 Participant (P) demographics . . . . . . . . . . . . . . . . . . . . . . . . . . . . . 1509.2 Participants’ job roles and experience . . . . . . . . . . . . . . . . . . . . . . . . 1519.3 Participants’ levels of musical experience . . . . . . . . . . . . . . . . . . . . . . . 1519.4 Detection of, and time taken (in seconds) to detect, anomalous traffic and alerts
(presented separately) following the FTP brute-force attack . . . . . . . . . . . . 1529.5 Detection and time taken (in seconds) to detection following the FTP brute-force
attack: first detection — traffic (T) or alerts (A) . . . . . . . . . . . . . . . . . . 1529.6 Recall rate, and mean and standard deviation (S. D.) of detection times (in
seconds) following the FTP brute-force attack: traffic only, alerts only, and overall(first detection of attack-related traffic or alerts) . . . . . . . . . . . . . . . . . . 152
9.7 t-test (two-sample assuming equal variances): time taken to detection followingthe FTP brute-force attack in Study Task 1 : comparison of participants usingthe SIEM and the Sonification SIEM (alpha=0.05) . . . . . . . . . . . . . . . 153
9.8 t-test (two-sample assuming unequal variances): time taken to detection followingthe FTP brute-force attack in Study Task 2 : comparison of participants using theSIEM and the Sonification SIEM (alpha=0.05) . . . . . . . . . . . . . . . . . 154
9.9 Identification of the FTP brute-force attack: proportion of those participants whodetected anomalous traffic following the attack, who also correctly identified thetraffic as continuously high levels of FTP . . . . . . . . . . . . . . . . . . . . . . 154
viii

9.10 Precision, recall, F-score and identification accuracy for alert detections in thestudy tasks . . . . . . . . . . . . . . . . . . . . . . . . . . . . . . . . . . . . . . . 155
9.11 Time taken to true-positive alert detections (mean and standard deviation) ineach dataset . . . . . . . . . . . . . . . . . . . . . . . . . . . . . . . . . . . . . . . 155
9.12 Time taken to true-positive alert detections (mean and standard deviation) acrossboth datasets . . . . . . . . . . . . . . . . . . . . . . . . . . . . . . . . . . . . . . 155
9.13 t-test (two-sample assuming unequal variances): time taken to detect alerts inStudy Task 1 : comparison of participants using the SIEM and the SonificationSIEM (alpha=0.05) . . . . . . . . . . . . . . . . . . . . . . . . . . . . . . . . . . 156
9.14 t-test (two-sample assuming unequal variances): time taken to detect alerts inStudy Task 2 : comparison of participants using the SIEM and the SonificationSIEM (alpha=0.05) . . . . . . . . . . . . . . . . . . . . . . . . . . . . . . . . . . 156
9.15 Ground truth for anomalous traffic deviations in each dataset, and indication ofelements added following the responses of particular participants . . . . . . . . . 157
9.16 Classifications of anomalous traffic detected . . . . . . . . . . . . . . . . . . . . . 1579.17 Precision of anomalous traffic detection, and identification accuracy . . . . . . . 1579.18 Time taken to detection of traffic anomalies: mean and standard deviation . . . . 1589.19 t-test (two-sample assuming unequal variances): time taken to first detection of
either traffic or alerts following the FTP brute-force attack using the Sonifica-tion SIEM, by participants with and without musical experience (alpha=0.05) . 159
9.20 t-test (two-sample assuming equal variances): time taken to detect alerts usingthe Sonification SIEM, by participants with and without musical experience(alpha=0.05) . . . . . . . . . . . . . . . . . . . . . . . . . . . . . . . . . . . . . . 160
9.21 System usability scale (SUS) scores given by each participant: SIEM and Soni-fication SIEM . . . . . . . . . . . . . . . . . . . . . . . . . . . . . . . . . . . . . 161
9.22 Auditory interface user experience scale (BUZZ) scores: Sonification SIEM . . 161
B.1 Sonification use case table for SOCs interviews . . . . . . . . . . . . . . . . . . . 204
C.1 SUS usability questionnaire . . . . . . . . . . . . . . . . . . . . . . . . . . . . . . 206C.2 BUZZ questionnaire . . . . . . . . . . . . . . . . . . . . . . . . . . . . . . . . . . 207
D.1 Coding table: Chapter 7. Theme: Perspectives on use case utility . . . . . . . . . 209D.1 Coding table: Chapter 7. Theme: Perspectives on use case utility (continued) . . 210D.2 Coding table: Chapter 7. Theme: Perspectives on integrating sonification into
SOCs . . . . . . . . . . . . . . . . . . . . . . . . . . . . . . . . . . . . . . . . . . 210D.2 Coding table: Chapter 7. Theme: Perspectives on integrating sonification into
SOCs (continued) . . . . . . . . . . . . . . . . . . . . . . . . . . . . . . . . . . . . 211D.3 Coding table: Chapter 7. Theme: Perspectives on sonification design . . . . . . . 211D.3 Coding table: Chapter 7. Theme: Perspectives on sonification design (continued) 212D.4 Coding table: Chapters 8 and 9. Theme: SOCs: setup and working practice . . . 212D.4 Coding table: Chapters 8 and 9. Theme: SOCs: setup and working practice (con-
tinued) . . . . . . . . . . . . . . . . . . . . . . . . . . . . . . . . . . . . . . . . . . 213D.5 Coding table: Chapters 8 and 9. Theme: Descriptions of experience in the study 214D.5 Coding table: Chapters 8 and 9. Theme: Descriptions of experience in the study
(continued) . . . . . . . . . . . . . . . . . . . . . . . . . . . . . . . . . . . . . . . 215D.5 Coding table: Chapters 8 and 9. Theme: Descriptions of experience in the study
(continued) . . . . . . . . . . . . . . . . . . . . . . . . . . . . . . . . . . . . . . . 216D.6 Coding table: Chapters 8 and 9. Theme: Integrating sonification into SOCs . . . 216D.6 Coding table: Chapters 8 and 9. Theme: Integrating sonification into SOCs (con-
tinued) . . . . . . . . . . . . . . . . . . . . . . . . . . . . . . . . . . . . . . . . . . 217
ix

D.6 Coding table: Chapters 8 and 9. Theme: Integrating sonification into SOCs (con-tinued) . . . . . . . . . . . . . . . . . . . . . . . . . . . . . . . . . . . . . . . . . . 218
D.6 Coding table: Chapters 8 and 9. Theme: Integrating sonification into SOCs (con-tinued) . . . . . . . . . . . . . . . . . . . . . . . . . . . . . . . . . . . . . . . . . . 219
D.7 Coding table: Chapters 8 and 9. Theme: Sonification design requirements andsuggestions . . . . . . . . . . . . . . . . . . . . . . . . . . . . . . . . . . . . . . . 219
D.7 Coding table: Chapters 8 and 9. Theme: Sonification design requirements andsuggestions (continued) . . . . . . . . . . . . . . . . . . . . . . . . . . . . . . . . 220
D.8 Coding table: Chapters 8 and 9. Theme: Study design and realisticness . . . . . . 221D.8 Coding table: Chapters 8 and 9. Theme: Study design and realisticness (continued)222
E.1 Ratios of musical intervals with respect to C . . . . . . . . . . . . . . . . . . . . . 226E.2 Relevant results from prior work . . . . . . . . . . . . . . . . . . . . . . . . . . . 228E.3 Results: number of positive/negative/no polarity estimates; polarity majorities;
power functions; error calculations; unanimity of polarity . . . . . . . . . . . . . 236E.4 Results: mapping effectiveness (from most to least effective for each data param-
eter) according to each definition of effectiveness (as defined in Section E.3.6). . . 237E.5 Results divided by level of musical experience . . . . . . . . . . . . . . . . . . . . 239E.6 Results divided by gender . . . . . . . . . . . . . . . . . . . . . . . . . . . . . . . 240E.7 Results: mapping effectiveness (according to the Combined Effectiveness Def-
initions) divided by level of musical experience, and gender . . . . . . . . . . . . 241
x

Abbreviations
• ANOVA: Analysis of Variance
• CAPEC: Common Attack Pattern Enumeration and Classification
• DDoS: distributed denial-of-service (attack)
• DNS: Domain Name System
• DoS: denial-of-service (attack)
• FTP: File Transfer Protocol
• HCI: Human-Computer Interaction
• HTTP(S): Hypertext Transfer Protocol (Secure)
• ICAD: International Conference on Auditory Display
• IDS: intrusion-detection system
• IPS. intrusion-prevention system
• LAN: local-area network
• MAN: metropolitan area network
• MIDI: Musical Instrument Digital Interface
• PCAP: Packet capture
• PMSon: Parameter-mapping sonification
• SDSM: Sonification Design Space Map [60]
• SIEM: Security Information and Event Management tool
• SOC: security operations centre
• TCP: Transmission Control Protocol
• UCSD: User-Centred Systems Design
• UDP: User Datagram Protocol
• WAN: wide-area network
xi

Chapter 1
Introduction
This thesis explores the use of sonification systems for network-security monitoring in securityoperations centres (SOCs). Sonification is the representation of data as sound; more specifically,it is widely accepted to be “the use of non-speech audio to convey information” [120]. Sonificationhas potential as an approach to addressing some of the unique challenges faced by SOCs. Abody of research exists into the use of sonification for monitoring processes, exploring data, andalerting [101], and in recent years the use of sonification in SOCs has been considered. Based onexisting research, the properties afforded by sonification align with some known requirementsof SOCs. In this research, we seek to explore the potential for sonification to aid securitypractitioners in SOCs in carrying out network-security monitoring tasks.
1.1 Motivation
This research is motivated by the need for effective analytical tools for use by security prac-titioners monitoring network security in SOCs, the potential we anticipate for sonification tocomplement those tools currently in use, and the requirement this produces to validate theutility of sonification in this role.
Monitoring Network Security in SOCs
Organisations are frequently targeted by network attacks, which vary widely in motivation,characteristics and scale. The nature of the attacks faced by organisations can vary widely fromransomware to denial-of-service (DoS) attacks to the exfiltration of sensitive data by insiders,for example. Organisations can experience considerable harm as a result of suffering a cyberattack, which may range between economic harm caused by financial loss or market degradation,physical harm to industrial systems, reputational harm resulting in deteriorated customer andbusiness relations, and psychological harm to employees and customers as a result of personaldata breaches, for example [4].
The timely and accurate detection of threats is crucial to maintaining the confidentiality, in-tegrity and availability of network data and functionality. Timely detection of real-time attacks,or of breaches that have occurred, can enable mitigative work, in preventing the attack fromcontinuing, or in constraining its effects — reducing the amount of customer data exfiltrated,or the number of networked machines to which some malware can propagate, for example. Inlarge organisations, this is the function of SOCs, in which security practitioners work, oftenunder high pressure, interacting with a range of security tools to detect and prevent maliciouscomputer activity [163]. The networks of organisations generate big data [128], and one of thekey challenges that SOCs face is the huge volume of data and metadata that can be presenton the network. This consists of both the data created by the day-to-day operations of theenterprise, and the data created by security tools.
1

In the face of a constantly evolving set of threats and attack vectors, and changing businessoperations, there is a constant requirement for effective monitoring tools and methods in SOCsto both automatically and semi-automatically detect attacks. For real-time monitoring, toolsthat present the huge volumes of network data in a form that can be processed in negligible timeare essential [12]. Automated approaches to attack detection are widely used in SOCs to helpsecurity practitioners deal with the volume of attacks. These include intrusion-detection systems(IDSs), network firewalls, and statistical or machine learning-based approaches to anomalydetection [51].
While vital to operations, automated approaches can be inaccurate [84], and automatedapproaches alone cannot be relied on for maintaining organisational cybersecurity. For example,some IDSs can produce up to 99% false-positive alerts, based on events that are not related tosecurity issues [145].
The Role of Security Practitioners
Security practitioners play a vital role in determining inaccuracies in alerting from automatedtools, identifying false-positives and also threats that may have been missed, and interpretingand understanding the network-security state [57] – also referred to as the security postureof the organisation being monitored. Despite advances in the quality of automated tools fornetwork-security monitoring, research into data-presentation techniques for supporting humansecurity practitioners in their monitoring work in SOCs is, and will remain, relevant for a numberof reasons:
• Humans are essential to determining the criticality of an apparent attack, using theirobservations of network activity and of the interpretations made of this activity by thetools they use to assess intent, the likely source of the threat, and the harm consequence forthe organisation. There is a need to apply judgement when deciding on whether and how torespond to an attack, and automated systems currently cannot replicate the function of ahuman in this regard. Ensuring that humans working in SOCs are able to keep as informedas possible, in as many situations as possible, will continue to be vital to operations aslong as humans are involved in making decisions on technical actions and factors affectingthe organisation being monitored.
• Automated approaches are not perfect. This can mean that they are not entirely accuratein attack detection — that they cannot detect certain types of attack, variants of attacks,or unknown attacks that they have not previously been exposed to or trained to detect.It is therefore important to have multiple layers of defence — multiple opportunities fordetecting attacks [86]. Humans can observe the network activity in real time or retrospec-tively, to hunt for anomalous traffic that may have been missed by automated systems.This, in conjunction with the use of other tools, can broaden the opportunity for attackdetection in SOCs and thus strengthen the security posture of an organisation.
• The imperfections of automated approaches at present can also mean that they producelarge numbers of false-positive detections. These numbers can be overwhelming for thehumans working in SOCs, who can in some cases build up multiple alerts that they arerequired to sift through in order to find those which are related to actual security concerns.Triaging huge volumes of security alerts becomes a burden for security practitioners, andkeeping practitioners aware of the network activity, with an understanding of the trafficmoving around the network, is an approach to enabling this decision-making on the validityof events [57].
Thus, the human security practitioner is crucial to the detection and understanding of at-tacks and anomalous network conditions, and must interact with automated systems — deciding
2

the validity of, and acting on, their output [68]. For security practitioners working in SOCs,detecting attacks, and recognising which risks must be prioritised over other attacks and malignactivities is difficult, and the degree of inaccuracy of detection systems can make it even moreso.
The Need For Analytical Tools to Support Security Practitioners
Security practitioners involved in monitoring organisational security require tools to help themengage with and understand not only the outputs of automated threat-detection tools, but alsothe low-level network data (such as packet traffic and network flows). Ongoing research intotechniques for the presentation of security-monitoring data to security practitioners focuses ontext-based presentation and security visualizations, including advanced visualization methodsfor complex network-security data [73, 138]. Text-based interfaces and security visualizationsare widely used in SOCs to present information about the data travelling through the network,in conjunction with the outputs generated by automated systems [58, 73].
A shortcoming of existing text-based and visualization-based network-monitoring systems isthe requirement that operators dedicate their full attention to the display in order to ensure thatno information is missed (for real-time monitoring especially) which can restrict their abilityto perform other tasks [94]. Furthermore, the number of visual dimensions and properties ontowhich data can be mapped is limited [147], and the presentation of large amounts of informationvisually may put strain on the visual capacity of security practitioners.
The Potential for Sonification
Based on these shortcomings in existing monitoring practice, we believe that sonification mayhave the potential to improve monitoring capabilities in SOCs, in a number of ways. Priorexperimental work in sonification has shown the technique is useful in, for example, monitoringelectroencephalogram (EEG) data [99], and exploring astrophysical datasets [48]. A body ofresearch exists into the design and use of sonification for monitoring processes, exploring data,and alerting on particular events [101]. Over the last two decades, progress has been made indeveloping novel sonification systems to further support network-security monitoring tasks. Ithas been reported by researchers that some developed sonifications of network traffic signalledabnormal network conditions and attacks.
Sonification could be an extra interface that requires humans to use their sense of hearingrather than vision. It is important to design representations of large volumes of network datathat are as easy as possible for security practitioners to use, understand and act on. Usingsound offers another set of dimensions in addition to visual dimensions onto which data can bemapped. The addition of sonification to existing visualization-based or text-based data presen-tation approaches could provide a usable method of monitoring highly complex, multivariatenetwork data.
Articles exploring the sonification of network-security data indicate its promise as a tech-nique for attack detection [13], improved methods for which are critical to SOCs. Humans havestrong pattern-recognition capabilities using sound [19], and sonifying network data may there-fore enable network-anomaly detection by listening security practitioners. We aim to explorethe potential for sonification to enable humans to detect patterns, recognise anomalous activityand prioritise risks. A potential advantage of using sonification in this context is that it has beenshown to be an effective medium for peripheral listening. This means that, if designed correctly,sonification could enable practitioners to monitor the network-security state as a non-primarytask, peripherally, whilst performing other main tasks. This could be useful to practitioners inbusy SOCs [11].
3

The Gap that Motivates this Research
Sonification could provide a potential solution to some of the challenges faced by security prac-titioners in SOCs. The use of sonification systems in this context has not been sufficientlyvalidated, however, and there is a lack of uptake in SOCs. Furthermore, little guidance existson design requirements for the sonification of network data. Based on the current state of theart, there are clear needs for further research and testing to validate the utility of sonificationsystems for efficient network monitoring, and to develop appropriate and effective sonificationdesigns to enhance network-security monitoring capabilities.
The research presented in this thesis aims to address these needs, by contributing to researchinto using sonification to present security-monitoring data to humans working in SOCs, as anapproach to facilitating attack detection and awareness of the network-security state. We aim todesign sonification systems appropriate for use in this context, and explore the extent to whichsuch systems could aid in the monitoring work of security practitioners. The anticipated resultof the research is evidence of the role sonification could play as an approach to network-securitymonitoring in SOCs.
1.2 Problem Statement and Research Aims
Based on evidence of the utility of sonification for applications integral to working practice inSOCs, there is potential for sonification to complement the existing monitoring setup in SOCsas an additional security tool. Figure 1.1 shows the existing relationship between low-levelnetwork data, anomaly-detection techniques, network-monitoring appliances such as IDSs, anddata-presentation techniques, and the position we envisage sonification might take in this setup.Figure 1.1 shows two approaches to sonifying network-security monitoring data. In Approach 1,the low-level network data (unparsed logs of the network activity, such as packet traffic, networkflows, and server activity, for example) is represented in the sonification — perhaps with somescaling or sampling methods applied. In Approach 2, the network data is not sonified in itslow-level form but is subject to some automated detection procedure prior to sonification. Thiseither means that the output of some network-monitoring appliance — an IDS, for example —is sonified, or that there is some detection algorithm involved in the sonification method itselfprior to the rendering of the data as sound. In this research, we begin by exploring Approach1, directly sonifying network packet captures. Later in the research, we incorporate Approach2, exploring the sonification of the alerts produced by automated systems.
Low-levelnetworkdata
Sonification
Visualization ortext-based pre-sentation
Anomaly detection
IDS
Firewall
Network-monitoringappliances
Approach 1
Approach 2
Figure 1.1: A summary of the existing relationship between traditional monitoring techniquesand their potential relationship with sonification systems in SOCs
4

The aim of this research project is to explore the potential for sonification to aid in SOCpractice. We pose four main research questions, described below, with the aim of investi-gating this question. RQ4 is the overarching research question, which it is the main aim of thisthesis to explore. The other three research questions are constructed to contribute to address-ing RQ4. The relationships between the research questions are illustrated in Figure 1.2. Theresearch questions below are listed in the order in which they are addressed in this thesis.
RQ1 Is sonification viable as an approach to communicating network-security monitoring in-formation to human listeners?
RQ2 In which contexts of use could the sonification of network-security data aid securitypractitioners in their network-security monitoring tasks?
RQ3 What are the design requirements for sonifications of network-security data that wouldbe appropriate and helpful for security practitioners to use in SOCs?
RQ4 To what extent do sonification systems prove useful to security practitioners when carryingout security-monitoring tasks?
Initially, we consider the sonification of network-security data from a theoretical perspective,selecting monitoring approaches and formalising a model for mapping relevant network-securitydata to sound. We then assess the viability of our sonification approach for representing network-security information, by testing the effectiveness of a network-packet sonification prototype(Approach 1 in Figure 1.1) for signalling abnormal network conditions (RQ1).
Exploring how viable it is to represent the data types in question, with a view to signallinginformation relevant to network-security monitoring (in particular, attacks), is an importantinitial step in this research. If the information signalled can be reliably interpreted by humans,then sonification could be a promising approach for use as a complementary tool to other SOCtools. The layering of multiple different detection approaches is important for ensuring that allpossible security concerns are covered [86]. In order to enable humans working in SOCs to actas one of these “layers”, it is valuable to keep humans presented with and aware of as muchof the relevant network-security activity as possible. We then turn our attention to identifyingappropriate designs for sonification in this setting, and to exploring whether, in addition tobeing a complementary tool, it can offer any additional advantages over existing approaches.
After making this assessment of the viability of this approach to presenting network-securityinformation to humans, we gather user requirements through interviews with security practi-tioners (RQ2). Through these interviews, we aim to understand and refine contexts of use forsonification in real-world SOCs, to extract capabilities that sonification systems would ideallyenable for security practitioners. We also aim to identify potential challenges to integrationand the design requirements that should be met in order to develop systems that would beappropriate to, and useful in, this setting.
We detail these design requirements and consider approaches to addressing them, with aview to developing a system that matches the requirements of SOCs (RQ3). The potentialutility of sonifying the alerts produced by automated systems was highlighted in the interviewswith security practitioners, for example (Chapter 7); we therefore incorporated alert sonificationinto the sonification system used in the later stages of the thesis (Approach 2 in Figure 1.1).
We explore the effectiveness of the developed system in the contexts of use highlighted in theinterviews with security practitioners (RQ4). In this way, we contribute an assessment of thepotential utility of sonification to SOCs, of suitable design strategies for the setting, and of theextent to which these types of technology could be appropriate for use in the SOC environment.
5

Is sonification aviable approachto representing
network-securitymonitoring infor-mation? (RQ1)
Attack detec-tion: accuracy,
efficiency
Communicatingnetworkactivity
Is that usefulto SOCs? Why,
and in whichcontexts? (RQ2)
What could itenable users todo? (use cases)
How can it com-plement existing
SOC setups?
How shouldsonification systemsbe designed for usein SOCs? (RQ3)
What fea-tures shouldsonificationtools have?
What arethe SOC-
specific designrequirements?
To what extentdoes sonificationprove useful to
SOC tasks? (RQ4)
Can it enablethe targetedcapabilities?
How well doessonification in-tegrate into the
SOC environment?
Figure 1.2: Map of research questions
RQ 1: is sonification viable as an approach to communicating network-securitymonitoring information to human listeners?
This question explores the viability of using sonification as an approach to representing infor-mation relevant to network-security monitoring. The information we focus on is network attacksof different types and sizes, and the amount and distributions of traffic on the network.
We aim to first address this question from a theoretical perspective, considering the typesof network-security monitoring information that are within scope, and potential approaches torepresenting that information sonically. We then aim to assess experimentally both whethernetwork attacks can be detected (their presence recognised) as deviations in the sounds pro-duced by a sonification prototype, and whether these conditions can be identified (their natureunderstood) by listening to the sonification.
6

This question should be addressed in one of the first research studies, to give insight intothe potential for sonification to signal this type of information for network-security monitoring.This will provide a foundation on which sonification design questions, contexts for the use ofsonification in SOCs, and effectiveness studies with end-users, can be built. We address thisresearch question in Chapter 6.
RQ 2: in which contexts of use could the sonification of network-security dataaid security practitioners in their network-security monitoring tasks?
We explore use cases in which sonification has the potential to aid in network-security monitor-ing tasks in SOCs. This research question is focused on extracting the views of the end-users(security practitioners working in SOCs) on the potential utility of the approach, and on re-quirements for its integration into the environment in which they work.
For each potential use case, the research question can be divided into a number of constituentparts.
1. Is the use case realistic: does it describe a process that security practitioners are actuallyrequired to perform as part of their network-security monitoring work?
2. What are the current methods or tools used by security practitioners to carry out theprocesses described in the use case?
3. What are the shortcomings of the methods currently used to carry out these processes?
4. How could sonification alleviate any difficulties that these shortcomings cause securitypractitioners carrying out network-security monitoring work?
Addressing this research question is the focus of Chapter 7. By addressing these questions,we aim to construct a set of realistic cases in which network-monitoring tasks in SOCs could beaided by using sonification systems, based on the properties that sonification offers in theory.We will then aim to assess the extent to which our sonification approach actually aids in theseuse cases in RQ4.
RQ 3: what are the design requirements for sonifications of network-securitydata that would be appropriate and helpful for security practitioners to usein SOCs?
We aim to explore design strategies for producing sonifications that are appropriate for usein SOCs, and have the potential to aid in real-world network-security monitoring tasks. To beappropriate for use in SOCs, sonification systems should integrate with existing SOC practice ina way that users deem appropriate. Developing designs that integrate with SOCs appropriatelywill involve drawing on design and integration requirements gathered from information providedby the end-users themselves.
We also aim to explore methods of designing systems that sonify pertinent security-monitoringinformation effectively. The question of which data types should be sonified for the contexts ofuse we target in SOCs, and of effective ways of sonifying this information, will be addressedhere. Focus will also be placed on the sonification system as a practical tool for security practi-tioners to use. This means identifying the tool features that should be provided that are usefulin SOCs, and exploring methods of providing these features.
We address this research question in Chapter 7, and our findings inform the sonificationsystem developed in Chapter 8 for the study reported in Chapters 8 and 9.
7

RQ 4: to what extent do sonification systems prove useful to security practi-tioners when carrying out security-monitoring tasks?
This question is concerned with the effectiveness of the developed sonification approach whenused by security practitioners in the targeted contexts of use for SOCs. This means experimentalassessment of the extent to which users are able to use the sonification to aid in a set of realisticmonitoring use cases. This research question also focuses on the views of security practitioners,both on using the sonification system in the study tasks, and on its utility and appropriatenessfor the SOC environment from a qualitative perspective.
For each targeted context of use, we will devise experimental strategies for assessing theeffectiveness of the sonification system. Ensuring that this testing is as realistic and unbiasedas possible is essential. Addressing this research question is the focus of Chapters 8 and 9.
1.3 Research Scope
In the following points, we present the reasoning behind our decisions to scope certain aspectsof this research.
• The research focuses on the application of sonification to network-security monitoring inSOCs specifically. The incorporation of sonification into other security-monitoring appli-cations may also be worth exploring — for example, monitoring the security of devicesand interactions in Internet of Things (IoT) networks such as smart homes, or enablingusers to monitor the security of their single personal devices (such as smart phones) bylistening. In this research, however, the application environment is SOCs, and we aim toexplore the utility of sonification in this particular environment in depth, deriving require-ments from, and evaluating the system with, end users (security practitioners working inSOCs).
• We focus initially on the use of parameter-mapping sonification to represent low-level network traffic (network packets in particular), assessing the viability of a pro-totype sonification of this data in Chapter 6. Other sources of monitoring information,such as logs of activity at machines on the network, might eventually be incorporated intonetwork sonification systems, and we include such sources when developing the sonifica-tion model (Chapter 5) to facilitate this. Focusing on packet traffic for the majority ofthe research reported in this thesis allowed us to explore a smaller scope in greater depth,with principles derived that could be applied to further monitoring sources (for example,the findings in the design experiments with regard to the parameter-mapping of packettraffic rates might also be applied to the parameter-mapping of machine CPU activity,since both are representations of levels of activity).
Approaches to this direct sonification of low-level network traffic are represented as Ap-proach 1 in Figure 1.1, and reports made in prior literature of research taking this approachare reviewed in the category Approach 1 in Section 3.1. In the later chapters of this thesis(Chapters 7 and 8), we also explore the use of sonification for representing network-security alerts (Approach 2 in Figure 1.1, prior approaches to which are reviewed underApproach 2 in Section 3.1), based on feedback from security practitioners (our designrequirements derived from the interviews in Chapter 7 included the addition of sonifiedalerting information). Since both low-level network traffic and network-security alerts areused at varying stages of the thesis, we review relevant background and related work onboth in Chapters 2 and 3.
• We carry out this research using sonification systems with a musical aesthetic. Despitethis choice, many of the results of the thesis — such as the contexts in which sonification
8

might be used in SOCs — may be applicable to sonification systems more broadly. Weelect to use systems with a musical aesthetic in the research we report, although thereexists research into other sonification aesthetics that may also be appropriate for use insuch research, such as the natural and real-world sound mappings used in proposals forsome network-sonification systems previously [87]. There has not been any comparison ofthese approaches for the network-security monitoring context, so our selection of aestheticcannot be informed by this. There are two main reasons why we believe sonificationsystems with a musical design are likely to be appropriate for this research topic.
Firstly, previous work in sonification has shown that users report finding sonificationsystems “fatiguing” when exposed to them over an extended period of time [119, 131]. Itis important that we minimise this effect, given that our aim is to produce systems thatare suitable for use in SOCs. In general, music is intended to be aesthetically pleasing, andthere is much work in designing music that is unobtrusive (deliberate efforts to composebackground music, for example). Music is a paradigm we can draw on, in theory, to producesound designs that are aesthetically pleasing and unobtrusive, with the aim of producingsonification systems that address the problem of the “fatigue” experienced by listeners,and are more likely to be suitable for the application targeted.
Secondly, the musical canon contains a usable set of recognised sonic patterns. Musicalpatterns are implicitly learned, and we anticipate leveraging the cognitive structures ac-quired by humans over many years of exposure to music, and drawing on these structuresand the associations made with them in order to create effective systems. Using a baseidea of associating the network “normal” with “musical” sounds, we aim to signal thenetwork “abnormal” by creating strongly recognisable departures from this “music”, thatcan be recognised by listeners (for example, the harmonic structures that underlie muchWestern music are recognisable following lifelong exposure to them).
1.4 Thesis Structure
This thesis is structured as follows, with the aim of addressing the research questions presented.In Chapter 2 we present the background information relevant to this research: methods ofmonitoring network traffic; SOCs and their use of traditional network-security monitoring tech-niques; guidelines for and approaches to designing sonification systems; and relevant researchmethods.
We then present a review of related literature in Chapter 3, focusing on the application ofsonification to network-security monitoring specifically. Based on this review of the state of theart, we identify outstanding challenges that are not comprehensively addressed in prior work.Our aim in constructing the research approach and methodology presented in Chapter 4 is toaddress these outstanding challenges through a number of research studies, in order to furtherknowledge in this field.
In Chapter 5 we address the problem of sonifying network data from a theoretical perspec-tive, presenting a model developed to enable such transformations. This model underpins thesonification designs used throughout the rest of the thesis. In Chapter 6 we address RQ1. Here,we explore the question of viability experimentally, assessing the effectiveness of a sonificationprototype developed using the model for signalling network-security information to humans.
We address RQ2 in Chapter 7, conducting an online survey and interviews with securitypractitioners working in SOCs in order to identify contexts of use in which sonification has thepotential to aid in SOC working practice. RQ3 is also addressed in Chapter 7: we derive inte-gration and design requirements, which inform our research into designing sonification systemsappropriate for use in SOCs. We present the sonification design requirements for SOCs derivedin the interviews, and demonstrate approaches to addressing them.
9

Finally, in Chapters 8 and 9, we address RQ4. In these chapters, we assess the utility ofthe developed sonification system in a set of contexts of use for SOCs (contexts derived in theinterviews reported in Chapter 7), through a user study with security pracititioners workingin SOCs. We also examine, and gather the views of security practitioners on, the potential forsuch technologies to integrate into real-world SOC settings. We present the sonification systemdesign and study design in Chapter 8, and the results of the study are reported and discussedin Chapter 9.
1.5 Publications
We present the research published during the course of this DPhil that relates to the contentof this thesis, and link it to the relevant chapters.
Five articles that relate to the DPhil topic have been published:
• L. Axon, S. Creese, M. Goldsmith, J. R. C. Nurse, Reflecting on the use of sonification fornetwork monitoring, Proceedings of the International Conference on Emerging SecurityInformation, Systems and Technologies (IARIA SECURWARE), 2016 (Best Paper Award)(this publication forms the basis of Chapter 3)
• L. Axon, J. R. C. Nurse, M. Goldsmith and S. Creese, A formalised approach to designingsonification systems for network-security monitoring, International Journal on Advancesin Security, vol. 10 no. 1&2, 2017 (this publication forms the basis of Chapter 5)
• L. Axon, B. Alahmadi, J. R. C. Nurse, M. Goldsmith and S. Creese, Sonification insecurity operations centres: what do security practitioners think?, in Proceedings of theWorkshop on Usable Security (USEC) at the Symposium on Network and DistributedSystems Security (NDSS), 2018 (Best Paper Award) (this publication forms the basis ofChapter 7)
• L. Axon, M. Goldsmith and S. Creese, Sonification mappings: estimating effectiveness,polarities and scaling in an online experiment, Journal of the Audio Engineering Society,vol. 66 no. 12, pp. 1016-1032, 2018 (this publication forms the basis of Appendix E)
• L. Axon, J. Happa, M. Goldsmith and S. Creese, Hearing attacks in network data: aneffectiveness study, Computers & Security, vol. 83, pp. 367-388, 2019 (this submissionforms the basis of Chapter 6)
One article is currently under journal review:
• L. Axon, M. Goldsmith and S. Creese, Sonification to support the monitoring tasks of secu-rity operations centres, under journal review (this submission forms the basis of Chapters8 and 9)
All publications, and submissions currently under review, are presented in Table 1.1, withmy contribution to papers with multiple authors described.
10

Table 1.1: Publications, submissions, and contributions of authors
Venue Publication/Submission My Contribution
Proceedings of the International Conferenceon Emerging Security Information, Systemsand Technologies (IARIA SECURWARE),2016 (Best Paper Award)
Conference paper: L. Axon, S. Creese, M.Goldsmith, J. R. C. Nurse, Reflecting on the use ofsonification for network monitoring (this paperforms the basis of Chapter 3)
I was the first author of this paper, and wasresponsible for the research reported and forwriting the paper, with contributions from theother authors
International Journal on Advances in Security,vol. 10 no. 1&2, 2017
Journal article: L. Axon, J. R. C. Nurse, M.Goldsmith and S. Creese, A formalised approach todesigning sonification systems for network-securitymonitoring (this forms the basis of Chapter 5)
I was the first author of this article, and wasresponsible for the research reported and forwriting the paper, with contributions from theother authors
Proceedings of the Workshop on UsableSecurity (USEC) at the Symposium onNetwork and Distributed Systems Security(NDSS), 2018 (Best Paper Award)
Workshop paper: L. Axon, B. Alahmadi, J. R. C.Nurse, M. Goldsmith and S. Creese, Sonification insecurity operations centres: what do securitypractitioners think? (this paper forms the basis ofChapter 7)
I was the first author of this paper, and wasresponsible for writing the paper, withcontributions from the other authors. Theinterviews reported were part of a wider set ofinterviews carried out jointly with another author(Bushra Alahmadi); the questions relating to thispaper were devised, asked, and analysed by myself
Journal of the Audio Engineering Society, vol.66 no. 12, pp. 1016-1032, 2018
Journal article: L. Axon, M. Goldsmith and S.Creese, Sonification mappings: estimatingeffectiveness, polarities and scaling in an onlineexperiment (this forms the basis of Appendix E)
I was the first author of this article, and wasresponsible for the research reported and forwriting the paper, with contributions from theother authors
Computers & Security vol. 83, pp. 367-388 L. Axon, J. Happa, M. Goldsmith and S. Creese,Hearing attacks in network data: an effectivenessstudy (this forms the basis of Chapter 6)
I was the first author of this article, and wasresponsible for the research reported and forwriting the paper, with contributions from theother authors
Under journal review L. Axon, M. Goldsmith and S. Creese, Sonificationto support the monitoring tasks of securityoperations centres (this submission forms the basisof Chapters 8 and 9)
I was the first author of this article, and wasresponsible for the research reported and forwriting the paper, with contributions from theother authors
11

Chapter 2
Background
We review background in areas relevant to this thesis: monitoring network traffic, existingapproaches to network-security monitoring in SOCs, sonification approaches and research, andrelevant research in the field of Human-Computer Interaction (HCI). Existing literature directlyrelated to our research — prior literature exploring the use of sonification for network-securitymonitoring — is then reviewed in Chapter 3. The ways in which the methodology followed inthe research presented in this thesis drew on the background and existing research presented inthe current chapter is explained in Chapter 4.
2.1 Monitoring Network Traffic
Computer networks may take a range of forms: business and home networks, wireless and mobilenetworks. Networks can vary in size according to their application. Local area networks (LANs)span individual homes or organisations. Metropolitan area networks (MANs) cover whole cities,and wide area networks (WANs) span countries and continents [168]. LANs are generally used inbusinesses to connect machines for resource sharing. In addition, businesses usually use wirelessnetworks (wireless LANs).
The packets moving through the network from a source to a destination address createnetwork traffic, which can be captured for observation as part of cybersecurity procedure, orto provide information on issues such as network or system performance. Network traffic isgenerally captured as individual data packets, or as traffic flows (sequences of packets fromsource to destination addresses). There are a number of approaches to monitoring networkactivity. For LANs, sources of direct information about the low-level network traffic (directtraffic data) are packet captures (PCAPs produced by Wireshark, for example), Netflow andSflow (captures of traffic flows), and logs of activity at network resources (hosts and servers,for example). The information outputted by security tools (security tool data) such as IDSs canalso be monitored.
• Direct traffic data:
– Packet captures (PCAPs): PCAPs present individual packets travelling through thenetwork. Both the header and payload information of each packet is representedin PCAPs. Packet headers contain the following information: time of transmis-sion; source (IP/port); destination (IP/port); protocol/application; packet size. Thepacket contents also capture information about the data contained within the packet.
– Netflow/Sflow: flows are sequences of packets sent over the same connection fromsource to destination computers. Tools for capturing flows include Netflow, used forCisco routers; and Sflow, which can be used for other routers. These tools collectinformation on network flows, and present the following aspects of it: time of flow
12

start; flow duration; protocol; source (IP/port); destination (IP/port); number ofpackets; bytes.
– Resource activity logs: information can be logged about activity at hosts and serverson the network. The information logged, that can be used in network-security mon-itoring, includes authentication attempts, errors generated, and access to resources.
• Security tool data:
– IDS logs: IDS logs present the security events detected by IDSs. The informationusually presented in logs includes the type of event detected (a particular type ofattack, for example), the priority of the event (a value, usually numerical, describingthe priority with which the event should be treated), and information about thetraffic to which the event relates. This includes the time at which the traffic wasobserved, its source and destination, the protocol it used, and its attributes (forexample, the sequence number for TCP packets).
– Firewall logs: network traffic reaching the firewall is logged in firewall logs. This in-cludes packet information (source and destination IP addresses and ports, protocols)and also includes the packets or connections that are blocked by the firewall (andso do not reach the internal network).
Host
Host
Host
Host
Switch
Host
Host
Host
Host
Switch
Router Firewall
Firewall
Internet
Server(e.g.web)
WirelessWirelesslaptop
Wirelesslaptop
Monitoringinternalnetwork
traffic (B)(anywhere
insidefirewall)
Monitoringtraffic
externalto the
network(outsidefirewall)
(A)Monitoringserver logs
Monitoringhost logs
Monitoringwirelesstraffic
Figure 2.1: Monitoring network traffic on a local area network (LAN)
Figure 2.1 shows the types of network monitoring that are possible on LANs. By monitoringnetwork traffic at different points on a network, different types of information can be gathered.
13

Monitoring traffic outside the firewall (point A in Figure 2.1), affords a view of the traffic beingsent from the Internet towards the network, that may then be stopped by the firewall andtherefore not be captured by monitoring inside the firewall only. Monitoring outside the firewalldoes not capture traffic that is only internal to the network (i.e., that is sent from one networkmachine to another). Monitoring inside the firewall (point B in Figure 2.1) affords a view ofthe traffic that has actually passed the firewall and reached the network, as well as the trafficthat is only internal to the network (i.e., that is sent from one network machine to another).
2.2 Network-Security Monitoring in SOCs
The research presented in this thesis is motivated by the monitoring work carried out in SOCs,and its importance to preventing various types and levels of harm to organisations, as explainedin Section 1.1. In this section, we describe the approaches taken to network-security monitoringin SOCs, focusing on the use of tools and roles of security practitioners. This information wasof particular importance to the research we present in the later stages of this thesis: to theproposal of use cases for sonification in SOCs in Chapter 7, and to the development of thestudy we report in Chapters 8 and 9, in which we aimed to explore the potential for sonificationto aid in SOC tasks.
The objective of a SOC is primarily to mitigate cybersecurity threats towards the organisa-tions for which they are responsible [166]. Internal SOCs are responsible for the organisationsthey are placed within, and usually operate from a space physically within that organisation,focusing on monitoring the security of its networks. Multitenanted SOCs are responsible formonitoring network security on behalf of multiple client organisations. This type of SOC isusually positioned away from the organisations for which it is responsible, and provides securitymonitoring as a service. We explore the utility of sonification to both internal and multitenantedSOCs in this thesis, and explore key differences between the two with regard to the use of soni-fication.
Figure 2.2: A SOC (United States Air Force photo) [5]
Throughout this thesis, we use the terms “security practitioner” or “SOC practitioner” todenote a person who works in a SOC (an analyst, engineer, or manager). The role of security
14

analysts can include preliminary detection, triage of events, and responding to customer tickets.Security engineers are also responsible for maintaining infrastructure, configuring monitoringtools, and creating detection rules, for example. Figure 2.2 is an example of a SOC, with securitydata presented to security practitioners on computer monitors. Practitioners often work withmultiple monitors, positioned on their desks and around the SOC [164]. The figure shows theuse of large screens positioned on the walls, for example, to present monitoring information tomultiple practitioners.
SOCs often operate for 24 hours a day, with practitioners required to work long shifts,including night shifts, looking at multiple screens for extended time periods. The resultingpressure and demanding nature of SOC work have been highlighted in HCI research [163, 164](reviewing approaches to such research is the sole focus of Section 2.4.3). Pressure arises from theconstant possibility of malicious attacker activity. Timeliness in the detection of such activity isof paramount importance to maintaining organisational network security. Threats to the networkmust be recognised quickly, and dealt with in a way matching the needs of the organisation, inorder to minimise the damage they cause.
Security practitioners working in SOCs interact with a range of automated tools to detectand mitigate malicious network activity. In Section 2.2.1, we provide a review of the types ofautomated detection tools used in SOCs. Security Information and Event Management (SIEM)tools are widely used to present the information produced by these automated detection toolsto security practitioners, and we review such data-presentation approaches in Section 2.2.2.
2.2.1 Automated Detection Tools
We review the automated security tools used in SOCs. IDSs use signature- or anomaly-basedapproaches to detect malicious computer activity. Intrusion-prevention systems (IPSs) auto-mate the prevention of detected threats, and firewalls block potentially malicious traffic fromreaching the network. Anomaly-detection systems using statistics or machine learning to detectabnormal behaviour are increasingly used and researched [35]. Alerts are produced by theseautomated systems, detailing the presence and types of activity detected. This data is oftencollated in integrated SIEM solutions [164] (we describe SIEM tools further in Section 2.2.2).Below, we focus primarily on detection systems (in particular, IDSs and anomaly detection),rather than preventative measures (IPSs and firewalls), since threat detection, rather than au-tomated prevention, is the focus of this thesis.
Network-security monitoring is largely based on alerts given by IDSs. Many IDSs have beenbased on Denning’s model [64], which used statistical models and metrics, and rules for acquiringknowledge about behaviour, to detect abnormal patterns of system usage from audit logs. Ingeneral, there are two types of IDS. Anomaly-based IDSs monitor network traffic, and compare itagainst an established baseline (based on bandwidth, protocols, ports, devices, and connectionsthat are “normal” for the network). Signature-based IDSs, on the other hand, compare packetsmonitored on the network against a database of signatures or attributes from known maliciousthreats [84].
While a number of widely used manufacturers (Snort, Bro, and Suricata, for example) takeslightly varied approaches to developing signature-based IDSs, the basic concept is the same.1,2,3
Signatures describing the characteristics of activity that should be alerted on are defined, suchthat if activity matching these signatures is observed on the network, alerts relating to theactivity are produced by the IDS. The communities of IDS users often produce standard setsof signatures that can be used to capture general malicious activity.4 Leading SOCs typicallycraft bespoke signatures, defined by security practitioners in the form of rules, in order to alert
1https://www.snort.org/2https://www.bro.org/3https://suricata-ids.org/4The Snort 3 Community Ruleset is available at https://www.snort.org/, for example.
15

on network activity of concern to their particular organisations. Below, we illustrate the use ofsignatures in signature-based IDSs, by presenting an example of a signature format for SnortNetwork IDS. Snort is an open-source network IDS for UNIX derivatives and Windows, and isamongst the most widely used signature-based IDSs. We used Snort IDS to generate the alertsrepresented later in this thesis (in Chapters 8 and 9).
alert icmp any any -> $HOME NET any (msg: "ICMP event";
sid: 1000015; classtype: icmp-event;)
The above is a signature that creates an alert if traffic is sent from any source IP addressand port over ICMP to any port on the defined home network (“HOME NET”). This signature,if matched, would generate an alert with message “ICMP event”, Snort rule ID 1000015, andwould be associated with the pre-defined Snort rule category “icmp-event”.
Another technique used for the detection of malicious traffic by IDSs is anomaly detection.Anomaly-detection techniques detect changes in systems that may indicate the presence ofthreat, and may as such be of interest from a monitoring perspective. In contrast with signature-based detection, which relies on comparison with known attack signatures, in anomaly detection,the state of the network is monitored and compared with a “normal” baseline. Anomalousactivity is that which exceeds an acceptable threshold difference from this baseline. Anomalydetection often informs the output of IDSs and visualizations. There are several reports reflectingon the state of the art in anomaly-detection techniques [51, 84, 122].
In general, we can divide anomaly-detection methods into three categories [84, 121]: detectionmethods based on statistics, in which values are compared against a defined acceptable rangefor deviation [65, 192]; detection methods based on Knowledge Systems, in which the currentactivity of the system is compared against a rule-based “normal” activity [6]; and detectionmethods based on machine learning. The latter are automated methods in which systems learnabout activities and detect whether these are anomalous through supervised or unsupervisedlearning [122, 155, 170].
Anomaly-detection techniques based on machine learning are in theory suitable for findingnovel attacks — those which have characteristics similar to attacks previously seen, but donot match exact characteristics that can be prescribed beforehand in the form of signatures (assignature-based detection requires) [155]. The machine learning approaches researched and usedinclude fuzzy logic, genetic algorithms, Bayesian networks, and neural networks [112, 155]. Hy-brid approaches to anomaly detection combine signature-based detection with machine learning.
There are certain drawbacks to current approaches to the monitoring and analysis of securitydata. Existing automated techniques can be unreliable or inaccurate. Signature-based IDSs maysuffer from poorly defined signatures, and are limited to detecting only those attacks for whichsignatures are known. The algorithms underlying anomaly-detection techniques using statisticsor machine learning also produce false-positive and false-negative attack detections [10, 84].There is, therefore, a requirement to identify improved anomaly-detection methods, and this isan area of continuing research.
2.2.2 Data-Presentation Approaches and SIEM Tools
The role of data-presentation techniques in SOCs is to convey network-security monitoringinformation to security practitioners. It is important that security practitioners are presentedwith network-security information, such that they are best able to detect anomalies that donot fit automated detection profiles, and to triage machine-based detection inaccuracies [68].The provision of effective techniques for conveying network-security monitoring information tohumans is important for SOCs, and an area of continuing academic research [195]. Securityvisualizations and text-based interfaces present automated system (e.g., IDS) output, as wellas unparsed network packets, which can enable security practitioners to recognise anomalousactivity [40].
16

In practice, the various presentations of network-security data are often integrated into asingle SIEM tool, which is the core tool used by security practitioners in their monitoring work.SIEMs are used to collect the information pertinent to network-security monitoring from varioussources such as network traffic and flow logs, host, server and firewall logs, and the output ofautomated detection tools. SIEMs store this data, make correlations between the data sources,and present the resulting information in a format comprehensible by security practitioners [33].
A key class of information conveyed by SIEM tools is the output of automated detectiontools such as IDSs (which were described in the previous section). Such information may bedisplayed in text-based formats such as tables, streams of alerting information, and command-line interfaces. Visualizations such as time series and other plots can be used to highlight trendsin alerting information, or present summaries of it. Visualizations generally work by mappingnetwork data parameters to visual parameters, such that analysts can observe the changes in thevisualization presented and from this deduce changes in, and information about, the network.The design of effective visualizations involves identifying mappings that represent the data in away that can be understood by security practitioners, without inducing cognitive overload, andcan convey clearly information pertaining to the security of the network [150].
As well as alerting information, security visualizations can present information about thelow-level network data. This low-level network data may also be presented in text-based formatssuch as tables. There are a number of recent surveys of approaches to visualizing complexnetwork data. Zhang et al. [195] and Etoty and Erbacher [73] presented reviews reportingresearch into improving graphical-layout and user-interaction techniques. As part of ongoingresearch into improving the accuracy of automated anomaly-detection methods, one avenuethat has been researched in security-visualization work is the detection of anomalies by humansobserving aspects of the low-level network data [138].
SIEM manufacturers have produced sample SIEM dashboards to demonstrate the types ofdata representation available, and possible setups of their SIEM tools for network-security mon-itoring purposes. The sample dashboards produced for a range of SIEM tools were presented inan online article [53]. The SIEM tools represented here were LogRhythm; Sentinel and SecurityManager (NetIQ); Enterprise Security Manager (McAfee); Q1 Labs (IBM); and ArcSight (HP).56,7,8,9
Figure 2.3 shows the sample McAfee SIEM dashboard presented in that online article. Weincluded this figure to illustrate the types of data presentation that might be included in a SIEMtool, although gaining access to information on the actual SIEM setups used by operationalSOCs was not feasible within the scope of this background review. The dashboard includesalerting information such as a table and time series of network events and their severity, aswell as lower-level information on network flows (in the top right, a plot of flow source anddestination, for example). In Chapter 8, we used such example SIEM dashboards to informthe development of the SIEM used in the study reported. The way in which this backgroundinformed the design process is detailed in Section 8.2.1.
Based on a review of the use of SIEM tools in SOCs, and related challenges, Bhatt, Manad-hata and Zomlot summarised their views on the role SIEMs can play in SOC work, in relationto the work carried out by security practitioners [33, p. 40].
We believe that SIEM systems will never reach the maturity level needed to replacehuman analysts in SOCs. At best, they’ll be tools in analysts’ and network ad-ministrators’ decision-making processes. Hence, SIEM systems face the challenge of
5https://logrhythm.com6https://www.netiq.com7https://www.mcafee.com/enterprise/en-us/products/enterprise-security-manager.html#vt=
vtab-Overview8https://www.ibm.com/us-en/marketplace9https://software.microfocus.com/en-us/solutions/enterprise-security#
17

Figure 2.3: Sample McAfee SIEM dashboard (as presented in an online article [53])
summarizing analysis results and presenting them so that humans can make more ef-fective and efficient decisions, for instance, identifying a new attack or deciding whichsecurity alerts to respond to. SIEM systems must develop visualization techniquesthat aid humans in gathering information from large quantities of data, providecontext information in a timely manner, and work at different organizational levels,such as system administrator and higher-level management.
This summary highlights that the utility of SIEM tools and the automated approaches thatfeed them may not lie in making decisions, or acting alone in the mitigation of network threats(such that they might eventually act independently of human practitioners). Rather, the role ofSIEM tools is to optimise the efficacy of security practitioners, by providing information criticalto their network-security monitoring work in a comprehensible and usable way. Alongside theSIEM, security practitioners may also use other individual tools. This includes, for example,the use of low-level views of the packets captured on the network by tools such as Wireshark[164].10
2.3 Sonification: a Background
We review various aspects of existing sonification research: guidelines for and approaches to soni-fication design; applications of sonification in prior work; aesthetic sonification and musification;psychological factors affecting the use of sonification; and guidance on using and experimentingwith mappings from data to sound.
Sonification is the presentation of data in a sonic form — generally a non-speech form (theterm “auditory display” refers to a wider field that also encompasses speech-based sonic presen-tation). Kramer et al. defined sonification in the Sonification Report, prepared by researchersat the 1999 International Conference on Auditory Display (ICAD) to present the status of thefield [120].
10https://www.wireshark.org/
18

... sonification is the transformation of data relations into perceived relations in anacoustic signal for the purposes of facilitating communication or interpretation.
De Campo presented working definitions highlighting the difference between auditory infor-mation display and data sonification, which are both presented as subspecies of auditory display[60]. While auditory information display is described as representing well-known information assound, and includes speech messages at airports and auditory feedback sounds on computers,sonification represents information the value of which is often unknown beforehand. For real-time network monitoring, therefore, sonification describes the appropriate approach to the sonicrepresentation of data, as we look to represent previously unknown information on processes asthey occur.
2.3.1 Sonification Approaches, Models and Guidance
Throughout sonification literature, approaches are divided into three groups: event-based sonifi-cation, parameter-mapping sonification, and model-based sonification. De Campo outlined thesegroupings in [60].
1. Event-based sonification. These are sonifications based on simple triggering: alerts andalarms triggered by recognised events. Numerous techniques for event-based sonificationare listed by Csapo and Wersenyi [55]: auditory icons (discrete sound events representinga defined event, which can be intuitively understood by anybody without prior knowl-edge of what is represented); earcons (like auditory icons, but not necessarily intuitivemappings — can be understood by those who have learnt the mapping from conceptsto sounds); spearcons (time-compressed speech samples that are often names, words orsimple phrases); spindices (accelerated initial sounds to provide direct information on thestarting letter); auditory emoticons; spemoticons (acoustic events synthesised based onmeaningless vocal expressions that do not occur in real life); musicons (extremely briefsamples of well-known music); and morphocons (earcons and earcon families that can becustomised to users’ preferences).
2. Parameter-mapping sonification (PMSon). In parameter-mapping sonification,changes in some data dimensions are represented by changes in acoustic dimensions; dataparameters are mapped to acoustic parameters continuously. A common approach is themapping of various parameters of sound (pitch, timbre, tempo, for example) to the variousdimensions of a multidimensional dataset (a dataset could list types of car, for example,with parameters describing their size, speed and colour). According to Neuhoff, three ofthe auditory dimensions that are most commonly used are pitch, loudness and timbre[136].
3. Model-based sonification
In model-based sonification, a virtual model is built by the designer. The acoustic responseto the model is based on user interaction: the user can probe the model and receive acousticresponses derived from the data. From these responses to probing the model, the user cancome to understand the data. Sonification designers have produced examples of interactivemodel-based sonifications [100, 103].
In the context of this project, parameter-mapping sonification is suited to continuous, periph-eral and non-exploratory monitoring systems (representations of network state), while model-based sonification may be more effectively used for dynamic, exploratory systems. Event-basedsonification is suited to the representation of defined events; in particular, alerts generated byautomated systems. As described in Section 1.3, we focus on the use of parameter-mappingsonification in this thesis, and later explore the use of event-based sonification for representing
19

alerts. In Section 2.3.5, we review existing approaches to parameter-mapping sonification inmore detail, and identify guidance on the selection of and experimentation with mappings fromdata to sound parameters.
There is no fully established set of guidelines for sonification. There have, however, beenefforts to establish sets of principles for effective sonification design in prior literature, andat conferences such as the International Conference on Auditory Display (ICAD). A numberof guidelines for different aspects of sonification design, implementation, and validation havebeen proposed [22, 26, 60]. Kramer’s widely referenced book on auditory display provides de-sign guidance [118]. Kramer also presented design principles, linking implementation techniqueswith perceptual issues [119]. “The Sonification Handbook” presents the guidance of sonificationresearchers on topics ranging from parameter-mapping sonification approaches to the humanperception of auditory displays, for example [101].
We now present the frameworks and methods described in prior sonification literature thatwe can draw on in this research. We begin by presenting frameworks for the sonification designprocess. We then describe guidelines in sonification aesthetics and data-sound mappings. InSection 4.1, we describe how the methodologies we used in the research reported in this thesiswere guided by some of the information reported here.
Some taxonomies of approaches to sonification design exist. A workshop on the reusability ofdesign knowledge, Recycling Auditory Displays at ICAD 2008, produced a taxonomy of funda-mental approaches to auditory display design [26]. Barrass’ thesis provides a sonification-specifictaxonomy and the “TaDa” framework for task-based auditory information design, with whichdesigners start from the information requirements of the task and then consider the meaning ofthese requirements in terms of sound mappings [22]. Barrass presented a perceptual frameworkfor the auditory display of scientific data, which includes a translation of the application ofcolour sequences in information visualization to the sonification domain [24].
Barrass also established design patterns for sonification [3, 23]. The patterns make recom-mendations as to which sonification approaches are appropriate for representing particular typesof data, with particular aims, and when faced with particular problems. We draw on these designpatterns for this research project, in considering appropriate methods of sonifying particulardata types (as described in Section 4.1). For the sonification of low-level network packet traf-fic, for example, with the aim of enabling the capability to explore patterns in this data, thefollowing design pattern is relevant (quoted directly from Barrass’ patterns [23, pp. 172-173]),and suggests that a real-time parameter-mapping of the data to sound is appropriate:
PerceivingPatternsInDataIF you find yourselfDesigning a display to support exploration and discovery of patterns in complexmulti-attribute, multi-dimensional and/or time-varying datafor examplee1: predicting the direction of stock prices from depth of market stock datae2: analysing high-dimensional data setse3: exploring patterns in spectral oceanography datawith the problem thatit is difficult to perceive higher level information about relations between attributesin conventional graphs and impossible to perceive patterns in tables of data valuesentailing forcesf1: the need to perceive global information about the entire data setf2: the need to perceive intermediate level information about relations between at-tributes as they vary over timef3: the need to perceive local level information about how individual attributes varywith timeTHEN
20

Use a sonification to provide time varying information about multiple attributesApplyThe primitive levels heuristics from Bregman’s theory of auditory scene analysis [42]to map data attributes onto the attributes of auditory streamsto constructauditory streams that perceptually group and segregate to reflect higher level rela-tions between attributesleading tothe capability to explore and find patterns in complex data by listening to itanda perceptually structured information soundscape
De Campo presented the Sonification Design Space Map (SDSM), which allows designers toexplore design choices [60]. This map describes the questions to be addressed in any sonificationdesign process. The map presents, as axes, the following three key questions for reasoning aboutdata requirements in sonification design:
1. How many data points are required for patterns to emerge?
2. What properties of data dimensions should be represented?
3. How many sound streams should be present in the design?
Frauenberger and Stockman developed a methodological framework for auditory displaydesign, the PACO framework [78]. Here, the aim was to provide a pattern-based framework forthe design of auditory display, such that non-experts could design an auditory display. Both theSDSM and the PACO framework can be used when considering task and context, and in Section5.4, we show how we used the SDSM to reason about the requirements of our sonification model.
Some work in formalising the sonification of data has been presented previously. For parameter-mapping sonification, a formalised representation of the sonification mapping function was givenby Hermann [99]. In that representation, the parameter-mapping function g : Rd → Rm de-scribes the mapping from a d -dimensional dataset 〈x1, ..., xd〉 ∈ Rd to an m-dimensional vectorof acoustic attributes which are parameters of the signal generator. The q-channel sound signals(t) is computed as a function f : Rm+1 → Rq of the parameter-mapping function g applied tothe dataset, and time t:
s(t) =∑d
i=1 f(g(xi), t).
In Section 4.1, we describe how we drew on the above formalisation in the development ofthe parameter-mapping sonification model we present in Chapter 5.
A range of sound programming languages have been used in prior work on sonification:SuperCollider, Chuck, Pure Data and Jython Music, are among the most popular. We selectedSuperCollider for this research, since it has been used effectively in similar work.11
2.3.2 Prior Applications of Sonification
Early instances of sonification can be found in seismology, and in cockpit warnings and alarms.Bly mapped six-dimensional data to the pitch, volume, duration, waveshape, attack and over-tones of a synthesised tone in 1982, and showed that participants could classify the data usingthe sonification as well as they could using a visual representation [38].
In more recent years, sonification has been researched and used in numerous fields, such asfinancial markets, medicine (electroencephalography (EEG) monitoring [95] and image analysis
11http://supercollider.github.io/
21

[106]) and astronomy. It has been shown that the presentation of sonified data can improvecertain capabilities in a number of applications: improved capabilities in the exploratory analysisof EEG data, for example [99].
Sonification has been used for three main functions: 1) alerts, alarms and warnings; 2)status, process and monitoring messages; and 3) data exploration [183, p. 12]. Vickers gave anoverview of the application of sonification to process monitoring, and argued that sonificationis particularly well-suited to use in process-monitoring applications [174]. In such applications,in which it is crucial to monitor developments in real time, sonification is appropriate becausesound is inherently a temporal medium (according to Mountford and Gaver [135]).
Sonification has been applied to real-time monitoring in a range of fields: business-processmonitoring [104], and industrial production monitoring [85], for example. Design considerationsfor a background auditory monitoring display to aid pilot situational awareness were presentedby Kazem, Noyes and Lieven [113]. Although this is not situational awareness in the cyberdomain, this use of a background auditory display for aiding users to maintain awareness of theprocesses they are monitoring is close to the anticipated function of our network sonificationsystems. The authors focused on design, and concluded with a requirement for flexible researchtools to investigate the possibilities of background auditory environments in this context. Theauthors also argued that based on prior work it seems that humans have the ability to leaveunattended and yet still monitor background auditory information channels. This bolsters theargument that it is important to explore the potential for background auditory information toenhance cyber situational awareness.
2.3.3 Aesthetic Sonification and Musification
As we explained in the research scope in Chapter 1.3, the sonification systems developed foruse in the research reported in this thesis have a musical aesthetic. Prior research into musicalsonification aesthetics — system design, theories, and user testing — can be drawn on, aswell as compositional techniques from music, including the development of data-driven andalgorithmic music. We explore the crossover between music and sonification, with the aim ofdeveloping network sonifications that are “musical”.
There is an important distinction between musical sonification, which must have a purpose:the communication of some information; and data-driven music with the sole aim of creatingart. Whereas sonification has the practical primary aim of conveying information to the listenerthrough sound, musical compositions have the aesthetic primary aim of creating music. Whilewe aim to develop approaches to the former, we posit that some of the techniques used in thelatter might inform the design of musical sonifications.
This review is in two parts: first, we explore sonification approaches that focus on aestheticsand music — “musification” in particular. We then present techniques from music compositionthat are in some way relevant to sonification.
Sonification, as defined by Kramer et al., is the representation of data using sound; thereis by definition no requirement for aesthetics or musicality [120]. Broadly speaking, the outputof sonification systems is driven by the underlying data in a way that is not musical. There is,however, some prior work in designing sonifications with a musical aesthetic, and in “musifica-tion” — a derivative of sonification in which the outputted sound is intended to be in some waymusical. Edlund defined musification to be “the musical representation of data” [54] .
There have been a number of theories and sets of guidance on musical sonification aesthetics.Fritz proposed a model for sonification design that is centred on intersections of culturallyperceived features of music [80]. Straebel related sonification design to historical movements,concepts and theories of music, with a particular focus on Romanticism [162]. Vickers andHogg explored sonification aesthetics, associating sonifications with their closest analogue inthe musical world [175]. Stallmann, Peres and Cortum explored the design of auditory stimulususing concepts and techniques commonly used in musical composition [157].
22

Barrass, Schaffert and Barrass compared the use of musification to other methods of soni-fication for the communication of health- and exercise-related information [27]. The study, inwhich six different sonifications were compared, showed that sonification based on algorithmicmusic was the most frequently chosen for use by users, who also reported it to be the most liked;sinusoidal sonification and musification were also chosen frequently compared with sonificationbased on weather metaphors and speech formants (vowel-like sounds).
Childs, Perkins and Brooks proposed a data-independent system and method for the musicalsonification of a stream of complex data [52]. This converted data to sound parameters based onthe configuration data and a mapping scheme, to produce a personalised musical rendering ofsome data. There is a significant body of prior research into musification in biology: for artificiallife and cellular automata [9, 8, 36, 37]; micro-organism movements [189]; and mapping EEGinformation to music [70]. The musification of computer game processes has also been explored[188].
Barra et al. took a musical approach to the development of sonifications of web servers,with the aim that administrators could listen for a long time without becoming fatigued [21].Their approach was to mix external music of the administrator’s choice with system-generatedmusic. The administrator could personalise the system by configuring it to associate web serverevents with specific external musical tracks of their choice. The background music (the system-generated music) had the aim of reducing listener fatigue with “musical structure that’s neutralwith respect to the usual and conventional musical themes” [21]. Vickers and Hogg wrote thatthis approach drew on the ideas in musical composition of Luigi Russolo, Pierre Schaeffer’smusique concrete, Edgard Varese’s Poeme Electronique and John Cage’s aleatoric compositionssuch as Music of Changes [175].
The Crumbs software was developed for use in biological imaging research, with the aimof generating sonification that would be melodic and unobtrusive [41]. The goal was to createa sonification method that would avoid a problem observed in previous work: that repetitioustones and dissonant chords made sonifications difficult to listen to for extended periods of time.Crumbs sonified a magnetic resonance imaging (MRI) scan of a horse’s leg by rotating throughseveral different dorian scale melodies played on a guitar. As the user got closer to fibrous tissue(aiding in the search for which was the aim of the system), other instruments were added: apiano in both single and multiple registers, a synthesised voice instrument, and a flute. Allinstruments played when the user reached the most dense region of fibre.
User testing of musical sonification systems has been carried out. Parameters of music weredefined and evaluated in a user experiment which explored their perceived properties, perceivedinfluence on the music as a whole, and emotional content [31]. The musical parameters involvedwere mode (major/minor), instrumentation, tempo, accent evenness, articulation, volume, andregister. The authors found clear associations between musical parameters and the basic emo-tions they were perceived to express. It was also found that for some of the musical parametersexplored, musicians performed significantly differently to those participants who did not havemusical training; for example, musicians frequently expressed that changes to the mode param-eter had the most altering effect on the music overall, while for non-musicians instrumentationand accent evenness were chosen more frequently. Participants were asked to manipulate mu-sical parameters to represent emotions presented: “happiness” and “sadness”. For all musicalparameters, it was shown that the emotions presented significantly affected the changes madeto the musical parameters by the participants.
Musical sonifications have been designed as art. The Sydney Opera House Studio staged aconcert of sonifications with a call for submissions of “musically satisfying” and “data-driven”sonifications.12 De Campo organised another concert for sonifications of socio-economic data inthe Institute of Contemporary Arts, London.13 These concerts, which bridge sonification, music
12http://www.icad.org/websiteV2.0/Conferences/ICAD2004/concert_call.htm13http://cogsci.eecs.qmul.ac.uk/oldpages/icad2006/concertcall.php
23

and artistic practices, are highly relevant and their programmes worthy of exploration to drivemusical sonification design.
We have considered sonification approaches that focus on aesthetics and music. We nowexplore techniques from musical composition that are data-driven, or in some way related tosonification. Throughout the history of musical composition, composers have used extra-musicalmaterial to inform their work. In Ancient Greece, music was composed that was informedby geometric ratios, and Mozart used dice throws to inform his compositions [28, p. 145].More recently, Karlheinz Stockhausen and Iannis Xenakis have composed music informed byextra-musical sources [162]; Xenakis famously used statistics and stochastic processes in hiscompositions. Composers have drawn on data-driven composition, in recent years particularly,using data relations and natural patterns as compositional tools: planetary motion and naturallanguage patterns, for example.
The experimental music composed from the mid-20th century onwards has interesting linkswith sonification. Pierre Schaeffer’s Musique Concrete, originating in France in the 1940s, useselectronic means to produce music from extra-musical sound material: the sounds of the naturalenvironment, synthesised sounds, sounds derived from digital-signature processing, as well ashuman voices and musical instruments. This approach to organising extra-musical materialinto music is somewhat similar to that required for the development of data sonifications thatare musical. For aesthetic sonification, lessons might be learned from the techniques used inthis musical paradigm: fragmentation, organisation and transposition of sound resources which,amongst other treatments, interact in Schaeffer’s jeu (play).
Algorithmic composition, in which music is composed from computational models of, forexample, fractal equations and neural networks, is close to sonification insofar as underlyingprocesses determine the sound composition. Similarly, extra-musical data such as EEG brain-waves and Internet traffic have been used to inform the composition of computer music [25].
2.3.4 Auditory Perception and Psychological Factors
Observing relevant knowledge from the science of auditory perception and cognition is key tothe development of effective sonification approaches, and there exists a wealth of literatureon the subject. An understanding of the ways in which humans hear sound, their cognitivelimits, and the associations they make with different sounds (which may be affected by culturalbackground or references to popular culture, for example) is required in order for the designerto have control over users’ perceptions of the sonifications they develop.
Some key sources of knowledge on this subject include a large body of work by Deutsch onauditory perception and pattern recognition [66]; Bregman’s theory of auditory scene analysis(a well-regarded model in auditory perception for the organisation of sound into perceptuallymeaningful elements by the human auditory system) [42]; and Levitin’s auditory perceptionwork with a focus on music [124]. The psychoacoustic factors associated with a range of soundparameters must inform our research: common human associations with, and responses to, soundparameters such as pitch and tempo, for example. Prior studies address correlations betweensound properties and perceived urgency [31, 71, 98]. Information on this area of psychoacousticsis presented by Neuhoff, with a focus on its application to sonification [136].
For our research, in which we hope to facilitate network-attack and security-event detectionby presenting sound from which security practitioners may recognise patterns, knowledge aboutthe human pattern-recognition ability, using sound in particular, is relevant. It is known that thehuman brain is a very strong pattern processor in general [131]. Deutsch argued that humansalso have a strong ability to recognise composite musical patterns [66]. Neuhoff presented thefollowing comparison of the perceptive strengths of the visual and auditory systems [136, p. 73],which draws on prior work [109, 110]. The comparison highlights the strength of the auditorysystem in perceiving temporal information such as tempo and rhythm:
24

One indication of the dominance of vision over other senses in humans is the tremen-dous disparity in the amount of cortex devoted to visual processing when comparedto the other sensory modalities. Thus, as one might expect, the visual system tendsto show better performance on many types of perceptual tasks when compared toaudition (e.g. spatial localization). However, when it comes to rhythmic perceptionand temporal resolution, the auditory system tends to perform significantly betterthan the visual system. Thus, auditory display is particularly well suited for domainsin which rhythmic perception and temporal discrimination are critical and domainsin which the underlying data lend themselves to rhythmic and temporal variation,particularly when the rate of presentation is within the optimal sensitivity range oftempi for the user.
There is evidence that humans can achieve very high performances in pattern recognitionin some contexts using sonification. User testing showed that users could classify vectors withextremely high accuracy (90% after first training, 98% and 100% after second training) by lis-tening to a sonification of a multivariate dataset containing elemental concentrations of metals[193]. Cullen and Coleman explored human pattern-recognition capabilities using data soni-fication [56], and argued that the human audio-processing capability is innate, demonstratedby the ability of infants to discriminate pitch, melodic contour and rhythm as well as adultscan. In that article, guidelines for human pattern recognition in the context of sonification werepresented. Testing of the effects of melodic contour and rhythm on pattern recognition showedthat participants detected patterns more efficiently using melodic contour than using event-based earcons. Participants also performed better at recognising patterns using a sonificationwhen it was rhythmically parsed [56]. With regard to anomaly detection, a study by Smith etal. provides tentative support for the hypothesis that the right hemisphere of the human brainperforms better than the left at detecting anomalies [153].
A challenge we were aware of throughout this research is the question of variations in soundperception: perceived emotional content of, and responses to, sound across people with differentcultural backgrounds. Addressing this challenge by exploring the effect of cultural differenceswould be an important part of understanding the utility of sonification to SOCs; in particular,how scalable the approach is to different users. In this thesis, the sonification design approachdraws on the Western musical tradition, and the user studies we report involve practitionersworking in Westerns SOCs. The question of how these systems would be perceived by practi-tioners from other cultures is not addressed, but we review prior work on the subject here, andhighlight this as an important direction for future research in Chapter 10.
It is known that visual perception varies between different cultures; a well-known exampleis the colour red, which suggests danger in Western culture, but is associated with good luckin Chinese culture. Musical tradition varies between cultures, with the structures behind theWestern musical tradition differing greatly to those underlying other traditions. This suggeststhat the perception of sound may also differ cross-culturally, and that the development of asonification system that can be used effectively in network-monitoring tasks by security prac-titioners of Western origin, for example, may not necessarily be universally useful. This hasimplications for the utility of sonification to SOC practitioners, and it is worth exploring theextent to which users’ cultural backgrounds, and variations in their levels of musical exposure,affect their design preferences for, and their ability to use, sonification systems.
There is some prior work exploring cross-cultural differences in the associations humans holdwith particular sounds. Universal recognition of basic emotions (happy, scared/fearful) in musicwas explored in a cross-cultural study involving two groups supposedly naıve of one another’srespective musical cultures — the native African Mafa population and Western participants [81].The results indicated that the Mafas recognised the three emotions represented in the Westernmusic above chance, and thus showed that the expression of these emotions through Westernmusic can be universally recognised. An experiment was carried out to investigate whether
25

the perception of emotions in music is culture-specific or multicultural [7]. The experimentinvolved subjects from Western Europe (Germany and Norway) and Asia (South Korea andIndonesia), with results that indicated pan-cultural emotional sentience in music, althoughwith cultural specifics. Trained musicians in this experiment gained a slight, but statisticallysignificant, predominance over non-musicians. “Happy” and “sad” were the emotional categoriesthat participants were universally able to detect from the music. Differences between groupswere shown for other emotions; particularly for those that were not typical of musical expression,such as “disgust”.
2.3.5 Data-Sound Mappings
As we explained in Sections 1.3 and 2.3.1, parameter-mapping sonification is the approach wetake to sonification design throughout the majority of the research presented in this thesis. Inparameter-mapping sonification, changes in some data parameters are represented by changesin sound parameters, where data and sound parameters are described as follows.
• Data parameters are properties of the data under study, which the designer intendsto represent the state of using sonification. In a multidimensional dataset representingthe properties of a body of water, for example, selected data parameters may include thevolume and temperature of the water.
• Sound parameters are properties created by the acoustic signal generator, using whichthe sonification designer intends to convey information about the data under study. Asonification may use multiple sound parameters. The sound parameter tempo, for example,may be used to represent the temperature of water, and vary accordingly. The volume ofwater may be represented by another sound parameter such as amplitude (loudness).
Parameter-mapping sonification allows data parameters to be mapped to acoustic parame-ters continuously. A common approach is the mapping of various parameters of sound (pitch,timbre, tempo, for example) to the various dimensions of a multidimensional dataset [92]. Modelsdescribing approaches to designing parameter-mapping sonification systems have been presented[99, 190]. In general, data parameters are chosen based on context, and on the data propertiesthe designer wishes to represent. Using parameter-mapping models, these data parameters canthen be mapped to sound parameters, taking into consideration the suitability of different sonicproperties for signalling data properties, and the number of data points that can be represented,discretely or continuously, using different sound parameters [59].
It has been shown that the data-sound mappings used can impact the effectiveness of asonification system. Parseihian et al. compared sonifications of guidance systems, and showedthat sonification strategies based on pitch and tempo enabled higher precision than strategiesbased on loudness and brightness [143]. It is therefore important that suitable mappings aremade from data to sound in the design of sonification systems. For guidance in data-soundmappings, scaling and polarity for sonification design, we can observe prior work. There isexisting knowledge on appropriate sound mapping designs for data quantities, presented in priortheoretical and experimental work. Stevens investigated the psychophysical scaling functionsbetween auditory parameters and subjective perceptions of stimuli — the change in soundperceived compared with the actual change in sound [158, 159, 160, 161].
Dubus and Bresin presented a review of the sonification design strategies and mappingsused across 179 publications related to the sonification of physical quantities [67]. They foundthat a proper evaluation of the sonification mappings used was performed only by very few ofthe works reviewed. Of particular relevance to our research, they constructed a database of themappings used in the reviewed works, with 495 entries, analysing their frequency of use, andany work experimenting with them, successful or unsuccessful. It was reported that pitch was
26

the most-used sound dimension, occurring in 23.8% of the mappings reviewed. We drew on thisreview in developing the data-sound mappings used in the research reported in this thesis.
2.4 Human-Computer Interaction (HCI)
In an introduction to the research area, Booth defines HCI to be “the study of the interactionbetween humans and computers” [39]. Booth outlines the components of HCI more specifically.HCI is concerned with developing methods to assess the needs of users, and suggesting tech-nologies based on this to meet the needs of users in particular situations. User-centred systemsdesign (UCSD) is a key part of HCI, taking account of the user to ensure that computer sys-tems provide users with the required information and functions. Developed systems may impactindividual users, as well as larger groups such as organisations, and examining the impact ofsystems on their users is part of HCI research.
Many aspects of the research reported in this thesis can be classed as HCI research, givenour aim to develop sonification systems and assess their utility to security practitioners in SOCs.Thus, it was important that our research methods were informed by existing knowledge in HCI.In the following sections, we review the previous HCI research most relevant to this researchproject. In Section 4.1, we describe how some of this research informed our development of themethodologies used in this thesis.
2.4.1 User-Centred Systems Design (UCSD)
UCSD describes a set of processes for addressing the needs of users in the development ofcomputer systems. The tasks of users using the system, the environments in which they willuse it, and requirements with regard to usability and integration are addressed through UCSD.Users of systems being developed are generally involved in specifying their requirements andevaluating whether these are met by the system.
UCSD processes are important for this research, in which we aim to design systems thatmeet the network-security monitoring requirements of users (security practitioners working inSOCs), and evaluate the systems against these requirements. The UCSD principles relevant toour research are as follows, quoted directly from Gulliksen et al. [93, pp. 401-403].
1. User activity — the goals of the activity, the work domain or context of use,the user’s goals, tasks and needs should early guide the development.
2. Active user involvement — representative users should actively participate,early and continuously throughout the entire development process and through-out the system lifecycle.
3. Evolutionary systems development — the systems development should be bothiterative and incremental.
4. Simple design representations — the design must be represented in such waysthat it can be easily understood by users and all other stakeholders.
5. Prototyping — early and continuously, prototypes should be used to visualizeand evaluate ideas and design solutions in cooperation with the end users.
6. Evaluate use in context — baselined usability goals and design criteria shouldcontrol the development.
7. Explicit and conscious design activities — the development process shouldcontain dedicated design activities.
27

8. A professional attitude — the development process should be performed byeffective multidisciplinary teams.
9. Usability champion — usability experts should be involved early and contin-uously throughout the development lifecycle.
10. Holistic design — all aspects that influence the future use situation should bedeveloped in parallel.
11. Processes customisation — the UCSD process must be specified, adaptedand/or implemented locally in each organization.
12. A user-centred attitude should always be established.
We used requirements analysis to explore the needs of SOC practitioners, as part of thisUCSD process. The aim of requirements analysis is to establish the needs of users of a softwaresystem, and to explore the meaning of these needs in terms of systems design [167]. Maguireand Bevan presented a four-stage approach to requirements analysis [127], which is presentedin Figure 2.4. We used this requirements analysis approach in eliciting the requirements of SOCpractitioners in the research reported in Chapter 7.
Informationgathering
Identifyuser needs
Envisioningand evaluation
Requirementsspecification
Figure 2.4: Requirements analysis process [127]
As another part of the UCSD process, we assessed the usability of the systems we devel-oped (in Chapters 8 and 9), using the System Usability Scale (SUS) and BUZZ scale for userexperience with auditory interfaces. SUS is a widely used tool for assessing the usability ofsystems in general, consisting of a 10-item questionnaire, to each item of which participantsindicate their response on a 5-point scale from strongly disagree to strongly agree [43]. BUZZis a questionnaire for assessing the experience of users of auditory interfaces specifically. Thequestionnaire consists of 11 items, responses to each of which participants record on a 7-pointscale from strongly disagree to strongly agree [169]. The SUS and BUZZ questionnaires arepresented in Appendix C.
2.4.2 HCI Work in Sonification
Ibrahim and Hunt presented an HCI model for the usability of sonification applications [107].The model was in two parts: the Sonification Application Model (which relates to “what theapplication or designer would like the user to do and to know”) and the User InterpretationConstruction Model (which relates to “what the user might perceive and understand”. The modelwas based on the definition of sonification, issues that exist in sonification design, an assumeddefinition of usability for sonification, a data state model, and Norman’s HCI model (presentedby Norman for HCI in general [139]).
Barrass and Zehner explored the sonification of well logs, considering the requirements ofusers: geological interpreters building models of underground formations, and stakeholders inoil and gas companies, software and research [29]. Users were experts in oil and gas exploration,but had little (or no) experience with sonification. The derived requirements were that the soni-fication must be useful and usable, easily explained and quick to understand. The requirements
28

analysis in this research was done in three stages: task identification, scenario description, andinformation characterisation, which drew on methods from HCI and scientific visualization [49].
Hermann and Nattkemper sonified multidimensional biomedical datasets containing imagesbased on requirements for multi-parameter fluorescence microscopy data of immunifluorescentlylabelled lymphocytes [102]. The sonification was designed to meet specific requirements: easyperception of cells with identical patterns as identical sounds; similarity of the sounds of thesonification of similar cell fluorescence patterns; extensibility of the sonification to add futuremarkers without changing the sound characteristic; short duration of the sonification — ap-proximately one second, to allow fast browsing of the image.
Van Scoy discussed the capacity for sonification to meet the described goals of visualiza-tion of complex datasets [172]. The sonification of scores and simple mathematical functionsfrom basketball games was presented as an example in that discussion. Van Scoy listed therequirements for excellence in statistical graphics, which include making large datasets coher-ent, encouraging the eye to compare different pieces of data, revealing data at different levelsof detail (from broad overviews to smaller detail), and serving a clear purpose (description orexploration, for example).
These methods used in prior work for deriving sonification requirements tend to be basedon the researchers considering the characteristics of the data, and its conversion to sound froma theoretical perspective. We drew on these theoretical approaches to deriving sonification re-quirements, in the development of the sonification model (presented in Chapter 5). We alsoinvolved end-users in the requirements elicitation stage (presented in Chapter 7), interviewingsecurity practitioners working in SOCs to identify requirements for the development of sonifi-cation systems for network-security monitoring.
Studies assessing the performance of users of sonification systems have been carried out.Hildebrandt, Hermann and Rinderle-Ma compared the utility of continuous sonification withauditory alerts and visual only conditions for business-process monitoring tasks [105]. In theexperiment, participants showed significantly higher monitoring performances in the continuoussonification condition, while the main task was not significantly affected by this condition.
The approach taken in the above study was to compare participants’ performances in amain task (in which participants solved arithmetic problems) and a secondary monitoring task,using three monitoring conditions: visual only, visual and auditory alerts, and visual with acontinuous sonification of process events (the sonification was based on a forest soundscape).The research we report in Chapters 8 and 9 was informed by aspects of this methodology. Inparticular, we drew on their presentation of the separate primary task and assessment of theperipheral monitoring capability of participants, in assessing the non-primary task monitoringperformance of SOC practitioners using sonification.
2.4.3 HCI Studies in SOCs
A number of HCI articles have focused on examining the work of security practitioners inSOCs, and the challenges faced. This has included interview-based research [69, 185, 187], andethnographic fieldwork [57, 164, 184]. We reflect on some of the most pertinent to our research.
Sundamarthy et al. conducted anthropological fieldwork in SOCs spanning four years. Stu-dents trained in anthropological methods were embedded in three different SOCs as securityanalysts [163, 164, 165, 166]. Activity Theory was used to model SOC operations, and the suc-cesses and failures encountered in integrating new technologies into SOCs were studied. Theimplications of the findings for improving SOC operations were described, including the needfor useful new tools to be dynamic and constantly resolve emerging conflicts [165]. Factors con-tributing to security analyst burnout, rates of which are consistently high, were modelled as acycle linking factors concerning skills, empowerment, creativity and growth [163].
Werlinger et al. used interviews and participatory observation to identify the interactions ofsecurity practitioners [184, 185, 186]. They found that the existing tools used were not sufficient
29

to support complex security tasks. In extended research, Werlinger et al. used semi-structuredinterviews to understand the security incident-response practices of security practitioners [187].Findings included a tendency for complication of incident diagnosis by usability issues withsecurity tools, and by a need for practitioners to rely on their own knowledge.
D’Amico et al. investigated the workflow, decision processes, and tool use of security prac-titioners in SOCs using cognitive task analysis as part of interviews and observations [57].Cognitive challenges including the massive amounts of network data were identified. D’Amicoalso used a survey and interviews to explore the perspectives of security practitioners on the useof security visualizations in their work [68]. Findings indicated that visualizations could sup-port data analysis. D’Amico et al. describe the aspects of network data that security analystsobserve in order to achieve network situational awareness, presenting a list of these aspects ofthe network data, obtained through a cognitive task analysis performed with security analysts[57].
In summary, interviews and ethnographic fieldwork have both produced important findingsrelating to SOC tool use and working practice in prior work. This informed the methodologies(described in Chapter 4) we used to explore the potential utility of sonification to SOCs inChapters 7 and 8.
2.5 Summary
We reviewed existing knowledge in a number of areas relevant to the research we present in thisthesis. These are areas that can inform the research, but are not directly related to the topicof this thesis (directly related literature reporting the design and use of sonification systemsfor network-security monitoring is presented in the next chapter). Of particular importanceis information relating to SOC working practice and the use of tools such as SIEMs, whichinformed our development of the studies we carried out with SOC practitioners, as described inChapter 4.
From the survey of the current state of the art in sonification applications and design (Section2.3.1), we observe that there is a large body of knowledge around specific techniques for, methodsof implementation of, and psychological factors affecting, sonification. There is, however, nodefinitive set of principles for sonification design. Nor has there been any extensive comparison ofthe results achieved by different sonification approaches: in all application domains the approachto design has been largely experimental.
While the body of existing knowledge in sonification can be drawn on therefore, it cannotform the sole basis of our sonification design. User testing will be a vital part of the developmentof sonifications in our research, to ensure that requirements are being met. In the involvementof users in these studies, it is critical that we draw on knowledge in the field of HCI to ensurethat the processes used are effective and the results reliable. In Chapter 4, we explain how theresearch methodology we developed for this thesis was informed by the relevant background wehave presented in this chapter.
30

Chapter 3
Related Work: Applications ofSonification to Network-SecurityMonitoring
In this chapter, we review the state of the art in the application of sonification to network-security monitoring. Based on the findings of this review, we identify outstanding challenges(presented in Section 3.3), related to the research questions we presented in Chapter 1, that havenot been fully addressed in prior work. Addressing the outstanding challenges we identify hereis the aim of the research approach we propose in the next chapter, on which the methodologywe followed in carrying out the research reported in this thesis is based.
The current state of the art in sonification for network and server monitoring was summarisedby Rinderle-Ma and Hildebrandt [147]. In that article, systems for sonification of computer-security data were identified, in various stages of maturity. It was concluded that there was alack of formal user and usability testing, even in those systems that were already fully developed[87, 88, 191]. Our survey work differs from that of Rinderle-Ma and Hildebrandt: while theirsurvey gives an overview of the design approaches taken in some existing sonification systems,our survey provides greater detail on the design of existing systems in terms of sonificationtechniques, sound mapping types, the network data and attack types represented, and thenetwork-monitoring scope.
Low-levelnetworkdata
Sonification
Visualization ortext-based pre-sentation
Anomaly detection
IDS
Firewall
Network-monitoringappliances
Approach 1 : [18, 44, 61, 62, 87, 88, 115, 129, 130, 142, 146, 177, 191]
Approach 2 : [44, 63, 72, 90, 152, 156]
Figure 3.1: A summary of the data types used in previous approaches to sonifying network data
In Figure 3.1 we show the approaches to designing network-data sonifications taken in pre-vious work, in terms of the type of network data sonified. In this figure, we position the existingsonification systems surveyed onto the monitoring tool relationships diagram presented in Fig-
31

ure 1.1. Previously proposed sonifications of network-security data can be divided into two sets:those that take Approach 1 (in which the sonification system takes as input some direct trafficdata, as described in Section 2.1, with scaling functions applied such that the sonification is arepresentation of the low-level network data itself), and those that take Approach 2 (in whichthe system sonifies security tool data, as described in Section 2.1: the output of some networkmonitoring tool such as an IDS or anomaly-detection system).
We present the related work that used Approach 1, followed by those systems that followedApproach 2. In Table 3.1, we summarise the sonification design techniques used and the usertesting carried out in the reviewed articles.
3.1 Approach 1 : Sonifying Network Data Directly
PEEP, a “network auraliser” for monitoring networks with sound was designed to enable systemadministrators to detect network anomalies — both in security and general performance — bycomparing sounds with the sound of the “normally functioning” network [87]. PEEP usednatural sounds — birdsong, for example — to sonify network events. Recordings were mappedto network conditions (excessive traffic and email spam, for instance), and were played backto reflect these conditions. Abnormal events were signalled by a change in the sounds. PEEPrepresented both network events (when an event occurred it was represented by a single naturalsound) and network state (state was represented through sounds played continuously, whichchanged when there was a change in some aspects of the state, such as the average networkload). There was no experimental validation of the performance of PEEP and its utility formonitoring networks, but the authors reported the ability to hear common network problemssuch as excessive traffic using the sonification.
The Stetho network sonification system sonified network events by reading the output ofthe Linux tcpdump command, checking for matches using regular expressions, and generatingcorresponding Musical Instrument Digital Interface (MIDI) events, with the aim that the systemcreated sounds that were “comfortable as music” [115]. The aim of developing Stetho was toconvey the status of network traffic, without a specific focus on anomaly detection. The researchincluded an experimental evaluation of the ability of users to interpret the traffic load from thesounds generated by Stetho. The experiment showed that this information could be recognisedby users from the sounds; only four users (subjects familiar with network administration) wereinvolved in the evaluation experiment, however.
Network Monitoring with Sound (NeMoS) is a network sonification system in which theuser defines network events, and the system then associates these events with MIDI tracks[129]. The system was designed to allow a system manager to monitor different parts of apotentially large networked system at once, with a single musical flow representing the wholestate of the part of the system they are interested in. The focus was not on network security,but on monitoring network performance in general; printer status and system load, for example,could be represented through two different sound channels.
More recently, Ballora, Giacobe and Hall aimed to create a soundscape representation ofnetwork state which would aid in anomaly detection, by assigning sounds to signal certaintypes and levels of network activity such as unusual port requests [18]. The concept was asystem capable of combining multiple network parameters through data fusion to create thissoundscape. The fusion approach was based on the JDL Data Fusion Process Model [114],with characteristics of the data assigned to multiple parameters of the sound. The authorsaimed, firstly, to map anomalous events to sound and, secondly, to represent the IP space as asoundscape in which patterns could emerge for experienced listeners. No user testing was carriedout to establish the utility of the system for anomaly-detection tasks. The authors reported theability to hear patterns associated with DDoS and port-scanning attacks, however (see Table3.2).
32

Table 3.1: Review of approaches to and user testing in existing sonification systems for network-security monitoring, ordered by year.
Author Year Sonification approach description Use
rte
stin
g
Nu
mb
er
of
par-
ticip
ants
Typ
eof
part
icip
ants
Netw
ork
data
typ
em
ap
ped
Sou
nd
typ
e
Son
ificati
on
tech
niq
ue
Mon
itori
ng
scop
e
Evalu
ate
sm
on
-it
ori
ng
uti
lity
?
Mu
ltim
od
al
GilfixandCouch[87]
2000 Natural sounds mapped to networkconditions
7 Low-level data(network packetlogs)
Natural(wildlifeandna-ture)sounds
PMSon Anomalydetection:conditions suchas high trafficload and emailspam are mappedto sound
7 7
VarnerandKnight[173]
2002 Multimodal system: visualization conveysstatus of network nodes; sonificationconveys additional details on network nodesselected by the user
7 Not specified Notspeci-fied
Notspeci-fied
Network attackdetection
7 3
KimotoandOhno[115]
2002 Maps parameters of sound to low-levelnetwork data
3 4 Subjectsfamiliarwithnetworkadminis-tration
Low-level data(Linux tcpdump
output)
Musical PMSon General networkactivity andnetwork anomalydetection
3 3
Malan-drinoet al.[129]
2003 Associates MIDI tracks to user-definednetwork events
7 Low-level data(printer status,server CPU, fileserver logs,network packetlogs)
Musical Event-based
Networkperformance
7 7
33

Table 3.1: Review of approaches to and user testing in existing sonification systems for network-security monitoring, ordered by year (continued).
Author Year Sonification approach description Use
rte
stin
g
Nu
mb
er
of
par-
ticip
ants
Typ
eof
part
icip
ants
Netw
ork
data
typ
em
ap
ped
Sou
nd
typ
e
Son
ificati
on
tech
niq
ue
Mon
itori
ng
scop
e
Evalu
ate
sm
on
-it
ori
ng
uti
lity
?
Mu
ltim
od
al
Gopin-ath[90]
2004 Instrument and pitch mapped to IDS alertintrusion type
3 20 ComputerSciencestudentsand staff
IDS alerts(Snort)
Real-worldandmusi-cal
PMSon Intrusiondetection: IDSlogs sonified toaid users inmonitoringintruders andvulnerable hosts
3 7
Papado-pouloset al.[142]
2004 Combines network events rendered asspatial audio with 3D stereoscopic visuals toform a multimodal representation ofnetwork information. Sounds are created inresponse to changes in data patterns usingGaussian Mixture Modelling
7 Low-level data(incomingnetwork flows)
Real-worldandmusi-cal
PMSon Anomalydetection:network datapresented forpatternrecognition
7 3
Qi etal.[146]
2007 Maps traffic pattern (classified, queued andscheduled) to audio; bytes and packet ratemapped to frequency and intensity of audiorespectively
7 Low-level data(network packetlogs)
Musical PMSon Network attackdetection (DoS,port scanning)
7 3
ElSeoudet al.[72]
2008 Auditory icons (non-instrumental) andearcons (instrumental) mapped to attacktype
3 29 Telematicsengi-neeringstudents
Marked attacksfrom network log
Real-worldandmusi-cal
Event-based
Network attackdetection
7 7
34

Table 3.1: Review of approaches to and user testing in existing sonification systems for network-security monitoring, ordered by year (continued).
Author Year Sonification approach description Use
rte
stin
g
Nu
mb
er
of
par-
ticip
ants
Typ
eof
part
icip
ants
Netw
ork
data
typ
em
ap
ped
Sou
nd
typ
e
Son
ificati
on
tech
niq
ue
Mon
itori
ng
scop
e
Evalu
ate
sm
on
-it
ori
ng
uti
lity
?
Mu
ltim
od
al
Brownet al.[44]
2009 Proposed system maps low-level networktraffic to sound to convey information onnetwork status; current system mapsproperties of traffic classified as disruptiveby an IDS to properties of piano tones
7 Low-level data(network packetlogs) and IDSoutput
Musical PMSon Network anomalydetection(increase intraffic; HTTPerror messages;number of TCPhandshakes)
7 3
Ballora,Gia-cobeandHall[18]
2011 Parameter-mapping-based soundscape foroverall IP space; obvious sound signals forcertain types of activity levels
7 Low-level data(network packetlogs)
Musical PMSon Anomalydetection:anomalousincidents sonified,and networkstate presented tothe human toenable patternrecognition
7 7
GiotandCourbe[88]
2012 MIDI messages mapped to data outputtedby the SharpPCap library network trafficanalysis; MIDI messages mixed to produce asoundscape
7 Low-level data(network packetlogs)
Musical PMSon General networkactivity andattack detection
7 7
35

Table 3.1: Review of approaches to and user testing in existing sonification systems for network-security monitoring, ordered by year (continued).
Author Year Sonification approach description Use
rte
stin
g
Nu
mb
er
of
par-
ticip
ants
Typ
eof
part
icip
ants
Netw
ork
data
typ
em
ap
ped
Sou
nd
typ
e
Son
ificati
on
tech
niq
ue
Mon
itori
ng
scop
e
Evalu
ate
sm
on
-it
ori
ng
uti
lity
?
Mu
ltim
od
al
deButts[63]
2014 Maps distinct notification tones toanomalous network events; createsvisualizations of network traffic activity(multimodal)
7 Low-level data(access logs)
Musical(singletones)
Event-based
Anomalydetection: definedanomalousincidents mappedto sounds
7 3
Vickers,LaingandFair-fax[177]
2014 Parameters of each sound generator (voice)mapped to the log return values for thenetwork’s self-organised criticality
7 Low-level data(network packetlogs)
Natural PMSon Networkperformance andattack detection
7 7
Worrall[191]
2015 Multimodal system for real-time sonificationof large-scale network data. Maps dataparameters and events to sound;parameter-mapping sonification approach
7 Low-level data(sampled networkpacket traffic)
Musical PMSon General networkactivity
7 3
Mancu-so etal.[130]
2015 Multimodal system for representing data onmilitary networks, in which each source anddestination IP is mapped to an instrumentand pitch, and the loudness is increasedwhen a packet size threshold is exceeded
3 30 Localpopula-tion andair forcebaseperson-nel
Low-level data(network packetlogs)
Musical PMSon Network anomalydetection (packetrate threshold,source anddestination IPssonified)
3 3
36
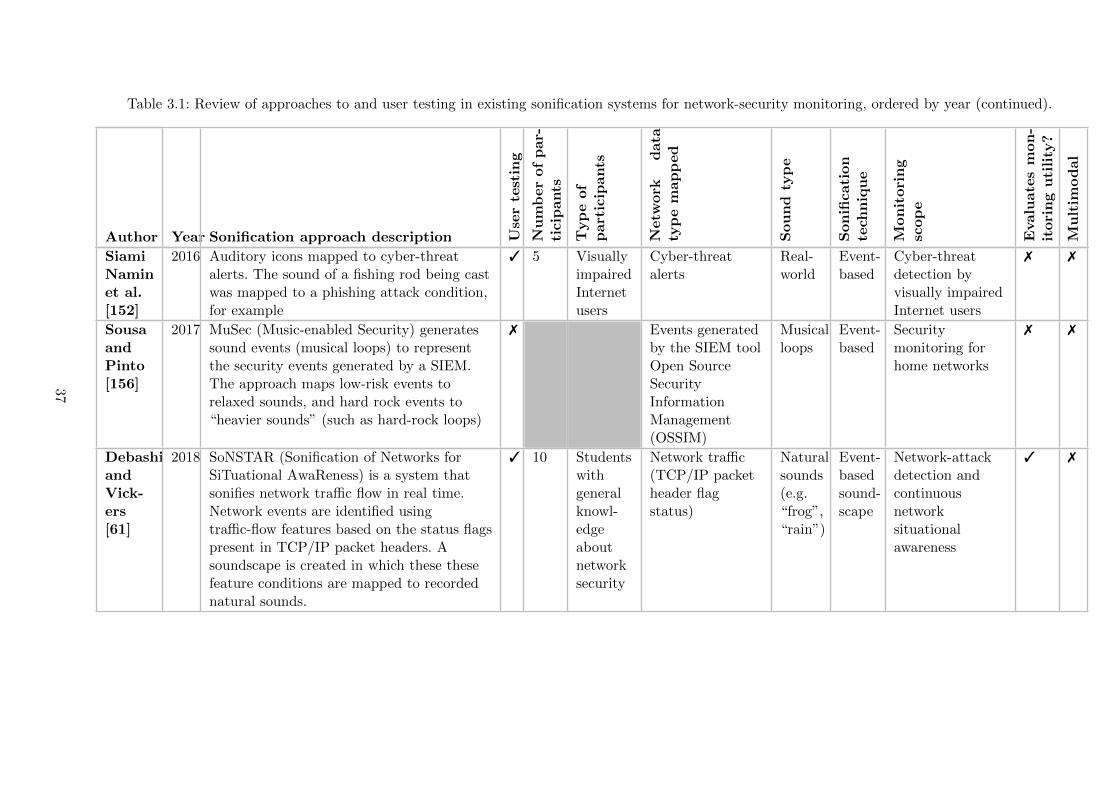
Table 3.1: Review of approaches to and user testing in existing sonification systems for network-security monitoring, ordered by year (continued).
Author Year Sonification approach description Use
rte
stin
g
Nu
mb
er
of
par-
ticip
ants
Typ
eof
part
icip
ants
Netw
ork
data
typ
em
ap
ped
Sou
nd
typ
e
Son
ificati
on
tech
niq
ue
Mon
itori
ng
scop
e
Evalu
ate
sm
on
-it
ori
ng
uti
lity
?
Mu
ltim
od
al
SiamiNaminet al.[152]
2016 Auditory icons mapped to cyber-threatalerts. The sound of a fishing rod being castwas mapped to a phishing attack condition,for example
3 5 VisuallyimpairedInternetusers
Cyber-threatalerts
Real-world
Event-based
Cyber-threatdetection byvisually impairedInternet users
7 7
SousaandPinto[156]
2017 MuSec (Music-enabled Security) generatessound events (musical loops) to representthe security events generated by a SIEM.The approach maps low-risk events torelaxed sounds, and hard rock events to“heavier sounds” (such as hard-rock loops)
7 Events generatedby the SIEM toolOpen SourceSecurityInformationManagement(OSSIM)
Musicalloops
Event-based
Securitymonitoring forhome networks
7 7
DebashiandVick-ers[61]
2018 SoNSTAR (Sonification of Networks forSiTuational AwaReness) is a system thatsonifies network traffic flow in real time.Network events are identified usingtraffic-flow features based on the status flagspresent in TCP/IP packet headers. Asoundscape is created in which these thesefeature conditions are mapped to recordednatural sounds.
3 10 Studentswithgeneralknowl-edgeaboutnetworksecurity
Network traffic(TCP/IP packetheader flagstatus)
Naturalsounds(e.g.“frog”,“rain”)
Event-basedsound-scape
Network-attackdetection andcontinuousnetworksituationalawareness
3 7
37

Table 3.1: Review of approaches to and user testing in existing sonification systems for network-security monitoring, ordered by year (continued).
Author Year Sonification approach description Use
rte
stin
g
Nu
mb
er
of
par-
ticip
ants
Typ
eof
part
icip
ants
Netw
ork
data
typ
em
ap
ped
Sou
nd
typ
e
Son
ificati
on
tech
niq
ue
Mon
itori
ng
scop
e
Evalu
ate
sm
on
-it
ori
ng
uti
lity
?
Mu
ltim
od
al
DebashiandVick-ers[62]
2018 SoNSTAR (same as above [61]) 3 1 A re-searcheracting inthe roleof anetworkoperator
Network traffic(TCP/IP packetheader flagstatus)
Naturalsounds(e.g.“frog”,“rain”)
Event-basedsound-scape
Identification ofIP flows relatingto bot activity
3 7
38

Vickers, Laing and Fairfax sonified meta-properties of network traffic data as a countrysidesoundscape [177]. In that system, the log returns of successive values of network traffic prop-erties (number of packets received and sent, number of bytes received and sent) were used tomodulate the amplitude, pan, phase or spectral characteristics of four sound channels, includingthe sound of a running stream and rain. The intended use of the system was to alert the systemadministrator to abnormal network behaviour with regard to both performance and security;it was suggested, for example, that a DDoS attack might be recognisable by the system’s rep-resentation of an increase in certain types of traffic. There was no experimental evaluation ofthe ability of users to recognise such information using the system. Vickers et al. extended thatwork to further explore the potential for using sonification to enable network situational aware-ness [176]. For this context, i.e., maintaining network situational awareness through continuousmonitoring, it was argued that solutions based on soundscape have an advantage over othersonification design approaches, and that there is a need for sonifications that are not annoyingor fatiguing, and that complement the user’s existing sonic environment.
A soundscape approach was also adopted for the InteNtion system for network sonification[88]. In that approach, the output of network-traffic analysis was converted to MIDI eventsand sent to synthesisers for dynamic mixing. The output was a soundscape composed from thenetwork activity generally, rather than from detected suspicious activity. It was argued that thesystem could be used to help administrators detect attacks; this was not validated through usertesting, however. As part of a student project by deButts, network data was sonified with theaim of aiding security analysts to detect anomalous incidents in network access logs [63]. Thesonification system developed in that work was not evaluated.
Debashi and Vickers presented SoNSTAR (Sonification of Networks for SiTuational AwaRe-ness), a system for the real-time sonification of network-traffic flow to support network monitor-ing and situational awareness [61]. SoNSTAR identifies network events using traffic-flow featuresbased on the status flags present in TCP/IP packet headers, different combinations of whichdefine particular traffic events, and creates a soundscape in which these events are mapped torecorded sounds. Feature conditions (particular combinations of status flags) are mapped torecordings of natural sounds (for example, “frog”, “wind on grass” and “rain”).
To evaluate SoNSTAR, a user study was carried out in which ten participants (students withgeneral knowledge about network security) monitored network behaviour under three conditions:1) using SoNSTAR only, 2) using Snort IDS only, and 3) using both SoNSTAR and Snort IDS.The ability of participants to detect (recognise the occurrence of) a set of attack conditions(ICMP ping; four types of port scan — SYN, Null, Xmas and FIN; SYN flood DOS; DDoS)under each condition was assessed. The workload experienced by participants in each conditionwas also assessed using the NASA Task Load Index (TLX) questionnaire [96]. Participantswere asked to rate their detection confidence, and the sound fatigue and visual fatigue theyexperienced in each of the three monitoring conditions.
The results of the SoNSTAR evaluation showed that recall was 100% in all conditions: thatno attacks were missed by participants, and that the detection precision was highest (withthe lowest number of false-positive detections) by participants in the combined SoNSTAR andSnort IDS condition. The F-score (a measure of accuracy that combines precision and recall)was highest in the combined SoNSTAR and Snort IDS condition (96.77%), and the F-scorefor SoNSTAR alone (94.29%) was higher than that for Snort IDS alone (89.86%). By thesemeasurements, therefore, participants were most accurate when using both tools, followed bywhen using SoNSTAR alone. This indicates that using the sonification system improved theperformance of participants in detecting these attacks.
In another study to assess SoNSTAR, Debashi and Vickers showed that using the systemenabled an operator to identify IP flows relating to bot activity with greater accuracy than threeleading machine learning-based traffic classifiers [62]. This type of comparison with state of theart anomaly-detection techniques is a key avenue for research into the utility of sonification for
39

network-security tasks, which is outside the scope of the studies presented in this thesis, butis highlighted as an outstanding challenge in Section 3.3.2, and an area for future research inChapter 10.
Multimodal systems, that combine visualization and sonification for network monitoring,have also been explored. Varner and Knight presented a system in which visualization was usedto convey the status of network nodes, while sonification conveyed additional details on networknodes selected by the user [173]. This multimodal approach combined advantages of the twomodalities: the spatial nature of visualization, and the temporal nature of sonification.
Garcıa-Ruiz, Martin and Green described the benefits and pitfalls of using multimodalhuman-computer interfaces for the forensic analysis of network logs for attacks [82]. In thatarticle, a sonification method was proposed for IDSs as part of a multimodal interface, toenable analysts to cope with the large amounts of information contained in network logs. Thesonification design approach was not detailed, and the system was not tested with users.
The CyberSeer system used sound to aid in the presentation of network-security informationwith the aim of improving network-monitoring capability [142]. Sound was used in addition todata-visualization techniques to produce an audio-visual display that conveyed informationabout logged network traffic and IDS events. The requirement for user testing to establish themost effective audio mappings was recognised, but no such testing was carried out.
Qi et al. presented another multimodal system for detecting intrusions and attacks on net-works [146]. The system generated distinctive sounds for a set of attack scenarios consisting ofDoS and port scanning. The authors stipulated that the sounds generated could enable humansto recognise and distinguish between the two types of attack; however, user testing is needed tovalidate this conclusion and investigate the extent to which this approach is effective. In anothermultimodal approach presented as a poster by Brown et al., the bit rates and packet rates of adelay queue were sonified in a system for intrusion detection [44].
NetSon is a system for the real-time sonification and visualization of network traffic, witha focus on application in large-scale organisations [191]. No user studies have been carried out,but the system is being used at Fraunhofer IIS, a research institution, who provide a live webstream of their installation [79]. Microsoft have a multimodal system, Specimen Box, for real-time retrospective detection and analysis of botnet activity. It has not yet been presented in ascientific publication, but descriptions and videos of the functioning system are presented online[2]. The system has not been subjected to a formal evaluation, but is used in operations at theMicrosoft Cybercrime Centre.
Mancuso et al. conducted a user study to assess the utility of a network-data sonificationsystem for military cyber operations [130]. Participants were tasked with detecting target pack-ets matching specific signatures (see Table 3.2), using either a visual display (a visual interfacethat emulated network packet-capture viewing and analysis software such as Wireshark) only,or both visual and sonified displays. The aim of the user study was to assess the extent to whichsonification could improve the performance of, help to manage the perceived workload of, andreduce the stress felt by, users conducting cyber-monitoring operations on military networks.
In this study, the performance of participants in the visual-only condition and the conditionthat included sonification was compared. Performance was considered to be the number ofcorrect detections of target packets. The study results showed that the use of sonification in thetask did not improve the performance of participants. Nor did it reduce their perceived workloador stress. Only one method of sonifying the data was tested, however, in which each possiblesource and destination IP address was represented by a different instrument and note, and theloudness increased if a threshold packet size was exceeded. The results did not, therefore, showcomprehensively that using sonification does not affect performance, stress and workload in thiscontext, but demonstrated only that this particular method of sonifying the data was ineffective.
In Table 3.2 we examine in greater detail those existing sonification systems developed forenabling attack detection by sonifying low-level network data specifically (Approach 1 repre-
40

sented in Figure 3.1). For each system, we present the types of attacks targeted and the networkdata features represented in the sonification, and describe the reported effectiveness of thesesystems for “hearing” cyber attacks.
As shown in Table 3.2, some previously designed sonification systems have been reported toproduce sonic patterns from which it is possible to “hear” cyber attacks [18, 87, 146, 177]. Inparticular, it has been reported previously that DoS attacks and port-scanning attacks couldbe heard using systems that sonified low-level network data. Qi et al. mapped network-trafficparameters to sound, and stated that a range of attack scenarios were distinguishable. Ballora,Giacobe and Hall sonified network traffic with a view to aiding in anomaly detection, andreported the ability to hear patterns associated with port-scanning and DDoS attacks. Gilfixand Couch detected unusual network conditions such as excessive traffic using a mapping fromnetwork traffic to natural sounds [87]. Debashi and Vickers showed that users (10 participantsin a study) were able to hear a number of different types of port scan, DoS, and DDoS attacks,as well as ICMP pings using the SoNSTAR sonification system [61]. Furthermore, participantsdetected these attacks more effectively when using SoNSTAR than when using an IDS alone.The utility of SoNSTAR for hearing bot activity was reported in extended work [62].
41

Table 3.2: Attack detection and network data-feature representation in previous sonification systems that take Approach 1
Author Network data features sonified Can attacks be “heard”? Attacks targeted
GilfixandCouch[87]
Incoming and outgoing mail; average trafficload; number of concurrent users; bad DNSqueries; telnetd traffic; others unspecified
Not assessed, but the authors reportedthe ability to “easily detect commonnetwork problems such as high load,excessive traffic, and email spam”
Not specified
VarnerandKnight[173]
Not specified Not assessed
Papado-pouloset al.[142]
Packet rate; others not specified Not assessed
Qi etal.[146]
Packet rate; byte rate No formal usability assessment, but theauthors reported that the systemproduced sounds “notably” differentenough that distinguishing between DoSand port scanning attacks is “relativelyeasy”, while no sounds were producedunder “normal” traffic conditions
DoS; port scanning
Brownet al.[44]
Prolonged increase in traffic volume; number ofTCP handshakes in progress; number of HTTPerror messages
Not assessed
42

Table 3.2: Attack detection and network data-feature representation in previous sonification systems that take Approach 1 (continued)
Author Network data features sonified Can attacks be “heard”? Attacks targeted
Ballora,Gia-cobeandHall[18]
Source IP address; destination IP address;frequency of packets in ongoing socketconnections; packet rate; requests to unusualports; geographic location of sender (suggestedbut not implemented)
Not assessed, but the authors reportedfinding “that patterns associated withintrusion attempts such as port scans anddenials of service are readily audible”
Dataset used contains DoS andport scanning attacks
GiotandCourbe[88]
Packet size ; Time-to-Live (TTL) of packet;bandpass of network ; source IP address;destination IP address; protocol (type ofservice); number of useless packets (e.g. TCPACK packets)
Not assessed
Vickers,LaingandFairfax[177]
The data sonified is the log returns of thesuccessive instances of the following values:number of bytes sent; number of packets sent;number of bytes received; number of packetsreceived
Changes in soundscape not noticeableunder “normal” network conditions;noticeable change occurs when logreturns large (large log return for numberof packets received might indicate DDoS,for example)
Not specified
Mancusoet al.[130]
Source IP address (of packet); destination IPaddress (of packet); packet size
Use of sonification alongside the visualinterface did not improve participants’performance in detecting “target packets”compared with their performance usingthe visual interface alone
Not specific attacks — targetpacket characterised by“signatures”: network tranmissionsoriginating from either of twoparticular source IP addresses,directed at either of twodestination IP addresses, usingeither of two protocols, with packetsize 500 bytes or more
43

Table 3.2: Attack detection and network data-feature representation in previous sonification systems that take Approach 1 (continued)
Author Network data features sonified Can attacks be “heard”? Attacks targeted
DebashiandVickers[61, 62]
Features identified by the system werecombinations of status flags for TCP/IP packetheaders (extended study: IP flows related tobot activity [62])
User testing indicated that participantswere able to hear all targeted attackconditions using the sonification system
Port scans (SYN, Null, Xmas,FIN); SYN flood DoS; DDoS;ICMP Ping; (bot activity [62])
44

3.2 Approach 2 : Sonifying the Output of Detection Systems
Systems have been proposed to sonify the output of existing IDSs, and to act as additions tothese tools. Gopinath sonified a range of events generated by Snort IDS to signal maliciousattacks [90]. The aim was to explore the utility of sonification for improving the accuracy ofIDS alert interpretation by users; usability studies indicated that sonification may increase userawareness in intrusion detection. Experiments were carried out to test three hypotheses onthe usability and efficacy of sonifying Snort IDS. The findings were: musical knowledge hadno significant effect on the ability of subjects to use the system to find intrusions; sonificationdecreased the time taken to detect false positives; immediate monitoring of hosts was possiblewith a sonified system. As noted by Rinderle-Ma and Hildebrandt, however, the comparison wassomewhat biased since the control group without auditory support had to conduct the tasksby reading log files, without access to the visualization-based tools to which those tested withauditory support had access [147].
Garcıa-Ruiz et al. investigated the application of sonification to attacks marked in networklogs as a teaching and learning tool for network-intrusion detection [83], which was extended byEl Seoud et al. [72]. This work included an exploratory piece in which information was gatheredregarding the subjects’ preferred auditory representations of attacks. Sonification prototypeswere given for the mapping of log-registered attacks to sound. The first used animal sounds— auditory icons — for five different types of attack (“guess”, “rcp”, “rsh”, “rlogin”, “port-scan”); the second used piano tones at five different frequencies as earcons to represent the fivetypes of attack. Informal testing was carried out for these two prototypes, and suggested that theearcons were more easily identifiable, while the subjects could recall the attack types more easilyusing the auditory icons. This is a useful start to comparing approaches to sonification designfor network data, and further research is required into the effectiveness and design mappingsinvolving other sound and data types.
Siami Namin et al. explored the use of auditory icons for conveying information aboutcyber-threat alerts to visually impaired Internet users [152]. The usability of a set of audio cuesfor representing these threat conditions was tested in a study involving five visually impairedInternet users. The auditory icons tested included, for example, the sound of a fishing rodbeing cast (to represent a phishing attack), and the sound of bombs dropping (to representmalvertising). Initially, participants were asked to indicate the threat they thought each audiocue related to, and to rate the pleasantness, urgency and conspicuity of the cue. For each threat,the three audio cues chosen by the researchers to represent that threat were then presented,and participants were asked to choose the cue which represented the threat best. Participantswere asked to rate the discriminability of the best pairing they had chosen for each threat, andfollowing this, listened to each audio cue again and were asked to remember the threat conveyedby each.
Results showed that participants identified the threats represented by some cues more accu-rately than others. The representation of phishing by the casting of a fishing rod, for example,was identified by 80% in the first stage of the study, before participants had been informed ofthe pairings intended between threats and audio cues, suggesting that this representation mayhave been more intuitively easy to identify than others. The representation of phishing by thesound of a rusty door opening, for example, was detected by 0%. In cases of such incorrect iden-tifications, however, participants were able to remember the pairing when tested at the end ofthe study, having by that point been informed of the intended pairing, which suggests that theability of users to recognise such pairings could improve with training. The pairings rated bestby the highest proportion of participants were between phishing and the sound of a fishing rodbeing cast, malvertising and the sounding of a siren, and form-filling and the sound of typingon a keyboard.
Sousa and Pinto created an application, Music-enabled Security (MuSec) to sonify the events
45

generated by a SIEM tool [156]. The aim was to enable computer users with little technical ex-perience to carry out security monitoring on their home network by listening to the sonification.MuSec plays sonification events based on the events generated by Open Source Security Infor-mation Management (OSSIM), a SIEM tool that captures and processes network traffic andgenerates network events.1 The sonification events played by MuSec are musical loops; the ap-proach taken was to map low-risk events generated by OSSIM to relaxed-sounding loops, andhigh-risk events to “heavier”-sounding loops, such as heavy-metal and hard-rock loops. Theutility of the system was not validated with end-users. This research is relevant to the studywe present in Chapters 8 and 9 insofar as the information generated by a SIEM tool is soni-fied. While MuSec is event-based, our approach is based on parameter-mapping sonification,however, and as such there are differences in the system design.
3.3 Outstanding Challenges Based on Literature Review andBackground
From this review of the prior literature relating to the design and use of sonification for network-security monitoring, and of the relevant background presented in Chapter 2, we have identifiedthe key areas in which research is lacking. In the sections below, we list the outstanding chal-lenges relating to sonification design (Section 3.3.1), and the outstanding challenges relating touser testing (Section 3.3.2). These challenges inform the questions this thesis aims to address,through the research approach and methodology developed in the next section.
3.3.1 Designing Sonification Systems for Network-Security Monitoring
The sonification systems reviewed vary in the data they represent. Some map low-level networkdata to sound, some map the output of IDSs, while some aim to map attacks to sounds. Thereis no comparison of the efficacy of these approaches, however. Identification of the network-datasources and features that should be sonified in order to represent network attacks is needed.The sonification design approaches used (event-based, parameter-mapping, and soundscape-based) also vary, as do the sound types (natural sounds, sounds that are musically informed),and the mappings selected from network data to sound, but there is as yet no comprehensiveinvestigation into the utility of these methods.
Based on the points above, we propose that there is a need to further explore the sonificationapproaches most appropriate for use in network monitoring: the sound design, and the selectionof mappings from data to sound. There is also a need for a formalised model for designingsonifications in this field, to underpin developments. For the research reported in this thesis,for the reasons explained in Section 1.3, we have chosen to develop sonification systems with amusical aesthetic; given this scope we do not explore the other sound types mentioned above(natural sounds, for example), and leave comparison between the suitability of different soundtypes for SOCs to future work. In the following, we detail the requirement for a formalisedsonification model, and for research into appropriate sonification designs for the context.
Requirement for a formalised sonification model
To enable sonification researchers to architect and experiment with sonifications in a flexibleway, there is a need for an underpinning sonification model that is applicable to the task ofsonifying network-security monitoring information. This should enable the use of heterogeneoussonifications alongside each other in order to compare performance, and iteration over designchoices. No such model currently exists, and we therefore propose the development of a for-malised model specifically for developing sonification systems for network-security monitoring.
1https://www.alienvault.com/products/ossim
46

The model should describe a grammar for the representation of network data throughparameter-mapping sonification that enables incorporation of and experimentation with ap-propriate design aesthetics, techniques of musical composition, and the science of auditoryperception. It is important that the model encompasses prior art, and enables comparison withprevious approaches to designing sonifications in this space. While such comparison betweenthe performance of different sonification systems is outside the scope of this thesis, developing amodel general enough to encompass all approaches will enable comparisons between systems inthe future. We can verify the applicability of the model for this task by verifying that it is ca-pable of representing the existing sonification systems reported in the relevant articles reviewedin this chapter.
The sonification model should take as input both the requirements for the representationof data, and the requirements for sound design: appropriate data-sound mappings and soundaesthetics, and methods of scaling the data to the sound domain. The model should provide amethod for mapping the required data to sound, following the data-representation and sound-design requirements inputted. The model itself should then produce the input to some sonifica-tion engine.
In general, huge quantities of multivariate and highly complex data move through the net-works of organisations. It is important that the model enables the sonification designer to reasonabout the parts of the data to be sonified, the key information about these parts that must beconveyed to the sonification user, and the most appropriate method of representing this infor-mation through sound. The data-representation requirements include firstly the data sourcesused, since these produce different data types. Packet-header data might be represented, forexample — a different data type to machine-log data (including machine core processing unitusage, for example) or file access log data.
The data-representation requirements must also include the data features addressed. Theseare the properties of the data that we choose to sonify, and may be low-level properties (suchas a representation of the source IP address from which each packet is received) or may beattack-detection features (such as comparisons of data against packet-rate thresholds). Someprior work involves interviews with security analysts to identify the properties that data analystssearch for in network-security monitoring to enable attack detection [45, 57]. This informationcan be drawn on in defining the data features for sonification. Attack characterisation could alsobe used to extract the ways in which classes of network attacks (flooding attacks, for example)manifest in the data sources selected for representation in the sonification.
The data-representation requirements depend to a large part on the use case. In developingsonification systems for anomaly detection by humans, data-representation requirements shouldbe derived from information about all data sources and features that enable network anomalydetection, and through which attacks are conveyed. On the other hand, for use in a multimodalsystem, which conveys part of the network data sonically while other data is conveyed visually,the data-representation requirements for the sonification would depend on which data had beenselected to be conveyed visually, and which using the sonification.
As another example, if the aim of the sonification system was to enable analysts to mon-itor network security as a non-primary task, the data-representation requirements should beinformed by the data sources that analysts may frequently be required to monitor while si-multaneously conducting other tasks. These sources might include IDS alert logs, or the logs ofcritical servers on the network, for example. Buchanan, d’Amico and Kirkpatrick categorised thepotential data sources used by security analysts in answering a number of different analyticalquestions (in searching for the activities associated with a particular suspicious IP address, forexample) [45]. This information can be drawn on in defining the data-representation require-ments for sonification, and this understanding of the data sources used in the various types ofSOC monitoring task could be bolstered through further interviews with security practitioners.
47

Sonification design
While there has been some work in aesthetic sonification, it has not been much applied in thecontext of network-security monitoring. Prior work indicates that sonification aesthetics havean impact on the effectiveness of sonification systems. It was shown that particular sonificationdesigns resulted in better participant performance in identifying features of Surface Electromyo-graphy data for a range of different tasks involved, for example [144] .
The aesthetics of the design are an important factor in producing sonifications that aresuitable for use in SOCs. In particular, the sounds should be unfatiguing [176], unobtrusive tothe existing workflow in SOCs, and able to attract the required level of attention from securitypractitioners. While there are other techniques that may be useful, we propose an approach tothis design that draws on techniques and theories of musical composition (as scoped in Section1.3). We can draw on the prior work in aesthetic sonification, and in musification, i.e., thedesign of sonifications that are musical, reviewed in Chapter 2. To understand the scalabilityof the sonification approach to use by security practitioners in general, it will be important toassess the extent to which musical experience affects the ability of security practitioners to usesonification systems in network-security monitoring tasks.
A key aspect of sonification aesthetics that requires investigation for the network-securitymonitoring context is the selection of mappings from data to sound. It has been shown thatthis is a factor that can impact the effectiveness of sonification: in an experiment comparingsonifications of guidance systems, for example, it was shown that sonification strategies basedon pitch and tempo enabled higher precision than strategies based on loudness and brightness[143]. Prior work has indicated preferred mappings from data to sound in certain contexts; formapping physical quantities such as speed and size, for example [67]. Useful parallels can bedrawn between these previous experiments and the network-monitoring context, and hypothesescan thus be made about appropriate data-sound mappings.
Besides aesthetics, aspects of human perception must influence the design: the prior associ-ations sounds may hold for users and the way in which this affects interpretation; and the effectof musical experience on perception. The effect of users’ musical experience on their abilityto understand and make use of sonification systems will require investigation. Here, musicalexperience refers to the level of prior theoretical and practical musical training attained by theuser. For this SOC monitoring context, security practitioners’ use of the systems should not beimpaired by a lack of musical experience.
3.3.2 User Studies and the Utility of Sonification for SOCs
Our review of the prior work showed that there has been a limited amount of user testingof sonification systems for network-security monitoring carried out. As shown in Table 3.1,Gopinath sonified a range of security events in Snort IDS [90], with results indicating thatsonification may increase user awareness in intrusion detection. Mancuso et al. tested theirsonification system with cyber operators searching a packet capture for “target packets” andreported that participants’ performance in detecting these packets was not improved by theintroduction of a particular sonification design [130].
The sonification designs and applications tested in this prior work are limited, and the resultsare not comprehensive enough to suggest that further research in this area is futile. It is clear thatvariations in the sonification design approach may affect the utility of the system for network-security monitoring, and as such further research is required into appropriate sonification designsfor the context. Given the prior work reporting the effectiveness of sonification for signallingnetwork attack types [18, 87, 146], it is worthwhile performing further assessment of differentsonification designs for aiding in SOC practice. These reports were made based on observationsby the researchers, and user testing was not carried out. We aimed to address this gap by carryingout user testing to assess the viability of a sonification system for representing network-security
48

monitoring information to humans.User testing recently reported by Debashi and Vickers showed an improvement in the per-
formance of participants (university students) in detecting network attacks when using theSoNSTAR sonification system [61]. This supports the viability of that sonification system forsignalling network-security monitoring information, and for improving network-security moni-toring performance. This knowledge can be extended, by assessing the effectiveness of differentapproaches to sonifying network-security data (both aesthetically and in terms of the data rep-resented). Additional questions remain to be explored such as the effect of musical experienceon the performance of humans in detecting network attacks using sonification, and the abilityof sonification systems to signal network attacks occurring simultaneously, for example.
It may be the case that certain types of network-security condition can be represented moreeffectively through sonification than others, and that some attacks sound anomalous in a waythat is more easy for security practitioners to use than others. Findings on this subject shouldinform sonification system design by distinguishing the attacks and threats in relation to whichsonification performs best, and the areas in which the technique therefore has the potential tobe most effective. This question could be addressed through an analysis of the differences in theperformance of humans in detecting different types of attack using sonification. Addressing thisquestion comprehensively would mean using systems to sonify wide ranges of network-securityattacks carried out on real-world networks.
Of the user testing carried out in prior work, little has specifically targeted the intended usersof the research presented in this thesis — security practitioners working in SOCs. It is possiblethat some of the Air Force Base personnel who participated in the user testing by Mancuso etal. were security analysts, but this is not made clear in that paper [130]. Furthermore, as shownin Section 2.4.3, while much research exists in identifying challenges and developing technologiesfor improving SOC operations, the potential for using sonification has not yet been explored.
We therefore identify a need for in-context user testing of sonification systems for network-monitoring tasks, carried out with security practitioners working in SOCs, to inform the designand investigate the advantages and disadvantages of the approach. In particular, we aim toinvestigate the hypothesis that sonification can improve the network-monitoring capabilities ofsecurity practitioners. This hypothesis is proposed in light of prior work in other fields in whichit is proven that certain capabilities (peripheral monitoring of information as a non-primarytask, for example [105]) can be improved by the presentation of sonified data, as presented inChapter 2, and of the limited experimental evidence indicating that sonification may be aneffective approach to representing network data [90, 115].
Assessing the utility of sonification systems for SOCs will involve eliciting the SOC-specificuser requirements, exploring contexts in which using sonification might aid in SOC workingpractice, and examining the use of sonification systems by SOC practitioners in their monitoringwork. This will enable validation of the utility of the approach and of proposed systems, andrefinement of appropriate sonification designs. An important part of exploring the utility ofsonification to SOCs will be assessing whether it can improve the performance of users, comparedwith their performance using existing approaches. To make this assessment, the network-securitymonitoring performance of SOC practitioners using existing monitoring methods should becompared with monitoring approaches incorporating sonification. Answers to these questionswill provide a greater understanding of the role sonification can play in improving monitoringcapabilities in SOCs, the limits of the approach, and the extent to which it can be reliable as amonitoring technique.
To further knowledge on the advantages of using sonification for anomaly detection, users’performances in detecting network attacks using the sonification should also be compared withthe performance of existing automated approaches: anomaly-detection systems using machinelearning and statistics, and IDSs. This assessment against existing automated approaches wasoutside the scope of this thesis, and is highlighted as a direction for future work in Chapter
49

10. Debashi and Vickers indicated the potential of sonification in this application by using theSoNSTAR sonification system to identify IP flows relating to bot activity with greater accuracythan three leading machine learning-based traffic classifiers [62].
It is important that sonification systems are tested in the SOC environment, in order to in-vestigate how well they can incorporate into SOCs given the characteristics of that environment— time-criticality and high pressure; a variety of systems running simultaneously; collaborativeworking practice; and high levels of attention required from workers. It is important to noteat this stage that in this thesis, while we aim to create study conditions that replicate SOCconditions as realistically as possible, and explore these integration factors through interviewswith practitioners, we do not actually assess the use of sonification systems deployed in SOCs,and highlight this as a key direction for future work in Chapter 10.
3.4 Summary
We conclude that there is a growing requirement to validate the extent to which using sonifica-tion in SOCs can complement existing practice. The current state of the art provides evidenceof the potential of sonification in advancing network-security monitoring capabilities. Some ofthe sonification systems proposed and in use have been shown to be as effective as, or moreeffective than, other network-security monitoring techniques insofar as a limited amount of usertesting has been performed.
Two key outstanding challenges not fully addressed in the prior literature were presented inSection 3.3. Despite the development of a number of sonification systems in prior work, ques-tions remain around how to design these systems to be suitable for network-security monitoring,and no work has comprehensively explored the design of sonification systems appropriate foruse in the SOC environment. These design-based questions are detailed in Section 3.3.1. Thesecond main question is around the viability and utility of using sonification in network-securitymonitoring tasks. User testing of sonification systems to assess the whether humans can viablyextract network-security monitoring information from the sound has been limited, and no exten-sive assessment of the utility of the approach to SOC practitioners in monitoring tasks relevantto SOCs has been made. These questions relating to user testing are detailed in Section 3.3.2.
It is these two outstanding challenges that we seek to address in the remainder of this thesis.These challenges informed the research questions we developed, as presented in Chapter 1. Inthe next chapter, we present the methodology followed in this thesis, using which we aimed toaddress these questions.
50

Chapter 4
Methodology
We developed a research methodology, aiming to address the questions outstanding after thereview of prior literature (presented in the last chapter) relating to our aim of exploring the po-tential for sonification to aid in SOC practice. We begin this chapter in Section 4.1 by providingan overview of the methodology followed in the remainder of this thesis. Here, we present the re-search approach we proposed based on the outstanding challenges identified in Section 3.3, andshow how each stage of the methodology we developed contributed to this research approach.We also explain how we were informed by the relevant prior work reported in Chapter 2 at eachstage of the research. In Section 4.2, we provide details on the core research methods used inthis thesis: those that were common to multiple chapters. This section serves as a reference forthese methods wherever they are used in the thesis.
4.1 Research Methodology Overview
The methodology followed in this thesis was constructed with the aim of addressing the researchquestions posed in Chapter 1, in line with the research gaps identified in Section 3.3. We showhow the stages of the methodology were developed to address these four research questions, andhow their design was informed by relevant prior work, as presented in Chapters 2 and 3. Aswe explained in Chapter 1, by addressing these four research questions, we aimed to contributeevidence towards the wider question of the potential for sonification to aid in SOC practice: thegoal of this thesis as a whole.
Our research methodology followed an approach to developing sonification systems and as-sessing their utility to SOCs. The research gaps that we aimed to address (as identified in Section3.3) were the formalisation of a sonification model, elicitation of approaches to and requirementsfor the representation of network-security data and sonification design, and the involvement ofSOC practitioners in studies to explore the utility of sonification systems to SOCs. The approachwe proposed to addressing these challenges is illustrated in Figure 4.1, and involves formalis-ing a model for designing sonification systems for network-security monitoring, identifying thenetwork-data representation requirements, investigating sonification design requirements for thecontext, and assessing the utility of the developed systems through user testing.
Figure 4.1 shows the relationships between the different parts of the approach we proposed.The formalised network data sonification model takes as input sound design requirements anddata-representation requirements, and these inputs are informed by the results of iterative usertesting. We believe that these elements combine to form a solution to the problem of designingand testing the utility of sonification systems for network-security monitoring.
Based on this approach, we developed a methodology to enable user-centric investigationof design requirements for sonification for network-security monitoring in SOCs, and validationthrough user testing of the utility of the resulting sonification systems for SOC tasks. In Figure4.2, we illustrate the methodology we followed in conducting the research reported in this
51

Inputnetwork-security
data
Sonificationmodel
Software
Interactionwith users:testing andinterviews
Assessment ofutility: viability
of representation,and use inSOC tasks
Sound design: sonificationaesthetics; SOC-specific
design requirements
Data requirements: datasources, data features;SOC-specific represen-
tation requirements
Figure 4.1: Proposed approach to designing and assessing the utility of sonification systems fornetwork-security monitoring in SOCs
thesis. In the figure, we indicate the project research questions (RQs, as presented in Section1.2) addressed at each stage of the methodology. The research questions (RQs) addressed ateach stage are indicated in yellow boxes, and details of and links between stages are describedin pink boxes.
52

Chapter 5: Sonifica-tion model and pro-totype development
Build sonification modelto be used throughout
research and use itto develop prototypesonification systems
Chapter 6: Proto-type viability study
RQ1
Assess effectiveness ofprototype (developed
in Chapter 5) forsignalling network-
security information
Chapter 7: Inter-views with SOC
practitioners; develop-ment of sonification
system design
RQ2,RQ3
Present design represen-tations and prototype
(developed in Chapter 5and assessed in Chapter6); identify contexts ofuse and requirements;
develop sonification ap-proaches in line with
requirements gathered
Chapters 8 and9: Study to assess
the utility of devel-oped sonification
system in SOC tasks
RQ4
Adapt sonification system(prototype) presentedin Chapter 5 in linewith requirements de-rived in Chapter 7
and data-sound map-pings from AppendixE; assess capabilities
derived in Chapter 7;interview practitioners
Figure 4.2: Overview of DPhil research methodology
Chapter 5
In the research presented in Chapter 5 we formalised a model for the sonification of network-security data, and used it to develop a prototype sonification system. The sonification modelwas at the core of our sonification design process, allowing us to develop systems for testing. Wefed the findings made throughout the thesis relating to sonification design back into the model,and thus made iterative alterations to the sonification design explored in line with our findings.Iterative prototyping and user testing of systems are an important part of UCSD (see Section2.4.1. It was important that the first stage in this research project was the development of thismodel, since all findings made throughout the project related to systems produced using the
53

model, and fed back into it.Figure 4.3 illustrates that in the development of the model, we considered the data require-
ments for network-security monitoring (by extracting data sources and data features throughattack characterisation). Chapter 5 also describes our use of the model to develop a prototypesonification system that was presented to humans in the research reported in Chapters 6 and7. In developing this prototype, we considered sound-design requirements, selecting data-soundmappings for the prototype developments that were reported to be effective in prior work. Wedetail the implementation of the sonification prototype (the software) in Chapter 5.
Inputnetwork-security
data
Sonificationmodel
Software
Interactionwith users:testing andinterviews
Assessment ofutility: viability
of representation,and use inSOC tasks
Sound design: sonificationaesthetics; SOC-specific
design requirements
Data requirements: datasources, data features;SOC-specific represen-
tation requirements
Figure 4.3: Stages of research approach (as presented in Figure 4.1) addressed in Chapter 5
The methodology we followed in developing the model presented in Chapter 5 drew on thefollowing relevant prior work.
• Sonification design patterns were described in Section 2.3.1, and were designed byBarrass for use in selecting sonification approaches for different types of data [23] . Thesedesign patterns informed our decision that it would be appropriate to use parameter-mapping sonification to represent continuous streams of packet-header data. Based on thisdecision we present a model for the musical parameter-mapping sonification of network-security data in Chapter 5, which is the basis for the design of the sonification systemspresented throughout this thesis.
• The Sonification Design Space Map (SDSM) [59] informed the development of thesonification model. This map describes the questions to be addressed in any sonificationdesign process, and is described further in Section 2.3.1. As shown in Chapter 5, weconstructed our model based on our findings from considering these questions from anetwork-security monitoring perspective.
• The parameter-mapping sonification formalisation presented by Hermann [99] wasalso used in the development of the sonification model. We extended this formalisation(which was presented in Section 2.3.1), to be applicable to the sonification of network-security monitoring data specifically, by considering the design questions indicated by theSDSM from a network-security monitoring perspective.
• Reports of previously used sonification mappings from an extensive sonificationof physical properties survey [67] (presented by Dubus and Bresin, and reviewed in Sec-tion 2.3.5) informed our development of the sonification prototype (see Section 5.6.2). In
54

particular, we identified the sound parameters assessed as effective in that prior work,when mapped to data parameters included in our network-security data representation.These data-sound mappings were fed into the model as part of the development of thesonification prototype.
Chapter 6
The research presented in Chapter 6 is an assessment of the effectiveness of the sonificationprototype developed in Chapter 5, with the aim of exploring the viability of using sonificationfor signalling network-security information to humans. As shown in Figure 4.4, at this stage weinputted network-security data (synthetically generated network-attack datasets) to be repre-sented by the developed sonification software, and carried out a user study to produce evidenceon the viability of using sonification for network-security data representation.
Before extracting specific contexts of use for sonification in SOCs, and extracting designrequirements (Chapter 7), it was important to explore the effectiveness with which sonificationcould represent this type of information. For this reason, the viability study was carried out asthe second stage of this research project, and the findings we made in the study supported thenext steps in refining system designs and discussing uses for sonification with SOC practitioners.
Inputnetwork-security
data
Sonificationmodel
Software
Interactionwith users:testing andinterviews
Assessment ofutility: viability
of representation,and use inSOC tasks
Sound design: sonificationaesthetics; SOC-specific
design requirements
Data requirements: datasources, data features;SOC-specific represen-
tation requirements
Figure 4.4: Stages of research approach (as presented in Figure 4.1) addressed in Chapter 6
In the research reported in Chapter 6, we drew on the following relevant information reportedin prior work.
• Sonification user studies reported in prior work, as reviewed in Chapter 3, informedour approach to assessing the performance of participants using the sonification system. Inprevious studies examining the use of sonification by participants in network-monitoringtasks, the accuracy with which participants detected particular network events was as-sessed [61, 130], and this formed a key part of our assessment reported in Chapter 6.
Chapter 7
We explored requirements for the use of sonification in SOCs through interviews with SOCpractitioners, as reported in Chapter 7. Having established the viability of network-securitydata representation using sonification in Chapter 6, it was important to elicit SOC-specificrequirements for data representation and sound design. As shown in Figure 4.5, we could thenuse these requirements to refine the sonification design by feeding them back into the sonification
55

model, producing an altered system for assessment in the final study of this thesis (reported inChapters 8 and 9).
It was also important to understand the contexts in which sonification had the potentialto be useful to SOCs at this stage. This would enable us to design a study (carried out inChapters 8 and 9) that assessed the utility of sonification in tasks in which SOC practitionersfelt that it could aid in their working practice. Establishing such contexts of use was a keyaim of this stage of the research, which acted as a bridge between our research into developingsonification systems that could represent network-security data effectively (Chapters 5, 6), andour assessment of the utility of sonification systems tailored to the requirements of SOCs inSOC-specific tasks (Chapters 8 and 9).
Inputnetwork-security
data
Sonificationmodel
Software
Interactionwith users:testing andinterviews
Assessment ofutility: viability
of representation,and use inSOC tasks
Sound design: sonificationaesthetics; SOC-specific
design requirements
Data requirements: datasources, data features;SOC-specific represen-
tation requirements
Figure 4.5: Stages of research approach (as presented in Figure 4.1) addressed in Chapter 7
The methodology we followed in carrying out the research presented in Chapter 7 drew onthe following relevant prior work.
• Requirements analysis was the approach we used to deriving requirements for the use ofsonification in SOCs. We followed the requirements analysis process presented by Maguireand Bevan [127] (this four-stage process is reviewed in Section 2.4.1), which has beenwidely used in prior literature. The way in which we applied this process in developingthe methodology for our study is shown in Section 7.1.1.
• Reports of prior HCI work in SOCs, as reviewed in Section 2.4.3, informed ourdecision to use semi-structured interviews to identify the needs of users. In this priorresearch, both interviews and ethnographic fieldwork had proved to be effective waysof gathering information on the needs of users working in SOCs. The practicalities andlengths of time that would have been involved with running ethnographic fieldwork meantthat such studies were outside the scope of this research project. We therefore elected touse semi-structured interviews, and highlight studies involving in-SOC ethnographies asan important area for future work in the last section of this thesis (Section 10.3).
• Prior work suggesting potential use cases for sonification in SOCs was drawnon in our development of tentative use cases for sonification in SOCs. As part of therequirements analysis process described above, we drew on existing literature to gatherinitial information. Here, we explored the potential contexts in which sonification mightbe useful to SOCs, based on a number of findings on the properties of sonification in priorwork (experimental evidence of its utility for peripheral monitoring, for example [105]).The development of these tentative use cases in presented in Section 7.2.
56

Chapters 8 and 9
In the research presented in Chapters 8 and 9, we assessed the utility of a sonification system toSOC tasks through user testing in which we quantitatively assessed the monitoring performanceof SOC practitioners using it. The sonification system design and the study design are reportedin Chapter 8, and the results of the study are reported in Chapter 9. As shown in Figure 4.6,we inputted network-security data (network-attack datasets extracted from a dataset createdby researchers carrying out attacks on a network testbed [47]) to the sonification model. At thisstage, some of the design requirements (e.g., the representation of alert data as well as packets,as highlighted by SOC practitioners and reported in Chapter 7) had been fed back into thesonification model, and thus informed the design of the sonification system produced.
Through user testing and interviews, we assessed the utility of the sonification approachdeveloped in SOC-specific tasks. These were tasks in which sonification could have the potentialto be useful to SOCs, based on the views of interviewed security practitioners reported inChapter 7. We also derived further requirements for design and data representation specificto SOCs, based on the qualitative data gathered in interviews with participants, and on ourobservations during the study. These requirements, as shown in Figure 4.6, could then be fedback to inform further sonification design developments for this context, continuing the iterativedesign process. Future research directions based on these requirements are suggested in Section10.3.
Inputnetwork-security
data
Sonificationmodel
Software
Interactionwith users:testing andinterviews
Assessment ofutility: viability
of representation,and use inSOC tasks
Sound design: sonificationaesthetics; SOC-specific
design requirements
Data requirements: datasources, data features;SOC-specific represen-
tation requirements
Figure 4.6: Stages of research approach (as presented in Figure 4.1) addressed in Chapters 8and 9
In the research reported in Chapters 8 and 9, we drew on the following research reported inprior work.
• Existing SIEM designs observed from the sample dashboards produced by SIEM ven-dors, as described in Section 2.2.2, informed the design of the tools (the SIEM and Soni-fication SIEM) we developed for the study. The elements of existing SIEM dashboardsincluded in our designs are shown in Table 8.1.
• Sonification user studies, which informed our approach to assessing the performanceof participants using the sonification system in Chapter 6, as described, also informed ourapproach here ([61, 130], as reviewed in Chapter 3). Again, the accuracy of event detectionby participants formed a key part of our assesment. In order to assess the non-primarytask monitoring capabilities of participants, we drew on the methodology employed by
57

Hildebrandt, Hermann and Rinderle-Ma [105] (as reviewed in Section 2.4.2), in which aseparate primary task was introduced to participants, to be carried out simultaneouslywith a non-primary monitoring task involving sonification.
• Usability questionnaires were used to assess the usability of the study tools presentedin Chapter 8. In particular, SUS [43] and BUZZ [169], which were reviewed in Section 2.4.1,were completed by participants, and analysed to assess system usability, as we report inSection 8.4.2.
4.2 Research Methods
We describe the core research methods used through this thesis: the ethical procedures followed,approaches to statistical analysis, and qualitative research techniques that were used acrossmultiple chapters. Descriptions of research methods that were used only in a single chapterof this thesis (the Likert scale method used in Chapter 7, for example) are provided in themethodology section of the chapter to which they are relevant.
4.2.1 Running Studies and Ethical Procedures
All three studies reported in this thesis involved human participants. Careful adherence toresearch ethics guidelines was therefore required in the procedures involved prior to, during andafter the study, the reporting of results, and the storage of the data collected. For all threestudies, ethical approval was granted by the Central University Research Ethics Committee atthe University of Oxford, under the reference codes presented in Table 4.1.
Table 4.1: Overview of the studies presented in this thesis
Study Type of study Participants/ exclusioncriteria
Ethical approvalreference code
Prototype viability(Chapter 6)
In-person studytasks andinterview
Computer Science andCybersecurity researchers atthe University of Oxford(N=30)
R44043/RE002
SOCs survey andinterviews(Chapter 7)
Online survey;in-personsemi-structuredinterviews
Security practitioners withexperience of working inSOCs (N=21)
R48822/RE001
Assessment ofsonification systemin SOC tasks(Chapters 8 and9)
In-person studytasks andinterview
Security practitioners withexperience of working inSOCs (N=22)
R55132/RE001
Researchers at the University of Oxford were recruited to participate in the prototype vi-ability study through spoken or email contact. For the two studies in which participants weresecurity practitioners with experience of working in SOCs, we targeted SOCs with which wehad previously established relationships. Participants were recruited through spoken or emailcontact with those responsible for the SOC.
A participant consent process took place at the beginning of each study. Participants werepresented with a participant information sheet, including a description of the study aims andprocesses, information on the handling and anonymisation of their data, processes for withdrawalof their data, and contacts should they have any concerns. In the in-person studies, participants
58

then indicated their consent to participate by signing a written consent form. In the onlinesurvey reported in Chapter 7, the participant information sheet took the form of a webpage,and participants indicated their consent to participate by proceeding to the next page of thestudy.
In all studies, participants were able to withdraw their information at any time during orafter the study (prior to the completion of the study analysis) without reason or consequence,and the participant information sheet provided an email address at which to contact the re-searchers if they wished to withdraw. If a participant chose to withdraw, all data collected upuntil the time of their withdrawal was deleted.
We ensured ethical handling of the data collected in the study by anonymising any trendsestablished for publication in research articles and in this thesis. All data collected was stored ina password-protected file on the researcher’s computer, to be accessed only by the researcher. Inaccordance with policy at the University of Oxford, all research data collected in these studieshas been and will continue to be stored for a minimum retention period of three years afterpublication or public release of the research.
4.2.2 Collection of Participant Demographics
In each of the three studies, we collected different sets of participant demographics, accordingto the information we wished to understand about participants. These demographics were col-lected as written responses by participants to preliminary questions presented on paper (or asa webpage in online studies) prior to the beginning of each study. Some of this informationwas used to explore correlations between characteristics of participants (their level of musicalexperience, or their gender, for example), and the results generated by their participation in thestudies.
Table 4.2 shows the studies in which each class of demographic information was collected.The phrasing of the questions used to collect each class of demographic information throughoutthe research is presented in Appendix A. Next to each type of demographic information pre-sented in the table, we indicate the number of the corresponding question presented in AppendixA.
4.2.3 Measuring Accuracy of Network-Event Detection: Precision, Recalland F-Scores
In Chapters 6 and 8, we made assessments of the accuracy with which participants detectednetwork events using precision, recall and F-score. The calculations were made using the fol-lowing formulae. The calculations use the numbers of true-positive (tp), false-positive (fp) andfalse-negative (fn) detections.
• Precision = tptp + fp takes values in the range (0, 1), and is the probability that an object is
relevant given that it is returned by the system [91]: here, the probability that a networkevent was occurring given that the participant clicked.
• Recall = tptp + fn takes values in the range (0, 1), and is the probability that a relevant
object is returned [91]: here, that when a network event occurred, the participant clicked.
• F-score = 2× precision× recallprecision + recall takes values in the range (0, 1), and is the harmonic mean of
precision and recall [91].
4.2.4 Interview Analysis: Transcription and Coding
We used template analysis [116] to analyse the interview data collected in Chapters 7 and 8.This qualitative research approach is useful for analysing data for which the researcher has
59

Table 4.2: Collection of participant demographics during the studies presented in this thesis
Demographic information Cha
pter
6
Cha
pter
7
Cha
pter
s8
&9
Age (1) 3 3
Gender (2) 3 3
Level of musical experience (3) 3 3
Level of network-security monitoringexperience (4)
3 3
Country of origin (5) 3 3
Hearing impairments (6) 3 3
Visual impairments (7) 3
Music listening habits (8) 3
Job role (in SOCs) (9) 3 3
SIEM tool experience (10) 3
Security visualization experience (11) 3
Use of other network-security moni-toring tools (12)
3
some prior understanding of the concepts to be identified. In this process, a coding table isextended and refined from a set of initial themes of interest to the researcher, defined prior tothe data analysis. We began by developing a priori themes to be identified in the data. We thenmanually transcribed our interview recordings, to produce a transcript for each discussion, andspent time becoming familiarised with the data.
We then coded the interview transcript dataset initially, attaching relevant parts of thetranscriptions to the a priori themes. The coding of interview transcripts was carried out inNVivo, a software for qualitative data analysis.1 Sections of data relevant to the research thatdid not fit into these themes were assigned new codes. We thus produced an initial templateof codes, which we then developed through iterative application to the dataset, modifying thetemplate as appropriate to the data. Through this refinement we produced a final template anddataset coded according to it. We then interpreted the data and wrote up the findings. Duringthe interview result interpretation and write-up processes, we engaged in frequent reflections toavoid bias and the influence of personal beliefs.
4.3 Summary
We presented the methodology we followed in carrying out the research presented in the nextfive chapters. The methodology was developed with the aim of addressing the key challengesrelating to our research questions (Chapter 1) that were outstanding based on the prior researchinto the use of sonification for network-security monitoring that we reviewed in Chapter 3. Weillustrated how our approach to the remainder of the research presented in this thesis was takenwith the aim of addressing these challenges. We also showed how we aimed to paint a pictureof the potential utility of sonification to SOCs, and of the ways in which systems should bedesigned for this context, by structuring our methodology in this way.
The specific research methods that are used consistently throughout this thesis were de-
1http://www.qsrinternational.com/nvivo/nvivo-products
60

scribed, and serve as a reference for these methods wherever they are used. In the next chapter,we present our research on the development of a formalised sonification model, and use it todevelop a sonification prototype for initial experimentation. This sonification model, as we havediscussed in this chapter, is at the core of the sonification design process followed throughoutthe remainder of this thesis.
61

Chapter 5
Data Requirements and SonificationModel
In Chapters 3 and 4, we identified a need for a model to enable the design of sonification systemsthat can represent the aspects of network data relevant to network-security monitoring. In thischapter, we report our formalisation of a model for the sonification of network-security data.This model is the basis for the sonification systems we design, experiment with, and adapt,throughout the rest of this thesis.
We begin by exploring the requirements for sonifying the data relevant to network-securitymonitoring, with a view to formalising an approach that meets these needs. We then present themodel, and show how we used it to develop a sonification prototype. This prototype was usedin the studies reported in Chapters 6 and 7. The model we develop is intended to be broadlyapplicable to monitoring a range of sources pertinent to security on a local area network (LAN).This is reflected by our consideration of these sources in the development of the model. We thennarrow the scope considered in the development of the prototype sonification. As we explainedin Section 1.3, our focus in this thesis was on the sonification of network-packet information(and in the later chapters, on the inclusion of alerts); we therefore aimed to use this broadermodel to create a prototype system that sonified network-packet headers.
5.1 Methodology
An overview of the process we followed in the research reported in this chapter is presented inFigure 5.1. As illustrated, we began by defining a network and monitoring scope for this re-search, and considering which attacks could be visible within that scope. We then characterisedthe attacks in terms of the indicators that might be seen within the network and monitoringscope, when they occurred. Using this characterisation, we derived the network-data featuresand sources of monitoring information that would ideally be represented, in order to captureindicators of these attacks. The basis of network-security monitoring is the detection and pre-vention of attacks, and we therefore judged that considering the ways in which attacks areobservable within the scope of a network being monitored would be an appropriate way ofderiving the data-representation requirements of the sonification model.
The required properties of the sonification model were then defined: we considered howsonification design aspects should be addressed in the model. As we explained in Chapter 4,we were guided at this stage by the key questions that should be addressed as part of thesonification design process, according to the Sonification Design Space Map (SDSM) [59]. Thisreflection informed the formalised network-data sonification model that we present, and onwhich the sonifications developed throughout the rest of this thesis are based. The applicationof this model is demonstrated through our development of a prototype sonification system foruse in monitoring network security.
62

Define networkmonitoring and
attack scope
Characteriseattacks toderive data
features
Develop soni-fication model
Apply modelto prototypedevelopment
Figure 5.1: Developing a sonification model: overview of methodology
5.1.1 Scoping of Network Model and Attacks
We began by modelling the organisational network and attack vectors within scope, and definingthe scope of the network monitoring, based on the LAN monitoring scope we presented in Section2.1.
We then applied this scope to the complete list of attacks from the Mitre Common AttackPattern Enumeration and Classification (CAPEC), which lists security attacks, classified ac-cording to their domain and the mechanism by which they are carried out.1 We added furtherattacks to this list as we saw fit (for example, we added data exfiltration to the list). The Mitreresource is very comprehensive and includes a number of attacks whose detection falls outsidethe network model and monitoring scope we considered. We selected the attacks relevant to thiswork according to our scope, discounting those attacks which fell outside it. We carried out thiselimination of attacks outside our scope by defining elements outside the scope (such as attackson mobile phones or organisational websites) and marking attacks that used these vectors asout of scope.
5.1.2 Characterisation of Network Attacks and Selection of Data Features
We described the indicators of each attack, based on a range of sources including the descriptionswritten for each attack in the Mitre CAPEC listing. We then characterised the attacks in termsof the way they are shown through a variety of data features (for example, a characteristic of anattack might be the average packet size, an increase in the traffic rate in a particular protocol,or the insertion of an external drive). The data features we considered were added to as requiredas we moved through the attacks, for example we added a “USB insertions” data feature tohandle USB memory attacks. These data features informed the development of the sonificationmodel, in which we aimed to represent these features.
5.1.3 Development of Sonification Model and Application to Prototype De-velopment
Based on the attack characterisation, and on considering the characteristics of the derived datafeatures, we identified requirements for a sonification model for the mapping of network-securitydata to sound. We formalised these requirements mathematically, to produce a model throughwhich sonifications of network data could be developed. We demonstrated the application ofthis model initially by designing a prototype system for the sonification of data relevant tonetwork-security monitoring.
5.2 Network and Attack Scope
Using the network and monitoring-source description we presented in Chapter 2, we define thenetwork scope over which we consider security monitoring, and the monitoring sources that arerelevant. Based on this, we select and characterise attacks that could be detected within thisscope. This attack selection informs the attacks we experiment with primarily throughout thisproject.
1https://capec.mitre.org/
63

5.2.1 Network-Monitoring Scope
Based on our research scope, as described in Chapter 1, we define our network scope to bean organisational local area network (LAN) (see Figure 5.2). The network-monitoring scope istraffic internal to the LAN (traffic that is inside the firewall). While this is the scope chosenfor this thesis, the scope could be expanded in future work to include monitoring of wirelesstraffic, or traffic external to the firewall (point A in Figure 5.2), for example. We considered theinformation sources by which we could collect information. Based on the information each canprovide, we scoped the information sources that could be monitored within the network scopewe defined. We arrived at the scope of monitoring-information sources illustrated in Figure 2.1.
As shown in the figure, we aimed to monitor for malicious internal network traffic, bymonitoring network-packet traffic, resource-activity logs, and security-tool data (IDS logs, forexample). We assume monitoring from inside the network, at a point between the networkfirewall and internal LAN.
Host
Host
Host
Host
Switch
Host
Host
Host
Host
Switch
Router Firewall
Firewall
Internet
Server(e.g.web)
WirelessWirelesslaptop
Wirelesslaptop
Monitoringinternalnetwork
traffic (B)(anywhere
insidefirewall)
Monitoringtraffic
externalto the
network(outsidefirewall)
(A)Monitoringserver logs
Monitoringhost logs
Monitoringwirelesstraffic
Figure 5.2: Network scope
5.2.2 Attack Scope
Using the Mitre CAPEC listing, we indexed network attacks observable within our network-monitoring scope, discounting those which fall outside its scope. More specifically, we discountedattacks that were:
• Not related to internal traffic on organisational LANs (attacks on mobile phones, forexample).
64

• Not detectable through the network-monitoring information sources we listed.
• Passive, and so not possible to detect by monitoring the network. An example is passivelysniffing and capturing application code on the network (although the installation of apacket sniffer on the network could be detected and would fall within our scope).
The attacks within scope can be divided into four types, related to the stage at which theyare performed:
• Reconnaissance (R):
• Intermediate Steps (S):
• Implantation (I):
• Threat Realisation (T):
Reconnaissance
• Identification of hosts.
– Network ping sweeps: ICMP echo request ping; ICMP address mask request; ICMPtimestamp request; ICMP information request; TCP SYN ping; TCP ACK ping;UDP ping.
– Port scanning: proxy scanning; dumb host scan; scanning ‘FTP bounce’; half scan;TCP SYN scan; TCP connect scan; TCP FIN scan; TCP xmas scan; TCP null scan;TCP ACK scan; TCP window scan; TCP RPC scan; UDP scan.
• Identification of services: services footprinting.
• Identification of network topology: traceroute route enumeration; enumerate mailexchange (MX) records; DNS ZONE transfer.
• Identification of processes: processes footprinting.
• Identification of operating system:
– IP fingerprinting probe: IP ‘ID’ echoed byte-order probe; IP DF ‘don’t fragment bit’echoing probe.
– TCP/IP fingerprinting probe: TCP timestamp probe; TCP sequence number probe;TCP (ISN) greatest common divisor probe; TCP (ISN) counter rate probe; TCP(ISN) sequence predictability probe; TCP congestion control flag (ECN) probe; TCPinitial window size probe; TCP options probe; TCP ’RST’ flag checksum probe.
– ICMP fingerprinting probe: ICMP error message quoting probe; ICMP error messageechoing integrity probe; ICMP IP total length field probe; TCP IP ‘ID’ field errormessage probe.
• Collection of additional information: directory indexing; fuzzing for garnering user/sensitivedata; malware-directed internal reconnaissance; social information gathering via dumpsterdiving; dump password hashes.
• Users and groups enumeration: account footprinting; group permissions footprinting;owner footprinting.
65

• Applications and banners enumeration: fuzzing for garnering J2EE/.NET-basedstack traces for application mapping; fuzzing and observing application log data/errorsfor application mapping; security software footprinting; scanning for vulnerable software.
• General reconnaissance/unspecified: fuzzing.
Intermediate Steps
• Getting access to resources: bypassing ATA password security (ATA is a type of HardDisk Drive technology); directory traversal; password recovery exploitation; dictionary-based password attack; try common (default) usernames and passwords; create files withthe same name as files protected with a higher classification; manipulate writeable con-figuration files; open session remotely.
• Covering tracks: block logging to central repository; disable security software; artificiallyinflate file sizes.
• Creating back doors: removal of filters: input filters, output filters, data masking; forcethe system to reset values; opening ports - enabling telnet and SSH.
Implantation
• Modify system to cause access to or execution of attacker-controlled resource:symlink attack; leveraging/manipulating configuration file search paths; DLL search orderhijacking; poison web service registry; DNS cache poisoning; task impersonation; schemesquatting; tapjacking; leveraging race conditions via symbolic links; user-controlled file-name; modification of registry run keys; altered installed BIOS.
• Implant targeted malware: install new service; modify existing service; install rootkit;replace file extension handlers; schedule software to run; replace trusted executable; runsoftware at logon.
• Physically implant into hardware: malicious logic insertion into product hardware;USB memory attacks.
Threat Realisation
• Confidentiality destruction: exfiltrate data; capture credentials via keylogger.
• Integrity destruction: activity hijack; modify shared file; executing malware to destroyintegrity.
• Availability destruction.
– Flooding attack: TCP flood; UDP flood; ICMP flood; HTTP flood; SSL flood; XMLflood; amplification; DoS; DDoS.
– Excessive allocation: TCP fragmentation; UDP fragmentation; ICMP fragmentation.
– Resource leak exposure.
– Inducing account/system lockout.
– Executing malware to deny availability.
66

5.3 Attack Characterisation and Data Requirements
We characterised each of the network attacks within scope, in terms of the ways in which theyare indicated through attributes of the network data. We began with a list of data features webelieved may be required in order to characterise the attacks (protocol, source IP address, andpacket rate, for example). As we encountered attacks with indicators not yet included in ourlist of features, we added to the features. For an example of the way in which we characterisedattacks, see Table 5.6 (which shows the characterisation of a few example attacks consideredwithin the scope of the prototype developed).
Through this iterative characterisation process, we arrived at a list of data and resources thatthe sonification model should be capable of representing, in order to capture the characteristicsof the network attacks within our scope. It may be unrealistic to represent all of these featuresusing sound, and this is an area for investigation in the future, and in our initial testing stages,in which we will aim to assess the ability of humans to extract information from a prototypesonification system (Chapter 6).
Table 5.1: Data-representation requirements
Data feature Source Treatment Information
Packet rate Packet header Parameter None
Source IP Packet header Parameter Commonness, location(internal/external), rate (fromthat IP)
Destination IP Packet header Parameter Commonness, range, location,rate (at that IP)
Destination port Packet header Parameter Commonness, range, status(open/closed), location, rate (atthat port)
Protocol Packet header Parameter Rate (in that protocol), type
Packet size Packet header Parameter None
Direction of traffic Packet header Parameter Rate (in that direction)
Modified resource Logs Event Type, location
Added resource Logs Event Type, location
Session opened Logs Event Location
Error messagegenerated
Logs Event Type, location
Activity of resources Logs Parameter Rate, resource
CPU usage Logs Parameter Location
Access to unintendedresource
Logs Event Resource
USB insertion Logs Event None
Change to systemprocess
Logs Event Type
Change to systemstructure
Logs Event Type, location
In Table 5.1 we present each data feature identified, the information source from which it canbe monitored, and information about the feature that is needed in order to represent the scopedattacks (e.g., range is information that may be observed about the source IP addresses that areinvolved in communications, an increase in which may signal a distributed flooding attack suchas a DDoS). In the table, we also consider information relevant to the sonic representation of the
67

feature (in the “Treatment” column). Here, we examine whether it is suitable to treat the featureas a parameter (i.e., the values of a data parameter, such as size, represented using parameter-mapping sonification would be continuously mapped to the values of a sound parameter, such asamplitude), or whether the feature should be treated as a event (a defined event the occurrenceof which causes a particular sound event, such as a musical motif, to play).
5.4 Requirements of the Sonification Model
In what follows, we describe the use of the SDSM design questions (as presented by de Campo[59], which we first reviewed in Section 2.3.1) to extract requirements for the model, basedon the attack characterisation and network-security monitoring scope presented. We presenteach question included in the SDSM, then consider context-specific answers. We thus identifyrequirements particular to sonification for network-security monitoring.
• Question 1: How many data points are required for patterns to emerge?The presentation of network data at a range of different resolutions may be required fordifferent monitoring applications:
Requirement 1: the model should enable any number of data points to be represented.
• Question 2: What properties of data dimensions should be represented?The properties of data dimensions represented should be those through which indicatorsof attacks are shown. These may vary based on the network type and the source of themonitoring information:
Requirement 2: the model should enable the inclusion of appropriate data dimensions forindividual designs.
Furthermore, these dimensions may be continuous (for example, packet rate), or discrete(for example, direction of packet flow — incoming/outgoing). Appropriate mapping ofboth continuous and discrete data dimensions should be enabled in order to prevent un-necessary loss of resolution in the data representation (for example, there would be a lossof resolution in a representation in which data with continuous values, such as packetrate, was mapped to a sound with a small number of discrete values, such as type ofinstrument):
Requirement 3: the model should provide a systematic method of mapping continuous anddiscrete data dimensions to continuous and discrete sound dimensions.
• Question 3: How many sound streams should be present in the design?This depends on the network type, use case and monitoring-information source, but ingeneral network data is multivariate, with many network elements, data sources, andpacket flows that require monitoring. We require a method of communicating which ofthese streams is represented by particular sounds: we need to represent information abouta number of different channels of the network data. This means, we need to know what ishappening, and to which parts of the data:
Requirement 4: the model should allow the inclusion of appropriate sound channels forindividual designs, and provide a method for systematically identifying the channels and
the dimensions required in the representation
The formalised model should also meet certain other requirements, based on the observationsthat were made in Section 3.3.1. These can be summarised as follows:
68

• We argued that sonification aesthetics, and mappings, require testing for the context inwhich they are used. As a result, the model should facilitate the insertion of those data-sound mappings selected, according to experimental results and user preferences:
Requirement 5: the model should not prescribe data-sound mappings.
• We argued that experimentation with different musical aesthetics is required to determinethose most suitable for the SOC environment. Therefore:
Requirement 6: the model should not prescribe musical genre, and should allow for choicein its selection.
5.5 Formalised Model for the Sonification of Network-SecurityData
We present a formalised approach to the musical parameter-mapping sonification of network-security data. As we explained in Section 4.1, the model we present is based on the formalisationfor sonification design previously presented by Hermann [99], which we introduced in Section2.3.1. Here, we extend this existing model to be applicable to the sonification of network-securitymonitoring data, by addressing the design questions indicated by the SDSM (as presented inthe previous section).
5.5.1 Formalised Sonification Model
In Tables 5.2 and 5.3 we present a formalised sonification model for designing musical parameter-mapping sonifications for use in network-security monitoring, developed to meet the require-ments identified.
To construct the model, we divided Hermann’s formalisation for the parameter-mappingof a dataset [99] into individual mapping functions for data channels (corresponding to thechannels identified in Requirement 4 ), continuous data dimensions and discrete data dimensions(corresponding to the dimensions identified in the Requirements 2 and 3). In Table 5.2, we definethese data channels and data dimensions. Our approach is well-suited to this context becauseit allows us to reason about the channels of information to be presented for each particularuse case. Moreover, we can systematically identify continuous and discrete data, and theirmost appropriate mappings to sound. After presenting the model, we discuss how it meets therequirements identified.
The model comprises components (individual parts of the data and the sound to be mapped,which we present in Table 5.2), and relations (by which components are associated with oneanother, which we present in Table 5.3). The relations are described by mapping functions. Asonification is described by the tuple of its components and relations (which are described inTables 5.2 and 5.3):
〈CDR,DDR,VDR, Relc, Reldα, Reldβ, Relv〉.
The relations presented in Table 5.3 are described by the channel-mapping function (whichdescribes the channel relation Relc) and the dimension-mapping function (which describes boththe dimension relation Reld and the value relation Relv). We also treat sound dimensions dsas functions of sound channels cs, which have values in the tuple of sound values of each sounddimension, vs.
The channel-mapping function ψ:Rn → Rm describes the mapping from a tuple of ndata channels CD = 〈cd1, ..., cdn〉 to a tuple of m sound channels CS = 〈cs1, ..., csm〉. Theq-dimensional sound signal s(t) is computed as the sum over m sound channels cs of thedimension-mapping function Γ : Rm+1 → Rq,
69

Table 5.2: Description and formal notation of model components
Component Description Formal Notation
Data channels Parts of the network-security monitoringinformation, about which information shouldbe presented, e.g. individual packets, IDSalerts, sensitive IP addresses on the network
The tuple CD of data channels cd
Data dimensions Types of information we can present aboutdata channels, e.g. amount of activity (atnetwork IPs, for example), protocol used (inpacket transmission), CPU usage (of networkmachines). These can have continuous ordiscrete values
The tuple DD of data dimensions dd . The tuple ofdata dimensions DD is the concatenationDDα_DDβ of the tuple DDα of continuous datadimensions ddα, and the tuple DDβ of discretedata dimensions ddβ
Data values The values data dimensions can take. Thesecan be continuous or discrete, e.g. acontinuous scale from low to high (for packetrate, for example); discrete names (ofprotocols)
The tuple VDdd of data values vddd of the datadimension dd
Sound channels Streams of sound which we can vary sonically,e.g. individual tone events, or separatemelodic/instrumental lines
The tuple CS of sound channels cs
Sounddimensions
Types of sonic variations we can make tosound channels, e.g. varying the tempo orloudness at which they are presented, or theharmonic structure they follow. These canhave continuous or discrete values
The tuple DS of sound dimensions ds. The tupleof sound dimensions DS is the concatenationDSα_DSβ of the tuple DSα of continuous sounddimensions dsα, and the tuple DSβ of discretesound dimensions dsβ
Sound values The values sound dimensions can take. Thesecan be continuous or discrete, e.g. acontinuous scale from slow to fast (tempo);discrete names of instruments
The tuple VSds of sound values vsds of the sounddimension ds
Table 5.3: Description and formal notation of model relations
Relation Description Formal Notation
Channel relation Data channels are mapped to sound channels Channel relation Relc: CD ↔ CS is a totalrelation between the tuple of data channels andthe tuple of sound channels
Dimensionrelation
Data dimensions are mapped to sounddimensions (which can be discrete orcontinuous)
• Continuous dimension relation, inwhich continuous data dimensions aremapped to continuous sounddimensions
• Discrete dimension relation, in whichdiscrete data dimensions are mappedto continuous or discrete sounddimensions
Dimension relation Reld: DD ↔ DS is a totalrelation between the tuple of data dimensions andthe tuple of sound dimensions
• Continuous dimension relation Reldα:DDα↔ DSα is a total relation between thetuple of continuous data dimensions andthe tuple of continuous sound dimensions
• Discrete dimension relation Reldβ :DDβ ↔ DSβ is a total relation betweenthe tuple of discrete data dimensions andthe tuple of discrete sound dimensions
Value relation Values of data dimensions are mapped tovalues of sound dimensions
For each data dimension dd , mapped to sounddimension ds, value relation Relvdd :VDdd ↔ VSds is a total relation between the tupleof data values of dd and the tuple of sound valuesof ds
s(t) =∑m
i=1 Γi(cs i, t),
where cs i is the output of the channel-mapping function ψ : Rn → Rm applied to the datachannel cd j and time t:
70
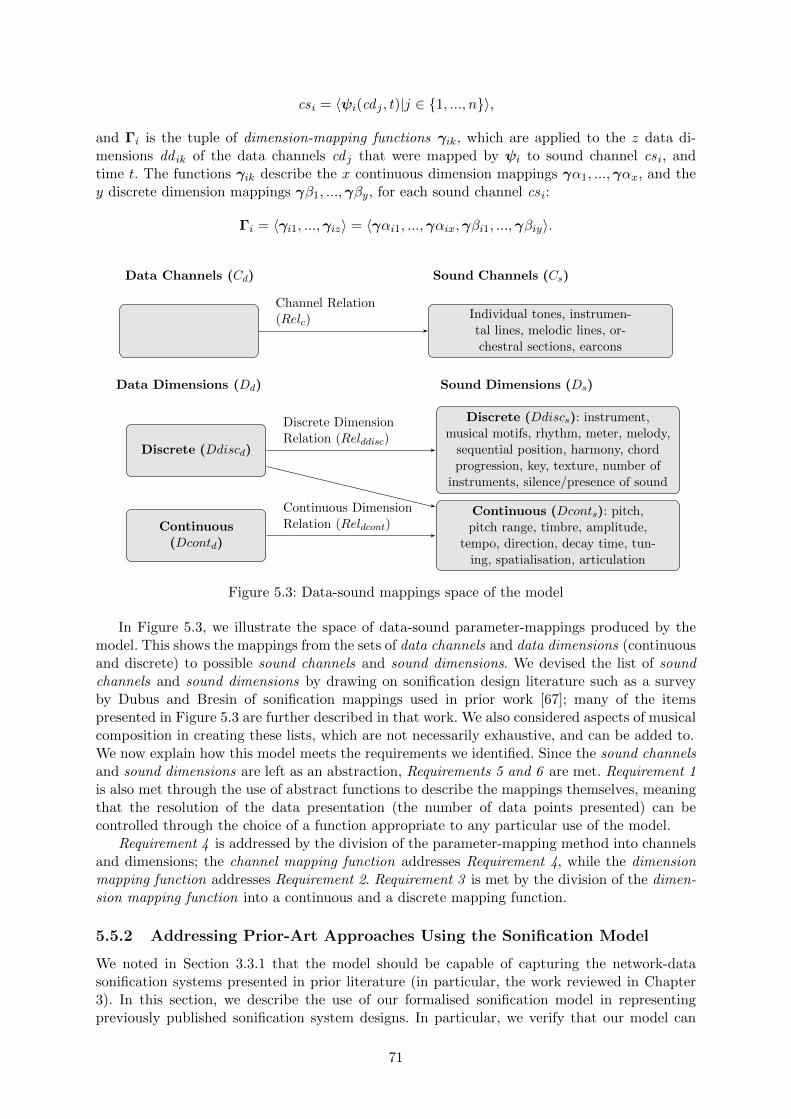
cs i = 〈ψi(cd j , t)|j ∈ {1, ..., n}〉,
and Γi is the tuple of dimension-mapping functions γik, which are applied to the z data di-mensions dd ik of the data channels cd j that were mapped by ψi to sound channel cs i, andtime t. The functions γik describe the x continuous dimension mappings γα1, ...,γαx, and they discrete dimension mappings γβ1, ...,γβy, for each sound channel cs i:
Γi = 〈γi1, ...,γiz〉 = 〈γαi1, ...,γαix,γβi1, ...,γβiy〉.
Sound Channels (Cs)Data Channels (Cd)
Individual tones, instrumen-tal lines, melodic lines, or-chestral sections, earcons
Channel Relation(Relc)
Data Dimensions (Dd) Sound Dimensions (Ds)
Discrete (Ddiscs): instrument,musical motifs, rhythm, meter, melody,
sequential position, harmony, chordprogression, key, texture, number of
instruments, silence/presence of sound
Discrete (Ddiscd)
Discrete DimensionRelation (Relddisc)
Continuous (Dconts): pitch,pitch range, timbre, amplitude,
tempo, direction, decay time, tun-ing, spatialisation, articulation
Continuous(Dcontd)
Continuous DimensionRelation (Reldcont)
Figure 5.3: Data-sound mappings space of the model
In Figure 5.3, we illustrate the space of data-sound parameter-mappings produced by themodel. This shows the mappings from the sets of data channels and data dimensions (continuousand discrete) to possible sound channels and sound dimensions. We devised the list of soundchannels and sound dimensions by drawing on sonification design literature such as a surveyby Dubus and Bresin of sonification mappings used in prior work [67]; many of the itemspresented in Figure 5.3 are further described in that work. We also considered aspects of musicalcomposition in creating these lists, which are not necessarily exhaustive, and can be added to.We now explain how this model meets the requirements we identified. Since the sound channelsand sound dimensions are left as an abstraction, Requirements 5 and 6 are met. Requirement 1is also met through the use of abstract functions to describe the mappings themselves, meaningthat the resolution of the data presentation (the number of data points presented) can becontrolled through the choice of a function appropriate to any particular use of the model.
Requirement 4 is addressed by the division of the parameter-mapping method into channelsand dimensions; the channel mapping function addresses Requirement 4, while the dimensionmapping function addresses Requirement 2. Requirement 3 is met by the division of the dimen-sion mapping function into a continuous and a discrete mapping function.
5.5.2 Addressing Prior-Art Approaches Using the Sonification Model
We noted in Section 3.3.1 that the model should be capable of capturing the network-datasonification systems presented in prior literature (in particular, the work reviewed in Chapter3). In this section, we describe the use of our formalised sonification model in representingpreviously published sonification system designs. In particular, we verify that our model can
71

address all previous systems (those in which the sonification design is specified completely)that use a musical parameter-mapping sonification method to represent low-level network data(these aspects of the systems are presented in Table 3.1) [18, 44, 88, 130, 146]. Other relevantsystems which use a musical parameter-mapping approach to represent low-level network dataare presented in [115, 142], but the sonification designs for these works are not specified inenough detail to include.
Table 5.4: Applying the formalisation to capture previous musical parameter-mapping systemsfor the sonification of low-level network data: components
Author Data Channels Data Dimensions Sound Channels Sound Dimensions
Qi [146]Mapping 1:
Traffic queue 16(cd1)
Continuous: Byte rate(ddα11); Packet Rate(ddα12)
Piano tones (cs1) Continuous: Frequency(dsα11); Amplitude(dsα12)
Qi [146]Mapping 2:
Traffic queues 1–16(cd1, ..., cd16)
Continuous: Byte rate(ddα11); Packet rate(ddα12)
16 groups of pianotones(cs1, ..., cs16)
Continuous: Frequency(dsα11); Amplitude(dsα12)
Brown[44]
Network traffic(cd1)
Continuous: Packet rate(ddα11; Number of TCPhandshakes (ddα12);Number of HTTP errormessages (ddα13)
Existing musicalpiece (cs1)
Number of sharp notes(dsα11); Continuous:Pitch (dsα12); Rhythm(dsα13)
Ballora[18]
Socket exchanges(cd1); Requests tounusual ports(cd2); Traffic infive differentmonitoringlocations (withintwo subnets;between subnets;external trafficgoing to eachsubnet) (cd3)
Continuous: Source IP(ddα11); DestinationIP(ddα12); Frequency ofpackets in ongoing socketconnections (ddα13);Traffic rate (ddα34)Discrete: Port number(ddβ21)
An individualstrike of a gong(cs1); Hummingsound (cs2); Fivedistinct whooshingsounds (cs3)
Continuous: Rumble’stimbre (dsα11); Sizzle’stimbre (dsα12); Stereo panposition (dsα13); Force ofstrike (dsα14); Timbre (ofhumming sound) (dsα25);Amplitude (of whooshingsound) (dsα36)
Giot [88] Packets (cd1);useless packets(e.g. ACK packets)(cd2)
Continuous: Packet size(ddα11); Time-To-Live(TTL) (ddα12);Rate/bandpass (ddα13);Number of useless packets(ddα21)Discrete: Protocol(ddβ11)
Individual noteevents (MIDI)(cs1); Noise (cs2)
Continuous: Frequency(dsα11); Note duration(dsα12); Bandpass ofresonant filter (dsα13);Amount of noise (dsα24)Discrete: Soundsynthesiser (dsβ11);
Mancuso[130]
Individual packets(cd1)
Continuous: Source IP(ddα11); Destination IP(ddα12)Discrete: Packet size(ddβ11)
String note (cs1);wind note (cs2)
Continuous: Pitch(dsα11, dsα21); amplitude(dsα12, dsα22)
In Table 5.4 we present the relevant pre-existing sonification systems in terms of the datachannels and data dimensions, and the sound channels and sound dimensions of our model. InTable 5.5 we present the channel relations and dimension relations for each prior sonificationapproach addressed. This shows that the systems addressed can all be represented in our model,which allows for comparative testing of newly developed sonification systems against pre-existingapproaches.
5.6 Application of the Model to Facilitate Prototype Design
To illustrate the application of the model, in this section we show how we used it to design a pro-totype sonification system for network packet-header data. The aim was to create a sonificationprototype that would represent network packet-header data continuously, such that attack con-
72

Table 5.5: Applying the formalisation to capture previous musical parameter-mapping systemsfor the sonification of low-level network data: relations
Author Channel Relations Dimension Relations
Qi [146]Mapping 1:
Single traffic queue → allpiano tones (cs1 = ψ(cd1))
Byte rate → frequency (dsα11 = γα1(ddα11, t)); Packet rate →amplitude (dsα12 = γα2(ddα12, t))
Qi [146]Mapping 2:
Traffic queue i → piano tonesgroup i(csi = ψ(cdi)∀i ∈ {1, ..., 16})
Byte rate → frequency (dsαi1 = γα1(ddαi1, t)∀i ∈ {1, ..., 16});Packet rate → amplitude (dsαi2 = γα2(ddαi2, t)∀i ∈ {1, ..., 16})
Brown[44]
Network traffic → existingmusical piece (cs1 = ψ(cd1))
Traffic rate → number of sharp notes (dsα11 = γα1(ddα11, t));Number of TCP handshakes → pitch (dsα12 = γα2(ddα12, t));Number of HTTP error messages → rhythm(dsα13 = γα2(ddα13, t))
Ballora[18]
Socket exchange → individualstrike of gong (cs1 = ψ(cd1));Request to unusual port →humming sound; Traffic in fivedifferent monitoring locations→ five distinct whooshingsounds
Source IP → gong rumble’s timbre (dsα11 = γα1(ddα11, t));Destination IP → gong sizzle’s timbre (dsα12 = γα2(ddα12, t));Source IP, Destination IP → Stereo pan position(dsα13 = γα3(ddα11, ddα12, t)); Frequency of packets → force ofstrike (dsα14 = γα4(ddα13)); Port number → Timbre of hummingsound (dsα25 = γβ1(ddβ21)); Traffic rate → Amplitude ofwhooshing sound (dsα36 = γα4(ddα34))
Giot [88] Packets → individual noteevents (cs1 = ψ(cd1)) Uselesspackets → noise(cs2 = ψ(cd2))
Packet size → frequency (dsα11 = γα1(ddα11, t); TTL → noteduration (dsα12 = γα2(ddα12)); Rate → bandpass of resonant filter(dsα13 = γα3(ddα13)); Protocol → sound synthesiser(dsβ11 = γβ1(ddβ11)); Number of useless packets → amount of noise(dsα24 = γα4(ddα21))
Mancuso[130]
Individual packets → stringnote, wind note(cs1 = ψ(cd1), cs2 = ψ(cd1))
Source IP → pitch of string note (dsα11 = γα1(ddα11, t));Destination IP → pitch of wind note (dsα21 = γα2(ddα12, t));Packet size → Amplitude (of string note and wind note)(dsα12 = γβ1(ddβ11)), (dsα22 = γβ1(ddβ11))
ditions would be indicated sonically. We begin by presenting the network-attack characterisationthat we used to derive the attack indicators to be represented for a defined network-monitoringscope (this was similar to the attack characterisation reported previously that was used indeveloping the model, but focused on a monitoring-information scope of packet headers only,omitting the others used earlier in this chapter, such as host and server logs). We demonstratehow the formalised model was applied, using these attack indicators, to generate the sonificationprototype design, and we describe its implementation.
5.6.1 Data Requirements: Network-Attack Characterisation
The data requirement was that network packet-header data should be represented such thatattacks are signalled by the sonification. We characterised the data requirements for representingindicators of attacks that can be detected within a network-monitoring scope. For this prototypesonification system, the scope was defined as follows:
1. The network is a local area network (LAN).
2. The network data monitored is packet-header information, excluding packet contents.
3. Network data is monitored in real time only (we therefore excluded aspects such as supplychain attacks on hardware components during manufacture and transportation).
With this scope in mind, we considered the attacks included in the Mitre CAPEC list.From this list, we selected attacks that fell within the defined scope. Excluding packet contentsespecially enabled us to narrow the scope of attacks considered initially to a list of around 20types of attack, including reconnaissance such as port scanning, and threat realisation such asservice flooding. This is because many of the attacks listed in CAPEC could not be detectedby monitoring only packet header information without packet contents.
73

We characterised the attacks in terms of the way they are indicated through the networkdata monitored, i.e. packet-header information. After completing this work, we were able toproduce a summary of the data features needed to capture indicators of the attacks within thenetwork monitoring scope. The data features we selected are defined as follows.
• Packets: the flow of packets into, out of or within the network.
– Rate: the amount of traffic.
– Direction: The direction in which network traffic is moving (entering network, leavingnetwork, moving within network).
– Size: the byte count of a packet.
– Protocol : the protocol with which traffic is associated.
∗ Rate: the amount of traffic transmitted using a particular protocol.
– Source IP : the IP from which packets are sent, within or outside the network.
∗ Rate: the amount of traffic associated with a source IP address.
∗ Commonness: how frequently the source IP from which traffic is sent is presenton the network.
– Destination IP/port : the IP and port to which packets are sent, within or outsidethe network.
∗ Rate: the amount of traffic associated with a destination IP address or port.
∗ Commonness: how frequently the destination IP or port to which traffic is sentis present on the network.
The derived data features are shown in Table 5.6. In the table, the leftmost three columnsdisplay the data features, while the rightmost three columns show the characterisation of threeexamples of attacks (TCP SYN scan, data exfiltration and DDoS) in terms of these features.The data features entered in each column are characteristics of those in the preceding column.For example, rate (third column) is a characteristic of source IP, (second column), which isitself a characteristic of packet (first column). The attack characterisation columns show howwe used the data features to characterise three different network attacks. For example, given adata exfiltration attack, the data features listed in the second attack characterisation columnof Table 5.6 are required.
74

Table 5.6: Network-attack characterisation examples and data-presentation requirements
Required Data Attack characterisation
Features Features(Characteristicsof First Column)
Features(Characteristics ofSecond Column)
TCP SYN scan Data exfiltration DDoS
TCP protocol, SYN packetssent to a range of destinationports on a host
Data exfiltrated fromnetwork to externaladdress
Network is flooded by a highwide oftraffic sent frommultiple hosts
Packet
Rate High
Direction Inbound Outbound Inbound
Size
Protocol FTP
Rate High
Source IP Single IP outsidenetwork
Single IP insidenetwork
Multiple IPs outside network
Rate High High High
Commonness Uncommon Multiple uncommon
Destination IP Single IP insidenetwork
Single IP outsidenetwork
One or more IPs inside network
Rate High High High
Commonness Uncommon
Destination port Ports on single host IP insidenetwork
Rate
Commonness Multiple uncommon (manyports targeted — scan)
75

5.6.2 Applying the Sonification Model
The aim of the prototype was to sonically represent network data through which an attackmight be signalled with as high a resolution as possible, in order to enable anomaly detectionthrough emerging sound patterns. We show how we applied the model in the design of thesonification by considering appropriate data channels, dimensions and values. We develop aprototype design, and highlight challenges in the implementation.
We derived the data channels, data dimensions and data values for the prototype using thedata requirements presented in Table 5.6. In this case, in order to achieve the highest possibleresolution in the sonification of these data requirements, we aimed to present, as closely aspossible, each packet captured, and to represent as much information about each packet aspossible as dimensions of the packet channel. We therefore let the entries in the first column(a single entry: packets) of Table 5.6 be the tuple of data channels, and entries in the secondcolumn be the tuple of data dimensionsFor this prototype, the sonification is described by the tuple〈CDR,DDR,VDR, Relc, Reldα, Reldβ, Relv〉:
• CDR = 〈cdR1〉 = 〈packets〉
• DDR = DDα_R DDβR = 〈ddαR1, ddαR2〉_〈ddβR1, ddβR2, ddβR3, ddβR4〉 = 〈Rate,Size〉_〈Type of information, Commonness, Direction, Protocol〉
• VDdR=〈vddαR1, vddαR2, vddβR1, vddβR2, vddβR3, vddβR4〉 = 〈{low, normal, high},{small,normal, large},{source IP, destination IP, source port, destination port},{hotlisted, not hotlisted},{incoming,outgoing,internal},(the protocols present in thedataset)〉
• Relc is described by the function ψi : R1 → Rm, cs i = ψi(cd1)
• Reld and Relv are described by the function Γ : Rm+1 → Rq,Γi=〈γαi1, ...,γαix,γβi1, ...,γβiy〉∀i ∈ {1, ...,m}
In describing some data values, we used a notion of “normal”. This is left as an abstractionin the model, and describes some expectation for the observed behaviour of the data dimensions.We discuss how this normal abstraction might be implemented in sonification designs in Section5.6.3.
To simplify the design process, we describe data values for rate and size as discrete points ofinterest (for example, low, high, narrow, wide). This description does not exclude the possibilityof mapping continuously in the representation, but allows indication of the polarity required indimension mapping. In sonification, polarity is the direction of the mapping from data to sound.For example, positive mapping polarity from the data dimension rate to the sound dimensionamplitude would be described:
• rate: high → amplitude: loud;
• rate: low → amplitude: soft.
In Figure 5.4, we present the sonification mappings space introduced in Figure 5.3, appliedto the prototype design. This shows the data channels, continuous data dimensions and discretedata dimensions with all possible mappings to sound channels and sound dimensions.
To determine the mappings from data to sound for the prototype, we selected sound channels,continuous sound dimensions and discrete sound dimensions from the sets CS , DSα and DSβrespectively. We made predictions about appropriate mappings, drawing on a survey of mappings
76
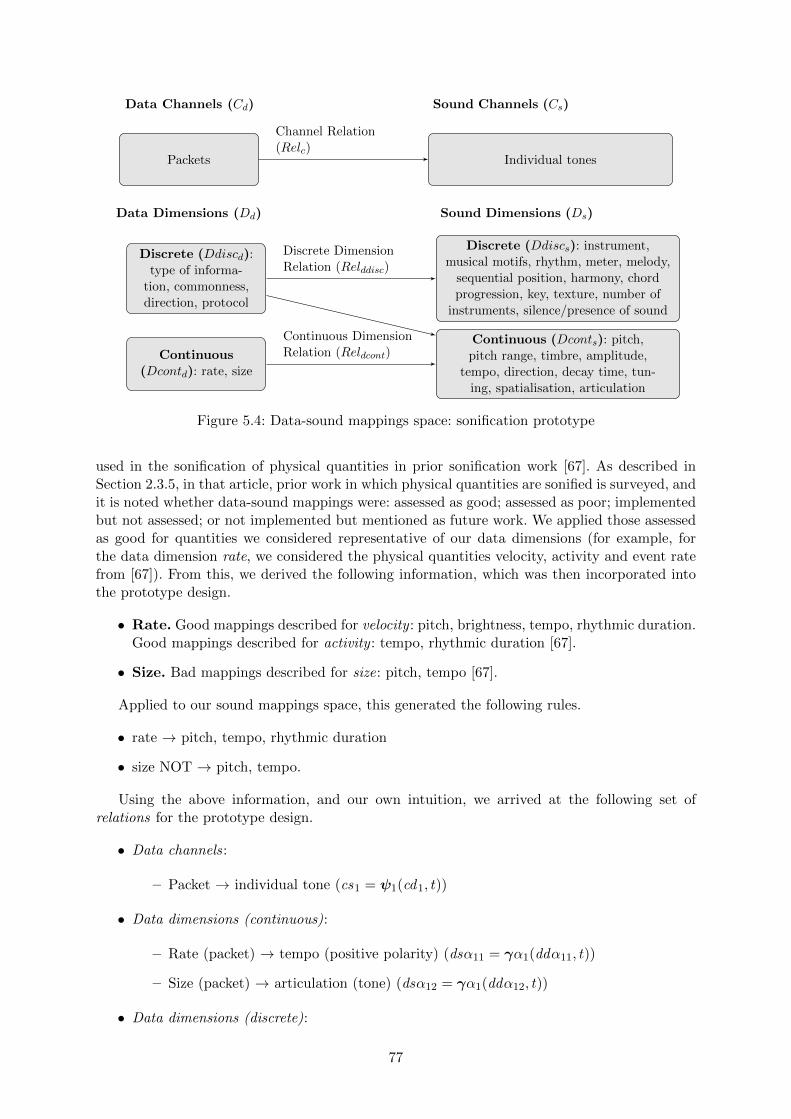
Sound Channels (Cs)Data Channels (Cd)
Individual tonesPackets
Channel Relation(Relc)
Data Dimensions (Dd) Sound Dimensions (Ds)
Discrete (Ddiscs): instrument,musical motifs, rhythm, meter, melody,
sequential position, harmony, chordprogression, key, texture, number of
instruments, silence/presence of sound
Discrete (Ddiscd):type of informa-
tion, commonness,direction, protocol
Discrete DimensionRelation (Relddisc)
Continuous (Dconts): pitch,pitch range, timbre, amplitude,
tempo, direction, decay time, tun-ing, spatialisation, articulation
Continuous(Dcontd): rate, size
Continuous DimensionRelation (Reldcont)
Figure 5.4: Data-sound mappings space: sonification prototype
used in the sonification of physical quantities in prior sonification work [67]. As described inSection 2.3.5, in that article, prior work in which physical quantities are sonified is surveyed, andit is noted whether data-sound mappings were: assessed as good; assessed as poor; implementedbut not assessed; or not implemented but mentioned as future work. We applied those assessedas good for quantities we considered representative of our data dimensions (for example, forthe data dimension rate, we considered the physical quantities velocity, activity and event ratefrom [67]). From this, we derived the following information, which was then incorporated intothe prototype design.
• Rate. Good mappings described for velocity : pitch, brightness, tempo, rhythmic duration.Good mappings described for activity : tempo, rhythmic duration [67].
• Size. Bad mappings described for size: pitch, tempo [67].
Applied to our sound mappings space, this generated the following rules.
• rate → pitch, tempo, rhythmic duration
• size NOT → pitch, tempo.
Using the above information, and our own intuition, we arrived at the following set ofrelations for the prototype design.
• Data channels:
– Packet → individual tone (cs1 = ψ1(cd1, t))
• Data dimensions (continuous):
– Rate (packet) → tempo (positive polarity) (dsα11 = γα1(ddα11, t))
– Size (packet) → articulation (tone) (dsα12 = γα1(ddα12, t))
• Data dimensions (discrete):
77

– Type of information (packet) → pitch range (tone) (dsβ11 = γβ1(ddβ11, t))
– Commonness (packet) → harmony (tone) (dsβ12 = γβ2(ddβ12, t))
– Direction (packet) → spatialisation (tone) (dsβ13 = γβ2(ddβ13, t))
– Protocol (packet) → instrument (tone) (dsβ14 = γβ2(ddβ14, t))
Table 5.7: Sonification prototype: design and basis in the sonification model. Dark grey bandsindicate the relation between data channels and sound channels (between CD and CS ), anddata dimensions and sound dimensions (between DD and DS ). Light grey bands indicate thebreakdown of data and sound dimensions into continuous and discrete dimensions. White bandsindicate the data channels and dimensions, and sound channels and dimensions, we selected tocreate this sonification prototype.
DataComponent
Relation SoundComponent
Description of Mapping
Data channels(CD)
Channel Relation−−−−−−−−−−→(Relc)
Sound channels(CS )
Network packet(cd1)
Tone event (cs1) Sampled packet → tone event
Datadimensions(DD)
Dimension Relation−−−−−−−−−−−−→(Reld)
Sound dimensions(DS )
Datadimensions(continuous)(DDα)
Continuous Dimension−−−−−−−−−−−−−−→Relation (Reldα)
Sound dimensions(continuous) (DSα)
Packet rate(ddα11)
Tempo (dsα11) Higher packet rate → fastertempo
Packet size(ddα12)
Articulation(dsα12)
Smaller packet size → Morestaccato tone (shorter tonelength)
Datadimensions(discrete)(DDβ)
Discrete Dimension−−−−−−−−−−−−→Relation (Reldβ)
Sound dimensions(continuous ordiscrete) (DSα,DSβ)
Direction oftraffic (ddβ13)
Pan (dsβ13) Incoming traffic → left pan;outgoing traffic → right pan
Type ofinformation(IP/port)(ddβ11)
Pitch range (dsβ11) Source IPs → low range;destination IPs → mediumrange; destination ports →high range
Commonness(ddβ12)
Harmony (dsβ12) IP/port in hotlist → harmonytones; IP/port not in hotlist →dissonant tones
Protocol(ddβ14)
Instrument (dsβ14) HTTP traffic → string; TCPtraffic → clarinet; FTP traffic→ piano; Other → strings
Table 5.7 describes the sonification prototype developed from the relations. This is the
78

prototype that we used to assess the viability of sonification for enabling humans to hear networkattacks in the study presented in Chapter 6.
5.6.3 Implementing the Sonification Prototype
We implemented the prototype, such that it could be applied to sonify network packet-headerdatasets in comma-separated value (CSV) format. The implemented prototype uses Python toread a dataset and parses the data values according to the mapping functions presented inTable 5.8. We then use a separate Python program to read this parsed output in (pseudo) realtime, sample packets, and send Open Sound Control (OSC) messages containing the sonificationvalues of the packets sampled to the sound engine in SuperCollider audio synthesis platform.SuperCollider is a platform for audio programming and synthesis (which we described in Section2.3.1), which has been used frequently in prior sonification work. Figure 5.5 illustrates thisprocess.
Networkpacket-
capture CSV
Pythonparser
PythonOSC sender
SuperCollidersound engine
Sonificationoutput
parsed CSV OSC messages
Figure 5.5: Sonification system implementation
As described in Table 5.7, the system sonifies incoming and outgoing packet rate, mappingincoming traffic to a left pan (such that all incoming traffic is heard through the left speakeror headphone), and outgoing traffic to a right pan. Internal network traffic is not sonifiedin the system presented. Selected protocols and applications over which packets are sent arerepresented by the instruments in which sound events play.
The pitch range within which a sound event plays represents the type of information de-scribed. Information about source and destination IPs, and destination ports, is played as low-medium- and high-range sound events respectively. For each of these three information types,hotlists (lists of the most commonly observed) are calculated based on the first section of thedataset used.
For each packet sonified, the IP and port values are checked against their respective hotlists.If the value is found in the hotlist (and is therefore “common”), it is mapped to a harmony note;otherwise (if the value is “uncommon”), it is mapped to a random frequency within the pitchrange, so sounds dissonant. As such, packets with unusual source IP addresses are representedas three-tone chord sound events in which the lowest tone (representing source IP) is dissonant,for example.
To test that the implemented prototype ran correctly, we used it to sonify the Centre forApplied Internet Data Analysis (CAIDA) “DDoS Attack 2007” dataset [75]. We encounteredsome challenges during this phase; in the following, we reflect on possible solutions to thesechallenges, and hence identify directions for future development. The most significant challengewhen running the prototype on this real-world capture of network traffic arose as a result ofthe sheer number of packets logged in the dataset, and the small times between their arrival.Because of this, it was challenging to implement the channel relation ψ1 — to render eachpacket observed as individual tones without overloading the sound engine, or creating soundstoo complicated to be of use to human listeners.
To address this challenge, we use linear sampling of the packets represented by the prototype,
79

Table 5.8: Implementation of the sonification prototype
Relation Addressed Description of Implementation Mapping Function
Channel relation:cs1 = ψ1 (cd1 , t)
Individual packets observed are mapped to individualtones
The function ψ1 can be described: forthe pth packet cd1p observed at timet, play a single tone cs1p at time t
Dimension relation:dsα12 = γα2(ddα12, t)
Destination IP is mapped to spatialisation (pan fromleft to right headphone). Here, the possibledestination IP addresses take values in the range[0, 232], we converted destination IP addresses tovalues in this range using a function such that IPaddress 0.0.0.0 → 0, and 0.0.0.1 → 1. The pan valuevaries continuously in the range [−1, 1]
The function γα2 can be described:for a tone cs1p played at time t, andIP conversion function IPVal, the pan
value is dsα12p =IPVal(ddα12p)×2
232− 1
Dimension relation:dsα13 = γα3(ddα13, t)
Source IP is mapped to pitch. Here, the possiblesource IP addresses take values in the range [0, 232]and the frequencies vary in the chosen range[261.63, 2093]. Frequency 261.63Hz corresponds to C4— middle C — while frequency 2093Hz correspondsto C7, three octaves higher. We also use a hotlistingmethod: the top 50 source IPs we expect to observeare mapped to harmonic tones (the notes of a Cmajor 7th chord), while source IPs outside thishotlist are mapped on a continuous scale tofrequencies in the selected range
For a source IP hotlist tuple Hs, andtuple Mn of musical notes〈C,E,G,B〉, the function γα3 can bedescribed: for tone cs1p at time t, andIP conversion function IPVal, thepitch value isddα13p ∈ Hs =⇒ dsα13p ∈Mn,ddα13p 6∈ Hs =⇒ dsα13p =IPVal(ddα13p)×(2093−261.63)
232+ 261.63
Dimension relation:dsα14 = γα4(ddα14, t)
Destination port is mapped to articulation. Here, thepossible destination ports take values in the range[0, 216], and the articulation takes values in the range[0.1, 1]. Many packets observed in this dataset did nothave destination port values; in these cases we set thesound articulation value to be 0.5 in SuperCollider.
The function γα4 can be described:for a tone cs1p played at time t, thearticulation value isdsα14p =
ddα14p×0.9
216+ 0.1
Dimension relation:dsα15 = γα5(ddα15, t)
Size is mapped to amplitude (positive polarity).Here, for the dataset we implemented the averagepacket size was 60 bytes, while occasional packetsizes were very large. We mapped the size values ofthe packets to the amplitude values of the soundusing a logarithmic function, in which the averagepacket size, 60, mapped to an amplitude value wejudged “comfortable” — the amplitude value 1 inSuperCollider.
The function γα5 can be described:for a tone cs1p played at time t, theamplitude value is
dsα15p = 12
(log10(ddα15p
60× 100))
Dimension relation:dsβ11 = γβ1(ddβ11, t)
Protocol is mapped to instrument. Here, a hotlistingmethod is used again. The two protocols mostfrequently seen in this dataset are mapped onto twodifferent instruments; the remaining protocols aremapped to another instrument. For this dataset, thetuple of hotlisted protocols is: Hp = 〈ICMP, TCP〉,and the tuple of instruments selected was:Mi = 〈strings, saxophone, piano〉
The function γβ1 can be described:for a tone cs1p played at time t, theinstrument value isddβ11p ∈ Hp =⇒ dsβ ∈ 〈Mi1,Mi2〉,ddβ11p 6∈ Hp =⇒ dsβ = Mi3
such that the number of sound events played (tempo) correlates linearly with the number ofpackets observed. A maximum sound event rate is set, to avoid overloading the sound engine.The sampling of packets is weighted, such that packets for which the IPs and ports do notfall within their respective hotlists are sampled with a higher probability. As future work it isimportant to investigate the most appropriate methods of aggregation, sampling and scaling.Grond and Berger write that sonification mapping functions may sometimes be linear, but otherforms may be more suitable depending on the data [92]. Scaling exponentially, or using methodssuch as step-change analysis or Fourier Transforms, are examples of avenues worth exploring.
During the presentation of the prototype, we highlighted our use of “normal” in describingthe values of some data dimensions. A challenge in the implementation of the prototype isdetermining this “normal”, which is left as an abstraction in the model. The normal might inpractice be defined, or calculated using statistics or machine learning for a network. The normalcould also be defined not by the system itself, but discerned by the humans using the system,based on what they expect to be, or have become accustomed to, hearing.
80

5.7 Summary
We developed a sonification model, which we use to design the sonification systems presentedthroughout the rest of this thesis. We showed how we used existing sonification design guide-lines to create a model that addresses the data-presentation requirements of network-securitymonitoring tasks. We presented a sonification prototype, developed using this model, in Section5.6. In the next chapter, we report on the results of an effectiveness study we ran using thisprototype, to assess the viability of using it to present network-security information to humans.
81

Chapter 6
Assessing the Viability of PresentingNetwork-Security Information asSound in a Prototype EffectivenessStudy
In the research reported in this chapter, we aimed to assess the viability of using sonificationto enable humans to detect network-attack conditions. Specifically, we aimed to investigatethe concept that sonification can represent network datasets such that network attacks can bedetected (that the presence of some attack can be recognised) and identified (that the type ofattack can be understood) by humans. In Chapter 5 we developed a model for sonifying network-security data, and created a sonification prototype based on this model. Prior research articleshad suggested the potential of network-traffic sonification systems for signalling attacks, butextensive assessment had not been made of their effectiveness [18, 87, 146, 177] (see Chapter3 for more details). It was this gap that we sought to address in the research presented inthis chapter by assessing the short-term effectiveness of the prototype sonification system wedeveloped in the previous chapter for signalling network attack conditions.
More recently, Debashi and Vickers showed that the SoNSTAR sonification system improvedthe performance of participants in detecting network attacks compared with using Snort IDS[61] (see Section 3.1 for details). This is experimental evidence of the effectiveness of that soni-fication system for signalling network attacks. The research we report in this chapter extendsthis knowledge, by assessing the effectiveness of a different sonification approach (in which theaesthetic is musical rather than natural sounds, and the system represents packet-header infor-mation rather than TCP/IP status flag features). Furthermore, we explore additional questionssuch as the effect of musical experience on the ability of participants to use the sonificationsystem, the detection of attacks occurring in combination, and the changes in the performanceof participants during the training stage.
6.1 Aims and Hypotheses
The aim of the study was to assess the accuracy and efficiency with which participants coulddetect the presence of an attack by listening to sonified network-packet headers (syntheticallygenerated), and the accuracy with which they could identify the type of attack detected. Wedifferentiate between detection and identification of attacks: detection refers to the recognitionthat some attack is being signalled by the sonification, without necessarily knowing the type ofattack; identification means understanding the type of attack signalled.
82
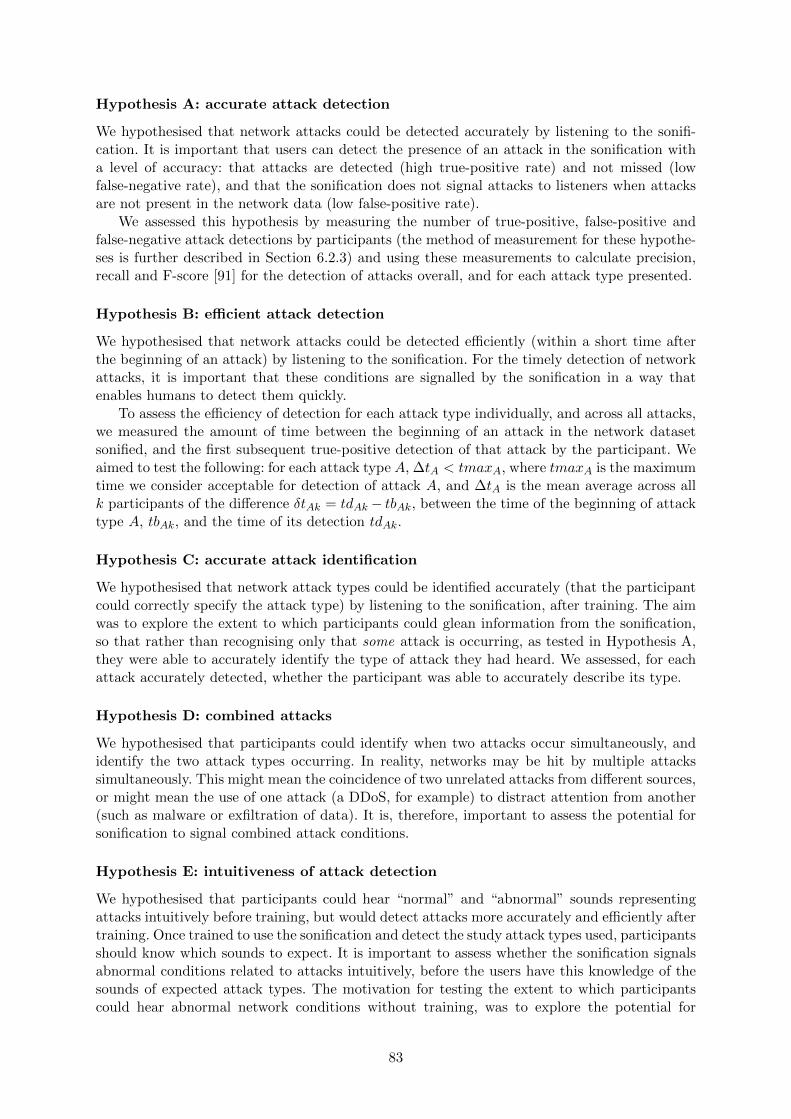
Hypothesis A: accurate attack detection
We hypothesised that network attacks could be detected accurately by listening to the sonifi-cation. It is important that users can detect the presence of an attack in the sonification witha level of accuracy: that attacks are detected (high true-positive rate) and not missed (lowfalse-negative rate), and that the sonification does not signal attacks to listeners when attacksare not present in the network data (low false-positive rate).
We assessed this hypothesis by measuring the number of true-positive, false-positive andfalse-negative attack detections by participants (the method of measurement for these hypothe-ses is further described in Section 6.2.3) and using these measurements to calculate precision,recall and F-score [91] for the detection of attacks overall, and for each attack type presented.
Hypothesis B: efficient attack detection
We hypothesised that network attacks could be detected efficiently (within a short time afterthe beginning of an attack) by listening to the sonification. For the timely detection of networkattacks, it is important that these conditions are signalled by the sonification in a way thatenables humans to detect them quickly.
To assess the efficiency of detection for each attack type individually, and across all attacks,we measured the amount of time between the beginning of an attack in the network datasetsonified, and the first subsequent true-positive detection of that attack by the participant. Weaimed to test the following: for each attack type A, ∆tA < tmaxA, where tmaxA is the maximumtime we consider acceptable for detection of attack A, and ∆tA is the mean average across allk participants of the difference δtAk = tdAk − tbAk, between the time of the beginning of attacktype A, tbAk, and the time of its detection tdAk.
Hypothesis C: accurate attack identification
We hypothesised that network attack types could be identified accurately (that the participantcould correctly specify the attack type) by listening to the sonification, after training. The aimwas to explore the extent to which participants could glean information from the sonification,so that rather than recognising only that some attack is occurring, as tested in Hypothesis A,they were able to accurately identify the type of attack they had heard. We assessed, for eachattack accurately detected, whether the participant was able to accurately describe its type.
Hypothesis D: combined attacks
We hypothesised that participants could identify when two attacks occur simultaneously, andidentify the two attack types occurring. In reality, networks may be hit by multiple attackssimultaneously. This might mean the coincidence of two unrelated attacks from different sources,or might mean the use of one attack (a DDoS, for example) to distract attention from another(such as malware or exfiltration of data). It is, therefore, important to assess the potential forsonification to signal combined attack conditions.
Hypothesis E: intuitiveness of attack detection
We hypothesised that participants could hear “normal” and “abnormal” sounds representingattacks intuitively before training, but would detect attacks more accurately and efficiently aftertraining. Once trained to use the sonification and detect the study attack types used, participantsshould know which sounds to expect. It is important to assess whether the sonification signalsabnormal conditions related to attacks intuitively, before the users have this knowledge of thesounds of expected attack types. The motivation for testing the extent to which participantscould hear abnormal network conditions without training, was to explore the potential for
83
sonification to represent unknown types of attacks, or variations on known attack types (as inthese cases, users would not be listening for “expected” attack sounds). We aimed to test thefollowing for pre-training dataset d1 and post-training dataset d4: amind1 < ad1 < ad4 andemind1 < ed1 < ed4, where adn, edn, n ∈ (1, 4) are respectively the accuracy and efficiency ofattack detection of participants in the nth dataset, and amind1, emind1 are respectively theminimum accuracy and efficiency we accept in dataset d1.
Hypothesis F: the effect of musical experience
We hypothesised that a participant’s level of musical experience would not affect their ability todetect and identify attacks using the sonification. For the integration of sonification into SOCs,and its use by security practitioners, it is important that the approach does not favour users whoare musically experienced, and that users without musical experience are equally able to detectand identify network attacks. We aim to test the following: amus = anonmus, emus = enonmus,and imus = inonmus, where amus and anonmus are the detection accuracy, emus and enonmus thedetection efficiency, and imus and inonmus the identification accuracy of participants with andwithout musical experience respectively.
Hypothesis G: improvement through familiarity
We hypothesised that participants’ accuracy and efficiency in detecting attacks would improvewith time spent using the sonification. It is beneficial if users can improve at, and become com-fortable with, using the sonification over time, detecting and identifying attacks more accuratelyand quickly. If this is the case, we argue that sonification is a network-monitoring approach thatusers can potentially come accustomed to, continuously improving their understanding of itssignals. For this study, we aimed to measure participants’ performance at each stage of use of thesonification, and assess whether there was an improvement over time. Formally, we aimed to testthe following hypotheses over the pre-training dataset (d1), training datasets 2 and 3 (d2 and d3
respectively), and post-training dataset (d4): ad1 < ad2 < ad3 < ad4, ed1 < ed2 < ed3 < ed4, andid1 < id2 < id3 < id4, where adn, edn, and idn, n ∈ (1, .., 4) are respectively the accuracy of attackdetection, efficiency of attack detection, and accuracy of attack identification of participants inthe nth dataset.
6.2 Methodology
We describe the preparation of network-attack datasets and systems prior to running the study,the process we followed while running the study, and our approach to analysing the data collectedin the study.
6.2.1 Network-Attack Datasets
We generated synthetic network-attack datasets to be sonified for the study, based on a networkmodel and a set of attack models. Using synthetic generation enabled us to select the attacksto be experimented with, and produce labelled datasets containing the modelled attacks in anorder pseudorandomised for each participant. To do this, we generated background traffic, andselected attacks for injection at specified timestamps. The datasets were generated as packet-capture headers in comma-separated value (CSV) format, with the fields shown in Table 6.1,and included both background traffic and selected attack traffic. In order to generate packetcaptures with field values as realistic as possible, we drew on statistics collected from realnetwork datasets and attack characteristics [1, 133, 50, 34, 178].
To generate the background traffic, we modelled a network in which 25 desktop hosts com-municated with 40 remote hosts. The distribution of protocols and applications used was based
84

Table 6.1: Packet-capture header fields
Time SourceIP
Destination IP Sourceport
Destinationport
Protocol Size
on statistics collected from existing network datasets [50, 123], by observing average traffic ratesfor a range of different services. Standard ports were used for the protocols and applicationsmodelled. To imitate network traffic rate distributions, we generated activity for each servicewith a probabilistic approach using an Interrupted Poisson Process (IPP), in which each net-work service has two states — on or off. This meant that services were active at any time with agiven probability. The background traffic had an average rate of 4500 packets per second. Thiswas scaled up from an average packet rate we derived across the datasets presented in [178](1750 packets per second) to test whether the sonification system could handle realisticallylarge traffic rates by packet sampling.
We selected four attack types for the study. In selecting the attack types, we consideredattacks that could be signalled through the packet information sonified by our system (for ex-ample, at this stage, the system does not sonify packet contents, and we therefore excludedattacks signalled through packet contents only, such as delivery of certain malware). This listof attacks used is not exhaustive; the aim of this study was to test the concept that attackscould be signalled to humans using sonification, and we therefore selected a subset of the pos-sible attacks. We leave to future work assessment of the full range of attacks that sonificationsystems are capable of representing. The attacks selected here were modelled with the followingcharacteristics.
• DDoS attack: TCP SYN flood, in which ten DDoS bots each sent on average two TCPSYN packets per second. Compared with the peak DDoS packet rate calculated in thereal-world CAIDA DDoS dataset [75] (175,010 packets per second), we consider this asmall attack.
• Port scan: TCP Connect scan, based on TCP Connect send/respond characteristics[34]. Two scan bots scanned network host ports in a pseudorandom order, each sendingon average 15 TCP Connect packets per second.
• Data exfiltration: data exfiltrated over FTP, in which on average three FTP packetsper second were sent from an internal network source IP address to a single externaldestination IP address. We drew on a flow-level breakdown of an FTP transfer [20].
• Loss of connectivity: complete connectivity loss, in which traffic in each service stoppedwith some probability.
Given the design of the sonification system, these attacks sounded as illustrated in Figure6.1. As shown, the DDoS attack, in which an increase in incoming traffic from unusual (non-hotlisted) source IP addresses (bots) is seen, can be heard as an increase in the amount ofdissonant activity in a low pitch range. Since the DDoS modelled is a TCP SYN flood, theattack is heard in the clarinet in this instance. For the port scan, we hear a range of unusualdestination ports being targeted as an increase in dissonant activity in a high pitch range. Wehear data being exfiltrated as an increase in the piano activity with a right pan, to an unusualdestination IP address (a dissonant medium-range note), and the loss of connectivity fades tosilence as activity comes to a stop in each service.
Based on the network and attack models described, five network-attack datasets were gen-erated for each participant:
• Pre-training dataset — used in the study before training, to test the “intuitiveness”hypothesis (see Hypothesis E in Section 4)
85

Figure 6.1: Representations of network attacks in the sonification system
• Three training datasets — used in the second part of training, in which participantspractised completing the study task
• Post-training dataset — used in the task after training
The datasets were generated to contain each of the four attacks, in a pseudorandomisedorder (using the Random module in Python). Sonifications of all datasets were pre-recordedin Waveform Audio File (WAV) format, to allow for playing and pausing as necessary by theresearcher during the study. As well as the deliberate pseudorandomisation of attack orders,there was some variation in the datasets across participants due to the use of the probabilis-tic dataset-generation approach described. This level of variability was intended to produceenough similarity to enable comparison of participants’ performances across datasets, yet avoidpresenting participants with exactly the same dataset each time. We judged that this wouldenable validation of the effectiveness of the sonification approach, rather than of the ability ofparticipants to learn the exact sounds of the study.
The process we used to sonify these network-attack CSVs was the same as the prototypeimplementation process introduced in Section 5.6.3, producing an output sound for each packetrepresentation sampled from the CSV.
6.2.2 Study Process
The study was carried out with 30 computer science and cybersecurity researchers at the Univer-sity of Oxford, with ethical approval granted as described in Section 4.2.1. Prior to the trainingand study tasks, participants were asked to answer some preliminary demographic questions,as described in Section 4.2.2.
86

In the study, participants sat with their backs to a monitor (from which the study wasconducted), facing the researcher across a table. Participants were positioned at an equidistancebetween two speakers (the left and right speaker, see pan mapping), with a computer mousepositioned in front of them, as illustrated in Figure 6.2. They then completed the followingstages of the study. Table 6.2 illustrates the measurements taken and the hypotheses tested ateach stage.
Figure 6.2: Participant setup
Table 6.2: Hypotheses tested at each stage of the study
Stage Measurements taken Hypothesestested
Pre-trainingtask
Attack detection: accuracy, efficiency A, B, E, F, G
Trainingdataset 2
Attack detection: accuracy, efficiency A, B, F, G
Trainingdataset 3
Attack detection: accuracy, efficiencyAttack identification: accuracy
A, B, C, F, G
Post-trainingtask
Attack detection: accuracy, efficiencyAttack identification: accuracy
A, B, C, F, G
Combinedattacks task
Combined attack identification: accuracy D
Pre-training study task
Participants were played a 30-second sonification of a network dataset containing no attacks —a representation of the “normal sound of the network”. They were then played a sonification of anetwork dataset containing all four attacks in a pseudorandomised order, and were asked to clickthe mouse button whenever they heard anything “abnormal”. The aim was to assess the extentto which the attacks sounded intuitively “abnormal” compared with the usual network sound,and to compare results with the post-training results to assess the improvement of participants.
Training
In the first stage of training, participants were introduced to the method behind the sonificationsystem. The sonification system used was the prototype presented in Section 5.6.2. Participantswere presented with the sonification system diagram and mappings table shown in Figure 6.3and Table 6.3, which they kept to refer to throughout the study. The design and sounds of
87

the sonification system were described by the researcher, with the individual mappings of thesonification system (such as the instruments, pitch ranges, and left and right pan involved)played individually.
The attacks used in the study were then presented in a pseudorandomised order. The keycharacteristics of each attack were described to participants, and were also presented to par-ticipants on paper retained throughout the study. Below we present the information presentedabout the port scan, for example.
Port scan: network reconnaissance technique in which messages are sent to a rangeof ports on one or more network hosts, with the aim of determining which ports areopen. The port scan we model is a TCP Connect scan, using TCP protocol.
The effect of each attack on the sonification system was described using a second set ofdiagrams (Figure 6.1). Sounds and descriptions were repeated at participants’ request.
Figure 6.3: Sonification system diagram
Table 6.3: Data-sound parameter mappings
Sound Data Rule
Tempo Packet rate Faster tempo → higher packet rate
Pan Direction oftraffic
Left pan → incoming traffic;Right pan → outgoing traffic
Pitch range Type ofinformation
Low range → source IPs;Medium range → destination IPs;High range → destination ports
Harmony Commonness(presence inhotlist)
Harmony notes → IP/port in hotlist;Dissonant notes → IP/port not in hotlist
Instrument Protocol Strings → HTTP traffic;Clarinet → Other TCP traffic;Piano → FTP traffic; Strings → other
In the second stage of training, participants were taught to respond to sonified datasets asrequired in the study task, using three training network-attack dataset sonifications. For the
88

first dataset, participants were asked to listen without responding, and consider the systemdesign and attacks presented. For the second, participants were asked to click the mouse buttonwhenever they heard an attack. For the final training dataset, participants were instructed toclick at each attack and subsequently describe verbally the change they heard in the sound andthe attack type signalled (this verbal response was prompted by the researcher where necessary).
Post-training study task
A sonification of a new network-attack dataset was played. As in the final training dataset,participants were asked to click when they heard an attack, then describe the musical changeand the type of attack.
Combined attack task
Participants were played a short sonification of a network dataset, containing two attacks occur-ring simultaneously (any pair from DDoS, port scan, and data exfiltration). Instruction in thistask was deliberately vague, with the aim of not indicating any information about the contentsof the datasets to participants: “you will be played a sonification of a dataset. Please listen, andat the end describe what you think happened in the dataset”. The attack pairing presented toeach participant was pseudorandomised.
6.2.3 Analysis
Recordings of each of the sonified datasets were made for each participant, and used as inputto a testing webpage. This webpage was not seen by participants, and enabled playing andpausing of audio recordings by the researcher, while recording the time of participants’ mouseclicks on the webpage with respect to the audio playing. We were thus able to ascertain, foreach recording of a sonified dataset, the time during the dataset at which the participant clickedthe mouse button having “heard an attack”.
In the calculation of detection and identification accuracy and efficiency, we made the as-sumption that a participant’s mouse click was a detection of the attack sonified at that pointin the audio. To support this, we left gaps of around 20 seconds between each attack sonifiedin the study task, and we discuss the implications of this assumption further in Section E.5.Using the click timestamps and verbal responses collected, we measured detection accuracy andefficiency, and identification accuracy, as described in Table 6.4. Precision, recall and F-scoresfor detection accuracy were calculated as described in Section 4.2.3.
Following the study tasks, participants were interviewed about their experience using thesonification, the ease of attack detection and identification, and their view of the training stageand the sonification tool. The full set of interview questions used is presented in Appendix B.1.We transcribed and manually coded the data collected in these interviews to identify commonthemes related to the study hypotheses, sonification design, and study design, which we presentin Section E.5.
6.2.4 Reliability
Pseudorandomisation of attack order was used throughout the study to avoid bias. The or-der in which the individual attacks were presented was pseudorandomised for the first part oftraining. Participants were presented with a pre-training attack dataset, three datasets con-taining attacks, and a post-training study attack dataset. All of these datasets were generatedindividually for each participant, and the order in which attacks appeared in each dataset waspseudorandomised. Finally, participants were presented with a dataset containing a pseudoran-domised one of the three combinations of two attacks (DDoS/port scan; DDoS/data exfiltration;port scan/data exfiltration).
89

Table 6.4: Measuring performance in the study
Measurementtaken
Method Assessment criteria
Detectionaccuracy
We recorded the time atwhich the participant clickedthe mouse, and comparedthis with the times betweenwhich the attack happenedin the dataset. Mouse clicksthat fell within these attacktimes were marked correct;all others were markedincorrect
• If the button is clicked during the attacktime window → true-positive detection
• If the button is clicked outside the attacktime window → false-positive detection
• If the button is not clicked during attackwindow (i.e. attack missed) → false-negativedetection
Detectionefficiency
For all true-positive attackdetections (assessed asdescribed above), wecalculated the timedifference between thebeginning of the attack andthe participant’s first mouseclick following it
If true-positive detection:
• Time difference between the start of theattack and the first button click → detectionefficiency
Identificationaccuracy
For all true-positivedetections (assessed asdescribed above), we markedparticipants’ verbaldescription of the attacktype correct or incorrect
If true-positive detection:
• If the attack is correctly described → correctidentification
• If the attack is incorrectly described →incorrect identification
Potential biasing factors were eliminated from the study setup as much as possible. Partici-pants sat with their backs to the screen in a deliberately clear room, to avoid visual distractions.The mouse click (anywhere on screen) and verbal response method by which participants wereasked to respond to attack detections was intended to be simple, to reduce the time delayintroduced by the participants actually carrying out the response method as much as possible.
6.3 Results
Of the 23 male and seven female participants in the study, 20 claimed to have some level ofmusical training (both taught and self-taught), while ten did not. More specifically, we consid-ered participants to be trained musically if they reported any of the following: some instructedmusical training; some self taught musical training; having reached a graded standard in amusical instrument; having advanced (university/conservatoire-level) musical training. All par-ticipants claimed either to know the TCP/IP model or to have some theoretical knowledgeabout network-security monitoring principles. Thirteen participants reported limited, and threeextensive, practical experience of network-security monitoring. There were no reported medicalhearing disabilities, and all participants reported that their hearing was not currently affectedby past experiences (such as loud musical concerts).
Figure 6.5 shows the mouse click times of participants in the post-training study task,compared with the attack times (attack times are shown in the green bands). Figure 6.4 showsthose for the pre-training task.
90

Figure 6.4: Participant click times in pre-training task
Figure 6.5: Participant click times in post-training task
Hypothesis A: Accurate attack detection
We used the true-positive (tp), false-positive (fp) and false-negative (fn) detection rates, mea-sured as described in Table 6.4, to calculate the precision, recall and F-score for participantsin the post-training study task. Precision, recall and F-score were calculated as described inSection 4.2.3. The proportion of true-positive attack detections for all attack types pre- andpost-training are shown in Table 6.5. The precision, recall and F-score values calculated for alltasks are presented in Table 6.6, which shows post-training precision was 0.86, recall 1, andF-score 0.93.
Table 6.5: Proportion of participants who accurately detected each attack type pre- and post-training
Attack type Pre-training
Training2
Training3 Post-training
All 110/120 116/120 118/120 120/120DDoS 30/30 30/30 30/30 30/30Port scan 30/30 30/30 30/30 30/30Data exfiltration 29/30 30/30 30/30 30/30Loss of connectivity 21/30 26/30 28/30 30/30
91

Table 6.6: Precision, recall and F-score for pre-training, training and post-training datasets
Dataset Precision Recall F-score
Pre-training 0.61 0.96 0.75Training 2 0.78 0.98 0.87Training 3 0.84 0.98 0.91Post-training 0.85 1 0.92
Hypothesis B: Efficient attack detection
To assess the efficiency of attack detection post-training, we calculated the mean and standarddeviation of the time between the start of each attack type and the first button click of allparticipants who accurately detected it. These results are presented in Table 6.7, which showsmean detection times between two and three seconds for DDoS, port scan and data exfiltrationattacks, and a much longer mean detection time for loss of connectivity.
Table 6.7: post-training, efficiency of attack detection (seconds)
Attack type Detection time: mean Detection time:standard deviation
DDoS 2.43 1.64Port scan 2.66 1.39Data exfiltration 2.99 1.67Connectivity loss 6.44 1.82
We assessed the variance in efficiency of detection across the four different attack types usingone-way Analysis of Variance (ANOVA) analysis [74] with significance α = 0.05. We obtainedp < α, and therefore there is a significant difference in the means across the four attack types.We then discounted the loss of connectivity from this analysis, since clearly the detection timeaverage was much longer (see Table 6.7). We believe this was due to confusion caused by the wayin which the sonification represented connectivity loss, and we discuss this further in SectionE.5. We performed one-way ANOVA analysis across the remaining three attack types: DDoS,port scan and loss of connectivity. Table 6.8 shows the results. Since p > α, there is no significantdifference in the mean detection times across these three attack types.
Table 6.8: Single-factor ANOVA analysis of mean detection times for DDoS, port scan and dataexfiltration
Source of Variation SS df MS F p F crit
Between Groups 4.75 2 2.38 0.93 0.40 3.10Within Groups 222.23 87 2.55
Total 226.99 89
Hypothesis C: Accurate attack identification
To assess identification accuracy, we calculated the proportion of correct identifications for eachaccurately detected attack, measured as described in Table 6.4. These results are presented inTable 6.9, which shows that 114/120 detected attacks were identified correctly, but port scanwas identified incorrectly six times. Each of these times, the port scan was identified as a DDoSby the participant. This was the most challenging pair of attacks to differentiate between (themain difference in sound between these two attack types was the gap between low and high pitch
92

ranges, approximately two octaves apart). Some participants reported difficulty differentiatingbetween these two attack types, and between pitch ranges, in the post-study interview. Wediscuss the implications of this for sonification design in Section E.5.
Table 6.9: Post-training accuracy of attack identification
Attack Type Proportion Accurately Identified (ofthose detected)
All attacks 114/120DDoS 30/30Port scan 24/30Data exfiltration 30/30Connectivity loss 30/30
Hypothesis D: Combined attack identification
We observed three outcomes in the combined attack identification task:
1. participant recognised it was combined and identified both attacks correctly;
2. participant recognised it was combined and identified one attack correctly; or
3. participant did not recognise it was a combined attack.
We calculated the number of participants with each outcome, for each of the three possibleattack combinations. These results are presented in Table 6.10, and show that of the 30 partici-pants, 24 recognised that they had heard a combined attack, 16 of which identified both attackscorrectly, and eight only one of the attacks. The results also show that almost all (five out ofsix) participants who did not recognise that it was a combined attack had been presented withthe DDoS/port scan combination.
Table 6.10: Combined attack results
Attack combination Number ofparticipants
Outcome1
Outcome2
Outcome3
All combinations 30 16 8 6DDoS/port scan 10 4 1 5DDoS/data exfil 10 6 4 0Port scan/data exfil 10 6 3 1
Hypothesis E: Intuitiveness of attack detection
Figures 6.5 and 6.4 are histograms of the click times in the pre- and post-training tasks. Theplots show that while detection was more accurate post-training, the click times were clusteredaround the beginning of each attack in the pre-training task also. Tables 6.5 and 6.6 show thatparticipants were mostly able to detect attacks in the pre-training task, with precision of 0.63,recall of 0.96 and an F-score of 0.76. Loss of connectivity had a significantly lower detectionrate than the other attacks — we discuss the reasons for and implications of this in Section E.5.
We assessed the pre-training attack-detection efficiency, by calculating mean detection timesfor each of the attack types in the pre-training task. The results are presented in Table 6.11.Compared with the post-training detection efficiency results presented in Table 6.7, the meandetection efficiency is similar (detection was slightly less efficient post- than pre-training for all
93

attacks apart from DDoS). The standard deviation in detection efficiency is higher pre-training,indicating greater variance in the time taken to detect attacks before training.
Table 6.11: Pre-training efficiency of attack detection (seconds)
Attack Type Detection time: mean Detection time:standard deviation
DDoS 2.53 2.32Port scan 2.16 0.90Data exfiltration 2.73 3.05Connectivity loss 6.18 4.16
Hypothesis F: The effect of musical experience
We assessed the effect of musical experience on detection accuracy, detection efficiency, andidentification accuracy, by comparing the results of participants who reported some level ofmusical training, to those without. Figures 6.6 and 6.7 show the click times post-training ofparticipants with musical experience, and without musical experience, respectively.
Figure 6.6: Click times in post-training task: participants with musical experience
Figure 6.7: Click times in post-training task: participants without musical experience.
94

Detection accuracy
The precision, recall and F-scores for participants with (20 participants) and without (ten partic-ipants) musical experience are compared in Table 6.12. The results show that while participantswith musical experience detected attacks more accurately, the F-score for participants withoutmusical experience is still reasonably high.
Table 6.12: Accuracy of attack detection, pre- and post-training musical experience comparison
Pre-training Post-trainingPrecision Recall F-score Precision Recall F-score
Musical 0.62 0.97 0.75 0.90 1 0.95Non-musical 0.60 0.93 0.73 0.76 1 0.87
Detection efficiency
Descriptive statistics for the detection efficiency of participants with and without musical expe-rience are presented in Table 6.13, and show that participants without musical experience hada slightly quicker mean detection time.
Table 6.13: Post-training efficiency of attack detection: musical experience comparison
Variable N Detection time:mean
Detection time: standarddeviation
Musical 20 3.68 2.32Non-musical 10 3.52 2.36
We ran a t-test to check for significant differences in the mean detection efficiency for par-ticipants with and without musical experience. We selected a two-sample t-test assuming equalvariances. The variances were treated as equal based on the result on an initial F-test, whichshowed there was no significant difference in the variance in detection efficiency [74]. The resultsof the t-test are displayed in Table 6.14. The results show that there was no significant differencein the mean detection efficiency between participants with and without musical experience withsignificance α = 0.05, since t Stat > -t Critical two-tail and t Stat < t Critical two-tail.
Table 6.14: t-test (two-sample assuming equal variances): attack-detection efficiency for partic-ipants with and without musical experience (alpha=0.05)
Non-musical Musical
Mean 3.52 3.68Variance 5.55 5.38Observations 40 80Pooled Variance 5.44Hypothesized MeanDifference
0
df 118t Stat -0.36P(T<=t) one-tail 0.36t Critical one-tail 1.66P(T<=t) two-tail 0.72t Critical two-tail 1.98
95

Identification accuracy
Table 6.15 shows the identification accuracy results of participants with musical experience, andthose of participants without musical experience. The results show that the incorrect port scanidentification was made by three participants with musical experience, and three without.
Table 6.15: Post-training accuracy of attack identification: musical experience comparison
Attack Type Participants withmusical experience
Participantswithout musicalexperience
All attacks 77/80 37/40DDoS 20/20 10/10Port scan 17/20 7/10Data exfiltration 20/20 10/10Connectivity loss 20/20 10/10
Hypothesis G: Improvement through familiarity
We compared the pre-training with the post-training accuracy and efficiency of detection. Theresults are shown in Tables 6.6 (accuracy) and 6.16 (efficiency). While there was a markedand continued improvement in detection accuracy throughout the four assessed datasets, therewas little change in efficiency. Table 6.16 shows that detection time actually increased slightlythroughout the datasets. Possibly, this is due to participants having more to think about, causinga delayed reaction time. Whereas in the initial task, participants were asked to click immediatelyif they heard anything abnormal, in the later tasks, in which they had knowledge of the attacksthey should aim to detect and were asked to describe them verbally, it is likely that the processof deciding what the attack type was and whether it was one of the attacks involved in thestudy added to the detection time.
Table 6.16: Efficiency of attack detection: dataset comparison
Attack type Detection time: mean Detection time:standard deviation
Pre-training 3.18 3.11Training 2 3.19 2.30Training 3 3.46 2.21Post-training 3.63 2.32
6.4 Discussion
6.4.1 Hypotheses
The results show that participants were able to detect attacks accurately, as shown by thepost-training F-score. The recall score (1) shows that no attacks were missed by participants(no false-negatives) post-training, while the precision (0.86) shows that participants generallyclicked at the time of attacks in the dataset — the false-positive detection rate was low.
For DDoS, port scan and data exfiltration attacks, the mean detection efficiency across par-ticipants was less than three seconds, and mean detection time did not vary significantly, asshown by the ANOVA analysis. For the loss of connectivity, the detection time was significantly
96

greater. This is largely due to the study setup and the way the loss of connectivity was repre-sented by the sonification: from the time connectivity loss began in the data, services stoppedwith some probability, such that the sound thinned but sometimes did not reach a significantlyquieter or silent level for five or more seconds. This accounts for the much longer detectiontime for this condition. The accuracy and efficiency of attack detection suggests there is valuein further exploring the use of sonification in network-security monitoring tasks, in SOCs forexample.
Participants were also able to accurately identify attacks most of the time — the exceptionbeing the confusion for some (six) participants between the sounds of DDoS and port scan.We discuss the implications for sonification design later. This suggests that sonification maynot only be a viable approach to detecting abnormalities in the network traffic, but also holdspromise for signalling information about the attack type. It is important to note that whilethese results suggest promise, they were obtained using synthetically generated datasets. Assuch, we cannot claim generalisability of the results to real-world network-security monitoringtasks at this stage.
In an interview immediately following the study, participants were asked to rate the difficultyof each of the task breakdown components (detection of some attack; identification of musicalchange; identification of attack type) using a Likert scale, in which 1 was “very easy”, and 5“very difficult”. Their responses are summarised in Table 6.17, and indicate that on averageparticipants considered identification of the musical change and type of attack slightly moredifficult than the initial detection of the attack. Some participants reported the types of attacksthey had found it challenging to identify. The difficulty differentiating between port scan andDDoS was frequently noted at this stage, which supports our observations on the confusionbetween these two attacks.
Table 6.17: Participants’ ratings for the ease of each of the study task components (Likert scale,1: very easy – 5: very difficult)
Detection ofsome attack
Identificationof musicalchange
Identification ofattack type
Mean rating 1.667 1.9 2.217Standard deviation 0.699 0.770 0.953
Musical experience had no significant effect on the ability of participants to use the sonifica-tion, either for detection or identification of attacks. This is important, since for use in real-worldapplications such as network-security monitoring in SOCs, the system should be accessible tousers regardless of their level of musical training. The results show that participants with somelevel of experience playing a musical instrument performed slightly better than those without(see Table 6.12).
We observed during the study that some participants with a high level of musical experienceappeared disadvantaged by a sensitivity to musical change that led to false-positive detections.However, some such participants also seemed to have an ability for learning the meanings of thesonification system such that they could report extra information over the attacks they had beentrained to recognise, with one musically trained participant reporting: “for abnormal stuff thatyou’re not looking for, the most common that I’m hearing and that’s throwing me off is higherrange clarinet coming from this speaker, which would indicate to me then that something funnyis going on in TCP with the outgoing destination ports”. It is important to investigate furtherthe effect of high levels of musical experience on ability to use sonification for network-securitymonitoring tasks.
All participants reported that the training session had helped them to use the sonificationin the study. Some felt that the training had helped them only with the attack identification,
97

while some reported that the training had also helped them with the initial identification ofattacks. For example, “if there is no training, you can identify that something is wrong, butafter a few minutes of training I could distinguish between traffic, outgoing, incoming traffic, soI can distinguish basically the source of the problem, if it’s outgoing or incoming, and the type ofattack quite easily I think”. Asked about whether the training helped, for the initial detection,one participant stated: “it [the training] didn’t help for detection that something was wrong, thatwas because it was obvious anyway”, which suggests the participant felt able to hear anomaliesin the network traffic equally well before and after training.
Participants were able to hear anomalies in the network traffic prior to training, but alsogave more false-positive responses at this stage than after training, as shown in Figure 6.4. Anumber of participants stated that they felt the sonification was “intuitive” and could hearwhen the sound was “off ” without training: “detection of an attack in sonification it’s quiteeasy. Your brain captures the pattern of normal traffic quite fast, and you can distinguish theattack or not attack easily, even with no training”. The ability of participants to hear anomalieswithout knowing what an anomaly “should sound like” (i.e., having as reference only the baselinesound of the network presented briefly at the beginning of the pre-training task) has importantimplications for the detection of network anomalies and attacks whose properties are unknown,that do not follow expected signatures or patterns, or which are zero-days. These results on theintuitiveness of attack detection therefore suggest that there is promise in exploring the use ofsonification further for the detection, by listening humans, of attacks that do not match knownprofiles.
Of the participants, 80% were able to distinguish the combined attack condition. No informa-tion was given suggesting this condition (at this stage of the study, participants were instructed:“you will be played a sonification of a dataset. Please listen, and at the end describe what youthink happened in the dataset”). It is important to test whether combinations of attacks can beheard, in order to assess the potential of the sonification tool for representing such conditions— where an attacker attempts to disguise one attack, such as the exfiltration of data, by usinganother attack as a distraction (such as a DDoS).
Of the 30 participants, six did not recognise that they had heard a combined attack. Of those,five had been presented with the combined DDoS and port scan attack. This may have been dueto the raised level of confusion between DDoS and port scan attack sounds across participantsas a whole. This is supported by the discussion with participants presented with this particularcombination: “I’m not sure if when two are combined together it’s so easy, because I was notsure for the last example if it was DDoS or a port scan, or if it was really both together”. Thismay be due to the sonification design and rectifying this will be addressed in future work.
6.4.2 Sonification design
The performance of participants in the study highlighted some design questions. A design aspectthat caused some difficulty in the study was the sound of the piano representing packets sentover FTP. Some participants reported that the piano did not fit in with the normal sound ofthe network, as the piano tones were too distinct. This caused a problem when occasional FTPtransfers were present in the background data, unrelated to the data exfiltration attack. Manyof the false-positive clicks, during the pre-training task especially, correlated with the sound ofindividual piano tones that sounded abnormal to participants but in fact signalled small FTPtransfers rather than attack traffic.
Participants frequently had difficulty distinguishing between the DDoS and port scan at-tacks, the most audible difference between which was the difference in pitch range — DDoSbeing audible in the low pitch range, and port scan two octaves higher in the high pitch range.The port scan had some of the sonic indicators of a DDoS: since it was an incoming attack fromunusual IP addresses, there was some low-range dissonance (beneath the high-range dissonantport sounds), which was also a DDoS indicator. This may have contributed to the confusion.
98

As shown in Table 6.9, the only incorrect identification (which occurred six times) was theidentification of the port scan as a DDoS.
When asked in the post-study interview whether there was anything they would changeabout the sonification design, the aspects noted most frequently by participants were the use ofthe pitch range mapping, and the background sound of the sonification. On the pitch ranges, oneparticipant reported: “the thing that I found most difficult was deciding, is it high or low, therange”, and the effect this had on participants’ ability to differentiate between DDoS and portscan was also indicated: “for me between port scan and DDoS I had to always think – which wasit, was it port scan or is it DDoS”. It was suggested by participants that a different mapping(not using pitch range) might be more appropriate for this data parameter, or a clearer differencebetween the low, medium and high pitch ranges by widening the range between them (greaterthan the octave between each used here). Assessing the effectiveness of these suggestions is leftfor further design experimentatation.
On the subject of the background noise of the sonification, one participant stated: “it wasnot my kind of music and I think that it was very annoying”. However, some participantsreported positively on the background noise “it was actually like music that I could listento”. This difference in opinion suggests the importance of addressing the sound design of thesonification by considering musical taste, and indicates that a choice of musical genres mightbe an appropriate approach. This is an area in which further research is important.
A number of participants reported that they felt able to understand and use the sonificationmapping system: “I think the mapping makes sense, coming in from one side, going out theother side, different instruments for different protocols, that all makes sense”. In particular, themapping between the direction of traffic and the pan of the sound was mentioned by a numberof participants as being effective: “the left and right works well I think”.
6.4.3 Study design: observations and limitations
There were some difficulties noticed in the study setup. Most obvious was the setup of theconnectivity loss. In the sonification, a loss of connectivity was represented through silence, sinceas traffic ceased no sound events were generated. However, in the pre-training task especially,this caused some confusion for participants, some of whom assumed that the silence signalledthe end of the task. Participants were instructed that the researcher would tell them when thedataset finished, and not to assume it had finished until that point, but there was still a levelof confusion for some participants, and this seemed to affect the number of false-negatives forconnectivity-loss detection (see Table 6.5).
When asked whether there was anything they would change about the study design, theaspects that participants noted most frequently were the difficulties in the loss of connectivitysetup, and the positioning of the speakers. Participants suggested that the loss of connectivitysetup would work well in practice, with the sudden silence being “striking”, but that in thecontext of this study it was confusing: “I remain convinced that it would work very well inpractice, so possibly some other indicator that experiment is going on, or something”. Anotherparticipant suggested the use of a sonic indicator that the end of each dataset had been reached,such as a “beeping” sound. Some participants suggested that the positioning of the speakersused in the study should be different, or that they would have preferred to use headphones:“I think maybe the speaker placement should be a bit different. Because obviously that affectseveryone’s hearing differently, I mean I haven’t got great hearing so I would probably try andget a bit closer”.
There are potential limitations to the way in which true- and false- positive detectionswere measured (using the approach described in Table 6.4). In particular, since participantssometimes clicked multiple times during the same attack time windows, the measurement ofwhat constituted a true-positive detection had to be considered. In calculating the efficiency ofattack detection, we used the first click of the participant, separating them from other true-
99

positive clicks. The calculation of precision and recall scores also helped to address this, since itshowed the balance of true-positive clicks compared with false-positive, and is a measurement ofparticipants clicking at any time during the attack window, versus outside the attack window.
In the datasets in which no verbal description of attack type was required by participants (thepre-training and training 2 datasets), it was not possible to know exactly what the participantsbelieved they had heard. For example, it was unclear whether participants who clicked multipletimes during the same attack believed that they had heard a new attack condition, or wereclicking for the same one continuing. It was also not possible to know whether the participant wasclicking the mouse, following the beginning of an attack in the dataset, because they had heardthe indicators of that attack condition, or something else. For example, following a connectivityloss in the dataset, as the sound thinned, participants who clicked were recorded as havingdetected the connectivity loss, while it is possible that they in fact believed they had heardsome anomalous sound other than the thinning of the sound.
It is difficult to avoid the above limitation, since it was essential to test the participants earlyon without describing the attack sounds, in order to assess the intuititiveness hypothesis, yetthis naturally meant the participant was unable to describe the attack type. An approach mightbe to ask the participant in these early stages to describe the change in sound after each mouseclick. However this may have placed extra strain on the participant in this early stage of thestudy, having only just been introduced to the sonification. We believe our results suggest thatin general participants were detecting the correct attack indicators in the early stages, since theprecision and recall scores across all attacks were good at this stage. The verbal description inlater datasets solved this problem, since the researcher was able to verify whether the respondentbelieved they had heard a different attack type during a continuing attack.
Participants were asked to describe both the musical change and the attack type signalled.The aim here was to understand how they were completing the study tasks. We aimed tounderstand whether participants were memorising the sounds of the attacks (approach A inFigure 6.8), or were hearing the changes, contextualising their meaning in terms of the networkdata, and then deriving the type of attack (approach B in Figure 6.8). The distinction ties inwith the intuitiveness hypothesis: for attacks that do not fit an expected profile, or are evolvingin nature, it is important to assess whether participants are able to contextualise informationand work out what is happening on the network using the sonification.
Detectchange
in sound
Identifychange
in sound
Identifysignified
datachange
Identifyattack type
B
A
Figure 6.8: Possible approaches to completing the study task.
It appeared that there was a largely mixed approach: based on the researcher’s observationsin the study, some participants clearly memorised the attack types and sounds (approach A),and this is unsurprising given that only four attack types with distinctive sounds were used inthis study. However, it also appeared that other participants were working from their knowledgeof the data the sonification represented in order to work out the attack type, as in approach B.As discussed, participants were sometimes able to report extra information over what they had
100
been taught in terms of attacks. This ability to derive further information suggests a depth tosome participants’ understanding of the sounds of the sonification and their meaning in termsof the network data.
In the post-study interview, some participants considered their method of completing thetasks. A number of participants reported that they had waited for some threshold amount ofanomalous sound to play, before deciding whether an attack was happening. This was partic-ularly true for data exfiltration, since small amounts of outgoing FTP traffic were considerednormal, while higher amounts indicated data exfiltration: “I think the hardest part was identi-fying, well once you pick the odd sound out, is identifying when that’s like an actual persistentthing or not, or whether it’s a one-off like the FTP thing still sounds out of place, but sometimesit might be ok”.
Some participants also stated that they had used association of the sounds of the sonificationwith sounds from their background, to facilitate ease of recognition: “for me it’s easier to think ofthem, again as I was saying jokily the eight-bit gameboy game, or the piano as opposed to tryingto — I mean, go through more details of, the way you have put the different instruments in”.The question of participants’ task completion methods should be addressed more empiricallyin future, and participants could be asked to consider in more detail how they believe they areperforming the detections.
The omission of a dataset containing no attacks from this study limits our findings (alldatasets contained at least one attack), since we were unable to assess the ability of participantsusing sonification to recognise conditions in which no attacks are present. There were stretchesof time in each dataset during which no attacks were occurring, and we were able to assesswhether false-positive detections were made by participants at these times. Given the likelihoodof network conditions in the real world in which no attacks occur over a longer period of time, itwould have been valuable to study the detection accuracy of participants under such conditions,however, by presenting datasets containing no attacks. The recognition of this limitation informsour study methodology in Chapters 8 and 9, in which we include a dataset containing no attacks.
As we have noted throughout this chapter, a key constraint that limits the relevance ofthe findings to network-security monitoring practice in the real world is the use of syntheticnetwork-attack datasets. We judged that this approach was suitable for this viability study,enabling us to explore the concept while controlling the attacks presented to each participantand randomisation of their order. The huge scale and complexity of actual network data posesa new challenge, that we explore later in this thesis: in Chapters 8 and 9, we use captures ofnetwork attacks carried out on a simulated network testbed, created by researchers who tookvarious measures to create a realistic representation of real-world network traffic and attacks[149].
We observed a key difference between the datasets used in this chapter and in Chapters 8and 9. In the datasets we generated synthetically for the study reported in this chapter, althoughtraffic was generated probabilistically (as described in Section 6.2), noticeably anomalous trafficconditions tended to occur only at the times when attacks were present (outside the times atwhich network attacks occurred, there were no spikes in the traffic load, and little activity atephemeral ports, for example). Real network data is varied and complex, and anomalous activitymay occur that is benign, and does not indicate an attack, and this was true of the datasets usedin Chapters 8 and 9. Because of the presence of such benign anomalous events in the datasetsused in Chapters 8 and 9, we took a slightly different approach to measuring anomalous-trafficand attack detection to the one taken in the current chapter. These adjustments made to theanalysis method are described in Section 8.4.3.
101

6.5 Summary
We reported on the results of a user study to assess the utility of a prototype sonification system(as presented in Section 5.6.2), for signalling network-attack conditions to humans. Our resultsshow that by listening to sonified network-packet headers (synthetically generated), participantsin an experimental setting could detect attacks accurately and efficiently, including combinedattacks in some cases, and identify the types of attacks. We also found that musical experiencehad no significant effect on the ability of participants to use the sonification prototype, andthat participants could detect attacks to some extent without training, and improved theirperformance throughout training.
These results suggest the viability of presenting sonified network traffic as an approachto enabling humans to quickly recognise abnormal network conditions, and understand thoseconditions. Due to certain study constraints (as we discussed in Section 6.4.3), we cannot claimthat these results are generalisable to network-security monitoring in the real world: based onthese results it is still unclear whether sonification might aid in attack detection in SOCs, forexample. This evidence does, however, support the further research, presented in the rest of thisthesis, into the potential to use sonification in network-monitoring tasks in SOCs.
In the next chapter, we report on the results of an online survey and interviews with securitypractitioners working in SOCs, in which we presented our sonification prototype and discussedthe ways in which sonification might be used in SOC tasks. By considering the contexts inwhich sonification might be used in SOCs, we identify its potential utility to SOC tasks. Designrequirements arise for sonification systems that could be suitable for use in such tasks, and forintegration into the SOC environment.
102

Chapter 7
Identifying Contexts of Use andAnalysing Requirements forSonification in SOCs
As we showed in Chapters 2 and 3, the perspectives of security practitioners on the contexts inwhich sonification could integrate into SOC workflow, and the challenges that might arise, hadnot been examined in prior work. Nor had sonification design requirements specific to the SOCenvironment been considered. It was therefore unclear what users felt about the incorporationof sonification into SOCs. Addressing the needs of users is a crucial part of incorporating newtechnologies into their working environment, however [32].
The aim of the research presented in this chapter was to address this gap, through an HCIstudy in which we explored the views of security pracitioners on incorporating sonification intothe SOC setting in which they worked. We aimed to identify requirements and contexts of usefor sonification in SOCs, as part of the user-centred design process [127]. By contexts of use werefer to the conditions under which sonification could be used in SOC work [126]. We focusedon requirements in integration and sonification design. In particular, we aimed to:
• Identify and refine contexts in which sonification systems could aid in SOC working prac-tice.
• Establish an empirical understanding of the challenges of integrating sonification into theSOC environment.
• Extract design requirements for sonification systems that would be effective and useful toSOCs.
• Explore approaches to meeting the identified design requirements
We report on the results of a study involving an online survey and semi-structured interviews.Firstly, we designed tentative use cases for sonification in SOCs, using information gathered fromexisting literature and the responses of security practitioners to an online survey. We then carriedout semi-structured interviews with security practitioners working in SOCs. In these interviews,the proposed tentative use cases were explored, and participants’ views on sonification designand the integration of sonification systems into SOCs discussed. We thus refined contexts of usein which sonification could have the potential to aid in SOC practice, and analysed the needsof users with regard to integration and design [93].
Our contribution to HCI research into the use of sonification in SOCs is a refinement ofthe contexts in which sonification could aid in SOC working practice, an analysis of the criticaldesign requirements and challenges in integration, and identification of the design requirements
103

for sonification systems that could be effective and useful to SOCs. Our findings clarify insightsinto the potential benefits of introducing sonification to support work in the SOC environment.The findings we made in this chapter also informed the development of the sonification methodsused in the remainder of this thesis, and the approaches we took to assessing their utility (inChapters 8 and 9 in particular).
7.1 Methodology
We present an overview of our research approach, and show how it was based on existingrequirements analysis processes. We then describe each stage of the study in more detail.
7.1.1 Research Approach
An overview of the research approach we followed is illustrated in Figure 7.1, in which wepresent the stages of our study methodology, and, beneath this, the stages of the requirementsanalysis process each relates to. This requirements analysis approach was presented by Maguireand Bevan and has been widely used in prior literature [127]; we detail the approach further inChapter 2. The way in which we followed this approach is shown in Figure 7.1.
Informationgathering [127]
Identify userneeds [127]
Envisioning andevaluation [127]
Requirementsspecification [127]
Literature andonline survey
Tentativeuse cases
Semi-structuredinterviews
(Refined contextsof use, integration
and design)
Figure 7.1: Requirements analysis process
As illustrated in Figure 7.1, we drew on existing literature and the results of an onlinesurvey to design tentative use cases. These use cases took the form of descriptions of conditionsin which we believed sonification might be used in SOCs. We then developed these tentativeuse cases in the interviews, to produce refined contexts of use.
Since this is early-stage work in identifying the challenges and potential for integrating soni-fication into SOCs, questions remain to be answered before a full requirements specification (thefinal stage in Figure 7.1) is appropriate. The refined contexts of use, and integration and de-sign requirements we contribute do not, therefore, consititute a complete requirements analysis.Rather, our results represent initial work that can form the basis of a requirements specification.In Section E.5, we highlight the areas that remain to be addressed experimentally and throughfurther interaction with users in the construction of a full requirements specification.
To ensure face validity [137] of the online survey and interview questions, both were discussedwith, and incorporated feedback from, a field expert (a researcher in HCI), and three subjectmatter experts (who worked, or had previously worked, in SOCs). Both the survey and interviewquestions were also answered by subject matter experts in a pilot study.
We recruited 20 participants for the online survey, and 21 participants for the interview.Participants were security practitioners who worked in both internal and multitenanted SOCs,Participants were recruited as described in Section 4.2.1, in which we also present our ethicalapproval reference for this study, and explain how we followed ethical procedures in carrying itout.
104

7.1.2 Developing Tentative Use Cases
We drew on existing literature in developing ideas for tentative use cases for sonification inSOCs. From this, we identified areas in which further evidence was required to justify theproposal of these use cases and, based on this, we constructed questions to validate aspects thatwere unclear. These questions were asked in an online survey of 20 security practitioners, inwhich participants were asked to indicate their level of agreement with six assertions.
Level of agreement with assertions was indicated using a Likert-type scale [125] with responsecategories “Strongly disagree” (= 1), “Disagree” (=2), “Neutral” (=3), “Agree” (=4), “Stronglyagree” (=5). We selected the Likert-type scale as an efficient method of collecting participants’attitudes [111]. Based on these responses, we designed five tentative use cases.
7.1.3 Semi-Structured Interviews
Face-to-face interviews took place at the organisations at which participants worked, in roomsexterior to the SOC. The exception was two participants who were interviewed through a livevideo chat due to travel constraints. Interviews were audio-recorded and lasted approximately30 minutes. The full set of interview questions used is presented in Appendix B.2.
First, participants were introduced to the sonification prototype, a system that maps pa-rameters data from a network packet capture to parameters of music. The prototype was pre-recorded running on a synthetically generated dataset containing network attacks includinga port scan, DDoS, and data exfiltration. Familiarisation of participants with the concept ofsonification was the main aim of this stage, particularly important given that the techniqueis relatively little-known, and not currently operational in SOCs. Early prototyping is key touser-centred design, to convey to users an understanding of the type of system proposed, elicitideas for discussion, and enable users to play a role in the iterative design process [93].
The researchers described the system and each of the mappings used from data to sound.Participants then listened to an audio recording of the prototype using headphones. Next, thesemi-structured interview took place, based around the following questions. We chose to carryout semi-structured interviews, for which these questions served as a guide, with the aim ofallowing further discussion based on the flow of the conversation. This enabled exploration offurther use cases and problems identified by participants.
[1-5.] We are considering the use of sonification for [tentative use cases 1–5] inSOCs. What is your view on the potential of sonification in this use case? This caninclude this particular prototype, and also the concept of sonification as a whole forSOCs.
Before these interview questions were asked, participants were given a table on paper con-taining all five tentative use cases, presented with a Likert-type scale for rating. Participantsthen answered each of the questions, and discussion ensued with the researchers, expandingon topics brought up by the participant such as other use cases, and challenges in integration.Throughout the interview, we highlighted that the participant could consider different sonifica-tion designs to the prototype presented. We ensured that this was clear, since the aim of theinterview was to discuss the potential for the concept of sonification in SOCs in general.
Participants were then asked to rate each of the five tentative use cases presented using theLikert-type scale in terms of its potential utility: “Please rate the potential utility of sonificationin this use case, from 1: not at all useful, to 5: very useful”. This rating stage was placed atthe end of the discussion of each use case to allow participants to formulate their views.
7.1.4 Data Analysis
Given discrepancy in the community as to how to treat Likert scale data [108, 140, 148], wecalculated the mode and median to analyse both the responses to the assertions in the online
105

survey, and the ratings given to each use-case in the interviews. We considered that a modeor median rating higher than 3 constituted overall agreement with an assertion, since 3 wasthe middle value. We also calculated a comparison of non-neutral scores (CNNS), in which wetook the ratio of scores less than (1, 2) and greater than (4, 5) the neutral value (3). The threemeasures support the same conclusions, considered alongside the analysis of the interview data.
We transcribed the interviews, and analysed them using template analysis [116], as describedin Section 4.2.4. We used this qualitative data analysis technique, since it is useful for data forwhich the researcher has some understanding of the concepts to be identified. The interviewresults are presented within the themes of this template in Sections 7.3, 7.4, 7.5 and 7.6, andthe coding table produced is presented in Appendix D.
7.1.5 Development of Approaches to Meeting Requirements
In the research presented in Section 7.8, we considered approaches to developing sonificationmethods that met the requirements we identified in this study. We did not explore designpossibilities exhaustively, but considered how each requirement might be met in practice. Someof these developed methods are included in the sonification system we developed for the studypresented in Chapters 8 and 9.
7.2 Tentative Use Case Development
We summarise our development of ideas using existing literature on SOC working practiceand sonification, indicating potential uses for sonification in SOCs. We present the outstandingquestions (OQs) that we identified and addressed to support the evolution of these ideas, andtheir formulation into assertions in an online survey. Finally, we present the five tentative use-cases derived.
7.2.1 Developing Ideas Using Existing Literature
Anomaly-detection approaches for security monitoring are widely researched, including visuali-zation-based techniques to enable detection of abnormal activity by humans [73, 195]. A widearray of experimental results evidence the utility of sonification for detecting anomalous patternsin data in fields including medicine and astrophysics, for example [14, 17, 134, 171]. Furthermore,prior work has supported the use of sonification for hearing network attacks [18, 146]. Wetherefore posit that it is important to explore the potential for sonification to enable humansworking in SOCs to detect anomalies in the network traffic, and seek to address the followingquestion:
OQ1. Do security practitioners feel capable of detecting anomalies directly from thenetwork traffic?
Security practitioners may be required to carry out other tasks while monitoring the network;for example, managing email inboxes [164]. Prior literature indicates the utility of sonification asa solution to enabling monitoring as a non-primary task. Hildebrandt, Hermann and Rinderle-Ma showed that using sonification to monitor a process as a secondary task while performing adifferent primary task had no significant effect on performance in either task [105]. The use ofsonification for peripheral monitoring may extend to cases in which security practitioners wishto continue to monitor whilst outside of the SOC. We consider that this may be true particularlyfor practitioners alone on shift, while taking breaks for example. To support the evolution ofthis idea, we seek to address the following question:
OQ2. To what extent are security practitioners required to multitask while moni-toring in SOCs?
106

The information required for monitoring in SOCs is often distributed across multiple moni-tors used by security practitioners [68], including large screens at the front of the SOC. Securitypractitioners may therefore be required to focus their visual attention in multiple directions, yetit has been shown that visual perceptual clutter leads to increased errors in judgement [16]. Fur-thermore, security practitioners, depending on their role, can be required to monitor screens forextended time periods, focusing on visual representations of the data and monitoring alerts fromSIEM solutions, for example [164], which may lead to visual fatigue. Presenting sonified datacould reduce the emphasis on visual monitoring. This could mean either reducing the numberof directions in which visual focus is required, or providing an alternative monitoring methodfor visually-fatigued practitioners. We seek to address the following question in developing thisidea:
OQ3. To what extent are security practitioners required to visually monitor infor-mation presented on multiple screens?
7.2.2 Exploring Ideas Using an Online Survey
The six assertions developed to assess the OQs, and participants’ responses to them, are pre-sented in Table 7.1. The online survey was completed by 20 participants working in SOCs: twoSOC managers; 14 security analysts, five of whom were “senior” security analysts; and four (twosenior) security engineers.
Table 7.1: Online Survey Results: Responses to Assertions (Resp., ordered from “Strongly dis-agree” (=1) – “Strongly agree” (=5)): Mode, Median (Med.), and Comparison of Non-NeutralScores – Disagree (1-2): Agree (4-5) (CNNS: D:A)
Assertion Resp
.
Mod
e
Med
.
CN
NS
Anomaly detection by humans (pertains to OQ1)
Assertion 1 : Human analysts monitoring the network are capable ofdetecting network anomalies missed by automated systems
0,1,5,10 4 4 1:14
Assertion 2 : The monitoring setup I use enables me to detect networkanomalies that are missed by automated systems
0,4,11,4,1 3 3 4:5
Assertion 3 : I sometimes rely on my experience and intuition to detectnetwork anomalies rather than monitoring system alerts
0,2,7,7,4 3.5 4 2:11
Multitasking/non-primary task monitoring (pertains to OQ2)
Assertion 4 : I am required to monitor the network, while carrying outother tasks simultaneously (e.g., responding to emails)
0,2,2,13,3 4 4 2:16
Monitoring across multiple screens (pertains to OQ3)
Assertion 5 : In monitoring, I am required to watch multiple monitorsdepicting different data at one time
0,1,2,12,5 4 4 1:17
Assertion 6 : I am required to watch multiple dashboards on the samemonitor depicting data at one time
0,3,4,9,4 4 4 3:13
Five of the assertions obtained mode and median ratings greater than 3, which we consideragreement, as explained in Section 7.1.4. The exception is Assertion 2, which indicates thatwhile practitioners feel capable of detecting anomalies, they are less confident that their exist-ing monitoring setups enable this, and this is supported by the CNNS. This result supportsexperimentation with new methods of enabling this capability. The survey results can thereforebe seen to affirm the three OQs.
107

7.2.3 Tentative Use-Cases
Based on the survey results presented in Table 7.1, and the prior literature, we derived thefollowing five tentative use-cases to carry forward to the interviews.
1. Detecting anomalies in the network traffic. Presenting high-resolution sonificationsof the network traffic, to enable humans to hear network anomalies.
2. Monitoring as a non-primary task. Sonifying network-security data to be monitoredas a secondary task, enabling the user to carry out a separate primary task simultaneously.
3. Monitoring data presented across multiple screens. Sonifying parts of informationthat are currently presented across multiple screens, reducing the directions for focus ofvisual attention by users.
4. Alleviating fatigue from monitoring screens. Enabling users to monitor with reducedstrain on visual attention, by providing the option to use sonification.
5. Enabling monitoring whilst outside of the SOC. Enabling users to continue moni-toring work (e.g., using wireless earpieces) whilst outside of the SOC.
Use-Case 1 was supported by the assertions of survey participants that detecting anomaliesdirectly from the traffic was a capability of practitioners. The requirement to monitor acrossmultiple screens motivated the development of Use-Case 3. Use-Case 4 was supported by therequirement for extended periods of visual monitoring reported in prior literature [164]. Therequirement affirmed by the survey to multitask while monitoring the network justified thedevelopment of Use-Cases 2 and 5. We considered that multitasking might occur while carryingout other work inside the SOC, or while carrying out activities when away from the SOC, butstill on duty.
7.3 Interview Results
In this section we present demographics of participants in the interviews. Interview resultsrelating to use case utility, and themes arising in integration and design, are reported in sections7.4, 7.5 and 7.6, respectively.
7.3.1 Participants
We interviewed 21 participants between May and June 2017. Participants were security prac-titioners working in seven different SOCs. From three different internal SOCs, responsible forthe security of a single organisation, 12 participants were interviewed. We also interviewed nineparticipants from four different multitenanted SOCs, who provided managed services for clientorganisations. Of the participants, four were SOC managers; three described themselves as “se-nior” or “lead” security analyst, and ten as security analyst; two were both security analystand engineer; two were security engineers. Table 7.2 shows the job role and organisation typeof each participant.
7.4 Perspectives on Use Case Utility
We present the interview results on each of the use cases presented, as well as some new use casesproposed by participants. The extent to which each use case was considered to have potentialin SOCs is analysed here, differences in opinion are considered and challenges described, withthe aim of refining promising contexts for the use of sonification in SOCs. In Section 7.7, weengage in a critical reflection on the requirements for these refined contexts of use.
108

Table 7.2: Interview participant (P) demographics
Internal SOC Multitenanted SOC
Manager 3 (P1, P2, P17) 1 (P6)“Senior” 0 3 (P7, P15, P16)Analyst 7 (P3, P4, P13, P18, P19, P20, P21) 3 (P10, P11, P12)Analyst & engineer 0 2 (P8, P9)Engineer 2 (P5, P14) 0
7.4.1 Use Case 1: Detecting Anomalies in the Network Traffic
Overall, participants felt that sonification had potential in this use case. A number of par-ticipants felt that humans were capable of detecting anomalies when presented with networkdata. The belief that it was mostly humans who detect network anomalies was expressed (P15),and it was suggested that humans have the capacity to recognise more subtle anomalies thanmachines: “there’s still a lot of human analysis, and a machine can only determine the reallyobvious ones” (P8). Security visualizations were frequently specified as a class of tool that en-abled participants to detect anomalies (4/21). The ability to see anomalous spikes in trafficvolume over time using visualizations was highlighted.
Possible benefits of sonification over existing approaches to anomaly detection were explored.The potential of sonification for detecting anomalies not apparent from visualizations was de-scribed, because “the thing with a graph is you can only — it’s not how much you can see,it’s how much you can present on the technology” (P6). The trustworthiness of the informationconveyed by the sonification was highlighted as an advantage over automated approaches, whichcan produce false-positives:
It can’t ever lie because it’s just going on what it’s seeing, it’s not saying it’s maliciousit’s just saying that that’s what I am seeing. (P10)
The ways in which anomalies might be detected using sonification were discussed; in par-ticular, the potential to learn some baseline sound of the network, and from this basis detectanomalies. This included hearing deviations from a baseline amount of traffic to larger amountsof throughput. The potential to “get used to the sound” such that deviations were apparent wasalso highlighted:
When say a DoS attack or some other form of attack would take place, I’m sure itwould stand out because you would get used to hearing a certain type of tune or humfrom day-to-day activity. (P15)
In general, participants felt that sonification had promise in this use case. Assessment of thekey points highlighted — the ability to hear deviations from a baseline sound, and the compar-ison of a sonification-based approach to anomaly detection with automated and visualization-based approaches — will be important in developing this use case. This comparison is partic-ularly important given that, while many participants believed humans could detect anomaliesin the data, some felt that anomaly-detection currently was predominantly machine-driven,while another participant noted that the real solution may be somewhere in between, i.e., thatanomaly-detection capabilities differ between individuals (P16).
7.4.2 Use Case 2: Monitoring as a Non-Primary Task
Perspectives on the potential utility of sonification in this use case were positive in general. Anumber of participants stated that they were required to multitask in their role. Participantsreported a range of tasks during which they were required to multitask whilst monitoring,
109

including: researching new threats, composing reports, sending emails, or investigating cyberincidents. Participants saw potential value in the use of sonification at times when multitaskingwas required:
One of the issues we have is that when we see something of interest, and we areresearching that or raising a ticket for escalation, you’re no longer monitoring. So,at points in time where you’re not monitoring, if there was an audible cue that “ohactually, there is something happening right now, maybe my attention should be backthere rather than on the task in hand”. (P13)
The current requirement to use visual means in multiple tasks was highlighted as a challenge:“If we’re investigating something else ... I’ve only got three screens, and I’ve only got one pairof eyes” (P10). Existing approaches to multitasking were discussed; a light-based solution, forexample, in which coloured light would signal alerts. The value of attention-grabbing forms ofindication was described: “That’s why I love the light ... any other indicators for me are reallyuseful, because I don’t focus on any one thing” (P16).
Participants described the potential value of sonification for monitoring without focusedvisual attention: “you could just be monitoring or listening to that background rather than havingto keep looking up” (P8). This extended to the use of sonification for monitoring alerts generatedby automated systems, removing the need to keep “viewing the alarm view while I’m doing otherthings” (P7).
The discussion of both sonified network traffic and sonified auditory alerts brings into ques-tion the type of information that is most appropriate for sonification in this multitasking ap-plication. The information content of the sonified network packets, compared with an auditoryalert, was highlighted as advantageous by one participant: “the music can tell me, ‘somethingelse has happened, you need to go look at that’, and not just as an — ‘alert, alert, alert’” (P8).
In summary, perspectives on this use case were positive, subject to some design and capabil-ity questions. A key question is the type of information to be sonified — both network-packetdata and alert data were discussed as advantageous. Participants voiced concerns about the pos-sible effect of monitoring using sonification on their primary task, and of the primary task ontheir monitoring capability. While Hildebrandt, Hermann and Rinderle-Ma showed that theseeffects were not significant in a different context [105], assessment with SOC-specific tasks,which are often time-pressured, and require high levels of attention, is required. The nature ofSOC tasks could affect the performance of users multitasking using sonification.
7.4.3 Use Case 3: Monitoring Data Presented Across Multiple Screens
The potential for sonification in this use case divided opinion. Firstly, the extent to whichpractitioners felt that they were required to monitor across multiple screens differed betweenSOCs. Some (8/21) stated that multiple screens (between two and seven) were used to showalarms, devices, and chat feeds, for example. In other SOCs, monitoring across several screenswas not required, since all monitoring information was presented within a single pane of glass(6/21).
Opinions also differed on the challenges posed by the use of multiple screens. It was reportedthat information could be missed because of its distribution across multiple screens. Missedinformation on monitors at the front of the SOC in particular was reported, if practitionerswere engaged in another screen doing an activity:
Something on this screen [at the front] could be red, but if they’re already doing apriority 1, they’re not going to be looking over there seeing the other priority 1. (P6)
For these participants, monitoring across multiple screens was a challenge sonification couldhelp alleviate. Both sonification of alerts and of network traffic were mentioned:
110
There are analysts sitting down there, and you have a massive dashboard, so theyare still required to be looking at that at all times, and looking at their own screen.Sound will help in minimising that if you know what I mean, just looking, as it avoidsconstant attention. (P17)
For some participants, however, the use of multiple screens did not pose a challenge and wastheir own choice, since it was convenient to have dedicated screens for executing commands,for example. These participants stated that they would not find sonification useful in thisapplication anyway; that they would not wish to reduce the number of screens: “I will still useseven [screens], even if I have all the sound in the world” (P12). One participant reported thatreducing the number of screens would make their job more challenging:
If I don’t have enough screens, I’ve got to constantly minimise, maximise, and copythis and go here and it can be very difficult. (P7)
On the whole, participants were divided as to whether sonification had the potential tobe useful in this use case. The type of information that might usefully be represented by thesonification was unclear, and a number of participants did not desire any fewer screens. Whileit is clear that the spread of screen locations can cause information to be missed, it is likely thatother technologies would be more effective solutions than sonification, meeting the needs of agreater proportion of security practitioners. Some participants suggested that the combinationof this information through a single pane of glass would be a solution preferable to sonificationin this instance.
7.4.4 Use Case 4: Alleviating Fatigue from Monitoring Screens
In general, sonification was not perceived to have potential as a solution here. Some participants(6/21) stated that they were sometimes visually fatigued by their monitoring work in the SOC,yet others (3/21) stated that they were not visually fatigued as they were accustomed to lookingat screens. It was suggested that the extent to which fatigue was felt differed between individualsand types of role: “nowadays I am doing stuff all the time, but there was a period when I wasjust staring at, I think it was, three different monitors at once” (P9).
Methods used for mitigating fatigue currently were described. Encouraging workers to takeregular breaks was one approach used. Another approach adopted was using as much automationas possible. Participants questioned how sonification would work in practice as an alternativefor visually fatigued practitioners. If the sonification played only at times practitioners werefatigued, their ability to interpret information from it might be limited:
I can see it as an alternative to visualization for when you get to a point when youreyes are tired ... the thing is if you only switch it on when you get to that point, thenI think you won’t really understand what normal would be, so you would still need iton in the background to some extent. (P15)
A number of participants felt that sonification would not be useful for them in this applica-tion. This was either because they felt visual fatigue was already prevented through the otherapproaches described (automation and regular breaks), or because using sonification would notstop them from looking at screens anyway. Overall, the utility of sonification in this use casewas questionable, and the ways in which it might work in practice unclear.
7.4.5 Use Case 5: Enabling Monitoring While Outside the SOC
Participants generally felt that sonification had strong potential in this use case: “if you werejust going out and you pop a pair of headphones on or whatever and you can hear, ‘oh right,
111

something is going on’, I can jump back in” (P10). Specific times when it could be necessaryto continue monitoring while outside of the SOC, included during a fire alarm, while makingdrinks, while on break, and while going to the shop. This was particularly true for participantswho were required to do one-man shifts: “today it’s only me here, and I did have to leave to theshop earlier” (P11).
It was noted that using sonification in this application could be particularly useful forpractitioners alone on shift: “The first ever job I did in a SOC I was the only person in the room.You could definitely say that would help with that one” (P9). Smaller SOCs, in which one-manshifts occurred, as well as companies running their own SOCs, were mentioned as situations inwhich this capability might be especially helpful:
The guy running his own SOC, the SOC won’t be his only task, he might be plumbingcomputers in the main office, and want to come back in if something big happens.(P6)
It was reported that there were existing approaches to monitoring whilst outside of theSOC. This included emails sent to cellphones, and a sonic alarm used when on break: “WhenI leave, I unmute it, so that I can go and put my feet up, and then if there’s an alarm I wouldcome” (P11). The potential value of a more informative sonic approach (than the simple alarmcurrently used) was discussed by this participant:
If we had a melody like yours representing that, and I knew what the melody wasplaying and what it was, then maybe I wouldn’t have to come and look at it, becauseI would be like “ok it’s something normal for this time” ... with the current beep, wedon’t know until we actually log in. (P11)
The placement of monitoring screens in the break room was another approach currentlyused to indicate to practitioners that they were required in the SOC. A number of participantsdiscussed being waved at through the window by other workers in the SOC, to attract theirattention if required while on break. This was particularly true for analysts with higher skilllevels, who were required for specific types of event. Participants felt that sonification could beuseful as an alternative approach to informing practitioners on break that they are requiredin the SOC, played through speakers break areas such as the kitchen, or through an earphoneworn while on break:
They wouldn’t need to rush back, keep checking, they could just go about their businessand know “right, when I hear that sound, I need to take whatever action”. (P7)
The desire to use sonification for monitoring outside of the SOC might differ depending onthe way in which different SOCs are run. For example, one participant, a SOC manager, was ofthe opinion that monitoring should not be continued outside the SOC, on break for example,as it would defeat the purpose of the break. In general, however, this use case shows promiseas an approach to addressing an area that currently poses challenges in the work of securitypractitioners in SOCs.
7.4.6 Use Case Ratings
Table 7.3 presents participants’ ratings for each of the five use cases presented. Use cases 1, 2,3 and 5 obtained mode ratings greater than 3, which we consider indicates overall agreementwith potential usefulness (as explained in Chapter 4). Use Cases 2 and 5 attained the highestpossible mode rating.
Based on these results, we selected Use Cases 1, 2 and 5 to form the basis of our refinedcontexts of use, presented in Section E.5. Although Use Case 3 also scored a mode rating greater
112

Table 7.3: Mode, and number of ratings given to each use case by participants
Use Case Ratings Mode1 2 3 4 5
1: Anomaly detection 1 1 7 7 5 3.52: Multitasking 1 4 4 4 8 53: Multiple screens 3 2 2 8 6 44: Visual fatigue 3 6 4 3 5 25: Outside-SOC activities 0 1 1 3 16 5
than 3, we chose to omit it from the refined contexts of use, based on the qualitative analysisof the interviews, from which we concluded that other solutions to the challenge of multiplescreens may be more appropriate for SOCs.
7.4.7 Other Use Cases Suggested by Participants
Aside from the use cases we presented, other uses were suggested by participants, falling underthe following themes.
Occasional use
One participant suggested that the sonification would be useful for occasionally checking thesound of the network:
I might listen to it once an hour, and go “ ... it doesn’t sound the same at 1 o’clocktoday as it did at 1 o’clock last three days”. (P6)
It was suggested that sonification could be played for the duration of particular events, andthat this would be useful for conveying the length of events, since: “sometimes looking at datayou might not fully understand when it started and when it ended” (P11). Sonification could alsobe played in the background particularly at times when high-severity incidents were being dealtwith, to act as an indicator for SOC workers when a new incident may require their attention(P8).
Hunting for anomalies
One participant suggested the use of sonification as a threat-hunting tool, for times when ana-lysts are required to hunt through data retrospectively, searching for anomalies. This includedlocating the packets worth investigating:
If I put that on for five minutes, and it sounds anomalous, then I know there’sfive minutes’ worth of packets worth looking at. Otherwise I might look at five min-utes’ worth of packets, and spend an hour just looking at some packets with nothingparticularly interesting in. (P6)
The potential to listen to the sonification at increased speed (using some fast-forward fea-ture), both for conducting audio reviews of data retrospectively (“if you’ve got an alarm or aperiod that you’re interested in”) and for real-time monitoring applications, was discussed:
If you had a baseline amount of traffic for a given network, you could go “I’ll listen toa minute of that, now I’m going to listen to a minute of what has just gone throughthe sensors”, maybe accelerated, you will then start straight away going “hold onthat doesn’t sound right”. (P6)
113

Improving SOC workflow
It was suggested that a continuous soundtrack could improve the SOC workflow as a moreefficient method of making practitioners aware of events that are relevant to them, without thetime needed for others who noticed it to escalate it to them:
At the minute, I guess, it relies on the first person who sees those events to recognisethat that’s bad, to then escalate ... if you heard lots of anomalies, the people who itwould be eventually escalated to would instantly know that, and could maybe starton that earlier. (P8)
An idea suggested by a manager, to take over some of their alert-handling workload, wasthe presentation of alert-severity ratings using an automated voice:
An audio prompt would give me more time, because I could sit at the back of theroom, and if it’s not shouting numbers out, I don’t need to look at the queue. (P6)
7.5 Perspectives on Integrating Sonification
We present key themes identified relating to the integration of sonification into the SOC envi-ronment, before summarising the challenges identified.
Headphones or speakers?
A number of participants discussed whether the sonification would be best played throughspeakers or personal headphones (5/21). Some participants highlighted potential problems withplaying the sonification through speakers in the SOC (3/21) — for example, that if the sonifi-cation was made the soundtrack to the SOC, practitioners who were not monitoring would stillhave to listen to: “the ‘work noise’, as they will understand it, when they’re trying to concentrateon doing something else” (P2).
Some participants, however, felt that headphones were not always a desirable solution, aswearing headphones could isolate practitioners, or hamper collaboration (5/21). Alternative so-lutions were suggested, including the use of a single earpiece rather than headphones, suggestedby two different participants, to enable practitioners to continue to collaborate.
Existing SOC workflow and soundscape
Some participants focused on integration of the sonification with necessary SOC workflow inan unobtrusive way, noting that it should not get in the way of “people being able to talkabout what’s going on” (P10). A potential need to standardise responses to sounds heard wassuggested:
Everything we do is based around a process or procedure, so I’m not sure how youwould ... get everyone to conform to, “when you hear this, you do this”. (P7)
The existing soundtrack in the SOC environments they worked in was described by partic-ipants. Some participants stated that in their SOC there was an existing soundtrack, such asradio for the whole room. In other SOCs, there was no deliberate noise — generally in thesecases practitioners would listen to music or audiobooks at times through personal headphones:
We don’t have any audio stuff in there ... Occasionally people use headphones andstuff to listen to music, and on the odd occasion we will put some music on. (P15)
114

The frequency with which workers in the SOC used personal headphones was discussed. Insome cases, those working in the SOC listened through personal headphones all the time (P16).In other cases, headphones were used occasionally:
They do listen to their own music, but not constantly and this is my only worryabout whether this would work if it’s constant. (P11)
Complexity of Networks
Participants discussed the difficulty of finding unusual behaviour in networks: “the more complexyour network is, the more difficulty you have working out what is unusual” (P6). A suggestedapproach to dealing with large amounts of network traffic was filtering sound by particular IPaddresses or assets.
One participant highlighted the issue of network complexity in the multitenanted SOC theyworked in: “I think if it was for an internal SOC for a specific company that probably would workbetter. Here because we’re a managed services provider, I think there would be too many thingsgoing on” (P10). Further research into differences in required design solutions for different SOCtypes is needed, such as filtering sound to focus on single networks for multitenanted SOCs.
Summary: challenges in integration
Some challenges in integrating sonification into SOCs emerged from the interview responses.Appropriate integration of sonification with existing SOC soundscapes and workflow will bekey if the technology is to be unobtrusive to users. The existing SOC soundscapes identifiedhave implications for integration. In SOCs where the soundscape is silent, appropriate methodsof integrating sonification — using headphones, or a design that is sufficiently unobtrusive —should be considered. Equally, the effect of the existing SOC soundscapes on listening shouldbe considered: sonifications may be drowned out in noisy SOC environments.
To be appropriate for use in SOCs, sonification systems must integrate with existing SOCtools in a way that does not obstruct their use. A key class of tool used in SOCs, on which thenetwork-security monitoring practice of security pracititioners is usually based, is the SIEM.The importance of the SIEM as the basis for monitoring was cited by multiple participants:“everyone is monitoring output of the SIEM ” (P1), and “everything that happens in the SOCcomes into our SIEM ” (P6), for example. Tools external to the SIEM, such as packet-captureviewers, are also widely used, for retrospective investigative work in particular. In designingsonification solutions for SOCs, sensitivity to the existing use of tools will be critical.
It was highlighted that sonification should not distract users in a way detrimental to SOCactivity. Sonification systems should be designed with appropriate sound complexity for partic-ular tasks, since complexity of auditory stimuli has been shown to affect cognitive performance[154]. Reducing cognitive load is a key consideration for creating usable security interfaces [141].Less complex sound is needed for non-primary tasks, since less complex background auditorystimuli have been shown to improve the performance of security-critical tasks [30]. Mappinghighly complex network data to low-complexity sounds will pose a challenge.
The copious amounts of complex data present on networks exacerbates the challenge of de-signing sonification systems suitable for the SOC environment, since it makes finding a baselineof “normal” behaviour difficult. Concerns were voiced in interviews that sonification systemsrepresenting such data could become cacophonous, and tuning systems to some network base-line would take time. The need to train users to use these systems, and understand the soundsof the networks monitored such that abnormalities could be identified, was also discussed as apotential challenge. The time required for adequate training of users, and for tuning of systemsto networks, is a key factor affecting the utility of the approach.
Listening to sonification for extended time periods may be fatiguing. Fatigue caused byprevious sonification designs has been reported and was highlighted as a potential pitfall by a
115

large number of participants. In integrating sonification into SOCs, therefore, it is important toconsider mitigating fatiguing effects. Kramer argued that “improved aesthetics will likely reducedisplay fatigue” [28, p. 145], and prior research into sonification aesthetics can be drawn on. An-other approach to mitigating fatigue, to be assessed experimentally, is to enable personalisationof the sounds listened to.
7.6 Perspectives on Sonification Design
The main questions relating to sonification design discussed by participants are described, andsummarised at the end of this section.
Sonification of alerts
Sonification of alerts was mentioned by a number of participants (6/21). Sonified alerting wasproposed as an approach for communicating events considered critical, and the use of sonificationfor alerting on particular systems was discussed:
Using this would benefit us, say if the DDoS mitigation stuff that we use, if onlythat, or only a subset of alarms or devices alerts us to anomalies via sound. (P7)
The severity of an alert, and the class of network activity it relates to, were types of infor-mation that might usefully be conveyed by an alert-sonification system. It was also suggestedthat sonification of alerts could be layered with the sonified low-level network traffic:
You could tell the system to play music not just based upon the packet captures butbased upon outputs of other things, outputs of the signatures, outputs of x, y, z, thenyou can kind of build up two layers of that, so you could listen to the underlyingtraffic as part of an incident. (P8)
Mitigating fatigue
A number of participants (8/21) stated that they felt they would be fatigued by continuousexposure to the sonification. The potential for occasional use of the sonification was discussedin the context of listening fatigue:
I guess you could use it as and when, but I think if you put that on somebody’s headfor a day, I think you would struggle with that. (P6)
The potential for the sonification to be unobtrusive unless required was highlighted: “musicyou can switch off to, but equally the anomalies in there, your brain is going to pick up on themand go ‘that’s changed, that different’”. Designing sonifications that are unobtrusive in this wayis a potential approach to mitigating fatiguing effects.
What next — approaches to investigating anomalies heard
The role of sonification as a tool for enabling anomaly detection, as the initial indicator thatsomething was wrong, resulting in some follow-up by the analyst, was discussed:
It takes care of the first bit for you. So you’re going to after, go and investigateit yourself, and you’re going to have to ask a question — why has there been anincrease, or why this anomaly has occurred. (P7)
116

Participants raised the question of how to make hearing deviations in the sonification ac-tionable (P8, P13). It was suggested that without enabling investigation of anomalies heard,the sonification would be less useful:
Saying you heard something weird is great, but unless you can quantify that, in anactual investigation, then you know something is bad, but you don’t know what thatbad thing is. (P8)
A suggested approach to this was making the sonification informative in particular ways.Participants working in multitenanted SOCs made design suggestions for monitoring for multiplecustomers, including ways of linking events from the same customer, while listening across allcustomers. One suggestion was a voice-based approach to this linking across multiple customers,in which a voice would speak the customer number simultaneously with the network sonificationplaying, for example (P8). Another idea used sonic methods of conveying information aboutwhich customer was affected:
Different sound sets for different customers. So if I hear the ddos sound and themalware sound for customer x and they’re at pitch y, then I can go “ok yeah Irecognise that. Hold on those are both from the same customer.” (P6)
Outputting to visualizations was another approach suggested for the linking of anomaliesheard to information content (P8, P10). Visual representation of the sound itself, such thatrecognition of times at which events were heard was possible, was suggested (P10). Addressingthis question will involve assessing the amount of information that can be extracted from thesonification, and the implications this has for the way in which further information shouldbe conveyed. One participant suggested that music could be a viable approach to identifyinginformation content, and expressing significant amounts of information:
It’s identifying that change ... which you would learn, because that’s how musicworks, it’s association ... You show me a bunch of colours, I’ll be going “great that’sa bunch of colours”. But I wouldn’t understand them ... whereas music for me ismuch more than that, it represents significantly more than a bunch of colours couldever do. (P8)
Assessing the quantity and granularity of information extraction possible by humans listen-ing to sonification, and the learning curve required to achieve it, is important.
Summary: the need for flexibility in design
Some key differences in opinion were highlighted, with implications for sonification design.Participants differed in their opinions on whether it would be suitable to play sonificationsystems using headphones, speakers, or single earpieces in SOCs, and whether continuous oroccasional use would be most appropriate. It is clear that the different approaches may suitdifferent users and different scenarios. It is therefore appropriate for sonification designs to beflexible, depending on the use case and SOC worker preference. Playing the audio throughheadphones, speakers and single earpieces should all be viable, and the sonification methodshould support both continuous and occasional use.
The analysis also highlights a difference in requirements between multitentanted and internalSOCs. One participant working in a multitenanted SOC described the potential difficulty ofusing a sonification system in the environment in which they worked, with large amounts of datafor so many customers, compared with an internal SOC. Further research into differences in therequired design solutions across different SOC types is necessary. A solution for multitenanted
117

SOC environments might be the provision of tool features to filter sound by single SOCs to bemonitored.
It is clear that in some applications, simple, informative audio alerts would be useful. Thispoints to further exploration of the use of event-based sonification and earcons (short musicalmessages whose properties communicate properties of the data represented) [132] for presentingnetwork-security alerts.
The prototype design presented in this study initiates the participatory design process [93].This should be iterative, and as such future design of sonification systems for this applicationcan draw on the design requirements we identified. Consulting users in the development processis especially important given that the technology is not currently operational in SOCs.
7.7 Refined Contexts of Use
Based on the interview results relating to use case utility, we refined contexts of use, identifyingthe potential actors, key usage scenarios, and relevant SOC workflow factors [127].
Multitasking whilst monitoring as a non-primary task
Sonification is potentially useful for aiding security practitioners in carrying out monitoringtasks while conducting other primary tasks. It is important to assess this capability experi-mentally; in particular, the effect of primary tasks on the ability to monitor the sonification,and of performing secondary-task monitoring on the primary task. Such work can draw on theaforementioned work of Hildebrandt, Hermann and Rinderle-Ma, which showed such monitoringhad no significant effect on either primary or secondary task [105]. However, context-specificassessment is important, using the primary tasks we identified as relevant to SOCs: sendingemails, writing threat intelligence reports, and investigating incidents were some of the tasksdescribed.
The value of having a sonification system that is unobtrusive to primary tasks, but drawsattention to anomalous sounds, was described, and this should be considered in sonificationdesign. Both network traffic and alert streams were considered types of information that couldbe monitored as a non-primary task; sonification designs should therefore encompass both.Speakers, headphones, and single earpieces (to prevent isolation) were all considered appropri-ate playing mediums for this application by different participants. Sonification designs shouldtherefore use mappings suitable for all these mediums (for example, spatialisation of differentsounds through different ears in unsuitable for single earpiece listening).
Monitoring traffic and alerts as a primary task
For some SOC practitioners, in particular some Level 1 Security Analysts, there is a less frequentneed to multitask, and the focus is on monitoring the automated system output and networktraffic as a primary task. This context of use is an adaptation of the multitasking one above,aimed at monitoring as a primary task. Again, both network traffic and alerts are relevant tothis type of monitoring, and a sonification system combining the two may be appropriate. Ifused continuously, it is important that the sonification aesthetic is not fatiguing to the useror distracting to other SOC practitioners. It is also important for these real-time monitoringcontexts of use that users can link the sounds heard to the data itself: sonification tool designshould incorporate facilities for users to understand visually the sounds heard and thus observedetails of the data they represent.
As well as sonification systems combining traffic and alerts, the use of low-level traffic soni-fications in this context may be appropriate. Situations in which sonification of network traffichas potential value as an anomaly-detection approach include long-term, continuous listeningto the sonification for real-time detection of deviations. To support this use, anomaly-detection
118
capabilities using sonification should be compared with those using security visualizations andautomated tools. Prior sonification work indicates that malicious network activity can be de-tected using sonification [18, 146], but does not make this comparison.
Monitoring whilst outside of the SOC
There are times when it is ideal for security practitioners to be able to continue their monitoringwork whilst outside of the SOC. This is particularly true for smaller SOCs, in which workersundertake one-man night shifts. Such workers, who might leave the SOC for a short time (e.g.,to make a drink) or for a longer time (e.g., to go to the shop) saw potential value in theuse of sonification to enable their monitoring work to continue. In larger SOCs, listening tosonification in break areas could improve SOC workflow for more experienced practitioners,who might currently be called (e.g., waved at physically) back into the SOC by others whentheir expertise is needed.
This capability could be enabled through wireless earpieces worn by workers when venturingoutside the SOC, or by speakers playing sonification in break areas. As well as the network-packet sonification approach, of which the prototype presented was an example, sonified alertstreams were highlighted as information that could be monitored at times outside the SOC.Sonification designs that enable both packet and alert representation, individually or in combi-nation, would therefore be appropriate. Monitoring accuracy and attention during out-of-SOCactivities should be compared with inside-SOC capabilities, to support the development of thisuse.
Short-term anomaly-detection tasks
Short-term anomaly-detection uses include real-time checking of the sound of the sonificationoccasionally (once per hour, for example) to compare with previous times of listening. Anotherpromising short-term use is retrospective analysis. Practitioners tasked with searching retrospec-tively through data for anomalies suggested that using sonification could enable the location ofinteresting packets for closer inspection using other tools. For anomaly-detection tasks in whichthe aim is to hunt for anomalies that were not alerted on by automated systems, sonificationsof packet traffic are more relevant than sonification of alerts.
For both of these short-term anomaly detection tasks, listening to sonification at an increasedspeed was highlighted as potentially useful. A sped-up sonic representation of the last hour (forexample) of network data might be used to occasionally spend a few minutes checking thestate of the network. For retrospective analysis, speeding up the sound could enable securitypractitioners to retrospectively sift through data from extended time periods more quickly. Theability for users to return to specific timestamps, and replay and pause the sonification to honein on particular areas of data would be important in such investigative tasks, as well as theability to filter so that particular sounds or types of data are represented. Effective methodswould be needed to link the sounds heard to the visuals and the data itself. Research is neededinto approaches to enabling this link between anomalous sounds heard and the data (in a visualor text-based form) it relates to.
7.8 Approaches to Addressing Sonification Design Requirements
We explore approaches to addressing a selected set of the design requirements highlighted forsonification systems, for use in SOC monitoring tasks. In formulating these design requirements,we drew on findings and outstanding questions from the interviews with security practitioners.
We aimed to address the following design requirements.
119

1. Configurability. Participants in the interviews highlighted aspects of the sonificationtool that should be configurable by users, in order that developed sonification tools canalign with SOC working practice and possibly be less fatiguing to listeners.
(a) Data-sound mappings should be configurable, such that a user can select whichdata parameters are represented sonically in the system they use, and which soundparameters they are repesented by.
(b) The network details used by the sonification system should be configurable by users:it is important that users can list internal network IPs and alter details of theseaccording to changes to the network configuration, as well as inputting blacklists orwhitelists of IPs, ports and services that should inform the baseline sonification anddeviations from it.
(c) Configurable sonification aesthetics may be an approach to reducing the fatigue ex-perienced by listeners. Participants noted that musical tastes differ between people,and that in order that the approach can be scaled to use by users with varyingtastes, it may be appropriate to enable selection of the sound aesthetic by the user.
2. Tool Features. The interviews showed that security practitioners perceived that certainfeatures could improve the potential utility of a sonification tool to them.
(a) Enabling the user to play, pause, and rewind parts of the sonification, or selecttimestamps in the data from which the sonification should play.
(b) Playback speed: enabling the user to speed up or slow down the speed at whichdata is played (for use in retrospective anomaly hunting by security practitioners,for example, as suggested in the interviews).
(c) A visual means of linking sounds heard to the network data itself. This related to therequirement highlighted in the interview for users to be able to use a visual meansto make a link between a sound heard and the data itself, and thus understand themeaning of the sounds heard.
(d) Enabling the user to filter the sound by either:
• Filtering by data: for example, selecting certain source IP addresses and onlysonifying the packets with that source IP address; or
• Filtering by sound: for example, selecting a certain instrument (if the userhas heard something of interest playing in that instrument, for example) andlistening only to the sounds that are played in that instrument.
3. Sonification of alerts. Multiple participants expressed the view that using sonificationsof alerts could be useful to SOCs. This included incorporating alerts into the packetsonification (layering the two), or using them separately as an alert-only sonification.Integration with Snort IDS alerts, or similar, was suggested. Key information that it isimportant to represent about alerts was highlighted by practitioners in the interviews:
• Type of alert
• Severity of alert
• Number of alerts
In Sections 7.8.1, 7.8.3 and 7.8.2, we explore approaches to meeting some of these designrequirements. The requirements explored are configurability of data-sound mappings (1a) andof sonification aesthetics (1c); development of a visual linking method (2c); and sonification ofalerts (3 )).
120

7.8.1 Configurability
Configurable data-sound mappings
The approach taken to developing a method by which users can configure data-sound mappingsis shown in Figure 7.2. We normalise the values of data parameters to fall within a range that isuniform across data parameters. These values are then sent to “sonifiers”, which transform thereceived normalised value into a value in the range of a particular sound parameter, dependenton the mapping selection, using a selected scaling function. It is thus possible to change betweena range of sound-mapping choices for any data parameter selected.
Mapping betweendata parameter
D and soundparameter S
selected by user
Value of D ex-tracted from thenetwork data andnormalised to fallwithin a set range
Sonifier representingsound parameter
S transformsthe normalisedvalue of D to a
sonification value
Sonificationvalue is sent asan input to the
sonification engine
Figure 7.2: Approach to enabling selection of data-sound mappings by users
Configurable sonification aesthetics
In line with requirements from the interviews with security practitioners, we developed a methodof enabling users to select certain characteristics of the sound used. Our approach was to enableusers to make choices about various different aspects of the music: musical key, chord progression,time signature, tempo, and instruments. This is an early-stage example of an approach toenabling configurability of the sonification aesthetic by users; expanding on the work presentedhere is out of scope for this thesis and left to future work.
We took a two-stage approach to generating the characteristics of the sound event to beplayed for each data event. Firstly, the system calculates the sound event characteristics basedon the aesthetic selection (key signature and time signature, for example), and the position inthe music generated (which chord is currently being played, for example). At this stage, the noteevent is ready to be generated according to the baseline sound. Secondly, the system calculatesadditional information on, and deviations in, the sound event by deriving the values of the soundparameters involved based on the characteristics of the data event to be represented. At thisstage, the sound event might be mapped to a dissonant sound, set to play in the flute, or itsvolume increased, depending on the characteristics of the data event (the packet, for example),it represents.
7.8.2 Tool Features
Visual linking plot
The visual interface we developed is presented in Figure 7.3. In this time series, each dotrepresents a sound event, coloured according to the instrument in which it is played. Soundevents that are dissonant are represented as crosses, and the frequency of the sound event isrepresented on the y-axis (so dots and crosses nearer the top of the plot represent higher notes).
Hovering over any dot reveals information on the data sonified: the source and destinationIP addresses and ports, protocol, and packet size. The aim is to enable listeners to recognisesounds heard in the plot (by observing their consonance, the time at which they played, theirfrequency, or the colour that represents the sound), and thus to explore them further by hoveringover them for details.
121

Figure 7.3: Sonification-visual linking plot
7.8.3 Sonification of Alerts
We applied the sonification model presented in Chapter 5 to the problem of sonifying informationabout alerts. In the following, we consider relevant data and sound channels and parameters(information that might usefully be conveyed about alerts through sonification, according to thesonification model), drawing on the views expressed by security practitioners in the interviewson the type of alerting information it could be useful to represent sonically (see Section 7.6). Wethen show how the sonification model can be applied to derive a data-sound mappings space,sonification tuple and possible set of relations for the sonification of alerts.
Approaches to sonifying alerts were divided into two approaches in the responses of securitypractitioners in the interviews.
1. Sonified alerts only (played without sonified network traffic)
2. Sonified alerts combined with sonified network traffic
In this section, we focus on sonifying alerts only; in Chapter 8, we show how we used thesonification model to combine packet traffic and alert information into a single sonified displaythat was used in the study reported in that chapter and Chapter 9.
Based on the responses of security practitioners in the interviews, we chose to develop anapproach focused on representing IDS alert severity, class (e.g., malware alert), and the numberof alerts. We considered a single alert data channel : the presence of an alert event. This alertdata channel could be mapped to one of two alert sound channels: a single sound event, or achange to the soundscape (a change in the tonality of the music, for example).
The single alert data channel : alert event then had three alert data parameters: severity,class, and number. If using Snort IDS alerts, for example, an alert’s severity is in the range 1–4,where 1 is the highest, and 4 the lowest, alert severity. An alert’s class describes the type ofnetwork anomaly the triggered alert signature implies: “attempted administrator privilege” isan example.
In Figure 7.4, we present the data-sound mappings space introduced in Chapter 5, appliedto alert-only sonification, using these alert data channels and alert data parameters.
122

Sound Channels (Cs)Data Channels (Cd)
Individual tones, instrumen-tal lines, melodic lines, or-chestral sections, earcons
Alerts
Channel Relation(Relc)
Data Dimensions (Dd) Sound Dimensions (Ds)
Discrete (Ddiscs): instrument,musical motifs, rhythm, meter, melody,
sequential position, harmony, chordprogression, key, texture, number of
instruments, silence/presence of sound
Discrete (Ddiscd):type/class of alert
Discrete DimensionRelation (Relddisc)
Continuous (Dconts): pitch,pitch range, timbre, amplitude,
tempo, direction, decay time, tun-ing, spatialisation, articulation
Continuous(Dcontd): severity,rate
Continuous DimensionRelation (Reldcont)
Figure 7.4: Data-sound mappings space: alerts
We modeled the sonification of alerts, presented according to the sonification model (Chapter5).The sonification is described by the tuple 〈CDR,DDR,VDR, Relc, Reldα, Reldβ, Relv〉:
• CDR = 〈cdR1〉 = 〈alerts〉
• DDR = DDα_R DDβR = 〈ddαR1, ddαR2〉_〈ddβR1〉 = 〈Severity, Rate〉_〈Class〉
• VDdR=〈vddαR1, vddαR2, vddβR3〉 = 〈{low, medium, high},{low, normal, high}, (theclasses of alert present)〉
• Relc is described by the function ψi : R1 → Rm, csi = ψi(cd1)
• Reld and Relv are described by the function Γ : Rm+1 → Rq,Γi=〈γαi1, ...,γαix,γβi1, ...,γβiy〉∀i ∈ {1, ...,m}
Using this model, and based on the data-sound mappings space presented in Figure 7.4,and on the results of the magnitude estimation experiment (Appendix E, which indicated theeffectiveness of mappings from rate to tempo and from severity to pitch), we arrived at thefollowing possible set of relations for the alert-sonification design.
• Data channels:
– Alert → musical motif (cs1 = ψ1(cd1, t))
• Data dimensions (continuous):
– Severity → pitch (dsα11 = γα1(ddα11, t))
– Rate → tempo (dsα12 = γα1(ddα12, t))
• Data dimensions (discrete):
– Class of alert → instrument (dsβ11 = γβ1(ddβ11, t))
123

The above describes a sonification which maps alert events to musical motifs. For each alertevent, the alert severity is mapped to the pitch of the motif, the number of alerts (rate) ismapped to the number of motifs that play (tempo), and the class of the alert is mapped to theinstrument in which the motif plays.
7.9 Summary
Sonification has promise as an approach to aiding in the working practices of security practition-ers in SOCs, based on SOC workflow and challenges, and evidence of the benefits sonificationcan offer. Using an online survey and semi-structured interview responses from practitioners,we explored perspectives on the use of sonification systems in SOCs. The results presented inthis chapter show that security practitioners saw high potential for the use of sonification ina range of use cases; in particular, for peripheral monitoring — while multitasking with otherwork tasks, or whilst outside of the SOC. Participants also saw value in using sonification foranomaly detection, in an approach similar to the existing visualization techniques used in SOCs.
We identified challenges in integration, and requirements for design, that should be addressedwhen developing systems for this environment. In order to be appropriate for a range of differentSOC types, SOC soundscapes, and practitioners’ job roles, sonification tools should be flexiblein design. More specifically, sonification should be playable through a range of mediums, andsuitable for a range of different types and lengths of use. Sonification of alerts was a key areahighlighted for further design investigation, as well as approaches to mitigating listener fatigue.
In the next chapter and Chapter 9, we draw on the findings of this chapter to assess the utilityof a sonification system to SOC tasks. The system is developed in line with the requirements weidentified for sonification design, and uses some of the design approaches we explored in Section7.8. The use of the system by security practitioners in a set of network-security monitoringtasks is assessed. These tasks were designed to be representative of the refined contexts inwhich sonification has the potential to be useful in SOCs, that we identified in the currentchapter.
124

Chapter 8
Exploring the Use of a SonificationSystem by Security Practitioners:Study Design
We carried out a study with security practitioners working in SOCs, with the aim of exploring theextent to which using sonification could aid in SOC working practice. We explored the utility ofnetwork-monitoring setups including sonification, compared with those without sonification, forcarrying out tasks representative of a selected set of the potential contexts of use for sonificationin SOCs, as identified in Section 7.7.
We aimed to develop a study that was as realistic as possible, in order to obtain resultsrelevant to the tasks carried out in real-world SOCs. We therefore studied the findings fromour earlier interviews with security practitioners (see Chapter 7) on the physical setup of SOCmonitoring tools (e.g., number of screens used), the types of tools used to monitor networksecurity, and the contexts in which sonification might realistically have the potential to aid inSOCs.
In this chapter, we report the development of the tools used in the study, and presentthe study aims, hypotheses and methodology. The results of the study, and our analysis anddiscussion of them, are presented in Chapter 9. We begin this chapter by presenting the scopeof the study in Section 8.1: the contexts of use and monitoring tools we chose to focus on. Wethen describe our preparation of the scoped tools for the study in Section 8.2. In Section 8.3 wedetail the aims and hypotheses of the study, and we present the study methodology in Section8.4.
8.1 Study Scope
In the latter sections of Chapter 7, we presented a number of contexts of use for sonification inSOCs, and design requirements for sonification. Our aim in the study we present in the currentchapter was to explore the use of a sonification system incorporating a scoped set of thesedesign developments, in a scoped set of the contexts of use. This scoping was required in orderthat a study could be designed that would fit the practical constraints of visiting SOCs, andto ensure that the time required for each security practitioner to participate in the study wasreasonable (we judged that we could not reasonably ask for more than one hour of each securitypractitioner’s time).
We scoped our study in two parts. We selected the sonification tool developments, whichwere presented in Section 7.8, that would be included in the tools used in the study. We alsochose a set of contexts, taken from those presented in Section 7.7, in which we would explore theuse of tools in the study. The relationship between sonification developments and the contexts in
125

which they should be examined was derived based on the specification of tool requirements foreach context of use, presented in Section 7.7. The developments made relating to the sonificationof alerts, for example, could be examined in the context of monitoring in real time as a primaryor non-primary task, but were not relevant in the context of retrospective anomaly-huntingtasks (in which the focus is the detection of anomalies in the network traffic itself, rather thanin any information outputted by the alerting systems).
In Figure 8.1, we present the scope of our study, and show how it is positioned against allcontexts of use and sonification developments derived in Chapter 7. The relationships betweensonification developments and the contexts of use in which it is relevant to assess them areshown by the lines linking each. The contexts of use and sonification developments within scopefor this study are highlighted in red.
Contexts of Use/Capabilities
Monitoring asa primary task
Monitoring as anon-primary task
Monitoring whilstoutside of the SOC
Short-term anomaly-detection tasks (huntingfor anomalies retrospec-tively, and short-term
checking of traffic)
Setting up tool (usability)
SonificationDevelopments
Incorporatingalert sonification
Alerts combined withtraffic sonification
Alert sonification only
Tool features
Visual linking
Playback features
Configurability
Configurability ofdata-sound mappings
Configurability ofnetwork details
Configurability ofsonification aesthetics
Figure 8.1: Scoping the contexts of use and sonification developments to focus on in the study
126

We elected to study the use of sonification in the following two contexts of use, as shown inFigure 8.1:
• network-security monitoring in real time as a primary task; and
• network-security monitoring in real time as a non-primary task, whilst conducting otherwork-related tasks.
As shown in Figure 8.1, as well as the sonification of network packets explored in Chapter6, we aimed to assess the developments to the sonification of alerts presented in Chapter 7.We therefore developed a sonification system for assessment that represented network-packetinformation and information about IDS alerts simultaneously, and this system is presented inSection 8.2. We also aimed to assess the developed approach to enabling users to link visualinformation to the sounds heard, as presented in Section 7.8.2. The assessment of this waslimited by the use of videos in the study (see Section 8.4), however, which prevented users frominteracting with the visualization.
8.2 Development of Tools for the Study
We aimed to assess the use of sonification alongside tools that are used to carry out network-security monitoring tasks in real-world SOCs. This was important in order to ensure that thestudy made as realistic an assessment as possible of the utility of sonification as an addition tothe tools that are actually deployed in SOCs. From existing literature on SOC working practice(e.g., [164]), and information gathered in the interviews with security practitioners, we observedthat most security practitioners working in SOCs carried out their network-security monitoringwork using a SIEM tool (see Chapter 7, e.g., “everyone is monitoring output of the SIEM ”).
On this basis, we assumed that most security practitioners working in SOCs would beaccustomed to using a SIEM tool as the basis for a large proportion of their network-securitymonitoring work. We therefore focused on assessing the use of sonification alongside a SIEM toolin this study. We chose to explore the use of a SIEM tool without sonification for representingpacket traffic and IDS alerts (named SIEM in this chapter), compared with the use of a SIEMtool that incorporated the sonification of packets traffic and IDS alerts (named SonificationSIEM in this chapter).
Both the SIEM and the Sonification SIEM were designed by the researchers. We electedto produce our own tools for the purpose of this study, rather than using an existing commercialSIEM solution, for example, for the following reasons.
• Avoiding bias. Using any one existing commercial SIEM tool might have introduced biasby favouring participants already accustomed to using that particular SIEM. We aimed tocreate as close as possible a representation of SIEM tools in general, capturing propertieswe observed across a range of existing commercial SIEM tools. This was particularlyimportant for avoiding bias in the study, in which practitioners from different SOCs mighthave experience using different SIEM tools.
• Incorporating sonification. We judged that it would be more practical to incorporatesonified information, and the sonification tool features and sonification-related visualiza-tions (presented in Chapter 7) into a SIEM of our own creation, than to attempt toincorporate this into an existing commercial SIEM tool.
Whilst in real-world use, SIEM tools would incorporate information extra to packet trafficand IDS logs, such as threat-intelligence sharing information and correlations across monitoringtools, the representation of packet traffic and IDS alerts were the focus of this study. We thereforerestricted the SIEM and the sonification to represent these two types of information, in order
127

that the study was not complicated by extraneous information, and that the focus would be onrepresenting these two types of information.
We aimed to produce a SIEM and Sonification SIEM that were identical apart from theadditional elements relating to sonification. This meant that we could explore the effect of usingsonification alongside a SIEM tool without changing other aspects of it, so that any effectsobserved could reasonably be attributed to the use of the elements relating to sonification,rather than being due to some other difference between the two tools. We describe the designof the SIEM and the Sonification SIEM in Sections 8.2.1 and 8.2.2, respectively.
8.2.1 SIEM Tool
In the design of the SIEM, we aimed to replicate the visual representations of data (both astext, and graphically, as plots or visualizations) observed across existing commercial SIEM tools.In the following, we justify our selection of each element included in the SIEM dashboard, andpresent the visualization design principles we drew on in designing the tool. We then presentthe resulting SIEM tool that we used in the study.
We drew on a number of existing commercial SIEMS, examining the types of visualizationpresent in sample dashboards produced for those SIEMs (as we explained in Section 4.1), in orderto develop a SIEM as close to those that might be used in operational SOCs as possible. Table8.1 shows how we drew on these commercial SIEM dashboards: LogRhythm, NetIQ, McAfee,IBM, ArcSight, and Splunk, which we know to be market-leading SIEMs. Further informationon these SIEM tools and the data they represent is given in Section 2.2.2. We also consideredthe displays available in packet-capture tools such as Wireshark, which were cited as a widelyused monitoring tool in the interviews reported in Chapter 7.
Our selection of plots to display network-security information was also informed by theSysAdmin, Audit, Network and Security (SANS) guidelines on security data visualization [15].As shown in the list below, much of the information we aimed to represent was in time seriesform. Based on the SANS guidelines, we used a mixture of line plots and bar charts to representthis time series information, as an effective method of displaying trends and supporting theircomparison.
We selected the following elements for inclusion in the SIEM dashboard, which were presentin one or more of the sample commercial SIEM dashboards.
• Protocol counts plot: a time series of the traffic on the network, divided by protocol/application.
• Incoming protocols plot: a time series of the traffic incoming to the network (sent froman IP address external to the network to an internal network IP address), divided byprotocol/application.
• Outgoing protocols plot: a time series of the traffic outgoing from the network (sent froman internal network IP address to an IP address external to the network), divided byprotocol/application.
• Alert counts plot: a time series of the alerts generated, coloured according to alert severity.
• Packets table: information about the packets captured on the network, presented in a table.The information presented for each packet was the packet time, source and destination IPaddresses and ports, protocol or application, and packet size.
• Alerts table: information about the alerts generated, presented in a table. The informationpresented for each alert was the alert time, class, severity, associated source and destinationIP address, and protocol or application.
• Parallel coordinates plot (IP addresses): plot showing connections (coloured according toprotocol or application) between source and destination IP addresses.
128

• Parallel coordinates plot (ports): plot showing connections (coloured according to protocolor application) between source and destination ports.
In Table 8.1 we show the existing commercial SIEM displays that informed our selection ofeach dashboard element. Some of the plots were directly replicated from the commercial SIEMdisplays, while others were designed differently, with the aim of displaying the same type ofinformation (we designed the IP and port parallel coordinates plots, for example, to display thetype of connection information displayed in a single “Flow Source and Destination Graph” inthe McAfee SIEM).
Table 8.1: Selection of SIEM dashboard elements based on existing commercial SIEMs
LogRhy
thm
Net
IQ
McA
fee
IBM
Arc
Sigh
t
Wires
hark
Splu
nk
Protocol counts plot X XIncoming protocols plot XOutgoing protocols plot XAlert counts plot X X XPackets table XAlerts table X X X X XIP parallel coordinates XPort parallel coordinates X
We created the SIEM dashboard presented in Figure 8.2, on which we have labelled eachof the dashboard elements listed above.
Figure 8.2: SIEM dashboard created for the study
We aimed to adhere to visualization design principles in the design of the SIEM dashboard.Many design principles relate to the design of interactive visualizations; we drew on only those
129

that could be applied to non-interactive visualizations, since the videos we used in the studywere not interactive. An important principle was to create consistency across the visual repre-sentations, in order to enable users to more easily become familiarised with a standard way ofdisplaying information [151]. We aimed to be consistent across the plots and tables in our use ofcolours for representing certain information (different protocols and applications, and differentseverities of alerts, for example). We also aimed to be consistent in the placement and formatof legends, labelling of plots, and formatting of information such as timestamps.
8.2.2 Sonification SIEM Tool
We aimed to replicate the SIEM, incorporating sonified information and additional facilitiesfor the control and visualization of the sonified display.
Sonification approach
In designing the sonified display, we used the sonification model presented in Chapter 5 tocreate the data-sound mappings space. We also drew on the sonification design developmentsmade based on the design requirements derived in Chapter 7. These design developments werepresented and addressed in Section 7.8. In that section, we showed how the sonification of alertscould be achieved according to the sonification model presented in Chapter 5. We combinedthat approach to sonifying alerts with packet sonification, using the sonification model to deriveapproaches to sonifying packets and alerts in combination.
In the selection of the data-sound mappings to be used in the Sonification SIEM, we drewon the results of the magnitude estimation experiment presented in Appendix E. We selectedmappings perceived effectively (from rate-tempo and severity-pitch, for example), and used thescaling functions and polarities derived for them. We chose not to use mappings that had beenperceived less effectively by participants in the study reported in Appendix E (from commonnessto consonance, for example). We drew on these magnitude estimation results in the followingways.
• Use of the derived rate-tempo mapping, scaled with the derived power function (0.53) byusing N0.53/N , where N is the number of packets in the last second, as the rate at whichpackets were randomly sampled.
• Use of the derived size-articulation mapping, scaled with the derived power function (0.24)by mapping the packet size S to note articulation S0.24/S.
• Use of the severity-pitch mapping for alerts. Only two alert severity values were used inthis study, so the derived scale factor was not incorporated. Alerts with severity 1 and 2were mapped to two different musical motifs, where the pitch of the motif representingalerts with severity 1 was higher than that representing alerts with severity 2. We deliber-ately kept the sonified alert information involved in this study simple, to avoid presentingparticipants with too much information to feasibly be used in the study, particularly sincepacket-traffic information was already being sonified.
Based on the sonification model, developments to alert sonification as part of the model,and the above mappings, we created a sonification tuple and data-sound mappings space forthe sonification of packets and alerts combined.The sonification is described by the tuple 〈CDR,DDR,VDR, Relc, Reldα, Reldβ, Relv〉:
• CDR = 〈cdR1, cdR2〉 = 〈packets, alerts〉
• DDR = DDα_R DDβR = 〈ddαR1, ddαR2, ddαR3〉_〈ddβdR1, ddβdR2, ddβdR3, ddβdR4〉 =〈Rate, Size, Severity〉_〈Type of information, Commonness, Direction, Protocol〉
130

• VDdR=〈vddαR1, vddαR2, vddαR3, vddβR1, vddβR2, vddβR3, vddβR4〉 =〈{low,normal,high},{small,normal,large},{low, normal, high}{source IP, destination IP, source port, destination port}, {hotlisted, not hotlisted},{incoming,outgoing,internal},(the protocols present in the dataset)〉
• Relc is described by the function ψi : R1 → Rm, cs i = ψi(cd1, cd2)
• Reld and Relv are described by the function Γ : Rm+1 → Rq,Γi=〈γαi1, ...,γαix,γβi1, ...,γβiy〉∀i ∈ {1, ...,m}
The data-sound mappings space for the combined packet and alert sonification is presentedin Figure 8.3.
Sound Channels (Cs)Data Channels (Cd)
Individual tones, musical motifsPackets, alerts
Channel Relation(Relc)
Data Dimensions (Dd) Sound Dimensions (Ds)
Discrete (Ddiscs): instrument,musical motifs, rhythm, meter, melody,
sequential position, harmony, chordprogression, key, texture, number of
instruments, silence/presence of sound
Discrete (Ddiscd):rate, size, severity
Discrete DimensionRelation (Relddisc)
Continuous (Dconts): pitch,pitch range, timbre, amplitude,
tempo, direction, decay time, tun-ing, spatialisation, articulation
Continuous(Dcontd): typeof information,
commonness, di-rection, protocol
Continuous DimensionRelation (Reldcont)
Figure 8.3: Data-sound mappings space: combined sonification
From this sonification tuple and data-sound mappings space, and using the magnitude esti-mation results as described above, we selected the following relations.
• Data channels:
– Packet → individual tone (cs1 = ψ1(cd1, t))
– Alert → musical motif (cs2 = ψ1(cd2, t))
• Data dimensions (continuous):
– Rate (packet) → tempo (note) (dsα11 = γα1(ddα11, t))
– Size (packet) → articulation (note) (dsα12 = γα1(ddα12, t))
– Severity (alert) → pitch (motif) (dsα21 = γα21(ddα21, t))
• Data dimensions (discrete):
– Type of information (packet) → pitch range (note) (dsβ11 = γβ1(ddβ11, t))
131

– Commonness (packet) → harmony (note) (dsβ12 = γβ2(ddβ12, t))
– Direction (packet) → spatialisation (note) (dsβ13 = γβ2(ddβ13, t))
– Protocol (packet) → instrument (note) (dsβ14 = γβ2(ddβ14, t))
Incorporating sonification into the SIEM
As shown in Figure 8.1, the tool features (playback, for example) developed in Section 7.8 wereout of scope for this study and as such were not included in the Sonification SIEM. Whilewe aimed to replicate the SIEM dashboard as closely as possible in the Sonification SIEM,there were two adjustments we made to the dashboard relating to the addition of sonification.
1. Addition of instrument information with each protocol or application represented in theprotocol counts plot legend, to enable users to make a link between the instruments heardand the protocols represented (by colour) using the protocol-instrument mapping.
2. Addition of the visual linking plot developed in Section 7.8, since this could be observedin real time with the other SIEM dashboard plots by participants. This plot was includedalongside the others already present in the SIEM. We ensured that the placement ofall other dashboard plots was identical in the SIEM and Sonification SIEM, and thepresence of this extra plot was the only difference.
We created the Sonification SIEM dashboard presented in Figure 8.4, on which we haveindicated these two areas in which it differs visually from the SIEM (points 1 and 2 above arehighlighted in red as Differences 1 and 2, respectively). In the Sonification SIEM, as dataappeared in the SIEM dashboard, it was represented sonically in the sonified display.
Figure 8.4: Sonification SIEM dashboard created for the study
132

8.3 Aims and Hypotheses
Our aim was to explore the utility of the Sonification SIEM compared with the SIEM in thetwo scoped contexts of use: real-time primary-task monitoring (monitoring as the sole focus) andreal-time secondary-task monitoring (monitoring whilst simultaneously carrying out a separatework-related primary task). We aimed to assess the monitoring capability of participants in eachof these contexts, using the two tools. As in Chapter 6, we considered the monitoring capabilityof participants to be their ability to accurately and efficiently detect (recognise the presenceof), and accurately identify (understand the nature of):
• packet-traffic anomalies: anomalous deviations in the network-packet traffic (whichmay be related to network attacks); and
• alerts: alerts generated by Snort IDS.
The reasons why detection accuracy and efficiency, and identification accuracy, are importantin network-security monitoring were described when they were first introduced as hypothesesin Chapter 6 (see Hypotheses A, B and C in Section 6.1); the reasoning remains the same here.
To address these aims, we developed hypotheses about the following capabilities.
1. Real-time monitoring as a primary task (comparison of SIEM with Sonification SIEM).
(a) Detection and identification of anomalous traffic (Hypothesis A)
(b) Detection and identification of IDS alerts (Hypothesis B)
2. Real-time monitoring as a non-primary task (comparison of SIEM with SonificationSIEM).
(a) Detection and identification of anomalous traffic (Hypothesis C)
(b) Detection and identification of IDS alerts (Hypothesis D)
We also aimed to explore the effect of musical experience on the performance of participantsmonitoring using the Sonification SIEM (Hypothesis E). As well as assessing monitoringcapability in these ways, we aimed to explore the views of participants on the study, the suit-ability of sonification systems for carrying out tasks in the SOC environment, the potential forintegrating sonification into SOCs, and the usability of the tools presented.
We now present the hypotheses we tested in the study. By “network-attack traffic”, we referto packet traffic that relates to a network attack; by “alert”, we refer to the alerts produced bySnort IDS.
Hypothesis A: participants will perform better at monitoring for network-attacktraffic as a primary task when using the Sonification SIEM than when using theSIEM
1. Detection accuracy. We hypothesised that network-attack traffic would be detectedmore accurately when using the Sonification SIEM than when using the SIEM tomonitor as a primary task. We aimed to test the following: RAT (SIEM) < RAT (Son),where RAT (SIEM) is the recall rate calculated across all k participants in the detection ofthe attacks at in the set of all attacks AT , using the SIEM (recall calculated as describedin Section 4.2.3). RAT (Son) is the recall rate calculated across all k participants in thedetection of the attacks at in the set of all attacks AT , using the Sonification SIEM.
133

2. Detection efficiency. We hypothesised that network-attack traffic would be detectedmore efficiently (in a shorter time) when using the Sonification SIEM than when usingthe SIEM to monitor as a primary task. We aimed to test the following: ∆tAT (SIEM) <∆tAT (Son). ∆tAT (SIEM) is the mean average across all k participants using the SIEM,and across all attacks at in the set of all attacks AT , of the difference δtatk(SIEM) =tdatk(SIEM)−tbatk, between the time of the beginning of an attack at, tbatk, and the timeof its detection tdatk(SIEM). ∆tAT (Son) is the mean average across all k participantsusing the Sonification SIEM, and across all attacks at in the set of all attacks AT , ofthe difference δtatk(Son) = tdatk(Son)− tbatk, between the time of the beginning of attackat, tbatk, and the time of its detection tdatk(Son).
3. Identification accuracy. We hypothesised that network-attack traffic would be identifiedmore accurately when using the Sonification SIEM than when using the SIEM tomonitor as a primary task. We aimed to test the following: IAT (SIEM) < IAT (Son),where IAT (SIEM) is the attack-identification rate calculated across all k participantsusing the SIEM, across all attacks at in the set of all attacks AT . IAT (Son) is the attack-identification rate calculated across all k participants using the Sonification SIEM,across all attacks at in the set of all attacks AT .
Hypothesis B: participants will perform better at monitoring for alerts as a primarytask when using the Sonification SIEM than when using the SIEM
1. Detection accuracy. We hypothesised that IDS alerts would be detected more accuratelywhen using the Sonification SIEM than when using the SIEM to monitor as a primarytask. We aimed to test the following: FAL(SIEM) < FAL(Son), where FAL(SIEM) isthe F-score calculated across all k participants in the detection of the alerts al in theset of all attacks AL, using the SIEM (F-score calculated as described in Section 4.2.3).FAL(Son) is the F-score calculated across all k participants in the detection of the alertsal in the set of all attacks AL, using the Sonification SIEM.
2. Detection efficiency. We hypothesised that IDS alerts would be detected more efficiently(in a shorter time) when using the Sonification SIEM than when using the SIEM tomonitor as a primary task. We aimed to test the following: ∆tAL(SIEM) < ∆tAL(Son).∆tAL(SIEM) is the mean average across all k participants using the SIEM, and acrossall alerts al in the set of all alerts AL, of the difference δtalk(SIEM) = tdalk(SIEM) −tbalk, between the time of the beginning of alert al, tbalk, and the time of its detectiontdalk(SIEM). ∆tAL(Son) is the mean average across all k participants using the Soni-fication SIEM, and across all alerts al in the set of all alerts AL, of the differenceδtalk(Son) = tdalk(Son) − tbalk, between the time of the beginning of alert al, tbalk, andthe time of its detection tdalk(Son).
3. Identification accuracy. We hypothesised that IDS alerts would be identified moreaccurately when using the Sonification SIEM than when using the SIEM to moni-tor as a primary task. We aimed to test the following: IAL(SIEM) < IAL(Son), whereIAL(SIEM) is the alert-identification rate calculated across all k participants using theSIEM, across all alerts al in the set of all alerts AL. IAL(Son) is the alert-identificationrate calculated across all k participants using the Sonification SIEM, across all alertsal in the set of all alerts AL.
134

Hypothesis C: participants will perform better at monitoring for network-attacktraffic as a non-primary task when using the Sonification SIEM than when usingthe SIEM
1. Detection accuracy. We hypothesised that network-attack traffic would be detectedmore accurately when using the Sonification SIEM than when using the SIEM tomonitor as a non-primary task. We aimed to test the following: RAT (SIEM) < RAT (Son),where RAT (SIEM) is the recall rate calculated across all k participants in the detection ofthe attacks at in the set of all attacks AT , using the SIEM (recall calculated as describedin Section 4.2.3). RAT (Son) is the recall rate calculated across all k participants in thedetection of the attacks at in the set of all attacks AT , using the Sonification SIEM.
2. Detection efficiency. We hypothesised that network-attack traffic would be detectedmore efficiently (in a shorter time) when using the Sonification SIEM than whenusing the SIEM to monitor as a non-primary task. We aimed to test the following:∆tAT (SIEM) < ∆tAT (Son). ∆tAT (SIEM) is the mean average across all k participantsusing the SIEM, and across all attacks at in the set of all attacks AT , of the differenceδtatk(SIEM) = tdatk(SIEM)− tbatk, between the time of the beginning of an attack at,tbatk, and the time of its detection tdatk(SIEM). ∆tAT (Son) is the mean average acrossall k participants using the Sonification SIEM, and across all attacks at in the set ofall attacks AT , of the difference δtatk(Son) = tdatk(Son)− tbatk, between the time of thebeginning of attack at, tbatk, and the time of its detection tdatk(Son).
3. Identification accuracy. We hypothesised that network-attack traffic would be identifiedmore accurately when using the Sonification SIEM than when using the SIEM tomonitor as a non-primary task. We aimed to test the following: IAT (SIEM) < IAT (Son),where IAT (SIEM) is the attack-identification rate calculated across all k participantsusing the SIEM, across all attacks at in the set of all attacks AT . IAT (Son) is the attack-identification rate calculated across all k participants using the Sonification SIEM,across all attacks at in the set of all attacks AT .
Hypothesis D: participants will perform better at monitoring for alerts as a non-primary task when using the Sonification SIEM than when using the SIEM
1. Detection accuracy. We hypothesised that IDS alerts would be detected more accu-rately when using the Sonification SIEM than when using the SIEM to monitor asa non-primary task. We aimed to test the following: FAL(SIEM) < FAL(Son), whereFAL(SIEM) is the F-score calculated across all k participants in the detection of thealerts al in the set of all attacks AL, using the SIEM (F-score calculated as described inSection 4.2.3). FAL(Son) is the F-score calculated across all k participants in the detectionof the alerts al in the set of all attacks AL, using the Sonification SIEM.
2. Detection efficiency. We hypothesised that IDS alerts would be detected more effi-ciently (in a shorter time) when using the Sonification SIEM than when using theSIEM to monitor as a non-primary task. We aimed to test the following: ∆tAL(SIEM) <∆tAL(Son). ∆tAL(SIEM) is the mean average across all k participants using the SIEM,and across all alerts al in the set of all alerts AL, of the difference δtalk(SIEM) =tdalk(SIEM) − tbalk, between the time of the beginning of alert al, tbalk, and the timeof its detection tdalk(SIEM). ∆tAL(Son) is the mean average across all k participantsusing the Sonification SIEM, and across all alerts al in the set of all alerts AL, of thedifference δtalk(Son) = tdalk(Son) − tbalk, between the time of the beginning of alert al,tbalk, and the time of its detection tdalk(Son).
135

3. Identification accuracy. We hypothesised that IDS alerts would be identified moreaccurately when using the Sonification SIEM than when using the SIEM to monitoras a non-primary task. We aimed to test the following: IAL(SIEM) < IAL(Son), whereIAL(SIEM) is the alert-identification rate calculated across all k participants using theSIEM, across all alerts al in the set of all alerts AL. IAL(Son) is the alert-identificationrate calculated across all k participants using the Sonification SIEM, across all alertsal in the set of all alerts AL.
Hypothesis E: a participant’s level of musical experience will not effect their mon-itoring performance in the study
1. Monitoring for network-attack traffic.
a Detection. We hypothesised that there would be no significant difference in theability of participants with and without musical experience to detect network-attacktraffic. We aimed to test the following: aAT (mus) = aAT (nonmus) and eAT (mus) =eAT (nonmus), where aAT (mus) and aAT (nonmus) are the attack-traffic detectionaccuracy, and eAT (mus) and eAT (nonmus) the attack-traffic detection efficiency ofparticipants with and without musical experience respectively (detection accuracyand efficiency defined as in the hypotheses above).
b Identification. We hypothesised that there would be no significant difference inthe ability of participants with and without musical experience to identify network-attack traffic. We aimed to test the following: iAT (mus) = iAT (nonmus), whereiAT (mus) and iAT (nonmus) is the attack-traffic identification accuracy of partic-ipants with and without musical experience respectively (identification accuracydefined as in the hypotheses above).
2. Monitoring for alerts.
a Detection. We hypothesised that there would be no significant difference in the abil-ity of participants with and without musical experience to detect alerts. We aimedto test the following: aAL(mus) = aAL(nonmus) and eAL(mus) = eAL(nonmus),where aAL(mus) and aAL(nonmus) are the alert-detection accuracy, and eAL(mus)and eAL(nonmus) the alert-detection efficiency of participants with and withoutmusical experience respectively.
b Identification. We hypothesised that there would be no significant difference inthe ability of participants with and without musical experience to identify alerts.We aimed to test the following: iAL(mus) = iAL(nonmus), where iAL(nonmus) isthe alert-identification accuracy of participants with and without musical experiencerespectively.
8.4 Methodology
We present the methodology we devised to address the aims presented in Section 8.3. We beginby describing the preparation of the network-attack datasets, Snort IDS, and training and taskmaterials for the study (Section 8.4.1). We then present the various stages of the study (Section8.4.2), and our data collection and analysis methods (Section 8.4.3).
136

8.4.1 Study Preparation
We created network-attack datasets and set up Snort IDS for use in the study. We recordedvideos of the tools running on these network-attack datasets, and also created videos describingthe two tools, for use in training the participants.
Network-attack datasets
We created network-attack datasets for the study by extracting sections of the CIC-IDS 2017Intrusion Detection Evaluation Dataset, which is publicly available online [47]. The datasetcontains benign traffic and up-to-date common attacks, synthetically generated and captured ona network testbed over a one-week period [149]. We selected this dataset for the study because ofits realisticness and ease-of-use. The dataset was generated with the aim of providing intrusion-detection evaluation data that was as realistic as possible: to achieve realistic background traffic,a system was used to profile the behaviour of humans interacting with machines. Furthermore,the details and times of attacks are labelled for ease-of-use in intrusion-detection research, andfurther details such as the victim and attacker network configurations used are made clear.
The network-attack datasets we extracted from the full CIC-IDS 2017 dataset are listedbelow.
• Baseline Dataset. This dataset was taken from the “baseline day” for the CIC-IDS 2017dataset (Monday 9am-5pm). This was a day during which no attacks were syntheticallylaunched on the network, and as such no known attacks were recorded in the dataset.
• Dataset 1. This was one of two datasets used for the two main study tasks, with the orderof their use pseudorandomised. Dataset 1 was taken from a time in the CIC-IDS 2017dataset that did not contain any synthetically generated attacks.
• Dataset 2. This was the second of the two datasets used in the two main study tasks.Dataset 2 was taken from the time at which an FTP brute-force attack began in theCIC-IDS 2017 dataset.
We included Dataset 1, a dataset containing no known attacks, to assess the ability ofparticipants to recognise a network state with no attacks. Our aim was to replicate real-worldoccurrences of network attacks as closely as possible: in SOCs the times at which attacks occurare unpredictable, and there are likely to be times when no attacks are occurring. Furthermore,by including this dataset, we aimed to avoid bias in the study, and prevent participants frombeing able to “game” the experiment by guessing that each dataset might include a differentattack, for example.
We used the Baseline Dataset in the training stage, in order to present participants with“baseline data” running in the SIEM and the Sonification SIEM. For the study tasks, theorder in which Dataset 1 and Dataset 2 were used (with one used in Study Task 1, and theother in Study Task 2 ) was chosen pseudorandomly for each participant.
Setting up Snort IDS, and alerting on the dataset
We ran Snort IDS version 3 (which we presented details on in Section 2.2.1) on the network-attack datasets, to generate IDS alerts. In Snort 3, signatures can be written to produce alertsbased on network-traffic features. The alerts produced by Snort are usually given a class (describ-ing the type of alert: “Attempted Privelege Escalation”, for example), a severity, and includedetails such as the source and destination IP addresses and ports, and protocols or applicationsused by the traffic that caused the alert to be generated.
137

The Snort community has produced standard rulesets, which include signatures developedfor alerting on malicious network traffic.1 We opted to use the Snort 3 Community Rules, inorder that our installation of Snort was consistent with installations that might be used byother Snort users. Whilst many leading SOCs will also craft their own IDS signatures basedon knowledge of the networks they monitor and the threats to them, this is done on a basisindividual to SOCs, and replicating this practice for the purpose of this study would have beenchallenging.
Baselining and running the tools
As described in Section 8.2.2, to train our sonification approach on a network, we required abaseline “hotlist” of the most commonly observed source and destination IP addresses and portsduring normal network operation. We therefore calculated hotlists of the source and destinationIP addresses and ports present in the Baseline Dataset, since this was taken from a period oftime during which no attacks were synthetically launched on the network, and as such no knownattacks were recorded in the dataset. IP address and port commonness was calculated accordingto these hotlists in the real-time sonification of the network-attack datasets for the study.
As shown in Figure 8.5, we used tcpreplay (a utility for replaying traffic stored in PCAPfiles onto a network) to play the network-attack datasets onto a loopback network.2 On thisloopback network, we ran a packet logger to recapture a sample of the packets (at most 30per second) and log them in a PCAP file. Packets with properties that were not commonlyobserved on the network (those using uncommon IP addresses and ports, or using protocols orapplications that, unlike UDP, TCP and HTTP, for example, were not commonly used) weresampled with a higher probability to increase their chances of being represented by the tools.At the same time, we ran an alert logger (using Snort IDS) on the loopback network, to captureand log the alerts generated in response to the replayed packets. The logged packets and alertswere then sent directly to the SIEM for representation visually and as text. The SonificationSIEM also controlled the sonification of network data and alerts.
Creating training and task videos
Prior to running the study, we recorded videos of both the SIEM and the Sonification SIEMrunning while each network-attack dataset (Baseline Dataset, Dataset 1, and Dataset 2 ) wasreplayed on the network. We used Kazam screen recorder to capture the screen and correspond-ing audio.3 We elected to use pre-recorded videos in the study, rather than running the toolslive, for the following reasons.
1. Consistency of presentation. Packets were sampled randomly with a certain probabil-ity by the packet logger on each run. If the setup had been run live in the study, therefore,the packets sampled might have differed between participants, resulting in differences inthe information displayed in the SIEM and Sonification SIEM. By presenting eachparticipant in the study with the same pre-recorded video of a live run of each tool, weensured that the information displayed was consistent across all participants.
2. Reducing risks in running the study. We judged that using videos recorded in advancewould bring less risk than attempting to run the entire setup live for each participant,reducing the chance of faults occurring during the study.
As well as these task videos, we created two training videos: a SIEM training video anda Sonification SIEM training video. These two videos were used in the training stage of the
1Snort 3 installation and rulesets are available at https://www.snort.org/.2http://tcpreplay.synfin.net/tcpreplay-edit.html3https://github.com/sconts/kazam
138

Network-attackdataset
Loopbacknetwork
Packet logger
Alert logger
Packet log
Alert log
SIEM/ Sonifi-cation SIEM
tcpreplay
Packets(sampled)
Snort IDSalerts
Figure 8.5: Replaying and recapturing traffic, and representing traffic and alerts in the SIEMand Sonification SIEM
study, to introduce each tool and describe its functionality to participants. We chose to usevideos in order to ensure consistency of the training information presented to each participant,by presenting each participant with the same two videos. The videos showed a static screencapture of each tool, and the plots and tables present in each tool were described verbally inthe video by the researcher, with the relevant parts of the visuals indicated by computer mousemovements captured in the video. In the Sonification SIEM training video, the sonificationapproach was described, in addition to the visuals.
8.4.2 Study Process
We recruited a convenience sample of 22 participants for the study. Participants were securitypractitioners with experience of working in SOCs, both internal and multitenanted. The studytook place in-person with each participant at their organisation, in a room separate to the SOC.Participants were recruited as described in Section 4.2.1. We received ethical approval for thisstudy, and followed ethical procedures in carrying it out, as is also described in that section.
In the materials we used in the recruitment process (the paragraph presented below), wedeliberately avoided mentioning sonification, or the fact that we were aiming to compare ap-proaches newly developed by the researchers.
We are carrying out a study to compare network-security monitoring tools and theireffectiveness in use. This study is part of a doctoral research project investigatingthe design and utility of security-monitoring approaches, with a focus on use in thesecurity tasks carried out in SOCs. The study itself involves the use of some moni-toring tools to conduct a common-place threat detection task, and we need securitypractitioners who work in SOCs to participate and complete these tasks in order
139

that our assessment of the tools takes into consideration the knowledge and expertisepossessed by professionals.
The aim of taking this approach to recruitment was to avoid biasing participants prior tothe study. If we had mentioned sonification in this recruitment material, participants mighthave researched sonification in advance, for example. Furthermore, the knowledge that we wereassessing the use of tools that we had designed ourselves might have caused acquiescence bias,in which the participant aims to provide the results they believe the researchers are hoping for.
Figure 8.6 provides an overview of the study. We now describe each stage of the study infurther detail.
Participant information sheet, introduction to study, and consent forms
Preliminary collection of participant demographics
Training:1. SIEM training video
2. Sonification SIEM training video
Study Task 1:
1. Baseline video
2. Primary-task monitoring
3. Usability questionnaires
Study Task 2:
1. Baseline video
2. Introduce primary task
3. Secondary-task monitoring
4. Usability questionnaires
Post-study interview
Figure 8.6: Study process: overview
Introduction and preliminary data collection
We began by introducing the premise of the study to each participant. Participants then readthe participant information sheet, which described the aims of the study, the processes thatwould be carried out in the study, the measures the researchers would take to ensure that data
140

collected were treated ethically, and the procedures that a participant should follow if theyhad any concerns during the study, or after completing the study. Participants indicated theirconsent to participate in the study and to be audio recorded by signing the participant consentform. We took audio recordings of the study beginning after the signing of the consent form, inorder to capture the dialogue.
Participants then completed a set of preliminary questions on paper, which captured demo-graphics including the job role and network-security monitoring experience of the participant,the types of network-security monitoring tools (including SIEM tools) they were accustomedto using, and their level of musical experience (more detail on all demographics collected isprovided in Section 4.2.2).
Participants sat at a desk, next to the researcher. A MacBook Pro laptop and a monitorwere set up on the desk, and headphones were used by the participant to listen during thetraining videos and the tasks involving sonification. We chose to use headphones because ofthe restrictions of visiting organisations: we could not play sound out loud in the rooms in theorganisations in which we ran the study, since we needed to be as unobtrusive as possible to thework of the rest of the organisation. We used headphone splitters so that the participant couldlisten to the sonification through headphones, while the researcher monitored the sound to keeptrack of proceedings and make sure that all was running smoothly with the sound, throughanother pair of headphones.
Training
Participants watched the training videos, first for the SIEM and then for the SonificationSIEM. It was required that participants watched the videos in this order, since the SonificationSIEM was designed as an extension of the SIEM, and it was therefore necessary to explainhow the SIEM functioned first.
The researcher sat with the participant while they watched the training videos, and beforestarting to watch the videos, participants were informed that they could pause the video atany time to ask the researcher questions. We elected not to use training datasets, in which theparticipant could practice completing the study tasks, in the interest of keeping the study to areasonable length of time. Furthermore, we did not wish to train participants in the detectionof any particular types of attacks, which would have had to have been present in the trainingdatasets. This enabled us to obtain results on the capabilities of participants using the tools forthe first time, and to gather their views on the viability of learning to use these tools.
Study task overview
Participants were divided into four groups, using one of the two tools to monitor one of the twodatasets in each study task.
A Participants in Group A completed Study Task 1 using the SIEM running on Dataset 1,and Study Task 2 using the Sonification SIEM running on Dataset 2.
B Participants in Group B completed Study Task 1 using the SIEM running on Dataset 2,and Study Task 2 using the Sonification SIEM running on Dataset 1.
C Participants in Group C completed Study Task 1 using the Sonification SIEM runningon Dataset 1, and Study Task 2 using the SIEM running on Dataset 2.
D Participants in Group D completed Study Task 1 using the Sonification SIEM runningon Dataset 2, and Study Task 2 using the SIEM running on Dataset 1.
Each participant was assigned to one of these four groups pseudorandomly: we pseudoran-domised the order of an array containing five of each group, in order to ensure that at least five
141

participants were assigned to each group, enabling us to compare performance across groups inour analysis. We aimed to avoid bias through this process. For example, if participants alwaysmonitored with the SIEM prior to monitoring with the Sonification SIEM, it might be ex-pected that their performance would improve over time as a result of becoming accustomed tothe task, which might bias the results to suggest that participants had performed better usingthe Sonification SIEM.
At the beginning of each study task, participants were shown the Baseline Dataset runthrough either the SIEM or Sonification SIEM — whichever had been selected for theparticipant in that task. As in the rest of the study, we used pre-recorded videos to presentthe tools running on the Baseline Dataset at this stage. The aim was to enable participants toexperience each tool running in real time, and to observe the types of traffic that were presentin a network baseline.
During the SIEM baseline video, the researcher described verbally aspects of the presen-tation described in the training videos: the balance of protocols in the plots, and the presenceof new packets and alerts in the tables, for example. The Sonification SIEM baseline videowas paused at a particular point, to allow the researcher to highlight these aspects (since theheadphones would have obstructed this communication while the video was playing).
Participants then completed the study task, listening using headphones when the Sonifica-tion SIEM was used. Videos were played from a MacBook Pro laptop, presented on a largermonitor such that all aspects presented were easily visible.
At the end of each of the two study tasks, participants completed the SUS usability ques-tionnaire [43], and (after completing the study task in which they had used the SonificationSIEM) the BUZZ questionnaire on user experience with auditory interfaces [169]. Further in-formation on both SUS and BUZZ is presented in Section 2.4.1, and the questionnaires arepresented in Appendix C to this thesis.
Study Task 1: monitoring as a primary task
Participants were presented verbally with the following instructions:
You are required to monitor network security as a primary task using the (SIEM/Sonification SIEM). Please monitor using this tool, and respond verbally if youobserve either anomalous packet traffic, a severity 1 alert, or a severity 2 alert, asfollows:
• If you observe anomalous packet traffic, say: “anomalous traffic”, and give averbal description of the anomalous traffic you have observed.
• If you observe a severity 1 alert, say: “alert severity 1”.
• If you observe a severity 2 alert, say: “alert severity 2”.
To aid with remembering the required responses participants were provided with a sheet ofpaper on which the verbal responses were written: “anomalous traffic”, “alert severity 1 ”, and“alert severity 2 ”.
Participants then completed the task, monitoring the video played from the MacBook Proand shown in the larger monitor. Participants’ verbal responses were collected in the audiorecording. At the beginning of each task, the researcher spoke the word “go” into the audiorecording. This enabled us to later calculate the time at which participants made each verbalresponse in relation to the dataset being represented (and thus to calculate, for example, thetime delay between the presence of a severity 1 alert and the response of the participant havingidentified it).
142

At the end of the task, participants were asked to describe what they had observed inthe dataset, and to describe any observations that would cause concern, or require furtherinvestigation.
Study Task 2: monitoring as a non-primary task
Participants were presented verbally with the following instructions:
You are required to monitor network security as a non-primary task using the (SIEM/Sonification SIEM). As before, please monitor using this tool, and respond ver-bally if you observe either anomalous packet traffic, a severity 1 alert, or a severity2 alert, as follows:
• If you observe anomalous packet traffic, say: “anomalous traffic”, and give averbal description of the anomalous traffic you have observed.
• If you observe a severity 1 alert, say: “alert severity 1”.
• If you observe a severity 2 alert, say: “alert severity 2”.
Simultaneously, you are required to carry out a separate primary task. This taskinvolves the creation of folders and files in the OSX terminal.
For the separate primary task, participants were presented with an instruction sheet, con-taining instructions such as “create a new folder named ‘new folder 1’” and the correspondingtext to be typed in the terminal (e.g. “mkdir "new folder 1"”). This instruction sheet waspresented on the MacBook screen, with the OSX terminal open alongside it ready for the par-ticipant to carry out the primary task. We assumed that participants would be familiar withthe types of terminal operations required in the primary task, and this proved to be the case inthe study — we checked with participants whether they were comfortable with this type of taskbefore beginning Study Task 2. The instruction sheet included the exact commands needed,in case these were not known. Before beginning the study task, participants were given theopportunity to practice the primary task, which some participants took.
This separate primary task was selected to be representative of the type of task that apractitioner might realistically be required to carry out whilst monitoring the network. Forthe purposes of this study, this separate primary task was appropriate insofar as we judged itrealistic, and it did not create any ethical concerns (as writing an email or an incident reportmight give away more information on the participant’s personal details or working practice, forexample).
The non-primary monitoring task was then presented as a video played from the MacBookPro (in the terminal of which participants completed the separate primary task), and presentedin the same larger monitor as in the previous task. The exact multitasking requirements werenot specified to participants. The amount of attention to devote to the primary and the sec-ondary task was left to be decided by the participant: the researcher simply instructed as above.The aim here was to capture as realistic as possible a view of the way in which practitionersmight multitask in such a scenario, and the amount of attention they might devote to eachtask (although this realisticness was undoubtedly limited by the constraints of the study: theunfamiliarity of the tools and setup to participants, compared to in their day-to-day work, forexample).
As before, at the end of the task participants were asked to describe what they had observedin the dataset, and to describe any observations that would cause concern, or require furtherinvestigation.
143

Usability questionnaires
Participants were presented with usability questionnaires at the end of each of the two studytasks. For both the SIEM and the Sonification SIEM, participants completed the SUS us-ability questionnaire [43]. As advised in the SUS usage guidelines, the SUS scale was used afterparticipants had had the opportunity to use the system, and before any discussion or debrief-ing took place [43]. Participants were asked to record their immediate response to each item,marking the centre point of the scale if they felt unable to respond to an item. Following theuse of the Sonification SIEM, participants also completed the BUZZ questionnaire designedspecifically to evaluate user experience with auditory interfaces [169].
Post-study interviews
After the study tasks had finished, participants completed a spoken post-study interview ontopics including their experience in the study, the realisticness of the study design, and theirthoughts on using sonification in their SOC work. The interview was semi-structured: the re-searchers had a prepared set of questions as a guide, and selected questions to ask based onthe direction in which the conversation had been taken during the study itself (if a participanthad given their view on how realistic the study setup was earlier in the study, for example, wedid not repeat a question on this topic in the post-study interview). The full list of interviewquestions we were guided by is presented in Appendix B.3.
We chose to conduct semi-structured interviews, in order that we could understand theviews of participants without creating any bias on some topics, by using neutral phrasing inquestions such as: “Please describe your experience in the study”, and allowing discussion toensue, developing the subjects the participant had chosen to speak about in their response.There were also more closed questions that we wished to gather answers to, and such questionswere asked directly (“Did you experience fatigue in the study”, for example, was a specificquestion we intended to ask participants, based on our findings earlier in this thesis on theimportance of understanding the extent to which sonification systems cause fatigue).
We also recorded and analysed the spoken dialogue between the participant and researcherthroughout the study. In this way, in addition to the views expressed in the post-study interview,we were able to evaluate the views that participants expressed throughout the study. Thisincluded comments on the tools presented, the study tasks, the utility of sonification and otherfactors relating to its effectiveness (such as sonification design), and the realisticness of themonitoring setup used.
8.4.3 Analysis
We aimed to evaluate the effect of incorporating sonification into a SIEM tool on primary- andnon-primary task network-security monitoring performance. This was achieved by comparingthe monitoring performance of participants using the SIEM and that of those using the Soni-fication SIEM during both Study Task 1 and Study Task 2. We illustrate these comparisons inFigure 8.7. In the figure, solid lines represent quantitative comparisons; dotted lines representqualitative comparisons (based on the interview data).
As shown in Figure 8.7, while we used quantitative analysis to compare the performance ofparticipants using the two tools in Study Task 1, and in Study Task 2, separately, we did notuse quantitative analysis to compare performance across the two tasks. Instead, we explored theviews of participants relating to comparing their experience in Study Task 1 and Study Task 2qualitatively, using the interview data gathered in the post-study interview and throughout thestudy. This meant comparing the views of an individual participant on using the SonificationSIEM for primary-task monitoring, and the SIEM for non-primary task monitoring, for ex-ample. We chose not to compare quantitatively the performance of participants across the two
144

SIEM
Study Task 1
Sonification SIEM
Study Task 2
Sonification SIEM SIEM
Figure 8.7: Comparisons made in the analysis.
tasks because, since Study Task 1 was always carried out before Study Task 2, we could notaccount for the possible effect of each participant first carrying out Study Task 1 (using one ofthe two tools) on their performance in Study Task 2 (using the other of the two tools).
The two quantitative comparisons shown in Figure 8.7 (comparison of SIEM and Sonifi-cation SIEM in Study Task 1 ; comparison of SIEM and Sonification SIEM in Study Task2 ) comprised comparisons of a number of participant performance assessments. In Table 8.2,we describe the aspects of monitoring performance involved in each comparison.
Table 8.2: Quantitative comparisons made in the study analysis
Network Event Type Performance Assessment
FTP Brute-Force AttackDetection accuracy (Recall)Detection efficiencyIdentification accuracy
AlertsDetection accuracy (Precision, Recall, F-score)Detection efficiencyIdentification accuracy
Traffic DeviationsDetection accuracy (Precision)Detection efficiencyIdentification accuracy
We transcribed the interview data collected throughout the study and in the post-studyinterview, and coded and analysed it using the template analysis approach described in Section4.2.4. The interview results are presented within the themes of this template in Section 9.2, andthe coding table produced is presented in Appendix D.
Measuring participants’ performance
Participants were asked to respond verbally if they observed an anomalous deviation in thetraffic (and give a description of its nature), and if they observed an alert (and describe itsseverity). The researcher marked the time of the beginning of each video-recorded dataset byspeaking the word “go”. We were thus able to ascertain from the audio recordings taken of thestudy, the time during the dataset at which each participant had made each response. Dependingon the event type (attack, event, or anomalous deviation), we varied our interpretation of whatconstituted a detection, as follows:
• For the FTP brute-force attack (in Dataset 2 ), in the calculation of detection accuracyand efficiency, and identification accuracy, we made the assumption that a participant’s
145

first response following the FTP brute-force attack was a detection of traffic or an alertrelating to that attack. The first traffic relating to the attack was at 115 seconds, and thefirst alert at 119 seconds, in the dataset. We counted any response after 115 seconds as adetection of the attack, as all anomalous traffic deviations after that point were ongoingFTP traffic relating to the attack.
• For alerts, we assumed that a participant’s response was a detection of the last alertpresent in the dataset. We observed that some participants took longer to detect alerts,particularly when multitasking, and the participants themselves noted, whilst monitoring,their delay in spotting the alerts (“I’ve also only just noticed that we have sev 2s and sev1s” (P5), for example). We wished to capture these late detections in our analysis, sochose not to impose a time limit on responses that would constitute detections of an alert.
• For anomalous traffic deviations, we made the assumption that a participant’s responsewas a detection of the last traffic deviation present in our ground truth, if that traffic devi-ation fell within the ten seconds prior to the response. Whilst, as described, we chose notto use such a time limit for alert detection, we judged that detection of anomalous trafficwas more ambiguous and required some time constraint. Assuming that an anomalous-traffic detection made 20 seconds after the presence of anomalous traffic in the datasetwas a detection of that anomalous traffic would not have been appropriate, for example.The large volumes and variability of the events in the traffic made it more difficult to becertain of what change in traffic had actually prompted a response than it was to decidewhich alert had prompted a response (since there were only two variants of alert). Thereare limitations to this approach, which we discuss in Section 9.3.2: knowing what traffichas truly been detected by participants is a difficult problem that we also encountered inChapter 6, and we chose to follow this timing-based approach for this thesis.
Using these assumptions, we measured detection accuracy and efficiency, and identificationaccuracy, as described in Table 8.3. We explore the potential limitations of these approaches tomeasurement in Section 9.3.2.
Comparing detection accuracy and efficiency, and identification accuracy
As shown in Table 8.2, we analysed the accuracy of detection using combinations of precision,recall and F-score for different types of event. The reasons why each type of assessment waschosen for each event type are explained in the next subsection. Where we calculated precision,recall and F-score, we used the formulae presented in Section 4.2.3.
We compared the efficiency with which events were detected by the two populations (partic-ipants using the SIEM and the Sonification SIEM) using t-tests (preceded by an F-test, todecide the type of t-test required based on equality of variance [74]). We compared identificationaccuracy by calculating the number of correctly identified, incorrectly identified, and unidenti-fied detections of each of the three types of event by each of the two populations. Idenficationrate was calculated as the number of correctly identified true-positive detections, divided by thetotal number of true-positive detections.
We removed outliers in the time taken to detect alerts and the FTP brute-force attack, toprevent skewing of the mean and standard deviation values we presented. We tested for theseoutliers using the z-score: results for which the z-score had an absolute value greater than 3.29were considered to be outliers [74].
Note on approach to network-traffic analysis: attacks and anomalous deviations
Our aim in this section is to provide a justification for our treatment of network-traffic anomaliesin the analysis. Our hypotheses focused on the accuracy with which participants would detect
146

Table 8.3: Measuring performance in the study: detection accuracy and efficiency, and identifi-cation accuracy
Measurementtaken
Assessment criteria
Detection accuracy
• If the response constitutes a detection of any of the three types ofevent (detection interpreted for each event type using theassumptions above) → true-positive detection
• If the response does not constitute a detection → false-positivedetection
• If the response is not made within the detection constraints (i.e.the event is missed) → false-negative detection
Detection efficiency If true-positive detection:
• Time difference between the onset of an event and the firstresponse constituting a detection of it by the participant →detection efficiency
Identificationaccuracy
If true-positive detection:
• If the attack is correctly described → correct identification
• If the attack is incorrectly described → incorrect identification
network attacks. Our observations during the study on the nature of network-traffic monitoringand on the methods by which this is practiced in SOCs supported an alteration to the analysisof precision, recall and F-score of attack detection we had originally planned, to an analysisof the recall of attack detection, qualified by an exploration of the network-traffic awareness ofparticipants throughout the datasets.
As shown in Table 8.2, we used precision, recall and F-score to assess the accuracy ofalert detection. Making these calculations requires measurements of the number of true- andfalse-positive detections and of the number of false-negative (missed) detections. It was straight-forward to identify the times at which alerts did and did not occur in each dataset, and we weretherefore able to make these measurements with certainty.
Participants were asked to monitor for “anomalous traffic”, having observed the BaselineDataset represented in the SIEM and Sonification SIEM. If, as for the detection of alerts, wehad assessed the accuracy of attack detection using precision, recall and F-scores, the responsesof participants would have been compared against the ground truth that Dataset 1 containedno attack, while Dataset 2 contained an attack after 115 seconds. During the study, however,we observed that participants were making many anomalous traffic detections extra to thoserelated to the attack.
Furthermore, the comments made by participants indicated that deciding whether anoma-lous traffic relates to an attack is not necessarily an activity that is immediately carried outwhilst monitoring in real time (e.g., “I think in reality you would look at that and go stop/pause,and look at something again” (P11)). The decision on whether anomalous traffic is maliciousor benign would often be informed by further investigation of the traffic observed, exploringthe traffic in closer detail retrospectively. Given that our study explored real-time monitoringusing videos, and there was no facility for participants to return to events and investigate themretrospectively, this key decision-making aspect of attack detection was not captured. A descrip-
147

tion by P1 of the type of extensive network knowledge required to detect and identify an FTPbrute-force attack (see Section 9.2.5) suggested that in reality, practitioners would draw on agreater knowledge of the network than we were able to impart in this short study, in decidingwhether anomalous traffic constituted an attack.
We therefore reconsidered the anomalous-traffic detection capabilities that were importantto this study. For the initial real-time part of the monitoring, it is important that the anomaloustraffic relating to the attack is noticed, so that security practitioners are made aware that furtherretrospective investigation of it is required. As such, rather than measuring the accuracy ofparticipants’ decisions on whether anomalous traffic relating to a network attack had or hadnot been observed, we chose to focus on ensuring that participants detected the anomalous trafficat the time of the attack. We posit that other detections of anomalous traffic, not necessarilyrelating to an attack, are part of the real-time monitoring process. Such a detection might bereturned to retrospectively by practitioners in reality, in order to make decisions on whether itconstitutes an attack.
Our aim in involving practitioners in the study was to draw on their experience of monitoringand detecting anomalies: rather than impose rules in the study on what constituted anomaloustraffic or otherwise, we wished to learn what appeared anomalous to experts when representedin the SIEM and Sonification SIEM. P3, for example, noted that while not necessarilyindicating an attack, certain traffic would usually prompt further investigation: “things likeTelnet and FTP would be things I would like to investigate further, so not necessarily somethingthat was going to be bad, but something that would at least make me want to look into it further”.Rather than making the same measurements of true- and false-positive and negative detectionsof anomalous network traffic as we had for alerts, therefore, we judged it more appropriate toassess how the anomalous traffic detections made by participants related to the events occurringin the dataset at the time. Based on all these observations, we elected to focus on measuringthe following two aspects of monitoring for anomalous network traffic.
a Detection of anomalous traffic at the time of the attack. We calculated the recall accuracy(as described in Section 4.2.3) — which accounts for true-positive and false-negative de-tections, and is a measure of the probability that when the attack occurred, a participantdetected it. Recall does not account for false-positive detections, so was unaffected by thedetections of anomalous traffic made by participants at other times in the dataset.
b “Network-traffic awareness”, by which we describe the relevance of the anomalous devi-ations in traffic described by participants, to the network traffic actually present in thedataset at the time. This means, for example, if a participant described an anomalous spikein FTP traffic at a time outside the FTP brute-force attack time window, we would verifywhether there was an increased amount of FTP traffic at that time. If the descriptions ofanomalous traffic given by participants aligned with the traffic represented in the dataset(in terms of precision, timeliness, and correctness of identification), we considered thatthis constituted “network-traffic awareness”. In this way, we examined what awarenessof the network traffic participants were able to gain using the SIEM and SonificationSIEM.
The ground truth used in point (a) above was the timing of the attack, which occurred from115 seconds onwards in Dataset 2. We assessed whether, and how efficiently and accurately,participants detected the anomalous traffic and IDS alerts related to the attack. For the assess-ment of network-traffic awareness (point (b) in the list above), we compiled a list of the groundtruth for each dataset. These ground-truth lists were generated iteratively: we began with theanomalous traffic noticed by the researchers: spikes of particular protocols, and times at whichparticularly dissonant sound was generated, for example.
Because of the large amount of highly varied traffic the datasets contained, we could notguarantee that all anomalous traffic deviations had been captured by the researchers. Therefore,
148

as new anomalous traffic was identified by participants, we verified its presence in the dataset.If the traffic was present at that time, we added it to the ground-truth lists. In cases whereanomalous traffic was detected but its nature was not identified, if the traffic did not match thetiming of an existing anomalous traffic deviation in the ground truth, we judged that there wastoo much ambiguity to add it to the ground truth. An advantage of creating these ground-truthlists iteratively, based on the responses of participants, was that it enabled us to understandthe types of event most frequently assessed by SOC practitioners as being anomalous using thestudy tools. We present these events in Table 9.16.
We assessed whether correctly detected anomalous traffic deviations were also correctlyidentified. Responses were coded as either correctly identified (an attempt at identification wasmade, and matched the ground truth according to our analysis approach), incorrectly identified(an attempt at identification was made, but did not match the ground truth according to ouranalysis approach), or unidentified (no attempt was made at identifying the nature of the traffic).Identification of the nature of the anomalous traffic is an important part of the network-trafficawareness we assessed. We present the identification rates, and plots of the times at whichcorrectly and incorrectly identified, and unidentified detections were made, in Section 9.1.4.
Usability scales: SUS and BUZZ
We analysed the SUS and BUZZ usability scales according to the analysis methods describedin their respective papers [43, 169]. The analysis for each participant’s questionnaire responsesinvolved summing the score contribution for each scale item, and performing assigned calcula-tions to derive a single number representing a measurement of the system’s overall usability. Itis stated that scores for individual items on their own are not meaningful [43], so we did notcarry out an analysis of the scores given to each question by participants.
8.5 Summary
We have presented the setup of the study: the development of the SIEM and SonificationSIEM, the preparation of study datasets and training videos, our study hypotheses and themethodology we used to explore them. In the next chapter, we report the results of the studytasks and the interviews, and analyse these results according to our hypotheses.
149

Chapter 9
Exploring the Use of a SonificationSystem by Security Practitioners:Study Results
In Chapter 8, we presented the setup of our study, aiming to explore the use of a sonificationsystem by security practitioners. In this chapter, we report the results of the study tasks and theinterviews with security practitioners, and present our analysis and discussion of these results.In Sections 9.1 and 9.2 we present the results of the study tasks and the interviews, respectively.We discuss these results in the context of our study hypotheses, and explore the implicationsof the results for the use of sonification in SOCs, in Section 9.3.
9.1 Participants’ Demographics and Performance in the StudyTasks
We present the demographics of the participants in the study, followed by a quantitative analysisof their performance in the study tasks. In the tables in which we present the results of thequantitative analysis (Tables 9.4 - 9.20), the values relevant to the assessment of the hypothesespresented in Section 8.3 are highlighted in yellow. These hypotheses are then assessed in Section9.3.1. In these sections we present results relating to monitoring for both anomalous packet trafficand alerts; we refer to anomalous packet traffic as “traffic”, for brevity.
9.1.1 Participants and Demographics
Table 9.1: Participant (P) demographics
Gender Age Bracket
male 19 18-24 3female 3 25-34 10
35-44 745-54 2
Of the 22 participants in the study, 20 completed the entire study, including the studytasks, while two (P4 and P9) were shown the tool-introduction videos and then took partin the interview (due to time constraints of those participants). Nineteen participants statedthat their country of origin was the UK, while three gave other countries. All participants hadno hearing or visual impairments, and all participants had experience of using a SIEM tool.Thirteen participants had experience of using security visualizations, while nine did not.
150
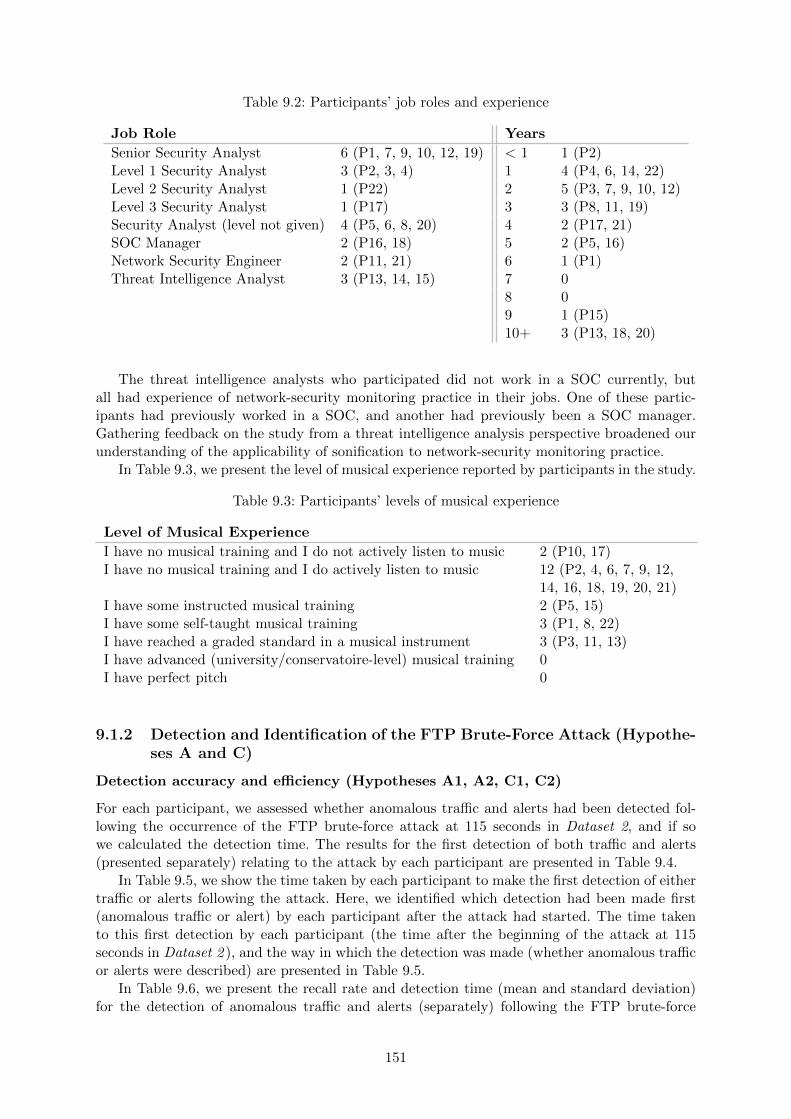
Table 9.2: Participants’ job roles and experience
Job Role Years
Senior Security Analyst 6 (P1, 7, 9, 10, 12, 19) < 1 1 (P2)Level 1 Security Analyst 3 (P2, 3, 4) 1 4 (P4, 6, 14, 22)Level 2 Security Analyst 1 (P22) 2 5 (P3, 7, 9, 10, 12)Level 3 Security Analyst 1 (P17) 3 3 (P8, 11, 19)Security Analyst (level not given) 4 (P5, 6, 8, 20) 4 2 (P17, 21)SOC Manager 2 (P16, 18) 5 2 (P5, 16)Network Security Engineer 2 (P11, 21) 6 1 (P1)Threat Intelligence Analyst 3 (P13, 14, 15) 7 0
8 09 1 (P15)10+ 3 (P13, 18, 20)
The threat intelligence analysts who participated did not work in a SOC currently, butall had experience of network-security monitoring practice in their jobs. One of these partic-ipants had previously worked in a SOC, and another had previously been a SOC manager.Gathering feedback on the study from a threat intelligence analysis perspective broadened ourunderstanding of the applicability of sonification to network-security monitoring practice.
In Table 9.3, we present the level of musical experience reported by participants in the study.
Table 9.3: Participants’ levels of musical experience
Level of Musical Experience
I have no musical training and I do not actively listen to music 2 (P10, 17)I have no musical training and I do actively listen to music 12 (P2, 4, 6, 7, 9, 12,
14, 16, 18, 19, 20, 21)I have some instructed musical training 2 (P5, 15)I have some self-taught musical training 3 (P1, 8, 22)I have reached a graded standard in a musical instrument 3 (P3, 11, 13)I have advanced (university/conservatoire-level) musical training 0I have perfect pitch 0
9.1.2 Detection and Identification of the FTP Brute-Force Attack (Hypothe-ses A and C)
Detection accuracy and efficiency (Hypotheses A1, A2, C1, C2)
For each participant, we assessed whether anomalous traffic and alerts had been detected fol-lowing the occurrence of the FTP brute-force attack at 115 seconds in Dataset 2, and if sowe calculated the detection time. The results for the first detection of both traffic and alerts(presented separately) relating to the attack by each participant are presented in Table 9.4.
In Table 9.5, we show the time taken by each participant to make the first detection of eithertraffic or alerts following the attack. Here, we identified which detection had been made first(anomalous traffic or alert) by each participant after the attack had started. The time takento this first detection by each participant (the time after the beginning of the attack at 115seconds in Dataset 2 ), and the way in which the detection was made (whether anomalous trafficor alerts were described) are presented in Table 9.5.
In Table 9.6, we present the recall rate and detection time (mean and standard deviation)for the detection of anomalous traffic and alerts (separately) following the FTP brute-force
151

Table 9.4: Detection of, and time taken (in seconds) to detect, anomalous traffic and alerts(presented separately) following the FTP brute-force attack
Traffic AlertsSIEM Sonification SIEM SIEM Sonification SIEMDetected Time Detected Time Detected Time Detected Time
Task 1 3(P3) 5 3(P2) 4 3(P3) 9 3(P2) 43(P10) 4 3(P7) 11 3(P10) 20 3(P7) 33(P15) 30 3(P14) 5 3(P15) 3 3(P14) 23(P17) 0 7(P18) 3(P17) 2 3(P18) 53(P22) 3 7(P20) 3(P22) 13 3(P20) 2
Task 2 3(P5) 8 3(P1) 0 3(P8) 4 3(P1) 23(P16) 19 3(P11) 1 3(P12) 6 3(P6) 03(P21) 7 3(P13) 4 3(P16) 5 3(P11) 57(P8) 3(P19) 5 3(P21) 2 3(P13) 97(P12) 7(P6) 7(P5) 3(P19) 7
Table 9.5: Detection and time taken (in seconds) to detection following the FTP brute-forceattack: first detection — traffic (T) or alerts (A)
SIEM Sonification SIEMDetected Time Detected Time
Study Task 1 3(P3)(T) 4 3(P2)(T) 43(P10)(T) 4 3(P7)(A) 73(P15)(A) 7 3(P14)(T) 53(P17)(T) 0 3(P18)(A) 53(P22)(T) 3 3(P20)(A) 2
Study Task 2 3(P8)(A) 4 3(P1)(T) 03(P12)(A) 6 3(P6)(A) 03(P16)(A) 9 3(P11)(T) 13(P21)(A) 6 3(P13)(T) 43(P5)(T) 8 3(P19)(T) 5
attack in Dataset 2, using the results presented in Table 9.4. We also present the recall rateand detection time (mean and standard deviation) for the FTP brute-force attack using bothtraffic and alerts. Here, we use the results presented in Table 9.5, considering the first detectionof either traffic or alerts (whichever was first) following the beginning of the attack.
Table 9.6: Recall rate, and mean and standard deviation (S. D.) of detection times (in seconds)following the FTP brute-force attack: traffic only, alerts only, and overall (first detection ofattack-related traffic or alerts)
SIEM Sonification SIEMRecall Detection Time Recall Detection Time
Mean S. D. Mean S. D.
TrafficStudy Task 1 1.0 3.0 2.16 0.60 6.67 3.79Study Task 2 0.60 7.50 0.71 0.80 2.50 2.38
AlertsStudy Task 1 1.0 6.75 5.19 1.0 3.20 1.30Study Task 2 0.80 4.25 1.71 1.0 4.60 3.65
OverallStudy Task 1 1.0 3.60 2.51 1.0 4.60 1.82Study Task 2 1.0 6.60 1.95 1.0 2.0 2.35
152

We ran t-tests to check for significant differences between participants using the SIEM andthe Sonification SIEM in the mean time taken to detect either traffic or alerts relating to theFTP brute-force attack (whichever the participant detected first, as presented in the “Overall”row of Table 9.6).
To analyse these results for Study Task 1, we selected a two-sample t-test assuming equalvariances. The variances were treated as equal based on the result of an initial F-test, whichshowed there was no significant difference between the variances of the two populations. Theresults of the t-test are displayed in Table 9.7, and show that there was no significant differencein the mean times taken by participants in Study Task 1 using the SIEM and the SonificationSIEM to their first detection of either traffic or alerts (whichever was first) following the attack,with significance α = 0.05, since t Stat > -t Critical two-tail and t Stat < t Critical two-tail.
Table 9.7: t-test (two-sample assuming equal variances): time taken to detection following theFTP brute-force attack in Study Task 1 : comparison of participants using the SIEM and theSonification SIEM (alpha=0.05)
SIEM Sonification SIEM
Mean 3.6 4.6Variance 6.3 3.3Observations 5 5Pooled Variance 4.8Hypothesized MeanDifference
0
df 8t Stat -0.721687836P(T<=t) one-tail 0.245519213t Critical one-tail 1.859548038P(T<=t) two-tail 0.491038426t Critical two-tail 2.306004135
To analyse these results for Study Task 2, we selected a two-sample t-test assuming unequalvariances. The variances were treated as unequal based on the result of an initial F-test, whichshowed there was a significant difference between the variances of the two populations. Theresults of the t-test are displayed in Table 9.8. The results show that the mean time taken byparticipants in Study Task 2 using the Sonification SIEM to detect either traffic or alerts(whichever was first) following the attack was significantly faster than that taken by participantsusing the SIEM, with significance α = 0.05, since t Stat > t Critical two-tail.
Therefore, the results of the t-tests show that when monitoring as a non-primary task,participants made their first detection of either traffic or alerts following the FTP brute-forceattack in a significantly faster mean time when using the Sonification SIEM than when usingthe SIEM. When monitoring as a primary task, there was no significant difference in the meandetection times between the participants using the two tools.
Identification accuracy (Hypotheses A3, C3)
No participant identified that the attack was an FTP brute-force. It is likely that further infor-mation and the opportunity to further explore the data would have been required for this specificattack identification to be made, and this was supported by the comments of some participants(see the comments of P1 on the information needed to detect an FTP brute-force attack, forexample, which are presented in Section 9.2.5). A number of participants did, however, identifya continuously high level of FTP traffic, which was a key indicator of the attack. In Table 9.9,we show the proportion of the participants who detected anomalous traffic following the attack,
153

Table 9.8: t-test (two-sample assuming unequal variances): time taken to detection followingthe FTP brute-force attack in Study Task 2 : comparison of participants using the SIEM andthe Sonification SIEM (alpha=0.05)
SIEM Sonification SIEM
Mean 6.6 2Variance 3.8 5.5Observations 5 5Hypothesized MeanDifference
0
df 8t Stat 3.372883645P(T<=t) one-tail 0.004871924t Critical one-tail 1.859548038P(T<=t) two-tail 0.009743847t Critical two-tail 2.306004135
who also made this identification.
Table 9.9: Identification of the FTP brute-force attack: proportion of those participants whodetected anomalous traffic following the attack, who also correctly identified the traffic as con-tinuously high levels of FTP
SIEM Sonification SIEM
Task 1 3/5 0/3
Task 2 1/3 3/4
9.1.3 Detection and Identification of Snort IDS Alerts (Hypotheses B andD)
Detection accuracy and identification accuracy (Hypothesis B1, B3, D1, D3)
In Table 9.10, we present results on detection and identification accuracy for Snort IDS alerts.The table reports the precision, recall and F-score measures of detection accuracy, and theidentification rate (the proportion of the alerts detected that were also correctly identified).
As shown in Table 9.10, participants obtained perfect recall of alerts (meaning that noalert detections were missed — there were no false-negative detections) using the SonificationSIEM. Using the SIEM, the recall rate shows that there were some false-negative detections,resulting in lower (but still reasonable) F-scores of 0.95 in Dataset 1, and 0.97 in Dataset 2.The table also shows that the mean identification rate across both tasks was slightly higher forparticipants using the SIEM (0.99) than the Sonification SIEM (0.96).
Detection efficiency (Hypotheses B2, D2)
In Tables 9.11 and 9.12 we present the time (mean and standard deviation) taken to true-positive alert detections by participants using each tool in the two study tasks. In Table 9.11these results are divided over Dataset 1 and Dataset 2, while in 9.12 the results are calculatedfrom the detection times across both datasets.
We ran t-tests to check for significant differences between participants using the SIEM andthe Sonification SIEM in the mean time taken to detect alerts in both Study Task 1 andStudy Task 2. For Study Task 1, we selected a two-sample t-test assuming unequal variances.The variances were treated as unequal based on the result of an initial F-test, which showed
154

Table 9.10: Precision, recall, F-score and identification accuracy for alert detections in the studytasks
SIEM Sonification SIEMDataset 1 Dataset 2 Mean Dataset 1 Dataset 2 Mean
Task 1
Precision 1.0 1.0 1.0 1.0 1.0 1.0Recall 0.8 1.0 0.9 1.0 1.0 1.0F-score 0.89 1.0 0.95 1.0 1.0 1.0Identification 1.0 1.0 1.0 1.0 0.93 0.97
Task 2
Precision 1.0 1.0 1.0 1.0 1.0 1.0Recall 1.0 0.88 0.94 1.0 1.0 1.0F-score 1.0 0.94 0.97 1.0 1.0 1.0Identification 1.0 0.93 0.97 1.0 0.90 0.95
Both Tasks
Precision 1.0 1.0 1.0 1.0 1.0 1.0Recall 0.9 0.94 0.92 1.0 1.0 1.0F-score 0.95 0.97 0.96 1.0 1.0 1.0Identification 1.0 0.97 0.99 1.0 0.91 0.96
Table 9.11: Time taken to true-positive alert detections (mean and standard deviation) in eachdataset
SIEM Sonification SIEMDataset 1 Dataset 2 Dataset 1 Dataset 2Mean S. D Mean S. D. Mean S. D. Mean S. D
Task 1 4.60 2.88 3.29 3.09 1.60 1.14 1.75 1.73Task 2 7.33 3.88 5.25 3.96 3.14 2.34 2.28 2.22Both 6.17 3.43 8.30 7.07 2.50 2.02 2.05 1.99
Table 9.12: Time taken to true-positive alert detections (mean and standard deviation) acrossboth datasets
SIEM Sonification SIEMMean S. D Mean S. D.
Task 1 3.63 2.32 1.78 1.64Task 2 6.20 3.78 2.44 2.24
there was a significant difference between the variances of the two populations. The results ofthe t-test are displayed in Table 9.13. The results show that the mean time taken by participantsusing the Sonification SIEM to detect alerts in Study Task 1 was significantly faster thanthat taken by participants using the SIEM, with significance α = 0.05, since t Stat > t Criticaltwo-tail.
For Study Task 2, we selected a two-sample t-test assuming unequal variances. The varianceswere treated as unequal based on the result on an initial F-test, which showed there was asignificant difference between the variances of the two populations. The results of the t-test aredisplayed in Table 9.14. The results show that the mean time taken by participants using theSonification SIEM to detect alerts in Study Task 2 was significantly faster than that takenby participants using the SIEM, with significance α = 0.05, since t Stat > t Critical two-tail.
Therefore, the results of the t-tests show that when monitoring as a primary task, and whenmonitoring whilst multitasking, participants detected alerts in a significantly faster mean timewhen using the Sonification SIEM than when using the SIEM.
155

Table 9.13: t-test (two-sample assuming unequal variances): time taken to detect alerts in StudyTask 1 : comparison of participants using the SIEM and the Sonification SIEM (alpha=0.05)
SIEM Sonification SIEM
Mean 3.631578947 1.78125Variance 5.356725146 2.692540323Observations 19 32Hypothesized MeanDifference
0
df 29t Stat 3.058186971P(T<=t) one-tail 0.00237675t Critical one-tail 1.699127027P(T<=t) two-tail 0.0047535t Critical two-tail 2.045229642
Table 9.14: t-test (two-sample assuming unequal variances): time taken to detect alerts in StudyTask 2 : comparison of participants using the SIEM and the Sonification SIEM (alpha=0.05)
SIEM Sonification SIEM
Mean 6.2 2.444444444Variance 14.31428571 4.996825397Observations 15 36Hypothesized MeanDifference
0
df 18t Stat 3.592087784P(T<=t) one-tail 0.001041774t Critical one-tail 1.734063607P(T<=t) two-tail 0.002083548t Critical two-tail 2.10092204
9.1.4 Anomalous Traffic Deviations: Network-Traffic Awareness
We present an analysis of participants’ detection and identification of anomalous deviations inthe traffic throughout both datasets (rather than only at the time of the attack in Dataset 2,which we presented the analysis of in Section 9.1.2). For this study, we considered an anomaloustraffic deviation to be a change in the traffic to a state different from the most frequently presentbaseline. This baseline traffic was, for the most part, a balance of IPV4 traffic sent over TCP,HTTP and UDP, with mostly common (hotlisted) IP addresses and ports used. The decisionon whether a change in the traffic constituted an anomalous traffic deviation was made by theresearcher based on their knowledge of this usual traffic state.
As we described in Section 8.4.3, we took an iterative approach to creating the ground-truth lists for anomalous traffic against which the responses of participants were assessed. Theground-truth lists we produced through this process, which are the basis on which we analysedthe performance of participants in this section, are presented in Table 9.15. In Table 9.16 wesummarise the types of anomalous traffic deviation correctly identified by participants.
Table 9.17 shows the precision with which participants detected anomalous deviations inthe traffic, and the accuracy with which they identified these events. Table 9.18 shows the timetaken by participants to detect anomalous traffic deviations following their occurrence in thedataset (mean and standard deviation). These assessments were made in comparison with theground truth we present in Table 9.15.
156

Table 9.15: Ground truth for anomalous traffic deviations in each dataset, and indication ofelements added following the responses of particular participants
Dataset 1 Dataset 2Time Classification Added? Time Classification Added?
9 IPV6 P1 11 Dissonance P720 FTP N 28 Dissonance P841 FTP N 32 Dissonance P951 SSH N 48 Dissonance P1361 TCP increase P11 56 SSH N102 Dissonance P21 64 FTP N103 FTP N 75 Dissonance P11107 FTP N 81 FTP Nthroughout Traffic between
high portsP11 96 SSH N
108 FTP N115 FTP (continu-
ous until end ofdataset)
N
Table 9.16: Classifications of anomalous traffic detected
Category Classification Number of DetectionsDataset 1 Dataset 2
Protocol/ applicationFTP/ voices 20 46SSH/ organ 6 13TCP increase 1 0
IP/ portIPV6 traffic 1 0Traffic between high ports 1 0Dissonance 1 8
Table 9.17: Precision of anomalous traffic detection, and identification accuracy
Task Assessment SIEM Sonification SIEM
Dat
aset
1
Dat
aset
2
Mea
n
Dat
aset
1
Dat
aset
2
Mea
n
Task 1
Detection: precision 0.93 1.0 0.97 1.0 1.0 1.0Correctly identified 0.93 0.83 0.88 0.38 0.43 0.41Incorrectly identified 0.07 0.06 0.07 0.0 0.0 0.0Unidentified 0.0 0.11 0.06 0.62 0.57 0.60
Task 2
Detection: precision 1.0 1.0 1.0 0.73 1.0 0.86Correctly identified 0.25 0.71 0.48 0.81 0.96 0.89Incorrectly identified 0.0 0.0 0.0 0.13 0.0 0.07Unidentified 0.75 0.29 0.52 0.06 0.04 0.05
Both
Detection: precision 0.95 1.0 0.98 0.83 0.94 0.89Correctly identified 0.78 0.81 0.80 0.62 0.73 0.68Incorrectly identified 0.06 0.05 0.06 0.07 0.0 0.04Unidentified 0.17 0.14 0.16 0.31 0.27 0.29
157

Table 9.18: Time taken to detection of traffic anomalies: mean and standard deviation
Task SIEM Sonification SIEMDataset 1 Dataset 2 Dataset 1 Dataset 2Mean S. D. Mean S. D. Mean S. D. Mean S. D.
Task 1 5.25 3.20 3.76 1.82 2.25 1.14 3.25 2.18Task 2 6.33 3.51 4.5 2.18 4.21 2.26 1.64 1.26
Figure 9.1: Dataset 1 network-traffic awareness: true-positive detections (top); false-positiveand unidentified detections (middle); ground truth (bottom)
Figure 9.2: Dataset 2 network-traffic awareness: true-positive detections (top); false-positiveand unidentified detections (middle); ground truth (bottom)
In Figures 9.1 and 9.2, we present time-series plots describing the network-traffic awarenessof participants in each dataset. In the figures, the bottom plots show the ground truths againstwhich we assessed network-traffic awareness in Dataset 1 and Dataset 2, which match theground-truth lists described in Table 9.15. The top plots show the true-positive detections
158

of anomalous traffic, assessed against these ground truths. In these four graphs, line colourrepresents the classification of the anomalous traffic detected, according to the classificationsdescribed in Table 9.16. FTP/voice is represented by the pink line; SSH/organ by purple;dissonance by orange; TCP increase by yellow; and IPV6 traffic by green. The middle plotsshow false-positive (red line) and unidentified detections (blue line) of anomalous network traffic,assessed against the ground truths.
9.1.5 The Effect of Musical Experience on Monitoring Performance (Hy-pothesis E)
We divided participants into two groups: those with and without musical experience, basedon their responses to the preliminary demographic question on musical experience (see Section4.2.2). We considered participants with musical experience to be those who reported havingsome level of instructed or self-taught musical training, had reached a graded standard in amusical instrument or had advanced musical training. Participants without musical experiencewere those who reported having no musical training and either did or did not actively listen tomusic.
We ran t-tests to check for significant differences between participants with and withoutmusical experience using the Sonification SIEM in the mean time taken to detect alerts, andalso in the mean time to detect either traffic or alerts following the FTP brute-force attack(the first detection of either following the attack, as used in Section 9.1.2). For both of theseassessments, we considered only the datasets in which participants had used the SonificationSIEM. We collected all alert-detection times of participants using the Sonification SIEM,and considered FTP brute-force attack detection only for those participants who used theSonification SIEM in Dataset 2, in which this attack was present. We also calculated theaccuracy of detection and identification for these two populations.
Network-attack traffic (Hypothesis E1)
To assess the effect of musical experience on the time taken to detect traffic or alerts relatingto the FTP brute-force attack (by participants who used the Sonification SIEM in Dataset2, in which the FTP brute-force attack was present), we selected a two-sample t-test assumingunequal variances. The variances were treated as unequal based on the result of an initial F-test,which showed there was a significant difference between the variances of the two populations.The results of the t-test are displayed in Table 9.19.
Table 9.19: t-test (two-sample assuming unequal variances): time taken to first detection ofeither traffic or alerts following the FTP brute-force attack using the Sonification SIEM, byparticipants with and without musical experience (alpha=0.05)
Musical Non-musical
Mean 1.666666667 4Variance 4.333333333 5.333333333Observations 3 7Hypothesized MeanDifference
0
df 4t Stat -1.570867881P(T<=t) one-tail 0.095653219t Critical one-tail 2.131846786P(T<=t) two-tail 0.191306439t Critical two-tail 2.776445105
159

The results presented in Table 9.19 show that there was no significant difference in themean times taken by participants with and without musical experience, using the SonificationSIEM, to their first detection of either traffic or alerts following the attack, with significanceα = 0.05, since t Stat > -t Critical two-tail and t Stat < t Critical two-tail. Since all participantsdetected the attack in either the traffic or alerts (as shown in Table 9.5), the recall rates ofparticipants with and without musical experience for the attack were equal (both 1.0).
Of the three participants with musical experience who detected the attack traffic (beforealerts) using the Sonification SIEM, all three correctly identified the attack traffic as con-tinuously high rates of FTP (identification rate 1.0). Of the three participants without musicalexperience who detected the attack traffic (before alerts) using the Sonification SIEM, nonecorrectly identified this attack traffic (identification rate 0). In this study, therefore, participantswith musical experience were better able to identify the attack traffic, although the populationscompared are too small for the results to be generalisable.
Alerts (Hypothesis E2)
To assess the effect of musical experience on the time taken to detect alerts, we selected a two-sample t-test assuming equal variances. The variances were treated as equal based on the resultof an initial F-test, which showed there was no significant difference between the variances ofthe two populations. The results of the t-test are displayed in Table 9.20.
Table 9.20: t-test (two-sample assuming equal variances): time taken to detect alerts using theSonification SIEM, by participants with and without musical experience (alpha=0.05)
Musical Non-musical
Mean 2.28 2Variance 5.46 3.209302326Observations 25 44Pooled Variance 4.015522388Hypothesized MeanDifference
0
df 67t Stat 0.557903136P(T<=t) one-tail 0.289385003t Critical one-tail 1.667916114P(T<=t) two-tail 0.578770007t Critical two-tail 1.996008354
The results presented in Table 9.20 show that there was no significant difference in the meantimes taken by participants with and without musical experience, using the Sonification SIEMto detect alerts, with significance α = 0.05, since t Stat > -t Critical two-tail and t Stat < tCritical two-tail. Since, as Table 9.10 shows, the precision, recall and F-score of participants forthe detection of alerts using the Sonification SIEM were all 1.0, it follows that the precision,recall and F-score of participants with and without musical experience for the detection of alertsusing the Sonification SIEM were equal (1.0).
Of the 25 true-positive alert detections by participants with musical experience using theSonification SIEM, three were not correctly identified, resulting in an identification rate of22/25 = 0.88. Two of the 44 true-positive alert detections by participants without musical expe-rience using the Sonification SIEM were not correctly identified, resulting in an identificationrate of 42/44 = 0.95.
160

9.1.6 Usability Questionnaires
SUS results: SIEM and Sonification SIEM
In Table 9.21 we present the results of the SUS scores given by each participant to the SIEMand the Sonification SIEM, analysed according to the SUS guidelines ([43]), as described inSection 8.4.3. The resulting score is presented on a scale from 0 to 100, where 0 represents thelowest, and 100 the highest, possible score.
Table 9.21: System usability scale (SUS) scores given by each participant: SIEM and Sonifi-cation SIEM
Participant 1 2 3 4 5 6 7 8 9 10 11
SIEM 75 85 72.5 90 67.5 60 77.5 22.5 50 67.5 75Sonification SIEM 67.5 65 67.5 77.5 57.5 50 85 50 40 25 77.5
Participant 12 13 14 15 16 17 18 19 20 21 22
SIEM 70 57.5 45 70 77.5 52.5 62.5 67.5 42.5 62.5 70Sonification SIEM 35 45 67.5 77.5 55 57.5 40 47.5 57.5 70 60
An SUS score above 68 is considered to be above the average for systems, while below 68is considered below average.1 Tables 9.21 and 9.22 show that the SIEM was given an SUSscore above 68 by ten participants, while the Sonification SIEM was scored above 68 by fiveparticipants. These results suggest that the usability of both tools, and of the SonificationSIEM in particular, need improvement.
BUZZ results: Sonification SIEM
In Table 9.22 we present the results of the BUZZ scores given by each participant to theSonification SIEM, analysed according to the BUZZ guidelines ([169]), as described in Section8.4.3. The resulting score is presented on a scale from 0 to 100, where 0 represents the lowest,and 100 the highest, possible score.
Table 9.22: Auditory interface user experience scale (BUZZ) scores: Sonification SIEM
Participant 1 2 3 4 5 6 7 8 9 10 11
Sonification SIEM 56.1 39.4 47.0 81.8 48.5 43.9 77.3 31.8 53.0 47.0 59.1
Participant 12 13 14 15 16 17 18 19 20 21 22
Sonification SIEM 62.1 54.5 62.1 78.8 39.4 57.6 48.5 45.5 50.0 57.6 60.6
The BUZZ questionnaire scores obtained by our sonification system varied widely between alowest score of 31.8 and a highest score of 81.8. This suggests that the views of participants ontheir experience using the sonification differed, an inference supported by the interview resultswe present in Section 9.2. The BUZZ auditory interface user experience scale has only recentlybeen published and has not yet been used to assess many other sonification systems, meaningthat we cannot compare the results obtained by our system with those obtained by others.
9.2 Interviews
We present the results of the interview analysis. These results are presented within the themesof the coding template we produced, which is provided in Appendix D.
1https://www.usability.gov/how-to-and-tools/methods/system-usability-scale.html
161

9.2.1 SOCs: Setup and Working Practice
We begin with a summary of our findings on working practice in SOCs, in order to set thebackground for the rest of the interview results.
Participants’ roles within the SOC
A number of participants with different job titles described their roles in the SOC. Securityanalysts are primarily responsible for monitoring network security and investigating incidents.A security analyst described the constant, busy nature of the work they carried out in the SOC:
Things just constantly being bombarded at you, and you’ve got to try and get yourjob done and deal with that and pick out anything that’s weird. (P5)
Differences between the work of senior security analysts and lower-level security analystswere described. A senior analyst stated that in their senior role they were no longer responsiblefor monitoring alerting systems, but were “there as backup for the guys if they’re all looking atalerts and they go ‘they’re still coming in’” (P7). Senior analysts may focus on tasks other thanmonitoring: this particular senior analyst was working on rewriting playbooks on the day of theinterview.
A number of the senior analysts interviewed stated that while other analysts would worklong shift patterns, including night shifts, senior analysts (and SOC managers) tended to workdaytime hours (similar to 9am–5pm working hours). The night shifts worked by security analystswere usually described as being roughly 12-hour shifts, with a set of analysts working the 12-hour day shift, and another set of analysts working the 12-hour night shift. Night shifts weredescribed as “not very eventful to be honest, because our network, along with everybody else’s,goes to sleep” (P2). Shifts are often worked in blocks, followed by some rest days “12-hour shiftsand it was three on three off and a mixture of nights” (P7).
We also interviewed two security engineers. One engineer described their work as a mixtureof tool configuration, data parsing, and support of and interaction with analysts around toolsand alerting: “interacting with the analysts in that I will do some work on that data first, beforegiving a new kind of security type alarm to look at, so I would have looked at the data behindthat before they get to that” (P11).
Physical setup of SOCs
A number of participants described working in a large, shared space: “where we work here, it’squite a large open office shared by lots of different companies” (P22). A participant explainedthat sometimes the SOC and the network operations centre (NOC) would be placed in the sameroom.
Often, these large spaces are set up as open office environments in which each practitionersits at a desk with (usually multiple) monitors, and in which larger screens are positioned onthe wall to display information to everyone working in the room. A SOC in which high-end,expensive technology was used (“you’ve got three projectors, I think they’re £80,000 each, andthey project onto a big screen with all our data on the back wall. So yes, it’s very impressive”(P6)), was described by one participant who worked in it as “a whole different world” (P2).
Use of tools
Participants described the tools they used in their SOC work. One participant described theuse of a console for displaying an alert list to all practitioners:
Usually we have our main LogRhythm console open on everyone’s screen at everygiven moment. And that’s literally just like a list of alert alert alert alert and you
162

just keep adding one to the top and stuff ... so that’s how we inform the analysts ofincoming alerts. (P7)
In general, real-time monitoring was carried out based on the output of alerting systemsmore than using representations of the network traffic, such as advanced security visualizations:“a lot of the time, people like you to just go off the alert logs, rather than use dashboards,although the SIEM manufacturers will prefer you to use the dashboards” (P18).
There was some discussion around the reasons why advanced visualizations were not usedfrequently in SOCs in general. A SOC manager suggested that an advantage of primarily usingalerts was that it showed management that the SOC was busy:
I suppose if they tuned the SIEMs properly, they would be able to use the dashboards,but management don’t like that because they like to see a lot of alerts on the screenso that it looks like you’re busy all the time, and people coming by see a screen fullof alerts, so they tend to leave it that way. (P18)
This SOC manager, however, felt that in the SOC in which they worked, there was advanceduse of security visualization: “I would say we are quite advanced, in terms of visualization ... weare doing this on a daily basis, visualization and hunting and stuff” (P18). Another participantfelt that visualizations could be beneficial, but the technology had not been purchased by theorganisation:
It’s an argument that maybe we would benefit from having something that wouldvisualize the traffic for us. We just don’t use it, we didn’t purchase the software todo that sort of thing. (P5)
The need for SOCs to be well-tuned in order for visualization dashboards to be practicalwas highlighted: “I know the SIEM manufacturers would prefer that you had the centres allwell-tuned and you actually used dashboards in that way” (P18). For threat hunting, in whichpractitioners search through low-level network data retrospectively with the aim of identifyingundetected threats, some participants used advanced visualizations: “they find the needle in thehaystack, discovering unknowns by using different visualization methodologies” (P18). The useof tools for displaying and querying PCAPs when retrospectively hunting through data was alsodescribed:
We’ve got a new tool ... where we download packet captures and events to go into,but we had a tool where we could query traffic that was coming in, it was just fullpacket captures all the time for however long, and we could jump back, query it andfind out anything. (P7)
The use of bespoke monitoring tools, rather than commercial solutions, was described: “oneof these multi-devices so it tries to be everything in one, it’s a firewall, an IDS, a SIEM tool”(P19).
Existing audio in SOCs
Some participants described the soundscape in the SOCs they worked in currently. In someSOCs, no audio was used currently, possibly due to factors relating to practical difficulties: “it’sall done visually. I think that’s probably because it’s an office-based environment where there’sso many people, and obviously you can’t wear headphones the whole day” (P1). Even in a SOCwith no audio deliberately played, a participant noted that there was always some level of noise:“of just people talking around you and an office happening and things like that” (P5).
Some participants worked, or had in the past worked, in SOCs where there were some audiocues used for alerting platforms (P7, P16, P18, P22). In all cases described, this was a singlesound (“just a klaxon for an L1 ” (P7), for example) representing a high-severity alert:
163

We had all clients’ alerts through, and then when ones were created it would createan alert, when they hit an SLA [service-level agreement: a commitment between theSOC and customer], it would play another one that’s like nobody’s looked at this infive minutes, now you really need to look at it before it ticks over. But still then youhave to understand context, so it would still be one alarm for anything that couldhappen. (P16)
Another participant described having used sound for alerting on device status (devices break-ing, for example) in a NOC: “we experimented with different sounds for different types of alertsand things like that, but that was actually in network operations rather than security operations.So usually for things falling over and breaking” (P19).
9.2.2 Descriptions of Experience in the Study
We present the ways in which participants described their experience in the study. This relatesto the questions asked in the post-study interview on experience in the study as a whole (Pleasedescribe your experience in the study), and to the points highlighted by participants throughoutthe study. We also report participants’ views on whether they experienced fatigue in the study,which was a question asked directly in the post-study interview.
Monitoring as a primary task
Participants described their experience in Study Task 1 : monitoring as a primary task. We beginby presenting the experience described by those participants who completed this task using theSIEM, and then consider the views of those who used the Sonification SIEM.
Participants generally felt comfortable monitoring as a primary task using the SIEM:
Without the sound it was fine, you’re just watching the packets come in, you couldkind of tell what was normal traffic and what was anomalous because you would seethe spikes come up on the screen. (P6)
Some participants described completing the primary-monitoring task using the SIEM asbeing fatiguing. One participant attributed this to the continuous nature of the study — the factthat the SIEM could not be paused for further investigation and the information representedvisually changed at speed: “Very tiring actually, constantly watching the lines ... the physicalact of watching those at speed. I think in reality you would look at that and go stop/pause, andlook at something again” (P11). Another participant attributed their fatigue in this task tohaving to solely focus on a single task:
I oddly felt that because I was just solely looking at the screen in the one withoutsound, it seemed a bit more mentally exhausting than when I was doing somethingelse with the other one. It sounds a little bit strange, but it’s just because I wasfocusing on one thing, rather than having two things going on. (P3)
Some participants using the Sonification SIEM for primary-task monitoring felt that thesonification was helpful: “it was a lot easier to concentrate on the monitoring side of things,especially with the sounds kicking off ” (P8). There were challenges, however. It was stated,for example, that using the sonification at the same time as the visuals was difficult: “I thinkaltogether it’s just very hard to look and listen to at the same time” (P8). For another participant,the difficulty lay in hearing anomalous sounds but not being experienced enough with the tool tounderstand their meaning in terms of the traffic, resulting in a feeling of confusion or distraction:
164

I started to get distracted, because normally, human behaviour, when you hear asiren, you know “ok, that’s an ambulance, something is wrong”, because it’s quiteloud, it’s very unique. But I get confused between sirens of ambulance, police, orwhatever different sirens, I kind of get distracted. Of course, after a few days orweeks or months you would get used to it and now you could easily distinguish.(P18)
Monitoring as a non-primary task
When monitoring as a non-primary task using the SIEM, several participants experienced somedifficulty, including the possibility of missing monitoring information displayed visually in theSIEM when their attention was focused on the primary task: “I could easily miss things becauseyou’re just not looking at the screen” (P5). During the task itself, some participants noted thatthey had missed information for a period of time: “[looking at the SIEM after a time focusingon the primary task] wow ok, a ton of alerts that I missed” (P16).
Participants again cited the real-time nature of the study as a reason for the difficulty theyexperienced in this task: “Because of how real time it was, I was really distracted from that [theseparate primary task] and that [the monitoring] at the same time, because I’m trying to do this,and then I’m trying to look at that, everything’s happening” (P12).
A number of participants using the Sonification SIEM to monitor as a non-primarytask felt that the sonification was beneficial. A key advantage that was highlighted was be-ing prompted to the fact that something had changed in the traffic: “it [the sound] certainlyalerts you to the fact that there’s something going on” (P19). The fact that this notificationhappened without the user having to focus attention on the monitoring was noted:
I was notified to go and look by the sound and things that were different ... you couldkind of focus on that [primary task], but something changing would make you aware,“oh I need to have a look”. (P11)
Alerts were highlighted as information that participants were notified of sonically whilstfocusing on the primary task: “concentrating on the primary task and then the sound, and itwas just the alarm for the severity 1s and severity 2s that made me take notice” (P6). A moregeneral awareness of what was happening on the network was also described as having beengained from the use of sonification in this task:
With the sound, although I found it a little bit difficult to do the task with that muchnoise going on in the background, if I was doing something which wasn’t necessarilyimportant but was on the screen, then it would give me some sort of idea of whatwas going on behind it. (P3)
Of the ten participants who completed this task in the SIEM condition, five (P7, P8, P12,P16, P20) expressed the view that the multitasking might have been easier had they been usingthe sonification to monitor, rather than monitoring visually only:
I feel it would have been easier for me if I had been doing that task [the multitask]with it [the sonification] on. I can definitely see a benefit to that, because I wouldn’thave had to keep checking it because I would have heard alarms coming in ... thatwould have meant I was freed up to spend a lot more attention on that [the separateprimary task], I don’t have to keep kind of flicking over ... I could have primarilyfocused on one task, if I had known that I was going to get a different cue for that,in a different sense, rather than trying to use the same sense of visual for both. (P7)
165

There were difficulties experienced by participants trying to monitor as a non-primary taskusing the Sonification SIEM. This included maintaining concentration on the separate pri-mary task:
When I started concentrating on that [primary task], I completely lost concentrationon that [monitoring sonification], so just thought I had missed something. So it’sreally conflicted, completely separate schools of thought. I couldn’t run them both atthe same time. (P10)
Some participants felt distracted from the primary task by the sonification: “I found it reallyconfusing actually, it totally put me off the primary task. I found the primary task very difficult”(P19). A participant suggested that their lack of experience using the sonification might havecontributed to their distraction from the primary task, since it meant more attention was focusedon using the new monitoring approach:
I didn’t get very far with that [primary task] because I was distracted by that. BecauseI haven’t used it that often so I don’t know what to listen out for, I was more focusedon that [monitoring] than I was that [primary task]. (P22)
Participants in both the SIEM and the Sonification SIEM condition noted that in reality,they would have stopped trying to carry out the separate primary task at the point where theyhad spotted anomalies in the traffic they were monitoring, and would instead have focused oninvestigating the anomalous traffic or alerts: “real world, if you have that many alerts you needto stop what you’re doing ... something more serious is happening that overrules what you’redoing at the time” (P16).
In summary, using sonification was perceived by some participants to be helpful when mon-itoring as a primary task and as a non-primary task, but the level of difficulty experienced indoing so varied between individual participants. The challenges cited: trying to use both visu-als and sound cues at the same time, the confusion resulting from an inability to identify theinformation portrayed sonically, and distraction from the separate primary task caused by themonitoring, may be lessened with training and experience. The extent to which further trainingreduces these challenges, and whether the benefits gained from using sonification are worth thetime required for training, are avenues for further investigation.
Detecting and identifying alerts and anomalous traffic
We examine participants’ descriptions of their experience in detecting and identifying alerts andanomalous traffic, and of their methods of doing so. This was not the result of a direct interviewquestion on this topic, but arose several times in participants’ discussions of their experiencein the various study tasks. We begin by focusing on the detection and identification of anoma-lous traffic. We then consider the detection and identification of alerts, and the comparisonsparticipants made between monitoring for alerts and for anomalous traffic.
Participants described the ways in which they used the sound and visuals in both theprimary-monitoring and secondary-monitoring task to monitor for anomalous traffic. Of the 20participants who completed the study tasks, five explained that they had first heard a changein the sound, and then consulted the dashboard to understand more about what this meantin terms of the network data. Participants described the role the sonification had played inprompting them to look at the SIEM dashboard, having heard a change in the sound: “itprompted me to look at the SIEM to say ‘oh you’re seeing FTP there, what is it’, and thenobviously to look into it a bit deeper” (P1). A participant stated that they felt they had found iteasier to detect anomalous traffic with the sonification than without: “with the music actuallyit was easier to identify that anomalous traffic than it was without the music” (P20).
166

Participants described their experience trying to understand information about changes inthe traffic against the sonification baseline. For some participants, there was a sonic baseline,against which deviations could be heard: “there was definitely a consistent sound all the waythrough and then spikes in different noises, different types of traffic and stuff ” (P14). A partici-pant described becoming accustomed to this baseline over time, such that anomalous deviationsbecame apparent:
It’s interesting because for the first like ten seconds you’re not used to it, so every-thing sounds new. Once you baseline it in your own mind almost, when there is stuffit flags as anomalous, as “this has changed”. (P16)
Observing changes both visually and aurally was discussed: “I think it was good because youcould visualize changes. You could hear changes as well” (P1). Having detected the presenceof a change, participants were required to identify the meaning of the change in order to givetheir verbal responses. The importance of having the dashboard to aid in the identification ofanomalous traffic once it had been detected aurally was highlighted:
You can definitely hear differences in what’s kicking off. I definitely think you need toreference the actual sheet to be able to see what you’re doing and what it is, becauseit’s impossible to be able to say “that’s sounds like a violin and that’s this”, sort ofthing. But at least you can see a difference to then be able to go back to the SIEMtool. (P1)
The extent to which participants relied on the dashboard for the identification of a changein the traffic varied. For some participants, the sound served as an indicator of some change, thenature of which was unknown without use of the information presented visually in the SIEMdashboard: “I would hear something that didn’t sound right, and then look at the visuals tofigure out what it was” (P3). An example of this was participants using the SIEM dashboard toidentify the protocol to which a change in instrument related to: “luckily this is all here, becauseI will need to go – well I can recognise this sound in my ear, but I don’t know what protocol thatrelates to” (P1).
There were some difficulties experienced by participants in the identification of changes,caused by a discrepancy between what participants thought they had heard, and what theycould see on the screen: “I was actively thinking, right I’ve got to think, to see if my brainis going to register that as dipping, and then visually I am looking at this dipping. That wassaying no and this was saying yes” (P2). This difficulty, caused by a difference between whatwas perceived visually and aurally, was discussed in the context of the instruments representingprotocols by one participant: “there’s some instruments, I can’t really see what’s abnormal, Ijust hear that something sounds wrong, but I can’t really see” (P18).
Other participants appeared to be able to determine some information about the changein the traffic from the sound alone. The following is a description of the traffic, made by aparticipant completing the study task, in which the use of descriptions of the sound followed bydescriptions of their meaning in terms of the data suggests an understanding of the meaning ofthe sound directly:
... that’s the organ sound, so that’s SSH... and voices, so FTP of some description...that’s some more voices, and lots going on there. That’s FTP, there’s a lot of that[at the time of the beginning of the FTP brute force attack]. (P13)
A participant suggested that with further experience using the tool, they might be able tobetter identify changes in the traffic from the sound directly: “with a bit more time it would beintuitive and I would know what it was. But on my first go, I did need to check” (P13).
167

Participants described the rationale behind their decisions on whether the traffic they ob-served was anomalous. Indicators of traffic that could have been benign, but would merit furtherinvestigation, were described by participants as they arose:
I would definitely have a look to see what that Telnet traffic was doing, and why theFTP was from high port to high port. That in itself could be totally legit but it couldbe indicative of something. (P11)
Such descriptions of traffic that could be either anomalous or benign but would merit furtherinvestigation contributed evidence towards our observations on the way in which participantsdecided anomalous traffic. As we discussed in Section 8.4.3, these observations were importantin deciding our approach to the analysis of anomalous traffic deviations.
A participant highlighted the necessity for in-depth knowledge of a network and of what is“normal” for it, to inform decisions on whether traffic is anomalous or benign.
I would always want to investigate things like FTP and SSH that I noticed, justbecause – unless it’s a network I’m familiar with and I know that that happens atparticular times or from particular places, I would always consider that to be a bitsuspicious. (P5)
For participants to gain in-depth knowledge of the network presented in the study, and ofits “normal” state, would have been infeasible given the time constraints. There are possibleapproaches to improving the knowledge of the network through aspects of the study design,however, which we discuss in Section 9.3: the inclusion of network diagrams was suggested, forexample, “to tell you what your home network is and what you should be seeing from that pointof view” (P1). In the design of such adjustments to the study, care should be taken to avoidpresenting participants with an information overload.
Detecting anomalous traffic using sonification in the study was difficult for some participants:“the background noise and all the different trumpets and all that, I couldn’t get my head roundthat” (P6). Of the six participants who compared the relative ease of detection of anomaloustraffic and alerts using sonification, five felt that alerts had been easier to detect in the study:“I couldn’t really spot much apart from when the alerts came through it was a bit obvious” (P8).Conversely, one participant (P21) was able to detect fluctuations in the packet traffic duringthe sonification baseline training video, but was not able to detect the alerts initially.
The role of the sonification in helping with enabling the detection of alerts that had not beenspotted visually was explained: “I mean I heard things there and went ‘ok yes’ I mean I didn’tsee that alert come through, but I heard it, so I went ‘oh ok now I’ll have a look at the alert’”(P2). Some participants described the ability to identify the meaning of alert information usingthe sonification only (without having to check its meaning visually):
Quite quickly you could pick up what was a sev 1 and sev 2 so at certain points Iwas not even looking at the screen to clarify “oh yeah that’s a sev 2 come through,oh yeah that’s another sev 2 come through.” (P1)
For other participants, identifying the meaning of alert information using sonification inthe study was less straightforward: “listening to severity 1 and severity 2, for me they werequite close” (P2). One participant described an inability to identify any information, havingdetected that something had changed in the sound: “A lot of it, I had no idea what was actuallyhappening, just something was happening” (P10).
As shown, participants felt that the role of the sonification in their monitoring work in thestudy had been to inform them of some change in the traffic or alerts, prompting further inves-tigation into the meaning of those changes using the visuals in the SIEM dashboard. In general,
168

participants felt able to detect alerts using the sonification; fewer stated that they felt able todetect anomalous deviations in the traffic using the sonification. Participants felt able to distin-guish whether a change related to IDS-alert or packet-traffic information, but generally foundidentifying the meaning of traffic-related information more difficult that identifying informationabout alerts in this study.
Participants’ perceptions of their own abilities to detect and identify monitoring informationvaried. Some participants felt able to identify the severity of alerts directly from the sonification,without needing to consult the dashboard, while a smaller number were also able to identify someinformation about the traffic itself directly from the sonification. There may be a relationshipbetween musical experience and the ability of participants to identify information about thetraffic directly from the sonification: P11 and P13, for example, both of whom had played amusical instrument to a graded standard, were able to identify information in this way. Ourcollection of results did not allow us to produce any statistical evidence relating to this question,however.
Fatigue
When asked whether they felt they had experienced fatigue in the study, participants discussedfatigue in the context of using both the SIEM and the Sonification SIEM.
Participants expressed varying views on whether they experienced fatigue using the sonifi-cation. Some participants stated that they had found the sound fatiguing. It was suggested thatthis could be due to not having the time in the study to get used to using the sonification:
With the sound, I did find a little bit of fatigue as well, because there’s a lot goingon and you’re trying to associate each noise with each protocol, and that’s probablyme not having the time or experience to get used to it. (P7)
Some participants felt that while they had not experienced fatigue whilst using sonificationin this study, this may have been due to the short time for which the sonification had been used,and predicted that they might experience fatigue if using the sonification over longer periodsof time: “not for the length of this, but I think you possibly could if you were doing it in realtime” (P20). Other participants stated that they had not found the sonification fatiguing. Aparticipant suggested that while sonification might be fatiguing if used for a longer period oftime, this might be dependent on whether the type of music was one that the user would usuallychoose to listen to:
No, not really [fatiguing]. Maybe after 12 hours of it. I guess it depends what you’reused to listening to as well. Because if you usually listen to certain types of musicor freestyle jazz, then maybe people just don’t like that sound. But it’s not a problemfor me. (P22)
Participants also discussed fatigue in the context of using the SIEM dashboard and its visu-alizations, without sonification. According to some participants who completed the secondary-monitoring task in the SIEM condition, multitasking across two sets of visuals (such as thedashboard and the separate primary-task screen in this study) would be fatiguing over a longtime period:
If I had to multitask and do that non-sound monitoring at the same time, I thinkthat would be very fatiguing over a long period. So if I was having to type, whichtakes me a lot of effort, plus monitor the screen, I would definitely miss stuff. Overa short period, it was ok. (P21)
169

Another participant stated that even carrying out the primary-monitoring task in the SIEMcondition was visually fatiguing. This was attributed to it being the first time using this SIEMtool, and to the real-time nature of the dashboard — the speed at which the visualizationschanged:
The first one [primary-monitoring task in SIEM-only condition] I found very tiringactually, constantly watching the lines, and then obviously it’s the first time so you’retrying to work out what that means, but the physical act of watching those at speed.(P11)
Overall, participants expressed mixed views on whether they had experienced fatigue. Itappears likely that the experience of fatigue when using sonification in particular varies onan individual basis. We consolidate these findings and consider their implications for usingsonification in SOCs in Section 9.3.3.
9.2.3 Integrating Sonification into SOCs: Utility and Practicalities
Views were expressed on the potential utility of using sonification in SOCs, in response to thedirect question asked on this in the post-study interview: “Are there any scenarios in which youcan see a monitoring solution using sonification being useful in your SOC work?”. Participantsalso described the challenges that might be faced when using sonification in this environment.
Scenarios in which participants felt sonification could be useful in their SOC work
Participants discussed a number of different potential applications in which sonification couldbe beneficial to their work in SOCs. Some of these applications (multitasking, monitoring whilstaway from the SOC, threat hunting) related to the scenarios we derived from the initial inter-views with security practitioners (presented in Section 7.7).
Participants discussed the type of multitasking scenario represented in the study as anapplication in which sonification had the potential to be useful in their day-to-day SOC work.
The sound side of things is good. It is definitely good. For us, when you’re doingsomething else and that’s largely what we’re reliant on, when you’re monitoring andI’ve been in a SOC before where we’re monitoring 15 different customers, and youliterally cannot – you can sit there and monitor through some of one customer, andyou can catch up real-time for a while, and the something else will kick off and ifyou’ve got alerts going off in your ear, that’s an absolute god send because you cancatch that within – if you’re seeing something like a sev 1 or something like that.(P1)
The multitasking applications discussed extended beyond screen-based primary tasks toprimary tasks involving communications with others:
This would be really useful, because you have this nice music going on and then“oh, out of tune, start looking”. And actually, even if you’re talking to someone,you can hear that noise and everybody’s attention can go “ok something happened”.Straightaway cut the conversation and go back to work. (P3)
For use at times when the user is carrying out a task that involves moving away fromtheir desk to another location within the SOC, monitoring using sonification was highlighted aspotentially advantageous: “for when you’re walking away from the desk as well at quieter times,to be able to have something so that you can go ‘right actually’, because some of the times whenwe deal with other customers that involves stepping away from the desk as well” (P1).
170

Monitoring whilst away from the desk, physically outside of the SOC, was also highlightedas a potential application: “if I have to go and take an incident to another department, I canwalk over there, give them the incident, but still if something happens I can go ‘ok I need tobe back in a minute’” (P2). Monitoring whilst away from the SOC carrying out activities notdirectly related to work was also discussed as an application: “it would allow me to go ‘ok, Ineed a cup of coffee, but I’m still monitoring’. So I would just go, instead of having to go, ‘backin a sec’” (P2).
Night shifts were highlighted as a time at which it could be advantageous to use sonificationto enable security practitioners to shift their focus from monitoring quiet networks to othertasks:
On night shift or something like that, say if there isn’t a great deal going on, soyou could be doing personal admin or something like that, and if you’re meant tobe looking at the screen, and you look at the screen every ten minutes or whateverand nothing changes and you don’t see anything, then you could just end up focusingmore on doing the personal admin. Whereas with the music, it allows you to havethat freedom just to focus on the personal admin, and then if you hear something...(P3)
The potential utility of sonification on night shifts was also discussed in the context of thetiredness experienced by security practitioners on these shifts:
Especially on nights, because when you’re out of hours, your compos-mentis drops abit because of the fact your body clock is not used to it ... sometimes you may notnecessarily pick things up quite so quickly so to have something real-time, an audiocue is a very good idea. (P1)
Participants expressed conflicting views on the potential utility of sonification in retrospec-tive anomaly-detection applications such as threat hunting. Although not directly addressed asa study task, the viability of using sonification to quickly listen to an overview of past traffic,to hone in on anomalous-sounding parts of the traffic, was of interest to some participants, andan area for further investigation:
To be able to play a sample through it, as a sort of “I think there’s something inthere but I just can’t pick it out”, and see whether the sounds would help me pick outparticular points, almost as a very quick way of going through a very large amount oftraffic. Instead of having to go through it myself, I can play it through the SIEM withthe sounds, and that would then give me some points I could go “there’s somethingthat doesn’t sound right, I’ll zero in on that bit”. (P5)
The necessity for sonifications of past traffic to be playable at an increased speed in order tobe worthwhile in this application was highlighted: “one week’s worth of network traffic, condensethat into maybe half an hour of some kind of sound that you can play back ... because you don’twant to spend one week’s worth of time listening to one week’s worth of traffic, the managementis not going to buy into that sort of time to listen” (P17).
Other participants felt that sonification was unlikely to be a viable approach to threat hunt-ing, because of the huge variation in the methods by which security practitioners would carryout such activity: “how do you want to apply sonification on this real-time manual investigation,that’s the tricky part ... I think the first challenge will be, people look at PCAP files for differentpurposes” (P18). Collecting the views of participants, once they had used the sonification toolduring the study tasks, on its potential for application in their threat-hunting work was un-doubtedly useful. There is a need, however, for an actual assessment of the utility of sonification
171

in such tasks, and of the viability of detecting anomalies in a sped-up sonification of networktraffic, in order to fully understand the potential for sonification to be useful in this application.
The use of sonification for monitoring platform availability was suggested by a participantwho worked in a SOC that provided 24/7 monitoring of a customer organisation’s web services:“for monitoring the platform availability or website availability” (P18). This participant, aSOC manager, used a graphic showing the different roles in the SOC, and iterated through theroles considering the potential utility of sonification to them. Lastly, the possibility of usingsonification to enable blind people to work in SOCs was noted: “it is intriguing because it opensa horizon for a blind security analyst to be working in a SOC ” (P17).
In summary, while participants were divided in their views on the viability of using sonifi-cation for lower-level threat detection, a majority saw potential benefits to using sonificationof traffic and alerts when multitasking or away from the SOC. As a caveat to these potentialbenefits, however, a number of concerns were voiced around the practicality of using sonificationin SOCs. We present these challenges in the following section.
Challenges to integration
Some of the discussion around the potential challenges in using sonification in SOCs arosein response to the post-interview question: “Are there any scenarios in which you feel that amonitoring solution using sonification could be useful in your SOC work?”. Views on potentialchallenges to integration were also expressed by participants throughout the various stages ofthe study. Many of these challenges were touched on in the interviews presented in Chapter7. Our discussion of the challenges here supports those previous findings, and extends ourunderstanding of them.
A challenge highlighted by multiple participants was the potential for using sonification toobstruct the communications required between people working in the SOC:
We do have to communicate and talk, so having this ongoing all the time, yes okyou could just drop out, but what happens when your manager needs to get hold ofyou, and what happens when the fire alarm goes?. (P2)
This challenge extended to the need to speak with customers and providers: “we do haveto go and interact with the customer, and also our MSPs [managed service providers]” (P2). Itwas stated that wearing headphones might not be an appropriate method of using sonificationfor long time periods for this reason: “I couldn’t necessarily always wear headphones because Istill need to be able to talk to the guys next to me” (P5).
If used without headphones, however, participants felt that sonification could be distractingto those people working nearby: “where we work here, it’s quite a large open office shared by lotsof different companies, so I don’t think they would appreciate that” (P22). The distraction topeople nearby was related to the physical setup of SOCs. Participants stated that the proximityof their working spaces to those of others could cause difficulty: “it wouldn’t be effective in thatenvironment, for one because we are literally all next to each other, crammed in” (P2). As inthe interviews reported in Chapter 7, using a single earpiece to listen to the sonification wassuggested as a possible way of avoiding these problems with both headphones and speakers:
You can’t wear headphones the whole day, but perhaps there could be a more com-fortable solution like an earpiece or something that you would be able to wear, butyes it’s definitely an advancement I would like to see as a SOC analyst. (P1)
A number of participants felt that using the sonification for extended time periods would bechallenging for the user; this would be exacerbated by the long shifts that security practitionersfrequently work in SOCs: “we do 12-hour shifts, you couldn’t keep up with that for 12 hours”
172

(P1). The views of numerous participants on this topic, both in this study and in the interviewsreported in Chapter 7, suggest that sonification may be more practicable in short-term use casesthan for continuous use over long periods of time.
Participants also highlighted some challenges to the actual implementation of the sonificationto represent SOC monitoring information. Firstly, the large amount of traffic observed constantlyon the network, in particular for SOCs responsible for monitoring multiple networks: “it won’tjust be that, it will be that times 1000. It would be a bit impractical for that scale of network,because we do control a big network – it’s not small, it’s every device in the organisation” (P1).
Similarly, representing enough distinct information sonically to be useful for SOC moni-toring was noted as a challenge. One participant described the possible need to sonify moreprotocol information, and cited concerns about the resolution of such information that could berepresented sonically:
The number of protocols ... those could grow depending on what you are looking for,and you’ve got to grow that sound as well, and add new types of instrument in there,which challenges the less musical person like me to discern the type of instrument.(P17)
As well as the scale of traffic on the network, a participant noted that it would be difficultto represent using sonification the large number of devices used to monitor in the SOC:
We don’t just monitor one SIEM, we also monitor, probably on average, about sevenIPS managers, which manage about 800 IPSs total ... they would probably need eightdifferent audio tunes, plus our SIEM. (P5)
Challenges in sonifying the output of automated systems were described. The large number ofalerts produced by automated approaches, many of which are not associated with true maliciousactivity, could create a cacophony. A participant described the need for this information to berepresented, in case it represents malicious activity: “we have so many things that are false-positives that we don’t tune out just in case ... we constantly have red alerts, but we can’t turnaround and go “oh just tune them out”, because we need them” (P2).
There are also cases where alterations to, and inconsistencies in, network-monitoring setupscan mean that automated system output is incorrect (and does not constitute “necessary”false-positives, as above). For SOCs responsible for monitoring multiple networks remotely,for example, changes may be made to a network without informing the SOC, such that themonitoring information used by the SOC does not match the setup of the network. The effectthis would have on the accuracy of the monitoring information would impact that accuracy withwhich sonification could represent the activity on the network:
Misconfiguration from a local market happens often in such a big organisation, theymay change a firewall setting without informing us, and all of a sudden the amount ofevents decreases because we’re not receiving the firewall events. Or they put anothernew server behind a firewall, then the amount of traffic may increase because there’smore traffic towards those new servers ... it’s not always correct. So there’s a lot ofdependencies and different factors and variables that may impact the accuracy of thesonification, regardless of sonification or not. (P18)
The same participant discussed the difficulty of capturing new malicious traffic scenarios.Specifically, if security practitioners used sonification to monitor whilst away from the desk,traffic from new attack variants that did not match specific alerting signatures would not berepresented through alert sonification, and could be missed completely: “if the analysts are awayfrom the console and if there’s a new scenario that you don’t have a ringtone or something likethat mapped to that scenario, then they will miss it” (P18).
173

In summary, there are clear challenges that would be faced in trying to integrate sonificationinto SOCs. There is a need for sonification system designs to be adapted to the specific challengesof this environment, and for longitudinal studies in which sonification is used in operationalSOCs to analyse whether the benefits of using sonification outweigh the challenges it brings.
Perspectives on the learning curve
Participants varied in their views on the amount of learning needed to use sonification effectivelyfor network-security monitoring, relative to the learning other SOC tools had required.
Of the participants, five expressed the view that the sonification tool would take a long timeto learn. Consonance and dissonance were highlighted as aspects of the sound that would takeextra training. It was suggested that different levels of information would take different amountsof time to learn to understand from the sonification: “I think you could pick some basic thingsout really quick. I think it would probably take a long time to start to get good” (P11).
The time taken to learn to recognise a network baseline in the sonification was cited as afactor that would contribute to the time required to learn to use it effectively: “I imagine Iwould need a bit of time to get used to what a baseline would sound like, and then from that,would be able to identify it a bit more easily” (P3). This was linked to the time taken by securitypractitioners to learn the baseline for a new network in general:
I think as an analyst it’s quite difficult to pick up a baseline as quickly as what we’vedone now, you know it would take a few days normally to be able to start seeingthings. (P1)
Other participants stated that the amount of learning they felt they would require to usethe sonification tool in their day-to-day work was small, relative to other SOC tools they hadtrained to use: “It’s very easy to – compared to any other tool – you will learn and start shoutingout alerts and anomalies straight away ... there’s not much learning curve on this” (P4). It wasstated that SIEM tools generally take a long time to train to use: “at the end of the day, anySIEM tool has a long lot of time to be able to bring yourself up to speed with” (P1).
A musically experienced participant likened learning to use sonification to learning to playa piece of music by ear:
If I were to play something by ear, that would be not very good the first few times,and over years in my case of music practice, you learn to do that a lot better. And asyou listened to the sounds, you would pick them out better. So the more you listenedto the different sounds of whatever was in there, you would learn to pick them outbetter, rather than the first time where it’s a bit of a wall of noise with a few bits.(P11)
A participant with no musical training also expressed the view that they would eventuallybe able to learn to use the sonification effectively:
For the study itself, it’s a learning curve to differentiate the sound and instrumentsfor a non-musical person like me. So once you get to grips with it, yes you will startto differentiate the type of protocols associated with the type of instrument that wasbeing heard and transmitted over the wire. So that can become intuitive, especiallyfor the alarm system, for the IDS because it just popped up. (P17)
Participants discussed how their use of the sonification had progressed as they had learnedto use it, and become more accustomed to it, throughout the study:
174

Actually listening through it a second time, you are actually able to work out theconsonance with the different instruments, and it doesn’t sound quite so much mish-mash. I think now I know roughly what I’m looking at, and definitely picked up - Imean I missed that the first time round, but picked it up now, I think maybe becauseI’m more trained to listen to it. (P1)
The same participant felt that they might already be able to perform better at the end ofthe study, if it were repeated: “I think if I had another go now, I could probably do it betterand it would quite quickly progress I think” (P1). Some participants described their perceivedimprovement throughout the study tasks at understanding the baseline and thus deciding whatconstituted anomalous traffic:
The first two times I flagged anomalous traffic it’s because it’s different to what Iheard. The third time, your mind starts going “I’ve seen it before” quicker, so youestablish patterns quicker, I guess. (P16)
Approaches to learning to use sonification were discussed. It was suggested that learning touse sonification through experience might be more effective than long training sessions: “If youwere using it, you would learn by experience rather than training. But training gets you set up”(P5).
Based on these views of participants, the amount of learning required may vary betweenindividuals, and this should be taken into consideration when investigating the training required,and when devising training approaches for using sonification in SOCs.
9.2.4 Sonification Design Requirements and Suggestions
Participants made a number of suggestions in relation to sonification design. Many of theseextend our findings from Chapter 7 and consolidate the design requirements we derived in thatchapter. We refer to the requirements for configurability and playback features in particular,which were not included in the system designed for this study, and the need for which was againdiscussed by participants.
Configurability
A range of suggestions related to the “configurability” design requirement derived earlier in thisthesis (see Section 7.8.1). The need for users to be able to configure the sonification to meettheir needs and preferences was discussed:
If you left it down to the users to configure that would be the best option, but thenagain that would probably take a bit more training from a setup perspective. But onceyou’ve got it set up, you could almost have that as your profile and you could take itwherever you go kind of thing. It’s definitely useful, but you would want to be ableto configure it I think, definitely myself. (P1)
The idea that the sonification aesthetic should be configurable by the user was reiterated:“can you change the music at all? According to my taste?” (P4). One participant stated thatthey would probably prefer a subtler sonification aesthetic, for example:
Something like isotonics, or binaural beat sort of level, where it’s a subtle, staticnoise, and you will have a deviation from that static noise if one of your rule set iscoming out ... I just think having an orchestral noise, number one isn’t everybody’staste – I mean, I like it personally, but I know people that would hate it. (P2)
175

The need for users to be able to configure the network settings was highlighted, in line withthe activity they carry out in their current SOC work. A participant described how the abilityfor users to feed in details about the network configuration would help the sonification approachto fit in with the network-monitoring approaches they used in their SOC work:
Our network is all NAT [network address translation — a method of mapping inthe IP address space]. So we don’t have external IPs within the network that I’mmonitoring. So I would need to be able to carve out my own 192 range and assigncertain IPs to being external, so it would have to have a configurable database in thebackground of which IPs are internal and which are external. (P5)
Configuring the protocols and applications monitored, such that a small and distinguishablesubset of instruments could be used to represent those protocols of interest, was suggested as auseful feature (one that we developed approaches to enabling in Chapter 7, and the reiterationof which here strengthens the case for developing sonification solutions with such features): “itmay be that you to look at a number of protocols that you are actually interested in, and definethese disparate, distinct musical instruments that you can really tell apart” (P17). This couldbe an approach to addressing challenges relating to sonifying large amounts of information, byselecting a subset of elements to represent sonically.
A need for users to be able to configure the alerts fed into the SIEM was also discussed,to enable users to “only feed in the ones you’re particularly interested in” (P5). A participantlinked the need for configurability of the sonification to the fact that the dashboards used inSOCs are usually configurable by their users:
From our point of view the dashboards that we have usually are pretty much config-urable by ourselves as analysts. So if there’s something going on that day and wewant a certain set of data broadcast up onto the screen, and I think almost as I saidbefore the audio stuff is good, but I think every person is different, and we’ve goteverybody from, I mean the next person you’ve got coming in is 20 years old, wehave people on shift who are 60. Obviously their tolerances for different sounds anddifferent instruments and things are all going to be very different. So I think it wouldbe useful to be able to have either different profiles or different sounds. (P1)
Changes to the sonification design
A number of the design suggestions made by participants related to the need to reduce the overallbackground noise produced by the sonification, and ensure that aspects of interest were conveyedappropriately by the sound. A general need to reduce the noise was highlighted: “I would preferthe baseline to be clipped so that there was less noise coming through the headphones, or lesscommotion, so something smoother, something more harmonious” (P1). A suggested approachto reducing the overall level of noise was to use thresholds — rather than representing a sampleof all traffic sonically, to represent only the traffic that had exceeded certain set thresholds (athreshold amount of traffic for a particular protocol or application, for example): “to be able toset your own threshold before you heard the piano riff for instance, or your threshold before youheard this, for the baseline of your network, so that it didn’t quite trigger so much” (P1).
Another suggestion for reducing the noise was to play sounds only when certain anomalousstates were reached: “so you’ve reached the point of – the traffic is really really high, so they turnaround and go ok brilliant now it will make a noise to say that it has gone a little bit higher orlower” (P2). This suggestion may be worth investigating, although such an approach is closer tothe representation of alert conditions, rather than representations of the network-packet traffic,since it displays sound only when defined states have been reached.
The potential to use volume to highlight changes of interest, to help users to distinguishthem, was discussed. One participant suggested that users could assign their own volumes
176

to particular instruments (“being able to change the volume of things as well, so that someinstruments are louder than others” (P5)), in order to ensure that the instruments representingparticular protocols could be distinguished:
I could quieten everything else down, so it would still be there and I would still maybehear if it got a bit dissonant, but it wouldn’t be front and centre. The ones [protocols]that I’m actually interested in would be that little bit louder. Attract my attention abit more and help me pick it out. (P5)
Along the same lines, it may be appropriate to use volume to highlight information thatis pertinent based on the changing state of traffic, using some pre-parsing to identify trafficof interest such that it can be highlighted by the sonification. A participant suggested that incases where a particular protocol was observed on the network for the first time that day, forexample, the volume at which it was represented should be increased: “the announcement thata new protocol had appeared may be more prominent than other sound already playing, maybe,maybe not. The first seen one, does it need to be a little louder than the other one? For thatday, maybe” (P17).
Suggestions were made around improving the instrumentation used in the sonification. Itwas noted that some of the instruments naturally sounded more alarming than others: “theorgan almost always sounds alarming. Even when it’s normal, I’m like ‘what’s that’ (P19). Thesame participant suggested that intuitive associations between instruments and protocols couldbe explored — that more concerning protocols or applications could be represented by morealarming-sounding instruments, for example.
For some participants, the instruments were too similar in sound, and there was a challengein distinguishing between them. It was highlighted that the electronic instruments used (MIDIinstruments) were less easy to distinguish, or sounded less realistic, than real musical instru-ments: “the violin and sometimes the piano, ... when it’s synthesised sound, for me it’s too close”(P17). In improving the sonification design, the use of better-quality, recorded instruments is akey area for investigation.
As well as the network traffic, design suggestions were made regarding the sonification ofIDS alerts. To ensure that alerts attracted an appropriate level of attention, “they could maybebe a bit louder, with a bit more urgency” (P22). An approach to presenting the user with furthersonic information about the IDS alerts by varying the pitch levels at which different severitiesof alert were played was suggested: “introduce some kind of pitch level maybe, I don’t know,to introduce more severities. That allows the analyst to take more action on it” (P17). As weexplained in Section 8.2.2, we deliberately kept the alert-sonification approach simple for thisstudy. We varied the pitch such that severity 1 alerts were represented at a higher pitch thanseverity 2 alerts. This suggestion supports further investigation into the representation of morealert severities, increasing the amount of alerting information displayed sonically.
Sonification playback and filtering
As in the initial interviews with security practitioners, reported in Chapter 7, participantsdiscussed the requirements for playback of previously heard sonification, with alteration of thespeed at which it plays: “maybe you need a way of being able to replay things from the last tenminutes, or at least a compressed version of the last ten minutes” (P1).
The ability to filter to listen to certain parts of the sonified data was again highlighted aspotentially advantageous. This included the ability to filter by instrument: “being able to maybefilter out some of the sound, and say that I’m not interested in particular types of instruments,filter out some of the instruments” (P5). The need to exercise caution when designing filteringapproaches, to ensure that the baseline against which anomalies could be heard was still present,was highlighted in the context of IP addresses: “I don’t know about filtering IP because it’s almosthaving the background IPs is what makes some of the other stuff stand out” (P5).
177

Both playback and filtering were explored in the design developments (Section 7.8) basedon existing sonification design requirements. The discussion of these factors by security practi-tioners supports and further details these requirements, as these developments were not withinscope for presentation as part of this study.
9.2.5 Study Design and Realisticness
We explore the views expressed by participants on the design of various elements of the study,including the training stage, for example, and on the realisticness of the tools, tasks and network-monitoring information used in the study. Understanding how realistic the study was in com-parison to actual SOC tools and working practice is important in enabling us to qualify thefindings of this study, and to explore their relevance to real-world SOCs.
Realisticness of the study setup
Participants’ views on the realisticness of the SIEM tool presented varied. There was a clearlink between the views of participants on this subject, and the types of monitoring setups theywere accustomed to using in their SOC work.
Many participants stated that they would usually use tools that had a greater focus onrepresenting alerts, and less on visualizing traffic, than the SIEM dashboard we presented. Forsome participants, the SIEM we presented was not realistic because of this: “we wouldn’t haveanything feeding through really live like that, apart from when the alerts obviously come up tosay ‘this has come through, go and investigate’” (P8). In their comment, this participant notedthat the real-time, “live” feed of information displayed in the SIEM was not what they wouldusually see in their monitoring tools, and this was a point made by a number of participants. Thisappeared to vary between participants, with others stating that they were accustomed to suchlive information feeds: “if you look at Arcsight you always get a constant feed of information, sothere’s no difference there” (P22). This difference was likely caused by variations in the typesof tools used across SOCs, and across practitioners within SOCs.
The display of alerts itself was described as being close to what some participants werefamiliar with using: “the alerts section, certainly, that’s pretty much how we display our alerts,it’s IP, source, destination and time series and a bit about it. It’s pretty much spot on” (P5). Asfor the visualizations of traffic, whilst many practitioners did not usually use advanced securityvisualizations in real time in their SOC work, others were more accustomed to using this typeof approach:
Visualization and hunting and stuff, and you may bring something more that we’renot doing but at least the short clip I just went through [SIEM training video] yesexactly what we’re doing daily. And much more than that. (P18)
It was explained by some participants that security visualizations of low-level views of thetraffic (rather than of alerts) were used for investigation around alerts in the SOCs in whichthey worked. In this case, real-time monitoring was carried out using an alert feed, and packetcaptures or visualizations would be opened by the practitioner in cases where the traffic aroundan alert required investigation: “it’s just alerting that comes, there’s no graphs or anything. Ifwe want to do a further investigation, then we’ve got tools that do the graphs and stuff ” (P9).This ability to choose to investigate data further was missing from our study, since we usedvideos that could not be interacted with, to investigate real-time monitoring only: “being ableto pause it and drill into each one [was missing], but it’s a simulation here anyway” (P22).
Comparisons to interacting with SIEMs in real-world SOCs also extended to the ability tostop, and go back and look at past information — another aspect that was missing due toour use of videos: “I think in reality you would look at that and go stop/pause, and look at
178

something again” (P11). This contributed to participants’ comments on the SIEM tool beingtoo “real-time”: “I was not able to really perceive what was happening by looking at it before thenext thing happened” (P10).
Another factor that was highlighted as reducing the realisticness of the SIEM was the timespan represented. Participants generally used tools in which information stayed represented onthe screen for longer, and felt that this usually made their monitoring work less “intense interms of time” (P4): “we wouldn’t necessarily see things moving quite so fast like that. Wewould generally tend to have a much wider scale, like say for instance an hour’s worth of stuff ”(P1).
The realisticness of specific plots in the SIEM was discussed. For some participants, the alertcounts plot was the closest to their usual real-time monitoring method:
Our mainstay of watching on a daily basis will be this mainly [indicates the alertcounts plot], the individual signatures that trigger, and then obviously when there’snot too much coming in, then we can do historicals and we can start looking at thetraffic. (P1)
The utility of the parallel coordinates plot was questioned; particularly given that due to thevideos used in the study, it could not be drilled into for further investigation of the IP addressesand ports: “we do see it, but it’s only got so much usability when you can’t see in-depth enough”(P1).
Most participants expressed the view that using a setup with multiple screens to carry outmultiple tasks was representative of the type of setup they would use in the SOC: the reportednumber of screens participants usually worked with in the SOC ranged between two and eight.
Participants commented on the realisticness of baselining network traffic, as our approachto representing the network traffic attempted to use a baseline of commonly seen IP addressesand ports. We presented participants with a network baseline dataset with the aim of enablingthem to recognise the network baseline and deviations from it. For some participants, the idea ofknowing a network baseline was not realistic: “we never know a baseline - I would love somebodyto give me a baseline” (P5). Others felt that trying to understand a baseline for the networkbeing monitored was an important part of their work:
One of the first things I was told when I went on the early training courses, the keything that the instructor was very keen to get over was, know what normal looks like.So that is important ... it comes with experience. (P19)
A participant highlighted the need to have more knowledge of the network setup in reality, inorder to contextualise events and make decisions: “as an analyst we would have to delve in andwe would make ourselves familiar with the IP ranges that we are working with, so anything thatappeared out of those ranges, we could say” (P1). The same participant explained how furtherknowledge of the network setup and normal activity would have been required to identify thedetails of the FTP brute-force attack in Dataset 2 :
To know that it was FTP brute force, first of all you would have to know that youhad an FTP server in your network, and then you would have to see the number oflogins that would be expected, and the escalation of how many would be consideredas a brute force as such. (P1)
In summary, the views of different participants, working in different SOCs, on the realistic-ness of the study setup compared to the setups used in SOCs varied. In general, the displayof alerting information was similar to that used across SOCs, while the display of real-timepacket-traffic visualizations was less widely used.
179

Realisticness of the study tasks
We asked participants for their views on how realistic the tasks carried out in the study were,compared to the tasks they carried out in their SOC work. In general, participants felt thatmonitoring as a primary task was less realistic than multitasking. Some (in particular, some ofthe Level 1 Security Analysts interviewed) were required to monitor as a primary task (i.e., tofocus solely on monitoring): “primary-task monitoring, yes, I do that every day, that is prettymuch the meat and potatoes of what I do” (P2).
Others stated that monitoring as a primary task was not something they would do in theirday-to-day SOC work: “you could be monitoring something while raising a ticket for somethingyou’ve seen, so you would always be doing – you’re never just looking at the screen solidly”(P20). A majority of participants (14) stated that their SOC work required them to multitaskwhilst monitoring, although the nature of this multitasking (the primary tasks carried out, forexample) varied.
We have the SIEM running in the background in our everyday jobs, so we are mon-itoring that all the time. And obviously doing other work so yes it’s very similar.Different stuff [primary task] to that but it’s very similar. (P6)
The types of other tasks participants described carrying out whilst monitoring includedmanaging multiple email inboxes with large numbers of emails (“they have a SOC functionalmailbox which is around 4000 emails per month, which is around 130 emails a day” (P18)),raising tickets for security events, investigating events identified from the SIEM, and commu-nicating with customers or colleagues. The type of primary task being carried out could affectthe frequency with which practitioners check back to activity in the SIEM:
If we’re investigating something we’ve identified from the SIEM, we probably won’tcheck back to the SIEM while we’re still investigating that. But if we’re just writingan email or something like that, something that isn’t related, then we would probablycheck that more often. (P3)
Some felt that rather than multitask, their SOC work required them to prioritise tasks: “it’smore like prioritising. So an alert comes in, that’s your priority. There are no alerts coming in,go back to your task” (P7). A number of participants described their multitasking in the SOCas being different temporally to that in the study — in particular, less time-pressured:
We would be trying to monitor and do other things, but it’s not as real-time, so it’snot as time-sensitive. If you miss something there [in the study SIEM dashboard] andyour attention is neglected for ten seconds, it’s gone, and it’s like ‘I can’t rememberwhere I was now’, there’s even more stimulus. (P10)
Some participants noted that, if working in an operational SOC, they would have stoppedmultitasking at the point when they observed anomalous traffic or alerts:
I probably would have dropped that task [the primary task] and concentrated on this[monitoring the SIEM] at that point. At the point where there were a few discordantsounds and then there were several alerts in a row. I think that would be enough tosay “drop what you’re doing”. (P19)
These results show that multitasking was considered a realistic part of SOC work, but maybe less time-pressured in reality. The primary-task monitoring was considered less realistic ingeneral, but was a task carried out by some Level 1 Security Analysts.
180

Training session
Participants expressed views on the strengths and limitations of the training session held at thebeginning of the study, and made suggestions for its improvement.
In general, participants felt that the training session had helped them to use the SIEM andthe Sonification SIEM, but that ideally the training session would have been longer, withmore time available to become accustomed to using the two new tools: “in an ideal world youdo need longer for the training. But it was enough to be able to get a feel and associate things”(P1). A need to have the time to memorise the sounds used as part of learning to use the toolswas noted: “if I sat down and I learned all the different noises, instead of it being what time wehad today, then I would know better probably” (P2).
The short training time was a limitation, but was necessary in order to create a study thatcould be carried out within an hour with each participant. Aside from the extra time needed totrain to learn the tools, suggestions for improving the training session related to helping usersto distinguish particular sounds from the sonified display as a whole. This included allowingparticipants to replay the instruments until they were accustomed to the sound of each: “to giveeveryone a way to play the different instruments a couple of times, to help tune into what theysound like” (P5).
Another participant suggested that building up the sounds gradually might be an easier wayof eventually learning to distinguish its components: rather than introducing each individualcomponent (e.g., an individual instrument) and then immediately playing them all together, anintermediate stage could demonstrate smaller combinations of sound components (combinationsof instruments, for example) to enable participants to learn to distinguish the various sounds.It was suggested that this would be a beneficial approach to sonification training for real-worlduse by security practitioners:
It might almost be for me personally worth being able to build up on those sounds,to separate them, because for me at the moment it’s all one big mash, together ... Tobe able to build up each individual sound would be quite helpful, but then I supposewhen you’re just doing a basic study, it’s quite hard to open that out probably, but itwould be useful for training, to actually do the job. (P1)
These suggestions can be leveraged to increase the effectiveness of sonification training infuture studies, and to design training approaches for the use of such systems.
Challenges relating to the study design noted by participants
A key challenge in the study design, highlighted by a number of participants, was the time-pressure — the fact that a large amount of new information and tooling was introduced in ashort space of time:
I’m feeling slightly sort of, stressed, a little bit. It’s not so much the jumping fromactivity to activity, it’s the during the little samples, having a completely new tooland having it thrown at you means there is a lot of stuff for you to process, which isall new. (P5)
This time pressure was a facet of the time constraints associated with running studies withSOC practitioners, and supports the need for a longitudinal study run over a longer period oftime.
For one participant, the nature of the primary task setup (the use of a MacBook in particular)caused difficulty: “I couldn’t do any of that whilst that was going on, although I think also I’mnot used to using a Mac, I’m used to Linux” (P19). Some participants described the challengeof filling in the SUS usability questionnaire. In particular, two participants noted that it was
181

difficult to answer the SUS questionnaire question: “I think that I would like to use this systemfrequently” having experienced using the SIEM and the Sonification SIEM only for thelength of the study. These participants stated that they would need to use the systems over alonger period of time to give a confident answer to this question: “I’ll have to disagree, becauseI think if I had to listen to it for a normal day shift, then I could give you a better answer aboutwhether I would do that over a long term” (P21). These are all challenges that can be takeninto consideration when designing future studies on this topic.
9.3 Discussion
We consolidate our findings in this study. In Section 9.3.1, we assess the hypotheses describedin Section 8.3, using the results presented in Section 9.1. We also compare the results relatingto network-traffic awareness across tasks and tools. We reflect on the design of the study,identifying limitations and approaches to improving the design of such studies in the future, inSection 9.3.2. Section 9.3.3 explores the findings on the integration of sonification into SOCs:its potential utility, practicality, and the design requirements for suitable systems. We scope thefindings of the study in light of the limitations identified and the comments of participants onthe realisticness of the study setup compared with their SOC monitoring practice.
9.3.1 Hypotheses and the Performance of Participants in the Study
We reflect on the results presented in Section 9.1 in the context of the study hypotheses, pre-sented in Section 8.3, assessing whether each hypothesis was proved true by the results obtained.We qualify the relevance of these findings by considering the study scope and realisticness inSection 9.3.3.
Hypothesis A: participants will perform better at monitoring for network-attacktraffic as a primary task when using the Sonification SIEM than when using theSIEM
1. Detection accuracy. Table 9.6 shows that the overall recall rate for participants primary-task monitoring using the SIEM in the detection of the FTP brute-force attack trafficor alerts (1.0) was equal to that of participants using the Sonification SIEM (1.0).Therefore, RAT (SIEM) = RAT (Son) and we reject Hypothesis A1.
2. Detection efficiency. The t-test presented in Table 9.7 shows that the mean time takento detect the attack by participants primary-task monitoring using the SIEM was notsignificantly different to that taken by participants using the Sonification SIEM. Wetherefore reject Hypothesis A2.
3. Identification accuracy. As shown in Table 9.9, of the five participants who detected theattack traffic whilst monitoring the SIEM as a primary task, three correctly identified thetraffic as a continuously high level of FTP (identification rate 0.6). Of the three who de-tected it using the Sonification SIEM, zero correctly identified the traffic (identificationrate 0). Therefore, IAT (SIEM) > IAT (Son) and we reject Hypothesis A3.
When monitoring for network-attack traffic as a primary task, therefore, participants didnot perform better when using the Sonification SIEM than the SIEM in terms of eitherdetection accuracy, detection efficiency, or identification accuracy.
182

Hypothesis B: participants will perform better at monitoring for alerts as a primarytask when using the Sonification SIEM than when using the SIEM
1. Detection accuracy. Table 9.10 shows that the mean alert-detection F-score across bothdatasets for participants monitoring as a primary task using the Sonification SIEM (1.0)was slightly higher than that using the SIEM (0.95). Therefore, FAL(SIEM) < FAL(Son)and we accept Hypothesis B1.
2. Detection efficiency. The t-test presented in Table 9.13 shows that participants moni-toring as a primary task using the Sonification SIEM detected alerts in a significantlyfaster mean time than those using the SIEM. Therefore, ∆tAL(SIEM) < ∆tAL(Son)and we accept Hypothesis B2.
3. Identification accuracy. Table 9.10 shows that the mean identification rate acrossboth datasets for participants monitoring as a primary task using the SIEM (1.0) wasslightly higher than that using the Sonification SIEM (0.95). Therefore, IAL(SIEM) >IAL(Son) and we reject Hypothesis B3.
When monitoring as a primary task, participants performed better in the detection of alerts(both accuracy and efficiency) when using the Sonification SIEM than the SIEM, but usingthe Sonification SIEM did not improve the accuracy of participants in identifying those alertsdetected.
Hypothesis C: participants will perform better at monitoring for network-attacktraffic as a non-primary task when using the Sonification SIEM than when usingthe SIEM
1. Detection accuracy. Table 9.6 shows that the overall recall rate for participants mon-itoring as a non-primary task using the SIEM in the detection of the FTP brute-forceattack traffic or alerts (1.0) was equal to that of participants using the SonificationSIEM (1.0). Therefore, RAT (SIEM) = RAT (Son) and we reject Hypothesis C1.
2. Detection efficiency. The t-test presented in Table 9.8 shows that participants mon-itoring as a non-primary task using the Sonification SIEM detected the attack in asignificantly faster mean time than those using the SIEM. Therefore, ∆tAT (SIEM) <∆tAT (Son) and we accept Hypothesis C2.
3. Identification accuracy. As shown in Table 9.9, of the three participants who detectedthe attack traffic whilst monitoring the SIEM as a non-primary task, one correctly iden-tified the traffic as a continuously high level of FTP (identification rate 0.33). Of thefour who detected it using the Sonification SIEM, three correctly identified the traffic(identification rate 0.75). Therefore, IAT (SIEM) < IAT (Son) and we accept HypothesisC3.
When monitoring as a non-primary task, there was no difference in the accuracy of network-attack detection between participants using the SIEM and the Sonification SIEM (par-ticipants achieved perfect recall of 1.0 using both tools). Participants did, however, detectnetwork-attack traffic significantly more efficiently, and identify it more accurately, when usingthe Sonification SIEM than the SIEM.
Hypothesis D: participants will perform better at monitoring for alerts as a non-primary task when using the Sonification SIEM than when using the SIEM
1. Detection accuracy. Table 9.10 shows that the mean alert-detection F-score across bothdatasets for participants monitoring as a non-primary task using the Sonification SIEM
183

(1.0) was slightly higher than that using the SIEM (0.97). Therefore, FAL(SIEM) <FAL(Son) and we accept Hypothesis D1.
2. Detection efficiency. The t-test presented in Table 9.14 shows that participants monitor-ing as a non-primary task using the Sonification SIEM detected alerts in a significantlyfaster mean time than those using the SIEM. Therefore, ∆tAL(SIEM) < ∆tAL(Son)and we accept Hypothesis D2.
3. Identification accuracy. Table 9.10 shows that the mean identification rate across bothdatasets for participants monitoring as a non-primary task using the SIEM (1.0) wasslightly higher than that using the Sonification SIEM (0.97). Therefore, IAL(SIEM) >IAL(Son) and we reject Hypothesis D3.
Similarly to when monitoring for alerts as a primary task, when monitoring as a non-primarytask, participants performed better in the detection of alerts (both accuracy and efficiency) whenusing the Sonification SIEM than the SIEM, but using the Sonification SIEM did notimprove the accuracy of participants in identifying those alerts detected.
Hypothesis E: a participant’s level of musical experience will not affect their mon-itoring performance in the study
1. Monitoring for network-attack traffic.
a Detection. As shown in Table 9.19, there was no significant difference in the meantimes taken by participants with and without musical experience to detect the FTPbrute-force attack when using the Sonification SIEM. There was no differencein the detection recall achieved by the two populations (both were 1.0). Therefore,aAT (mus) = aAT (nonmus) and eAT (mus) = eAT (nonmus), and we accept Hy-pothesis E1a.
b Identification. There was a difference between the identification rates of the twopopulations: 0 for participants without musical experience, and 1.0 for participantswith musical experience (although the sample size was very small: three participantsfell into each population of those who had detected the attack traffic using the Soni-fication SIEM). Therefore iAT (mus) > iAT (nonmus), and we reject HypothesisE1b.
2. Monitoring for alerts.
a Detection. As shown in Table 9.20, there was no significant difference in the meantimes taken by participants with and without musical experience to detect alertswhen using the Sonification SIEM. There was no difference in the detection F-scores achieved by the two populations (both were 1.0). Therefore, aAL(mus) =aAL(nonmus) and eAL(mus) = eAL(nonmus), and we accept Hypothesis E2a.
b Identification. There was a difference between the identification rates of the twopopulations: 0.95 for participants without musical experience, and 0.88 for partic-ipants with musical experience. Therefore iAL(mus) < iAL(nonmus) (i.e., partic-ipants without musical experience performed better in the identification of alertsusing the Sonification SIEM in this study), and we reject Hypothesis E2b.
In summary, there was no significant difference in the accuracy and efficiency of participantswith and without musical experience in detecting either network-attack traffic or alerts using theSonification SIEM. Participants with musical experience were more accurate at identifying
184

network-attack traffic than those without (although, as noted above, the population sizes inthis comparison were very small). Contrary to our predictions, participants without musicalexperience were slightly more accurate at identifying alerts than those with musical experience.We noted in Section 9.2.2 that some of the participants with higher levels of musical training(P11, P13) appeared able to identify anomalous traffic deviations using the sound, withoutneeding to consult the dashboard, and this suggests that musically experienced participantsmay require less training to understand traffic information represented sonically.
Network-traffic awareness: detection and identification of anomalous traffic devia-tions
We explore the results presented in Section 9.1.4 relating to network-traffic awareness. Table9.17 shows that the mean level of precision in the detection of anomalous network traffic washigh for participants using the SIEM in both tasks (0.97 in Study Task 1 and 1.0 in Study Task2 ), and using the Sonification SIEM in Study Task 1 (1.0). The high precision shows thatwhen participants stated “anomalous traffic” throughout these tasks, it generally correspondedto an anomalous traffic deviation in the dataset (according to our assumptions, as detailed inSection 8.4.3). For participants using the Sonification SIEM in Study Task 2, whilst multi-tasking, the level of precision was lower, although still reasonably high (0.86). This may suggestthat participants were somewhat misled by the sound, believing that they had heard changesrepresenting anomalous traffic at times when there was no anomalous traffic in the dataset. Itis possible that the need to multitask prevented confirmation of the anomalies visually, whichmight have led to the lower precision using the Sonification SIEM in Study Task 2 than inStudy Task 1. This is an area that requires further investigation.
True-positive detections of anomalous traffic deviations were made more efficiently by par-ticipants using the Sonification SIEM than the SIEM in both Study Task 1 and Study Task2, as Table 9.18 shows. This suggests that on average participants were more quickly madeaware of anomalous deviations in the traffic when using the Sonification SIEM than whenusing the SIEM, both when multitasking and when monitoring as a primary task.
As shown in Table 9.17, the highest identification rates for correctly detected anomaloustraffic were achieved by participants using the Sonification SIEM in Study Task 2, and usingthe SIEM in Study Task 1 (the proportions of correctly detected traffic that was also correctlyidentified were 0.89 and 0.88 respectively). The correct identification rates by participants usingthe Sonification SIEM in Study Task 1 and the SIEM in Study Task 2 were considerably lower(0.41 and 0.48 respectively). In these cases, a large proportion of the correctly detected trafficwas unidentified by participants (no identifying information was included in their response).
Some incorrect identifications were made; amongst the most common was an identificationof SSH traffic as Telnet. This may be accounted for by the use of colour in the dashboard: bothSSH and Telnet were represented in purple, and while the shades were different, this may havecaused some confusion. This incorrect identification suggests an identification performed usingthe visual display (since it is likely to have been caused by the similarity of these two colours);there were indications of other participants making identifications using the sound itself. P11and P13, for example, frequently described the instrument and then its meaning in terms ofthe data when making identifications: “organ, so therefore SSH, and voices so FTP of somedescription” (P13). In future studies, making a quantified assessment of the methods by whichusers make their identifications of anomalous traffic (using visuals or sound) will be importantto understanding the interplay between the use of sonification and visualization.
In Table 9.16, we presented the types of anomalous traffic identified by participants. FTPand SSH traffic (or the corresponding instruments: voice and organ respectively) were the de-viations most frequently described by participants. While dissonant sound was also describedby a number of participants, there was much less identification of this deviation. This may in-dicate that participants were less confident about identifying dissonant sound (a theory that is
185

supported by the comment of P17: “the consonance and dissonance, they will take more train-ing, because I couldn’t spot any of those, whether there’s normal traffic pattern or not normaltraffic pattern”) and as such we posit that users may require more training to use sonificationmappings involving consonance and dissonance than to use mappings involving instruments.
9.3.2 Study Design: Limitations and Lessons Learned
There were a number of limitations in our study design, which we explore in this section, andbased on which we suggest approaches to designing more realistic and effective studies in thisspace.
Study structure and process
There is a potential limitation with the study structure: the comparisons between the primary-and secondary-task monitoring might be biased by the fact that the primary-task monitoring wasalways carried out first. This could affect performance by enabling participants to become moreaccustomed to the study processes by the time they participate in the secondary-monitoringtask. We judged that presenting the primary-task monitoring before secondary-task monitoringwas necessary since the secondary-task monitoring was more complicated (more tasks needed tobe completed) and the primary-task monitoring could prepare participants for the secondary-task monitoring to some extent.
The biasing effect should have been minimised by the fact that the same tool was not usedfor the two tasks by any participant: all participants used one of the two tools in the firststudy task, and the other tool in the second. Whilst they may have become accustomed to theprocesses of the study, and monitoring in general, therefore, participants would not have becomeaccustomed to using either of the tools, and would not therefore have carried this experiencefrom the primary- to the secondary-task monitoring. Furthermore, we did not quantitativelycompare the performance of participants across the two tasks, but compared performance usingeach tool in Study Task 1, and then separately compared performance using each tool in StudyTask 2.
Another option would have been to train participants in both primary- and secondary-taskmonitoring first using practice datasets, and then to randomise the order in which the two taskswere presented in the study. This may have improved the reliability of the results, but wouldhave extended the time required to run the study to an impractical length.
In the analysis of Study Task 2, we did not assess the effect of using either tool to monitor,on the performance of participants in the primary shell-based task. Making this assessment ofthe effect of monitoring on the separate primary task would have required an initial assessmentof the performance of each participant completing the primary task only (without monitoring),as in previous studies into the use of sonification for monitoring as a non-primary task [105].Again, our decision not to include this assessment was based on the time constraints of thestudy.
Furthermore, we aimed to capture as closely as possible the actual multitasking methods ofthe practitioners in their SOC work, and were therefore not prescriptive about how to multitask(how much attention to pay to each display). As some participants noted, in their real SOCmonitoring work, at the point where multiple alerts or traffic anomalies were observed, theywould have stopped trying to complete the separate primary task, and focused on the monitoringonly. This was reflected by the multitasking approach of some participants in the study, as somedid pause their primary-task work at key monitoring points, in order to focus on the dashboardfor a time. Given that participants were not given strict instructions on their completion ofthe primary task, it would not have been meaningful to assess the effect of the monitoringon it. Rather, we explored how having that primary-task distraction affected the monitoringperformance, and compared this across tools.
186

Given the described effects of time constraints on our study design decisions, which mayhave introduced certain limitations or prevented the exploration of key questions relating to theutility of sonification to SOCs, it is clear that this study must be complemented by longitudinalstudies, or studies that involve the use of sonification in operational SOCs.
Study setup
We took measures based on our findings in Chapter 7, and on relevant background information,to ensure that the study setup (the tools, network datasets and the monitoring tasks we focusedon) was as realistic as possible within practical and time constraints. The interviews presentedin Section 9.2.5 showed that there were limitations to this, however.
A number of aspects of the SIEM design we presented were cited as being unrealistic byparticipants. The SIEM was used for real-time monitoring only in this study and events observedcould not be returned to and investigated, in accordance with our study aims to explore real-time monitoring capabilities, and due to the fact that we used pre-recorded videos. In reality,participants noted that their real-time monitoring work using a SIEM would be supplementedby further investigation following the initial recognition of events, and that this was an aspect ofmonitoring using a SIEM that was missing from our study. We learned that assessing real-timeattack detection is difficult, as this would usually involve investigation after the initial detectionof a potential security event. As described in Section 8.4.3, we assessed whether participantswere aware that there were anomalous network events at the time of the attack, but could notcapture their decisions on whether the events actually constituted an attack.
The observations made by participants on the realisticness of the information included in theSIEM varied. While the inclusion of traffic visualizations was not realistic in some SOCs, whoused streams of alerts only as the basis for real-time monitoring, for example, other participantswere more accustomed to using these approaches. We designed the SIEM tool based on existingcommercial SIEM dashboards (as shown in Section 8.2.1). It was suggested, however, thatSOCs do not always use the types of visualization-based dashboard produced by SIEM vendorsin reality (P18). The types of tools that practitioners are accustomed to using may vary betweenSOCs, and it is important to take this into account in the design of solutions for SOCs, and ofSOC-related studies.
It is clear that the time span presented in our SIEM was too short, and that practitionersare more accustomed to displays that show network information moving at slower rates (eventsremaining on the screen for an hour, for example). This information can be taken forward tofuture studies, and we discuss the implications of this limitation for the relevance of our findingsin Section 9.3.3.
In real-world SOC monitoring tasks, practitioners would have a more in-depth knowledgeof the network being monitored than we presented in this study. This may have had an impacton the ability of participants to make decisions on network events. This could be improvedin future studies by providing participants with some additional information on the network:a participant (P1) suggested that a diagram of the network architecture would be useful, forexample. In including such materials, it is important to avoid information overload. A morenatural way of addressing this limitation would be to run studies over a longer time, in whichthe participants have time to become familiar with the network being monitored, or to run trialsof sonification solutions in operational SOCs, on networks with which practitioners are alreadyfamiliar.
Of the two tasks we focused on this study, monitoring as a non-primary task was consideredthe more realistic to SOC-monitoring work by a majority of participants. The exception wassome Level 1 Security Analysts, who were accustomed to monitoring as a single primary taskat times.
187

Measurement and analysis of performance
As we described in Section 8.4, we made a number of assumptions in deciding the data event towhich a participant’s response related. For the attack, we assumed that any response during theattack time window (between 115 seconds and the end of Dataset 2 ) was a detection of eithertraffic or alerts relating to the attack. For alerts, we assumed that an alert detection was ofthe most recent alert present in the dataset, and for anomalous traffic outside the attack timewindow, we assumed that a response related to the most recent anomalous traffic present in thelast ten seconds of data. Understanding exactly what change in the visuals or sound has led aparticipant to make a response is a difficult problem, that we also observed when running theprototype viability study presented in Chapter 6.
For the attack, for example, it was not possible using our study setup to be certain aboutwhether a participant’s response was made because they had observed the indicators of thatattack condition, or because they believed they had observed something else. As in Chapter 6,we used time windows to reduce the length of data, and therefore number of events, againstwhich a participant’s response would be compared, increasing the likelihood that we wouldassess their response against the event they had actually observed. This was with the exceptionof alerts, for which we did not use time windows: during the study we observed that a numberof participants identified alerts remaining in the visuals long after they had first been presentin the data, and we elected not to impose a time window on alert detection in order to capturesuch late detections.
A limitation of the time-window approach in constructing the anomalous-traffic ground truthis that events constituting anomalous traffic deviations were frequent (in Dataset 2 especially),and as such there were stretches of time in which most responses were assessed as relating tosome event that had occurred within the last ten seconds. This meant that the number of false-positive detections was low, and this may have influenced the results by increasing the level ofprecision calculated. Considering the accuracy of identification is particularly important in thiscase.
A way of addressing the difficulty of understanding the object of participants’ responsesmay be to capture visual information on the study through video recording, eye tracking, orobservation. This would enable physical actions such as pointing at the screen or changes ingaze to be analysed, which may divulge further information as to the focus of participants’attention whilst monitoring. Such information could also be valuable in enabling researchers tounderstand more fully the methods employed by participants when completing the study.
In this particular study, such information could have enabled us to measure how ofteneach participant observed the dashboard whilst multitasking during Study Task 2, and thusassess both how much attention was devoted to the primary and non-primary tasks, and howparticipants used the sonification whilst multitasking. Some participants claimed to have beenprompted by a change in the sound to pause the primary task and focus their attention on thedashboard. Furthermore, the responses of some participants (those who began their responses bydescribing the sound — the instrument heard, for example — followed by its meaning in termsof the data) suggested that they were able to use the sound to identify monitoring informationwithout having to verify its meaning on the screen. Using the data collected in this study doesnot enable us to make a reliable assessment of the use of these methods by participants, however,since we did not capture their physical actions.
While in this study, for the reasons we presented in Section 8.4.3, we elected not to considerthe precision of attack detection based on the amount of other anomalous traffic, unrelated tonetwork attack, that was detected, considering the precision of attack detection is of courseimportant. Monitoring tools for SOCs must enable users to make accurate decisions on whetheran event observed is malicious and related to an attack, or is benign. Measuring the precisionwith which sonification can enable this capability is essential to understanding its potentialfor use as a network-security monitoring approach. Future work should make this assessment,
188

testing the attack-detection precision of users with more substantial training and experience ofusing sonification (this is supported by the comments of some participants, reported in Section9.2, on the perceived improvement to their ability to assess whether deviations were anomalousagainst the baseline the longer they had spent using the tools in the study), and with the abilityto use the tools under study for the type of retrospective exploratory work that is carried outat part of SOC monitoring practice. We observed that the additional detections of anomaloustraffic (outside the attack window) by participants were a facet of the way in which we haddesigned the study, and this observation had to influence the analysis method.
9.3.3 Using Sonification in SOCs: Utility, Practicalities and Requirements
We found that there were a number of ways in which SOC practitioners, having experiencedusing the Sonification SIEM, felt that sonification systems could be useful in SOCs, whichwe presented in Section 9.2.3. Each context in which sonification had the potential to be usefulbrought a number of practical challenges.
Of the contexts described by participants, many were connected by their basis in the po-tential advantage to SOC working practice of using sound to monitor peripherally. Sound is anaturally effective medium through which to present information to be monitored peripherally,given the ability of humans to receive sonic cues without focusing their attention in the directionof the sound source (unlike visual cues, for example). Using sonification to monitor traffic andalerts as a secondary task, whilst at the desk working, moving around the SOC, or away fromthe SOC, all have a basis in this property of sound. These are examples of tasks carried out inSOCs by practitioners, in which the ability to monitor peripherally using sound could be useful.
Sonification designs for such peripheral-monitoring contexts must enable users to interpretthe information presented in an accurate and timely way. In Section 9.3.1 we assessed ourstudy hypotheses, and found that in this study participants monitoring as a non-primary taskdetected traffic and alerts relating to the network attack more efficiently, and identified it moreaccurately, when using the Sonification SIEM than when using the SIEM. There was nodifference in the detection accuracy (assessed using the recall score), since all participants usingeach tool detected the network attack. Furthermore, participants monitoring as a non-primarytask detected IDS alerts more accurately and efficiently when using the Sonification SIEMthan when using the SIEM, but were not more accurate at identifying their severity.
Given that in all but the extra components relevant to the sonification, the two study toolswere identical (see Section 8.2), our hypothesis testing suggests that using sonification mayimprove the efficiency with which users are able to detect IDS alerts, and traffic and alertsrelating to network-attack conditions, when monitoring as a non-primary task. For IDS alerts,recall was higher when participants used the Sonification SIEM, meaning that fewer alertswent undetected. Our assessment of network-traffic awareness also showed that participantsmore efficiently detected other anomalous deviations in the network traffic when using theSonification SIEM than the SIEM, although their detections were less precise (with a greaternumber of false-positive detections).
While we have provided evidence supporting the potential benefits of using sonification topractitioners monitoring as a non-primary task, it is important to recognise that we were onlyable to assess these hypotheses using the results collected in the study. There are a number oflimitations to making these assessments in an hour-long study: as described in Section 9.3.2, thetime pressure and difficulty of exactly replicating the realistic conditions of SOCs, for example.In light of these limitations, running future longitudinal studies in which sonification systemsare actually deployed in SOCs will be vital to understanding their true utility.
It is key that sonification systems can be interpreted effectively, yet it is also essentialthat their use does not fatigue or inappropriately distract the practitioners using them. Inparticular, as was highlighted by a number of participants in the interviews, the sound shouldnot be distracting from other tasks, unless important monitoring information is being conveyed.
189

The potential advantages of sonification systems with such properties extended to use on nightshifts, in which practitioners may be less attentive and may therefore benefit from an extra cueto prompt them to notice security events.
Participants varied in their views on the fatigue caused by the sound design in this study, withsome stating that they had not experienced fatigue, or that they might experience fatigue if usingthe sonification for longer, but had not for the length of this study. Some participants, however,stated that using the sound in the study had been fatiguing, and suggestions of alterations tothe design to reduce fatigue centred around reducing the overall level of noise. These changesinvolved either altering the data-parsing method to include thresholds or filtering, or alteringthe sound engineering (improving the sound of the instruments, for example).
The effectiveness of the suggested approaches to producing appropriate sonification designsfor SOCs is an avenue for future research. Again, longitudinal studies using sonification inoperational SOCs will be key to assessing whether these systems cause fatigue when actuallydeployed. The limitations to our study design — the time pressure, and the real-time presen-tation of information in the SIEM tools (both factors that were described as unrealistic by anumber of participants) — may have contributed to their experience of fatigue. As such, ourresults cannot constitute a reliable assessment of whether the use of sonification would cause anyadditional fatigue to be experienced by practitioners carrying out their work in SOCs. Similarly,the results of the SUS and BUZZ questionnaires indicate that there is room for improvementin the usability of both the SIEM and the Sonification SIEM, and we cannot account forhow difficulties relating to tool usability may have contributed to the fatigue experienced byparticipants.
Issues may arise relating to the scalability of the sonification approach. Participants in theinterview described the large quantities of information that need to be represented for networkmonitoring: both in terms of the huge volumes of network data, and of the many aspectsof information (such as the various protocols and applications used in communications) thatneed to be represented. The large number of monitoring devices used in SOCs about whichinformation might need to be represented was cited as another potential scalability issue. Itwas suggested that it may be beneficial if participants could configure sonification systems torepresent only those aspects of the data they are interested in knowing about (so that onlypackets sent over user-selected protocols or applications are represented, for example). Thiswould appear to be one way of addressing the scalability problem, reducing the set of elementsrepresented sonically to only those selected by the user.
The descriptions given by participants of their experience in using sonification in the studyvaried widely. Some participants felt able to use the sonification approach to detect and under-stand monitoring information; some felt that they would be able to learn to use sonification andthat the learning curve may be less severe than for other monitoring tools. For other partici-pants, sonification was considered too difficult to use for monitoring work, and this was linkedto a lack of general musical experience described by some participants. While it is worthwhileinvestigating the effects of extended training and long-term exposure on the ability of partici-pants to use sonification systems, the evidence of this study suggests that sonification systemsmay be appropriate for use on an individual basis, by practitioners who elect to use them.
There were also differences of opinion between participants on the potential utility of sonifi-cation to SOCs, and on contexts in which the approach could prove useful. As described above,contexts based on using sonification for peripheral monitoring were frequently cited; some par-ticipants saw more potential in other uses, however. Two participants working in the sameorganisation (P17 and P18) differed in their opinions on the potential of sonification for use inretrospective anomaly-hunting tasks. While for P17, this was the clearest area in which sonifica-tion might be useful, P18 described challenges that could prevent the effective use of sonificationin this context (see Section 9.2.3). We did not assess the use of sonification for retrospectivehunting tasks in this study, so cannot comment on its effectiveness, but this context of use
190

could be explored as future work using the additional suggestions in these interviews, and inthe interviews presented in Chapter 7.
Participants working in different SOCs were divided in their opinions on the relevance ofpresenting low-level packet information to real-time monitoring work in SOCs. For some practi-tioners, real-time monitoring was based primarily on observing streams of alerts, for investiga-tion at a lower level if necessary. In general, differences in opinion between participants suggestthat it may be appropriate for sonification to be used in tasks chosen by individual users, andconfigured as those users choose (to represent alerts only for some practitioners, for example, inline with the previous point). The interviews highlighted challenges to integrating sonificationinto SOCs as a tool used by individuals, however: in particular, the need to avoid obstructingthe communication between practitioners that is integral to existing SOC working practice (asmight occur if individuals listened through personal headphones).
Our findings in this study consolidated the three key design requirements derived in Chapter7: the addition of sonified alerting information; the configurability of the sonification tool; andthe inclusion of tool features such as playback, filtering and links between sonified informationand visual representations of it. The only design requirement within scope to be addresseddirectly in this study (through its inclusion in the Sonification SIEM) was the sonificationof alerts (see Figure 8.1). In general, the sonified alerts were met with positive feedback, fur-ther improvements were suggested for their design by participants, and participants were ableto recognise both sonified alerts relating to the network-attack condition, and those presentthroughout the datasets. The other two design requirements were not within scope for inclusionin the systems designed for use in this study, yet their importance was supported by furtherdiscussion. These were the need for the various aspects of the sonification system to be config-urable, and the need for users to be able to play back and filter the sounds produced. Furtherinformation gathered on these design requirements is presented in Section 9.2.4.
9.4 Summary
The aim of the research reported in this chapter and Chapter 8 was to explore the extent towhich using sonification could aid in SOC working practice. We addressed this aim by carryingout a study in which security practitioners with experience of working in SOCs carried out ascoped set of tasks relevant to SOCs using both a SIEM tool, and a SIEM tool that incorporatedsonified information.
Our results showed that participants using the sonification alongside the SIEM when mon-itoring as a non-primary task (whilst carrying out a separate primary task) detected networktraffic and alerts following an FTP brute-force attack more efficiently and identified its naturemore accurately, as well as detecting the alerts produced by an IDS more accurately and ef-ficiently. Furthermore, participants monitoring the network security as a single primary taskdetected alerts more accurately and efficiently when using the sonification. The precision of theanomalous-traffic detections made by participants multitasking using the sonification was lower,however: more false-positive detections were made by participants (according to our analysis ofnetwork-traffic awareness), suggesting that participants may have been misled by the sound.
We also gathered and analysed the spoken views of participants on various topics, includingtheir experience using the study tools, the potential utility of sonification to their work, and thestudy design. This highlighted requirements around the design of sonification systems to enabletheir integration into SOCs, and showed a division in the views of participants on the contextsin which sonification systems may aid in their own work in the SOC, and in SOC workingpractice in general. We discussed the various limitations of our study, and of short-term studiesin which resources are designed by the researchers in general, for providing realistic assessmentsof the true utility of new network-security monitoring approaches for SOCs, and qualified ourfindings in light of these limitations.
191

In Chapter 10, we conclude this thesis, summarising our findings on the utility and designof sonification systems for network-security monitoring in SOCs, consolidating our researchcontributions at each stage of the thesis, and recommending directions for future work.
192

Chapter 10
Conclusion
In this chapter, we conclude this thesis. We begin by considering the extent to which the researchwe have presented addresses our original research aims in Section 10.1, reflecting critically onthe validity of the findings in light of methodological limitations. We summarise our researchcontributions in Section 10.2, and finish by suggesting directions for future work on this topicin Section 10.3.
10.1 Reflection on the Research Aims Addressed, and Critique
As described in Chapter 1, the aim of this research project was to explore the potential forsonification to aid in SOC practice. Four key research questions were posed that we envisagedwould contribute to addressing this aim. In Figure 10.1, we present the map of research questionsand their subdivisions originally shown in Figure 1.2, adapted to demonstrate the stages of thisthesis at which we believe each question has been addressed. We now comment on the extentto which we have addressed these research questions, exploring the findings in each area of thismap, and reflecting critically on them in light of methodological limitations.
We began by considering the sonification of network-security data from a theoretical per-spective in Chapter 5, and thus defining a model for sonifying network-security data. Thissonification model was the basis for our network-data sonification design throughout the thesis,enabling us to explore each of the stages shown in Figure 10.1. While there are undoubtedlyother possible approaches to sonifying network-security data, defining our approach throughthis model early in the research project allowed us to explore and adapt designs as requiredthroughout the thesis (to include new mappings in light of the data-sound mappings findingsreported in Appendix E, and to incorporate sonified alerts into the system in Chapter 8, forexample).
The model was used to create the sonification prototype (see Section 5.6.2) that was used toassess the viability of sonification as an approach to representing network-security monitoringinformation in Chapter 6. The same sonification prototype was presented to SOC practitionersin the interviews reported in Chapter 7. The design requirements identified in these interviewswere then fed back into the model to inform the development of the sonification system assessedin Chapters 8 and 9.
As shown in Figure 10.1, our first research question (RQ1) was on the viability of usingsonification as an approach to representing network-security monitoring information. This wasdivided into two main parts: the accuracy and efficiency with which sonification enabled usersto detect network attacks, and the accuracy with which the nature of the information commu-nicated sonically could be identified by users. The hypotheses we assessed in the sonification-prototype viability study reported in Chapter 6 were developed around points we consideredwould indicate the viability or otherwise of using sonification to represent network-securitymonitoring information.
193

Is sonification aviable approachto representing
network-securitymonitoring infor-mation? (RQ1)
Chapter 6
Attack detec-tion: accuracy,
efficiency
Communicatingnetworkactivity
Is that useful toSOCs? Why, and
in which contexts?(RQ2) Chapter 7
What could itenable users todo? (use cases)
How can it com-plement existing
SOC setups?
How should sonificationsystems be designed
for use in SOCs?(RQ3) Chapter 7
What fea-tures shouldsonificationtools have?
What arethe SOC-
specific designrequirements?
To what extentdoes sonificationprove useful to
SOC tasks? (RQ4)Chapters 8 and 9
Can it enablethe targetedcapabilities?
How well doessonification in-tegrate into the
SOC environment?
Figure 10.1: Chapters in which we have addressed the research questions
The results of the study presented in Chapter 6 showed that participants were able todetect the attacks presented accurately and efficiently, and identify them accurately, using thesonification prototype in an experimental setting. The prototype enabled participants to detectattacks, and to identify the types of attacks after training. Even before training, abnormalnetwork conditions could be heard intuitively to some extent, supporting further investigationinto the use of sonification for signalling unknown or evolving attack types, for which signaturesdo not exist. A majority of participants were able to recognise combinations of attacks occurringsimultaneously using the prototype, and the performance of participants in this study was notsignificantly affected by their level of musical experience: participants without musical trainingwere able to use the prototype.
A limitation to the study reported in Chapter 6 was the absence of a dataset in whichno attacks were present. This failure to assess the attack-detection and identification rates of
194

participants monitoring network traffic containing no attacks reduced the validity of the resultssomewhat, particularly given the relative rarity of the presence of attack conditions during real-world security monitoring compared to during this study. Recognition of this limitation informedour decision to include a dataset containing no attacks in the study reported in Chapters 8 and9.
We altered our analysis method in Chapters 8 and 9, however, based on our observationsthat monitoring for anomalous deviations in the traffic in real time, as in the study, is a some-what different task to deciding true- and false-positive network attacks. Decisions on attackswould usually involve further investigative work by practitioners having observed the potentiallyanomalous events in real time. Thus, for the dataset containing no attacks in Chapters 8 and9, we assessed the real-time network-traffic awareness of participants, rather than consideringtheir detections of anomalous traffic to be false-positive attack detections. This means that inthis thesis we have not comprehensively assessed the attack-detection accuracy of humans usingsonification, in terms of their ability to recognise extended periods of time in which no attacksare occurring. This is a condition that it is important to assess, since it is likely to occur inreal-world monitoring work, and we leave its assessment to future work.
Only a small set of attacks (four types of network attack) were used in the study reportedin Chapter 6, and the network-attack datasets used were synthetic (created by the researchers).This means that we cannot generalise the results as evidence that sonification can enable humansto detect attacks on real-world networks. What the results of this study provide is evidence ofthe viability of sonification for representing network-security monitoring information, whichsupports the investigation of the ensuing research questions.
RQ2 was concerned with whether the sonification of network-security data has the potentialto be useful to SOCs. This included a question on the specific use cases in which sonificationmight be useful to SOCs, and a question on whether and how sonification could complementexisting SOC setups. Addressing this research question was the aim of the interviews reported inChapter 7. The interviews showed that SOC practitioners saw potential for the use of sonificationin a range of use cases. The envisaged potential for using sonification was particularly high incontexts in which the ability to monitor peripherally would be advantageous: monitoring sonifiednetwork traffic and alerts whilst multitasking with other work tasks, or whilst away from theSOC. Participants also saw value in using sonification for anomaly detection, in an approachsimilar to the existing visualization techniques used in SOCs.
We developed each use case in which SOC practitioners saw potential into a refined contextof use, detailing for each the requirements for sonification design and foreseen challenges tointegration, based on the comments of participants in the interviews. These requirements arepresented in the latter sections of Chapter 7, and contributed to addressing the part of RQ3concerned with SOC-specific design requirements. The SOC is a unique environment, with highpressure and time intensity in the work of practitioners. Developing an understanding of existingSOC environments and their setups enabled us to identify the factors that should be consideredin order to minimise the disruption caused by integrating sonification systems into SOCs forthese various uses.
Key findings were that sonification systems should not interfere with the collaboration be-tween practitioners that is common to SOC practice; listening using personal headphones, forexample, might isolate practitioners, jeopardising collaboration and conversation. On the otherhand, SOCs are often situated in open-plan offices in which a number of practitioners work; assuch using speakers to play the sonification to the whole SOC would be distracting to practition-ers not using it. Single earpieces may be an appropriate solution to this problem, and creatingsystem designs that have the flexibility to be played through different listening mediums, fordifferent purposes, is important. Minimising the fatigue that might be induced by listening tosonification was another key requirement, particularly given the long shifts (12-hour shifts, forexample) frequently worked by SOC practitioners.
195

As well as these design requirements relating to integrating sonification into SOCs, a setof features that should be included in sonification tools for SOCs arose from the comments ofparticipants, providing evidence towards the part of RQ3 that focused on tool features. Threekey features were listed in Section 7.8, in which we also explored approaches to developing thesefeatures. Firstly, alerts were a type of information, alongside network-packet traffic, the sonicrepresentation of which practitioners envisaged they might benefit from monitoring peripherally.We also found that there might be benefit in making various aspects of the sonification approach(including details of the network setup, the aspects of the network data to represent sonically,and the sound aesthetic) configurable by users. Finally, in practice, users of sonification systemsmight require facilities for the playback of previously heard sound, perhaps at altered speeds,and with methods by which they are able to link the sounds heard to the visual and textualrepresentations of data currently used in SOCs.
RQ4 was concerned with assessing the extent to which sonification proved useful when usedfor SOC tasks. From the refined contexts of use for sonification in SOCs presented in Chapter7 (in response to RQ2), we selected two to study: monitoring as a non-primary task whilstcarrying out another work-related primary task (taking advantage of the potential to use soundto monitor peripherally, as described above), and monitoring as a single primary task. In linewith the relevant subdivision of RQ4, we aimed to assess whether using sonification couldenable these targeted capabilities.
We found that participants using a SIEM tool to monitor as a non-primary task in the studydetected network-attack traffic (packets and alerts relating to the attack) and IDS alerts signifi-cantly more efficiently when sonification was incorporated into the SIEM tool. Furthermore IDSalerts were detected more accurately, and network-attack traffic identified more efficiently. Whenmonitoring as a primary task, participants detected alerts more accurately and efficiently whenusing a SIEM incorporating sonification, but using sonification made no significant difference tothe ability of participants to detect or identify network-attack traffic. Using the sonification mayhave disadvantaged monitoring performance in some ways, however: the precision with whichparticipants detected anomalous traffic deviations when multitasking using the sonification waslower, meaning that more false-positive detections were made.
These results provide evidence of the potential for sonification to improve the monitoringcapabilities of security practitioners in SOCs, when monitoring as a non-primary task especially.As we discussed at length in Section 9.3.2, however, making a realistic assessment of actual SOCmonitoring capability in a study of this nature (in which the resources were designed by theresearchers) is difficult. We took steps to replicate the tools, tasks and physical setups to whichSOC practitioners would be accustomed, based on existing literature and evidence gatheredin the earlier interviews presented in Chapter 7. Limitations to the realisticness of the studyresources, compared with their actual SOC practice, were noted by participants, however, andthis impacts the claims we can make based on these findings.
We can claim that in this study, using sonification improved aspects of the non-primarytask monitoring capability of participants, and this supports the potential for sonification toimprove this capability in actual SOC practice. We cannot guarantee that the same resultswould be obtained if a sonification system were to actually be employed in a SOC, however.The complexity of SOC working practice, with multiple networks and devices monitored, andmultiple practitioners working in the same room, as well as the possible barriers to use suchas fatigue and distraction highlighted by participants, could have a significant effect on theseresults.
Furthermore, the findings of this thesis are constrained by the network-attack datasets used:a small set of attacks were focused on in this thesis (in Chapter 6, and Chapters 8 and 9, andof these, only those used in Chapters 8 and 9 were captured from attacks actually carried out,rather than synthetically generated). As such, our findings on attack-detection capability cannotbe generalised to network attacks in general, but relate to a subset of network attacks presented
196

in an experimental setting. It is crucial that longitudinal studies, in which sonification systemsare deployed in operational SOCs and their effects studied, are carried out as future work.Such research should examine not only whether using sonification enables the improvementof monitoring capabitities in any of the targeted contexts of use, but also the severity of thechallenges to SOC working practice posed by the actual (rather than hypothetical, as in thisstudy) integration of SOCs into this environment.
We discussed the limitations specific to each study in their respective chapters. A problemwe encountered at various stages of the thesis was the difficulty of measuring the monitoringperformance of participants. Monitoring performance was assessed in Chapters 6 and 8. Furtherdetail on the method used in each study is presented in their respective chapters. As discussedin those sections, making assessments of the detection and identification accuracy of particu-lar network events by participants is problematic, because it is difficult for the researcher tounderstand exactly which changes in the network data have prompted a particular responseby a participant. Our methods enabled an assessment of monitoring performance according tocertain assumptions (that a detection by a participant must refer to the last event present inthe dataset, for example). As a next step towards fully understanding the utility of sonificationfor monitoring in SOCs, a more reliable assessment of improvements to monitoring performancemight be achieved through the in-SOC longitudinal studies we described above.
10.2 Summary of Research Contributions
We summarise the contributions of this thesis to research into the use of sonification for network-security monitoring. These are areas in which we believe the research presented in this thesishas extended the pre-existing knowledge in the field.
10.2.1 Sonification Design
In Chapter 5, we contributed a formalised model for the sonification of network-security data.This model can be used for the development of sonification systems for network-security datain general, such that sonification designs created by others might be evaluated and compared.The model captures prior-art system designs for the sonification of network data, such thatnewly developed designs can be compared with these existing designs. The model can be usedby others in developing and comparing sonification designs for network-security data.
We contributed to research in sonification design in Chapter 7, in which we identified de-sign requirements for sonification systems to be used in SOCs, and considered approaches tomeeting these requirements. The design requirements identified can inform the designers ofsonification systems for the SOC environment. These requirements can also act as a basis forfurther experimentation with sonification design, and the design of tool features, to be used inSOCs.
10.2.2 Contexts of Use and Requirements for Sonification in SOCs
In Chapter 7, we contributed contexts of use in which sonification could aid in working prac-tice in SOCs, based on an analysis of interviews with security practitioners working in SOCs.Contexts such as multitasking and monitoring whilst away from the SOC, which leverage thepotential for sound to be listened to peripherally, held particular promise. We also establishedan understanding of the challenges to integrating sonification into the SOC environment: tointegrate effectively into SOCs, sonification systems must be unfatiguing to users, must not ob-struct communication between SOC practitioners, and must not be inappropriately distractingto the listener or to others working in close proximity to the listener.
We contributed a set of SOC-specific requirements for sonification systems in Chapter 7,and demonstrated approaches to addressing these requirements. The sonification of alerts may
197
be useful separately to, or alongside, packet-traffic sonifications. To integrate with the workingmethods of SOC practitioners, various aspects of sonification systems, including details of thenetworks monitored and choice of aesthetic, should be configurable by the user. Features suchas playback and pausing of the sound, and methods of linking the sounds heard to the datathey represent in a visual or text format, should be included in sonification tools. Such featuresare relevant particularly if these tools are used in the investigative work carried out by SOCpractitioners following an initial indication of a security event, or for the possible retrospectivethreat-hunting applications of sonification systems discussed by a number of SOC practitioners.
10.2.3 Assessments of Network-Security Monitoring Performance Using Soni-fication
In Chapter 6, we contributed empirical evidence of the capability of humans to hear networkattacks in sonified packet headers (synthetically generated), in an experimental setting. Weshowed, through an effectiveness study carried out with human participants, that a set of net-work attacks, including attacks occurring simultaneously, could be detected accurately andefficiently by humans listening to the sonification, and that the type of attack could be identi-fied accurately. We also showed that musical experience had no significant effect on the abilityof participants to use the sonification, and that participants were able to detect attacks as de-viations in the sound prior to training (with no knowledge of the attacks represented or theirmapping to sound). These results suggest that listening to sonifications of network traffic maybe a viable approach for humans to detect network attacks. This can inform the application of,and further research into, sonification in network-security monitoring tasks.
In Chapters 8 and 9 we contributed evidence of the extent to which sonification can be usedto improve a set of capabilities required by security practitioners working in SOCs. We showedthat in this study, participants detected network-attack traffic and IDS alerts significantly moreefficiently when using sonification alongside a SIEM to monitor as a non-primary task, thanwhen using a SIEM only. They also detected alerts more accurately, and identified network-attack traffic more accurately. When monitoring as a primary task, participants detected alertsmore accurately and efficiently when using sonification alongside a SIEM. These results provideevidence of the potential for sonification to improve network-security monitoring capabilitieswhen used alongside traditional SOC monitoring tools for monitoring as a non-primary task es-pecially. This supports further research into the utility and practicality of deploying sonificationsystems in real SOC settings.
We made methodological contributions in Chapter 6, and Chapters 8 and 9. We presentedand evaluated methodologies for the assessment of network-security monitoring performanceaccording to our definitions based on detection and identification accuracy, and detection ef-ficiency. We described methods of assessing the correctness of detections and identificationsof network-traffic events made by participants, and of measuring the time these actions took.These methods were based on assumptions about the events to which responses made by par-ticipants referred. By reflecting on the limitations of these methodologies, we highlighted areasin which adjustments to the methodologies, or studies in real-world SOC settings, are needed.The methodologies and our reflections on them can be drawn on by others researching thenetwork-security monitoring capabilities of participants using security tools.
10.3 Directions for Future Work
Based on the research reported in this thesis, we present our ideas on directions for future work.These are areas in which we anticipate that extended findings would further understanding ofthe questions addressed in this thesis: in particular, the potential utility of sonification to SOCs,but also related questions that arose as we explored this topic. We begin by highlighting the
198

outstanding questions specific to each chapter, before summarising the key research needed toprovide stronger answers to the main research question on the utility of sonification to SOCs.
Having tested the attacks presented in the prototype viability study (Chapter 6), we high-lighted the need to assess the effectiveness of sonification for testing other attack types andvariants, and to address the question of anomaly detection for attacks not fitting expectedprofiles. This included testing sonification of slower-moving malware and advanced persistentthreats (APTs) through longer-term studies, as well as testing variants on attack types (dif-ferent types of DoS attack, for example). The network-attack datasets used in Chapter 6 weresynthetic, developed by the researchers, and it was only in the research reported in Chapters 8and 9 that we sonified captures of network attacks that had actually been carried out. As such,a more extensive assessment of the use of sonification to represent a wider range of networkthreats from real-world network data captures, or on actual real-world networks, would advanceknowledge around the attack-detection potential of humans using sonification systems.
Comparing detection approaches using sonification with existing anomaly-detection tech-niques using statistics and machine learning was outside the research scope for this thesis.Debashi and Vickers have provided an indication of the potential of sonification to competewith anomaly-detection techniques using machine learning: using the SoNSTAR sonificationsystem they identified IP flows relating to bot activity with greater accuracy than three leadingmachine learning-based traffic classifiers [62]. Further such comparisons would deepen under-standing of the types of anomaly detection for which the use of sonification may be appropriate,and where the limits of this approach lie.
In Chapters 8 and 9, we aimed to explore a scoped set of findings from Chapter 7. Thismeant validating experimentally the capability of SOC workers to use the sonification in ourrefined contexts of use, and addressing the design and integration questions highlighted. Asillustrated in Figure 8.1, the need to reduce the scope investigated in the study reported inChapters 8 and 9 meant that a number of the points that arose in Chapter 7 were not explored.These are clearly areas that remain to be investigated as future work, since we elected not toinvestigate them here.
Assessing the usability of the sonification design developments made in Section 7.8 fell out-side the scope of Chapters 8 and 9, as shown in Figure 8.1. The comments of participantsreported in Chapter 7 highlighted a number of features that might increase the utility of soni-fication systems to SOCs. Various aspects of the systems developed should be configurable byusers (details of the network, selection of data-sound mappings, and sonification aesthetics),and facilities should be available by which users can manipulate (replay, filter and alter thespeed of) the sonification, and link the sounds produced to the text-based data. For any ofthese developments to be effective, it is essential that they are designed in a way that is usable.As such, assessing and making improvements to the usability of the approaches we proposed tomaking these developments in Section 7.8 is important.
Two of the refined contexts of use presented in Section 7.7 were not included in our scope forChapters 8 and 9. The utility of sonification for monitoring whilst outside of the SOC is yet tobe explored. The use of sonification for short-term anomaly-detection tasks also remains to beinvestigated: in particular, short-term, periodic checking on the state of the traffic, and huntingfor anomalies retrospectively. The potential utility of sonification in retrospective hunting taskswas discussed again by participants in the study reported in Chapters 8 and 9, supportingthe need to explore this last use case especially. Figure 8.1 can inform future work exploringthese contexts of use, since it shows the sonification developments relevant to each, based onour findings in Chapter 7 (investigating the use of playback features such as rewinding andaltering the speed of sonification should be a part of studies exploring the use of sonificationfor retrospective hunting tasks, for example).
The above unexplored contexts of use might be investigated in another study designedsimilarly to the study we presented in Chapters 8 and 9. Alternatively, they could be addressed
199

through longer-term studies in which sonification systems are deployed in operational SOCs.It would be valuable to study even those contexts of use we did explore in Chapters 8 and 9(monitoring as a primary and as a non-primary task) as part of a longitudinal in-SOC study,given that the time and resource constraints of our study may have affected the relevance ofthe findings to real-world SOC practice (these constraints were described in Section 9.3.2). Aswe have noted a number of times in the later parts of this thesis, such studies will be key todeveloping an understanding of the true utility of sonification to SOCs. We believe that runningsuch studies will be the most important area of research for extending the findings of this thesis.
In-SOC studies could enable researchers to investigate the potential challenges to the inte-gration of sonification into SOCs that were highlighted in Chapter 7. As we described in thatchapter, sonification must integrate into SOCs without obstructing collaborative SOC prac-tice, distracting practitioners unnecessarily, or causing user fatigue. Furthermore, sonificationsystems would need to integrate with the multitude of monitoring devices currently used inSOCs, representing huge amounts of data, often observed on multiple complex networks, in auseful way. Running sonification systems in SOC environments would be the most reliable wayof assessing whether meeting these requirements is achievable. Insights into the learning curverequired for practitioners to become proficient in using sonification systems for SOC tasks, andinto the most appropiate methods of training users, could be gained by running such studiesover longer periods of time.
200

Appendix A
Collection of ParticipantDemographics
We present the questions we used to collect participant demographics in the studies presentedin this thesis. Each study used a subset of these questions, as indicated in Table 4.1. In thattable, the numbers associated with each type of demographic information correspond to thenumbering of the questions in the list below.
1. Which age bracket do you fall into?
• 18-24
• 25-34
• 35-44
• 45-54
• 55+
2. What is your gender?
• Male
• Female
• Other
3. How would you describe your level of musical experience?
• I have no musical training and do not actively listen to music
• I have no musical training and I do actively listen to music (specify genres listenedto)
• I have some instructed musical training
• I have some self-taught musical training
• I have reached a graded standard in a musical instrument (specify grade, standardand instrument)
• I have advanced (university/conservatoire-level) musical training
201
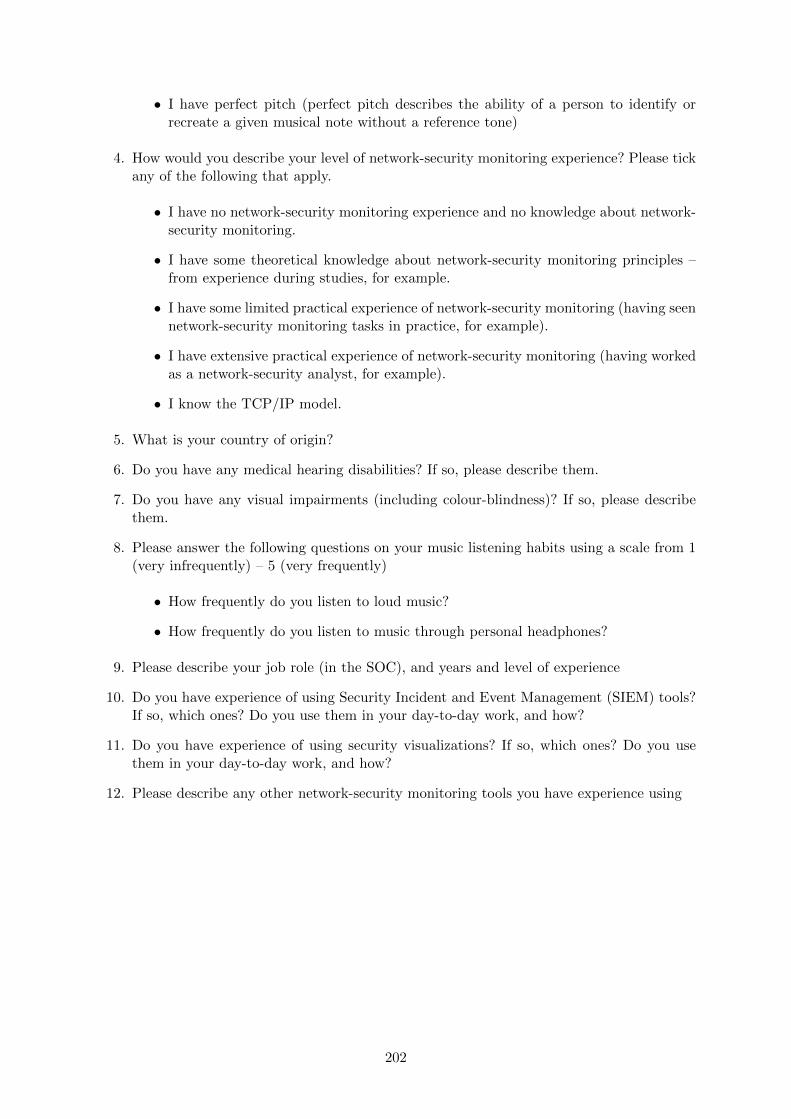
• I have perfect pitch (perfect pitch describes the ability of a person to identify orrecreate a given musical note without a reference tone)
4. How would you describe your level of network-security monitoring experience? Please tickany of the following that apply.
• I have no network-security monitoring experience and no knowledge about network-security monitoring.
• I have some theoretical knowledge about network-security monitoring principles –from experience during studies, for example.
• I have some limited practical experience of network-security monitoring (having seennetwork-security monitoring tasks in practice, for example).
• I have extensive practical experience of network-security monitoring (having workedas a network-security analyst, for example).
• I know the TCP/IP model.
5. What is your country of origin?
6. Do you have any medical hearing disabilities? If so, please describe them.
7. Do you have any visual impairments (including colour-blindness)? If so, please describethem.
8. Please answer the following questions on your music listening habits using a scale from 1(very infrequently) – 5 (very frequently)
• How frequently do you listen to loud music?
• How frequently do you listen to music through personal headphones?
9. Please describe your job role (in the SOC), and years and level of experience
10. Do you have experience of using Security Incident and Event Management (SIEM) tools?If so, which ones? Do you use them in your day-to-day work, and how?
11. Do you have experience of using security visualizations? If so, which ones? Do you usethem in your day-to-day work, and how?
12. Please describe any other network-security monitoring tools you have experience using
202

Appendix B
Semi-Structured Interviews: GuidingQuestions
We present the questions that guided the semi-structured interviews we carried out as part ofthe studies reported in Chapters 6, 7, and 8.
B.1 Prototype Effectiveness Study (Chapter 6)
1. Please describe your experience using the sonification.
2. Please describe your experience in each of the following components of the study task.
• Detection of an attack in the sonification
• Identification of the musical change
• Identification of the attack type signalled
3. How easy did you find each of the above components on a scale of 1-5? (1. Very easy; 2.Easy; 3. Neutral; 4. Difficult; 5. Very difficult)
4. Did you feel that the training session helped you to use the sonification tool in the studytask?
5. Is there anything you would change about the training session?
6. Is there anything you would change about the sonification?
B.2 Initial Interviews with Security Practitioners (Chapter 7)
In this part of the interview, we will present a prototype sonification system for network-packet captures. The system sonifies (represents as sound) network packet captures in realtime, mapping properties of the data to properties of the sound. We will introduce the system,and then introduce and discuss use cases for sonification in SOCs. We would like to gather yourthoughts on what the strengths and weaknesses of sonification might be in each case.
[Description of sonification system given by the researcher, and participant listens to thesonification recorded running on network traffic]
[Use case table presented (as shown in Table B.1), participants discuss each use case withresearcher, and rate each]
203

Table B.1: Sonification use case table for SOCs interviews
Use case 1 (not atalluseful)
2 3 4 5 (veryuseful)
Hearing anomalies in the network traffic
Continuous monitoring: maintaining situationalawareness as a non-primary task
Fusion of data represented across multiple sources(e.g. screens)
Alternative to visualization to help alleviate fatiguefrom monitoring screens
Alerting analysts to alerts and potential anomalieseven when their attention is not focused onmonitoring tasks
B.3 Interviews with Security Practitioners Following Use ofSonification in Network-Security Monitoring Tasks (Chap-ters 8 and 9)
1. Please describe your experience in the study
2. Please describe your experience using each of the tools
(a) SIEM
(b) Sonification SIEM
3. Please describe your experience monitoring as a primary task
(a) When monitoring for anomalous traffic
(b) When monitoring for alerts
4. Please describe your experience monitoring as a non-primary task
(a) When monitoring for anomalous traffic
(b) When monitoring for alerts
5. Please describe how easy you found each of the following using the SIEM
(a) Detecting the presence of anomalous traffic
(b) Detecting the presence of an alert
(c) Understanding the nature of the anomalous traffic
(d) Understanding the nature of the alert
6. Please describe how easy you found each of the following using the Sonification SIEM
(a) Detecting the presence of anomalous traffic
(b) Detecting the presence of an alert
204

(c) Understanding the nature of the anomalous traffic
(d) Understanding the nature of the alert
7. Did you experience fatigue during the study?
8. How realistic were the study tasks compared with what you might do in your everydayjob? Please explain
(a) Monitoring as a primary task
(b) Monitoring as a non-primary task
9. How realistic was the physical setup of the experiment compared with the setup in whichyou carry out your network-security monitoring work? Please explain
10. How realistic was the SIEM tool compared with the types of tool you would use in yournetwork-security monitoring work?
11. Did you feel that the training session helped you to use the tools? How?
12. Are there any scenarios in which you can see a monitoring solution using sonification beinguseful in your SOC work?
205

Appendix C
Usability Questionnaires: SUS andBUZZ
We present the questionnaires we used to assess participants’ views on the usability of the toolspresented in Chapters 8 and 9.
C.1 System Usability Scale (SUS)
SUS is a widely used tool for assessing the usability of systems in general [43]. Participantsindicate their agreement with each item on the following scale.
Table C.1: SUS usability questionnaire
Stronglydisagree
Stronglyagree
I think that I would like to use this systemfrequently.
I found the system unnecessarily complex.
I thought the system was easy to use.
I think that I would need the support of a technicalperson to be able to use this system.
I found the various functions in this system werewell integrated.
I thought there was too much inconsistency in thissystem.
I would imagine that most people would learn touse this system very quickly.
I found the system very cumbersome to use.
I felt very confident using the system.
I needed to learn a lot of things before I could getgoing with this system.
C.2 Auditory Interface User Experience Scale (BUZZ)
BUZZ is a questionnaire for assessing user experience with auditory interfaces specifically [169].Participants indicate their agreement with each item on the following scale.
206

Table C.2: BUZZ questionnaire
Stronglydisagree
Disagree Somewhatdisagree
Neitheragree nordisagree
Somewhatagree
Agree Stronglyagree
The sounds were helpful.
The sounds were interesting.
The sounds were pleasant.
The sounds were easy to understand.
The sounds were relatable to their ideas.
It was easy to match these sounds totheir meanings.
It was difficult to understand how thesounds changed from one variable to thenext.
It was fun to listen to these sounds.
It was boring to listen to these sounds.
It was confusing to listen to these sounds.
It was easy to understand what each ofthe sounds represented.
207

Appendix D
Coding Tables Produced for theInterviews with SecurityPractitioners (Chapters 7, 8 and 9)
We present the coding tables produced in our analysis of the interview data, reported in Chapters7 and 8. The tables are divided according to the themes we coded the data under; within thetables are further divisions into subthemes. In Tables D.1-D.3, we present the coding tablesproduced in the analysis of the interviews with security practitioners reported in Chapter 7. InTables D.4-D.8, we present the coding tables produced in the analysis of the interviews withsecurity practitioners, following their use of sonification for network-security monitoring tasks,as reported in Chapters 8 and 9.
208

Table D.1: Coding table: Chapter 7. Theme: Perspectives on use case utility
Subthemes Sub-subthemes Definition Example of Evidence from the Data
Use case 1:detectinganomalies in thenetwork traffic
The views of participants on thepotential utility of sonification in usecase 1
“I think it would be quite good for looking for interestingevents, that are not necessarily quickly visible in a graph.Because the thing with a graph is you can only – it’s nothow much you can see, it’s how much you can presenton the technology”
Use case 2:monitoring as anon-primary task
The views of participants on thepotential utility of sonification in usecase 2
“I could see that as a good application for helping peoplemultitasking. Because you would have it on in thebackground so you’re not focusing on it, but you candefinitely hear if it starts – drumbeats start rolling orsomething”
Use case 3:monitoring datapresented acrossmultiple screens
The views of participants on thepotential utility of sonification in usecase 3
“I will still use seven [screens], even if I have all thesound in the world ... because I don’t consider them to berelated, to be honest”
Use case 4:allevating fatiguefrom monitoringscreens
The views of participants on thepotential utility of sonification in usecase 4
“I can see it as an alternative to visualization for whenyou get to a point when your eyes are tired”
Use case 5:enablingmonitoring whileoutside the SOC
The views of participants on thepotential utility of sonification in usecase 5
“If you want to go and get a coffee on a one-man nightshift you have got to be very quick about doing it,because anything could kick off. If you could have just anearphone in or something, and you just hear a noisewhen something is going on”
Other use casessuggested
Occasional use tocheck networkstate
The views of participants on thepotential utility of sonification for useoccasionally in checking the state ofthe network
“As a quick indicator, or maybe if an alarm fires forthat customer, you bang the headphones on, listen forfive minutes, and go ‘yeah there’s something going onthere, that doesn’t sound right’”
209

Table D.1: Coding table: Chapter 7. Theme: Perspectives on use case utility (continued)
Subthemes Sub-subthemes Definition Example of Evidence from the DataHunting foranomalies
The views of participants on thepotential utility of sonification inretrospective anomaly-hunting tasks
“I might look at a customer and want to go hunting, forinstance, I might bung those headphones on for thatcustomer and have a quick listen and just think ‘ok yeahthere’s something different happening on that network, itdoesn’t sound like it did yesterday’”
Improving SOCworkflow
The views of participants on thepotential utility of sonification in usesthat could improve workflow in SOCs
“You could just leave it in the kitchen somewhere ...they’ll hear that and go ‘I need to go back in’, things likethat, rather than somebody being on the phone, trying towave at you through the window, saying come out”
Table D.2: Coding table: Chapter 7. Theme: Perspectives on integrating sonification into SOCs
Subthemes Sub-subthemes Definition Example of Evidence from the Data
Speakers orheadphones?
Opinions expressed by participantson appropriate listening mediums forsonification: headphones, speakersand single earpieces
“I would have more of a preference for having things onin the background, rather than headphones, becauseotherwise people would get a bit unsociable, and youdon’t necessarily know what they are going to listen to”
Existing SOCpractice
Existing awarenesssystems
Reports of systems used in SOCs toaid practitioners in maintainingnetwork awareness
“We’ve got something similar but we use lights, if it’sgreen it’s ok, but it changes based on what’s going on”
SOC soundscape Reports of the current soundscape inthe SOCs in which practitioners work
“Occasionally people use headphones and stuff to listento music, and on the odd occasion we will put somemusic on on one of the laptops, but that’s really down towhat people are up to”
Types of SOC The factors to be considered inintegrating sonification into specifictypes of SOC
“I think if it was for like an internal SOC for a specificcompany that probably would work better. Here becausewe’re a managed services provider, I think there wouldbe too many things going on, that it would be just aconstant smattering of everything”
210

Table D.2: Coding table: Chapter 7. Theme: Perspectives on integrating sonification into SOCs (continued)
Subthemes Sub-subthemes Definition Example of Evidence from the DataStandardisingresponses
Comments on the need to integratesonification into SOCs in such a waythat practitioners’ responses tosounds heard could be standardised
“Everything we do is kind of based around a process or aprocedure, so I’m not sure how you would kind ofstandardise, without everyone having like a musicallytrained ear I think it would be hard to get everyone toconform to, ‘right, when you hear this, you do this’”
Networkbaselining
The factors to consider with regardto baselining the networks monitoredin operational SOCs
“The bigger your network is, the more complex yournetwork is, the more difficulty you have working outwhat is unusual”
Potentialchallenges to usingsound
Listening fatigue Comments on the challenges thatfatigue caused by listening tosonification could cause
“I guess you could use it as and when, but I think if youput that on somebody’s head for a day, I think you wouldstruggle with that”
Attention loss Comments on the potential challengeof practitioners’ attention beingdiverted from the sonification inSOCs
“I think the biggest danger is, if you expose them for toolong they will tune out”
Table D.3: Coding table: Chapter 7. Theme: Perspectives on sonification design
Subthemes Sub-subthemes Definition Example of Evidence from the Data
Sonification ofalerts
Comments on the potential utility ofpresenting sonified alerts
“We have a product that mitigates DdoS, as much as itcan anyway. If we could do all of our alerting on thatparticular product by just hearing it, rather than havingto see the alarms, that would be really good because itwould free us up to do all sorts of other stuff ”
Mitigating fatigue Suggestions for sonification designapproaches that could mitigate thefatigue caused by listening tosonification
“Music you can switch off to, but equally the anomaliesin there, your brain is going to pick up on them”
211

Table D.3: Coding table: Chapter 7. Theme: Perspectives on sonification design (continued)
Subthemes Sub-subthemes Definition Example of Evidence from the Data
Linking sounds tovisualrepresentations
Expressions of the need forpractitioners to be able to link thesounds heard to a visualrepresentation of the informationrepresented
“Music would be the transient bit, you would hear it andit would be gone, if you could have some way of thatoutputting to a visualization...”
Configurability Comments on the need for aspects ofsonification systems (the networkinformation presented, and the sounddesign, for example) to beconfigurable by their users
“If you can make that build upon, almost user-inputtedevents, so you could tell the system to play music notjust based upon the packet captures but based uponoutputs of other things”
Table D.4: Coding table: Chapters 8 and 9. Theme: SOCs: setup and working practice
Subthemes Sub-subthemes Definition Example of Evidence from the Data
Current audio inSOC
None currently Descriptions of SOCs in which noaudio is used currently
“It’s all done visually. I think that’s probably because it’san office-based environment where there’s so manypeople”
People talking Descriptions of the soundscapecreated by people talking in SOCs
“Even the level of noise, of just people talking aroundyou and an office happening and things like that, becausewe’re not in our own little room, we are in the middle ofa bigger floor plane”
Sounds used foralerting
Descriptions of the use of sound foralerting in SOCs
“We have utilized stuff like that in our platform before,where it was just a klaxon for an L1 ”
Job rolesNetwork-securityengineer
Descriptions of the roles ofnetwork-security engineers in SOCs
“I’m network security third line, so I manage a lot of thedevices and their tuning and all that, and then supportthe front-desk analysts as required”
Senior analyst Descriptions of the roles of senioranalysts in SOCs
“Being a senior analyst, I don’t do the alerts day-inday-out any more. I’ve been an analyst for quite a while,so now it’s a case of, I’m there as backup for the guys ifthey’re all looking at alerts”
212

Table D.4: Coding table: Chapters 8 and 9. Theme: SOCs: setup and working practice (continued)
Subthemes Sub-subthemes Definition Example of Evidence from the Data
SOC manager Descriptions of the roles of SOCmanagers
“I’ve got five teams in the SOC, so across a fewcountries, India, Germany and the UK, and the mainmission is to detect cyber attacks against [theorganisation] across [the organisation]”
Physical setup Descriptions of the physical setup ofthe SOC environment
“It’s a whole different world. It is very high-security,you’ve got loads and loads of computers, massiveprojectors, projecting all of our comm links”
Nature of SOCwork
High numbers ofalerts
Descriptions of the high number ofalerts experienced by practitioners intheir SOC work
“I think you’re talking to people to have at last countwhat a million alerts a day? Possibly more?”
Guided by alertsrather than traffic
Descriptions of SOC work bypractitioners that is guided byalerting information rather than bylow-level network traffic
“We get an alarm, and then from the alarm we jump inand investigate in whatever tool is needed. So it’s astrange one to see live traffic because I don’t know howmuch manpower it would take to monitor live traffic”
Shift patterns Descriptions of the shift patterns ofpractitioners in SOCs
“12-hour shifts and it was three on three off and amixture of nights”
Other tools (notSIEM) used
Advancedvisualization
Descriptions of the use of advancedsecurity visualizations in SOCs
“We use a lot of different low-level diagrams to visualizethe data, to tell the story about what’s going on”
Bespoke tools Descriptions of the use of tools thatare bespoke to particular SOCs
“Some of the tools we use are bespoke, so they don’t fallinto the categories of distinct IPS, or. . . also,[organisation] has its own intrusion detection devicecalled [tool name]”
Packet captures Descriptions of the use of tools forthe presentation and querying ofnetwork-packet captures bypractitioners
“We’ve got a new tool where we download packetcaptures and events to go into, but we had a tool wherewe could query traffic that was coming in, it was just fullpacket captures all the time for however long, and wecould jump back, query it and find out anything”
213
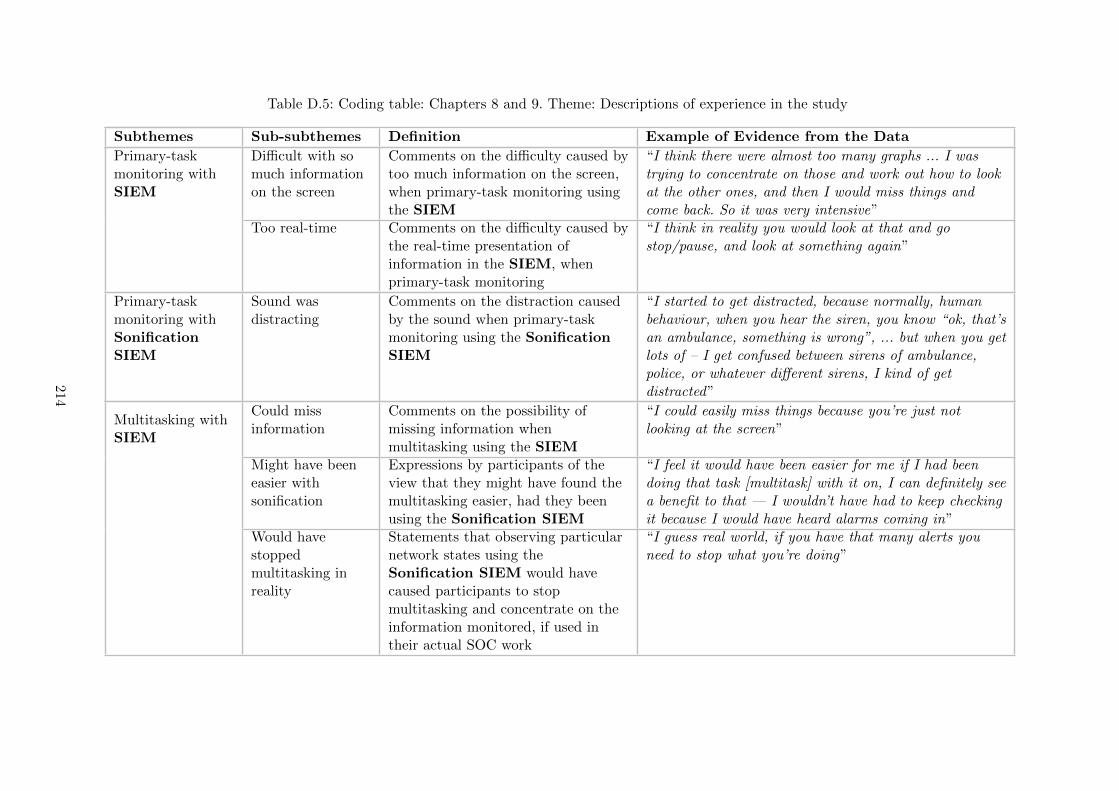
Table D.5: Coding table: Chapters 8 and 9. Theme: Descriptions of experience in the study
Subthemes Sub-subthemes Definition Example of Evidence from the Data
Primary-taskmonitoring withSIEM
Difficult with somuch informationon the screen
Comments on the difficulty caused bytoo much information on the screen,when primary-task monitoring usingthe SIEM
“I think there were almost too many graphs ... I wastrying to concentrate on those and work out how to lookat the other ones, and then I would miss things andcome back. So it was very intensive”
Too real-time Comments on the difficulty caused bythe real-time presentation ofinformation in the SIEM, whenprimary-task monitoring
“I think in reality you would look at that and gostop/pause, and look at something again”
Primary-taskmonitoring withSonificationSIEM
Sound wasdistracting
Comments on the distraction causedby the sound when primary-taskmonitoring using the SonificationSIEM
“I started to get distracted, because normally, humanbehaviour, when you hear the siren, you know “ok, that’san ambulance, something is wrong”, ... but when you getlots of – I get confused between sirens of ambulance,police, or whatever different sirens, I kind of getdistracted”
Multitasking withSIEM
Could missinformation
Comments on the possibility ofmissing information whenmultitasking using the SIEM
“I could easily miss things because you’re just notlooking at the screen”
Might have beeneasier withsonification
Expressions by participants of theview that they might have found themultitasking easier, had they beenusing the Sonification SIEM
“I feel it would have been easier for me if I had beendoing that task [multitask] with it on, I can definitely seea benefit to that — I wouldn’t have had to keep checkingit because I would have heard alarms coming in”
Would havestoppedmultitasking inreality
Statements that observing particularnetwork states using theSonification SIEM would havecaused participants to stopmultitasking and concentrate on theinformation monitored, if used intheir actual SOC work
“I guess real world, if you have that many alerts youneed to stop what you’re doing”
214

Table D.5: Coding table: Chapters 8 and 9. Theme: Descriptions of experience in the study (continued)
Subthemes Sub-subthemes Definition Example of Evidence from the Data
Multitasking withSonificationSIEM
Difficult to doboth primary taskand listening
Comments that carrying out theseparate primary task, and themonitoring using the SonificationSIEM, simultaneously, causeddifficulty
“When I started concentrating on that [primary task], Icompletely lost concentration on that [sonification], sojust thought I had missed something. So it’s reallyconflicted, completely separate schools of thought. Icouldn’t run them both at the same time”
Sound wasdistracting fromprimary task
Comments that the sound producedby the Sonification SIEM wasdistracting from the separate primarytask
“I didn’t get very far with that [primary task] because Iwas distracted by that. Because I haven’t used it thatoften so I don’t know what to listen out for, I was morefocused on that [monitoring] than I was that [primarytask]”
Prompted bysound to look atthe SIEMdashboard
Observations by participants that,when multitasking using theSonification SIEM, changes in thesound prompted them to look at theSIEM dashboard
“What it did do was it prompted me to look at the SIEMto say ‘oh you’re seeing FTP there, what is it, and thenobviously to look into it a bit deeper”
Sound givesawareness ofinformation in theSIEM
Comments by participants that whenmultitasking using the SonificationSIEM, the sound provided themwith an awareness of the informationrepresented in the SIEM dashboard
“If I was doing something which wasn’t necessarilyimportant but was on the screen, then it [thesonification] would give me some sort of idea of whatwas going on behind it”
FatigueFatiguing sound Comments that using the sound in
the study was fatiguing“With the sound, I did find a little bit of fatigue as well,because there’s a lot going on and you’re trying toassociate each noise with each protocol”
Fatiguing visually Comments that aspects of the studywere fatiguing visually
“The first one I found very tiring actually, constantlywatching the lines, and then obviously it’s the first timeso you’re trying to work out what that means, but thephysical act of watching those at speed”
215

Table D.5: Coding table: Chapters 8 and 9. Theme: Descriptions of experience in the study (continued)
Subthemes Sub-subthemes Definition Example of Evidence from the DataSound was notfatiguing in thisstudy, but mightbe if used forlonger
Suggestions that while using soundhad not been fatiguing for the lengthof this study, it might be fatiguing ifused for longer
“I imagine if it was like that all day then eventually itwould get a bit tiring, but no it was fine”
Detecting andidentifying alertsand anomaloustraffic
Deciding whethertraffic wasanomalous
Comments by participants relating tothe rationale behind their decisionson whether traffic was anomalous
“I was picking up, there was peak in, what I’m thinkingwas some kind of SSH, it was the SSH/FTP/Telnet typetraffic, which on any network would have been a little bitstrange”
Hearing soundsthen derivingmeaning in visuals
Descriptions by participants of theirmethods of first hearing changes inthe sound, and then using the visualsto understand its meaning
“I would hear something that didn’t sound right, andthen look at the visuals to figure out what it was”
Recognisingmeaning directlyfrom sounds
Comments by participants suggestingan interpretation of the networkactivity directly from the soundsheard
“That’s some more voices, and lots going on there.That’s FTP, there’s a lot of that”
Table D.6: Coding table: Chapters 8 and 9. Theme: Integrating sonification into SOCs
Subthemes Sub-subthemes Definition Example of Evidence from the Data
Scenarios in whichpotentially useful
Multitasking The views of participants on thepotential utility of sonificationsystems when multitasking in SOCs
“You can carry on with the – once you memorise thesound, you can carry on with another task, or talking tosomeone, and then if you hear the sound you turn yourattention to the screen”
Night shifts The views of participants on thepotential utility of sonificationsystems when on night shifts
“Especially on nights, because when you’re out of hours,your compos-mentis drops a bit ... you may notnecessarily pick things up quite so quickly so to havesomething real-time, an audio cue is a very good idea”
216

Table D.6: Coding table: Chapters 8 and 9. Theme: Integrating sonification into SOCs (continued)
Subthemes Sub-subthemes Definition Example of Evidence from the DataWhen away fromdesk
The views of participants on thepotential utility of sonificationsystems for when practitioners areaway from their desks
“Normally you could be dealing with other things,walking, going to deal with something, and having asound which could draw your attention back to yourprimary task, I could see there being definitelyfunctionality for that”
Retrospectivehunting tasks
The views of participants on thepotential utility of sonificationsystems in retrospective hunting tasks
“I think specifically for traffic, once we have appropriatetraining on the type of instruments that played, it ispossible to use it as a proactive discovery of anomalousactivity. Do it as a retrospective, proactive discovery inthat sense”
Platformavailability
The views of participants on thepotential utility of sonificationsystems for representing informationabout platform availability
“Availability, which is completely different to thissecurity packet stuff ... to alert by sound”
Monitoringmultiple networks
The views of participants on thepotential utility of sonificationsystems for monitoring the networksof multiple different customers
“I’ve been in a SOC before where we’re monitoring 15different customers, and you literally cannot – you cansit there and monitor through some of one customer,and you can catch up real-time for a while, and thensomething else will kick off and if you’ve got alerts goingoff in your ear, that’s an absolute god send because youcan catch that”
Blind analysts The views of participants on thepotential utility of sonificationsystems for enabling blind people towork as security practitioners inSOCs
“It opens a horizon for a blind security analyst to beworking in a SOC ”
Challenges
Baselining Descriptions of the difficulty ofdetermining network baselines
“We never know a baseline - I would love somebody togive me a baseline”
217

Table D.6: Coding table: Chapters 8 and 9. Theme: Integrating sonification into SOCs (continued)
Subthemes Sub-subthemes Definition Example of Evidence from the DataDistraction Comments on the problems that
could be created in SOCs by thedistraction that sonification systemsmight cause
“I think that’s going to be difficult to do. Because of thedistraction, and I think in any tool, sound is going to bedistracting in that way”
Integration withexistingmonitoringapproaches
Comments on the potentialchallenges to integrating sonificationsystems with the monitoringapproaches currently used in SOCs
“The classification is not always right ... there’s a lot ofdependencies and different factors and variables thatmay impact the accuracy of the sonification”
Obstructingcommunication
Comments that using sonificationsystems could cause problems byobstructing necessary communicationbetween practitioners in SOCs
“We do have to communicate and talk, so having this[sonification] ongoing all the time, yes ok you could justdrop out, but what happens when your manager needs toget hold of you, and what happens when the fire alarmgoes?”
Physical setup ofSOC
Comments on the challenges to usingsonification in SOCs, related to thephysical setup of SOCs
“We’re not in our own little room, we are in the middleof a bigger floor plane, so we would have to be consciousof not disturbing people around us”
Scaling to largeamounts ofnetworkinformation(traffic, alerts,devices, protocols)
Comments on the potentialchallenges of integrating sonificationinto SOCs in light of the largevolumes of information present inthat environment
“It won’t just be that, it will be that times 1000. It wouldbe a bit impractical for that scale of network, because[the organisation] do control a big network – it’s notsmall, it’s every device”
Using sound forextended periodsof time
Observations that using sound forextended periods of time could bechallenging in SOCs
“I don’t think you could keep that up, because we do12-hour shifts, you couldn’t keep up with that for 12hours”
218
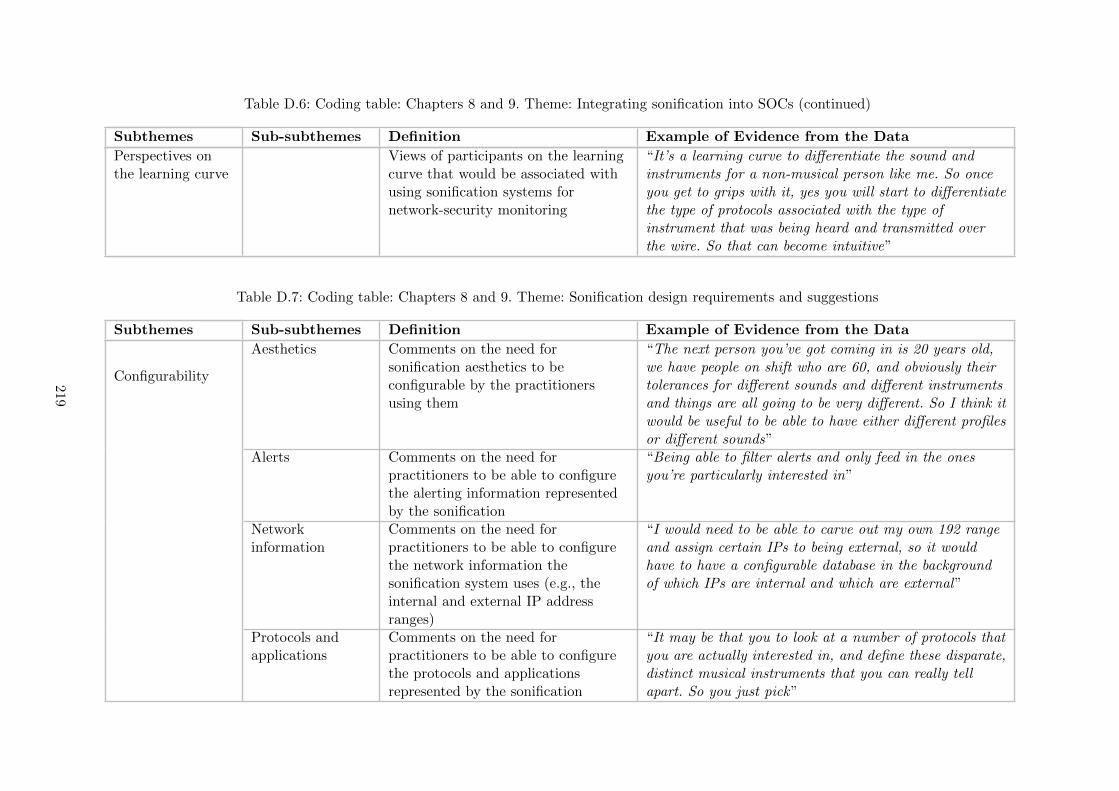
Table D.6: Coding table: Chapters 8 and 9. Theme: Integrating sonification into SOCs (continued)
Subthemes Sub-subthemes Definition Example of Evidence from the Data
Perspectives onthe learning curve
Views of participants on the learningcurve that would be associated withusing sonification systems fornetwork-security monitoring
“It’s a learning curve to differentiate the sound andinstruments for a non-musical person like me. So onceyou get to grips with it, yes you will start to differentiatethe type of protocols associated with the type ofinstrument that was being heard and transmitted overthe wire. So that can become intuitive”
Table D.7: Coding table: Chapters 8 and 9. Theme: Sonification design requirements and suggestions
Subthemes Sub-subthemes Definition Example of Evidence from the Data
Configurability
Aesthetics Comments on the need forsonification aesthetics to beconfigurable by the practitionersusing them
“The next person you’ve got coming in is 20 years old,we have people on shift who are 60, and obviously theirtolerances for different sounds and different instrumentsand things are all going to be very different. So I think itwould be useful to be able to have either different profilesor different sounds”
Alerts Comments on the need forpractitioners to be able to configurethe alerting information representedby the sonification
“Being able to filter alerts and only feed in the onesyou’re particularly interested in”
Networkinformation
Comments on the need forpractitioners to be able to configurethe network information thesonification system uses (e.g., theinternal and external IP addressranges)
“I would need to be able to carve out my own 192 rangeand assign certain IPs to being external, so it wouldhave to have a configurable database in the backgroundof which IPs are internal and which are external”
Protocols andapplications
Comments on the need forpractitioners to be able to configurethe protocols and applicationsrepresented by the sonification
“It may be that you to look at a number of protocols thatyou are actually interested in, and define these disparate,distinct musical instruments that you can really tellapart. So you just pick”
219

Table D.7: Coding table: Chapters 8 and 9. Theme: Sonification design requirements and suggestions (continued)
Subthemes Sub-subthemes Definition Example of Evidence from the Data
Changes to thesonification design
Reducing noise Suggestions of changes to thesonification design related toreducing noise
“I think for me to drop the level of things you werehearing would be more peaceful and less stressful”
Methods ofhighlightingchanges of interest
Suggestions of methods ofhighlighting the changes of interest topractitioners through the sonificationdesign
“It would still be there and I would still maybe hear if itgot a bit dissonant, but it wouldn’t be front and centre.The ones that I’m actually interested in would be thatlittle bit louder. Attract my attention a bit more and helpme pick it out”
Changes toinstrumentation
Comments on the need for changes tothe instruments used in thesonification design
“I think a lot of the sounds that you’ve chosen areactually very similar, so being able to differentiatebetween them – the guitar, I was expecting a twang”
Sonification ofalerts
Design suggestions for thesonification of alerts
“There are different types of priority level in the IDSrules itself ... do you want to break it into – introducesome kind of pitch level maybe, I don’t know, tointroduce more severities. That allows the analyst totake more action to it”
Sonification toolfeatures
Playback Comments on the need for playbackfeatures to be included in sonificationsystems
“From the audio side of things, I guess maybe you needa way of being able to replay things from the last tenminutes, or at least a compressed version of the last tenminutes”
Filtering Comments on the need forpractitioners to be able to filteraspects of the informationrepresented sonically
“Being able to maybe filter out some of the sound, andsay that I’m not interested in particular types ofinstruments, filter out some of the instruments”
220
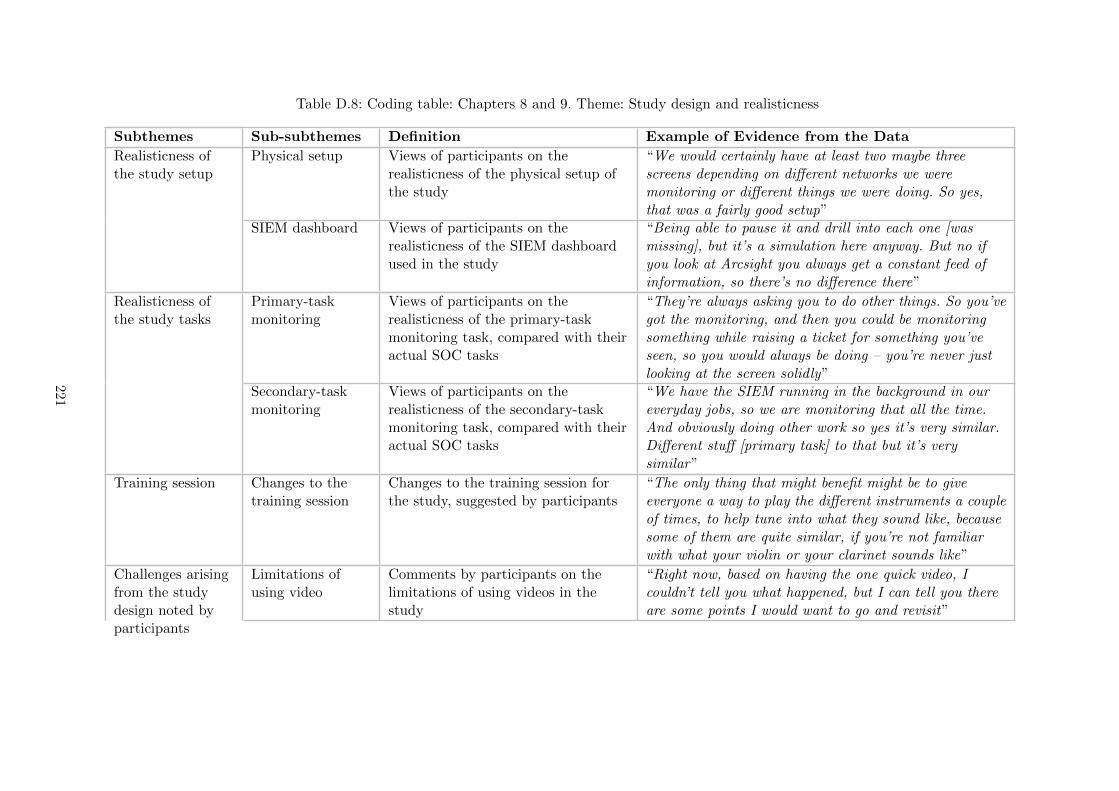
Table D.8: Coding table: Chapters 8 and 9. Theme: Study design and realisticness
Subthemes Sub-subthemes Definition Example of Evidence from the Data
Realisticness ofthe study setup
Physical setup Views of participants on therealisticness of the physical setup ofthe study
“We would certainly have at least two maybe threescreens depending on different networks we weremonitoring or different things we were doing. So yes,that was a fairly good setup”
SIEM dashboard Views of participants on therealisticness of the SIEM dashboardused in the study
“Being able to pause it and drill into each one [wasmissing], but it’s a simulation here anyway. But no ifyou look at Arcsight you always get a constant feed ofinformation, so there’s no difference there”
Realisticness ofthe study tasks
Primary-taskmonitoring
Views of participants on therealisticness of the primary-taskmonitoring task, compared with theiractual SOC tasks
“They’re always asking you to do other things. So you’vegot the monitoring, and then you could be monitoringsomething while raising a ticket for something you’veseen, so you would always be doing – you’re never justlooking at the screen solidly”
Secondary-taskmonitoring
Views of participants on therealisticness of the secondary-taskmonitoring task, compared with theiractual SOC tasks
“We have the SIEM running in the background in oureveryday jobs, so we are monitoring that all the time.And obviously doing other work so yes it’s very similar.Different stuff [primary task] to that but it’s verysimilar”
Training session Changes to thetraining session
Changes to the training session forthe study, suggested by participants
“The only thing that might benefit might be to giveeveryone a way to play the different instruments a coupleof times, to help tune into what they sound like, becausesome of them are quite similar, if you’re not familiarwith what your violin or your clarinet sounds like”
Challenges arisingfrom the studydesign noted byparticipants
Limitations ofusing video
Comments by participants on thelimitations of using videos in thestudy
“Right now, based on having the one quick video, Icouldn’t tell you what happened, but I can tell you thereare some points I would want to go and revisit”
221

Table D.8: Coding table: Chapters 8 and 9. Theme: Study design and realisticness (continued)
Subthemes Sub-subthemes Definition Example of Evidence from the DataIntensity and timepressure
Comments by participants on thechallenges they experienced in thestudy, relating to time pressure andintensity
“So I’m feeling slightly sort of, stressed, a little bit. It’snot so much the jumping from activity to activity, it’sthe during the little samples, having a completely newtool and having it thrown at you means there is a lot ofstuff for you to process, which is all new”
Challenges in theseparate primarytask
Comments by participants on thechallenges they experienced incarrying out the separate OSXshell-based primary task
“I think also I’m not used to using an Mac, I’m used toLinux”
222

Appendix E
Sonification Mappings and Scaling:Magnitude Estimation Study
We report on the results of an online experiment, in which we used magnitude estimation, atechnique used in prior sonification-design research, as an approach to deriving appropriatedata-sound mappings and scaling functions for some of the data parameters involved in oursonification system. We considered data parameters that are related to network-data parame-ters (packet rate, packet size, alert severity, and IP/port commonness respectively) but wereabstracted away from the network-data context for this study (they were presented as rate, size,severity, and commonness). By making this abstraction, we produced results that are general-isable to sonification design more broadly: these data parameters are relevant to a number offields outside network security for which sonification systems might be designed.
This research also contributes to the wider field of sonification design. Some prior workhas explored and compared the effectiveness of using various sonification design strategies anddata-sound mappings (as reported in Chapter 2). Given the importance of selecting appro-priate sonification aesthetics and mappings, there is a need to extend the knowledge abouteffective mappings and methods of scaling. There is also a need to generate efficient, reliableand reproducible methodologies to be used by the sonification research community to assessthe effectiveness of, and generate scaling functions for, other mappings from data to sound(since there are a multitude of possible mappings to be experimented with, and ideally scalingfunctions should be readily available, or found, for each mapping where its use is considered).
With the aim of addressing these needs, we assessed and compared the effectiveness (ac-cording to a range of different definitions) of mappings from four data parameters to four soundparameters (16 mappings in total), and explored ways of reasoning about mapping effectiveness.We derived suitable mapping polarities and scaling functions for these data-sound mappings,based on the perceptions of participants in the study, and these polarities and scaling functionscan inform sonification designers using these mappings. We also made some exploratory obser-vations on the effects of musical experience and gender on our results (although a statisticalanalysis of these effects was prevented by the presence of small and irregular group sizes acrossthe demographics).
While our study methodology was based on the magnitude estimation experiments reportedin prior work (as described in Section E.1.1), this research differs from previous studies insofaras we introduced new data and sound parameters on which no previous experimental mappingwork existed. Furthermore, we demonstrated and reflected on an adaptation of existing mag-nitude estimation methodologies, that could be used in time-efficient experiments using onlineexperiment platforms, and explored new approaches to reasoning about mapping effectiveness.
223

E.1 Background
We used an online platform to run the magnitude estimation experiment reported. In thissection, we review background on magnitude estimation experiments and running studies usingonline platforms, which informed our methodology.
E.1.1 Magnitude Estimation
As described in Section 2.3.5, parameter-mapping sonification involves the representation ofcertain data parameters using selected sound parameters. A range of data-sound mappings hasbeen used in prior work, with some experiments exploring and comparing the effectiveness anddesign (polarity and scaling) of these mappings. Walker presented a methodology for, and theresults of, magnitude estimation experiments aimed at exploring the effectiveness and designof a range of data-sound mappings [179, 180], developed from earlier work in modulus-freemagnitude estimation tasks by Stevens [160]. magnitude estimation is a technique for derivingappropriate mapping polarities and scaling functions for the representation of particular dataparameters as sound, and reasoning about the effectiveness of these mappings.
In the study we report here, we used magnitude estimation as our approach to experimentingwith the effectiveness and scaling of data-sound mappings. The technique involves presentingpeople with audio cues representing different points on a scale for a particular sound parameter(for example, different levels of loudness), and asking them to use these audio cues to estimatethe size of changes in the data parameter that they are prescribed to represent. Participantsmight be told that the loudness of the sound represents the temperature of a liquid, for example,and to estimate the temperature represented by a set of sound cues with varying loudness.
To run a magnitude estimation study, several stimuli must be created. The middle stimulus(the “reference value”) is played first, and given a value for the data dimension represented— height: 100, for example. The other stimuli are then played in a random order, and thelistener is asked to estimate the value of the data dimension represented — for example, 200if it appears twice as loud as the “reference value”. The geometric mean of responses at eachstimulus from all subjects gives a function relating the magnitude of the data dimension to theperceived magnitude of the sound dimension [179].
Walker explored the use of magnitude estimation to investigate three research questions (1)the best sound parameters for representing particular data types; (2) the polarity of data-soundmappings (whether an increase in the value of the sound parameter should represent an increaseor decrease in the value of the data parameter); and (3) the scaling of the data-sound mapping(the size of change in the data parameter that should be represented by a given change inthe sound parameter) [179]. It was found that the type of data represented influenced valueestimation, and that data-sound mappings should therefore be scaled according to the typeof data represented. The use of the unanimity of the polarity perceived by participants for aparticular mapping (the proportion of participants who perceived the same polarity for themapping) as a measure of that mapping’s effectiveness was supported by the results.
In extended work using magnitude estimation, Walker explored the effectiveness and scal-ing of mappings from a set of data parameters (size, temperature, pressure, velocity, numberof dollars, urgency, proximity, attractiveness, danger, and mass) to a set of sound parameters(frequency, tempo, modulation index) [180]. The results of two in-person experiments involving209 and 226 undergraduate student participants respectively were reported, showing that thepolarities and scaling functions were stable across the experiments, that both the data param-eters and the sound parameters involved in a mapping affected listeners’ estimations of value,and that while some estimations were unanimous, others differed across listeners. Walker andMauney investigated individual differences, and the effect of demographics, in the perception ofdata-sound mappings, and found that gender had a significant effect for some mappings [182].
224
E.1.2 Online and User Interface-Based Experiments
Online experiment platforms provide the mechanisms required for running studies online, gath-ering pools of study owners and participants, facilitating the recruitment and payment of par-ticipants in studies, and enabling the collection and storage of study data. Recently, platformssuch as Amazon Mechanical Turk (MTurk), and Prolific Academic, have increasingly been usedto run both industrial and academic studies.1,2 In this way, researchers can gather informationfrom a wide array of participants in diverse locations, without the need for in-person meet-ings, with advantages to time- and cost-efficiency, and to the diversity of participants [46].Recommendations for running studies using these platforms (including payment guidelines forparticipants, for example) have been produced.3
In a comparative study of the use of MTurk for studies in psychology and other socialsciences, Buhrmester, Kwang and Gosling found that the data obtained through MTurk wereat least as reliable as those obtained through traditional methods [46]. Given the difference insetup between these online experiments and traditional in-person experiments, guidelines havebeen proposed to ensure the fair running of studies, and the reduction of bias, in these newmethodologies [89]. An example that has proved to be effective is the use of attention tests,which are non-study tasks designed to measure the extent to which participants are payingattention whilst completing the study [97].
User interface-based experiments have been used to explore the preferences of listenersacross different spatial audio reproduction systems [76, 77, 194]. Francombe, Brookes and Masonproduced preference-rating scales, and assessed the effect of attributes of the sound (such asthe amount of distortion) on preference ratings [77]. Participants completed the experimentthemselves, using a software user interface with multiple pages containing written instructionsfor the completion of the experiment, and sonic material. Given the importance of the acousticreproduction quality and consistency for that experiment, audio reproduction methods includingparticular loudspeakers and headphones were used, and participants were required to be presentin the location in which these audio systems were set up to complete the experiment.
E.2 Development of Data-Sound Mappings for Assessment
We used four data parameters and four sound parameters, resulting in 16 data-sound mappings.
E.2.1 Data Parameters
We aimed to capture a range of contrasting data properties, that were relevant to the widerange of fields in which sonification may be applied. We selected some data parameters thathad not been explored in prior work, in order to generate knowledge on the effectiveness andscaling of data-sound mappings on which no prior experimental work had been reported. Wealso targeted some data-sound mappings that were not new, and had been explored in previoussound perception work (other magnitude estimation experiments, for example); the aim herewas to enable benchmarking of the methodology, through comparison with these prior results.
Using these criteria, we selected four data parameters for experimentation. These parametersare presented below, accompanied by the descriptions with which participants were presentedin the study.
• Rate. “By rate, we refer to the number of events occurring in a certain amount of time.Events occurring very quickly in succession would have a high rate value, while eventsoccurring less frequently would have a lower rate value.”
1https://www.mturk.com/2https://www.prolific.ac/3http://wiki.wearedynamo.org/index.php/Guidelines_for_Academic_Requesters
225

• Size. “By size, we refer to how big or small an event is. An event that is large would havea high size value, while a smaller event would have a lower size value.”
• Severity. “By severity, we refer to how severe an event is. An event that is very severe,and therefore a cause for concern, would have a high severity value, while an event that isnot severe, and should not cause concern, would have a low severity value.”
• Commonness. “By commonness, we refer to how usual it is for an event to occur. Anevent that occurs often would have a high commonness value, while an event that does notoccur often would have a low commonness value.”
E.2.2 Sound Parameters
The rationale behind our choice of sound parameters was similar to that described for theselection of data parameters: we aimed to capture a range of contrasting sonic properties,combining both new and previously explored sound parameters. Furthermore, we aimed totarget a range of properties with which we expected that participants with and without musicalexperience might perform differently, to enable us to explore the effect of musical experienceon performance using such mappings. We anticipated, for example, that non-musicians mightperceive changes in tempo, and estimate their magnitude, more readily than changes to thedegree of consonance, while we expected that participants with musical training might perceivethese changes to consonance, which is a more exclusively “musical” property, more clearly.
Using these criteria, we selected four sound parameters. These parameters are presentedbelow, with a description of the way in which we treated each for this study.
• Tempo. The speed with which consecutive events were played. High tempo meant thatevents were occurring quickly in succession, while for lower tempos the time between theplaying of each consecutive note was longer.
• Articulation. We treated articulation as a scale between very staccato (very short, sharpnote durations), and very legato (very long, sustained note durations).
• Pitch. The frequency at which a note was played — from low-pitched (deep-sounding)notes, to high pitched notes.
• Degree of Consonance. The extent to which a set of notes sounded consonant, or“fitted into the harmony”. We used Euler’s definition of the “Degree of Consonance”(see description of this method and calculation below) [117] to define a range from verydissonant chords (which do not appear to “fit into the harmony”) to very consonantchords.
We now describe the method we used to calculate the Degree of Consonance soundparameter. We followed an approach defined by Euler to calculating the degree of consonance ofa musical interval [117]. In that approach, the degree of consonance of an interval with ratio a : bis equal to the degree of agreeableness of the least common multiple (lcm) of the numbers in theratio d(a : b) = d(lcm(a, b)), where the degree of agreeableness d(n) of a number n = pa11 p
a22 ...p
ann
(as a product of its prime factors) is d(n) = a1(p1 − 1) + ...+ an(pn − 1) + 1.
Table E.1: Ratios of musical intervals with respect to C
C C# D D# E F F# G G# A A# B C
1:1 16:15 9:8 6:5 5:4 4:3 45:32 3:2 8:5 5:3 9:5 15:8 2:1
We developed an approach to using this definition of the degree of consonance as a soundparameter. Taking all m combinations of n notes, where n ∈ {2, ...4}, for example, we calculated
226

an ordered list of the degree of consonance for these m combinations of notes (i.e., chords). Anexample of the calculation for a combination of n = 4 notes is presented below.
1. For the notes in the chord, find the ratios of each note relative to C. For example, from C:the ratios of D#, F, A# (the chord shown in Figure E.1) are 6
5 , 43 , 9
5 respectively (theseratios are shown in Table E.1).
G 44 ˇˇ ˇˇ
Figure E.1: Example chord for degrees of consonance calculation: C, D#, F, A#.
2. Find the ratio of the chord notes relative to each other. For example, in the chord above(C, D#, F, A#), the ratios 6
5 :43 :9
5 can be rewritten as 7260 :60
45 :4525 , so the ratio of all notes in
the chord can be expressed: 72:60:45:25. For chords of different sizes, these are found asfollows:
• If the number of notes (in addition to C) is 1: return the ratio of first note
• If the number of notes is 2:
lcm(b, c)× ab : lcm(b, c) : lcm(b, c)× d
c
• If the number of notes is 3:
lcm(b, c)× lcm(d, e)× adb : lcm(b,c)×lcm(d,e)
d : lcm(d,e)×lcm(b,c)c : lcm(d, e)× lcm(b, c)× f
ce
3. Find the lcm of the values in the ratio. In the working example, lcm(75, 60, 45, 25) = 900
4. Express the lcm as a product of its prime factors pa11 pa22 ...p
ann . In this example:
900 = 32 × 4× 52 =⇒ p1 = 3, p2 = 4, p3 = 5, a1 = 2, a2 = 1, a3 = 2.
5. Then the degree of consonance of the chord is:
d(n) = a1(p1 − 1) + ...+ an(pn − 1) + 1.
In this example, d(n) = 2× 2 + 1× 3 + 2× 4 = 15.
We thus produced a list of the degrees of consonance of all combinations of up to four notes,the greatest distance between the lowest and highest of which was one octave. In Section E.3.4we show how we used this list of degrees of consonance to select note combinations to serve assound stimuli for the degree of consonance sound parameter.
E.2.3 Existing Knowledge on the Selected Data-Sound Mappings
In Table E.2, we present the prior results obtained in the magnitude estimation work by Walker,for mappings using the same data or sound parameters as we are exploring, or those that weconsider are related (e.g., we consider that “severity” is related to “urgency”). This forms thebasis of the comparison of our results with prior work in Section E.5, through which we canbenchmark our methodology.
227

Table E.2: Relevant results from prior work
Soundparameter
Reference Rate (“velocity”[180])
Size (“size”[180])
Severity(“urgency” [180])
Pitch “Frequency”[180]
polarity majority:+; unanimity: 0.95;m: 0.77; r2: 0.96
polarity majority:-; unanimity: 0.53;m: -0.87, 0.66; r2:0.97, 0.98
polarity majority:+; unanimity: 0.74;m: 0.70; r2: 0.98
Tempo “Tempo”[180]
polarity majority:+; unanimity: 0.89;m: 0.90; r2: 0.99
polarity majority:equal +, -;unanimity: 0.47; m:0.87, -0.77; r2:0.99, 0.94
polarity majority:+; unanimity: 0.89;m: 0.64; r2: 0.99
E.3 Methodology
We designed the methodology for our online study, with a view to addressing the followingquestions for the data-sound mappings developed in Section E.2.
1. Which are the most effective sound parameters for representing a given data parameter?
2. Which mapping polarities are perceived by participants? For a given increase in the valueof the sound parameter, do participants perceive an increase or decrease in the value ofthe data parameter it represents?
3. Which scaling functions are perceived by participants, for a particular data-sound map-ping?
4. To what extent do musical experience and gender affect results relating to the threequestions above? We made preliminary observations on this question, since the samplesizes we collected within some demographics were too small to allow a full statisticalanalysis.
The experiment methodology and analysis approach draw on the magnitude estimationtechniques developed by Walker [180], described in Section E.1.1.
E.3.1 Recruitment and Introduction
We carried out the magnitude estimation study online, using Prolific Academic, an online facilityfor recruiting experiment participants, and for carrying out experiments (see Section E.1.2).In the recruitment material displayed through Prolific Academic, the basis of the study —listening and responding to audio clips — was described, and a more detailed explanation ofthe process given. Participants were paid £2.50 for their participation, through the ProlificAcademic payment facility. The average completion time for the study was 15 minutes, andthe rate therefore £10 per hour, which falls within fair pay guidelines (as described in SectionE.1.2). The maximum allowed time was 120 minutes.
At the beginning of the study, participants were informed that their payment was conditionalon their completion of all response boxes, and correct completion of all attention checks. The useof attention checks has been recommended in guidelines for running online studies (see SectionE.1.2), and our use of attention checks is described in Section E.3.5. The exclusion criteriondescribed in the recruitment material was that participants must be able to listen to audiothrough either speakers or headphones.
We received ethical approval for this study from the Central University Research EthicsCommittee at the University of Oxford (reference R44043/RE006). After reading the online
228

participant information webpage, and before indicating their consent to participate by proceed-ing to the next study webpage, participants were asked to report their Participant ID, providedby Prolific Academic. This ID enabled us to correlate the results submitted on each page, and topay participants following completion of the study, using the Prolific Academic payment facility.
E.3.2 Study Process
Figure E.2 illustrates the process we used for magnitude estimation.
Introduce eachof the 16 data-sound mappingpairs dsx, forx ∈ (1, 16),
which has Nx
sound stimuli
Present dataparameter dx,and play first
corresponding soundstimulus sx1 (inmiddle of sound
parameter range)
Play remainingsound stimuli(sxn for n ∈(2, Nx)) fordata-sound
mapping pair dsx
For each soundstimulus sxn,
participant enterstheir estimate ofthe value of the
data parameter dxnin a free-text box
Figure E.2: Magnitude estimation experiment: overview of methodology
As shown in Figure E.2, participants were presented with a data-sound mapping (e.g. dataparameter: size mapped to sound parameter: amplitude). A stimulus (mid-range for the soundparameter) was presented initially, and a data value assigned to it (e.g., a mid-range amplitudenote was played, and assigned the value, size: 100). The other stimuli (ten stimuli were used intotal for each data-sound mapping) were then played in a randomised order, with the restrictionthat the smallest or largest stimulus could not occur first. These guidelines in the ordering ofsound stimuli were given by Walker in his prior work reporting magnitude estimation method-ologies. Participants were asked to write their estimation of the data parameter value (e.g., thevalue of size) represented in a free text box.
Once all estimations for the values of the data-sound mapping had been completed, partic-ipants proceeded to the next data-sound mapping, until they had been presented with each ofthe four data parameters used in the experiment.
E.3.3 Online Interface
To complete the study, participants followed an online study interface themselves. This beganwith an introduction page, which included the participant consent process and a description ofthe study. Participants then proceeded to the following page, in which participant demographics(level of musical experience, country of origin, gender and age) were collected (the collection ofdemographics is described in more detail in Section 4.2.2). The study tasks then began. Theweb interface used by participants in the experiment is shown in Figure E.3. This is an exampleof the page participants would use in the task relating to sound mappings to the size dataparameter.
On each page, participants were given the following instructions (this example relates to thesize data parameter in Figure E.3).
The data parameter represented by the sounds on this page is size. By size, we referto how big or small an event is. An event that is large would have a high size value,while a smaller event would have a lower size value.
Please listen to the first sound clip - the “reference sound”, which lasts for eightseconds. Each of the sounds played during this reference sound represents an eventof size: 100. Then proceed by listening to each of the sound clips in turn. In each ofthese sound clips a “task sound” which may differ from the “reference sound” will
229

Figure E.3: Web interface used by participants
play for eight seconds. Please estimate the size of the events represented in the ”tasksound”, by entering your estimation of the size value in the corresponding text box.
You may return to play any of the sound clips, including the “reference sound”, asmany times as you wish. Once you have completed the text boxes for all sound clips,you may proceed to the next page.
The aim, as in previous magnitude estimation work using these type of instructions, wasto encourage participants to use a ratio scale, without prescribing a range for the scale. Theresponses of participants were submitted through the online interface, and stored, to be accessedfor analysis by the researchers.
E.3.4 Sound Stimuli
The stimuli used for each sound parameter were calculated as follows.
• Tempo: a range of ten equally spaced stimuli from one note per second to ten notes persecond (1, 2, 3, 4, 5, 6, 7, 8, 9, 10 notes per second).
• Articulation: a range of ten equally spaced legato values (as represented by SuperCollidersound engine, which we described in Section 2.3.1): 0.01, 0.112, 0.223, 0.334, 0.445, 0.556,0.667, 0.778, 0.889, 1.0.
• Pitch: ascending fifths from G1-A6 (G1, D2, A2, E3, B3, F4, C5, G5, D6, A6).
I8 ˇ ˇ ˇ ˇ ˇ
Hˇ ˇ ˇ 8��������‰ˇ ˇ
Figure E.4: Pitches used as stimuli for the pitch sound parameter. Left to right shows stimuli1-10: G1, D2, A2, E3, B3, F4, C5, G5, D6, A6.
• Degree of consonance: all chords of up to four notes were listed in order of degree ofconsonance with C (according to the definition by Euler — see Section E.2.2). Chordswith degrees of consonance matching the series 2, 4, 6, 8, 10,... were selected, with thecondition that their top note was a C (to prevent perceived pitch from interfering withparticipants’ judgement, as a higher top note could produce a higher perceived pitch of
230

the chord). Since no chords with degree 18 or 20 had top note C, we selected chords withdegrees: 2, 4, 6, 8, 10, 12, 14, 16, 19, 21, and account for this deviation from the serieswhen considering the data value estimates made by participants by scaling the data valueestimates against the actual degree of consonance values.
G ˇˇ
ˇˇˇ
ˇˇˇ
ˇˇˇ 2 ˇˇˇ
ˇ 2 ˇˇˇˇ 4 ˇˇ
ˇˇ 2 ˇˇ ˇˇ 44 ˇˇˇ
ˇ 4 ˇˇ ˇˇ
Figure E.5: Chords used as stimuli for degrees of consonance sound parameter. Left-to-rightshows stimuli 1-10, with degrees of consonance 2, 4, 6, 8, 10, 12, 14, 16, 19, 21, respectively.
E.3.5 Reliability
To ensure that participants listened to all audio clips and paid full attention to the study, weincluded two “attention checks” in the study webpages [97]. Only the results collected for the100 participants who completed both attention checks correctly were used in the analysis. Theattention checks were two audio clips which contained verbal instructions to insert a spokenpassword into the corresponding answer text box, instead of a numeric quantity. Visually, theaudio clip button and answer text box were identical to the others, so only participants wholistened to that audio clip could have answered the attention check correctly. Participants wereinformed at the beginning of the study that there would be attention checks during the study(but were given no information on the form these checks would take, or the number of checksthere would be), and that they would be reimbursed for their participation only if the attentionchecks were completed correctly.
For each participant, the order in which the four data parameters were presented was pseu-dorandomised, and the sound parameter to which each data parameter was mapped was pseu-dorandomised.
E.3.6 Analysis
Our aim in the data analysis was to explore the effectiveness of each data-sound mapping, toassess trends in the polarities chosen, and to derive scaling functions for the mappings. Thestages of our data analysis are illustrated in Figure E.6.
1. All responsesfor each data-
sound mappingplotted as
log-log plots.Power functioncalculated for
the responses ofeach participant
individually.
2. Polarityof individualparticipants’
power functionscalculated;polarities
grouped into“positive”,
“negative”, and“no significant
polarity”categories.
3. For eachpolarity category(e.g., all “positive
polarities”grouped),geometric
mean at eachsound cue value
taken, andpower functioncalculated using
geometric means.
4. Gradient ofpower function
(equal toexponent of
scaling functionfor non-log
data) calculated;r-value errors
calculated.
Figure E.6: Analysis process for each data-sound mapping
We describe the analysis stages shown in Figure E.6 in more detail.
231

1. We calculated a power function of the form Y = bXm for the responses of each individuallistener. Here, the exponent m indicates the size of the effect of changing the stimulusvalue on the perceived change in the estimated value. We calculated power functions byplotting the log of the estimated data values against the log of the value of the relevantsound cue. We took a line of best fit for this log-log plot, y = Ax + B. Here, in relationto the original equation, m = A and b = eB since:
Ax+B = y = log(Y ) = log(bXm) = log(b) + log(Xm) = m log(X) + log(b) = mx+ log(b)
2. In order to assess the polarity of the responses of an individual listener for a particulardata-sound mapping, we calculated the Pearson Product Moment Coefficient (PMCC) forthe log-log plot (using a two-tailed test, since we had no prior hypothesis as to the signof the correlation). There were three polarities into which the results fell, based on thePMCC value, which could indicate either a significant positive or negative correlation, orno significant correlation: positive polarity, negative polarity, and no polarity [179, 181].These polarities were defined as follows, using a defined level of statistical significancercritical = 0.632: the critical value for the PMCC, with Degree of Freedom df = 10−2 = 8(since 10 is the number of data points for each mapping); α = 0.05.
• Positive polarity : the value of the correlation coefficient was positive, and its abso-lute value reached the defined level of statistical significance rcritical (PMCC > 0,|PMCC| > rcritical).
• Negative polarity : the value of the correlation coefficient was negative, and its abso-lute value reached the defined level of statistical significance rcritical (PMCC < 0,|PMCC| > rcritical).
• No polarity : the absolute value of the correlation coefficient did not reach the definedlevel of statistical significance rcritical (|PMCC| < rcritical).
3. We grouped all responses by positive polarity, negative polarity or no polarity. For eachof the positive and negative polarity groups for each data-sound mapping, we took thegeometric mean of all responses in that group, and calculated a power function usingthese means, to describe the average power function representing all responses with thatpolarity. Beginning the analysis by grouping responses into these polarities enabled us toassess whether each individual had perceived a polarity for the mapping, with significance,and to then analyse the responses according to these groupings.
4. From these calculations, we derived:
• The majority (most common) polarities perceived for each data-sound mapping.
• A ratio representing the unanimity of polarity: the ratio of those participants whoperceived the majority polarity to those who did not.
• For mappings with a positive or negative polarity, a power function calculated fromthe mean average responses of all participants whose responses had that polarity.
• The PMCC r-value for each line. This is a measure of how close the actual estimatesof participants were to the fitted power function.
232

Mapping effectiveness definitions
Using the output of the analysis approach described, we considered that the effectiveness of amapping could be measured in the following three ways. We explore what each measure tells us,before producing combined definitions of overall effectiveness incorporating all three measures.These measures and definitions are used for the purpose of exploring methods of measuringsonification mapping effectiveness, and we discuss their strengths and weaknesses in SectionE.5.2.
1. Polarity Proportion. We calculated the proportion of participants who perceived asignificant polarity for each mapping, either positive or negative (this is the proportionreported in the “Proportion with Polarity” column in Table E.3). We considered thatmeasuring what proportion of the participants presented with a data-sound mappingperceived it to have a polarity (as opposed to perceiving it with no significant polarity)could be an indication of its effectiveness, since the perception of a polarity, either positiveor negative, indicates that the participant has been able to make some interpretation ofthe mapping. This measure is important, adapted from Walker’s “unanimity of polarity”(which is described in the next point), since in this measure effectiveness is not affectedby participants perceiving different polarities. We posit that a difference in the mappingpolarity perceived may in fact be due to differences between individuals, rather than theeffectiveness of the mapping, and a mapping may be effective with positive polarity forone listener, and negative polarity for another.
2. Unanimity of Polarity. We observed the unanimity of the polarity choices for each map-ping, as defined by Walker [180]. Across all participants whose results had a significantpolarity, we calculated the ratio of positive to negative polarity responses. The more unan-imously participants produced either a positive or negative polarity with their estimates,the more confidence we can have in assigning that gradient to the mapping. Mappingswere considered to have a majority polarity, if over half of all polarities (positive, negativeand no polarity) fell into either the positive or negative category. In Table E.3:
• The column “Unanimity (all)” presents the proportion of all estimates (those withpositive, negative, and no polarities) that had the majority polarity, calculated as:(number of participants with majority polarity responses)/(number of responses).
• The column “Unanimity (pol)” contains the proportion of only those estimateswith polarity (positive or negative, with “no polarity” excluded) that had the ma-jority polarity, calculated as: (number of participants with majority polarity re-sponses)/(number of participants with significant polarity responses). This showsthe unanimity of polarity responses amongst only those participants who had per-ceived a significant polarity for the mapping.
The effectiveness measure Unanimity of Polarity refers to the “Unanimity (pol)” cal-culation presented in the results tables.
3. Pearson Correlation Coefficient (PMCC) r-value. We calculated the PMCC r-valueerror on the plots generated for the majority polarity. We thus assessed the extent to whichthe mean estimates were correlated to the line of best fit derived. This assessment of thecloseness of the average value estimates to the line of best fit produced (by observing theirdeviation from it) enabled us to make an assessment of the precision of the derived scalingfunctions in describing participants’ estimates — which we posit is another approach toexploring the effectiveness of the mapping. The effectiveness measure r-value is equal to|r|, where r is the PMCC r-value.
233

From these three individual measures of effectiveness: Polarity Proportion, Unanimityof Polarity, and r-value, we produced two combined definitions of effectiveness, by which wecould consider overall effectiveness, enabling us to compare across mappings. These two com-bined definitions are presented below. Combined Effectiveness Definition 1 uses thresholdvalues for all three of the measures presented above, while Combined Effectiveness Defi-nition 2 uses threshold values for the latter two measures only, addressing only the results ofthose participants who had perceived a significant polarity for each mapping. We selected thethreshold values by considering values that might constitute a significant proportion for each ofthe three measures above, enabling us to compare across mappings.
Combined Effectiveness Definition 2 addresses the question: “how effective was themapping for only those participants who were able to make a reasonable interpretation of it?”,and highlights mappings that were effective for certain users, with potential for use in per-sonalised sonification designs, for example. It uses the fact that some participants were ableto perceive certain mappings better than others (under the assumption that if a participantperceives a significant polarity for a mapping, then they have been able to make a reasonableinterpretation of that mapping), and measures effectiveness using only the Unanimity of Po-larity and r-value for those participants, i.e., omitting the Polarity Proportion). CombinedEffectiveness Definition 1, on the other hand, considers the effectiveness of a mapping acrossall participants, including those that we judge did not make a reasonable interpretation of it,and is in this sense a stronger definition (since mappings meeting Combined EffectivenessDefinition 1 must also meet Combined Effectiveness Definition 2, but not vice versa).We consider the strengths and weaknesses of these definitions in Section E.5.2.
1. Combined Effectiveness Definition 1. A data-sound mapping is effective, if it hasPolarity Proportion > 0.6, Unanimity of Polarity (pol) > 0.7, and r-value > 0.8.
2. Combined Effectiveness Definition 2. A data-sound mapping is effective, if it hasUnanimity of Polarity (pol) > 0.7, and r-value > 0.8.
E.4 Results
The study was completed by 100 participants, of which 50 were male, 49 female, and one didnot specify their gender. Of the participants, 26 claimed to have some level of musical training(self-taught or instructed training of any level on a musical instrument), while 74 did not. Wemake preliminary observations on the effect of musical training and gender on participants’performance in Section E.4.2.
For each of the 16 pairings of data parameter to sound parameter, we collected all estimatesmade by participants of the data value represented by each sound cue. As described in SectionE.3.6 we used these values to calculate power functions representing the average for all significantpositive polarity responses, and all significant negative polarity responses, for each data soundmapping. In Figure E.7, we present the plots of these positive and negative polarity powerfunctions, with the positive functions represented by dots, and the negative functions by crosses.It is clear from these plots that stronger linear relationships were produced from the estimatesof participants using some data-sound mappings than others, and the aim of our analysis wasto understand these differences.
In Table E.3, we present the results: the number of each pairing presented to participantsin the experiment; the number and proportion of participants whose responses had positive,negative, or no polarity for each data-sound mapping; power function exponents m for thosemappings with positive or negative polarity; and the r-value indicating the deviation at eachvalue from this power function (r-value in Section E.3.6). We also present the proportion ofparticipants whose responses had some significant polarity (Polarity Proportion in Section
234

Figure E.7: Positive and negative power functions over log-log plots of the data parameters(x-axis values) to sound parameters (y axis values). Values that are part of positive functionsare represented by dots; values that are part of negative functions are represented by crosses.
E.3.6), the majority polarity for each mapping (the polarity with which the majority of partici-pants perceived the mapping), and the Unanimity of Polarity ratios. “Unanimity (all)” presentsthe estimates with the majority polarity as a proportion of all estimates, while “Unanimity(pol)” (Unanimity of Polarity in Section E.3.6) presents the estimates with the majoritypolarity as a proportion of only those estimates with a significant polarity. These “Unanimity”calculations are described in Section E.3.6.
We refer to mappings with majority polarities + and - as having obtained a true majority,meaning that a majority of all participants presented with the mapping responded with thatpolarity. Majority polarities (+) or (-) do not have a true majority, indicating that of theresponses with a significant polarity, a majority were positive or negative, respectively, yetthe number of participants who perceived the mapping with this polarity did not constitutea majority of those presented with the mapping. The table shows that most mappings (ten)obtained Majority polarity +, while six obtained (+) or (-) (not a true majority).
235

Table E.3: Results: number of positive/negative/no polarity estimates; polarity majorities;power functions; error calculations; unanimity of polarity
Data
Para
mete
r
Sou
nd
Para
mete
r
Tota
lP
art
icip
ants
Pro
port
ion
wit
hP
ola
rity
Pola
rity
Nu
mb
er
m PM
CC
r-valu
e
Majo
rity
Pola
rity
Un
an
imit
y(a
ll)
Un
an
imit
y(p
ol)
Severi
ty
Tempo 20 18 (0.9)+ 18 0.71 0.97
+ 0.90 1.0- 0None 2
Articulation 26 17 (0.65)+ 16 0.29 0.98
+ 0.62 0.94- 1 0None 9
Consonance 32 16 (0.50)+ 16 0.44 0.92
+ 0.5 1.0- 0None 16
Pitch 21 15 (0.71)+ 14 1.41 0.97
+ 0.67 0.93- 1 -1.13 -0.94None 6
Siz
e
Tempo 24 20 (0.83)+ 19 0.58 0.97
+ 0.79 0.95- 1 -0.74 -0.88None 4
Articulation 21 14 (0.67)+ 13 0.24 0.99
+ 0.62 0.93- 1 -0.12 -0.85None 7
Consonance 27 14 (0.52)+ 13 0.48 0.94
(+) 0.48 0.93- 1 -1.66 -0.84None 13
Pitch 27 23 (0.85)+ 18 1.56 0.99
+ 0.67 0.78- 5 -1.20 -0.85None 4
Com
mon
ness
Tempo 35 27 (0.77)+ 25 0.62 0.96
+ 0.71 0.93- 2 -0.74 -0.90None 8
Articulation 24 13 (0.54)+ 11 0.47 0.92
(+) 0.46 0.85- 2 -0.14 -0.81None 11
Consonance 20 8 (0.40)+ 3 0.37 0.89
(-) 0.15 0.63- 5 -0.31 -0.89None 12
Pitch 21 11 (0.52)+ 7 0.83 0.81
(+) 0.33 0.64- 4 -1.33 -0.89None 10
Rate
Tempo 20 19 (0.95)+ 19 0.53 0.91
+ 0.95 1.0- 0None 1
Articulation 28 18 (0.64)+ 11 0.30 0.97
(+) 0.39 0.61- 7 -0.14 -0.84None 10
Consonance 20 9 (0.45)+ 5 0.43 0.90
(+) 0.25 0.56- 4 -0.28 -0.80None 11
Pitch 31 24 (0.77)+ 20 1.14 0.98
+ 0.65 0.83- 4 0None 7
236

The results in Table E.3 show that there were wide variations in the proportions of differentdata-sound mappings that were perceived to have polarity. The mapping from rate to tempo, forexample, was perceived with a significant polarity by 95% of the participants it was presentedto, while the mapping from commonness to consonance was perceived with a significant polar-ity by only 40%. Furthermore, there was variation in the Unanimity of Polarity calculationsacross mappings, with “Unanimity (all)” ranging between 0.15 (commonness-consonance) and0.90 (severity-tempo), for example. This shows that as well as differences between the num-ber of participants who perceived any significant polarity across different mappings, there weredifferent levels of agreement in the perception of these polarities as positive or negative.
The power function exponents (m) calculated for the mappings with significant polarityvaried between 0.24 (size-articulation) and 1.56 (size-pitch). In summary, the results presentedin the table suggest that some mappings may have been perceived with stronger polaritiesthan others, and that the scaling functions perceived differed between mappings. In the nextsection, we compare the effectiveness of the mappings, according to our definitions of mappingeffectiveness.
E.4.1 Mapping Effectiveness
In Table E.4, we present the analysis of the effectiveness of the mappings. In each cell incolumns 2-4, the sound parameters are ordered from most to least effective as mappings tothe data parameter in question, according to the three measures of effectiveness, described inSection E.3.6. In the fifth column, the effectiveness of mappings assessed using the CombinedEffectiveness Definitions is presented. In this column, the mappings are not ordered byeffectiveness, but mappings meeting Combined Effectiveness Definition 1 are shaded darkgrey, while those meeting Combined Effectiveness Definition 2 are shaded light grey.
Table E.4: Results: mapping effectiveness (from most to least effective for each data parameter)according to each definition of effectiveness (as defined in Section E.3.6).
Data Effectiveness:PolarityProportion
Effectiveness:Unanimity ofPolarity
Effectiveness:PMCC r-value
CombinedEffectivenessDefinitions
Severity
Tempo: 0.9 Consonance: 1.0 Articulation: 0.98 ArticulationPitch: 0.71 Tempo: 1.0 Pitch: 0.97 PitchArticulation: 0.65 Articulation: 0.94 Tempo: 0.97 TempoConsonance: 0.50 Pitch: 0.93 Consonance: 0.92 Consonance
Size
Pitch: 0.85 Tempo: 0.95 Articulation: 0.99 PitchTempo: 0.83 Articulation: 0.93 Pitch: 0.99 TempoArticulation: 0.67 Consonance: 0.93 Tempo: 0.97 ArticulationConsonance: 0.52 Pitch: 0.78 Consonance: 0.94 Consonance
Commonness
Tempo: 0.77 Tempo: 0.93 Tempo: 0.96 TempoArticulation: 0.54 Articulation: 0.85 Articulation: 0.92 ArticulationPitch: 0.52 Pitch: 0.64 Consonance: 0.89 ConsonanceConsonance: 0.40 Consonance: 0.63 Pitch: 0.81 Pitch
Rate
Tempo: 0.95 Tempo: 1.0 Pitch: 0.98 PitchPitch: 0.77 Pitch: 0.83 Articulation: 0.97 TempoArticulation: 0.64 Articulation: 0.61 Tempo: 0.91 ArticulationConsonance: 0.45 Consonance: 0.56 Consonance: 0.90 Consonance
As shown in Table E.4, there are some discrepancies between the effectiveness of data-soundmappings according to different measures. The mapping from severity to tempo is most effectiveby Polarity Proportion for example, while by the r-value effectiveness measure severity ismore effectively mapped to articulation.
Mappings using tempo as a sound parameter were always effective by Combined Effec-
237

tiveness Definition 1, signalling that they were effective for most participants. Other soundparameters, consonance in particular, met Combined Effectiveness Definition 2, mean-ing that they were effective when used by only a subset of participants — those who wereable to make a reasonable interpretation of them — when mapped to severity and size. Forother data parameters — commonness and rate — consonance was not perceived effectivelyby participants under the Combined Effectiveness Definitions, since there was significantdiscrepancy between the polarities perceived by participants, resulting in a low Unanimity ofPolarity measure. We discuss the implications of this Unanimity of Polarity measure forsonification design further in Section E.5.1: in reality, this may not signal the ineffectiveness ofthe mapping, but that different participants perceive it effectively with different polarities.
There were some interesting differences in the effectiveness of other sound parameters; pitchwas effective when mapped to rate, for example, but much less so when mapped to commonness,while articulation was an effective mapping for severity and size, but not for rate. Certain map-pings, in particular those from commonness to both consonance and pitch, and those from rateto both articulation and consonance, seem to have been more challenging to perceive, or causedmore discrepancy in their perception, than others. The mapping from rate to articulation, forexample, failed to meet the Combined Effectiveness Definitions due to a low Unanimityof Polarity score, as can be seen from the values in Table E.3.
E.4.2 Preliminary Observations on the Effect of Musical Experience andGender
We explored the effect of musical experience and gender on the results obtained, by dividingthem over these different groups, and we present these divided results in Table E.5. As shownin the table, some of the groups were very small when split over these demographics (in themusical experience division in particular), and the distribution of participants across groups wasirregular due to the pseudorandomisation procedure we used to assign mappings to participants(see Section E.3.5). We opted to consider the differences between groups, searching by eye forclear differences, since the sample sizes within some groups were too small to allow us to performstatistical significance tests such as Analysis of Variance (ANOVA), and we discuss this furtherin Section E.5.2. The observations presented in this section are therefore exploratory, based onlyon preliminary evidence.
In Tables E.5 and E.6, the results are split over two demographics: musical experience (yesvalue: participant had some level of musical training; no value: participant had no musicaltraining); and gender (male; female). In the table, “n/a” is written in cases where there was nomajority (the number of responses with positive, negative, and no polarity were equal).
As shown in Tables E.5 and E.6, some of the groups were very small when split over thesedemographics (in musical experience groups in particular), and the distribution of participantsacross groups was irregular due to the randomisation procedure we used to assign mappings toparticipants (see Section E.3.5). We therefore opted to consider the differences between groups,searching by eye for clear differences, rather than performing statistical significance tests suchas ANOVA analysis, and we discuss this further in Section E.5.2.
In general, there was agreement across the demographic groupings as to the majority po-larities of mappings, with the only exceptions being in cases where the proportion who hadperceived any polarity was low and as such the polarity did not constitute a true majority of allresponses (as defined for Table E.3). The mapping from rate to consonance, for example, hadmajority polarity (+) for participants with, and (-) for those without, musical experience.
In Table E.7, we show the analysis of the mappings according to the Combined Effective-ness Definitions (see Section E.3.6). As in Table E.4, those meeting Combined EffectivenessDefinition 1 are shaded dark grey, while those meeting Combined Effectiveness Definition2 are shaded light grey. The mappings are not in order, but either meet the definitions, or donot.
238

Table E.5: Results divided by level of musical experienceD
ata
Para
mete
rS
ou
nd
Para
mete
r
Tota
lP
art
icip
ants
Pro
port
ion
wit
hP
ola
rity
Majo
rity
Pola
rity
m PM
CC
r-valu
e
Un
an
imit
y(a
ll)
Un
an
imit
y(p
ol)
Mus.: Y N Y N Y N Y N Y N Y N Y N
Severi
ty
Tem. 6 14 6(1.0)
12(0.86)
+ + 0.71 0.71 0.98 0.95 1.0 0.86 1.0 1.0
Art. 10 16 7(0.70)
10(0.63)
+ + 0.35 0.24 0.97 0.98 0.70 0.56 1.0 0.90
Con. 5 27 3(0.60)
13(0.48)
+ (+) 0.50 0.43 0.88 0.92 0.60 0.48 1.0 1.0
Pit. 5 16 4(0.80)
11(0.69)
+ + 1.58 1.33 0.99 0.94 0.80 0.63 1.0 0.91
Siz
e
Tem. 4 20 3(0.75)
17(0.85)
+ + 0.49 0.60 0.90 0.98 0.75 0.80 1.0 0.94
Art. 3 18 2(0.67)
12(0.67)
n/a + n/a 0.22 n/a 0.98 n/a 0.67 0.50 1.0
Con. 9 18 7(0.78)
7(0.39)
+ (+) 0.48 0.47 0.96 0.90 0.67 0.39 0.86 1.0
Pit. 10 17 8(0.80)
15(0.88)
+ + 1.28 1.70 0.99 0.99 0.60 0.71 0.75 0.80
Com
mon
ness
Tem. 11 24 8(0.73)
19(0.79)
+ + 0.69 0.57 0.96 0.96 0.73 0.71 1.0 0.89
Art. 9 15 3(0.33)
10(0.67)
(+) + 0.58 0.42 0.80 0.97 0.33 0.53 1.0 0.80
Con. 4 16 3(0.75)
5(0.31)
- (-) -0.59 -0.09 -0.85 -0.74 0.50 0.19 0.67 0.60
Pit. 2 19 2(1.0)
9(0.47)
+ (+) 0.09 1.03 0.67 0.80 1.0 0.26 1.0 0.56
Rate
Tem. 5 15 5(1.0)
14(0.93)
+ + 0.68 0.48 0.89 0.92 1.0 0.93 1.0 1.0
Art. 4 24 2(0.50)
16(0.67)
+ + 0.35 0.29 0.83 0.98 0.50 0.38 1.0 0.56
Con. 8 12 4(0.50)
5(0.42)
(+) (-) 0.47 -0.36 0.86 -0.80 0.375 0.25 0.75 0.60
Pit. 9 22 9(1.0)
15(0.68)
+ + 1.33 1.03 0.97 0.98 0.78 0.59 0.78 0.87
Across these demographic divisions, there are trends that follow those observed across all theparticipants combined (Tables E.3 and E.4). Mappings from commonness to both consonanceand pitch were problematic across all demographic groups studied, matching the findings overall participants (see Table E.4). As in the results taken across all participants, tempo alwaysproduced mappings that met Combined Effectiveness Definition 1 for all demographics.
We can observe some differences between the performance of participants with and withoutmusical experience (although, as in the rest of this section, it is important to note that this is ourinitial observation and has not been shown statistically). Mappings involving the consonancesound parameter appear to have been perceived more readily by participants with musicalexpererience (with a proportion 0.5 upwards of all responses having a significant polarity inall mappings involving consonance) than by those without musical experience (with a polarityproportion below 0.5 for all mappings involving consonance). This suggests that the consonancesound parameter may be better suited for use by users with some musical training, and this
239
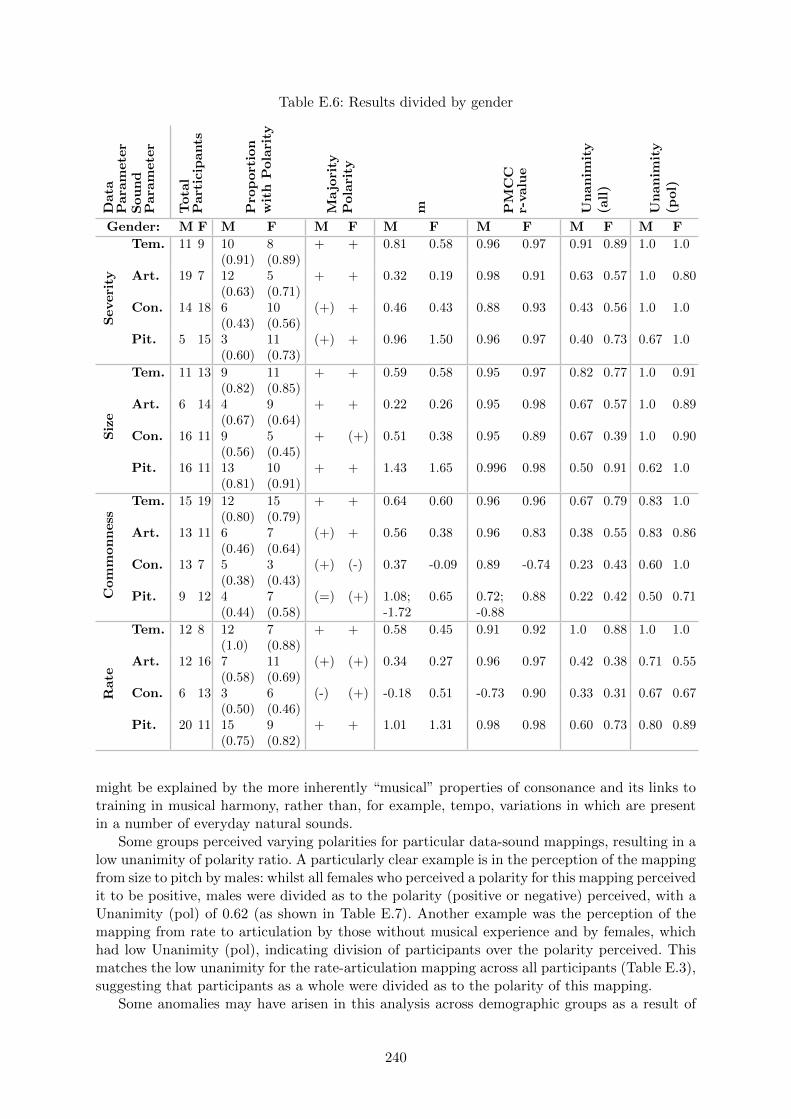
Table E.6: Results divided by genderD
ata
Para
mete
rS
ou
nd
Para
mete
r
Tota
lP
art
icip
ants
Pro
port
ion
wit
hP
ola
rity
Majo
rity
Pola
rity
m PM
CC
r-valu
e
Un
an
imit
y(a
ll)
Un
an
imit
y(p
ol)
Gender: M F M F M F M F M F M F M F
Severi
ty
Tem. 11 9 10(0.91)
8(0.89)
+ + 0.81 0.58 0.96 0.97 0.91 0.89 1.0 1.0
Art. 19 7 12(0.63)
5(0.71)
+ + 0.32 0.19 0.98 0.91 0.63 0.57 1.0 0.80
Con. 14 18 6(0.43)
10(0.56)
(+) + 0.46 0.43 0.88 0.93 0.43 0.56 1.0 1.0
Pit. 5 15 3(0.60)
11(0.73)
(+) + 0.96 1.50 0.96 0.97 0.40 0.73 0.67 1.0
Siz
e
Tem. 11 13 9(0.82)
11(0.85)
+ + 0.59 0.58 0.95 0.97 0.82 0.77 1.0 0.91
Art. 6 14 4(0.67)
9(0.64)
+ + 0.22 0.26 0.95 0.98 0.67 0.57 1.0 0.89
Con. 16 11 9(0.56)
5(0.45)
+ (+) 0.51 0.38 0.95 0.89 0.67 0.39 1.0 0.90
Pit. 16 11 13(0.81)
10(0.91)
+ + 1.43 1.65 0.996 0.98 0.50 0.91 0.62 1.0
Com
mon
ness
Tem. 15 19 12(0.80)
15(0.79)
+ + 0.64 0.60 0.96 0.96 0.67 0.79 0.83 1.0
Art. 13 11 6(0.46)
7(0.64)
(+) + 0.56 0.38 0.96 0.83 0.38 0.55 0.83 0.86
Con. 13 7 5(0.38)
3(0.43)
(+) (-) 0.37 -0.09 0.89 -0.74 0.23 0.43 0.60 1.0
Pit. 9 12 4(0.44)
7(0.58)
(=) (+) 1.08;-1.72
0.65 0.72;-0.88
0.88 0.22 0.42 0.50 0.71
Rate
Tem. 12 8 12(1.0)
7(0.88)
+ + 0.58 0.45 0.91 0.92 1.0 0.88 1.0 1.0
Art. 12 16 7(0.58)
11(0.69)
(+) (+) 0.34 0.27 0.96 0.97 0.42 0.38 0.71 0.55
Con. 6 13 3(0.50)
6(0.46)
(-) (+) -0.18 0.51 -0.73 0.90 0.33 0.31 0.67 0.67
Pit. 20 11 15(0.75)
9(0.82)
+ + 1.01 1.31 0.98 0.98 0.60 0.73 0.80 0.89
might be explained by the more inherently “musical” properties of consonance and its links totraining in musical harmony, rather than, for example, tempo, variations in which are presentin a number of everyday natural sounds.
Some groups perceived varying polarities for particular data-sound mappings, resulting in alow unanimity of polarity ratio. A particularly clear example is in the perception of the mappingfrom size to pitch by males: whilst all females who perceived a polarity for this mapping perceivedit to be positive, males were divided as to the polarity (positive or negative) perceived, with aUnanimity (pol) of 0.62 (as shown in Table E.7). Another example was the perception of themapping from rate to articulation by those without musical experience and by females, whichhad low Unanimity (pol), indicating division of participants over the polarity perceived. Thismatches the low unanimity for the rate-articulation mapping across all participants (Table E.3),suggesting that participants as a whole were divided as to the polarity of this mapping.
Some anomalies may have arisen in this analysis across demographic groups as a result of
240

Table E.7: Results: mapping effectiveness (according to the Combined Effectiveness Defi-nitions) divided by level of musical experience, and gender
Data Musical Experi-ence
No MusicalExperience
Male Female
Severity
Articulation Articulation Articulation ArticulationConsonance Consonance Consonance ConsonancePitch Pitch Pitch PitchTempo Tempo Tempo Tempo
Size
Articulation Articulation Articulation ArticulationConsonance Consonance Consonance ConsonancePitch Pitch Pitch PitchTempo Tempo Tempo Tempo
Commonness
Articulation Articulation Articulation ArticulationConsonance Consonance Consonance ConsonancePitch Pitch Pitch PitchTempo Tempo Tempo Tempo
Rate
Articulation Articulation Articulation ArticulationConsonance Consonance Consonance ConsonancePitch Pitch Pitch PitchTempo Tempo Tempo Tempo
the uneven group sizes. Only three participants with musical experience were presented with themapping: size-articulation, for example, and there was no unanimity (all) or majority polarityobtained for this mapping. Similarly, the commonness-pitch mapping was presented to only twoparticipants with musical experience, and the power function exponent m calculated for thismapping is anomalous compared to other mappings involving pitch. We discuss these factorsand possible solutions further in Section E.5.2.
E.5 Discussion
E.5.1 Implications of the Findings for Sonification Design
We reflect on the wider implications of our findings in this study for sonification design, with aview to consolidating the information that can be drawn on by sonification designers.
Our findings mostly aligned with our expectations based on previous data-sound mappingswork (see Section E.2.3). In particular, mappings to the sound parameters tempo and pitch wereeffective for the data parameters severity, size and rate, which supports the findings in [180].The positive majority polarities we obtained matched the previous findings in five of those sixmappings, with the exception of the mapping from size to pitch, which obtained a negativemajority polarity in the study by Walker [180], but obtained a positive majority in our study.There was clearly some discrepancy amongst participants as to the polarity of this mapping,however, with a relatively low unanimity of polarity score. The perception of this particularmapping may require clarification in future research, or the discrepancy may indicate that apolarity choice based on the personal preference of individuals is appropriate in this case.
We recommend the use of the mappings that meet Combined Effectiveness Definition1 in sonification systems that are intended for use by multiple participants with the sameprescribed mappings design. These mappings are most appropriate in such cases, since they werejudged effective across all participants: many participants were able to interpret them effectively.On the other hand, some mappings (those from commonness to pitch and consonance, forexample) were perceived to have no polarity by a large proportion of participants; we considerthat this indicates that participants were less able to interpret changes to data parametersusing these mappings, and as such considering the use of alternative mappings is necessary.
241

Alternatively, training users to interpret auditory displays using these mappings could improvethe perception of such mappings [180], and assessment of the extent to which training can aidhere is an area for further research. It is beneficial to sonification design to expand the range ofusable sound parameters, but only if it can be proved that they can represent data parameterseffectively.
It was clear that participants differed in their ability to interpret some mappings: those map-pings that met Combined Effectiveness Definition 2, but not Combined Effectiveness Definition1. Consonance was an example of a sound parameter that was effective in certain mappings(to severity and size), when used by those participants who perceived a significant polarity,but was not perceived to have a polarity by the threshold proportion of participants requiredto meet Combined Effectiveness Definition 1 (as shown in Table E.4). Furthermore, the ex-ploratory evidence presented in Table E.7 suggests that mappings involving consonance may bemore effective according to Combined Effectiveness Definition 1 amongst the demographic withmusical experience than amongst other demographics. This is an example of a sound parameterthat could be suitable for use based on individual preference, for those participants for whomit is effective.
Similarly, the personalisation of mapping polarities to suit the individual preferences of usersmay be appropriate in cases where there is discrepancy amongst participants as to the polarityof the mapping. We found that there were mappings for which this was the case (unanimity ofpolarity was low). The mapping from rate to articulation, for example, did not meet either of theCombined Effectiveness Definitions due to its low Unanimity of Polarity. In reality, however,participants’ responses were relatively evenly divided over significant polarities, with strongr-values for the derived scaling functions, and strong positive and negative scaling functionsacross 18 participants, as can be seen in Figure E.7 and Table E.3. Rather than judging suchmappings as ineffective, the use of personalised polarities for users could be considered, such thatone user might use a sonification in which the rate-articulation mapping has positive polarity,and another might use the same mapping with a negative polarity.
E.5.2 Reuse of the Methodology: Limitations and Improvements
We reflect on aspects of the methology we used, with a view to strengthening the potential forits reuse by other researchers. We highlight possible improvements to it, its limitations, andareas in which there remains some ambiguity requiring further research.
Our measures and definitions of mapping effectiveness each show different aspects of theperformance of participants in interpreting the mappings, and this means that there is someambiguity as to the real meaning of “effectiveness”. Given this ambiguity, it is important thatthere is clarity around the exact meaning of different measures, to enable sonification designersto interpret the findings according to the type of effectiveness that meets their needs. An exampleis the fact that low unanimity of polarity does not necessarily point to an ineffective mapping,but may indicate a need to personalise the mapping polarities used in sonification systems basedon the perceptions of their individual users.
For some systems, it may be necessary that the mappings used are globally effective, whileothers may be tailored to users, or may target particular demographics such as people withmusical experience. We aimed to clarify suitable mappings for these different cases throughour analysis and discussion, and it would be beneficial to assess the validity of these findingsby testing sonification mappings as part of both globally usable and personalised systems. Itis important that such individual differences are explored, as this could be an approach toexpanding the range of usable sound parameters.
A limitation in our correlation of the results over different demographics was the size ofthe groups in some of these divisions. Since the pseudorandomisation process we used to assignmappings to participants did not take into account their demographics, there were cases in whichvery few participants from certain demographics were presented with some of the data-sound
242

mappings, and this was exacerbated by the fact that a large majority of participants (74%)did not claim to have any musical experience. This limited the claims we were able to make,based on these results, on the effect of demographics on the perception of the mappings, sinceour observations of the differences across groups were exploratory and could not be analysedwith statistical validity. In future studies, approaches could be taken to controlling the samplesize presented with each mapping according to the demographics under study, in order tofacilitate a more reliable exploration of the effect of demographics on the results, such thattests for statistically significant differences (such as ANOVA) could be carried out. Increasingcontrol over the assignment of mappings to participants in this way is in contradiction withpseudorandomisation, however, and a suitable balance must be struck.
A potential limitation in our methodology was that the listening medium with which par-ticipants should complete the experiment was not prescribed. The exclusion criteria stated onlythat participants should listen through either speakers or headphones and, given that this studywas carried out remotely, we have no guarantees as to the sound reproduction quality experi-enced by each participant. It is possible that this affected our results, although we posit that themusical parameters we studied (consonance and articulation, for example) should have been lessaffected by the sound reproduction quality than physical qualities of sound (such as reverbera-tion and timbre) would have been. In order to control this factor in future studies, the effect ofremote listening on the performance of participants could be assessed using an in-person controlgroup.
E.6 Summary
We demonstrated the use of an online study methodology for exploring the effectiveness ofdata-sound mappings for use in sonification design, and for deriving appropriate polarities andscaling exponents for them, drawing on the magnitude estimation approaches used in previoussonification design research. We found that mappings that used the sound parameter tempowere generally perceived effectively, while those that used other sound parameters varied intheir effectiveness across mappings from different data parameters. In some cases, the ability tointerpret mappings, and the polarities with which they were perceived, varied across the individ-uals using them. Our exploratory observations suggest that differences may have arisen betweenparticipants with different levels of musical experience. These results contribute to knowledgeon effective data-sound mappings, and can be used by researchers designing sonification systemsthat involve the four targeted data parameters.
243

Bibliography
[1] Center for Applied Internet Data Analysis (CAIDA). http://www.caida.org. [Accessed15-March-2017].
[2] Specimen Box, The Office for Creative Research, 2014. http://ocr.nyc/
user-focused-tools/2014/06/01/specimen-box/ [Accessed 24-February-2017].
[3] M. Adcock and S. Barrass. Cultivating design patterns for auditory displays. In Proceed-ings of the International Conference on Auditory Display, 2004.
[4] I. Agrafiotis, M. Bada, P. Cornish, S. Creese, M. Goldsmith, E. Ignatuschtschenko,T. Roberts, and D. M. Upton. Cyber harm: Concepts, taxonomy and measurement.2016. Saıd Business School Research Papers.
[5] American Forces Press Service. Airmen must understand business of cyber, gen-eral says, 2013. http://www.166aw.ang.af.mil/News/Article-Display/Article/
448041/airmen-must-understand-business-of-cyber-general-says/ [Accessed 19-September-2017].
[6] D. Anderson, T. F. Lunt, H. Javitz, A. Tamaru, and A. Valdes. Detecting unusual programbehavior using the statistical component of the Next-generation Intrusion Detection ExpertSystem (NIDES). SRI International, Computer Science Laboratory, 1995.
[7] H. Argstatter. Perception of basic emotions in music: Culture-specific or multicultural?Psychology of Music, 44(4):674–690, 2016.
[8] K. Ash and N. Stavropoulos. Livecell: Real-time score generation through interactivegenerative composition. In Proceedings of the International Computer Music Conference,2011.
[9] K. Ash and N. Stavropoulos. Stochastic processes in the musification of cellular automata.에밀레, 10:13–19, 2012.
[10] S. Axelsson. The base-rate fallacy and its implications for the difficulty of intrusiondetection. In Proceedings of the ACM Conference on Computer and CommunicationsSecurity, pages 1–7. ACM, 1999.
[11] L. Axon, B. Alahmadi, J. R. C. Nurse, M. Goldsmith, and S. Creese. Sonification insecurity operations centres: What do security practitioners think? In Proceedings of theWorkshop on Usable Security (USEC) at the Network and Distributed Systems SecuritySymposium (NDSS), 2018.
[12] L. Axon, S. Creese, M. Goldsmith, and J. R. C. Nurse. Reflecting on the use of sonificationfor network monitoring. In Proceedings of the International Conference on EmergingSecurity Information, Systems and Technologies, pages 254–261, 2016.
244

[13] L. Axon, J. R. C. Nurse, M. Goldsmith, and S. Creese. A formalised approach to designingsonification systems for network-security monitoring. International Journal on Advancesin Security, 10(1&2):26–47, 2017.
[14] G. Baier, T. Hermann, and U. Stephani. Event-based sonification of EEG rhythms in realtime. Clinical Neurophysiology, 118(6):1377–1386, 2007.
[15] Balaji Balakrishnan. Security Data Visualization, 2013. https://www.sans.org/
reading-room/whitepapers/metrics/security-data-visualization-36387 [Ac-cessed 05-July-2018].
[16] S. Baldassi, N. Megna, and D. C. Burr. Visual clutter causes high-magnitude errors. PLoSBiology, 4(3):e56, 2006.
[17] M. Ballora, R. Cole, H. Kruesi, H. Greene, G. Monahan, and D. Hall. Use of sonificationin the detection of anomalous events. In SPIE Defense, Security, and Sensing, pages84070S–84070S. International Society for Optics and Photonics, 2012.
[18] M. Ballora, N. Giacobe, and D. Hall. Songs of cyberspace: an update on sonifications ofnetwork traffic to support situational awareness. In SPIE Defense, Security, and Sensing,pages 80640P–80640P. International Society for Optics and Photonics, 2011.
[19] M. Ballora, N. A. Giacobe, M. McNeese, and D. L. Hall. Information data fusion andcomputer network defense. In Situational Awareness in Computer Network Defense: Prin-ciples, Methods and Applications, pages 141–164. IGI Global, 2012.
[20] P. Barford and D. Plonka. Characteristics of network traffic flow anomalies. In Proceedingsof the ACM SIGCOMM Workshop on Internet Measurement, pages 69–73. ACM, 2001.
[21] M. Barra, T. Cillo, A. De Santis, U. Petrillo, A. Negro, and V. Scarano. Poster: Web-melody: Sonification of web servers. In Proceedings of the International World Wide WebConference, pages 15–19, 2000.
[22] S. Barrass. Auditory Information Design. PhD thesis, 1997. The Australian NationalUniversity.
[23] S. Barrass. Sonification design patterns. In Proceeedings of the International Conferenceon Auditory Display, volume 3, pages 170–175, 2003.
[24] S. Barrass. A perceptual framework for the auditory display of scientific data. ACMTransactions on Applied Perception (TAP), 2(4):389–402, 2005.
[25] S. Barrass. The aesthetic turn in sonification towards a social and cultural medium. AI& Society, 27(2):177–181, 2012.
[26] S. Barrass and C. Frauenberger. A communal map of design in auditory display. InProceedings of the International Conference on Auditory Display, pages 1–10, 2009.
[27] S. Barrass, N. Schaffert, and T. Barrass. Probing preferences between six designs ofinteractive sonifications for recreational sports, health and fitness. In Human Interactionwith Auditory Displays–Proceedings of the Interactive Sonification Workshop, pages 23–30,2010.
[28] S. Barrass and P. Vickers. Sonification design and aesthetics. In T. Hermann, A. Hunt,and J. Neuhoff, editors, The Sonification Handbook, pages 145–172. Logos Verlag Berlin,2011.
245

[29] S. Barrass and B. Zehner. Responsive sonification of well-logs. In Proceedings of theInternational Conference on Auditory Display, 2000.
[30] B. G. Berg, T. Kaczmarek, A. Kobsa, and G. Tsudik. An exploration of the effects ofsensory stimuli on the completion of security tasks. IEEE Security & Privacy, 15(6):52–60,2017.
[31] J. Berg and J. Wingstedt. Perceived properties of parameterised music for interactiveapplications. Journal of Systemics, Cybernetics and Informatics, 4(2):65–71, 2006.
[32] N. Bevan. International standards for hci and usability. International Journal of Human-Computer Studies, 55(4):533–552, 2001.
[33] S. Bhatt, P. K. Manadhata, and L. Zomlot. The operational role of security informationand event management systems. IEEE Security & Privacy, 12(5):35–41, 2014.
[34] M. H. Bhuyan, D. K. Bhattacharyya, and J. K. Kalita. Surveying port scans and theirdetection methodologies. The Computer Journal, 54(10):1565–1581, 2011.
[35] M. H. Bhuyan, D. K. Bhattacharyya, and J. K. Kalita. Network anomaly detection:methods, systems and tools. IEEE Communications Surveys & Tutorials, 16(1):303–336,2014.
[36] E. Bilotta and P. Pantano. Artificial life music tells of complexity. In Proceedings of theWorkshop on Artificial Life Models for Musical Applications, pages 17–28, 2001.
[37] E. Bilotta and P. Pantano. Synthetic harmonies: an approach to musical semiosis bymeans of cellular automata. Leonardo, 35(2):153–159, 2002.
[38] S. Bly. Presenting information in sound. In Proceedings of the Conference on HumanFactors in Computing Systems, pages 371–375. ACM, 1982.
[39] P. Booth. An Introduction to Human-Computer Interaction (Psychology Revivals). Psy-chology Press, 2014.
[40] D. Botta, R. Werlinger, A. Gagne, K. Beznosov, L. Iverson, S. Fels, and B. Fisher. Towardsunderstanding IT security professionals and their tools. In Proceedings of the Symposiumon Usable Privacy and Security, pages 100–111. ACM, 2007.
[41] R. Brady, R. Bargar, I. Choi, and J. Reitzer. Auditory bread crumbs for navigatingvolumetric data. In IEEE Visualization, volume 96, 1996.
[42] A. S. Bregman. Auditory Scene Analysis: The Perceptual Organization of Sound. MITpress, 1994.
[43] J. Brooke. SUS-A quick and dirty usability scale. Usability Evaluation in Industry,189(194):4–7, 1996.
[44] A. Brown, M. Martin, B. Kapralos, M. Green, and M. Garcia-Ruiz. Towards music-assisted intrusion detection. 2009. Poster presented at IEEE Workshop on StatisticalSignal Processing.
[45] L. Buchanan, A. D’Amico, and D. Kirkpatrick. Mixed method approach to identify an-alytic questions to be visualized for military cyber incident handlers. In Symposium onVisualization for Cyber Security (VizSec), pages 1–8. IEEE, 2016.
246

[46] M. Buhrmester, T. Kwang, and S. D. Gosling. Amazon’s mechanical turk: A new sourceof inexpensive, yet high-quality, data? Perspectives on Psychological Science, 6(1):3–5,2011.
[47] Canadian Institute for Cybersecurity. Intrusion Detection Evaluation Dataset. http:
//www.unb.ca/cic/datasets/ids-2017.html [Accessed 25-May-2018].
[48] R. Candey, A. Schertenleib, and W. Diaz Merced. Sonification prototype for space physics.In AGU Fall Meeting Abstracts, 2005.
[49] J. M. Carroll. Designing Interaction: Psychology at the Human-Computer Interface. CUPArchive, 1991.
[50] Center for Applied Internet Data Analysis. Trace Statistics for CAIDA Passive OC48and OC192 traces. http://www.caida.org/data/passive/trace_stats/. [Accessed15-March-2017].
[51] V. Chandola, A. Banerjee, and V. Kumar. Anomaly detection: a survey. ACM ComputingSurveys (CSUR), 41(3):15, 2009.
[52] E. P. Childs Jr, J. C. Perkins, and J. G. Brooks. System and method for musical sonifi-cation of data, Nov. 21 2006. US Patent 7,138,575.
[53] Complex Data Visualized. Security Log Visualization with a Correlation Engine, 2013.complexdatavisualized.com/tag/siem [Accessed 05-July-2018].
[54] A. D. Coop. Sonification, musification, and synthesis of absolute program mu-sic. In Proceedings of the International Conference on Auditory Display (doi:10.21785/icad2016.030), 2016.
[55] A. Csapo and G. Wersenyi. Overview of auditory representations in human-machineinterfaces. ACM Computing Surveys (CSUR), 46(2):19, 2013.
[56] C. Cullen and W. Coleman. Human pattern recognition in data sonification. In Proceedingsof the International Workshop on Folk Music Analysis. Dublin Institute of Technology,2016.
[57] A. D’Amico, K. Whitley, D. Tesone, B. O’Brien, and E. Roth. Achieving cyber defensesituational awareness: a cognitive task analysis of information assurance analysts. InProceedings of the Human Factors and Ergonomics Society Annual Meeting, volume 49,pages 229–233. SAGE Publications, 2005.
[58] A. D. D’Amico, J. R. Goodall, D. R. Tesone, and J. K. Kopylec. Visual discovery incomputer network defense. IEEE Computer Graphics and Applications, 27(5):20–27, 2007.
[59] A. de Campo. A data sonification design space map. In Proceedings of the InternationalWorkshop on Interactive Sonification, 2007.
[60] A. de Campo. Toward a data sonification design space map. In Proceedings of the Inter-national Conference on Auditory Display, pages 342–347, 2007.
[61] M. Debashi and P. Vickers. Sonification of network traffic flow for monitoring and situa-tional awareness. PloS One, 13(4):e0195948, 2018.
[62] M. Debashi and P. Vickers. Sonification of network traffic for detecting and learning aboutbotnet behaviour. IEEE Access, 6:33826–33839, 2018.
247

[63] B. deButts. Network access log visualization & sonification. Master’s thesis, Tufts Uni-versity, Medford, MA, US, 2014.
[64] D. Denning. An intrusion-detection model. IEEE Transactions on Software Engineering,(2):222–232, 1987.
[65] D. Denning and P. G. Neumann. Requirements and Model for IDES-a Real-TimeIntrusion-Detection Expert System. SRI International, 1985.
[66] D. Deutsch. Auditory pattern recognition. In K. R. Boff, L. Kaufman, and J. P. Thomas,editors, Handbook of Perception and Human Performance, pages 1–49. John Wiley &Sons, 1986.
[67] G. Dubus and R. Bresin. A systematic review of mapping strategies for the sonificationof physical quantities. PloS One, 8(12):e82491, 2013.
[68] A. D’Amico, L. Buchanan, D. Kirkpatrick, and P. Walczak. Cyber operator perspectiveson security visualization. In Advances in Human Factors in Cybersecurity, pages 69–81.Springer, 2016.
[69] A. D’Amico and K. Whitley. The real work of computer network defense analysts. InSymposium on Visualization for Cyber Security (VizSec), pages 19–37. Springer, 2008.
[70] J. Eaton and E. R. Miranda. On mapping eeg information into music. In Guide toBrain-Computer Music Interfacing, pages 221–254. Springer, 2014.
[71] J. Edworthy, S. Loxley, and I. Dennis. Improving auditory warning design: Relationshipbetween warning sound parameters and perceived urgency. Human Factors: The Journalof the Human Factors and Ergonomics Society, 33(2):205–231, 1991.
[72] S. El Seoud, M. Garcia-Ruiz, A. Edwards, R. Aquino-Santos, and M. Martin. Audi-tory display as a tool for teaching network intrusion detection. International Journal ofEmerging Technologies in Learning (iJET), 3(2):59–62, 2008.
[73] R. E. Etoty and R. F. Erbacher. A survey of visualization tools assessed for anomaly-based intrusion detection analysis. Technical report, Army Research Lab Adelphi MDComputational and Information Sciences Directorate (Technical Report), 2014.
[74] A. Field. Discovering Statistics Using IBM SPSS Statistics. Sage, 2013.
[75] C. for Applied Internet Data Analysis (CAIDA). DDoS Attack 2007 dataset. https:
//www.caida.org/data/passive/ddos-20070804_dataset.xml [Accessed 24-February-2017].
[76] J. Francombe, T. Brookes, and R. Mason. Evaluation of spatial audio reproduction meth-ods (part 1): Elicitation of perceptual differences. Journal of the Audio EngineeringSociety, 65(3):198–211, 2017.
[77] J. Francombe, T. Brookes, R. Mason, and J. Woodcock. Evaluation of spatial audio repro-duction methods (part 2): analysis of listener preference. Journal of the Audio EngineeringSociety, 65(3):212–225, 2017.
[78] C. Frauenberger, T. Stockman, and M.-L. Bourguet. Pattern design in the context space:paco-a methodological framework for designing auditory display with patterns. In Pro-ceedings of the Conference on Pattern Languages of Programs, page 17. ACM, 2007.
[79] Fraunhofer Institute for Integrated Circuits. Netson, 2016. http://www.iis.
fraunhofer.de/en/muv/2015/netson.html [Accessed 24-February-2017].
248

[80] T. Fritz. The anchor model of musical culture. In Proceedings of the International Con-ference on Auditory Display, pages 141–144, 2010.
[81] T. Fritz, S. Jentschke, N. Gosselin, D. Sammler, I. Peretz, R. Turner, A. D. Friederici,and S. Koelsch. Universal recognition of three basic emotions in music. Current Biology,19(7):573–576, 2009.
[82] M. Garcıa-Ruiz, M. Martin, and M. Green. Towards a multimodal human-computerinterface to analyze intrusion detection in computer networks. In Proceedings of theHuman-Computer Interaction Workshop, 2006.
[83] M. Garcia-Ruiz, M. Vargas Martin, B. Kapralos, J. Tashiro, and R. Acosta-Diaz. Bestpractices for applying sonification to support teaching and learning of network intrusiondetection. In Proceedings of the World Conference on Educational Multimedia, Hyperme-dia and Telecommunications, pages 752–757, 2010.
[84] P. Garcia-Teodoro, J. Diaz-Verdejo, G. Macia-Fernandez, and E. Vazquez. Anomaly-basednetwork intrusion detection: Techniques, systems and challenges. Computers & Security,28(1):18–28, 2009.
[85] W. Gaver, R. Smith, and T. O’Shea. Effective sounds in complex systems: The arkolasimulation. In Proceedings of the SIGCHI Conference on Human factors in ComputingSystems, pages 85–90. ACM, 1991.
[86] Gilbert Sison. Cerber Starts Evading Machine Learning, 2017.http://blog.trendmicro.com/trendlabs-security-intelligence/
cerber-starts-evading-machine-learning/ [Accessed 19-October-2017].
[87] M. Gilfix and A. Couch. Peep (the network auralizer): Monitoring your network withsound. In Proceedings of the Large Installation System Administration Conference, pages109–117, 2000.
[88] R. Giot and Y. Courbe. Intention–interactive network sonification. In Proceedings of theInternational Conference on Auditory Display, pages 235–236, 2012.
[89] J. K. Goodman, C. E. Cryder, and A. Cheema. Data collection in a flat world: Thestrengths and weaknesses of mechanical turk samples. Journal of Behavioral DecisionMaking, 26(3):213–224, 2013.
[90] M. Gopinath. Auralization of intrusion detection system using Jlisten. Development, 22:3,2004.
[91] C. Goutte and E. Gaussier. A probabilistic interpretation of precision, recall and f-score,with implication for evaluation. In European Conference on Information Retrieval, pages345–359. Springer, 2005.
[92] F. Grond and J. Berger. Parameter mapping sonification. In T. Hermann, A. Hunt, andJ. Neuhoff, editors, The Sonification Handbook, pages 363–397. Logos Verlag Berlin, 2011.
[93] J. Gulliksen, B. Goransson, I. Boivie, S. Blomkvist, J. Persson, and A. Cajander. Key prin-ciples for user-centred systems design. Behaviour and Information Technology, 22(6):397–409, 2003.
[94] R. S. Gutzwiller, S. Fugate, B. D. Sawyer, and P. Hancock. The human factors of cybernetwork defense. In Proceedings of the Human Factors and Ergonomics Society AnnualMeeting, volume 59, pages 322–326. SAGE Publications, 2015.
249

[95] Z. Halim, R. Baig, and S. Bashir. Sonification: a novel approach towards data mining.In Proceedings of the International Conference on Emerging Technologies, 2006, pages548–553. IEEE, 2006.
[96] S. G. Hart and L. E. Staveland. Development of nasa-tlx (task load index): Results ofempirical and theoretical research. Advances in Psychology, 52:139–183, 1988.
[97] D. J. Hauser and N. Schwarz. Attentive turkers: Mturk participants perform better ononline attention checks than do subject pool participants. Behavior Research Methods,48(1):400–407, 2016.
[98] E. J. Hellier, J. Edworthy, and I. Dennis. Improving auditory warning design: Quantifyingand predicting the effects of different warning parameters on perceived urgency. HumanFactors: The Journal of the Human Factors and Ergonomics Society, 35(4):693–706, 1993.
[99] T. Hermann. Sonification for Exploratory Data Analysis. PhD thesis, 2002. BielefeldUniversity.
[100] T. Hermann. Model-based sonifiation. In T. Hermann, A. Hunt, and J. Neuhoff, editors,The Sonification Handbook, pages 399–427. Logos Verlag Berlin, 2011.
[101] T. Hermann, A. Hunt, and J. Neuhoff. The Sonification Handbook. Logos Verlag Berlin,2011.
[102] T. Hermann and T. W. Nattkemper. Multi-channel image data analysis using sonification.Bielefeld University (doi:10.4119/unibi/2763993), 2001.
[103] T. Hermann and H. Ritter. Listen to your data: Model-based sonification for data analysis.Advances in Intelligent Computing and Multimedia Systems, 8:189–194, 1999.
[104] T. Hildebrandt. Short paper: Towards enhancing business process monitoring with soni-fication. In Proceedings of the Business Process Management Workshops, pages 529–536.Springer, 2014.
[105] T. Hildebrandt, T. Hermann, and S. Rinderle-Ma. Continuous sonification enhances ade-quacy of interactions in peripheral process monitoring. International Journal of Human-Computer Studies, 2016.
[106] T. Hinterberger and G. Baier. Parametric orchestral sonification of EEG in real time.IEEE MultiMedia, (2):70–79, 2005.
[107] A. A. A. Ibrahim and A. Hunt. An hci model for usability of sonification applications. InInternational Workshop on Task Models and Diagrams for User Interface Design, pages245–258. Springer, 2006.
[108] S. Jamieson. Likert scales: how to (ab) use them. Medical Education, 38(12):1217–1218,2004.
[109] M. R. Jones. Time, our lost dimension: toward a new theory of perception, attention, andmemory. Psychological Review, 83(5):323, 1976.
[110] M. R. Jones and M. Boltz. Dynamic attending and responses to time. PsychologicalReview, 96(3):459, 1989.
[111] M. C. Kaptein, C. Nass, and P. Markopoulos. Powerful and consistent analysis of likert-type rating scales. In Proceedings of the SIGCHI Conference on Human Factors in Com-puting Systems, pages 2391–2394. ACM, 2010.
250

[112] H. Kaur, G. Singh, J. Minhas, et al. A review of machine learning based anomaly detectiontechniques. International Journal of Computer Applications Technology and Research,2(2):185–187, 2013.
[113] M. L. Kazem, J. M. Noyes, and N. J. Lieven. Design considerations for a backgroundauditory display to aid pilot situation awareness. In Proceedings of the InternationalConference on Auditory Display, pages 91–94, 2003.
[114] O. e. a. Kessler, K. Askin, N. Beck, J. Lynch, F. White, D. Buede, D. Hall, and J. Llinas.Functional description of the data fusion process. Office of Naval Technology, Naval AirDevelopment Center, Warminster, PA, 16, 1992.
[115] M. Kimoto and H. Ohno. Design and implementation of stetho—network sonificationsystem. In Proceedings of the International Computer Music Conference, pages 273–279,2002.
[116] N. King. Template analysis. In G. Symon and C. Cassell, editors, Qualitative Methods andAnalysis in Organisational Research: A Practical Guide, pages 118–134. Sage PublicationsLtd, Thousand Oaks, CA, 1998.
[117] E. Knobloch. Euler transgressing limits: the infinite and music theory. Quaderns d’Historiade l’Enginyeria, 9:9–24, 2008.
[118] G. Kramer. Auditory Display: Sonification, Audification, and Auditory Interfaces. PerseusPublishing, 1993.
[119] G. Kramer. Some organizing principles for representing data with sound. AuditoryDisplay-Sonification, Audification, and Auditory Interfaces, pages 185–221, 1994.
[120] G. Kramer, B. Walker, T. Bonebright, P. Cook, J. Flowers, N. Miner, J. Neuhoff, R. Bar-gar, S. Barrass, and J. Berger. The sonification report: Status of the field and researchagenda. International Community for Auditory Display (ICAD), 1999.
[121] V. Kumar, J. Srivastava, and A. Lazarevic. Managing Cyber Threats: Issues, Approaches,and Challenges. Springer Science & Business Media, 2006.
[122] A. Lazarevic, L. Ertoz, V. Kumar, A. Ozgur, and J. Srivastava. A comparative studyof anomaly detection schemes in network intrusion detection. In Proceedings of SIAMInternational Conference on Data Mining, pages 25–36, 2003.
[123] D. Lee, B. E. Carpenter, and N. Brownlee. Observations of UDP to TCP ratio and portnumbers. In Proceedings of the International Conference on Internet Monitoring andProtection (ICIMP), pages 99–104. IEEE, 2010.
[124] D. J. Levitin. This is Your Brain on Music: Understanding a Human Obsession. AtlanticBooks Ltd, 2011.
[125] R. Likert. A technique for the measurement of attitudes. Archives of Psychology, 1932.
[126] M. Maguire. Context of use within usability activities. International Journal of Human-Computer Studies, 55(4):453–483, 2001.
[127] M. Maguire and N. Bevan. User requirements analysis. In Usability, pages 133–148.Springer, 2002.
[128] T. Mahmood and U. Afzal. Security analytics: Big data analytics for cybersecurity: Areview of trends, techniques and tools. In Conference on Information Assurance, pages129–134. IEEE, 2013.
251

[129] D. Malandrino, D. Mea, A. Negro, G. Palmieri, and V. Scarano. Nemos: Network moni-toring with sound. In Proceedings of the International Conference on Auditory Display,pages 251–254, 2003.
[130] V. F. Mancuso, E. T. Greenlee, G. Funke, A. Dukes, L. Menke, R. Brown, and B. Miller.Augmenting cyber defender performance and workload through sonified displays. ProcediaManufacturing, 3:5214–5221, 2015.
[131] M. P. Mattson. Superior pattern processing is the essence of the evolved human brain.Frontiers in Neuroscience, 8, 2014.
[132] D. McGookin and S. Brewster. Earcons. In T. Hermann, A. Hunt, and J. Neuhoff, editors,The Sonification Handbook, pages 339–362. Logos Verlag, 2011.
[133] Measurement and Analysis on the WIDE Internet, Working Group. Traffic Archive.http://mawi.wide.ad.jp/mawi/. [Accessed 15-March-2017].
[134] D. Merced and L. Wanda. Sound for the Exploration of Space Physics Data. PhD thesis,University of Glasgow, 2013.
[135] S. Mountford and W. Gaver. Talking and listening to computers. The Art of Human-Computer Interface Design, pages 319–334, 1990.
[136] J. Neuhoff. Perception, cognition and action in auditory displays. In T. Hermann, A. Hunt,and J. Neuhoff, editors, The Sonification Handbook, pages 63–85. Logos Verlag Berlin,2011.
[137] B. Nevo. Face validity revisited. Journal of Educational Measurement, 22(4):287–293,1985.
[138] J. Nicholls, D. Peters, A. Slawinski, T. Spoor, S. Vicol, J. Happa, M. Goldsmith, andS. Creese. NetVis: a Visualization Tool Enabling Multiple Perspectives of Network TrafficData. In S. Czanner and W. Tang, editors, Theory and Practice of Computer Graphics.The Eurographics Association, 2013.
[139] D. A. Norman. The Design of Everyday Things: Revised and Expanded Edition. Basicbooks, 2013.
[140] G. Norman. Likert scales, levels of measurement and the “laws” of statistics. Advancesin Health Sciences Education, 15(5):625–632, 2010.
[141] J. R. C. Nurse, S. Creese, M. Goldsmith, and K. Lamberts. Guidelines for usable cyber-security: Past and present. In Proceedings of the International Workshop on CyberspaceSafety and Security (CSS), pages 21–26. IEEE, 2011.
[142] C. Papadopoulos, C. Kyriakakis, A. Sawchuk, and X. He. Cyberseer: 3d audio-visualimmersion for network security and management. In Proceedings of the ACM Workshopon Visualization and Data Mining for Computer Security, pages 90–98. ACM, 2004.
[143] G. Parseihian, C. Gondre, M. Aramaki, S. Ystad, and R. K. Martinet. Comparison andevaluation of sonification strategies for guidance tasks. IEEE Transactions on Multimedia,18(4):674–686, 2016.
[144] S. C. Peres, D. Verona, T. Nisar, and P. Ritchey. Towards a systematic approach toreal-time sonification design for surface electromyography. Displays, 47:25–31, 2017.
[145] T. Pietraszek. Using adaptive alert classification to reduce false positives in intrusiondetection. In Recent Advances in Intrusion Detection, pages 102–124. Springer, 2004.
252

[146] L. Qi, M. Martin, B. Kapralos, M. Green, and M. Garcıa-Ruiz. Toward sound-assisted in-trusion detection systems. In On the Move to Meaningful Internet Systems 2007: CoopIS,DOA, ODBASE, GADA, and IS, pages 1634–1645. Springer, 2007.
[147] S. Rinderle-Ma and T. Hildebrandt. Server sounds and network noises. In Proceedingsof the International Conference on Cognitive Infocommunications (CogInfoCom), pages45–50. IEEE, 2015.
[148] J. Robertson. Likert-type scales, statistical methods, and effect sizes. Communications ofthe ACM, 55(5):6–7, 2012.
[149] I. Sharafaldin, A. H. Lashkari, and A. A. Ghorbani. Toward generating a new intrusiondetection dataset and intrusion traffic characterization. In Proceedings of the InternationalConference on Information Systems Security and Privacy, ICISSP, 2018.
[150] B. Shneiderman. Dynamic queries for visual information seeking. IEEE Software,11(6):70–77, 1994.
[151] B. Shneiderman, C. Plaisant, M. Cohen, S. Jacobs, N. Elmqvist, and N. Diakopoulos. De-signing the User Interface: Strategies for Effective Human-Computer Interaction. Pearson,2016.
[152] A. Siami Namin, R. Hewett, K. S. Jones, and R. Pogrund. Sonifying internet securitythreats. In Proceedings of the CHI Conference Extended Abstracts on Human Factors inComputing Systems, pages 2306–2313. ACM, 2016.
[153] S. D. Smith, W. J. Tays, M. J. Dixon, and M. B. Bulman-Fleming. The right hemisphereas an anomaly detector: evidence from visual perception. Brain and Cognition, 48(2-3):574–579, 2001.
[154] G. Soderlund. Positive effects of noise on cognitive performance: Explaining the moderatebrain arousal model. In The Congress of the International Commission on the BiologicalEffects of Noise, pages 378–386. Leibniz Gemeinschaft, 2008.
[155] R. Sommer and V. Paxson. Outside the closed world: On using machine learning fornetwork intrusion detection. In Symposium on Security & Privacy, pages 305–316. IEEE,2010.
[156] L. Sousa and A. Pinto. MuSec: sonification of alarms generated by a SIEM. In Interna-tional Symposium on Ambient Intelligence, pages 32–39. Springer, 2017.
[157] K. Stallmann, S. Peres, and P. Kortum. Auditory stimulus design: Musically informed.In Proceedings of the International Conference on Auditory Display, pages 1–5, 2008.
[158] S. S. Stevens. The relation of pitch to intensity. The Journal of the Acoustical Society ofAmerica, 6(3):150–154, 1935.
[159] S. S. Stevens. Mathematics, measurement, and psychophysics. In S. S. Stevens, editor,Handbook of Experimental Psychology. Wiley, 1951.
[160] S. S. Stevens. Psychophysics: Introduction to its Perceptual, Neural and Social Prospects.Routledge, 2017.
[161] S. S. Stevens and H. Davis. Hearing: Its Psychology and Physiology. American Instituteof Physics for the Acoustical Society of America, 1983.
253

[162] V. Straebel. The sonification metaphor in instrumental music and sonification’s roman-tic implications. In Proceedings of the International Conference on Auditory Display,Washington, 2010.
[163] S. C. Sundaramurthy, A. G. Bardas, J. Case, X. Ou, M. Wesch, J. McHugh, and S. R. Ra-jagopalan. A human capital model for mitigating security analyst burnout. In Symposiumon Usable Privacy and Security (SOUPS), pages 347–359, 2015.
[164] S. C. Sundaramurthy, J. Case, T. Truong, L. Zomlot, and M. Hoffmann. A tale of threesecurity operation centers. In Proceedings of the ACM Workshop on Security InformationWorkers, pages 43–50. ACM, 2014.
[165] S. C. Sundaramurthy, J. McHugh, X. Ou, M. Wesch, A. G. Bardas, and S. R. Rajagopalan.Turning contradictions into innovations or: How we learned to stop whining and improvesecurity operations. In Symposium on Usable Privacy and Security (SOUPS), 2016.
[166] S. C. Sundaramurthy, M. Wesch, X. Ou, J. McHugh, S. R. Rajagopalan, and A. G. Bardas.Humans are dynamic-our tools should be too. IEEE Internet Computing, 21(3):40–46,2017.
[167] A. Sutcliffe. User-Centred Requirements Engineering. Springer Science & Business Media,2012.
[168] A. S. Tanenbaum. Computer Networks. Prentice Hall, 2003.
[169] B. J. Tomlinson, B. E. Noah, and B. N. Walker. Buzz: An auditory interface user experi-ence scale. In Extended Abstracts of the CHI Conference on Human Factors in ComputingSystems, page LBW096. ACM, 2018.
[170] C. Tsai, Y. Hsu, C. Lin, and W. Lin. Intrusion detection by machine learning: A review.Expert Systems with Applications, 36(10):11994–12000, 2009.
[171] R. van Ee, J. J. van Boxtel, A. L. Parker, and D. Alais. Multisensory congruency asa mechanism for attentional control over perceptual selection. Journal of Neuroscience,29(37):11641–11649, 2009.
[172] F. L. Van Scoy. Sonification of complex data sets: An example from basketball. Proceedingsof VSMM99 (Virtual Systems and MultiMedia), pages 203–216, 1999.
[173] P. Varner and J. Knight. Monitoring and visualization of emergent behavior in large scaleintrusion tolerant distributed systems. Technical report, Pennsylvania State University,2002.
[174] P. Vickers. Sonification for process monitoring. In T. Hermann, A. Hunt, and J. Neuhoff,editors, The Sonification Handbook, pages 455–492. Logos Verlag Berlin, 2011.
[175] P. Vickers and B. Hogg. Sonification abstraite/sonification concrete: An aesthetic per-spective space for classifying auditory displays in the ars musica domain. In Proceedingsof the International Conference on Auditory Display, pages 210–216, 2006.
[176] P. Vickers, C. Laing, M. Debashi, and T. Fairfax. Sonification aesthetics and listening fornetwork situational awareness. In Proceedings of the Conference on Sonification of Healthand Environmental Data, 2014.
[177] P. Vickers, C. Laing, and T. Fairfax. Sonification of a network’s self-organized criticality.arXiv preprint arXiv:1407.4705, 2014.
254

[178] K. V. Vishwanath and A. Vahdat. Swing: Realistic and responsive network traffic gener-ation. IEEE/ACM Transactions on Networking (TON), 17(3):712–725, 2009.
[179] B. N. Walker. Magnitude estimation of conceptual data dimensions for use in sonification.Journal of Experimental Psychology: Applied, 8(4):211, 2002.
[180] B. N. Walker. Consistency of magnitude estimations with conceptual data dimensionsused for sonification. Applied Cognitive Psychology, 21(5):579–599, 2007.
[181] B. N. Walker, G. Kramer, and D. M. Lane. Psychophysical scaling of sonification map-pings. In Proceedings of the International Conference on Auditory Display, pages 90–94,2001.
[182] B. N. Walker and L. M. Mauney. Individual differences, cognitive abilities, and the inter-pretation of auditory graphs. In International Conference on Auditory Display, 2004.
[183] B. N. Walker and M. A. Nees. Theory of sonification. In T. Hermann, A. Hunt, andJ. Neuhoff, editors, The Sonification Handbook, pages 9–39. Logos Verlag Berlin, 2011.
[184] R. Werlinger, K. Hawkey, and K. Beznosov. Security practitioners in context: their ac-tivities and interactions. In CHI Extended Abstracts on Human Factors in ComputingSystems, pages 3789–3794. ACM, 2008.
[185] R. Werlinger, K. Hawkey, and K. Beznosov. An integrated view of human, organizational,and technological challenges of it security management. Information Management &Computer Security, 17(1):4–19, 2009.
[186] R. Werlinger, K. Hawkey, D. Botta, and K. Beznosov. Security practitioners in context:Their activities and interactions with other stakeholders within organizations. Interna-tional Journal of Human-Computer Studies, 67(7):584–606, 2009.
[187] R. Werlinger, K. Muldner, K. Hawkey, and K. Beznosov. Preparation, detection, andanalysis: the diagnostic work of it security incident response. Information Management& Computer Security, 18(1):26–42, 2010.
[188] D. Williams, A. Kirke, J. Eaton, E. Miranda, I. Daly, J. Hallowell, E. Roesch, F. Hwang,and S. J. Nasuto. Dynamic game soundtrack generation in response to a continuouslyvarying emotional trajectory. In Audio Engineering Society Conference: 56th InternationalConference: Audio for Games. Audio Engineering Society, 2015.
[189] D. Williams and L. Wilson. Multi-criteria decision aid analysis of a musification approachto the auditory display of micro-organism movement. In Audio Engineering Society Con-vention 139. Audio Engineering Society, 2015.
[190] K. E. Wolf, G. Gliner, and R. Fiebrink. A model for data-driven sonification using sound-scapes. In Proceedings of the International Conference on Intelligent User InterfacesCompanion, pages 97–100. ACM, 2015.
[191] D. Worrall. Realtime sonification and visualisation of network metadata. In Proceedingsof the International Conference on Auditory Display, pages 337–339, 2015.
[192] N. Ye, S. Emran, Q. Chen, and S. Vilbert. Multivariate statistical analysis of audit trailsfor host-based intrusion detection. IEEE Transactions on Computers, 51(7):810–820, 2002.
[193] E. Yeung. Pattern recognition by audio representation of multivariate analytical data.Analytical Chemistry, 52(7):1120–1123, 1980.
255

[194] N. Zacharov and K. Koivuniemi. Audio descriptive analysis & mapping of spatial sounddisplays. In Proceedings of the International Conference on Auditory Display, 2001.
[195] Y. Zhang, Y. Xiao, M. Chen, J. Zhang, and H. Deng. A survey of security visualizationfor computer network logs. Security and Communication Networks, 5(4):404–421, 2012.
256