Solution structure and dynamics of ADF from Toxoplasma gondii
19
JOURNAL OF STRUCTURAL BIOLOGY, 176(1), 97-111 Solution structure and dynamics of ADF from Toxoplasma gondii Prem Prakash Pathak 1 , Vaibhav Shukla 1 , Rahul Yadav 1 , Anupam Jain 1 , Shubhra Srivastava 1 , Sarita Tripathi 1 , S.V.S.R. Krishna Pulavarti 1 , Simren Mehta 2 , L. David Sibley 2 , Ashish Arora 1 * 1 Molecular and Structural Biology Division, Central Drug Research Institute, Lucknow – 226 001, India 2 Microbiology, Washington University School of Medicine, 660 S. Euclid Ave., St. Louis, Missouri 63110. Tel.: 314-362-8873; Fax: 314-286-0060; Present address: Molecular and Structural Biology Division, Central Drug Research Institute, Lucknow – 226 001, India. Tel: 91 -522- 261 2411-18 ext.4329; Fax: 91-522-262 3405. E-mail address of corresponding author: [email protected] Running title: Solution structure and dynamics of TgADF CDRI communication number: xxxxx Abstract Toxoplasma gondii (TgADF) belongs to a functional subtype characterized by strong G-actin sequestering activity and low F-actin severing activity. Among the characterized ADF/cofilin proteins, TgADF has the shortest length. In order to understand its characteristic properties, we have determined the solution structure of TgADF and studied its backbone dynamics from 15 N-relaxation measurements. TgADF has conserved ADF/cofilin fold consisting of a central mixed - sheet comprised of six β-strands which are partially surrounded by three -helices and a C-terminal helical turn. The high G-actin sequestering activity of TgADF is explainable in terms of the highly structurally and dynamically optimized interactions of G-actin with the G-actin binding surface of TgADF. Using ITC, the equilibrium dissociation constant for TgADF and rabbit muscle G-actin, in G-actin buffer, has been directly determined to be 23.81 nM. This reflects the highest affinity determined so far for any ADF/cofilin and G-actin interaction, in the presence of ADP. The F-actin binding site is partially formed, yet it is more rigid than the fully formed F-actin binding site of LdCof. The experimental observations and structural features do not support the interaction of PIP2 with TgADF, and PIP2 does not affect the interaction of TgADF with G-actin. Overall, this study suggests that conformational flexibility of G-actin binding sites enhances the affinity of ADF/cofilin for G-actin, while conformational rigidity of F-actin binding sites of ADF/cofilin is necessary for stable binding to F-actin. KEYWORD- Toxoplasma gondi, (TgADF), ADF-homology (ADF-H), amino acid, human cofilin, NMR spectral, N relaxation parameters.
Transcript of Solution structure and dynamics of ADF from Toxoplasma gondii

JOURNAL OF STRUCTURAL BIOLOGY, 176(1), 97-111
Solution structure and dynamics of ADF
from Toxoplasma gondii
Prem Prakash Pathak1, Vaibhav Shukla
1, Rahul Yadav
1, Anupam Jain
1, Shubhra
Srivastava1, Sarita Tripathi
1, S.V.S.R. Krishna Pulavarti
1, Simren Mehta
2, L. David
Sibley2, Ashish Arora
1*
1 Molecular and Structural Biology Division, Central Drug Research Institute, Lucknow – 226 001, India 2Microbiology, Washington University School of Medicine, 660 S. Euclid Ave., St. Louis, Missouri 63110. Tel.: 314-362-8873; Fax:
314-286-0060;
Present address: Molecular and Structural Biology Division, Central Drug Research Institute, Lucknow – 226 001, India. Tel: 91 -522-
261 2411-18 ext.4329; Fax: 91-522-262 3405.
E-mail address of corresponding author: [email protected]
Running title: Solution structure and dynamics of TgADF
CDRI communication number: xxxxx
Abstract
Toxoplasma gondii (TgADF) belongs to a functional subtype characterized by strong G-actin sequestering activity and
low F-actin severing activity. Among the characterized ADF/cofilin proteins, TgADF has the shortest length. In order to
understand its characteristic properties, we have determined the solution structure of TgADF and studied its backbone
dynamics from 15
N-relaxation measurements. TgADF has conserved ADF/cofilin fold consisting of a central mixed -
sheet comprised of six β-strands which are partially surrounded by three -helices and a C-terminal helical turn. The high
G-actin sequestering activity of TgADF is explainable in terms of the highly structurally and dynamically optimized
interactions of G-actin with the G-actin binding surface of TgADF. Using ITC, the equilibrium dissociation constant for
TgADF and rabbit muscle G-actin, in G-actin buffer, has been directly determined to be 23.81 nM. This reflects the
highest affinity determined so far for any ADF/cofilin and G-actin interaction, in the presence of ADP. The F-actin
binding site is partially formed, yet it is more rigid than the fully formed F-actin binding site of LdCof. The experimental
observations and structural features do not support the interaction of PIP2 with TgADF, and PIP2 does not affect the
interaction of TgADF with G-actin. Overall, this study suggests that conformational flexibility of G-actin binding sites
enhances the affinity of ADF/cofilin for G-actin, while conformational rigidity of F-actin binding sites of ADF/cofilin is
necessary for stable binding to F-actin.
KEYWORD- Toxoplasma gondi, (TgADF), ADF-homology (ADF-H), amino acid, human cofilin, NMR spectral, N
relaxation parameters.

JOURNAL OF STRUCTURAL BIOLOGY, 176(1), 97-111
Introduction The proteins of the ADF/cofilin family are one of the key regulators of actin filament dynamics and have been shown
to be essential for several eukaryotes (1). ADF/cofilin proteins increase the turnover rate of actin filaments which is
accomplished by accelerating the dissociation of actin monomers from the filament pointed end. In addition, F-actin
filaments are actively severed by several members of the ADF/cofilin family proteins, leading to the generation of new
uncapped barbed ends that immediately start growing. The ADF/cofilin proteins manifest their activity through G-actin
binding (2), F-actin binding and depolymerization (2), F-actin severing (3), controlling the rate of nucleotide exchange
from actin monomer (3-7), and actin monomer sequestering activity (4, 8-10). ADF/cofilin proteins show pH sensitivity
which is more pronounced in case of the vertebrate than other eukaryote. The F-actin depolymerizing activity (11) of
ADF/cofilin proteins is higher at high pH ~8 compared to pH~6.8 (12). However, the activity of ADF/cofilin from
Leishmania donovani and Toxoplasma gondii are pH independent (10, 13).
Based on structure and function, ADF/cofilins have been categorized into vertebrate, plant, and non-vertebrate
subgroups. The non-vertebrate ADF/cofilins represent the highly conserved ADF-homology (ADF-H) fold, which is also
observed in destrin, actophorin, gelsolin etc. The structure of 143 residue S. cerevisiae cofilin consists of a six stranded
mixed -sheet, in which the four central strands are anti-parallel while the two edge strands run parallel to the neighboring
strands. The -sheet is sandwiched between a pair of -helices on each face. The longest helix (3) is kinked at the
position of a serine residue in a conserved segment. ADF/cofilins have two distinct actin-binding sites. These have been
named as the G/F-site and the F-site (14). The G/F-site of ADF/cofilins is required for binding to both the G-actin and the
F-actin. This binding site corresponds to helix α3 (long kinked helix), the N-terminal flexible region and the strand β5.
This region also includes the loop before the C-terminal helix (α4) (15). The F-site is responsible for binding to F-actin
and F-actin severing activity. In conventional ADF/cofilins, the F-site is comprised of the β3-β4 loop, also called the „F-
loop‟, C-terminal helix (helix α4), and the C-terminus. The F-loop typically projects out of the structure and is predicted
to intercalate within the actin filament. Sites of ADF/cofilin involved in actin binding have been confirmed by several
mutational analysis (16-18), cross-linking (19), and peptide competition or synchrotron electron footprinting (20). The
G/F-actin binding sites and the F-actin binding sites cluster together in the three-dimensional structure (21-23) to
constitute respective actin binding surfaces.
Vertebrate cofilins are ~160 residues long and in comparison to non-vertebrate subgroup, these have two sequence
inserts and an extension of C-terminus. In chick cofilin, human cofilin, and destrin, the first insert is an additional segment
bearing helix (2), in between 1 and 2, which contains a putative nuclear localization sequence (NLS). A second seven
residue insert follows 3. In chick cofilin, this insert forms a bulge followed by an additional -strand that pairs with the
N-terminal end of 2 and expands the central sheet scaffold (24). Vertebrate ADF/cofilins also contain a C-terminal
extension of approximately eight residues. In chick cofilin, this extension forms a -hairpin comprising antiparallel
strands 7 and 8 that nestle between 4 and 6 (24). This places the C-terminal hairpin adjacent to the putative F-actin-
binding site that has been mapped to the N-terminal end of 4, the C-terminal end of 6, and the loop immediately
preceding the hairpin. In chick cofilin, the strand 7 pairs with the C-terminal end of 4 and expands the core six-stranded
ADF/cofilin -sheet to an eight-stranded sheet by addition of the C-terminal hairpin. The sequence of the C-terminal
extension may be unique to vertebrate cofilins and it may impart unique F-actin binding properties. The two vertebrate
specific inserts are spatially proximal to the C-terminal extension, and together they define a contiguous “horseshoe-
shaped” surface that provides structural stability to the F-loop.
Various activities of ADF/cofilin family proteins have been shown to be dependent on the affinity of these
proteins for the actin filaments. It has been observed in the case of the human cofilin that a point mutation of a basic
residue K96 in the F-loop leads to a loss of severing activity and increased depolymerizing activity (23). Similarly it has
been reported that by mutation, in the F-actin binding sites of ADF/cofilin proteins, severing and depolymerizing
activities can be uncoupled (18, 23, 25). In the case of Schizosaccharomyces pombe cofilin, it has been found that the
point mutation of R78 in the F-loop resulted in a loss of nucleating activity (26).
Intracellular protozoan parasites that belong to the phylum Apicomplexa are a significant cause of disease in humans
and animals (27). Apicomplexa parasites utilize a unique mode of motility, termed gliding, to move across epithelial
barriers and translocate into the host cytoplasm (28). Gliding motility is conserved across the Apicomplexa, is dependent
on the turnover of actin filaments, and is inhibited by treatment of the parasites with cytochalasin D (29). Although,

JOURNAL OF STRUCTURAL BIOLOGY, 176(1), 97-111
Apicomplexa actins characterized so far exhibit high sequence homology to the vertebrate actins, they are in contrast
typically inherently unstable (30-32), have significantly lower critical concentration for polymerization (30), and yet are
almost exclusively unpolymerized in the cytoplasm (30, 33-34). For example, 98% of actin is present as G-actin in T.
gondii (30, 33-34), in comparision to higher eukaryotes where up to 50% cellular actin is in the filament form. Despite the
presence of G-actin in high cellular concentration, filamentous actin, and its efficient turnover, are essential for both
gliding motility and the host cell invasion by T. gondii (33,35-36).
T. gondii expresses a conserved homolog of the ADF/cofilin family (TgADF) that has been shown to play a critical
role in actin monomer sequestering and filament disassembly (10). TgADF does not co-sediment with actin filaments.
However, it does disassemble actin filaments in pH independent manner but does not form stable association with actin
filaments. At low concentration, TgADF was also shown to possess low severing activity. However, at high
concentrations, TgADF inhibited nucleation and polymerization due to sequestering of monomer.
The genomes of Apicomplexa T. gondii, Eimeria tenella and Neospora caninum express ADF/cofilin proteins that are
only 118 residues in length. In these ADF/cofilin proteins, the G/F-actin binding sites are significantly conserved, but
there are significant deletions of residues that are required to form the sites for binding F-actin. Specifically, these
Apicomplexan ADF/cofilins possess a truncated C-terminus and lack the C-terminal charged residues that are predicted as
necessary to bind to F-actin. The F-loop is itself much shorter and lacks the conserved basic residue for interaction with F-
actin. Plasmodium contains two members of the ADF/cofilin family. In P. falciparum, the larger of the two, termed as
PfADF2, is a 143 residue protein which is closer to the conventional yeast type ADF/cofilin (37). The shorter ADF,
termed as PfADF1, consists of 122 residues, and closely resembles ADF from the other Apicomplexa described above.
The shorter Apicomplexan ADF proteins are the smallest in the ADF/cofilin family and have not been structurally
characterized so far.
In our present study, we have determined the solution structure of TgADF using NMR spectroscopy. Further, we
have measured backbone 15
N-relaxation rates and have analyzed the dynamics of TgADF in solution using the Lipari-
Szabo formalism. We have also determined the thermodynamic parameters characterizing the interaction of TgADF with
rabbit muscle ADP-G-using isothermal titration calorimetry (ITC). Another experimental investigation was to probe the
affect of dioctanoyl phosphatidylinositol-4,5-bisphosphate (PIP2), on TgADF itself, and on biding of TgADF to rabbit
muscle ADP-G-actin, using ITC and NMR experiments. In order to better understand the structure-function relationship,
we have docked the solution structure of TgADF on the crystal structure of G-actin monomer. The docking study has
provided us with important insights into the dynamic regulation of structural interaction that lead to high affinity of
TgADF and G-actin interactions.
Experimental Procedures
Preparation of NMR samples
The TgADF protein is composed of 118 amino acid residues with an additional N-terminal twenty-one residue
purification tag making the molecular weight of the tagged protein equal to 15480 Da. TgADf was cloned by Mehta et.
al.(10). The clone was over-expressed in BL21 (λDE3) strain of E. coli. Condition for optimal over-expression and
purification were standardized. The yield of purified protein was 30 mg/L of culture medium. For isotopic labeling, over-
expressed TgADF was standardized in minimal media containing 15
N-ammonium sulfate and 13
C-glucose (CIL, MA,
USA) as the sole nitrogen and carbon sources, respectively.
NMR samples of 13
C / 15
N-labeled TgADF were prepared at concentration of approximately 0.8 mM in NMR
buffer (20 mM sodium phosphate pH 6.5, 50 mM NaCl, 1 mM DTT, 0.1% NaN3, and 1 mM AEBSF) containing 95%
H2O / 5% 2H2O.
Dioctanoyl-PI(4,5)P2 sample was prepared in G-actin buffer (2.0 mM HEPES, 0.2 mM CaCl2, 0.2 mM ADP, 1.0
mM NaN3, 1.0 mM BME, pH 7.4) at a concentration of 1 mg/mL (1.34 mM). TgADF was added to this sample for a final
concentration of 0.1mM for recording the 1D spectra of dioctanoyl-PI(4,5)P2 in presence of TgADF.
NMR spectral assignments

JOURNAL OF STRUCTURAL BIOLOGY, 176(1), 97-111
The following experiments were acquired using Varian Biopack package: two-dimensional 15
N-1H-HSQC, and three-
dimensional HNCACB, CBCA(CO)NH, HNCO, HN(CA)CO, HNCA, H(CCO)NH-TOCSY, (H)C(CO)NH-TOCSY,
HCCH-TOCSY, and 15
N-edited NOESY HSQC (τmix -100 ms), (aromatic), HBHA(CBCACO)NH, 2D-13
C-1H-HSQC
(aliphatic), 13
C-1H-HSQC , HB(CBCGCE)HE, and HB(CBCGCD)HD. All spectra were collected at 298 K on Varian
Inova 600 MHz spectrometer equipped with actively shielded Z-gradient triple resonance Cold probe. Spectra were
processed by using the software NMRPipe (38) and analyzed by CARA-1.8.4 (39). The NMR data was referenced for 1H
chemical shifts by using 2, 2-dimethyl-2-silapentane-5-sulphonic acid (DSS) at 298 K as a standard. The 13
C and 15
N
chemical shift were referenced indirectly. All NMR experiments were collected at 25 ˚C.
Structure calculations
Distance constraints were obtained from 3D 15
N-edited NOESY-HSQC spectra (τmix-150 ms), 13
C-edited NOESY-
HSQC (τmix-100 ms and 180 ms), and 13
C (aromatic)-edited NOESY-HSQC spectra (τmix-100 ms). All the spectra were
processed using NMRPipe (38) and all NOE were assigned manually using CARA-1.8.4 (39). Integrated NOE peaks were
calibrated and converted to distance constraints with the program CALIBA. In the final structural determination, the
program CYANA-3.0 (40) was used. The torsion angle constraints were obtained from assigned backbone chemical shifts
using the program TALOS+ (41). A total of 200 randomized conformers were generated and 20 conformers with lowest
target function were selected. The 20 structures with lowest target function were further subjected to molecular dynamics
simulation in explicit water using the CNS 1.21 program (42) and the standard water shell refinement protocol (43,44). At
this stage the distances were relaxed and in addition to this CHI2 angles were included for LEU and LYS residues. This
step improved the Ramachandran plot statistics and also the Z-score for the Procheck (phi-psi) and Procheck (all) for the
ordered residues. The programs CING and PSVS v1.4 (www.psvs-1_4.nesg.org) were used to analyze the quality of the
structures. The program PYMOL (http://pymol.sourceforge.net/) was used for generating figures for structures. The
charged surface was generated by using program GRASP (45).
Relaxation measurements
All relaxation experiments were recorded on uniformly 15
N-labeled 0.8 mM TgADF sample. The spin-lattice R1 rate
measurements were conducted with relaxation delays of 0, 10, 70, 110, 190, 280, 450, 610, 890, 1100, and 1330 ms. The
spin-spin relaxation measurements R2 were done with Carr-Purcell-Meiboom-Gill delays of 10, 30, 50, 70, 90, 130, 170,
190, and 230 ms. Duplicate 1H-
15N HSQC spectra were recorded for every relaxation delay value for both R1 and R2 data.
The relaxation rates for both R1 and R2 were determined from the decay of the intensity of each 1H-
15N crosspeaks in this
series of spectra. All of the relaxation parameters, along with the {1H}-
15N nuclear Overhauser effect (NOE) intensities
for backbone 15
N nuclei, were measured at 25 ˚C, at a magnetic field strength of 14.1 T (corresponding to the resonance
frequency of 599.721 MHz for 1H). All the relaxation data were acquired with 96 Χ 1024 (t1 Χ t2) complex points and
spectral width of 2309.493 Hz and 8401.596 Hz, respectively. The R1 and R2 values were obtained by using the program
Curvefit. The errors in individual R1 and R2 measurements were estimated by Monte Carlo simulations. The steady state
heteronuclear {1H}-
15N NOE spectra were acquired in an interleaved manner, in which each individual FID was collected
with and without proton presaturation. The steady state heteronuclear {1H}-
15N NOE values were obtained by recording
spectra with and without proton presaturation period (3 s) applied before the start of the 1H-
15N HSQC experiment. The
heteronuclear 15
N relaxation parameters R1, R2, and the steady state heteronuclear {1H}-
15N NOE values were analyzed by
model-free formalism as described earlier (46-48). For model-free analysis, the N-H bond length was assumed to be 1.02
Å and 15
N chemical shift anisotropy value of –160 ppm was considered. The uncertainties in R1 and R2 were set to an
upper limit of 3% and 5%, respectively. While the uncertainties in steady state heteronuclear {1H}-
15N NOE were fixed at
0.05.
R1, R2, and steady state heteronuclear {1H}-
15N NOE were subjected to model-free analysis (48-51). The ratio of
principle components of inertia tensor, calculated using the software Pdbinertia (http:
//biochemistry.hs.columbia.edu/labs/palmer/software/pdbinertia.html), for the solution structure with lowest target
function was found to be 1.0:0.79:0.66, suggesting that the molecule could be axially symmetric. However, a statistical F-
test indicated that an axially symmetric diffusion model did not describe the experimental data significantly better than an

JOURNAL OF STRUCTURAL BIOLOGY, 176(1), 97-111
isotropic model (F =4.59, p =0.0058). A final optimization of R1, R2, and steady state heteronuclear {1H}-
15N NOE value
for the residues that were assigned to any of the five motional models yielded τm = 6.203 0.02 ns.
Isothermal Titration Calorimetry
ITC experiments were performed at 25 ˚C on a VP-ITC calorimeter from MicroCalTM
(Northampton, MA, USA). The
calorimeter was calibrated according to the user manual of the instrument. All the samples were short spinned and then
degassed for 20 min before each of the ITC experiments. Titrations were performed at least in duplicate using the same
set of stock solutions. The ITC experiments were performed by adding aliquots of ligands to rabbit muscle actin. The
rabbit muscle actin for the experiments were prepared as mentioned earlier (52,53). Stock solution of TgADF and rabbit
muscle actin were dialyzed extensively against the HEPES buffer (G-actin buffer) (2.0 mM HEPES, 0.2 mM CaCl2, 0.2
mM ADP, 1.0 mM NaN3, 1.0 mM BME, pH 7.4). The sample cell was filled with 1.459 mL of 0.003 mM of rabbit
muscle actin (titrand) and titrated against TgADF which was filled in the syringe of 290 μL at a concentration of 0.03
mM. The injectant volume was set at 10 μL per injection, and the duration of the injection was 20 s, with an interval of
180 s between injections. During the titration, the reaction mixture was continuously stirred at 351 rpm. Control
experiments were performed by injecting TgADF into G-actin buffer under condition exactly similar to the rabbit muscle
actin/titrand titration, to take into account heats of dilution and viscous mixing. The heats of injection of the control
experiment were subtracted from the raw data of rabbit muscle actin and titrand titration.
L-α-Phosphatidyl-D-myo-inositol 4,5-diphosphate dioctanoyl, (dioctanoyl-PI(4,5)P2) was purchased from Sigma-
Aldrich. The two stock solution of dioctanoyl-PI(4,5)P2 were prepared by dissolving 1 mg in 1 ml of G-actin buffer and
other in 1 ml of 0.03 mM TgADF and sonicated three times for 10 seconds in sonicator. Titration of TgADF-dioctanoyl
PI(4,5)P2, and dioctanoyl PI(4,5)P2 to G-actin was done in similar condition as above for TgADF and G-actin. The
concentration of G-actin in the serial titration is reduced to 0.0025 mM due to addition of 282 L of titrant from syringe
for first titration. Control experiments were performed by injecting dioctanoyl-PI(4,5)P2 and TgADF-dioctanoyl-
PI(4,5)P2 in buffer.
The ITC data were analyzed using the ORIGIN version 7.0 software provided by MicroCalTM
. The heats of binding
were normalized with respect to the titrand concentration, and a volume correction was performed to take into account
dilution of titrand during each injection. The amount of heat produced per injection was calculated by integration of the
area under each peak using a baseline selected by the ORIGIN program, assuming a one site binding model. The
dissociation constant (Kd) and molar enthalpy (H) for the binding of titrand to actin was determined by non-linear least
square fitting to the data.
Docking of rabbit muscle actin monomer with TgADF
The Crystal structure of C-terminal ADF-H domain of Twinfilin (Twc) in complex with G-actin monomer (PDB ID:
3DAW) was taken as a model to build a docked model of TgADF with G-actin monomer. TgADF shares only 12%
sequence identity with Twc. However, residues in the helix α3 region which is important for the G-actin binding are
highly conserved. We used GRAMM-X protein-protein docking web server V-1.2.0 which is publicly available
(http://vakser.bioinformatics.ku.edu/resources/gramm/grammx) for docking studies. In order to validate the docking
program we analyzed the details of interface of Twc and G-actin monomer crystal structure (PDB ID: 3DAW) by using
the web based sever PDBePISA (http://www.ebi.ac.uk/msd-srv/prot_int/pistart.html). Thereafter, we separated the Twc
and G-actin monomer from the crystal structure and used the actin and Twc as receptor and ligand, respectively for
docking at the GRAMM-X protein-protein docking server. The details of interface of the Twc docked over G-actin
monomer were reanalyzed using the server PDBePISA. Now, TgADF was taken as ligand and the G-actin monomer from
the crystal structure of PDB ID 3DAW, after removing the Twc from it, was taken as receptor and docked using the
GRAMM-X protein-protein docking server. The details of the interface area were analyzed by using the web based sever
PDBePISA (http://www.ebi.ac.uk/msd-srv/prot_int/pistart.html).
JOURNAL OF STRUCTURAL BIOLOGY, 176(1), 97-111
Result
Assignments and Data deposition
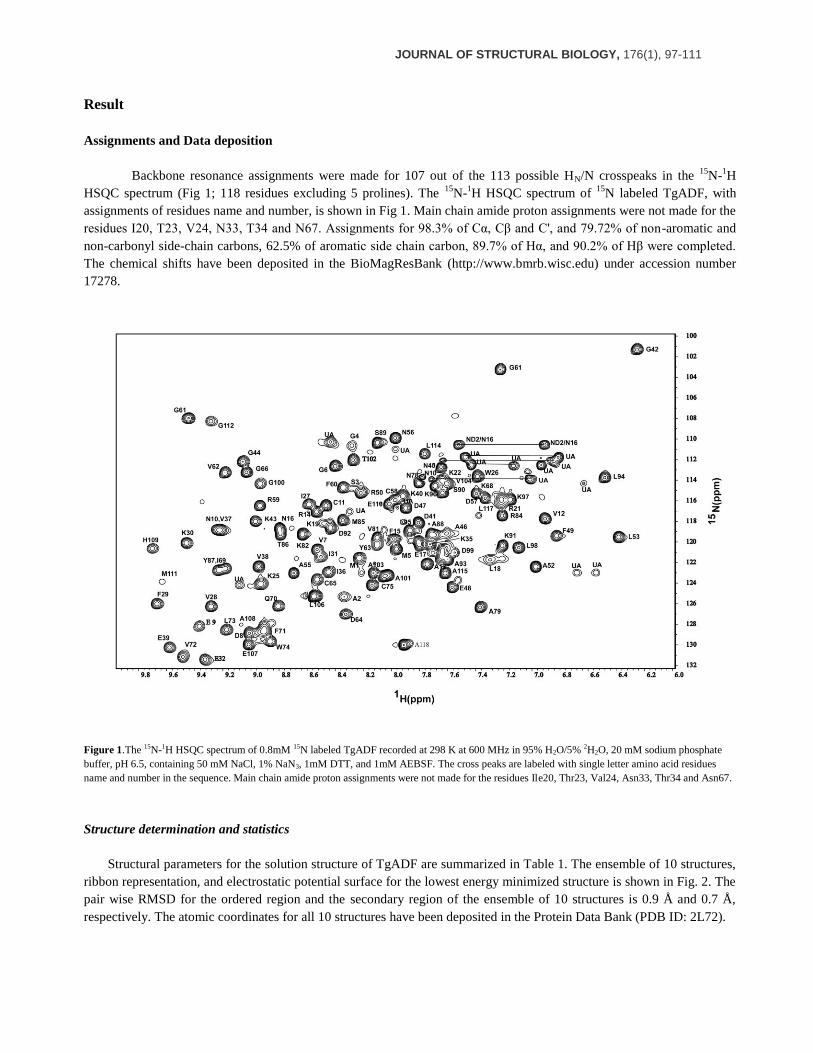
Backbone resonance assignments were made for 107 out of the 113 possible HN/N crosspeaks in the 15
N-1H
HSQC spectrum (Fig 1; 118 residues excluding 5 prolines). The 15
N-1H HSQC spectrum of
15N labeled TgADF, with
assignments of residues name and number, is shown in Fig 1. Main chain amide proton assignments were not made for the
residues I20, T23, V24, N33, T34 and N67. Assignments for 98.3% of Cα, Cβ and C', and 79.72% of non-aromatic and
non-carbonyl side-chain carbons, 62.5% of aromatic side chain carbon, 89.7% of Hα, and 90.2% of Hβ were completed.
The chemical shifts have been deposited in the BioMagResBank (http://www.bmrb.wisc.edu) under accession number
17278.
Figure 1.The 15N-1H HSQC spectrum of 0.8mM 15N labeled TgADF recorded at 298 K at 600 MHz in 95% H2O/5% 2H2O, 20 mM sodium phosphate
buffer, pH 6.5, containing 50 mM NaCl, 1% NaN3, 1mM DTT, and 1mM AEBSF. The cross peaks are labeled with single letter amino acid residues
name and number in the sequence. Main chain amide proton assignments were not made for the residues Ile20, Thr23, Val24, Asn33, Thr34 and Asn67.
Structure determination and statistics
Structural parameters for the solution structure of TgADF are summarized in Table 1. The ensemble of 10 structures,
ribbon representation, and electrostatic potential surface for the lowest energy minimized structure is shown in Fig. 2. The
pair wise RMSD for the ordered region and the secondary region of the ensemble of 10 structures is 0.9 Å and 0.7 Å,
respectively. The atomic coordinates for all 10 structures have been deposited in the Protein Data Bank (PDB ID: 2L72).

JOURNAL OF STRUCTURAL BIOLOGY, 176(1), 97-111
FIGURE 2. Solution structure of TgADF. (A) Superimposition of backbone traces from final ensemble of 10 structures with lowest target function. (B)
Ribbon diagram of lowest energy structure of TgADF showing five stranded mixed β-sheet surrounded by four α-helices. The individual β strands and α
helices are labeled. (C) Electrostatic potential of TgADF generated with GRASP. The positively and negatively charged groups are shown in blue and
red, respectively.
Table. 1 Experimental restraints and structural statistics for final ensemble of 10 TgADF Structures
Distance Restraint List
classes TgADF
sequential 440
intra-residual 444
medium-range 275
long-range 359
Hydrogen bonds 47
Dihedral angle constraints( and ) 192
RMSD values (Å) Ordered residuesa
(Å)
All backbone atoms 0.9
All heavy atoms 1.3
Ramachandran plot statisticsa
Most favored region (%) 93.3
Allowed region (%) 6.6
Additionally allowed region (%) 0.1
Disallowed region (%) 0.0 a region,2-51,57-98,100-108,112-117

JOURNAL OF STRUCTURAL BIOLOGY, 176(1), 97-111
The solution structure of TgADF can be conventionally related to the canonical ADF/cofilin fold found in the
ADF/cofilin, twinfilin, and drebrin/abp1 families of ABPs (54). The core of the TgADF consists of a central six-stranded
mixed β-sheet which is encased by helices α1 and α3 on one face and by helix α2 and the C-terminal end of the TgADF,
on the opposite face. The strand ordering is β1-β3-β2-β4-β5-β6, in which four central strands are antiparallel and strands
β1-β3 and β5-β6 run parallel to each other. The β-strands are β1 (G6-V7), β2 (W26-E32), β3 (K35-G42), β4 (F60-D64),
β5 (I69-W74) and β6 (A105-A108), and the -helices are 1 (E9-L18), 2 (N45-A52), and 3 (V81-L98). Close to the
C-terminal of TgADF, there is a short helical turn involving the residues M111-L114. The orientation of this helical turn
is fixed due to NOEs observed between residues of this region and residues around the helix α2. The helix α1 is parallel to
the strand β2 and helix α3 is parallel to the strand β5. The longest helix α3 in the structure of TgADF is slightly kinked,
almost in the center, at residues S89 and S90. This kinking, which is a conserved structural feature of ADF/cofilins, is
well supported by observed NOEs between side chain of L94 (helix α3) and F60 (strand β3) and between S90 and L94 of
helix α3 and I31 of strand β2. Long range NOEs were observed between residues of helix α3, strand β5, and the loop
connecting strand β2-β3. These NOEs define the position of the helix α3. The solution structure of TgADF is stabilized by
a few salt bridges in the structure. The C-terminal of the helix α1 is stabilized by the salt bridges clustered between E17
and R21 (C-terminal of α1), K25 (β2), and K43 (β3). The interaction of helix α1 and strand β3 is stabilized by the salt
bridge between R14 (α1) and D41 (β3). K19 of helix α1 also forms salt bridge with D99 present at the C-terminal end of
the helix α3. Another salt bridge is present between R59 (β4) and E39 (β3) and D57, which stabilizes the interaction of
strand β3 and strand β4.
Comparison of TgADF structure with other ADF/cofilin proteins in the Protein Data Bank was carried out using the
program DaliLite version 3.0 (55). TgADF has structural similarity with Acanthamoeba actophorin with Z-score of 12.1
and RMSD of 2.6 Å. TgADF shares RMSD of 2.4 Å with plant ADF (PDB ID: 1F7S) and Schizosaccharomyces pombe
(PDB ID: 2I2Q). However, it shares higher RMSD with vertebrate ADF/cofilin structures. It has RMSD of 2.8 Å, 2.9 Å,
and 3.3 Å with Twinfilin C-terminal ADF-H domain (PDB ID: 3DAW), chicken cofilin (PDB ID: 1TVJ), and human
non-muscle cofilin (PDB ID: 1Q8Q), respectively.
The solution structure of TgADF varies from the other ADF/cofilin structure in terms of the surface charge
distribution which is, putatively, an important factor for dioctanoyl-PI(4,5)P2 interaction. Residues K95, K96, W104,
K112, K114, K125, K126, K127, K132, and H133 are conserved in mouse cofilin 1, human cofilin 1, chicken cofilin 1,
and human destrin. The cluster of these residues confers a large positively charged surface which is critical for dioctaoyl-
PI(4,5)P2 binding. In TgADF, the corresponding residues are C65, G66, W74, K82, R84, L95, K96, K97, T102, and
A103, which do not yield a large positively charged surface similar to vertebrate analogs. C65 and G66 are present at the
F-loop (loop connecting β4-β5). The residues K82-K97 are present on the helix α3, while T102 and A103 are at the N-
terminal of strand β6.
Backbone Dynamics of TgADF
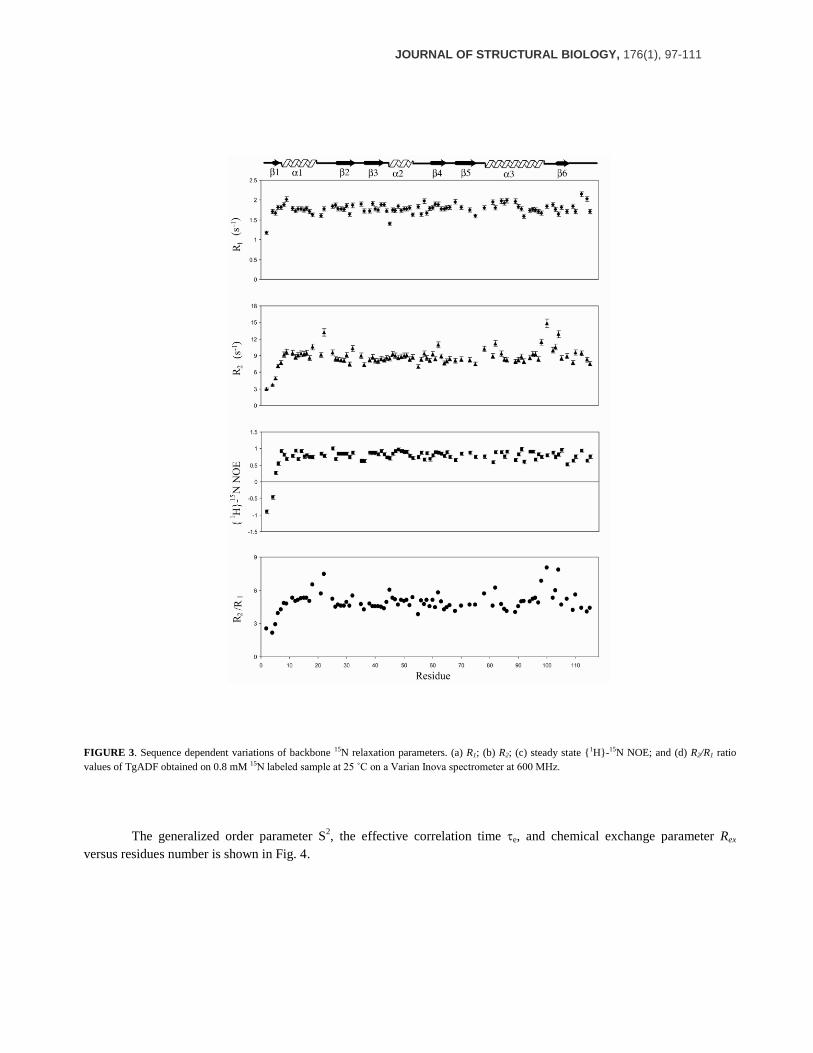
To gain an insight into the backbone dynamics of TgADF in solution, we measured 15
N longitudinal relaxation
rates (R1), transverse relaxation rates (R2) and {1H}-
15N heteronuclear NOEs. The backbone relaxation rates of 85 out of
113 non proline residues were calculated by using the program Curvefit. The average values of relaxation parameters for
these residues are R1 = 1.78 s-1
, R2 = 8.77 s-1
, and steady state heteronuclear {1H}-
15N NOE = 0.76. The residue specific
R1, R2 and steady state heteronuclear {1H}-
15N NOE values obtained for TgADF at 600 MHz are shown in Fig. 3. The
relaxation parameters were subjected to model-free analysis (48-51), which yielded a rotational correlation time (m) of
6.203 0.02 ns for the protein molecule. In model-free analysis, 84 residues could be fitted while one residue, A2,
remained unfitted. The average generalized order parameter S2 for the 84 fitted residues is 0.88 ± 0.02. 61 residues were
fitted to model 1, with an average S2 = 0.91 ± 0.01; ten residues were described by model 2, with an average S
2= 0.79 ±
0.02; 10 residues were described by model 3, with an average S2= 0.87 ± 0.01; one residue was described by model 4 with
S2 value of 0.81± 0.02; two residues were described by model 5, with an average S
2 = 0.55 ± 0.01. Most of the residues
fitted in model 1 lie in regions having secondary structure.
JOURNAL OF STRUCTURAL BIOLOGY, 176(1), 97-111
FIGURE 3. Sequence dependent variations of backbone 15N relaxation parameters. (a) R1; (b) R2; (c) steady state {1H}-15N NOE; and (d) R2/R1 ratio
values of TgADF obtained on 0.8 mM 15N labeled sample at 25 ˚C on a Varian Inova spectrometer at 600 MHz.
The generalized order parameter S2, the effective correlation time e, and chemical exchange parameter Rex
versus residues number is shown in Fig. 4.

JOURNAL OF STRUCTURAL BIOLOGY, 176(1), 97-111
FIGURE 4. The order parameter S2, conformational exchange Rex, and effective correlation time e are plotted against residue number.
The generalized order parameter S2 for N-terminal, F-loop, and C-terminal are 0.45 ±0.02, 0.88 ± 0.01, and 0.82
± 0.02, respectively, indicating that the N-terminal is far more flexible in comparison to the F-loop and the C-terminal.
The residues L18, R21 (C-terminal of α1), K22, N78, K82 (α3), L98 (α3), G100 (loop between α3 and β6), A103, V104
(loop between α3 and β6), E107 (β6), and E110, show Rex term ranging from 1.15 to 5.97 Hz. Residues G4, M5, G6, K35,
I36, D57, R59, K68, S89, D92, E107, H109, L114, show effective correlation term and are expected to undergo
fluctuations on fast picoseconds-to-nanosecond time scale. The ribbon representations of lowest energy TgADF structure
shaded according to residue specific generalized order parameters (S2), effective correlation time (τe) and conformational
exchange term (Rex) are shown in Fig. 5.

JOURNAL OF STRUCTURAL BIOLOGY, 176(1), 97-111
FIGURE 5. Backbone dynamics of TgADF from model-free analysis. (A) The ribbon representation of TgADF lowest energy solution structure shaded
according to the S2 values derived from model-free analysis. The color coding is from blue for S2=1, to red for S2=0.2. Prolines and residues that are not
included in model-free analysis are colored gray. (B) The ribbon representation of TgADF shaded according to chemical exchange (Rex) terms, effective
correlation (τe) times from model-free analysis, and the unassigned residue. The residues displaying conformational exchange are represented in green,
while the residues displaying motion on picosecond to nanosecond timescale are represented in blue and the unassigned residues (UA) are colored red.
FIGURE 6. Probing TgADF-Actin interactions by ITC. The negative peaks indicate an exothermic reaction. The area under each peak represents the
heat released after an injection of TgADF into ADP-G-Actin solution. (Lower) Binding isotherms obtained by plotting peak areas against the molar ratio
of TgADF to ADP-G-Actin. The lines represent the best-fit curves obtained from least-squares regression analyses assuming a one-site binding model

JOURNAL OF STRUCTURAL BIOLOGY, 176(1), 97-111
Isothermal Titration Calorimetry
The structural features of TgADF are well supported by a direct demonstration of its binding with rabbit muscle
G-actin in the presence of ADP. Isothermal titration calorimetry (ITC) titration of TgADF with ADP-G-actin reveals
1:1.23 stoichiometry and a dissociation constant Kd of 23.81 nM, with ∆G of -10.3947 X 10⁴ cal/mole, ΔH of -1.391 X
104 ± 175.5 cal/mole and ΔS of -11.7961 cal/mole K. The binding of TgADF to G-actin is enthalpy driven. The ITC curve
is shown in Fig. 6.
FIGURE 7. Probing TgADF - dioctonoyl PI(4,5)P2 interaction by ITC and NMR. The negative peaks indicate an exothermic reaction. The area under
each peak represents the heat released after an injection of TgADF into ADP-G-Actin solution. (Lower) Binding isotherms obtained by plotting peak
areas against the molar ratio of TgADF to ADP-G-Actin. The lines represent the best-fit curves obtained from least-squares regression analyses
assuming a one-site binding model. (A) ITC of TgADF-dioctonoyl PI(4,5)P2, (B) ITC of Rabbit muscle ADP-G-actin, (C) TgADF- dioctonoyl
PI(4,5)P2+ Rabbit muscle ADP-G-actin. (D) 1-D spectra of buffer (blue), dioctonoyl PI(4,5)P2 (red), dioctonoyl PI(4,5)P2 in presence of TgADF
(green). (E) 1H-15N HSQC spectra overlap of TgADF (red) and TgADF in presence of dioctonoyl PI(4,5)P2 (blue).
The ITC titrations show that neither ADP-G-actin nor TgADF, in G-actin buffer, interact with dioctanoyl-
PI(4,5)P2. The interaction of TgADF with G-actin in the presence of dioctanoyl-PI(4,5)P2 was confirmed by first titrating
dioctanoyl-PI(4,5)P2 with G-actin, and then the G-actin–dioctanoyl-PI(4,5)P2 mixture with TgADF. The ITC data reveals
the stoichiometry of 1:1.40 and a dissociation constant Kd of 69.44 nM with ∆G of -9.7608 X 10⁴ cal/mole, ΔH of -1.1549
X 104 ± 409.7 cal/mole and ΔS of -19.2 cal/mole K, which is relevant with result obtained from titrating TgADF alone
with G-actin. A similar S-shaped one-binding site thermogram was obtained, although with higher baseline noise, when a
mixture of TgADF-dioctanoyl-PI(4,5)P2 was titrated with G-actin. The lack of structural interaction between TgADF and
dioctanoyl-PI(4,5)P2 was also confirmed by recording 1H-
15N-HSQC spectra of
15N-labeled -TgADF in the presence and
JOURNAL OF STRUCTURAL BIOLOGY, 176(1), 97-111
absence of dioctanoyl-PI(4,5)P2. The 1D proton spectra of dioctanoyl-PI(4,5)P2 with and without TgADF is shown in Fig
7D. In Fig 7E, the overlapped 1H-
15N-HSQC spectra of Tgadf and Tgadf-dioctanoyl-PI(4,5)P2 are shown. No chemical
shift perturbation of TgADF peaks is seen in the presence of ~10 fold molar excess of dioctanoyl-PI(4,5)P2.
Docking of rabbit muscle actin monomer with TgADF
We used the GRAMM-X protein-protein docking web server V-1.2.0 for generating a docked model of TgADF with
rabbit muscle G-actin monomer. The starting template for docking was the crystal structure of G-actin bound to C-
terminal ADF-H domain of Twinfilin (Twc) (PDB Id: 3DAW). To test the software and docking parameters, Twc and G-
actin monomer were re-docked and the result was compared with the crystal structure of the their complex (PDB Id:
3DAW). Based on the overall comparison of interfacial area of the crystal structure and the docking model, it was inferred
that the GRAMM-X protein-protein docking web server was able to dock the Twc and G-actin monomer in correct
orientation. Therefore, using a similar protocol, the lowest energy solution structure of TgADF was docked onto the G-
actin crystal structure, after removing Twc from the crystal structure of its complex with G-actin. The details of interface
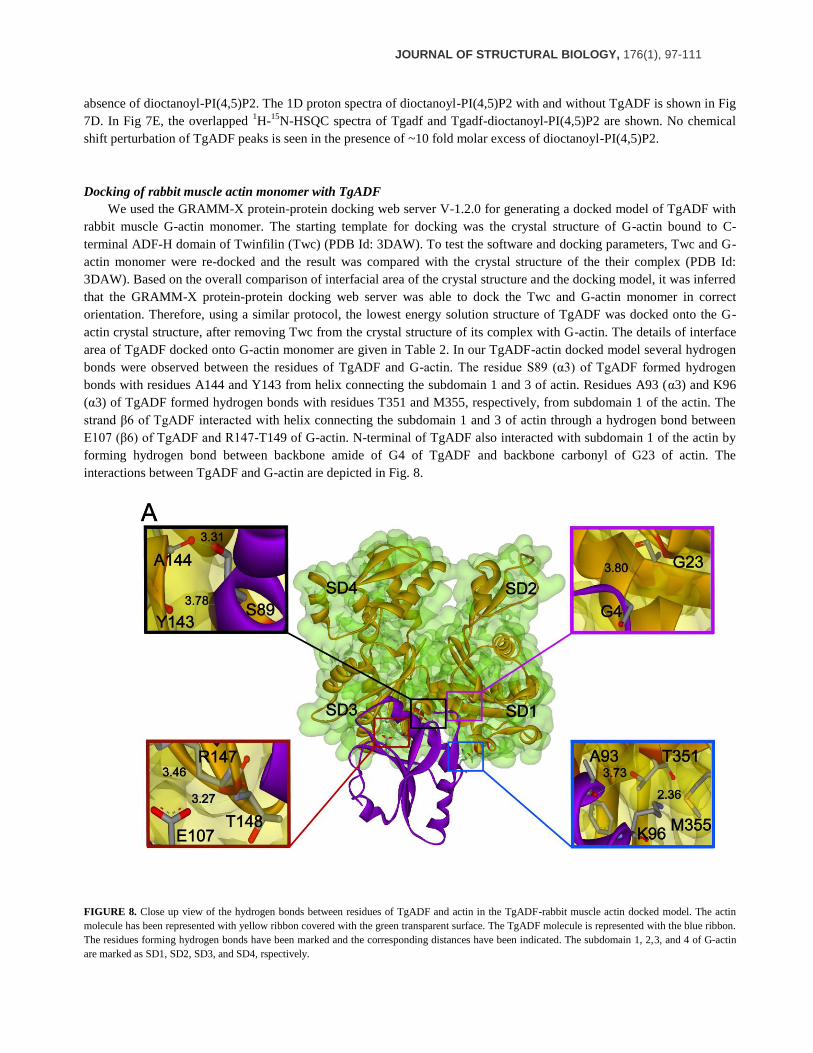
area of TgADF docked onto G-actin monomer are given in Table 2. In our TgADF-actin docked model several hydrogen
bonds were observed between the residues of TgADF and G-actin. The residue S89 (α3) of TgADF formed hydrogen
bonds with residues A144 and Y143 from helix connecting the subdomain 1 and 3 of actin. Residues A93 (α3) and K96
(α3) of TgADF formed hydrogen bonds with residues T351 and M355, respectively, from subdomain 1 of the actin. The
strand β6 of TgADF interacted with helix connecting the subdomain 1 and 3 of actin through a hydrogen bond between
E107 (β6) of TgADF and R147-T149 of G-actin. N-terminal of TgADF also interacted with subdomain 1 of the actin by
forming hydrogen bond between backbone amide of G4 of TgADF and backbone carbonyl of G23 of actin. The
interactions between TgADF and G-actin are depicted in Fig. 8.
FIGURE 8. Close up view of the hydrogen bonds between residues of TgADF and actin in the TgADF-rabbit muscle actin docked model. The actin
molecule has been represented with yellow ribbon covered with the green transparent surface. The TgADF molecule is represented with the blue ribbon.
The residues forming hydrogen bonds have been marked and the corresponding distances have been indicated. The subdomain 1, 2,3, and 4 of G-actin
are marked as SD1, SD2, SD3, and SD4, rspectively.

JOURNAL OF STRUCTURAL BIOLOGY, 176(1), 97-111
Table 2. Interface interaction results for docking of crystal structure of actin and TgADF
ACTIN TgADF
Number of atom
Interface
Surface
Total
116(4.0%)
1598(55.1%)
2901(100%)
89(9.2%)
582(64.2%)
906(100%)
Number of residue
Interface
Surface
Total
35(9.4%)
344(92.5%)
372(100%)
28(23.7%)
115(97.5%)
118(100%)
Solvent accessiblearea,A2
Interface
Total
1061(6.2%)
17135(100%)
1085.3(16.0%)
6769.2(100%)
Solvent energy in kcal/mol
Isolated residue
Gain of complexation
Average gain
P-value
-378.8(100%)
-8.1(2.1%)
-2.1(0.6%)
0.031
-103.3(100%)
-7.2(7.0%)
-3.0(2.9%)
0.0.107
SALT BRIDGE
Hydrogen Bond
## ACTIN Distance(Å) TgADF
1 THR 351 (OG1) 3.73 ALA 93 (O)
2 THR 148 (N) 3.27 GLU 107 (OE2)
3 THR 149 (N) 3.72 GLU 107 (OE2)
4 ARG 147 (NE) 3.46 GLU 107 (OE1)
5 GLY 23 (O) 3.80 GLY 4 (N)
6 ALA 144 (O) 3.31 SER 89 (OG)
7 TYR 143 (O) 3.79 SER 89 (N)
8 MET 355 (SD) 2.36 LYS 96 (NZ)
SALT BRIGES
## ACTIN Distance(Å) TgADF
1 ARG 147 (NE) 3.46 GLU 107 (OE1)
In our TgADF-actin docked model, residues M1, A2, and S3 from N-terminal were in close proximity to the
residues D24, D25, L349, and I345 from subdomain 1 of G-actin. The residues V81, K82, M85, A88, D92, and K97 from
helix α3 of TgADF were in close proximity to residues P332, P333, E334, N296, K326, and E167 from subdomain 3 of
G-actin. The residues V104 (β6), H109, and E110 of TgADF were in close proximity to the residues S145 and Y143
from helix connecting subdomain 1 and 3 of actin, respectively. The Comparison of TgADF-actin docked model and Twc
in complex with the G-actin monomer shows that the residues Y143, A144, R147, T148, and T149 from the helix
connecting subdomain 1 and subdomain 3; T351, I345, and E334 of subdomain 1; and E167 from subdomain 3, are
common in interaction of TgADF and Twc with G-actin. The buried interface area for the Twc in complex with the G-
actin monomer is ~1200 Å2 (15.2%) and for the TgADF-actin docked model it is ~1000 Å
2 (16%). The percentage of
interacting residues at the interface of the Twc-actin is 21.4% while that for the TgADF-actin interface, it is 23.7%. The
long conserved and kinked helix α3 is the region through which both Twc and Tgadf are primarily interacting with the G-
actin monomer at the cleft between subdomain 1 and 3. However, the orientation of the helix α3 with respect to the cleft is
different for the Twc and TgADF. In the TgADF-actin docked model complete helical length of helix α3 fits at the cavity
formed by subdomain 1 and 3 of actin, while in case of crystal structure of Twc in complex with the G-actin only half of
the complete helical length of helix α3 fits in the cavity and rest half of the helix does not participate in interaction with

JOURNAL OF STRUCTURAL BIOLOGY, 176(1), 97-111
G-actin. This apparent difference in the orientation of the helix α3 of TgADF and Twc at the cavity of subdomain 1 and 3
of actin is clearly noticeable in the Fig. 9.
FIGURE 9. (A)TgADF-rabbit muscle G-actin monomer docked model. The interacting residues are color in yellow. (B) Crystal structure of Twinfilin‟s
C-terminal ADF-domain in complex with rabbit muscle G-actin monomer. The interacting residues have been colored in yellow. This figure shows that
the interacting orientation of the TgADF and Twc at the cleft between the subdomain 1 and subdomain 3 are different.
Discussion
The gliding motility of Apicomplexa parasite Toxoplasma gondii is essential for it to invade host cells and to survive
intracellularly. Productive gliding motility requires rapid turnover of actin filaments, which is carefully regulated by small
subset of actin binding proteins formins, profilins, capping protein, ADF, cyclase-associated protein, and coronin (56). T.
gondii actin is relatively unstable and under conditions suitable for formation of F-actin, it only forms small oligomers
that sediment at 350,000 x g. Interestingly, 98% of the actin is unpolymerized in T. gondii, even though it lacks a
dedicated G-actin sequestering protein, such as -thymosin. Additionally, TgProfilin, although essential for gliding
motility, shows only weak sequestering activity towards heterologous actin. Since TgADF possesses high net F-actin
disassembling activity in conjunction with low severing activity, it has been proposed to be a prime candidate for
controlling the filament turnover. The biochemical properties of TgADF have been studied in detail and in terms of its
biological activity, TgADF belongs to a specific functional subtype, shared with C. elegans ADF/cofilin homologue
Unc60a, and embryonic chick skeletal muscle ADF. This functional subtype is characterized as having the following
activities: an inhibitory effect on actin polymerization; strong sequestration of monomeric actin (G-actin); inhibition of
actin nucleation; inhibition of nucleotide exchange by G-actin; weak F-actin severing activity; lack of stable F-actin

JOURNAL OF STRUCTURAL BIOLOGY, 176(1), 97-111
binding; and highly efficient net disassembly of F-actin. Moreover, the TgADF activity is independent of pH. The high
monomer sequestering activity and low severing activity has been associated with the scenario where the actin filaments
must be rapidly assembled and disassembled.
From a primary sequence viewpoint, TgADF belongs to a specific subgroup of ADF/cofilin family having the
smallest number of residues within the ADF/cofilin family. In terms of its length, it exactly matches the known ADF
sequences from Eimeria tenella and Neospora caninum. In Plasmodium, there are two genes expressing ADF proteins of
lengths 122 and 143 residues, respectively. TgADF has very high sequence homology to the shorter Plasmodium ADFs.
With respect to TgADF, the shorter Plasmodium ADFs have a one residue insert after the C-terminus residue G42 of
strand β3, and a three residues insert after the residue D57 in the loop connecting α2 to β4. The position of these residues
is such that it does not affect interaction with actin. Therefore, the biochemical properties and structural properties of
shorter ADFs of Plasmodium are expected to be very similar to that of TgADF. Based on the sequence alone, TgADF is
expected to have almost completely conserved G-actin binding residues but it lacks F-actin binding residues. Specifically,
TgADF lacks a few residues in the segment that forms the F-loop, such that the F-loop was expected to be shortened. In
addition, the C-terminal residues that form a part of helix 4 and following charged residues, that are essential for
interaction with F-actin, were absent.
Indeed, the solution structure of TgADF is characterized by conserved ADF/cofilin fold with the N-terminal
flexible region, conserved long kinked helix, shortened F-loop that did not project beyond the overall ellipsoid structure,
and a truncated C-terminal having a short helical segment in place of the helix 4. The G-actin binding site of the TgADF
is well formed and is defined by the long kinked helix α3, the N-terminal flexible region, the strand β6, and loop before
the C-terminal helical turn (57). The 15
N-rexation relaxation dynamics of residues in this region also have desired
flexibility to facilitate the interaction of TgADF with G-actin monomer. The docking of TgADF with rabbit muscle G-
actin monomer suggests that the complete helical length of helix α3 of TgADF interacts with G-actin. The helix α3 in the
TgADF has positively charged residues K82 at its N-terminus, while it has two contiguous charged residues, K96 and
K97, at its C-terminus. The latter feature is also observed in human ADF and actophorin. Infact, residue K125 of human
ADF, which corresponds to K96 of TgADF, has been shown to interact with actin. The residues V81, K82, M85, A88,
D92, A93, K96, and K97 from helix α3 of TgADF were found to interact with the G-actin. The residues at both the ends
of the helix α3 (K82 and L98) show conformational exchange which underscores the importance of conformational
flexibility of helix 3 in optimising its interaction with G-actin. In addition to the helix 3, other interacting residues are
from the N-terminal region, strand 6, and the segment preceding C-terminal helical turn. Interestingly, many of these
residues, eg. N78, G100, A103, V104 (β6), E107 (β6), are similarly involved in conformational exchange on milli-to-
microsecond time scale. Moreover, the two residues S89 and D92 at the center of helix α3 are flexible as indicated by
effective correlation term τe. Thus, overall it seems that TgADF is structurally and dynamically suited to have highly
optimized interactions with G-actin.
The dynamically optimized interaction of TgADF with G-actin is reflected in the high equilibrium dissociation
constant of 0.02 M measured with the ITC experiments. ITC experiments were done with rabbit muscle ADP-G-actin.
This is the strongest affinity observed so far for the ADF/cofilin family of proteins for ADP-G-actin, and this may very
well reflect the maximum possible interaction between any ADF/cofilin protein and G-actin, as most ADF/cofilin proteins
bind to ADP-G-actin with affinities of 0.5-1 M. For comparison, the equilibrium dissociation constant for the interaction
of ADF/cofilin protein from Leishmania donovani with ADP-G-actin, also obtained from ITC experiments (53), has been
reported to be ~0.2 M. The structural features of TgADF have to be examined in view of this high affinity for ADP-G-
actin. Usually there is a 10 to 20-fold decrease in the affinity for Mg-ATP-G-actin in comparison to ADP-G-actin.
Previously, the apparent affinity of 0.64 M has been reported between TgADF and Mg-ATP-G-actin, which was
determined on the basis of the effect of TgADF on the rate of nucleotide exchange by G-actin. The affinity of TgADF for
Mg-ATP-G-actin is in the same range as other members of its functional subtype. For example, Unc60A and chick ADF
have affinities for Mg-ATP-G-actin of ~1.6 M and 1 M, respectively. The large difference between the affinities of
TgADF for ADP-G-actin versus ATP-G-actin may provide thermodynamically the driving force needed for highly
efficient disassembly of F-actin.
In conventional ADF/cofilins, the F-site is comprised of the „F-loop‟, C-terminal helix (helix α4), and the C-
terminal tail. The F-loop typically projects out of the structure and is predicted to intercalate within the actin filament. The
F-loop includes a pair of basic residues at the beginning of the 5 strand. The C-terminal 4 helix, and/or the C-terminal

JOURNAL OF STRUCTURAL BIOLOGY, 176(1), 97-111
tail, also contain some charged residues. These F-loop basic residues and C-terminal charged residues together can
increase the stability of interaction of ADF/cofilin for F-actin, leading to increased severing activity. It has been observed
for many systems that the net filament disassembly activity is inversely related to stability of interaction with F-actin.
Pope et. al., (12) have demonstrated that mutating the first (R96 in S. pombe cofilin) of the two basic residues in the F-
loop region that are critical for F-actin binding, results in human cofilin losing its ability to bind F-actin, and instead
causes it to effect the extensive depolymerization of filaments. However, introduction of corresponding point mutations in
TgADF (G66R and G66K) had little effect on its co-sedimentation or disassembly of actin filaments, indicating that this
site alone is not sufficient to confer F-actin binding to TgADF. On the other hand, extension of C-terminal of TgADF with
a seven residue charged segment, corresponding to the last seven residues of S. pombe cofilin, resulted in a 2-fold increase
in the amount of TgADF co-sedimenting with F-actin and decreased disassembly of F-actin.
In the TgADF solution structure, the F-loop comprises the β - β turn connecting strand β4 and strand β5 and contains
a total of 15 residues (β4: 5 residues; β5: 6 residues; interconnecting loop: 4 residues). Unlike all the other ADF/cofilin
proteins, this segment does not project out of the structure because of its short length. In the solution structure of TgADF,
the C-terminal helix 4 is not properly formed and in its place there is a three residue helical turn. Yet, in terms of
dynamics, both the F-loop, and the C-terminal regions are fairly rigid, except for residues N67 and K68 that are at the tip
of F-loop. This allows for an interesting comparison with the solution structure of LdCof. In LdCof, the F-loop contains a
total of 23 residues (β4: 10 residues; β5: 11 residues; interconnecting loop: 2 residues), i.e. 8 residues more than TgADF,
and the F-loop duly projects out of the structure. The turn residues connecting 4 and 5 are K77 and R78, i.e. basic
residues. The C-terminal of LdCof has a properly formed helix 4 and also several basic residues are present in the C-
terminal tail. Therefore, although LdCof conforms to all of the above described features for stable interaction with F-actin,
yet it has been experimentally demonstrated that it does not co-sediment with rabbit muscle F-actin, and it has weak F-
actin severing activity. It is interesting to note that for LdCof, both the C-terminal and F-loop have been found to be fairly
dynamic from NMR relaxation experiments. Therefore, the conclusion that can be drawn here is that while the structural
features like an outwardly projecting F-loop and well formed C-terminal helix 4, in conjunction with biochemical
features like presence of basic residues on the F-loop and at the C-terminal of the protein, are essential for stable
interaction of ADF/cofilins with F-actin, yet another necessary, but hitherto unrecognized, feature seems to be the
conformational rigidity of these segments. Alternately, we believe that the residual weak severing activity in case of
TgADF is a consequence of the rigidity of F-loop and C-terminal segments in spite of structural and biochemical
differences with respect to conventional ADF/cofilin proteins.
The N terminus of ADF/cofilin proteins is highly conserved and in particular the serine 3 residue is an important
contact site for interactions with actin. The activity of some AC proteins is negatively regulated by phosphorylation at this
site (58-61). In the case of TgADF, the S3E mutation, which potentially mimics the phosphorylation at this site, made the
resulting mutant completely inactive. The N-terminal of TgADF is clearly very mobile and structurally poorly defined.
However, we could clearly notice a chemical shift perturbation effect for residues I31 (2) and L94 (3) upon cleavage of
N-terminal purification tag. Therefore, it is imperative that the N-terminal is nestled along the border of helix 3 and
strands 2. Incidentally, in TgADF structure S3 is proximal to T34. The residues N33 and T34 located between the loop
connecting the strand β2 and β3 could not be assigned due to line broadening. Moreover, contiguous residues K35 and I36
display fluctuations on picoseconds-to-nanosecond time scale. Overall, this gives a picture of highly dynamic N-terminal
with residues around S3, especially N33 and T34 from the loop joining 2 and 3, displaying conformational flexibility,
perhaps, to accommodate the steric requirements of phosphorylation.
The residues L18, R21 and K22 display conformational exchange on millisecond-to-microsecond time scale. These
residues are near to the residues I20, T23, and V24 located between the helix α1 and strand β2 which could not be
assigned due to line broadening. The involvement of the unstructured segment L18-K25 in conformational exchange
suggests that this segment could have some undiscovered role in interaction with other proteins. The segment R21-K25 of
TgADF overlaps with vertebrate ADF/cofilins, viz. destrin, human cofilin-1 and chicken cofilin-2 (12, 24, 62), where this
region corresponds to an insert that contains a putative nuclear localization signal (NLS) which is believed to be
responsible for the nuclear translocation of ADF/cofilin proteins upon cellular stresses. It has been proposed that this
region may be undergoing an exchange between a helical and extended conformation, and may, therefore, function as a
molecular switch to dictate the cellular localization of vertebrate ADF/cofilin proteins. The putative NLS sequence in
vertebrates is also believed to be responsible for the formation of nuclear cofilin:actin rods.

JOURNAL OF STRUCTURAL BIOLOGY, 176(1), 97-111
TgADF does not show any detectable interaction with dioctanoyl PI(4,5)P2 in ITC and NMR experiments. Moreover,
the presence of dioctanoyl PI(4,5)P2 does not interfere with binding of TgADF with rabbit muscle ADP-G-actin. It has
been suggested that PIP2 inhibits the ADF/cofilin-actin interaction by steric occlusion of actin binding site on ADF/cofilin
(63-65). Gorbatyuk et al, 2006 has shown that dioctanoyl-PI(4,5)P2 interacts specifically to the putative F-actin and G-
actin binding site on the ADF/cofilin (24), but a recent study suggest that this interaction is unspecific and multivalent in
nature (66). The negatively charged phosphate head of dioctanoyl-PI(4,5)P2 interacts with the positively charged surface
of the ADF/cofilin (66). It has been observed that in mouse cofilin 1, human cofilin 1, chicken cofilin 1, and human
destrin the positively charged surface is created by the cluster of highly conserved residues K95, K96, W104, K112,
K114, K125, K126, K127, K132, and H133. Thus the interaction of dioctanoyl-PI(4,5)P2 with ADF/cofilin needs a
cluster of large solvent exposed positively charged amino acid residues on the surface of the ADF/cofilin proteins. The
sequence alignment of TgADF with above mentioned cofilin sequences suggests that the positively charged surface in
TgADF is contributed by a cluster of small subset of positively charged residues K82, R84, K96, and K97 all from helix
α3, and therefore lacks the large patch required for interacting with the negatively charged head of dioctanoyl-PI(4,5)P2.
Overall, we conclude that conformational flexibility of G-actin binding sites enhances the affinity of ADF/cofilin for
G-actin, while conformational rigidity of F-actin binding sites of ADF/cofilin is necessary for stable binding to F-actin.
Acknowledgment
This work was supported by grants from CSIR Network NWP0038. P.P.P., and V.K.S are recipient of research
fellowships from the Council of Scientific and Industrial Research (CSIR), New Delhi, India. R.Y. and S.S. is recipient of
research fellowships from DBT, India and ICMR, India, respectively. We thank Prof. C.L. Khetrapal, Director, CBMR,
Lucknow, for access to the Bruker 800 MHz spectrometer. We thank Dr. Raja Roy, and Dr. Dinesh kumar for help. We
thank Dr. Chhitar Mal Gupta, distinguished scientist DBT, India, Dr. Amogh Anant Sahasrabuddhe and Mr. Rajendra
Kumar Srivastava for their help in preparing actin and with the project.
References:
Ono S. (2007) Int. Rev. Cytol. 258, 1-82.
Lappalainen, P., Fedorov, E. V., Fedorov, A. A., Almo, S. C., and Drubin, D. G. (1997) EMBO J. 16, 5520–
5530.
Andrianantoandro, E., and Pollard, T. D. (2006) Mol. Cell 24, 13–23.
Yamashiro, S., Mohri, K., and Ono, S. (2005) Biochemistry 44, 14238–14247.
Nishida, E. (1985) Biochemistry 24, 1160–1164.
Hawkins, M., Pope, B., Maciver, S. K., and Weeds, A. G. (1993) Biochemistry 32, 9985–9993.
Hayden, S. M., Miller, P. S., Brauweiler, A., and Bamburg, J. R. (1993) Biochemistry 32, 9994–10004.
Chen, H., Bernstein, B. W., Sneider, J. M., Boyle, J. A., Minamide, L. S., and Bamburg, J. R. (2004)
Biochemistry 43, 7127–7142.
Nachmias, V. T. (1993) Curr. Opin. Cell Biol. 5, 56–62.
Mehta, S., and Sibley, L. D. (2010) J. Biol. Chem. 285, 6835-6847.
Yonezawa, N., Nishida, E., and Sakai, H. (1985). J. Biol. Chem. 260, 14410–14412.
Pope, B. J., Ziegler-Gould, K. M., Kuhne, R., Weeds, A. G., and Ball, L. J. (2004) J. Biol. Chem., 279, 4840-
4848.
Tammana, T.V.S., Sahasrabuddhe, A.A., Mitra, K., Bajpai, V.K., and Gupta, C.M.(2008) Mol. Microbiol. 70,
837–852.
Ono, S. (2003) Biochemistry 42, 13363–13370.
Paavilainen, V.O., Oksanen, E., Goldman, A., Lappalainen, P. (2008) J. Cell. Biol. 182, 51-59.
Moriyama, K., and Yahara, I. (1999) EMBO J. 18, 6752–6761.
Moriyama, K., Yonezawa, N., Sakai, H., Yahara, I., and Nishida, E. (1992) J. Biol. Chem. 267, 7240–7244.
Ono, S., Baillie, D. L., and Benian, G. M. (1999) J. Cell Biol. 145, 491–502.
Yonezawa, N., Nishida, E., Iida, K., Kumagai, H., Yahara, I., and Sakai, H. (1991) J. Biol. Chem. 266, 10485–
10489.
Guan, J. Q., Vorobiev, S., Almo, S. C., and Chance, M. R. (2002) Biochemistry 41, 5765–5775.
Fedorov, A. A., Lappalainen, P., Fedorov, E. V., Drubin, D. G., and Almo, S. C. (1997) Nat. Struct. Biol. 4, 366–
369.
Hatanaka, H., Ogura, K., Moriyama, K., Ichikawa, S., Yahara, I., and Inagaki, F. (1996) Cell 85, 1047–1055.
Leonard, S. A., Gittis, A. G., Petrella, E. C., Pollard, T. D., and Lattman, E. E. (1997) Nat. Struct. Biol. 4, 369–
373.

JOURNAL OF STRUCTURAL BIOLOGY, 176(1), 97-111
Gorbatyuk, V. Y., Nosworthy, N. J., Robson, S. A., Bains, N. P., Maciejewski, M. W., Dos Remedios, C. G., and
King, G. F. (2006) Mol. Cell 24, 511–522.
Ono, S., McGough, A., Pope, B. J., Tolbert, V. T., Bui, A., Pohl, J., Benian, G. M., Gernert, K. M., and Weeds,
A. G. (2001) J. Biol. Chem. 276, 5952–5958.
Andrianantoandro, E., and Pollard, T. D. (2006) Mol. Cell 24, 13–23.
Joynson, D. H., and Wreghitt, T. J. (2001) Toxoplasmosis: A Comprehensive Clinical Guide, Cambridge
University Press, New York
Barragan, A., and Sibley, L. D. (2003) Trends Microbiol. 11, 426–430.
Dobrowolski, J. M., and Sibley, L. D. (1996) Cell 84, 933–939.
Sahoo, N., Beatty, W., Heuser, J., Sept, D., and Sibley, L. D. (2006) Mol. Biol. Cell 17, 895–906.
Schuler, H., Mueller, A. K., and Matuschewski, K. (2005) FEBS Lett. 579, 655–660.
Schmitz, S., Grainger, M., Howell, S., Calder, L. J., Gaeb, M., Pinder, J. C., Holder, A. A., and Veigel, C. (2005)
J. Mol. Biol. 349, 113–125.
Wetzel, D. M., Håkansson, S., Hu, K., Roos, D., and Sibley, L. D. (2003) Mol. Biol. Cell 14, 396–406.
Dobrowolski, J. M., Niesman, I. R., and Sibley, L. D. (1997) Cell Motil.Cytoskeleton 37, 253–262.
Poupel, O., and Tardieux, I. (1999) Microbes Infect. 1, 653–662
Shaw, M. K., and Tilney, L. G. (1999) Proc. Natl. Acad. Sci. U.S.A. 96, 9095–9099.
Schüler H, Mueller AK, Matuschewski K (2005) Mol Biol Cell 16, 4013–4023.
Delaglio, F., Grzesiek, S., Vuister, G. W., Zhu, G., Pfeifer, J. Bax, A. et al. (1995) J. Biomol. NMR, 6, 277-293.
Keller, R. (2005) Optimizing the process of nuclear magnetic resonance spectrum analysis and computer aided
resonance assignment. Diss. ETH No. 15947, Swiss federal Institute of Technology, Zurich.
Guntert, P., Mumenthaler, C., Wuthrich, K., (1997) J. Mol. Biol. 271, 283–298.
Shen, Y., Delaglio, F., Cornilescu, G., Bax, A., (2009) J. Biomol. NMR 44, 213–223.
Brunger, A.T., Adams, P.D., Clore, G.M., Delano, W.L., Gros, P., Grosse-Kunstleve, R.W., Jiang, J.S.,
Kuszewski, J., Nilges, M., Pannu, N.S., Read, R.J., Rice, L.M., Simonson, T., and Warren, G.L., (1998) Acta
Crystallogr.54, 905–921.
Linge, J.P., Williams, M.A., Spronk, A.E.M., Bonvin, A.M., and Nilges, M., (2003) Proteins 50, 496–506.
Jung, J.W., Yee, A., Wu, B., Arrowsmith, C.H., and Lee, W., (2005) J. Biochem. Mol. Biol. 38, 550–554.
Nicholls, A., Sharp, K. A., and Honig, B. (1991) Proteins. Struct. Funct. Genet. 11, 281-285.
Lipari, G., and Szabo, A., (1982a) J. Am. Chem. Soc. 104, 4546–4559.
Clore, G.M., Szabo, A., Bax, A., Kay, L.E., Driscoll, P.C., and Gronenborn, A.M., (1990) J. Am. Chem. Soc.
112, 4989–4991.
Mandel, A.M., Akke, M., and Palmer, A.G., (1995) J.Mol. Biol. 246, 144–163.
Pulavarti, S.V.S.R.K., Jain, A., Pathak, P.P., Mahmood, and A., Arora, A., (2008) J. Mol. Biol. 378, 165–177.
Roger, C., and Loria, J.P., (2003) J. Biomol. NMR 26, 203–213.
Palmer, A.G., Rance, M., and Wright, P.E., (1991) J. Am. Chem. Soc. 113, 4371–4380.
Pardee, J.D., and Spudich, J.A., (1982) Methods Enzymol. 85, 164–181.
Pathak, P.P., Pulavarti, S.V.S.R.K., Jain, A., Sahasrabuddhe, A.A., Gupta, C.M., and Arora, A. (2010) J. Struc.
Biol. 172, 219-224.
Lappalainen, P., Kessels, M.M., Cope, M.J., and Drubin, D.G. (1998) Mol. Biol. Cell 9, 1951–1959.
Holm, L., Kaariainen, S., Rosenstrom, P., and Schenkel, A., (2008) Bioinformatics 24, 2780–2781.
Carlier, M. F., Laurent, V., Santolini, J., Melki, R., Didry, D., Xia, G. X., Hong, Y., Chua, N. H., and Pantaloni,
D. (1997) J. Cell Biol. 136, 1307–1323
Paavilainen, V.O., Oksanen, E., Goldman, A., and Lappalainen, P., (2008) J. Cell. Biol. 182, 51–59.
Allwood, E. G., Anthony, R. G., Smertenko, A. P., Reichelt, S., Drobak, B. K., Doonan, J. H., Weeds, A. G., and
Hussey, P. J. (2002). Plant Cell 14, 2915–2927.
Gungabissoon, R. A., Jiang, C.-J., Drobak, B. K., Maciver, S. K., and Hussey, P. J. (1998) Plant J. 16, 689–696.
Ojala, P. J., Paavilainen, V., and Lappalainen, P. (2001). Biochemistry 40, 15562–15569.
Yonezawa, N., Nishida, E., Iida, K., Yahara, I., and Sakai, H. (1990) J. Biol. Chem. 265, 8382–8386.
Hatanaka, H., Ogura, K., Moriyama, K., Ichikawa, S., Yahara, I., and Inagaki, F. (1996). Cell 85, 1047–1055.
Yonezawa, N., Homma, Y., Yahara, I., Sakai, H., and Nishida, E. (1991) J. Biol. Chem. 266, 17218–17221.
Kusano, K., Abe, H., and Obinata, T. (1999) Mol. Cell. Biochem. 190, 133–141.
Ojala, P.J., Paavilainen, V., and Lappalainen, P. (2001) Biochemistry 40, 15562–15569.
Zhao, H., Hakala, M., Lappalainen, P. (2010) Biophysical Journal 98, 2327–2336.


![Synthesis, anti- Toxoplasma gondii and antimicrobial activities of benzaldehyde 4-phenyl-3-thiosemicarbazones and 2-[(phenylmethylene)hydrazono]-4-oxo-3-phenyl-5-thiazolidineacetic](https://static.fdokumen.com/doc/165x107/63133f6fb22baff5c40f0921/synthesis-anti-toxoplasma-gondii-and-antimicrobial-activities-of-benzaldehyde.jpg)