Model 282L Single Point Insertion Electromagnetic ... - McCrometer
Soluble Amyloid b-Oligomers Affect Dielectric Membrane Properties byBilayer Insertion and Domain Formation: Implications for Cell Toxicity
Gintaras Valincius,* Frank Heinrich,yz Rima Budvytyte,* David J. Vanderah,§ Duncan J. McGillivray,{
Yuri Sokolov,k James E. Hall,k and Mathias Loscheyz
*Department of Bioelectrochemistry and Biospectroscopy, Institute of Biochemistry, Vilnius, Lithuania; yPhysics Department,Carnegie Mellon University, Pittsburgh, Pennsylvania; zCenter for Neutron Research, National Institute of Standards and Technology(NIST), Gaithersburg, Maryland; §Chemical Sciences and Technology Laboratory, NIST, Gaithersburg, Maryland; {Department of Chemistry,The University of Auckland, Auckland, New Zealand; and kDepartment of Physiology and Biophysics, School of Medicine, University ofCalifornia at Irvine, Irvine, California
ABSTRACT It is well established that Alzheimer’s amyloid b-peptides reduce the membrane barrier to ion transport. Theprevailing model ascribes the resulting interference with ion homeostasis to the formation of peptide pores across the bilayer. In thiswork, we examine the interaction of soluble prefibrillar amyloid b (Ab1–42)-oligomers with bilayer models, observing also dramaticincreases in ion current at micromolar peptide concentrations. We demonstrate that the Ab-induced ion conductances across free-standing membranes and across substrate-supported ‘‘tethered’’ bilayers are quantitatively similar and depend on membranecomposition. However, characteristic signatures of the molecular transport mechanism were distinctly different from ion transferthrough water-filled pores, as shown by a quantitative comparison of the membrane response to Ab-oligomers and to the bacterialtoxin a-hemolysin. Neutron reflection from tethered membranes showed that Ab-oligomers insert into the bilayer, affecting bothmembrane leaflets. By measuring the capacitance of peptide-free membranes, as well as their geometrical thicknesses, thedielectric constants in the aliphatic cores of 1,2-dioleoyl-sn-glycero-3-phosphocholine and 1,2-diphytanoyl-sn-glycero-3-phos-phocholine bilayers were determined to be e¼ 2.8 and 2.2, respectively. The magnitude of the Ab-induced increase in e indicatesthat Ab-oligomers affect membranes by inducing lateral heterogeneity in the bilayers, but an increase in the water content of thebilayers was not observed. The activation energy for Ab-induced ion transport across the membrane is at least three times higherthan that measured for membranes reconstituted with a-hemolysin pores, Ea ¼ 36.8 vs. 9.9 kJ/mol, indicating that the molecularmechanisms underlying both transport processes are fundamentally different. The Ab-induced membrane conductance shows anonlinear dependence on the peptide concentration in the membrane. Moreover, Ea depends on peptide concentration. Theseobservations suggest that cooperativity and/or conformational changes of the Ab-oligomer particles upon transfer from theaqueous to the hydrocarbon environment play a prominent role in the interaction of the peptide with the membrane. A model inwhich Ab-oligomers insert into the hydrophobic core of the membrane—where they lead to a local increase in e and a concomitantreduction of the membrane barrier—describes the experimental data quantitatively.
INTRODUCTION
The correlation between neurodegenerative disease and am-
yloid aggregation in brain tissue has long been established
(1): fibrillar plaques associated with dead or damaged neu-
rons are a characteristic observation in postmortem brains of
patients suffering from Alzheimer’s disease (AD) and Par-
kinson’s disease. Consequently, the amyloid hypothesis links
protein aggregation into fibrillar structures with a cascade of
events that leads ultimately to neurodegeneration (2). How-
ever, the question of whether the deposits are caused by, or,
rather, lead to, neurodegeneration has been vigorously de-
bated for a century and remains unanswered (3), at least
partially due to the lack of a viable molecular-scale approach
to its investigation.
One reason for the persistence of this debate lies in the
variety of guises in which amyloid peptides and their ag-
gregation products occur in vivo. First, there is a variability in
the cleavage sites in the proteolytic processing of the amyloid
precursor protein (APP) by various secretases (4), yielding
product peptides of different lengths, i.e., Ab1–40 and Ab1–42.
Second, their sequential oligomerization into larger aggre-
gates leads to different physical forms—monomers, oligo-
mers, protofibrils, fibrils, and fibrillar tangles—that may be in
dynamic equilibrium and may each contribute differently to
pathogenicity. Much recent work has been dedicated to
structural characterization of amyloid aggregation products
and attempts to unravel their reactive pathways (5–9). In-
deed, evidence has recently accrued that Ab toxicity resides
primarily with a soluble oligomeric form of the peptide rather
than Ab-monomers or mature fibrils (10–17). In view of the
lack of understanding of the molecular origin of Ab toxicity,
it is therefore timely to concentrate on molecular biophysical
studies of the properties of Ab-oligomer particles (18).
Because Ab peptides implicated in AD and the aggre-
gation products of other misfolded peptides implicated
in related peptide misfolding pathologies (19)—such as
a-synuclein (Parkinson’s disease), polyglutamine (Hunting-
ton’s disease), islet amyloid polypeptide (type 2 diabetes
doi: 10.1529/biophysj.108.130997
Submitted April 1, 2008, and accepted for publication May 9, 2008.
Address reprint requests to Mathias Losche, Physics Department, Carnegie
Mellon University, 5000 Forbes Ave., Pittsburgh, PA 15213-3890. Tel.:
412-268-2735; Fax: 412-268-8252; E-mail: [email protected].
Editor: Thomas J. McIntosh.
� 2008 by the Biophysical Society
0006-3495/08/11/4845/17 $2.00
Biophysical Journal Volume 95 November 2008 4845–4861 4845
mellitus)—affect very different tissues in patients and be-
cause misfolded peptide oligomers appear to translocate
membranes easily, it is intriguing to speculate that oligomer
interaction with bilayer membranes plays a major part in
determining the physiological roles of these peptide oligo-
mers on the molecular scale (4). In fact, soluble Ab1–42-
oligomers destabilize the membrane of giant unilamellar
vesicles (20). It is not surprising that the poration of mem-
branes by amyloid aggregates has been a major recurring
theme in explaining amyloid toxicity ever since a first report
of membrane channels induced by amyloid peptide was
published (21). After all, membrane pores formed by amyloid
oligomers or even specific channel structures similar to those
formed by bacterial exotoxins, would greatly disturb Ca21
homeostasis, thereby providing a plausible mechanism for
oligomer toxicity (22). The amyloid channel hypothesis has
also been fueled by the observation of annular peptide ag-
gregates, for example, in atomic force microscopy (AFM)
studies of substrate-supported membranes (23,24), which
suggest the formation of pores. However, the preparation
protocol invokes self-assembly from premixed lipid/peptide
dispersions, possibly limiting their physiological signifi-
cance, particularly because the incubation of preformed bi-
layers with amyloid solution yields peptide structures that are
morphologically distinct (25).
Evidence for ion channels from membrane conductivity
measurements is also not yet conclusive. On the one hand,
there are reports of conductance patters in bilayers (23,26)
and clamped cell membranes (27) that resemble the single-
channel behavior observed in exotoxin studies (28) in free-
standing bilayers (black lipid membranes (BLMs); Fig. 1 A).
On the other hand, it has been demonstrated in both BLMs
and cultured rat basophilic leukemia cells that soluble Ab1–42-
oligomers increase the conductance of membranes in a way
inconsistent with the formation of ion channels (15,17).
These studies show that the oligomers affect the lipid mem-
branes by lowering the dielectric barrier of the bilayer. Most
intriguing, in the BLM studies that investigated composi-
tionally well-defined lipid bilayers, it was found that mem-
branes composed of lipids with high compressibility, such as
phospholipids with unsaturated chains, are more amenable to
peptide oligomer effects than those composed of low-
compressible lipids, such as phospholipids with phytanoyl
chains or sphingomyelins (17).
Beyond interference with ion homeostasis by conductance
increases, subtle alterations of membrane properties may
play more complex roles in AD etiology. Seelig and co-
workers recognized early on the interdependence of mem-
brane exposure of Ab and peptide conformation (see Terzi
et al. (29) and work cited therein). McLaurin and co-workers
continue to investigate the role of membranes in peptide fi-
brillogenesis (30), and others are pursuing this line of re-
search as well, with progressively deeper insight into
molecular details (31,32). Even more intriguing are aspects
of membrane microstructure and their implications for dis-
ease. The role of lipid material properties in the formation of
microheterogeneity (the ‘‘raft hypothesis’’) was recently re-
viewed, with a discussion of their role in the recruitment of
peptides (33). In the context of AD, the role of ‘‘lipid rafts’’
in cell signaling may be of secondary relevance, but there
have been reports implicating rafts in the amyloidogenic
processing of amyloid precursor protein by both b-secretase
and g-secretase (34–36). In the light of those findings, the
interaction of Ab with rafts becomes very relevant. Indeed, if
Ab-peptide affects the formation or balance of microheter-
ogeneities in membranes, this might provide a fatal amplifi-
cation mechanism for pathogenesis.
Here, we investigate supported membranes (37–39) for
their structural and electrochemical response to soluble Ab-
oligomers to study the molecular-scale events that govern
Ab-oligomer interaction with bilayers. We have optimized a
supported bilayer system, the sparsely tethered bilayer lipid
membrane (stBLM, see schematic representation in Fig. 1 B),
in which a lipopolymer tether anchors a bilayer structure to
the gold-coated surface of a Si wafer (40). Neutron reflec-
tometry (NR) has been used to determine the molecular-scale
structure of these systems. In the preparation of stBLMs, the
tether molecules are laterally diluted by a hydrophilically
terminated thiol, b-mercaptoethanol (bME), resulting in a
molecularly thin (d � 15 A), stable hydration layer between
the membrane and the gold layer (40,41). For biophysical
work, stBLMs offer the advantage of a well defined model
system that is amenable to a multitude of well established,
molecular-scale characterization techniques. For example,
stBLMs were structurally characterized in detail using NR
(40). Of equal importance, the synergy between NR and
electrochemical impedance spectroscopy (EIS) has been
demonstrated (41). The combined metrologies couple struc-
tural characterization (NR) with the assessment of protein
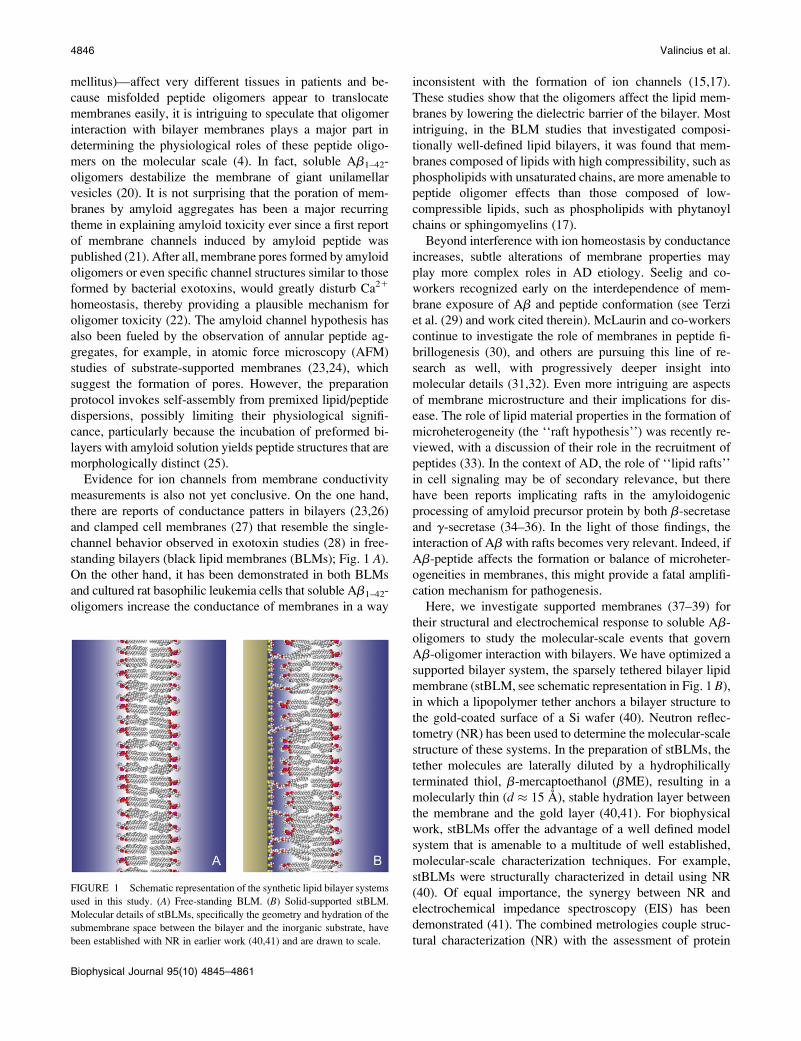
FIGURE 1 Schematic representation of the synthetic lipid bilayer systems
used in this study. (A) Free-standing BLM. (B) Solid-supported stBLM.
Molecular details of stBLMs, specifically the geometry and hydration of the
submembrane space between the bilayer and the inorganic substrate, have
been established with NR in earlier work (40,41) and are drawn to scale.
4846 Valincius et al.
Biophysical Journal 95(10) 4845–4861
function in the membrane (EIS). For example, a recent in-
vestigation of the formation of nanoscale pores in stBLMs by
the exotoxin a-hemolysin (aHL) from Staphylococcus au-reus (42) using these techniques (43) enables us to make a
quantitative comparison of the impact of Ab-oligomers with
that of aHL in this study. Taken together, these results on
stBLMs also afford a comparison with the effects of Ab-
oligomers on free-standing BLMs and cell membranes. In the
context of Alzheimer’s etiology, this is important, because
monitoring membrane conductivity provides access to mo-
lecular details of the interaction between Ab1–42-oligomers
and the bilayer, whose dielectric properties are essential for
the homeostasis of ions, as well as the passive and active ion
transport that governs signal conduction along the axon. It is
conceivable that an increase of membrane permeability by
Ab-oligomers triggers a complex network of biochemical
cascades, thus leading to a spectrum of pathological symp-
toms. A better understanding of molecular-level effects of
Ab-oligomers on membranes is therefore critically needed
for the development of early-detection mechanisms for AD,
as well as for therapeutic approaches.
MATERIALS AND METHODS
Materials and sample preparation
20-tetradecyloxy-3,6,9,12,15,18,22-heptaoxahexatricontane-1-thiol (WC14)
was synthesized and characterized as described (supporting information for
McGillivray et al. (40)). bME, from Sigma-Aldrich (St. Louis, MO), was
distilled before use. 1,2-diphytanoyl-sn-gly-cero-3-phosphatidylcholine,
1,2-dioleoyl-sn-glycero-3-phosphatidylcholine, 1,2-dimyristoyl-sn-glycero-
3-phosphatidylcholine, and 1,2-perdeuterodimyristoyl-sn-glycero-3-phos-
phatidylcholine (DPhyPC, DOPC, DMPC, and DMPC-d54, respectively)
were from Avanti Polar Lipids (Alabaster, AL). H2O was purified in a
Millipore (Billerica, MA) UHQ reagent-grade water purification system.
D2O (99.9% isotope purity) was from Cambridge Isotopes Laboratory
(Andover, MA). Salts, buffers, organic solvents, and squalene from Sigma-
Aldrich, J. T. Baker, or Mallinkrodt-Baker were of at least ACS reagent or
analytical reagent grade.
Planar lipid bilayers
Free-standing BLMs were formed at room temperature by the union of two
monolayers, as previously described (15,17). Briefly, lipid monolayers were
formed on aqueous solutions that contained various concentrations of KCl or
NaCl buffered with 10 mM HEPES-Tris to pH 7.4. They were apposed over a
hole (diameter ;150 mm) in a 15-mm-thick Teflon partition that separated
the two aqueous phases. The hole, punched by an electric spark, was precoated
with a 2.5% solution of squalene in n-pentane. Bilayer formation was moni-
tored by measuring capacitance. Silver/silver chloride electrodes were used to
apply voltages and record currents across the bilayer. One chamber potential
was taken as ground and additions were made to the other chamber. Solutions
were stirred with magnetic stirring bars for ;30 s after additions. Voltages
were generated and currents digitized at a resolution of 12 bits by an AD Lab
ADC/DAC board controlled by JCLAMP (SciSoft, New Haven, CT) driving a
PCI-6024E board (National Instruments, Austin, TX). Currents were trans-
duced by an Axopatch 200A amplifier (Axon Instruments, Foster City, CA)
connected to the board. For measurements of the membrane conductance, a
voltage ramp protocol (U ¼ �150 to 1150 mV at 60 mV/s) was applied.
Tethered lipid bilayers
stBLMs were formed on thin gold films (thickness ;10 nm for NR and ;200
nm for EIS), deposited by magnetron sputtering (Auto A306, BOC Edwards,
Crawley, United Kingdom) on n-doped, [100]-cut Si wafers (El-Cat,
Waldwick, NJ, or Silicon, Boise, ID) precoated with an ;2-nm-thick Cr
adhesion layer, as described (44). Typically, the gold films had an RMS
surface roughness of 0.5 nm, as measured by x-ray reflectometry (Bruker
AXS, Madison, WI). Similar values were determined by AFM: ;0.5 nm for
thin gold films and ;0.8 nm for the 200-nm gold films. The thickness uni-
formity across the surface was 63% or better, as determined by ellipsometry.
The formation of stBLMs is a two-step process that involves the co-
adsorption of WC14 with bME, followed by incubation with an ethanolic
phospholipid solution and rapid solvent exchange (38). 1), Mixed self-
assembled monolayers were prepared by exposing magnetron-sputtered Au
films to solutions of WC14:bME (3:7 mol/mol, 0.2 mM total concentration)
in 99.5% ethanol for .12 h. 2), stBLMs were completed by incubation of the
moderately hydrophobic surface with a concentrated (;10 mM) ethanolic
solution of a phospholipid that was rapidly, within ;5 s, replaced by vig-
orous injection of aqueous buffer (0.1 M NaCl, 0.01 M phosphate, pH 7.0–
7.5) into the sample cell. This rapid solvent-exchange procedure leads to the
formation of a complete and electrically insulating bilayer with a residual
conductance of 1–2 mS/cm2 (40).
Amyloid oligomer particles
Ab1–42-oligomers were prepared at the University of California, Irvine, as
described (15,17). Lyophilized peptides were resuspended in 50% acetoni-
trile in water and relyophilized. Soluble oligomers were prepared by dis-
solving 1.0 mg of peptide in 400 mL hexafluoroisopropanol at room
temperature. Of the resulting seedless solution, 100 mL was added to 700 mL
H2O in a siliconized Eppendorf tube. After 10–20 min incubation, samples
were centrifuged for 15 min at 14,000 3 g. The supernatant (pH 2.8–3.5) was
transferred into a new siliconized tube and the hexafluoroisopropanol was
evaporated in a gentle N2 stream. Samples were then stirred at 500 rpm using
a Teflon-coated micro stir bar for 24–48 h at room temperature. Aliquots
were taken at 6- to 12-h intervals for testing in dot blots with the antioligomer
antibody A11 (14). Samples were also characterized using electron micros-
copy and size exclusion chromatography (45). Freshly prepared peptide olig-
omers were shipped overnight to the NIST Center for Neutron Research for
characterization in EIS and NR experiments. As described in detail below, the
concentration dependence of Ab1–42-oligomers on EI spectra can be used to
monitor oligomer activity. In split batches, the activity of oligomer preparations
determined with EIS on stBLMs correlated well with the oligomer activity
measured on free-standing BLMs at the University of California.
Electrochemical impedance spectroscopy
EIS measurements were performed using a Solartron (Farnborough, United
Kingdom) system (1287A potentiostat and 1260 frequency response ana-
lyzer) between 1.0 and 65,000 Hz, with 10 logarithmically distributed
measurements per decade. Data were fitted using ZView (Scribner Associ-
ates, Southern Pines, NC). Gold-coated silicon wafers (20 3 40 mm) served
as the working electrodes in a setup that allowed simultaneous EIS mea-
surements in six distinct electrochemical cells (V (volume) � 250–300 mL)
on each wafer, with their surface areas (Ael � 0.33 cm2) on the gold film
confined by Viton O-rings. Copper contrast was used to measure the geo-
metric electrode surface area (46). EIS data were normalized to Ael and the
roughness factor b was estimated from the gold surface oxidation/oxide
stripping charge (47). A saturated silver-silver chloride (Ag/AgCl/NaCl
(aq,sat)) microelectrode (M-401F, Microelectrodes, Bedford, NH) was used
as reference. The auxiliary electrode was a 0.25-mm-diameter platinum wire
(99.99% purity, Aldrich) coiled around the barrel of the reference electrode.
Ab-Oligomer Effects on Membrane Barrier 4847
Biophysical Journal 95(10) 4845–4861
The distance between the tip of the reference and the working gold electrode
surface was set to 2–3 mm. All measurements were carried out at 0 V bias
versus the reference electrode at 21 6 1�C in aerated solutions.
Neutron reflection and data analysis
NR measurements were performed at the AND/R (48) at the NIST Center for
Neutron Research. The resilience of the stBLMs permitted the NR charac-
terization of the as-prepared membrane at various solvent contrasts, followed
by measurement of the stBLM incubated with Ab-oligomers, all with the
same physical sample. Also, since the incubation with the peptide was per-
formed in situ on the neutron spectrometer, all reflectivity curves were
measured on exactly the same sample footprint. With the substrate and
membrane structures thus established in a first step, structural changes due to
amyloid incubation were studied in detail.
All stBLMs were prepared with a single phosphatidylcholine species:
DOPC, DPhyPC, DMPC, or DMPC-d54. With hydrogenated phospholipid,
the inner and outer bilayer leaflets are identical in neutron scattering length
density (nSLD), and cannot be discriminated. On the other hand, using
DMPC-d54 enabled a discrimination of the stBLM leaflets because the outer
leaflet is composed of 100% deuterated polymethylene, whereas the inner
leaflet is composed of a mixture of hydrogenated polymethylene (of the
WC14) and deuterated polymethylene (of DMPC-d54 intercalating the
tethered WC14 self-assembled monolayer). Further neutron contrast is most
easily achieved by using buffers of various isotopic compositions for the
solution bathing the stBLM. We showed in earlier work that stBLMs are
stable over days (at least) and are also stable against buffer exchange. Ex-
ploiting this stability, each of the as-prepared stBLMs was sequentially
characterized in three different solvent contrasts using buffer based upon
D2O, H2O, or a mixture of both with, e.g., an nSLD, rn � 4 3 10�6 A�2
(‘‘CM4’’). This basic characterization of the neat stBLM was followed by
continuous incubation with Ab1–42-oligomers at the desired peptide con-
centration and further NR measurements with peptide solutions in buffers of
different isotopic constitution. Reversibility of the peptide interaction with
the lipid bilayer was routinely probed in a final NR measurement after ex-
tensive rinsing.
Data analysis was performed in terms of slab models, or ‘‘box’’ models
(49), using ga_refl (50), in which the reflectivity from a model nSLD profile
is computed using an optical matrix formalism based on Parratt’s recursion
algorithm (51). Isostructural samples with distinct isotopic contrast were
simultaneously fitted by consistently refining the corresponding nSLD pro-
files, which were parameterized in terms of the underlying molecular
structures (52), an approach termed ‘‘composition-space refinement’’ (53).
In the implementation used in this work, the model contains the following
sequence of layers to represent the sample system: (semi-infinite) Si wafer,
silicon oxide, chromium, gold, the hydrated hexa(ethylene oxide) (HEO)
spacer, the inner leaflet of the bilayer, the outer leaflet of the bilayer, the outer
headgroup layer, and the bulk solvent. The model allows all organic layers to
comprise solvent (thought to either hydrate organic moieties such as a
phospholipid headgroups or to form solvent-filled defect pockets, as in the
case of the hydrophobic chain layer). Thus, solvent contributes to the average
scattering power of each layer according to the nSLD of the bulk solvent
multiplied by its volume fraction in the layer (which is zero for a defect-free
stBLM). Both lipid leaflets in the stBLM model were constrained to the same
hydrophobic thickness, because in high-quality bilayers such as those in-
vestigated in this work, the two thicknesses are highly correlated. The inner
headgroup layer of the lipid membrane was indistinguishable from the HEO
tether at all solvent contrasts, and was therefore not separately modeled.
The stability of the stBLMs was confirmed by the fact that any of the data
sets at different solvent contrasts can be well described by the same pa-
rameter set in the refined composition-space model (40,41). Moreover, if data
sets representing different neutron contrasts were fitted independently of
each other, this yielded consistent parameter values, albeit with larger un-
certainties. The final analysis of an experiment—reported in the following
section in terms of best-fit parameters and associated uncertainties—was
therefore always performed in a simultaneous fit to all reflectivity curves
taken on a particular bilayer sample. In these results, identical parameter
values describe those regions in the sample invariant to solvent exchange or
peptide oligomer incubation (i.e., the inorganic multilayer substrate). In
contrast, regions that are solvent-accessible and/or affected by the peptide are
described by parameter sets that are mutually consistent in that they derive
from a unique molecular structure that translates into distinct nSLDs by
attaching the appropriate scattering lengths to its atomic composition.
RESULTS
Neutron reflection from tetheredbilayer membranes
Only protonated Ab1–42 was available in these experiments.
Because the contrast of the peptides against the membrane
structure is low, the particles could not be directly located at
the membrane in a structural model. On the other hand, the
membrane structural properties were critically affected by
Ab1–42-oligomer incubation, which led to significant and
reversible changes in the stBLM structural parameters. Here,
we use this information for a quantitative assessment of the
membrane dielectric responses. Initial NR experiments with
fully hydrogenated stBLMs suggested a small, reversible
thinning of the hydrophobic core of the bilayers, which
depended in its extent on the nature of the lipid, peptide
concentration, and the activity of the Ab1–42-oligomer
preparation. Subsequent measurements employing chain-
perdeuterated DMPC-d54 showed these changes in more
detail. We will therefore concentrate here on experiments
with the chain-labeled membrane component.
The stBLM prepared from DMPC-d54 was characterized
with NR in an extended set of measurements. The as-pre-
pared membrane was first characterized at three solvent
contrasts, then subjected to soluble Ab1–42-oligomers at cp¼2 mM in D2O-based buffer and characterized at two more
solvent contrasts; subjected at cp¼ 6 mM and characterized at
three more solvent contrasts; subjected at cp ¼ 12 mM and
characterized at two more solvent contrasts; was and, finally,
rinsed with peptide-free buffer and characterized again at
three solvent contrasts. The entire experiment used around
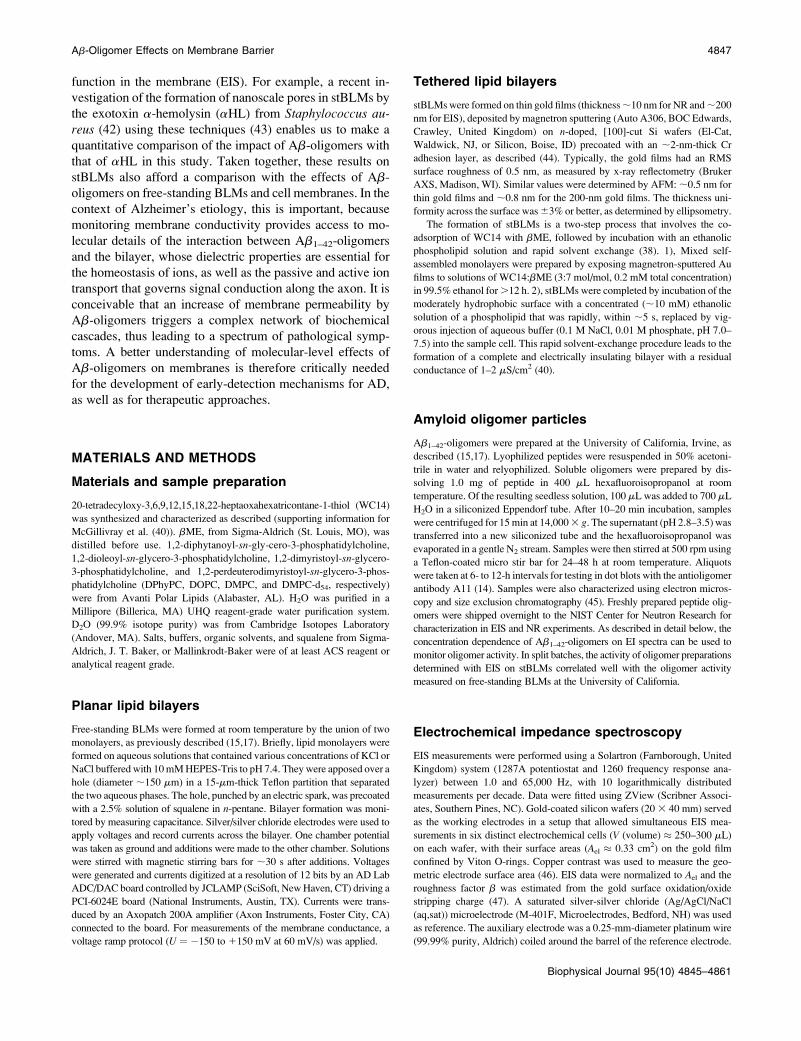
four days of neutron beamtime. In Fig. 2, we present exem-
plary NR data sets measured in H2O-based buffer, as well as
the respective model fits, for the neat stBLM and the same
stBLM incubated with soluble Ab1–42-oligomers at the final
peptide concentration of cp ¼ 12 mM. The normalized re-
siduals (Fig. 2, lower inset) emphasize the reflectivity
changes induced by the peptide oligomers. They also dem-
onstrate the almost complete reversal of those effects upon
rinsing with peptide-free buffer. Because the stBLM was
prepared from (fully hydrogenated) WC14/bME (3:7 in the
adsorption solution) and completed with DMPC-d54, the in-
ner and outer hydrophobic sheaths of the bilayer show dif-
ferent nSLD, which are easily distinguished in nSLD profiles
(Fig. 2, upper inset). A close inspection of these profiles
shows that Ab-oligomer incubation increases the nSLD of
4848 Valincius et al.
Biophysical Journal 95(10) 4845–4861
the hydrophobic slabs, and shifts the peak nSLD closer to the
substrate surface. Table 1 lists the model parameters obtained
from a simultaneous fit to all NR data. A more complete
account that includes the inorganic substrate and confidence-
limit estimates based on a Monte Carlo resampling technique
is provided in Supplementary Material, Data S1.
The bilayer shows no increase of solvent content in the
hydrophobic slabs that would indicate the formation of sol-
vent-filled defects in the bilayer by the peptide. The initial
nSLDs of the inner and outer leaflets were rn ¼ 1.60 6
0.13 3 10�6 A�2 and rn ¼ 5.55 6 0.34 3 10�6 A�2, re-
spectively. The difference derives from the fact that the inner
leaflet incorporates the (hydrogenated) lipid anchor, WC14.
Assuming an alkyl nSLD of rn ¼ �0.4 3 10�6 A�2, typical
for chains in a fluid bilayer, and equal mass densities in the
inner and outer leaflets, we estimate the volume fraction of
DMPC-d54 in the inner lipid leaflet to be 34 6 4% in the as-
prepared stBLM. Incubation with soluble Ab1–42-oligomers
led to significant changes of the nSLD in both lipid leaflets
for all peptide concentrations applied in the experiment. As
for fully hydrogenated DOPC-based stBLMs (see below),
we observe a thinning of the membrane. For the deuterated
bilayer, this thinning amounts to Dd ¼ �1.4 6 0.4 A and
�3.0 6 0.4 A at cp ¼ 6 mM and cp ¼ 12 mM, respectively.
The material density of the headgroup (i.e., its volume frac-
tion within the layer next to the bulk solvent) increased by
8 6 4%, independent of the peptide concentration. Upon
rinsing with buffer, all structural effects induced by Ab1–42-
oligomers on the stBLM were reversible within the confi-
dence limits of the experiment. Trial models that included an
adsorbed peptide layer at the interface between the bilayer
headgroups and the bulk solvent did not indicate any sig-
nificant volume fraction of adsorbed material for any of the
peptide concentrations. The detection limits are estimated to
be ,10% for the volume fraction and ;10 A for the thick-
ness of such a hypothetical peptide layer. This indicates that
the peptide is not peripherally adsorbed on the membrane
surface or inserted into the membrane and extending into
the adjacent buffer. Rather, the model suggests that peptide
oligomers insert fully into the hydrophobic membrane core.
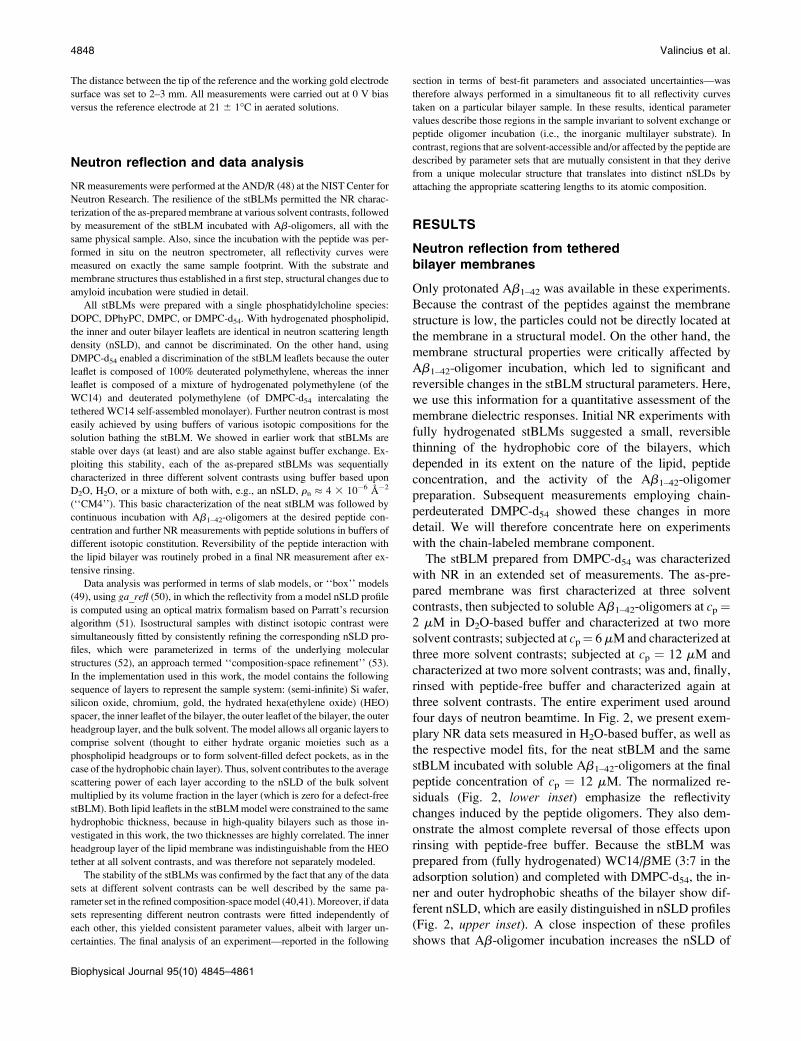
In terms of nSLD changes, fully hydrogenated stBLMs
based upon DOPC and DPhyPC showed smaller responses
than deuterated stBLMs to the incubation with Ab1–42-
oligomers. Complex data sets that were collected in proce-
dures similar to that described above for DMPC-d54-based
stBLMs are partially presented in Figs. 3 and 4. The corre-
sponding model fits are given in Tables 2 and 3. These
models show that nSLD shows little response to peptide in-
cubation. The one notable exception is the nSLDs of the
hydrophobic bilayer interior, which increased slightly due to
peptide insertion. On the other hand, comparison of the nSLD
profiles in different solvent contrasts shows unmistakably
that peptide incubation didn’t affect the water content of the
bilayers: consistent with the DMPC-d54 results, both leaflets
in both the DOPC and DPhyPC bilayers remained solvent-
free within an uncertainty of 3%.
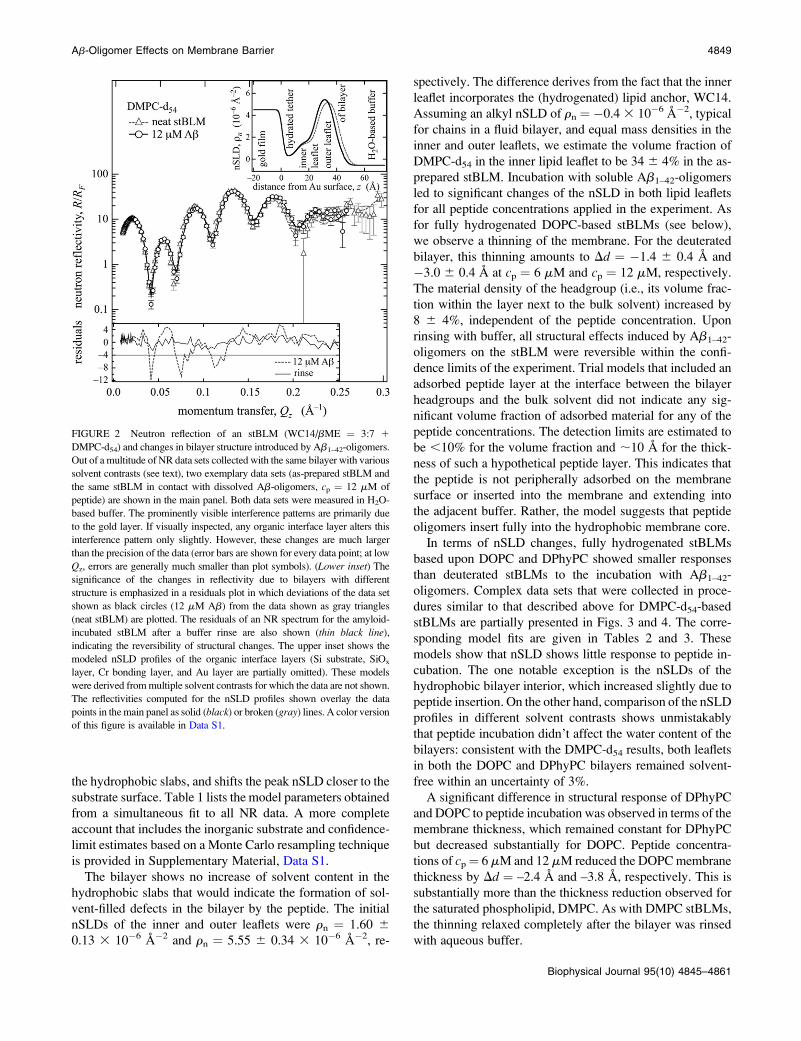
A significant difference in structural response of DPhyPC
and DOPC to peptide incubation was observed in terms of the
membrane thickness, which remained constant for DPhyPC
but decreased substantially for DOPC. Peptide concentra-
tions of cp¼ 6 mM and 12 mM reduced the DOPC membrane
thickness by Dd ¼ –2.4 A and –3.8 A, respectively. This is
substantially more than the thickness reduction observed for
the saturated phospholipid, DMPC. As with DMPC stBLMs,
the thinning relaxed completely after the bilayer was rinsed
with aqueous buffer.
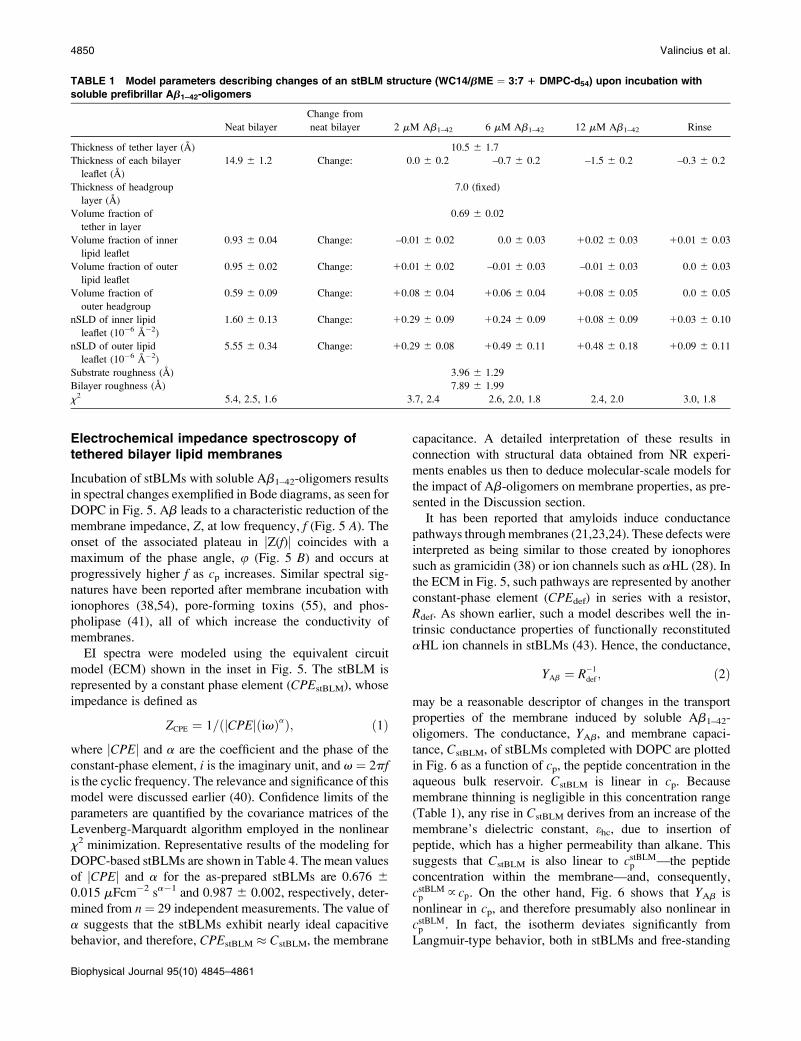
FIGURE 2 Neutron reflection of an stBLM (WC14/bME ¼ 3:7 1
DMPC-d54) and changes in bilayer structure introduced by Ab1–42-oligomers.
Out of a multitude of NR data sets collected with the same bilayer with various
solvent contrasts (see text), two exemplary data sets (as-prepared stBLM and
the same stBLM in contact with dissolved Ab-oligomers, cp ¼ 12 mM of
peptide) are shown in the main panel. Both data sets were measured in H2O-
based buffer. The prominently visible interference patterns are primarily due
to the gold layer. If visually inspected, any organic interface layer alters this
interference pattern only slightly. However, these changes are much larger
than the precision of the data (error bars are shown for every data point; at low
Qz, errors are generally much smaller than plot symbols). (Lower inset) The
significance of the changes in reflectivity due to bilayers with different
structure is emphasized in a residuals plot in which deviations of the data set
shown as black circles (12 mM Ab) from the data shown as gray triangles
(neat stBLM) are plotted. The residuals of an NR spectrum for the amyloid-
incubated stBLM after a buffer rinse are also shown (thin black line),
indicating the reversibility of structural changes. The upper inset shows the
modeled nSLD profiles of the organic interface layers (Si substrate, SiOx
layer, Cr bonding layer, and Au layer are partially omitted). These models
were derived from multiple solvent contrasts for which the data are not shown.
The reflectivities computed for the nSLD profiles shown overlay the data
points in the main panel as solid (black) or broken (gray) lines. A color version
of this figure is available in Data S1.
Ab-Oligomer Effects on Membrane Barrier 4849
Biophysical Journal 95(10) 4845–4861
Electrochemical impedance spectroscopy oftethered bilayer lipid membranes
Incubation of stBLMs with soluble Ab1–42-oligomers results
in spectral changes exemplified in Bode diagrams, as seen for
DOPC in Fig. 5. Ab leads to a characteristic reduction of the
membrane impedance, Z, at low frequency, f (Fig. 5 A). The
onset of the associated plateau in jZ(f)j coincides with a
maximum of the phase angle, u (Fig. 5 B) and occurs at
progressively higher f as cp increases. Similar spectral sig-
natures have been reported after membrane incubation with
ionophores (38,54), pore-forming toxins (55), and phos-
pholipase (41), all of which increase the conductivity of
membranes.
EI spectra were modeled using the equivalent circuit
model (ECM) shown in the inset in Fig. 5. The stBLM is
represented by a constant phase element (CPEstBLM), whose
impedance is defined as
ZCPE ¼ 1= jCPEjðivÞað Þ; ð1Þ
where jCPEj and a are the coefficient and the phase of the
constant-phase element, i is the imaginary unit, and v ¼ 2pfis the cyclic frequency. The relevance and significance of this
model were discussed earlier (40). Confidence limits of the
parameters are quantified by the covariance matrices of the
Levenberg-Marquardt algorithm employed in the nonlinear
x2 minimization. Representative results of the modeling for
DOPC-based stBLMs are shown in Table 4. The mean values
of jCPEj and a for the as-prepared stBLMs are 0.676 6
0.015 mFcm�2 sa�1 and 0.987 6 0.002, respectively, deter-
mined from n¼ 29 independent measurements. The value of
a suggests that the stBLMs exhibit nearly ideal capacitive
behavior, and therefore, CPEstBLM � CstBLM, the membrane
capacitance. A detailed interpretation of these results in
connection with structural data obtained from NR experi-
ments enables us then to deduce molecular-scale models for
the impact of Ab-oligomers on membrane properties, as pre-
sented in the Discussion section.
It has been reported that amyloids induce conductance
pathways through membranes (21,23,24). These defects were
interpreted as being similar to those created by ionophores
such as gramicidin (38) or ion channels such as aHL (28). In
the ECM in Fig. 5, such pathways are represented by another
constant-phase element (CPEdef) in series with a resistor,
Rdef. As shown earlier, such a model describes well the in-
trinsic conductance properties of functionally reconstituted
aHL ion channels in stBLMs (43). Hence, the conductance,
YAb ¼ R�1
def ; ð2Þ
may be a reasonable descriptor of changes in the transport
properties of the membrane induced by soluble Ab1–42-
oligomers. The conductance, YAb, and membrane capaci-
tance, CstBLM, of stBLMs completed with DOPC are plotted
in Fig. 6 as a function of cp, the peptide concentration in the
aqueous bulk reservoir. CstBLM is linear in cp. Because
membrane thinning is negligible in this concentration range
(Table 1), any rise in CstBLM derives from an increase of the
membrane’s dielectric constant, ehc, due to insertion of
peptide, which has a higher permeability than alkane. This
suggests that CstBLM is also linear to cstBLMp —the peptide
concentration within the membrane—and, consequently,
cstBLMp } cp. On the other hand, Fig. 6 shows that YAb is
nonlinear in cp, and therefore presumably also nonlinear in
cstBLMp . In fact, the isotherm deviates significantly from
Langmuir-type behavior, both in stBLMs and free-standing
TABLE 1 Model parameters describing changes of an stBLM structure (WC14/bME ¼ 3:7 1 DMPC-d54) upon incubation with
soluble prefibrillar Ab1–42-oligomers
Neat bilayer
Change from
neat bilayer 2 mM Ab1–42 6 mM Ab1–42 12 mM Ab1–42 Rinse
Thickness of tether layer (A) 10.5 6 1.7
Thickness of each bilayer
leaflet (A)
14.9 6 1.2 Change: 0.0 6 0.2 –0.7 6 0.2 –1.5 6 0.2 –0.3 6 0.2
Thickness of headgroup
layer (A)
7.0 (fixed)
Volume fraction of
tether in layer
0.69 6 0.02
Volume fraction of inner
lipid leaflet
0.93 6 0.04 Change: –0.01 6 0.02 0.0 6 0.03 10.02 6 0.03 10.01 6 0.03
Volume fraction of outer
lipid leaflet
0.95 6 0.02 Change: 10.01 6 0.02 –0.01 6 0.03 –0.01 6 0.03 0.0 6 0.03
Volume fraction of
outer headgroup
0.59 6 0.09 Change: 10.08 6 0.04 10.06 6 0.04 10.08 6 0.05 0.0 6 0.05
nSLD of inner lipid
leaflet (10�6 A�2)
1.60 6 0.13 Change: 10.29 6 0.09 10.24 6 0.09 10.08 6 0.09 10.03 6 0.10
nSLD of outer lipid
leaflet (10�6 A�2)
5.55 6 0.34 Change: 10.29 6 0.08 10.49 6 0.11 10.48 6 0.18 10.09 6 0.11
Substrate roughness (A) 3.96 6 1.29
Bilayer roughness (A) 7.89 6 1.99
x2 5.4, 2.5, 1.6 3.7, 2.4 2.6, 2.0, 1.8 2.4, 2.0 3.0, 1.8
4850 Valincius et al.
Biophysical Journal 95(10) 4845–4861
BLMs: Y�1Ab vs. c�m
p is linear for m � 2 (instead of m ¼ 1, as
expected for a Langmuir isotherm), suggesting cooperative
effects and/or conformational changes of the Ab1–42-oligo-
mer particles as they transfer from the aqueous to the
hydrocarbon environment.
Conductance of free-standing bilayerlipid membranes
Fig. 7 shows Ab-oligomer-induced current-voltage (I/U)
curves through free-standing BLMs as a function of tem-
perature. All curves show the typical exponential shape for
activated charge translocation with nearly linear portions
near the origin (jUj # 30 mV (Fig. 7, inset)). This inner part
of the curves was used to estimate the zero-voltage conduc-
tances of the BLMs. Representative data are summarized in
Table 5. The increase of the Ab-induced conductance is su-
perlinear, and a strong temperature dependence—a factor of
;2 per 10�C—indicates a high activation energy of the ion
transfer through the membrane.
The ion current induced by Ab-oligomers across free-
standing BLMs was measured as a function of lipid com-
position. Fig. 8 displays bilayer currents, IAb, vs. cp for
DOPC, DPhyPC, and their equimolar mixture. Their cp de-
pendence is nonlinear, with I�1Ab vs. c�m
p linear for m � 2.3,
which is quantitatively similar to those observed with
stBLMs (Fig. 6). Just as the stBLM response is a function of
membrane composition seen in NR, the peptide-induced
currents show a strong dependence on the phospholipid chain
constitution. As the membrane composition is changed from
DPhyPC to DOPC, the induced currents increase by a factor
of ;20 for a given cp. Similar effects were observed in the EI
spectra of stBLMs, though the differences between saturated
and unsaturated chains were smaller, amounting to a factor of
only 3–4 (data not shown).
Activation energies of ion transferacross membranes
In view of the remarkable temperature dependence of ion
transport through BLMs shown in Fig. 7, EI spectra of
stBLMs affected by soluble Ab1–42-oligomers were also
determined as a function of T. As with BLMs, a temperature
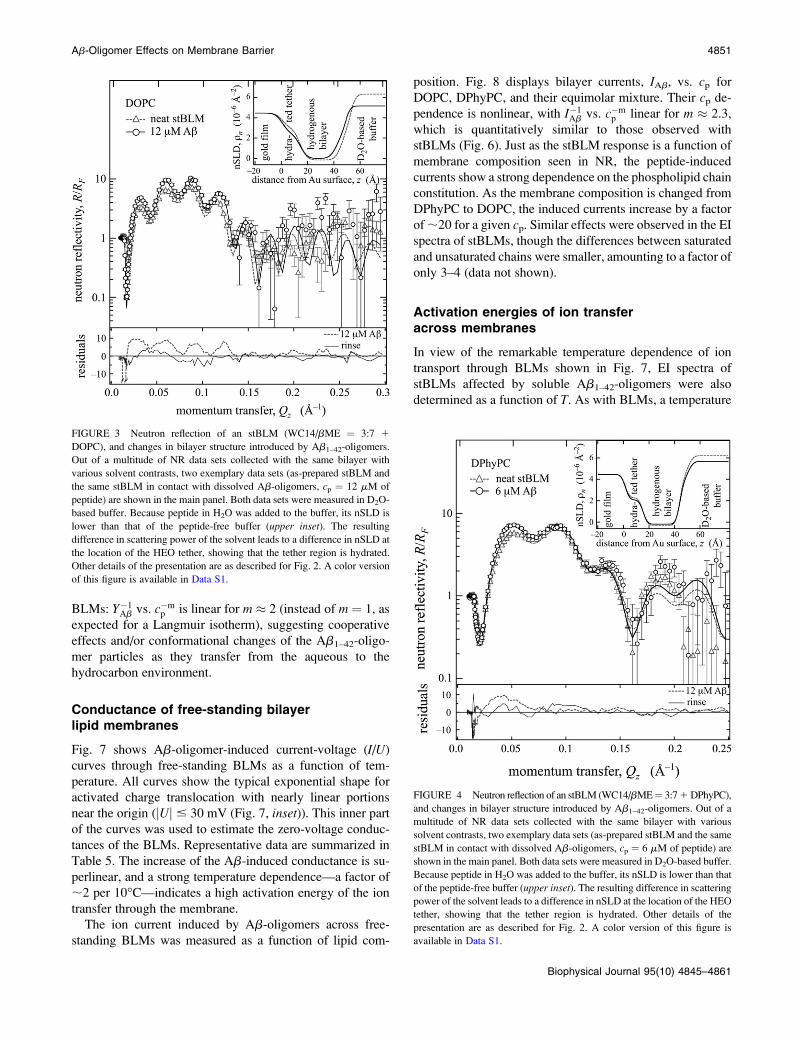
FIGURE 3 Neutron reflection of an stBLM (WC14/bME ¼ 3:7 1
DOPC), and changes in bilayer structure introduced by Ab1–42-oligomers.
Out of a multitude of NR data sets collected with the same bilayer with
various solvent contrasts, two exemplary data sets (as-prepared stBLM and
the same stBLM in contact with dissolved Ab-oligomers, cp ¼ 12 mM of
peptide) are shown in the main panel. Both data sets were measured in D2O-
based buffer. Because peptide in H2O was added to the buffer, its nSLD is
lower than that of the peptide-free buffer (upper inset). The resulting
difference in scattering power of the solvent leads to a difference in nSLD at
the location of the HEO tether, showing that the tether region is hydrated.
Other details of the presentation are as described for Fig. 2. A color version
of this figure is available in Data S1.
FIGURE 4 Neutron reflection of an stBLM (WC14/bME¼ 3:7 1 DPhyPC),
and changes in bilayer structure introduced by Ab1–42-oligomers. Out of a
multitude of NR data sets collected with the same bilayer with various
solvent contrasts, two exemplary data sets (as-prepared stBLM and the same
stBLM in contact with dissolved Ab-oligomers, cp ¼ 6 mM of peptide) are
shown in the main panel. Both data sets were measured in D2O-based buffer.
Because peptide in H2O was added to the buffer, its nSLD is lower than that
of the peptide-free buffer (upper inset). The resulting difference in scattering
power of the solvent leads to a difference in nSLD at the location of the HEO
tether, showing that the tether region is hydrated. Other details of the
presentation are as described for Fig. 2. A color version of this figure is
available in Data S1.
Ab-Oligomer Effects on Membrane Barrier 4851
Biophysical Journal 95(10) 4845–4861
increase leads to pronounced increases of stBLM conduc-
tances (Fig. 9). To be specific, both the plateau in the jZ(f)jplot and the phase minimum move toward higher frequencies
(data not shown). Modeling of the spectra facilitates a de-
termination of Rdef and, consequently, an assessment of the
temperature-dependence of the conductance changes in the
stBLMs.
Temperature effects on stBLM and BLM conductances
were determined at cp ¼ 1.6 mM for stBLMs and at cp ¼1 and 2 mM for BLMs. Results are summarized in Fig. 9 and
quantified in Table 6. In the figure, Arrhenius plots of stBLM
and BLM conductances in the presence of Ab1–42-oligomers
are compared with those for the ion transport in bulk elec-
trolyte and across stBLMs reconstituted with aHL. The
slopes of the Arrhenius plots yield activation energies (Ea) for
ion conductance in the presence of Ab1–42-oligomers of Ea �37 kJ/mol for a DOPC stBLM; Ea � 46 kJ/mol at 1 mM
peptide and Ea� 33 kJ/mol at 2 mM peptide for free-standing
DOPC BLMs (Table 6). These values are much lower than the
activation energies for bare ions to cross neat lipid bilayers, but
much larger than those for ion transport in bulk water. In
comparison, the activation energy for ion transport through
aHL is also significantly lower, Ea� 10 kJ/mol—closer to the
value for ion transport through bulk solvent. Ea for the Ab-
induced membrane conductivity itself depends pronouncedly
on peptide concentration. In connection with the nonlinear
relation, YAb(cp), shown in Fig. 6, this suggests that the am-
yloid properties within the membrane change in a concentra-
tion-dependent manner.
DISCUSSION
The different model systems investigated in this work, and
the measurement techniques employed in their study, are well
connected. The combined application of EIS and NR is
highly synergetic and provides insight into physical models
of the bilayers, and the direct comparison of conductivity
measurements and EIS link ion transfer across free-standing
bilayers and surface-stabilized membranes. As we show be-
low, there is quantitative agreement between these results.
The biophysical effects we report here occur at Ab concen-
trations similar to those at which characteristic increases in
the membrane conductance of patch-clamped cells were re-
ported in other studies (15,17). Moreover, shifts of the gating
properties of voltage-dependent channels (56), as well as cell
lysis in tissue culture (57), occur at similar peptide concen-
trations. We therefore argue that the mechanism by which
Ab-oligomers induce electrical and structural changes in
membranes may have significance for the understanding of
toxic effects exerted on cellular systems. We first discuss
structural implications of the NR results, then, more quanti-
tatively, the electrical effects of Ab-oligomers on membranes;
TABLE 2 Model parameters describing changes of an stBLM structure (WC14/bME ¼ 3:7 1 DOPC) upon incubation with soluble
prefibrillar Ab1–42-oligomers
Neat bilayer Change from neat bilayer 6 mM Ab1–42 12 mM Ab1–42 Rinse
Thickness of tether layer (A) 11.3 6 1.0
Thickness of both bilayer leaflets (A) 31.0 6 0.6 Change: �2.4 6 0.6 �3.8 6 0.6 0.0 6 0.6
Thickness of headgroup layer (A) 7.0 (fixed)
Volume fraction of tether in layer 0.59 6 0.02
Volume fraction of inner lipid leaflet 1.00 6 0.02 Change: �0.01 6 0.02 0.00 6 0.03 �0.01 6 0.02
Volume fraction of outer lipid leaflet 1.00 6 0.02 Change: 0.00 6 0.02 0.00 6 0.03 �0.02 6 0.02
Volume fraction of outer headgroup 0.66 6 0.10 Change: 0.05 6 0.10 10.05 6 0.10 �0.02 6 0.10
nSLD of both lipid leaflets (10�6 A�2) �0.15 6 0.08 Change: 10.15 6 0.06 10.19 6 0.06 10.02 6 0.06
Bilayer roughness (A) 6.5 6 2.2
x2 3.30
TABLE 3 Model parameters describing changes of an stBLM structure (WC14/bME ¼ 3:7 1 DPhyPC) upon incubation with
soluble prefibrillar Ab1–42-oligomers
Neat bilayer Change from neat bilayer 6 mM Ab1–42 Rinse
Thickness of tether layer (A) 14.0 6 1.5
Thickness of both bilayer leaflets (A) 28.6 6 1.4 Change: 10.2 6 0.4 �0.4 6 0.4
Thickness of headgroup layer (A) 7.0 (fixed)
Volume fraction of tether in layer 0.66 6 0.04
Volume fraction of inner lipid leaflet 1.00 6 0.04
Volume fraction of outer lipid leaflet 1.00 6 0.01
Volume fraction of outer headgroup 0.42 6 0.12
nSLD of both lipid leaflets (10�6 A�2) �0.31 6 0.09 Change: 10.12 6 0.05 �0.02 6 0.05
Bilayer roughness (A) 6.4 6 3.1
x2 3.06
4852 Valincius et al.
Biophysical Journal 95(10) 4845–4861
finally, we comment on implications of these results for our
understanding of the mechanism by which Ab affects mem-
branes, specifically in light of the amyloid channel hypothesis.
Both bilayer leaflets respond similarly topeptide incubation
Fig. 10 shows changes in nSLD (Fig. 10 A) and bilayer
thickness (Fig. 10 B) of deuterated stBLMs due to their ex-
posure to soluble Ab-oligomers. Because the thickness pa-
rameters for the inner and outer leaflets were observed to be
highly correlated in the fits, they were constrained to be
identical in the model. On the other hand, the nSLDs of the
two leaflets, well discriminated due to their distinct isotopic
composition, develop differently as a function of cp. How-
ever, this apparent difference vanishes if one compares the
scattering-length area density,
ra
n ¼ rn 3 d; ð3Þ
which is a measure of inserted material per unit area and is
shown in Fig. 10 C as a function of cp. The nearly perfect
coincidence of ran in both leaflets at any peptide concentration
indicates that both monolayers are similarly affected by the
peptide.
From these results, the impact of Ab1–42-oligomers on the
DMPC-d54 bilayer can be summarized as follows: at cp ¼2 mM, no geometrical changes of the membrane are detected.
However, the nSLD of both lipid leaflets rises by 0.29 6
0.09 3 10�6 A�2. This shows conclusively that there is in-
corporation of peptide material into the membrane, accom-
panied by an increase of the lipid packing density. Because
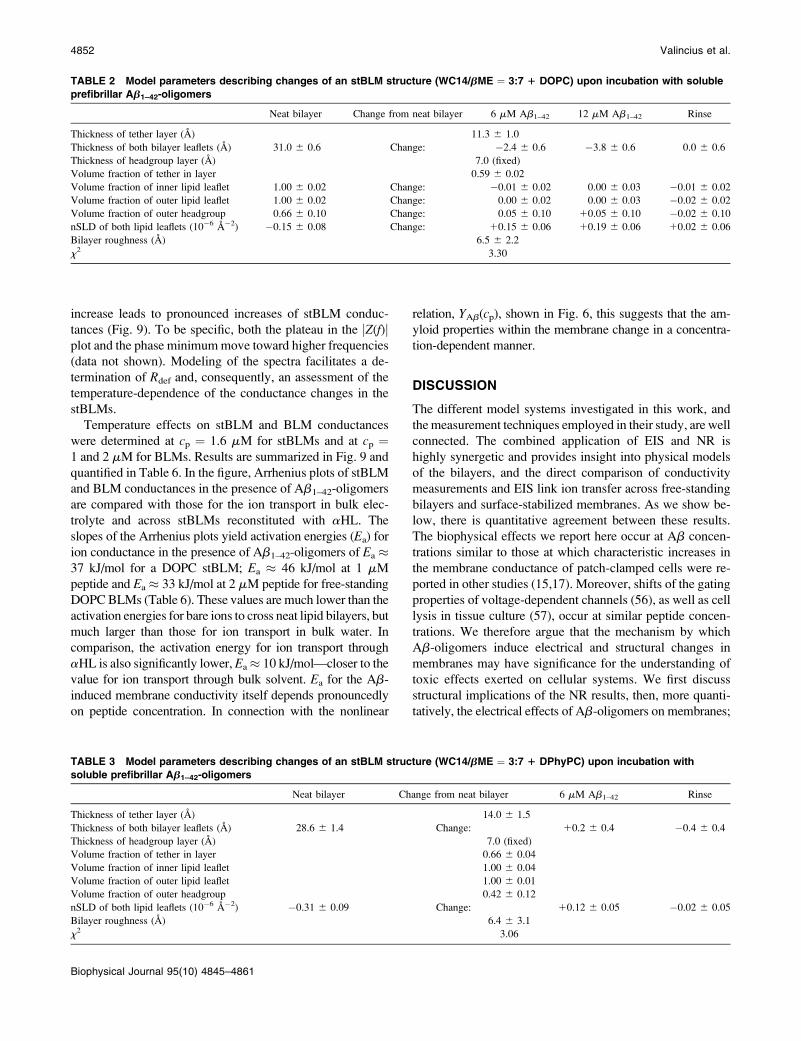
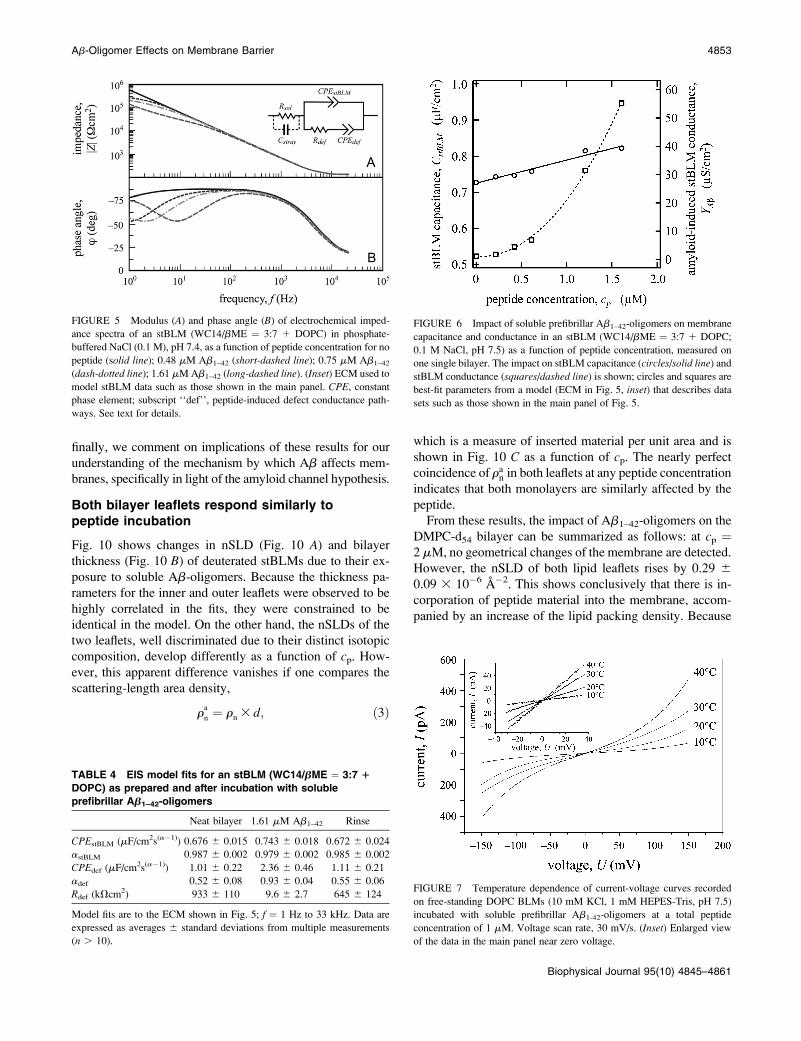
FIGURE 5 Modulus (A) and phase angle (B) of electrochemical imped-
ance spectra of an stBLM (WC14/bME ¼ 3:7 1 DOPC) in phosphate-
buffered NaCl (0.1 M), pH 7.4, as a function of peptide concentration for no
peptide (solid line); 0.48 mM Ab1–42 (short-dashed line); 0.75 mM Ab1–42
(dash-dotted line); 1.61 mM Ab1–42 (long-dashed line). (Inset) ECM used to
model stBLM data such as those shown in the main panel. CPE, constant
phase element; subscript ‘‘def’’, peptide-induced defect conductance path-
ways. See text for details.
TABLE 4 EIS model fits for an stBLM (WC14/bME ¼ 3:7 1
DOPC) as prepared and after incubation with soluble
prefibrillar Ab1–42-oligomers
Neat bilayer 1.61 mM Ab1–42 Rinse
CPEstBLM (mF/cm2s(a�1)) 0.676 6 0.015 0.743 6 0.018 0.672 6 0.024
astBLM 0.987 6 0.002 0.979 6 0.002 0.985 6 0.002
CPEdef (mF/cm2s(a�1)) 1.01 6 0.22 2.36 6 0.46 1.11 6 0.21
adef 0.52 6 0.08 0.93 6 0.04 0.55 6 0.06
Rdef (kVcm2) 933 6 110 9.6 6 2.7 645 6 124
Model fits are to the ECM shown in Fig. 5; f ¼ 1 Hz to 33 kHz. Data are
expressed as averages 6 standard deviations from multiple measurements
(n . 10).
FIGURE 6 Impact of soluble prefibrillar Ab1–42-oligomers on membrane
capacitance and conductance in an stBLM (WC14/bME ¼ 3:7 1 DOPC;
0.1 M NaCl, pH 7.5) as a function of peptide concentration, measured on
one single bilayer. The impact on stBLM capacitance (circles/solid line) and
stBLM conductance (squares/dashed line) is shown; circles and squares are
best-fit parameters from a model (ECM in Fig. 5, inset) that describes data
sets such as those shown in the main panel of Fig. 5.
FIGURE 7 Temperature dependence of current-voltage curves recorded
on free-standing DOPC BLMs (10 mM KCl, 1 mM HEPES-Tris, pH 7.5)
incubated with soluble prefibrillar Ab1-42-oligomers at a total peptide
concentration of 1 mM. Voltage scan rate, 30 mV/s. (Inset) Enlarged view
of the data in the main panel near zero voltage.
Ab-Oligomer Effects on Membrane Barrier 4853
Biophysical Journal 95(10) 4845–4861
the nSLD of the peptide is substantially lower than that of
perdeuterated alkane, a mere replacement of lipid by peptide
would be expected to reduce the nSLD of the bilayer core.
Fig. 10 A shows that the opposite is true. Estimating the
peptide nSLD to be rn ¼ 2.1 3 10�6 A�2, the volume
fraction of peptide material within the bilayer is estimated to
amount to ;14%. This model assumes that the number of
lipids/unit area remains constant. However, a fluid bilayer
may respond to peptide-induced changes in lipid con-
formation—affecting the area/lipid—with lateral flow, de-
positing excess lipid in reservoirs at defect sites (or retrieving
material from such sites). For example, if due to a peptide-
induced increase in local-disorder lipid material expanded
laterally, the estimate for ran is too low. Conversely, the es-
timate is too high if peptide insertion leads to lipid compac-
tion. Exposure to increasingly larger amyloid concentrations
will in that case eventually lead to a situation where mem-
brane compaction can no longer be compensated for by the
influx of lipid along the bilayer plane—which might ex-
plain the observed membrane thinning at cp¼ 6 mM and cp¼12 mM.
The nSLD of the outer lipid leaflet increases further by
Drn ¼ 0.49 6 0.11 3 10�6 A�2 upon raising the peptide
concentration in the buffer to 6 mM, and saturates at this level.
On the other hand, the nSLD of the inner lipid leaflet decreases
gradually from its peak value reached at cp ¼ 2 mM. This difference in behavior between the two membrane leaflets
is a consequence of the thinning of the membrane and the
distinct starting values of the nSLDs in both leaflets due to
different degrees of deuteration. The apparent discrepancy
is reconciled if one evaluates the neutron scattering length
area densities: ran is expected to change equally in both
leaflets if they are affected by the same influx or outflux of
deuterated lipid (which is the only mobile lipid species).
This is in fact what was observed (Fig. 10 C). In conclu-
sion, this experiment shows unmistakably that 1), peptide
material inserts into the membrane in significant amounts;
2), peptide material affects both bilayer leaflets similarly;
and 3), lipid is not simply replaced by the peptide but is,
rather, compacted in its local density—at least on average
within the plane of the membrane.
NR results for the incubation of fully hydrogenated
stBLMs with soluble Ab1–42-oligomers (Figs. 3 and 4)
showed small nSLD increases in response to peptide expo-
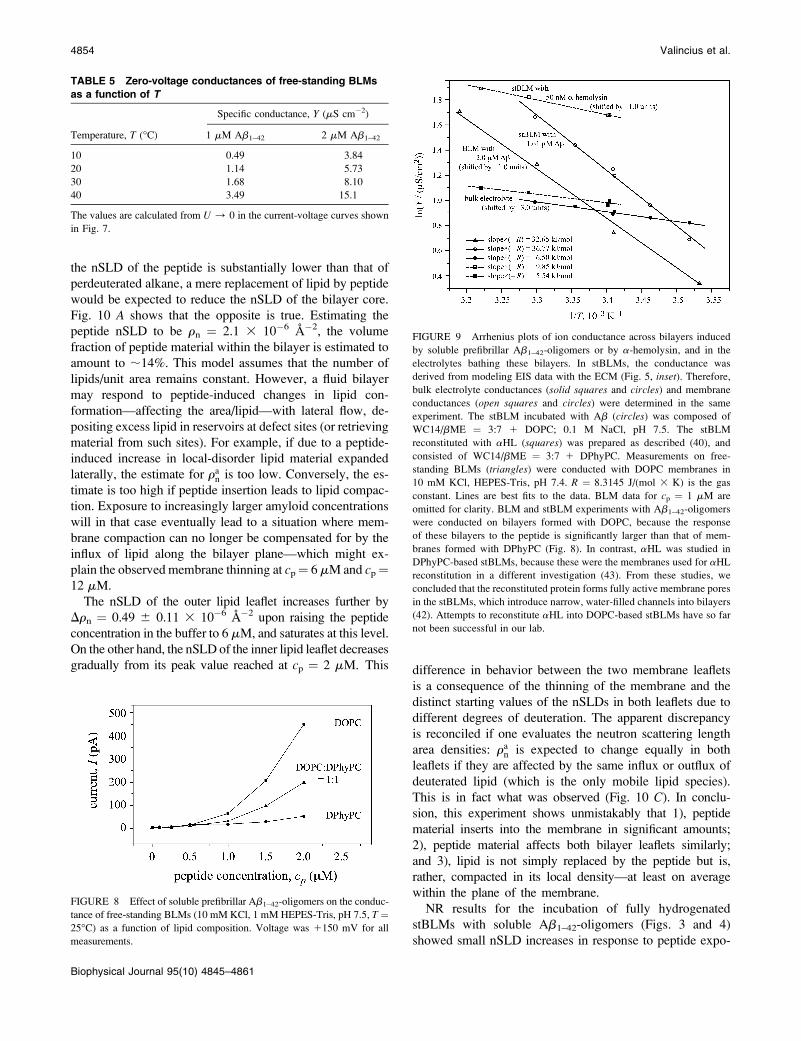
TABLE 5 Zero-voltage conductances of free-standing BLMs
as a function of T
Specific conductance, Y (mS cm�2)
Temperature, T (�C) 1 mM Ab1–42 2 mM Ab1–42
10 0.49 3.84
20 1.14 5.73
30 1.68 8.10
40 3.49 15.1
The values are calculated from U / 0 in the current-voltage curves shown
in Fig. 7.
FIGURE 8 Effect of soluble prefibrillar Ab1–42-oligomers on the conduc-
tance of free-standing BLMs (10 mM KCl, 1 mM HEPES-Tris, pH 7.5, T ¼25�C) as a function of lipid composition. Voltage was 1150 mV for all
measurements.
FIGURE 9 Arrhenius plots of ion conductance across bilayers induced
by soluble prefibrillar Ab1–42-oligomers or by a-hemolysin, and in the
electrolytes bathing these bilayers. In stBLMs, the conductance was
derived from modeling EIS data with the ECM (Fig. 5, inset). Therefore,
bulk electrolyte conductances (solid squares and circles) and membrane
conductances (open squares and circles) were determined in the same
experiment. The stBLM incubated with Ab (circles) was composed of
WC14/bME ¼ 3:7 1 DOPC; 0.1 M NaCl, pH 7.5. The stBLM
reconstituted with aHL (squares) was prepared as described (40), and
consisted of WC14/bME ¼ 3:7 1 DPhyPC. Measurements on free-
standing BLMs (triangles) were conducted with DOPC membranes in
10 mM KCl, HEPES-Tris, pH 7.4. R ¼ 8.3145 J/(mol 3 K) is the gas
constant. Lines are best fits to the data. BLM data for cp ¼ 1 mM are
omitted for clarity. BLM and stBLM experiments with Ab1–42-oligomers
were conducted on bilayers formed with DOPC, because the response
of these bilayers to the peptide is significantly larger than that of mem-
branes formed with DPhyPC (Fig. 8). In contrast, aHL was studied in
DPhyPC-based stBLMs, because these were the membranes used for aHL
reconstitution in a different investigation (43). From these studies, we
concluded that the reconstituted protein forms fully active membrane pores
in the stBLMs, which introduce narrow, water-filled channels into bilayers
(42). Attempts to reconstitute aHL into DOPC-based stBLMs have so far
not been successful in our lab.
4854 Valincius et al.
Biophysical Journal 95(10) 4845–4861
sure (Tables 2 and 3). These changes are consistent with the
interpretation, derived from results with deuterated stBLMs,
that Ab-oligomer incorporation into the membrane increases
the lipid density. However, such a conclusion cannot be
drawn from the DOPC and DPhyPC data alone, because both
a peptide-induced lipid compaction and displacement of
hydrogenated lipids by peptide without compaction are ex-
pected to result in an nSLD increase of a fully hydrogenated
lipid bilayer.
Reversibility of Ab1–42-oligomer effects onmembranes upon rinsing
As shown in the residual plots in Figs. 2–4 and Fig. 10, the
structural impact of Ab1–42-oligomers on membranes is al-
most perfectly reversible upon rinsing. In a similar way,
conductivity increases of bilayer induced by the peptide are
largely reversed by simply rinsing the membranes with
buffer, consistent with earlier reports (17). Moreover, it has
been shown that most adverse effects of Ab1–42-oligomers on
membrane and cell models—and even in vivo effects—can
be avoided, or even reverted, by exposure to the oligomer-
specific antibody, A11, developed in the Glabe lab (14).
Although due to the lack of NR experiments with deuterated
peptide we do not yet have a detailed molecular-scale picture
of the interaction of Ab-oligomers with the membrane, these
findings suggest an intriguing and unusual propensity for
adaptation of the peptide aggregates to either the aqueous or
the hydrophobic milieus. Clearly, upon transferring from
buffer to the membrane interior, Ab-oligomers must undergo
conformation and/or aggregation changes to adapt to the
different natures of these molecular environments. The ap-
parent ease of peptide clearance from the membrane, pre-
sumably connected with a redispersion into aqueous buffer,
then indicates that this interconversion cannot be associated
with a large energetic barrier. It is unfortunate that a lack of
more detailed structural information prevents us from
drawing more rigorous conclusions at this time.
Dielectric membrane properties andmechanisms that may compromisebarrier function
Earlier results (17), as well as those presented here, suggest
that the increased ion conductance of membranes affected by
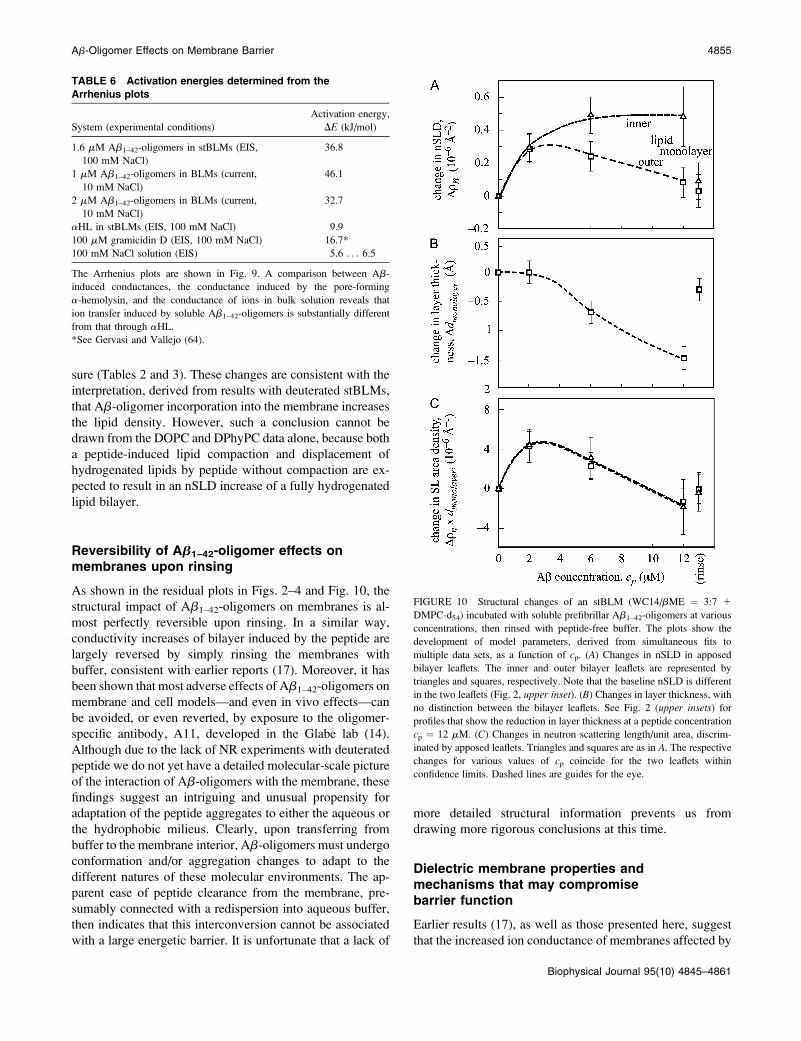
FIGURE 10 Structural changes of an stBLM (WC14/bME ¼ 3:7 1
DMPC-d54) incubated with soluble prefibrillar Ab1–42-oligomers at various
concentrations, then rinsed with peptide-free buffer. The plots show the
development of model parameters, derived from simultaneous fits to
multiple data sets, as a function of cp. (A) Changes in nSLD in apposed
bilayer leaflets. The inner and outer bilayer leaflets are represented by
triangles and squares, respectively. Note that the baseline nSLD is different
in the two leaflets (Fig. 2, upper inset). (B) Changes in layer thickness, with
no distinction between the bilayer leaflets. See Fig. 2 (upper insets) for
profiles that show the reduction in layer thickness at a peptide concentration
cp ¼ 12 mM. (C) Changes in neutron scattering length/unit area, discrim-
inated by apposed leaflets. Triangles and squares are as in A. The respective
changes for various values of cp coincide for the two leaflets within
confidence limits. Dashed lines are guides for the eye.
TABLE 6 Activation energies determined from the
Arrhenius plots
System (experimental conditions)
Activation energy,
DE (kJ/mol)
1.6 mM Ab1–42-oligomers in stBLMs (EIS,
100 mM NaCl)
36.8
1 mM Ab1–42-oligomers in BLMs (current,
10 mM NaCl)
46.1
2 mM Ab1–42-oligomers in BLMs (current,
10 mM NaCl)
32.7
aHL in stBLMs (EIS, 100 mM NaCl) 9.9
100 mM gramicidin D (EIS, 100 mM NaCl) 16.7*
100 mM NaCl solution (EIS) 5.6 . . . 6.5
The Arrhenius plots are shown in Fig. 9. A comparison between Ab-
induced conductances, the conductance induced by the pore-forming
a-hemolysin, and the conductance of ions in bulk solution reveals that
ion transfer induced by soluble Ab1–42-oligomers is substantially different
from that through aHL.
*See Gervasi and Vallejo (64).
Ab-Oligomer Effects on Membrane Barrier 4855
Biophysical Journal 95(10) 4845–4861
Ab-oligomers results from a breakdown of the dielectric
barrier that prevents charged species from crossing the lipid
bilayer. What is the mechanism of this dielectric breakdown?
At least four scenarios are conceivable. 1), Pores or channels
may be formed by Ab-oligomers in the membrane. 2), A
mere thinning of the membrane (without the formation of
pores), as observed with NR at cp . 2 mM (Fig. 10), could
increase ionic permeability. 3), Because proteinaceous ma-
terial has a larger e than alkane, incorporation of Ab-oligo-
mers into the membrane may elevate ehc, thus reducing the
energetic barrier for ion transport. 4), Ab incorporation into
the membrane could also introduce water and increase e.Even if this did not lead to the formation of contiguous,
membrane-spanning water-filled channels, such water-filled
pockets might be even more effective than scenario 2 in re-
ducing the energy barrier.
The formation of membrane pores has been a recurring
theme in the explanation of the observed increases in bilayer
conductivity after incubation with Ab (21–24,58–60). This
possibility has therefore been thoroughly considered in the
data interpretation. However, for the membrane model sys-
tems and experimental conditions employed here, this sce-
nario is not consistent with the experimental results, even if at
first sight circumstantial evidence appeared to point toward
channel formation.
For example, our observation of membrane thinning ac-
companying a conduction increase might be interpreted as a
result of amyloid channel formation, since reports in the lit-
erature show that pore-forming antimicrobial peptides lead to
similar effects (61–63). Nevertheless, the nature of the con-
ductance increase in the systems investigated here is dra-
matically different from those in other systems interpreted as
being due to channel formation (15,17). Moreover, NR does
not indicate any increase of water content in the bilayers.
Although narrow pores at low concentration in a bilayer may
not increase their water content sufficiently to be detected by
NR, the activation energy of ion transport across the bilayer
(Fig. 9 and Table 6) all but rigorously exclude channel for-
mation in the BLMs and stBLMs we studied. As suggested
from its crystal structure (42), and verified in electrophysi-
ology experiments (28), aHL forms well defined water-filled
pores in phospholipid bilayers. Ion transport through aHL
pores is characterized by about the same activation energy
(Ea� 10 kJ/mol) as ions moving freely in solution bulk (Ea�5 kJ/mol). In distinction, the ion conduction through Ab-
induced pathways has a significantly higher activation energy
(Ea � 46–33 kJ/mol for stBLMs and BLMs, both composed
of DOPC, in the concentration range of 1–2 mM peptide),
suggesting a fundamentally different mechanism. As shown
in Table 6, the activation energy observed for Ab1–42-olig-
omers is not only three times higher than that measured with
aHL, but is also significantly higher (more than twofold) than
that reported for a different pore, gramicidin D (64), which
forms narrower pores (diameter 3–4 A (65,66)) than aHL
(;10 A). Therefore, we dismiss the formation of pores as the
origin of the increase in ion conductivity across the mem-
brane in the model systems studied here under the experi-
mental conditions used.
In a similar way, by virtue of the NR results we can dismiss
scenario 4, the possibility that water inclusions contribute
significantly to an increase in the dielectric constant of the
bilayer. Changes of the water content in the bilayers, if there
were any, were ,1%, as judged from the models displayed in
Tables 1–3. One percent of water in the bilayer would in-
crease the dielectric constant, e, by ,0.8—too little to ac-
count for the observed increase in membrane current, as we
show below.
Before discussing in detail the most likely amyloid-in-
duced ion transport mechanism(s), we quantify in more detail
the dielectric properties of the membrane. Using the mem-
brane thickness derived from NR, we estimate the dielectric
constant, ehc, of the hydrophobic membrane slab as follows.
The capacitance of the stBLM is composed of serial contri-
butions from the hydrocarbon (hc) slab and the Helmholtz
(H) capacitance:
C�1
stBLM ¼ C�1
hc 1 C�1
H : ð4Þ
On the basis of an approximate value for CH of 6.25 6 0.12
mF cm�2 with a ¼ 0.992 6 0.001 (n ¼ 10), determined
earlier, and the experimental result for CstBLM, we calculate
Chc � 0.76 mF cm�2. Using Eq. 5,
ehc ¼Chc 3 dhc
e0
; ð5Þ
Chc in connection with the experimentally measured thick-
ness, dhc ¼ 32.8 6 0.5 A, yields ehc � 2.8 for DOPC. An
analogous estimate for DPhyPC yields ehc � 2.2, consistent
with the distinct nature of the unsaturated and saturated
chains. In what follows, these results for ehc will serve as an
experimentally determined basis for the quantification of Ab-
oligomer-induced changes of dielectric membrane properties.
Fig. 6 shows that a pronouncedly nonlinear increase in YAb
is accompanied by an increase in CstBLM that is linear in cp.
Because a remains close to unity (Table 4), CPEstBLM �CstBLM at all cp. At cp ¼ 1.6 mM, CAb
stBLM ¼ 0.74 6 0.02 mF/
cm2, and with Eq. 4, CAbhc ¼ 0.84 6 0.02 mF/cm2 for DOPC
membranes affected by Ab-oligomers, an increase in mem-
brane capacitance of ;11%.
Since we have dismissed the channel scenario, this Ab-
induced conductance increase may be due to either mem-
brane thinning or an increase in ehc or both. Membrane
permeability and conductance both scale with the geometric
barrier thickness as d�1hc (67,68). In addition, membrane
thinning may also affect permeability by lowering the barrier
for ion penetration into the hydrophobic core of the bilayer.
Image charge effects are the main reason for this reduction
but do not change the barrier height significantly in the mem-
brane thickness regime dhc � 30 A (68,69). For example,
from the data in Fig. 2 of Neumcke and Lauger (68), we
4856 Valincius et al.
Biophysical Journal 95(10) 4845–4861
estimate that the hydrophobic barrier is lowered by only 5%
as dhc decreases from 60 to 40 A. In comparison, geometric
changes of the bilayer are much smaller here. As seen in Fig.
10, a measurable reduction of dhc is only observed at cp . 2
mM for DMPC. The situation is similar for stBLMs com-
posed of DOPC, where geometrical changes of the mem-
brane were smaller than the confidence limits at cp # 2 mM.
Consequently, one may with confidence exclude geometric
changes of the bilayer thickness as the source of the observed
increase in CPE. Therefore, we proceed by analyzing quan-
titatively the possibility of changes of ehc by peptide insertion
as the origin of dielectric breakdown of the membrane bar-
rier.
A uniform increase in membrane dielectricconstant is inconsistent with the observedconductivity increase
The dielectric constant, ehc, has a profound effect on ion
permeability across the membrane because of the exponential
dependence of the transfer rate on barrier height (70). For
monovalent ions, Eq. 6 shows that the DG depends on ehc as
DGbarrier ¼e
2
8pe0rion
1
ehc
� 1
ew
� �� e
2
4pe0ehcdhc
ln2ew
ew 1 ehc
� �;
ð6Þ
where ew is the dielectric constant of bulk water, e is the
elementary charge, and rion is the ion radius. Equation 6
accounts only for electrostatic contributions to the energy
required for transferring an ion into a hydrophobic medium—
the Born self-energy—(first term) and a finite-size correction
for the hydrocarbon thickness (second term) (68,69). For an
order-of-magnitude estimate of Ab-induced ionic conduc-
tance changes, it is sufficient to account only for electrostatic
contributions.
From the barrier height, one may further estimate the
membrane conductance for monovalent ions:
Y ¼ cionF2
RT
g1 D1 1 g�D�dhc
; ð7Þ
where cion is the concentration of the electrolyte, R and F are
the gas and Faraday constants, respectively, T is temperature,
and g and D are the partition coefficients and diffusion
constants of ions in the membrane, respectively. For an ion k,
g is defined as
gk ¼ expð�DGk=RTÞ: ð8Þ
As quantified above, Ab1–42-oligomers increase the capaci-
tance of the hydrocarbon membrane core by 11% at cp ¼ 1.6
mM. For the DOPC-based stBLM, Eq. 5 then predicts an
increase in ehc from 2.8 to 3.1. On the other hand, for ehc ¼3.1, Eq. 6 yields an energy barrier, e.g., for chloride anions,
(rCl� ¼ 0.181 nm), Ea ¼ 107 kJ/mol, that would leave the
membrane practically impermeable. (On the role of Na1
ions, see the Appendix.) The ionic conductance of such a
membrane in 0.1 M NaCl solution would be Y� 1 mS/cm2,
well below the experimentally observed result. A compelling
conclusion from this inconsistency is that Ab-oligomers
cannot affect the membrane dielectric properties uniformly
but must exert their impact locally, e.g., by formation of
domains where lipids in contact with the peptide may have
different properties from lipids far away. It is evident that the
increase of e within Ab-induced membrane domains is bound
to be larger than the expected increase in a hypothetical
uniform adsorption model, i.e., edomainhc � 3.1. The actual
value of edomainhc may be estimated by assuming that both Ab-
induced domains and unaffected areas contribute to the
membrane capacitance in parallel. If so, then
edomain
hc ¼ eaverage
hc
ðj � 1Þ1 u
ux; ð9Þ
determines e within a peptide-induced domain. In Eq. 9
ehcaverage ¼ 3.1 is determined from Eq. 5, u is the area fraction
of membrane domains, j ¼ CAbhc /Chc is the ratio of specific
capacitances of the membrane hydrocarbon slabs within and
without peptide, and x ¼ dAb/dhc is the corresponding
thickness ratio. Vice versa, if edomainhc is known, e.g., from
Eq. 6, u can be determined by inverting Eq. 9.
Implications for membrane physiology
As discussed above, the EIS data yield an estimate of j ¼1.11 at cp ¼ 1.6 mM. Independent NR results show that x in
Eq. 9 is ;1 at low cp for stBLMs of all compositions in-
vestigated here. The largest uncertainty concerns the estimate
of u, which cannot be derived with comparable precision
from the available data. The most precise NR results—those
that involve chain-perdeuterated DMPC—suggest that u is
;14% of peptide material by volume inside the membrane at
cp ¼ 2 mM, if one assumes that the lipid area density in the
membrane remains constant; for (hydrogenated) DOPC and
DPhyPC, NR results are even less precise. On the other hand,
an estimate of u can be obtained by using the experimentally
measured activation energy, Ea ¼ 36.8 kJ/mol, as an ap-
proximate measure of DGbarrier. (On the validity of this ap-
proximation, see Appendix) edomainhc ¼ 8.6 is determined from
Eq. 6. With this value for edomainhc ; Eq. 9 yields u � 0.06.
A decrease in barrier height from DGbarrier� 100 kJ/mol
for a neat lipid membrane to DGbarrier � 30–40 kJ/mol will
severely compromise the insulation properties of the phos-
pholipid bilayer and result in an increase in membrane con-
ductance. With the results derived in the previous paragraph,
we are in a position to estimate membrane conductance from
Eq. 7. The finding that a homogeneous membrane model
cannot quantitatively account for the observed ion conduc-
tion suggests that Ab1–42-oligomers form localized ion
conductance pathways within a laterally inhomogeneous
membrane. In light of the activation energy results, these
Ab-Oligomer Effects on Membrane Barrier 4857
Biophysical Journal 95(10) 4845–4861
pathways cannot, however, be in the form of water-filled
membrane-spanning channels. Equation 7 needs to be mod-
ified to describe such structural inhomogeneity in a parallel
capacitor model. The parameter u then determines the con-
ductance, Y ¼ u 3 YAb, and yields Y � 180 mS/cm2. This
value is higher than the experimental data presented in Fig. 6,
but is nevertheless a realistic quantitative description of the
physical situation, given the substantial uncertainty of some
of the input values. A similar analysis for free-standing
BLMs in 10 mM electrolyte solution with experimentally
determined activation energy Ea � 39.4 kJ/mol yields a
conductance of 6.3 mS/cm2—close to the experimental re-
sults in Table 5. In BLMs, neither reliable membrane ca-
pacitance data nor area fraction estimates exist for the
presumed highly conducting membrane domains. In view of
the lack of such information, when substituting stBLM re-
sults into the estimate for the BLM, we assumed that ehc in-
creases by 11% in Ab-affected areas and that the surface
fraction of Ab-induced domains in the membrane is u� 0.06.
Implications for the molecular etiology ofAlzheimer’s disease
In a recent article, Lashuel and Lansbury reviewed the avail-
able evidence for amyloid protofibrils as triggers of age-related
neurodegenerative disease by induction of unregulated mem-
brane permeabilization, and they posed the question, Are
amyloid diseases caused by aggregates that mimic bacterial
pore-forming membranes? (71) In the data presented here, we
see significant differences between the molecular mechanisms
by which Ab-oligomers on the one hand and aHL or grami-
cidin D on the other—prototypical and well-studied mem-
brane pores—affect the membrane ion barrier. There is
nevertheless ample evidence, according to the seminal work
by Arispe and collaborators (21,72), for amyloid-induced
current traces reminiscent of channel-like conductance, as
presented in various publications (23,24,73). Complementary
morphological studies show AFM images in which donut-
shaped peptide aggregates decorate bilayer surfaces (23–25),
suggestive of pores perforating the underlying membranes.
Further circumstantial evidence from blockage studies with
specific metal ions such as Al31, Zn21, or Cu21 (72,74,75)
lends even more credibility to the amyloid channel hypoth-
esis. One has to keep in mind, however, that studies per-
formed with Ab until recently were mostly ill defined with
respect to the peptide aggregation state, and peptide con-
centrations used in early work were often extremely high.
With the exception of studies on acidic membranes (75), all
the ‘‘classical’’ studies suggesting pore formation employed
peptide concentrations that were at least four times higher
(24,25) than those in our experiments—and in many cases
substantially higher than that (58,72,73,76). On the other
hand, physiological damage to cultured cells has been re-
ported at peptide concentrations comparable to those used in
this study (77,78).
The fact that Ea is cp-dependent and the nearly quadratic
dependence of YAb on peptide concentration may hold im-
portant clues to the mode of action of the amyloid particles
and possible conformational changes they incur in the
membrane as a function of cp. Clearly, we are at best in the
very early stages of unraveling the molecular details of how
soluble Ab-oligomers affect membranes, and the cp depen-
dencies of YAb and Ea in particular require careful investi-
gation.
In addition to the use of well defined Ab1–42-oligomer
preparations at low concentrations, this study also provides a
novel approach to investigations on membrane-related issues
concerning AD: it encompasses structural and functional
characterization of the same physical system, as well as a
quantitative comparison of the physical state of membranes
before and during incubation with Ab1–42-oligomers. In
contrast, earlier studies often used a variety of more indirect
approaches to sample preparation, including the fusion of
preformed peptide-lipid assembly products to membranes
(72,74), or—as in most AFM studies—premixing of lipid
and peptide in dispersions at high peptide/lipid ratios (24,79).
Although the impact of these earlier studies on our thinking
about amyloid-induced membrane damage cannot be over-
stated, there has recently been substantial progress in the
areas of biochemical synthesis and characterization, and of
physical characterization, that make possible a reinvesti-
gation of the underlying mechanisms. Analogous to the re-
alization more than a decade ago that the conspicuous fibrils
are not the main pathologically active form of amyloid, an-
other paradigm shift may be just beyond the horizon. One
should therefore be open to a reassessment of the arguments
about the molecular mechanisms that lead to membrane
damage in Alzheimer’s disease.
CONCLUSIONS
Arrhenius plots of ion conductance across membranes show
that amyloid-induced ion transport is fundamentally different
from transport through water-filled aHL pores or gramicidin
channels: The activation energies for ion transport through
membranes affected by Ab-oligomers is substantially higher
than that found with aHL and gramicidin. In addition, Ea
decreases with increasing amyloid concentration, whereas it
is approximately constant as a function of aHL concentra-
tion. The presence of a large barrier is also inferred from the
exponential form of current-voltage curves (Fig. 7), which
differ from the near-linear current-voltage characteristics of
water-filled, low-barrier aHL pores reconstituted in mem-
branes (80). The combination of precise experimental results
for the membrane thickness and specific capacitance is in
quantitative accordance with a model in which Ab1–42-oli-
gomers insert into the bilayer membrane, where they lead to
domain formation. Amyloid oligomers may thereby create a
mosaic with regions of high local dielectric constant—and
consequently low dielectric barrier to ion transfer. Our
4858 Valincius et al.
Biophysical Journal 95(10) 4845–4861
experiments described here cannot assess the size or distri-
bution of these regions directly, but recent BLM experiments
with conductance probes, as well as work on Kv1.3 channels
in living cells, suggest that such regions of lower dielectric
barrier may alter characteristic properties of a variety of
ionophores and physiological ion channels in the membrane.
Specifically, Ab increases the conductance due to nonactin
and tetraphenylborate in BLMs and accelerates the gating
kinetics of the voltage-gated Kv1.3 channel in rat basophilic
leukemia cells (17). Ab also increases the single-channel
conductance of gramicidin channels and increases the effi-
ciency of alamethicin (Y. Sokolov and J. E. Hall, unpub-
lished data). Thus Ab-oligomers alter the dielectric structure
of the lipid bilayer in such a way as to facilitate charge
translocation by a variety of conductance mechanisms. We
suggest that such effects on the intrinsic membrane conduc-
tance and—more likely—on resident voltage-dependent
proteins, such as synaptic Ca21 channels (78), may well
account for some of the toxic properties of soluble amyloid
oligomers in Alzheimer’s disease.
APPENDIX
Na1 ions do not contribute to the ion currentacross the membrane
Using rNa1¼ 0.102 nm, a membrane thickness, dhc¼ 3.28 nm (Table 2), T¼293 K, c¼ 10�4 mol/cm3, and ew¼ 80, the barrier for Na1 ions is higher by a
factor of ;1.8 than that for C1�. Therefore, we assume that Na1 does not
significantly contribute to membrane conductance. We note that this as-
sumption may not be generally valid, because it is not clear whether or not
Na1 dehydrates fully upon partitioning into amyloid-affected membrane
domains. In an indirect manner, the absence of reversal potentials (17)
indicates that the permeability of Na1 might be comparable to that of Cl�. If
so, our quantitative estimate for Y may be too low by up to a factor of ;23.
Relation between activation energy andmembrane barrier height
Generally, Ea 6¼ DGbarrier. Instead, Ea � DHbarrier, where H is enthalpy.
However, because the activation energy is quite significant (Ea . 10 RT), and
because Born theory doesn’t account for chemical contributions to DGbarrier,such as the entropy increase associated with ion dehydration upon partition-
ing into the membrane, we assume that Ea � DGbarrier is also valid for the
purpose of our estimate.
Conductivity of the laterallyheterogeneous membrane
Na1 contributions to the bilayer conductance are neglected (see above).
D ¼ kBT/(6phrion) with rCl� ¼ 0.181 nm yields a diffusion constant for
the chloride ion of DCl� ¼ 3.95 3 10�6 cm2/s. With DGbarrier ¼ 36.8
kJ/mol and a membrane thickness, dhc ¼ 3.28 nm, in the presence of Ab
oligomers (u ¼ 0.06), Y ¼ 180 mS/cm2. The experimental result for the
mean conductance of DOPC-based stBLMs obtained with different am-
yloid oligomer batches was Y ¼ 104 6 22 mS/cm2 (n ¼ 15) at cp ¼ 1.6
mM. (The data set shown in Fig. 6 was at the low end of those results.)
Therefore, the theoretically estimated conductance exceeds this mean
value by a factor of 1.8.
SUPPLEMENTARY MATERIAL
To view all of the supplemental files associated with this
article, visit www.biophysj.org.
The support of the National Institute of Standards and Technology (U.S.
DOC) in providing the neutron research facilities used in this work is
gratefully acknowledged. We benefited from helpful discussions with
Charlie G. Glabe and valuable advice on Ab-oligomer preparation from
Rakez Kayed and Saskia C. Milton. Paul A. Kienzle provided support for
the NR data analysis.
This work was in part funded by the National Science Foundation (CBET-
0555201 and 0457148), the National Institutes of Health (1 R01 RR14182),
the Lithuanian State Science and Studies Foundation (B38/2008), the
American Health Assistance Foundation (A2008-307), and the Alzheimer’s
Foundation (IIRG-06-26167).
Certain commercial materials, instruments, and equipment are identified in
this manuscript to define the experimental procedure as completely as
possible. In no case does such identification imply a recommendation or
endorsement by the National Institute of Standards and Technology, nor
does it imply that the materials, instruments, or equipment identified are
necessarily the best available for the purpose.
REFERENCES
1. Cummings, B. J., C. J. Pike, R. Shankle, and C. W. Cotman. 1996.b-amyloid deposition and other measures of neuropathologypredict cognitive status in Alzheimer’s disease. Neurobiol. Aging. 17:921–933.
2. Hardy, J., and D. J. Selkoe. 2002. The amyloid hypothesis ofAlzheimer’s disease: progress and problems on the road to therapeu-tics. Science. 297:353–356.
3. Lansbury, P. T., and H. A. Lashuel. 2006. A century-old debate onprotein aggregation and neurodegeneration enters the clinic. Nature.443:774–779.
4. Hardy, J. A., and G. A. Higgins. 1992. Alzheimers disease: the amyloidcascade hypothesis. Science. 256:184–185.
5. Temussi, P. A., L. Masino, and A. Pastore. 2003. From Alzheimer toHuntington: why is a structural understanding so difficult? EMBO J.22:355–361.
6. Lindgren, M., K. Sorgjerd, and P. Hammarstrom. 2005. Detection andcharacterization of aggregates, prefibrillar amyloidogenic oligomers,and protofibrils using fluorescence spectroscopy. Biophys. J. 88:4200–4212.
7. Luhrs, T., C. Ritter, M. Adrian, D. Riek-Loher, B. Bohrmann, H.Dobeli, D. Schubert, and R. Riek. 2005. 3D structure of Alzheimer’samyloid-b(1–42) fibrils. Proc. Natl. Acad. Sci. USA. 102:17342–17347.
8. Mastrangelo, I. A., M. Ahmed, T. Sato, W. Liu, C. P. Wang, P. Hough,and S. O. Smith. 2006. High-resolution atomic force microscopy ofsoluble Ab42 oligomers. J. Mol. Biol. 358:106–119.
9. Chimon, S., M. A. Shaibat, C. R. Jones, D. C. Calero, B. Aizezi, and Y.Ishii. 2007. Evidence of fibril-like b-sheet structures in a neurotoxicamyloid intermediate of Alzheimer’s b-amyloid. Nat. Struct. Mol. Biol.14:1157–1164.
10. Kuo, Y. M., M. R. Emmerling, H. C. Lambert, S. R. Hempelman, T. A.Kokjohn, A. S. Woods, R. J. Cotter, and A. E. Roher. 1999. Highlevels of circulating Ab42 are sequestered by plasma proteins inAlzheimer’s disease. Biochem. Biophys. Res. Commun. 257:787–791.
11. Lue, L. F., Y. M. Kuo, A. E. Roher, L. Brachova, Y. Shen, L. Sue, T.Beach, J. H. Kurth, R. E. Rydel, and J. Rogers. 1999. Soluble amyloidb peptide concentration as a predictor of synaptic change in Alz-heimer’s disease. Am. J. Pathol. 155:853–862.
12. McLean, C. A., R. A. Cherny, F. W. Fraser, S. J. Fuller, M. J. Smith,K. Beyreuther, A. I. Bush, and C. L. Masters. 1999. Soluble pool of Ab
Ab-Oligomer Effects on Membrane Barrier 4859
Biophysical Journal 95(10) 4845–4861
amyloid as a determinant of severity of neurodegradation in Alz-heimer’s disease. Ann. Neurol. 46:860–866.
13. Walsh, D. M., I. Klyubin, J. V. Fadeeva, W. K. Cullen, R. Anwyl,M. S. Wolfe, M. J. Rowan, and D. J. Selkoe. 2002. Naturally secretedoligomers of amyloid b protein potently inhibit hippocampal long-termpotentiation in vivo. Nature. 416:535–539.
14. Kayed, R., E. Head, J. L. Thompson, T. M. McIntire, S. C. Milton,C. W. Cotman, and C. G. Glabe. 2003. Common structure of solubleamyloid oligomers implies common mechanism of pathogenesis.Science. 300:486–489.
15. Kayed, R., Y. Sokolov, B. Edmonds, T. M. McIntire, S. C. Milton,J. E. Hall, and C. G. Glabe. 2004. Permeabilization of lipid bilayers is acommon conformation-dependent activity of soluble amyloid oligo-mers in protein misfolding diseases. J. Biol. Chem. 279:46363–46366.
16. Guo, J. P., T. Arai, J. Miklossy, and P. L. McGeer. 2006. Ab andt form soluble complexes that may promote self aggregation of bothinto the insoluble forms observed in Alzheimer’s disease. Proc. Natl.Acad. Sci. USA. 103:1953–1958.
17. Sokolov, Y., J. A. Kozak, R. Kayed, A. Chanturija, C. Glabe, and J. E.Hall. 2006. Soluble amyloid oligomers increase bilayer conductance byaltering dielectric structure. J. Gen. Physiol. 128:637–647.
18. Eliezer, D. 2006. Amyloid ion channels: a porous argument or a thinexcuse? J. Gen. Physiol. 128:631–633.
19. Bucciantini, M., E. Giannoni, F. Chiti, F. Baroni, L. Formigli, J. S.Zurdo, N. Taddei, G. Ramponi, C. M. Dobson, and M. Stefani. 2002.Inherent toxicity of aggregates implies a common mechanism forprotein misfolding diseases. Nature. 416:507–511.
20. Ambroggio, E. E., D. H. Kim, F. Separovic, C. J. Barrow, K. J.Barnham, L. A. Bagatolli, and G. D. Fidelio. 2005. Surface behaviorand lipid interaction of Alzheimer b-amyloid peptide 1–42: a mem-brane-disrupting peptide. Biophys. J. 88:2706–2713.
21. Arispe, N., H. B. Pollard, and E. Rojas. 1993. Giant multilevel cationchannels formed by Alzheimer disease amyloid b protein [AßP(1–40)]in bilayer membranes. Proc. Natl. Acad. Sci. USA. 90:10573–10577.
22. Kawahara, M., and Y. Kuroda. 2000. Molecular mechanism of neuro-degeneration induced by Alzheimer’s b-amyloid protein: channelformation and disruption of calcium homeostasis. Brain Res. Bull.53:389–397.
23. Lin, H., R. Bhatia, and R. Lal. 2001. Amyloid b protein forms ionchannels: implications for Alzheimer’s disease pathophysiology.FASEB J. 15:2433–2444.
24. Quist, A., L. Doudevski, H. Lin, R. Azimova, D. Ng, B. Frangione, B.Kagan, J. Ghiso, and R. Lal. 2005. Amyloid ion channels: a commonstructural link for protein-misfolding disease. Proc. Natl. Acad. Sci.USA. 102:10427–10432.
25. Green, J. D., L. Kreplak, C. Goldsbury, X. L. Blatter, M. Stolz, G. S.Cooper, A. Seelig, J. Kistler, and U. Aebi. 2004. Atomic forcemicroscopy reveals defects within mica supported lipid bilayersinduced by the amyloidogenic human amylin peptide. J. Mol. Biol.342:877–887.
26. Micelli, S., D. Meleleo, V. Picciarelli, and E. Gallucci. 2004. Effect ofsterols on b-amyloid peptide (AßP 1–40) channel formation and theirproperties in planar lipid membranes. Biophys. J. 86:2231–2237.
27. Kawahara, M., Y. Kuroda, N. Arispe, and E. Rojas. 2000. Alzheimer’sb-amyloid, human islet amylin, and prion protein fragment evoke intra-cellular free calcium elevations by a common mechanism in a hypotha-lamic GnRH neuronal cell line. J. Biol. Chem. 275:14077–14083.
28. Bezrukov, S. M., and J. J. Kasianowicz. 1993. Current noise revealsprotonation kinetics and number of ionizable sites in an open proteinion channel. Phys. Rev. Lett. 70:2352–2355.
29. Terzi, E., G. Holzemann, and J. Seelig. 1997. Interaction of Alzheimerb-amyloid peptide(1–40) with lipid membranes. Biochemistry. 36:14845–14852.
30. Yip, C. M., and J. McLaurin. 2001. Amyloid-b peptide assembly: acritical step in fibrillogenesis and membrane disruption. Biophys. J.80:1359–1371.
31. Widenbrant, M. J. O., J. Rajadas, C. Sutardja, and G. G. Fuller. 2006.Lipid-induced b-amyloid peptide assemblage fragmentation. Biophys.J. 91:4071–4080.
32. Chi, E. Y., C. Ege, A. Winans, J. Majewski, G. Wu, K. Kjaer, andK. Y. C. Lee. 2008. Lipid membrane templates the ordering andinduced fibrillogenesis of Alzheimer’s disease amyloid-b peptide.Proteins. 72:1–24.
33. McIntosh, T. J., and S. A. Simon. 2006. Roles of bilayer materialproperties in function and distribution of membrane proteins. Annu.Rev. Biophys. Biomol. Struct. 35:177–198.
34. Ehehalt, R., P. Keller, C. Haass, C. Thiele, and K. Simons. 2003.Amyloidogenic processing of the Alzheimer b-amyloid precursorprotein depends on lipid rafts. J. Cell Biol. 160:113–123.
35. Hur, J. Y., H. Welander, H. Behbahani, M. Aoki, J. Franberg, B.Winblad, S. Frykman, and L. O. Tjernberg. 2008. Active g-secretase islocalized to detergent-resistant membranes in human brain. FEBS J.275:1174–1187.
36. Hattori, C., M. Asai, H. Onishi, N. Sasagawa, Y. Hashimoto, T. C.Saido, K. Maruyama, S. Mizutani, and S. Ishiura. 2006. BACE1interacts with lipid raft proteins. J. Neurosci. Res. 84:912–917.
37. Sackmann, E. 1996. Supported membranes: scientific and practicalapplications. Science. 271:43–48.
38. Cornell, B. A., V. L. B. Braach-Maksvytis, L. B. King, P. D. J. Osman,B. Raguse, L. Wieczorek, and R. J. Pace. 1997. A biosensor that usesion-channel switches. Nature. 387:580–583.
39. Tanaka, M., and E. Sackmann. 2005. Polymer-supported membranes asmodels of the cell surface. Nature. 437:656–663.
40. McGillivray, D. J., G. Valincius, D. J. Vanderah, W. Febo-Ayala, J. T.Woodward, F. Heinrich, J. J. Kasianowicz, and M. Losche. 2007.Molecular-scale structural and functional characterization of sparselytethered bilayer lipid membranes. Biointerphases. 2:21–33.
41. Valincius, G., D. J. McGillivray, W. Febo-Ayala, D. J. Vanderah, J. J.Kasianowicz, and M. Losche. 2006. Enzyme activity to augment thecharacterization of tethered bilayer membranes. J. Phys. Chem. B.110:10213–10216.
42. Song, L., M. R. Hobaugh, C. Shustak, S. Cheley, H. Bayley, and J. E.Gouaux. 1996. Structure of staphylococcal a-hemolysin, a heptamerictransmembrane pore. Science. 274:1859–1865.
43. McGillivray, D. J., G. Valincius, F. Heinrich, J. W. F. Robertson, D. J.Vanderah, W. Febo-Ayala, I. Ignatjev, M. Losche, and J. J. Kasianowicz.2007. Functional reconstitution of Staphylococcus aureus a-hemolysinin tethered bilayer lipid membranes. Biophys. J. Under revision.
44. Vanderah, D. J., C. W. Meuse, V. Silin, and A. L. Plant. 1998.Synthesis and characterization of self-assembled monolayers of alky-lated 1-thiahexa(ethylene oxide) compounds on gold. Langmuir.14:6916–6923.
45. Demuro, A., E. Mina, R. Kayed, S. C. Milton, I. Parker, and C. G.Glabe. 2005. Calcium dysregulation and membrane disruption as aubiquitous neurotoxic mechanism of soluble amyloid oligomers.J. Biol. Chem. 280:17294–17300.
46. Vanderah, D. J., R. S. Gates, V. Silin, D. N. Zeiger, J. T. Woodward,C. W. Meuse, G. Valincius, and B. Nickel. 2003. Isostructural self-assembled monolayers. 1. Octadecyl 1-thiaoligo(ethylene oxides).Langmuir. 19:2612–2620.
47. Trassati, S., and O. A. Petrii. 1991. Real surface area measurements inelectrochemistry. Pure Appl. Chem. 63:711–734.
48. Dura, J. A., D. Pierce, C. F. Majkrzak, N. Maliszewskyj, D. J.McGillivray, M. Losche, K. V. O’Donovan, M. Mihailescu, U. A.Perez-Salas, D. L. Worcester, and S. H. White. 2006. AND/R:a neutron diffractometer/reflectometer for investigation of thinfilms and multilayers for the life sciences. Rev. Sci. Instrum. 77:074301.
49. Als-Nielsen, J., and K. Kjaer. 1989. X-ray reflectivity and diffractionstudies of liquid surfaces and surfactant monolayers. In Phase Transi-tions in Soft Condensed Matter. T. Riste and D. Sherrington, editors.Plenum Press, New York. 113–138.
4860 Valincius et al.
Biophysical Journal 95(10) 4845–4861
50. Kienzle, P. A., M. Doucet, D. J. McGillivray, K. V. O’Donovan, N. F.Berk, and C. F. Majkrzak. 2000–2006. ga_refl, http://www.ncnr.nist.gov/reflpak/garefl.html.
51. Parratt, L. G. 1954. Surface studies of solids by total reflection ofx-rays. Phys. Rev. 95:359–369.
52. Vaknin, D., K. Kjaer, J. Als-Nielsen, and M. Losche. 1991. Structuralproperties of phosphatidylcholine in a monolayer at the air/waterinterface. Neutron reflection study and reexamination of x-ray reflec-tion experiments. Biophys. J. 59:1325–1332.
53. Wiener, M. C., and S. H. White. 1991. Fluid bilayer structuredetermination by the combined use of x-ray and neutron diffraction.II. ‘‘Composition-space’’ refinement method. Biophys. J. 59:174–185.
54. Cornell, B. A., G. Krishna, P. D. Osman, R. D. Pace, and L.Wieczorek. 2001. Tethered-bilayer lipid membranes as a support formembrane-active peptides. Biochem. Soc. Trans. 29:613–617.
55. Glazier, S. A., D. J. Vanderah, A. L. Plant, H. Bayley, G. Valincius,and J. J. Kasianowicz. 2000. Reconstitution of the pore-forming toxina-hemolysin in phospholipid/18-octadecyl-1-thiahexa(ethylene oxide)and phospholipid/n-octadecanethiol supported bilayer membranes.Langmuir. 16:10428–10435.
56. Kozak, J. A., Y. Sokolov, R. Kayed, C. Glabe, and J. E. Hall. 2007.Multiple effects of soluble amyloid peptide oligomers on humanpotassium channels. Biophys. J. Supplement. Abstract 393A.
57. Chong, Y. H., Y. J. Shin, E. O. Lee, R. Kayed, C. G. Glabe, and A. J.Tenner. 2006. ERK1/2 activation mediates Ab oligomer-inducedneurotoxicity via caspase-3 activation and tau cleavage in rat organo-typic hippocampal slice cultures. J. Biol. Chem. 281:20315–20325.
58. Hirakura, Y., M. C. Lin, and B. L. Kagan. 1999. Alzheimer amyloidAb1–42 channels: Effects of solvent, pH, and Congo Red. J. Neurosci.Res. 57:458–466.
59. Jang, H., J. Zheng, and R. Nussinov. 2007. Models of b-amyloid ionchannels in the membrane suggest that channel formation in the bilayeris a dynamic process. Biophys. J. 93:1938–1949.
60. Kagan, B. L., Y. Hirakura, R. Azimov, R. Azimova, and M. C. Lin.2002. The channel hypothesis of Alzheimer’s disease: current status.Peptides. 23:1311–1315.
61. Heller, W. T., A. J. Waring, R. I. Lehrer, T. A. Harroun, T. M. Weiss,L. Yang, and H. W. Huang. 2000. Membrane thinning effect of theb-sheet antimicrobial protegrin. Biochemistry. 39:139–145.
62. Ludtke, S., K. He, and H. Huang. 1995. Membrane thinning caused bymagainin 2. Biochemistry. 34:16764–16769.
63. Chen, F. Y., M. T. Lee, and H. W. Huang. 2003. Evidence formembrane thinning effect as the mechanism for peptide-induced poreformation. Biophys. J. 84:3751–3758.
64. Gervasi, C. A., and A. E. Vallejo. 2002. Sodium ion transport throughgramicidin-doped bilayers. Influences of temperature and ionic con-centration. Electrochim. Acta. 47:2259–2264.
65. Smart, O. S., J. M. Goodfellow, and B. A. Wallace. 1993. The poredimensions of gramicidin A. Biophys. J. 65:2455–2460.
66. Wallace, B. A. 2000. Common structural features in gramicidin andother ion channels. Bioessays. 22:227–234.
67. Walz, D., E. Bamberg, and P. Lauger. 1969. Nonlinear electrical effectsin lipid bilayer membranes. 1. Ion injection. Biophys. J. 9:1150–1159.
68. Neumcke, B., and P. Lauger. 1969. Nonlinear electrical effects in lipidbilayer membranes. 2. Integration of generalized Nernst-Planck equa-tions. Biophys. J. 9:1160–1170.
69. Parsegian, V. A. 1969. Energy of an ion crossing a low dielectricmembrane: solutions to four relevant electrostatic problems. Nature.221:844–846.
70. Dilger, J. P., S. G. A. McLaughlin, T. J. McIntosh, and S. A. Simon.1979. Dielectric constant of phospholipid bilayers and the permeabilityof membranes to ions. Science. 206:1196–1198.
71. Lashuel, H. A., and P. T. Lansbury. 2006. Are amyloid diseases causedby protein aggregates that mimic bacterial pore-forming toxins? Q.Rev. Biophys. 39:167–201.
72. Arispe, N., E. Rojas, and H. B. Pollard. 1993. Alzheimer diseaseamyloid b protein forms calcium channels in bilayer membranes:blockade by tromethamine and aluminum. Proc. Natl. Acad. Sci. USA.90:567–571.
73. Kawahara, M., N. Arispe, Y. Kuroda, and E. Rojas. 1997. Alzheimer’sdisease amyloid b protein forms Zn21-sensitive, cation-selectivechannels across excised membrane patches from hypothalamic neu-rons. Biophys. J. 73:67–75.
74. Arispe, N., H. B. Pollard, and E. Rojas. 1996. Zn21 interaction withAlzheimer amyloid b protein calcium channels. Proc. Natl. Acad. Sci.USA. 93:1710–1715.
75. Bahadi, R., P. V. Farrelly, B. L. Kenna, C. C. Curtain, C. L. Masters,R. Cappai, K. J. Barnham, and J. I. Kourie. 2003. Cu21-inducedmodification of the kinetics of Ab(1–42) channels. Am. J. Physiol. CellPhysiol. 285:C873–C880.
76. Singer, S. J., and N. N. Dewji. 2006. Evidence that Perutz’s double-b-stranded subunit structure for b-amyloids also applies to theirchannel-forming structures in membranes. Proc. Natl. Acad. Sci.USA. 103:1546–1550.
77. Bhatia, R., H. Lin, and R. Lal. 2000. Fresh and globular amyloid b
protein (1–42) induces rapid cellular degeneration: evidence for AßPchannel-mediated cellular toxicity. FASEB J. 14:1233–1243.
78. MacManus, A., M. Ramsden, M. Murray, Z. Henderson, H. A. Pearson,and V. A. Campbell. 2000. Enhancement of 45Ca21 influx and voltage-dependent Ca21 channel activity by b-amyloid-(1–40) in rat corticalsynaptosomes and cultured cortical neurons. Modulation by the proin-flammatory cytokine interleukin-1b. J. Biol. Chem. 275:4713–4718.
79. Lin, B., T. L. Morkved, M. Meron, Z. Q. Huang, P. J. Viccaro, H. M.Jaeger, S. M. Williams, and M. L. Schlossman. 1999. X-ray studies ofpolymer/gold nonocomposites. J. Appl. Phys. 85:3180–3184.
80. Misakian, M., J. J. Kasianowicz, B. Robertson, and O. Petersons. 2001.Frequency response of alternating currents through the Staphylococcusaureus a-hemolysin ion channel. Bioelectromagnetics. 22:487–493.
Ab-Oligomer Effects on Membrane Barrier 4861
Biophysical Journal 95(10) 4845–4861
Copyright © 2022 FDOKUMEN