The critical role of magma degassing in sulphide melt ... - Nature
Upload
independentCategory
view
0download
0
Available online at www.sciencedirect.com
www.elsevier.com/locate/gca
Geochimica et Cosmochimica Acta 73 (2009) 5764–5777
Solubility of Pt in sulphide mattes: Implications for the genesisof PGE-rich horizons in layered intrusions
Raul O.C. Fonseca a,b,*, Ian H. Campbell a, Hugh St. C. O’Neill a, Charlotte M. Allen a
a Research School of Earth Sciences, Australian National University, Canberra, ACT, Australiab Steinmann Institut, Universitat Bonn, Bonn, Germany
Received 15 October 2008; accepted in revised form 23 June 2009; available online 19 July 2009
Abstract
The partitioning of Pt in sulphide melt (matte) has been studied as a function of fS2 and fO2 at 1200 and 1300 �C. Theresults show that the solubility of Pt in mattes increases strongly with increasing fS2 and decreases weakly with increasingfO2. The increase in Pt solubility with increasing fS2 is attributed to Pt dissolving in the melt as a sulphide species and theweak inverse dependence of Pt solubility on fO2 to the diluting effect of increasing O in the melt at high fO2. These results,coupled with measurements of Pt solubility in silicate melts taken from the literature, allow the calculation of Pt matte/sili-cate-melt partition coefficients (Dmatte–sil
Pt ) for a range of conditions pertinent to the formation of Pt-rich horizons in layeredintrusions. The calculated values range between 107 and 1011, depending on fO2 and fS2, several orders of magnitude higherthan previously published values. Our preferred value for Dmatte–sil
Pt for conditions appropriate to the Merensky Reef is 107 andfor the Stillwater Pt-rich horizon 108. The new results are consistent with the magmatic hypothesis for Pt-rich horizons inlayered intrusions.� 2009 Elsevier Ltd. All rights reserved.
1. INTRODUCTION
Platinum Group Elements (Os, Ir, Ru, Pt, Pd and Rh –the PGE) have a high affinity for metallic and sulphidephases and as a consequence are defined as being both chal-cophile and highly siderophile elements. The highly sidero-phile characteristics of Pt are well accepted, with measureddistribution coefficients (Dmetal–sil
Pt ) as high as 1012 for thepartitioning of Pt between metal and silicate melt. How-ever, the extent to which Pt is chalcophile remains contro-versial, with measured partitioning coefficients for Ptbetween sulphide melt (here referred to as matte) and sili-cate melt (Dmatte–sil
Pt ) ranging between 103 and 109. Manyauthors including Helz and Rait (1988), Peach et al.(1990, 1994), Stone et al. (1990), Fleet et al. (1991, 1996),
0016-7037/$ - see front matter � 2009 Elsevier Ltd. All rights reserved.
doi:10.1016/j.gca.2009.06.038
* Corresponding author. Address: Steinmann Institut, Universi-tat Bonn, Bonn, Germany. Tel.: +49 (0)228 739782; fax: +49(0)228 732763.
E-mail address: [email protected] (R.O.C. Fonseca).
Bezmen et al. (1994), Crocket et al. (1997), and Fleetet al. (1999) accept values towards the lower end of thisrange (103–104). However, others (e.g., Bezmen et al.,1991; Pruseth and Palme, 2004) have calculated Dmatte–sil
Pt
that are several orders of magnitude higher than these pre-vious values (Table 1).
The controversy regarding the extent to which Pt is chal-cophile affects whether the so-called ‘‘R-factor” model canexplain PGE enrichment in magmatic sulphide deposits(e.g., Campbell and Naldrett, 1979). If Dmatte–sil
Pt is very large,the high-temperature equilibration between a matte and asilicate melt will inexorably lead to the matte being enrichedin Pt when compared to the silicate melt. Furthermore, theenrichment would not only be a function of the highDmatte–sil
Pt but, due to mass balance considerations, wouldalso be constrained by the mass ratio of the silicate liquidto sulphide liquid, R. The R-factor model, which was ini-tially proposed by Campbell and Naldrett (1979), has beenused to explain the high PGE enrichments observed in hori-zons found in a number of mafic layered intrusions such asthe Merensky Reef, Stillwater complex, etc. (e.g., Keays

Table 1Summary of some of the different matte/silicate and metal silicate partition coefficients for Pt and Pd available in the literature.
Authors Temperature (�C) Pressure (bars) �log fS2 �log fO2 Dmatte–silPt Dmatte–sil
Pd
Bezmen et al. (1991) 1200–1350 100–4000 0.1–3.7 9.9–12.4 >106 –Bezmen et al. (1994) 1200–1300 1000–4000 0.3–4 9.9–12 – 5.5 � 104
Crocket et al. (1997) 1250 1 0.9 8.6 1.65 � 104 2.8 � 104
Fleet et al. (1991) 1300 1 – CCOa–WMb 2.00 � 104 2.00 � 104
Fleet et al. (1996) 1250 1 0.9–1.0 8.5–8.6 1.50 � 104 –Fleet et al. (1999) 1300 1 0.2–2.3 11.4–12 1.30 � 104 2.50 � 104
Helz and Rait (1988) – – – – 3.6 � 104 2.50 � 104
Peach et al. (1990) 1260 1 – QFM�0.5 1 � 103 2.30 � 104
Peach et al. (1994) 1450 8000 2.3–1 �QFM2.5 – 3.4 � 104
Pruseth and Palme (2004) 1100–1300 1 0–6 QFMc (assumed) >109 –Stone et al. (1990) 1200 1 0.9 9.2 9.1 � 103 8.80 � 104
a C–CO–CO2 oxygen fugacity buffer.b Wustite–magnetite oxygen fugacity buffer.c Quartz–fayalite–magnetite oxygen fugacity buffer. Taken from Mallmann and O’Neill (2007).
Solubility of Pt in sulphide mattes 5765
and Campbell, 1981; Campbell et al., 1983; Campbell andBarnes, 1984; Barnes and Naldrett, 1985; Naldrett et al.,1987; Barnes and Campbell, 1988; Godel et al., 2007). How-ever, the R-factor model was almost immediately criticized,because until recently, Dmatte–sil
Pt available in the literature(e.g., Helz and Rait, 1988; Peach et al., 1990, 1994; Stoneet al., 1990; Fleet et al., 1991, 1996, 1999; Bezmen et al.,1994; Crocket et al., 1997) were lower than required bythe model to explain the level of PGE enrichment in sulp-hides observed in many magmatic PGE deposits. Fleetet al. (1999) for example, argued that the low Dmatte–sil
PGE valuesmeasured in their experiments, and also those measured byPeach et al. (1994), were not consistent with the enrich-ments observed in the reef deposits of the Bushveld andStillwater complexes. Fleet et al. (1999) instead proposedthat the discrepancy between measured Dmatte–sil
PGE and theempirically determined Dmatte–sil
PGE argued in favor of an ‘‘up-ward” migrating fluid as the source of PGE enrichment.This view was reiterated by Mathez (1995) who pointedout that because PGE enrichments in mafic layered intru-sions are often associated with textural indicators for exten-sive metasomatism, ‘‘it may be taken as evidence that thePGE were enriched by a metasomatic process”, a view thatfound support in a number of subsequent studies (Ballhausand Stumpfl, 1985, 1986; Boudreau and McCallum, 1992;Boudreau and Meurer, 1999; Meurer et al., 1997; Meurerand Boudreau, 1998). However, Wood (1987) pointed outthat even though PGE may be transported in Cl-rich brinefluids, as suggested for instance by Boudreau and McCal-lum (1992) and Boudreau and Meurer (1999), Cu, Ni andFe should be more enriched by hydrothermal fluids thanthe PGE by ‘‘several factors of tens”, which is not observedin the PGE-rich reefs of the Stillwater and Bushveld Com-plexes. Moreover, PGE abundances in hydrothermal sulp-hides are typically very low as shown in a recent study byLuguet et al. (2004), further reinforcing the likelihood thatPGE cannot be strongly enriched by hydrothermal fluids. Amore detailed discussion on the pros and cons of the ‘‘up-ward” migrating fluid model may be found on Barnesand Campbell (1988).
The discrepancies between estimates for Dmatte–silPtGE are at
the core of the debate between the ‘‘upper”, those who
advocate a hydrothermal origin of PGE-rich reefs, andthe ‘‘downers”, who favor a magmatic origin. The directexperimental determination of Pt (or PGE) matte/silicate-melt partition coefficients (Dmatte–sil
Pt ) is difficult (e.g., O’Neillet al., 1995). Although there are numerous experimentaldata on the partitioning of Pt between mattes and silicatemelts (Bezmen et al., 1991, 1994; Crocket et al., 1997; Fleetand Stone, 1991; Fleet et al., 1996, 1999; Peach et al., 1990,1994; Stone et al., 1990), early experimental attempts tomeasure Dmatte–sil
Pt directly are now thought to have beencompromised by the presence of ‘‘nanonuggets” in runproducts. Nanonuggets consist of sub-micron particles ofPt metal and/or Pt-rich sulphides globules that remain sus-pended in the silicate melt, resulting in an overestimate ofthe Pt content in the quenched glass, which lead toDmatte–sil
Pt that may be orders of magnitude too low (e.g.,O’Neill et al., 1995; Ertel et al., 1999, 2008). The adventof laser-ablation ICP–MS as a microanalytical method suit-able for determining PGEs in experimental run productshas confirmed the ubiquity of the nanonugget problem.
As pointed out by O’Neill et al. (1995), the customaryexperimental tactic of performing ‘‘reversal” experimentsto test for equilibrium does not address the nanonuggetproblem. The ‘‘reversal” tactic was introduced into experi-mental petrology specifically to guard against erroneous re-sults that often arise in silicate systems due to sluggishnucleation and growth, and is irrelevant to sulphide/silicatemelt partitioning experiments where nucleation is not an is-sue and diffusion kinetics are rapid. Instead, the differentproblems of PGE partitioning experiments demand thatother criteria be used to assess equilibrium, such as demon-stration of a smooth response to variations in the physicalvariables to which partitioning is expected to be sensitive,particularly oxygen fugacity (fO2) and sulphur fugacity(fS2). At present, no studies that have tried to measurePGE matte/silicate partitioning directly have attemptedthe appropriate tests for equilibrium.
Unless special experimental techniques can be found toeliminate the nanonugget problem (e.g., Brenan, 2008),the PGE partitioning needed to discriminate between mod-els must be obtained indirectly, by performing experimentsunder conditions where nanonuggets do not pose an over-

Pt in
met
al (w
t%)
Thickness (µm)
100
95
90
85
80
75
70
65
60
1hr
4hrs
48hrs
24hrs
96hrs
0 10 20 30 40 50 60 70 80 90 100
10 20 30 40 50 60 70 80 90 1000
Time (hours)
0
0.5
1.0
1.5
2.0
2.5
A
B
Pt in
met
al (w
t%)
Fig. 1. (A) Profile of the Pt content of the metal phase for differentrun times. Curves represent five point moving averages derivedfrom 30 to 50 EMP point analyses for each profile. (B) Pt contentin matte at different run times. Time series carried out at constantfS2 (0.001 bars), fO2 (10�11 bars) and temperature (1200 �C).
5766 R.O.C. Fonseca et al. / Geochimica et Cosmochimica Acta 73 (2009) 5764–5777
whelming obstacle to measuring equilibrium relations, andthen combining the results in a thermodynamic model tocalculate the desired quantities, such as Dmatte–sil
PGE . This ap-proach also has the advantage that the sensitivity ofDmatte–sil
Pt to petrologically important variables is alsoobtained.
Here we report experiments in which the solubility of Ptin mattes was investigated as a function of fO2, fS2 and tem-perature. The results may be combined with solubility datafor Pt in silicate melts at 1 bar of Ertel et al. (1999), Borisovand Palme (1997, 2000), and Fortenfant et al. (2003), andthe activity–composition relationships of Pt–Fe alloys(Gudmundsson and Holloway, 1993), to calculate Dmatte–sil
Pt
over a range of conditions that are pertinent to the uppermantle and crust. We shall show that the very high valuesof Dmatte–sil
PGE calculated by this method require that thehigh-temperature equilibrium between a matte and a sili-cate melt will lead to the matte being greatly enriched in Pt.
2. EXPERIMENTAL METHODS
Three sets of experiments were carried out to evaluatethe effects of T, fO2 and fS2 separately on the solubility ofPt in mattes. For each set of experiments two thermody-namic variables were kept constant while the third wasvaried. The experimental set-up was the same for allexperiments. Each experimental charge consisted of troilite(Fe/S atomic = 1) powder of 99.99% purity placed insidean open capsule made from pure SiO2 glass, and con-tained a loop of Pt wire. The crucibles were suspendedin a vertical muffle tube furnace equipped for gas mixing,in which both fO2 and fS2 were controlled independentlyusing CO2–CO–SO2 gas mixtures. The gas flows weremeasured using Tylan F2800 mass flow controllers. Twocontrollers were available for each gas: for CO and CO2
the controller had ranges between 0–10 and 0–200 SCCM(standard cubic centimeters per minute) and 0–10 and 0–100 SCCM for SO2. The fO2 and fS2 for each run werecalculated using the thermodynamic data for gas speciesin the NIST-JANAF tables (Chase, 1998) according toO’Neill and Mavrogenes (2002). Temperature was heldconstant to ±5� for the duration of each run using a cen-tral Pt–Rh thermocouple external to the muffle tube. Runtimes of 96, 72 and 24 h were used to ensure equilibriumbetween the Pt metal and the mattes in the runs performedat 1200, 1300 and 1400 �C, respectively. Equilibrium wassubsequently tested by analysing Fe and Pt in line profilesthrough sections of the Pt wire and the Pt content of thematte at different run times (between 1 and 96 h) and con-stant fS2 (0.001 bars), fO2 (10�11 bars) and temperature(1200 �C). Profiles of the metal wire at the end of eachrun (Fig. 1A), showed that the wire is strongly zoned atrun times of less than 4 h, and homogeneous after 24 hrun time. The activity of Pt is higher in the beginning ofa run because Fe has not diffused completely into the me-tal wire. This led to the zonation of the metal wire withrespect to Pt (Fig. 1A), and higher concentrations of Ptin the matte (Fig. 1B) at 1 and 4 h of run time. However,after 24 h of run time, the metal wire reaches its equilib-rium Fe and Pt contents, (Fig. 1A), and displays a con-
stant Pt solubility in the matte over time (Fig. 1B). Atthe end of each run the charges were quenched by drop-ping them into a beaker of water at room temperature.The experimental products were then recovered, mountedin epoxy resin and polished for analysis.
3. ANALYTICAL METHODS
3.1. Petrographical description
Unlike many silicate liquids, mattes do not quench to aglass but to a texturally complex mass of crystalline sul-phide, metals and oxides, depending on the composition,requiring special care in determining the composition ofthe original matte.
Fig. 2B is a Pt X-ray map of a typical quenched exper-imental run, which shows that a Pt metal phase exsolvesfrom the matte during quenching. In addition, a depletionhalo, �40 lm wide, formed around the original Pt-rich

Fig. 2. (A) Pt X-ray map of run PtO11 for Pt. The original Pt metal (in the top center) is surrounded by a depletion halo (1) where no Pt isobserved due to Pt diffusion into the Pt wire during quenching. The sulphide phase includes quench nuggets of PtFe metal (2) which exsolvedfrom the matte during quenching. (B) Backscatter electron image of run PtS1. This is a typical run product where nuggets of PtFe are rosetteshaped indicating they are a product of quenching.
Solubility of Pt in sulphide mattes 5767
metal upon quenching. A closer look at the PtFe quenchnuggets shows typical quench textures (Fig. 2B), whichindicates that these nuggets are the result of exsolutionof dissolved Pt in the matte. The scale of the quench tex-tures also varies depending on which part of the charge isconsidered. The quench nuggets tend to be larger near thecenter of the crucible because quenching is slower. More-over, the shape of the quench nuggets is dependent on thefS2 of the run, which controls the speciation of Pt in thematte. Any measurement of the Pt content of the mattehas to include these Pt-rich quench nuggets, as they repre-sent Pt that was dissolved in the matte prior to quenching.This requires the experiments to be performed at a scalesufficiently large to produce areas of quenched sulphidesuitable for representative analyses.
3.2. Electron microprobe analysis – major elements
Both sulphide and metal phases were analysed usingthe CAMECA-SX100 Electron Microprobe, in wave-length dispersive mode (WDS), with 15 kV accelerationvoltage and 20 nA beam current. The alloys were ana-lysed using line profiles across the wire, and the sulphidesas area scans in 300 lm � 300 lm grids. Standard calibra-tions were carried out using Pt0.7Rh0.3 metal for Pt andpure troilite for Fe and S. Oxygen was analysed usingthe CAMECA-SX100 EMPA, in WDS mode. Calibra-tions for O were conducted on rutile (TiO2), chromiteand quartz using the PC0 monolayer pseudocrystal, fol-lowing the methodology described in detail in Fonsecaet al. (2008).
5768 R.O.C. Fonseca et al. / Geochimica et Cosmochimica Acta 73 (2009) 5764–5777
3.3. Laser ablation mass spectrometry (LA-ICP–MS) – trace
elements
LA-ICP–MS was used for trace element analysis in thesulphide phase, following the procedure described by Fons-eca et al. (2007) with 57Fe as the internal standard. Thestandard used was the CANMET727T2 synthetic PGEand Au bearing FeS from the Memorial University of New-foundland. The spot size for all analyses was 112 lm, thelaser repetition rate was 5 Hz, and the laser pulse energywas 120 mJ with �75% energy loss, resulting in a fluenceof �265 J cm�2. The Pt isotopes 194Pt, 195Pt and 196Pt wereanalysed, which produced results in good agreement witheach other, showing that there were no significant interfer-ences from other isotopes or molecular compounds. Plati-num metal has a very low vapor pressure when comparedto mattes. It is therefore possible that, during ablation ofthe sample, Pt alloys may not ablate at the same rate asthe matte matrix, resulting in lower measured Pt concentra-tions. This possibility was tested by measuring Pt contentsin matte over a range of laser pulse energies, between�25 mJ (100 mJ laser output, filtered by 25% optical mir-ror), and 160 mJ (no transmission loss). The measured Ptconcentrations in mattes were constant over the range of la-ser pulse energies used, indicating that Pt alloys are notfractionated relative to Fe and S in the matte duringablation.
4. THEORETICAL BACKGROUND
The solubility of Pt in mattes requires an understandingof the effects of several competing variables, the mostimportant of which are likely to be temperature, fS2 andfO2. Platinum could dissolve in a matte as oxide, sulphideand metal species, with solution reactions taking the follow-ing form:
Ptsolid þx4
S2 ¼ PtðþxÞSx2matte ð1Þ
Ptsolid þx4
O2 ¼ PtðþxÞOx2matte ð2Þ
Ptsolid ¼ Ptmatte ð3Þ
where x is the effective valence state of Pt in the matte. Thecommon valence state of Pt in silicate melts in the oxygenfugacity regime of the terrestrial upper mantle appears tobe Pt2+, but Pt4+ occurs at higher fO2 (O’Neill et al.,1995; Ertel et al., 1999), and is the common higher oxida-tion state of Pt in many chemical compounds. Any changein valence must profoundly affect the solubility of Pt inmattes, and experiments that do not address his mostimportant aspect of PGE chemistry cannot be extrapolatedto natural systems reliably.
5. RESULTS
5.1. Activities of Fe and Pt in the metal phase
The major element composition of mattes and alloys, aswell as the experimental run conditions, are presented inTable 2. The results show that the Pt-rich metal phase in
equilibrium with the sulphide-rich matte in the experimen-tal runs display varying concentrations of Fe, whichchanges the activity of Pt (ametal
Pt ) in the system Fe–Pt–S–O. The Pt–Fe binary shows a very strong negative deviationfrom Henry’s law (Gudmundsson and Holloway, 1993;Okamoto, 2002). Since the majority of the (Pt,Fe) alloysobtained in the experimental runs in this study fell withinthe face-centered cubic continuous solid solution (c-phase)field in the FePt phase diagram, the activities of Pt and Fein the metal were calculated from the equations ofGudmundsson and Holloway (1993):
log cFe ¼ ð1� X FeÞ2½Bþ Cð4X Fe � 1Þ� ð4Þlog cPt ¼ X 2
Fe½Bþ Cð4X Fe � 3Þ� ð5Þ
where cPt and cFe are the activity coefficients of Pt and Fe,respectively, XFe is the mole fraction of Fe in the metal, andB and C are temperature-dependent constants. Gudmunds-son and Holloway (1993) only determined B and C for thetemperatures of 1300 and 1400 �C. Since our experimentalruns were also conducted at 1200 �C, the values for theseconstants were linearly extrapolated to lower temperaturesfollowing Pruseth and Palme (2004), yielding:
B ¼ 0:0062T � 12:302 ð6ÞC ¼ 0:0017T � 2:565 ð7Þ
A listing of all activity coefficients and activities of Ptand Fe is provided in Table 3. Measured concentrationsof Pt in the matte may be normalised to unit activity ofPt in the alloy (i.e., ametal
Pt ¼ 1) using ½Pt�a normmatte ¼
½Pt�matte=ametalPt ½Pt� (Table 3).
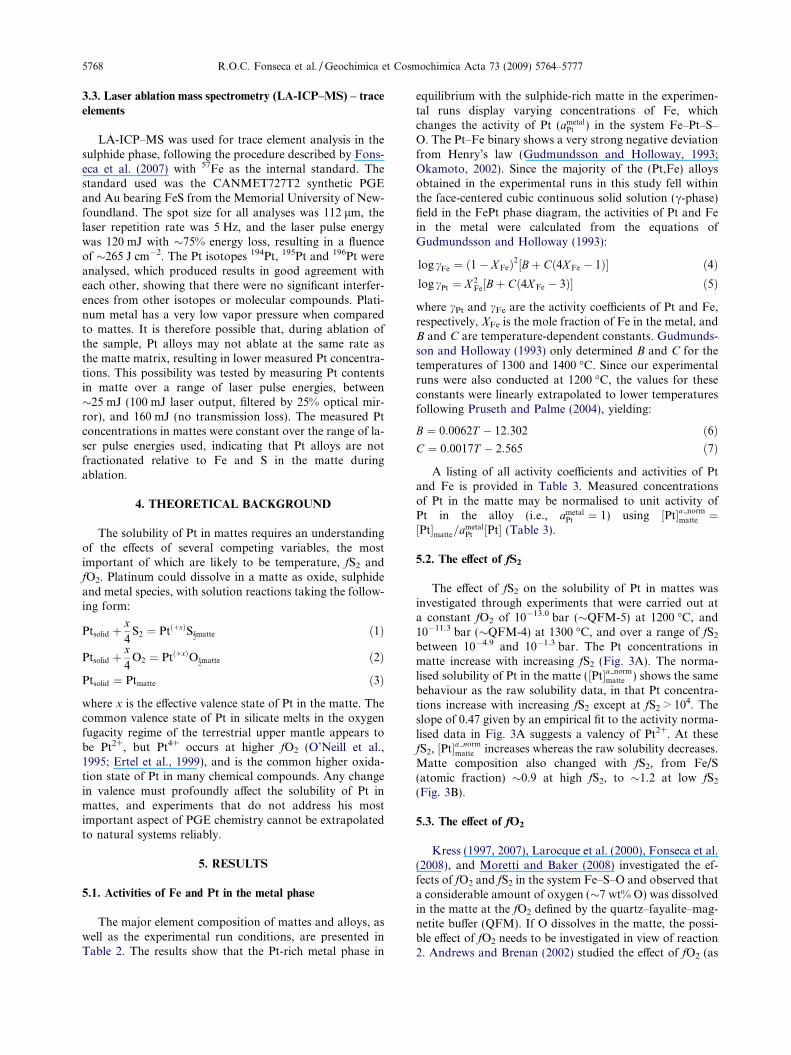
5.2. The effect of fS2
The effect of fS2 on the solubility of Pt in mattes wasinvestigated through experiments that were carried out ata constant fO2 of 10�13.0 bar (�QFM-5) at 1200 �C, and10�11.3 bar (�QFM-4) at 1300 �C, and over a range of fS2
between 10�4.9 and 10�1.3 bar. The Pt concentrations inmatte increase with increasing fS2 (Fig. 3A). The norma-lised solubility of Pt in the matte (½Pt�a norm
matte ) shows the samebehaviour as the raw solubility data, in that Pt concentra-tions increase with increasing fS2 except at fS2 > 104. Theslope of 0.47 given by an empirical fit to the activity norma-lised data in Fig. 3A suggests a valency of Pt2+. At thesefS2, ½Pt�a norm
matte increases whereas the raw solubility decreases.Matte composition also changed with fS2, from Fe/S(atomic fraction) �0.9 at high fS2, to �1.2 at low fS2
(Fig. 3B).
5.3. The effect of fO2
Kress (1997, 2007), Larocque et al. (2000), Fonseca et al.(2008), and Moretti and Baker (2008) investigated the ef-fects of fO2 and fS2 in the system Fe–S–O and observed thata considerable amount of oxygen (�7 wt% O) was dissolvedin the matte at the fO2 defined by the quartz–fayalite–mag-netite buffer (QFM). If O dissolves in the matte, the possi-ble effect of fO2 needs to be investigated in view of reaction2. Andrews and Brenan (2002) studied the effect of fO2 (as

Table 2Experimental conditions and major and trace element concentrations.
Run Run conditions Composition of the sulphide matte X metalPt
�log fS2 �log fO2 Pt/FeSa T (�C) Run time (h) Fe (wt%) S (wt%) O (wt%) Pt (ppm) Total (wt%)
Pt1h 2.94 10.9 0.2 1200 1 63.9 ± 0.3 33.2 ± 0.1 0.8 ± 0.2 11204 ± 1512 99.0 0.65Pt4h 2.94 10.9 0.2 1200 4 62.3 ± 0.2 36.4 ± 0.3 1.5 ± 0.3 17103 ± 3210 101.9 0.83Pt24h 2.94 10.9 0.2 1200 24 59.1 ± 0.4 36.7 ± 0.8 1.6 ± 0.1 11488 ± 948 98.6 0.53Pt48h 2.94 10.9 0.2 1200 48 58.2 ± 0.4 39.8 ± 0.1 2.4 ± 0.4 6146 ± 675 101.0 0.52Pt96h/PtO11 2.94 10.9 0.2 1200 96 64.1 ± 0.1 33 ± 0.4 3.5 ± 0.2 6234 ± 1567 101.2 0.54PtO9b 3.05 9.0 0.2 1200 96 52.8 ± 0.5 6.1 ± 1.1 29.8 ± 0.8 3 ± 2 88.7 0.88PtO10 2.94 10.3 0.2 1200 96 64.8 ± 0.1 27.4 ± 0.2 6.91 ± 0.5 3189 ± 122 99.4 0.52PtO11/Pt96h 2.94 10.9 0.2 1200 96 64.1 ± 0.2 33.0 ± 0.3 3.46 ± 0.4 3785 ± 39 100.9 0.51PtO12 2.24 11.8 0.2 1200 96 64 ± 0.1 32.6 ± 0.4 2.1 ± 0.1 6898 ± 916 99.4 0.52PtO13/PtS3 2.94 12.9 0.2 1200 96 64.6 ± 0.5 34.2 ± 0.2 0.5 ± 0.1 6112 ± 1121 99.9 0.49PtO15 3.05 14.9 0.2 1200 96 60.9 ± 0.6 35.2 ± 0.2 bdlc 25354 ± 375 98.6 0.5PtS1/PtH2 1.31 11.8 0.2 1200 96 58.5 ± 0.4 35.1 ± 0.6 0.2 ± 0.1 62927 ± 1939 100.1 0.63PtS2 2.21 12.9 0.2 1200 96 62.9 ± 0.1 34.9 ± 0.5 0.2 ± 0.1 26525 ± 715 100.7 0.6PtS3/PtO13 2.94 12.9 0.2 1200 96 64.6 ± 0.2 34.2 ± 0.4 0.3 ± 0.1 6112 ± 1121 99.7 0.49PtS4 3.96 12.8 0.2 1200 96 66.1 ± 0.4 33.6 ± 0.1 0.4 ± 0.1 1665 ± 273 100.3 0.42PtS5 4.96 13.1 0.2 1200 96 66.0 ± 0.9 32.5 ± 0.1 1.5 ± 0.3 816 ± 259 100.0 0.33PtH1 2.21 13.1 0.1 1200 96 64.1 ± 1.1 35.2 ± 0.4 bdl 7700 ± 529 100.1 0.51PtH2 1.31 11.8 0.2 1200 96 58.5 ± 0.5 35.1 ± 0.3 bdl 62967 ± 1263 99.9 0.7PtH3 2.21 12.9 1.0 1200 96 57.9 ± 0.1 34.6 ± 0.5 bdl 62927 ± 1939 98.8 0.8Pt#1 1.61 11.3 0.2 1300 72 58.4 ± 0.1 34.8 ± 0.1 0.2 ± 0.1 55622 ± 2491 99.0 0.62Pt#2 1.81 11.3 0.2 1300 72 60.2 ± 0.2 33.9 ± 0.1 0.3 ± 0.2 45000 ± 3741 98.9 0.6Pt#3 2.10 11.3 0.2 1300 72 61.4 ± 0.5 34.1 ± 0.3 0.9 ± 0.3 30650 ± 4030 99.5 0.57Pt#4 2.48 11.4 0.2 1300 72 63.5 ± 0.1 33.6 ± 0.1 0.6 ± 0.1 17807 ± 2167 99.5 0.54Pt#5 2.84 11.4 0.2 1300 72 64.4 ± 0.1 33.1 ± 0.2 1.5 ± 0.2 8500 ± 674 99.9 0.5Pt#6 3.15 11.2 0.2 1300 72 64.5 ± 0.3 31.7 ± 0.6 2.0 ± 0.2 6573 ± 386 98.9 0.48Pt#7 3.64 11.4 0.2 1300 72 63.5 ± 0.8 33.8 ± 0.2 2.1 ± 0.5 6027 ± 661 100.0 0.5Pt#8 3.05 13.7 0.2 1300 72 63.7 ± 0.1 34.4 ± 0.8 0.5 ± 0.3 12210 ± 679 99.8 0.5Pt#9 2.88 12.7 0.2 1300 72 63.3 ± 0.4 34.2 ± 0.3 1.1 ± 0.2 13408 ± 2250 99.9 0.49Pt#10 2.83 10.3 0.2 1300 72 64.5 ± 0.5 30.5 ± 0.1 4.0 ± 0.7 7474 ± 485 99.7 0.52Pt#11c 2.94 9.7 0.2 1300 72 52.9 ± 1.1 5.6 ± 0.9 28.6 ± 0.5 97 ± 2 87.1 0.54Pt#12 1.58 10.3 0.2 1400 24 59.4 ± 0.7 33.9 ± 0.2 1.1 ± 0.3 41524 ± 6630 98.6 0.59Pt#13 3.88 10.3 0.2 1400 24 61.7 ± 0.2 33.4 ± 0.3 2.8 ± 0.6 27437 ± 3149 100.6 0.57Pt#14 1.61 11.3 0.8 1300 72 59.2 ± 0.1 34.5 ± 0.1 bdl 61227 ± 1564 99.8 0.62Pt#15 1.61 11.3 1.0 1300 72 58.8 ± 0.0 34.0 ± 0.5 bdl 70950 ± 1294 99.9 0.62
a Initial Pt/FeS wt% of the experimental charge.b Reacted extensively with the SiO2 capsule with 11.1 wt% Si dissolved in the matte.c Reacted extensively with the SiO2 capsule with 10.9 wt% Si dissolved in the matte.
So
lub
ilityo
fP
tin
sulp
hid
em
attes5769

Table 3Calculate activity coefficients for Pt in the metal phase and correspondent paritition coefficients.
Run cmetalPt
a ametalPt ½Pt�a norm
matte (wt%)b ½Pt�sil–melt (ppb)c Dmetal=mattePt Dmetal=sil
Pt Dmatte=silPt
Pt1h 0.327 0.214 5.2 0.0274 77 3.65 � 1010 4.75 � 108
Pt4h 0.79 0.658 2.6 0.0274 55 3.65 � 1010 6.63 � 108
Pt24h 0.111 0.058 19.7 0.0274 69 3.65 � 1010 5.28 � 108
Pt48h 0.1 0.052 11.9 0.0274 127 3.65 � 1010 2.87 � 108
Pt96h/PtO11 0.12 0.064 9.7 0.0274 130 3.65 � 1010 2.80 � 108
PtO10 0.102 0.053 6 0.07901 251 1.27 � 1010 5.05 � 108
PtO11/Pt96h 0.094 0.048 7.9 0.0274 206 3.65 � 1010 1.77 � 108
PtO12 0.104 0.054 12.8 0.00995 114 1.01 � 1011 8.78 � 108
PtO13/PtS3 0.077 0.038 16 0.00268 128 3.74 � 1011 2.92 � 109
PtO15 0.086 0.043 58.8 0.00025 32 4.00 � 1012 1.30 � 1011
PtS1/PtH2 0.283 0.179 35.2 0.00995 14 1.01 � 1011 7.07 � 109
PtS2 0.216 0.13 20.5 0.0025 32 4.00 � 1011 1.26 � 1010
PtS3/PtO13 0.077 0.038 16 0.00268 128 3.74 � 1011 2.92 � 109
PtS4 0.031 0.013 12.9 0.0025 437 4.00 � 1011 9.17 � 108
PtS5 0.009 0.003 28.4 0.0025 792 4.00 � 1011 5.05 � 108
PtH1 0.09 0.046 16.8 0.0025 104 4.00 � 1011 3.87 � 109
PtH2 0.432 0.301 21 0.00995 14 1.01 � 1011 7.07 � 109
PtH3 0.719 0.578 10.9 0.0025 15 4.00 � 1011 2.71 � 1010
Pt#1 0.28 0.172 32.3 0.02458 15 4.07 � 1010 2.68 � 109
Pt#2 0.248 0.148 30.4 0.02458 18 4.07 � 1010 2.20 � 109
Pt#3 0.193 0.109 28.1 0.02458 26 4.07 � 1010 1.54 � 109
Pt#4 0.152 0.082 21.8 0.02458 45 4.07 � 1010 9.01 � 108
Pt#5 0.109 0.055 15.6 0.02458 93 4.07 � 1010 4.37 � 108
Pt#6 0.092 0.044 14.8 0.02458 118 4.07 � 1010 3.44 � 108
Pt#7 0.106 0.053 11.4 0.02458 130 4.07 � 1010 3.12 � 108
Pt#8 0.105 0.052 23.4 0.00157 64 6.37 � 1011 9.99 � 109
Pt#9 0.093 0.045 29.8 0.00514 58 1.95 � 1011 3.39 � 109
Pt#10 0.128 0.066 11.3 0.08234 107 1.21 � 1010 1.14 � 108
Pt#12 0.268 0.158 26.3 0.0814 20 1.23 � 1010 6.12 � 108
Pt#13 0.235 0.134 20.5 0.0814 30 1.23 � 1010 4.08 � 108
Pt#14 0.29 0.179 34.1 0.02458 14 4.07 � 1010 2.90 � 109
Pt#15 0.291 0.181 39.3 0.02458 12 4.07 � 1010 3.34 � 109
a Calculated from Eq. (5).b Pt concentration in the matte normalised to unit activity – ½Pt�matte=ametal
Pt .c Calculated from Ertel et al. (1999) and corrected for temperature using Fortenfant et al. (2003).
5770 R.O.C. Fonseca et al. / Geochimica et Cosmochimica Acta 73 (2009) 5764–5777
well as fS2) on the solubility of Ru in matte and found thatincreasing fO2 decreased the solubility of Ru. They sug-gested that the observed negative correlation between Rusolubility and fO2 shows that Ru oxide is not a species inthe matte and that the addition of oxygen raises cmatte
Ru . Morerecently, Fonseca et al. (2007) showed that Re solubility insulphide-rich matte has no obvious dependence on fO2, ex-cept at fO2 larger than �10�10 bar where solubility de-creases sharply due to the formation of an oxide-rich matte.
The influence of fO2 on the solubility of Pt in mattes wasinvestigated through a series of experiments that were car-ried out at a nearly constant fS2 of �10�3.0 bar and overa range of fO2, between 10�14.9 and 10�9.0 bar (QFM-6.6and QFM-0.8) at 1200 �C and between 10�13.7 and10�9.6 bar (QFM-6.4 and QFM-2.3), at 1300 �C. The con-centration of Pt in matte showing no clear dependence onfO2, except at fO2 > 10�10 bar when solubility decreasessharply to less than 100 ppm (Fig. 4A), indicating that Ptdoes not dissolve as an oxide component as in reaction 2.The sharp decrease in Pt solubility in matte atfO2 > 10�10 bar is probably due to the increasing amountsof oxygen dissolving into the matte at the expense of sul-
phur, decreasing the amount of sulphur in the matte avail-able to react with Pt (reaction 1). The matte also gets moremetallic as fO2 decreases which is shown by the higher Fe/(S + O) of the matte a lower fO2 (Fig. 4B).
5.4. The Pt–Fe–(S + O) pseudo-ternary
The concentration of Pt, in both metal and sulphidephases, can be plotted on the Fe–Pt–(S + O) pseudo-ter-nary diagram (Fig. 5). The results agree with the ternaryplots of Pruseth and Palme (2004) at 1200 and 1300 �C.Majzlan et al. (2002) and Pruseth and Palme (2004)observed that there is a direct correlation between high Ptconcentrations in the matte and Pt contents of the alloysin equilibrium with the matte, for runs carried out at vari-able fS2 (Fig. 5). The chemographic trend shown in theclose ups in Fig. 5 suggests that Pt might dissolve into themelt as PtS, a well known Pt-bearing phase, with a valenceof Pt2+, which is consistent with the good fit between theplotted data and the slope of the FeS–PtS binary seen inFig. 3. The dissolution of Pt in the sulphide-rich matte asPtS is not surprising considering that the free energy of for-

-log fS2
1.2
1.1
1.0
0.91 2 3 4 5
1200ºC1300ºC
Fe/S
in m
atte
(at%
)A
B
1200ºC1300ºC
[Pt]1200ºC1300ºC
log
[Pt]
in m
ate
(ppm
)6
Troilite
a normalizedmatte [Pt]matte
5
4
3
Pt0
Pt2+
Fig. 3. Pt concentrations in matte in equilibrium with Pt metal atdifferent fS2 and constant fO2 at 1200 and 1300 �C. Pt concentra-tions were normalised to unit activity of Pt because theseexperiments had significant amounts of Fe in the metal phase,therefore ½Pt�a norm
matte ¼ ½Pt�matte=ametalPt . Error bars (2r standard error)
in log plot smaller than symbols. (B) Fe/S (at%) as a function offS2. Because the experimental system is an open one, mattecomposition changes over the range of fS2 studied. Such a variationis demonstrated by the Fe/S (at%) of the matte, which approachesunity at high fS2.
101
102
103
104
105
106
1200ºC1300ºC
1200ºC1300ºC
-log fO2
0.08 9 13 151410 11 12
0.2
0.4
0.6
0.8
1.0
1200ºC1300ºC
B
A
-logfS =3.02
[Pt]a normalizedmatte [Pt]matte
[Pt]
in m
atte
(ppm
)Fe
/(S+O
) in
mat
te (a
t%)
Fig. 4. (A) Pt concentrations in matte at different fO2, constant fS2
and 1200–1300 �C. Note that there is a small negative dependenceof Pt contents on fO2 until at higher fO2 when Pt solubilitysuddenly drops. Error bars (2r standard error) smaller thansymbols. (B) The metallic character of the matte (FeS + O)decreases with increasing fO2.
Solubility of Pt in sulphide mattes 5771
mation of PtS, over the range of temperatures studied, is al-most an order of magnitude lower than that of PtS2, whichis not a known natural phase (Barin, 1989).
In runs where oxygen fugacity was varied, no such cor-relation is observed, because Pt does not dissolve as anoxide component as in reaction 4. According to Raghavan(1988), three distinct alloys are stable at the temperature of1200 �C, a c phase which represents a continuous solidsolution between Fe and Pt, and two ordered phases, FePt,and FePt3, representing miscibility gaps. At 1300 �C, only cand FePt3 are present. All but one of the PtFe alloys ana-lysed to date fall within or at the boundary of the c field.No significant difference was found in Pt solubility mea-surements in matte, between 1200 and 1300 �C, showingthat temperature is not an important factor over the rangestudied, and therefore will not be considered further.
5.5. Platinum solubility in mattes and DmattesilPt
Previous experimental measurements of Pt solubility insilicate melts were obtained from Fe-free anorthite-diopside
eutectic melts (Borisov and Palme, 1997; Ertel et al., 1999;Fortenfant et al., 2003). Moreover, as shown in Fig. 3B,matte composition, i.e., its molar Fe/S, changes as a func-tion of fS2 and fO2. It is therefore desirable to derive anexpression that describes the partitioning of Pt betweenmatte and silicate melt as a function of fS2 and fO2, whichis independent of the Fe content of the two phases. Fromthe Fe–(S + O)–Pt ternary phase diagram (Fig. 5A andB), it was established that Pt should dissolve into the sul-phide-rich matte as PtS according to the reaction:
Ptmetal þ 1
2S2ðgÞ ! PtSmatte ð8Þ
for which the equilibrium is:
�DGð8ÞRT
¼ ln amattePtS �
1
2ln f S2 � ln aPt ð9Þ
Because Pt dissolves in silicate melt at geologically rele-vant redox conditions as Pt2+ (Borisov and Palme, 1997;Ertel et al., 1999; Fortenfant et al., 2003):
Ptmetal þ 1
2O2ðgÞ ! PtOsil ð10Þ
�DGð10ÞRT
¼ ln asilPtO �
1
2ln f O2 � ln aPt ð11Þ

53
48
(S+O)
PtFe
PtS
PtS2
20 40 60 80 1000
100
80
60
40
20
0
20
40
60
80
100
0
(S+O)
PtFe
PtS
PtS2
20 40 60 80 1000
100
80
60
40
20
0
20
40
60
80
100
0
1200ºC
1300ºC
53
48
PtS2
PtS
PtS2
PtS
Fig. 5. Compositions of the matte plotted on the Fe–Pt–(S + O) ternary at 1200 �C (A) and 1300 �C (B). Tie lines connect the equilibriumcompositions of matte to the corresponding metal. Solid lines represent binary systems (e.g., FeS–PtS). In both cases, the more Pt-richsulphides appear to follow a path along the FeS–PtS binary.
5772 R.O.C. Fonseca et al. / Geochimica et Cosmochimica Acta 73 (2009) 5764–5777
Subtracting Eq. (11) from Eq. (9) eliminates aPt, to give:
ln asilPtO � ln amatte
PtS ¼ �DGð10Þ þ DGð8ÞRT
þ 1
2ln f O2
þ 1
2ln f S2 ¼ ln
X silPtOcsil
PtO
X mattePtS cmatte
PtS
� �ð12Þ
The partition coefficient of Pt between matte and silicatemelt is defined as:
Dmatte=silPt ¼ ln
X mattePt
X silPt
!ð13Þ
The effect of Fe on the solubility of Pt in matte can beeliminated by normalizing the solubility of PtS in the matteto unit activity of Pt, using the appropriate values for amatte
Pt
from Table 3. An expression can then be derived to calcu-late the molar fraction of PtS in the matte (at unit activity)as a function of fS2 amatte
Pt ¼ 1.
aPt ¼ 1 ! DGð8ÞRT
� ln cmattePtS
� �¼ ln X matte
PtS � ln f S2 ð14Þ
The equation above shows that if we plot activity nor-malised ln X matte
PtS as a function of ln f S2, the y intercept in
this plot is DGð8ÞRT � ln cmatte
PtS , which in this case equals
�0.346 (Fig. 6). Moreover, the slope of the fit shown inFig. 6 is �1/2, which is the expected value when Pt dissolvesin the matte as PtS. Therefore:
ln X mattePtS ¼ 0:47 ln f S2 � 0:346 ð15Þ

Solubility of Pt in sulphide mattes 5773
The solubility of Pt in a silicate melt at 1300 �C can bedescribed by the following equation Ertel et al. (1999):
½Pt�silðppbÞ ¼ 2100f O2 þ 10980f O1=22 ð16Þ
From Eq. (16), the molar fraction of PtO in the silicatemelt can be calculated as a function of fO2. This proceduregives �DGð10Þ
RT � ln csilPtO ¼ �12:5 and a slope of 0.5, yielding:
ln X mattePtO ¼ �DGð10Þ
RT� ln csil
PtO
� �
¼ ln X silPtO �
1
2ln f O2 ¼ 12:5 () ln X sil
PtO
¼ 1
2ln f O2 � 12:5 ð17Þ
Eqs. (15) and (17) can be combined to derive an equa-tion for Dmatte–sil
Pt as a function of both fS2 and fO2 at unitactivity of Pt:
ln Dmatte=silPt ¼ Q 0:47 ln f S2 �
1
2ln f O2 þ 12:15
� �ð18Þ
where Q is a constant to convert fromX matte
PtS
X silPtO
intoX matte
Pt
X silPt
.
5.6. Extrapolation to natural systems: possible effects of S
and Fe
Eq. (18) is derived by combining our results on Pt solu-bility in Fe–S–O mattes with experiments on the solubilityof Pt in simple-system silicate melts that lack both Fe andS, two elements that have a strong geochemical affinityfor Pt. This raises the question of whether these two ele-ments, when present at their normal abundance in naturalsilicate melts, can affect the solubility of Pt sufficiently toinvalidate our approach. The matter was considered byO’Neill et al. (1995), who concluded that the effects of nei-ther Fe nor S would be large. As there have been severaldevelopments since 1995 that add weight to this conclusion,it is worth recapitulating the arguments here.
The thermodynamics of S dissolving as sulphide (S2�) insilicate melts are well understood (see discussion in O’Neill
-2 -4 -6 -8 -10 -12
ln Sf 2
X PtS
ln
ln X = 1/2 ln S -0.3462fPtSmatte
-4
0
-5
-6
-7
-3
-2
-1
0
mat
te
Fig. 6. Molar fraction of PtS in matte as a function of fS2.
and Mavrogenes (2002)). Under moderate to low oxygenfugacities, such as are appropriate for terrestrial basalts,S2� dissolves by replacing O2� on the anion sublattice, asshown experimentally by the variation of S solubility with(fO2/fS2)1/2, which relationship has been found valid forevery composition of silicate melt investigated, both Fe-containing and Fe-free (O’Neill and Mavrogenes, 2002).This relationship allows one to define a sulphide capacityCS:
ln CS ¼ ln½S� þ 1=2 lnðf O2=f S2Þ ð19Þ
It has been shown experimentally that dependence of CS
on the composition of the melt is given by a relationship ofthe form:
ln CS ¼ A0 þX
M
X MAM ð20Þ
where XM are the mole fractions of cations M in the silicatemelt, and the coefficients AM are related to the difference inthe chemical potentials of the components MzO and MzS inthe silicate melt, which are in turn expected to be related, atleast approximately, to the standard chemical potentials ofthe component oxide (or silicate) and sulphide, i.e.:
AM ¼ ðlMzO � lMzSÞ=RT þ constant ð21Þ
(for a full derivation, see O’Neill and Mavrogenes, 2002,their Eqs. 6 to 19). This relationship shows qualitativelythat the reason why Fe has such a strong influence on sul-phide solubility in silicate melts is simply because FeS ismore stable, thermodynamically, than FeO (O’Neill andMavrogenes, 2002). Evans et al. (2008) have recently pre-sented the experimental evidence for a similar relationshipfor some other chalcophile elements, namely Mn, Ni andCu.
This experimentally tested thermodynamic modeldescribing the effect of a cation M2z+ in a silicate melt onS2� solubility may be inverted rigorously (i.e., via theGibbs–Duhem relationship) to calculate the influence ofS2� in the silicate melt on the activity coefficient of MzO.Although we cannot use this approach to calculate the ef-fect of S2� on PGE components because the solubilitiesof PGE cations in silicate melts are not great enough tohave a discernible influence on S solubilities, this approachnevertheless permits the question to be posed in a way thatis amenable to quantitative reasoning. As pointed out inO’Neill et al. (1995 – see his Eqs. 13 and 14), the changein the activity coefficient of the component PtxO in the sil-icate melt from substitution of S2� for O2� on the anionsublattice, relative to its activity in S-free melt of otherwisethe same composition, is given by:
cmelt;þSPtxO =cmelt;no S
PtxO ¼ expX
M
X MX SDlPt–Mrec =RT
( )ð22Þ
where DlPt–Mrec ¼ðlPtxO�lPtxSÞ�ðlMzO�lMxSÞ;
PMX M¼ 1,
and XS is the fraction of S2� on the anion sublattice. Fora silicate melt with 1000 ppm S and 45 wt% O,XS = 0.001. The question then boils down to what is a phys-ically reasonable range in which values of Dlrec may fall?From the experimental S2� solubility measurements sum-marized in Table 12 of O’Neill and Mavrogenes, 2002),

5774 R.O.C. Fonseca et al. / Geochimica et Cosmochimica Acta 73 (2009) 5764–5777
we find that values of cations with the largest interactionswith S, namely Fe2+ and Mn2+, have values of AFe andAMn that are �20 relative to non-chalcophile cations likeCa2+ and Mg2+ (i.e., AFe–ACa, �20, etc. – see Table 12 inO’Neill and Mavrogenes, 2002). If we adopt this extremevalue for Pt then we obtain cmelt;þS
PtxO =cmelt;no SPtxO �
expf20� 0:001g, or 2%, which is trivial given that even afactor of 10 change in csil
PtO would not effect our arguments.Note that the thermochemical data for PtO2 and PtS2
(Barin, 1989) suggest values of Dlrec/RT that are actuallymuch less 20, so even the 2% is likely to be overestimated.
In considering the possible effect of adding Fe to thesimple-system silicate melts, we note first that there is noth-ing in the known chemical properties of PGE cations to ex-pect any strong chemical interactions with Fe2+ (or Fe3+).The chemical properties of ionic substances are of coursequite different from those of the elements from which theyform, so there is no rational reason to expect that the largeinteractions between Pt and Fe in the metallic state shouldcarry over into interactions between Ptx+ and Fe2+ in sili-cate melts. Ternary oxide compounds involving Ptx+ andFe2+ are not known, so there is no reason to suppose thatthey might be unusually stable. Unlike for S, there is nowsome experimental evidence for whether the presence ofFe in a silicate melt has a noticeable effect on the solubilitiesof some other PGEs, although Pt itself has not been studiedexplicitly. The issue was briefly reviewed by Borisov andPalme (2000), who quote direct evidence from the experi-mental study of Borisov et al. (1992), which demonstratedno difference in Ir solubilities between Fe-free melts andthose containing up to 20 wt% ‘‘FeO” (total Fe as FeO),whereas the study of Capobianco and Hervig (1996) foundonly a modest effect of Fe on Pd solubilities. Since then,Brenan et al. (2005) have studied the solubilities of Ir, Osand Au in high-FeO melts using laser-ablation ICP–MSas the analytical method, which of course has the advantagethat nanonuggets would be detected if present. This studyshows convincingly from nugget-free experiments that thesolubilities of these elements are comparable to, or lowerthan, those in Fe-free compositions. The lower solubilityof Ir found by Brenan et al. (2005) in their melts comparedto O’Neill et al. (1995) in Fe-free anorthite-diopside eutecticmelt is likely due to the much higher concentration of CaOin the latter, since basic oxide components like CaO are ex-pected to enhance the solubility of high-valence cations likeIr3+ (e.g., O’Neill and Eggins, 2002). The lack of any effectof FeO on the solubility of Re, another Highly SiderophileElement, has recently been documented by Mallmann andO’Neill (2007).
6. DISCUSSION
As discussed previously, the assumption that Dmatte–silPt
lies appreciable below the value required for the magmatichypothesis for Pt-rich ore deposits has lead to a number ofad hoc models to explain the origin of Pt-rich horizons inlayered mafic intrusions (e.g., the Merensky Reef). How-ever, our results as well as those from Pruseth and Palme(2004) have shown that Dmatte–sil
Pt is larger than previous esti-mates by up to five orders of magnitude. The likely expla-
nation is that the previous estimates were compromisedby unrecognized nanonugget contamination, as they wereperformed under conditions that are in no significant waydifferent from our experiments in which the equilibrium sol-ubility of PGEs is completely obscured by nanonuggets.The nanonugget contamination is clearly revealed by la-ser-ablation ICP–MS analysis.
Our high calculated Dmatte–silPt values are in good agree-
ment with calculated values for other PGE (Ru – Andrewsand Brenan, 2002; Os – Brenan, 2008). Here we discusssome of the implications of very high Dmatte–sil
Pt , and conse-quent high enrichment of a matte in Pt, to the enrichmentmodels used to explain PGE-rich horizons associated withmafic intrusions.
6.1. The relationship between the matte/silicate-melt mass
ratio (R), and DmattesilPt
The difference between the Dmatte–silPt proposed in this
study, and the much lower values proposed earlier by Helzand Rait (1988), Peach et al. (1990, 1994), Stone et al.(1990), Fleet et al. (1991, 1996), and Crocket et al. (1997),has implications for genetic models for Pt-rich horizons inlarge layered intrusions such as the Merensky Reef. If anelement i partitions between a sulphide-rich matte and a sil-icate melt of finite volume, it can be shown that the concen-tration of i in the matte (Yi) is given by (Campbell andNaldrett, 1979):
Y i ¼ X 0i DiðRþ 1Þ=ðRþ DiÞ ð23Þ
where X 0i is the original concentration of i in the silicate
melt, R is the silicate-melt/sulphide-matte mass ratio, andDi the distribution coefficient of i between sulphide-richmatte and silicate melt. Re-arranging the equation in termsof R yields:
R ¼ ½DiðY i=X i � 1Þ�=½Di � Y i=X 0i � ð24Þ
where Y i=X 0i is the apparent partition coefficient for the ele-
ment i, called here the empirical partition coefficient (Dai ).
Substituting Dai into equation 24 yields:
R ¼ ½DiðDai � 1Þ�=½Di � Da
i � ð25Þ
From Eq. (24), R can be plotted as a function of Di fordifferent values of Da
i (Fig. 7). Three observations can bemade from Fig. 7:
(1) When Di > 10R, R � Dai , and independent of Di;
(2) When R 6 Di 6 10R, Dai depends on both Di and R;
(3) When Di < 10R, Dai depends on Di and is indepen-
dent of R.
DaPt for the Merensky Reef is between 104 and 105 (e.g.,
Campbell et al., 1983). When Dmatte–silPt is significantly smal-
ler than 105 (Helz and Rait, 1988; Peach et al., 1990, 1994;Stone et al., 1990; Fleet et al., 1991, 1996; Crocket et al.,1997), then Da
Pt will depend on Dmatte–silPt . On the other hand,
if Dmatte–silPt is much larger than Da
Pt, (this study, Pruseth andPalme, 2004; Bezmen et al., 1991), then Da
Pt equals R and isindependent of Dmatte–sil
Pt .

Solubility of Pt in sulphide mattes 5775
6.2. Should elemental PGE ratios in magmatic sulphides
reflect differences in their DmattesilPGE ?
It has been noted that the Pt/Pd of the Merensky Reefsulphides is equal to the ratio of the silicate melt it sepa-rated from (Davies and Tredoux, 1985). It has been arguedthat because Dmatte–sil
Pt is unlikely to be equal to Dmatte–silPd , the
observation that (Pt/Pd)matte � (Pt/Pd)sil is inconsistentwith a magmatic hypothesis for the Merensky Reef sulp-hides (Ballhaus and Ryan, 1995). This argument is validonly if Dmatte–sil
Pt and Dmatte–silPd < R. However if Dmatte–sil
Pt andDmatte–sil
Pd >> R, it can be shown (see Eq. (27) below) thatthe Pt/Pd in the matte is approximately equal to the Pt/Pd of the silicate melt it separated from.
Preliminary experiments where the solubility of Pd inmattes was investigated show that Pd is more compatiblewith the matte with respect to the metal phase than Pt.However, it was not possible to saturate a matte in Pd with-in the range of experimental conditions studied. For thepurposes of this discussion a minimum Dmetal–matte
Pd of 1 willbe assumed. At QFM, Dmatte–sil
Pd ¼ 3� 108 (Borisov et al.,1994). By dividing Dmatte–sil
Pd with Dmetal–mattePd , we obtained a
Dmatte–silPd > 3� 108.
Eq. (23) can be expressed as the ratio between the concen-trations of Pt and Pd in the sulphide-rich matte (YPd/YPt):
Y Pd
Y Pt
¼ X 0PdDmatte–sil
Pd ðRþ 1Þ=ðRþ Dmatte–silPd Þ
X 0PtD
matte–silPt ðRþ 1Þ=ðRþ Dmatte–sil
Pt Þð26Þ
Assuming that (R + 1) � R and because D >> R, then(R + D) � D:
Y Pd
Y Pt
¼ X 0PdDmatte–sil
Pd R=Dmatte–silPd
X 0PtD
matte–silPt R=Dmatte–sil
Pt
ð27Þ
Eq. (27) shows that if both Dmatte–silPt , Dmatte–sil
Pd >> R, thePt/Pd ratio of the sulphide-rich matte is the same as inthe parental silicate magmas and is independent of the dif-ference between Dmatte–sil
Pd and Dmatte–silPt . As a consequence, if
Dmatte–silPt and Dmatte–sil
Pd are both greater than 107, as this studysuggests, the similarity between the Pt/Pd ratio in the
102
104
107
108
DPtmatte/sil
103
D = R=Pta 105
R 105
106
102 103 104 105 106 107
D =Pta 104
D =Pta 103
D =Pta 102
D=Pt a
DPt Matte/sil
Ddepends on both
D
and R
Pta
Ptmatte
/sil
Fig. 7. Dependence of DaPt on R and Dmatte–sil
Pt . If Dmatte–silPt < R, Da
Pt
depends on Dmatte–silPt . If Dmatte–sil
Pt > R, DaPt depends on R and is
independent of Dmatte–silPt .
Merensky Reef and the silicate melt it crystallised from can-not be used to argue against an magmatic origin for PGE-rich horizons in layered intrusions, but rather providesstrong evidence in support of this hypothesis.
6.3. Matte/silicate-melt equilibrium as the primary cause for
PGE enrichment in mafic layered intrusions
Our high-temperature, supra-liquidus experiments showthat the partition coefficients for Pt and the other PGE intosulphide mattes are well above the level required for themagmatic hypothesis to explain the PGE enrichment inPt-rich horizons in layered intrusions. However, the highlychalcophile nature of Pt and other PGE in magmatic sys-tems does not preclude the possibility that sulphides andPGE may be remobilized under subsolidus or near solidusconditions by deuteric or metasomatic fluids. Remobiliza-tion of sulphides by late stage fluids would undoubtedlymodify the primary sulphide textures found in PGE-richhorizons in layered intrusions. The action of late fluidswould be felt more strongly by phases with lower meltingpoints, especially those that are soluble in hydrothermal flu-ids. In this respect sulphides are particularly vulnerable,and have been shown to be easily remobilized during lowtemperature metasomatism (e.g., Luguet et al., 2008). Theremobilization of sulphides would leave behind the less mo-bile PGE, more refractory PGE-rich phases (platinumgroup minerals – PGM), giving the appearance that the flu-ids themselves were responsible for the initial enrichment(Godel et al., 2006, 2007). Even though fluids may locallyremobilize the PGE, Wood (1987) in his experimental studyof PGE solubilities in brine-rich fluids, argued that Pt andPd solubilities in fluids are too low to be consistent withthe observed enrichments found in layered mafic intrusions.Moreover, base metals such as, Fe, Cu and Ni were shownto be over an order of magnitude more mobile than thePGE, which would cause an enrichment of base metals overthe PGE. In PGE-rich horizons associated with mafic intru-sions PGE tend to be greatly enriched relative to the basemetals (see for example, Naldrett et al., 1987).
In light of the above discussion, it is possible to reconcilethe textural evidence of metasomatism in mafic layeredintrusions (e.g., Mathez, 1995), with the primary enrich-ment in Pt, at supra-liquidus conditions, of a sulphide-richmatte relative to a silicate melt.
ACKNOWLEDGMENTS
We would like to thank Michael Shelley and Charles Magee, forproviding invaluable assistance during ELA-Q-ICP–MS work;Ashley Norris for his assistance while using of the CAMECA-SX100 electron microprobe; Guilherme Mallmann, Chris Ballhausand Ambre Luguet for their insightful reviews and comments. Wethank Ed Ripley’s editorial handling, and Ed Mathez, Alan Boud-reau and an anonymous reviewer for their thorough reviews.
REFERENCES
Andrews D. R. A. and Brenan J. M. (2002) The solubility ofruthenium in sulfide liquid: implications for platinum group

5776 R.O.C. Fonseca et al. / Geochimica et Cosmochimica Acta 73 (2009) 5764–5777
mineral stability and sulfide melt–silicate melt partitioning.Chem. Geol. 192, 163–181.
Ballhaus C. and Ryan C. G. (1995) Platinum-group elements in theMerensky reef. I. PGE in solid solution in base metal sulfidesand the down temperature equilibration history of Merenskyores. Contrib. Mineral. Petrol. 122, 241–251.
Ballhaus C. G. and Stumpfl E. F. (1985) Occurrence andpetrological significance of graphite in the upper critical zone,western Bushveld complex, South Africa. Earth Planet. Sci.
Lett. 74, 58–68.
Ballhaus C. G. and Stumpfl E. F. (1986) Sulphide and platinummineralization in the Merensky reef – evidence from hydroussilicates and fluid inclusions. Contrib. Mineral. Petrol. 122, 241–
251.
Barin I. (1989) Thermochemical Data of Pure Substances Part II.VCH, Weinheim, Federal Republic of Germany, New York,NY, USA.
Barnes S. J. and Campbell I. H. (1988) Role of late magmatic fluidsin Merensky type platinum deposits: a discussion. Geology 16,
488–491.
Barnes S. J. and Naldrett A. J. (1985) Geochemistry of the J-M(Howland) reef of the Stillwater complex, Minneapolis aditarea. I. Sulfide chemistry and sulfide-olivine equilibrium. Econ.
Geol. 80, 1251–1729.
Bezmen N. I., Asif M., Brugmann G. E., Romanenko I. M. andNaldrett A. J. (1994) Distribution of Pd, Rh, Ru, Ir and Aubetween sulfide and silicate metals. Geochim. Cosmochim. Acta
58, 1251–1260.
Bezmen N. I., Brugmann G. E., Asif M. and Naldrett A. J. (1991)Mechanism of concentration of platinum group elements:partitioning between silicate and sulfide melts. Int. Geol. Rev.
33, 784–792.
Borisov A. and Palme H. (1997) Experimental determination of thesolubility of platinum in silicate melts. Geochim. Cosmochim.
Acta 61, 4349–4357.
Borisov A. and Palme H. (2000) Solubilities of noble metals in Fe-containing silicate melts as derived from experiments in Fe-freesystems. Am. Mineral. 85, 1665–1673.
Borisov A., Palme H. and Spettel B. (1994) Solubility of palladiumin silicate melts: implications for core formation in the earth.Geochim. Cosmochim. Acta 58, 705–716.
Borisov A., et al. (1992). The origin of highly siderophile elementsin the upper mantle of the Earth: an experimental approach. InProc. Lunar Planet. Sci. Conf., vol. XXIII, pp. 139–140.
Boudreau A. E. and McCallum I. S. (1992) Concentration ofplatinum-group elements by magmatic fluids in layered intru-sions. Econ. Geol. 87, 1830–1848.
Boudreau A. E. and Meurer W. P. (1999) Chromatographicseparation of the platinum-group elements, gold, base metalsand sulphur during degassing of a compacting and solidifyingigneous crystal pile. Contrib. Mineral. Petrol. 134, 174–185.
Brenan J. M., McDonough W. F. and Ash R. (2005) Anexperimental study of the solubility and partitioning of iridium,osmium and gold between olivine and silicate melt. Earth
Planet. Sci. Lett. 237, 855–872.
Brenan M. J. (2008) Re–Os fractionation by sulfide melt silicatemelt partitioning: a new spin. Chem. Geol. 248, 140–165.
Campbell I. H. and Barnes S. J. (1984) A model for thegeochemistry of the platinum-group elements in magmaticsulfide deposits. Can. Mineral. 22, 151–160.
Campbell I. H. and Naldrett A. J. (1979) The influence ofsilicate:sulfide ratios on the geochemistry of magmatic sulfides.Econ. Geol. 74, 1503–1506.
Campbell I. H., Naldrett A. J. and Barnes S. J. (1983) A model forthe origin of the platinum rich sulfide horizons in the Bushveldand Stillwater complexes. J. Petrol. 24, 133–165.
Capobianco C. and Hervig R. (1996) Solubility of Ru and Pd insilicate melts: the effect of melt composition. In Proc. Lunar
Planet. Sci. Conf., vol. XXVII, p. 197.Chase M. W. (1998) NIST-JANAF Thermodynamic Tables.
National Institute of Standards and Technology, Washington,DC, USA.
Crocket J. H., Fleet M. E. and Stone W. E. (1997) Implications ofcomposition for experimental partitioning of platinum-groupelements and gold between sulfide liquid and basalt melt: thesignificance of nickel content. Geochim. Cosmochim. Acta 61,
4139–4149.
Davies G. and Tredoux M. (1985) The platinum group element andgold content of marginal rocks and sills of the bushveldcomplex. Econ. Geol. 80, 838–848.
Ertel W., Dingwell D. B. and Sylvester P. J. (2008) Siderophileelements in silicate melts – a review of the mechanically assistedequilibration technique and the nanonugget issue. Chem. Geol.
248, 119–139.
Ertel W., O’Neill H. S. C., Sylvester P. J. and Dingwell D. B. (1999)Solubilities of Pt and Rh in a haplobasaltic silicate melt at1300 �C. Geochim. Cosmochim. Acta 63, 2439–2449.
Evans K., O’Neill H. and Mavrogenes J. (2008) Sulphur solubilityand sulphide immiscibility in silicate melts as a function of theconcentration of manganese, nickel, tungsten and copper at1 atm and 1400 �C. Chem. Geol. 255, 236–249.
Fleet M. E., Crocket J. H., Menghua L. and Stone W. E. (1999)Laboratory partitioning of platinum-group elements (PGE) andgold with applications to magmatic sulfide–PGE deposits.Lithos 47, 127–142.
Fleet M. E., Crocket J. H. and Stone W. E. (1996) Partitioning ofplatinum-group elements (Os, Ir, Ru, Pt, Pd) and gold betweensulfide liquid and basalt melt. Geochim. Cosmochim. Acta 60,
2397–2412.
Fleet M. E. and Stone W. E. (1991) Partitioning of platinum groupelements in the Fe–Ni–S system and their fractionation innature. Geochim. Cosmochim. Acta 55, 245–253.
Fleet M. E., Stone W. E. and Crocket J. H. (1991) Partitioning ofpalladium, iridium, platinum and gold between sulfideliquid and basalt melt: effects of melt composition, concentrationand oxygen fugacity. Geochim. Cosmochim. Acta 55, 2545–2554.
Fonseca R. O. C., Campbell I. H., O’Neill H. S. C. and FitzgeraldJ. D. (2008) Oxygen solubility and speciation in sulphide-richmattes. Geochim. Cosmochim. Acta 72(1), 2619–2635.
Fonseca R. O. C., Mallmann G., O’Neill H. S. C. and Campbell I.H. (2007) How chalcophile is rhenium? An experimental studyof the solubility of Re in sulphide mattes. Earth Planet. Sci.
Lett. 260, 537–548.
Fortenfant S. S., Gunther D., Dingwell D. B. and Rubie D. C.(2003) Temperature dependence of Pt and Rh solubilities in ahaplobasaltic melt. Geochim. Cosmochim. Acta 67, 123–131.
Godel B., Barnes S.-J. and Maier W. D. (2007) Platinum-groupelements in sulphide minerals, platinum-group minerals and thewhole rocks of the Merensky Reef (Bushveld Complex, SouthAfrica): implications for the formation of the reef. Chem. Geol.
48, 1569–1604.
Godel B., Barnes S. J. and Maier W. F. (2006) 3D distribution ofsulphide minerals in the Merensky Reef (Bushveld complex,South Africa) and the J-M Reef (Stillwater complex, USA) andtheir relationship to microstructures using X-ray computedtomography. J. Petrol. 47, 1853–1872.
Gudmundsson G. and Holloway J. R. (1993) Activity–compositionrelationships in the system Fe–Pt at 1300 and 1400 �C and at1 atm and 20 kbar. Am. Mineral. 78, 178–186.
Helz R. T. and Rait N. (1988) Behavior of Pt and Pd in Kilauea Ikilava lake. V.M. Goldschmidt Conference Abstract, Baltimore,p. 47.

Solubility of Pt in sulphide mattes 5777
Keays R. R. and Campbell I. H. (1981) Precious metals in thejimberlana intrusion, western Australia: implications for thegenesis of platiniferous ores in layered intrusions. Econ. Geol.
76, 1118–1141.
Kress V. (1997) Thermochemistry of sulfide liqfluids. I. The systemO–S–Fe at 1 bar. Contrib. Mineral. Petrol. 127, 176–186.
Kress V. (2007) Thermochemistry of sulfide liqfluids. III. Ni-bearing liquids at 1 bar. Contrib. Mineral. Petrol. 154, 191–204.
Larocque A. C. L., Stimac J. A., Keith J. D. and Huminicki M. A.E. (2000) Evidence for open-system behavior in immiscible Fe–S–O liquids in silicate magmas: implications for contributionsof metals and sulfur to ore-forming fluids. Can. Mineral. 38,
1233–1249.
Luguet A., Lorand J., Alard O. and Cottin J. (2004) A multi-technique study of platinum group element systematic in someLigurian ophiolitic peridotites, Italy. Chem. Geol. 208, 175–194.
Luguet A., Pearson D. G., Nowell G. M., Dreher S. T., Coggon J.A., Spetsius Z. V. and Parman S. W. (2008) Enriched Pt–Re–Osisotope systematics in plume lavas explained by metasomaticsulfides. Science 319, 453–456.
Majzlan J., Makovicky M., Makovicky E. and Rose-Hansen J.(2002) The system Fe–Pt–S at 1100 �C. Can. Mineral. 40, 509–
517.
Mallmann G. and O’Neill H. S. C. (2007) The effect of oxygenfugacity on the partitioning of rhenium between crystals andsilicate melt during mantle melting. Geochim. Cosmochim. Acta
71, 2837–2857.
Mathez E. (1995) Magmatic metasomatism and formation of theMerensky reef, Bushveld Complex. Contrib. Mineral. Petrol.
119, 277–286.
Meurer W. P. and Boudreau A. E. (1998) Concentration ofplatinum-group elements by magmatic fluids in layered intru-sions. J. Geol. 106, 281–292.
Meurer W. P., Klaber S. and Boudreau A. E. (1997) Discordantbodies from olivine-bearing zones III and IV of the Stillwatercomplex, Montana – evidence for postcumulus fluid migrationand reaction in layered intrusions. Contrib. Mineral. Petrol.
130, 81–92.
Moretti R. and Baker D. R. (2008) Modeling the interplay of fO2
and fS2 along the FeS–silicate melt equilibrium. Chem. Geol.
256, 285–297.
Naldrett A. J., Cameron G., Gruenewaldt G. V. and Sharpe M. R.(1987) The formation of stratiform PGE deposits in layeredintrusions. In Origin of Igneous Layering (ed. I. Parsons).Reidel, Dordrecht, pp. 313–397.
Okamoto H. (2002) Phase Diagrams of Binary Iron Alloys. Thematerials information Society, Ohio, USA.
O’Neill H. S. C., Dingwell D. B., Borisov A., Spettel B. and PalmeH. (1995) Experimental petrochemistry of some highly sidero-phile elements at high temperatures, and some implications forcore formation and the mantles early history. Chem. Geol. 120,
255–273.
O’Neill H. S. C. and Eggins S. M. (2002) The effect of meltcomposition on trace element partitioning: an experimentalinvestigation on the activity coefficients of FeO, NiO, CoO,MoO2 and MoO3. Chem. Geol. 186, 151–181.
O’Neill H. S. C. and Mavrogenes J. A. (2002) The sulphidecapacity and the sulphur content at sulfide saturation of silicatemelts at 1400 �C and 1 bar. J. Petrol. 43, 1049–1087.
Peach C. L., Mathez E. A. and Keays R. R. (1990) Sulfide melt–silicate melt distribution coefficients for noble metals and otherchacophile elements as deduced from MORB: implications forpartial melting. Geochim. Cosmochim. Acta 54, 3379–3389.
Peach C. L., Mathez E. A., Keays R. R. and Reeves S. J. (1994)Experimentally determined sulfide melt–silicate melt partitioncoefficients for iridium and palladium. Chem. Geol. 117, 361–
377.
Pruseth K. L. and Palme H. (2004) The solubility of Pt in liquid Fe-sulfides. Chem. Geol. 208, 233–245.
Raghavan V. (1988) Phase Diagrams of Ternary Iron Alloys Pt. 2.Indian Institute of Technology, Delhi, India.
Stone W. E., Crocket J. H. and Fleet M. E. (1990) Partitioning ofpalladium, iridium, platinum and gold between sulfide liquidand basalt melt. Geochim. Cosmochim. Acta 54, 2341–2344.
Wood S. (1987) Thermodynamic calculations of the volatility of theplatinum group elements (PGE): the PGE content of fluids atmagmatic temperatures. Geochim. Cosmochim. Acta 51, 3041–
3050.
Associate editor: Edward M. Ripley
Copyright © 2022 FDOKUMEN