Govt issues notifications proposing 13 new districts - Daily ...

SOILS AND LAND RESOURCES OF MOROGORO RURAL AND URBAN DISTRICTS
ISBN 9987 605 26 5
VOLUME 1
LAND SUITABILITY EVALUATION FOR THE PRODUCTION OF
FOOD CROPS AND EXTENSIVE GRAZING: A CASE STUDY OF
WAMI PLAINS IN MOROGORO RURAL DISTRICT, TANZANIA
Balthazar M. Msanya
Didas N. Kimaro
Emmanuel P. Kileo
Gerald G. Kimbi
Sibaway B. Mwango
2001
Department of Soil Science
Faculty of Agriculture
Sokoine University of Agriculture
P.O. Box 3008
Morogoro, Tanzania

ii
Correct Citation: Msanya, B.M., Kimaro, D.N., Kileo, E.P., Kimbi, G.G. and
Mwango, S.B. (2001). Land suitability evaluation for the
production of food crops and extensive grazing: a case study of
Wami Plains in Morogoro Rural District, Tanzania. Soils and
Land Resources of Morogoro Rural and Urban Districts, Volume
1. Department of Soil Science, Faculty of Agriculture, Sokoine
University of Agriculture, Morogoro, Tanzania
“No part of this report may be reproduced, stored in a retrievable system, or transmitted
in any form or by any means, without prior written permission of the author(s) or
Sokoine University of Agriculture in that behalf”.
Published by:
Directorate of Research and Postgraduate Studies
Sokoine University of Agriculture
P.O. Box 3151 CHUO KIKUU
MOROGORO, TANZANIA
Phone +255 23 2603511/2604388 Fax +255 23 2604388
E-mail: [email protected]
2001
ISBN 9987 605 26 5
Type setting, cover design, printing and graphic design by the authors
iii
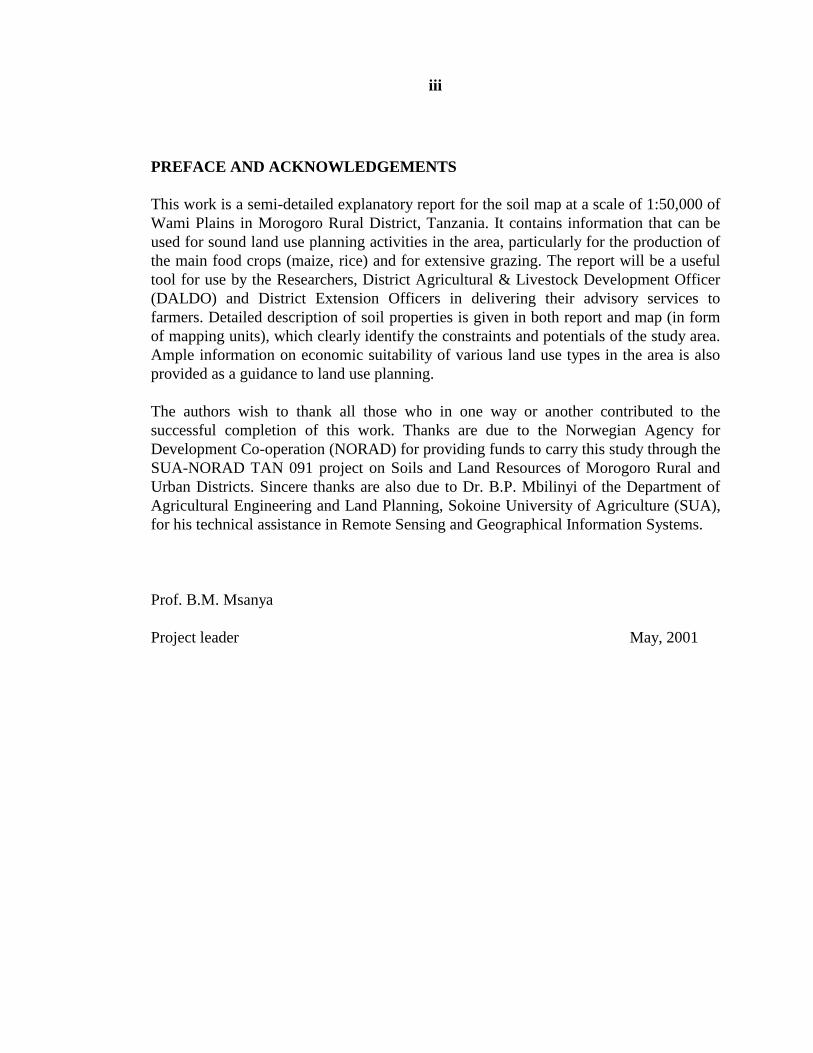
PREFACE AND ACKNOWLEDGEMENTS
This work is a semi-detailed explanatory report for the soil map at a scale of 1:50,000 of
Wami Plains in Morogoro Rural District, Tanzania. It contains information that can be
used for sound land use planning activities in the area, particularly for the production of
the main food crops (maize, rice) and for extensive grazing. The report will be a useful
tool for use by the Researchers, District Agricultural & Livestock Development Officer
(DALDO) and District Extension Officers in delivering their advisory services to
farmers. Detailed description of soil properties is given in both report and map (in form
of mapping units), which clearly identify the constraints and potentials of the study area.
Ample information on economic suitability of various land use types in the area is also
provided as a guidance to land use planning.
The authors wish to thank all those who in one way or another contributed to the
successful completion of this work. Thanks are due to the Norwegian Agency for
Development Co-operation (NORAD) for providing funds to carry this study through the
SUA-NORAD TAN 091 project on Soils and Land Resources of Morogoro Rural and
Urban Districts. Sincere thanks are also due to Dr. B.P. Mbilinyi of the Department of
Agricultural Engineering and Land Planning, Sokoine University of Agriculture (SUA),
for his technical assistance in Remote Sensing and Geographical Information Systems.
Prof. B.M. Msanya
Project leader May, 2001

iv
EXECUTIVE SUMMARY
A study was conducted at Wami Plains in Morogoro Rural District, Tanzania to assess
the suitability of lands for the production of the main food crops and for extensive
grazing. Field land resources survey was conducted covering an area of 35,810 hectares.
Soil profiles were excavated, studied and sampled for laboratory analysis.
The Wami area experiences largely a monomodal type of rainfall with a mean annual
rainfall ranging from 768 to 1036 mm. The wettest month is April with rainfall ranging
between 139 and 204 mm. The mean monthly air temperature range from 21.2oC in July
to 26.0 oC in December with mean annual air temperature of 24.3
oC.
The geology of the area comprises Neogene deposits (sands, red clays and mbuga clays)
derived from old rocks belonging to the Usagaran precambrian metasediments mostly
migmatites and acid gneisses.
The topography of the area is a mixture of flat and almost flat to undulating slopes (0.5-
6%). Local depressions are observed from place to place. Three major landforms are
described in the study area. These include piedmont, peneplane and plain. Piedmont is
situated at an altitude range of 520-600 m.a.s.l. Most of them have almost flat to
undulating topography. The second major landform is the peneplane situated at an
altitude range of 480-520 m.a.s.l. The peneplane consists of ridge summits, ridge slopes
with red soils and ridge slopes with sandy soils and valley bottoms. The third major type
of landform is the plain which consists of flat topography with red soils, flats with sandy
soils, floodplains and Mbuga with almost flat to flat topography and are situated at
altitudes between 380-480 m.a.s.l.
The soils were classified according to both FAO-World Reference Base and USDA Soil
Taxonomy systems. The FAO-WRB soil names with their mapping units in brackets are
as follows: Chromi-Rhodic Cambisols and Hapli-Hypocalcic Calcisols (Alluvial fan);
Rhodi-Profondic Lixisols (Ridge summits); Rhodi-Profondic Lixisols (Ridge slopes with
red soils); Hypereutri-Ferralic Cambisols (Ridge slopes with sandy soils); Hypereutri-
Mollic Fluvisols and Calcari-Mollic Cambisols (Valley bottoms); Chromi-Profondic
Lixisols and Hapli-Hypocalcic Calcisols (Flats with red soils); Calcari-Mollic Fluvisols
(Flats with sandy soils); Hypocalci-Endosodic Calcisols (Floodplains) and Endosodi-
Pellic Vertisols (Mbuga).
Soils of Wami Plains are mostly well-drained, sandy clay loams, except on the valley
bottoms, floodplains and mbuga where they are poorly drained. They have low to
medium available water capacity (83 - 135 mm/m). The soils are generally poor in
chemical fertility. The levels of nitrogen range from very low (0.04%) to low (0.17%)

v
while those of organic carbon are between low (0.66%) and medium (1.46%). Available
phosphorus contents range between low and medium (0.96-16.0 mg/kg).
Three land utilisation types (LUTs) (smallholder rainfed maize production, smallholder
rainfed rice production and extensive grazing) were selected for physical and economic
suitability evaluation of the area. The results show that about 80% of the area is rated
potentially and economically as marginally to moderately suitable while the rest of the
lands (about 20%) are potentially and economically not suitable for smallholder rainfed
maize production. These areas have moderate to severe limitations related to soil erosion
hazards, soil fertility and moisture availability.
Only about 55% of the area is classified as potentially and economically marginally
suitable, while 45% is potentially and economically not currently suitable for low input
rainfed rice production. These lands have severe to very severe limitations associated
with generally low soil fertility, unfavourable temperature in the growing period and soil
wetness.
The largest part of the Wami plains (about 85%) is classified as potentially moderate and
economically highly suitable land, while 15% is potentially and economically marginally
suitable for extensive grazing. The most limiting factors for this land utilisation type are:
moisture availability, biological hazards (tsetse and ticks infestation), availability of
drinking water and accessibility of animals to grazing lands.
There is no land with good potential or economically highly suitable for maze and rice
land utilisation types.
From these results it appears clearly that the lands of the Wami plains are potentially and
economically marginal for smallholder production of food crops (maize and rice).
Basing on current observed and predicted smallholder farmer’s yields and returns and
the present marketing structure and prices, use of high cost input materials at the present
level of production is not feasible. The lands of the Wami plains show clearly that there
is high potential for large-scale investment in food production. However, major
investment should consider the introduction of water harvesting techniques, crop
selection including drought resistant crops, control of soil erosion, and mechanisation.
Management of saline and sodic soils and use of organic and inorganic fertilisers are
prerequisite. As for extensive grazing more than 80% of the Wami lands are moderately
and highly suitable both potentially and economically. Prospects for improved grazing
are high in the area. Promising high returns under high investment in this LUT could be
realised easily given the potential marketing sources and extension services available in
the expanding Morogoro municipality and Dar es Salaam city.

vi
TABLE OF CONTENTS
PREFACE AND ACKNOWLEDGEMENTS…………………………………………..iii
EXECUTIVE SUMMARY .............................................................................................. iv
LIST OF TABLES......................................................................................….…….……vi
LIST OF FIGURES.....................................................................................……….……vi
LIST OF APPENDICES................................................................................……...…...vii
ABBREVIATIONS .....................................................................................…….……..vii
1.0 INTRODUCTION ..................................................................................................... 1
2.0 MATERIALS AND METHODS ............................................................................. 3
2.1 Pre-field work activities ........................................................................................... 3
2.2 Field work activities................................................................................................. 4
2.3 Post field work activities.......................................................................................... 5
2.3.1 Laboratory methods ........................................................................................... 5
2.3.2 Data processing and soil classification .............................................................. 5
2.3.3 Preparation and presentation of the soil map and legend .................................. 6
2.4 Land evaluation ........................................................................................................ 6
2.4.1 Description of the land utilisation types ............................................................ 6
2.4.2 Land use requirements and decision rules ......................................................... 6
2.5 Land suitability classification .................................................................................. 7
2.5.1 Physical suitability classification ....................................................................... 7
2.5.2 Economic suitability classification .................................................................... 7
3.0 RESULTS AND DISCUSSION ............................................................................. ..8
3.1 Physical environment ............................................................................................... 8
3.1.1 Location ............................................................................................................. 8
3.1.2 Climate .............................................................................................................. 8
3.1.3 Growing season ............................................................................................... 11
3.1.4 Average annual evaporation (Eo) ..................................................................... 11
3.1.5 Geology and landforms ................................................................................... 12
3.1.6 Vegetation and land use .................................................................................. 12
3.1.7 Major soils ....................................................................................................... 13
3.2 Mapping units description ..................................................................................... 13
3.3 Soil classification ................................................................................................... 32
3.4 Land evaluation ..................................................................................................... 37
3.4.1 Description of land utilisation types (LUTs) ................................................... 37
3.4.2 Land suitability classification .......................................................................... 42
4.0 CONCLUSIONS AND RECOMMENDATIONS ................................................ 49
4.1 Conclusions ............................................................................................................ 49
4.1.1 Land and soil characteristics ............................................................................ 49
4.1.2 Land suitability
classification……………...…………………….………………………………….49
4.2 Recommendations………………………………………………………………..50
5.0 REFERENCES…………………………………………………………………….52

vii
LIST OF TABLES
Table 1. Rain season, humid months and growing season, calculated according
to FAO (1984) from selected rainfall stations in Wami
Plains...........…...…
9
Table 2 Relationship between average annual potential evaporation (Eo), mean
annual rainfall and land mapping units in the study
area……………..…..
11
Table 3 Salient site features, landform, vegetation/land use and soils of the
study
area..............………………………………………………………...…..
15
Table 4 Physical characteristics of the studied soils.....…..................................... 18
Table 5 Selected soil chemical properties of the Wami
Plains...……................…
24
Table 6 Summary of morphological and diagnostic features of studied soils
according to the FAO-WRB system..............................…..................…
33
Table 7 Summary of morphological and diagnostic features of studied soils
according to the USDA Taxonomy system.......................….......…........
34
Table 8 Classification of the studied soils........................................…...….......... 35
Table 9 Description of land utilisation types in Wami Plains................……........ 38
Table 10 Agro-economic survey results for low input rainfed maize production in
Wami Plains..........................................................................….....….....
39
Table 11 Agro-economic survey results for low input rainfed rice production in
Wami Plains.........................................................................…......…….
40
Table 12 Agro-economic survey results for extensive grazing in Wami
Plains…....
41
Table 13 Limiting factors and physical suitability classification for low input
rainfed maize, low input rainfed rice and extensive grazing in wami
plains…………………………………………………………………….
.
45
Table 14 Predicted yields for low input rainfed maize, low input rainfed rice and
extensive grazing in wami plains……………………….....................….
46
Table 15 Economic suitability classification for low input rainfed maize, low
input rainfed rice and extensive
grazing...............…….........…........……...….
47
Table 16 Predicted gross margins for low input rainfed maize, low input rainfed
rice and extensive grazing ………….……………………….............…..
48
LIST OF FIGURES
Figure 1 Climatic regimes from two meteorological stations in the study
area…...
10

viii
Figure 2 Percent particle size distribution of some selected soils in Wami
Plains...
19
Figure 3 Soil moisture release curves of some selected soils in the study
area…...
20
Figure 4 Relationship between some soil chemical properties and soil
depth.…....
26
Figure 5 Relationship between soil pH and soil depth in Wami Plains
…..............
31

ix
LIST OF APPENDICES
Appendix 1 Soil profile description and analytical data..................................…. 55
Appendix 2 Rating of land use requirements for maize production in Wami
Plains.....…………………………………………........……………
67
Appendix 3 Rating of land use requirements for rice production in Wami
Plains……………………………………………………………….
68
Appendix 4 Rating of land use requirements for extensive grazing in Wami
Plains................….......………………….………………………….
69
Appendix 5 Guide to general rating of some chemical and physical soil
properties...................................................................….……...….
70
Appendix 6 Soil map of the study area.......................................……...…..... Back cover
ABBREVIATIONS
ALES = Automated Land Evaluation System
API = Aerial photo interpretation
AWC = Available water capacity
BD = Bulk density
BS = Base saturation
C:N = Carbon to nitrogen ratio
CEC = Cation exchange capacity
ECe = Electrical conductivity of the saturated soil paste extract
ESP = Exchangeable sodium percentage
ETo = Potential Evapotranspiration
FAO = Food and Agricultural Organisation of the United Nations
GIS = Geographical Information System
GM = Gross margin
km2 = Square kilometres
LIRMP = Low input rainfed maize production
LIRRP = Low input rainfed rice production
LMU = Land mapping unit
LQ = Land quality
LUR = Land use requirements
LUT = Land utilisation type
NORAD = Norwegian Agency for Development Co-operation
NSS = National Soil Service oC = Degree centigrade
PRA = Participatory Rural Appraisal
SISTAN = Soil information system for Tanzania
SUA = Sokoine University of Agriculture
URT = United Republic of Tanzania

x
USDA = United States Department of Agriculture
WRB = World Reference Base

Msanya et al.
1
1.0 INTRODUCTION
Morogoro region covers an area of about 73,000 km2, which is about 8% of the total land
of Tanzania (Ngasongwa, 1980). It has a high potential for agricultural production
especially in valleys and plains such as Wami. Various food crops are grown in Wami
area including sorghum, maize, rice, cassava, field beans and pigeon peas (Kileo, 2000).
Despite the agricultural potential in many parts of the country, Tanzania continues to
face frequent and intermittent food shortages {United Republic of Tanzania (URT),
1988)} and that food demand in Tanzania is likely to increase due to rapid population
growth and expanding urbanisation (World Food Summit, 1996).
The low food production in Tanzania is contributed to a large extent by poor agricultural
technical packages including inadequate research and lack of information on different
agro-ecological zones (Kimaro, 1989; Kileo, 2000), poor land use planning (Msanya et
al., 1999), poor crop husbandry and management and growing of crops in marginal
areas. Low food production is also caused by unreliable rainfall, poor soil fertility and
different forms of land degradation (Kileo, 2000).
Some of important measures reported to alleviate the problems of food scarcity in
Tanzania include: (i) identifying and increasing access to new farm land by farmers and
improving means of communication, (ii) intensifying production on already cultivated
land through improved technologies and inputs, (iii) encouraging increased investment
in small-holder irrigation systems, (iv) increasing availability of credit and other forms
of financial support to the agricultural sector, (v) improving and speeding up the process
of land surveying and issuing title deeds to individuals and communities (Araki et al.,
1998; Kileo, 2000), (vi) developing and setting aside grazing land (URT, 1998), (vii)
encouraging agricultural production in areas with higher potential to maximise yields
(Kileo, 2000), (viii) encouraging large scale private farming to supplement small holder
production to obtain surplus for export and (ix) emphasis on research on major crops
using sound technical packages (Kimaro, 1989).
In order to enhance the implementation of the above strategies, it is necessary to carry
out land evaluation studies to explore high potential agricultural areas in the country.
Studies on the potential and constraints of land for production of crops and extensive
grazing in Tanzania are scarce. Moreover, those few studies have in most cases been
carried out using conventional land evaluation systems. Such systems are quite tedious
and time consuming as they are basically manual land evaluations involving large
amounts of natural resource data which could also lead to serious errors. This situation
has lead to inappropriate land use, inefficient exploitation of natural resources,
destruction of the land resource, poverty and other social problems.

Msanya et al.
2
Introduction of computerised systems for land evaluation such as Automated Land
Evaluation System (ALES) will be of tremendous benefit, as they will assist to quickly
process large natural resource database for decision-making on land use and
management and for timely generation of information required by investors.
The current study is part of the continuing project on Soils and Land Resources of
Morogoro Rural and Urban Districts. The objective of the study was to conduct land
suitability assessment of a part of the Wami Plains with respect to maize, rice and
extensive grazing. Specifically, the study had the following objectives:
i) to identify soils and terrain characteristics of the area.
ii) to characterise soils of Wami area including their morphological and physico-
chemical properties.
iii) to classify the soils of the area using internationally recognised systems of soil
classification commonly used in Tanzania (i.e. FAO World Resource Base
(WRB) (FAO, 1998) classification and USDA Taxonomy (Soil Survey Staff,
1998).
iv) to assess the suitability of the area for maize, rice and extensive grazing using
Automated Land Evaluation System (ALES).
Information gathered from this study will enable land users and developers of the Wami
area to make proper decisions as to what crops to be produced and management levels to
be applied so as to meet the increasing food demand by the rapidly growing population.
The information generated can be extrapolated to other areas with similar conditions to
provide a firm base for future research and assessment of land potential in Tanzania.

Msanya et al.
3
2.0 MATERIALS AND METHODS
2.1 Pre-field work activities
The tasks performed during this phase included literature search, collection of available
data and preliminary study of materials listed below:
(1) geological map (Quarter Degree Sheet 183) at the scale of 1:125,000. Geological
survey of Tanganyika 1961. Geological Survey Department, Dodoma, Tanzania.
(2) topographic map sheet 183/1 (Nguru ya Ndege) at the scale of 1:50,000. Ministry
of Lands, 1970. Survey and Mapping Division, Dar es Salaam, Tanzania.
(3) aerial photographs: Nos. 60, 61, 62, 63, 64 and 65 of 1964; 88, 89, 90, 91, 92,
142, 143, 144, 145 and 146 of 1966 at the scale of 1:40,000 respectively.
(4) climatological data: Mean rainfall and temperature data for Wami Prison station
(1957-1990) and Kihonda station (1967-1990).
(5) Mean evaporation data from Morogoro meteorological station (1971-1990) was
used to calculate the evapotranspiration for Kihonda and Wami Prison
meteorological stations
(6) The length of rainy and growing seasons were calculated according to FAO
(1984) methodology based on mean monthly rainfall and potential
evapotranspiration (ETo) which assumes 100 mm soil moisture storage.
(7) review of previous works and other relevant literature: Kaaya, 1998; Msanya et
al., 2000; Kileo, 2000.
In preparation for mapping in the field, stereoscopic examination of aerial photographs
and interpretation of photo elements (landform, geology, lineaments, drainage patterns,
vegetation cover, land use and drainage attributes) was done. This exercise was done in
order to get a general impression of features, which are commonly related to kinds of
soils and terrain characteristics. Land units were identified based on relief features and
then delineated on the aerial photos. The land units established during API were then
used to predict broad soil patterns and the associated range of soil properties since the
processes responsible for landform features are known to have strong influence on parent
materials and soils. The resulting soil landform-mapping units represent associations
and/or complexes of soils described and delineated by means of landform units. These
were then scaled down and transferred to a base map obtained from the available
topographic map on which field survey and soil investigations were based.
Semi-structured questionnaires were prepared for socio-economic data collection. The
questionnaire included important attributes on: production packages, farming systems,
capital and labour intensity, level of technical know-how, observed yields and prices,
land tenure and farm size.

Msanya et al.
4
2.2 Field work activities
In the field, soils and land resources survey and mapping were done at a semi-detailed
scale (1:50,000) with observation intensity of 8 observations per km2. Systematic free
survey procedures were followed as outlined by Dent and Young (1981). Selection of
representative transects in sample area was done and soils and other land characteristics
such as vegetation, land use and erosion features were described along the selected
transects. Soils were described by hand augering to a depth of 120 cm except where there
was a limitation by bedrock or other limiting layers. At each observation point
information on soils such as soil drainage, soil colour, soil texture, soil structure
(topsoil), soil consistence, surface cracks and surface stoniness (if present) were
recorded. Thorough field checks of the whole study area to confirm boundaries made on
the photo interpretation map and to establish range of characteristics were done.
Correlation of the described soils and terrain characteristics enabled the delineation of
the homogeneous land-mapping units. In this way nine land mapping units were
confirmed on the photo interpretation base map.
Based on the information obtained from field observations for each delineated land-
mapping unit, a representative soil profile pit for every major soil type was excavated on
a selected site. Global Positioning System (model GARMIN 12XL) was used to
determine the geographical locations of the sites. Soil profile pits were dug to a depth of
2 m or to a limiting layer. The soils were described according to FAO Guidelines for Soil
Profile description (FAO, 1990; 1998). Moist and dry soil colours were described using
Munsell Soil Colour Charts (Munsell Colour Company, 1992).
Disturbed soil samples were collected from all soil profile layers for laboratory physico-
chemical analysis. Undisturbed core soil samples were taken for the determination of soil
moisture characteristics and bulk density. Composite soil samples (0-20 and 25-50 cm
depths) were collected for general soil fertility evaluation.
Participatory Rural Appraisal (PRA) was carried out in the field using the prepared semi-
structured questionnaire to collect socio-economic data for agro-economic suitability
evaluation. In this exercise thirty farmers were interviewed. Data on production levels,
farming systems, capital and labour intensity, level of technical know-how, crop yields
and prices, land tenure and farm size were collected. In addition information related to
population and extension services was also gathered. Informal meetings with farmers
provided additional information, which was used to define the major land use types in
the study area.
2.3 Post-field work activities
2.3.1 Laboratory methods
Soil samples were air dried, ground and sieved through a 2 mm sieve to obtain the fine
earth fractions. Particle size distribution was carried out by Hydrometer method as

Msanya et al.
5
described by Gee and Bauder (1986). Bulk density for non-stony soils was determined by
core method (Black and Hartge, 1986) while bulk density for shrink-swell soils was
calculated as follows;
Bulk density (max.) = 1/(Wmax. + 0.4046) (Shaw and Yule, 1978)
where Wmax. is the maximum gravimetric water content of the horizon in question (the
field saturated water content). Soil moisture characteristics were determined by
sand/kaolin box and pressure membrane apparatus (NSS, 1990).
The pH of the soil was determined potentiometrically in water and 1MKCl at a ratio of
1:2.5 soil-water and soil-KCl respectively (McLean, 1986). The electrical conductivity of
the saturated soil paste extract (ECe) for soil samples was determined by an EC meter at
a standard temperature of 25oC at the ratio of 1:2.5 soil-water (Rhodes, 1982).
Organic carbon was determined by Walkley and Black wet-acid dichromate digestion
method (Nelson and Sommers, 1982). Organic matter percentage was estimated by
multiplying the percentage organic carbon by 1.724. Total nitrogen was determined by
Semimicro Kjeldahl digestion followed by ammonium distillation titrimetric
determination (Bremner and Mulvaney, 1982). Available phosphorus was determined by
Kurtz-Bray-1 and Olsen methods (Olsen and Sommers, 1982). Calcium carbonate
content was determined titrimetrically following methods outlined by National Soil
Service (NSS, 1990).
The exchangeable bases were determined by atomic adsorption spectrophotometer
(Thomas, 1982). The cation exchange capacity (CEC) of soils with pH < 7.5 was
determined by NH4OAc method, at pH 7.0, and for soils with pH > 7.5 it was determined
by sodium saturation method with sodium acetate, at pH 8.2 (Hesse, 1971). Total
exchangeable bases, base saturation and ESP were determined by calculations. CEC of
clay was calculated using a formula by Baize (1993) which corrects for the CEC
contributed by organic matter; CECclay = [CECsoil - (% OM x 2) x 100]/% clay.
2.3.2 Data processing and soil classification
Soil morphological and laboratory analytical data were stored in the digital soil data base
management system (SISTAN) (Magoggo, 1991) and processed using Microsoft Word
programme (Appendix 1). Soil morphological properties and laboratory analytical data
were used to classify the soils according to FAO World Reference Base (WRB)
classification system (FAO, 1998) up to third level soil unit names and USDA Soil
Taxonomy (Soil Survey Staff, 1998) to the subgroup level names.
2.3.3 Preparation and presentation of the soil map and legend
The soil map polygons were delineated on the basis of the following hierarchy of
elements: landforms, relative position in the landscape, slope classes and soil properties.
The analogue map compiled from aerial photo interpretation and during field work was

Msanya et al.
6
digitised and analysed using ARC/INFO and ARC/VIEW-GIS software to produce the
final physiographic soil map with legend at a scale of 1:50,000 (Back cover).
2.4 Land evaluation
The land evaluation method applied in this study basically follows the procedures laid
down in the FAO Framework for Land Evaluation (FAO, 1976). Firstly the land
utilization types (LUTs) were described. The next step in the evaluation process is to
compare the (optimal) environmental requirements of the LUTs with the actual
conditions of the land (matching). The matching process in this study was done using the
Automated Land Evaluation System (ALES) programme (Rossiter and Van Wambeke,
1989; 1994). The tracts of the land being used for suitability assessment in this study are
mapping units of the soil map (Back cover).
2.4.1 Description of the land utilisation types
Land utilisation types in the area were selected and described on the basis of field
observations on farming systems, produce (varieties grown), labour input, farm size, land
tenure, yields and prices of the produce as obtained by farmers. Information on land
utilisation types was also used to generate data for screening by ALES.
2.4.2 Land use requirements and decision rules
The suitability of the lands in the study area was assessed on the basis of those land use
requirements (LURs) that were considered diagnostic for the identified LUTs. In the
study area the diagnostic LURs taken into consideration are: moisture availability,
nutrient availability, nutrient retention, duration of flooding, oxygen availability to roots,
temperature regime, soil wetness, temperature in the growing period, accessibility of
animals to grazing lands, biological hazards, climatic conditions and drinking water
availability. LURs are composed of certain land characteristics (LCs). For example the
LUR “nutrient availability” is composed of the LCs “soil reaction, topsoil organic
carbon, topsoil nitrogen content, and topsoil available phosphorus” (Appendices 2, 3 and
4).
In ALES the interrelations of LCs to rate LURs are accounted for in the form of decision
trees. These trees are structured representations of the reasoning processes (expert
knowledge system) needed to reach decisions. Class limits sets in the decision trees for
the selected LUTs were mainly based on literature sources and information obtained
from PRA and field observations. Rating of the LURs was done using severity levels as
follows: (1) no limitation, (2) moderate limitation, (3) severe limitation and (4) very
severe limitation.
2.5 Land suitability classification
Land suitability classification takes into account a sustainable use of the lands basing on
the environmental resources (physical suitability) and socio-economic factors (economic

Msanya et al.
7
suitability). In this study both physical and economic suitability were carried out using
ALES programme.
2.5.1 Physical suitability classification
In ALES programme the final physical suitability classification of the land mapping
units was arrived at by using the “Liebig’s law of minimum” by which the most limiting
LUR determines the suitability class (Rossiter and Van Wambeke, 1989). Four physical
suitability classes were defined as (1) good potential, (2) moderate potential, (3) poor
potential and (4) very poor potential. As part of the physical evaluation ALES can be
instructed to predict yield in two ways: (1) on the basis of limiting yield factors and (2)
on the basis of proportional yield factors. Both types need to be defined by the evaluator.
ALES predicted yields are obtained by multiplying the chosen yield factors with the
maximum attainable yield. In this study the limiting yield factors were used to define the
physical suitability classes. The limiting yield factors were chosen in accordance with the
FAO guidelines (FAO, 1984) as follows: class 1 (optimal conditions) yield factor 1,
class 2 yield factor 0.8, class 3 yield factor 0.4 and class 4 yield factor 0.2. Subsequently,
the predicted yields were calculated using maximum limiting yield factor per class.
2.5.2 Economic suitability classification
ALES compute the economic evaluation after the physical evaluation. The economic
evaluation is carried using the predicted yields arrived at in the physical evaluation. The
results of the economic evaluation are the predicted gross margins for each mapping unit
for a specific LUT. In the economic evaluation the FAO suitability classes were used as
follows: S1 (highly suitable), S2 (moderately suitable), S3 (marginally suitable), N1
(economically not suitable) and N2 (is reserved for physically unsuitable land). ALES
require the evaluator to set the economic suitability class limits. These class limits are
gross margins based on the maximum attainable yields. The same factors were used for
setting the class limits as for the physical evaluation.

Msanya et al.
8
3.0 RESULTS AND DISCUSSION
3.1 Physical environment
3.1.1 Location
The study area is located within Morogoro Rural District. It extends from the south at the
footslopes of Nguru ya Ndege mountains to “Mbuga ya Rumanda” in the northwest. The
approximate geographical co-ordinates are 37o3000 to 37
o386.7E and 6
o30 to
6o413.3S. The area lies at an average elevation ranging from 380 m.a.s.l. in the north-
west to about 600 m.a.s.l. in the south-west. The areal extent is about 35,810 ha (358.10
km2).
3.1.2 Climate
The most important climatic factors influencing plant growth in the Wami plains are
rainfall, temperature and evapotranspiration.
Rainfall
The average rainfall in Wami Plains ranges from 768 mm in the southern part to about
1036 mm in the northern part (Kileo, 2000). The rainfall pattern is largely monomodal.
Rains start in December through May with a slight decrease in February (Table 1). April
is the wettest month in the study area with a mean rainfall varying between 139 and 204
mm. Rainfall decreases sharply in the months of May (59 - 94 mm).
Temperature
Temperature is almost uniform throughout the surveyed area with the coldest month in
July (20.8-21.4oC) and the hottest month in December (26.2-26.8
oC) (Table 1).
Evapotranspiration (ETo)
Generally evapotranspiration increases during the dry season. Maximum
evapotranspiration is experienced in the months of November and December (162-165
mm), just in the onset of the rainy season and it is minimum in the months of July (142-
145 mm) (Table 1). Seasonal variation in potential evapotranspiration is rather small
compared to the seasonal variation in rainfall (Figure 1).

9
Table 1. Rainy season, humid months and growing season, calculated according to FAO (1984) for selected
rainfall stations in Wami Plains Met.
Station
Climatic
parameter
Sept Oct Nov Dec Jan Feb Mar Apr May Jun Jul Aug Year
Wami Temperature (oC) 22.9 24.3 25.4 26.2 26.0 26.0 25.8 24.7 23.2 21.3 20.8 21.8 24.0
Prison ETo 150.1 155.3 159.4 162.4 161.7 161.7 160.9 156.8 151.2 144.2 142.3 146.0 1429
(579 m) 05ETo 75.1 77.7 79.7 81.2 80.9 80.9 80.5 78.4 75.6 72.1 71.2 73.0 1852
Rainfall (mm) 17 43 68 139 138 110 161 204 94 19 11 7.5 1036
Rain season + + + + + +
Humid months +
Growing season + + + + + +
Kihonda Temperature (oC) 23.5 24.9 26.0 26.8 26.6 26.6 26.4 25.3 23.8 21.9 21.4 22.4 24.6
(480 m) ETo 152.4 157.6 161.7 164.7 163.9 163.9 163.2 159.1 153.5 146.4 144.5 148.3 1879
05ETo 76.2 78.8 80.8 82.4 82.0 82.0 81.6 79.5 76.7 73.2 72.3 74.1
Rainfall (mm) 13 26 70 117 129 90 121 139 59 9.2 9.5 5.1 768
Rain season + + + + +
Humid months
Growing season + + + + +
ETo = Potential evapotranspiration (Penman); 0.5 ETo = half of the potential evapotranspiration; + = this month is part of the rainy season (if rainfall >
0.5 ETo); a humid month (rainfall > ETo) or part of the growing season.

10
Climatic regime at Wami Prison Met. station
0
50
100
150
200
250O
ct
Nov
Dec Jan
Feb
r
Mar
Apr
May Ju
n
July
Aug
Sep
t
Months
Rain
fall
an
d 0
.5 E
To (
mm
)
0
5
10
15
20
25
30
Tem
per
atu
re
(degre
e c
enti
gra
des
)Rainfall (mm) 0.5 ETo (mm) Temp (oC)
Climatic regime at Kihonda Met. station
0
20
40
60
80
100
120
140
160
Oct
Nov
Dec Jan
Feb
r
Mar
Apr
May Ju
n
July
Aug
Sep
t
Months
Rain
fall
an
d 0
.5 E
To (
mm
)
0
5
10
15
20
25
30
Tem
per
atu
re
(degre
e c
enti
gra
des
)
Rainfall (mm) 0.5ETo (mm) Temp (oC)
Figure 1. Climatic regimes from two meteorological stations in the study area

11
3.1.3 Growing season
The length of growing season in the study area varies from about 150 days in
December through May in the southern part (Makunganya) to 180 days, in the
northern part (Rumanda, Sokoine and Dakawa) (Table 1) (Kileo, 2000). The southern
part (Makunganya) has no humid months whereas the northern part (Dakawa,
Sokoine and Rumanda) has only one humid month (April). In this study the
calculation of growing season is based on the assumption that all rainfall is effective
and that no rainfall is lost by run off or deep percolation beyond the reach of the plant
roots. Therefore, it must be noted that the length of growing season calculated here
gives only rough indications of the length of the growing season in the study area.
Table 2. Relationship between average annual potential evaporation (Eo),
mean annual rainfall and land mapping units in the study area
Mapping unit Soil unit Altitude (m) Eo (mm) Mean annual rainfall
(mm)
Pi1 NYN-P8 465 2255.5 768
NYN-P11 580 2214.4 768
Pe1 NYN-P12 460 2255.3 768
Pe2 NYN-P1 480 2250.2 768
Pe3 NYN-P3 530 2232.3 768
Pe4 NYN-P2 420 2271.6 768
NYN-P4 440 2264.5 768
PL1 NYN-P7 420 2271.6 1036
NYN-P10 440 2264.5 1036
PL2 NYN-P6 420 2271.6 1036
PL3 NYN-P9 450 2260.9 1036
PL4 NYN-P5 420 2271.6 1036
3.1.4 Average annual evaporation (Eo)
The calculated average annual evaporation varies between approximately 2214 mm
in the southern part (mapping unit Pi1, Pe1, Pe2, Pe3, and Pe4) and 2272 mm in the
northern part (mapping unit PL1, PL2, PL3 and PL4) (Table 2).

12
3.1.5 Geology and landforms
Geology
The geology of the area is comprised of Neogene deposits (sands, red clays and
mbuga clays) mostly derived from Usagaran metasedimentary rocks of the Mindu,
Lugala and Nguru ya Ndege Hills. These rocks are rich in muscovite-biotite gneisses
and migmatites (Sampson and Wright, 1964).
Landforms
The topography of the study area is a mixture of flat and almost flat to undulating
slopes (0.5-6%). Local depressions are observed from place to place. Three major
landforms were described in the area (Kileo, 2000) (Table 4 and Appendix 6). These
include piedmont slopes of the Nguru ya Ndege Hills, peneplanes and plains. The
piedmonts are situated at an altitude ranging between 520 -600 m.a.s.l. The second
major landform forms the peneplanes, which are situated at an altitude between 480
to 520 m.a.s.l. The peneplanes consist of ridge summits, ridge slopes and valley
bottoms. The plains form the low laying landscape (380 to 480 m.a.s.l.) in the study
area. They are comprised of flats, floodplains and Mbuga.
3.1.6 Vegetation and land use
Natural vegetation
Under natural conditions almost the whole of the Wami plains would be lightly or
thickly wooded with very little open grassland. However, native cultivation, charcoal
burning and cutting trees for timber have replaced the natural vegetation to a very
large extent. This, together with uncontrolled grazing has led to severe soil erosion
leaving bare land in some places. There are remnants of miombo woodland in which
the typical species are Brachystegia boehmii, B. bussei, Isoberlina spp, Pterocarpus
angolensis (mninga), Afzelia quanzensis (mkongo), and Acacia nigrescens as
characteristic tree species. Pterocarpus angolensis (mninga) and Afzelia quanzensis
(mkongo) are tree timber species of economic importance and they are very valuable.
These are among the few timber species that are resistant to termite and ant damage.
Thickets, bushes, scrub and tussock grasses dominated by Panicum maximum,
Cynodon spp. and Hyparrhenia rufa are mostly found in the surveyed area.
Land use
Smallholder farming dominates the major part of the study area. Various food crops
are grown at subsistence level under rainfed conditions. These include maize,
cowpeas, cassava, beans and bananas. Few scattered fruit trees such as mango,
oranges and some cashew and coconuts are observed in some places. Extensive
grazing, clearing of woody vegetation for fire wood, timber and charcoal burning are
the most important human activities in the study area.

13
3.1.7 Major soils
Generally the soils of the Wami plains are complex of: deep, well drained, dark
greyish brown clays, and moderately well to imperfectly drained, dark greyish brown,
sandy clays and very shallow, well drained, dark reddish brown, sandy clays to clays.
The piedmont slopes have moderate to very deep, well-drained dark reddish brown
sandy clay to sandy loam soils. Undulating areas of peneplanes have moderately deep
to very deep, well-drained soils. On the valley bottoms soils are developed from
fluvial deposits and are complex of: shallow to deep, moderately well drained black
to dark brown sandy clay loam soils. The soils are stratified as a result of cyclic
deposition of materials of diverse origin (Msanya et al., 2000). Almost flat areas
(floodplains and mbuga) in general have deep to very deep, moderately well drained
to very poorly drained soils. Accumulation of secondary lime in the subsoils is
common in these soils. Dark cracking clays are characteristic in the mbuga landscape.
3.2 Mapping units description
Each mapping unit is described in a defined order. The soils were described and
distinguished on the basis of landforms, relief, parent material and soil morphology,
physical and chemical properties. Some soil profiles representing the mapping units
are presented in Appendix 1. An accompanying soil map with descriptive legend is
presented in Back cover. Summary of some site features, landform, vegetation and
land use, soil morphological and physical properties are presented in Table 3 and 4
respectively. Figure 2 gives percentage particle size distribution with soil depth of
some selected soils in the Wami plains while Figure 3 presents soil moisture
characteristics of some selected soils in the study area. Chemical properties of the
studied soils are summarised in Table 5. Detailed chemical properties of these soils
are presented in Appendix 1. Figures 4 and 5 represent relationship between some
soil chemical properties of some selected soils in the study area with soil depth. A
concise description of the soil-mapping units is therefore presented in conformity to
the legend construction.
Mapping unit Pi1
Association of: very deep, well drained, reddish brown to dark reddish brown loamy
sands to sandy clay loams, with thick reddish brown loamy sand topsoils and deep,
well drained, very dark grey to dark brown sandy clay loams, with thick very dark
grey sandy clay topsoils developed on colluvium mainly superficial sands derived
from banded muscovite-biotite gneiss and migmatites of Nguru ya Ndege mountains.
This mapping unit has gently undulating to undulating topography with slopes
ranging from 1-6 % at an altitude of 520-600 m.a.s.l. Secondary miombo woodland,
thickets and grasses are the main vegetation cover types in the unit. Extensive grazing
is common. The crops grown are maize, sunflower, sweet potatoes and sorghum.
The thick topsoils (40 cm) have loamy sand to sandy clay loam textures and are
weakly structured while subsoils (below 40 cm) are sandy clay loam and moderately
structured. In some places, few faint clay cutans are found in the subsoils, which is an

14
indication of clay illuviation from the topsoils. The topsoils have soft to slightly hard
consistence when dry, friable when moist and sticky and plastic to non-sticky and
non-plastic when wet. The consistence of subsoils is slightly hard to very hard when
dry, friable to very firm when moist, slightly sticky and slightly plastic to sticky and
plastic when wet. CaCO3 concretions are found in places in the subsoils of this
mapping unit. The soils classify as Chromi-Rodic Cambisols (Typic Haplustepts)
and Hapli-Hypocalcic Calcisols (Typic Calciustepts). Profiles NYN-P8 and NYN-
P11 are representative of soils in this mapping unit.
The topsoils have bulk densities ranging between 1.4 and 1.5 g/cc. The available
water capacity is low (96 mm/m) to medium (130 mm/m)
Soil reaction of the soils of this mapping unit ranges from slightly acid to neutral
(6.5- 6.9). Most plants thrive well in these pH values. The soils have low to medium
levels (0.66-1.46%) of organic carbon in the topsoils, which decreases with depth.
Total nitrogen levels are very low to low (0.07-0.17%) with good quality organic
matter. The available phosphorus in topsoils varies from low to medium (3.7-16.0
mg/kg).
CEC can be used as a measure of potential productivity in terms of the capacity of the
soil to retain and supply plant nutrients and can give a clue about the nature of the
clay minerals present. The soils of this land mapping unit have CEC values ranging
from very low to medium (5.32-25 cmol(+)/kg). Base saturation is more than 50%
throughout the profiles. The exchangeable calcium in this mapping unit is high to
very high (3.3- 14.46 cmol(+)/kg) while the exchangeable magnesium levels range
from high to very high (1.8-9.92 cmol(+)/kg). The levels of exchangeable potassium
are generally very low (0.05 cmol(+)/kg) in topsoils and medium in subsoils (0.42
cmol(+)/kg). The levels of exchangeable sodium are very low to low (0.03-0.21
cmol(+)/kg) in topsoils. The soils are non-sodic since they have very low ESP (<6%).

15
Table 3. Salient site features, landform, vegetation/land use and soils of the study area
Mapping
unit
symbol
Landform
Dominant
slopes (%)
Vegetation/
Land use
Soil description Area
ha % PIEDMONT (Pi)
Pi1 Alluvial fans 1.5-6 Secondary miombo woodland,
thickets, bushes and grasses. It is
used for extensive grazing,
cultivation of maize, sunflower,
sweet potatoes and sorghum.
Association of: Very deep, well drained, reddish brown to
dark reddish brown loamy sand to sandy clay loams, with
thick reddish brown loamy sand topsoils and deep, well-
drained, very dark grey to dark brown sandy clay loams,
with thick very dark grey sandy clay topsoils developed on
colluvium mainly superficial sands derived from banded
muscovite-biotite gneiss and migmatites of Nguru ya
Ndege mountains. Profiles NYN-P8 and NYN-P11 are
representative.
1524.8 4.3
PENEPLANE (Pe)
Pe1 Ridge summits 2-4 Secondary miombo woodland,
thickets, bushes and grasses. This
unit is used for extensive
grazing, forest reserve and
cultivation of maize, cassava and
sweet potatoes.
Shallow to moderately deep, well drained, dark reddish
brown to dark red sandy clays to clays, with thin dark
reddish brown sandy clay topsoils developed on colluvium
(red clays) derived from banded muscovite-biotite gneiss
and migmatites of Nguru ya Ndege mountains. In places
stones and gravels are common. In some places stones and
gravels mainly quartz occurs. Profile NYN-P12 represents
the soils of this unit.
3025.9 8.5
Pe2 Ridge slopes
with red clays.
2-3 Secondary miombo woodland,
thickets, bushes and grasses. It is
used for extensive grazing and
forest reserve.
Very deep, well-drained, dark reddish brown sandy clays,
with thick very dark reddish brown sandy clay loam
topsoils topsoils developed on colluvium (red clays)
derived from banded muscovite biotite gneiss and
migmatites of Nguru ya Ndege mountains. NYN-P1 is
representative profile.
2506.7 7.0

16
Table 3. Continued
Mapping
unit
symbol
Landform
Dominant
slopes (%)
Vegetation/
Land use
Soil description Area
ha % Pe3 Ridge slopes
with brown
sands.
2-3 Secondary miombo woodland,
thickets, bushes and grasses. This
unit is used for extensive
grazing, cultivation of maize,
coconuts and cashew nuts.
Moderately deep, well drained, dark brown sandy loams,
with very thick very dark grey sandy loam topsoils
developed on colluvial-alluvium (sands) derived from
banded muscovite-biotite gneiss and migmatites of Nguru
ya Ndege mountains. Profile NYN-P3 is representative.
4327.5 12
Pe4 Valley bottoms 0.5-2 Acacia woodland and few
scattered miombo trees, bushes,
thickets and grasses. This area is
used for extensive grazing and
forest reserve.
Complex of: very deep, moderately well drained, black,
very dark grey and dark yellowish brown sandy clay loams
and deep, moderately well drained, dark brown to brown
sandy clay loams, with thick black sandy clay loam
topsoils developed on fluvial deposits (sands and loams)
derived from banded muscovite-biotite gneiss and
migmatites of Nguru ya Ndege mountains. Profiles NYN-
P2 and NYN-P4 are representative.
3452.7 9.6
PLAIN (PL)
PL1 Flats with red
clays.
0.5-1 Acacia woodland and few
scattered miombo trees, bushes,
thickets and grasses. This area is
used for extensive grazing.
Association of: Very deep, well drained, reddish brown to
yellowish red sandy clay to clays, with thick dark brown
sandy clay loam topsoils and very deep, well drained, dark
reddish brown sandy clay to clays, with thin dark reddish
brown sandy clay loam topsoils developed on colluvium
(red clays) derived from banded muscovite-biotite gneiss
and migmatites of Nguru ya Ndege mountains.
Representative profiles are NYN-P7 and NYN-P10.
5510.4 15.4

17
Table 3. Continued
Mapping
unit
symbol
Landform
Dominant
slopes
(%)
Vegetation/
Land use
Soil description Area
PL2 Flats with brown
sands
0-0.5 Remnants of miombo woodland,
thickets, bushes and grasses
mainly used for extensive
grazing.
Very deep, stratified, well drained, very dark greyish
brown sandy clay loams, dark greyish brown and dark
yellowish brown clays developed on recent alluvial
deposits mostly sands and clays derived from banded
muscovite-biotite gneiss and migmatites of Nguru ya
Ndege mountains. Representative profile is NYN-P6.
8252.2 23.0
PL3 Floodplains 0-1 Acacia woodland and few
scattered miombo trees, bushes,
thickets and grasses. This area is
used for extensive grazing,
cultivation of rice, maize, sweet
potatoes and cassava.
Very deep, poorly drained, dark brown to very dark
greyish brown loamy sand to sandy loams, with thin very
dark grey sandy clay loam topsoils developed on colluvium
(sands) derived from banded muscovite-biotite gneiss and
migmatites of Nguru ya Ndege mountains.
Profile NYN-P9 represents soils of this unit.
4097.9 11.4
PL4 Mbuga 0.5-1 Acacia woodland scrubs and
grasses. It is used for extensive
grazing and rice cultivation.
Deep, poorly to very poorly drained, very dark grey sandy
clays, with very thick black sandy clay topsoils developed
on recent alluvial deposits (black clays) derived from
banded muscovite-biotite gneiss and migmatites of Nguru
ya Ndege mountains. Profile is NYN-P5 representative.
3111.7 8.7
Total 35,810 100
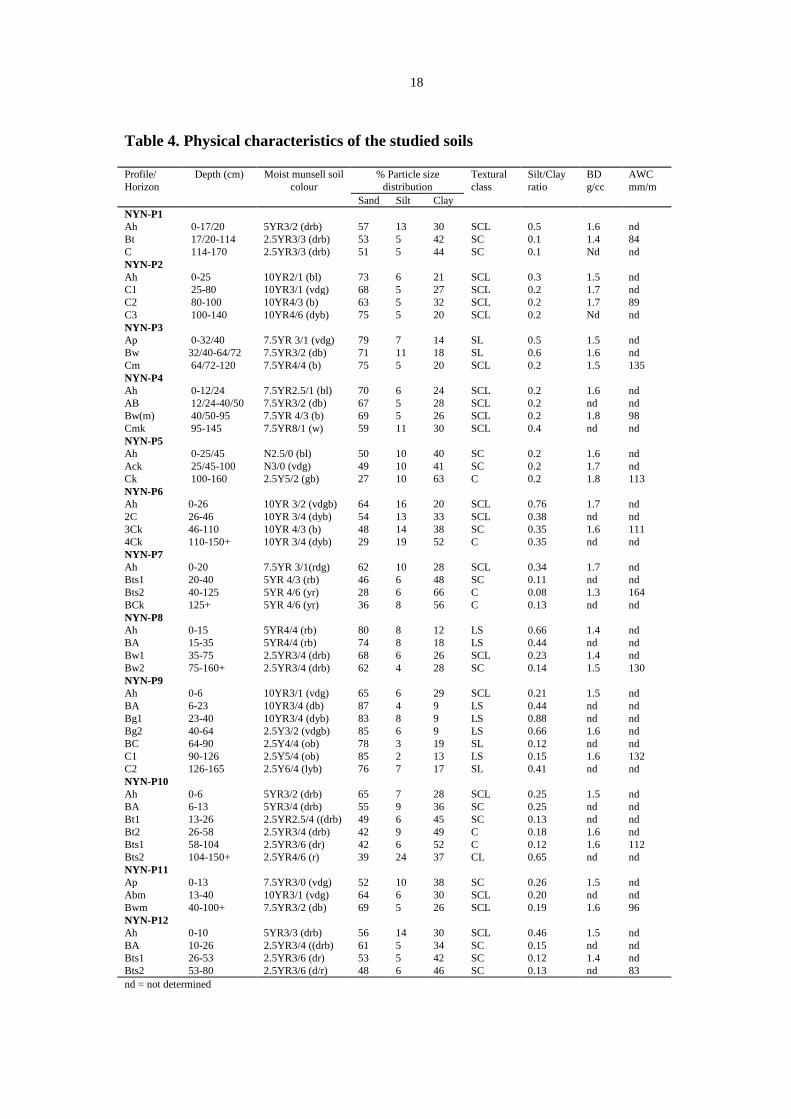
18
Table 4. Physical characteristics of the studied soils
Profile/
Horizon
Depth (cm) Moist munsell soil
colour
% Particle size
distribution
Textural
class
Silt/Clay
ratio
BD
g/cc
AWC
mm/m
Sand Silt Clay
NYN-P1
Ah
0-17/20
5YR3/2 (drb)
57
13
30
SCL
0.5
1.6
nd
Bt 17/20-114 2.5YR3/3 (drb) 53 5 42 SC 0.1 1.4 84
C 114-170 2.5YR3/3 (drb) 51 5 44 SC 0.1 Nd nd
NYN-P2
Ah 0-25 10YR2/1 (bl) 73 6 21 SCL 0.3 1.5 nd
C1 25-80 10YR3/1 (vdg) 68 5 27 SCL 0.2 1.7 nd
C2 80-100 10YR4/3 (b) 63 5 32 SCL 0.2 1.7 89
C3 100-140 10YR4/6 (dyb) 75 5 20 SCL 0.2 Nd nd
NYN-P3
Ap 0-32/40 7.5YR 3/1 (vdg) 79 7 14 SL 0.5 1.5 nd
Bw 32/40-64/72 7.5YR3/2 (db) 71 11 18 SL 0.6 1.6 nd
Cm 64/72-120 7.5YR4/4 (b) 75 5 20 SCL 0.2 1.5 135
NYN-P4
Ah 0-12/24 7.5YR2.5/1 (bl) 70 6 24 SCL 0.2 1.6 nd
AB 12/24-40/50 7.5YR3/2 (db) 67 5 28 SCL 0.2 nd nd
Bw(m) 40/50-95 7.5YR 4/3 (b) 69 5 26 SCL 0.2 1.8 98
Cmk 95-145 7.5YR8/1 (w) 59 11 30 SCL 0.4 nd nd
NYN-P5
Ah 0-25/45 N2.5/0 (bl) 50 10 40 SC 0.2 1.6 nd
Ack 25/45-100 N3/0 (vdg) 49 10 41 SC 0.2 1.7 nd
Ck 100-160 2.5Y5/2 (gb) 27 10 63 C 0.2 1.8 113
NYN-P6
Ah 0-26 10YR 3/2 (vdgb) 64 16 20 SCL 0.76 1.7 nd
2C 26-46 10YR 3/4 (dyb) 54 13 33 SCL 0.38 nd nd
3Ck 46-110 10YR 4/3 (b) 48 14 38 SC 0.35 1.6 111
4Ck 110-150+ 10YR 3/4 (dyb) 29 19 52 C 0.35 nd nd
NYN-P7
Ah 0-20 7.5YR 3/1(rdg) 62 10 28 SCL 0.34 1.7 nd
Bts1 20-40 5YR 4/3 (rb) 46 6 48 SC 0.11 nd nd
Bts2 40-125 5YR 4/6 (yr) 28 6 66 C 0.08 1.3 164
BCk 125+ 5YR 4/6 (yr) 36 8 56 C 0.13 nd nd
NYN-P8
Ah 0-15 5YR4/4 (rb) 80 8 12 LS 0.66 1.4 nd
BA 15-35 5YR4/4 (rb) 74 8 18 LS 0.44 nd nd
Bw1 35-75 2.5YR3/4 (drb) 68 6 26 SCL 0.23 1.4 nd
Bw2 75-160+ 2.5YR3/4 (drb) 62 4 28 SC 0.14 1.5 130
NYN-P9
Ah 0-6 10YR3/1 (vdg) 65 6 29 SCL 0.21 1.5 nd
BA 6-23 10YR3/4 (db) 87 4 9 LS 0.44 nd nd
Bg1 23-40 10YR3/4 (dyb) 83 8 9 LS 0.88 nd nd
Bg2 40-64 2.5Y3/2 (vdgb) 85 6 9 LS 0.66 1.6 nd
BC 64-90 2.5Y4/4 (ob) 78 3 19 SL 0.12 nd nd
C1 90-126 2.5Y5/4 (ob) 85 2 13 LS 0.15 1.6 132
C2 126-165 2.5Y6/4 (lyb) 76 7 17 SL 0.41 nd nd
NYN-P10
Ah 0-6 5YR3/2 (drb) 65 7 28 SCL 0.25 1.5 nd
BA 6-13 5YR3/4 (drb) 55 9 36 SC 0.25 nd nd
Bt1 13-26 2.5YR2.5/4 ((drb) 49 6 45 SC 0.13 nd nd
Bt2 26-58 2.5YR3/4 (drb) 42 9 49 C 0.18 1.6 nd
Bts1 58-104 2.5YR3/6 (dr) 42 6 52 C 0.12 1.6 112
Bts2 104-150+ 2.5YR4/6 (r) 39 24 37 CL 0.65 nd nd
NYN-P11
Ap 0-13 7.5YR3/0 (vdg) 52 10 38 SC 0.26 1.5 nd
Abm 13-40 10YR3/1 (vdg) 64 6 30 SCL 0.20 nd nd
Bwm 40-100+ 7.5YR3/2 (db) 69 5 26 SCL 0.19 1.6 96
NYN-P12
Ah 0-10 5YR3/3 (drb) 56 14 30 SCL 0.46 1.5 nd
BA 10-26 2.5YR3/4 ((drb) 61 5 34 SC 0.15 nd nd
Bts1 26-53 2.5YR3/6 (dr) 53 5 42 SC 0.12 1.4 nd
Bts2 53-80 2.5YR3/6 (d/r) 48 6 46 SC 0.13 nd 83
nd = not determined

19
% Sand distribution agaist soil depth
0 20 40 60 80
0
50
100
180
Dep
th (
cm
)
Percent sand
NYN-P1 NYN-P5 NYN-P6 NYN-P7
% Clay distribution against soil depth
0 20 40 60 80
0
50
100
180
Dep
th (
cm
)
Percent clay
NYN-P1 NYN-P5 NYN-P6 NYN-P7
% Silt distribution against soil depth
0 5 10 15 20
0
50
100
180
Dep
th (
cm
)
Percent silt
NYN-P1 NYN-P5 NYN-P6 NYN-P7
Figure 2. Percent particle size distribution of some selected soils in Wami Plains

20
Soils on ridge slopes (sands)
0
5
10
15
20
25
30
35
40
45
50
0.1 10 1000
Logarithmic water potential (kPa)
Vol
um
e fr
act
ion
of
wat
er (
%)
Surface soil Intermediate Subsoil
Soils on ridge slopes (clays)
0
5
10
15
20
25
30
35
40
45
0.1 10 1000
Logarithmic water potential (kPa)
Vol
um
e fr
act
ion
of
wat
er (
%)
Surface soil Intermediate Subsoil
Soils on valley bottoms (loams)
0
5
10
15
20
25
30
35
40
45
50
0.1 10 1000
Logarithmic water potential (kPa)
Vol
um
e fr
act
ion
of
wat
er (
%)
Surface soil Intermediate Subsoil
Soils on Flats (sands)
0
5
10
15
20
25
30
35
40
45
50
0.1 10 1000
Logarithmic water potential (kPa)
Vol
um
e fr
act
ion
of
wat
er (
%)
Surface soil Intermediate Subsoil
Soils on Flats (red clays)
0
5
10
15
20
25
30
35
40
45
50
0.1 10 1000
Logarithmic water potential (kPa)
Vol
um
e fr
act
ion
of
wat
er (
%)
Surface soil Intermediate Subsoil
Soils on Mbuga (black clays)
0
5
10
15
20
25
30
35
40
45
50
0.1 10 1000
Logarithmic water potential (kPa)
Vol
um
e fr
act
ion
of
wat
er (
%)
Surface soil Intermediate Subsoil

21
Figure 3. Soil moisture release curves of some selected soils in the study area
Mapping unit Pe1
Shallow to moderately deep, well drained, dark reddish brown to dark red, sandy
clays to clays, with thin dark reddish brown sandy clay topsoils developed on
colluvium (red clays) derived from banded muscovite-biotite gneiss and migmatites
of Nguru ya Ndege mountains. In places stones and gravels are common.
This mapping unit forms the ridge summits of the peneplain landscape. It has nearly
flat to undulating topography with slopes ranging from 2-3 % and an altitude of 480-
520 m.a.s.l. The unit is characterised by secondary miombo woodland, thickets,
bushes and grassland. It is used for extensive grazing and forest reserve. Maize,
cassava and sweet potatoes are grown in scattered plots in some places.
The thick topsoils (26 cm) have moderate sub-angular blocky structures and are
sandy clay loam textured while subsoils (below 26 cm) have sandy clay texture and
are weakly structured. The topsoil consistence is slightly hard when dry, friable when
moist, slightly sticky and slightly plastic when wet while the subsoils are soft when
dry, friable when moist, sticky and plastic when wet. The subsoils have few faint clay
cutans. The soils classify as Rhodi-Profondic Lixisols (Kanhaplic Rhodustalfs).
Profile NYN-P12 is a representative for the soils in this mapping unit.
These soils have low available water capacity (83 mm/m) and a bulk density of 1.5
g/cc in the topsoils.
The topsoils of this unit show a slightly acid soil reaction (pH 6.2) while subsoils are
neutral (pH 6.7). The electrical conductivity of these soils is very low (<1.7 dS/m)
indicating that no yield reduction will be caused by soluble salts in this mapping unit.
The levels of total nitrogen ranges from low in the topsoils (0.13%) to very low in
subsoils (0.03 %) while those of organic carbon are medium in the topsoils (1.29 %)
and very low (0.3 %) in the subsoils with good quality organic matter. The available
phosphorus levels are very low (<7 mg/kg) pointing out that phosphorus fertilisation
is a prerequisite. The soils have in general medium CEC (17.4 cmol(+)/kg). Base
saturation values are high (>50%). The exchangeable calcium levels are high in the
topsoils (4.2 cmol(+)/kg) and have a tendency to increase with depth. The
exchangeable magnesium levels are high (3.3 cmol(+)/kg) and increase with soil
depth. The exchangeable potassium levels are very high in topsoils (1.6 cmol(+)/kg)
while those of exchangeable sodium are low (0.21 cmol(+)/kg). The soils are found
to be non-sodic as indicated by their very low values of exchangeable sodium
percentage (ESP < 6.0).
Mapping unit Pe2
Very deep, well-drained dark reddish brown sandy clays, with thick very dark
reddish brown sandy clay loam topsoils developed on colluvium mostly red clays
derived from banded muscovite biotite gneiss and migmatites of Nguru ya Ndege
mountains.

22
This mapping unit comprises the gently undulating dissected ridge slopes of the
peneplane landscape. Slopes are between 2 and 3%. It is at an elevation of 450 to 480
m.a.s.l. The unit is characterised by secondary miombo woodland, thickets, bushes
and grasses. It is mainly used for extensive grazing and as a forest reserve. Termite
and ant mounds are common in this mapping unit.
The thick topsoils (20 cm) have weak to moderately structure with sandy clay loam
textures while most of subsoils are moderately structured and have sandy clay
textures. The deeper horizons below a depth of 114 cm from the surface are
structureless and massive. The topsoils have very friable to friable consistence when
moist and slightly sticky and slightly plastic when wet. The consistence of subsoils is
hard to slightly hard when dry, friable when moist, slightly sticky to sticky and plastic
to non-plastic when wet. In the deeper subsoils there are many medium and coarse
fresh angular and spherical rock fragments of quartzitic nature, muscovite-biotite
gneiss and migmatites. The soils classify as Rhodi-Profondic Lixisols (Kanhaplic
Rhodustalfs). Profile NYN-P1 represents these soils.
The bulk densities of these soils range from 1.5 g/cc in the topsoils to 1.4 g/cc in the
subsoils. The available water capacity of the soils in this mapping unit is low (84.8
mm/m) indicating that these soils do not store enough water readily available for
uptake by plant roots.
The soils have a net negative charge as indicated by their pH (KCl) being lower than
pH (H20). The topsoils and subsoils show neutral soil reaction while the deeper
subsoils below a depth of 114 cm are moderately alkaline. The electrical conductivity
of these soils is very low thus no yield reduction, which may be caused by soluble,
salts in this mapping unit. The levels of total nitrogen range from low in the topsoils
to very low in subsoils while organic carbon levels are medium in the topsoil and
very low in the subsoils with good quality organic matter. The available phosphorus
levels are low and thus phosphorus fertilisation is of paramount importance in these
soils. The soils of this unit have low CEC values throughout. Percentage base
saturation is high (>50%). The exchangeable calcium and magnesium levels are high
while those of exchangeable potassium range from very high in the topsoils to low in
the subsoils. These soils are non-sodic as indicated by their very low values of
exchangeable sodium percentage (Table 5).
Mapping unit Pe3
Moderately deep, well-drained, dark brown sandy loams, with very thick, very dark
grey sandy loam topsoils developed on colluvial-alluvium mostly sands derived from
banded muscovite-biotite gneiss and migmatites of Nguru ya Ndege mountains.
This mapping unit comprises the gently undulating dissected ridge slopes of the
peneplane landscape. Slopes are between 2 and 3%. It is at an elevation of 460 to 480
m.a.s.l. The unit is characterised by secondary miombo woodland, thickets, bushes

23
and grasses. It is mainly used for extensive grazing and cultivation of maize,
coconuts and cashew nuts.
The thick topsoils (40 cm) are sandy loam textured and have weak sub-angular
blocky structures while subsoils are weakly structured with loamy sand textures. The
deeper subsoils (below 72 cm) are structureless and massive with sandy clay loam
textures. Consistence of the topsoils is very friable when moist, non-sticky and non-
plastic when wet while that of subsoils is extremely hard when dry, friable when
moist, slightly sticky and slightly plastic when wet. In the deeper subsoils there are
common fine and medium fresh angular and spherical rock fragments of quartzitic
and iron in nature. The soils classify as Hypereutri-Ferralic Cambisols (Typic
Haplustepts). Profile NYN-P3 represents the soils of this land-mapping unit.
The bulk densities of this unit are 1.5 g/cc in the topsoils and 1.6 g/cc in the subsoils.
These soils have medium available water capacity (135 mm/m).
Soil reaction in this mapping unit ranges from neutral in the topsoils to slightly acid
in the subsoils as indicated by their pH values of 6.8 to 6.4 respectively. Most plants
thrive well in this range of pH values. The levels of organic carbon and total nitrogen
are very low throughout the mapping unit. The available phosphorus levels in the
topsoils are low (6.8 mg/kg) and decrease with soil depth. The soils of this unit have
very low CEC ranging from 3.5 to 3.8 cmol(+)/kg indicating that the unit is
dominated by low activity clays (kaolinitic). Base saturation is more than 50%. The
exchangeable calcium levels in this unit are low throughout with higher values in the
topsoils. The levels of exchangeable magnesium and potassium are medium
throughout while those of exchangeable sodium are low. The soils are slightly sodic
in the deeper subsoils below a depth of 72 cm from the surface with exchangeable
sodium percentage of 2.63 to 6.3 %.
Mapping unit Pe4
Complex of: Very deep, moderately well drained, black, very dark grey and dark
yellowish brown, stratified sandy clay loams and deep, moderately well drained,
dark brown to brown sandy clay loams, with thick black sandy clay loam topsoils
developed on fluvial deposits (sands and loams) derived from banded muscovite-
biotite gneiss and migmatites of Nguru ya Ndege mountains.
This mapping unit comprises the almost flat to gently undulating valley bottoms of
the peneplane landscape. Slopes are between 0.5 and 2% and it is situated at an
elevation of 440 to 480 m.a.s.l. The unit is characterised by acacia woodland and few
scattered miombo trees, bushes, thickets and grasses. It is mainly used for extensive
grazing and forest reserve.
The thick topsoils (25 cm) have weak sub-angular blocky structures while subsoils
(below 25 cm) are weakly structured to structureless and massive. The soils are sandy
clay loam textured throughout. The consistence of the topsoils is friable to very

24
friable when moist, sticky and plastic to non-sticky and non-plastic when wet. The
consistence of the subsoils ranges from very hard when dry, firm when moist, sticky
and plastic when wet to very friable when moist, slightly sticky and slightly plastic
when wet. The accumulation of secondary CaCO3 in the subsoils is common in this
unit. The soils classify as Hypereutri-Mollic Fluvisols (Fluventic Haplustolls) and
Calcari-Mollic Cambisols (Typic Haplustolls) and profiles NYN-P2 and NYN-P4
are representative for these soils.
The soils of this land-mapping unit have bulk densities ranging from 1.4 to 1.7 g/cc.
In some places the topsoils have bulk density of 1.4 g/cc and 1.6 g/cc. The bulk
densities of the subsoils range from 1.6 - 1.7 g/cc. The available water capacity of the
soils in this mapping unit range between 89.4 and 97.6 mm/m. These values of AWC
suggest that these soils do not store enough water, which is readily available for plant
roots.
Soil reaction of the soils of this mapping unit ranges from neutral to mildly alkaline
(6.7 to 7.8). These values are optimum for most crops. The soils have low to medium
levels (0.79 to 1.7%) of organic carbon in the topsoils with good quality organic
matter. Total nitrogen levels are very low to low (0.07 to 0.17%). The available
phosphorus content in the topsoils varies from low to medium (1.95 to 7.42 mg/kg)
and there is a tendency to decrease with soil depth. The soils of this mapping unit
have CEC values ranging from low to medium (6.72 to 18.2 cmol(+)/kg). Base
saturation is more than 50% throughout the mapping unit. The levels of exchangeable
calcium in this mapping unit range from high to very high (4.6 to 13.1 cmol(+)/kg).
The levels of exchangeable magnesium range from medium to very high (1.57 to
4.95 cmol(+)/kg) while those of exchangeable potassium ranges between medium to
very high (0.38 to 1.98 cmol(+)/kg). The exchangeable sodium levels are very low to
low (0.05 - 0.15 cmol(+)/kg) with very low exchangeable sodium percentage (<6%)
which indicates that these soils are non-sodic.

25
Table 5. Selected soil chemical properties of the Wami Plains Profile/
Horizon
Depth
(cm)
PH
ECe
mS/cm
%
OC
%N C:N
ratio
P
(mg/kg)
CEC
Soil
Ca Mg K Na %
BS
%
ESP
%
CaCO3
H20 KCl Bray Olsen (cmol(+)/kg NYN-P1
Ah 0-17/20 6.8 5.2 0.08 1.39 0.11 12.6 1.53 nd 11.9 5.0 3.3 1.70 0.21 86.0 1.76 6.41
Bt 17/20-114 7.0 5.4 0.04 0.44 0.06 7.3 0.26 nd 7.92 4.3 3.0 0.29 0.06 97 0.76 7.46
C 114-170 8.0 7.4 0.17 0.32 0.05 6.4 nd 0.45 4.73 3.0 1.6 0.40 0.20 110 4.20 7.61
NYN-P2
Ah 0-25 6.7 5.2 0.03 0.79 0.07 11.3 1.27 nd 6.72 4.6 1.6 0.38 0.05 98 0.74 2.15
C1 25-80 6.8 5.1 0.03 0.12 0.06 2.0 0.99 nd 7.20 4.7 1.8 0.43 0.17 99 2.40 6.66
C2 80-100 6.9 5.2 0.04 0.48 0.08 6.0 0.57 nd 10.6 7.6 2.2 0.48 0.24 99 2.30 3.20
C3 100-140 6.8 5.0 0.02 0.24 0.03 8.0 0.36 nd 5.40 3.5 1.3 0.33 0.05 97 0.93 2.80
NYN-P3
Ap 0-32/40 6.8 5.7 0.03 0.59 0.06 9.8 6.82 nd 3.80 2.0 0.84 0.73 0.10 97 2.63 2.75
Bw 32/40-64/72 6.4 4.7 0.04 0.40 0.06 6.7 3.67 nd 3.64 1.3 1.5 0.33 0.05 88 1.40 4.35
Cm 64/72-120 6.8 4.5 0.04 0.28 0.04 7.0 1.28 nd 3.52 1.6 10.6 0.52 0.22 97 6.30 2.30
NYN-P4
Ah 0-12/24 7.9 7.1 0.14 1.70 0.17 10.0 nd 7.42 18.2 13 3.2 1.98 0.15 101 0.82 2.25
AB 12/24-40/50 7.6 6.2 0.06 1.03 0.11 9.40 nd 1.11 13.9 8.7 4.1 1.61 0.13 105 0.94 3.30
Bw(m) 40/50-95 7.8 6.4 0.06 0.52 0.05 10.4 nd 1.76 12.3 8.3 5.0 0.71 0.10 114 0.89 2.65
Cmk 95-145 8.4 7.4 0.17 0.44 0.06 7.30 nd 1.48 13.6 11 2.6 1.40 0.40 109 2.94 11.8
NYN-P5
Ah 0-25/45 7.7 6.1 0.09 0.79 0.08 9.9 nd 0.96 21.2 14 5.0 0.71 0.90 97 4.25 3.95
Ack 25/45-100 8.4 7.0 0.38 0.52 0.04 13 nd 0.68 25.3 10 11 0.76 4.82 103 19.1 3.90
Ck 100-160 8.6 7.2 0.94 0.08 0.03 2.7 nd 0.31 35.9 13 11 1.37 13.8 109 38.4 4.90
NYN-P6
Ah 0-26 6.2 4.6 0.03 0.71 0.04 17.8 2.29 nd 4.84 1.9 1.5 0.39 0.13 81 2.70 3.15
2C 26-46 8.9 6.9 0.76 0.60 0.04 15.0 nd 0.16 10.8 5.4 1.4 0.54 4.70 111 43.5 3.70
3Ck 46-110 7.5 5.2 0.18 0.16 0.03 5.3 nd 0.6 13.0 4.6 3.9 0.33 5.02 106 38.6 4.65
4Ck 110-150+ 8.7 6.7 1.09 0.51 0.01 51 nd 1.11 21.8 8.2 4.7 0.54 9.50 105 43.6 4.85
NYN-P7
Ah 0-20 6.5 4.8 0.03 0.91 0.06 15.2 2.23 nd 8.3 3.4 2.3 0.99 0.12 82 1.44 2.65
Bts1 20-40 5.7 4.0 0.03 1.03 0.05 20.6 2.52 nd 8.0 2.0 2.4 0.66 0.21 67 2.60 3.55
Bts2 40-125 5.9 3.7 0.02 0.79 0.04 19.8 1.04 nd 8.4 2.7 1.8 0.44 0.44 64 5.20 3.40
BCk 125+ 6.2 3.7 0.03 0.51 0.04 12.8 0.52 nd 7.9 2.8 2.2 0.80 1.15 87 14.6 2.30

26
Table 5. Continued
Profile/
Horizon
Depth
(cm)
PH
ECe
mS/cm
%
OC
%N C:N
ratio
P
(mg/kg)
CEC
Soil
Ca Mg K Na %
BS
%
ESP
%
CaCO3
H20 KCl Bray Olsen (cmol(+)/kg NYN-P8
Ah 0-15 6.9 5.4 0.02 0.66 0.07 9 3.7 nd 5.9 3.0 1.8 0.05 0.03 84 0.51 0.14
BA 15-35 7.1 4.7 0.02 0.38 0.04 10 nd 14.7 7.2 3.9 2.4 0.05 0.05 89 0.69 1.40
Bw1 35-75 7.2 4.4 0.02 0.26 0.03 9 nd 8.08 8.0 4.6 2.7 0.04 0.06 93 0.75 4.60
Bw2 75-160+ 7.7 4.5 0.03 0.19 0.02 10 nd 2.58 9.0 5.4 3.1 0.01 0.09 95 0.01 3.80
NYN-P9
Ah 0-6 6.1 5.5 0.02 0.69 0.07 9.9 3.2 nd 3.0 0.72 0.68 0.17 0.02 86 1.9 44.0
BA 6-23 6.1 5.6 0.03 0.42 0.04 10.5 4.1 nd 2.1 1.08 0.24 0.14 0.03 71 1.5 31.0
Bg1 23-40 6.1 5.5 0.02 0.24 0.02 12 5.2 nd 2.8 1.01 0.48 0.08 0.15 61 5.6 21.0
Bg2 40-64 5.6 4.9 0.04 0.11 0.01 11 5.6 nd 2.9 1.03 0.88 0.04 0.08 70 2.7 34.0
BC 64-90 6.2 5.8 0.03 0.12 0.01 12 7.2 nd 3.39 1.10 0.40 0.04 1.06 77 31.0 60.0
C1 90-126 7.3 6.9 0.04 0.09 0.01 9.0 nd 2.0 5.2 1.81 1.53 0.02 1.13 86 21.6 99.0
C2 126-165 8.0 7.5 0.03 0.06 0.01 6.0 nd 2.0 5.4 1.92 1.39 0.05 0.70 76 13.1 75.0
NYN-P10
Ah 0-6 6.7 5.8 0.03 1.35 0.14 10 8.5 nd 9.10 4.53 2.85 0.77 0.13 91.5 1.44 54.0
BA 6-13 6.7 5.9 0.04 1.32 0.13 10 7.6 nd 11.4 4.35 2.45 0.91 0.10 68.3 0.88 41.0
Bt1 13-26 6.5 5.8 0.03 0.98 0.10 9.8 8.7 nd 11.2 3.76 2.71 1.05 0.08 67.8 0.71 34.0
Bt2 26-58 6.3 5.9 0.05 0.43 0.04 11 9.1 nd 10.4 2.52 2.44 0.83 0.11 57.0 1.06 27.0
Bts1 58-104 5.9 5.1 0.04 0.40 0.04 10 10 nd 9.20 2.07 2.07 0.39 0.15 50.6 1.62 26.0
Bts2 104-150+ 5.9 5.2 0.05 0.29 0.03 9.7 11 nd 14.9 2.61 2.07 0.24 0.34 35.2 2.27 21.0
NYN-P11
Ap 0-13 6.5 5.9 0.03 1.46 0.15 9 16.0 nd 25.0 14.5 9.92 0.04 0.21 98.5 0.84 64.0
Abm 13-40 6.6 6.0 0.04 0.94 0.10 10 9.60 nd 13.2 5.75 3.52 0.42 0.03 73.4 0.23 35.0
Bwm 40-100+ 6.6 5.9 0.02 0.66 0.07 9 6.12 nd 8.08 4.20 2.50 0.33 0.12 88.5 1.49 35.0
NYN-12
Ah 0-10 6.2 5.1 0.06 1.29 0.13 9.9 1.46 nd 17.4 4.2 3.3 1.60 0.21 53 1.21 3.6
BA 10-26 6.5 5.3 0.03 0.54 0.05 11 0.26 nd 9.9 3.3 3.4 0.28 0.06 71 0.61 3.3
Bts1 26-53 6.7 5.6 0.15 0.30 0.03 10 0.46 nd 13.2 7.0 3.7 2.40 0.26 101 1.97 2.2
Bts2 53-80 6.6 5.5 0.12 0.23 0.02 12 0.39 nd 15.7 9.0 3.1 0.98 0.19 85 1.21 2.0
nd = not determined.

27
% Organic carbon against soil depth
0 0.5 1 1.5
0
50
100
180
Soil
dep
th (
cm
)
% Organic carbon
NYN-P1 NYN-P5 NYN-P6 NYN-P7
% Total nitrogen against soil depth
0 0.05 0.1 0.15
0
50
100
180
Soil
dep
th (
cm
)
% Total nitrogen
NYN-P1 NYN-P5 NYN-P6 NYN-P7
Available P against soil depth
0 1 2 3
0
50
100
180
Soil
dep
th (
cm
)
Available phosphorus (mg/kg)
NYN-P1 NYN-P5 NYN-P6 NYN-P7
ESP against soil depth
0 20 40 60
0
50
100
180
Soil
dep
th (
cm
)
ESP
NYN-P3 NYN-P5 NYN-P6 NYN-P7
% BS against soil depth
0 50 100 150
0
50
100
180
Soil
dep
th (
cm)
%BS
NYN-P1 NYN-P5 NYN-P6 NYN-P7
CEC against soil depth
0 10 20 30 40
0
50
100
180
Soil
dep
th (
cm)
CEC cmol(+)/kg soil
NYN-P1 NYN-P5 NYN-P6 NYN-P7
Figure 4. Relationship between some soil chemical properties and soil depth

28
Mapping unit PL1
Association of: very deep, well drained, reddish brown to yellowish red sandy clays to
clays, with thick, dark brown sandy clay loam topsoils and very deep, well drained, dark
reddish brown sandy clays to clays, with thin, dark reddish brown sandy clay loam
topsoils developed on colluvium-alluvium mainly red clays derived from banded
muscovite-biotite gneiss and migmatites of Nguru ya Ndege mountains.
This mapping unit comprises the almost flat to gently undulating flats of the plain
landscape. Slopes are between 0.5 and 1 % and it is situated at an elevation of 400 to 450
m.a.s.l. This mapping unit is characterised by acacia woodland and few scattered
miombo trees, bushes, thickets and grasses and it is mainly used for extensive grazing.
The thick topsoils (20 cm) are sandy clay loam to sandy clay textured with moderate sub-
angular blocky structure while most of the subsoils have moderately strong structures
with sandy clay to clay texture. The topsoils have soft to slightly hard consistence when
dry, friable when moist and slightly sticky and slightly plastic to sticky and plastic when
wet. The consistence of the subsoils is slightly hard to hard when dry, friable when
moist, sticky and plastic to very sticky and very plastic when wet. Few, fine clay cutans
are found in the subsoils of this unit which is an indication of clay illuviation from the
overlying horizons. CaCO3 concretions are common in the subsoils of this mapping unit.
The soils classify as Chromi-Profondic Lixisols (Kanhaplic Haplustalfs) and Hapli-
Hypocalcic Calcisols (Calcic Haplustalfs). Profiles NYN-P7 and NYN-P10 represent
the soils of this unit.
The topsoils have higher bulk density (1.7 g/cc) than subsoils (1.3 g/cc). The soils of this
unit have high available water capacity (164.4 mm/m) indicating that they can store
enough water readily available for uptake by plant roots.
Topsoils show slightly acid to neutral soil reaction (pH 6.5 to 6.7) (Figure 4). The
electrical conductivity of these soils is very low thus no any yield reduction due to
soluble salts in this mapping unit. The levels of total nitrogen range from very low to
low (0.06-0.14%) in the topsoils while those of organic carbon are low to medium (0.91-
1.35%) with moderate to good quality organic matter. The available phosphorus levels
range from very low to medium thus phosphorus fertilisation is required in these soils.
These soils have low levels of CEC. Percentage base saturation levels are high (>50%).
The exchangeable calcium levels range from medium to high (3.4 to 4.53 cmol(+)/kg) in
the topsoils and decreases with soil depth. The exchangeable magnesium levels are high.
Exchangeable potassium levels range from medium to high while those of exchangeable
sodium are low in topsoils (0.12 cmol(+)/kg) and high (1.15 cmol(+)/kg) in the subsoils.
The topsoils and subsoils are non-sodic as indicated by their very low values of
exchangeable sodium percentage (<6%) while deeper subsoils below a depth of 125 cm
from the surface are moderately sodic (14.6%).

29
Mapping unit PL2
Very deep, well drained, very dark greyish brown to dark yellowish brown, stratified
sandy clay loams and clays, developed on colluvium-alluvium mostly sands and clays
derived from banded muscovite-biotite gneiss and migmatites of Nguru ya Ndege
mountains.
The topography of this mapping unit ranges between almost flat to flat with slopes of 0.5
%. It is situated at an elevation of 360 to 440 m.a.s.l. This mapping unit is characterised
by remnants of miombo woodland, bushes, thickets and grasses and it is mainly used for
extensive grazing.
The topsoils (25 cm thick) are weakly structured with sandy clay textures while the
subsoils (below 25 cm) are structureless and massive with sandy clay loam to sandy clay
textures. The consistence of the topsoils is soft when dry, friable when moist and non-
sticky and non-plastic when wet. The subsoils have very hard consistence when dry,
friable to very firm when moist and sticky and plastic when wet. There are many fine
prominent sharp mottles below a depth of 25 cm indicating poor drainage conditions.
CaCO3 concretions are common in the subsoils of this land-mapping unit. The soils
classify as Calcari-Mollic Fluvisols (Fluventic Haplustolls). The soils of this land-
mapping unit are represented by soil profile NYN-P6.
The bulk densities of these soils range from 1.6 to 1.7 g/cc. The soils of this land-
mapping unit have medium available water capacity (111.5 mm/m).
Soil reaction in this mapping unit ranges from slightly acid in the topsoils (6.2) to
strongly alkaline in the subsoils (8.9) (Figure 4). The levels of total nitrogen are very low
while those of organic carbon range from low (0.71%) in the topsoils to very low (0.16
%) in the subsoils. The available phosphorus contents in the topsoils are low (2.29
mg/kg) while in the subsoils are very low suggesting the need for phosphorus
fertilisation. The CEC values of these soils range from very low (4.84 cmol(+)/kg) in the
topsoils to medium (9 to 19.8 cmol(+)/kg) in the subsoils. The CEC increases with soil
depth owing to clay movement down the profile. Base saturation is more than 50 %. The
exchangeable calcium levels are low (1.9 cmol(+)/kg) in the topsoils and medium (5.4 to
8.2 cmol(+)/kg) in the subsoils. The levels of exchangeable magnesium range from
medium in topsoils (1.5 cmol(+)/kg) to high in the subsoils (3.9 cmol(+)/kg). The levels
of exchangeable potassium in the topsoils are medium (0.39 cmol(+)/kg) and high in the
subsoils (0.54 cmol(+)/kg) while those of exchangeable sodium are low (0.13
cmol(+)/kg) in the topsoils and very high (5.02 cmol(+)/kg) in the subsoils. The levels of
exchangeable sodium percentage in this land-mapping unit vary from non-sodic (2.7%)
in the topsoils to extremely sodic (43.5%) in the subsoils.

30
Mapping unit PL3
Very deep, poorly drained, dark brown to very dark greyish brown loamy sand to sandy
loams, with thin very dark grey sandy clay loam topsoils developed on alluvium-
colluvium mostly sands derived from banded muscovite-biotite gneiss and migmatites of
Nguru ya Ndege mountains.
The topography of this mapping unit ranges between almost flat to flat. The slopes range
between 0.5 to 1% at an elevation of 450 - 470 m.a.s.l. This mapping unit is
characterised by acacia woodland and few scattered miombo trees, bushes, thickets and
grasses and it is mainly used for extensive grazing, cultivation of maize, rice, sweet
potatoes and cassava.
The topsoils (23 cm thick) are weakly structured with sandy clay loam to loamy sand
textures while subsoils are loamy sand textured with moderate structures. The
consistence of the topsoils is soft when dry, friable when moist, non-sticky and non-
plastic when wet while subsoils are extremely hard when dry, friable when moist, sticky
and plastic when wet. Fine, distinct mottles are common in the subsoils at a depth below
40 cm from the surface. The soils of this land-mapping unit are moderate to extremely
calcareous in the subsoils below a depth of 40 cm from the surface. The soils classify as
Hypocalci-Endosodic Calcisols (Typic Calciustepts). Profile NYN-P9 represents the
soils of this land-mapping unit.
The bulk densities of this unit range between 1.5 g/cc in the topsoils and 1.6 g/cc in the
subsoils. These soils have medium available water capacity (132 mm/m).
Soil reaction of this mapping unit is generally slightly acid throughout with an average
pH value of 6.1. The levels of organic carbon and total nitrogen are low and very low
respectively in the topsoils and decreases with soil depth. The available phosphorus
contents are very low (< 6.0 mg/kg) in the topsoils and increases to medium in the
subsoils. These soils have very low levels of CEC (< 6.0 cmol(+)/kg) and high base
saturation (>50%). The levels of exchangeable calcium are low to medium with lower
values in the topsoils. The exchangeable magnesium levels range from low in the
topsoils to medium in the subsoils (0.68 to 0.88 cmol(+)/kg). The levels of exchangeable
potassium in the topsoils are generally very low (0.17 cmol(+)/kg) and decreases with
soil depth while those of exchangeable sodium are very low (0.02 cmol(+)/kg) in the
topsoils and low in the subsoils (0.15 cmol(+)/kg). The deeper subsoils to a depth below
64 cm from the surface have high exchangeable sodium levels (1.06-1.13 cmol(+)/kg)
The soils are non-sodic (ESP < 6) in topsoils to a depth of 64 cm and very strongly sodic
in the deeper subsoils below a depth of 64 cm from the surface (ESP > 31).

31
Mapping unit PL4
Deep, poorly to very poorly drained, very dark grey sandy clays, with very thick black
sandy clay topsoils developed on recent alluvium mainly black clays derived from
banded muscovite-biotite gneiss and migmatites of Nguru ya Ndege mountains.
This mapping unit comprises flat to almost flat topography with slopes ranging between
0 to 1% at an elevation of 380 to 420 m.a.s.l. It is mainly a depositional area of materials
from higher geomorphic units. The unit has a low gilgai microrelief, which occur nearly
everywhere. This mapping unit is characterised by acacia woodland, scrubs and grasses
and it is mainly used for extensive grazing and cultivation of rice and maize.
The thick topsoils (45 cm) have weak to moderate subangular blocky structures and are
sandy clay textured. Subsoils have moderate angular blocky and wedge-shaped structures
with clay textures. The deeper subsoils to a depth below 100 cm from the surface have
weak, very coarse prisms. The consistence of these soils is very hard when dry, firm to
very firm when moist and sticky and plastic to very sticky and very plastic when wet.
These soils are moderate to strongly calcareous in the subsoils. Deep, moderately to
widely spaced hexagonal cracks are common during dry season due to alternate swelling
and shrinking of the expanding clays. Very few moderately thick slickensides are present
in the profiles below a depth of 100 cm from the surface. The soils classify as Endosodi-
Pellic Vertisols (Sodic Haplusterts). Profile NYN-P5 represents the soils of this land-
mapping unit.
The bulk densities of these soils range from 1.6 g/cc in the topsoils to 1.7 g/cc in the
subsoils. The available water capacity of the soils in this land-mapping unit is medium
(113.4 mm/m soil depth).
The soils of this unit have pH (KCl), which is lower than pH (H20), indicating that the
soils have a net negative charge. The topsoils are mildly alkaline (pH 7.7) and pH
increases gradually with soil depth to moderately and strongly alkaline (pH 8.4 to 8.6) in
the subsoils.

32
pH against soil depth
5 6 7 8 9 10
0
50
100
180
Soil
dep
th (
cm
)
Soil pH
NYN-P1 NYN-P5 NYN-P6 NYN-P7
Figure 5. Relationship between soil pH of some soils in Wami Plains and soil depth
The levels of total nitrogen and organic carbon are generally very low and low
respectively in the topsoils and are both very low in the subsoils. These soils have good
quality organic matter with the C:N ratio ranging from 8-13. The available phosphorus
contents in the topsoils are very low (0.96 mg/kg), suggesting the need for phosphorus
fertilisation in this mapping unit. The soils of this mapping unit have high CEC and high
percent base saturation indicating that the soils are generally fertile in terms of
macronutrients, which is a general characteristic of many Vertisols. The topsoils CEC
values are 21.2 cmol(+)/kg and increases with soil depth to 35.9 cmol(+)/kg soil. Base
saturation is >50% with high calcium and magnesium contents. The Ca:Mg ratio is 3.02
in the topsoils which is favourable for most crops. The CEC of clay is fairly high in these
soils suggesting high contents of smectite in the clay fraction. The levels of
exchangeable potassium are medium while those of exchangeable sodium in the topsoils
are high (0.90 cmol(+)/kg) and increases with soil depth.
Vertisols are known to have high agricultural potential, but require special management
practices for optimal rainfed or irrigated agriculture. They are characterised by relatively
high chemical fertility with poor workability due to their poor physical properties. Poor
infiltration of water and high vulnerability to erosion are the major problems associated
with poor physical properties of these soils. Management practices should therefore aim
at increasing infiltration rates of water as well as reducing erosion hazard in these soils.
Mulching with crop residues, contour cultivation and contour banding are some of the
management practices that have proved to be successful for production of crops (rice and
maize) in these soils.

33
3.3 Soil classification
Tables 6 and 7 give a summary of morphological and diagnostic features while Table 8
presents classification of the studied soils according to both WRB and USDA Taxonomy
systems respectively. Using FAO system of classification, five soil levels were identified
namely; Lixisols, Fluvisols, Vertisols, Cambisols and Calcisols. The Cambisols are
found on the peneplane (ridge slopes with sandy soils, valley bottoms) and on the
piedmont. Lixisols are dominant on the Peneplane (ridge summits, ridge slopes with red
soils) and on the flats with red soils. Floodplains, some parts of the piedmont and some
parts of Flats with red soils are dominated by Calcisols. Flats with sandy soils and some
parts of valley bottoms are dominated by Fluvisols while Vertisols are dominant in the
Mbuga.

34
Table 6. Summary of morphological and diagnostic features of studied
soils (FAO, 1998)
Profile Diagnostic horizons Other diagnostic features,
properties/ materials
NYN-P1 Ochric horizon,
Argic horizon
Profondic, Rhodic
NYN-P2 Mollic horizon Mollic, Hypereutric
NYN-P3 Ochric horizon,
Cambic Horizon
Hyperferralic, Hypereutric
NYN-P4 Mollic horizon,
Cambic horizon
Calcaric, Hypereutric
NYN-P5 Ochric horizon,
Vertic horizon
Hypereutric,
Pellic, Endosodic
NYN-P6 Mollic horizon Mollic, Calcaric,
Endosodic, Hypereutric
NYN-P7 Ochric horizon,
Argic horizon
Profondic, Chromic
NYN-P8 Ochric horizon,
Cambic horizon
Rhodic, Chromic,
Hypereutric
NYN-P9 Ochric horizon,
Calcic horizon
Endosodic, Hypocalcic
NYN-P10 Ochric horizon,
Argic horizon,
Calcic horizon
Hypocalcic, Haplic
NYN-P11 Ochric horizon,
Cambic horizon,
Calcic horizon
Hypocalcic, Haplic
NYN-P12 Ochric horizon,
Argic horizon
Rhodic, Chromic,
Profondic

35
Table 7. Summary of morphological and diagnostic features of studied soils
(Soil Survey Staff, 1998)
Profile Diagnostic horizons Other diagnostic features
NYN-P1 Ochric epipedon,
Argillic horizon
Ustic SMR,
Isohyperthermic STR
NYN-P2 Mollic epipedon Ustic SMR,
Isohyperthermic STR
NYN-P3 Ochric epipedon,
Cambic horizon
Ustic SMR,
Isohyperthermic STR
NYN-P4 Mollic epipedon,
Cambic horizon
Ustic SMR,
Isohyperthermic STR
NYN-P5 Ochric epipedon
Ustic SMR,
Isohyperthermic STR,
Slickensides, gilgai micro-relief
NYN-P6 Mollic epipedon
Ustic SMR,
Isohyperthermic STR
NYN-P7 Ochric epipedon,
Argillic horizon
Ustic SMR,
Isohyperthermic STR
NYN-P8 Ochric epipedon,
Cambic horizon
Ustic SMR,
Isohyperthermic STR
NYN-P9 Ochric epipedon,
Calcic horizon
Ustic SMR,
Isohyperthermic STR
NYN-P10 Ochric epipedon,
Argillic horizon,
Calcic horizon
Ustic SMR,
Isohyperthermic STR
NYN-P11 Ochric epipedon,
Cambic horizon,
Calcic horizon
Ustic SMR,
Isohyperthermic STR
NYN-P12 Ochric epipedon,
Argillic horizon
Ustic SMR,
Isohyperthermic STR
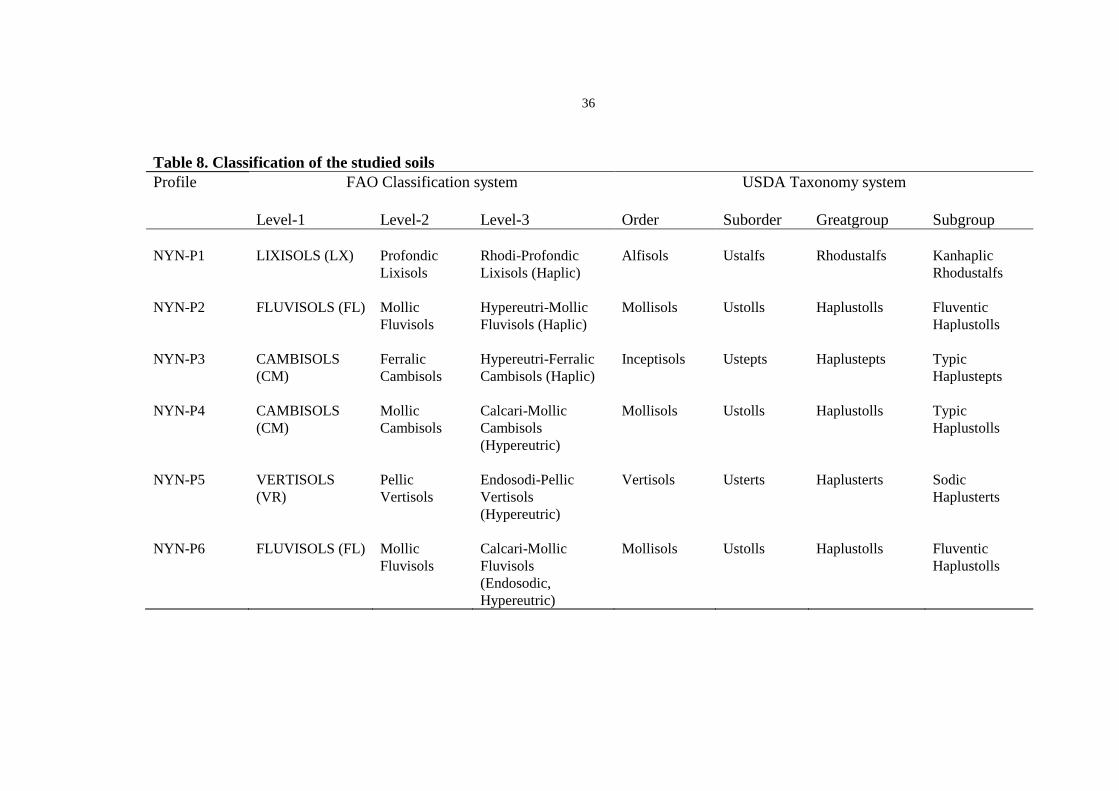
36
Table 8. Classification of the studied soils
Profile FAO Classification system
USDA Taxonomy system
Level-1 Level-2 Level-3 Order Suborder Greatgroup Subgroup
NYN-P1 LIXISOLS (LX) Profondic
Lixisols
Rhodi-Profondic
Lixisols (Haplic)
Alfisols Ustalfs Rhodustalfs Kanhaplic
Rhodustalfs
NYN-P2 FLUVISOLS (FL) Mollic
Fluvisols
Hypereutri-Mollic
Fluvisols (Haplic)
Mollisols Ustolls Haplustolls Fluventic
Haplustolls
NYN-P3 CAMBISOLS
(CM)
Ferralic
Cambisols
Hypereutri-Ferralic
Cambisols (Haplic)
Inceptisols Ustepts Haplustepts Typic
Haplustepts
NYN-P4 CAMBISOLS
(CM)
Mollic
Cambisols
Calcari-Mollic
Cambisols
(Hypereutric)
Mollisols Ustolls Haplustolls Typic
Haplustolls
NYN-P5 VERTISOLS
(VR)
Pellic
Vertisols
Endosodi-Pellic
Vertisols
(Hypereutric)
Vertisols Usterts Haplusterts Sodic
Haplusterts
NYN-P6 FLUVISOLS (FL) Mollic
Fluvisols
Calcari-Mollic
Fluvisols
(Endosodic,
Hypereutric)
Mollisols Ustolls Haplustolls Fluventic
Haplustolls

37
Table 8. Continued
Profile FAO classification system USDA Taxonomy system
Level-1 Level-2 Level-3 Order Suborder Greatgroup Subgroup
NYN-P7 LIXISOLS (LX) Profondic
Lixisols
Chromi-Profondic
Lixisols (Haplic)
Alfisols Ustalfs Haplustalfs Kanhaplic
Haplustalfs
NYN-P8 CAMBISOLS
(CM)
Rhodic
Cambisols
Chromi-Rhodic
Cambisols
(Hypereutric)
Inceptisols Ustepts Haplustepts Typic
Haplustepts
NYN-P9 CALCISOLS
(CL)
Endosodic
Calcisols
Hypocalci-Endosodic
Calcisols (Haplic)
Inceptisols Ustepts Calciustepts Typic
Calciustepts
NYN-P10 CALCISOLS
(CL)
Hypocalcic
Calcisols
Hapli-Hypocalcic
Calcisols
Alfisols Ustalfs Haplustalfs Calcic
Haplustalfs
NYN-P11 CALCISOLS
(CL)
Hypocalcic
Calcisols
Hapli-Hypocalcic
Calcisols
Inceptisols Ustepts Calciustepts Typic
Calciustepts
NYN-P12 LIXISOLS (LX) Profondic
Lixisols
Rhodi-Profondic
Lixisols (Chromic)
Alfisols Ustalfs Rhodustalfs Kanhaplic
Rhodustalfs

38
3.4 Land evaluation
3.4.1 Description of land utilisation types (LUTs)
Three dominant land utilisation types were selected for evaluation in this study (Table
9). The selected LUTs were evaluated on the basis of management levels, social
preferences and type of crop(s) grown in the area. A brief description of the selected
three LUTs (low input rainfed maize, low input rainfed rice and extensive grazing) is
presented in Table 9. The results of agro-economic survey for the three LUTs are
summarized in Tables 10, 11 and 12 respectively.
Low input rainfed maize production (LIRMP)
Maize is grown in many parts of the area except in those areas where there is water
logging condition e.g. in Mbuga. It is characterised by low capital and labour input and
is one of the main food crop in the area. Most farmers use hand hoe and family labour in
land preparation, planting and weeding. Planting is done in February/March and
harvesting is done in June/July. The average maize grain yields ranges between 1.25-5.0
tonnes per ha (Table 10). The average labour requirement for maize production per
season is about 60 MD/ha.

39
Table 9. Description of land utilisation types in Wami Plains
Land
Utilisation
Type (LUT)
Produce Farming System Labour intensity
(MD/ha)
Level of
technical
knowledge
Farm
size (ha)
Land tenure Range of
observed yield
(kg/ha)
Low input
rainfed maize
production
Maize; local
varieties
Single and
mixed/sequentia
l cropping
Low
50-70
Low; (extension,
credit, marketing
required)
0.5-17 Family farm 1250-5000
Low input
rainfed rice
production
Rice; local
varieties
Single
(monoculture)
High
133-210
Low; (extension,
credit, marketing
required)
1-7 Family farm 1200-3000
Extensive
grazing
Grazing of local
breeds
Grazing of
cattle, goats and
sheep
High
730
MD/farmer/year
Low; (extension,
credit, marketing
required)
8-900 Family farm
Meat 4950
kg/farmer/year
Milk 51,100
litres/farmer/year

40
Table 10. Agro-economic survey results for low input rainfed maize production in Wami Plains
Smallholder low-input rainfed Maize
Economic component Unit Range Calculation based on
maximum attainable yield
Yield kg/ha 1250-5000 ...........
Maximum attainable yield kg/ha ............. 6250
Farm gate price of product TShs/kg 100.00 100.00
Returns TShs/ha 125,000.00-500,000.00 625,000.00
Annual costs
1. Labour inputs
(i) Land preparation MD/ha 16-26 21
(ii) Planting MD/ha 4-14 9
(iii) Weeding MD/ha 8-16 12
(iv) Harvesting MD/ha 8-18 13
(v) Shelling and pesticide application MD/ha 4-8 6
Total labour input MD/ha 50-70 60
Sub-total labour cost at 1000 TShs/MD TShs/ha 50,000.00-70,000.00 60,000.00
2. Material input costs
(i) Seeds (local variety) TShs/ha 1,000.00-2,000.00 1,500.00
(ii)Pesticides TShs/ha 9,000.00-15,000.00 12,000.00
Sub-total input costs TShs/ha 10,000.00-17,000.00 13,500.00
Total costs TShs/ha 60,000.00-87,000.00 73,500.00
Gross margin (net benefit) TShs/ha 65,000.00-413,000.00 .............
Maximum gross margin TShs/ha ............. 551,500.00

41
Table 11. Agro-economic survey results for low input rainfed rice production in Wami Plains
Smallholder low-input rainfed Rice
Economic component Unit Range Calculation based on
maximum attainable yield
Yield kg/ha 1200-3000 ...........
Maximum attainable yield kg/ha ............. 5000
Farm gate price of product TShs/kg 187.50 187.50
Returns TShs/ha 225,000.00-562,500.00 937,500.00
Annual costs
1. Labour inputs
(i) Land preparation MD/ha 25-40 33
(ii) Planting MD/ha 7.5-35 21
(iii) Weeding MD/ha 35-70 53
(iv) Thinning MD/ha 10-35 23
(v) Harvesting MD/ha 35-75 55
Total labour input MD/ha 133-210 172
Sub-total labour cost at 1,000 Tsh/MD TShs/ha 133,000.00-210,000.00 172,000.00
2. Material input costs
(i) Seeds (Local variety) TShs/ha 10,000.00
Sub-total input costs TShs/ha 10,000.00 10,000.00
Total costs TShs/ha 143,000.00-220,000.00 182,000.00
Gross margin (net benefit) TShs/ha 82,000.00-342,500.00 .............
Maximum gross margin TShs/ha ............. 755,500.00

42
Table 12. Agro-economic survey results for extensive grazing in Wami Plains
Extensive grazing
Economic component Range Calculation based on maximum
attainable yield
Calculation based on maximum
attainable yield
Meat Milk Meat Milk
Yield 330-7150 kg/farmer/year 2190-32850 litres/farmer/year ………..
Maximum attainable yield ………….. ............. 4950 kg/farmer/year 51,100 Litres/farmer/year
Farm gate price of product 500.00 TShs/kg 125 TShs/litre 500.00 TShs/litre 125 TShs/litre
Returns 165,000.00-3,575,000.00
TShs/year
273,750.00-4,106,250.00
TShs/year
2,475,000.00 TShs/year 6,387,500.00 TShs/year
Total returns 8,862,500.00 TShs/year
Annual costs
1. Labour inputs
Cattle rearing 608 MD/farmer/year
Milking 122 MD/farmer/year
Total labour input cost 730 MD/farmer/year
Sub-total labour cost at
500.00 TShs/MD
365,000.00 TShs/year
2. Material input costs
Medicine
Terramycin
429 mills/cow/year
18,018-390,390 00 TShs/year 204,204.00 TShs/year
Parvexon
14.6 mills/cow/year
8,760-189,800 00 TShs/year 99,280.00 TShs/year
Berenil 22 mills/cow/year 16,500-357,500 00 TShs/year 187,000.00 TShs/year
Stelladon
910 mills/cow/year
38,220-828,100 00 TShs/year 433,160.00 TShs/year
Sub-total cost of input 81,498-1,765,790 00 TShs/year 923,644.00 TShs/year
Total costs 1,288,644.00 TShs/year
Maximum gross margin ............. 7,573,856.00 TShs/year
MD= Mandays; ha = Hectare; kg = Kilogram; TShs = Tanzanian shillings

43
Low input rainfed rice production (LIRRP)
Rice is grown mainly in depressions, Mbuga and floodplains. It is also one of the main
food crop in the area. It is characterised by low capital and labour input. Hand hoe and
family labour are commonly used in land preparation. The average labour is 172 MD/ha
(Table 11). Planting starts in December to February and harvesting is done in May/June.
The average yield is between 1.2 - 3.0 tonnes per ha.
Extensive grazing (E)
Extensive grazing is an important land use in the area. Cattle are primarily kept as bank
account and as a source of meat and milk for the family. Sheep and goats are primarily
kept for meat production. Livestock is mainly perceived as material wealth even at the
sacrifice of the animal health and milking quality. The animals are communally grazed
within or outside the village area. The herd sizes do not consider the carrying capacity of
the available grazing lands. Grazing lands are used in their present unimproved state. In
most cases after the crop harvest, animals are led to feed on crop residues (maize,
cowpeas and rice stubble) left in the arable fields. In dry season herds may be grazed at
very long distances from the homesteads e.g. from Wami Plains to Kingolwira and
Pangawe areas (about 30-40 km). Apart from inadequate pastures during dry season
livestock diseases such as trypanosomiasis and east cost fever are rampant in the area.
However, vertinary services are not available. This LUT is basically characterised by
low capital investment and labour intensity (average labour is 730 MD/farmer/year)
(Table 12). Overgrazing and severe soil erosion are some of the adverse environmental
consequences associated with extensive grazing in the study area.
Common livestock diseases in the Wami area include: (1) Bacterial diseases:
Pneumonitis (Lung disease); Pylonephritis (kukojoa damu); and fever (2) Protozoan
diseases: East Coast Fever (Ndigana kali); Anaplasmosis (Ndigana baridi); Babesiosis
(kukojoa damu) and Trypanosomiasis (Ndorobo) (3) Viral diseases (Foot and Mouth
Disease (Orkulu) and (4) Lumpy Skin Disease. Livestock keepers in Wami plains travel
long distances to Morogoro town to purchase drugs to cure their livestock. Common
drugs used in area and their prices are: Terramycin at 14 TShs/cm3, Parvexon at 200
TShs/cm3, Berenil at 250 TShs/cm
3 and Stelladon at 14 TShs/cm
3.
3.4.2 Land suitability classification
Land suitability that takes into account a sustainable use of the lands, not only depends
upon the environmental resources but also on socio-economic factors (FAO, 1976;
Kimaro and Kips, 1991; Rossiter, 1995; 1996). In this study both biophysical as well as
socio-economic resources were evaluated for the lands of Wami plain as presented
below.

44
Physical suitability classification
The physical suitability classification for low input rainfed maize, low input rainfed rice
and extensive grazing in the study area are presented in Table 13. Predicted yield levels
are presented in Table 14.
Of the nine mapping units identified in the area, three mapping units (PL1, Pe1, Pe3 and
some parts of Pi1) have moderate potential for low input rainfed maize production with
yield predictions of 5,000 kg/ha (Tables 13 and 14) and annual returns of 500,000 TShs
ha-1
yr-1
. The most limiting factors are nutrients availability, nutrients retention, moisture
availability and erosion hazards. Three mapping units (PL2, PL3, Pe2 and some parts of
mapping unit Pi1) have poor potential with yield prediction of 2,500 kg/ha and annual
returns of 250,000 TShs ha-1
yr-1
. The limiting factors are nutrient availability and
oxygen availability in the root zone. Two mapping units (Pe4, PL4) presently have very
poor potential for the production of maize crop. These units have severe limitations
associated with flooding hazards and oxygen availability in the root zone.
Five mapping units (PL1, PL3, PL4, Pe1, Pe2 and some parts of mapping units Pe4 and
Pi1) have poor potential for low input rainfed rice production (Table 13). Predicted yield
levels for the LUT in these mapping units are 2000 kg/ha (Table 14) with annual returns
of 196,274.00 TShs ha-1
yr-1
. Nutrients availability, temperature regime in the growing
period and soil wetness are the most limiting factors for rice production. The rest of the
land mapping units (PL2, Pe3 and some parts of Pe4 and Pi1) physically have very poor
potential for rice production due to severe limitations associated with nutrients
availability and unfavourable temperature in the growing period.
Six land mapping units (PL1, PL2, PL3, Pe1, Pe2, Pe3 and some parts of Pe4) have
moderate potential for extensive grazing (Table 13). Predicted yield levels of these land-
mapping units are 3969 kg of meat per farmer per year and 59130 litres of milk per
farmer per year (Table 14). The expected annual returns amount to about 10,057,500.00
TShs per farmer per year. The most limiting factors of the lands for this LUT are: poor
accessibility of animals to grazing lands, poor climatic conditions (temperature),
biological hazards (tsetse and ticks infestation), availability of drinking water and
moisture availability for the production of enough pasture for the livestock throughout
the year. Two land mapping units (PL4, Pi1 and some parts of Pe4) physically have poor
potential for extensive grazing with the yield predictions of 1980 kg per farmer per year
for meat and 29565 litres of milk per farmer per year. The annual returns amount to
5,028,750.00 TShs per farmer per year. The most severe limitations are bushy coverage
which hinders accessibility of animals to grazing lands and biological hazards especially
tsetse and ticks infestation.

45
Economic suitability classification
The results of economic suitability evaluation are presented in Table 15. The gross
margins for each LUT are summarised in Table 16. Three mapping units (PL1, Pe1, Pe3
and some parts of mapping unit Pi1) were economically classified as moderately
suitable (s2) for maize production. Gross margins for maize production in these
mapping units amount to 415,402.50 TShs ha-1
yr-1
(Table 16). Other three mapping
units (PL2, PL3, Pe2 and some parts of Pi1) were economically classified as marginally
suitable (s3) for maize production with gross margins of 165,402.50 TShs ha-1
yr-1
. Two
mapping units (PL4 and Pe4) were economically classified as not suitable (n1) for this
LUT.
Most parts of the study area which includes land mapping units PL1, PL3, PL4, Pe1,
Pe2 and some parts of Pe4 and Pi1 were economically classified as marginally suitable
(s3) for rice production with gross margin of 196,274.00 TShs ha-1
yr-1
. Land mapping
units PL2, Pe3 and some parts of Pe4 and Pi1 were economically classified as not
suitable (n1) for rice production.
Seven mapping units (PL1, PL2, PL3, Pe1, Pe2, Pe3 and Pe4) were economically
classified as highly suitable (s1) for extensive grazing with gross margins of
9,563,085.00 TShs/farmer/yr. Two mapping units (PL4 and Pi1) were classified as
marginally suitable (s3) for extensive grazing with gross margins of 4,534,335.00
TShs/farmer/yr.
From these results it appears clearly that the lands of the Wami plains are potentially
and economically marginal lands for smallholder production of food crops (maize and
rice). Basing on current observed and predicted smallholder farmer’s yields and returns
and the present marketing structure and prices, use of high cost input materials at the
present level of production is not feasible. The lands of the Wami plains show clearly
that there is high potential for large-scale investment in food production. However,
major investment should consider the introduction of water harvesting techniques, crop
selection including drought resistant crops, control of soil erosion, and mechanisation.
Management of saline and sodic soils and use of organic and inorganic fertilisers are
prerequisite. As for extensive grazing more than 80% of the Wami lands are moderately
and highly suitable both potentially and economically. Prospects for improved grazing
are high in the area. Promising high returns under high investment in this LUT could be
realised easily given the potential marketing sources and extension services available in
the expanding Morogoro municipality and Dar es Salaam city.

46
Table 13. Limiting factors and physical suitability classification for low input rainfed maize, low input rainfed
rice and extensive grazing in Wami plains
LMUs SOIL TYPE MAIZE RICE EXTENSIVE GRAZING AREA
RATING ha
Pi1 Chromi-Rhodic Cambisols 3na 4tg 3acc 920
Hapli-Hypocalcic Calcisols 2m/na 3tr/wt 3acc 613
Pe1 Rhodi-Profondic Lixisols 2na/nr 3na/tr/wt 2acc/bh/clm/m 3029
Pe2 Rhodi-Profondic Lixisols 3na 3na/tr/wt 2acc/bh/clm/m 2508
Pe3 Hypereutri-Ferralic Cambisols 2e/na/nr 4na 2acc/bh/clm 4331
Pe4 Hypereutri-Mollic Fluvisols 4df 4na 2bh/clm 2422
Calcari-Mollic Cambisols 4df 3na/tr 3acc 1038
PL1 Chromi-Profondic Lixisols 2df/na/nr 3na/tr 2acc/bh/clm/dwa 4409
Hapli-Hypocalcic Calcisols 2df/m/na/nr 3tr 2acc/bh/clm/dwa/m 1102
PL2 Calcari-Mollic Fluvisols 3na 4na 2acc/bh/clm/dwa/m 8767
PL3 Hypocalci-Endosodic Calcisols 3o 3na/tr 2bh/clm/m 4152
PL4 Endosodi-Pellic Vertisols 4df/o 3na/tr 3bh 3181
m = moisture availability, na = nutrients availability, nr = nutrients retention, df = duration of flooding, o = oxygen availability to roots, tr =
temperature regime , wt = soil wetness, tg = temperature in growing period, acc = accessibility of animals to grazing lands, bh = biological
hazards (tsetse ticks), clm = climatic conditions, dwa = drinking water availability.

47
Table 14. Predicted yields for low input rainfed maize, low input rainfed rice and extensive grazing in Wami plains
LMUs SOIL TYPE MAIZE
RICE
EXTENSIVE GRAZING
Maize grain (kg ha-1
) Rice (kg ha-1
) Meat (kg/farmer/yr) Milk (litres/farmer/yr)
Individual
soil
Overall Individual
soil
Overall Individual
soil
Overall Individual
soil
Overall
Pi1 Chromi-Rhodic
Cambisols
2500 0 1980 29565
Hapli-Hypocalcic
Calcisols
5000 3500 2000 800 1980 1980 29565 29565
Pe1 Rhodi-Profondic
Lixisols
5000 5000 2000 2000 3960 3960 59130 59130
Pe2 Rhodi-Profondic
Lixisols
2500 2500 2000 2000 3960 3960 59130 59130
Pe3 Hypereutri-Ferralic
Cambisols
5000 5000 0 0 3960 3960 59130 59130
Pe4 Hypereutri-Mollic
Fluvisols
0 0 0 3960 59130
Calcari-Mollic
Cambisols
0 0 2000 600 1980 3366 29565 50261
PL1 Chromi-Profondic
Lixisols
5000 2000 3960 59130
Hapli-Hypocalcic
Calcisols
5000 5000 2000 2000 3960 3960 59130 59130
PL2 Calcari-Mollic
Fluvisols
2500 2500 0 0 3960 3960 59130 59130
PL3 Hypocalci-
Endosodic
Calcisols
2500 2500 2000 2000 3960 3960 59130 59130
PL4 Endosodi-Pellic
Vertisols
0 0 2000 2000 1980 1980 29565 29565

48
Table 15. Economic suitability classification for low input rainfed maize,
low input rainfed rice and extensive grazing LMUs SOIL TYPE MAIZE RICE EXTENSIVE GRAZING
RATING
Pi1 Chromi-Rhodic Cambisols s3 n1 s3
Hapli-Hypocalcic Calcisols s2 s3 s3
Pe1 Rhodi-Profondic Lixisols s2 s3 s1
Pe2 Rhodi-Profondic Lixisols s3 s3 s1
Pe3 Hypereutri-Ferralic Cambisols s2 n1 s1
Pe4 Hypereutri-Mollic Fluvisols n1 n1 s1
Calcari-Mollic Cambisols n1 n1 s1
PL1 Chromi-Profondic Lixisols s2 s3 s1
Hapli-Hypocalcic Calcisols s2 s3 s1
PL2 Calcari-Mollic Fluvisols s3 n1 s1
PL3 Hypocalci-Endosodic Calcisols s3 s3 s1
PL4 Endosodi-Pellic Vertisols n1 s3 s3

49
Table 16. Predicted gross margins for low input rainfed maize, low input
rainfed rice and extensive grazing LMUs SOIL TYPE MAIZE RICE EXTENSIVE GRAZING
TShs ha-1
yr-1
TShs ha-1
yr-1
TShs/farmer/year
Individual
soil
Overall Individual
soil
Overall Individual
soil
Overall
Pi1 Chromi-Rhodic
Cambisols
165,402.50 0 4,534,335.00
Hapli-Hypocalcic
Calcisols
415,402.50 265,402.50 196,274.00 78,509.60 4,534,335.00 4,534,335.00
Pe1 Rhodi-Profondic
Lixisols
415,402.50 415,402.50 196,274.00 196,274.00 9,563,085.00 9,563,085.00
Pe2 Rhodi-Profondic
Lixisols
165,402.50 165,402.50 196,274.00 196,274.00 9,563,085.00 9,563,085.00
Pe3 Hypereutri-
Ferralic
Cambisols
415,402.50 415,402.50 0 0 9,563,085.00 9,563,085.00
Pe4 Hypereutri-Mollic
Fluvisols
0 0 0 0 9,563,085.00
Calcari-Mollic
Cambisols
0 0 196,274.00 196,274.00 4,534,335.00 8,054,460.00
PL1 Chromi-Profondic
Lixisols
415,402.50 196,274.00 9,563,085.00
Hapli-Hypocalcic
Calcisols
415,402.50 415,402.50 196,274.00 196,274.00 9,563,085.00 9,563,085.00
PL2 Calcari-Mollic
Fluvisols
165,402.50 165,402.50 0 0 9,563,085.00 9,563,085.00
PL3 Hypocalci-
Endosodic
Calcisols
165,402.50 165,402.50 196,274.00 196,274.00 9,563,085.00 9,563,085.00
PL4 Endosodi-Pellic
Vertisols
0 0 196,274.00 196,274.00 4,534,335.00 4,534,335.00

50
4.0 CONCLUSIONS AND RECOMMENDATIONS
4.1 Conclusions
4.1.1 Land and soil characteristics
Climate, landform patterns and parent materials have had profound influence on types and
distribution of soils in the study area. The piedmont slopes and peneplains with colluvial
materials have deep to very deep soils. The dissection of the piedmont and peneplain slopes
coupled with thin topsoils and shallow soils in some places could be explained by high rate of
soil erosion in these land units. Valley bottoms and plains have medium textures and are
stratified as a result of cyclic deposition of materials of diverse origin.
Soils of Wami plains are mostly sandy clay loams and are well drained except on the valley
bottoms, floodplains and mbuga where they are clayey and poorly drained. Soil reaction
ranges between slightly acid to alkaline and are generally poor in soil chemical fertility. These
soils classify into five major soil types namely: Lixisols, Fluvisols, Vertisols, Cambisols and
Calcisols.
4.1.2 Land suitability classification
The land suitability classification carried out in this study can be used as a basis for the
preparation and implementation of a land use plan in Wami plains in the Morogoro Rural
District. Sound land use planning is highly essential for the lands of the Wami plains due to
the fact that many areas appear to have potential for intensive land use while at the same time
having potential for degradation and some areas not suited to some land use due to a
combination of various limitations which cannot be solved, within the present economic
context of the of the area.
Potential and economic suitability of the lands for the studied LUTs
About 80% of the area is rated potentially and economically marginally to moderately suitable
while the rest of the lands (about 20%) are potentially and economically not suitable for
smallholder rainfed maize production. These areas have moderate to severe limitations related
to: soil erosion hazards, soil fertility and moisture availability.
Only about 55% of the area is classified as potentially and economically marginally suitable,
while 45% is potentially and economically not currently suitable for low input rainfed rice
production. These lands have severe to very severe limitations associated with general low
soil fertility, unfavourable temperature in the growing period and soil wetness.
The largest part of the Wami plains (about 85%) is classified as potentially moderate and
economically highly suitable land, while 15% is potentially and economically marginally
suitable for extensive grazing. The most limiting factors for this land utilisation type are:
moisture availability, biological hazards (tsetse and ticks infestation), and availability of
drinking water and accessibility of animals to grazing lands.
There is no land with good potential or economically highly suitable for maize and rice land
utilisation types.
51
4.2 Recommendations
The fact that there is no economically highly suitable land for the production of maize and rice
in the area means that, the lands of the Wami plains require high levels of management in
order to increase their productivity and minimise degradation.
The immediate crop production constraint in Wami plains is its poor natural soil fertility. To
address this problem it is strongly suggested that emphasis should be put on integrated
nutrient management strategies. Farmers should use animal manure and other sources of
organic fertilisers. Use of indigenous fertilisers such as rock phosphate could immensely
contribute to the improvement of soil fertility in the Wami lands.
Alley-cropping systems whereby crops are planted between rows of multi-purpose shrubs and
trees (e.g. Gliricidia sepium, Moringa oleifera, Sesbania spp., and Crotalaria spp.) should be
encouraged. The shrubs and trees will among other things, provide mulch and manure,
biologically fix nitrogen for companion crops, suppress weeds and also form barriers for
control of soil erosion.
Poor soil drainage condition in the mbuga and floodplains could be controlled by provision of
drainage systems that will effectively keep the ground water levels low.
Regular flushing of the soils through drainage systems, proper crop selection and planting of
salt tolerant crops such as sorghum, which can cope very well with drought and saline
environments, could largely control the problem of saline soils in the area.
Extensive grazing is recommended as the best and most profitable land utilisation type in the
Wami plains. However, it is strongly recommended that detailed studies on carrying capacity
should be carried out in the area, which will also assist in the quantification of livestock
carrying capacities of various areas in the district.
Grazing in the arable fields after harvest should not be allowed. Stubble and other plant
residues should be left on the fields and ploughed in when preparing the fields for the next
growing season. This will also protect the soil against erosion and increase the available water
holding and nutrient retention capacities of the arable lands.
There should be proper grazing rotation within the grazing lands. Grazing should not be
continued in any one area for so long to the extent that the lands remain bare. Animals could
be allowed on all grazing lands during the rainy season, where as in the dry season grazing
could be restricted to the mbuga and floodplains, which have a higher vegetation regeneration
rate.
It is strongly suggested that improved grazing be introduced in the area as promising high
returns under high investment in this LUT is feasible. However, studies on the nutritive values
of natural pastures in the area are of paramount importance, as this will give a rational basis
for pasture improvement in the Wami lands.

52
Construction of artificial water dams which store run off during rainy season could minimize
the problem of water shortage for livestock in the area which in turn will improve yield of
both meat and milk and at the same time reduce soil erosion caused by animal trampling over
long distances.
The exercise of formulating livestock policy in Morogoro Rural District should be approached
systematically since livestock have strong economic and social value to the people. However,
sociological and economic studies should be taken into consideration.

53
5.0 REFERENCES
Baize, D (1993) Soil science analyses. A guide to current use. John Wiley & Sons Ltd. West
Sussex. Pp. 192.
Black, G.R. and Hartge, K.H. (1986) Bulk density. In: Methods of Soil Analysis. Part 1. 2nd
edition. (Edited by Klute, A.). Agronomy Monograph No. 9. Soil Science Society of
America. Madison. Wisconsin. pp 364-376.
Bremner, J.M. and Mulvaney, C.S. (1982) Total Nitrogen. In: Methods of Soil Analysis. Part
2. Agronomy Monograph No. 9. (Edited by Page, A.L; Miller, R.H.and Keeney, D.R.).
American Society of Agronomy. Madson. Wisconsin. pp 595-624.
Dent, D and Young, A. (1981) Soil Survey and Land Evaluation. George Allen & Unwin,
London England. pp 278.
EUROCONSULT (1981) Agricultural Compendium for rural development in the tropics and
subtropics. Elsevier, Amsterdam. Pp. 740.
FAO (1976) A framework for land evaluation. Soils Bulletin. 32, Food and Agriculture
Organisation of the United Nations, Rome, Italy. pp 72.
FAO (1984) Land evaluation for forestry. Forestry paper 48 Food and Agriculture
Organisation of the United Nations, Rome, Italy.
FAO (1990) Guidelines for Soil profile Description. 3rd
edition. FAO, Rome. pp 66.
FAO (1998) World Reference Base for Soil Resources (WRB) World Soil Resources Reports.
No. 84. Food and Agriculture Organisation of the United Nations. Rome, and
International Society of Soil Science. Pp. 88.
Gee, G.W. and Bauder, J.W. (1986) Particle size analysis. In: Methods of Soil Analysis. Part 1.
2nd
edition. (Edited by Klute, A.). Agronomy Monograph No. 9. Soil Science Society
of America. Madson. Wisconsin. pp 383-412.
Hesse, P.R. (1971) A Text Book of Soil Chemical Analysis. John Murray Ltd, London. pp 388.
Kaaya, A.K. (1998) Characterization, Genesis and Classification of Some Soils of Northern
Part of Morogoro District, Tanzania. PhD Thesis. Department of Soil and Water
Sciences Agricultural University of Norway.
Kileo, E.P. (2000) Land Suitability Assesment of the Wami Plains in Morogoro, Tanzania
with Respect to the Production of the Main Food Crops and Extensive Grazing. M.Sc.
Thesis, Sokoine University of Agriculture, Morogoro, Tanzania. pp. 152.
Kimaro, D.N. (1989) Potentials and constraints of the Kilosa area for rainfed agriculture with
emphasis on maize. MSc. Thesis, ITC, Enschede, The Netherlands. pp. 235.
Kimaro, D.N. and Kips, Ph.A. (1991) Testing ALES in Tanzania: A case study in
computerized physical and economic land suitability assessment for smallholder low-
input maize. In: Proceedings of the Second African Soil Science Society Conference on
Soil and Water Management for Sustainable Productivity (Edited by Elgala, A. M;
Parr, J. F; Hornick, S. B; Taha; T. A. and Simpson, M.E. 1993). The Egyptian
International Center for Agriculture, Cairo, Egypt, November 4-10, 1991. pp. 325-335.
Landon, J.R. (Editor) (1991) Booker Tropical soil Manual: A Handbook for Soil Survey and
Agricultural Land Evaluation in the Tropics and Subtropics. John Wiley and Sons,
Inc., New York. pp. 474.
Magoggo, J.P. (1991) SISTAN: The Soil Information System for Tanzania. Version 2.
National Soil Service, ARTI- Mlingano, Tanga, Tanzania.
54
McLean, E.O. (1986) Soil pH and lime requirement. In: Methods of Soil Analysis, part 2;
Chemical and Mineralogical Properties, 2nd
. (Edited by Page, A.L., Miller, R.H.and
Keeney, D.R.) No. Agronomy, Madson, Wisconsin. pp. 199-223.
Msanya, B.M; Wickama, J.M; Kimaro, D.N; Magoggo, J.P and Meliyo, J. L. (1996)
Investigation of the environmental attributes for agricultural development in Kitanda
village, Mbinga District, Tanzania. Technical Report No 5. Department of Soil
Science, Faculty of Agriculture, Sokoine University of Agriculture, Morogoro,
Tanzania and Ministry of Agriculture, National Soil Service, Agricultural Research
Institute, Mlingano, Tanga, Tanzania. pp. 38.
Msanya, B.M., Kimaro, D.N., Shayo-Ngowi, A.J. Kimbi, G.G. (1999) Pedological
Characterization, Clay Mineralogy and Classification of Some Soils of Mikese Area,
Morogoro District, Tanzania. Tanzania J. Agric. Sc. Vol. 2 No. 1, 7-18.
Msanya B.M., Kimaro, D.N., Mbogoni, J.D.J and Kimbi, G.G. (2000) Soils and Land
Resources Report of Morogoro Urban District, Tanzania. Sokoine University of
Agriculture, Faculty of Agriculture, Department of Soil Science, Morogoro, Tanzania.
Ministry of Agriculture, ARI- Mlingano, National Soil Service, Tanga, Tanzania
Munsell Colour Company (1992) Munsell Soil Colour Charts. Baltimore, Maryland, USA.
National Soil Service (1990) National Soil Service Laboratory Procedures for Routine Soil
Analysis. Third edition. Miscellaneous Report. M13. Mlingano, Tanga, Tanzania. pp.
94.
Nelson, D.W. and Sommers, L.E. (1982) Organic carbon. In: Methods of Soil Analysis. Part 2.
Agronomy Monograph No. 9. (Edited by Page, A.L., Miller, R.H. and Keeney, D.R.).
American Society of Agronomy. Madison. Wisconsin. pp. 539-578.
Ngasongwa, J.A. (1980) A study of agricultural development in Morogoro region; an
historical perspective. Unpublished report. Sokoine University of Agriculture,
Morogoro, Tanzania.
Olsen, S.R. and Sommers, L.E. (1982) Phosphorus. In: Methods of Soil Analysis. Part 2.
Agronomy Monograph No. 9. (Edited by Page, A.L., Miller, R.H. and Keeney, D.R.).
American Society of Agronomy. Madison. Wisconsin. pp. 403-430.
Rhodes, J.D. (1982) Soluble salts. In: Methods of Soil Analysis. Part 2. Agronomy Monograph
No. 9. (Edited by Page, A.L., Miller, R.H.and Keeney, D.R.). American Society of
Agronomy. Madison. Wisconsin. pp 149-158; 167-180.
Rossiter, D.G. (1995) Economic land evaluation: why and how. Soil Use and Management 11,
132 - 140.
Rossiter, D.G. (1996) A theoretical framework for land evaluation. Geoderma 72, 165-190.
Rossiter, D.G. and Van Wambeke, A.R. (1989) Automated Land Evaluation System, ALES
version 2.0, User’s Manual. Department of Agronomy, Cornell University, Ithaca,
New York.
Rossiter, D.G. and Van Wambeke, A.R. (1994) Automated Land Evaluation System: ALES
version 4.5 User’s Manual. SCAS Teaching Series No. T93-2, Revision 4 Department
of Soil, Crop & Atmospheric Sciences, Cornell University, Ithaca, NY.
Sampson, D.N and Wright, A.E. (1964) The Geology of the Uluguru Mountains. Geology
Survey of Tanzania Bulletin No. 37. pp. 69.
Shaw, R.J. and Yule, D.F. (1978) The Assessment of Soils for Irrigation, Emerald,
Queensland. Technical Report 13, Agricultural Chemistry Branch, Queensland Dept.
of Primary Industries, Australia.

55
Soil Survey Staff (1998) Keys to Soil Taxonomy 8th
Edition. United States Department of
Agriculture Natural Resources Conservation Service. pp 328.
Sys, C; Van Ranst, E; Debaveye, J. and Beernaert, F. (1993) Land Evaluation. Part 3: Crop
Requirements. Agricultural Publications No. 7. General Administration for
Development Cooperation, Brussels, Belgium.
Thomas, G.W. (1982) Exchangeable cations. In: Methods of Soil Analysis. Part 2. Agronomy
Monograph No. 9. (Edited by Page, A.L; Miller, R.H. and Keeney, D.R.). American
Society of Agronomy. Madson. Wisconsin. pp 159-164.
United Republic of Tanzania (1988) Agricultural Sample Survey of Tanzania Mainland Vol.
1: Technical Report DSM.
United Republic of Tanzania (1998) The National Poverty Eradication Strategy. Vice-
President’s office, Dar es Salaam.
World Food Summit (WSF) (1996) Food Production and Environmental Impact. FAO of the
United Nations. Provisional version for the World Food Summit.
Copyright © 2022 FDOKUMEN