Soil biodiversity: myth, reality or conning
22
OIKOS 96: 3–24, 2002 Minireviews provides an opportunity to summarize existing knowledge of selected ecological areas, with special emphasis on current topics where rapid and significant advances are occurring. Reviews should be concise and not too wide-ranging. All key references should be cited. A summary is required. MINI- REVIEW Soil biodiversity: myth, reality or conning? Henri M. Andre ´, Xavier Ducarme and Philippe Lebrun Andre ´, H. M., Ducarme, X. and Lebrun, Ph. 2002. Soil biodiversity: myth, reality or conning? – Oikos 96: 3–24. The study of soil microarthropod biodiversity is illustrative of problems that are related to other soil organisms (fungi, for instance) or that can be found in other environments (canopy, oceanic sediments, hosts accommodating parasites, etc.). Indeed, the contri- bution of the soil fauna to global biodiversity remains an enigma even though, in recent years, it has received considerable attention. Our contention is that the debate on soil biodiversity will remain open – and even sterile – as long as adequate sampling methodologies are not set up, critically evaluated and largely used. First, a critical review of the sampling strategies used for soil microarthropods is presented. In addition to an extensive compilation of publications on extraction method efficiency, articles from two journals devoted to soil biology are compared for two five-year periods (before and after Erwin’s papers and before and after Rio). The most frequently used extraction methods (over 90% of studies) have a poor numerical efficiency (e.g. 7 – 26% for the Berlese-Tullgren funnels) and also are selective with respect to their efficiency for certain taxa (variable taxonomic and functional efficiency), 75% of studies are restricted to the upper 10 cm of soil and therefore overlook largely the microarthropod populations, some groups are often neglected, however diversified they are, and the taxonomic resolution tends to become impoverished in recent years. In the second part of our study, the importance of bias induced by inadequate or restricted sampling strategies on biodiversity estimates is evaluated: densities are dramatically underestimated (down to 14 times less); conversely species aggregation, a factor advocated to explain the existence of numerous soil species, is overestimated; some functional groups may be quite overlooked; the species distribution along a gradient deduced from the sampling may be rather different from that really existing in the soil and interfere with the evaluation of -diversity; species richness is often crudely underestimated (down to 50%). Overall, at most 10% of soil microarthropod populations have been explored and 10% of species described. Obviously, much has still to be done to evaluate soil mi- croarthropod biodiversity and a fortiori understand the mechanisms underlying it. Improving and renewing the soil sampling strategy is thus a prerequisite to any real advance in our knowledge of this fascinating and obscure domain. H. M. Andre ´ , UR Faune du sol, Muse ´e royal de l’Afrique centrale, B-3080 Teruren, Belgium (handre@africamuseum.be).– H. M. Andre ´ , X. Ducarme and Ph. Lebrun, Unite ´d’E ´ cologie et de Bioge ´ographie, Centre de Recherche sur la Biodiersite ´ , Unier - site ´ catholique de Louain, Place Croix du Sud 5, B-1348 Louain -la -Neue, Belgium. OIKOS 96:1 (2002) 3 Accepted 14 August 2001 Copyright © OIKOS 2002 ISSN 0030-1299
Transcript of Soil biodiversity: myth, reality or conning

OIKOS 96: 3–24, 2002
Minireviews provides an opportunity to summarize existing knowledge of selectedecological areas, with special emphasis on current topics where rapid and significantadvances are occurring. Reviews should be concise and not too wide-ranging. All keyreferences should be cited. A summary is required.
MINI-REVIEW
Soil biodiversity: myth, reality or conning?
Henri M. Andre, Xavier Ducarme and Philippe Lebrun
Andre, H. M., Ducarme, X. and Lebrun, Ph. 2002. Soil biodiversity: myth, reality orconning? – Oikos 96: 3–24.
The study of soil microarthropod biodiversity is illustrative of problems that are relatedto other soil organisms (fungi, for instance) or that can be found in other environments(canopy, oceanic sediments, hosts accommodating parasites, etc.). Indeed, the contri-bution of the soil fauna to global biodiversity remains an enigma even though, in recentyears, it has received considerable attention. Our contention is that the debate on soilbiodiversity will remain open – and even sterile – as long as adequate samplingmethodologies are not set up, critically evaluated and largely used.First, a critical review of the sampling strategies used for soil microarthropods ispresented. In addition to an extensive compilation of publications on extraction methodefficiency, articles from two journals devoted to soil biology are compared for twofive-year periods (before and after Erwin’s papers and before and after Rio). The mostfrequently used extraction methods (over 90% of studies) have a poor numericalefficiency (e.g. 7–26% for the Berlese-Tullgren funnels) and also are selective withrespect to their efficiency for certain taxa (variable taxonomic and functional efficiency),75% of studies are restricted to the upper 10 cm of soil and therefore overlook largelythe microarthropod populations, some groups are often neglected, however diversifiedthey are, and the taxonomic resolution tends to become impoverished in recent years.In the second part of our study, the importance of bias induced by inadequate orrestricted sampling strategies on biodiversity estimates is evaluated: densities aredramatically underestimated (down to 14 times less); conversely species aggregation,a factor advocated to explain the existence of numerous soil species, is overestimated;some functional groups may be quite overlooked; the species distribution along agradient deduced from the sampling may be rather different from that really existingin the soil and interfere with the evaluation of �-diversity; species richness is oftencrudely underestimated (down to 50%).Overall, at most 10% of soil microarthropod populations have been explored and 10%of species described. Obviously, much has still to be done to evaluate soil mi-croarthropod biodiversity and a fortiori understand the mechanisms underlying it.Improving and renewing the soil sampling strategy is thus a prerequisite to any realadvance in our knowledge of this fascinating and obscure domain.
H. M. Andre, UR Faune du sol, Musee royal de l’Afrique centrale, B-3080 Ter�uren,Belgium ([email protected]). – H. M. Andre, X. Ducarme and Ph. Lebrun,Unite d’Ecologie et de Biogeographie, Centre de Recherche sur la Biodi�ersite, Uni�er-site catholique de Lou�ain, Place Croix du Sud 5, B-1348 Lou�ain-la-Neu�e, Belgium.
OIKOS 96:1 (2002) 3
Accepted 14 August 2001
Copyright © OIKOS 2002ISSN 0030-1299

A scientific discipline is circumscribed, if not exactlydefined, by the methods available to it.Crossley and Coleman (1991)
The contribution of soil fauna to global biodiversityremains an enigma even though, since Erwin’s stimulat-ing papers (1982, 1983), it has received considerableattention. No less than ten issues of scientific journalswere devoted to the subject during the last decade:Agriculture, Ecosystems and En�ironment (special issue40(1–4), 1992; 62(2–3), 1997; 74(1–3), 1999), Biodi�er-sity and Conser�ation (issue 5(9), 1996), Ambio (issue26(8), 1997), Applied Soil Ecology (special issue 6(1),1997; issue 10(3), 1998; issue 13(2), 1999) and Bio-Science (issue 49(2), 1999; issue 50(12), 2000).Alongside or outside these issues, reviews on soil biodi-versity and/or ecosystem functioning were presented byLee (1994, 1996), Freckmann et al. (1997), Brussaard etal. (1997), Wall and Moore (1999). Other recent reviewswere devoted to the conservation of biological diversityin relation to agriculture (Matthey et al. 1990, Dahlberg1992, Paoletti et al. 1992, Brussaard 1994, Koehler1994, 1996, Lebbink et al. 1994, McLaughlin andMineau 1995, Michalk 1996, Paoletti and Bressan 1996,Giller et al. 1997).
Mites and other microarthropods – which are part ofthe mesofauna – play a crucial role in the context ofsoil biodiversity. Soil acarologists already stressed theirimportance in the seventies, well before the currentvogue (Anderson 1975, 1977, Wallwork 1976, Andersonand Hall 1977, Ghilarov 1977, Lebrun 1979, Stanton1979). Despite these early calls most often neglected inthe current literature devoted to biodiversity (e.g. Cop-ley 2000), the real contribution of the number of mi-croarthropod species to soil biodiversity is far frombeing appreciated. According to Erwin (1982, 1983), thecanopy fauna was believed to be at least twice as rich asthe forest floor. This was questioned by Stork (1988)and May (1990). They observed that the number ofarthropods in the soil and leaf litter is typically fivetimes larger than in the canopy and concluded that ifthe number of species bore a direct relation to thenumber of individuals, then Erwin’s estimate of oneinsect species elsewhere on the tree for every two speciesin the canopy would be out by almost a factor of 10.The high diversity of soil fauna was however contestedby Usher et al. (1979) who suggested that it might be anartefact of the way in which soil biologists view thecommunities and concluded that the ‘decomposer’ com-munities were not as diverse as the ‘grazer’ communi-ties. This view has recently received some support fromWalter et al. (1994), Walter and O’Dowd (1995), Walter(1995), Behan-Pelletier and Winchester (1998) and Be-han-Pelletier and Walter (2000) who showed that themite fauna of the outermost canopy of subtropicalforests was quite distinct from that observed in the soiland much richer than expected.
To explain why the importance of soil fauna has beenmisunderstood, it is customary to stress or allude to thelack of taxonomic expertise (Giller 1996, Beare et al.1997, Brussaard et al. 1997, Behan-Pelletier 1999, An-dre et al. 2001). The lack of adequate techniques is alsooutlined but less frequently. While there is an urgentneed for standard sampling protocols for each of themajor taxa of soil organisms as emphasized by Brus-saard et al. (1997), there is a still more striking need forefficient methods of collecting soil microarthropods andfor a critical appraisal of the existing techniques. In-deed, although there is a comparative review of meth-ods used to sample dust mites (Bronswijk et al. 1987),we have been unable to find anything similar in soilecology. In the absence of such a quantitative analysis,there is no way of selecting an appropriate method andof appreciating its drawbacks and the resulting biases inthe sampling data. There is even no way of estimatingthe validity of our current knowledge of soil mi-croarthropod ecology and of adequately evaluating thegaps to be filled in.
The aim of our paper is twofold. First, we will makea critical review of the existing literature on the sam-pling strategies used for soil microarthropods. By sam-pling strategy, we not only mean the extractionmethods, but also the sampling depth, selective sortingand taxonomic resolution. Then, we will analyze theextent of bias induced by inadequate or restricted sam-pling strategies. Our contention is that the debate onsoil biodiversity will remain open – and even sterile –as long as adequate sampling methodologies are notestablished, critically evaluated and largely used.
A literature review
To analyze the literature on soil fauna, we used twoapproaches. On the one hand, we made an extensivecompilation of existing publications on extractionmethod efficiency. On the other hand, we made acomparative analysis of papers published in two jour-nals exclusively devoted to soil biology, namely Pedobi-ologia and the European Journal of Soil Biology(formerly the Re�ue d’Ecologie et de Biologie du Sol).All papers published during two lustra (five-year peri-ods), 1977–1981 and 1993–1997 (i.e. before and afterErwin’s papers and also before and after Rio) werescanned in order to outline trends. Out of the 830papers published, 296 (i.e. 36%) dealt with soil mi-croarthropods. Those devoted to population biology(feeding habits, genetics, autecology, etc.) discarded, theremaining 111 (48+63) papers treated microarthropodsynecology. They represented respectively 17 and 10%of all papers published during the two lustra inquestion.
4 OIKOS 96:1 (2002)

Extraction methods
Hand sorting set apart, extraction methods for soilmicroarthropods are of two types: (1) Direct (mechani-cal or passive), those by which the animals are physi-cally separated from the soil (e.g. washing,hydrocarbon adhesion or flotation) or (2) indirect (dy-namic or active), those which depend on the migrationof the organisms towards a trapping device in responseto induced physicochemical gradients in their medium(e.g. Berlese-Tullgren funnels).
The pre�alence of methodsAccording to a pool survey carried out by Edwards andFletcher (1971), more than 80% of the workers usedactive methods (74% used some kind of Berlese-Tull-gren funnels while 9% preferred modified Macfadyenfunnels). Among the passive methods, the most popularwas by far the Salt and Hollick flotation used by 12%of workers. Dynamic methods still accounted for themajority of soil fauna studies, according to Petersenand Luxton (1982).
This is confirmed by our publication compilation:85% of papers have recourse to active methods for theperiod 1977–1981 and 87% for the period 1993–1997(Table 1). However, high-gradient methods were morefrequently used (nearly 35% of studies) than at the timeof the Edwards and Fletcher (1971) survey. Flotationmethods were rarely adopted (4 and 2% of studies forthe two lustra, respectively). Other methods (includinghand sorting and pitfall) represented 10 and 22% of themethods used during the two periods studied. Surpris-ingly, we found no significant differences in methodfrequencies between 1977–1981 and 1993–1997 as if nonew methodologies had been introduced.
Extraction efficiencyThe literature is rich in descriptions of new extractionmethods and improvements brought to them by subse-quent users. Many overviews describing these methodsin a more or less detailed way are also available (Wall-work 1970, Southwood 1978: chapter 5, Freckmann etal. 1986, Edwards 1991, Kaczmarek 1993, Koehler1993, Bater 1996, Griffiths 1996, New 1998: chapter 3).Surprisingly, no comparative data are given in any ofthese papers (except in Edwards 1991) and this lack ofinformation deprives the reader of any criterion likelyto guide him/her in choosing an appropriate extractiontechnique.
Extraction efficiency may be estimated through abso-lute or relative values. Absolute efficiency aims at giv-ing a measure of the performance of a method andestimating the percentage of individuals that is ex-tracted compared to the total number of individualsinitially present in the soil sample. Relative efficiencyconsists in comparing one method to another. Classi-cally, the mean relative efficiency is defined as the ratio
between the number of animals extracted by eithermethod (Pande and Berthet 1973). Only a few paperspresent any kind of critical review and provide thereader with quantitative comparisons between morethan two methods and/or their variants. Aucamp et al.(1964) and Macfadyen (1961) compared the efficiencyof variants of the high-gradient apparatus while Nef(1960) focused on five variants of the Berlese-Tullgrenfunnels. Only Lasebikan et al. (1978) and Edwards andFletcher (1971) (results partly reproduced by Edwards(1991), Kaczmarek (1993) and New (1998)) analyzed awider range of techniques and included both active andpassive methods. Unfortunately, these quantitativestudies were somewhat incomplete. On the one hand,Lasebikan et al. (1978) as well as Edwards and Fletcher(1971) provided the reader with statistical tests outlin-ing the most efficacious methods of recovering varioustaxa from different soil types. Unfortunately, the rela-tive efficiencies were not given in either paper. Thisinformation is not superfluous: a reader might prefer amethod statistically but slightly less efficient than an-other, provided the former is less time-consuming thanthe latter. Contributions by Nef (1960) and Macfadyen(1961) suffered from the reverse problem: relative effi-
Table 1. Number of papers dealing with the synecology ofsoil microarthropods compiled in two journals (Pedobiologiaand the European Journal of Soil Biology, formerly the Re�ued’Ecologie et Biologie du Sol) for the lustra 1977–1981 and1993–1997.
1977–1981 1993–1997 Total
Extraction method*Berlese-Tullgren 26 32 58High-gradient 15 23 38Flotation 2 1 3Others 5 14 19
Sampling depth (cm)21120–5 33
185.1–10 23 41610.1–15 7 13
15.1–20 3 2 51 1 225.1–30
Species richness estimated in*Oribatida 13 15 28
945Astigmata58 13Prostigmata
Mesostigmata 11 8 19Acari (all orders) 0 0 0
3417Collembola 51Protura 1 10
HabitatForest 27 27 54Meadow, savanna 13 17 30Deserts (cold and warm) 0 4 4Culture 8 15 23
Climatic zonePolar 32 5Temperate 45 57 102Equatorial, subtropical… 1 3 4
* Some publications may use more than one method or treatmore than one taxon.
OIKOS 96:1 (2002) 5

ciencies were or may be estimated but were not sup-ported by statistical tests. Only Aucamp et al. (1964)published data on both relative efficiencies and statisti-cal significance. They even provided the reader withcoefficients of variability for the major groups of mites,but only considered high-gradient method variants. Inconclusion, none of these papers offers the right infor-mation to link data and recommend a method.
The many articles presenting a new method andcomparing it to another, often the Berlese-Tullgrenfunnels, must still be mentioned. These results arescattered in a wide range of periodicals. An attempt atsynthesizing all those experiments is given in Tables 2,3 (absolute efficiencies) and 4 to 7 (relative efficiencies).
Absolute efficiencyAbsolute efficiency aims at giving a measure of the realperformance of a method. It is estimated experimentallythrough the recovery rate using two basic approaches,the experimental introduction and the remaining animalcount.
In the first approach, a given number of animals isintroduced in a sample, usually defaunated, prior totesting by the extraction method. The recovery rate,here defined as the ratio between the number of animalsrecovered by the method and the number of individualsintroduced, determines its efficiency. However, the truemeaning of the recovery rate varies depending onwhether the method is said to be active or passive.
With active methods, animals must be introducedinto the artificial sample alive, unharmed and unim-paired if the experimenter wants to minimize any biascaused by decreased motility on the part of the animals.But the reverse bias, leading to an overestimation of themethod, may also be expected due to the stress towhich the animals are subjected and their consequentexcess agitation. The question of the balance betweenthe under- and overestimation determined by animalvagility remains quite open. Next, the animals used inthose control experiments were generally extracted forthe first time through the Berlese-Tullgren funnels andthus proved responsive to the method. In contrast,animals barely or not at all responsive to the funnelswere discarded at the first extraction. In such an exper-iment, a further bias is due to the nature of the sampleitself: it is difficult both to respect the real structure ofthe substrate, for example the porosity, and to put theanimals back into their original microsites. This willundoubtedly introduce a bias in the probability ofrecapture.
In contrast, the constraint on the good state of theanimals does not hold with passive methods since evenpharate1 specimens are collected. Respect for the struc-
ture of the sample and its dwelling place is no longeressential since the soil structure is destroyed during theextraction process. Values estimated for passive meth-ods appear to be more meaningful and less sensitive tovarious biases than those for active methods.
Absolute efficiencies estimated by experimental intro-duction are highly variable, even within the same study(Table 2). For active methods, values go from 2 to100% while the range for passive methods is 7 to 100%.While active methods present only four values under50%, passive methods have no less than nine valuesunder this threshold; the lowest values will be com-mented upon after analysis of the relative efficiencies.In most studies, Prostigmata appear to be the leastresponsive. High-gradient methods have not proved tobe more effective than the classic Tullgren method. Thehand sorting method, frequently used as a reference fortesting new techniques, has often proved inefficient.
Another approach in estimating absolute efficiencyconsists in submitting a sample to a specific methodand then checking what remains in the sample (Table3). This approach is sometimes used to validate theextraction method chosen (e.g. Dindal et al. 1975b).Strictly speaking, this method does not allow us toestimate absolute efficiency as, contrary to the firstapproach, the experimenter never knows the number ofanimals initially present in the sample. Indeed, thesecond step of the procedure consists in again submit-ting the sample to an extraction process, namely handsorting or flotation. The efficiency of this control willdepend on human skill, the complexity and structure ofthe sample and possibly the experimenter a priori. Thismight explain the discrepancies between estimationsbased on the introduction (Table 2) and the remaininganimal count (Table 3) controls: the NaCl flotation isillustrative with a range of 98–99% for the latter vs arange of 64–93% for the former. The efficiencies esti-mated through the remaining animal count for theBerlese-Tullgren funnels drop to 14–42% for Mesostig-mata and 4–85% for Collembola. It must be empha-sized that these values refer to woodland soils and,since the flotation used to count the animals remainingafter the first extraction is probably not 100% efficient,still overestimate the absolute efficiency of Berlese-Tull-gren funnels. Again, the high-gradient methods proveno more satisfactory than the classic Berlese-Tullgrenfunnels.
Relati�e efficiencyRelative efficiency consists in comparing one method toanother. Classically, the mean relative efficiency isdefined as the ratio between the number of animalsextracted by either method (Pande and Berthet 1973).
Hand sorting, however time-consuming and imper-fect, highlights the poor efficiency of the Berlese-Tull-gren funnels (Table 4). Overall, hand sorting appears tobe 5.8�12.7 times more efficient than the funnels. In
1 Instar within previous cuticle prior to ecdysis (Holmes 1979:326).
6 OIKOS 96:1 (2002)

Table 2. Absolute efficiency (%) of various extraction methods estimated through introduction of a known number of animals(compilation).
Coll.1Author(s) Substrate Orib.1 Ast.1 Prost.1 Mesost.1 Acari
Hand sortingPetersen 1978 woodland litter 14–100
22–28Petersen 1978 woodland soil
Tullgren funnelsBrady 1969 poultry litter 53–97Franco et al. 1979 sand —85—Marshall 1972 soil under aspen 84 64 89 83 72Niijima 1971 91Sinha 1961 grain 82–100 44–88 74–80van der Drift 1951 beech litter 75–100 100 81
High-gradient funnelsJoosse 1969 pine litter 76–83Marshall 1972 soil under beech-aspen 86–90 74–86 78–96 80–8185–89Petersen 1978 woodland litter 39–80Van Straalen and Rijninks 1982 under pine 82
High-gradient canistersBlock 1966 mineral soil 77 55 85 76Petersen 1978 woodland soil 2–100
High-gradient transformedKempson et al. 1963 beech litter 7895
7–87Shaw and Usher 1996 peat under pine
1,2-dibromoethane flotationDucarme et al. 1999 loam 67–100 41–100
CCl4 flotationAndre and Noti 1993 sand 7–100
Heptane flotationWalter et al. 1987 semi-arid soil 84 8995 39–47 69
KBr flotationAguilar et al. 1957 100100
MgSO4 flotationBlock 1967 none 8298 89 96Calvert 1987 compostHale 1964 peat 98–9998
NaCl flotationHart and Fain 1987 house dust 89Hart and Fain 1987 rearing medium 93Sasa et al. 1970 house dust 64–84
Water flotationHale 1964 peat 9974
NaCl centrifugationSasa et al. 1970 house dust 86–94
Water flotation+keroseneSasa et al. 1970 house dust 88–94
Salt and Hollick methodWillard 1972 2221
Grease filmAucamp and Ryke 1964 100
1: Orib.=Oribatida; Ast.=Astigmata; Prost.=Prostigmata; Mesost.=Mesostigmata; Coll.=Collembola.
other words, the overall efficiency of the latter methoddoes not exceed 17%. Similarly, hand sorting is 0.8 to4.6 times more efficiency than the high-gradient funnelsand canisters (Tables 5 and 6). All in all, high-gradientmethods do not prove more efficient than traditionalBerlese-Tullgren extractors (Table 4). Surprisingly,Berlese-Tullgren funnels are even more efficient thanhigh-gradient methods when Prostigmata are consid-ered (5 results out of 7 in Table 4).
Brine solutions (Tables 4 to 7) appear little efficient(inferior to other methods in 22 cases out of 31) asalready observed by Anderson (1959), Andre and Noti(1993) and Ducarme et al. (1999). The Salt and Hollick(Tables 4 to 7) method is also unreliable (inferior in 19cases, superior in 10). The grease film method efficiency(Tables 4 to 7) also seems debatable (nearly the samenumber of inferior and superior results). In contrast,recent flotation techniques have turned out to be more
OIKOS 96:1 (2002) 7

efficient than the active method. The heptane methodis four times more efficient than the high-gradient fun-nels (Table 5) while the dibromoethane (DBE) methodis four to eight times more efficient than the Berlese-Tullgren funnels (Table 4).
Conclusions on extraction efficiencyThis extensive compilation of the literature does notsupport the often acknowledged suspicion that passivemethods are characterized by poor extraction efficiencyand that high-gradient techniques are more efficientthan the classic Berlese-Tullgren funnels (Petersen andLuxton 1982). Even though new passive methods, e.g.the new flotation methods, are much more efficientthan active methods, they still extract only 7 to 100%of all animals in a sample (compare Tables 4–7 to2–3). This clearly supports our skepticism about previ-ous estimations of the absolute efficiency of activemethods. Compared to the DBE method, the meanrelative efficiency of the Berlese-Tullgren funnels isbelow 20% (Ducarme et al. 1999); given a mean abso-lute efficiency for DBE methods of 70%, the Berlese-Tullgren funnels have thus an absolute efficiency aslow as 14% (70%×20%) in mineral horizons. If handsorting is taken as the reference method, the overallabsolute efficiency of the Berlese-Tullgren funnelsdrops to 7% (17% multiplied by the mean absoluteefficiency of the hand sorting method, see Tables 2 and4). Such disappointing values quite confirm Mac-
fadyen’s statement (1955: 324): ‘‘I very much doubt ifthe Tullgren funnel can ever be a satisfactory appara-tus for extracting litter’’. Other active methods, thehigh-gradient funnels and canisters, are also much lessefficient than the heptane flotation and hand sortingand do not outclass the traditional Berlese-Tullgrenfunnels (Tables 4 to 6).
It has to be emphasized that the conditions of ex-traction implemented in different variants of the samemethod do have a marked effect on the extractionefficiency, as illustrated in the case of Tullgren andhigh-gradient funnels, high-gradient canisters and, to alesser extent, heptane flotation. In other words, thevariability within methods (and therefore between vari-ants) may be as great as between methods, dependingon the soil, sample characteristics, practical implemen-tation and the operator’s know-how. Efficiency alsovaries to a great extent with the microarthropod group(Aucamp et al. 1964) and important variations areobserved, depending on the species even belonging tothe same genus (see Table IIc in Lasebikan et al.1978), the stase or developmental stage (see Table IIbin Lasebikan et al. 1978), and the season (see Table Iain Lasebikan et al. 1978). Results are sometimes con-tradictory for the same group of microarthropods:collembolan Isotomidae were found to be evenly col-lected by the four methods tested by Edwards andFletcher (1971) while Lasebikan et al. (1978) observedmajor differences, depending on the method used.
Table 3. Absolute efficiency (%) of various extraction methods estimated through remaining animals counting (compilation).
Author(s) Substrate Orib.1 Ast.1 Prost.1 Mesost.1 Acari Coll.1
Brushing machineChant and Muir 1955 95–100apple trees foliageHenderson and McBurnie 1943 orange trees foliage 82–88Morgan et al. 1955 apple trees foliage 99–100
Tullgren funnelswoodland soil and litter 89–100Fujikawa 1970
90–91 89–98 45–46soil under beech-aspen 98–99Marshall 1972 76–9816–4717–29different soilsMuller 1962
Snider and Snider 1997 4–85woodland spodosol 80–100 14–42
High-gradient funnelsMarshall 1972 soil under beech-aspen 89–9596–99 84–99 63–8492–96
98grassland 40–97Bieri et al. 1978 96Petersen 19782 woodland litter 50–100
17–50Walter et al. 1987 semiarid soils 73–75 2–50 27–63 0–67 40
High-gradient canistersLussenhop 1971 93 —58— 91–93 63–65 41–73Petersen 19782 woodland soil 75–100Petersen 1978 woodland soil 95 97 96 89
High-gradient transformedKempson et al. 1963 beech litter 98 100
NaCl flotationHart and Fain 1987 museum jars 98
99house dustHart and Fain 1987
1: Orib.=Oribatida; Ast.=Astigmata; Prost.=Prostigmata; Mesost.=Mesostigmata; Coll.=Collembola.2: Figures corrected for the efficiency of the control method.
8 OIKOS 96:1 (2002)

OIK
OS
96:1(2002)
9
Table 4. Relative efficiency1 (%) of various extraction methods compared to the Tullgren funnels (compilation).
Author(s) Prost.2 Mesost.2 Acari Coll.2Substrate Orib.2 Ast.2
Hand sorting192–323 200 400Forsslund 1948 woodland soil 159–625
33 40 256936sandy grasslandHaarløv 1962Hugues 1954 769grassland
250–330 330–1000Niijima et al. 1968Shilova and Zhurik 1949 8
6147Tamura 1976 400 625coniferous forest 370417Tanaka 1970
Brushing9** 502 132041****540hornbeams barkAndre and Lebrun 1979
Gelatin sectionsPande and Berthet 1973 pine litter 46**–182**
Tullgren funnels3
179 238 159 122Auerbach and Crossley 1960 131� NS* ** � NS* **� NS**� **� NS**different soilsEdwards and Fletcher 1971
Fujikawa 1970 woodland soil and litter 101106–515Kikuzawa et al. 1967 red pine forest
Macfadyen 1953 308 207fen306–1763 265–941Murphy 1962 heathland podzol 317–679
Nef 1960 126–166 162–226pine litter and Sphagnum 193–216194–203 189–385under spruce or SphagnumTragardh and Forsslund 1932
High-gradient funnels68 75 67 7465Auerbach and Crossley 1960
�� NS** �� NS** �� NS** �� NS**silt clay loam soils � NS* **Edwards and Fletcher 1971�� NS* ** *** �� NS* ***�� NS** ***� NS**�� NS** ***different soilsLasebikan et al. 1978
155–282*Macfadyen 1953 234–453*fenMacfadyen 1955 110 NS
High-gradient canisters�� NS** � ** � NSsilt clay loam soilsEdwards and Fletcher 1971
90 NS 192 NS 90 NSValpas 1969 (Huhta 1972) under pine 87 NS
High-gradient transformed� ** � ** � NSsilt clay loam soilsEdwards and Fletcher 1971
�� NS* *** � ** � NS** ***� ***different soils � ***Lasebikan et al. 1978
Hot-rod115 NS 206 NS 102 NSunder spruce 89 NSValpas 1969 (Huhta 1972)81 NS 164 NS 85 NSValpas 1969 (Huhta 1972) under pine 86 NS
1,2-dibromoethane flotationDucarme et al. 1999 418 800loam 351
KBr flotation185Aguilar et al. 1957 423
MgSO4 flotation127–260 35–81Suleman et al. 1979 grassland soils

Sampling depth and vertical distribution
Publications dealing with the vertical distribution ofsoil microarthropods cover a wide range of depths,from 0–3 cm (Usher 1975) to 0–311 cm (Price andBenham 1977). In our comparative survey, many stud-ies deal with forest soil (Table 1). As it is generallyadmitted that most forest soil populations are concen-trated within the upper 5–10 cm (Petersen and Luxton1982), the sampling is frequently limited to the litterand the underlying layer. Elsewhere, in the absence of awell-defined organic layer, for example culture andmeadows, sampling is confined to the topsoil. Themean sampling depth was found to be 9.2�5.6 cm(n=40) for the period 1977–1981, and 7.9�5.1 cm(n=54) for the period 1993–1997. In either period,75% of publications were limited to the upper 10 cm ofdepth (Fig. 1A).
Depending on the microarthropod vertical distribu-tion, these restrictions may induce a bias of varyingseverity. In order to assess the extent of this bias, weselected studies where the prospected depth was equalto, or greater than, 30 cm (Table 8). For each studyand, where possible, for each major microarthropodgroup, we estimated the soil depth in which 50 or 90%of animals were living (respectively the Soil Depth50
and Soil Depth90, abbreviated as SD50 and SD90). Wefirst selected the best fitted curve (r2�0.6) and extrapo-lated it to a depth of 150 cm when the depth prospectedwas smaller. Data sets with r2�0.6 were discarded:Athias (1975), Haarløv (1955) data. From the bestfitted curve, the SD50 was estimated as illustrated inFig. 1C. It is worth stressing that the SD50 should notbe confused with the depth over which 50% of thecollection is caught (Collection Depth50, abbreviated asCD50). Although these two values may be quite differ-ent, several authors confused them.
The analysis of Table 8 calls for several comments.First, most SD50 estimates (71%) are greater than 10cm, the depth reached in 75% of the publications.Second, SD50 values vary to a great extent dependingon the group considered. In the meadow studied byHairston and Byers (1954), they vary from 12 cm formites to 43 cm for Thysanura, with a mean value of 13cm for the microarthropods as a whole. A similar rangeof SD50 values is observed in the meadow sampled byBuhlmann (1984). This bears out Price and Benham’s(1977) observations that the percentage of animals liv-ing in the upper 15 cm varied from 62% for Mesostig-mata to only 10% for Oribatida, passing through 24%for Collembola.
Third, similar SD50 values may correspond to differ-ent vertical distribution as illustrated by the comparisonof Protura and Pauropoda in the meadow studied byHairston and Byers (1954). Their SD50 are close, 17 vs21 cm, but the pauropod distribution is much skewerthan that of Protura. The comparison of SD90 values(33 vs 67 cm) may account for this difference.
10 OIKOS 96:1 (2002)
Tab
le4.
(Con
tinu
ed.)
Ast
.2O
rib.
2Su
bstr
ate
Aut
hor(
s)C
oll.2
Aca
riM
esos
t.2
Pro
st.2
NaC
lflo
tati
onsi
ltcl
aylo
amso
ilsE
dwar
dsan
dF
letc
her
1971
�**
�*
*�
NS
Bri
neflo
tati
onsa
ndF
ranc
oet
al.
1979
—11
1NS
—N
aCl
cent
rifu
gati
on28
1–94
3***
diff
eren
tso
ilsM
ulle
r19
6250
4–14
81***
Salt
and
Hol
lick
met
hod
��
NS
***
Edw
ards
and
Fle
tche
r19
71�
�N
S*
**
��
NS
***
��
NS
**
*di
ffer
ent
soils
��
NS
***
3934
El-
Kifl
1957
fallo
w-c
lay
loam
soil
==
�=
unde
rsp
ruce
Eva
ns19
5123
–53
48–7
10–
216–
1823
–53
fen
Mac
fady
en19
5314
0–14
4N
S*
Satc
hell
and
Nel
son
1962
woo
dlan
dun
der
map
le79
Woo
d19
65di
ffer
ent
soils
�57
29***
73*
�68
Gre
ase
film
Auc
amp
1967
156
silt
ycl
ay59
056
7�
�N
S*
*�
**
�*
*si
ltcl
aylo
amso
ilsE
dwar
dsan
dF
letc
her
1971
Las
ebik
anet
al.
1978
diff
eren
tso
ils�
�N
S*
**
�*
**
*�
NS
***
��
NS
*�
�N
S***
�N
S**
***
1:
��
test
edm
etho
dm
ore/
less
effic
ient
than
the
refe
renc
em
etho
d(o
nly
stat
isti
cal
test
sw
ere
avai
labl
e).
Sign
ifica
nce
leve
ls:
5,1
and
0.1%
.2:
Ori
b.=
Ori
bati
da;
Ast
.=A
stig
mat
a;P
rost
.=P
rost
igm
ata;
Mes
ost.
=M
esos
tigm
ata;
Col
l.=
Col
lem
bola
.3:
The
wor
stva
rian
tse
rves
asre
fere
nce.

OIK
OS
96:1(2002)
11
Table 5. Relative efficieny1 (%) of various extraction methods compared to high-gradient funnels (compilation).
Mesost.2 Acari Coll.2Substrate Orib.2Author(s) Ast.2 Prost.2
Hand sorting294 **161 208**Macfadyen 1953 455**
100–400 100–400Macfadyen 195577–86 NS*under pineVan Straalen and Rijninks 1982
High-gradient funnels3
174–237 NS 188 123–335 NS*clay pasture soil 222**–229* 115–1395 NS** 124–179 NS**Aucamp et al. 1964� NS* ** *** � ***Lasebikan et al. 1978 different soils � NS*** � NS** � NS** ***
512Macfadyen 1953 360 349268407grassland112Macfadyen 1961 201wet 107–112 130 160–198
grassland 110Macfadyen 1962
High-gradient canisters� NS** � NS**Edwards and Fletcher 1971 silt clay loam soils � * ** �� NS** � **
147–404*158–950*311–395*89–4167*Macfadyen 1961Macfadyen 1962 267–599 147?–404**grassland 257–1141** 311?–395** 190?–666**
123**Petersen 1978 litter under beech
High-gradient transformed� NS** � NS**silt clay loam soils � NS** � NS � NS**Edwards and Fletcher 1971�� NS** *** � NS*** � NS** ***different soilsLasebikan et al. 1978 � NS*** � NS � NS** ***
Glycerol flotation29–111 22–312Bieri et al. 1986 sandy loam/bog soil
Heptane flotationsemi-arid soilWalter et al. 1987 —379NS–416*—
NaCl flotationEdwards and Fletcher 1971 � NS**silt clay loam soils � NS** � ** � ** � NS**
Salt and Hollick method�� NS**� NS** � NS**Edwards and Fletcher 1971 silt clay loam soils � ** � NS**
Grease film200 ? 120 NSthorn-tree woodland 2500**Aucamp and Ryke 1965 � 60 NS
� NS** �� NS**silt clay loam soils � NS � ** � **Edwards and Fletcher 1971� NS** ***� NS** ***�� NS* ***�� NS** ***different soils �� NS***Lasebikan et al. 1978 �� NS* ** ***
1: �� tested method more/less efficient than the reference method (only statistical tests were available). Significance levels: 5, 1 and 0.1%.2: Orib.=Oribatida; Ast.=Astigmata; Prost.=Prostigmata; Mesost.=Mesostigmata; Coll.=Collembola.3: The worst variant serves as reference.

Studies carried out at shallow depths (30 cm or less)are not likely to give a good picture of the mi-croarthropod vertical distribution. This is clearly illus-trated by the Collembola studied down to either 30 or150 cm by Willard (1972, 1973a). The SD90 valuesderived from the 30-cm study (42 to 65 cm) are clearlybelow those estimated for the 150-cm study (74 cm).
The vertical distribution of endogeous taxa, Pomer-antziidae for example, is such that they are not men-tioned in all the studies surveyed in our literaturecomparative review. Indeed these mites are absent fromthe upper 23 cm (Price and Benham 1977), and theirSD50 approaches 60 cm. Similarly, Pauropoda from pineforest soils have a SD50 greater than 30 cm and ap-proaching 60 cm depending on the season (Price 1975).
Some groups such as Collembola are often character-ized by a bimodal vertical distribution (4 cases out of 9in Table 8). This pattern has been ignored by mostauthors and confirms the presence of endogeous specieswithin Collembola. The bimodal pattern was also ob-served in oribatid and prostigmatid mites from culture(Buhlmann 1984) and oribatid mites from mixed forest(Moskacheva 1973). A similar pattern in mi-croarthropod distribution was again found in the short-
grass steppe studied by Leetham and Milchunas (1985)in Colorado (Fig. 1B) and in subtropical thorn forestswhere the microarthropod number increased steadilyfrom the undersurface downwards and was greatest inthe deepest layers prospected (30 cm) (Fig. 1B, extrapo-lated data from Aucamp and Ryke 1965). In the lattercase, the SD50 exceeded 30 cm (Table 8). The bimodalpattern also applies to desert soils where it is generallyrecognized that temperature and humidity are relativelyconstant ‘‘at values agreeable to life below 30 cm depth’’(Seely 1983).
The vertical distribution as discussed here concernsonly general patterns, which may be complicated bydiurnal and seasonal vertical migrations (Franco et al.1979, Whitford et al. 1981), competition (Anderson1978) or pollution (Hagvar and Amundsen 1981). Thesefeatures are beyond the scope of this review where wemerely wish to stress that a large share of the soilmicroarthropods, 50% of individuals or much moredepending on the environment studied, is overlooked inmost publications due to a sampling restricted to theuppermost soil layers. In the light of Table 8, Petersenand Luxton’s (1982: 298) conclusion that most authorscan argue that 80% or more of the total recoverable
Table 6. Relative efficiency1 (%) of various extraction methods compared to high-gradient canisters (compilation).
Author(s) Orib.2 Ast.2 Prost.2Substrate AcariMesost.2 Coll.2
Hand sortingunder pineTakeda 1979 114–357
High-gradient canisters3
14864760�4600Macfadyen 1961 5200–�dry (Pteridium)481wet (Nardus) 1033–1940 867 200–�Macfadyen 1961 1254133 NSMacfadyen 1961 181–212 NS 154 NS 158–179 NS 154
High-gradient transformedEdwards and Fletcher � NSsilt clay loam soils1971
Hot rodunder pine 99 NSValpas 1969 (Huhta 1972) 90 NS 86 NS 95 NS
MgSO4 flotationBlock 1967 peat 46 0 159 50**
1834grassland mineral soilBlock 1967 31***46Hale 1964 peat 91–96 NS
NaCl flotationEdwards and Fletcher silt clay loam soils � NS
1971
Sugar flotationTakeda 1973 pine litter 20–162
NaCl centrifugation+benzenePetersen 1978 64 NS27 NSmull 93 NS36 NS96 NS
Salt and Hollick method� **silt clay loam soils � **Edwards and Fletcher � NS** � NS
1971
Grease film� NS � **silt clay loam soilsEdwards and Fletcher
1971
1: �� tested more/less efficient than the reference method (only statistical tests were available). Significance levels: 5, 1 and0.1%.2: Orib.=Oribatida; Ast.=Astigmata; Prost.=Prostigmata; Mesost.=Mesostigmata; Coll.=Collembola.3: The worst variant serves as reference.
12 OIKOS 96:1 (2002)

Table 7. Relative efficiency1 (%) of various extraction methods compared to different reference methods (in bold) (compilation).
Coll.2Author(s) Substrate Orib.2 Ast.2 Mesost.2 Acari
Heptane flotation
Heptane flotation3
Belascoin et al. 1998 beech forest soil 117 NS 191 ***144* 104 NS
Geurs et al. 1991 calcareous silt loam 152 NS142 NS
Sugar centrifugation
Hand sortingCromar and Williams 1991 stream sediment 4*
Salt and Hollick flotation
High-gradient transformed� NS* **Edwards and Fletcher 1971 silt clay loam soils � ** � NS
NaCl flotation� NS**Edwards and Fletcher 1971 silt clay loam soils � ** � NS
Salt and Hollick method3
Edwards and Fletcher 1971 silt clay loam soils � NS� ** � NS
Water flotation & Tullgren funnelsLebrun and Wauthy 1981 deep soil 216–1000
Grease film
High-gradient transformedEdwards and Fletcher 1971 silt clay loam soils � NS
Lasebikan et al. 1978 different soils � *** �� NS** ***� NS*** �� * ** *** � ***
NaCl flotationEdwards and Fletcher 1971 silt clay loam soils � **
Salt and Hollick methodEdwards and Fletcher 1971 silt clay loam soils � ** �� NS**� NS
1: �� tested method more/less efficient than the reference method (only statistical tests were available). Significance levels: 5,1 and 0.1%.2: Orib.=Oribatida; Ast.=Astigmata; Mesost.=Mesostigmata; Coll.=Collembola.3: The worst variant serves as reference.
populations are included in their observed density esti-mates is quite unrealistic. The disregard for the deepestsoil horizons, already reported by Seastedt (1984), isreally surprising since it has been repeatedly stated thatmicroarthropods are distributed downward to a consid-erable depth (Jacot 1936, Dowdy 1944, Pearse 1946, Saltet al. 1948, Hairston and Byers 1954, Aucamp and Ryke1965, Moskacheva 1973, Price 1975). It may be ofinterest to recall that Jacot (1936) suggested that the soilfauna probably extended to a depth equivalent to thatof root penetration and that mites have been collectedfrom the deepest soil layers, down to 13–14 m, close toaquifers in Austria (Fain 1982) or at the edge of a drylake in the Chihuahuan desert (Silva et al. 1989).
With regard to the sampling depth, another weaknessin a number of studies is the lack of information givenabout the soil profile and its properties. This capitalinformation is omitted in nearly half of the papersexamined. Some do not even mention the type of litterthough some keys are available to identify it (Toutain1981, Jabiol et al. 1995). This is all the more surprisingconsidering that nearly all the articles specify the sur-rounding vegetation. Yet, soil properties influence themite community composition and diversity in a decisiveway. Another problem lies in the use of inappropriatesoil terminology. For instance, authors often use the
term ‘humus’ to refer to the organo-mineral horizon(Ah). Actually, the term ‘humus’ is ambiguous (Gobat etal. 1998). First, humus or ‘humus form’ is commonlyused to designate the group of soil horizons located ator near the forest soil surface and refers to litter, duff,organic layers or forest floor (Green et al. 1993). Second,humus can refer to soil organic matter (SOM) whichencompasses humified organic substances in soil (Oades1989). The absence of precision is obviously problematicbecause it does not tell the readers which horizon wasreally sampled.
Selective sorting
There are very few studies embracing the whole range ofsoil microarthropods: either the Collembola are treated,or mites as a whole, or a subgroup of mites. Weis-Fogh(1948) is a remarkable exception, with a study of aDanish ‘poor’ pasture listing no less than 26 collembolanand 153 mite species (all mite orders being identified). Inour literature review, most studies (70–80%) deal withspringtails in both periods studied. The second mostimportant taxon is oribatid mites, with 53 and 37% ofstudies respectively for the periods 1977–1981 and1993–1997, followed by gamasid mites (47 and 17% ofstudies, respectively, for the two periods). As for the
OIKOS 96:1 (2002) 13

Acari as a whole, they are treated in only 34 and 22%of studies published. The least studied taxa were theAstigmata, a group usually considered as minor in thesoil, and Prostigmata. The disregard for the lattergroup, only 11% of synecological papers published inthe most recent years, significantly fewer than in thefirst lustrum, is of paramount importance in the contextof biodiversity. In temperate forest soils, Prostigmataform the second most abundant group after the Orib-atida (Hagvar and Amundsen 1981, Luxton 1982) orthe third after the Oribatida and Collembola (Lebrun1971, Ducarme unpubl.). In temperature cultures,Prostigmata can be dominant or subdominant after theCollembola depending on the depth (Buhlmann 1984).In extreme environments, as in cold and dry deserts,they overtake oribatid mites and become the dominantgroup – see Usher and Booth (1984) for Antarctica,Cepeda-Pizarro and Whitford (1989) for the Chi-huhuan, Steinberger (1990) for the Negev, Noble et al.(1996) for Australia, Andre et al. (1997) for the Namib.The trend is also visible in the tropics: Prostigmata arethe second most abundant group (22% of all mi-croarthropods) coming after Oribatida in the forest, butthey outnumber them in the woodland (38%) andlargely dominate in the savanna (44%) (Noti et al.1996). Prostigmata again form the dominant group inthe Lamto savanna (Athias 1975), the South Africanpasture (Loots and Ryke 1966) and thorn-tree forest(Den Heyer and Ryke 1966). In Californian culturesoils, Prostigmata even represent half of the mi-
croarthropod specimens collected by Price and Benham(1977). Their real importance may be severely underes-timated since they are barely responsive to active ex-traction methods (Tables 3 to 7), unfortunately themost frequently used (Table 1). A second underestima-tion is due to the sampling depth: in some forest soilsand savanna, Prostigmata tend to prevail over anyother group once the depth exceeds 10 cm, a depth toolittle prospected so far (Athias 1975, Price and Benham1977).
Our observations agree with Wilkinson’s (1998) con-clusions drawn from a larger scale study, namely thatcompared to ‘cute’ or larger species, the main taxo-nomic groups involved in decomposition receive scantattention from ecologists. The loss of information onspecies richness due to selective sorting and disregardfor ‘difficult’ but abundant groups is hard to evaluateand further discussed in the next section.
Taxonomic resolution
Counting animals is one thing, identifying them isanother story. The taxonomic resolution reached in theliterature varies widely (Fig. 2). Taxonomic identifica-tions at the familial and generic levels were alreadyinfrequent in mites during the period 1977–1981 andtended to disappear in the next lustrum. Collembolawas the group most frequently identified to species,followed by Mesostigmata and Oribatida. In the last
Fig. 1. (A) Frequencydistribution of soilsampling depths usedin the papers publishedin two journals(Pedobiologia and theEuropean Journal ofSoil Biology) duringtwo five-year periods(1977–1981) and(1993–1997) (samedepth scale as in C).(B) Vertical distributionover 1 m depth ofmicroarthropods invarious soils(diagrammatic: UT,unimodal, topsoilmode; US, unimodal,subsurface mode; UD,unimodal, deep soilmode; BT, bimodal,topsoil higher mode;BD, bimodal, deep soilhigher mode). (C)Cumulative abundanceof soil microarthropodsas a function of depthwith the estimatedSD50 (soil depth abovewhich 50% of theanimals are living). (*)Pomerantziidae only.References in the text.
14 OIKOS 96:1 (2002)

Table 8. SD50 and SD90 estimated for different habitats and climatic zones.
(5)Climate and location (1) Habitat PD (2) Taxa SD50 (3) SD90 (3) Type (4)
Arctic/PolarTareja (RUS) Tundra (river bank) 58 Collembola 6–20 b 30–49 b BT-BD 1
Arid with cold season/semi-arid (temperate)Matador (CAN) Grassland 2, 3150 Microarthropods 12 80 BT
2Collembola 10 74 BTAcari 336 87 UT
30 Collembola 8–20 s 42–65 5 2UT-USFort Collins (USA, CO) Steppe 60 Microarthropods 24 459 BT
Humid with cold season/temperateBern (CHE) 5Culture 60 Collembola 19–23 s 46–78 s US
Oribatida 41 53 BDGamasida 18 40 US
Rh. agrestis (6) 24 48 USProstigmata 41 109 BD
Pyemotidae 11 32 UTScutacaridae 34 53 UD
Edwin S. George (USA, MI) Meadow 152 Microarthropods 613 55 UTCollembola 21 77 BTThysanura 43 68 UDProtura 17 33 USPauropoda 21 67 UDAcari 12 51 UT
Le Pin-au-Haras (FRA) Meadow 50 Microarthropods 76 36 UTCollembola 8 47 UTOribatida 6 22 UTGamasida 1 13 UTTarsonemida 9 19 UT
Gorki (BLR) Mixed forest 64 Oribatida 4 836 BTLauzelle (BEL) Oak wood 100 Microarthropods 911 39 USTrevaresse (FRA) Meadow 30 Oribatida 12–15 s 1025–38 s UT
Oak forest 40 Oribatida 10–14 s 1018–28 s USMediterranean
Montpellier (FRA) Dune (grass) 70 Microarthropods 1140 70 BTBeach (barren) 60 Microarthropods 1135 52 UD
S. Joaquin Valley (USA, CA) Culture 122 12Microarthropods 22 72 UTCollembola 29 73 USAcari 13 59 UT
Culture 311 Microarthropods 1218 105 USCollembola 62 234 BSAcari 17 90 US
Pomerantziidae 56 13114 UDGrass Valley (USA, CA) Pine forest 156 Microarthropods 143–16 s 23–64 s ?
Collembola 3–21 s 23–47 s ?Protura 2–42 s 34–103 s ?Oribatida 3–16 s 16–47 s ?Prostigmata 3–18 s 19–49 s ?Mesostigmata 3–31 s 24–63 s ?Pauropoda 14–50 s 77–116 s ?
Subtropical, hot and arid/semi-arid (Mediterranean)Mojave (USA, CA) Around plants 1530 Arthropoda 5–18 s 11–43 s UT-US
Tropical/subtropicalPotchefstroom (ZAF) Acacia forest 30 Microarthropods 28–33 e 56–56 e BD 16
Equatorial/tropicalEl Salvador (SLV) Forest 1770 Oribatida 15–53 s 82–129 s UT-UDLamto (CIV) Savanna 85 Microarthropods 8 63 18UT
Collembola 15 43 UTMesostigmata 13 36 UTProstigmata 12 33 UT
TemperateHays (USA, KS) Prairie 1945 Acari 25 38–39 s BD
Oribatida 25–28 s 38 UB-BDProstigmata 26 38–39 s BD
Konza (USA, KS) Prairie 45 Acari 28–29 s 39 BDOribatida 29 38 BDProstigmata 27–30 s 39–41 s BD
(1) Climate terminology after Walter and Lieth (1960)/ Peguy (1970); countries designated by the iso 3166–code.(2) PD: Prospected depth in cm.(3) SD values (cm) interpolated for extrapolated to a 150 cm depth using the best fitted equation (logarithmic, power, or exponential;polynomial with bimodal pattern; r2�0.6); b: between sample variation; s: SD values variable depending on seasons; e: SD values variabledepending on the selected equation.(4) Type of vertical distribution (see Fig. 1B): UT: unimodal, topsoil mode; US: unimodal, subsurface; UD: unimodal, deep soil; BT:bimodal, topsoil higher mode; BS: bimodal, subsurface higher mode; BD: bimodal, deep soil higher mode; ?: Data not available (SDestimated through CD’s values calculated over a depth of 150 cm).(5) References: 1: Chernov et al. 1973; 2: Willard 1973a; 3: Willard 1973b; 4: Leetham and Milchunas 1985; 5: Buhlmann 1984; 6:Hairston and Byers 1954; 7: Athias-Henriot 1972; 8: Moskacheva 1973; 9: Ducarme et al. 2001; 10: Lions 1965; 11: Andre et al., 1994;12: Price and Benham, 1977; 13: Price and Benham 1976; 14: Price 1975; 15: Franco et al. 1979; 16: Aucamp and Ryke 1965; 17: Beck1964; 18: Athias 1975; 19: O’Lear and Blair 1999.(6) Rh. agrestis=Rhodacarus agrestis Karg, 1971.
OIKOS 96:1 (2002) 15

group, the findings were biased due to difficulty inrecognizing heteromorphic immatures: in most cases,identification was limited to adults, even when notspecified by the authors.
Again, Prostigmata arouses remarkably little interest.While the species richness was estimated in eight papers(Table 1), only four species lists were published in thetwo journals analyzed during the period 1993–1997.The two complete lists were nevertheless most meager(12 and 6 species) as they referred to species found inAntarctica, a ‘very simple’ ecosystem compared to tem-perate forest soils. The two other lists were incomplete,one dealt with a Chilean desert and the other with aPicea abies stand in Ireland (14 and 16 main species,respectively). This disregard for Prostigmata is not newand was already stressed by Evans et al. (1961) whonoted that very few soil ecologists had determined thesemites in any detail. This might be explained by theirsmall size (for instance, the maximum number ofprostigmatid species from the Namib desert occurs insize class 135–165 �m; Andre et al. 1994) and the rarityof identification keys and specialists (only 26 specialistsof prostigmatids vs 187 for oribatids in the 1992 direc-tory of acarologists of the world). That large speciestend to be described earlier than small species and taxawith large species are more completely described thanthose with small species are general trends outlined byGaston (1991).
Yet in several soils, Prostigmata constitute not onlythe most abundant but also the richest group, e.g. inmeadow (Dindal et al. 1975a). Weis-Fogh (1948) listed58 prostigmatid vs 59 oribatid species in a Danish‘poor’ pasture. In temperate forest soils, they form thesecond richest group after the Oribatida (Ducarmeunpubl.). If the identification and naming of species is adifficult matter, discriminating and counting them is aprerequisite to estimating their richness whatever their
size and the availability of relevant identification keys.Identification to stase (or development stage) is still
rarer, Wauthy and Lebrun (1980) is a remarkable ex-ception. Yet, the stases are a key factor explaining thecoexistence of competing species and the resulting highbiodiversity (Andre 1991). Next, identification to staseallows soil biologists to determine if a species spends allits life cycle in a given environment and to what extentit contributes to the local biodiversity. Lastly, imma-tures are heteromorphic in many Oribatida and someProstigmata and different ontogenetic niches are occu-pied by a same species in the course of its development;the case of Adoristes o�atus is illustrative (Gourbiere etal. 1985).
Effects of extraction biases
The effect of biases due to soil sampling procedures israrely treated in the literature. One exception is Sniderand Snider (1997) who recognized that ‘‘standard pro-cedures of handling, extraction, and subsequent sortingof soil faunal samples harbor numerous source of error,variable with soil type, operator skills, extraction ap-paratus and available facilities’’. However, the extantand type of errors have been overlooked and will beexplored briefly below.
Extraction efficiency and density
As already mentioned, the efficiency rate of traditionalextraction methods is especially weak. Recent flotationmethods collected four to five times as manyarthropods as traditional active extractions (Walter etal. 1987, Ducarme et al. 1999).
The impact of poor extraction techniques on theestimation of microarthropod densities is obvious. Onthe one hand, some density estimates are unrealisticallylow, as for instance the 3000 microarthropods/m2 re-ported by Stork (1988) for an Indonesian forest. Like-wise, densities of less than 500 mites/m2 in a Costa Ricaforest and ca 1200 mites/m2 in a Wyoming forest arenot realistic and make Stanton’s (1979) comparisonsbetween tropical and temperate forests unreliable andher conclusions debatable. On the other hand, differen-tial efficiencies of extraction methods may lead to sur-prising comparisons. For instance, the density ofmicroarthropods in sand dunes with low organic con-tent (more than 1 million individuals/m2) was found tobe higher than in temperate forest soils. Such an unex-pected result was explained by the high efficiency of theCCl4 method used for the sand dune samples, a methodmuch more efficient than the Berlese-Tullgren funnelstraditionally used in forest soils (Andre et al. 1994).
Recent studies support this interpretation. Ducarme(unpubl.) using a new flotation method (DBE) reported
Fig. 2. Taxonomic resolution used in the papers publishedduring two five-year periods (1977–1981) and (1993–1997) intwo journals (Pedobiologia and the European Journal of SoilBiology). Increases from the first to the second five-year-periodmarked in black. Percentages are relativized to the total num-ber of synecological papers published during each period.
16 OIKOS 96:1 (2002)

densities in a forest soil higher than what is usuallyobserved. However, the density value (ca 0.9 millionarthropods/m2) is still underestimated. The first errorderives from the DBE method itself, which is not 100%efficient. As the efficiency range of the DBE extractionvaries from 41 to 100%, we applied a mean correctionfactor of 70.5% to all samples collected from the soilitself. A second bias is due to the Berlese-Tullgrenmethod. Indeed, the new flotation method was usedonly in the lower part of the soil profile while the litterfauna was extracted once more with Berlese-Tullgrenfunnels. The absolute efficiency of the latter methodvaries, depending on the authors: from 25.7% (Forss-lund 1948, with volume samples similar to those ofDucarme unpubl.) to 7% (see above). Correcting ob-served densities in accordance with method efficienciesleads us to estimate that, depending on the correctionfactor chosen, the forest soil densities vary between 2.7and 8.9 million microthropods/m2. The final range ex-ceeds all the highest densities ever observed in forest(between 2.0 and 2.9 million microarthropods/m2 in aspruce moor according to Forsslund (1948), 0.84 mil-lion estimated by Murphy (1953) also in a spruce moor,0.72 million recorded by Persson et al. (1980) in a pineforest). It is also much greater than the densityrecorded in sand dunes by Andre et al. (1994), which isbiologically meaningful.
Extraction efficiency and aggregation
Independent aggregation of species in relation to spatialand temporal heterogeneity in soil has been advocatedto explain the coexistence amongst a number of speciesand therefore account for the high soil biodiversity(Giller 1996, O’Connell and Bolger 1998). Indeed,Berthet and Gerard (1965), among others, showed thatthe distribution of soil oribatid mites appeared to fol-low a negative binomial model.
Unfortunately, the estimation of species aggregationis also affected by the extraction techniques. Not onlydoes the extraction efficiency vary depending on thespecies, soil types, seasons and stases, it also fluctuatesseemingly at random (Snider and Snider 1997). Forexample, the mean recovery rate of the DBE methodwas found to vary with a standard deviation of 26%and 22% for small poduromorph Collembola and theoribatid Brachychthonius berlesei, respectively, whilelarge entomobryomorph collembolans and oribatidDamaeus spp. were always all recovered (Ducarme etal. 1999). The side effect of this variability on theestimation of species aggregation is obvious.
Take a 1-m2 area housing 30000 animals evenlydivided among three species, A, B and C. Suppose thatall three taxa are randomly distributed. Moreover, eachspecies is characterized by an extraction probability of100% for A, 67�22% for B and 41�26% for C (the
probability functions correspond to those found forDamaeus spp., Brachychthonius berlesei and smallPoduromorpha by Ducarme et al. 1999). When animalsare randomly distributed on a surface, they follow thePoisson distribution and the abundance mean and vari-ance are equal. Accordingly, the variance-to-mean ratiowas proposed as a measure of aggregation (Clapham1936, Blackman 1942). If the simulation is run asdescribed above, the mean value of this index is 1.02,3.62 and 7.96 for species A, B and C, respectively. Inthe field, such departures of the index from unity wouldbe interpreted as indicators of aggregation in species Band C, which is manifestly not the case in thesimulation.
Extraction efficiency and function within food webs
Extraction method efficiency is partly determined bythe species characteristics such as the stase, its size andvagility. Low vagility has been advocated to explain thelow efficiency of active methods (Haarløv 1947, van derDrift 1951, Murphy 1958, 1962). Similarly, small sizehas been advanced to explain the low recovery rate byflotation methods (Ducarme et al. 1999) and activemethods (e.g. Takeda 1973).
It is more puzzling to note that the extraction effi-ciency is also determined by the species function itself.An outstanding example is offered by endophagousmites found within petiole, wood and bark fragments inthe leaf litter, or within needles in coniferous litter.Such species are especially difficult to sample as they donot respond to funnel extraction and flotation methodsare ineffectual in this type of substrate. The only re-maining means of collection are the gelatin-embeddingtechnique and the needle hand sampling and dissectingmethod, two tedious and time-consuming approaches.Yet, endophagous mites play an essential role amongdecomposers: they occur at an early stage of the decom-position of coniferous needles and interact with fungiduring the whole process. However numerous they are(ca 8000 immature Adoristes o�atus/m2; Gourbiere etal. 1985), they have passed unnoticed in most studiesprecisely because of their function and feeding habits.Such a bias in the sampling strategies is deplorable forour understanding of soil functioning especially if lowertrophic levels in soil food webs are much more impor-tant than higher ones in regulating the ecosystem asrecently suggested by Van der Heijden et al. (1998) andWardle (1999).
In contrast, the relative importance of other mi-croarthropods may have been overestimated. Thismight be the case of large predatory mites which feedon Collembola and similar decomposers (e.g. Pergama-sus sp.): compared to their preys, these hunters arehighly mobile and easily trapped in the Berlese-Tullgrenfunnels and similar extraction methods.
OIKOS 96:1 (2002) 17

Fig. 3. Impact ofdifferential extractionefficiencies on�-diversity. A:Dummy 9 species×5sites matrix, with theextraction methodefficiency (�) for eachspecies. B:Abundance of speciesalong the gradient(species 6 to 9 arenot drawn, theyincrease along thegradientsymmetrically tospecies 1 to 4). C, D:Distances (1 minusthe Bray and Curtisindex) between sitesA, C, and E basedon real (C) andsampled (D) data.E, F: k-meanspartitioning methodapplied to sites A toE based on real (E)and sampled (F)data. G, H: DCAordination applied tosites A to E based onreal (G) and sampled(H) data: I: DCAordination of 70 soilsamples including 149oribatid species fromLubumbashi (Dem.Rep. Congo) (fromNoti et al. 1996).
Extraction efficiency and �-diversity
As the efficiency of extraction methods varies widelydepending on the soil types, species and stases, the�-diversity deduced from the sampling may be ratherdifferent from that really existing in the soil. Let ninespecies be sampled in five sites (Fig. 3A), with species 1to 4 decreasing along the gradient (Fig. 3B), species 6 to9 increasing symmetrically and species 5 having anoptimum at mid-gradient (Fig. 3B). Let us also supposethat the extraction efficiency is 90% for species 1, 80%for species 2, and so on down to species 9 with 10%extraction efficiency (Fig. 3A). These values lie withinthe range of efficiency of the Tullgren extractors. Thefauna of site C located at mid-gradient is equallydistant from that of sites A and E located at both endsof the gradient and sites A and E are the most distantfrom each other (Fig. 3C). Due to the various extrac-tion efficiencies, this pattern will not appear after ex-traction and samples A and C will be found to be moresimilar than in reality (Fig. 3D). This bias will affect the
classification of sites (Fig. 3E, F) and their ordination:all sample-points are shifted to the left by comparisonto the ordination based on real data (Fig. 3G, H). As aresult, the distance between points, i.e. the �-diversity,is underestimated in the left part of the ordination andoverestimated in the right one. This situation is not ofmere academic interest and has been observed in datapublished by Noti et al. (1996). The soil oribatid mitesamples are scattered along the first gradient rangingfrom the dense forest (to the left of Fig. 3I) to savanna(to the right) passing through woodland. Points fromthe dense forest are much more aggregated than thosefrom savanna which, by comparison, are widely dis-persed. The first interpretation is that the �-diversityobserved in savanna is higher than in forest. The sec-ond interpretation, which does not preclude the firstone, is related to variable extraction efficiencies. Indeedthe temperature and sunshine are higher in savannathan in forest. Like corticolous mites (see Andre andLebrun 1979), savanna species are probably welladapted to high temperatures and sunshine and conse-
18 OIKOS 96:1 (2002)

quently much less responsive to the Berlese funnels usedby Noti et al. than are forest species. As in Fig. 3H,sample-points of Fig. 3I would be shifted to the left dueto a differential efficiency of the extraction method.
Extraction efficiency and �-diversity
Not only the �-diversity pattern is distorted by extrac-tion techniques, but also some species are absent fromthe samples treated. Walter et al. (1987) showed that theheptane method collected twice as many species as thehigh-gradient extraction while the DBE flotationmethod was found to extract 1.5 more taxa than theBerlese-Tullgren funnels (Ducarme et al. 1999). Thus therichness of the soil fauna may be notably underesti-mated depending on the methods used. Quite surpris-ingly, we have been unable to find publications withsaturation curves for the cumulative number of speciesof soil microarthropods, excepted that of Noti et al.(2002).
Contribution of soil dwellers to biodiversity
Even when the contribution of mites to biodiversity hasbeen recognized by non-acarologists (May 1990, Wilson1992, Giller 1996), their real importance remains largelyundetermined.
Some biases are probably due to the difficulty ingathering relevant data and in building reliable data-bases. Hopefully, the development of new databases thatare searchable on the Web will make it easier to collectrelevant information (Behan-Pelletier 1999). Our inaccu-rate knowledge of the soil fauna due to poor samplingstrategies and poorly efficient extraction methods will,however, remain a major impediment to the properestimation of the soil microarthropod biodiversity.
To date, more than 30000 mite species have beendescribed according to Krantz (1978). Depending on theauthors, the number varies between approximately30000 (Hammond 1992), 35000 (Weygoldt 1996) and45000 (Brussaard et al. 1997, Behan-Pelletier 1999).Krantz (1978) estimated that half a million more speciesawaited discovery. Subsequently, Evans (1992) sug-gested that the number of undescribed species couldexceed 600000 and estimates of 900000 and 1 millionwere recently advanced by Brussaard et al. (1997) andLebrun and Van Straalen (1996). As Hammond (1992)commented, such high estimates may prove defensibleonce good data for tropical sites are forthcoming. So far,tropical inventories are unfortunately limited to very fewstudies (Africa: Den Heyer and Ryke 1966, Loots andRyke 1966, Noti et al. 1996; South America: Franklinet al. 1997). More circumspect, Weygoldt (1996)evaluated the total number of mite species to be morethan 100000.
The number of mite species described from the soil isestimated to vary between 20000 and 30000 (vs 6500 forCollembola) (Brussaard et al. 1997, Wall and Moore1999). No estimations have been found for the totalnumber of mite species inhabiting the soil. If we sup-pose, together with Brussaard et al. (1997), that the ratioof soil-dwelling mites/total number of mite species is 2/3,then the total number of mite species living in the soilmight fluctuate between 70000 and 600000.
Other estimates appear to be unrealistic. For instance,Behan-Pelletier and Bissett (1992) speculated that ‘only’53% of the expected 48500 species of North Americansoil arthropods had been described. Such a high percent-age is optimistic if we compare it to the situation ofEuropean spiders. According to Alderweireldt and Joc-que (1994), the number of spider species described asdwelling in Europe amounts to 3438 and there is no signof any leveling down to a plateau when the cumulativenumber of species described per decade was plotted.These authors estimate the total number of spiders livingon the European continent to be at least 5000–6000species, which means that only 57–69% of spider specieshave been described. As European spiders are muchbetter known that North American soil arthropods, it ishardly likely that 53% of the latter have been described.
Conclusions
When starting this review on soil arthropod diversityand the relevant literature, we anticipated three alterna-tives to depict the situation: myth, reality or conning.The first two terms were taken from Wallwork (1983)who wondered whether the abundance or oribatid spe-cies, a major group of soil dwellers, was a reality or amyth. We added a third alternative, conning, borrowedfrom an editorial by Di Castri (1993) devoted to biodi-versity after Rio.
We feel obliged to state that, since Wallwork’s (1983)review and earlier papers highlighting soil mi-croarthropod biodiversity (Anderson 1975, 1977, Wall-work 1976, Anderson and Hall 1977, Ghilarov 1977,Lebrun 1979, Stanton 1979), we have virtually no newdata to support their view and help us to decide betweenthe first two alternatives, nor are there strong argumentsfor rejecting the third possibility.
Indeed, if we consider that (1) the most frequentlyused extraction methods have a mean efficiency of 40%(a rough overestimation), (2) only half of the mi-croarthropod groups is considered in most studies and(3) at most half of the microarthropods are collected dueto a sampling restricted to the upper 8 cm, we mayconclude that at most 10% of soil microarthropodpopulations have been studied, even in countriesprospected for a long time. Of course, this chain ofarguments is not designed to give a precise estimate of
OIKOS 96:1 (2002) 19

our knowledge of soil microarthropods and their rich-ness; it nevertheless illustrates that we are a long wayfrom a clear and methodological approach to soil bio-diversity. To what extent these biases affect our esti-mates of the soil microarthropod richness depends onmany factors that we have explored: the taxonomic andfunctional efficiencies of extraction methods (that havebeen proved to be highly variable), the sampling effort(undeterminable in the absence of saturation curve), therichness of neglected groups (the smallest the taxa, thelatest they are studied and described), and the diversityand specificity for deep soils of endogeous species. Ineither case, estimates of the soil dwelling populationsthat have been studied and the ratio ‘‘number of de-scribed mite species/number of extant species’’ convergeon values inferior to 10%.
More surprising and worrisome are the trends out-lined in the literature comparative review: soil samplingis less and less deep, speciose and difficult groups aremore and more disregarded, traditional extractionmethods are still used as often as in the past. All thesetrends indicate a slackening in the sampling effort andinvolve a decrease in research standards. This is all themore unexpected because whether it be sampling depth,selective sorting, or extraction methods, biases havelong been recognized and mentioned in the literature.Our comparative review (before and after Erwin’s pa-per, and before and after Rio) obviously support DiCastri’s (1993) claim that intellectual conning does notreally upset the scientific community who plays thegame ‘‘in order to obtain important additional funds tobe spent more or less with the same intentions and inthe same way as was done before Rio’’.
In the light of our findings, we seriously question thecurrent vogue that consists in publishing the manyspecial issues and reviews such as those listed in theintroduction. Maybe these publications obey the ‘perishor publish’ motto. In any case, much has still to bedone to evaluate soil microarthropod biodiversity and afortiori understand the mechanisms underlying it. Im-proving and renewing the soil sampling strategy is thusa prerequisite to any real advance in that field. Neglect-ing those prerequisites will reduce any future researchto the intellectual conning vigorously denounced by theIUBS past president (Di Castri 1993).
Acknowledgements – We thank D. C. Coleman, D. A. Cross-ley Jr, B. Delvaux and H. Petersen for their suggestions andremarks on earlier drafts of the review. I. Bals provided uswith obscure reprints.
ReferencesAguilar, J. d’, Benard, R. and Bessard, A. 1957. Une methode
de lavage pour l’extraction des arthropodes terricoles. –Ann. Epiphyt. 8: 91–99.
Alderweireldt, M. and Jocque, R. 1994 (1993). Biodiversity inAfrica and Europe: the case of spiders (Araneae). – Biol.Jb. Dodonaea 61: 57–67.
Anderson, J. M. 1975. The enigma of soil animal speciesdiversity. – In: Vanek, J. (ed.), Progress in soil zoology.Czech, Acad. of Sciences, Prague, pp. 51–58.
Anderson, J. M. 1977. The organization of soil animal com-munities. Soil organisms as components of ecosystems. –Ecol. Bull. (Stockholm) 25: 15–23.
Anderson, J. M. 1978. Competition between two unrelatedspecies of soil Cryptostigmata (Acari) in experimental mi-crocosms. – J. Anim. Ecol. 47: 787–803.
Anderson, J. M. and Hall, H. 1977. Cryptostigmata speciesdiversity and soil habitat structure. Soil organisms as com-ponents of ecosystems. – Ecol. Bull. (Stockholm) 25: 473–475.
Anderson, R. O. 1959. A modified flotation technique forsorting bottom fauna samples. – Limnol. Oceanogr. 4:223–225.
Andre, H. M. 1991. Stase, competition and metamorphosis ininsects and other arthropods. – Belg. J. Zool. 121: 3–25.
Andre, H. M. and Lebrun, Ph. 1979. Quantitative comparisonof the funnel and the brushing methods for extractingcorticolous micro-arthropods. – Entomol. Exp. Appl. 26:252–258.
Andre, H. M., Ducarme, X., Anderson, J. M. et al. 2001.Skilled eyes are needed to go on studying the richness ofthe soil. – Nature 409: 761.
Andre, H. M. and Noti, M.-I. 1993. Extracting sand mi-croarthropods: a carbon tetrachloride flotation method. –Eur. J. Soil Biol. 29: 91–96.
Andre, H. M., Noti, M.-I. and Jacobson, K. M. 1997. The soilmicroarthropods of the Namib Desert: a patchy mosaic. –J. Afr. Zool. 111: 499–517.
Andre, H. M., Noti, M.-I. and Lebrun, Ph. 1994. The soilfauna: the other last biotic frontier. – Biodiv. Conserv. 3:45–56.
Athias, F. 1975. Donnees complementaires sur l’abondance etla distribution verticale des Microarthropodes de la savanede Lamto (Cote-d’Ivoire). – Bull. Mus. Nat. Hist. Nat.Ecol. Gen. 24: 1–28.
Athias-Henriot, C. 1972. Inventaire des microarthropodes pe-dogenetiques de la prairie permanente de Borculo en Nor-mandie. I. Echantilonnage preparatoire au protocoleexperimental. – Revue Soc. Savante Haute-Normandie1972: 5–21.
Aucamp, J. L. 1967. Efficiency of the grease film extractiontechnique in soil microarthropod surveys. – In: Graff, D.and Satchell, J. E. (eds), Progress in soil biology. North-Holland, pp. 515–523.
Aucamp, J. L. and Ryke, P. A. J. 1964. Preliminary report ona grease film extraction method for soil micro-arthropods.– Pedobiologia 4: 105–126.
Aucamp, J. L. and Ryke, P. A. J. 1965. The efficiency of animproved grease film extractor in stratification studies ofsoil micro-arthropods. – S. Afr. J. Sci. 61: 276–279.
Aucamp, J. L., Loots, G. C. and Ryke, P. A. J. 1964. Notes onthe efficiency of funnel batteries for the extraction of soilmicro-arthropods. – Tydskr. Natuurwet. 4: 105–126.
Auerbach, S. I. and Crossley, D. A., Jr. 1960. A samplingdevice for soil microarthropods. – Acarologia 2: 269–287.
Bater, J. E. 1996. Micro- and macroarthropods. – In: Hall, G.S. (ed.), Methods for the examination of organismal diver-sity in soils and sediments. CAB Int, pp. 163–174.
Beare, M. H., Reddy, M. V., Tian, G. and Srivastava, S. C.1997. Agricultural intensification, soil biodiversity andagroecosystem function in the tropics: the role of decom-poser biota. – In: Swift, M. (ed.), Agricultural intensifica-tion, soil biodiversity and agroecosystem function in thetropics. Appl. Soil Ecol. (Spec. Issue) 6: 87–108.
Beck, L. 1964. Tropische Bodenfauna im Wechsel von Regene-und Trockenzeit. – Nat. Mus. 94: 63–71.
Behan-Pelletier, V. 1999. Linking soil biodiversity and ecosys-tem function – The taxonomic dilemma. – BioScience 99:149–153.
20 OIKOS 96:1 (2002)

Behan-Pelletier, V. M. and Bissett, B. 1992. Biodiversity ofNearctic soil arthropods. – Can. Biodiv. 2 (3): 5–14.
Behan-Pelletier, V. and Winchester, N. 1998. Arboreal oribatidmite diversity: colonizing the canopy. – Appl. Soil Biol. 9:45–51.
Behan-Pelletier, V. and Walter, D. E. 2000. Biodiversity ofAcari in tree canopies and litter. – In: Coleman, D. C. andHendrix, P. (eds), Invertebrates as webmasters in ecosys-tems. CABI, pp. 187–202.
Belascoin, C., Arino, A. H. and Jordana, R. 1998. A newintegrated extraction method for microarthropods and ne-matodes from the same soil samples. – Pedobiologia 42:165–170.
Berthet, P. and Gerard, G. 1965. A statistical study of mi-crodistribution of Oribatei (Acari). Part I. – Oikos 16:214–227.
Bieri, M., Delucchi, V. and Lienhard, C. 1978. Ein abgandertMacfadyen-Apparat fur die namische Extraction von Bo-denarthropoden. – Mitt. Schweiz. Entomol. Ges. 51: 119–132.
Bieri, M., Delucchi, V. and Stadtler, M. 1986. Optimization ofextraction conditions in the air-conditioned Macfadyenfunnel extractor for soil arthropods. – Pedobiologia 30:127–135.
Blackman, G. E. 1942. Statistical and ecological studies in thedistribution of species in plant communities. I. Dispersionas a factor in the study of plant populations. – Ann. Bot.6: 351–370.
Block, W. 1966. Some characteristics of the Macfadyen highgradient extractor for soil micro-arthropods. – Oikos 17:1–9.
Block, W. 1967. Recovery of mites from peat and mineral soilsusing a new flotation method. – J. Anim. Ecol. 36: 323–327.
Brady, J. 1969. Some physical gradients set up in Tullgrenfunnels during the extraction of mites from poultry litter. –J. Appl. Ecol. 6: 391–402.
Bronswijk, J. E. M. H. van, de Saint-George-Gridelet, D. andLustgraaf, B. van de 1987. An evaluation of biologicalmethods in house-dust allergen research. – Allergie Im-munol. 24: 18–28.
Brussaard, L. 1994. An appraisal of the Dutch programme onsoil ecology of arable farming systems (1985–1992). –Agric. Ecosyst. Environ. 51: 1–6.
Brussaard, L., Behan-Pelletier, V., Bignell, D. E. et al. 1997.Biodiversity and ecosystem functioning in soil. – Ambio 26:563–570.
Buhlmann, A. 1984. Auswirkungen des konventionellen Land-baus und seiner Alternativemethoden auf die Acari, ins-besondere die Gamasida, und die Collembola im Lossbodender Nordwestschweiz. – PhD thesis, Univ. Basel.
Calvert, A. D. 1987. A flotation method using reduced airpressure for the extraction of sciarid fly larvae from organicsoil. – Pedobiologia 30: 39–43.
Cepeda-Pizarro, J. G. and Whitford, W. G. 1989. Speciesabundance distribution patterns of microarthropods in sur-face decomposing leaf-litter and mineral soil on a desertwatershed. – Pedobiologia 33: 257–268.
Chant, D. A. and Muir, R. C. 1955. A comparison of theimprint and brushing machine for estimating the numbersof fruit tree red spider mite, Metatetranychus ulmi (Koch),on apple leaves. – Rep. E. Malling Res. Sta. 1954: 141–145.
Chernov, Y. I., Ananjeva, S. I., Kuzmin, L. L. and Khajurova,E. P. 1973. The peculiarities of vertical distribution ofinvertebrates in soils of Tundra zone. – In: Tikhomirov, B.A. (ed.), Biogeocenoses of Taimyr tundra and their produc-tivity. Vol. 2. Nauka, pp. 180–186.
Clapham, A. R. 1936. Overdispersion in grassland communitiesand the use of statistical methods in plant ecology. – J.Ecol. 24: 232–251.
Copley, J. 2000. Ecology goes underground. – Nature 406:452–454.
Cromar, G. L. and Williams, D. D. 1991. Centrifugal flotationas an aid to separating invertebrates from detritus in benthicsamples. – Hydrobiologia 209: 67–70.
Crossley, D. A., Jr. and Coleman, D. C. 1991. Introduction. –In: Crossley, D. A., Jr., Coleman, D. C., Hendrix, P. F. etal. (eds), Modern techniques in soil ecology. – Agric.Ecosyst. Environ. (Spec. Issue) 34: 1.
Dahlberg, K. A. 1992. The conservation of biological diversityand U.S. agriculture: goals, institutions, and policies. –Agric. Ecosyst. Environ. 42: 177–193.
Den Heyer, J. and Ryke, P. A. J. 1966. A mesofaunal investi-gation of the soil in a thorn tree (Acacia karroo) biotope.– Rev. Biol. 5: 309–364.
Di Castri, F. 1993. One year after Rio: I am guilty. – Biol. Int.27: 1–2.
Dindal, D. L., Folts, D. and Norton, R. A. 1975a. Effects ofDDT on community structure of soil microarthropods in anold field. – In: Vanek, J. (ed.), Progress in soil zoology.Academia, Prague, pp. 505–513.
Dindal, D. L., Schwert, D. and Norton, R. A. 1975b. Effectsof sewage effluent disposal on community structure of soilinvertebrates. – In: Vanek, J. (ed.), Progress in soil zoology.Academia, Prague, pp. 419–427.
Dowdy, W. W. 1944. The influence of temperature on verticalmigration of invertebrates inhabiting different soil types. –Ecology 25: 449–460.
Drift, J. van der 1951. Analysis of the animal community in abeech forest floor. – Tijdschr. Entomol. 94: 1–168.
Ducarme, X., Andre, H. M. and Lebrun, Ph. 1999. Extractingendogeous microarthropods: a new flotation method using1,2-dibromoethane. – Eur. J. Soil Biol. 34: 143–150.
Edwards, C. A. 1991. The assessment of populations of soil-in-habiting invertebrates. – In: Crossley, D. A., Jr., Coleman,D. C., Hendrix, P. F. et al. (eds), Modern techniques in soilecology. Agric. Ecosyst. Environ. (Spec. Issue) 34: 145–176.
Edwards, C. A. and Fletcher, K. E. 1971. A comparison ofextraction methods for terrestrial arthropods. – In: Philip-son, J. (ed.), Methods of study in quantitative soil ecology:population, production and energy flow. Blackwell Scien-tific, pp. 150–185.
El-Kifl, A.H. 1957. Comparison between a wet and a drymethod for extraction of soil arthropod fauna. – Bull. Soc.Entomol. Egypte 41: 525–526.
Erwin, T. L. 1982. Tropical forests: their richness in Coleopteraand other arthropod species. – Coleopt. Bull. 36: 74–75.
Erwin, T. L. 1983. Tropical forest canopies: the last bioticfrontier. – Bull. Entomol. Soc. Am. 29: 14–19.
Evans, G. O. 1951. Investigations on the fauna of forest humuslayers. – In: Forestry Commission, Report on forest re-search for the year ending March 1950. H.M.S.O., pp.110–113.
Evans, G. O. 1992. Principles of acarology. – CAB Int.,Wallingford.
Evans, G. O., Sheals, J. G. and Macfarlane, D. 1961. Theterrestrial Acari of the British Isles. – In: Introduction andbiology. British Museum (Natural History), London.
Fain, A. 1982. Cinq especes du genre Schwiebea Oudemans,1916 (Acari, Astigmata) dont trois nouvelles decouvertesdans des sources du sous-sol de la ville de Vienne (Autriche)au cours des travaux du metro. – Acarologia 23: 359–371.
Forsslund, K.-H. 1948. Nagot om insamlingsmetodiken vidmarkfaunaundersokningar. – Medd. Statens Skogforskn-ingsinst. 37 (7): 1–22.
Franco, P. J., Edney, E. B. and McBrayer, J. F. 1979. Thedistribution and abundance of soil arthropods in the North-ern Mojave desert. – J. Arid Environ. 2: 137–149.
Franklin, E., Adis, J. and Woas, S. 1997. The oribatid mites.– In: Junk, W. J. (ed.), The Central Amazon floodplain.Springer-Verlag, pp. 331–349.
Freckmann, D. W., Cromack, K., Jr. and Wallwork, J. A.1986. Recent advances in quantitative soil biology. – In:Mitchell, M. J. and Nakas, J. P. (eds), Microfloral andfaunal interactions in natural and agro-ecosystems. Marti-nus Nijhoff, pp. 399–442.
OIKOS 96:1 (2002) 21
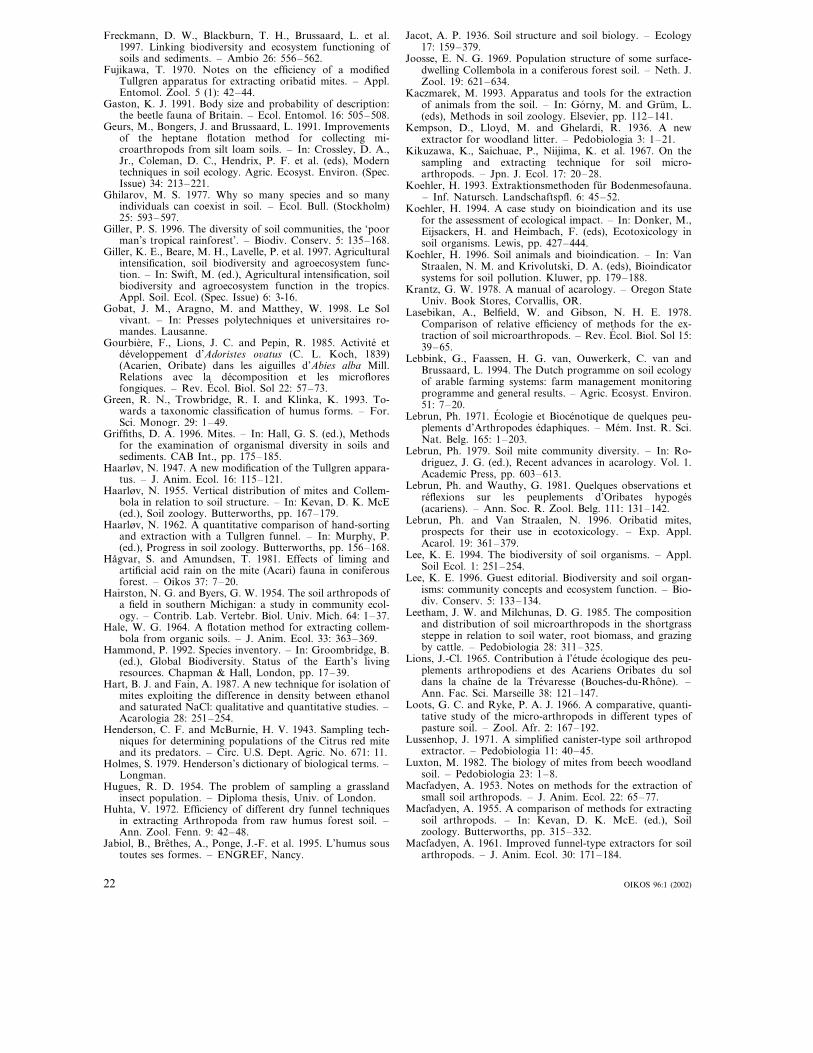
Freckmann, D. W., Blackburn, T. H., Brussaard, L. et al.1997. Linking biodiversity and ecosystem functioning ofsoils and sediments. – Ambio 26: 556–562.
Fujikawa, T. 1970. Notes on the efficiency of a modifiedTullgren apparatus for extracting oribatid mites. – Appl.Entomol. Zool. 5 (1): 42–44.
Gaston, K. J. 1991. Body size and probability of description:the beetle fauna of Britain. – Ecol. Entomol. 16: 505–508.
Geurs, M., Bongers, J. and Brussaard, L. 1991. Improvementsof the heptane flotation method for collecting mi-croarthropods from silt loam soils. – In: Crossley, D. A.,Jr., Coleman, D. C., Hendrix, P. F. et al. (eds), Moderntechniques in soil ecology. Agric. Ecosyst. Environ. (Spec.Issue) 34: 213–221.
Ghilarov, M. S. 1977. Why so many species and so manyindividuals can coexist in soil. – Ecol. Bull. (Stockholm)25: 593–597.
Giller, P. S. 1996. The diversity of soil communities, the ‘poorman’s tropical rainforest’. – Biodiv. Conserv. 5: 135–168.
Giller, K. E., Beare, M. H., Lavelle, P. et al. 1997. Agriculturalintensification, soil biodiversity and agroecosystem func-tion. – In: Swift, M. (ed.), Agricultural intensification, soilbiodiversity and agroecosystem function in the tropics.Appl. Soil. Ecol. (Spec. Issue) 6: 3-16.
Gobat, J. M., Aragno, M. and Matthey, W. 1998. Le Solvivant. – In: Presses polytechniques et universitaires ro-mandes. Lausanne.
Gourbiere, F., Lions, J. C. and Pepin, R. 1985. Activite etdeveloppement d’Adoristes o�atus (C. L. Koch, 1839)(Acarien, Oribate) dans les aiguilles d’Abies alba Mill.Relations avec la decomposition et les microfloresfongiques. – Rev. Ecol. Biol. Sol 22: 57–73.
Green, R. N., Trowbridge, R. I. and Klinka, K. 1993. To-wards a taxonomic classification of humus forms. – For.Sci. Monogr. 29: 1–49.
Griffiths, D. A. 1996. Mites. – In: Hall, G. S. (ed.), Methodsfor the examination of organismal diversity in soils andsediments. CAB Int., pp. 175–185.
Haarløv, N. 1947. A new modification of the Tullgren appara-tus. – J. Anim. Ecol. 16: 115–121.
Haarløv, N. 1955. Vertical distribution of mites and Collem-bola in relation to soil structure. – In: Kevan, D. K. McE(ed.), Soil zoology. Butterworths, pp. 167–179.
Haarløv, N. 1962. A quantitative comparison of hand-sortingand extraction with a Tullgren funnel. – In: Murphy, P.(ed.), Progress in soil zoology. Butterworths, pp. 156–168.
Hagvar, S. and Amundsen, T. 1981. Effects of liming andartificial acid rain on the mite (Acari) fauna in coniferousforest. – Oikos 37: 7–20.
Hairston, N. G. and Byers, G. W. 1954. The soil arthropods ofa field in southern Michigan: a study in community ecol-ogy. – Contrib. Lab. Vertebr. Biol. Univ. Mich. 64: 1–37.
Hale, W. G. 1964. A flotation method for extracting collem-bola from organic soils. – J. Anim. Ecol. 33: 363–369.
Hammond, P. 1992. Species inventory. – In: Groombridge, B.(ed.), Global Biodiversity. Status of the Earth’s livingresources. Chapman & Hall, London, pp. 17–39.
Hart, B. J. and Fain, A. 1987. A new technique for isolation ofmites exploiting the difference in density between ethanoland saturated NaCl: qualitative and quantitative studies. –Acarologia 28: 251–254.
Henderson, C. F. and McBurnie, H. V. 1943. Sampling tech-niques for determining populations of the Citrus red miteand its predators. – Circ. U.S. Dept. Agric. No. 671: 11.
Holmes, S. 1979. Henderson’s dictionary of biological terms. –Longman.
Hugues, R. D. 1954. The problem of sampling a grasslandinsect population. – Diploma thesis, Univ. of London.
Huhta, V. 1972. Efficiency of different dry funnel techniquesin extracting Arthropoda from raw humus forest soil. –Ann. Zool. Fenn. 9: 42–48.
Jabiol, B., Brethes, A., Ponge, J.-F. et al. 1995. L’humus soustoutes ses formes. – ENGREF, Nancy.
Jacot, A. P. 1936. Soil structure and soil biology. – Ecology17: 159–379.
Joosse, E. N. G. 1969. Population structure of some surface-dwelling Collembola in a coniferous forest soil. – Neth. J.Zool. 19: 621–634.
Kaczmarek, M. 1993. Apparatus and tools for the extractionof animals from the soil. – In: Gorny, M. and Grum, L.(eds), Methods in soil zoology. Elsevier, pp. 112–141.
Kempson, D., Lloyd, M. and Ghelardi, R. 1936. A newextractor for woodland litter. – Pedobiologia 3: 1–21.
Kikuzawa, K., Saichuae, P., Niijima, K. et al. 1967. On thesampling and extracting technique for soil micro-arthropods. – Jpn. J. Ecol. 17: 20–28.
Koehler, H. 1993. Extraktionsmethoden fur Bodenmesofauna.– Inf. Natursch. Landschaftspfl. 6: 45–52.
Koehler, H. 1994. A case study on bioindication and its usefor the assessment of ecological impact. – In: Donker, M.,Eijsackers, H. and Heimbach, F. (eds), Ecotoxicology insoil organisms. Lewis, pp. 427–444.
Koehler, H. 1996. Soil animals and bioindication. – In: VanStraalen, N. M. and Krivolutski, D. A. (eds), Bioindicatorsystems for soil pollution. Kluwer, pp. 179–188.
Krantz, G. W. 1978. A manual of acarology. – Oregon StateUniv. Book Stores, Corvallis, OR.
Lasebikan, A., Belfield, W. and Gibson, N. H. E. 1978.Comparison of relative efficiency of methods for the ex-traction of soil microarthropods. – Rev. Ecol. Biol. Sol 15:39–65.
Lebbink, G., Faassen, H. G. van, Ouwerkerk, C. van andBrussaard, L. 1994. The Dutch programme on soil ecologyof arable farming systems: farm management monitoringprogramme and general results. – Agric. Ecosyst. Environ.51: 7–20.
Lebrun, Ph. 1971. Ecologie et Biocenotique de quelques peu-plements d’Arthropodes edaphiques. – Mem. Inst. R. Sci.Nat. Belg. 165: 1–203.
Lebrun, Ph. 1979. Soil mite community diversity. – In: Ro-driguez, J. G. (ed.), Recent advances in acarology. Vol. 1.Academic Press, pp. 603–613.
Lebrun, Ph. and Wauthy, G. 1981. Quelques observations etreflexions sur les peuplements d’Oribates hypoges(acariens). – Ann. Soc. R. Zool. Belg. 111: 131–142.
Lebrun, Ph. and Van Straalen, N. 1996. Oribatid mites,prospects for their use in ecotoxicology. – Exp. Appl.Acarol. 19: 361–379.
Lee, K. E. 1994. The biodiversity of soil organisms. – Appl.Soil Ecol. 1: 251–254.
Lee, K. E. 1996. Guest editorial. Biodiversity and soil organ-isms: community concepts and ecosystem function. – Bio-div. Conserv. 5: 133–134.
Leetham, J. W. and Milchunas, D. G. 1985. The compositionand distribution of soil microarthropods in the shortgrasssteppe in relation to soil water, root biomass, and grazingby cattle. – Pedobiologia 28: 311–325.
Lions, J.-Cl. 1965. Contribution a l’etude ecologique des peu-plements arthropodiens et des Acariens Oribates du soldans la chaıne de la Trevaresse (Bouches-du-Rhone). –Ann. Fac. Sci. Marseille 38: 121–147.
Loots, G. C. and Ryke, P. A. J. 1966. A comparative, quanti-tative study of the micro-arthropods in different types ofpasture soil. – Zool. Afr. 2: 167–192.
Lussenhop, J. 1971. A simplified canister-type soil arthropodextractor. – Pedobiologia 11: 40–45.
Luxton, M. 1982. The biology of mites from beech woodlandsoil. – Pedobiologia 23: 1–8.
Macfadyen, A. 1953. Notes on methods for the extraction ofsmall soil arthropods. – J. Anim. Ecol. 22: 65–77.
Macfadyen, A. 1955. A comparison of methods for extractingsoil arthropods. – In: Kevan, D. K. McE. (ed.), Soilzoology. Butterworths, pp. 315–332.
Macfadyen, A. 1961. Improved funnel-type extractors for soilarthropods. – J. Anim. Ecol. 30: 171–184.
22 OIKOS 96:1 (2002)

Macfadyen, A. 1962. Control of humidity of three funnel typeextractors for soil arthropods. – In: Murphy, P. (ed.),Progress in soil zoology. Butterworths, pp. 158–168.
Marshall, V. G. 1972. Comparison of two methods of estimat-ing efficiency of funnel extractors for soil microarthropods.– Soil Biol. Biochem. 4: 417–426.
Matthey, W., Zettel, J. and Bieri, M. 1990. Invertebresbioindicateurs de la qualite des sols agricoles. Bericht 56des Nationalen Forschungprogrammes ‘‘Boden’’. – Liebe-feld, Bern.
May, R. M. 1990. How many species? – Philos. Trans. R. Soc.Lond. B 330: 293–304.
McLaughlin, A. and Mineau, P. 1995. The impact of agricul-tural practices on biodiversity. – Agric. Ecosyst. Environ.55: 201–212.
Michalk, D. 1996. Biotic diversity in agroecosystems. – Agric.Ecosyst. Environ. 57: 209–215.
Morgan, C. V. G., Chant, D. A., Anderson, N. H. and Ayre,G. L. 1955. Methods for estimating orchard mite popula-tions, especially with the mite brushing machine. – Can.Entomol. 87: 189–200.
Moskacheva, E. A. 1973. On depth of soil inhabiting withoribatids (Acariformes, Oribatei). – Zool. Zh. 46: 1400–1405 (in Russian).
Muller, G. 1962. A centrifugal-flotation extraction techniqueand its comparison with two funnel extractors. – In:Murphy, P. (ed.), Progress in soil zoology. Butterworths,pp. 207–211.
Murphy, P. W. 1953. The biology of forest soils with specialreference to the mesofauna or meiofauna. – J. Soil Sci. 4:155–193.
Murphy, P. W. 1958. The quantitative study of soil micro-fauna. – Entomol. Exp. Appl. 1: 94–108.
Murphy, P. W. 1962. Effect of sample treatment on extractionefficiency with the split-funnel extractor. – In: Murphy, P.W. (ed.), Progress in soil zoology. Butterworths, pp. 182–188.
Nef, L. 1960. Comparaison de l’efficacite de differentes vari-antes de l’appareil de Berlese-Tullgren. – Z. Angew. Ento-mol. 46: 178–199.
New, T. R. 1998. Invertebrate surveys for conservation. –Oxford Univ. Press.
Niijima, K. 1971. Seasonal changes in collembolan popula-tions in a warm temperate forest of Japan. – Pedobiologia11: 11–26.
Niijima, K., Tanaka, M., Aoki, J. et al. 1968. On the extrac-tion efficiency of Tullgren funnel in a comparison withhand-sorting. – Edaphologia 2: 22–27 (in Japanese).
Noble, J. C., Whitford, W. G. and Kaliszewski, M. 1996. Soiland litter microarthropod populations from two contrast-ing ecosystems in semi-arid eastern Australia. – J. AridEnviron. 32: 329–346.
Noti, M.-I., Andre, H. M. and Dufrene, M. 1996. Soil oribatidmite communities (Acari: Oribatida) from high Shaba(Zaıre) in relation to vegetation. – Soil Appl. Ecol. 5:81–96.
Noti, M.-I., Andre, H. M., Ducarme, X. and Lebrun, Ph.2002. The diversity of soil oribatid mites (Acari: Oribatida)from high Katanga (Dem. Rep. Congo): a multiscale andmultifactor approach. Biodiv. Conserv.
Oades, J. M. 1989. An introduction to organic matter inmineral soils. – In: Dixon, J. B. and Weed, S. B. (eds),Minerals in soil environments, 2nd ed. Soil Science Societyof America, pp. 89–159.
O’Connell, T. and Bolger, T. 1998. Intraspecific aggregation,‘probability niches’ and the diversity of soil mi-croarthropod assemblages. – Appl. Soil. Biol. 9: 63–67.
O’Lear, H. A. and Blair, J. M. 1999. Responses of soilmicroarthropods to change in soil water availability intallgrass prairie. – Biol. Fertil. Soils 29: 207–217.
Pande, Y. D. and Berthet, P. 1973. Comparison of the Tull-gren funnel and soil section methods for surveying oribatidpopulations. – Oikos 24: 273–277.
Paoletti, M. G. and Bressan, M. 1996. Soil invertebrates asbioindicators of human disturbance. – Critical Rev. PlantSci. 15: 21–62.
Paoletti, M. G., Pimentel, D., Stinner, B. R. and Stinner, D.1992. Agroecosystem biodiversity: matching productionand conservation biology. – In: Paoletti, M. G. and Pi-mentel, D. (eds), Biotic diversity in agroecosystems. Agric.Ecosyst. Environ. (Spec. Issue) 40: 3–23.
Pearse, A. S. 1946. Observations on the microfauna of theDuke forest. – Ecol. Monogr. 16: 127–150.
Peguy, Ch. P. 1970. Precis de Climatologie. – Masson, Paris.Persson, T., Baath, E., Clarholm, M. et al. 1980. Trophic
structure, biomass dynamics and carbon metabolism of soilorganisms in a Scots pine forest. – In: Persson, T. (ed.),Structure and function of northern coniferous forests. Anecosystem study. Ecol. Bull. (Stockholm) 32: 419–459.
Petersen, H. 1978. Some properties of two high-gradient ex-tractors for soil microarthropods, and an attempt to evalu-ate their extraction efficiency. – Natura Jutlandica 20:95–121.
Petersen, H. and Luxton, M. 1982. A comparative analysis ofsoil fauna populations and their role in decompositionprocesses. – Oikos 39: 287–388.
Price, D. W. 1975. Vertical distribution of small arthropods ina California Pine forest soil. – Ann. Entomol. Soc. Am.68: 174–180.
Price, D. W. and Benham, G. S., Jr. 1976. Vertical distributionof pomerantziid mites (Acarina: Pomerantziidae). – Proc.Entomol. Soc. Wash. 78: 309–313.
Price, D. W. and Benham, G. S., Jr. 1977. Vertical distributionof soil-inhabiting microarthropods in an agricultural habi-tat in California. – Environ. Entomol. 6: 575–580.
Salt, G., Hollick, F. S. J., Raw, F. and Brian, M. V. 1948. Thearthropod population of pasture soil. – J. Anim. Ecol. 17:139–150.
Sasa, M., Miyamoto, J., Shinohara, S. et al. 1970. Studies onmass culture and isolation of Dermatophagoides farinaeand some other mites associated with house dust andstored food. – Jpn. J. Exp. Med. 40: 367–382.
Satchell, J. E. and Nelson, J. M. 1962. A comparison of theTullgren-funnel and flotation methods of extractingAcarina from woodland soil. – In: Murphy, P. W. (ed.),Progress in soil zoology. Butterworths, pp. 212–216.
Seastedt, T. R. 1984. The role of microarthropods in decom-position and mineralization processes. – Annu. Rev. Ento-mol. 29: 25–46.
Seely, M. K. 1983. Effective use of the desert dune environ-ment as illustrated in the Namib tenebrionids. – In:Lebrun, Ph., Andre, H. M., De Medts, A. et al. (eds), Newtrends in soil biology. Dieu-Brichart, Ottignies, pp. 357–367.
Shaw, P. J. A. and Usher, M. B. 1996. Edaphic Collembola oflodgepole pine Pinus contorta plantations in Cumbria, UK.– Eur. J. Soil Biol. 32: 89–97.
Shilova, E. J. and Zhurik, L. W. 1949. Towards a characteri-zation of methods for the estimation of the number andmass of the soil fauna (in Russian). – Pochvovedenie 10:603–610.
Silva, S., Whitford, W. G., Jarrell, W. M. and Virginia, R. A.1989. The microarthropods fauna associated with a deeprooted legume, Prosopis glandulosa, in the ChihuahuanDesert. – Biol. Fertil. Soils 7: 330–335.
Sinha, R. N. 1961. Insects and mites associated with hot spotsin farm stored grain. – Can. Entomol. 93: 609–621.
Snider, R. M. and Snider, R. J. 1997. Efficiency of arthropodextraction from soil cores. – Entomol. News 108: 203–208.
Southwood, T. R. E. 1978. Ecological methods, 2nd ed. –Chapman and Hall.
Stanton, N. L. 1979. Patterns of species diversity in temperateand tropical litter mites. – Ecology 60: 295–304.
Steinberger, Y. 1990. Acarofauna of a Negev desert loessplain. – Acarologia 31: 313–319.
Stork, N. E. 1988. Insect diversity: facts, fiction and specula-tion. – Biol. J. Linn. Soc. 35: 321–337.
OIKOS 96:1 (2002) 23

Suleman, M., Arshad, M. and Jan, G. A. 1979. Relativeefficiency of mechanical and behavioral methods for theextraction of soil arthropods. – Pak. J. Zool. 11: 3–49.
Takeda, H. 1973. A preliminary study on collembolan popula-tions in a pine forest. – Res. Popul. Ecol. 15: 76–89.
Takeda, H. 1979. On the extraction process and efficiency ofMacFadyen’s high gradient extractor. – Pedobiologia 19:106–112.
Tamura, H. 1976. Biases in extracting Collembola throughTullgren funnel. – Rev. Ecol. Biol. Sol 13: 21–34.
Tanaka, M. 1970. The bio-economics on the populations ofIsotoma (Desoria) trispinata MacGillivray (Collembola:Isotomidae) and Onychiurus (Protaphorura) sp. (Collem-bola: Onychiuridae) in a grassfield. – Publ. Amakusa Mar.Biol. Lab. Kyushu Univ. 2: 51–120.
Toutain, F. 1981. Les Humus forestiers, structure et modes defonctionnement. – Rev. For. Fr. 6: 449–465.
Tragardh, I. and Forsslund, K. H. 1932. Studier over insam-lingstekniken vid undersokningar, over markens djurliv. –Medd. Statens Skogsforsoksanstalt 27 (2): 21–68.
Usher, M. B. 1975. Seasonal and vertical distribution of apopulation of soil arthropods: Cryptostigmata. – Pedobi-ologia 15: 364–374.
Usher, M. B. and Booth, R. G. 1984. Arthropod communitiesin a maritime Antarctic moss-turf habitat: three-dimen-sional distribution of mites and Collembola. – J. Anim.Ecol. 53: 427–441.
Usher, M. B., Davis, P. R., Harris, J. R. W. and Longstaff, B.C. 1979. A profusion of species? Approaches towardsunderstanding the dynamics of the populations of themicro-arthropods in decomposer communities. – In: An-derson, R. M., Turner, B. D. and Taylor, L. R. (eds),Population dynamics. Blackwell Scientific, pp. 359–384.
Valpas, A. 1969. Hot rod technique, a modification of the dryfunnel technique for extracting Collembola especially fromfrozen soil. – Ann. Zool. Fenn. 6: 269–274.
Van der Heijden, M. G. A., Klironomos, J. N., Ursic, M. et al.1998. Mycorrhizal fungal diversity determines plant biodi-versity, ecosystem variability and productivity. – Nature396: 69–72.
Van Straalen, N. M. and Rijninks, P. C. 1982. The efficiencyof Tullgren apparatus with respect to interpreting seasonalchanges in age structure of soil arthropod populations. –Pedobiologia 24: 197–209.
Wall, D. H. and Moore, J. C. 1999. Interactions underground.– BioScience 99: 109–117.
Wallwork, J. A. 1970. Ecology of soil animals. – McGraw-Hill.
Wallwork, J. A. 1976. The distribution and diversity of soilfauna. – Academic Press.
Wallwork, J. A. 1983. Oribatids in forest ecosystems. – Annu.Rev. Entomol. 28: 109–130.
Walter, D. E. 1995. Dancing on the head of a pin: mites in therainforest canopy. – Rec. W. Aust. Mus. Suppl. 52: 49–53.
Walter, D. E. and O’Dowd, D. 1995. Beneath biodiversity:factors influencing the diversity and abundance of canopymites. – Selbyana 16: 2–20.
Walter, D. E., Kethley, J. and Moore, J. C. 1987. A heptaneflotation method for recovering microarthropods fromsemiarid soils, with comparison to the Merchant-Crossleyhigh-gradient extraction method and estimates of mi-croarthropod biomass. – Pedobiologia 30: 221–232.
Walter, D. E., O’Dowd, D. and Barnes, V. 1994. The forgot-ten arthropods: foliar mites in the forest canopy. – Mem.Queensl. Mus. 36: 221–226.
Walter, H. and Lieth, H. 1960, 1964, 1967. Klimadiagramm-Weltatlas. – Gustav Fisher.
Wardle, D. A. 1999. How soil food webs make plants grow. –Trends Ecol. Evol. 14: 418–420.
Wauthy, G. and Lebrun, Ph. 1980. Synecology of oribatidmites of Belgium. 1. The zoosociological classes. – In:Dindal, D. (ed.), Soil biology as related to land use prac-tices. Proceedings VII International Soil Zoology Collo-quium. US EPA 560/13-8-03, Washington, pp. 795–805.
Weis-Fogh, T. 1948. Ecological investigations on mites andcollemboles in the soil. – Nat. Jutl. 1: 1–125.
Weygoldt, P. 1996. Chelicerata, Spinnentiere. – In: Westheide,W. and Rieger, R. (eds), Spezielle Zoologie (1er Teil). G.Fisher, pp. 449–500.
Whitford, W. G., Freckmann, D. W., Elkins, N. Z. et al. 1981.Diurnal migration and response to stimulated rainfall indesert soil microarthropods and nematodes. – Soil Biol.Biochem. 13: 417–425.
Wilkinson, D. M. 1998. Fragments of an entangled bank: doecologist study most of ecology? – Oikos 82: 393–394.
Willard, J. R. 1972. Soil invertebrates: I. Methods of samplingand extraction. – Canadian IBP Tech. Rep. 7: 1–40.
Willard, J. R. 1973a. Soil invertebrates: III. Collembola andminor insects: populations and biomass. – Canadian IBPTech. Rep. 19: 1–75.
Willard, J. R. 1973b. Soil invertebrates: IV. Acarina, minorArachnida and Chilopoda: populations and biomass. –Canadian IBP Tech. Rep. 20: 1–75.
Wilson, E. O. 1992. The diversity of life. – Belknap Press ofHarvard Univ. Press.
Wood, T. G. 1965. Comparison of a funnel and a flotationmethod for extracting Acari and Collembola from moor-land soils. – Pedobiologia 5: 131–139.
24 OIKOS 96:1 (2002)

![[Myth or reality? Man-eating wolves], « Mythe ou réalité ? Les loups mangeurs d’hommes », L’Histoire, 299, june 2005, p. 64-69.](https://static.fdokumen.com/doc/165x107/633179aff0080405510402ae/myth-or-reality-man-eating-wolves-mythe-ou-realite-les-loups-mangeurs.jpg)


![Myth of Heroes [Crandell]](https://static.fdokumen.com/doc/165x107/631db40d3dc6529d5d079a5c/myth-of-heroes-crandell.jpg)