Software Sector Summary Report - GCA Altium
42
SOFTWARE SECTOR REPORT Q4 2020
-
Upload
khangminh22 -
Category
Documents
-
view
1 -
download
0
Transcript of Software Sector Summary Report - GCA Altium

SOFTWARESECTOR REPORT
Q4 2020

22
2020 WRAP-UP
» The COVID-19 pandemic caused a significant downturn in the market in March of 2020. Across the board, valuations dropped substantially. Since that initial drop, however, the software sector has emerged as one of the strongest performing sectors and has consistently tracked well above the S&P 500.
» The M&A, IPO, financing and overall public markets activity in 2H 2020 highlights the attractiveness of the software sector given its:
— Stickiness and ubiquity
— Recurring revenue
— Mission-critical use cases
» Some significant trends include:
— Deeper focus on security and automation
— Overall digital transformation of multiple industries and processes
— Shift towards machine learning, cloud, AI, augmented reality, digital payments and enhanced infrastructure
» Infrastructure software continues to be at the forefront, leading most of the development in the sector
» Significant M&A activity in 2020 include: Salesforce’s $28.4Bn acquisition of Slack, Thoma Bravo’s $10.2Bn acquisition of RealPage, ICE’s $11.0Bn acquisition of Ellie Mae, Microsoft’s $985MM acquisition of ZeniMax and Mastercard’s $985MM acquisition of Finicity
» Significant financing activity in 2020 include: $668MM and $600M financings of Robinhood, $700M and $534MM financings of Chime, $550MM financing of Palantir, $850MM financing of Stripe and $479MM financing of Snowflake
» Significant IPOs activity in 2020 include: Root Insurance (ROOT), McAfee (MCFE), Datto (MSP), Asana (ASAN), Palantir (PLTR), Unity (U), Snowflake (SNOW), BigCommerce (BIGC), Lemonade (LMND)
» 2021 outlook for the software sector is promising, with most subsectors poised to see continued growth

33
Software Q4 2020
EXECUTIVE SUMMARY
» In Q4 2020, M&A deal activity and overall M&A deal value continued its aggressive growth, and private financing activity grew at an accelerating pace. Investors continue to show a strong desire for software business models amidst greater cloud adoption and remote work environments, evidenced by another quarter of favorable performances in public markets
– Software sector performed well in Q4 with the IGV tech-software index outperforming the S&P 500 by 35.7% LTM as of Q4 2020
– Infrastructure software index grew 118.7% LTM as of Q4 2020, outperforming all other software subsegments
» Q4 ’20 saw ~$22Bn in financing deal value and ~$76Bn in M&A deal value
- 284 financings, 25.1% higher than Q4 ‘19
- 532 M&A transactions, 52.4% higher than Q4 ’19
» Significant M&A activity in Q4 includes acquisitions in the ERP & General Business sector: Salesforce’s $28.4Bn acquisition of Slack and Adobe’s $1.5Bn acquisition of Workfront
» Financial software had some of the largest financing deals in Q4 ‘20 led by the $668MM financing of Robinhood, $534MM financing of Chime and $343MM financing of Molo
» Overall outlook in software growth remains healthy, with most sectors seeing notable growth
Notes:Sources: PitchBook, 451 Research, Capital IQ.
Select Q4 Active Investors Select Q4 Active Acquirers
44
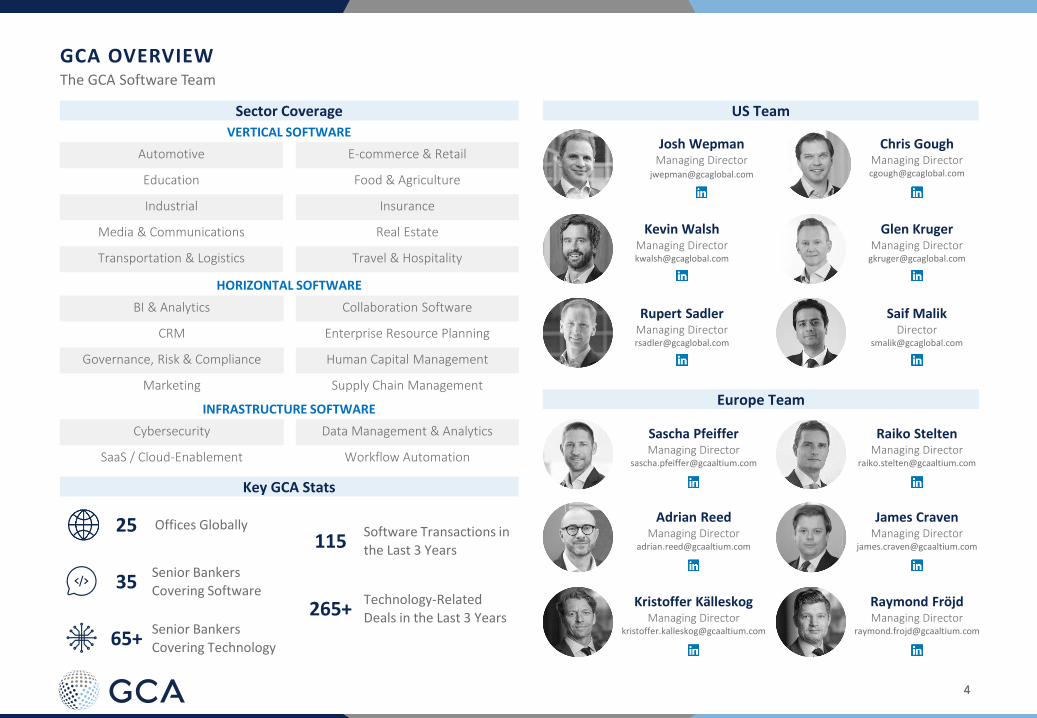
GCA OVERVIEWThe GCA Software Team
Sector Coverage US Team
VERTICAL SOFTWARE
Key GCA Stats
65+Senior Bankers Covering Technology
35Senior Bankers
Covering Software
25 Offices Globally Software Transactions in the Last 3 Years115
Technology-Related Deals in the Last 3 Years265+
Josh WepmanManaging Director
Chris GoughManaging [email protected]
Kevin WalshManaging [email protected]
Glen KrugerManaging Director
Rupert SadlerManaging [email protected]
Saif MalikDirector
Collaboration Software
Enterprise Resource Planning
Human Capital Management
Supply Chain Management
BI & Analytics
CRM
Governance, Risk & Compliance
Marketing
HORIZONTAL SOFTWARE
E-commerce & Retail
Food & Agriculture
Insurance
Real Estate
Travel & Hospitality
Automotive
Education
Industrial
Media & Communications
Transportation & Logistics
INFRASTRUCTURE SOFTWARE
Data Management & Analytics
Workflow Automation
Cybersecurity
SaaS / Cloud-Enablement
Europe Team
Sascha PfeifferManaging Director
James CravenManaging Director
Raymond FröjdManaging Director
Raiko SteltenManaging Director
Kristoffer KälleskogManaging Director
Adrian ReedManaging Director

55
Deep Software Sector Expertise with Demonstrated Success Advising Large-cap Public and Private Companies on Complex Assignments
GCA OVERVIEW
Notes:The above transactions represent a compilation of past and current deals that GCA entities, including GCA Advisors, LLC, GCA Advisors Corporation and GCA Altium, have advised on. Generally, GCA Advisors Corporation advises Asian-based transactions, while GCA Advisors, LLC advises U.S.-based transactions and GCA Altium advises UK/European-based transactions. At times, multiple GCA entities may be retained to advise on the same transaction.

66
DEAL DASHBOARD
Notes:Sources: Capital IQ, PitchBook, 451 Research and Dow Jones VentureSource. Market data as of 12/31/2020.1) Criteria based on software series A and subsequent rounds of global financings greater than or equal to $20MM. 2) Financings include software venture and private equity growth / expansion activity.3) Software M&A transactions reflect select transactions in Q4 2020. M&A metrics are based on closed and announced transactions.4) iShares North American Tech-Software ETF (IGV), used as proxy for software landscape. Top holdings in the ETF include ADBE, MSFT, ORCL, CRM and INTU.
Software Q4 2020
Quarterly Financing Deal Count (1)(2) Quarterly M&A Deal Count
$Bn $Bn
16.3%
52.0%
Select Financing Transactions Quarterly Financing Deal Value (1)(2) Quarterly M&A Deal Value Select M&A Transactions (3)
Company Amount ($MM) Acquirer Target EV ($MM)
$668 $28,445
$534 $10,200
$500 $3,200
$343 $2,750
$340 $2,227
$317 $2,065
$300 $1,600
$267 $1,500
LTM as of Q4 2020 Software Price Performance vs. S&P 500 (4)
Financing Activity by Quarter
$166.5 Billion
2020 YTD M&A Deal Value2020 YTD Financing Deal Value (1)(2)
$70.9 Billion
2020 YTD M&A Transactions2020 YTD Financing Transactions (1)(2)
944 1,705
(40%)
(20%)
0%
20%
40%
60%
80%
Jan-20 Feb-20 Mar-20 Apr-20 May-20 Jun-20 Jul-20 Aug-20 Sep-20 Oct-20 Nov-20 Dec-20
SPX IGV
$82
$30 $39
$22 $19 $28
$5
$56
$76
Q4'18 Q1'19 Q2'19 Q3'19 Q4'19 Q1'20 Q2'20 Q3'20 Q4'20
$23 $14 $15 $17 $18 $14 $16 $18 $22
Q4'18 Q1'19 Q2'19 Q3'19 Q4'19 Q1'20 Q2'20 Q3'20 Q4'20
225201 198
222 227 211 234 215
284
Q4'18 Q1'19 Q2'19 Q3'19 Q4'19 Q1'20 Q2'20 Q3'20 Q4'20
375 361 359 384349
389
315
469532
Q4'18 Q1'19 Q2'19 Q3'19 Q4'19 Q1'20 Q2'20 Q3'20 Q4'20

77
118.7%
Index Performance
RECENT STOCK PERFORMANCE
Last 12 Months
29.6%
66.9%
57.3%
89.9%
85.6%
25.4%
88.9%
58.6%
50.2%
26.1%
61.7%
Notes:Sources: Capital IQ. Market data as of 12/31/20.List of companies in each sector can be found in the public comparable tables.1) SaaS bucket is a subset of the other buckets and includes companies that operate a software-as-a-service platform.
Infrastructure BI & Analytics S&M SaaS(1) Development Technical Security ERP Content Vertical Financial Platform Nasdaq S&P 500
Low (2.1%) (31.4%) (35.8%) (19.3%) (23.2%) (24.4%) (27.0%) (26.5%) (18.7%) (27.6%) (28.3%) (20.0%) (24.5%) (31.3%)
Uptick from Low
120.8% 121.3% 124.7% 104.9% 90.1% 86.1% 85.5% 83.7% 68.9% 57.2% 54.4% 45.4% 66.3% 46.6%
Performance since Jan-20
118.7% 89.9% 88.9% 85.6% 66.9% 61.7% 58.6% 57.3% 50.2% 29.6% 26.1% 25.4% 41.8% 15.3%
15.3%
41.8%
(50.0%)
0.0%
50.0%
100.0%
150.0%
200.0%
Jan-20 Feb-20 Mar-20 Apr-20 May-20 Jun-20 Jul-20 Aug-20 Sep-20 Oct-20 Nov-20 Dec-20

88
Subsector Top Players and Key Operating Stats
SOFTWARE PUBLIC COMPANY LANDSCAPE
Platform
Combined Market Cap: $2,416Bn21E/20E Rev. Growth: 3.1%21E EBITDA Margin: 30.5%
Infrastructure
Combined Market Cap: $306Bn21E/20E Rev. Growth: 17.1%21E EBITDA Margin: 19.7%
Security
Combined Market Cap: $369Bn21E/20E Rev. Growth: 15.0%21E EBITDA Margin: 20.2%
Content & Storage Management
Combined Market Cap: $342Bn21E/20E Rev. Growth: 11.5% 21E EBITDA Margin: 21.9%
BI & Analytics
Combined Market Cap: $102Bn21E/20E Rev. Growth: 15.6%21E EBITDA Margin: 14.2%
Financial Applications
Combined Market Cap: $481Bn21E/20E Rev. Growth: 16.1%21E EBITDA Margin: 20.6%
Notes:Sources: Capital IQ. Market data as of 12/31/20.Logos shown represent largest players in each sub sector by enterprise value. Operating statistics for each sector represent full list of companies shown in public comparable tables.

99
Subsector Top Players and Key Operating Stats
SOFTWARE PUBLIC COMPANY LANDSCAPE
Technical Applications
Combined Market Cap: $309Bn21E/20E Rev. Growth: 12.4% 21E EBITDA Margin: 31.5%
Vertical
Combined Market Cap: $382Bn21E/20E Rev. Growth: 18.9%21E EBITDA Margin: 18.9%
ERP & General Business
Combined Market Cap: $608Bn21E/20E Rev. Growth: 12.5%21E EBITDA Margin: 18.7%
Development & Operations
Combined Market Cap: $385Bn21E/20E Rev. Growth: 17.1%21E EBITDA Margin: 13.3%
Sales & Marketing
Combined Market Cap: $58Bn21E/20E Rev. Growth: 19.1% 21E EBITDA Margin: 14.2%
SaaS
Combined Market Cap: $1,762Bn21E/20E Rev. Growth: 20.5% 21E EBITDA Margin: 16.1%
Notes:Sources: Capital IQ. Market data as of 12/31/20.Logos shown represent largest players in each sub sector by enterprise value. Operating statistics for each sector represent full list of companies shown in public comparable tables.
1010
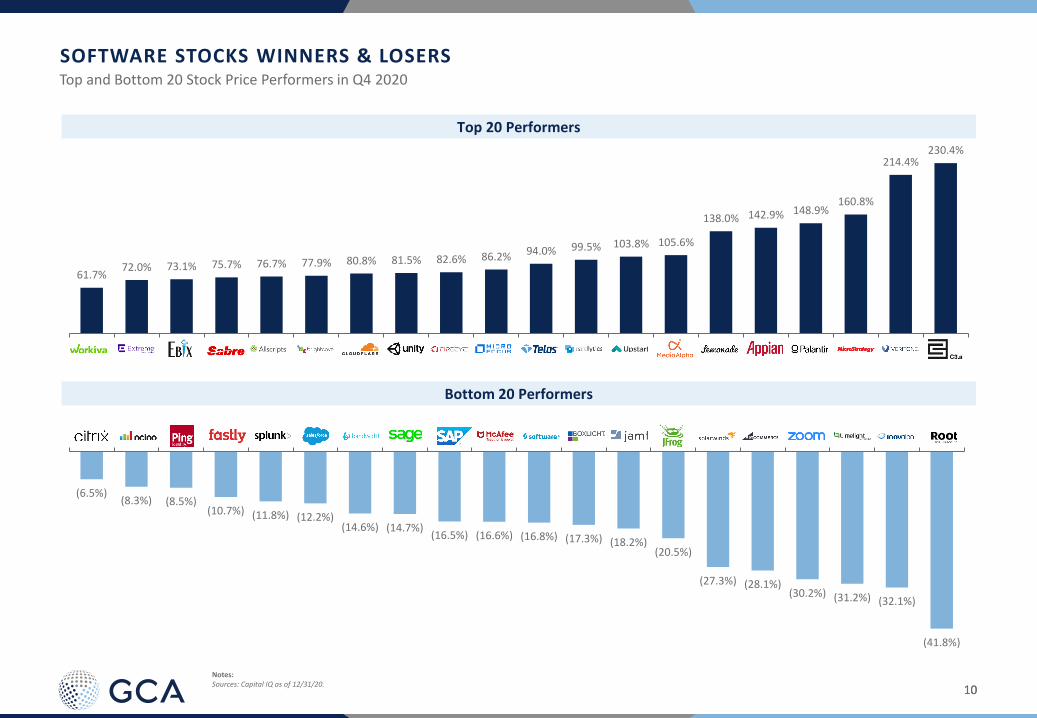
(6.5%)(8.3%) (8.5%)
(10.7%) (11.8%) (12.2%)(14.6%) (14.7%)
(16.5%) (16.6%) (16.8%) (17.3%) (18.2%)(20.5%)
(27.3%) (28.1%)(30.2%) (31.2%) (32.1%)
(41.8%)
61.7% 72.0% 73.1% 75.7% 76.7% 77.9% 80.8% 81.5% 82.6% 86.2% 94.0% 99.5% 103.8% 105.6%
138.0% 142.9% 148.9% 160.8%
214.4% 230.4%
SOFTWARE STOCKS WINNERS & LOSERS
Notes:Sources: Capital IQ as of 12/31/20.
Top and Bottom 20 Stock Price Performers in Q4 2020
Top 20 Performers
Bottom 20 Performers

1111
20.5% 19.1% 18.9%
17.1% 17.1% 16.1% 15.6% 15.0%
12.5% 12.4% 11.5%
3.1%
Median: 15.8%
15.7x 15.2x13.9x
12.3x10.9x 10.8x 10.4x
9.3x 8.9x 8.4x7.5x
3.9x
Median: 10.6x
Valuation and Operational Metrics
TRADING COMPARABLES
EV / 2020E Revenue EV / 2021E Revenue
2020E / 2019A Revenue Growth 2021E / 2020E Revenue Growth
Notes:Sources: Capital IQ. Market data as of 12/31/20.Figures represent mean values of respective comp groups.List of companies in each sector can be found in the public comparable tables.
18.0x17.2x
13.2x 12.9x 12.8x 12.5x11.4x 11.1x
10.6x9.4x 8.8x
4.1x
Median: 11.9x
35.9%
29.1%
24.4%
18.9% 17.6% 17.5% 16.4% 14.7% 14.4%
10.6%
4.8%
1.2%
Median: 17.0%

1212
31.9x
24.8x23.0x 22.5x 22.3x 21.9x 21.3x 20.9x
16.4x
12.4x 11.4x9.7x
Median: 21.6x
33.8x
27.3x25.6x 25.6x
23.8x22.3x 22.2x
19.0x 18.4x 17.2x14.4x
12.2x
Median: 22.3x
Valuation and Operational Metrics
TRADING COMPARABLES
EV / 2020E EBITDA EV / 2021E EBITDA
2020E EBITDA Margin 2021E EBITDA Margin
Notes:Sources: Capital IQ. Market data as of 12/31/20.Figures represent mean values of respective comp groups.List of companies in each sector can be found in the public comparable tables.
29.9% 29.5%
21.0% 20.5% 19.5% 19.1% 18.3% 17.9%
16.2% 13.7% 12.9%
11.7%
Median: 18.7%
31.5% 30.5%
21.9% 20.6% 20.2% 19.7% 18.9% 18.7%
16.1%
14.2% 14.2% 13.3%
Median: 19.3%

1313
PUBLIC SAAS COMPANIESEn
terp
rise
Val
ue
/ C
Y 2
02
1E
Re
ven
ue
CY 2021E Revenue Growth %
Low Growth Medium Growth High Growth
Median Rev. Growth % 10.6% 20.4% 32.6%
Median EV / Rev. 4.5x 15.2x 30.1x
High Growth Software(3)Medium Growth Software (2)Low Growth Software(1)
Notes:Sources: Capital IQ as of 12/31/20.1) Defined as companies with annual revenue growth <= 15%.2) Defined as companies with annual revenue growth >15% and <= 30%.3) Defined as companies with annual revenue growth >30%.
Valuation Correlation to Growth %
0.0x
10.0x
20.0x
30.0x
40.0x
50.0x
60.0x
0% 5% 10% 15% 20% 25% 30% 35% 40%
R = 0.74

1414
PUBLIC SAAS COMPANIES
Notes:Sources: Capital IQ as of 12/31/20.1) Defined as companies with revenue growth % + FCF margin % <= 20%.2) Defined as companies with revenue growth % + FCF margin % >20% and <= 40%.3) Defined as companies with revenue growth % + FCF margin % >40%.
Ente
rpri
se V
alu
e /
CY
20
21
E R
eve
nu
e
CY 2021E Revenue Growth % + CY 2021E FCF Margin %
Low Performance Medium Performance High Performance
Median Growth % + FCF Margin % 17.4% 28.5% 51.6%
Median EV / Rev. 5.2x 10.8x 22.0x
Valuation Correlation to Growth % & Free Cash Flow Margin %
High Performance Software(3)Medium Performance Software (2)Low Performance Software(1)
0.0x
20.0x
40.0x
60.0x
0% 5% 10% 15% 20% 25% 30% 35% 40% 45% 50% 55% 60%
R = 0.54
1515
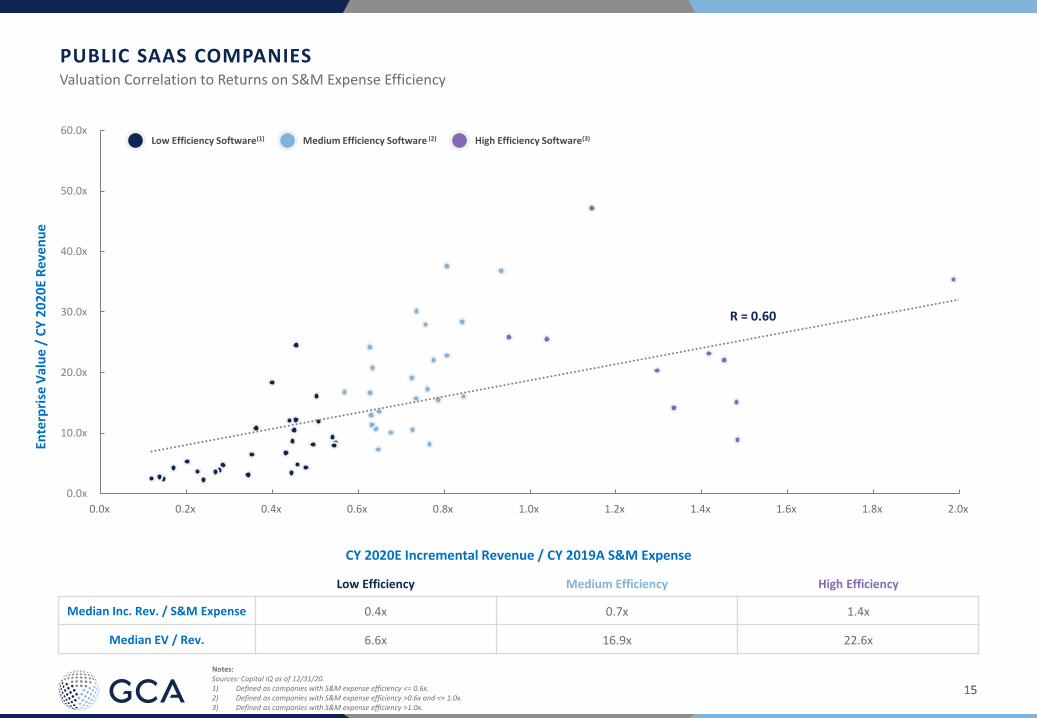
PUBLIC SAAS COMPANIESEn
terp
rise
Val
ue
/ C
Y 2
02
0E
Re
ven
ue
CY 2020E Incremental Revenue / CY 2019A S&M Expense
Low Efficiency Medium Efficiency High Efficiency
Median Inc. Rev. / S&M Expense 0.4x 0.7x 1.4x
Median EV / Rev. 6.6x 16.9x 22.6x
Notes:Sources: Capital IQ as of 12/31/20.1) Defined as companies with S&M expense efficiency <= 0.6x.2) Defined as companies with S&M expense efficiency >0.6x and <= 1.0x.3) Defined as companies with S&M expense efficiency >1.0x.
Valuation Correlation to Returns on S&M Expense Efficiency
High Efficiency Software(3)Medium Efficiency Software (2)Low Efficiency Software(1)
0.0x
10.0x
20.0x
30.0x
40.0x
50.0x
60.0x
0.0x 0.2x 0.4x 0.6x 0.8x 1.0x 1.2x 1.4x 1.6x 1.8x 2.0x
R = 0.60

1616
$82
$30
$39
$22 $19
$28
$5
$56
$76
375361 359
384
349
389
315
469
532
Q4'18 Q1'19 Q2'19 Q3'19 Q4'19 Q1'20 Q2'20 Q3'20 Q4'20
Notes:Sources: Capital IQ and 451 Research.
SOFTWARE M&A UPDATE
Select Q4 2020 M&A Transactions
Ann.Date
Acquirer TargetEnterprise
ValueEV/ LTM
Rev.
12/22 $1,300 NA
12/21 $10,200 9.4x
12/14 $1,210 7.6x
12/01 $28,445 36.4x
11/30 $1,450 NA
11/19 $2,750 NA
11/11 $800 NA
11/10 $1,600 NA
11/09 $1,500 6.3x
10/26 $1,000 1.4x
10/14 $2,065 8.4x
10/13 $1,350 13.0x
10/12 $3,200 NA
10/04 $2,227 NA
10/01 $940 7.2x
($MM)($Bn) Number of Deals M&A Deal Value
Q4 2020 Dashboard
Quarterly M&A Activity

1717
SOFTWARE FINANCINGS UPDATE
Quarterly Financing Activity Select Q4 2020 Financing Transactions
DealDate
CompanyLead/Selected
InvestorAmount Invested
Funding to Date
Post-Money
Valuation
12/28 $258 $416 $2,051
12/21 $300 $710 $5,100
12/17 $500 $500 $2,000
12/9 $317 $748 $2,817
11/11 $267 $697 $3,000
10/28 $340 $799 $3,300
10/15 $534 $1,541 $14,549
10/8 $200 $300 $3,000
10/5 $343 $361 $383
10/1 $668 NA $11,708
($MM)($Bn) Number of Deals Financing Deal Value
Q4 2020 Dashboard
Notes:Sources: PitchBook.
$23
$14 $15 $17
$18
$14 $16
$18
$22
225
201 198
222227
211
234
215
284
Q4'18 Q1'19 Q2'19 Q3'19 Q4'19 Q1'20 Q2'20 Q3'20 Q4'20

1818
($MM)
Offer Date(1) Name Market Cap @ IPO
DateAmount Raised Pre IPO Filing Range Offer Price Last Close Price % Change Current / Offer Price
12/16/2020 $2,135 $240 20.00 - 22.00 $20.00 $40.75
12/9/2020 $1,408 $118 16.00 - 18.00 $20.00 $27.96
12/9/2020 $8,865 $651 36.00 - 38.00 $42.00 $138.75
11/19/2020 $1,214 $254 16.00 - 18.00 $17.00 $32.98
10/28/2020 $6,622 $724 22.00 - 25.00 $27.00 $15.71
10/28/2020 $32 $176 18.00 - 20.00 $19.00 $39.07
10/22/2020 $3,094 $740 19.00 - 22.00 $20.00 $16.69
10/21/2020 $4,260 $594 24.00 - 27.00 $27.00 $27.00
10/1/2020 $341 $157 Direct Listing $10.17 $13.50
9/30/2020 $4,452 $631 Direct Listing $21.00 $29.55
9/30/2020 $15,673 $1,864 Direct Listing $7.25 $23.55
9/23/2020 $8,749 $237 19.00 - 21.00 $22.00 $40.51
9/18/2020 $18,001 $1,300 44.00 - 48.00 $52.00 $153.47
9/17/2020 $2,653 $326 17.00 - 21.00 $22.00 $28.58 29.9%
84.1%
40.7%
32.7%
0.0%
(16.6%)
105.6%
(41.8%)
94.0%
39.8%
103.8%
Select Recent Software IPO Pricings
SOFTWARE CAPITAL MARKETS UPDATE
Notes:Sources: Capital IQ and company filings. Market data as of 12/31/20. IPO pricings include public registrations only. 1) First Trading Day listed as Offer Date. 2) Reference price set by the New York Stock Exchange.3) Reference price set by the Nasdaq
(2)Median: 98.9%
(2)
230.4%
(3)
224.8%
195.1%

1919
($MM)
Offer Date(1) Name Market Cap @ IPO
DateAmount Raised Pre IPO Filing Range Offer Price Last Close Price % Change Current / Offer Price
9/16/2020 $70,261 $3,360 100.00 - 110.00 $120.00 $281.40
9/16/2020 $5,745 $509 39.00 - 41.00 $44.00 $62.83
8/14/2020 $5,133 $405 23.00 - 25.00 $27.00 $43.30
8/5/2020 $4,759 $216 21.00 - 23.00 $24.00 $64.15
8/5/2020 $3,263 $704 21.00 - 24.00 $21.00 $19.06
7/29/2020 $2,886 $402 14.00 - 16.00 $19.00 $34.85
7/22/2020 $4,561 $468 21.00 - 23.00 $26.00 $29.92
7/14/2020 $8,210 $250 28.00 - 29.00 $31.00 $72.41
7/2/2020 $3,810 $319 26.00 - 28.00 $29.00 $122.50
6/5/2020 $1,229 $345 19.00 - 21.00 $23.00 $75.40
6/4/2020 $1,513 $935 19.00 - 20.00 $21.00 $48.23
12/13/2019 $795 $150 16.00 - 18.00 $17.00 $45.41
12/12/2019 $2,505 $216 19.00 - 21.00 $22.00 $136.50
9/19/2019 $10,883 $648 19.00 - 22.00 $27.00 $98.44
129.7%
133.6%
15.1%
83.4%
(9.2%)
60.4%
42.8%
134.5%
(2)
Select Recent Software IPO Pricings (Cont’d.)
SOFTWARE CAPITAL MARKETS UPDATE
Notes:Sources: Capital IQ and company filings. Market data as of 12/31/20. IPO pricings include public registrations only. 1) First Trading Day listed as Offer Date. 2) Reference price set by the New York Stock Exchange.
MEDIAN: 98.9%
MEAN: 120.8%
Median: 98.9%
520.5%
322.4%
167.3%
227.8%
167.1%
264.6%

20
APPENDIX
2121
($MM)
Trading Metrics Operating Metrics CIQ
Stock Price Market Cash & Total Enterprise EV / Revenue EV / EBITDA Revenue Growth Gross Margin EBITDA Margin Revenue
Company 12/31/2020 Cap ST. Invest. Debt Value (EV) CY19A CY20E CY21E CY19A CY20E CY21E 19A/18A 20E/19A 21E/20E CY19A CY20E CY21E CY19A CY20E CY21E
Platform
Microsoft Corporation $222.42 $1,681,606 $137,949 $83,216 $1,626,873 12.1x 10.8x 9.8x 26.5x 23.5x 21.6x 13% 12% 10% 66% 66% 66% 46% 46% 45%
Oracle Corporation $64.69 $190,450 $38,610 $70,919 $223,458 5.6x 5.7x 5.5x 11.9x 11.5x 11.0x 0% (0%) 3% 80% 80% 80% 47% 49% 50%
Cisco Systems $44.75 $189,092 $30,016 $15,593 $174,669 3.4x 3.6x 3.5x 9.3x 9.9x 9.8x 1% (7%) 4% 63% 63% 63% 37% 37% 36%
International Business Machines Corporation$125.88 $112,166 $15,593 $70,385 $167,084 2.2x 2.3x 2.2x 9.2x 11.0x 8.8x (3%) (2%) 1% 47% 49% 48% 24% 21% 25%
SAP SE $131.16 $156,184 $9,742 $17,302 $163,743 5.3x 4.9x 4.9x 14.5x 14.0x 14.0x 9% 8% 1% 72% 72% 71% 37% 35% 35%
Dell Technologies Inc. $73.29 $54,953 $11,304 $52,114 $100,819 1.1x 1.1x 1.1x 8.6x 8.1x 7.7x 2% 1% 2% 34% 33% 31% 13% 13% 14%
HP Inc. $24.59 $31,712 $5,142 $7,399 $33,969 0.6x 0.6x 0.6x 6.5x 7.1x 6.7x (0%) (3%) 1% 18% 18% 18% 9% 8% 9%
Mean 4.3x 4.1x 3.9x 12.3x 12.2x 11.4x 3% 1% 3% 54% 55% 54% 30% 30% 31%
Median 3.4x 3.6x 3.5x 9.3x 11.0x 9.8x 1% (0%) 2% 63% 63% 63% 37% 35% 35%
Infrastructure
Zoom Video Communications $337.32 $98,212 $1,872 $70 $96,411 NM 37.4x 27.6x NM NM NM 88% 314% 36% 82% 69% 76% 17% 35% 29%
Snowflake Inc. $281.40 $79,664 $4,754 $206 $75,116 NM NM NM NM NM NM 174% 114% 90% 56% 63% 67% NM NM NM
RingCentral $378.97 $33,968 $746 $1,463 $34,686 42.4x 29.7x 24.2x NM NM NM 33% 43% 23% 76% 76% 78% 15% 13% 14%
Akamai Technologies $104.99 $17,092 $1,444 $2,709 $18,356 6.3x 5.8x 5.4x 15.2x 13.2x 12.4x 7% 10% 7% 66% 64% 65% 42% 44% 44%
Citrix Systems $130.10 $16,018 $925 $1,927 $17,021 5.7x 5.3x 5.1x 14.9x 14.6x 15.1x 1% 7% 4% 86% 86% 86% 38% 36% 34%
Five9 $174.40 $11,507 $781 $657 $11,383 34.7x 27.0x 22.8x NM NM NM 27% 29% 18% 63% 64% 61% 19% 18% 16%
Fastly $87.37 $9,916 $402 $32 $9,546 47.6x 32.9x 25.0x NM NM NM 39% 45% 31% 57% 60% 57% (9%) (0%) (0%)
Amdocs Limited $70.93 $9,300 $984 $1,033 $9,391 2.3x 2.2x 2.1x 11.4x 11.2x 9.5x 3% 2% 6% 35% 35% 35% 20% 20% 22%
Rackspace Technology $19.06 $3,818 $253 $4,157 $7,722 3.2x 2.9x 2.6x 13.0x 10.1x 9.6x (1%) 11% 9% 39% 38% 39% 24% 28% 28%
Juniper Networks $22.51 $7,422 $1,848 $1,873 $7,448 1.7x 1.7x 1.6x 7.8x 8.2x 8.0x (4%) (1%) 3% 60% 59% 60% 21% 20% 20%
Everbridge $149.07 $5,211 $469 $465 $5,207 25.9x 19.4x 15.5x NM NM NM 37% 33% 26% 71% 71% 70% 3% 3% 5%
Verint Systems Inc. $67.18 $4,416 $631 $886 $4,689 3.6x 3.7x 3.5x 14.4x 14.1x 13.4x 6% (2%) 5% 68% 70% 67% 25% 26% 26%
Jamf Holding Corp. $29.92 $3,489 $177 $0 $3,311 16.2x 12.6x 10.5x NM NM NM 39% 29% 20% 78% 81% 78% 9% 12% 9%
Software Aktiengesellschaft $40.78 $3,017 $638 $365 $2,745 2.7x 2.7x 2.7x 8.9x 12.4x 11.9x 1% 2% 0% 77% 76% 77% 31% 22% 23%
Extreme Networks $6.89 $848 $193 $455 $1,109 1.1x 1.2x 1.1x NA 15.8x 9.6x (1%) (12%) 7% 56% 56% 56% 0% 8% 12%
Radware Ltd. $27.75 $1,281 $291 $29 $1,019 4.0x 4.1x 3.8x 24.0x 29.1x 22.2x 8% (1%) 8% 83% 83% 82% 17% 14% 17%
A10 Networks $9.86 $756 $159 $30 $627 2.9x 2.8x 2.6x NA 14.1x 11.6x (8%) 6% 7% 78% 78% 78% 0% 20% 22%
Limelight Networks $3.99 $491 $125 $114 $480 2.4x 2.0x 1.9x 26.5x 15.7x 12.8x 3% 18% 9% 49% 47% 52% 9% 13% 15%
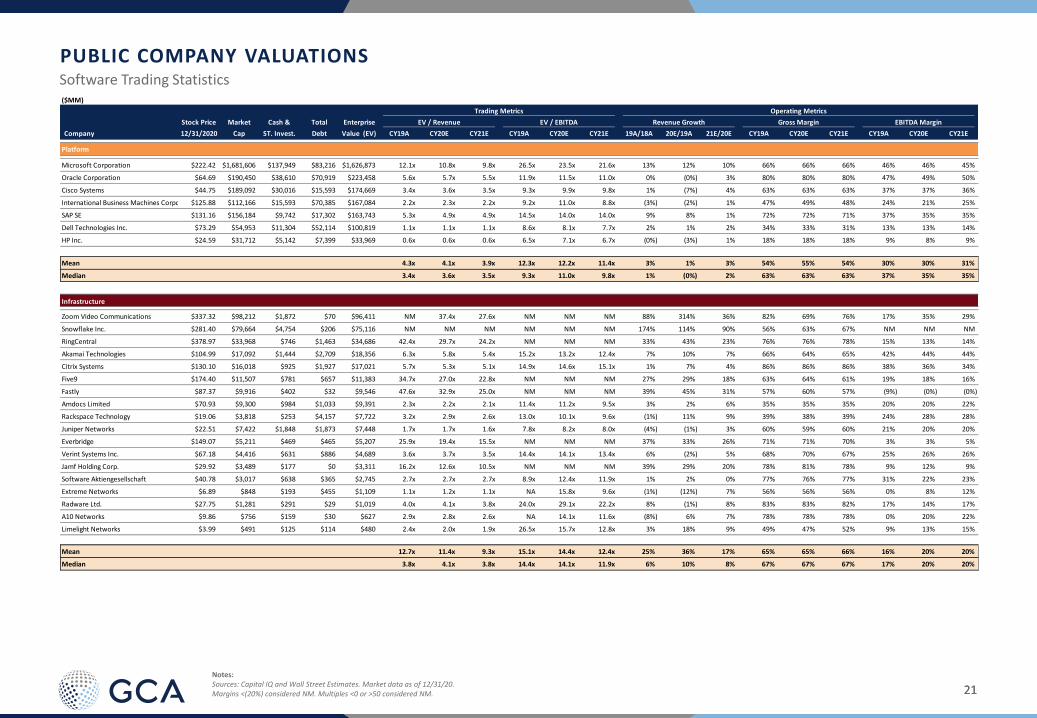
Mean 12.7x 11.4x 9.3x 15.1x 14.4x 12.4x 25% 36% 17% 65% 65% 66% 16% 20% 20%
Median 3.8x 4.1x 3.8x 14.4x 14.1x 11.9x 6% 10% 8% 67% 67% 67% 17% 20% 20%
Software Trading Statistics
PUBLIC COMPANY VALUATIONS
Notes:Sources: Capital IQ and Wall Street Estimates. Market data as of 12/31/20.Margins <(20%) considered NM. Multiples <0 or >50 considered NM.
2222
($MM)
Trading Metrics Operating Metrics CIQ
Stock Price Market Cash & Total Enterprise EV / Revenue EV / EBITDA Revenue Growth Gross Margin EBITDA Margin Revenue
Company 12/31/2020 Cap ST. Invest. Debt Value (EV) CY19A CY20E CY21E CY19A CY20E CY21E 19A/18A 20E/19A 21E/20E CY19A CY20E CY21E CY19A CY20E CY21E
Security
CrowdStrike Holdings $211.82 $46,868 $1,060 $43 $45,852 NM NM 38.1x NM NM NM 93% 78% 40% 72% 75% 68% (9%) 11% 10%
Palo Alto Networks $355.39 $34,411 $3,218 $3,443 $34,636 11.1x 9.2x 7.7x 45.7x 36.6x 34.0x 20% 20% 19% 71% 71% 71% 24% 25% 23%
Okta $254.26 $32,918 $2,536 $1,953 $32,335 NM 39.3x 30.1x NM NM NM 47% 40% 30% 76% 78% 74% (6%) 3% 3%
Splunk Inc. $169.89 $27,475 $1,994 $2,679 $28,160 11.9x 13.0x 10.8x NM NM NM 31% (8%) 21% 85% 79% 80% 17% (4%) 5%
Zscaler $199.71 $26,799 $1,416 $927 $26,311 NM 50.0x 37.6x NM NM NM 48% 46% 33% 79% 79% 79% 11% 13% 15%
VeriSign $216.40 $24,693 $1,150 $1,794 $25,337 20.6x 20.0x 18.8x 28.1x 29.1x 26.9x 1% 3% 7% 86% 86% 85% 73% 69% 70%
Cloudflare $75.99 $23,352 $1,055 $421 $22,718 NM NM 40.2x NM NM NM 49% 48% 34% 77% 77% 78% (15%) 2% 6%
Fortinet $148.53 $24,111 $1,657 $48 $22,503 10.4x 8.8x 7.6x 38.1x 29.8x 25.9x 20% 19% 16% 77% 79% 77% 27% 29% 29%
Check Point Software Technologies Ltd. $132.91 $18,634 $1,607 $0 $17,027 8.5x 8.3x 8.0x 16.7x 16.2x 16.0x 4% 3% 3% 90% 90% 89% 51% 51% 50%
Citrix Systems $130.10 $16,018 $925 $1,927 $17,021 5.7x 5.3x 5.1x 14.9x 14.6x 15.1x 1% 7% 4% 86% 86% 86% 38% 36% 34%
NortonLifeLock Inc. $20.78 $12,299 $1,049 $3,712 $14,962 6.0x 6.0x 5.9x 8.2x 11.0x 10.3x (18%) (0%) 3% 81% 81% 81% 73% 55% 57%
F5 Networks $175.94 $10,838 $1,210 $773 $10,402 4.6x 4.3x 4.1x 12.5x 12.9x 11.4x 4% 5% 6% 83% 83% 83% 37% 34% 36%
Proofpoint $136.41 $7,872 $1,020 $844 $7,696 8.7x 7.4x 6.5x 49.0x 41.7x 40.1x 24% 18% 14% 79% 80% 75% 18% 18% 16%
McAfee Corp. $16.69 $2,626 $348 $4,900 $7,178 2.7x 2.5x 2.4x 10.5x 6.3x 6.2x 9% 9% 4% 70% 78% 70% 26% 40% 39%
Trend Micro Incorporated $57.55 $7,979 $1,800 $0 $6,188 4.1x 3.7x 3.5x 12.6x 11.9x 11.1x 4% 10% 5% 80% 79% 80% 32% 31% 32%
CyberArk Software Ltd. $161.59 $6,259 $884 $498 $5,872 13.5x 13.1x 12.1x 43.8x NM NM 26% 3% 8% 88% 85% 85% 31% 20% 14%
FireEye $23.06 $5,211 $942 $1,030 $5,298 6.0x 5.7x 5.4x 46.0x 39.1x 36.4x 7% 5% 6% 72% 70% 68% 13% 15% 15%
Tenable Holdings $52.26 $5,389 $269 $62 $5,182 14.6x 11.9x 10.0x NM NM NM 33% 23% 19% 84% 83% 84% (11%) 7% 9%
Varonis Systems $163.61 $5,191 $326 $274 $5,139 20.2x 18.2x 15.2x NM NM NM (6%) 11% 20% 87% 86% 88% (8%) (1%) 0%
Rapid7 $90.16 $4,674 $321 $461 $4,814 14.7x 11.8x 9.9x NM NM NM 34% 25% 19% 75% 74% 72% 4% 4% 6%
SailPoint Technologies Holdings $53.24 $4,840 $484 $361 $4,717 16.3x 13.2x 11.8x NM NM NM 16% 23% 12% 80% 81% 79% 10% 9% 4%
Qualys $121.87 $4,755 $319 $60 $4,496 14.0x 12.4x 11.0x 31.9x 26.7x 24.3x 15% 13% 13% 80% 81% 79% 44% 46% 45%
Mimecast Limited $56.84 $3,632 $231 $261 $3,662 9.0x 7.6x 6.7x NM 32.7x 32.8x 26% 18% 15% 74% 74% 74% 17% 23% 20%
Sumo Logic $28.58 $2,924 $407 $0 $2,517 16.2x NA NA NM NA NA 50% NA NA 71% NM NM NM NA NA
Ping Identity Holding Corp. $28.64 $2,323 $173 $170 $2,320 9.5x 9.3x 8.0x 46.4x NM NM 21% 3% 16% 84% 81% 84% 21% 13% 14%
Telos Corporation $32.98 $2,133 $10 $180 $2,312 14.5x 12.9x 8.4x NM NM NM 15% 13% 53% 36% 33% 36% 5% 4% 11%
SecureWorks Corp. $14.22 $1,169 $188 $30 $1,012 1.8x 1.8x 1.7x NM 30.0x 33.0x 7% 1% 3% 57% 60% 56% 2% 6% 5%
F-Secure Oyj $4.69 $742 $50 $58 $750 3.1x 2.8x 2.6x 28.8x 16.3x 16.9x 12% 10% 6% 77% 78% 79% 11% 17% 16%
OneSpan Inc. $20.68 $838 $113 $15 $740 2.9x 3.6x 3.3x 22.5x NM 34.8x 20% (19%) 10% 67% 70% 69% 13% 4% 9%
Zix Corporation $8.63 $474 $24 $196 $647 3.7x 3.0x 2.7x 16.4x 12.5x 11.2x 146% 25% 12% 61% 54% 65% 23% 24% 24%
A10 Networks $9.86 $756 $159 $30 $627 2.9x 2.8x 2.6x NA 14.1x 11.6x (8%) 6% 7% 78% 78% 78% 0% 20% 22%
Absolute Software Corporation $11.89 $583 $58 $10 $534 5.3x 4.8x 4.3x 22.3x 18.5x 19.1x 6% 9% 12% 86% 86% 86% 24% 26% 23%
Tufin Software Technologies Ltd. $12.48 $447 $84 $23 $385 3.7x 4.0x 3.5x NM NM NM 22% (6%) 13% 83% 81% 83% (14%) NM (18%)
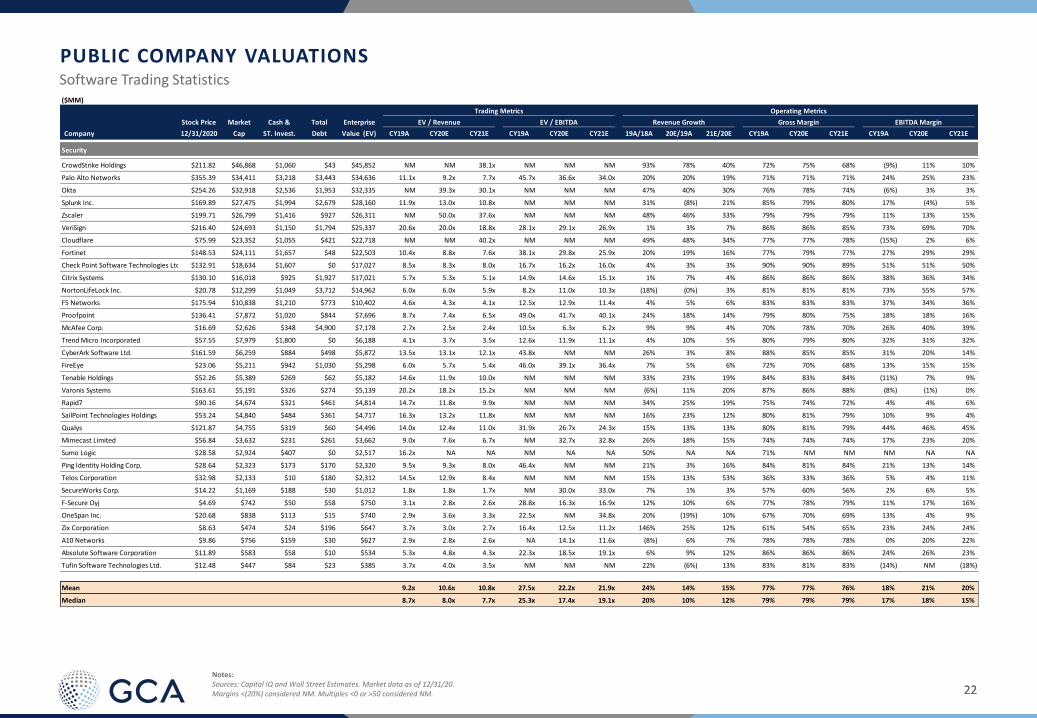
Mean 9.2x 10.6x 10.8x 27.5x 22.2x 21.9x 24% 14% 15% 77% 77% 76% 18% 21% 20%
Median 8.7x 8.0x 7.7x 25.3x 17.4x 19.1x 20% 10% 12% 79% 79% 79% 17% 18% 15%
Software Trading Statistics
PUBLIC COMPANY VALUATIONS
Notes:Sources: Capital IQ and Wall Street Estimates. Market data as of 12/31/20.Margins <(20%) considered NM. Multiples <0 or >50 considered NM.

2323
Software Trading Statistics
PUBLIC COMPANY VALUATIONS
Notes:Sources: Capital IQ and Wall Street Estimates. Market data as of 12/31/20.Margins <(20%) considered NM. Multiples <0 or >50 considered NM.
($MM)
Trading Metrics Operating Metrics CIQ
Stock Price Market Cash & Total Enterprise EV / Revenue EV / EBITDA Revenue Growth Gross Margin EBITDA Margin Revenue
Company 12/31/2020 Cap ST. Invest. Debt Value (EV) CY19A CY20E CY21E CY19A CY20E CY21E 19A/18A 20E/19A 21E/20E CY19A CY20E CY21E CY19A CY20E CY21E
Content & Storage Management
Adobe Inc. $500.12 $239,917 $5,992 $4,708 $238,633 21.4x 18.6x 15.7x 46.9x 38.6x 31.7x 24% 15% 19% 88% 88% 87% 46% 48% 50%
DocuSign $222.30 $41,472 $599 $686 $41,559 42.7x 29.1x 22.0x NM NM NM 39% 47% 32% 78% 78% 76% 10% 14% 15%
Open Text Corporation $45.46 $12,319 $1,846 $4,461 $14,936 5.1x 4.6x 4.6x 13.4x 12.0x 11.9x 3% 11% 0% 74% 74% 74% 38% 38% 38%
NetApp $66.24 $14,797 $3,653 $2,767 $13,911 2.5x 2.5x 2.4x 10.3x 10.9x 10.2x (10%) (1%) 3% 64% 64% 64% 24% 23% 24%
Dropbox $22.19 $9,178 $1,227 $1,123 $9,074 5.5x 4.8x 4.3x 24.0x 16.3x 13.8x 19% 15% 11% 76% 79% 74% 23% 29% 31%
Nutanix $31.87 $6,423 $1,318 $1,149 $6,254 5.0x 4.9x 4.7x NM NM NM 1% 3% 4% 71% 71% 71% NM NM NM
Pure Storage $22.61 $6,168 $1,201 $904 $5,871 3.6x 3.5x 3.1x 40.4x NM 37.6x 21% 1% 15% 70% 70% 68% 9% 6% 8%
Varonis Systems $163.61 $5,191 $326 $274 $5,139 20.2x 18.2x 15.2x NM NM NM (6%) 11% 20% 87% 86% 88% (8%) (1%) 0%
Box $18.05 $2,864 $275 $425 $3,013 4.3x 3.9x 3.6x 43.8x 16.2x 15.1x 14% 10% 9% 71% 73% 72% 10% 24% 24%
Commvault Systems $55.37 $2,610 $394 $20 $2,236 3.3x 3.3x 3.1x 20.0x NA 16.8x (4%) (0%) 4% 85% 85% 85% 16% 0% 19%
Brightcove Inc. $18.40 $732 $30 $18 $720 3.9x 3.7x 3.4x NM 39.7x 33.3x 12% 5% 10% 61% 62% 60% 5% 9% 10%
Mean 10.7x 8.8x 7.5x 28.4x 22.3x 21.3x 10% 11% 12% 75% 76% 75% 17% 19% 22%
Median 5.0x 4.6x 4.3x 24.0x 16.3x 15.9x 12% 10% 10% 74% 74% 74% 13% 18% 21%

2424
($MM)
Trading Metrics Operating Metrics CIQ
Stock Price Market Cash & Total Enterprise EV / Revenue EV / EBITDA Revenue Growth Gross Margin EBITDA Margin Revenue
Company 12/31/2020 Cap ST. Invest. Debt Value (EV) CY19A CY20E CY21E CY19A CY20E CY21E 19A/18A 20E/19A 21E/20E CY19A CY20E CY21E CY19A CY20E CY21E
Business Intelligence & Analytics
Palantir Technologies Inc. $23.55 $41,025 $1,800 $198 $39,423 NM 36.8x 27.9x NM NM NM 25% 44% 32% 71% 76% 71% NM 14% 18%
NICE Ltd. $279.96 $17,562 $1,543 $1,011 $17,055 10.8x 10.3x 9.4x 34.5x 30.9x 28.4x 9% 5% 9% 71% 71% 68% 31% 33% 33%
Elastic N.V. $146.13 $12,772 $351 $33 $12,454 32.4x 22.9x 18.6x NM NM NM 60% 41% 23% 72% 72% 72% (16%) (8%) (5%)
Alteryx $121.79 $8,109 $723 $780 $8,166 19.5x 16.9x 14.3x NM NM NM 65% 16% 18% 91% 92% 90% 19% 14% 16%
Medallia $33.22 $4,998 $654 $463 $4,807 11.9x 10.1x 8.7x NM NM NM 28% 18% 17% 67% 69% 65% 3% 7% 8%
Cloudera $13.91 $4,350 $395 $206 $4,161 5.2x 4.8x 4.4x NM 19.2x 16.9x 65% 9% 9% 76% 82% 73% (3%) 25% 26%
Inovalon Holdings $18.17 $2,824 $120 $1,040 $3,744 5.8x 5.7x 5.0x 17.8x 16.4x 14.1x 22% 3% 13% 74% 75% 73% 33% 35% 36%
MicroStrategy Incorporated $388.55 $3,601 $53 $106 $3,654 7.5x NA NA NM NA NA (2%) NA NA 80% NM NM 5% NA NA
Teradata Corporation $22.47 $2,456 $533 $683 $2,606 1.4x 1.4x 1.4x 7.8x 7.0x 6.2x (12%) (4%) 2% 54% 58% 52% 18% 20% 23%
Domo $63.77 $1,910 $84 $105 $1,931 11.1x 9.3x 8.1x NM NM NM 22% 20% 15% 76% 78% 70% NM (18%) (9%)
Talend S.A. $38.34 $1,218 $161 $178 $1,235 5.0x 4.4x 3.8x NM NM NM 20% 14% 13% 77% 80% 77% (7%) (6%) (3%)
Veritone $28.45 $887 $54 $0 $833 16.8x 14.6x 12.1x NM NM NM 84% 15% 20% 65% 71% 75% NM NM NM
Mean 11.6x 12.5x 10.4x 20.0x 18.4x 16.4x 32% 16% 16% 73% 75% 71% 9% 12% 14%
Median 10.8x 10.1x 8.7x 17.8x 17.8x 15.5x 23% 15% 15% 73% 75% 72% 5% 14% 17%
Technical Applications
Autodesk $305.34 $67,141 $1,616 $2,099 $67,624 21.5x 18.0x 15.7x NM NM 44.5x 29% 20% 15% 91% 92% 93% 27% 32% 35%
Dassault Systèmes SE $203.24 $53,027 $2,943 $5,394 $55,532 12.3x 10.2x 9.3x 34.4x 31.7x 28.0x 13% 21% 9% 85% 83% 84% 36% 32% 33%
Unity Software Inc. $153.47 $41,556 $1,759 $126 $39,923 NM NM 41.9x NM NM NM 42% 39% 26% 78% 80% 79% (19%) (6%) (1%)
Synopsys $259.24 $39,672 $1,236 $663 $39,105 11.6x 10.3x 9.5x 42.0x 31.4x 28.1x 6% 13% 8% 79% 79% 79% 28% 33% 34%
Cadence Design Systems $136.43 $38,055 $1,307 $697 $37,445 16.0x 14.1x 13.2x 42.9x 37.0x 34.1x 9% 14% 7% 90% 90% 89% 37% 38% 39%
ANSYS $363.80 $31,245 $845 $546 $30,945 20.4x 19.0x 16.9x 43.2x 43.7x 37.4x 17% 8% 12% 91% 90% 90% 47% 43% 45%
PTC Inc. $119.61 $13,954 $304 $1,220 $14,871 11.6x 10.0x 9.2x 26.7x 31.9x 29.3x 1% 16% 9% 75% 75% 75% 44% 31% 31%
Bentley Systems $40.51 $11,002 $138 $638 $11,502 15.6x NA NA NM NA NA 6% NA NA 81% NM NM 24% NA NA
Aspen Technology $130.25 $8,828 $318 $462 $8,973 14.8x 14.6x 12.3x 28.9x 27.5x 21.4x 12% 2% 18% 90% 90% 90% 51% 53% 57%
Altair Engineering Inc. $58.18 $4,285 $245 $251 $4,291 9.5x 9.5x 8.8x NM NM NM 16% 0% 8% 72% 74% 72% 11% 9% 9%
Mean 14.8x 13.2x 15.2x 36.3x 33.8x 31.9x 15% 15% 12% 83% 83% 83% 29% 30% 32%
Median 14.8x 12.2x 12.3x 38.2x 31.8x 29.3x 13% 14% 9% 83% 83% 84% 32% 32% 34%
Software Trading Statistics
PUBLIC COMPANY VALUATIONS
Notes:Sources: Capital IQ and Wall Street Estimates. Market data as of 12/31/20.Margins <(20%) considered NM. Multiples <0 or >50 considered NM.
2525
($MM)
Trading Metrics Operating Metrics CIQ
Stock Price Market Cash & Total Enterprise EV / Revenue EV / EBITDA Revenue Growth Gross Margin EBITDA Margin Revenue
Company 12/31/2020 Cap ST. Invest. Debt Value (EV) CY19A CY20E CY21E CY19A CY20E CY21E 19A/18A 20E/19A 21E/20E CY19A CY20E CY21E CY19A CY20E CY21E
Financial Applications
Fidelity National Information Services $141.46 $87,777 $2,366 $20,189 $105,790 10.2x 8.4x 7.7x 25.2x 20.0x 17.1x 23% 22% 9% 35% 35% 34% 41% 42% 45%
Intuit Inc. $379.85 $104,856 $5,793 $2,634 $101,697 14.3x 12.6x 10.6x 39.8x 32.6x 29.6x 13% 14% 19% 84% 84% 84% 36% 39% 36%
Fiserv $113.86 $76,336 $937 $21,259 $97,655 9.6x 6.5x 6.1x 19.9x 17.8x 15.5x 75% 47% 6% 47% 44% 47% 48% 36% 40%
MSCI Inc. $446.53 $37,015 $1,303 $3,540 $39,252 25.2x 23.2x 21.0x 46.2x 40.4x 36.2x 9% 9% 10% 81% 83% 81% 55% 57% 58%
SS&C Technologies Holdings $72.75 $18,621 $185 $7,172 $25,608 5.5x 5.5x 5.4x 14.0x 14.0x 13.4x 35% 0% 3% 54% 57% 49% 39% 40% 40%
Coupa Software Incorporated $338.91 $24,461 $1,354 $1,511 $24,618 NM 47.0x 36.9x NM NM NM 50% 34% 27% 72% 71% 68% 9% 17% 15%
Xero Limited $113.27 $16,576 $379 $330 $16,527 37.3x 28.8x 24.6x NM NM NM 32% 29% 17% 84% 84% 84% 19% 21% 29%
Fair Isaac Corporation $511.04 $14,870 $157 $936 $15,649 13.1x 11.9x 11.6x 41.7x 32.6x 35.8x 16% 10% 3% 70% 70% 70% 31% 37% 32%
Avalara $164.89 $13,945 $1,064 $66 $12,947 33.9x 26.5x 20.9x NM NM NM 41% 28% 26% 72% 73% 72% 0% 1% (0%)
Jack Henry & Associates $161.99 $12,362 $195 $70 $12,237 7.5x 7.1x 6.7x 22.9x 22.4x 21.1x 7% 6% 6% 42% 42% 42% 33% 32% 32%
Temenos AG $139.76 $10,119 $113 $1,114 $11,119 11.4x 12.4x 11.2x 30.4x 28.2x 25.6x 16% (8%) 10% 83% 82% 75% 38% 44% 44%
Bill.com Holdings $136.50 $11,079 $700 $58 $10,436 NM NM 47.2x NA NM NM NA 62% 25% 75% 75% 75% 0% (7%) (6%)
BlackLine $133.38 $7,637 $526 $413 $7,533 26.1x 21.6x 18.3x NM NM NM 27% 20% 18% 82% 82% 80% 9% 14% 12%
Q2 Holdings $126.53 $6,818 $396 $484 $6,906 21.9x 17.1x 14.1x NM NM NM 31% 28% 21% 53% 54% 50% 6% 6% 7%
nCino $72.41 $6,683 $379 $0 $6,309 45.7x 31.4x 25.5x NM NM NM 51% 45% 23% 53% 60% 53% (17%) (6%) (6%)
SimCorp A/S $148.81 $5,899 $38 $54 $5,915 11.6x 10.4x 9.5x 37.0x 34.7x 30.4x 16% 12% 10% 63% 63% 62% 31% 30% 31%
Envestnet $82.29 $4,440 $363 $848 $4,923 5.5x 5.0x 4.5x 25.5x 21.7x 20.0x 11% 10% 10% 69% 69% 45% 21% 23% 22%
Vertex $34.85 $5,092 $270 $2 $4,823 15.0x 13.1x 12.1x NM NM NM 18% 15% 8% 64% 71% 64% 15% 21% 18%
Shift4 Payments $75.40 $3,404 $329 $440 $3,763 5.1x 4.8x 3.5x NA 41.2x 23.7x 30% 7% 39% 35% 55% 35% 0% 12% 15%
Upstart Holdings $40.75 $2,953 $53 $115 $3,015 15.8x 13.7x 8.4x NM NM NM 52% 16% 63% 72% 84% 84% 12% 10% 7%
Bottomline Technologies (de) $52.74 $2,379 $197 $213 $2,395 5.6x 5.3x 4.9x 24.5x 24.5x 22.1x 6% 4% 10% 57% 57% 57% 23% 22% 22%
Asseco Poland S.A. $18.23 $1,513 $621 $785 $2,292 0.8x 0.7x 0.7x 5.4x 5.0x 4.8x 13% 13% 7% 22% 22% 22% 15% 14% 14%
Ebix $37.97 $1,176 $113 $730 $1,841 3.2x 3.3x 2.7x 10.6x NA NA 17% (3%) 24% 64% 50% 60% 30% 0% 0%
IRESS Limited $8.19 $1,561 $69 $146 $1,639 4.6x 3.9x 3.5x 17.4x 16.7x 15.4x 9% 19% 11% 27% 21% 29% 26% 23% 23%
Zuora $13.93 $1,660 $179 $72 $1,554 5.6x 5.1x 4.7x NM NM NM 17% 9% 10% 57% 62% 56% (10%) 0% 3%
Model N $35.68 $1,250 $200 $118 $1,168 8.1x 7.2x 6.6x NM NM NM (4%) 13% 8% 57% 57% 57% 10% 13% 12%
Basware Oyj $51.38 $741 $45 $97 $792 4.8x 4.3x 3.9x NM 32.5x 27.1x 3% 12% 9% 51% 56% 52% 3% 13% 14%
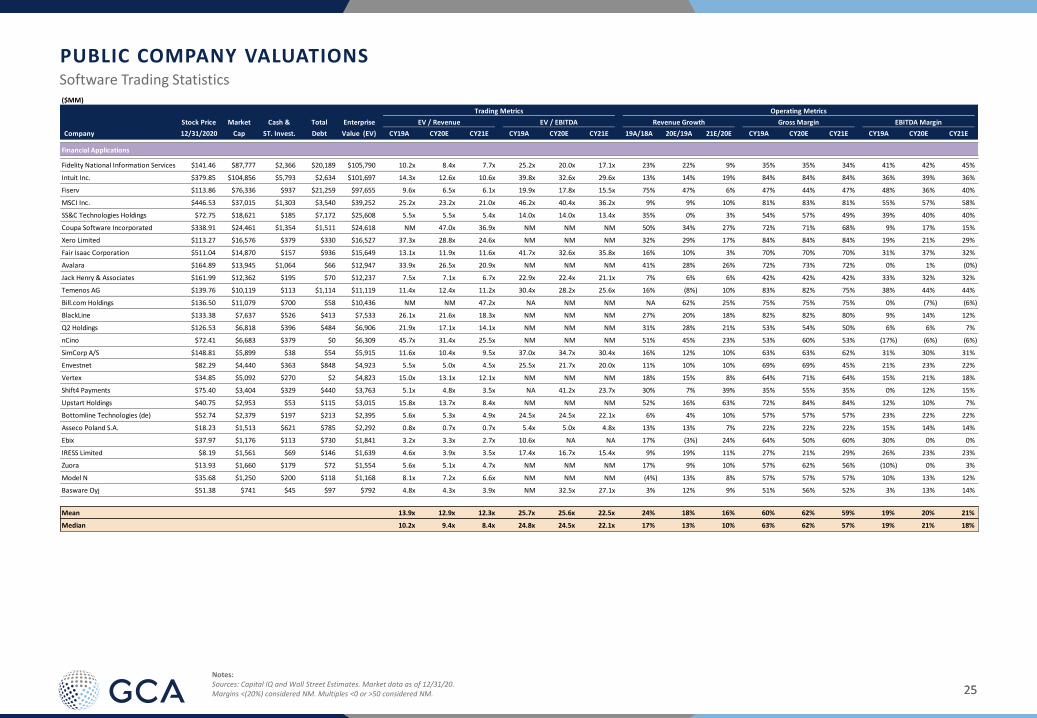
Mean 13.9x 12.9x 12.3x 25.7x 25.6x 22.5x 24% 18% 16% 60% 62% 59% 19% 20% 21%
Median 10.2x 9.4x 8.4x 24.8x 24.5x 22.1x 17% 13% 10% 63% 62% 57% 19% 21% 18%
Software Trading Statistics
PUBLIC COMPANY VALUATIONS
Notes:Sources: Capital IQ and Wall Street Estimates. Market data as of 12/31/20.Margins <(20%) considered NM. Multiples <0 or >50 considered NM.

2626
($MM)
Trading Metrics Operating Metrics CIQ
Stock Price Market Cash & Total Enterprise EV / Revenue EV / EBITDA Revenue Growth Gross Margin EBITDA Margin Revenue
Company 12/31/2020 Cap ST. Invest. Debt Value (EV) CY19A CY20E CY21E CY19A CY20E CY21E 19A/18A 20E/19A 21E/20E CY19A CY20E CY21E CY19A CY20E CY21E
Vertical Applications
Danaher Corporation $222.14 $157,803 $5,688 $22,761 $174,888 9.8x 8.0x 6.9x 39.2x 28.5x 23.2x 5% 23% 15% 56% 56% 56% 25% 28% 30%
Roper Technologies $431.09 $45,209 $302 $9,704 $54,611 10.2x 9.8x 8.7x 28.4x 27.7x 24.2x 3% 4% 13% 64% 64% 63% 36% 35% 36%
Veeva Systems Inc. $272.25 $41,237 $1,590 $59 $39,705 36.0x 27.4x 23.1x NM NM NM 28% 31% 19% 75% 74% 72% 40% 41% 39%
Amadeus IT Group $72.86 $32,804 $3,467 $6,933 $36,270 5.8x 13.1x 8.2x 14.4x NM 26.3x 11% (56%) 60% 69% 78% 55% 40% 12% 31%
Cerner Corporation $78.48 $24,061 $892 $1,502 $24,671 4.3x 4.5x 4.3x 14.9x 14.2x 13.2x 6% (3%) 4% 82% 83% 83% 29% 32% 33%
Tyler Technologies $436.52 $17,604 $574 $19 $17,048 15.7x 15.1x 14.1x NM NM 47.7x 16% 4% 7% 52% 52% 49% 28% 29% 30%
Guidewire Software $128.73 $10,782 $1,162 $471 $10,091 14.4x 13.4x 13.3x NM NM NM (4%) 7% 1% 56% 56% 56% 20% 13% 3%
RealPage $87.24 $8,619 $612 $1,332 $9,339 9.5x 8.1x 7.3x 33.2x 29.3x 25.7x 14% 17% 11% 63% 63% 62% 29% 28% 28%
CoreLogic $77.32 $6,014 $302 $1,693 $7,405 4.2x 4.3x 4.5x 14.9x 11.8x 12.0x (1%) (3%) (4%) 50% 59% 52% 28% 37% 38%
Sabre Corporation $12.02 $3,814 $1,668 $4,791 $6,945 1.7x 5.2x 2.9x 7.3x NM 25.7x 3% (66%) 80% 35% 63% 39% 24% NM 11%
Lemonade $122.50 $6,932 $590 $0 $6,342 NM NM NM NM NM NM 199% 30% 18% 32% 23% 35% NM NM NM
AppFolio $180.04 $6,180 $177 $35 $6,039 23.6x 19.4x 17.2x NM NM NM 35% 22% 13% 60% 62% 62% 14% 17% 18%
Duck Creek Technologies $43.30 $5,669 $361 $24 $5,332 29.6x 24.1x 20.5x NA NM NM NA 23% 18% 55% 55% 55% NA 4% 1%
Root $15.71 $3,940 $220 $220 $3,940 13.6x 11.4x 15.7x NM NM NM NA 19% (27%) (11%) 4% 4% NM NM NM
Blackbaud $57.56 $2,779 $31 $555 $3,303 3.7x 3.7x 3.7x 17.6x 14.4x 14.9x 6% (0%) (1%) 60% 59% 56% 21% 26% 25%
Allscripts Healthcare Solutions $14.44 $2,281 $219 $1,196 $3,258 1.8x 2.0x 2.1x 11.0x 11.1x 12.9x 1% (9%) (3%) 43% 41% 45% 17% 18% 16%
2U $40.01 $2,883 $481 $353 $2,755 4.8x 3.6x 3.0x NM NM NM 40% 34% 19% 72% 70% 74% (4%) 1% 4%
PROS Holdings $50.77 $2,205 $322 $255 $2,138 8.5x 8.5x 8.4x NM NM NM 27% 0% 2% 63% 61% 61% (5%) (12%) (7%)
HealthStream $21.84 $692 $150 $29 $571 2.2x 2.4x 2.5x 12.2x 12.8x 14.5x 10% (5%) (5%) 59% 63% 61% 18% 18% 17%
Castlight Health $1.30 $200 $47 $17 $170 1.2x 1.2x 1.3x NM 20.8x NM (8%) (1%) (7%) 61% 66% 63% (11%) 6% 1%
Boxlight Corporation $1.53 $78 $10 $22 $91 2.4x 1.8x 0.7x NM NM 10.6x 1% 31% 166% 30% 22% 25% (8%) (3%) 6%
Mean 10.1x 9.4x 8.4x 19.3x 19.0x 20.9x 21% 5% 19% 54% 56% 54% 19% 18% 19%
Median 7.2x 8.0x 7.1x 14.9x 14.4x 19.1x 6% 4% 11% 59% 61% 56% 22% 18% 18%
Software Trading Statistics
PUBLIC COMPANY VALUATIONS
Notes:Sources: Capital IQ and Wall Street Estimates. Market data as of 12/31/20.Margins <(20%) considered NM. Multiples <0 or >50 considered NM.

2727
($MM)
Trading Metrics Operating Metrics CIQ
Stock Price Market Cash & Total Enterprise EV / Revenue EV / EBITDA Revenue Growth Gross Margin EBITDA Margin Revenue
Company 12/31/2020 Cap ST. Invest. Debt Value (EV) CY19A CY20E CY21E CY19A CY20E CY21E 19A/18A 20E/19A 21E/20E CY19A CY20E CY21E CY19A CY20E CY21E
ERP & General Business
salesforce.com $222.53 $203,714 $9,492 $6,223 $200,445 11.7x 9.5x 7.9x 40.0x 31.6x 28.3x 29% 23% 20% 78% 78% 76% 29% 30% 28%
Shopify Inc. $1,131.95 $138,863 $6,121 $903 $133,645 NM 46.8x 35.3x NM NM NM 47% 81% 33% 55% 53% 55% 5% 15% 13%
Workday $239.61 $57,703 $2,948 $2,230 $56,985 15.7x 13.2x 11.3x NM NM 45.9x 29% 19% 17% 75% 77% 73% 21% 26% 25%
Constellation Software Inc. $1,297.22 $27,490 $574 $645 $27,561 7.9x 7.0x 6.0x 29.5x 22.9x 20.8x 14% 12% 18% 37% 37% 37% 27% 31% 29%
Paycom Software $452.25 $26,064 $156 $53 $25,960 35.2x 31.1x 25.8x NM NM NM 30% 13% 20% 85% 86% 86% 43% 39% 39%
Slack Technologies $42.24 $24,339 $1,575 $905 $23,690 37.6x 26.7x 20.7x NM NM NM 57% 41% 29% 87% 88% 87% (17%) (4%) (1%)
Zendesk $143.12 $16,699 $943 $1,158 $16,914 20.7x 16.5x 13.3x NM NM NM 36% 25% 24% 75% 78% 74% 8% 11% 11%
Ceridian HCM Holding Inc. $106.56 $15,750 $555 $1,009 $16,205 19.7x 19.4x 16.9x NM NM NM 11% 2% 15% 46% 43% 46% 22% 19% 20%
C3.ai $138.75 $13,299 $290 $0 $13,008 NM NM NM NM NM NM NA 71% 13% 67% 75% 75% NM NM NM
Paylocity Holding Corporation $205.91 $11,170 $240 $179 $11,109 22.3x 19.1x 16.0x NM NM NM 23% 17% 19% 64% 64% 64% 29% 27% 25%
Anaplan $71.85 $10,195 $297 $55 $9,953 28.6x 22.4x 18.1x NM NM NM 45% 28% 24% 76% 77% 74% (11%) (4%) (2%)
The Sage Group plc $7.95 $8,708 $1,075 $1,280 $8,914 3.5x 3.4x 3.4x 14.0x 13.6x 15.4x 8% 0% (0%) 93% 93% 93% 25% 25% 22%
Smartsheet Inc. $69.29 $8,471 $420 $69 $8,120 30.0x 21.5x 16.6x NM NM NM 52% 40% 29% 82% 80% 80% (19%) (10%) (8%)
Manhattan Associates $105.18 $6,682 $166 $34 $6,550 10.6x 11.3x 10.8x 42.1x 45.0x 49.6x 11% (7%) 5% 55% 55% 56% 25% 25% 22%
J2 Global $97.69 $4,454 $568 $1,586 $5,472 4.0x 3.8x 3.4x 9.9x 9.1x 8.3x 14% 6% 12% 83% 84% 84% 40% 41% 40%
The Descartes Systems Group Inc $58.43 $4,936 $114 $13 $4,835 14.8x 14.0x 12.5x 39.4x 34.6x 30.7x 18% 6% 13% 74% 74% 73% 38% 40% 41%
Datto Holding Corp. $27.00 $4,336 $99 $581 $4,819 10.5x 9.4x 8.4x NM 32.4x 33.9x 18% 12% 12% 71% 73% 71% 16% 29% 25%
BigCommerce Holdings $64.15 $4,436 $179 $38 $4,296 38.3x 29.1x 24.5x NM NM NM 22% 32% 19% 77% 78% 77% NM (18%) (14%)
Workiva Inc. $91.62 $4,416 $524 $326 $4,218 14.2x 12.1x 10.5x NM NM NM 22% 17% 16% 72% 75% 73% (2%) 2% (0%)
Cornerstone OnDemand $44.04 $2,845 $171 $1,321 $3,995 6.9x 5.5x 4.8x 30.6x 15.6x 14.4x 7% 27% 14% 76% 74% 73% 23% 35% 33%
SPS Commerce $108.59 $3,834 $261 $21 $3,594 12.9x 11.6x 10.1x NM 42.1x 37.0x 12% 11% 15% 68% 69% 68% 25% 28% 27%
Energy Harbor Corp. $25.50 $0 $1 $2,928 $2,927 NA NA NA NA NA NA NA NA NA NM NM NM NA NA NA
Pluralsight $20.96 $2,549 $405 $575 $2,757 8.7x 7.1x 6.2x NM NM NM 37% 23% 15% 78% 81% 76% (13%) (2%) 1%
Technology One Limited $6.33 $2,032 $90 $21 $1,963 9.6x 8.5x 7.8x 34.1x 26.6x 20.4x 14% 12% 9% 40% 40% 40% 28% 32% 38%
Upland Software $45.89 $1,352 $233 $569 $1,688 7.6x 5.9x 5.9x 20.5x 17.4x 18.5x 49% 28% 1% 71% 67% 68% 37% 34% 32%
QAD Inc. $63.18 $1,308 $143 $33 $1,197 3.9x 3.9x 3.7x NM 44.3x 37.7x (7%) (2%) 7% 55% 58% 55% 4% 9% 10%
Opera Limited $9.13 $1,051 $120 $9 $940 2.8x 2.8x 4.6x 20.6x 48.7x 17.5x 94% (1%) (39%) 81% 87% 71% 14% 6% 27%
Benefitfocus $14.48 $466 $176 $269 $560 1.9x 2.1x 2.0x 29.4x 14.6x 13.1x 14% (10%) 7% 54% 53% 51% 6% 14% 15%
American Software $17.17 $560 $94 $2 $467 4.2x 4.2x 4.0x 29.6x 34.7x 31.8x 1% (0%) 5% 54% 54% 54% 14% 12% 13%
Synchronoss Technologies $4.70 $198 $46 $68 $232 0.8x 0.8x 0.8x 8.4x 9.5x 7.9x (5%) (6%) (3%) 52% 58% 55% 9% 8% 10%
ServiceSource International $1.76 $170 $39 $55 $186 0.9x NA NA 43.7x NA NA (9%) NA NA 30% NM NM 2% NA NA
Park City Group $4.79 $94 $21 $7 $80 4.1x 3.8x 3.5x 20.8x 21.9x 15.8x (16%) 8% 7% 69% 69% 69% 20% 17% 22%
Mean 13.4x 12.8x 10.9x 27.5x 27.3x 24.8x 23% 18% 13% 67% 69% 68% 15% 18% 19%
Median 10.5x 9.5x 8.4x 29.5x 26.6x 20.6x 18% 13% 14% 71% 74% 72% 20% 19% 22%
Software Trading Statistics
PUBLIC COMPANY VALUATIONS
Notes:Sources: Capital IQ and Wall Street Estimates. Market data as of 12/31/20.Margins <(20%) considered NM. Multiples <0 or >50 considered NM.
2828
($MM)
Trading Metrics Operating Metrics CIQ
Stock Price Market Cash & Total Enterprise EV / Revenue EV / EBITDA Revenue Growth Gross Margin EBITDA Margin Revenue
Company 12/31/2020 Cap ST. Invest. Debt Value (EV) CY19A CY20E CY21E CY19A CY20E CY21E 19A/18A 20E/19A 21E/20E CY19A CY20E CY21E CY19A CY20E CY21E
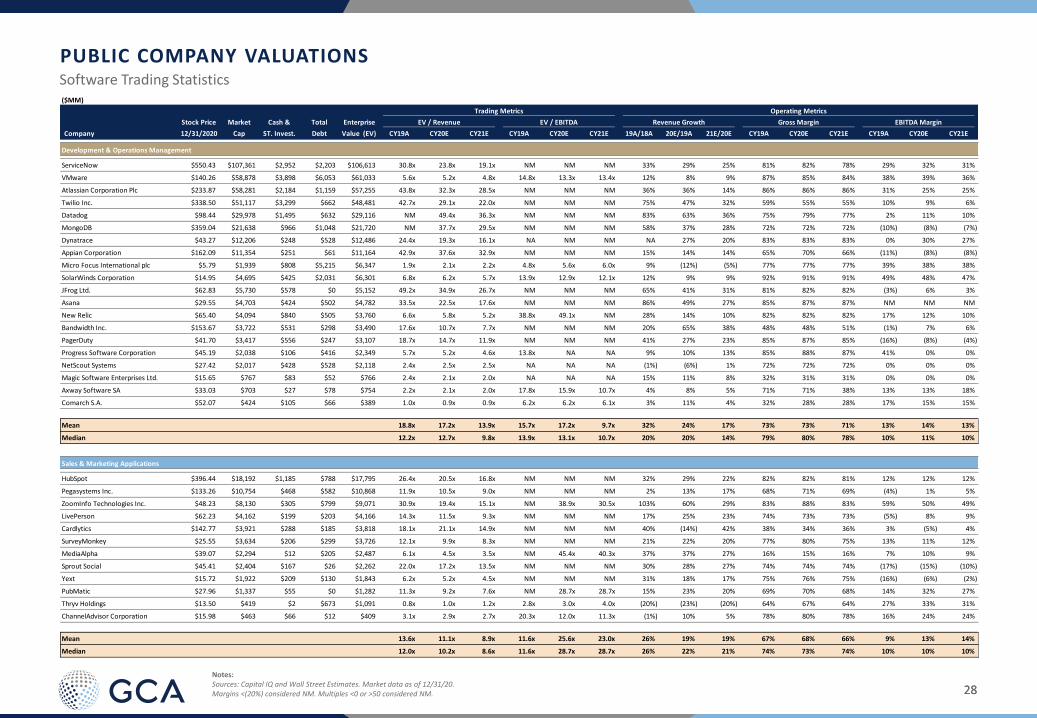
Development & Operations Management
ServiceNow $550.43 $107,361 $2,952 $2,203 $106,613 30.8x 23.8x 19.1x NM NM NM 33% 29% 25% 81% 82% 78% 29% 32% 31%
VMware $140.26 $58,878 $3,898 $6,053 $61,033 5.6x 5.2x 4.8x 14.8x 13.3x 13.4x 12% 8% 9% 87% 85% 84% 38% 39% 36%
Atlassian Corporation Plc $233.87 $58,281 $2,184 $1,159 $57,255 43.8x 32.3x 28.5x NM NM NM 36% 36% 14% 86% 86% 86% 31% 25% 25%
Twilio Inc. $338.50 $51,117 $3,299 $662 $48,481 42.7x 29.1x 22.0x NM NM NM 75% 47% 32% 59% 55% 55% 10% 9% 6%
Datadog $98.44 $29,978 $1,495 $632 $29,116 NM 49.4x 36.3x NM NM NM 83% 63% 36% 75% 79% 77% 2% 11% 10%
MongoDB $359.04 $21,638 $966 $1,048 $21,720 NM 37.7x 29.5x NM NM NM 58% 37% 28% 72% 72% 72% (10%) (8%) (7%)
Dynatrace $43.27 $12,206 $248 $528 $12,486 24.4x 19.3x 16.1x NA NM NM NA 27% 20% 83% 83% 83% 0% 30% 27%
Appian Corporation $162.09 $11,354 $251 $61 $11,164 42.9x 37.6x 32.9x NM NM NM 15% 14% 14% 65% 70% 66% (11%) (8%) (8%)
Micro Focus International plc $5.79 $1,939 $808 $5,215 $6,347 1.9x 2.1x 2.2x 4.8x 5.6x 6.0x 9% (12%) (5%) 77% 77% 77% 39% 38% 38%
SolarWinds Corporation $14.95 $4,695 $425 $2,031 $6,301 6.8x 6.2x 5.7x 13.9x 12.9x 12.1x 12% 9% 9% 92% 91% 91% 49% 48% 47%
JFrog Ltd. $62.83 $5,730 $578 $0 $5,152 49.2x 34.9x 26.7x NM NM NM 65% 41% 31% 81% 82% 82% (3%) 6% 3%
Asana $29.55 $4,703 $424 $502 $4,782 33.5x 22.5x 17.6x NM NM NM 86% 49% 27% 85% 87% 87% NM NM NM
New Relic $65.40 $4,094 $840 $505 $3,760 6.6x 5.8x 5.2x 38.8x 49.1x NM 28% 14% 10% 82% 82% 82% 17% 12% 10%
Bandwidth Inc. $153.67 $3,722 $531 $298 $3,490 17.6x 10.7x 7.7x NM NM NM 20% 65% 38% 48% 48% 51% (1%) 7% 6%
PagerDuty $41.70 $3,417 $556 $247 $3,107 18.7x 14.7x 11.9x NM NM NM 41% 27% 23% 85% 87% 85% (16%) (8%) (4%)
Progress Software Corporation $45.19 $2,038 $106 $416 $2,349 5.7x 5.2x 4.6x 13.8x NA NA 9% 10% 13% 85% 88% 87% 41% 0% 0%
NetScout Systems $27.42 $2,017 $428 $528 $2,118 2.4x 2.5x 2.5x NA NA NA (1%) (6%) 1% 72% 72% 72% 0% 0% 0%
Magic Software Enterprises Ltd. $15.65 $767 $83 $52 $766 2.4x 2.1x 2.0x NA NA NA 15% 11% 8% 32% 31% 31% 0% 0% 0%
Axway Software SA $33.03 $703 $27 $78 $754 2.2x 2.1x 2.0x 17.8x 15.9x 10.7x 4% 8% 5% 71% 71% 38% 13% 13% 18%
Comarch S.A. $52.07 $424 $105 $66 $389 1.0x 0.9x 0.9x 6.2x 6.2x 6.1x 3% 11% 4% 32% 28% 28% 17% 15% 15%
Mean 18.8x 17.2x 13.9x 15.7x 17.2x 9.7x 32% 24% 17% 73% 73% 71% 13% 14% 13%
Median 12.2x 12.7x 9.8x 13.9x 13.1x 10.7x 20% 20% 14% 79% 80% 78% 10% 11% 10%
Sales & Marketing Applications
HubSpot $396.44 $18,192 $1,185 $788 $17,795 26.4x 20.5x 16.8x NM NM NM 32% 29% 22% 82% 82% 81% 12% 12% 12%
Pegasystems Inc. $133.26 $10,754 $468 $582 $10,868 11.9x 10.5x 9.0x NM NM NM 2% 13% 17% 68% 71% 69% (4%) 1% 5%
ZoomInfo Technologies Inc. $48.23 $8,130 $305 $799 $9,071 30.9x 19.4x 15.1x NM 38.9x 30.5x 103% 60% 29% 83% 88% 83% 59% 50% 49%
LivePerson $62.23 $4,162 $199 $203 $4,166 14.3x 11.5x 9.3x NM NM NM 17% 25% 23% 74% 73% 73% (5%) 8% 9%
Cardlytics $142.77 $3,921 $288 $185 $3,818 18.1x 21.1x 14.9x NM NM NM 40% (14%) 42% 38% 34% 36% 3% (5%) 4%
SurveyMonkey $25.55 $3,634 $206 $299 $3,726 12.1x 9.9x 8.3x NM NM NM 21% 22% 20% 77% 80% 75% 13% 11% 12%
MediaAlpha $39.07 $2,294 $12 $205 $2,487 6.1x 4.5x 3.5x NM 45.4x 40.3x 37% 37% 27% 16% 15% 16% 7% 10% 9%
Sprout Social $45.41 $2,404 $167 $26 $2,262 22.0x 17.2x 13.5x NM NM NM 30% 28% 27% 74% 74% 74% (17%) (15%) (10%)
Yext $15.72 $1,922 $209 $130 $1,843 6.2x 5.2x 4.5x NM NM NM 31% 18% 17% 75% 76% 75% (16%) (6%) (2%)
PubMatic $27.96 $1,337 $55 $0 $1,282 11.3x 9.2x 7.6x NM 28.7x 28.7x 15% 23% 20% 69% 70% 68% 14% 32% 27%
Thryv Holdings $13.50 $419 $2 $673 $1,091 0.8x 1.0x 1.2x 2.8x 3.0x 4.0x (20%) (23%) (20%) 64% 67% 64% 27% 33% 31%
ChannelAdvisor Corporation $15.98 $463 $66 $12 $409 3.1x 2.9x 2.7x 20.3x 12.0x 11.3x (1%) 10% 5% 78% 80% 78% 16% 24% 24%
Mean 13.6x 11.1x 8.9x 11.6x 25.6x 23.0x 26% 19% 19% 67% 68% 66% 9% 13% 14%
Median 12.0x 10.2x 8.6x 11.6x 28.7x 28.7x 26% 22% 21% 74% 73% 74% 10% 10% 10%
Software Trading Statistics
PUBLIC COMPANY VALUATIONS
Notes:Sources: Capital IQ and Wall Street Estimates. Market data as of 12/31/20.Margins <(20%) considered NM. Multiples <0 or >50 considered NM.
2929
($MM)
Trading Metrics Operating Metrics CIQ
Stock Price Market Cash & Total Enterprise EV / Revenue EV / EBITDA Revenue Growth Gross Margin EBITDA Margin Revenue
Company 12/31/2020 Cap ST. Invest. Debt Value (EV) CY19A CY20E CY21E CY19A CY20E CY21E 19A/18A 20E/19A 21E/20E CY19A CY20E CY21E CY19A CY20E CY21E
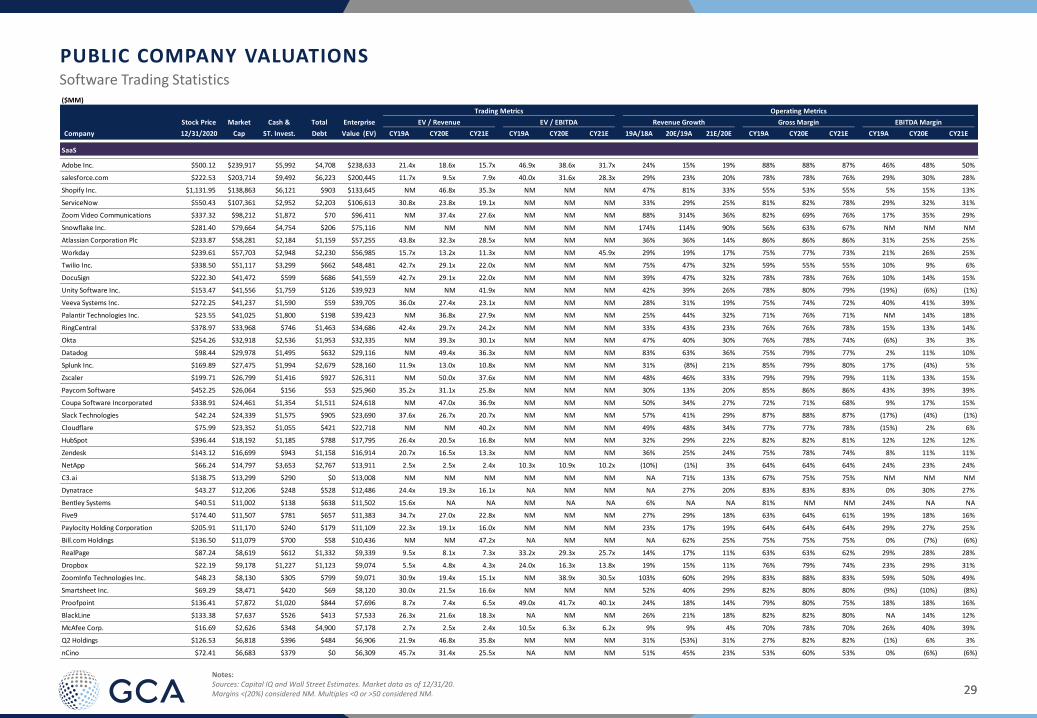
SaaS
Adobe Inc. $500.12 $239,917 $5,992 $4,708 $238,633 21.4x 18.6x 15.7x 46.9x 38.6x 31.7x 24% 15% 19% 88% 88% 87% 46% 48% 50%
salesforce.com $222.53 $203,714 $9,492 $6,223 $200,445 11.7x 9.5x 7.9x 40.0x 31.6x 28.3x 29% 23% 20% 78% 78% 76% 29% 30% 28%
Shopify Inc. $1,131.95 $138,863 $6,121 $903 $133,645 NM 46.8x 35.3x NM NM NM 47% 81% 33% 55% 53% 55% 5% 15% 13%
ServiceNow $550.43 $107,361 $2,952 $2,203 $106,613 30.8x 23.8x 19.1x NM NM NM 33% 29% 25% 81% 82% 78% 29% 32% 31%
Zoom Video Communications $337.32 $98,212 $1,872 $70 $96,411 NM 37.4x 27.6x NM NM NM 88% 314% 36% 82% 69% 76% 17% 35% 29%
Snowflake Inc. $281.40 $79,664 $4,754 $206 $75,116 NM NM NM NM NM NM 174% 114% 90% 56% 63% 67% NM NM NM
Atlassian Corporation Plc $233.87 $58,281 $2,184 $1,159 $57,255 43.8x 32.3x 28.5x NM NM NM 36% 36% 14% 86% 86% 86% 31% 25% 25%
Workday $239.61 $57,703 $2,948 $2,230 $56,985 15.7x 13.2x 11.3x NM NM 45.9x 29% 19% 17% 75% 77% 73% 21% 26% 25%
Twilio Inc. $338.50 $51,117 $3,299 $662 $48,481 42.7x 29.1x 22.0x NM NM NM 75% 47% 32% 59% 55% 55% 10% 9% 6%
DocuSign $222.30 $41,472 $599 $686 $41,559 42.7x 29.1x 22.0x NM NM NM 39% 47% 32% 78% 78% 76% 10% 14% 15%
Unity Software Inc. $153.47 $41,556 $1,759 $126 $39,923 NM NM 41.9x NM NM NM 42% 39% 26% 78% 80% 79% (19%) (6%) (1%)
Veeva Systems Inc. $272.25 $41,237 $1,590 $59 $39,705 36.0x 27.4x 23.1x NM NM NM 28% 31% 19% 75% 74% 72% 40% 41% 39%
Palantir Technologies Inc. $23.55 $41,025 $1,800 $198 $39,423 NM 36.8x 27.9x NM NM NM 25% 44% 32% 71% 76% 71% NM 14% 18%
RingCentral $378.97 $33,968 $746 $1,463 $34,686 42.4x 29.7x 24.2x NM NM NM 33% 43% 23% 76% 76% 78% 15% 13% 14%
Okta $254.26 $32,918 $2,536 $1,953 $32,335 NM 39.3x 30.1x NM NM NM 47% 40% 30% 76% 78% 74% (6%) 3% 3%
Datadog $98.44 $29,978 $1,495 $632 $29,116 NM 49.4x 36.3x NM NM NM 83% 63% 36% 75% 79% 77% 2% 11% 10%
Splunk Inc. $169.89 $27,475 $1,994 $2,679 $28,160 11.9x 13.0x 10.8x NM NM NM 31% (8%) 21% 85% 79% 80% 17% (4%) 5%
Zscaler $199.71 $26,799 $1,416 $927 $26,311 NM 50.0x 37.6x NM NM NM 48% 46% 33% 79% 79% 79% 11% 13% 15%
Paycom Software $452.25 $26,064 $156 $53 $25,960 35.2x 31.1x 25.8x NM NM NM 30% 13% 20% 85% 86% 86% 43% 39% 39%
Coupa Software Incorporated $338.91 $24,461 $1,354 $1,511 $24,618 NM 47.0x 36.9x NM NM NM 50% 34% 27% 72% 71% 68% 9% 17% 15%
Slack Technologies $42.24 $24,339 $1,575 $905 $23,690 37.6x 26.7x 20.7x NM NM NM 57% 41% 29% 87% 88% 87% (17%) (4%) (1%)
Cloudflare $75.99 $23,352 $1,055 $421 $22,718 NM NM 40.2x NM NM NM 49% 48% 34% 77% 77% 78% (15%) 2% 6%
HubSpot $396.44 $18,192 $1,185 $788 $17,795 26.4x 20.5x 16.8x NM NM NM 32% 29% 22% 82% 82% 81% 12% 12% 12%
Zendesk $143.12 $16,699 $943 $1,158 $16,914 20.7x 16.5x 13.3x NM NM NM 36% 25% 24% 75% 78% 74% 8% 11% 11%
NetApp $66.24 $14,797 $3,653 $2,767 $13,911 2.5x 2.5x 2.4x 10.3x 10.9x 10.2x (10%) (1%) 3% 64% 64% 64% 24% 23% 24%
C3.ai $138.75 $13,299 $290 $0 $13,008 NM NM NM NM NM NM NA 71% 13% 67% 75% 75% NM NM NM
Dynatrace $43.27 $12,206 $248 $528 $12,486 24.4x 19.3x 16.1x NA NM NM NA 27% 20% 83% 83% 83% 0% 30% 27%
Bentley Systems $40.51 $11,002 $138 $638 $11,502 15.6x NA NA NM NA NA 6% NA NA 81% NM NM 24% NA NA
Five9 $174.40 $11,507 $781 $657 $11,383 34.7x 27.0x 22.8x NM NM NM 27% 29% 18% 63% 64% 61% 19% 18% 16%
Paylocity Holding Corporation $205.91 $11,170 $240 $179 $11,109 22.3x 19.1x 16.0x NM NM NM 23% 17% 19% 64% 64% 64% 29% 27% 25%
Bill.com Holdings $136.50 $11,079 $700 $58 $10,436 NM NM 47.2x NA NM NM NA 62% 25% 75% 75% 75% 0% (7%) (6%)
RealPage $87.24 $8,619 $612 $1,332 $9,339 9.5x 8.1x 7.3x 33.2x 29.3x 25.7x 14% 17% 11% 63% 63% 62% 29% 28% 28%
Dropbox $22.19 $9,178 $1,227 $1,123 $9,074 5.5x 4.8x 4.3x 24.0x 16.3x 13.8x 19% 15% 11% 76% 79% 74% 23% 29% 31%
ZoomInfo Technologies Inc. $48.23 $8,130 $305 $799 $9,071 30.9x 19.4x 15.1x NM 38.9x 30.5x 103% 60% 29% 83% 88% 83% 59% 50% 49%
Smartsheet Inc. $69.29 $8,471 $420 $69 $8,120 30.0x 21.5x 16.6x NM NM NM 52% 40% 29% 82% 80% 80% (9%) (10%) (8%)
Proofpoint $136.41 $7,872 $1,020 $844 $7,696 8.7x 7.4x 6.5x 49.0x 41.7x 40.1x 24% 18% 14% 79% 80% 75% 18% 18% 16%
BlackLine $133.38 $7,637 $526 $413 $7,533 26.3x 21.6x 18.3x NA NM NM 26% 21% 18% 82% 82% 80% NA 14% 12%
McAfee Corp. $16.69 $2,626 $348 $4,900 $7,178 2.7x 2.5x 2.4x 10.5x 6.3x 6.2x 9% 9% 4% 70% 78% 70% 26% 40% 39%
Q2 Holdings $126.53 $6,818 $396 $484 $6,906 21.9x 46.8x 35.8x NM NM NM 31% (53%) 31% 27% 82% 82% (1%) 6% 3%
nCino $72.41 $6,683 $379 $0 $6,309 45.7x 31.4x 25.5x NA NM NM 51% 45% 23% 53% 60% 53% 0% (6%) (6%)
Software Trading Statistics
PUBLIC COMPANY VALUATIONS
Notes:Sources: Capital IQ and Wall Street Estimates. Market data as of 12/31/20.Margins <(20%) considered NM. Multiples <0 or >50 considered NM.
3030
($MM)
Trading Metrics Operating Metrics CIQ
Stock Price Market Cash & Total Enterprise EV / Revenue EV / EBITDA Revenue Growth Gross Margin EBITDA Margin Revenue
Company 12/31/2020 Cap ST. Invest. Debt Value (EV) CY19A CY20E CY21E CY19A CY20E CY21E 19A/18A 20E/19A 21E/20E CY19A CY20E CY21E CY19A CY20E CY21E
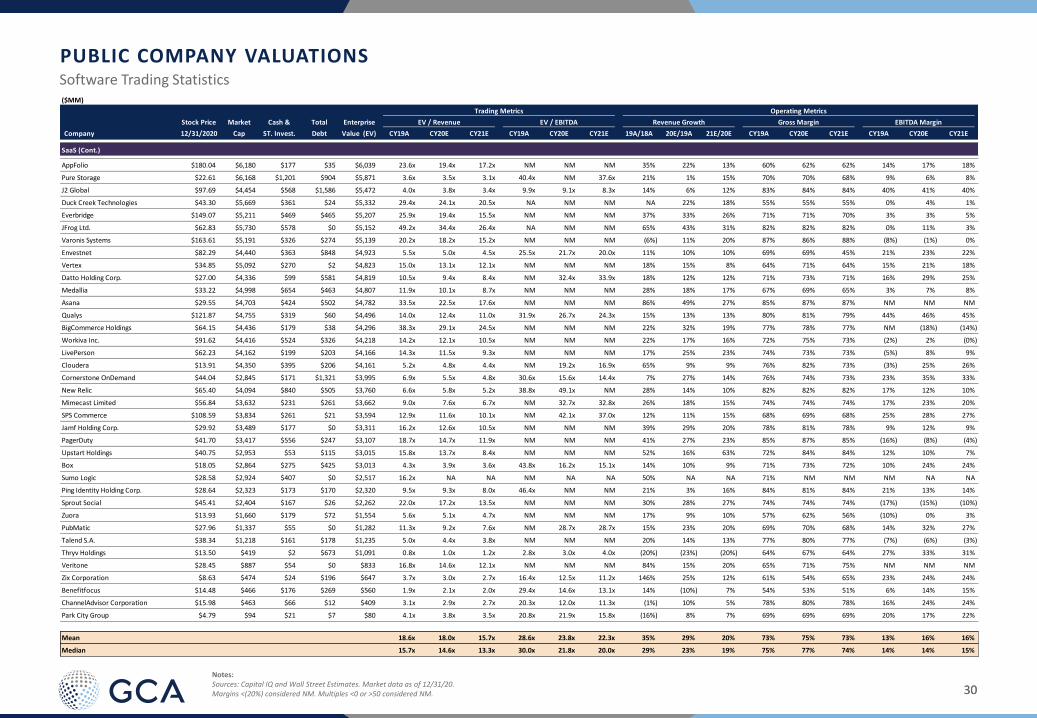
SaaS (Cont.)
AppFolio $180.04 $6,180 $177 $35 $6,039 23.6x 19.4x 17.2x NM NM NM 35% 22% 13% 60% 62% 62% 14% 17% 18%
Pure Storage $22.61 $6,168 $1,201 $904 $5,871 3.6x 3.5x 3.1x 40.4x NM 37.6x 21% 1% 15% 70% 70% 68% 9% 6% 8%
J2 Global $97.69 $4,454 $568 $1,586 $5,472 4.0x 3.8x 3.4x 9.9x 9.1x 8.3x 14% 6% 12% 83% 84% 84% 40% 41% 40%
Duck Creek Technologies $43.30 $5,669 $361 $24 $5,332 29.4x 24.1x 20.5x NA NM NM NA 22% 18% 55% 55% 55% 0% 4% 1%
Everbridge $149.07 $5,211 $469 $465 $5,207 25.9x 19.4x 15.5x NM NM NM 37% 33% 26% 71% 71% 70% 3% 3% 5%
JFrog Ltd. $62.83 $5,730 $578 $0 $5,152 49.2x 34.4x 26.4x NA NM NM 65% 43% 31% 82% 82% 82% 0% 11% 3%
Varonis Systems $163.61 $5,191 $326 $274 $5,139 20.2x 18.2x 15.2x NM NM NM (6%) 11% 20% 87% 86% 88% (8%) (1%) 0%
Envestnet $82.29 $4,440 $363 $848 $4,923 5.5x 5.0x 4.5x 25.5x 21.7x 20.0x 11% 10% 10% 69% 69% 45% 21% 23% 22%
Vertex $34.85 $5,092 $270 $2 $4,823 15.0x 13.1x 12.1x NM NM NM 18% 15% 8% 64% 71% 64% 15% 21% 18%
Datto Holding Corp. $27.00 $4,336 $99 $581 $4,819 10.5x 9.4x 8.4x NM 32.4x 33.9x 18% 12% 12% 71% 73% 71% 16% 29% 25%
Medallia $33.22 $4,998 $654 $463 $4,807 11.9x 10.1x 8.7x NM NM NM 28% 18% 17% 67% 69% 65% 3% 7% 8%
Asana $29.55 $4,703 $424 $502 $4,782 33.5x 22.5x 17.6x NM NM NM 86% 49% 27% 85% 87% 87% NM NM NM
Qualys $121.87 $4,755 $319 $60 $4,496 14.0x 12.4x 11.0x 31.9x 26.7x 24.3x 15% 13% 13% 80% 81% 79% 44% 46% 45%
BigCommerce Holdings $64.15 $4,436 $179 $38 $4,296 38.3x 29.1x 24.5x NM NM NM 22% 32% 19% 77% 78% 77% NM (18%) (14%)
Workiva Inc. $91.62 $4,416 $524 $326 $4,218 14.2x 12.1x 10.5x NM NM NM 22% 17% 16% 72% 75% 73% (2%) 2% (0%)
LivePerson $62.23 $4,162 $199 $203 $4,166 14.3x 11.5x 9.3x NM NM NM 17% 25% 23% 74% 73% 73% (5%) 8% 9%
Cloudera $13.91 $4,350 $395 $206 $4,161 5.2x 4.8x 4.4x NM 19.2x 16.9x 65% 9% 9% 76% 82% 73% (3%) 25% 26%
Cornerstone OnDemand $44.04 $2,845 $171 $1,321 $3,995 6.9x 5.5x 4.8x 30.6x 15.6x 14.4x 7% 27% 14% 76% 74% 73% 23% 35% 33%
New Relic $65.40 $4,094 $840 $505 $3,760 6.6x 5.8x 5.2x 38.8x 49.1x NM 28% 14% 10% 82% 82% 82% 17% 12% 10%
Mimecast Limited $56.84 $3,632 $231 $261 $3,662 9.0x 7.6x 6.7x NM 32.7x 32.8x 26% 18% 15% 74% 74% 74% 17% 23% 20%
SPS Commerce $108.59 $3,834 $261 $21 $3,594 12.9x 11.6x 10.1x NM 42.1x 37.0x 12% 11% 15% 68% 69% 68% 25% 28% 27%
Jamf Holding Corp. $29.92 $3,489 $177 $0 $3,311 16.2x 12.6x 10.5x NM NM NM 39% 29% 20% 78% 81% 78% 9% 12% 9%
PagerDuty $41.70 $3,417 $556 $247 $3,107 18.7x 14.7x 11.9x NM NM NM 41% 27% 23% 85% 87% 85% (16%) (8%) (4%)
Upstart Holdings $40.75 $2,953 $53 $115 $3,015 15.8x 13.7x 8.4x NM NM NM 52% 16% 63% 72% 84% 84% 12% 10% 7%
Box $18.05 $2,864 $275 $425 $3,013 4.3x 3.9x 3.6x 43.8x 16.2x 15.1x 14% 10% 9% 71% 73% 72% 10% 24% 24%
Sumo Logic $28.58 $2,924 $407 $0 $2,517 16.2x NA NA NM NA NA 50% NA NA 71% NM NM NM NA NA
Ping Identity Holding Corp. $28.64 $2,323 $173 $170 $2,320 9.5x 9.3x 8.0x 46.4x NM NM 21% 3% 16% 84% 81% 84% 21% 13% 14%
Sprout Social $45.41 $2,404 $167 $26 $2,262 22.0x 17.2x 13.5x NM NM NM 30% 28% 27% 74% 74% 74% (17%) (15%) (10%)
Zuora $13.93 $1,660 $179 $72 $1,554 5.6x 5.1x 4.7x NM NM NM 17% 9% 10% 57% 62% 56% (10%) 0% 3%
PubMatic $27.96 $1,337 $55 $0 $1,282 11.3x 9.2x 7.6x NM 28.7x 28.7x 15% 23% 20% 69% 70% 68% 14% 32% 27%
Talend S.A. $38.34 $1,218 $161 $178 $1,235 5.0x 4.4x 3.8x NM NM NM 20% 14% 13% 77% 80% 77% (7%) (6%) (3%)
Thryv Holdings $13.50 $419 $2 $673 $1,091 0.8x 1.0x 1.2x 2.8x 3.0x 4.0x (20%) (23%) (20%) 64% 67% 64% 27% 33% 31%
Veritone $28.45 $887 $54 $0 $833 16.8x 14.6x 12.1x NM NM NM 84% 15% 20% 65% 71% 75% NM NM NM
Zix Corporation $8.63 $474 $24 $196 $647 3.7x 3.0x 2.7x 16.4x 12.5x 11.2x 146% 25% 12% 61% 54% 65% 23% 24% 24%
Benefitfocus $14.48 $466 $176 $269 $560 1.9x 2.1x 2.0x 29.4x 14.6x 13.1x 14% (10%) 7% 54% 53% 51% 6% 14% 15%
ChannelAdvisor Corporation $15.98 $463 $66 $12 $409 3.1x 2.9x 2.7x 20.3x 12.0x 11.3x (1%) 10% 5% 78% 80% 78% 16% 24% 24%
Park City Group $4.79 $94 $21 $7 $80 4.1x 3.8x 3.5x 20.8x 21.9x 15.8x (16%) 8% 7% 69% 69% 69% 20% 17% 22%
Mean 18.6x 18.0x 15.7x 28.6x 23.8x 22.3x 35% 29% 20% 73% 75% 73% 13% 16% 16%
Median 15.7x 14.6x 13.3x 30.0x 21.8x 20.0x 29% 23% 19% 75% 77% 74% 14% 14% 15%
Software Trading Statistics
PUBLIC COMPANY VALUATIONS
Notes:Sources: Capital IQ and Wall Street Estimates. Market data as of 12/31/20.Margins <(20%) considered NM. Multiples <0 or >50 considered NM.

3131
($MM)
Announced Enterprise EV / Revenue EV / EBITDA
Date Acquirer Target Value (EV) LTM NTM LTM NTM Target Description
12/28/20 Azentio Software 3i Infotech $136 NA NA NA NAThe software products business of 3i Infotech, which provides ERP, compliance, and transaction security management SaaS and
related mobile application to businesses in banking, financial, and insurance sectors globally.
12/22/20Honeywell
International Sparta Systems $1,300 NA NA NA NA
Provides on-site and AI-based enterprise quality management software (EQMS) and SaaS, as well as supply chain regulatory
compliance and collaboration software to businesses in the life science industry.
12/21/20 Thoma Bravo RealPage $10,200 9.4x NA NM NAProvides property management software and SaaS for the multifamily property (MFP) real estate sector. Software enables web
development, market intelligence, revenue management and utility billing. Also provides related customer care services.
12/18/20Stillfront Group
AB
Super Free
Games $150 NA NA NA NA Provides computer and mobile-based casual and mash-up games, including trivia and social casino genres for consumers globally.
12/14/20 Electronic Arts
The
Codemasters
Software Co.
$1,210 7.6x NA 24.3x NADevelops and publishes driving and racing PC, console and mobile video games for consumers globally. The company began trading
on the London Stock Exchange under the stock ticker CDM in June 2018.
12/14/20 PTC Arena Solutions $715 NA 14.3x NA NA Provides product lifecycle management and SCM SaaS for businesses in the electronics and medical device sectors.
12/14/20Montagu Private
Equity Capita plc $529 NA NA NA NA
The education software solutions assets of Capita, which provides management information system (MIS) and administrative SaaS for
the education sector globally. Software provides features for records management, revenue and benefits management and contact
center management.
12/10/20Dye & Durham
Limited DoProcess LP $414 NA NA NA NA
Provides legal practice and document management SaaS for legal professionals in Canada. Software provides features for
conveyancing, corporate entity management, estate planning and estate administration management.
12/10/20 Wolters Kluwer eOriginal $280 NA 7.5x NA NAProvides financial document management software and SaaS for businesses, including banks, mortgage lenders, consumer lenders
and auto and equipment finance lenders. Software enables digital transaction management of financial documents.
12/10/20 CarGurus CarOffer $140 NA NA NA NAProvides automated instant vehicle trade management SaaS for businesses in the automotive industry in the US. Software provides
features for real-time offers, inventory management, marketing and selling vehicles, CRM integrations and data management.
12/7/20Norton
LifeLockAvira GmbH $360 NA NA NA NA
Provides desktop and mobile anti-virus, anti-malware and anti-spam software and SaaS for businesses and consumers globally.
Software provides features for sending suspicious files to the company's cloud database to back check against a possible threat and
returning the information to the device when considered safe.
Select Software M&A Transactions
RECENT ACQUISITIONS
Notes:Sources: Capital IQ and Wall Street Estimates. Reflects M&A activity through 12/31/20, where Enterprise Value is >$50MM.Transactions highlighted in light blue denote private equity transactions. Multiples <0 and >50 considered NM.

3232
($MM)
Announced Enterprise EV / Revenue EV / EBITDA
Date Acquirer Target Value (EV) LTM NTM LTM NTM Target Description
12/4/20Dye & Durham
Limited SAI Global Pty. $67 NA NA NA NA
The property division of Sai Global which provide property settlement and conveyancing software and services for businesses in
Australia. Software provides features for retrieving property, commercial and business information.
12/2/20New Mountain
Capital Tinuiti $575 NA NA 18.0x NA
Provides multi-channel e-commerce search engine marketing software and related digital marketing services for businesses. Offerings
focus on optimizing marketing capabilities across Google, Amazon and Facebook digital properties.
12/1/20 Salesforce.com Slack
Technologies $28,445 36.4x NA NM NA
Provides team collaboration SaaS to enable employees to upload, edit and manage documents collaboratively and across devices, as
well as send and receive real-time messages. Software integrates with third-party applications, news feeds and hosted storage
providers.
12/1/20Enad Global 7
AB
Daybreak Game
Company $300 3.9x NA NA NA Provides multi-player online (MMO), console and mobile video games for consumers in the US.
11/30/20Francisco
PartnersCDK Global $1,450 NA NA NA NA
The International business segment of CDK Global, which provides auto dealership management SaaS for businesses in EMEA and
Asia.
11/30/20 HealthStream Change
Healthcare $68 NA 3.8x NA 17.5x
The staff scheduling business and related assets of Change Healthcare, which provides staff scheduling and patient tracking SaaS for
businesses in the healthcare sector globally. Software provides features for schedule management, trend analysis and variance
intervention, patient tracking and predictive analytics.
11/25/20Mercell Holding
AS
Visma
Commerce AB $232 10.6x NA 21.3x NA
Provides cloud-based e-tendering and e-procurement SaaS to municipalities and businesses in Sweden. Software provides features for
public procurement information and monitoring, donation analysis, agreement follow-up and purchasing and invoice management.
Also includes Visma Commerce AS based in Norway.
11/23/20 Apex Technology AvePoint $1,990 NA 13.4x NA NAProvides big-data management, governance and compliance SaaS for enterprises and service providers. Offerings enable the
migration, management and protection of data in Microsoft 365.
11/19/20 Nasdaq Verafin $2,750 NA 19.6x NA NA
Provides financial anti-fraud, anti-money laundering, crime detection, reporting and regulatory compliance automation SaaS for
financial institutions, banks and credit unions. Software features include Big Data analytics, visual storytelling, and collaborative
investigation capabilities.
11/19/20 Experian plc Tapad $280 NA 5.1x NA NAProvides cross-screen, targeted advertising software, customer analytics and advertising delivery software and related digital
marketing campaign management services for marketers and advertising professionals globally.
11/19/20 FireEye Respond
Software $186 NA NA NA NA
Provides AI-enabled automated, unified cybersecurity threat investigation and response software for services providers, enterprises
and government agencies. Software integrates and unifies control points, security data, analytics and operations to accelerate
detection, response and engineering efforts.
Select Software M&A Transactions (Cont’d.)
RECENT ACQUISITIONS
Notes:Sources: Capital IQ and Wall Street Estimates. Reflects M&A activity through 12/31/20, where Enterprise Value is >$50MM.Transactions highlighted in light blue denote private equity transactions. Multiples <0 and >50 considered NM.

3333
($MM)
Announced Enterprise EV / Revenue EV / EBITDA
Date Acquirer Target Value (EV) LTM NTM LTM NTM Target Description
11/18/20Koch Media
GmbH
Flying Wild Hog
Sp. z o.o $137 NA NA NA NA Develops PC and console-based video games for consumers worldwide.
11/17/20 Autodesk Spacemaker AS $240 NA NA NA NAProvides AI-enabled urban and generative design SaaS for architects, urban designers and real estate developers. Software also
provides features for site evaluation, space utilization, 3D visualization and testing.
11/17/20Audax
Management Co. Jitterbit $150 NA 4.3x NA NA
Provides data and cloud integration platform as a service (iPaaS) for businesses. Service provides API creation used to connect SaaS on-
premise and cloud applications.
11/11/20Palo Alto
Networks Expanse $800 NA 11.9x NA NA
Provides cloud-based cybersecurity management SaaS for businesses and government agencies globally. Software provides features
for automated tracking and monitoring of Internet assets, attack surface and vulnerability management, inventory management, real-
time risk assessment and network security monitoring.
11/10/20TPG Capital / TA
Associates Planview $1,600 NA NA NA NA
Provides project and portfolio management SaaS, software and related systems integration services for enterprises. Software includes
features for plan design, agile project portfolio management and cost analysis and control.
11/10/20 PKWARE Dataguise $135 13.5x 6.8x NA NAProvides data discovery and protection security software and SaaS for businesses to automate information security and data privacy
management processes. Software enables risk and cost management, data analytics, compliance and governance capabilities.
11/9/20 Adobe Workfront $1,500 6.3x NA NA NAProvides enterprise work management SaaS for businesses globally. Software provides features for project management, team
collaboration and enterprise performance management.
11/9/20Sapiens
International
TIA Technology
A/S $78 NA NA NA NA
Provides insurance agency management software and related SaaS for the insurance sector globally. Software provides features for
CRM, policy administration, claims and event management, real-time pricing and compliance and risk management.
11/5/20 Avalara Business
Licenses LLC$97 NA NA NA NA
The operational assets of Business Licenses, which provides license registration, compliance management and filling SaaS for
businesses in the United States. Software provides features for research, acquisition and management of business licenses and
permits.
11/5/20ZoomInfo
Technologies
EverString
Technology$65 5.4x NA NA NA
Provides AI-enabled customer analytics and sales, marketing and enterprise data management SaaS for businesses and government
agencies. Software enables customer segmentation, purchase intent, insights and compliance based on online and offline cataloging
and integration of company and contact data.
11/2/20 Coupa Software LLamasoft $1,500 NA NA NA NA
Provides enterprise supply chain management (SCM) systems optimization software and SaaS that enable data modeling, design and
simulation of supply chain networks to improve operational and cost efficiency. Also provides related outsourced project staffing,
training and consulting services.
RECENT ACQUISITIONSSelect Software M&A Transactions (Cont’d.)
Notes:Sources: Capital IQ and Wall Street Estimates. Reflects M&A activity through 12/31/20, where Enterprise Value is >$50MM.Transactions highlighted in light blue denote private equity transactions. Multiples <0 and >50 considered NM.

3434
($MM)
Announced Enterprise EV / Revenue EV / EBITDA
Date Acquirer Target Value (EV) LTM NTM LTM NTM Target Description
11/2/20 CM Group Selligent $135 NA NA NM NAProvides AI-enabled marketing automation SaaS to businesses. Software provides features for customer engagement management
through advertisement personalization, behavioral targeting and monitoring audience engagement.
11/2/20 Coupa Software LLamasoft $1,500 NA NA NA NA
Provides enterprise supply chain management (SCM) systems optimization software and SaaS that enable data modeling, design and
simulation of supply chain networks to improve operational and cost efficiency. Also provides related outsourced project staffing,
training and consulting services.
10/29/20 Five9 Inference
Solutions $148 NA NA NA NA
Provides AI-enabled intelligent virtual agent (IVA) design and deployment SaaS for businesses and the public sector in North America,
Australia, New Zealand and the UK. Software enables self-service across voice, chat and messaging.
10/27/20dMY Technology
Group II
Genius Sports
Group Ltd $1,500 11.5x 10.3x NA NA
Provides sports data analytics and management software and related services to sport leagues, federations and betting markets
across the globe. Software enables users to collect, manage, analyze and distribute game data in real-time, publish statistics and
identify anomalous and suspicious patterns in data to prevent betting-related corruption.
10/27/20Teleperformance
SEHealth Advocate $690 4.9x NA NA NA
Provides ERP HR healthcare benefits and workforce management SaaS, mobile applications and related outsourced business process
services for enterprises.
10/26/20Francisco
PartnersForcepoint $1,000 1.4x NA 7.7x NA
Provides hosted anti-data leakage, intrusion detection and access control SaaS to enterprises. Software protects network users and
cloud access, prevents confidential data from leaving the corporate network, and eliminates breaches caused by insiders.
10/26/20 ANSYS Analytical
Graphics $700 NA NA NA NA
Provides simulation, modeling, testing and analysis SaaS for the aerospace and defense sector. Software enables spatial system
design, operations and analysis.
10/23/20SolarWinds
Worldwide SQL Sentry $142 4.1x NA NA NA
Provides database performance monitoring SaaS for businesses. Software enables diagnosis, optimization and management of
Microsoft SQL Server and Azure SQL relational and other databases.
10/22/20 TIBCO Software Information
Builders $550 2.3x 2.4x 22.0x 18.3x
Provides embedded BI data management and analytics SaaS and software for businesses. Software enables data integration,
management and governance as well as automated analytics, visualization and reporting.
10/19/20South Mountain
Merger Billtrust $1,493 12.8x 14.2x NA NA
Provides accounts receivable and payments automation SaaS and related outsourced transaction processing services for businesses.
Offerings enable cash flow management by automating credit decisioning and monitoring, invoice delivery, payment capture, cash
application and collections.
10/19/20Juniper
Networks 128 Technology $450 NA NA NA NA
Provides AI-enabled WAN routing and network management software for businesses, including enterprises and service providers.
Software provides features for secure application and service performance optimization and network automation capabilities.
RECENT ACQUISITIONSSelect Software M&A Transactions (Cont’d.)
Notes:Sources: Capital IQ and Wall Street Estimates. Reflects M&A activity through 12/31/20, where Enterprise Value is >$50MM.Transactions highlighted in light blue denote private equity transactions. Multiples <0 and >50 considered NM.
3535
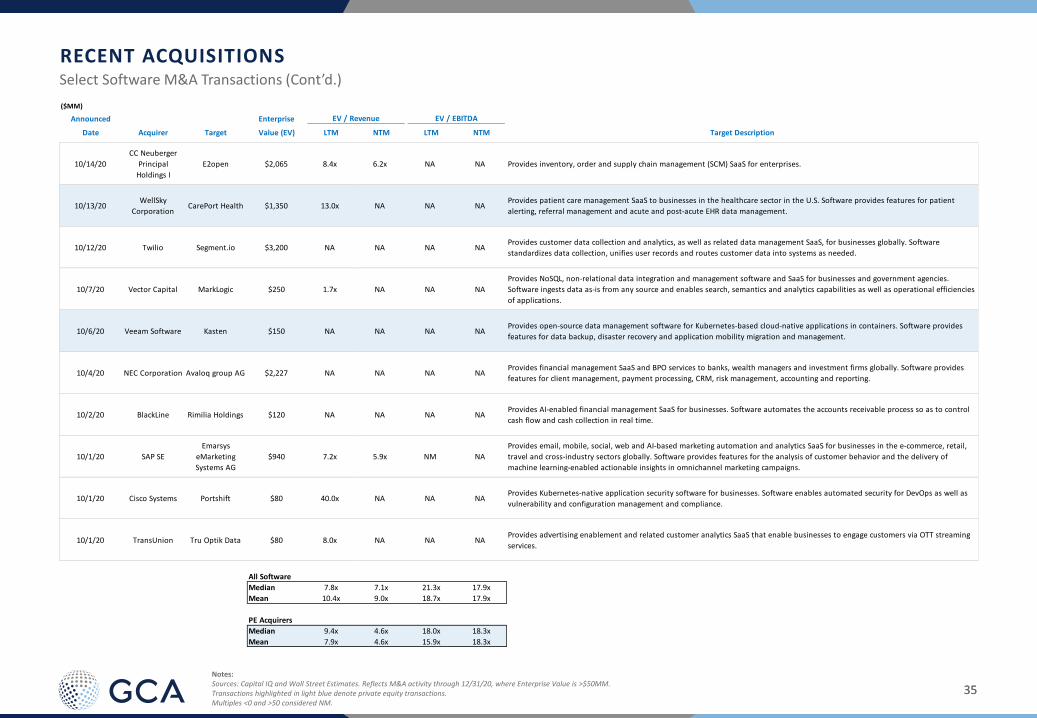
($MM)
Announced Enterprise EV / Revenue EV / EBITDA
Date Acquirer Target Value (EV) LTM NTM LTM NTM Target Description
10/14/20
CC Neuberger
Principal
Holdings I
E2open $2,065 8.4x 6.2x NA NA Provides inventory, order and supply chain management (SCM) SaaS for enterprises.
10/13/20WellSky
Corporation CarePort Health $1,350 13.0x NA NA NA
Provides patient care management SaaS to businesses in the healthcare sector in the U.S. Software provides features for patient
alerting, referral management and acute and post-acute EHR data management.
10/12/20 Twilio Segment.io $3,200 NA NA NA NAProvides customer data collection and analytics, as well as related data management SaaS, for businesses globally. Software
standardizes data collection, unifies user records and routes customer data into systems as needed.
10/7/20 Vector Capital MarkLogic $250 1.7x NA NA NA
Provides NoSQL, non-relational data integration and management software and SaaS for businesses and government agencies.
Software ingests data as-is from any source and enables search, semantics and analytics capabilities as well as operational efficiencies
of applications.
10/6/20 Veeam Software Kasten $150 NA NA NA NAProvides open-source data management software for Kubernetes-based cloud-native applications in containers. Software provides
features for data backup, disaster recovery and application mobility migration and management.
10/4/20 NEC Corporation Avaloq group AG $2,227 NA NA NA NAProvides financial management SaaS and BPO services to banks, wealth managers and investment firms globally. Software provides
features for client management, payment processing, CRM, risk management, accounting and reporting.
10/2/20 BlackLine Rimilia Holdings $120 NA NA NA NAProvides AI-enabled financial management SaaS for businesses. Software automates the accounts receivable process so as to control
cash flow and cash collection in real time.
10/1/20 SAP SE
Emarsys
eMarketing
Systems AG
$940 7.2x 5.9x NM NA
Provides email, mobile, social, web and AI-based marketing automation and analytics SaaS for businesses in the e-commerce, retail,
travel and cross-industry sectors globally. Software provides features for the analysis of customer behavior and the delivery of
machine learning-enabled actionable insights in omnichannel marketing campaigns.
10/1/20 Cisco Systems Portshift $80 40.0x NA NA NAProvides Kubernetes-native application security software for businesses. Software enables automated security for DevOps as well as
vulnerability and configuration management and compliance.
10/1/20 TransUnion Tru Optik Data $80 8.0x NA NA NAProvides advertising enablement and related customer analytics SaaS that enable businesses to engage customers via OTT streaming
services.
All Software
Median 7.8x 7.1x 21.3x 17.9x
Mean 10.4x 9.0x 18.7x 17.9x
PE Acquirers
Median 9.4x 4.6x 18.0x 18.3x
Mean 7.9x 4.6x 15.9x 18.3x
RECENT ACQUISITIONSSelect Software M&A Transactions (Cont’d.)
Notes:Sources: Capital IQ and Wall Street Estimates. Reflects M&A activity through 12/31/20, where Enterprise Value is >$50MM.Transactions highlighted in light blue denote private equity transactions. Multiples <0 and >50 considered NM.

3636
($MM)
Deal Date CompanyAmount
Raised Brief Description Investors
12/28/20 Unqork $258Developer of a no-code application development platform designed to help organizations build
custom software.
Aquiline Capital Partners, BlackRock, Broadridge Financial Solutions, CapitalG, Eldridge Industries,
Fin Venture Capital, Goldman Sachs Growth Equity, Hewlett Packard Enterprise
12/23/20 UnionTech $168 Developer of Unity Operating System compatible software solutions. E-Town International Investment
12/21/20 OneTrust $300 Developer of a technology platform designed for tackling privacy management. Coatue Management, Insight Partners, TCV
12/21/20 Ironclad $100Developer of a digital contracting platform intended to transform contract processes for legal,
sales and operations teams by automating workflows and approvals. Bond Capital
12/21/20 Pine Labs $100Developer of an online payment and loyalty platform intended to convert point of sale to point
of service. Lone Pine Capital
12/21/20 Bolt Financial $75Developer of a checkout experience platform designed to drive e-commerce businesses with
newfound revenue. Activant Capital, General Atlantic, Optus Capital Partners, Tribe Capital, WestCap Group
12/21/20 Qualia $65Developer of a real estate transaction management platform designed to simplify the real estate
closing process. 8VC, Menlo Ventures, Tiger Global Management
12/21/20 Trigo $60 Developer of an automation platform designed to help streamline the retail operations. 83North, Hetz Ventures, Morrag Investments, Red Dot Capital Partners, Tesco, Vertex Ventures
Israel
12/21/20 CAIS Capital $50Developer of a financial technology platform intended to connect independent financial advisors
with alternative investments. Eldridge Industries
12/18/20 Benson Hill $159 Developer of crop design platform intended to develop healthier and more sustainable crops. Argonautic Ventures, E-Mart, Fall Line Capital, GS Group, GV, iSelect Fund, LDC Innovations,
Mercury Fund, Prelude Ventures, Prolog Ventures, S2G Ventures, Wheatsheaf Group
12/18/20 Very Good Security $60 Developer of a data security platform designed to transfer data without any security breach. Andreessen Horowitz, Brighter Capital, Goldman Sachs Growth Equity, Vertex Ventures US
12/17/20 ISN Software $500 Developer of third-party contractor and supplier management software. The Blackstone Group
12/17/20 BeenVerified $150Operator of consumer and business information platform intended to make public records easy,
affordable and accessible to everyone.
Morgan Stanley, Morgan Stanley Credit Partners, Morgan Stanley Expansion Capital, ROCA
Partners
12/17/20 Lydia Solutions $131 Developer of a peer-to-peer payments application designed to make payments easier. Accel, Founders Future, Hedosophia, NewAlpha Asset Management, Open CNP, Siparex XAnge
Venture, Tencent Holdings
12/17/20 Spryker $130Developer of cloud commerce operating system designed to reach customers across all digital
touchpoints easily. One Peak Partners, Project A, TCV
12/17/20 Discord $100Developer of an instant messaging and digital distribution platform designed to offer VoIP and
texting services among friends or as part of gaming communities. Ben Jen Holdings, Greenoaks Capital Partners, Index Ventures
12/17/20 GoCardless $95Developer of an online payment platform designed to collect recurring payments from
customers. Bain Capital Ventures
12/17/20 Brainly $81Developer of an electronic learning platform designed to make learning effective outside the
class. General Catalyst, Learn Capital, Manta Ray Ventures, Prosus Ventures, Runa Capital
12/16/20 Paxos $142Developer of financial technologies designed to buy, sell, trade and manage assets in the global
economy.
Alua Capital, Declaration Partners, Ken Moelis, Liberty City Ventures, Mithril Capital Management,
PayPal Holdings, RIT Capital Partners, RRE Ventures, Senator Investment Group
RECENT FINANCINGS
Notes:Sources: PitchBook. Reflects deal activity through 12/31/20. Transactions reflect recent software venture and private equity growth / expansion activity where the amount raised was greater than or equal to $50MM.
Selected Software Private Financings

3737
($MM)
Deal Date CompanyAmount
Raised Brief Description Investors
12/16/20 BigID $70Developer of data-driven protection and privacy compliance platform designed to transform how
enterprises protect and manage the privacy of personal data.
Bessemer Venture Partners, Boldstart Ventures, Glynn Capital, Salesforce Ventures, Scale Venture
Partners, Tiger Global Management
12/16/20 Microblink $60 Developer of smartphone camera application to pay bills. Silversmith Capital Partners
12/15/20 Zenoti $160Developer of cloud-based enterprise software designed to empower the beauty and wellness
industry.
Advent International, Steadview Capital Management, Sunley House Capital Management, Tiger
Global Management
12/15/20 Clickup $100 Developer of a project management application designed to increase team productivity. Craft Ventures, Georgian Partners
12/15/20 Public.com $65Developer of a social investing application designed to provide access to the stock market for a
broader audience of investors. Accel, Advancit Capital, Dick Parsons, Greycroft, Lakestar, Mantis VC, Tony Hawk
12/11/20 Tink $102 Developer of an open banking platform intended to offer data-driven financial services. ABN AMRO Ventures, BNP Paribas, Dawn Capital, Eurazeo, Heartcore Capital, HMI Capital, Opera
Tech Ventures, PayPal Holdings, Poste Italiane
12/10/20 Uniphore $93Developer of an artificial intelligence-powered conversational automation platform designed to
offer speech analytics and change the way enterprises engage their consumers. NA
12/10/20 Hibob $70Developer of a cloud-based human resource and benefits platform designed to transform the
way modern businesses understand, interact and manage their talent.
Arbor Ventures, Battery Ventures, Bessemer Venture Partners, Cerca Partners, Eight Roads, Entrée
Capital, Israel Growth Partners, Perpetual Ventures, Presidio Ventures, Seek (Communications)
12/10/20 Solactive $60Developer of financial indices software intended to create exchange-traded funds and other
index-based products. Summit Partners
12/9/20 DataRobot $317Developer of an enterprise AI platform designed to accelerate data science by automating the
end-to-end journey from data to value.
BlackRock, HP Tech Ventures, New Enterprise Associates, Salesforce Ventures, Sapphire Ventures,
Silver Lake Management, Snowflake Ventures, Tiger Global Management, T. Rowe Price
12/9/20 Wiz $100Operator of a cloud security company intended to help companies to secure their cloud
infrastructure at scale. CyberStarts, Index Ventures, Insight Partners, Sequoia Capital
12/9/20 Bitso $62Developer of a bitcoin exchange platform designed to enable the seamless trade of
cryptocurrencies. Coinbase Ventures, Kaszek Ventures, Pantera Capital, QED Investors
12/9/20Cambridge
Quantum$50
Operator of independent quantum computing software company intended to build tools for the
commercialization of quantum technologies whose long-term impact will be profound.
Alvarium Investments, Honeywell Ventures, IBM Ventures, JSR, Serendipity Capital, Talipot
Holdings
12/8/20 SingleStore $80 Developer of a real-time analytics platform designed to ingest data and produce time to insight. Accel, Anchorage, Dell Technologies Capital, Glynn Capital, GV, Hercules Capital, Insight Partners,
REVIV
12/8/20 Beyond Identity $75Developer of passwordless identity management systems designed to provide secure,
passwordless authentication that integrates with SSO and customer application. Koch Disruptive Technologies, New Enterprise Associates
12/8/20 Orca Security $55Operator of a cloud-based security platform intended to deliver comprehensive full-stack
visibility into cloud infrastructure. GGV Capital, ICONIQ Capital, Silicon Valley CISO Investments, YL Ventures
12/7/20 Catawiki $179 Developer of an online marketplace intended for rare, precious and vintage objects. Accel, Peak Capital, Permira
12/6/20 Immedis $50Provider of multi-country payroll and employment tax solutions offered to provide global
mobility tax advice. Lead Edge Capital
12/3/20 Sourcegraph $50 Provider of a search engine that enables its users to search for codes. Sequoia Capital
RECENT FINANCINGS
Notes:Sources: PitchBook. Reflects deal activity through 12/31/20. Transactions reflect recent software venture and private equity growth / expansion activity where the amount raised was greater than or equal to $50MM.
Selected Software Private Financings (Cont’d.)

3838
($MM)
Deal Date CompanyAmount
Raised Brief Description Investors
12/2/20 Bizzabo $138Developer of a cloud-based event management platform designed to simplify the process of
marketing events. Insight Partners, OurCrowd, Viola Growth
12/2/20 Amount $81Developer of a financial platform intended to help banks and financial institutions to digitize their
retail product offerings.
August Capital, DFJ Growth, Goldman Sachs Growth Equity, Hanaco Venture Capital, Invus
Opportunities
12/2/20 Step $50 Developer of a mobile banking platform designed to provide financial tools for modern banking. Charli D'Amelio, Coatue Management, Collaborative Fund, Crosslink Capital, Dreamers VC, Stripe
12/1/20 Scale AI $155 Developer of a data platform designed to accelerate the development of AI applications. Tiger Global Management
12/1/20 NerdWallet $54 Developer of a financial platform designed to provide clarity for life's financial decisions. Fox Ventures
11/25/20 Aurora Solar $50 Developer of a 3D-modelling platform intended to help automate solar panel installation. Energize Ventures, Fifth Wall, ICONIQ Capital, Pear
11/23/20 Chainalysis $100Developer of a cryptocurrency investigation and compliance software intended to protect the
junction between finance and the decentralized internet. Accel, Addition, Benchmark (San Francisco), Ribbit Capital
11/20/20 Loadsmart $90Developer of an on-demand freight marketplace designed to help shippers move their freight and
carriers keep their trucks full.
Blackrock Innovation Capital Group, Bramalea Partners, Chromo Invest, Maersk Growth, Perry
Capital Partners, TFI International
11/19/20 Forter $125Provider of a decision as a service-based online fraud prevention tool designed to help online
retailers detect and eliminate transaction risks.
Bessemer Venture Partners, Commerce Ventures, Felix Capital, Itai Tsiddon, March Capital,
NewView Capital, Scale Venture Partners, Sequoia Capital Israel
11/19/20 Satispay $80Developer of an online payment platform intended to pay at stores and friends from a
smartphone. LGT Impact Ventures, Square, Tencent Holdings, Tim Ventures
11/19/20 Verbit $60Developer of transcription and captioning platform designed to generate detailed speech-to-text
files. ClalTech, HV Capital, Sapphire Ventures, Stripes, Vertex Growth, Vertex Ventures Israel
11/18/20 Addepar $117Developer of a wealth management platform designed to aggregate portfolio, market and client
data all in one place. 8VC, Sway Ventures, WestCap Group
11/18/20 Abnormal Security $50 Developer of a cloud email security platform designed to prevent cyber-crimes easily. Greylock Partners, Menlo Ventures
11/18/20 Udemy $50Operator of a learning platform intended to connect students all over the world to the best
instructors. Gaingels Syndicate, Learn Capital, Mindrock Capital, Tencent Holdings
11/17/20 Cato Networks $130Developer of a secure access service edge (SASE) platform intended to offer a secure enterprise
network connection to all enterprise locations, people and data.
Acrew Capital, Aspect Ventures, Coatue Management, Greylock Partners, Lightspeed Venture
Partners, Singtel Innov8
11/17/20 Paddle $68Developer of a revenue delivery platform designed for B2B SaaS companies to power growth
across acquisition, renewals and expansion. 83North, BGF, FTV Capital, Kindred Capital, Notion
11/17/20 HOVER $60Developer of a computer vision and 3D mapping technology designed to generate accurate 3D
models by simply taking photos with smartphones.
Alsop Louie Partners, Guidewire Software, GV, Menlo Ventures, Nationwide Insurance Company of
America, Nationwide Ventures, Standard Industries, State Farm Ventures, Travelers Companies
11/17/20 ActivTrak $50Developer of workforce productivity and analytics platform designed to provide visibility and
insights into how teams work - in office or remote environment. Elsewhere Partners, Sapphire Ventures
11/16/20 Strava $110 Developer of a social application designed to connect athletes worldwide. Dragoneer Investment Group, Go4it, Jackson Square Ventures, Madrone Capital Partners, Sequoia
Capital, TCV
RECENT FINANCINGS
Notes:Sources: PitchBook. Reflects deal activity through 12/31/20. Transactions reflect recent software venture and private equity growth / expansion activity where the amount raised was greater than or equal to $50MM.
Selected Software Private Financings (Cont’d.)

3939
($MM)
Deal Date CompanyAmount
Raised Brief Description Investors
11/16/20 MindTickle $100Developer of a data-driven sales readiness platform designed to maximize business impact across
pre- and post-sales teams.
Canaan Partners, NewView Capital, Norwest Venture Partners, Qualcomm Ventures, SoftBank
Group, SoftBank Investment Advisers
11/16/20 Zeotap $61Developer of a customer intelligence platform designed to help companies better understand
their customers and predict behaviors.
Capnamic Ventures, Coelius Capital, Coparion, Flight Ventures, Here IONIQ, Iris Capital,
MathCapital, NeueCapital Partners, New Science Ventures, SignalFire, Singtel Innov8
11/12/20 Menlo Security $100Developer of a cybersecurity platform designed to eliminate the threat of malware from the web
and email. General Catalyst, JP Morgan Asset Management, Neuberger Berman, Vista Equity Partners
11/11/20 SentinelOne $267Developer of an automated cybersecurity software designed to protect devices and servers
against malware and threats.
Insight Partners, Qualcomm Ventures, Sequoia Capital, Third Point Ventures, Tiger Global
Management
11/10/20 JumpCloud $75Developer of a Directory-as-a-Service (DaaS) platform intended to centralize and simplify identity
management. Blackrock Innovation Capital Group, General Atlantic
11/10/20 Shield AI $53Developer of a drone technology designed to protect service members and civilians with
artificially intelligent systems. NA
11/5/20 Vimeo $150Operator of professional video platform and community intended to create, manage and share
high-quality videos. Government of Singapore, Thrive Capital
10/29/20 nVoq $56Developer of a cloud-based speech recognition platform intended to support voice-enabled
workflow automation. NA
10/28/20 Scopely $340Developer of an interactive entertainment platform intended to create and publish a diverse
portfolio of immersive content.
Battery Ventures, BlackRock, D1 Capital Partners, Declaration Partners, NewView Capital,
Revolution Group, Sands Capital Ventures, TSG Consumer
10/27/20 Eightfold.ai $125Developer of a talent intelligence platform designed to help companies find, recruit and retain
workers. Capital One Ventures, Foundation Capital, General Catalyst, IVP, Lightspeed Venture Partners
10/27/20 OrderMark $120Developer of an online ordering management platform designed to help restaurants manage
online orders and other management operations. Act One Ventures, MicroVentures, SoftBank Group, SoftBank Investment Advisers
10/27/20 Cognite $75Developer of data management platform built for industries like oil and gas, shipping,
manufacturing and power and utilities. Accel
10/27/20 PrimaryBid $50Developer of an online investment platform designed to help private investors participate in new
share placings by listed companies.
ABN AMRO Ventures, Draper Esprit, Fidelity International Strategic Ventures, Hambro Perks,
London Stock Exchange Group, OMERS Ventures, Outward Venture Capital, Pentech Ventures
10/22/20 Applied Intuition $125 Developer of advanced simulation infrastructure software designed for autonomous vehicles. Andreessen Horowitz, General Catalyst, Lux Capital Management
10/22/20 Rokt $80Provider of marketing services intended to transform the customer buying experience by
bringing marketing to e-commerce through the transaction moment. Square Peg Capital, TDM Growth Partners
10/21/20 Tekion $150 Developer of a cloud-built platform intended to connect digital experiences to automotive retail. Advent International, Airbus Ventures, Exor, FM Capital, Index Ventures, Joe Serra
10/20/20 LearnUpon $56 Developer of a corporate learning platform designed to train employees, partners and customers. Summit Partners
10/20/20 Retool $50Provider of a tool development platform intended to help build custom business tools without
having any programming language knowledge.
Andrew Miklas, Elad Gil, Henrique Dubugras, John Collison, Nat Friedman, Patrick Collison, Paul
Graham, Pedro Franceschi, Peter Reinhart, Sequoia Capital, Tomer London
10/16/20 HyperScience $80 Developer of an AI-based enterprise software designed to automate office work. Bessemer Venture Partners, Bond, Schoeneck & King, FirstMark Capital, Government of Singapore,
Nathaniel Turner, PROOF, Stripes, Tiger Global Management
RECENT FINANCINGS
Notes:Sources: PitchBook. Reflects deal activity through 12/31/20. Transactions reflect recent software venture and private equity growth / expansion activity where the amount raised was greater than or equal to $50MM.
Selected Software Private Financings (Cont’d.)

4040
($MM)
Deal Date CompanyAmount
Raised Brief Description Investors
10/16/20 HOMER $55Developer of an essential early learning program designed to provide kids a personalized learning
journey that grows with them as they build skills for school and life.
3one4 Capital, Amanat Holdings, Gymboree Play & Music, Interlock Partners, LEGO Ventures,
Sesame Workshop, TrustBridge Partners, Vaidya Capital Partners
10/15/20 Chime $534 Developer of a mobile platform designed to offer banking services on the go. Coatue Management, Dragoneer Investment Group, DST Global, Flourish Ventures, General
Atlantic, ICONIQ Capital, Tiger Global Management, Whale Rock Capital Management
10/14/20 Disco $60 Operator of a legal technology company intended to provide SaaS solutions for law firms. Bessemer Venture Partners, Breyer Capital, Georgian Partners, LiveOak Venture Partners, The
Stephens Group
10/13/20 SnapDocs $60Developer of a digital closing platform designed to simplify mortgage loan closings and enhance
the borrower experience.
Ben Smith, Coyne Lloyd, David Eisenberg, David Vivero, DocuSign, Founders Fund, F-Prime Capital,
Kyle Vogt, Lachy Groom, Maverick Ventures, Sequoia Capital, Y Combinator, Zigg Capital
10/12/20 Triller $100 Developer of a social video sharing platform designed to create engaging media content. Intersect VC, Pegasus Tech Ventures, UBS
10/11/20 Razorpay $100Developer of an online payment platform designed to provide an affordable and secure way for
online transactions.
Government of Singapore Investment Corporation (GIC), Matrix Partners India, Ribbit Capital,
Sequoia Capital India, Tiger Global Management, Titan Capital, Y Combinator
10/8/20 MessageBird $200Developer of communication APIs designed to connect companies with their customers on
billions of devices around the world.
Accel, Atomico, Bonnier, Glynn Capital, LGT Lightstone Aspada, Longbow Capital, Mousse Partners,
NewView Capital, Spark Capital, Y Combinator
10/8/20AEGIS Hedging
Solutions$50
Developer of a fintech software and provider of hedge advisory services intended to deploy, grow
and protect capital through commodity and rate hedges. Trilantic North America
10/7/20 MineralTree $54Developer of a cloud-based automation software designed to automate accounts payable and
business to business payments. .406 Ventures, Eight Roads, Great Hill Partners
10/6/20 Tipalti $150Provider of a cloud-based automation platform designed to eliminate mass payment workload
and reduce automation payment risk. 01 Advisors, Durable Capital Partners, Greenoaks Capital Partners
10/6/20 Dialpad $100Developer of a business communications platform intended to offer cloud-based solutions for
businesses to communicate effectively.
Andreessen Horowitz, Felicis Ventures, GV, ICONIQ Capital, OMERS Growth Equity, Section 32,
TriplePoint Venture Growth, Work-Bench
10/6/20 ChargeBee $55Developer of SaaS-based subscription management and recurring billing platform designed to
offer subscription management services. Insight Partners, Steadview Capital Management, Tiger Global Management
10/5/20 Molo $343Developer of a digital lending platform designed to offer mortgages without papers and
appointments. Andenes Investments, GPS Ventures, Yabeo Capital
10/5/20 Tanium $151Developer of unified endpoint management and security platform designed to simplify endpoint
security and configuration compliance.
Baillie Gifford, Fidelity Management & Research, Salesforce Ventures, T. Rowe Price, TrueBridge
Capital Partners
10/5/20 Pollinate $90Developer of a cloud-based banking platform intended to unlock the power of payments and
data.
EFM Asset Management, MasterCard, Motive Partners, National Australia Bank, National
Westminster Bank
10/5/20 Cooler Screens $80Developer of a retail point of sale platform designed to transform retail cooler surfaces into IoT-
based screens. GreatPoint Ventures, M12, Verizon Ventures
10/1/20 Robinhood $668Developer of an investment platform intended to help teach people to invest in the stock
market.
9Yards Capital, Andreessen Horowitz, D1 Capital Partners, DST Global, Founders Circle Capital, Iron
Edge VC, IVP, John-Paul Gallo, Michael Kogan, Redalpine Venture Partners, Sequoia Capital
10/1/20 Alkami Technology $140Developer of a cloud-based banking platform intended to make banking more efficient, strategic
and successful.
D1 Capital Partners, Fidelity Management & Research, Franklin Templeton Investments,
Stockbridge Investors
10/1/20 Payrix $50 Developer of a flexible payment facilitator platform intended to unlock more revenue potential. Blue Star Innovation Partners, Providence Strategic Growth
RECENT FINANCINGS
Notes:Sources: PitchBook. Reflects deal activity through 12/31/20. Transactions reflect recent software venture and private equity growth / expansion activity where the amount raised was greater than or equal to $50MM.
Selected Software Private Financings (Cont’d.)

4141
GCA: A LEADING INDEPENDENT GLOBAL INVESTMENT BANKGlobal Investment Bank Providing Strategic M&A and Capital Markets Advisory Services to Growth Companies and Market Leaders
GCA operates as GCA in America and Asia and GCA Altium in Europe.
ZURICH
MILAN
FRANKFURT
MUNICH
TEL AVIV
LONDON
BIRMINGHAM
MUMBAI
SHANGHAI
SINGAPORE
TOKYO
NEW DELHI
NAGOYA
HO CHI MINH CITY
TAIPEI
PARISLEEDS
FUKUOKA
NEW YORK
SAN FRANCISCO
Sector expertise:
Expansive coverage
and deep specialization
Exceptional cross-border capabilities:
~50% of all transactions
Global platform:25 offices in key markets across
America, Asia and Europe
Broad spectrum of clients:
Leading conglomerates,
top private equity
firms and emerging high-growth
companies
Experienced team: Over 500 employees
across the globe
Strong reputation and track record: High number of
repeat clients and referrals
Diversified business model:
Geographically
balanced, synergistic
and complementary focus areas
KYOTO
OSAKA
MANCHESTER
LAUSANNE
STOCKHOLM

4242
GCA Advisors, LLC is the US entity of GCA, a global investment bank that provides strategic M&A and capital markets advisory services to growth companies and market leaders. The firm offers worldwide coverage with over 500 professionals in 25 locations across America, Asia and Europe. Built by the people that run the business, GCA is a firm of experts who focus on deals that require commitment, original perspective, skill and exceptional networks.
www.gcaglobal.com
This report was prepared by GCA Advisors, LLC, a registered broker-dealer and member of FINRA and SIPC. Sources of data include Capital IQ and other news organizations. Information obtained from third-party sources is considered reliable, but we do not guarantee that the information herein is accurate and complete. The report shall not constitute an offer to sell or the solicitation of an offer to buy any of the securities mentioned herein; past performance does not guarantee future results. Recipients of this report should not interpret the information herein as sufficient grounds for an investment decision or any other decision.
DISCLAIMER: This report includes logos or other words or devices that may be registered trademarks of their respective owners. Such use is solely for purposes of convenience in referring to the trademark owners and their products/services. This report and its contents are not endorsed by, sponsored by or affiliated with any trademark owners. GCA Advisors, LLC and its affiliates are not affiliated with any trademark owner but may provide financial services to one or more trademark owners or their affiliates.