Cepharanthine exerts antitumor activity on cholangiocarcinoma by inhibiting NF-κB
Endocrine-RelatedCancer
Research
Open Access
J Hoefer et al. Oncogenic role of SOCS2 in PCa 21 :2 175–187
SOCS2 correlates with malignancyand exerts growth-promoting effectsin prostate cancer
Julia Hoefer, Johann Kern1, Philipp Ofer, Iris E Eder, Georg Schafer, Dimo Dietrich2,
Glen Kristiansen2, Stephan Geley3, Johannes Rainer3, Eberhard Gunsilius1,
Helmut Klocker, Zoran Culig and Martin Puhr
Experimental Urology, Department of Urology, Innsbruck Medical University, Anichstrasse 35, A-6020 Innsbruck,
Austria1Oncotyrol Laboratory for Tumor Biology and Angiogenesis, Innsbruck, Austria2Institute of Pathology, University Hospital Bonn, Bonn, Germany3Division of Molecular Pathophysiology, Innsbruck Biocenter, Medical University Innsbruck, Innsbruck, Austria
http://erc.endocrinology-journals.orgDOI: 10.1530/ERC-13-0446
q 2014 The authorsPublished by Bioscientifica Ltd
Printed in Great Britain
This work is lAttribution 3
Correspondence
should be addressed
to Z Culig or M Puhr
Emails
Abstract
Deregulation of cytokine and growth factor signaling due to an altered expression of
endogenous regulators is well recognized in prostate cancer (PCa) and other cancers.
Suppressor of cytokine signaling 2 (SOCS2) is a key regulator of the GH, IGF, and prolactin
signaling pathways that have been implicated in carcinogenesis. In this study, we evaluated
the expression patterns and functional significance of SOCS2 in PCa. Protein expression
analysis employing tissue microarrays from two independent patient cohorts revealed a
significantly enhanced expression in tumor tissue compared with benign tissue as well as
association with Gleason score and disease progression. In vitro and in vivo assays uncovered
the involvement of SOCS2 in the regulation of cell growth and apoptosis. Functionally,
SOCS2 knockdown inhibited PCa cell proliferation and xenograft growth in a CAM assay.
Decreased cell growth after SOCS2 downregulation was associated with cell-cycle arrest and
apoptosis. In addition, we proved that SOCS2 expression is significantly elevated upon
androgenic stimulation in androgen receptor (AR)-positive cell lines, providing a possible
mechanistic explanation for high SOCS2 levels in PCa tissue. Consequently, SOCS2 expression
correlated with AR expression in the malignant tissue of patients. On the whole, our study
linked increased SOCS2 expression in PCa with a pro-proliferative role in vitro and in vivo.
Key Words
" prostate cancer
" SOCS2
" androgen
" proliferation
" survival
icen.0 U
Endocrine-Related Cancer
(2014) 21, 175–187
Introduction
Prostate cancer (PCa) represents the most common
malignancy in men in the Western world (Jemal et al.
2011). The development and progression of PCa are
strongly associated with the dysfunction of various
signaling pathways. Preserved androgen signaling is one
of the main characteristics of the disease, especially in
advanced and castration-resistant PCa (Locke et al. 2008,
Lonergan & Tindall 2011). Furthermore, cytokine and
growth factor signaling cascades are frequently deregu-
lated due to an altered expression of endogenous key
regulators such as protein inhibitors of activated
STAT (PIAS), Src-homology 2 (SH2)-containing protein
tyrosine phosphatases, and suppressors of cytokine sig-
naling (SOCS; Larsen & Ropke 2002, Heinrich et al. 2003,
sed under a Creative Commonsnported License.

Endocrine-RelatedCancer
Research J Hoefer et al. Oncogenic role of SOCS2 in PCa 21 :2 176
Tan & Nevalainen 2008, Dutt & Gao 2009, Puhr et al. 2009,
Hoefer et al. 2012, Singh et al. 2012).
SOCS proteins have originally been described as the
feedback inhibitors of cytokine-induced Janus kinase
(JAK/STAT) signaling (Endo et al. 1997, Naka et al. 1997,
Starr et al. 1997). However, they have also been reported
to be associated with other pathways such as nuclear factor
kappa B signaling (Ryo et al. 2003) and insulin signaling
(Rui et al. 2002). The SOCS family consists of eight
members: SOCS1–7 and cytokine-inducible SH2-
containing protein (CIS). They contain an N-terminal
region of variable length, a central SH2 domain, and a
conserved C-terminal region called SOCS box. SOCS
members can act as E3 ubiquitin ligases toward associated
proteins (Kamura et al. 1998, 2004) and are rapidly
induced upon the release of multiple growth factors
and cytokines, with STAT molecules being the main
transducers of these signals (Croker et al. 2008).
The involvement of SOCS1 and SOCS3 in PCa has
been extensively investigated and both tumor suppressive
and oncogenic roles have been reported (Bellezza et al.
2006, Neuwirt et al. 2007, 2009, Puhr et al. 2009, 2010,
Pierconti et al. 2011). However, to date, only a limited
number of studies have investigated the expression and
functional significance of SOCS2 in PCa. In other
malignancies, the upregulation or downregulation of
SOCS2 has already been demonstrated (Arany et al. 2001,
Schultheis et al. 2002, Wikman et al. 2002, Sutherland et al.
2004). Furthermore, Socs2 knockout as well as transgenic
mice have been reported to display gigantism (Metcalf
et al. 2000, Greenhalgh et al. 2002), suggesting a dual role
for SOCS2 in growth regulation. SOCS2 is preferentially
upregulated by growth hormone (GH; Greenhalgh et al.
2002), erythropoietin (Starr et al. 1997, Wang et al. 2004),
interleukins (ILs; Starr et al. 1997, Rico-Bautista et al.
2006), and prolactin (Pezet et al. 1999). Furthermore,
SOCS2 is implicated in insulin-like growth factor (IGF) 1
and insulin signaling cascades (Dey et al. 1998, Sadowski
et al. 2001). Deregulation of either of these signaling
cascades has already been reported to be associated
with PCa (Roberts 2004, Monti et al. 2007, Cox et al.
2009, Culig 2011, Goffin et al. 2011, Culig & Puhr 2012,
Nakonechnaya et al. 2013). Therefore, we hypothesize
that SOCS2 is a crucial regulator in PCa. To address
this question, in this study, we investigated SOCS2
expression in tissue samples and carried out in vitro and
in vivo assays to uncover its functional relevance in PCa.
Our data clearly demonstrate a growth-promoting role
for SOCS2 and provide an explanation for a high SOCS2
expression in malignant tissue via androgenic regulation.
http://erc.endocrinology-journals.orgDOI: 10.1530/ERC-13-0446
q 2014 The authorsPrinted in Great Britain
Materials and methods
Tissue microarray and immunohistochemistry
A tissue microarray (TMA) (Innsbruck-TMA) containing
tissue cores obtained from 90 PCa patients who under-
went radical prostatectomy at the University Hospital
Innsbruck was constructed and immunohistochemically
stained as described elsewhere (Hoefer et al. 2012). In
addition, SOCS2 expression in metastases was assessed
using two TMAs constructed from tissue cores obtained
from ten patients with lymph node and bone metastases
respectively. Evaluation was done by an uropathologist (G S)
using the semi-quantitative scoring system ‘quickscore’
(Detre et al. 1995). A second TMA (Bonn-TMA) comprising
tissue specimens collected from 25 PCa patients who
underwent radical prostatectomy at the University Hospital
Bonn, Germany, was constructed and stained as described
above. The study was approved by the institutional review
boards. Staining intensity was evaluated by an independent
pathologist (V S), defining a score between 0 (negative
staining) and 3 (intense staining). The following antibodies
were used: anti-SOCS2 (H-74) (1:100; Santa Cruz Bio-
technology) and anti-androgen receptor (AR) (1:400; Epi-
tomics, Burlingame, CA, USA).
Methylation analysis
Bisulfite-converted DNA from FFPE tissue samples was
prepared as described previously (Dietrich et al. 2012) (see
Supplementary Materials and methods). Relative DNA
methylation levels of the SOCS2 gene locus referred to as
total DNA as determined with a methylation-unspecific
b-actin (ACTB) assay were assessed using a quantitative
duplex PCR. PCR composition and thermal cycling were
used as described previously (Dietrich et al. 2012).
Cell culture and reagents
PC3, DU145, LNCaP, BPH-1, 22RV1, DUCaP, LAPC4,
RWPE-1, and VCaP cells were obtained from the American
Type Culture Collection (ATCC, Rockville, MD, USA) and
cultured as indicated. The DUCaP-R subline was esta-
blished by cultivation in the presence of 1 nM R1881
(Pfeiffer et al. 2010). The identity of the cell lines was
confirmed by short tandem repeat analysis. Benign
stromal PM151T and epithelial EP156T cells were cultured
as described elsewhere (Kogan et al. 2006). For androgen
stimulation, the cells were starved in RPMI containing
10% (v/v) charcoal-stripped FCS for 24 h and then treated
Published by Bioscientifica Ltd.

Endocrine-RelatedCancer
Research J Hoefer et al. Oncogenic role of SOCS2 in PCa 21 :2 177
with R1881 (DuPont NEN Products, Boston, MA, USA).
To antagonize androgen-induced effects, LNCaP cells
were incubated with 5 mM of bicalutamide for 24 h.
LAPC4 cells, which are usually maintained in a medium
containing dihydrotestosterone (DHT), were grown in
RPMI containing 10% (v/v) charcoal-stripped FCS with or
without 100 nM DHT (Sigma–Aldrich).
Western blotting
Nuclear and cytoplasmic fractions were separated using the
NE-PER Nuclear and Cytoplasmic extraction kit (Thermo
Scientific, Rockford, IL, USA) following the manufac-
turer’s instructions. Western blotting was carried out as
described previously (Puhr et al. 2009). The following
antibodies were used: anti-SOCS2 (1:500; Cell Signaling,
Danvers, MA, USA), anti-GAPDH (1:100 000; Chemicon,
Vienna, Austria), anti-cPARP (1:1000, Promega), and
anti-Lamin A (1:5000, Abcam, Cambridge, UK).
RNA isolation and qRT-PCR
RNA isolation, RT, and qRT-PCR were carried out as
described elsewhere (Puhr et al. 2009) (see Supplementary
Materials and methods).
SOCS2 downregulation
PC3, DU145, and LNCaP cells were stably transfected with
doxycycline-inducible shRNA constructs containing GFP
against SOCS2 (shSOCS2-1 and shSOCS2-3) or luciferase
(shLuc) (see Supplementary Materials and methods).
The generation and transfection of constructs have been
described in Sigl et al. (2009). For functional assays, the
cells were pretreated with doxycycline (1 mg/ml) for 6 days
to achieve SOCS2 downregulation.
SOCS2 overexpression
pCMV6-AC-GFP and pCMV-AC-GFP-SOCS2 plasmids
were obtained from Origene (Rockville, MD, USA). The
cells were transfected with DNA (0.5 mg/six wells) using
3 ml of Fugene HD (Roche) for 48 h. For stable over-
expression, the cells were selected with 0.5 mg/ml of G418
(neomycin) for 7 days.
Proliferation measurement
Proliferation wasassessed using [3H]thymidine incorporation
assay as described in Hoefer et al. (2012). The medium was
http://erc.endocrinology-journals.orgDOI: 10.1530/ERC-13-0446
q 2014 The authorsPrinted in Great Britain
supplemented with 10% FCS. Viability was measured by
WST assay. The cells were seeded in 96-well plates and grown
in the medium. To the plates, 10 ml of WST reagent (Roche)
were added for 60 min. Absorbance was assessed using
Chameleon 5025 (HVD Life Sciences, Vienna, Austria).
Clonogenic assay
A total of 1.500 cells (PC3 and DU145) or 10.000 cells
(LNCaP) were seeded into a 75 cm2 cell-culture flask and
incubated for 12 (PC3 and DU145) or 18 days (LNCaP).
Colonies were stained as described in Hoefer et al. (2012).
Apoptosis measurement and cell-cycle distribution
Apoptotic cells and cell-cycle distribution were assessed as
described previously (Hoefer et al. 2012) and analyzed
using the ModFit LT 3.2 software.
Chick chorioallantoic membrane assay
Chick chorioallantoic membrane (CAM) assay was carried
out as described (Deryugina & Quigley 2008) with slight
modifications. For onplant preparation, native, nonpepsi-
nized type I rat tail collagen (BD Bioscience, Schwechat,
Austria) was neutralized with 0.2 M NaOH solution and
mixedwith10!DMEM(LifeTechnologiesGibco).A totalof
5!105 pretreated PC3 cells were added to 50 ml of this
solution. Collagen onplants with or without doxycycline
(1 mg/ml) were applied to CAMs and incubated for 5 days.
Xenografts were analyzed under a stereomicroscope with a
digital camera (Olympus SZX10, Olympus E410, Vienna).
The tumor area was determined using ImageJ (NIH). For
histological analysis, onplants were excised from the CAMs,
fixed in 4% paraformaldehyde, and processed for paraffin
sectioning and immunohistochemistry (IHC). The follo-
wing antibodies were used: anti-SOCS2 (H-74) (1:100; Santa
Cruz) and anti-Ki67 (1:100; Dako, Glostrup, Denmark).
Microarray dataset generation and analysis
The microarray dataset was generated at the Expression
Profiling Unit of the Medical University Innsbruck
following the manufacturer’s protocols as described in
Martowicz et al. (2013). The analysis of the in total 30
Affymetrix HuGene-1.0-ST-v1 GeneChips was carried out
as described in Rainer et al. (2012) using functions from
Bioconductor packages (Gentleman et al. 2004). The raw
and pre-processed data were been submitted to GEO
(accession number: GSE 50936).
Published by Bioscientifica Ltd.

Endocrine-RelatedCancer
Research J Hoefer et al. Oncogenic role of SOCS2 in PCa 21 :2 178
Statistical analyses
SPSS (V15.0) and GraphPad Prism 4 were used for
statistical analyses. The Mann–Whitney U test or t-test
was carried out to calculate significances between two
groups. Correlation analysis was carried out using
Pearson’s method. Differences in relapse-free survival,
defined as biochemical recurrence, were assessed using
the Kaplan–Meier plots and log-rank test. Differences were
considered statistically significant when P was !0.05.
Results
SOCS2 expression increases with malignancy and
inversely correlates with time to disease recurrence
To evaluate SOCS2 expression patterns in benign and
malignant prostate tissue, we used a radical prostatectomy
specimen TMA of two independent PCa cohorts. Ninety
malignantand79benigncoresofPCaspecimensobtained in
Innsbruck (Innsbruck-TMA) were evaluable after immuno-
histochemical staining. A representative benign gland
(Fig. 1A) revealed a low SOCS2 expression in the surround-
ing stromal compartment (especially in smooth muscle
fibers), whereas epithelial cells expressed higher levels of
SOCS2. Within the epithelial compartment, the basal cell
layer exhibited a much more intense SOCS2 staining than
luminal cells. A similar phenomenon was observed in
benign epithelial and stromal prostate cell lines. We
detected the highest SOCS2 expression in EP156T cells,
which predominantly represent a basal epithelial pheno-
type (Kogan et al. 2006), lower SOCS2 expression in the
phenotypically luminal epithelial RWPE-1 cells, and the
weakest SOCS2 expression in the stromal cell line PM151T
(Fig. 1B). Quantitative analysis of the TMA demonstrated a
significantly elevated SOCS2 expression in malignant areas
compared with benign tissue, as well as in high- vs low-
Gleason score samples (Fig. 1C and D). Furthermore, SOCS2
expression was significantly higher in bone and lymph
node metastases compared with benign tissue (Fig. 1D). In
primary tumor tissue, SOCS2 expression was positively
correlated with the Gleason score (Fig. 1E), and relapse-free
survival was significantly shorter in patients with a high
SOCS2 expression (Fig. 1F). IHC staining of a second cohort
of patients (Bonn-TMA) confirmed an elevated SOCS2
expression in low- as well as high-Gleason score tumors
(Supplementary Figure 1, see section on supplementary
data given at the end of this article). Testing for SOCS2
gene hypermethylation, which is frequently reported for
other tumor entities (Sutherland et al. 2004, Culig 2013),
http://erc.endocrinology-journals.orgDOI: 10.1530/ERC-13-0446
q 2014 The authorsPrinted in Great Britain
revealed no alteration in malignant tissue (Fig. 1G),
consistent with the high expression of the protein in PCa.
SOCS2 expression regulates PCa cell growth
in vitro and in vivo
All the tested prostate cell lines expressed both SOCS2
mRNA and protein, as measured by qRT-PCR and western
blotting respectively (Fig. 2A and B). The observed
discrepancy between mRNA and protein levels indicates a
tight regulation of SOCS2 protein stability via proteasomal
degradation. Cellular fractionation and subsequent wes-
tern blotting revealed SOCS2 expression predominantly in
the cytoplasmic fraction (Fig. 2C). To uncover a possible
influence of SOCS2 on cell growth, we carried out
functional assays following SOCS2 depletion. For this
purpose, PC3, DU145, and LNCaP cells were stably
transfected with doxycycline-inducible SOCS2 shRNA
constructs and treated with doxycycline for 6 days to
achieve prolonged SOCS2 downregulation (Fig. 3A). Sub-
sequent [3H]thymidine incorporation and clonogenic
assays revealed a significant decrease in both proliferation
(Fig. 3B) and colony formation ability (Fig. 3C) in cells
in which SOCS2 was silenced. We obtained similar results
with both specific shRNA sequences; however, growth
inhibition with shSOCS2-1 was more prominent. The WST
assay confirmed decreased cell viability after SOCS2 down-
regulation (Fig. 3D). In line with these findings, SOCS2
overexpression increased the proliferation and clonogenic
potential in PC3 cells (Supplementary Figure 2, see section
on supplementary data given at the end of this article).
To confirm a possible anti-proliferative effect of SOCS2
knockdown on tumor growth in vivo, we applied a CAM
assay using PC3 shSOCS2-1 or shLuc cells. In the past three
decades, the CAM assay has become an accepted and reliable
in vivo model to replace animal experiments for testing
different treatments (Armstrong et al. 1982, Kunzi-Rapp
et al. 2001, Taizi et al. 2006, Tavaszi & Budai 2006, Saw et al.
2008). In xenografts derived from SOCS2 knockdown
cells, we observed a significantly reduced tumor area after
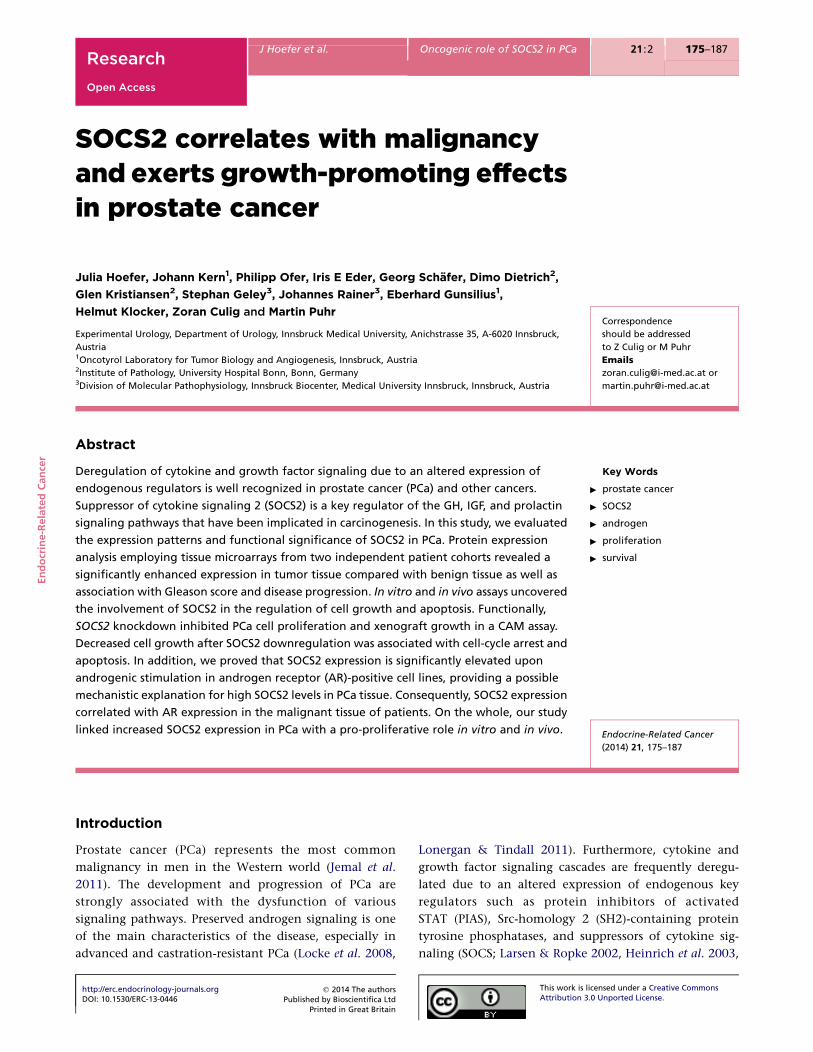
5 days on the CAM (Fig. 4A and D). Immunohistochemical
staining revealed a reduced SOCS2 expression in the
tumor cells as well as a significant decrease in the proportion
of Ki67-positive cells (Fig. 4B and C).
SOCS2 knockdown leads to cell-cycle arrest and
increased apoptosis
To elucidate the mechanism underlying the decreased
cell growth after SOCS2 downregulation, we measured
Published by Bioscientifica Ltd.

131211109876543210
300
200
Per
cent
age
of S
OC
S2
met
hyla
tion
75
50
25
0
131211109876543210
100
90
Rel
apse
-fre
e su
rviv
al (
%)
80
70
SOCS2 low
0.0 50.0 100.0 150.0 200.0
Follow-up time (months)
Benign Cancer BPH PIN
SOCS2 highCensored(end of follow-up)
60
50
SO
CS
2 st
aini
ng (
scor
e/pa
tient
)
SO
CS
2 st
aini
ng(s
core
/pat
ient
)
Benign
Correlations
Correlation coefficient 0.357**
Significance (two-sided) 0.001
84N
SOCS2 staining
Gleason score
Benign
A
C
D
E F
G
B
Benign Bone Lymph node
Metastases
Low GSC High GSC
Bone
SOCS2
SO
CS
2/T
BP
(2–∆
Ct)
GAPDH
Lymph node
PM151T
25.022.520.017.515.012.510.07.55.02.50.0
EP156T RWPE-1
Low GSC High GSC
Malignant
***
******
******
*
*
n=75 n=84
n=75
n=24
n=20
n=25
n=2
n=63 n=21 n=10 n=10
Figure 1
SOCS2 expression increases with malignancy and inversely correlates with
relapse-free survival. (A) SOCS2 immunostaining of a benign prostate gland
showing high SOCS2 expression in epithelial cells. Scale bar: 100 mm.
(B) qRT-PCR data and representative western blots of three benign prostate
cell lines: PM151T (stromal), EP156T (basal epithelial), and RWPE-1 (luminal
epithelial). (C) Immunohistochemical SOCS2 staining of representative
tissue samples of the Innsbruck-TMAs. Scale bar: 100 mm. (D) Statistical
analysis of the Innsbruck-TMAs. Low Gleason: Gleason patterns 3C4 or
below. High Gleason: Gleason patterns 4C3 or above. Box–Whiskers plot
represents median values and 10–90 percentiles (*P!0.05 and ***P!0.001;
Mann–Whitney U test). GSC, Gleason score. (E) Pearson’s correlation
analysis results for SOCS2 and Gleason score in malignant tissue samples of
the TMA. (F) Kaplan–Meier curve assessment of relapse-free survival,
defined as time to PSA progression, in patients exhibiting a low SOCS2
expression (N(total)Z52; N(relapse)Z5) vs patients exhibiting a high SOCS2
expression (N(total)Z30; N(relapse)Z7). High SOCS2 expression represents
samples with SOCS2 staining score R6 according to the ‘quickscore
method’ (*P!0.05; log-rank test). (G) Methylation status of the SOCS2
gene locus was determined by qRT-PCR using methylation-specific primers.
Results were normalized to b-actin and represent mean values.
Endocrine-RelatedCancer
Research J Hoefer et al. Oncogenic role of SOCS2 in PCa 21 :2 179
http://erc.endocrinology-journals.orgDOI: 10.1530/ERC-13-0446
q 2014 The authorsPrinted in Great Britain
Published by Bioscientifica Ltd.

7.5A
B
C
5.0
2.5
0.0
0.90.80.70.60.50.40.30.20.10.0
SO
CS
2/T
BP
(2–∆
Ct )
SO
CS
2/G
AP
DH
PM151T EP156T RWPE-1 BPH-1 LNCaP 22RV1 LAPC4 DUCaP DUCaP-R VCaP PC3 DU145
PM151T
SOCS2
GAPDH
SOCS2
GAPDH
Lamin A
PC3
WCL Cytoplasm Nucleus WCL Cytoplasm Nucleus
LNCaP
EP156T RWPE-1 BPH-1 LNCaP 22RV1 LAPC4 DUCaP DUCaP-R VCaP PC3 DU145
Figure 2
SOCS2 is expressed in the cytoplasm of prostate cell lines. (A) SOCS2 mRNA
and (B) SOCS2 protein expression in benign and malignant prostate
cell lines was assessed by qRT-PCR and western blotting respectively.
Data represent mean values of three independent experiments. (C) SOCS2
subcellular localization was determined by western blotting after
cytoplasmic and nuclear fractionation of PC3 and LNCaP cell lysates.
Endocrine-RelatedCancer
Research J Hoefer et al. Oncogenic role of SOCS2 in PCa 21 :2 180
apoptosis and cell-cycle distribution. The percentage of
apoptotic cells was slightly increased in PC3 and DU145
cells after SOCS2 silencing compared with the control
cells. However, LNCaP cells were more sensitive and
displayed a 40% apoptosis rate after SOCS2 knockdown
(Fig. 5A). These findings were confirmed by the measure-
ment of cleaved PARP (cPARP) levels by western blotting.
As expected, LNCaP shSOCS2 cells exhibited a massive
increase in cPARP levels compared with the respective
controls, while this effect was less distinct in PC3 and
DU145 cells (Fig. 5B). To further uncover the molecular
basis for altered cell proliferation after SOCS2 knockdown,
we analyzed cell-cycle distribution in the control as well as
shSOCS2 cells. As has been mentioned above, LNCaP
cell line responded with a massive increase in the subG1
proportion, which represents the apoptotic population
(Supplementary Figure 3, see section on supplementary
data given at the end of this article). However, we observed
an altered cell-cycle distribution pattern in PC3 and
DU145 cells after SOCS2 downregulation compared with
the control cells (Fig. 5C). Statistical analysis revealed
http://erc.endocrinology-journals.orgDOI: 10.1530/ERC-13-0446
q 2014 The authorsPrinted in Great Britain
an S-phase growth arrest in SOCS2-depleted PC3 and
DU145 cells and in addition an increase in the percentage
of G2/M-phase cells in PC3 shSOCS2 cell line. The G0/G1-
phase proportion was significantly decreased in both cell
lines after SOCS2 knockdown (Fig. 5D).
SOCS2 expression is upregulated by androgens
Finally, we aimed to provide a possible explanation for the
significantly increased SOCS2 expression in the malignant
tissue of PCa patients. AR is able to activate STAT5 (Tan
et al. 2008), which in turn has been shown to upregulate
SOCS2 in head-and-neck squamous cell carcinoma
(HNSCC; Sen et al. 2011). Therefore, we hypothesized
that SOCS2 expression might be influenced upon andro-
genic stimulation in PCa. To address this issue, we used
Affymetrix GeneChip expression data of LNCaP, DUCaP,
and VCaP cells cultured in the absence or presence of
R1881. SOCS2 was identified as an androgen-regulated
gene (Fig. 6A). We confirmed this finding also at the
mRNA and protein levels, demonstrating androgenic
Published by Bioscientifica Ltd.

shLuc
–Dox
– Dox + Dox
125
100
75
50
Per
cent
age
prol
ifera
tion
25
0
125
150
100
75
50P
erce
ntag
e pr
olife
ratio
n25
0
125
150
100
75
50
Per
cent
age
prol
ifera
tion
25
0
125
100
75
50
Per
cent
age
viab
ility
+ D
oxyc
yclin
e–
Dox
ycyc
line
25
0
125
150
100
75
50
Per
cent
age
viab
ility
25
0
125
150
100
75
50
Per
cent
age
viab
ility
25
0
+ – + – + – + – + – + – + – + – +
shSOCS2-1
SOCS2
GAPDH
shSOCS2-3
shLuc shSOCS2-1 shSOCS2-3 shLuc shSOCS2-1 shSOCS2-3 shLuc shSOCS2-1 shSOCS2-3
PC3A
B
C
D
shLuc shSOCS2-1 shSOCS2-3 shLuc shSOCS2-1 shSOCS2-3
shLuc shSOCS2-1 shSOCS2-3 shLuc shSOCS2-1 shSOCS2-3 shLuc shSOCS2-1
shLuc shSOCS2-1shLuc shSOCS2-1shLuc shSOCS2-1
shSOCS2-3
DU145 LNCaP
PC3
****
**** *** ***
****
** *** *****
****** ***
DU145 LNCaP
PC3 DU145 LNCaP
PC3 DU145 LNCaP
– Dox + Dox – Dox + Dox
– Dox + Dox – Dox + Dox – Dox + Dox
Figure 3
SOCS2 downregulation decelerates cell growth. (A) SOCS2 downregulation
after stable transfection of PC3, DU145, and LNCaP cells with doxycycline-
inducible shRNA sequences against SOCS2 (shSOCS2-1 and shSOCS2-3) or
luciferase (shLuc). A representative western blot after 6 days of doxycycline
treatment is shown. (B) Proliferation after SOCS2 downregulation
was assessed by the measurement of [3H]thymidine incorporation.
Data represent meansGS E M. from three independent experiments
(*P!0.05; **P!0.01; and ***P!0.001; t-test). (C) Colony formation
ability was measured by clonogenic assay. (D) Viability after SOCS2
downregulation was measured using WST reagent. Data represent
meansGS E M from three independent experiments (*P!0.05; **P!0.01;
and ***P!0.001; t-test).
Endocrine-RelatedCancer
Research J Hoefer et al. Oncogenic role of SOCS2 in PCa 21 :2 181
SOCS2 upregulation in a dose-dependent manner in
LNCaP cells. Furthermore, treatment with the anti-
androgen bicalutamide was sufficient to reverse this effect
(Fig. 6B). Androgen-induced SOCS2 expression increase
was in addition time dependent and peaked between 8 and
http://erc.endocrinology-journals.orgDOI: 10.1530/ERC-13-0446
q 2014 The authorsPrinted in Great Britain
24 h in LNCaP, DUCaP, and VCaP cells (Fig. 6C). To
further confirm androgen responsiveness of SOCS2, we
expected that androgen withdrawal would result in a
diminished SOCS2 expression. Hence, we depleted LAPC4
cells, which are usually grown in a medium containing
Published by Bioscientifica Ltd.
PC3 shLuc
– DoxycyclineA C
DB
+ Doxycycline
600
500
400
300
200
100
0
– Dox + Dox
8
Tum
or a
rea
(mm
2 ) 7
6
5
4
3
2
1
0
PC3 shSOCS2-1 PC3 shLuc
shLuc
PC3
Ki6
7 st
aini
ng(K
i67+
cel
ls/m
m2
tum
or s
ectio
n)
******
******
PC3
PC3 shSOCS2-1
shSOCS2-1
shLuc shSOCS2-1
PC3 shLuc
– Doxycycline + Doxycycline
500 µm
100 µm
PC3 shSOCS2-1 PC3 shLuc PC3 shSOCS2-1
GF
PK
i67
SO
CS
2B
right
fiel
d
– Dox + Dox
Figure 4
SOCS2 expression influences tumor growth in vivo. (A) Bright-field and
fluorescence pictures of representative tumors obtained in a CAM assay.
Before engraftment, the cells were pretreated with or without doxycycline
for 6 days. (B) Immunohistochemical staining of tumor cross-sections for
Ki67 and SOCS2. (C and D) Statistical analysis of Ki67-positive cells/cm2
tumor cross-section (C) and tumor area (D) of the CAM onplants.
Data represent meansGS.D. of five onplants/treatment, done in two
independent experiments (*P!0.05 and ***P!0.001; t-test).
Endocrine-RelatedCancer
Research J Hoefer et al. Oncogenic role of SOCS2 in PCa 21 :2 182
DHT. As expected, we observed a significantly decreased
SOCS2 expression in cells grown in the steroid-free
medium, compared with cells cultured in the presence of
DHT (Fig. 6D). Finally, we were able to translate these
findings to the patients, demonstrating a significant
correlation between SOCS2 and AR expression in patient
samples (Fig. 6E).
Discussion
Deregulation of endogenous feedback inhibitors of JAK/
STAT signaling is well recognized in PCa and other
cancers. We have previously demonstrated that SOCS1,
SOCS3, and PIAS1 are upregulated in prostate tumors
compared with benign tissue and have fundamental roles
in proliferation and apoptosis (Neuwirt et al. 2009, Puhr
et al. 2009, Hoefer et al. 2012). SOCS2 is hypermethylated
in ovarian and breast cancers, in which its reduced
expression is associated with the activation of STAT3,
indicating an increased cytokine responsiveness in these
tumors (Sutherland et al. 2004). SOCS2 mRNA has been
found to be downregulated in pulmonary cancer, hepato-
cellular cancer and PCa (Wikman et al. 2002, Hendriksen
et al. 2006, Qiu et al. 2013). On the other hand, SOCS2 acts
as an oncogene in advanced stages of chronic myeloid
http://erc.endocrinology-journals.orgDOI: 10.1530/ERC-13-0446
q 2014 The authorsPrinted in Great Britain
leukemia as well as in precursors of anal cancer, where
it is significantly upregulated (Arany et al. 2001,
Schultheis et al. 2002). However, other studies that have
investigated SOCS2 in PCa have addressed different
aspects of SOCS2 function and have been carried out
under different experimental conditions (Hendriksen et al.
2006, Iglesias-Gato et al. 2013, Zhu et al. 2013).
In the present study, we investigated SOCS2
expression patterns in benign and low- and high-Gleason
score tumor samples as well as in prostate cell lines.
Differences between SOCS2 mRNA and protein levels
observed in the cell lines are not surprising, because
SOCS2 protein is highly unstable as a consequence of
active degradation (Siewert et al. 1999). In tissue samples,
we detected significantly increased SOCS2 levels in
malignant areas and were furthermore able to positively
correlate SOCS2 expression with increasing Gleason
scores. In addition, we could demonstrate that patients
with a high SOCS2 expression are more likely to
experience biochemical tumor relapse. These findings are
partially in line with those of a recent study (Zhu et al.
2013), which identified an increased SOCS2 expression in
malignant vs benign tissue. However, in contrast to our
findings, that study observed a significant upregulation
only in low-Gleason score tumors, whereas in
Published by Bioscientifica Ltd.

555045
Per
cent
age
ofsu
bG1
cells
– D
oxyc
yclin
eC
ount
s
Cou
nts
FL2 area FL2 area FL2 area FL2 area
FL2 area FL2 area FL2 area FL2 area
Cou
nts
Cou
nts
Cou
nts
Per
cent
age
of c
ells
+ D
oxyc
yclin
e
Per
cent
age
ofsu
bG1
cells
Per
cent
age
ofsu
bG1
cells40
353025201510
50
160
120
80
40
00 200 400 600 0 200 400 600 0 200 400 600 0 200 400 600
0 200 400 6000 200 400 6000 200 400 6000 200 400 600
160
120G0/G1PC3 DU145
SG2/M
G0/G1SG2/M100
80
60
40
20
0
Per
cent
age
of c
ells
120
100
80
60
40
20
0
120
80
40
0
Cou
nts
160
120
80
40
0
Cou
nts
160
120
80
40
0
Cou
nts
160
120
80
40
0
160
120
80
40
0
160
120
80
40
0
160
120
80
40
0
5550454035302520151050
5550454035302520151050
PC3A
B
C
D
PC3
*** ***
**
shLuc– Dox
DoxcPARP
GAPDH
+ Dox
shLuc– + – + – + – + – + – +
shSOCS2-1
shSOCS2-1
shLuc shSOCS2-1
shLuc
– + – +Dox
shSOCS2-1
** **
**
**
*
shLuc
– + – +Dox
shSOCS2-1
shLuc shSOCS2-1
shLuc shLucshSOCS2-1 shSOCS2-1
shLuc shSOCS2-1 shLuc shSOCS2-1
DU145
DU145
LNCaP
– Dox + Dox – Dox + Dox
Figure 5
SOCS2 expression influences apoptosis and cell-cycle progression. (A and B)
Apoptosis after SOCS2 downregulation was assessed by flow cytometry
after PI staining (A), as well as cPARP measurement by western blotting (B)
after 6 days of doxycycline treatment. Data represent meansGS.E.M. from
three independent experiments (**P!0.01 and ***P!0.001; t-test).
(C) Representative histograms and (D) statistical analysis of cell-cycle
distribution after SOCS2 downregulation as measured by flow
cytometry. Data represent meansGS.E.M. from three independent
experiments (**P!0.01; and ***P!0.001; t-test).
Endocrine-RelatedCancer
Research J Hoefer et al. Oncogenic role of SOCS2 in PCa 21 :2 183
http://erc.endocrinology-journals.orgDOI: 10.1530/ERC-13-0446
q 2014 The authorsPrinted in Great Britain
Published by Bioscientifica Ltd.

Endocrine-RelatedCancer
Research J Hoefer et al. Oncogenic role of SOCS2 in PCa 21 :2 184
high-Gleason score tumors only a trend toward a high
SOCS2 expression was observed. SOCS2 expression was
found to be associated with longer relapse-free survival.
Besides ethnic differences, a diverse designation of tumors
into low- and high-Gleason score groups, as well as
different IHC scoring methods, might explain these
discrepancies. As SOCS2 is an androgen-regulated gene,
ethnic differences between the study populations may be
important for the analysis of data. Although more studies
comparing AR target gene expression in different ethnic
groups have to be carried out, one can expect that
differences occur in certain tumor subgroups as a
consequence of dissimilar AR transcriptional activities.
Nevertheless, the generally elevated SOCS levels found
in PCa were consistently observed in two independent
patient cohorts. Furthermore, it should be mentioned
that Iglesias-Gato et al. have very recently reported a
higher SOCS2 immunoreactivity in parallel with a Gleason
score increase in a Swedish population (2013).
In concordance with the tissue expression profile, our
functional assays point to a potential growth-promoting
activity of SOCS2 in PCa. First, SOCS2 downregulation
leads to a significantly diminished tumor growth in vivo.
Secondly, SOCS2 knockdown results in a substantial
decrease in cell proliferation and clonogenicity in AR-
negative and -positive cell lines. We could link this
growth inhibition to S-phase and G2/M-phase cell-cycle
10A
C
B
8
6
SO
CS
2re
lativ
e ex
pres
sion
SO
CS
2/T
BP
(2–∆
Ct)
4
2
0LNCaP
– 0.1 nM 1 nM 1 nM10 nM5 µM 5 µM– – – –
–
DUCaP VCaP
LNCaP
************
*** ***
***
*****
*
*
**
**Ctrl
Ctrl8 h R188124 h R1881
SOCS2
GAPDH
SOCS2
GAPDH
SOCS2
GAPDH
SOCS2
GAPDH
8 h 24
DU76543210
R1881Bic
SO
CS
2/T
BP
(2–∆
Ct) 7
8
6
5
4
3
2
1
0
Figure 6
SOCS2 is upregulated upon androgenic stimulation. (A) Affymetrix data
of R1881-treated LNCaP, DUCaP, and VCaP cells (***P!0.001; t-test).
(B) qRT-PCR data and representative western blot of LNCaP cells treated
with increasing concentrations of R1881 and bicalutamide (Bic) or a
combination of both for 24 h. Data represent mean values of three
independent experiments (*P!0.05; **P!0.01; t-test). (C) qRT-PCR data
and representative western blots of LNCaP, DUCaP, and VCaP cells treated
with 1 nM of R1881 for 8, 24, 48, and 72 h. Data represent mean values of
http://erc.endocrinology-journals.orgDOI: 10.1530/ERC-13-0446
q 2014 The authorsPrinted in Great Britain
arrests with a slight increase in apoptosis in AR-negative
PC3 and DU145 cells. Interestingly, SOCS2-depleted
LNCaP cells exhibit a dramatic increase in apoptosis,
suggesting an additional role for SOCS2 in AR-positive
cells, which renders them more sensitive to SOCS2
knockdown.
The concept of SOCS2 as a growth promoter rather
than as an inhibitor is supported by data obtained from
other studies. Both Socs2 knockout and transgenic mice
display gigantism (Metcalf et al. 2000, Greenhalgh et al.
2002). This observation can be explained by the circum-
stance that SOCS2 plays a dual role in growth regulation,
depending on its concentration. At low levels, SOCS2
inhibits several cascades such as GH, prolactin, and IL
signaling, whereas at high levels, SOCS2 restores or
potentiates responsiveness to these growth factors (Favre
et al. 1999, Pezet et al. 1999, Tannahill et al. 2005,
Piessevaux et al. 2006). In this context, SOCS2 has been
demonstrated to enhance GH, IL2, and IL3 signals and
subsequent proliferation via proteasomal degradation of
other SOCS members, thereby overcoming their inhibi-
tory effects (Favre et al. 1999, Tannahill et al. 2005). These
findings suggest SOCS2 to be a positive regulator of
proliferation when expressed at high levels. PCa is
characterized by the deregulation of several signaling path-
ways including GH, prolactin, IL6, and the IGF/insulin
axis (Roberts 2004, Monti et al. 2007, Cox et al. 2009,
D
E
***
***
****
**
Ctrl
Ctrl8 h R188124 h R1881
48 h R1881
72 h R1881
SOCS2
Correlations
SOCS2 staining
Correlation coefficient 0.561**
Significance(two-sided)
0.00000004
82N
AR staining
GAPDH h 48 h
48 h
72 h
72 h
LNC
aP
CaP
DU
CaP
VCaP
VC
aP
SO
CS
2/T
BP
(2–∆
Ct)
1.25
1.00
0.75
0.50
0.25
0.00
three independent experiments (*P!0.05; **P!0.01; and ***P!0.001;
t-test). (D) qRT-PCR data and representative western blot of LAPC4 cells
grown in steroid-free medium with the addition of 100 nM dihydrotes-
tosterone (DHT) (ctrl) or after 24 or 48 h of DHT depletion. Data represent
mean values of three independent experiments (**P!0.01; ***P!0.001,
t-test). (E) Pearson’s correlation analysis results for SOCS2 and AR staining in
malignant tissue samples of the TMA.
Published by Bioscientifica Ltd.
Endocrine-RelatedCancer
Research J Hoefer et al. Oncogenic role of SOCS2 in PCa 21 :2 185
Culig 2011, Goffin et al. 2011, Culig & Puhr 2012,
Nakonechnaya et al. 2013), which can induce SOCS2
expression (Trengove & Ward 2013). We therefore
hypothesize that in PCa SOCS2 is generally highly
expressed as a consequence of these oncogenic events
and thus acts as an accelerator of proliferative signals in
this disease. Hence, it is not surprising that SOCS2
knockdown in PCa cells resulted in growth inhibition.
In addition, we proved that SOCS2 is upregulated
by androgens in AR-positive cell lines. SOCS2 is induced
upon androgenic stimulation in a dose- and time-
dependent manner at both mRNA and protein levels.
Androgen responsiveness of SOCS2 was further confirmed
in an experimental setting, where androgens were
depleted. Although we cannot exclude alternative
mechanisms, a regulation via STAT5 might be a possible
explanation. AR increases the transcriptional activity of
STAT5 and vice versa (Tan et al. 2008). STAT5 has been
shown to stimulate SOCS2 expression in HNSCC (Sen et al.
2011). Furthermore, SOCS2 has been identified as a direct
STAT5 target in the liver (Vidal et al. 2007). On the basis
of these data and our results, we hypothesize that in
AR-positive cells SOCS2 expression is increased due to
STAT5 activation following androgen stimulation. This
mechanism provides a possible explanation for the
elevated SOCS2 expression in prostate tumors, which
frequently harbor a highly active androgen signaling
(Buchanan et al. 2001, Lonergan & Tindall 2011).
While this manuscript was in preparation, Iglesias-
Gato et al. (2013) reported that SOCS2 antagonizes the
oncogenic events caused by GH in PCa. It should be
mentioned that differences in the results of the two studies
may be explained by the presence or absence of GH in the
experiments carried out. In the present study, all the
experiments were carried out in cells not treated with
GH. On the whole, our study is the first to link increased
SOCS2 expression in tissue samples of PCa patients with a
growth-promoting role for SOCS2 in vitro and in vivo.
Furthermore, we demonstrated androgen responsiveness
of SOCS2 in AR-positive cell lines, providing a mechanistic
explanation for the high SOCS2 expression in PCa via
androgenic stimulation. These findings render SOCS2 an
interesting candidate for further investigations to clarify
specific pathways involved in SOCS2-mediated effects on
PCa cell growth.
Supplementary data
This is linked to the online version of the paper at http://dx.doi.org/10.1530/
ERC-13-0446.
http://erc.endocrinology-journals.orgDOI: 10.1530/ERC-13-0446
q 2014 The authorsPrinted in Great Britain
Declaration of interest
The authors declare that there is no conflict of interest that could be
perceived as prejudicing the impartiality of the research reported.
Funding
This work was funded by the Austrian Cancer Society/Tirol, the intramural
funding program of the Medical University of Innsbruck for young
scientists MUI-START, Project 2010012007, and FWF grant P 25639-B19
(to M Puhr), and FWF grant W1101 (to Z Culig).
Author contribution statement
J Hoefer carried out all the in vitro experiments except the Affymetrix
analysis and wrote the manuscript. J Kern and E Gunsilius carried out and
analyzed the CAM assay. P Ofer established shSOCS2 and shLuc LNCaP cell
lines. I E Eder and J Rainer conducted the Affymetrix experiment. G Schafer
scored IHC of the Innsbruck-TMA in cooperation with MP. D Dietrich and
G Kristiansen planned and coordinated the methylation analysis and IHC
staining of the Bonn-TMA. S Geley cloned the plasmids for shRNA
transfection. H Klocker was responsible for the generation of the
Innsbruck-TMA. Z Culig supervised J Hoefer and helped writing the
manuscript. M Puhr supervised J Hoefer, established shSOCS2 and shLuc
PC3 and DU145 cell lines, organized the in vivo experiments, analyzed the
Innsbruck-TMA and helped writing the manuscript. In addition, all the
co-authors improved the manuscript and approved its final version. M Puhr
and Z Culig are joint corresponding authors.
Acknowledgements
The authors thank Irma Sottsas, Karin Unterberger, Seher Aktekin, and
Magda Rohler for generation and IHC staining of the TMAs, Dr Verena
Seiler for scoring the Bonn-TMA, Cornelia Heis for IHC staining of the CAM
tumors, Veronika Rauch for help with viral infections, and Eberhard Steiner
for statistical analyses of patient data.
References
Arany I, Muldrow M & Tyring SK 2001 The endogenous interferon
system in anal squamous epithelial lesions with different grades from
HIV-positive individuals. International Journal of STD & AIDS 12
229–233. (doi:10.1258/0956462011922977)
Armstrong PB, Quigley JP & Sidebottom E 1982 Transepithelial invasion
and intramesenchymal infiltration of the chick embryo
chorioallantois by tumor cell lines. Cancer Research 42 1826–1837.
Bellezza I, Neuwirt H, Nemes C, Cavarretta IT, Puhr M, Steiner H, Minelli A,
Bartsch G, Offner F, Hobisch A et al. 2006 Suppressor of cytokine
signaling-3 antagonizes cAMP effects on proliferation and apoptosis
and is expressed in human prostate cancer. American Journal of Pathology
169 2199–2208. (doi:10.2353/ajpath.2006.060171)
Buchanan G, Irvine RA, Coetzee GA & Tilley WD 2001 Contribution of
the androgen receptor to prostate cancer predisposition and
progression. Cancer Metastasis Reviews 20 207–223. (doi:10.1023/
A:1015531326689)
Cox ME, Gleave ME, Zakikhani M, Bell RH, Piura E, Vickers E, Cunningham M,
Larsson O, Fazli L & Pollak M 2009 Insulin receptor expression by
human prostate cancers. Prostate 69 33–40. (doi:10.1002/pros.20852)
Croker BA, Kiu H & Nicholson SE 2008 SOCS regulation of the JAK/STAT
signalling pathway. Seminars in Cell & Developmental Biology 19
414–422. (doi:10.1016/j.semcdb.2008.07.010)
Published by Bioscientifica Ltd.

Endocrine-RelatedCancer
Research J Hoefer et al. Oncogenic role of SOCS2 in PCa 21 :2 186
Culig Z 2011 Cytokine disbalance in common human cancers. Biochimica et
Biophysica Acta 1813 308–314. (doi:10.1016/j.bbamcr.2010.12.010)
Culig Z 2013 Suppressors of cytokine signalling-3 and -1 in human
carcinogenesis. Frontiers in Bioscience 5 277–283. (doi:10.2741/S372)
Culig Z & Puhr M 2012 Interleukin-6: a multifunctional targetable cytokine
in human prostate cancer. Molecular and Cellular Endocrinology 360
52–58. (doi:10.1016/j.mce.2011.05.033)
Deryugina EI & Quigley JP 2008 Chapter 2. Chick embryo chorioallantoic
membrane models to quantify angiogenesis induced by inflammatory
and tumor cells or purified effector molecules. Methods in Enzymology
444 21–41.
Detre S, Saclani Jotti G & Dowsett M 1995 A "quickscore" method for
immunohistochemical semiquantitation: validation for oestrogen
receptor in breast carcinomas. Journal of Clinical Pathology 48 876–878.
(doi:10.1136/jcp.48.9.876)
Dey BR, Spence SL, Nissley P & Furlanetto RW 1998 Interaction of human
suppressor of cytokine signaling (SOCS)-2 with the insulin-like growth
factor-I receptor. Journal of Biological Chemistry 273 24095–24101.
(doi:10.1074/jbc.273.37.24095)
Dietrich D, Hasinger O, Liebenberg V, Field JK, Kristiansen G & Soltermann A
2012 DNA methylation of the homeobox genes PITX2 and SHOX2
predicts outcome in non-small-cell lung cancer patients. Diagnostic
Molecular Pathology 21 93–104. (doi:10.1097/PDM.0b013e318240503b)
Dutt SS & Gao AC 2009 Molecular mechanisms of castration-resistant
prostate cancer progression. Future Oncology 5 1403–1413.
(doi:10.2217/fon.09.117)
Endo TA, Masuhara M, Yokouchi M, Suzuki R, Sakamoto H, Mitsui K,
Matsumoto A, Tanimura S, Ohtsubo M, Misawa H et al. 1997 A new
protein containing an SH2 domain that inhibits JAK kinases. Nature
387 921–924. (doi:10.1038/43213)
Favre H, Benhamou A, Finidori J, Kelly PA & Edery M 1999 Dual effects
of suppressor of cytokine signaling (SOCS-2) on growth hormone
signal transduction. FEBS Letters 453 63–66. (doi:10.1016/
S0014-5793(99)00681-X)
Gentleman RC, Carey VJ, Bates DM, Bolstad B, Dettling M, Dudoit S, Ellis B,
Gautier L, Ge Y, Gentry J et al. 2004 Bioconductor: open software
development for computational biology and bioinformatics. Genome
Biology 5 R80. (doi:10.1186/gb-2004-5-10-r80)
Goffin V, Hoang DT, Bogorad RL & Nevalainen MT 2011 Prolactin
regulation of the prostate gland: a female player in a male game. Nature
Reviews. Urology 8 597–607. (doi:10.1038/nrurol.2011.143)
Greenhalgh CJ, Metcalf D, Thaus AL, Corbin JE, Uren R, Morgan PO, Fabri LJ,
Zhang JG, Martin HM, Willson TA et al. 2002 Biological evidence that
SOCS-2 can act either as an enhancer or suppressor of growth hormone
signaling. Journal of Biological Chemistry 277 40181–40184. (doi:10.1074/
jbc.C200450200)
Heinrich PC, Behrmann I, Haan S, Hermanns HM, Muller-Newen G &
Schaper F 2003 Principles of interleukin (IL)-6-type cytokine signalling
and its regulation. Biochemical Journal 374 1–20. (doi:10.1042/
BJ20030407)
Hendriksen PJ, Dits NF, Kokame K, Veldhoven A, van Weerden WM,
Bangma CH, Trapman J & Jenster G 2006 Evolution of the androgen
receptor pathway during progression of prostate cancer. Cancer Research
66 5012–5020. (doi:10.1158/0008-5472.CAN-05-3082)
Hoefer J, Schafer G, Klocker H, Erb HH, Mills IG, Hengst L, Puhr M & Culig Z
2012 PIAS1 is increased in human prostate cancer and enhances
proliferation through inhibition of p21. American Journal of Pathology
180 2097–2107. (doi:10.1016/j.ajpath.2012.01.026)
Iglesias-Gato D, Chuan YC, Wikstrom P, Augsten S, Jiang N, Niu Y, Seipel A,
Danneman D, Vermeij M, Fernandez-Perez L et al. 2013 SOCS2
mediates the crosstalk between androgen and growth hormone
signaling in prostate cancer. Carcinogenesis [in press].
Jemal A, Siegel R, Xu J & Ward E 2011 Cancer statistics 2010. CA:
A Cancer Journal for Clinicians 60 277–300. (doi:10.3322/caac.20073)
Kamura T, Sato S, Haque D, Liu L, Kaelin WG Jr, Conaway RC &
Conaway JW 1998 The Elongin BC complex interacts with the
http://erc.endocrinology-journals.orgDOI: 10.1530/ERC-13-0446
q 2014 The authorsPrinted in Great Britain
conserved SOCS-box motif present in members of the SOCS, ras,
WD-40 repeat, and ankyrin repeat families. Genes and Development 12
3872–3881. (doi:10.1101/gad.12.24.3872)
Kamura T, Maenaka K, Kotoshiba S, Matsumoto M, Kohda D, Conaway RC,
Conaway JW & Nakayama KI 2004 VHL-box and SOCS-box domains
determine binding specificity for Cul2-Rbx1 and Cul5-Rbx2 modules of
ubiquitin ligases. Genes and Development 18 3055–3065. (doi:10.1101/
gad.1252404)
Kogan I, Goldfinger N, Milyavsky M, Cohen M, Shats I, Dobler G, Klocker H,
Wasylyk B, Voller M, Aalders T et al. 2006 hTERT-immortalized prostate
epithelial and stromal-derived cells: an authentic in vitro model for
differentiation and carcinogenesis. Cancer Research 66 3531–3540.
(doi:10.1158/0008-5472.CAN-05-2183)
Kunzi-Rapp K, Genze F, Kufer R, Reich E, Hautmann RE & Gschwend JE
2001 Chorioallantoic membrane assay: vascularized 3-dimensional cell
culture system for human prostate cancer cells as an animal substitute
model. Journal of Urology 166 1502–1507. (doi:10.1016/S0022-
5347(05)65820-X)
Larsen L & Ropke C 2002 Suppressors of cytokine signalling: SOCS. APMIS:
Acta Pathologica, Microbiologica, et Immunologica Scandinavica 110
833–844. (doi:10.1034/j.1600-0463.2002.1101201.x)
Locke JA, Guns ES, Lubik AA, Adomat HH, Hendy SC, Wood CA, Ettinger SL,
Gleave ME & Nelson CC 2008 Androgen levels increase by intratumoral
de novo steroidogenesis during progression of castration-resistant
prostate cancer. Cancer Research 68 6407–6415. (doi:10.1158/
0008-5472.CAN-07-5997)
Lonergan PE & Tindall DJ 2011 Androgen receptor signaling in prostate
cancer development and progression. Journal of Carcinogenesis 10 20.
(doi:10.4103/1477-3163.83937)
Martowicz A, Rainer J, Lelong J, Spizzo G, Gastl G & Untergasser G 2013
EpCAM overexpression prolongs proliferative capacity of primary
human breast epithelial cells and supports hyperplastic growth.
Molecular Cancer 12 56. (doi:10.1186/1476-4598-12-56)
Metcalf D, Greenhalgh CJ, Viney E, Willson TA, Starr R, Nicola NA, Hilton DJ
& Alexander WS 2000 Gigantism in mice lacking suppressor of cytokine
signalling-2. Nature 405 1069–1073. (doi:10.1038/35016611)
Monti S, Proietti-Pannunzi L, Sciarra A, Lolli F, Falasca P, Poggi M, Celi FS &
Toscano V 2007 The IGF axis in prostate cancer. Current Pharmaceutical
Design 13 719–727. (doi:10.2174/138161207780249128)
Naka T, Narazaki M, Hirata M, Matsumoto T, Minamoto S, Aono A,
Nishimoto N, Kajita T, Taga T, Yoshizaki K et al. 1997 Structure and
function of a new STAT-induced STAT inhibitor. Nature 387 924–929.
(doi:10.1038/43219)
Nakonechnaya AO, Jefferson HS, Chen X & Shewchuk BM 2013 Differential
effects of exogenous and autocrine growth hormone on LNCaP prostate
cancer cell proliferation and survival. Journal of Cellular Biochemistry
114 1322–1335. (doi:10.1002/jcb.24473)
Neuwirt H, Puhr M, Cavarretta IT, Mitterberger M, Hobisch A & Culig Z
2007 Suppressor of cytokine signalling-3 is up-regulated by androgen in
prostate cancer cell lines and inhibits androgen-mediated proliferation
and secretion. Endocrine-Related Cancer 14 1007–1019. (doi:10.1677/
ERC-07-0172)
Neuwirt H, Puhr M, Santer FR, Susani M, Doppler W, Marcias G, Rauch V,
Brugger M, Hobisch A, Kenner L et al. 2009 Suppressor of cytokine
signaling (SOCS)-1 is expressed in human prostate cancer and exerts
growth-inhibitory function through down-regulation of cyclins and
cyclin-dependent kinases. American Journal of Pathology 174
1921–1930. (doi:10.2353/ajpath.2009.080751)
Pezet A, Favre H, Kelly PA & Edery M 1999 Inhibition and restoration of
prolactin signal transduction by suppressors of cytokine signaling.
Journal of Biological Chemistry 274 24497–24502. (doi:10.1074/
jbc.274.35.24497)
Pfeiffer MJ, Mulders PF & Schalken JA 2010 An in vitro model for
preclinical testing of endocrine therapy combinations for prostate
cancer. Prostate 70 1524–1532. (doi:10.1002/pros.21187)
Published by Bioscientifica Ltd.

Endocrine-RelatedCancer
Research J Hoefer et al. Oncogenic role of SOCS2 in PCa 21 :2 187
Pierconti F, Martini M, Pinto F, Cenci T, Capodimonti S, Calarco A, Bassi PF
& Larocca LM 2011 Epigenetic silencing of SOCS3 identifies a subset
of prostate cancer with an aggressive behavior. Prostate 71 318–325.
(doi:10.1002/pros.21245)
Piessevaux J, Lavens D, Montoye T, Wauman J, Catteeuw D,
Vandekerckhove J, Belsham D, Peelman F & Tavernier J 2006
Functional cross-modulation between SOCS proteins can stimulate
cytokine signaling. Journal of Biological Chemistry 281 32953–32966.
(doi:10.1074/jbc.M600776200)
Puhr M, Santer FR, Neuwirt H, Susani M, Nemeth JA, Hobisch A, Kenner L &
Culig Z 2009 Down-regulation of suppressor of cytokine signaling-3
causes prostate cancer cell death through activation of the extrinsic
and intrinsic apoptosis pathways. Cancer Research 69 7375–7384.
(doi:10.1158/0008-5472.CAN-09-0806)
Puhr M, Santer FR, Neuwirt H, Marcias G, Hobisch A & Culig Z 2010 SOCS-3
antagonises the proliferative and migratory effects of fibroblast growth
factor-2 in prostate cancer by inhibition of p44/p42 MAPK signalling.
Endocrine-Related Cancer 17 525–538. (doi:10.1677/ERC-10-0007)
Qiu X, Zheng J, Guo X, Gao X, Liu H, Tu Y & Zhang Y 2013 Reduced
expression of SOCS2 and SOCS6 in hepatocellular carcinoma correlates
with aggressive tumor progression and poor prognosis. Molecular and
Cellular Biochemistry 378 99–106. (doi:10.1007/s11010-013-1599-5)
Rainer J, Lelong J, Bindreither D, Mantinger C, Ploner C, Geley S & Kofler R
2012 Research resource: transcriptional response to glucocorticoids in
childhood acute lymphoblastic leukemia. Molecular Endocinology 26
178–193. (doi:10.1210/me.2011-1213)
Rico-Bautista E, Flores-Morales A & Fernandez-Perez L 2006 Suppressor
of cytokine signaling (SOCS) 2, a protein with multiple functions.
Cytokine & Growth Factor Reviews 17 431–439. (doi:10.1016/j.cytogfr.
2006.09.008)
Roberts CT Jr 2004 IGF-1 and prostate cancer. Novartis Foundation
Symposium 262 193–199 discussion 199-204, 265-198.
Rui L, Yuan M, Frantz D, Shoelson S & White MF 2002 SOCS-1 and SOCS-3
block insulin signaling by ubiquitin-mediated degradation of IRS1 and
IRS2. Journal of Biological Chemistry 277 42394–42398. (doi:10.1074/
jbc.C200444200)
Ryo A, Suizu F, Yoshida Y, Perrem K, Liou YC, Wulf G, Rottapel R, Yamaoka S
& Lu KP 2003 Regulation of NF-kappaB signaling by Pin1-dependent
prolyl isomerization and ubiquitin-mediated proteolysis of p65/RelA.
Molecular Cell 12 1413–1426. (doi:10.1016/S1097-2765(03)00490-8)
Sadowski CL, Choi TS, Le M, Wheeler TT, Wang LH & Sadowski HB 2001
Insulin induction of SOCS-2 and SOCS-3 mRNA expression in C2C12
skeletal muscle cells is mediated by Stat5*. Journal of Biological Chemistry
276 20703–20710. (doi:10.1074/jbc.M101014200)
Saw CL, Heng PW & Liew CV 2008 Chick chorioallantoic membrane
as an in situ biological membrane for pharmaceutical formulation
development: a review. Drug Development and Industrial Pharmacy 34
1168–1177. (doi:10.1080/03639040801974295)
Schultheis B, Carapeti-Marootian M, Hochhaus A, Weisser A, Goldman JM
& Melo JV 2002 Overexpression of SOCS-2 in advanced stages of
chronic myeloid leukemia: possible inadequacy of a negative feedback
mechanism. Blood 99 1766–1775. (doi:10.1182/blood.V99.5.1766)
Sen B, Peng S, Woods DM, Wistuba I, Bell D, El-Naggar AK, Lai SY &
Johnson FM 2011 STAT5A-mediated SOCS2 expression regulates Jak2
and STAT3 activity following c-Src inhibition in head and neck
squamous carcinoma. Clinical Cancer Research 18 127–139.
(doi:10.1158/1078-0432.CCR-11-1889)
Siewert E, Muller-Esterl W, Starr R, Heinrich PC & Schaper F 1999 Different
protein turnover of interleukin-6-type cytokine signalling components.
http://erc.endocrinology-journals.orgDOI: 10.1530/ERC-13-0446
q 2014 The authorsPrinted in Great Britain
European Journal of Biochemistry 265 251–257. (doi:10.1046/
j.1432-1327.1999.00719.x)
Sigl R, Wandke C, Rauch V, Kirk J, Hunt T & Geley S 2009 Loss of the
mammalian APC/C activator FZR1 shortens G1 and lengthens S phase
but has little effect on exit from mitosis. Journal of Cell Science 122
4208–4217. (doi:10.1242/jcs.054197)
Singh N, Hussain S, Bharadwaj M, Kakkar N, Singh SK & Sobti RC 2012
Overexpression of signal transducer and activator of transcription
(STAT-3 and STAT-5) transcription factors and alteration of suppressor
of cytokine signaling (SOCS-1) protein in prostate cancer. Journal of
Receptors and Signal Transduction Research 32 321–327. (doi:10.3109/
10799893.2012.733885)
Starr R, Willson TA, Viney EM, Murray LJ, Rayner JR, Jenkins BJ, Gonda TJ,
Alexander WS, Metcalf D, Nicola NA et al. 1997 A family of cytokine-
inducible inhibitors of signalling. Nature 387 917–921. (doi:10.1038/
43206)
Sutherland KD, Lindeman GJ, Choong DY, Wittlin S, Brentzell L, Phillips W,
Campbell IG & Visvader JE 2004 Differential hypermethylation of
SOCS genes in ovarian and breast carcinomas. Oncogene 23 7726–7733.
(doi:10.1038/sj.onc.1207787)
Taizi M, Deutsch VR, Leitner A, Ohana A & Goldstein RS 2006 A novel
and rapid in vivo system for testing therapeutics on human leukemias.
Experimental Hematology 34 1698–1708. (doi:10.1016/j.exphem.
2006.07.005)
Tan SH & Nevalainen MT 2008 Signal transducer and activator of
transcription 5A/B in prostate and breast cancers. Endocrine-Related
Cancer 15 367–390. (doi:10.1677/ERC-08-0013)
Tan SH, Dagvadorj A, Shen F, Gu L, Liao Z, Abdulghani J, Zhang Y,
Gelmann EP, Zellweger T, Culig Z et al. 2008 Transcription factor Stat5
synergizes with androgen receptor in prostate cancer cells. Cancer
Research 68 236–248. (doi:10.1158/0008-5472.CAN-07-2972)
Tannahill GM, Elliott J, Barry AC, Hibbert L, Cacalano NA & Johnston JA
2005 SOCS2 can enhance interleukin-2 (IL-2) and IL-3 signaling by
accelerating SOCS3 degradation. Molecular and Cellular Biology 25
9115–9126. (doi:10.1128/MCB.25.20.9115-9126.2005)
Tavaszi J & Budai P 2006 Toxicity study of agrochemicals on chorioallan-
toic membrane of the egg. Communications in Agricultural and Applied
Biological Sciences 71 101–105.
Trengove MC & Ward AC 2013 SOCS proteins in development and disease.
American Journal of Clinical and Experimental Immunology 2 1–29.
Vidal OM, Merino R, Rico-Bautista E, Fernandez-Perez L, Chia DJ, Woelfle J,
Ono M, Lenhard B, Norstedt G, Rotwein P et al. 2007 In vivo transcript
profiling and phylogenetic analysis identifies suppressor of cytokine
signaling 2 as a direct signal transducer and activator of transcription
5b target in liver. Molecular Endocinology 21 293–311. (doi:10.1210/
me.2006-0096)
Wang L, Zhang Z, Zhang R, Hafner MS, Wong HK, Jiao Z & Chopp M 2004
Erythropoietin up-regulates SOCS2 in neuronal progenitor cells derived
from SVZ of adult rat. Neuroreport 15 1225–1229. (doi:10.1097/
01.wnr.0000127636.15181.c1)
Wikman H, Kettunen E, Seppanen JK, Karjalainen A, Hollmen J, Anttila S &
Knuutila S 2002 Identification of differentially expressed genes in
pulmonary adenocarcinoma by using cDNA array. Oncogene 21
5804–5813. (doi:10.1038/sj.onc.1205726)
Zhu JG, Dai QS, Han ZD, He HC, Mo RJ, Chen G, Chen YF, Wu YD, Yang SB,
Jiang FN et al. 2013 Expression of SOCSs in human prostate cancer and
their association in prognosis. Molecular and Cellular Biochemistry 381
51–59. (doi:10.1007/s11010-013-1687-6)
Received in final form 22 November 2013Accepted 25 November 2013Made available online as an Accepted Preprint26 November 2013
Published by Bioscientifica Ltd.
Copyright © 2022 FDOKUMEN