Social Network Analysis of the Jangwi Urban Regeneration ...
19
Sustainability 2019, 11, x; doi: FOR PEER REVIEW www.mdpi.com/journal/sustainability Article 1 Social Network Analysis of the Jangwi Urban 2 Regeneration Community 3 Hwanbae Kim 1* , Jae-Kyoung Chung, 2 and Myeong-Hun Lee 3 * 4 1 Department of Frontier Architectural and Urban Environment Engineering, Graduate School of Hanyang 5 University, 222 Wangsimni-ro, Seongdong-gu, Seoul 04763 Korea; [email protected] 6 2 Graduate School of Urban Studies, Hanyang University, 222 Wangsimni-ro, Seongdong-gu, Seoul 04763 7 Korea; [email protected] 8 3 Graduate School of Urban Studies, Hanyang University, 222 Wangsimni-ro, Seongdong-gu, Seoul 04763 9 Korea; [email protected]@e-mail.com 10 * Correspondence: [email protected](H.K.); [email protected](M.-H. L.); Tel.: +82-10-7236-1370 11 (H.K.); +82-2-2220-4418 (M.L.) 12 13 Received: date; Accepted: date; Published: date 14 Abstract: The administrative turn to urban regeneration in South Korea prompts an examination 15 into the social aspects of sustainability for project areas. This retrospective study used social network 16 analysis (SNA) to compass the 2015—2018 formation of Jangwi urban regeneration community, 17 with average degree, centralization, and efficiency for network level and degree for individual level. 18 The study aimed to identify the network’s structural characteristics in terms of relationships and 19 social linkage. Average degree results note a rise in social exchange (2015: 0.609; 2018: 4.060), while 20 the 2018 centralization value (<0.5) and community efficiency indicate how such network 21 communication is dependent on key influencers. Introduced is a visual and quantitative analysis 22 method for community networks that may warrant urgent attention in the field of Korean urban 23 regeneration, as it provides potential strategies for governments and administrations to accomplish 24 sustainable and strategic goals. 25 Keywords: Social Network Analysis, Urban Regeneration, Community, Sustainable Social 26 Development, New Deal Policy, Social Relation 27 28 1. Introduction 29 1.1. Study Background and Purpose 30 Since the 1980s, projects for reconstruction and redevelopment in South Korea have invested 31 where surplus profits were a guarantee [1]. However, it is not only that such gentrification ousted 32 tenants and dismantled a sense of community [1–2]; the priority in surplus profits also overlooked— 33 if not caused—blighted neighborhoods with insufficient funds and measures to maintain amenities 34 and infrastructure [3]. The reparative shift for urban development came in 2007 when the national 35 government announced its goal “to build a living city,” which would later anticipate the “Special Act 36 on the Promotion of and Support for Urban Regeneration” of 2013, both for revitalizing the welfare 37 of declining communities [2,4]. The acts soon after precipitated the 2017 Urban Regeneration New 38 Deal Project (도시재생 뉴딜사업) of the then newly elected Moon administration. Under the New 39 Deal policy, regional governments with various local actors were required to formulate innovative 40 urban regeneration strategies for competitive state subsidy bidding, a grant that would cover 50% of 41 the project’s costs with the remainder to be borne by local governments [2]. 42 The funding is not indefinite, however, as the efforts must aim to strengthen local capacity for 43 eventual financial independence. The term “urban regeneration” refers to such strengthening, 44
-
Upload
khangminh22 -
Category
Documents
-
view
3 -
download
0
Transcript of Social Network Analysis of the Jangwi Urban Regeneration ...

Sustainability 2019, 11, x; doi: FOR PEER REVIEW www.mdpi.com/journal/sustainability
Article 1
Social Network Analysis of the Jangwi Urban 2
Regeneration Community 3
Hwanbae Kim1*, Jae-Kyoung Chung,2 and Myeong-Hun Lee3* 4
1 Department of Frontier Architectural and Urban Environment Engineering, Graduate School of Hanyang 5 University, 222 Wangsimni-ro, Seongdong-gu, Seoul 04763 Korea; [email protected] 6
2 Graduate School of Urban Studies, Hanyang University, 222 Wangsimni-ro, Seongdong-gu, Seoul 04763 7 Korea; [email protected] 8
3 Graduate School of Urban Studies, Hanyang University, 222 Wangsimni-ro, Seongdong-gu, Seoul 04763 9 Korea; [email protected]@e-mail.com 10
* Correspondence: [email protected](H.K.); [email protected](M.-H. L.); Tel.: +82-10-7236-1370 11 (H.K.); +82-2-2220-4418 (M.L.) 12
13 Received: date; Accepted: date; Published: date 14
Abstract: The administrative turn to urban regeneration in South Korea prompts an examination 15 into the social aspects of sustainability for project areas. This retrospective study used social network 16 analysis (SNA) to compass the 2015—2018 formation of Jangwi urban regeneration community, 17
with average degree, centralization, and efficiency for network level and degree for individual level. 18 The study aimed to identify the network’s structural characteristics in terms of relationships and 19 social linkage. Average degree results note a rise in social exchange (2015: 0.609; 2018: 4.060), while 20 the 2018 centralization value (<0.5) and community efficiency indicate how such network 21
communication is dependent on key influencers. Introduced is a visual and quantitative analysis 22 method for community networks that may warrant urgent attention in the field of Korean urban 23 regeneration, as it provides potential strategies for governments and administrations to accomplish 24 sustainable and strategic goals. 25
Keywords: Social Network Analysis, Urban Regeneration, Community, Sustainable Social 26
Development, New Deal Policy, Social Relation 27
28
1. Introduction 29
1.1. Study Background and Purpose 30
Since the 1980s, projects for reconstruction and redevelopment in South Korea have invested 31 where surplus profits were a guarantee [1]. However, it is not only that such gentrification ousted 32 tenants and dismantled a sense of community [1–2]; the priority in surplus profits also overlooked—33 if not caused—blighted neighborhoods with insufficient funds and measures to maintain amenities 34
and infrastructure [3]. The reparative shift for urban development came in 2007 when the national 35 government announced its goal “to build a living city,” which would later anticipate the “Special Act 36 on the Promotion of and Support for Urban Regeneration” of 2013, both for revitalizing the welfare 37 of declining communities [2,4]. The acts soon after precipitated the 2017 Urban Regeneration New 38
Deal Project (도시재생 뉴딜사업) of the then newly elected Moon administration. Under the New 39
Deal policy, regional governments with various local actors were required to formulate innovative 40 urban regeneration strategies for competitive state subsidy bidding, a grant that would cover 50% of 41 the project’s costs with the remainder to be borne by local governments [2]. 42
The funding is not indefinite, however, as the efforts must aim to strengthen local capacity for 43 eventual financial independence. The term “urban regeneration” refers to such strengthening, 44

Sustainability 2019, 11, x FOR PEER REVIEW 2 of 19
including the introduction of new functions and utilization of resources for a city affected by 45
depopulation, changes in industrial structure, and indiscriminate expansion. It is an integrated 46 approach that encourages the voluntary participation of citizens for sustainable growth and adds 47 new physical, economic, environmental, and social functions based on partnership [5]. With the 48 emphasis on public-private relationships for organizational structure and fair operation, urban 49
regeneration projects could proceed without being ruled out by interests of involved stakeholders 50 [6]. Of particular interest is the local government’s Urban Regeneration Support Center, the costs of 51 which are secured through the grant as well as support from public corporations, businesses, and 52 donations [7]. The Center seeks to foster competencies in managerial skills and values in 53 sustainability—done through seminars and educational programs held by government-funded 54
experts in the field—for residents to autonomously carry on the revitalization process. Additionally, 55 the Center’s coordinators mediate communication among the central and local governments and 56 residents, and disseminate relevant information to said parties. 57
Nevertheless, the nationwide competition for sponsorship under the New Deal policy may have 58 been a decision made too quickly. Local approaches did not account for community participation in 59
the past, such that there is no empirical data or analysis to evaluate the performances of organizations 60 that had to form nonetheless. Though active discussions on ways to support and promote community 61 organizations were expected to occur nationwide, most local governments had yet to learn how to 62 communicate and implement their cooperatives efficiently. Despite cooperative planning as the 63
policy’s core principle [8], it is not easy to objectively evaluate or monitor social aspects where a 64 public fund is invested. As in the past, physical development would receive principal focus to assure 65 direct results and justify budget expenditures. Ahn et al. [9] note that, regardless, the annual rate of 66 maintained community organization decreased from 88.2% in the second year to 48.3% in the sixth 67 year, while the communities formed were unable to attain the skillsets needed in time (e.g., fiscal 68
management and business model creation). This added difficulty presents that, if financial support 69 were discontinued without a proper plan and relations in place, there would be high risks of 70 severance for existing networks and citizen participation in sustaining the area [10–11]. 71
It would thus be necessary to examine one of the 13 pilot areas for urban regeneration chosen in 72 December 2014. This particular study conducted a social network analysis (SNA) to identify the 73
structural characteristics and influencers of the Jangwi urban regeneration community, a network 74 that gained recognition from the Seoul Metropolitan Government for its exemplary performance [12] 75 in its first stage. An in-depth analysis of Jangwi’s progress from beginning to end may offer ways to 76 cultivate interaction among members [13], assess and diagnose the network structure, and provide 77
insightful implications for sustaining areas that would undergo urban regeneration in the future. 78 Below is an outline of the Center’s social regeneration program (Table 1). 79
Table 1. Three stages of the Jangwi social regeneration program [14] 80
Stage Description
1. Project
Preparation
(2015)
• Identify the citizen community
• Develop a basic citizen education program for the residential and urban
environment
• Hold activities such as community regeneration educational programs
facilitated by invited experts, and explore other cases
2. Strengthening
Capacity
(2016—2018)
• Cultivate the identified community
• Train citizens in skills for project leadership and further skills
development
• Organize teams and personnel by project
• Hold activities such as operating a regional hub space, improving alleys,
and creating eco-friendly villages

Sustainability 2019, 11, x FOR PEER REVIEW 3 of 19
3. Building of the
Implementation
System
(2018)
• Establish a sustainable citizen-led implementation system
• Organize the Jangwi Urban Regeneration Cooperative
• Develop a business model for resolving regional issues
• Prepare executive groups via said business model
81 While the plan presents a continuity for urban regeneration, it also lists the projects held per 82
stage of development. The educational programs in stage 1 include a field trip to Suwon (a model 83 urban regeneration area), urban farming, home repair, rainwater utilization, and basic urban 84 regeneration concepts. The competencies formed will have equipped residents to lead and plan their 85
own projects for stage 2, involving urban agriculture, small-scale house repairs, the installation of 86 rainwater facilities, and holding local festivals. Such were thought to encourage deeper involvement 87 and on-the-job training until the development of an autonomous citizen body at the end of stage 3. 88 For Jangwi, the official program of the Seoul Metropolitan Government should have ended in 2018, 89
yet because stage 3 had not yet been completed, it was decided that the urban regeneration project 90 extend for another year through the constant requests of the citizens. In the process, however, 91 uncertainties over the extended support and the employment instability at the end of 2018 led to the 92 withdrawal of a considerable number of coordinators—the key mediators between the city 93 government and the region’s residents. As the Center serves as the primary means for integrating 94
and coordinating the projects—some of which were led by residents already [7], the social network 95 that it, the government, and the citizens have built together may be cut off. 96 97 1.2. Social Network Analysis and Community Organization 98 99
Previous SNA studies on community organizations held that social networks contribute to living 100 satisfaction, generosity and reciprocity between individuals, and social unity; in turn, they follow 101 that factors such as trust, social capital, and communication enhance or drive communal capacity for 102 collaborative urban planning [11, 15–18]. Such studies used the number of neighbors, the number 103
and intensity of the activities of the organization, and the increase in participation of the citizen 104 meetings relative to project costs as indicative SNA measures (Table 2). Though effective, these 105 studies encountered difficulties in data collection, as individual community members found it 106 difficult to objectively recognize an individual’s impact and ability given his or her relational position 107 in the network. 108
109 Table 2. Prior SNA studies on communities in urban regeneration 110
Researcher Study Theme Indicative Measure for SNA
Lee Y et al.
(2008) [15]
A Study on the Capacity Building for
Citizens’ Participation in Urban
Regeneration
Number of contacts and meetings between
neighbors, number of visits to friends‘
homes, conversation length, etc.
Choh
(2010) [16] Policy Issues of Social Capital in Seoul
Number of contacts between neighbors,
number of organizations participated,
personal credibility, public credibility, etc.
The Seoul
Institute
(2011) [17]
Development and Application of
Regional Comprehensive Diagnostic
Indicators for Sustainable Community
Regeneration
Status of low-income vulnerable citizens,
tenant ratio, residence period of citizens, etc.
Shin Y
(2012) [11]
The Influence of Community Capacity on
Continuing and Expanding Participation
Number of participant organizations,
personal relationship, personal credibility,
public credibility, the strength of
organizational cooperation, etc.

Sustainability 2019, 11, x FOR PEER REVIEW 4 of 19
MOLIT
(2013) [18]
A Study on the Establishment of Basic
Measures for Urban Regeneration in
Korea
Increased participation in citizen gatherings
related to the satisfaction of livelihood and
the cost of the project (project/KRW mil.)
111
The present study thus attempted an actor-level use of SNA to measure individual influence in 112 addition to a network-level approach similar to the studies mentioned. The stipulation is that an 113 accurate assessment of how an organization is managed and what specific parts actors play in it can 114 come from a birds-eye point of view of the whole network. Actors are any unit of two: e.g., an 115
individual to an organization, to a company, to a patent; the relationship formed between two actors 116 is a link, a dyadic characteristic that exists when both actors maintain mutual connection [19]. 117
For Spinks [20], actors can refer to SNA as a strategic viewpoint to take “proactive measures to 118 strengthen network ties,” voicing their norms, ideals, and opinions with their effect over others. 119 Similarly, Dale and Newman [21] believe that the lack in both coherent dialogue and an ethos of 120
sustainable development among stakeholders (i.e., the “gridlock”) can be mitigated via key 121 individuals who connect different members of the network. In a sense, Dale, Newman, and Spinks 122 place value on direct human relations for community building, such that this study defines 123 “community” as a social network of people with shared values and interests who share information, 124 opinions, trust, and camaraderie among one another. The Jangwi urban regeneration community 125
comprises, in turn, the members of the project, members of the Center, and the local government 126 officers. 127
Additionally present in a community is social capital, classified as either “bonding” or 128 “bridging,” in which bonding social capital is a high-density network internal to a community [22] 129
between actors and links. Meanwhile, “bridging social capital” is characterized by the external 130 connections a network has with other groups and communities [23–24]; actors are grouped according 131 to demographic differences (e.g., age, ethnicity, class; [25]) or based on sources of information, 132 knowledge, and finance from the different groups [26]. Although this study could have proceeded 133 thus by clustering citizens, coordinators, and government officials in a pattern after Woolcock and 134
Narayan [26], or by demographic differences following Portes [25], the method did not appear 135 needed. The Jangwi network could be fully visualized in a network map and was not large enough 136 to substantially cluster 119 respondents into subgroups. 137
Furthermore, though bonding and bridging can be considered as two separate connection types, 138 Leonard and Onyx [27] argue that they need not be mutually exclusive. At the same time, Crowe 139
asserts that network analysis can distinguish the different degrees of both bridging and bonding 140 capital, as conceptual models for empirically measuring their types are not provided. The different 141 levels of bridging and bonding capital are distinguishable by analyzing the network structure 142 through the actors and links; indeed, how the relationship of the actors and links are defined 143
determine a network’s structure [28], which can be mathematically and visually expressed through 144 SNA. 145
Reference to the network structure in regard of the actors and links may lead to a better 146 evaluation of network practices and decision-making for stakeholders such as identifying which 147 facets need further attention or how the cooperative should continue. Regional development and 148
community establishment, for example, can be assessed and managed in a fundamentally different 149 way: planners can refer to SNA to gradually discuss policy implications by visualizing how the 150 community is organized, noting its characteristics, and classifying them appropriately under regional 151 development, community building, and community interaction [29–32]. 152
153
2. Materials and Methods 154
2.1. Subject Area 155
Sustainability 2019, 11, x FOR PEER REVIEW 5 of 19
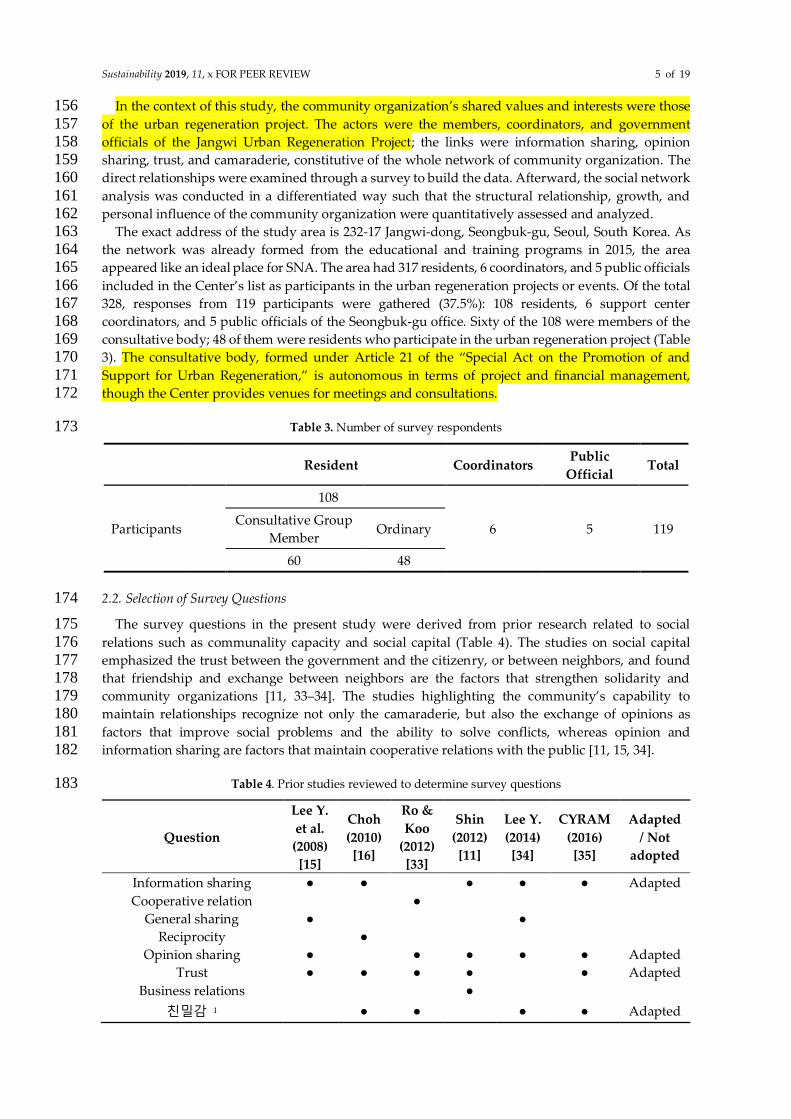
In the context of this study, the community organization’s shared values and interests were those 156
of the urban regeneration project. The actors were the members, coordinators, and government 157 officials of the Jangwi Urban Regeneration Project; the links were information sharing, opinion 158 sharing, trust, and camaraderie, constitutive of the whole network of community organization. The 159 direct relationships were examined through a survey to build the data. Afterward, the social network 160
analysis was conducted in a differentiated way such that the structural relationship, growth, and 161 personal influence of the community organization were quantitatively assessed and analyzed. 162
The exact address of the study area is 232-17 Jangwi-dong, Seongbuk-gu, Seoul, South Korea. As 163 the network was already formed from the educational and training programs in 2015, the area 164 appeared like an ideal place for SNA. The area had 317 residents, 6 coordinators, and 5 public officials 165
included in the Center’s list as participants in the urban regeneration projects or events. Of the total 166 328, responses from 119 participants were gathered (37.5%): 108 residents, 6 support center 167 coordinators, and 5 public officials of the Seongbuk-gu office. Sixty of the 108 were members of the 168 consultative body; 48 of them were residents who participate in the urban regeneration project (Table 169 3). The consultative body, formed under Article 21 of the “Special Act on the Promotion of and 170
Support for Urban Regeneration,” is autonomous in terms of project and financial management, 171 though the Center provides venues for meetings and consultations. 172
Table 3. Number of survey respondents 173
Resident Coordinators Public
Official Total
Participants
108
6 5 119 Consultative Group
Member Ordinary
60 48
2.2. Selection of Survey Questions 174
The survey questions in the present study were derived from prior research related to social 175
relations such as communality capacity and social capital (Table 4). The studies on social capital 176 emphasized the trust between the government and the citizenry, or between neighbors, and found 177 that friendship and exchange between neighbors are the factors that strengthen solidarity and 178 community organizations [11, 33–34]. The studies highlighting the community’s capability to 179 maintain relationships recognize not only the camaraderie, but also the exchange of opinions as 180
factors that improve social problems and the ability to solve conflicts, whereas opinion and 181 information sharing are factors that maintain cooperative relations with the public [11, 15, 34]. 182
Table 4. Prior studies reviewed to determine survey questions 183
Question
Lee Y.
et al.
(2008)
[15]
Choh
(2010)
[16]
Ro &
Koo
(2012)
[33]
Shin
(2012)
[11]
Lee Y.
(2014)
[34]
CYRAM
(2016)
[35]
Adapted
/ Not
adopted
Information sharing ● ● ● ● ● Adapted
Cooperative relation ●
General sharing ● ●
Reciprocity ●
Opinion sharing ● ● ● ● ● Adapted
Trust ● ● ● ● ● Adapted
Business relations ●
친밀감 1 ● ● ● ● Adapted

Sustainability 2019, 11, x FOR PEER REVIEW 6 of 19
1 As the translation is “closeness,” which may be confused with the term used in SNA, this Korean term will be 184 referred to as “camaraderie” instead. 185
186 The present study selected survey questions to examine the Jangwi community network 187
according to the relationships (“information sharing,” “opinion sharing,” “trust,” and 188 “camaraderie”), in consideration of community competence and social capital (Table 5; Tables S1 and 189
S2). The four relationships are features that facilitate interaction among members of the community; 190 the criteria and questions were patterned after the work of Cyram [35], a programming company and 191 SNA software developer, with a research institute that regularly conducts SNA for South Korean 192 governments and businesses. 193
Table 5. Survey Questions 194
Type of Network Question
Information sharing • Who has provided you with useful information on the urban
regeneration project?
Opinion sharing
• Who in your neighborhood do you often talk to about issues in the
urban regeneration project? (e.g., areas in need of improvement,
conflicts, and difficulties)
Camaraderie • You are going on a long bus trip. Who among the members of your
community would you feel comfortable sitting next to?
Trust • Among the community members, who do you trust the most?
1 The full surveys are presented in Tables S1 and S2, in Korean and English, respectively. 195
196
The questions were presented during face-to-face interviews with members of the Jangwi Urban 197 Regeneration Area, held at the Urban Regeneration Support Center from December 2–31, 2018. The 198 respondents were given a list of all 317 community members; those who relocated outside of the 199
Jangwi community were excluded. The interviewees could point out as many people from the list as 200 they could. The first set of interviews comprised members visiting the center; the second were 201 members who had, or were currently working on, projects; the third set of interviews was for 202 members who were cited frequently by others and were possible influencers. As a type of snowball 203 sampling, the process initially began with the highly active members at that time until there were no 204
more additional actors available to survey. The interviewees were also asked to disclose the longevity 205 of their relationships with the people they refer to examine the characteristics and changes in the 206 acquaintance network. Additionally, the managing director of the support center, other coordinators, 207 and core influencers identified via SNA were interviewed to better understand the causes of the SNA 208 results to discuss what had happened at that time, how personal connections were made, and what 209
activity was being done. 210
2.3. Method of Social Network Analysis 211
SNA involves actors and links, in which the nature of the latter constitutes the network. At the 212
network level, average degree, centralization, and efficiency were used while degree was used for 213
the actor level, in line with previous studies [35–39]. There are, however, challenges in capturing 214
changes in social relations over time for SNA that may present a problem to the study [40]. Despite 215
how observations were made at discrete time points, Snijders [41] observed that the resulting 216
dynamics is a result of a continuous time-process. In agreement with Bidart and Lavenu [42] (p. 360), 217
“personal networks have a history. The form and structure they show today result from a 218
construction elaborated over time.” Thus, if a connection changed at an initial time, it was assumed 219
in this study that the tie would not change, as SNA can involve static assumptions [43]. In this way, 220

Sustainability 2019, 11, x FOR PEER REVIEW 7 of 19
given that the interviewees disclose the year they acquainted with the actors they refer to in the 221
surveys, data prior to 2018 could therefore be retroactively obtained (Table 6; Figure 1). 222
223
Table 6. Network data based on the answer to the survey, “the year you first got to know the person.” 224
225
source target weight year relation year
A B 1 2015 A → B 2015
A C 1 2016 or A → C 2016
A D 1 2017 A → D 2017
A E 1 2018 A → E 2018
226 227 228
229 230
Figure 1. Network map of actors and ties. 231 232 First, the degree analysis of the network’s engagement typically has three indicators to 233
determine the degree of activity in the network: average degree, the proportion of isolated members, 234 and whether the network is connected and unbroken [19]; the average degree functioned as the 235 criteria to examine the relationships’ quantitative growth. As expressed in the formula [44], 236
average degree = 𝐿
𝑁
𝐿: the sum of links in a network; 𝑁: the sum of nodes in a network (1)
the average degree measures how many relationships each member forms in the network on average; 237
for which, the more interrelationships that are formed, the higher the value. The dynamic spread of 238 the network is visualized in the results. 239
Second, the study looked at centralization and efficiency to analyze the characteristics of the 240 network structure. Centralization is expressed as a ratio between 0 and 1, while its visual (Figure 2) 241
is a “concentration map” that intuitively identifies herding: It can be expressed as in formula (2) [37]. 242
243
𝐶𝐷 = ∑ [𝐶𝐷(𝑁∗) − 𝐶𝐷(𝑁𝑖)]
𝑔𝑖
(𝑔 − 2)(𝑔 − 1)
𝐶𝐷: Centralization; 𝐶𝐷(𝑁∗): highest Degree Centrality; 𝐶𝐷
(𝑁𝑖): Degree Centrality of node
i; 𝑔: the number of nodes)
(2)

Sustainability 2019, 11, x FOR PEER REVIEW 8 of 19
(a) Star network (centralization = 1)
(b) Ring network (centralization = 0)
Figure 2. Concentration map for centralization measurement 244
Points are placed on the concentric circle. The larger the value of a point, the more centered the point 245 is within the circle. The smaller the value of the point, the farther away it is from the circle center. If 246 centralization is 0.5 or higher, it indicates that the network relies on a small number of citizens while 247 centralization between 0.3 and 0.4 is a generally observed level [35]. 248
The efficiency of a network structure is measured by average distance from one citizen to 249
another citizen. It can be expressed as in formula (3) [19]. 250
Average Distance = ∑ 𝑑(𝑛𝑖,𝑛𝑖)
𝑔(𝑔−1)
𝑑(𝑛𝑖 , 𝑛𝑖): shortest distance between two nodes, 𝑔: number of nodes) (3)
Efficiency, on the other hand, represents whether the network is time-consuming and costly for 251
actors to communicate and agree with each other. To this end, the distance is measured by connecting 252 people with people (Figure 3). 253 254
Figure 3. Efficiency (Distance Measurement) 255
Finally, influencer analysis identifies who or which group of members of the urban regeneration 256
project that influence the network structure of the community when forging decisions. It examines 257 whether the initiative of urban regeneration is in place with the citizens. The members who take such 258 initiative are interviewed to review their characteristics. The influencer indicator is the number of 259 individuals pointed out by others in the survey, measured by In-degrees. In-degrees refer to the 260
connection in the incoming direction relative to one node. With reference to the average number of 261 connections in the reference network in Cyram’s report being 5.2 [35], the present study selected 262 people cited by five or more others as an influencer in the survey. 263
3. Results 264
3.1. Overview of Survey and Respondents 265
The gender of the survey respondents was mainly female (73%). By age, respondents in their 40s 266 to 60s accounted for most of the survey: 33% of whom were in their 40s, 22% in their 60s, and 21% in 267 their 50s. 50% of the respondents were members of the residents’ council, while 40% of the 268 respondents were ordinary citizens. Coordinators accounted for 5% while civil servants accounted 269 for 4% of the respondents. By lodging type, 67% of the respondents were house owners and 33% of 270
the respondents lived in rented homes. 76% of the respondents lived in the area before the first urban 271 regeneration project began in 2015, of which 34% had lived in the area for more than 20 years (Table 272 8). 273
Table 8. Statistics of Survey Respondents 274

Sustainability 2019, 11, x FOR PEER REVIEW 9 of 19
Question Ratio Question Ratio
Gender Men 27%
Resident status Own 67%
Women 73% Rented 33%
Composition
Residents Ordinary 50%
Housing type
Condominium 16%
Members 40% Single house 46%
Coordinators 5% Apartment 37%
Public official 4%
Period of
residence
1 yr less 7%
Age
20s 7% 1–5 yrs 18%
30s 18% 5–10 yrs 19%
40s 33% 10–15 yrs 14%
50s 21% 15–20 yrs 9%
60s 22% Over 20 yrs 34%
3.2. Level of Network 275
3.2.1. Average Degree 276
The study examined the average degree and its changes over time to determine the extent of 277 network activity. It was centered on the types of network present (opinion and information sharing, 278 camaraderie, and trust) among the citizens of Jangwi Urban Regeneration Area. While 76% of the 279
members participating in the Jangwi Urban Regeneration Area had lived there for five years or 280 longer, the average degree was only 0.331 before 2015. The succeeding years observed an average 281 growth rate of 92%: 84% in 2015, 151% in 2016, 104% in 2017, and 30% in 2018; of which the 0.609 282 average degree value at the beginning of the project in 2015 rose to 4.060 come 2018 (Table 9). 283
Table 9. Average Degree 284
Type Before the
Project 2015 2016 2017 2018
Whole 0.331 0.609 1.526 3.120 4.060
Information sharing 0.225 0.392 0.961 1.853 2.353
Opinion sharing 0.296 0.469 0.988 2.272 2.877
Camaraderie 0.253 0.446 0.940 1.928 2.590
Trust 0.291 0.481 0.987 1.975 2.544
285
According to the annual growth, the network appeared to have formed in 2015 and activated 286 about twice every year until 2017, as long-term residents who were once strangers to each other came 287 to interact more frequently (Figure 4). The network growth appears concurrent with the efforts of the 288 support center outlined earlier (Table 1), and especially so in regard to the various skill building 289 activities, such urban regeneration education programs and public contests held in April 6, 2016 290
(Table 10). 291 292
(a) Before Project
(b) 2015
(c) 2016
(d) 2017
(e) 2018
Figure 4. Network Map (Before the project and 2015–2018) 293

Sustainability 2019, 11, x FOR PEER REVIEW 10 of 19
1 In the network map, citizens were marked in red, coordinators in green and officials in blue. Members located 294 on the outside are the isolated members. 295 2 The corroborated data was obtained from the survey (see Table 6 and Figure 1). 296
Table 10. Social Regeneration Activity 297
Particular 2015 2016 2017 2018
Government-led
activities
Conference, public hearing, survey,
activation plan
Support
center-led activities
Community building, field trips, basic
education of urban regeneration
Operation of hubs, advanced training by project, organizing
public contests, and supporting for planning
Supporting the formation of
cooperatives
Citizen-led activities
Participating in advanced training and skill-building training,
supporting and operating public contests for the project
Formation of urban regeneration
cooperatives
298
3.2.2. Centralization 299
Centralization is an indicator of the degree typically dependent on a small number of citizens 300 which others move toward. If centralization is 0.5 or above, it is seen to be dependent on a small 301
number of people, but centralization of Jangwi’s overall network in 2015 was 0.0204 and 0.2362 in 302 2018. Jangwi was thus found not to be dependent on a few citizens compared to typical centralization 303 (Table 11). 304
Table 11. Network Centralization 305 Before the Project 2015 2016 2017 2018
Whole 0.0204 0.0412 0.1410 0.2204 0.2362
Information sharing 0.0177 0.0461 0.1204 0.1715 0.1765
Opinion sharing 0.0342 0.0573 0.1267 0.1738 0.1661
Camaraderie 0.0216 0.0439 0.0501 0.0996 0.1285
Trust 0.0352 0.0457 0.0911 0.1432 0.1617
However, the centralization map of the network in Figure 5(a) shows that citizens, coordinators, 306 and civil servants were evenly positioned in the center at the early stage of the project in 2015, 307 indicating equal influence. In 2018, on the other hand, the positions of the civil servants and citizens 308 were more or less on the outside, while the concentration of influence on the coordinators positioned 309 them at center (Figure 5(b)). In the centralization map, citizens were marked in red, coordinators in 310
green, and officials in blue. 311
312

Sustainability 2019, 11, x FOR PEER REVIEW 11 of 19
(a) 2015 (b) 2018
Figure 5. Centralization Map for years 2015 (a) and 2018 (b) 313
The purpose of the urban regeneration support center is to bridge communications between 314
citizens and the administration until the citizens can sustain the area independently. As the SNA 315 demonstrates, the coordinators have been at the center of the opinion-sharing network and trust 316 network, acting as such between the citizens and civil servants. If these networks do not have 317 coordinators, five groups and six isolated nodes would appear in “Information Sharing,” three 318 groups and four isolated nodes would appear in “Opinion Sharing,” four groups and eight isolated 319
nodes appear in “Trust,” and a relatively stable relationship would only appear in “Camaraderie.” If 320 the role of the urban renewal support center is reduced and existing coordinators are removed, there 321 is a risk that the connection between the citizen and the public will disappear as shown in the network 322 map in Figure 4, which would retract the community’s progress. 323
Should the coordinators suddenly disappear from the network, there would be a need to 324
establish a variety of alternative paths, such as members or channels of communication, which can 325 act as a bridge between citizen and administration. In the network map, citizens were marked in red, 326 coordinators in green, and officials in blue (Figure 6). 327
328
Particular Information
sharing Opinion sharing Trust Camaraderie
Without
coordinators
With
coordinators
Figure 6. Comparison of the Network in 2018 329
3.2.3. Efficiency 330
Average distance and efficiency share an inverse relationship: higher the indicators of average 331
distance, the lower the efficiency, and vice versa. The total number of network members rose by 31 332 people from 2015–2016 (33%) and again from 2016–2017 (25%). The average distance gradually 333 increased by 2017 for the entire network, however, thereby reducing efficiency. The efficiency 334 increased again in 2018 as the average distance decreased (see Table 12). In particular, the efficiency 335 of the “Opinion Sharing” and “Trust” networks increased with the lowered average distance between 336
2017 and 2018, which saw an increase in the number of members. The results of the citizen interview 337 show that the two coordinators who joined the project in 2018 are located between the existing 338 networks and have contributed to lowering the network’s average distance while lowering the 339 overall network’s largest distance (diameter) by one notch. 340
Table 12. Number of Members Connected and the Average Distance (dia) in Network 341
Before the Project 2015 2016 2017 2018

Sustainability 2019, 11, x FOR PEER REVIEW 12 of 19
Population
Average
Distance Population
Average
Distance Population
Average
Distance Population
Average
Distance Population
Average
Distance
Whole 42 1.375 64 2.718 95 3.117 126 3.513 133 3.134
Information
sharing 30 1.143 40 1.633 62 2.943 90 3.041 102 3.745
Opinion
sharing 34 1.172 37 1.576 54 3.200 75 3.510 81 3.467
Camaraderie 26 1.192 37 1.346 57 2.842 78 3.528 83 4.000
Trust 27 1.353 39 1.725 56 2.468 73 3.227 79 3.166
3.3. Influencers 342
Members cited by five or more others were deemed as influencers. Such members fell into one 343 or more of the following criteria: (1) was found in the information sharing network, (2) spread 344
information regarding the project to a large number of people, (3) attended to local problems or 345 difficulties from a large number of members according to the opinion sharing, (4) is perceived as 346 amicable by a large number of citizens (camaraderie), and (5) is trusted by a large number of 347 members. 348
As the actor level of the SNA, the number of influencers increased from two in 2015 to 28 in 2018 349 with only one civil servant found to be an influencer. Among the coordinators stationed at the 350 support center, one in 2015, three in 2016, and five in 2017 were found to be influencers. As for citizen-351 influencers, the number increased sharply from 8 in 2016 to 18 in 2017 as various programs such as 352 public contests and open urban regeneration education programs began in 2016 (Table 13). It is 353
believed that these citizens enhanced the members’ will to participate in various public projects and 354 programs. 355
Table 13. Result of Influencer Analysis 356
Year 2015 2016 2017 2018
Particular a b c d a b c d a b c d a b c d
Information sharing 1 0 0 1 6 2 3 1 16 4 11 1 19 5 13 1
Opinion sharing 1 1 0 0 3 1 2 0 14 3 11 0 16 4 12 0
Camaraderie 0 0 0 0 1 0 1 0 10 2 8 0 16 5 11 0
Trust 0 0 0 0 3 1 2 0 13 3 10 0 15 5 10 0
Total 2 1 0 1 12 3 8 1 24 5 18 1 28 5 22 12
1 a = Total; b = Coordinator; c = Citizen; d= Civil Servant 357 2 Duplicated members appearing simultaneously in other networks are excluded from totals. 358
The citizen-influencers were either executive members of the citizen consultative body or 359 members who actively participated in the body’s regular meetings. Most of them were women, 360 married, and house owners. Among the influencers, 40% had resided in the area for more than 20 361
years, followed by 23% who resided for more than five, but less than 10, years. From the 362 characteristics of citizen-influencers, it was surmised that they were the ones who spent the most time 363 in the area, are relatively free with their time to form opinions or activities, and lead lives of financial 364 stability. Financial stability was indicated through house ownership, given its difficulty in Seoul. 365
4. Discussion 366
The study used SNA to provide empirical data for an otherwise theoretical understanding of 367 “community,” based on that of the Jangwi community where an urban regeneration project had 368 occurred. The structural features of the community and its influencers leading the urban regeneration 369 project have been visually expressed, quantified, and verified. Although not all community members 370

Sustainability 2019, 11, x FOR PEER REVIEW 13 of 19
could not participate in the survey because of limited time and resources, the findings remain able to 371
depict the process of Jangwi’s network formation. This is better explained in terms of social resource 372 theory. Brass [45] argued that relationships individuals keep are a source of power; a rooted view 373 that actors’ positions in social networks are determinants of opportunities and constraints [46–47]. 374 The stance that the links constitute the network structure hold the inverse implication, that the actors’ 375
links, particularly that of influencers, would appear to reflect—if not greatly contribute to—the 376 formation of the network as a whole. 377
First, the relationship grew quantitatively in 2018 compared to 2015 in the degree of engagement; 378 the frequent meetings appears to have opened more opportunities to share information and opinions. 379 Not only were there quantitative increases, but positive changes in connectivity were also observed 380
as the number of isolated members decreased while previously disconnected groups became linked 381 together. Interpreted and in line with the observations of Cyram [35], information and opinions 382 appeared to be frequently shared among members in a constant flow of communication. 383
Second, the Jangwi social network is not dependent on a few (centralization < 0.5) compared to 384 the typical network. A closer look at the concentrated members, however, show that they were 385
centralized around the coordinators in 2018, proving that the imminent closure of support 386 organizations or the government’s suspension of support could threaten the connectivity of the 387 network. There is a risk that the community’s network, which has long been built with policy 388 funding, would revert to its state before 2018. As iterated by Ahn et al. [9], discontinuous 389
participation and detached relations would occur from poor coordination between residents and the 390 administration upon project completion, or if support is stopped altogether [9–10]. To prepare for 391 withdrawn coordinators because of suspended funding or policy changes and to maintain 392 sustainable public-private partnerships, various alternative routes need to be established in advance, 393 such as new communication channels as well as the promotion of competent members, with whom 394
the administration and government can interact. 395 Third, the number of members of the network had risen steadily from 2015 to 2018. In 2016 and 396
2017, the figure rose by a significant 33%, though the average distance increased and lowered the 397 efficiency. In 2018, however, efficiency improved despite another increase in members as two 398 coordinators who started in 2018 were positioned between existing networks, contributing to the 399
lowered average distance of the network. Lee [34] cites that, in an exceptional example of community 400 building, coordinators would have been active since the beginning, forming agreements among 401 various entities and coordinating relationships among stakeholders. The study confirmed that the 402 participation of high-performing coordinators who contribute to better communication and trust 403
could improve the efficiency of the entire network. The finding also supports the claim that SNA can 404 better perceive this to employ a strategic positioning of members in the network. Local governments 405 require a stable and sufficient pool of coordinators in such projects [48]; fostering competency among 406 them is crucial to maintain the network and provide information to residents involved. 407
Fourth, the total number of influencers increased from 2 in 2015 to 28 in 2018, with a sharp 408
increase, in particular, to the number of citizen-influencers (0 in 2015 to 22 in 2018). More than half 409 were citizens elected for official leadership roles, yet they were not influencers to begin with. Most 410 are homemakers or seniors that could participate in the activities as they are relatively free in the 411 daytime (when most activities and projects were conducted), lead a stable life, and spend much time 412 in the area. In the interviews from residents who are now influencers, we found that their urban 413
regeneration efforts were recognized by the local community. We also found that they felt “a sense 414 of social achievement” in the course of conducting contests related to the regeneration project (hosted 415 by Sungbuk-gu and managed by residents) and in receiving skills training—important factors for 416 continuous engagement [11, 15, 49]. 417
5. Conclusion 418
As the present urban regeneration policy in South Korea lacks empirical backing with its execution, 419 with most local governments unable to efficiently communicate and implement their cooperatives, 420 the present study used social network analysis to identify the quantitative and structural 421

Sustainability 2019, 11, x FOR PEER REVIEW 14 of 19
characteristics of community organization, visualized in network maps to offer a systemic view on 422
the position or influence of individuals within the given network. It also examined the changes made 423 to the social network of a community organization, the risk of the network under a change of 424 environment, such as the withdrawal of funds or coordinators, and the capacity of influential 425 members to present policy implications. 426
However, with the present analysis of the members of the urban regeneration area currently 427 underway in Jangwi, there are limitations in that all areas cannot be generalized through the results 428 and implications obtained from this case. This is especially the case with the limited responses from 429 the surveys, the findings of which do no more than represent Jangwi’s active participants in the urban 430 regeneration project, which, discusses the formation of its respective network. Nevertheless, future 431
studies are suggested to collect more network data from different areas, whether or not they failed 432 or succeeded, to properly apprehend the successes and shortcomings of the current policy or other 433 similar urban regeneration projects. Furthermore, as this study presents a retrospective formation of 434 Jangwi’s network, updated studies may instead consider conducting their network investigations 435 and data accumulation in advance. Also, criteria for comparative analysis are needed to determine 436
the size of various indicators that describe the characteristics of the network; practical criteria for 437 judgment rather than statistical verification would fit the purpose better. Currently, there are not 438 many examples of a network that could serve as a proper local benchmark. It is expected that if data 439 accumulates through a continuous survey in the same environment, it will enable continuous 440
monitoring and evaluation of urban regeneration by determining the degree of engagement and 441 structural changes when combined with substantial features such as on-site surveys and member 442 satisfaction. 443
444
Acknowledgments: This research received no external funding. The authors received help from Elo Dinglasan, 445 editor of Journal Lab by Lexcode Inc., for use in the English language and developmental editing. 446
Author Contributions: conceptualization, H.K. and J.-K.C.; methodology, H.K.; software, H.K.; validation, H.K. 447 and J.-K.C; formal analysis H.K.; investigation, H.K.; resources, H.K.; data curation, H.K.; writing—original draft 448 preparation, H.K. and J.-K.C; writing—review and editing, H.K. and J.-K.C; visualization, H.K.; supervision, 449 H.K. and M.-H.L; project administration, H.K. and M.-H.L; funding acquisition, H.K. and M.-H.L 450
Conflicts of Interest: The authors declare no conflict of interest. 451

Sustainability 2019, 11, x; doi: FOR PEER REVIEW www.mdpi.com/journal/sustainability
Supplementary Materials 452
Table S1: Original Survey Template (Korean) 453
⚫ 다음은 앞으로 장위동에서 이뤄지는 도시재생사업의 네트워크 요소와 관련된 질문입니다. (인원수와 상관없이 자유454
롭게 기입해 주시고, 기입하신 구성원을 처음 알게 된 해에 ⋏를 해주세요) 455
※ 기입해주신 구성원의 이름은 암호화되며 연구자 이외에는 비공개임을 약속드립니다. 456
457
1. 도시재생사업 중 귀하에게 유용한 정보를 제공해준 구성원은 누구입니까? (information sharing) 458
성함 처음 알게 된 해
15년이전 2015 2016 2017 2018
459
2. 만약 귀하께서 도시재생사업 중 우리 동네의 문제(개선사항, 갈등, 어려움 등)에 대해 자주 의견이나 460
고민을 나누는 구성원은 누구입니까? (opinion sharing) 461
성함 처음 알게 된 해
15년이전 2015 2016 2017 2018
462
3. 도시재생사업 구성원 중, 긴 시간동안 여행을 할 때, 버스에서 같이 앉고 싶은 구성원은 463
누구입니까? (“sense of closeness(?)”) 464
성함 처음 알게 된 해
15년이전 2015 2016 2017 2018
465
4. 귀하가 도시재생사업 진행 중 가장 신뢰하는 구성원은 누구입니까? (trust) 466
성함 처음 알게 된 해
15년이전 2015 2016 2017 2018

Sustainability 2019, 11, x FOR PEER REVIEW 2 of 19
467
Table S2: Original Survey Template (English, translated) 468
⚫ Below are questions on the network factors of the urban restoration project being pursued in Jangw469
i-dong. (Please fill it out freely regardless of the number of people in the year you have come to k470
now the member for the first time). 471
472
※ The name of the member you mention below will be encrypted and we promise that it will not be 473
disclosed to people other than the researcher. 474
475
1. Who is the member who provided you with useful information about the urban regeneratio476
n project? (information sharing) 477
Name
The year you first got to know the person
More
than 15
years ago
2015 2016 2017 2018
478
479
2. Who is the member you frequently share your opinions or concerns with as regards problems (areas in 480
need of improvement, conflicts, and difficulties) in your neighborhood related to the urban regeneration 481
project? (opinion sharing) 482
Name
The year you first got to know the person
More
than 15
years ago
2015 2016 2017 2018
483
3. Who is the member you want to sit next to in a bus when travelling long distance among members working 484
on the urban regeneration project? (“sense of closeness”; camaraderie) 485

Sustainability 2019, 11, x FOR PEER REVIEW 3 of 19
Name
The year you first got to know the person
More
than 15
years ago
2015 2016 2017 2018
486
4. Who is the member you trust the most among those pursuing the urban regeneration project? (trust) 487
Name
The year you first got to know the person
More
than 15
years ago
2015 2016 2017 2018
488
References 489
1. Shin, H. B. Property-based redevelopment and gentrification: The case of Seoul, South Korea. Geoforum 490 2009, 40, 906–917 491
2. Seo, B. K.; Joo, Y. M. Innovation or episodes? Multi-scalar analysis of governance change in urban 492 regeneration policy in South Korea, Cities 2019, 92, 27-35 493
3. Korea Research Institute for Human Settlements (KRIHS). Necessity of Urban Regeneration and Policy 494 Measures. KRIHS Policy Brief No. 416. Anyang, Korea: KRIHS, 2013. Available online: 495 http://eng.krihs.re.kr/whatsnew/briefView.do?pageIndex=25&searchCondition=&searchKeyword=&eb_id496 x=1577 (Accessed 20 June 2019). 497
4. Kim, H. J.; Kim, R. H. How can the state fund for urban regeneration be improved. J Korean Urban Manag 498 Assoc 2016, 29, 63–90. 499
5. Urban Regeneration: A Handbook; Roberts, P.W.; Sykes, H., Eds.; SAGE Publications Ltd: London, UK, 2008. 500 6. Kim, B. J.; Lee, W. G. A study on actual condition analysis of cultural industries quarter for urban 501
regeneration, J Korean Int Soc Community Dev 2009, 34, 33–62. 502 7. Kim, T. S.; Byun, S. K. 2017. Study on Urban Regeneration Support Center. Seoul: Korea Housing Institute. 503 8. Maclver, R. M. Community: A Sociological Study, Being an Attempt to Set Out Native & Fundamental Laws, 4th 504
ed.; Frank Cass and Co., Ltd.: Abingdon, UK, 2006. 505 9. Ahn, H. C.; Koo, A. Y.; Cho, Y. J. Study on the Performance Evaluation and Policy Issues of the Community 506
Project in Seoul, The Seoul Institute; Seoul. Available online: https://www.si.re.kr/node/60854 (Accessed 20 507 June 2019). 508
10. Rado, S.; Baek, S. H.; Noh, T. M. et al. A study on the projects of making a region through the arts. Res Rep 509 2008, 168. Available online: http://www.riss.kr/link?id=A103003901 (accessed on 2 May 2019). 510
11. Shin, Y. An Influence of Community Capacity on Continuous Participation and Expansion toward 511 Community Building, Doctorate dissertation, Urban Design Faculty, Hanyang University, 2012. 512

Sustainability 2019, 11, x FOR PEER REVIEW 4 of 19
12. Seoul Metropolitan Government. 2025 Urban Regeneration Strategy. Seoul Metropolitan Government, 2018. 513 Available online: 514 https://seoulsolution.kr/sites/default/files/2025%20%EC%84%9C%EC%9A%B8%EC%8B%9C%20%EB%8F515 %84%EC%8B%9C%EC%9E%AC%EC%83%9D%20%EC%A0%84%EB%9E%B5%EA%B3%84%ED%9A%8D516 .pdf 517
13. Dempwolf, C. S.; Lyles, L. W. The uses of social network analysis in planning. J Plan Lit 2012, 27, 3–21. 518 14. Seoul Metropolitan Government (2017) “Urban Regeneration Revitalization Plan in Jangwi-dong” Seoul 519
Metropolitan Government P182-184. Available online: 520 https://uri.seoul.go.kr/surc/archive/policyView.do?tab_se=POLICYTAB005&bbs_master_seq=POLICY&bb521 s_seq=2768 (Accessed 20 June 2019). 522
15. Lee, Y.; Byun, P. S.; Ryu, S. H. 2008. Capacity building for community development in Korea. Korea 523 Research Institute for Human Settlements. Available online: 524 http://library.krihs.re.kr/upload/publication/s_report/http%3A%2F%2Flibrary.krihs.re.kr%2Fdl_image%2F525 IMG%2F01%2F000000003673%2FSERVICE%2F000000003673_01.PDF (Accessed 03 May 2019). 526
16. Choh, K. J. 2010. Social Capital of Seoul Metropolitan Area: Current Status and Policy, Policy Report of the 527 Seoul Institute. The Seoul Institute. Available online: 528 http://www.dbpia.co.kr/journal/articleDetail?nodeId=NODE02001172&language=ko_KR (Accessed 20 June 529 2019) 530
17. The Seoul Institute. 2011. A Study on the Community Health Check Indicators for Sustainable Community 531 Regeneration in Seoul. The Seoul Institute. Available online: https://www.si.re.kr/taxonomy/term/16760 532 (Accessed 20 June 2019) 533
18. The Ministry of Land, Infrastructure and Transport. 2013. A Study on the Establishment of Basic Policies for 534 Urban Regeneration in Korea. Available online: 535 https://elaw.klri.re.kr/eng_mobile/viewer.do?hseq=48163&type=sogan&key=4 (Accessed 20 June 2019) 536
19. Wasserman, S.; Faust, K. Social Network Analysis: Methods and Applications. Cambridge University Press: 537 Cambridge, UK, 1994; Volume 8. 538
20. Spinks, M. Understanding and actioning BRE environmental assessment method: a socio-technical 539 approach, Local Environm 2015, 20, 131–148. 540
21. Dale, A.; Newman, L. Social capital: A necessary and sufficient condition for sustainable community 541 development, Community Dev J 2010, 45, 5–21 542
22. Taylor, M. Community Issues and Social Networks. In Social Networks and Social Exclusion; Phillipson, C., 543 Allan, G., Morgan, D. Eds.; Ashgate: Burlington, Vermont, 2004, 205–218. 544
23. Crowe, J. A. In search of a happy medium: How the structure of interorganizational networks influence 545 community economic development strategies. Soc Networks 2007, 29, 469–488. 546
24. Granovetter,M. Economic action and social structure: the problem of embeddedness. Am J Sociol 1986, 91, 547 481–510. 548
25. Portes, A. Social capital: its origins and applications in modern sociology. Annu Rev Sociol 1998, 24, 1–24. 549 26. Woolcock, M.; Narayan, D. Social capital: Implications for development theory, research, and policy. World 550
Bank Res Obser 2000, 15, 225–249. 551 27. Leonard, R.; Onyx, J. Networking through loose and strong ties: an Australian qualitative study. Voluntas 552
2003, 14, 189–203. 553 28. Kim, Y. Social network analysis. J Korean Regional Dev Assoc 2012, 24, 115–130. 554 29. Wellman, B. Computer networks as social networks. Science 2001, 293, 4. 555 30. Wellman, B. The Persistence and Transformation of Community: From Neighbourhood Groups to Social 556
Networks. Report to the Law Commission of Canada 2001, 45, 436. Available online: 557 http://groups.chass.utoronto.ca/netlab/wp-content/uploads/2012/05/The-Persistence-and-Transformation-558 of-Community-From-Neighbourhood-Groups-to-Social-Networks.pdf (Accessed 20 June 2019). 559
31. Mandarano, L. A. Social network analysis of social capital in collaborative planning. Soc Nat Resour 2009, 560 22, 245–60. 561
32. Hajer, M.; Zonneveld, W. Spatial planning in the network society—rethinking the principles of planning in 562 the Netherlands. Eur Plan Stud 2000, 8, 337–355. 563
33. Ro, J.; Koo, J. The analysis of an impact of resident activities on social capital in residential environment 564 improving projects. J Korean Regional Dev Assoc, 2012, 24, 115–130. 565

Sustainability 2019, 11, x FOR PEER REVIEW 5 of 19
34. Lee, Y. Features and issues of an urban community by analysing residents’ awareness and attitude. J Korean 566 Assoc Regional Geogr 2014, 20, 269–281. 567
35. Cyram. 2016. Study of residents-relationship network of residents’ centers in Seoul. Community Support Center 568 of Seoul. 569
36. Harary, F. Graph Theory. Addison-Wesley: New York, USA, 1969. 570 37. Freeman, L.C. Centrality in social networks: I. Conceptual clarification. Soc Networks 1979, 1, 215-239. 571 38. Borgatti, S.P.; Everett M.G. Models of core/periphery structures. Soc Networks 1999, 21, 375–395. 572 39. Burt, R.S. Range. In Applied Network Analysis: A Methodological Introduction; Burt, R. S., Minor, M. J., Eds.; 573
Sage Publications: Beverly Hills, USA, 1983; pp. 176–194. 574 40. Ryan L.; D’Angelo A. Changing times: Migrants’ social network analysis and the challenges of longitudinal 575
research. Soc networks 2018, 53, 148-158. 576 41. Snijders, T. Models for longitudinal network data. In Models and Methods in Social Network Analysis; 577
Carrington, P.J., Scott, J., Wasserman, S., Eds.; Cambridge University Press: New York, USA, 2005; pp. 215–578 247. 579
42. Bidart, C.; Lavenu, D. Evolutions of personal networks and life events. Soc Networks 2005, 27, 359-376 580 43. Borgatti, S. P.; Brass, D. J.; Daniel S. Halgin Social network research: confusions, criticisms, and controversies 581
Res Sociol Organ 2014, 40, pp. 1–29. 582 44. Barabási, Albert-László. Network Science Graph Theory; Northeastern University: Boston, USA, 2016; pp. 8–583
10. Available online: http://barabasi.com/f/625.pdf 584 45. Brass, D. Power in Organizations: A Social Network Perspective. In Research in Politics and Society; Moore, 585
G., White J.A., Eds. JAI Press: Greenwich, England, 1992; 295–323. 586 46. Wellman, B. Structural Analysis: From Metaphor to Theory and Substance. In Social Structures: A Network 587
Approach; Wellman, B., Berkowitz, S.D. Eds.; Cambridge University Press: New York; 19–61. 588 47. Stephen P. Borgatti & Candace Jones 1998 “Network Measures of Social Capital” CONNECTIONS 21(2): 27-589
36 590 48. Lee, Y.H., Baek H.S., Lee S. S., Im, J.M. Lee, S.J. Choi, J.S. (2014) A Study on the Implementation of Urban 591
Regeneration Support Organization: Focused on the Urban Regeneration Coordinator Promotion Plan, 592 Seoul, KOREA LAND & HOUSING CORPORRATION(LH). Available online: 593 http://lhi.lh.or.kr/common/include/file_download.asp?category=memberdata&idx=333 (Accessed 20 June 594 2019). 595
49. Sung, S. A. Impact Analysis of the Residents Participation Activities in Urban Regeneration Projects. 596 Doctorate dissertation, Chungbuk National University, 2015. 597
598
© 2019 by the authors. Submitted for possible open access publication under the terms
and conditions of the Creative Commons Attribution (CC BY) license
(http://creativecommons.org/licenses/by/4.0/).
599

![A DISCUSSION WITH PANTELIS SKAYANNIS ON URBAN REGENERATION [in Greek]](https://static.fdokumen.com/doc/165x107/6320c4324d56c588170f78e4/a-discussion-with-pantelis-skayannis-on-urban-regeneration-in-greek.jpg)