Social inclusion and income distribution in the European Union
291
European Commission Directorate-General "Employment, Social Affairs and Equal Opportunities" Unit E1 - Social and Demographic Analysis Manuscript completed in December 2006 European Commission Social Inclusion and Income Distribution in the European Union Monitoring Report prepared by the European Observatory on the Social Situation - Social Inclusion and Income Distribution Network http://www.applica.be
-
Upload
khangminh22 -
Category
Documents
-
view
0 -
download
0
Transcript of Social inclusion and income distribution in the European Union

European Commission Directorate-General "Employment, Social Affairs and Equal Opportunities"
Unit E1 - Social and Demographic Analysis
Manuscript completed in December 2006 European Commission
Social Inclusion and Income Distribution in the European Union Monitoring Report prepared by the European Observatory on the Social Situation - Social Inclusion and Income Distribution Network
http://www.applica.be

Social Inclusion and Income Distribution1
The analysis presented in this report was carried out by Terry Ward, Loredana Sementini, Mayya Hristova and Silvia Di Sante (Applica, Brussels), Asghar Zaidi, Orsolya Lelkes and Mattia Makovec (European Centre for Social Welfare Policy and Research, Vienna), István Tóth, Péter Szivós, András Gábos, Márton Medgyesi, Keller Tamás and Bernat Aniko (Tarki, Budapest), Holly Sutherland, Horacio Levy and Alari Paulus (ISER, University of Essex), Olivier Bargain (IZA, Bonn), Tim Callan (ESRI, Dublin) and Manos Matsaganis (Athens University of Economics & Business).
Terry Ward was responsible for coordination and editing.
For Chapter 11 on country policy developments, detailed contributions were also received from Kristian Orsini, Katholieke Universiteit Leuven (Belgium), Magdalena Kotynkova, Research Institute for Labor and Social Affairs (Czech Republik), Niels Ploug, The Danish National Institute of Social Research (Denmark), Lauri Leppik, PRAXIS Center for Policy Studies (Estonia), Mark Chandler – Baltic International Centre for Economic Policy Studies-BICEPS (Latvia), Romas Lazutka, Institute for Social Research (Lithuania), Frédéric Berger, CEPS/INSTEAD (Luxembourg), Gyorgyi Vajda, Ministry of Youth, Family, Social Affairs and Equal Opportunities (Hungary), Frances Camilleri-Cassar, University of Malta (Malta), Hugo Swinnen - Verwey-Jonker Instituut (Netherlands), Michael Fuchs, European Centre for Social Welfare Policy and Research (Austria), Irena Topinska, Warsaw University (Poland), Carlos Farinha Rodrigues, CISEP - Centro de Investigacao Sobre Economia Portuguesa (Portugal), Erika Kvapilova, United Nations Development Fund for Women (Slovakia), Tine Stanovnik, University of Ljubljana (Slovenia), Heikki Viitamaki, VATT (Finland), Joakim Palme, Swedish Institute for Social Research (Sweden), Teodora Noncheva, National Social Security Institute (Bulgaria), Livia Popescu, University „Babes Bolyai” Cluj (Romania), Paul Stubbs and Danijel Nestic, Institute of Economics, Zagreb (Croatia) and Gozde Sener, Boğazıçı University (Turkey).
1 The views expressed in this document are those of the authors and do not necessarily represent those of the European Commission.

Social Situation Observatory – Social inclusion and Income distribution Final report
Social Situation Observatory – Social inclusion and Income distribution 3
Table of contents
1. INCOME INEQUALITY AND POVERTY IN THE EU: RECENT DEVELOPMENTS AND TRENDS............................4
2. ECONOMIC GROWTH AND INCOME INEQUALITIES IN EUROPEAN COUNTRIES 2000-2004 ...........................44
3. DECOMPOSITION OF INEQUALITIES IN HOUSEHOLD INCOME IN THE EU........................................................62
4. SELECTED CASE STUDIES OF CHANGES IN INCOME DISTRIBUTION...............................................................86
5. THE EFFECT OF TAXES AND BENEFITS ON INCOME DISTRIBUTION IN THE EU ...........................................107
6. DYNAMICS OF POVERTY IN THE EU15 (1994-2001) ............................................................................................150
7. WHY ARE THE POOR POOR? THE ROLE OF LABOUR MARKET AND DEMOGRAPHIC FACTORS, INCLUDING HEALTH AND IMMIGRATION..............................................................156
8. NON-INCOME MEASURES OF DEPRIVATION.......................................................................................................184
9. THE SITUATION OF ROMA IN CENTRAL AND EASTERN EUROPE....................................................................212
10. THE POSITION OF ETHNIC MINORITIES ACROSS THE EU.................................................................................231
11. RECENT POLICY DEVELOPMENTS AFFECTING INCOME DISTRIBUTION........................................................247

Social Situation Observatory – Social inclusion and Income distribution Final report
Social Situation Observatory – Social inclusion and Income distribution 4
1. INCOME INEQUALITY AND POVERTY IN THE EU: RECENT
DEVELOPMENTS AND TRENDS2
Evidence
INCOME INEQUALITY
The inequality measure used as a primary Laeken indicator is the income quintile ratio, which
shows the ratio of income share received by the 20% of a country’s population with the highest
income (top quintile) to that received by the 20% with the lowest income (lowest quintile). The
difference between countries with the lowest and highest levels of income inequality, as
measured by the quintile ratio, is around two to one within the current European Union (Fig. 1).
In Slovenia, Sweden, Czech Republic and Denmark, the quintile ratio is 3. On the other extreme,
it reaches 7 in Portugal, indicating that the top fifth of the income distribution has 7 times
higher incomes than the bottom fifth. The average for EU25 countries is just below 5, and 20
out of 29 countries this ratio is between 4 and 6. In general, Mediterranean and Anglo-Saxon
countries tend to have higher than average inequality, while Nordic countries tend to have lower
than average levels. Evidence for the ex-Socialist countries and Cyprus, the last round of
enlargement countries, is mixed: they do not cluster at any particular level. There is disparity
even among those countries which have geographical proximity and common historical
development paths. For example, while the Czech Republic is one of the most equal countries,
inequality in Slovakia is relatively high. While two of the Baltic States, Latvia and Estonia tend to
have above average degrees of inequality, this is not true for the third State, Lithuania.
Inequality in Turkey surpasses that of all other EU and candidate countries, and the quintile
ratio is as high as 10. As for the other candidate countries, income inequality in Croatia and
Romania seems to be around the EU25 average, while it is somewhat lower in Bulgaria.
The quintile ratio highlights the general disparity of incomes, although it does not necessarily
reveal the differences between the most needy and the most affluent sections of the
population. These groups, however, are very difficult to capture in general household surveys.
According to a study of Atkinson (2003), focusing only on the richest, the share of the top 0.5%
reached 10% of total incomes in the UK in 2000 (see Fig. A1 in Appendix A - which is included
here for illustrative purposes). Some additional analyses on income differences across bottom,
middle and top income quintiles are presented below. As regards the relationship between
2 Orsolya Lelkes, Asghar Zaidi, European Centre for Social Welfare Policy and Research, Vienna

Social Situation Observatory – Social inclusion and Income distribution Final report
Social Situation Observatory – Social inclusion and Income distribution 5
inequality and social expenditure, as Fig. 2 shows, although countries with higher social
spending tend to have a somewhat lower level of inequality, the relationship is far from linear.
At a given level of social expenditure, therefore, say 25% of GDP, the Gini coefficient ranges
between 0.22 and 0.38. This suggests not that the overall level of social expenditure does not
matter as such, but rather, that the structure of this expenditure: how and on whom this money
is spent, may be important.
Fig. 1: Income inequality, as measured by quintile ratio, among the total population in EU25 and the
candidate countries
Source: Eurostat (2006), NewCronos database, except HU: EU-SILC 2004
Reference year: 2004, except: NL, UK, CZ, EE, CY, LV, LT, HU, PL, SI, SK: 2003; MT: 2000
Quintile ratio
0
1
2
3
4
5
6
7
8
9
10
11
SI
SE CZ
DK FI LU AT
BE
BG NL
CY
FR DE
HU LT HR
RO
EU
25 IE PL
ES
UK IT SK
EE
GR LV PT
TR

Social Situation Observatory – Social inclusion and Income distribution Final report
Social Situation Observatory – Social inclusion and Income distribution 6
Fig. 2: Relationship between social expenditures and income inequality (Gini Coefficient)
2a) Gini Index & social expenditure in EU25 (2003)
y = -0.3193x + 36.589R2 = 0.2084
20
22
24
26
28
30
32
34
36
38
40
0 5 10 15 20 25 30 35 40Social expenditure in percent of GDP
Gin
i Ind
e
Source: Eurostat (2006), NewCronos database
Reference year: 2004, except: NL, UK, CZ, EE, CY, LV, LT, HU, PL, SI, SK: 2003; MT: 2000
Income inequality indicators conceal differences between countries in absolute monetary terms.
Our calculations on the income distribution compare the Euro value of the highest income of
the bottom 20%, and the lowest income of the top 20% (see Fig. 3). In other words, we observe
the difference between the cut-off points for the bottom and top income quintile. As the
bottom quintile may be regarded as one definition of the poverty threshold, this can be
regarded as comparing the income thresholds of the affluent and the poor. The income gap
between the affluent and the poor is the highest in Luxembourg, and is also relatively large in
Ireland, while on the other hand, it is very small in Estonia. The figure also highlights the
disparity of income levels across countries. Someone may belong to the top 20% of the income
distribution in Estonia, Portugal and Greece, and have lower income than some people in the
bottom 20% in Denmark and Luxembourg.

Social Situation Observatory – Social inclusion and Income distribution Final report
Social Situation Observatory – Social inclusion and Income distribution 7
Fig. 3: Spread of income distribution between the bottom and top 20%
Source: Authors calculation based on EU-SILC, 2004
Notes: EU-SILC was launched in 2004 in 13 MS. This first release of the cross sectional data refers mainly to income reference year 2003. The current release corresponds thus to cross sectional data for a limited set of countries.
It is also interesting to analyse what is the likelihood that different population subgroups
belong to top, bottom and middle income classes. Figure 4 presents these results for Ireland
(which is identified as a median country from Figure 3), using subgroups based on household
type categorisations. These results highlight whether a subgroup is more (or less) likely to be a
member of an income class relative to the total population. For instance, the value of 2.7 for
one-person households in the bottom quintile implies that this subgroup's "risk" of belonging
to the bottom income quintile is 2.7 times higher than that observed for the total population.
Single parent households are the other subgroup which has a considerably high risk of
belonging to the bottom income quintile in Ireland (2.8 times more likely than the total
population). In contrast, two adults (both aged less than 65) with no dependent children and
other households without dependent children are more likely to belong to the top income
quintile.
Spread of the income distribution between the bottom and top 20% (p20-p80)
0
500
1000
1500
2000
2500
3000
3500
4000
4500
EE PT GR ES IT BE IE FR AT FI SE DK LU NO
Equi
valis
ed d
ispo
sabl
e in
com
e (E
uro,
100
0s)
P80
P20

Social Situation Observatory – Social inclusion and Income distribution Final report
Social Situation Observatory – Social inclusion and Income distribution 8
Fig. 4: Relative Risk Ratio (RRR) of membership of Income Quintiles (in Ireland)
Source: Authors’ calculation using 2004 EU-SILC data for Ireland.
These results for other 12 EU countries (for whom the 2003 EU-SILC data are currently
available) are presented in Table A.3 (in Annex A). In almost all countries, both single person
and single parent households are more likely to belong to the bottom income quintile; with a
notable exception of Belgium and Portugal (single person households in Belgium are not great
deal more likely to be in the bottom income quintile, and the same is true for single parent
households in Portugal).
Figure 5 presents the results using the employment status categorisation (the results for Ireland
only). It is not surprising to find that persons in employment are more likely to belong to the
top income quintile and the unemployed and inactive persons are more often found in the
bottom income quintile. The retired persons in Ireland are also more likely to be in the first two
income quintiles. These results for other 12 EU countries are presented in Table A.4 (in Annex
A). Without exception, employed persons are more likely to belong to the top income quintile in
all countries (although the differentials are less pronounced in Portugal, Italy and Greece). The
unemployed persons are more likely to fall in the bottom income quintile in almost all countries
(although there are notable differences in the value of the relative risk ratio: ranging from 2.7 in
Luxembourg to 1.3 in Portugal). The same is true for the inactive (non-retired) persons – the
relative risk ratio for this group to fall in the bottom quintile is high in France (2.1) and Estonia
(2.1) and relatively low in Denmark (1.3) and Greece (1.2). Retired persons are also considerably
more likely to belong to the bottom income quintile in Denmark (1.8), Finland (1.6), Ireland
(1.6) and Sweden (1.6). Luxembourg is the only country where retired persons are more likely to
be in the top income quintile.
0,00
1,00
2,00
3,00
One personhousehold
2 adults, nodependent,both adultsunder 65
2 adults, nodependent,at least one
adult 65
Otherhouseholds
withoutdependent
Single parenthousehold,one or moredependent
2 adults, onedependent
child
2 adults, twodependentchildren
2 adults,three or
moredependentchildren
Otherhouseholds
withdependentchildren
RR
R
1st2nd3rd4thTop

Social Situation Observatory – Social inclusion and Income distribution Final report
Social Situation Observatory – Social inclusion and Income distribution 9
Fig. 5: Relative Risk Ratio (RRR) of membership of Income Quintiles in Ireland
Source: Authors’ calculations using 2004 EU-SILC data for Ireland.
INCOME POVERTY
Some 75 million people have income below the (relative) poverty level in the European Union,
using country-specific poverty thresholds, the standard measure of poverty in the EU (see Table
A.1 in Appendix A). The cut-off point for this poverty threshold is 60% of the national median
income. The greatest number of poor people lives in countries which also have large
populations, in particular Germany, Italy, UK, France, Spain and to a lesser extent Poland (see
Figure 6). In the former five countries the total number of poor reaches 52 million, which
suggests that almost 70% of the “European poor” defined in these terms live in these countries.
0,00
1,00
2,00
3,00
Employed Unemployed Student Retired Other inactive
RR
R
1st
2nd
3rd
4th
Top

Social Situation Observatory – Social inclusion and Income distribution Final report
Social Situation Observatory – Social inclusion and Income distribution 10
Fig. 6. Concentration of those at-risk-of-poverty
Source: Eurostat (2006), NewCronos database, except HU: EU-SILC 2004
Reference year: 2004, except: NL, UK, CZ, EE, CY, LV, LT, HU, PL, SI, SK: 2003; MT: 2000
The variation in poverty rates, using the standard nation-specific poverty thresholds, is
relatively wide across Europe. As Figure 7 shows, Turkey, where the proportion below the
poverty line reaches 26% (using 60% of national median income as the threshold) is at the top
end of the scale, while Slovakia, Portugal and Ireland have the highest share of population
below this level among the current EU countries. The smallest shares are in the Czech Republic,
Slovenia, Denmark, Finland, Sweden and Luxembourg, where (relative) poverty rates defined in
these terms range between 8% and 11%.
The ranking of countries does not change significantly if the alternative poverty threshold of
50% of national median income is used. On this measure, poverty rates range between 4%
(Czech Republic) and 16% (Slovak Republic) within the EU, and reach 18% in Turkey. In other
words, although these alternative thresholds indicate a different extent of poverty due to the
different monetary value of the cut-off point, they both reveal very similar levels of inequality in
comparative terms. Either of them could be used as outcome measures for policy assessment.
0,00
10,00
20,00
30,00
40,00
50,00
60,00
70,00
80,00
LU CY SI EE LV LT FI DK CZ IE SE AT SK HU BE NL PT GR PL ES FR UK IT DE
Cum
ulat
ive
mill
ions
of p
eopl
e

Social Situation Observatory – Social inclusion and Income distribution Final report
Social Situation Observatory – Social inclusion and Income distribution 11
Fig. 7: Poverty rates in EU25 and the candidate countries, using 50% as well as 60% of median poverty
thresholds
Source: Eurostat (2006), NewCronos database, except HU: EU-SILC 2004
Reference year: 2004, except: NL, UK, CZ, EE, CY, LV, LT, HU, PL, SI, SK: 2003; MT: 2000
The ex-Socialist countries do not seem to perform any better or worse than EU Member States
overall, nor do they do seem to cluster together. The Czech Republic and Slovakia are the most
marked cases, the former having the lowest rate of relative poverty, the latter the highest. This,
however, is subject to the figures on which this finding is based, which come from national and
not necessarily directly comparable sources, being accurate, a condition which can only be
tested once data from the new EU-SILC become available. In addition, while Hungary and
Slovenia, Latvia and Bulgaria have lower than average levels of relative poverty, Latvia, Romania,
Poland, Estonia and Lithuania have higher than average figures. There is, therefore, no sign in
this respect of a common inheritance of the past relatively generous social welfare systems.
Poverty rates
0
5
10
15
20
25
30
CZ SI FI D
K LU SE NL
AT
HU FR LT BE
CY
BG
EU
25 DE LV RO PL
UK
EE
HR IT GR ES IE PT
SK
TR
%
50%60%

Social Situation Observatory – Social inclusion and Income distribution Final report
Social Situation Observatory – Social inclusion and Income distribution 12
The extent of poverty: poverty gaps
How poor are the poor? The poverty rates, on which the discussion so far has focussed, indicate
how many people have incomes below the particular threshold chosen, but reveal nothing
about the extent of their poverty. This aspect is explored in some detail in this section. The
‘poverty gap’ (the Laeken indicator termed the “relative median poverty risk gap”), measured as
the difference between the median income of persons below the poverty threshold and the
threshold itself, expressed as a percentage of the threshold, indicates the extent to which the
incomes of the poor fall below the poverty threshold on average. In policy terms, it shows the
scale of transfers which would be necessary to bring the incomes of the poor up to the poverty
Box. Differences in relative poverty thresholds
The poverty threshold used in the analysis is a relative one and country-specific, 60% of median income in each country. These thresholds in terms of purchasing power, however, differ greatly across countries.
Poverty thresholds in specific countries compared to EU15 average, (% difference)
EU-25 poverty treshold
New Member States poverty treshold
-90%
-75%
-60%
-45%
-30%
-15%
0%
15%
30%
45%
60%
75%
90%
lu at nl uk dk de be fr ie se fi cy it es mt gr si pt cz hr hu sk pl ee lt bg lv ro

Social Situation Observatory – Social inclusion and Income distribution Final report
Social Situation Observatory – Social inclusion and Income distribution 13
threshold level. In the following analysis, the conventional threshold of 60% of median
equivalised income is used to calculate the poverty gap. Note, however, that the resulting gaps
indicate the average income of those below the threshold, but not the distribution of incomes
between them.
Table 1. Relative median at-risk-of-poverty gap by gender and selected age groups
Males total Females total
Males between 16-64
Females between 16-64
Males 65 + Females 65+ Total less
than 16 year
EU 25 22 22 23 23 17 17 23 EU 15 22 22 23 24 17 17 23 New Member States 22 21 22 21 13 13 23 Belgium 24 22 25 24 19 17 22 Czech Republic 17 15 17 15 6 8 15 Denmark 22 18 27 21 7 9 19 Germany 24 25 23 27 17 19 31 Estonia 25 23 29 27 8 10 24 Greece 24 25 25 25 23 27 19 Spain 26 24 27 27 24 20 26 France 19 19 22 22 10 12 19 Ireland 20 18 21 23 13 10 24 Italy 26 25 28 29 13 13 28 Cyprus 18 21 15 18 23 25 12 Latvia 24 22 25 26 6 8 25 Lithuania 22 19 24 22 11 14 21 Luxembourg 17 16 17 20 14 14 15 Hungary 20 19 23 22 9 11 19 Malta 19 17 19 17 18 17 20 Netherlands 20 19 24 21 8 7 18 Austria 19 20 18 23 26 20 18 Poland 24 23 24 23 16 15 25 Portugal 25 27 29 30 17 19 29 Slovenia 20 18 21 20 17 16 22 Slovakia 42 38 45 41 18 16 38 Finland 15 14 17 15 9 10 14 Sweden 20 17 26 23 10 13 13 United Kingdom 20 19 25 21 15 19 17 Bulgaria 20 18 21 20 8 14 24 Croatia 23 21 21 21 26 21 23 Romania 21 22 22 21 17 21 23 Turkey 31 31 29 30 29 32 34
Note: Reference year: 2004, except CZ, EE, CY, LT, LV, HU, NL, PL, SI, SK, UK, CR, RO, TR: 2003; MT: 2000

Social Situation Observatory – Social inclusion and Income distribution Final report
Social Situation Observatory – Social inclusion and Income distribution 14
The poverty gap is largest in Slovakia, reaching 42 for men and 38 for women, followed by
Turkey, with a figure of 31 for both sexes (see Table 1). On the other hand, the poor have a less
severe financial disadvantage in the Czech Republic, Luxembourg, and Finland, with poverty
gaps ranging between 14 and 17. These results suggest that there is some correlation between
poverty rates and the size of the poverty gap: it seems better to be poor in low-poverty
countries, as the poor tend to have higher incomes in relative terms. This might reflect the
tendency for low poverty countries to have flatter distributions of income.
The poverty gap varies substantially across age groups, but less so between men and women.
We cannot observe a general gender pattern across countries. The poverty gap is wider for men
than for women in many countries, especially Denmark, Lithuania, Slovakia and Sweden. In a
large number of countries, there are no major differences between men and women, while in a
few others, for example in Cyprus and Portugal, the poverty gap is larger for women. The depth
of poverty varies substantially across age groups. Poverty in old age tends to be less severe. In
most countries, the poor aged 65 and over experience a smaller income disadvantage than the
younger age groups, while in others the situation of people of pensionable age does not differ
significantly from that of other age groups. Only in a few cases, specifically men in Austria and
Croatia and both men and women in Cyprus, is the poverty gap of the elderly comparatively
large.
TRENDS I POVERTY AND INCOME INEQUALITY SINCE THE 1990s
Trends in income inequality
Förster and d'Ercole (2005) compiled estimates of long run inequality trends for all OECD
countries, using perhaps the most consistent method and by relying on national data sources.
In Table 2, results for EU25 and candidate countries are included. These results show that there
are clearly different trends for different sub-periods and for different countries. The United
Kingdom is the only country that experienced an increase during all three subperiods (mid-
1970s to mid-1980s; mid-1980s to mid-1990s; and mid-1990s to 2000), although the rise in
inequality for later two periods is ‘moderate’ or ‘small’. Finland and Sweden are the only two
countries which have seen marked increases in inequality during the latest period.

Social Situation Observatory – Social inclusion and Income distribution Final report
Social Situation Observatory – Social inclusion and Income distribution 15
Table 2: Overall trends in income inequality: summary results for overall entire population Strong
decline Moderate decline
Small decline
No change Small increase Moderate increase
Strong increase
Mid-1970s to mid-1980s
Greece Finland Sweden
Netherlands United Kingdom
Mid-1980s to mid-1990s
Spain Denmark Austria France Greece Ireland
Belgium Germany Luxembourg Sweden
Czech Rep. Finland Hungary Netherlands Norway Portugal United Kingdom
Italy Turkey
Mid-1990s to 2000
Turkey France Ireland Poland
Czech Rep. Germany Hungary Italy Luxembourg Netherlands Portugal
Austria Denmark Greece Norway United Kingdom
Finland Sweden
Note: "Strong decline/increase" denotes a change in income inequality above +/- 12%; "moderate decline/increase" a change between 7 and 12%; "small decline/increase " a change between 2 and 7%; "No change" changes between +/- 2%. Results are based on the values of the Gini coefficient in four reference years which may vary among countries. "2000" data refer to the year 2000 in all countries except 1999 for Australia, Austria and Greece; 2001 for Germany, Luxembourg, New Zealand and Switzerland; and 2002 for the Czech Republic, Mexico and Turkey; "Mid-1990s" data refer to the year 1995 in all countries except 1993 for Austria; 1994 for Australia, Denmark, France, Germany, Greece, Ireland, Japan, Mexico and Turkey; and 1996 for the Czech Republic and New Zealand; "Mid-1980s" data refer to the year 1983 for Austria, Belgium, Denmark and Sweden; 1984 for Australia, France, Italy and Mexico; 1985 for Canada, Japan, the Netherlands, Spain and the United Kingdom; 1986 data for Finland, Luxembourg, New Zealand and Norway; 1987 for Ireland and Turkey; 1988 for Greece; and 1989 for the United States. For the Czech Republic, Hungary and Portugal, the period mid-80s to mid-90s refers to early to mid-90s.
Source: Adapted from Förster and d'Ercole, 2005.
Another recent OECD study explores the link between trends in inequality and unemployment
and finds no general relationship (Burniaux, Padrini and Brandt, 2006). In the period since
1993-1994, among countries where unemployed declined, inequality fell in four of them, but
increased in five others. Among countries with rising unemployment, the Czech Republic and
Luxembourg experienced rising inequality, while the opposite holds for Austria and Germany.
Similarly, they find only a weak link between unemployment trends and changes in relative
poverty.

Social Situation Observatory – Social inclusion and Income distribution Final report
Social Situation Observatory – Social inclusion and Income distribution 16
Source: Burniaux, Padrini and Brandt, 2006
Due to the inaccessibility of suitable micro dataset, it is not possible for us to provide a
systematic comparison on changes in different parts of the income distribution for all EU
countries. We refer here to OECD analyses which report on the gains and losses of income
shares by income quintiles during the period from the mid-1980s to mid-1990s (Förster and
d'Ercole 2005). They note that movements at the higher end dominated the changes in income
distribution for the majority of countries. Results included in Table 3 below indicate that in 6
out of 15 EU countries persons in the top quintile increased their share of disposable income
(more notably in Finland and Sweden), while 2 other countries gained in the middle income
quintiles (most notably in Ireland). In a majority of countries, income shares in the bottom,
middle and top quintiles remained broadly unchanged from the mid-1990s to early 2000.

Social Situation Observatory – Social inclusion and Income distribution Final report
Social Situation Observatory – Social inclusion and Income distribution 17
Table 3. Changes in income share by income quintile; for the total population, from mid-1990s to
early 2000 Bottom quintile Middles quintiles Top quintile
Austria - = +
Czech Republic = = =
Denmark = - +
Finland - - +++
France = = =
Germany = + =
Greece = - +
Hungary = = =
Ireland - +++ ---
Italy = = =
Luxembourg = = =
Netherlands = = =
Portugal = = =
Sweden - - +++
United Kingdom = - +
Note: The table shows percentage point changes in the shares of equivalised disposable income received by each quintile of the population. +++ denotes an increase of more than 1.5 percentage points in the share of disposable income received by the each quintile group; + denotes increase of between 0.5 and 1.5 percentage point. = denotes changes between -0.5 and +0.5 percentage points. - denotes decrease between 0.5 and 1.5 percentage point. --- denotes decrease of more than 1.5 percentage points.
Source: Förster and d'Ercole (2005) (Table 2 adapted)
Trends in overall poverty rates
Trends is overall poverty rates are presented in Table A.2 of Appendix A. Below, in Table 3,
these trends are summarised for two sub-periods: for 1995-2001 when the ECHP data was
available (only for the EU15 countries) and for the period after 2001. For the later period,
results for those countries are included which have already provided two years of data from the
EU-SILC survey (Belgium, Denmark, Greece, Ireland, Luxembourg, and Austria) and for those
New Member States which have at least three data points (Hungary, Lithuania and Estonia).
During the period 1995-2001, an increase in the poverty rate is observed for Ireland, France
and Finland. In contrast, for the same period, a decline in the poverty rate is observed for
Portugal, Greece, Italy and the UK as well as for Germany, Austria, and Belgium. In the period
after 2001, only limited evidence is available. Results included below show that Hungary and
Luxembourg showed an increase in the overall poverty rate whereas Denmark, Lithuania and
Greece have seen a decline in the rate.

Social Situation Observatory – Social inclusion and Income distribution Final report
Social Situation Observatory – Social inclusion and Income distribution 18
Table 4. Trends in poverty in countries with low, medium and high levels of poverty
Period: 1995-2001
Poverty trend
Decline No significant change or unclear trend
Increase
Low Luxembourg Denmark Sweden Netherlands
Finland
Medium Germany Austria Belgium
France Level of poverty
High Portugal Greece Italy UK
Spain
Ireland
Note: (1) Low poverty level: poverty rate<12; Medium poverty level: 12<poverty rate<18; and High level of poverty: poverty rate>18. (2) Changes are not tested for their statistical significance.
Period: after 2001
Poverty trend
Decline No significant change or unclear trend
Increase
Low Denmark Belgium
Luxembourg
Medium Lithuania Estonia Austria
Hungary
Level of poverty
High Greece Ireland Note: Within the EU15 countries, only those countries are included which provided results from both 2003 and 2004 EU-SILC surveys. For the New Member States, countries with data series of at least three years are included.
Trends in child poverty and elderly poverty
Estimates of poverty rates among children are especially problematic because of the
assumptions that need to be made about the weight that should be attached to them within
households relative to adults (ie about the burden they impose on income) and about the share
of household income which they have access to. In practice, the assumptions adopted here are
the conventional ones – that children have a weight of 0.3 relative to the first adult in the
household (ie that they add an additional 30% to household expenditure relative to the latter),

Social Situation Observatory – Social inclusion and Income distribution Final report
Social Situation Observatory – Social inclusion and Income distribution 19
which accords with the so-called OECD-modified scale, and that they have an equal share of
household income (measured in equivalised terms) to everyone else living there. The results are
dependent on these two assumptions,, both of which are debatable, and this should be kept in
mind when interpreting them. It should also be kept in mind that the estimates presented
below, as those above, relate to relative rather than absolute poverty rates and, accordingly,
indicate the risk of poverty rather than deprivation as such.
As mentioned in Appendix B, the most consistent estimates for trends are available only for the
EU15 countries and mainly for the period 1995-2001.3 Results included in Table 4 show that
the experience with respect to changes in the poverty risk for children has been mixed for the
EU15 countries during the period in question. A significant decline in the poverty rate for
children is observed for Germany (from 18% to 14%), Belgium (from 16% to 12%) and Austria
(from 16% to 13%). In contrast, an increase in the poverty rate for children is observed for the
Netherlands (from 13% to 17%), Luxembourg and France (from 16% to 18%) and Spain (from 24%
to 26%). The UK, Ireland, Portugal, Italy and Spain were the countries with the highest risk of
poverty among children in 1995 and this continued to be the case in 2001.
As regards at-risk-of-poverty rates for the elderly, data for more than a few years are
unfortunately available only for EU15 countries, with the exception of Sweden. Moreover, even
for these countries, the most consistent estimates are for the period 1995-2001, which is the
focus here.4 Ireland, Spain, Finland and Austria are the only countries where there was a
significant rise in the risk of poverty for the elderly over this period. Two of these countries
(Ireland and Spain) were among the five with the highest initial risk. In Austria, however, the
poverty rate in 2003 was significantly lower than in 2001, though this might be affected by the
change in data source. On the other hand, Portugal, the UK, France and Luxembourg are the
only countries that experienced a significant fall in the poverty risk for the elderly between
1995 and 2001.
3 For France, the Netherlands, Finland and the UK, we have consistent trends for the period 1995-2000 only. 4 The only notable trend in the latest two years is observed for Denmark and Luxembourg, where there seems to have been a significant decline in the risk of poverty for the elderly population (from 21% to 17% for Denmark; from 12% to 6% for Luxembourg). The opposite trend is observed for France, but the consistency of the data is open to question because of a change in source.

Social Situation Observatory – Social inclusion and Income distribution Final report
Social Situation Observatory – Social inclusion and Income distribution 20
Table 5: Trends in poverty risk of children, using 60% of median income as the poverty line
Notes: The year in the first row refers to the survey year. b Break in the series; in the majority of EU15 countries the results reported under 2001 come from the last wave of the ECHP, and results beyond 2001 are either from national data sources or from EU-SILC. b1: Break in the series, due to a switch from ECHP to another survey; b2: Break in the series, due to a switch to EU-SILC.
Country 1995 1996 1997 1998 1999 2000 2001 2002 2003 2004 Belgium 16 15 14 13 12 11 12 16b2 17 Czech Republic 12 15 Denmark 6 6 7 7 9b2 9 Germany 18 15 15 13 13 13 14 20 20 20 Estonia 21 19 18 20 Greece 18 19 18 17 17 19 18 23b2 20 Spain 24 23 26 24 25 25 26 21b1 19 24b2 France 16 16 16 16 17 18 16b1 16 15 14b2 Ireland 26 27 25 23 21 22 26 22b2 22 Italy 24 24 23 21 22 25 25 26b2 Cyprus 11 Latvia 21 19 19 Lithuania 18 20 20 17 Luxembourg 16 14 16 20 19 18 18 12b2 18 Hungary 17 15 13 17 Malta 21 Netherlands 13 14 13 14 14 17 17b1 17 18 Austria 16 18 15 15 14 12 13 16b2 15 Poland 22 22 23 23 Portugal 26 23 25 26 26 26 27 23b2 Slovenia 9 9 7 9 Slovakia 30 30 Finland 5 5 5 7 6 9b1 10 10 10b2 Sweden 7 7 7 10 11b2
United Kingdom 28 25 27 29 29 27 23b1 23 22

Social Situation Observatory – Social inclusion and Income distribution Final report
Social Situation Observatory – Social inclusion and Income distribution 21
Table 6: Trends in poverty rate of elderly population, using 60% of median income as the poverty line
Country 1995 1996 1997 1998 1999 2000 2001 2002 2003 2004
Cyprus 58 52
Ireland 19 22 27 33 34 42 44 41b2 40
Spain 16 14 16 15 16 19 22 28 b1 28 30b2
Portugal 38 36 37 35 33 33 30 : 29b2
Greece 35 33 34 35 33 31 33 28b2 28
United Kingdom 32 28 25 25 21 24 25b1 26 24
Belgium 25 25 23 22 22 24 26 23b2 21
Malta 20 :
Slovenia 21 20 19 19
Austria 20 21 22 21 24 23 24 16b2 17
Denmark 24 21b2 17
Estonia 16 18 16 17
Finland 12 12 16 16 19 18 18 17 17b2
France 19 18 17 18 19 19 11 b1 10 11 16b2
Italy 18 18 17 17 14 13 17 : 16b2
Germany 15 17 12 12 11 10 15 17 16 15 Latvia 6 10 14
Sweden 16 15 : 14b2
Lithuania 14 12 12 12
Slovakia 13 11
Hungary 8 12 8 10
Netherlands 8 7 4 4 7 6 9 b1 8 7
Luxembourg 12 9 9 9 8 9 7 12b2 6
Poland 8 7 7 6
Czech Republic 6 4
Notes: See the notes for Table 4

Social Situation Observatory – Social inclusion and Income distribution Final report
Social Situation Observatory – Social inclusion and Income distribution 22
Demographic factors
AGE
Figure 8a presents the risk of poverty among children in comparison with the poverty risk for
the overall population. Within the EU15 countries, the highest at-risk-of-poverty rate among
children is in Italy (26%), Spain (24%), Portugal (23%), Ireland (22%) and the UK (22%). With the
exception of Ireland, these countries exhibit a significantly higher poverty risk for children than
for the overall population. Greece and Germany are only slightly behind (with 20% at-risk-of-
poverty rate amongst children) – Greece has the same poverty risk for the overall population,
whereas in Germany, the at-risk-of-poverty rate for children is 25% greater than for the overall
population. In the new Member States, only Poland, Slovakia and Estonia have at-risk-of-
poverty rates among children in excess of 20%, although in almost all of these countries the
rate for children is higher than for the overall population. Two notable exceptions are Cyprus
and Slovenia, where the poverty risk among children is lower than for the overall population. In
the candidate countries, by far the highest poverty risk among children is in Turkey (34%), while
Croatia stands out as having a relatively low rate.
Figure 8b presents the risk of poverty among the elderly in comparison with that for the overall
population. By far the highest at-risk-of-poverty rate for the elderly is in Cyprus (52%), while
all other Member States with relatively high rates are EU15 countries: Ireland (40%), Spain
(30%), Portugal (29%), Greece (28%), and the UK (24%). The new Member States for the most part
have the lowest rates – the average poverty risk for the elderly in the EU15 (around 19%) being
more than twice as high as that in the new Member States (around 9%). With the exception of
Cyprus, Malta and Slovenia, all new Member States seem to do relatively well in protecting
their elderly citizens from the risk of (relative) poverty. The same is also true of the
Netherlands, Luxembourg, Italy and Germany. Elsewhere in the EU15, the risk of poverty among
the elderly is considerably higher than for the overall population – most notably in Ireland
where it is almost twice as high as for the latter.5
It should be noted, however, that an important resource for many of the elderly is their free
access to housing as they are more likely to be home owners than those younger. The figures
here do not take account of this and accordingly they may overestimate the proportion of the
elderly effectively at risk of poverty once allowance is made for this factor.
5 For Ireland, the median poverty gap is rather low for the elderly (11% for Ireland as opposed to 16% for the whole of EU25. For more details on other aspects of poverty amongst the elderly, see Zaidi et al. (2006).

Social Situation Observatory – Social inclusion and Income distribution Final report
Social Situation Observatory – Social inclusion and Income distribution 23
HOUSEHOLD COMPOSITION
Figure 9a shows the relative risk of poverty among households without dependent children. In
almost all countries, this sub-group is a low risk group with the rate being lower than for the
overall population. A notable exception is Cyprus where the households in question have a
significantly higher risk of poverty (28%) than for the population as a whole (15%). Other
countries with comparatively high rates for this sub-group are Slovenia (13% vs. 10%), Denmark
(14% vs. 11%) and Finland (14% vs 11%).
Figure 9b shows the relative risk of poverty among two-adult households with one dependent
child. This sub-group also stands out as having a relatively low risk in almost all countries, the
only exceptions being Slovakia, Malta and the Czech Republic.
Figure 9c presents the relative risk of poverty among two adult households with two dependent
children. This sub-group also has one of the lowest risks in almost all countries. The
exceptions are the Southern European countries of Portugal, Spain and Italy as well as Slovakia,
in each of which the risk of poverty for such households is significantly higher than for the
overall population. This is also the case in Luxembourg, though here the overall risk is relatively
low
Figures 9d, 9e and 9f present results for subgroups that are identified as having a high risk of
poverty in almost all EU countries.
Figure 9d shows the relative risk of poverty among two adult households with three or more
dependent children. Not surprisingly, the rates here are in line with those for children as a
whole presented above (in Figure 6a). In particular, the relative risk of poverty for this subgroup
is considerable in the high poverty risk countries of Italy, Spain, Portugal and Slovakia, where it
is more than 60% higher than for the overall population.
Figure 9e shows the relative risk of poverty among single person households. In most
instances, the rates are in line with those for the elderly (presented in Figure 6b above). Cyprus
and Ireland stand out as having considerably higher rates for this group than for the overall
population. Rates are lower in Spain, Portugal, Greece and Slovenia, but still significantly higher
than the rate for the population as a whole. In all the other countries, with the sole exception of
Poland, where the risk is lower, the risk of poverty for those living alone is also higher than the
overall risk, if in most cases only slightly.
Figure 9f shows the relative risk of poverty among single parent households. Without
exception, in all countries, this subgroup has a higher risk than for the overall population.
Within the EU15, over a third of all single parent households have income below the poverty

Social Situation Observatory – Social inclusion and Income distribution Final report
Social Situation Observatory – Social inclusion and Income distribution 24
line in Ireland, the UK, Spain, the Netherlands, Germany, Greece and Italy, while the same is the
case in Malta, Slovakia and Estonia among the new Member States.
LABOUR MARKET FACTORS
LABOUR MARKET PARTICIPATION
Labour market participation, or the lack of it, is a key factor explaining rates of (relative)
poverty among working age population. The unemployed are the most vulnerable group,
though the economically inactive also tend to have higher rates of poverty than those in
employment. This is not surprising, given that earnings from work tend to constitute a
substantial share of total household income.
The incidence of poverty is relatively high among the unemployed in most EU countries – over
twice as high on average as among the total population as a whole (Figure 10). In the UK, Italy,
Germany, Netherlands, Luxembourg, Slovenia, Hungary, the Czech Republic and Malta, the
incidence is at least three times higher. The poverty risk of the unemployed depends on two
main factors: the concentration of unemployment within the household (or more accurately, the
labour market status of other household members) and the unemployment insurance and social
assistance system in the country in question. As regards the former, the more other household
members are also out of work, the higher the risk of poverty. As regards the latter, while the
unemployment insurance system has a clearly positive role in cushioning individuals from the
income shock of job loss and helping them re-enter the labour market, it may also have a
disincentive effect by undermining their willingness to work. The latter depends on the
institutional design of the benefit and income tax system, and in particular on the entitlement
and withdrawal rules when entering part time or full time employment.
The relatively high poverty risk in some countries can be partly explained by the nature of the
unemployment benefit system. In the UK, Italy, Czech Republic for example the maximum
duration of unemployment insurance benefits is 6 months (2002 data, based on OECD 2004). In
these countries, the net replacement rate for the initial period of unemployment is around 50%
for a single person on average earnings. The relationship between the insurance system and the
risk of poverty, however, is not direct, as the latter also depends on the social assistance and
other benefits (such as in respect of housing) which are available to those out of work.
Poverty among the unemployed tends to be relatively high in all the new Member States, with
the exception of Cyprus. In many ex-Socialist countries, the rules governing entitlement to
benefit have been gradually tightened as a result of pressure on the State budget.

Social Situation Observatory – Social inclusion and Income distribution Final report
Social Situation Observatory – Social inclusion and Income distribution 25
SELF-EMPLOYMENT
In many countries, poverty among the self-employed is relatively low, while in some, the
reverse is the case. The number of self-employed with poverty levels of income seems to be
relatively high in Sweden, Austria, and Lithuania, while it is relatively low in Germany, Cyprus
and Luxembourg, There are other countries where the incidence of poverty among this group is
about the same as among the total population. These include Spain, the UK and the Czech
Republic These differences in the relative position of the self-employed may reflect differences
in macroeconomic condition and in the income risks associated with being self-employed (as
compared to being an employee). The empirical literature suggests that entrepreneurship in
itself brings higher job satisfaction and that a large number of people would prefer to be self-
employed than an employee for a given level of income (Blanchflower et al., 2001). Entry into
self-employment, however, is typically limited by capital constraints (Blanchflower and Oswald,
1998). Equally, however, there is evidence that, in some countries, people might become self-
employed to evade tax and/or social contributions (Peter and Bukodi, 2000). This might be the
case predominantly for those with low earnings potential who correspondingly are likely to be
at greater than average risk of poverty.
At the same time, it should be emphasised that survey data on the income of the self-employed
are inevitably much more problematic and uncertain than those on the earnings of employees.
Moreover, given the incentive for the self-employed to understate income for tax purposes, the
data collected on this are almost certainly more likely to be under-estimates than over-
estimates6.
RETIREMENT
As is evident from the data on the elderly reported above, retirement as such does not seem
necessarily to result in a higher risk of poverty, at least not in all countries. In the Czech
Republic, Slovakia, Luxembourg, Netherlands, Poland, and Italy, the rate of poverty among the
retired population is relatively low, in some of them being only half as high as for the total
population. On the other hand, those in retirement tend to have a relatively high risk in the UK,
Portugal, Greece, and Spain and most notably in Ireland and Cyprus.
6 It is also the case that the net income from trading reported by the self-employed might exclude payments made to themselves which are treated in their accounts as business costs.

Social Situation Observatory – Social inclusion and Income distribution Final report
Social Situation Observatory – Social inclusion and Income distribution 26
References
Atkinson, A. B. (2003). Top incomes in the United Kingdom over the twentieth century. Manuscript.
Blanchflower, D.G. and Andrew, O., 1998. What makes an entrepreneur? Journal of Labour Economics, 16 (1), 26-60.
Blanchflower, D.G., Oswald, A. and Stutzer, A., 2001. Latent entrepreneurship across nations. European Economic Review, 45, 680-691.
Burniaux, J-M., Padrini, F. and Brandt, N. 2006. Labour market performance, income inequality and poverty in OECD countries. Economics Department Working Paper No. 500. OECD, Paris
Förster, M., d'Ercole, M. M., 2005. Income Distribution and Poverty in OECD Countries in the Second half of the 1990s. OECD, Paris.
OECD, 2004. Benefits and Wages. OECD, Paris.
Peter, R. and Bukodi, E., 2000. Who are the Entrepreneurs and Where Do They Come From? Transition to Self-employment Before, Under and After Communism in Hungary. International Review of Sociology 2000. 10 (1): 147-171
Zaidi, A., Makovec, M., Fuchs, M., Lipszyc, B., Lelkes, O., Rummel, M., Marin B., De Vos, K. (2006) “Poverty of Elderly People in EU25”, Report submitted to the European Commission, DG Employment, Social Affairs and Equal Opportunities, Brussels.

Social Situation Observatory – Social inclusion and Income distribution Final report
Social Situation Observatory – Social inclusion and Income distribution 27
Annex
Fig. 8a: Child poverty (2004) p y p y
GR
BE
DE
FR
NL
IEPT
LU
ES
AT
DK
IT
FI
UK
SE
MT
LTHU
CZ
PL
LV
SK
SI
CY
EE
HR
TR
ROBG
0
5
10
15
20
25
30
35
0 5 10 15 20 25 30 35
Total poverty rate (%)
Child poverty rate (%)
EU 15NMSCC
45º
Fig. 8b: Elderly poverty (2004)
SE
UK
FI
ITDK
AT
ES
LU
PT
IE
NL
FR DE
BE
GR
EE
CY
SI
SK
LV
PLCZ
HU
LT
MT
BG
RO TR
HR
0
5
10
15
20
25
30
35
40
45
50
55
0 5 10 15 20 25 30 35 40 45 50 55
Total poverty rate (%)
Elderly poverty rate (%)
EU 15NMSCC
45º

Social Situation Observatory – Social inclusion and Income distribution Final report
Social Situation Observatory – Social inclusion and Income distribution 28
Poverty rates by household type (2004)
Fig. 9a: households with no dependent children
GR
BE DEFR
NL
IE
PT
LU
ES
ATDK
IT
FI
UK
SE MTLT
HU
CZ
PL
LV SK
SI
CY
EE
0
10
20
30
0 10 20 30
Total poverty rate (%)
Poverty rates of households without dependent children (%)
EU 15NMS
45º
Fig. 9b: two-adult households with one dependent child
SE
UK
FI
IT
DK
AT
ES
LU
PTIE
NL
FR
DE
BE
GREE
CY
SI
SK
LV
PL
CZHU
LT
MT
0
10
20
30
0 10 20 30
Total poverty rate (%)
Poverty rate of two-adults family with one dependent child (%)
EU 15NMS
45º

Social Situation Observatory – Social inclusion and Income distribution Final report
Social Situation Observatory – Social inclusion and Income distribution 29
Fig. 9c : two-adult households with two dependent children
GR
BEDE
FRNL IE
PT
LU
ES
AT
DK
IT
FI
UK
SE
MT
LT
HU
CZ
PL
LV
SK
SI
CY
EE
0
10
20
30
0 10 20 30
Total poverty rate (%)
Poverty rate of two-adults family with two dependent children (%)
EU 15NMS
45º
Fig. 9d : two-adult households with three or more dependent children
SE
UK
FI
IT
DK
AT
ES
LU
PT
IENL
FR
DE
BE
GR
EE
CY
SI
SKLVPL
CZ
HU
LT
MT
0
10
20
30
40
50
0 10 20 30 40 50
Poverty rate of two-adults family with three or more dependent children (%)
EU 15NMS
45º
Fig. 9e : one-person households with no dependent children
GR
BEDE
FRNL
IE
PT
LU
ES
ATDKITFI UK
SE
MTLT
HU
CZ PL
LV SK
SI
CY
EE
0
10
20
30
40
50
60
0 10 20 30 40 50 60
Total poverty rate (%)
Poverty rate of single persons without dependent children (%)
EU 15NMS
45º

Social Situation Observatory – Social inclusion and Income distribution Final report
Social Situation Observatory – Social inclusion and Income distribution 30
Fig. 9f : lone parents
SE
UK
FI
IT
DK
AT
ES
LU
PT
IE
NL
FR
DEBE
GR
EE
CYSI
SK
LV
PL
CZ
HU
LT
MT
0
10
20
30
40
50
60
0 10 20 30 40 50 60
Total poverty rate (%)
Poverty rate of lone parents (%)
EU 15NMS
45º
Poverty rates by economic activity status (2004)
Fig. 10a: employees
SEUK
FI
IT
DK
ATESLU PT
IENL FRDEBE
GR
EE
CY
SK
MT LV
SICZ
HULTPL
0
10
20
30
40
50
0 10 20 30 40 50
Total poverty rate (%)
Poverty Rate of the employee population (%)
EU 15NMS
45º
Fig. 10b: self-employed
GR
BE
DE
FRNL
IE
PT
LU
ES
AT
DK
IT
FIUK
SE
PLLT
HUCZ SI
LV SK
CY
EE
0
10
20
30
40
50
60Poverty Rate of the self-employed population (%)
EU 15NMS
45º

Social Situation Observatory – Social inclusion and Income distribution Final report
Social Situation Observatory – Social inclusion and Income distribution 31
Fig. 10c: unemployed
SE
UK
FI
IT
DKAT
ES
LU
PT
IENL
FR
DE
BEGR
EE
CY
SKMT LV
SICZ HU
LTPL
0
10
20
30
40
50
60
0 10 20 30 40 50 60
Total poverty rate (%)
Poverty Rate of the unemployed population (%)
EU 15NMS
45º
Fig. 10d: retired
GR
BE
DEFR
NL
IE
PT
LU
ES
AT
DK
ITFI
UK
SE
PL
LT
HU
CZ
SI LV
MT
SK
CY
EE
0
10
20
30
40
50
0 10 20 30 40 50
Poverty Rate of the retired population (%)
EU 15NMS
45º
Fig. 10e: inactive
SE
UK
FI
IT
DK
AT
ES
LU
PT
IE
NL
FRDE
BE GR
EE
CY
SK
MTLV
SICZ
HU
LTPL
0
10
20
30
40
50
60
0 10 20 30 40 50 60
Total poverty rate (%)
Poverty Rate of the inactive population (%)
EU 15NMS
45º

Social Situation Observatory – Social inclusion and Income distribution Final report
Social Situation Observatory – Social inclusion and Income distribution 32
Appendix A: Auxiliary graphs and tables
Fig. A.1. Shares of total personal income of top percentile groups in the UK 1908-2000
Source: Atkinson 2003

Social Situation Observatory – Social inclusion and Income distribution Final report
Social Situation Observatory – Social inclusion and Income distribution 33
Table A.1. Poverty rates and the number of the poor population
Poverty ratio, using national thresholds
(60% of median) Poor population
(1000s)
BE 15 1.563 CZ 8 817 DK 11 594 DE 16 13.203 EE 18 243 GR 20 2.212 ES 20 8.538 FR 14 8.705 IE 21 854 IT 19 11.053 CY 15 111 LV 16 370 LT 15 515 LU 11 50 HU 13 1.354 NL 12 1.954 AT 13 1.063 PL 17 6.491 PT 21 2.205 SI 10 200 SK 21 1.130 FI 11 575 SE 11 989 UK 18 10.722 Subtotal: 75.514 BG 15 1.167 HR 18 800 RO 17 3.686 TR 26 18.499 Total 999.666

Social Situation Observatory – Social inclusion and Income distribution Final report
Social Situation Observatory – Social inclusion and Income distribution 34
Table A.2: Trends in poverty risk of the total population (subdivided by gender), using 60% of median income as the poverty line
Notes: The year in the first row refers to the survey year. b Break in the series; in the majority of EU15 countries the results reported under 2001 come from the last wave of the
ECHP, and results beyond 2001 are either from national data sources or from EU-SILC. b1: Break in the series, due to a switch from ECHP to another survey; b2: Break in the series, due to a switch to EU-SILC.
1995 1996 1997 1998 1999 2000 2001 2002 2003 2004
Country
total
males
females
total
males
females
total
males
females
total
males
females
total
males
females
total
males
females
total
males
females
total
males
females
total
males
females
total
females
males
Belgium 16 15 17 15 14 17 14 13 15 14 12 15 13 11 14 13 12 14 13 12 15 15b2 14b2 16b2 15 16 14 Czech Republic 8 7 8 8 7 9 Denmark 10 10 10 10 12b2 11b2 12b2 11 11 11 Germany 15 13 16 14 12 16 12 11 13 11 10 12 11 10 12 10 10 11 11 15 13 18 15 13 17 16 18 13 Estonia 18 17 19 18 17 19 18 17 19 18 17 20 Greece 22 21 22 21 21 21 21 21 22 21 20 22 21 20 21 20 19 20 20 19 22 21b2 20b2 22b2 20 21 19 Spain 19 19 19 18 18 18 20 20 21 18 18 18 19 18 19 18 17 19 19 17 20 19b1 18b1 21b1 19 18 20 20b2 21b2 19b2 France 15 15 16 15 14 16 15 14 16 15 14 15 15 15 16 16 15 16 13b1 12b1 13b1 12 12 13 12 12 13 14b2 14b2 13b2 Ireland 19 17 20 19 18 21 19 18 20 19 18 20 19 17 20 20 19 21 21 20 23 21b2 20b2 22b2 21 23 19 Italy 20 19 21 20 19 21 19 19 20 18 17 19 18 18 18 18 18 19 19 19 20 19b2 20b2 18b2 Cyprus 15 14 17 Latvia 16 17 16 16 16 16 16 16 17 Lithuania 17 17 17 17 18 17 17 16 17 15 14 15 Luxembourg 12 11 13 11 11 11 11 11 12 12 12 13 13 12 13 12 12 12 12 12 13 10b2 9b2 11b2 11 11 11 Hungary 11 11 12 11 11 12 10 9 10 12 12 12 Malta 15 15 15 Netherlands 11 11 12 12 11 12 10 10 11 10 10 10 11 10 11 11 10 11 11b1 11b1 12b1 11 11 12 12 12 12 Austria 13 12 15 14 12 16 13 11 14 13 11 15 12 10 14 12 9 14 12 9 14 13b2 12b2 14b2 13 14 11 Poland 16 16 16 16 16 15 17 17 16 17 17 16 Portugal 23 21 24 21 20 22 22 20 23 21 19 22 21 19 22 21 19 22 20 20 20 20 19 21b2 22b2 20b2 Slovenia 11 11 12 11 10 12 10 9 11 10 9 11 Slovakia 21 21 21 21 21 22 Finland 8 8 9 8 8 9 9 8 11 11 9 12 11 9 13 11b1 10b1 12b1 11 11 12 11 11 12 11b2 11b2 11b2 Sweden 8 8 9 11 10 12 11b2 12b2 10b2
United Kingdom 20 19 22 18 16 20 18 16 19 19 17 21 19 18 21 19 16 21 18b1 17b1 19b1 18 17 19 18 17 19

Social Situation Observatory – Social inclusion and Income distribution Final report
Social Situation Observatory – Social inclusion and Income distribution 35
Table A.3: Relative Risk Ratio (RRR) of membership of Income Quintiles, by household type
(Income quintile thresholds defined using country-specific income distribution) Countries / Household type groups Income quintiles
1st 2nd 3rd 4th 5th Austria One person household 1.55 1.00 0.86 0.78 0.79 2 adults, no dependent, both adults under 65 0.89 0.69 0.85 0.98 1.59 2 adults, no dependent, at least one adult 65 1.19 1.08 0.88 0.98 0.86 Other households without dependent 0.39 0.80 1.18 1.36 1.28 Single parent household, one or more dependent 1.79 1.56 0.83 0.45 0.36 2 adults, one dependent child 0.81 0.95 1.01 1.12 1.12 2 adults, two dependent children 0.96 1.42 1.02 0.85 0.75 2 adults, three or more dependent children 1.83 1.45 0.66 0.67 0.38 Other households with dependent children 0.76 1.05 1.40 1.13 0.66 Belgium One person household 1.43 1.27 0.83 0.75 0.75 2 adults, no dependent, both adults under 65 0.75 0.78 0.84 0.91 1.70 2 adults, no dependent, at least one adult 65 1.39 1.54 1.03 0.59 0.48 Other households without dependent 0.36 0.51 1.17 1.45 1.47 Single parent household, one or more dependent 2.19 1.38 0.73 0.52 0.24 2 adults, one dependent child 0.66 0.85 0.94 1.27 1.25 2 adults, two dependent children 0.63 0.78 1.13 1.43 0.99 2 adults, three or more dependent children 1.12 1.05 1.41 0.90 0.52 Other households with dependent children 1.15 1.00 1.07 1.11 0.68 Denmark One person household 1.73 0.98 0.68 0.54 0.37 2 adults, no dependent, both adults under 65 0.45 0.66 0.96 1.52 2.08 2 adults, no dependent, at least one adult 65 1.58 1.31 0.52 0.37 0.58 Other households without dependent 0.30 0.57 1.24 2.01 1.68 Single parent household, one or more dependent 1.74 1.42 0.57 0.32 0.11 2 adults, one dependent child 0.40 0.84 1.44 1.60 1.33 2 adults, two dependent children 0.39 1.22 1.73 1.27 0.88 2 adults, three or more dependent children 1.14 1.64 1.16 0.36 0.36 Other households with dependent children 0.67 1.17 1.47 1.17 0.75 Estonia One person household 2.00 1.41 0.54 0.52 0.56 2 adults, no dependent, both adults under 65 0.81 0.75 0.74 1.15 1.44 2 adults, no dependent, at least one adult 65 0.58 1.85 1.60 0.81 0.37 Other households without dependent 0.50 0.65 0.89 1.32 1.54 Single parent household, one or more dependent 2.06 1.38 0.97 0.39 0.30 2 adults, one dependent child 0.81 0.71 0.97 1.00 1.42 2 adults, two dependent children 0.82 0.74 1.17 1.16 1.10 2 adults, three or more dependent children 1.28 1.08 1.11 0.83 0.75 Other households with dependent children 0.60 0.71 1.33 1.47 0.93

Social Situation Observatory – Social inclusion and Income distribution Final report
Social Situation Observatory – Social inclusion and Income distribution 36
Spain One person household 1.78 1.18 0.72 0.64 0.79 2 adults, no dependent, both adults under 65 0.64 0.56 0.72 1.07 1.88 2 adults, no dependent, at least one adult 65 1.49 1.34 1.07 0.71 0.50 Other households without dependent 0.56 0.87 1.14 1.27 1.09 Single parent household, one or more dependent 1.89 1.02 0.94 0.61 0.66 2 adults, one dependent child 0.73 0.82 0.93 1.18 1.27 2 adults, two dependent children 1.19 1.24 0.92 0.82 0.89 2 adults, three or more dependent children 1.74 1.09 0.90 0.66 0.72 Other households with dependent children 1.06 1.11 1.26 1.04 0.57 Finland One person household 2.39 0.98 0.72 0.47 0.36 2 adults, no dependent, both adults under 65 0.65 0.72 0.95 1.26 1.46 2 adults, no dependent, at least one adult 65 1.32 1.72 0.95 0.54 0.41 Other households without dependent 0.66 1.20 1.02 1.32 0.80 Single parent household, one or more dependent 1.96 1.65 0.70 0.39 0.21 2 adults, one dependent child 0.64 0.79 1.26 1.44 0.89 2 adults, two dependent children 0.73 1.10 1.47 1.09 0.60 2 adults, three or more dependent children 1.43 1.42 1.09 0.67 0.33 Other households with dependent children 0.85 1.15 1.37 1.07 0.53 France One person household 1.36 1.18 0.88 0.75 0.80 2 adults, no dependent, both adults under 65 0.65 0.62 0.90 1.28 1.59 2 adults, no dependent, at least one adult 65 1.12 1.12 0.92 0.77 1.07 Other households without dependent 0.71 0.85 0.76 1.33 1.39 Single parent household, one or more dependent 1.92 1.22 0.96 0.49 0.35 2 adults, one dependent child 0.71 0.85 1.17 1.18 1.10 2 adults, two dependent children 0.73 1.15 1.24 1.13 0.75 2 adults, three or more dependent children 1.34 1.35 1.02 0.68 0.57 Other households with dependent children 1.41 1.01 1.24 0.97 0.31 Greece One person household 1.52 1.06 0.96 0.83 0.71 2 adults, no dependent, both adults under 65 0.72 0.96 0.94 0.98 1.35 2 adults, no dependent, at least one adult 65 1.40 1.34 1.02 0.72 0.61 Other households without dependent 0.73 0.84 1.07 1.22 1.10 Single parent household, one or more dependent 1.72 1.33 0.55 0.95 0.56 2 adults, one dependent child 0.80 0.84 0.77 1.12 1.40 2 adults, two dependent children 0.95 0.97 1.03 1.04 1.00 2 adults, three or more dependent children 1.57 1.43 0.72 0.91 0.49 Other households with dependent children 1.18 1.09 1.16 0.77 0.83

Social Situation Observatory – Social inclusion and Income distribution Final report
Social Situation Observatory – Social inclusion and Income distribution 37
Ireland One person household 2.72 1.15 0.52 0.44 0.47 2 adults, no dependent, both adults under 65 0.94 0.64 0.57 1.07 1.70 2 adults, no dependent, at least one adult 65 1.07 2.39 0.83 0.57 0.39 Other households without dependent 0.48 0.64 1.12 1.00 1.61 Single parent household, one or more dependent 2.82 1.45 0.75 0.22 0.13 2 adults, one dependent child 0.70 0.69 0.83 1.47 1.21 2 adults, two dependent children 0.51 0.87 1.26 1.30 0.97 2 adults, three or more dependent children 1.19 1.30 1.15 0.82 0.63 Other households with dependent children 0.57 0.83 1.45 1.31 0.76 Italy One person household 1.26 1.02 1.04 0.86 0.77 2 adults, no dependent, both adults under 65 0.64 0.73 0.96 1.18 1.58 2 adults, no dependent, at least one adult 65 0.85 1.23 1.11 0.95 0.86 Other households without dependent 0.64 0.74 0.96 1.40 1.34 Single parent household, one or more dependent 1.83 1.16 0.75 0.50 0.61 2 adults, one dependent child 0.88 1.01 0.97 1.10 1.06 2 adults, two dependent children 1.32 1.18 1.02 0.70 0.71 2 adults, three or more dependent children 1.92 1.34 0.64 0.42 0.50 Other households with dependent children 1.28 1.12 1.07 0.78 0.69 Luxembourg One person household 1.02 0.81 0.96 1.13 1.10 2 adults, no dependent, both adults under 65 0.79 0.74 0.70 1.10 1.78 2 adults, no dependent, at least one adult 65 1.02 1.05 1.08 0.95 0.89 Other households without dependent 0.57 0.83 1.44 1.12 1.00 Single parent household, one or more dependent 1.69 1.13 0.42 1.25 0.49 2 adults, one dependent child 0.80 0.81 1.06 1.14 1.21 2 adults, two dependent children 1.39 1.05 1.04 0.78 0.76 2 adults, three or more dependent children 1.38 1.25 0.83 0.95 0.55 Other households with dependent children 0.99 1.70 1.08 0.71 0.40 Portugal One person household 1.86 1.35 0.60 0.55 0.76 2 adults, no dependent, both adults under 65 0.93 0.70 0.81 1.16 1.35 2 adults, no dependent, at least one adult 65 1.46 1.41 0.82 0.63 0.76 Other households without dependent 0.63 0.84 1.19 1.11 1.17 Single parent household, one or more dependent 1.39 1.00 1.00 0.87 0.79 2 adults, one dependent child 0.70 0.78 1.04 1.19 1.24 2 adults, two dependent children 1.27 0.93 1.08 0.89 0.86 2 adults, three or more dependent children 1.66 0.97 0.74 0.90 0.81 Other households with dependent children 0.80 1.19 1.10 1.14 0.78

Social Situation Observatory – Social inclusion and Income distribution Final report
Social Situation Observatory – Social inclusion and Income distribution 38
Sweden One person household 1.96 0.99 0.78 0.60 0.32 2 adults, no dependent, both adults under 65 0.41 0.49 0.69 1.46 2.19 2 adults, no dependent, at least one adult 65 0.81 1.55 1.06 0.79 0.83 Other households without dependent 0.27 0.75 1.38 1.52 1.36 Single parent household, one or more dependent 1.85 1.34 0.75 0.44 0.28 2 adults, one dependent child 0.56 0.65 1.29 1.37 1.31 2 adults, two dependent children 0.53 1.14 1.56 1.14 0.80 2 adults, three or more dependent children 0.97 1.80 1.09 0.58 0.52 Other households with dependent children 0.66 1.18 1.40 1.39 0.49

Social Situation Observatory – Social inclusion and Income distribution Final report
Social Situation Observatory – Social inclusion and Income distribution 39
Table A.4: Relative Risk Ratio of membership of Income Quintiles, by employment status
(Income quintile thresholds defined using country-specific income distribution) Countries / Employment status Income quintiles
1st 2nd 3rd 4th 5th
Austria Employed 0.66 0.92 1.07 1.16 1.20 Unemployed 2.18 1.08 0.90 0.49 0.33 Student 1.30 1.02 0.91 0.91 0.84 Retired 1.13 1.04 0.93 0.91 0.99 Other inactive 1.78 1.25 0.89 0.67 0.38 Belgium Employed 0.42 0.61 1.00 1.37 1.57 Unemployed 2.15 1.21 0.96 0.44 0.31 Student 1.29 0.98 1.08 1.04 0.62 Retired 1.24 1.53 1.06 0.66 0.53 Other inactive 1.86 1.39 0.86 0.55 0.39 Denmark Employed 0.48 0.94 1.28 1.40 1.40 Unemployed 1.53 1.00 0.85 0.58 0.52 Student 1.78 0.85 0.70 0.54 0.44 Retired 1.76 1.13 0.50 0.38 0.46 Other inactive 1.29 1.28 0.80 0.69 0.58 Estonia Employed 0.53 0.62 1.01 1.27 1.49 Unemployed 2.35 0.95 0.76 0.48 0.47 Student 1.19 0.93 1.02 1.00 0.87 Retired 1.25 1.93 1.08 0.64 0.28 Other inactive 2.06 0.96 0.88 0.70 0.44 Spain Employed 0.56 0.74 0.92 1.19 1.48 Unemployed 1.61 1.21 1.01 0.80 0.48 Student 1.26 1.03 1.05 1.00 0.70 Retired 1.15 1.31 1.15 0.83 0.63 Other inactive 1.55 1.26 1.05 0.77 0.49 Finland Employed 0.44 0.82 1.18 1.37 1.54 Unemployed 2.01 0.99 0.65 0.59 0.25 Student 1.57 1.08 0.91 0.66 0.43 Retired 1.59 1.30 0.76 0.52 0.45 Other inactive 1.39 1.21 0.89 0.73 0.48

Social Situation Observatory – Social inclusion and Income distribution Final report
Social Situation Observatory – Social inclusion and Income distribution 40
France Employed 0.54 0.93 1.12 1.26 1.19 Unemployed 1.89 1.04 0.79 0.62 0.61 Student 1.49 1.05 1.00 0.72 0.71 Retired 1.08 1.07 0.94 0.88 1.01 Other inactive 2.11 1.11 0.68 0.49 0.54 Greece Employed 0.67 0.79 0.95 1.15 1.36 Unemployed 1.48 1.20 1.07 0.87 0.49 Student 1.32 0.95 0.98 0.98 0.81 Retired 1.31 1.12 1.04 0.85 0.74 Other inactive 1.24 1.38 1.07 0.84 0.56 Ireland Employed 0.34 0.63 1.04 1.33 1.49 Unemployed 1.89 1.39 0.83 0.55 0.56 Student 1.20 1.03 1.26 0.85 0.70 Retired 1.59 1.68 0.78 0.63 0.52 Other inactive 1.99 1.49 0.90 0.55 0.32 Italy Employed 0.64 0.83 1.05 1.20 1.36 Unemployed 2.26 1.06 0.65 0.49 0.34 Student 1.27 1.10 0.95 0.76 0.87 Retired 0.75 1.10 1.12 1.11 0.96 Other inactive 1.52 1.19 0.90 0.72 0.57 Luxembourg Employed 0.86 0.85 0.96 1.09 1.27 Unemployed 2.73 0.94 0.68 0.47 0.26 Student 0.95 1.28 0.93 1.15 0.61 Retired 0.86 0.99 1.07 0.98 1.10 Other inactive 1.25 1.26 1.11 0.79 0.53 Portugal Employed 0.71 0.78 1.08 1.19 1.18 Unemployed 1.32 1.26 1.08 0.89 0.53 Student 1.04 0.97 0.97 0.97 1.05 Retired 1.26 1.35 0.88 0.69 0.88 Other inactive 1.77 1.29 0.80 0.72 0.54 Sweden Employed 0.52 0.82 1.13 1.28 1.44 Unemployed 1.46 1.14 0.88 0.86 0.49 Student 1.65 1.06 0.90 0.71 0.44 Retired 1.63 1.34 0.74 0.57 0.46 Other inactive 1.41 1.11 1.05 0.74 0.54

Appendix B: Data sources in use
In order to achieve consistency and international comparability of poverty statistics for the
largest number of Member States, the EUROSTAT NewCronos database has been used as the
main data source for the statistics on levels and trends of poverty presented in this report.
This database represents the most immediate source of up-to-date cross-country comparable
statistical sources for both old and the new Member States of EU25. For the reference period
1994-2001, the European Community Household Panel (ECHP) is the primary source of data
used for the calculation of poverty statistics for all EU15 countries. One exception is Sweden,
where the national data source mentioned in Box B.1 has been used.
Given the need to update the data contents of the ECHP and improve timeliness of the
availability of results from the survey, the ECHP was replaced by the EU-SILC (Community
Statistics on Income and living Conditions). The EU-SILC survey was launched in 2003 on the
basis of a 'gentleman’s agreement' in six Member States (Belgium, Denmark, Greece, Ireland,
Luxembourg, and Austria). Thus, for these six countries, the results reported under 2003 are
generated using the first wave of EU-SILC database (survey year is 2003, and the income data
refer to 2002).
Another five countries (Spain, France, Italy, Portugal and Finland) launched their EU-SILC survey
in 2004, and Germany, the Netherlands and the UK have undertaken EU-SILC in 2005. The
result from the 2004 surveys for Spain, France, Italy, Portugal and Finland are derived from
their first wave of EU-SILC. Note here that the timetable for the implementation of the EU-SILC
project is such that the first set of micro data and cross-sectional poverty statistics from EU-
SILC for all the EU25 countries will only be available in December 2006.
Due to the differences of data sources in use, the poverty results presented in this report
cannot be considered to be fully comparable across all 25 countries. However, in spite of this
difference of data sources, Eurostat has made every effort to use harmonised methods to insure
the maximum comparability between definitions and concepts used in the different countries,
and thus poverty statistics presented in this report provide valuable comparative information on
poverty at the EU25 level.
Note here that these datasets include only private households, and exclude population groups
such as those living in sheltered housing and institutions providing nursing and living care.
This exclusion may also affect international comparability of results presented in this report.

Social Situation Observatory – Social inclusion and Income distribution Final report
Social Situation Observatory – Social inclusion and Income distribution 42
Box B.1: Data sources used in poverty statistics in EU25
Country Source Survey year Income year
ECHP 1995-2001 1994-2000 EU-SILC 2003 2002
Belgium
EU-SILC 2004 2003 Survey on Social Situation of the Household (SSD: Sociální Situace Domácností)
2001 2000 Czech Republic
Microcensus 2003 2002 Law Model 1995,1997,
1999,2001 1994,1996, 1998,2000
EU-SILC 2003 2002
Denmark
EU-SILC 2004 2003 ECHP (adapted Sozio-oekonomische Panel (GSOEP) 1995-2001 1994-2000 Germany GSOEP (Sozio-oekonomische Panel) 2002-2004 2001-2003
Estonia Household Budget Survey (LEU: Leibkonna Eelarve Uuring) 2000-2003 2000-2003 ECHP 1995-2001 1994-2000 EU-SILC 2003 2002
Greece
EU-SILC 2004 2003 ECHP 1995-2001 1994-2000 Household Budget Survey (ECPF: Encuesta Continua de Presupuestos Familiares)
2002-2003 2001-2002 Spain
EU-SILC 2004 2003 ECHP 1995-2000 1994-1999 Tax Survey (ERF: Enquête Revenu Fiscaux) 2001-2003 2000-2002
France
EU-SILC 2004 2003 ECHP 1995-2001 1994-2000 EU-SILC 2003 2002
Ireland
EU-SILC 2004 2003 ECHP 1995-2001 1994-2000 Italy EU-SILC 2004 2003
Cyprus Household Budget Survey (FES: Family Expenditure Survey) 2003 2003 Household Budget Survey (MBP: Majsaimniecibu Budzetu Petijums)
2000 2000 Latvia
Household Budget Survey (MBP: Majsaimniecibu Budzetu Petijums)
2002-2003 2002-2003
Lithuania Household Budget Survey (Namu ukiu biudzetu tyrimas) 2000-2003 2000-2003 ECHP (adapt PSELL (Panel Socio-Economique Liewen zu Lëtzebuerg))
1995-2001 1994-2000
EU-SILC 2003 2002
Luxembourg
EU-SILC 2004 2003 Household Budget Survey (HKF: Háztartási Költségvetési Felvétel)
2000-2003 2000-2003 Hungary
TARKI Household Monitor Survey 2003 2003 Malta Household Budget Survey 2000 2000
ECHP 1995-2000 1994-1999 Netherlands Income Panel Survey (IPO: Inkomenspanelonderzoek) 2000-2003 2000-2003 ECHP 1995-2001 1994-2000 EU-SILC 2003 2002
Austria
EU-SILC 2004 2003

Social Situation Observatory – Social inclusion and Income distribution Final report
Social Situation Observatory – Social inclusion and Income distribution 43
Poland Household Budget Survey (Badania Budżetów Gospodarstw Domowych)
2000-2003 2000-2003
ECHP 1995-2001 1994-2000 ECHP small sub-sample 2002-2003 2001-2002
Portugal
EU-SILC 2004 2003 Slovenia Household Budget Survey (Anketa o porabi v
gospodinjstvih) 2000-2003 2000-2003
Microcensus 2003 2002 Slovakia Extrapolation 2004 2003 ECHP 1995-2000 1994-1999 Income Distribution Survey (Tulonjakotilasto) 2001-2003 2000-2002
Finland
EU-SILC 2004 2003 Income distribution survey (HEK: Hushållens ekonomi, formerly HINK: Hushållens Inkomstfördelningsundersökningen)
1997,1999, 2001
1997,1999, 2001
Survey of Living Conditions (ULF: Undersökning av levnadsförhållanden)
2002 2002
Sweden
EU-SILC 2004 2003 ECHP (adapted British Household Panel Survey (BHPS) 1995-2000 1994-1999 UK Household Budget Survey (FRS: Family Resources Survey) 2000/01-
2003/4 2000/01-2003/4
Note: The shaded cells highlight the 2003 and 2004 EU-SILC data.

Social Situation Observatory – Social inclusion and Income distribution Final report
Social Situation Observatory – Social inclusion and Income distribution 44
2. ECONOMIC GROWTH AND INCOME INEQUALITIES IN EUROPEAN
COUNTRIES 2000-20047
Introduction
This chapter provides an analysis of inequalities and poverty in relation to economic growth,
employment and social expenditure in European countries. First we review the main conclusions
of the analytical literature on the relationship between growth and inequalities in general.
Secondly, we recap the conclusions of our 2005 annual report on the macro level analysis of
inequalities and poverty. In the third part we extend the analysis to examine changes in the
variables included over time. The data for the analysis in this part of the chapter comes from
the Eurostat NewCronos database and covers the widest possible range of countries. Where
possible, we extend the analysis to the accession countries in addition to the current Member
States. Data in the detail required are, unfortunately, not available for all of the countries for a
long period of time. When trying to cover the widest possible range of countries and the
longest possible period, there were inevitably limitations on the comparative analysis which
could be undertaken and this part of the chapter focuses on the period between 1999 and
2004. Although our aim here is to analyse issues and relationships on the macro level and,
while doing that, we operate also with economic developments, our analysis is not macro-
economic. What we try to do is an attempt to explore the explore the relationships between
some macro economic variables and changes in poverty/inequalities.
The fourth part of the analysis presents case studies of selected countries. There are two
reasons for the inclusion of this section. First, as shown in the comparative chapter, a great
many aspects of local circumstances (policy variables, welfare state measures, path
dependencies and so on) shape the actual degree of inequalities. A more in-depth analysis of
the underlying circumstances is, therefore, necessary to gain a more thorough understanding.
Secondly, for individual countries, longer time series are available, allowing for a more in-depth
analysis of longitudinal developments in inequality and poverty. The present draft includes case
studies of four countries, Ireland, Hungary, Spain and Sweden, representing four different
European regimes of inequalities, growth and welfare systems. The final section presents some
conclusions.
7 István György Tóth, Péter Hudomiet, Hedvig Horváth, Márton Medgyesi, with the assistance of Tamás Keller, Tarki.

Social Situation Observatory – Social inclusion and Income distribution Final report
Social Situation Observatory – Social inclusion and Income distribution 45
Theoretical overview and empirical findings in the literature
Income distribution and poverty in general is determined by a broad set of factors like
economic growth, the skills of the work force and imbalances in the demand for the labour
(within the context of skill biased technology change), demographic developments (ageing,
family formation, etc), the dynamics of domestic policy (electoral cycles, different social and
economic policies) and a number of (residual) country-specific factors. While the list of the
determinants is not in much dispute, the weights given to the individual explanatory factors
described above vary greatly in the literature.
Despite a growing body of literature on the topic, the links between growth and inequalities are
far from clear. So far as the growth and inequality relationship is concerned, the growth-effect-
on-inequality and the inequality-effect-on-growth are both interesting to analyse. However, it
is only the first that is considered in any detail here. The original formulation of the often
quoted Kuznets curve (Kuznets [1995]) implies that a change in inequality is a result of the
expansion of a high income modern sector of the economy at the expense of a low income
traditional sector. This sectoral shift, which can be broken down into expansion and enrichment
effects accompanying overall growth in the economy, is claimed to result in an inverted U shape
of inequalities over time. The literature contains arguments for and against the relevance and
explanatory power of this general relationship, (for reviews, see, for example Ferreira [1999],
Arjona, Radaique and Pearson [2001]). Just to mention those against, some authors criticise the
inevitability of the process (like Deininger and Squire, 1997 on the one hand and Atkinson,
1999 on the other), while others question the direction of causation (see Ravallion and Chen
[1997], for example).
In the more recent theoretical literature, as Ravallion (2004) puts it, empirical findings on the
relationship between inequality and economic growth show virtually zero correlation8. Economic
growth may be accompanied by a reduction in inequality falls or an increase with equal
probability (for surveys see Ravallion and Chen, 1997, Dollar and Kraay, 2002). The almost
complete absence of a correlation may be due to measurement errors (in inequalities), the
inability of the Gini coefficient to capture growth-induced inequalities and reductions, in
poverty, a lack of capability of cross-sectional inequality measures to capture “churning”
phenomena and the need to use absolute rather than relative Gini coefficients to measure
inequality (Ravallion, 2004). However, while growth seems to be distribution neutral, the
absolute poverty reducing effects of growth seem to be demonstrated by many studies (see
8 This result may give rise to serious questions about the appropriateness of Kuznets curve to describe the inequality-growth relationships. Mention of the dangers of mixing cross-country data with explanations of a longitudinal nature seems warranted in the first place. Secondly the effect of growth on inequalities is best understood as part of a complex portfolio of possible explanations with a great many alternative factors which might be included.

Social Situation Observatory – Social inclusion and Income distribution Final report
Social Situation Observatory – Social inclusion and Income distribution 46
Ravallion, 2004, World Bank 2005a and 2005b for recent examples), despite appearing to be
distribution-neutral). The mechanism underlying this, however, needs to be clarified further,
paying special attention to the role of various institutions channelling growth to societal
developments.
A related issue is the relationship between growth, inequality and poverty (Bourguignon, 2003).
The empirical literature on this is well documented, and there is no need to go into detail here.
However, as both the increase in the openness of economies and the capacity of growth to
reduce poverty depend very much on endowment effects, one additional factor deserves a little
more attention. Although the relationship between inequality, growth and poverty is
complicated, it seems to be the case that the effect of economic growth in reducing poverty
depends very much on the initial extent of inequalities in a country. If growth, therefore, occurs
in a very unequal society, the poverty reducing elasticity of growth seems to be smaller than in
a society which is more equal (see, for example Cornia and Court, 2001). More precisely, as
they put it, there is an “efficient inequality range”, so that very low and very high degrees of
initial inequality tend to impede growth prospects while inequalities in the middle income range
seem to provide a favourable environment for growth. This latter inverted U shape of the
inequality-growth relationship (which is different from the Kuznets curve) deserves further
study in the future.
Income inequalities in the EU25
A CROSS SECTIONAL ACCOUNT
Recent research on cross-country differences in inequalities (based on the newly developed
Laeken indicators and produced within the framework of the Open Method of Coordination9)
presents six different country clusters based on simultaneous evaluation of levels economic
development and degrees of inequality10.
The six country groupings comprise three levels of inequality (unequal, moderately equal,
equal) each combined with one of two regional groupings (EU15 and the new Member States -
NMSs). An important finding is that there is a considerable degree of heterogeneity in both the level
of GDP and inequalities. However, while the NMSs have a much lower GDP per head, even in PPS
terms, there are, in general no significant differences between old and new Member States in terms of
the variance of overall income inequalities and relative poverty.
9 For a description and references, see Atkinson et al, 2002, 2005, European Commission 2004a, 2005a, 2006. 10 See the SSO 2005 Annual report of the Network on social inclusion and income distribution.

Social Situation Observatory – Social inclusion and Income distribution Final report
Social Situation Observatory – Social inclusion and Income distribution 47
The major conclusions from the 2005 study were as follows:
the extent of poverty and degree of inequality is shaped by a wide range of factors including
the level of economic development, structural factors (employment levels) and social policy
factors like the scale of social expenditure and the way that this spent in a given country.
there is a great deal of variation among European countries in terms of the mix of institutional
factors (and not only in terms of the factors which are capable of being captured in the
analysis). The specific circumstances prevailing in any country suggest a need for caution in
interpreting the results, especially when drawing policy conclusions. The same policy measures
may lead to different results in different countries because of differences in the national
context.
Higher levels of GDP per head may help to alleviate poverty, but lower level of relative poverty
do not necessarily result from higher GDP. In addition, higher social expenditure tends to be
associated with lower levels of poverty, but the actual pattern of expenditure may have very
different effects on relative poverty and inequalities.
These conclusions were, however, drawn from an analysis of a cross-sectional data which, as
always, cannot necessarily be carried over to the interpretation of the effect of different
patterns of development in particular countries. When, for example, it is conclude that higher
levels of GDP (expenditure, employment, etc) is associated with lower levels of poverty
(inequality, etc.) it is not safe to assume from this that an increase in GDP (expenditure,
employment, etc.) in a certain country will automatically lead to a lower level of poverty
(inequality) as well. We might get closer to an understanding of these types of relationship only
when we analyse time series data for individual countries. This is done in the next section.
Changes in inequalities over time
Table 1 is taken from a recent overview of income distribution trends (Förster and D’Ercole,
2005) and summarises trends in income distribution in OECD countries. The countries covered
include only a selection of EU25 ,Member States , while several other OECD countries are also
included.
What can we see from these data?
There were various divergent trends in inequality in the period between the mid-1970s and the
mid-1980s. Moderate and strong decline was evident in Greece, Finland and Sweden, while
there was a strong increase in the UK.

Social Situation Observatory – Social inclusion and Income distribution Final report
Social Situation Observatory – Social inclusion and Income distribution 48
The general trend in the period between the mid-1980s and the mid-1990s was characterised
by increases in inequality. However, this period included the most significant period of the
economic and social transition in the prospective NMSs.
The period between the mid-1990s and 2000 shows a mixed picture again. While in Finland
and Sweden, there was a large increase in the Gini coefficient, for the other countries, there was
either no change or a very small one.
Table 1. Overall trends in income inequality (mid 1970s to 2000): summary results for the entire
population (based on Gini for individuals, equalivalised household incomes)
Strong decline
Moderate decline Small decline No change Small increase
Moderate increase
Strong increase
Mid-1970s to mid-1980s
Greece Finland, Sweden
Canada Netherlands United States United Kingdom
Mid-1980s to mid 1990s
Spain Australia, Denmark
Austria, Canada, France, Greece, Ireland
Belgium, Germany, Luxembourg, Japan, Sweden
Czech Rep., Finland, Hungary, Netherlands, Norway, Portugal, United Kingdom, United States
Italy, Mexico, New Zealand, Turkey
Mid-1990s to 2000
Mexico, Turkey
France, Ireland, Poland
Australia, Czech Rep., Germany, Hungary, Italy, Luxembourg, Netherlands, New Zealand, Portugal, United States
Austria, Canada, Denmark, Greece, Japan, Norway, United Kingdom
Finland, Sweden
Source: Förster and D’Ercole 2005
Note: "Strong decline/increase" denotes a change in income inequality above +/- 12%; "moderate decline/increase" a change between 7 and 12%; "small decline/increase " a change between 2 and 7%; "No change" changes between +/- 2%. Results are based on the values of the Gini coefficient in four reference years which may vary among countries11. Current EU countries are in bold.
11 2000 data refer to the year 2000 in all countries except 1999 for Australia, Austria and Greece; 2001 for Germany, Luxembourg, New Zealand and Switzerland; and 2002 for the Czech Republic, Mexico and Turkey; "Mid-1990s" data refer to the year 1995 in all countries except 1993 for Austria; 1994 for Australia, Denmark, France, Germany, Greece, Ireland, Japan, Mexico and Turkey; and 1996 for the Czech Republic and New Zealand; "Mid-1980s" data refer to the year 1983 for Austria, Belgium, Denmark and Sweden; 1984 for Australia, France, Italy and Mexico; 1985 for Canada, Japan, the Netherlands, Spain and the United Kingdom; 1986 data for Finland, Luxembourg, New Zealand and Norway; 1987 for Ireland and Turkey; 1988 for Greece; and 1989 for the United States. For the Czech Republic, Hungary and Portugal, the period mid-1980s to mid-1990s refers to early to mid-90s.

Social Situation Observatory – Social inclusion and Income distribution Final report
Social Situation Observatory – Social inclusion and Income distribution 49
For the first few years of the present decade, more harmonised data are available for the whole
EU25. As a result of the development of indicators, new data on income inequalities have
become available, which are presented in Table 2.
Table 2. Overall trends in income inequality in the EU25 countries, 2000 to 2004 (end period Ginis in
brackets)12
--- -- - 0 + ++ +++
x>12% 12%<x>7% 7%<x>2% 0% 7%<x>2% 12%<x>7% x>12%
Strong decline Moderate decline
Small decline No change Small increase Moderate increase
Strong increase
Belgium (26)
Estonia (34) Spain (31) Lithuania (29) Netherlands (26)
Greece (33) France(28) Luxembourg (26) Czech Republic (25) Slovenia (22)
Portugal (38) Latvia (36) United Kingdom (34)Ireland (32) Poland (31) Romania (30) Hungary (27) Finland (25) Bulgaria (26) Sweden (23)
Germany (28) Austria (26)
Italy (33) Denmark(24)
Source: Eurostat NewCronos database
The messages of Table 2. can be summarised as follows:
Trends in changes are not very clear and certainly not going in the same directions when all the
European countries are taken together. However, there are slightly more countries where
inequalities seemed to have increased than those experiencing a decline.
There are no signs of “path dependencies”. That is, inequality increase occurred in countries
with relatively high initial inequalities and in countries with relatively low level of initial
inequalities and the same holds for the occurrence of inequality decreasing spells.
There can be no convergence of inequality levels be discerned, either. This follows partly from
the above conclusion. However, it is not only the initial inequality that will not drive directions
of change but neither the end-period variance in levels will be smaller than the variance
observed initially.
It is not the group of the EU10 that produces relatively sizeable changes in inequalities in the
observed period. Rather, relatively big increases (and decreases as well) could be observed in
12 Begin period data refer to 2000, except for Czech Republic (2001) Denmark and Sweden (1999). End period data refer to 2004, except for Czech Republic, Estonia, Hungary, Latvia, Netherlands, Poland, Romania, Slovenia and the UK (2003). Income concepts and equivalence scales differ from the OECD study quoted in Table 1. Most important difference is the use of Laeken definitions and concepts in Table 2. Cross country differences in trends over time are not suspected to be large in this respect, however. Alternative estimate (TÁRKI) for Hungary shows higher Gini values (29 for 2000 and 2005 as well). This would move Hungary into the „no-change” cell.

Social Situation Observatory – Social inclusion and Income distribution Final report
Social Situation Observatory – Social inclusion and Income distribution 50
EU15 countries. This directs our attention to assumptions about the emergence of new division
across Europe in terms of inequality developments, in addition to the EU10-EU15 divisions.
An analysis of growth and inequality spells in EU25 (2000-2004)
In the 2005 Annual report of the SSO, we tried to explain levels of poverty and inequality in
terms of levels of economic development, employment and social expenditures. The concern
here is to extend the analysis in the following directions:
The data are updated and the most recent data are used for each of the countries.
Rather than drawing conclusion from a cross-sectional data an analysis of changes over specific
periods of time is presented for the various countries
Rather than including all the (not too many) data points in a regression equation, a less
sophisticated, but perhaps easier-to-understand, method is used, namely that of simply
classifying and interpreting the coincidence of the variables over particular periods.
The latter two points require here a bit more explanation and some remarks about the methods
of international comparisons. When Kuznets carried out his famous analysis, he had cross
section data for various countries at various stages of their economic developments. Many
analysts interpreting his curve assumed that country “A” having a “lower level” position at date
t0 can be expected to move to a position taken by country “B” at a “higher level” of development
at date t0. However, this assumption of linear development paths is clearly an oversimplification
(at least) and represents a fallacious mixing up cross section differences with time series
trends. Therefore, to carry out a careful analysis of the relationship between economic growth
and inequalities necessitates longitudinal data for each and every countries (data for countries
“A” and “B”, for both dates at t0 and t1. The dataset we use from Eurostat is a big step forward
in this direction, but the current length of the inequality data series allows still a partial and
short term analysis only. This type of optimising for the number of countries and the length of
periods resulted in a nineteen country dataset for a four year period. Nevertheless, we try to
categorise spells of movements from periods t0 to t1 for a set of countries for whom we have
data for both the beginning and of the end of the periods for this grouping. We hope later a
longer period of data will be available for a greater number of European countries.
Attempts are made to explain changes in inequality (measured as shifts in the Gini coefficient
and in relative poverty) in terms of changes in GDP, the employment rate, and social protection
expenditure. The period analysed covers the years 1999 to 2003 and it is assumed that
explanatory factors have an effect with a one year time lag (changes in GDP, employment rate
and social expenditures between 1999 to 2002 are compared to changes of Gini between 2000

Social Situation Observatory – Social inclusion and Income distribution Final report
Social Situation Observatory – Social inclusion and Income distribution 51
and 2003). Changes in the different variables were classified into seven ranges (applying
different thresholds for each separately). These are described in Table 3.

Social Situation Observatory – Social inclusion and Income distribution Final report
Social Situation Observatory – Social inclusion and Income distribution 52
Table 3. Significant changes in the variables examined
Gini Poverty GDP Total employment rate - Employed persons aged 15-64
Total employment rate of older workers - Employed persons aged 55-64
Social protection benefits in the % of GDP
00/03 00/03 99/02 00/03 99/02 00/03 99/02 00/03 99/02 00/03
Belgium - + 0 0 0 0 + + + ++ The Change in Gini Czech Republic 0 ++ 0 0 + ++ 0 0 +/- 5,1-10% change in Gini Denmark -- -- 0 0 + + 0 + ++/-- 10,1-15% change in Gini
Germany ++ +++ -- -- 0 0 0 + 0 0 +++/--- More than 15% change in Gini
Estonia - 0 ++ ++ 0 ++ + ++ - The Change In Poverty
Greece + 0 ++ +++ + + 0 + 0 0 +/- 10% < x > 20% change in Poverty Spain 0 0 + ++ +++ ++ ++ 0 0 0 ++/-- 20,1% < x > 30% change in Poverty France 0 -- 0 0 ++ 0 +++ +++ 0 + +++/--- x> 30,1% change in Poverty
Ireland 0 0 +++ ++ ++ 0 + + ++ +++ The Change in GDP
Italy 0 -- -- ++ ++ 0 + 0 0 +/- t > x >2t change in GDP Cyprus + 0 ++ 0 ++/-- 2t <x> 4t change in GDP Latvia + 0 ++ ++ ++ ++ ++ +++ -- +++/--- x> 4t change in GDP
Lithuania - - ++ ++ - + 0 ++ -- Luxembourg + - + +++ ++ 0 + ++ + +++
t (threshold) = GDP 1998 would change with two numeral

Social Situation Observatory – Social inclusion and Income distribution Final report
Social Situation Observatory – Social inclusion and Income distribution 53
Table 3. Significant changes in the variables examined (continued)
Gini Poverty GDP Total employment rate – Employed persons aged 15-64
Total employment rate of older workers - Employed persons aged 55-64
Social protection benefits as a % of GDP
00/03 00/03 99/02 00/03 99/02 00/03 99/02 00/03 99/02 00/03
Hungary 0 0 ++ ++ 0 + +++ +++ 0 + Change in Employment Rate 15-64
Malta - -- 0 ++ 0 ++ +/- 2-4% change Netherlands - 0 0 0 ++ + ++ ++ 0 0 ++/-- 4-8% change Austria ++ 0 -- -- 0 0 0 + 0 0 +++/--- More than 8% change
Poland 0 0 0 0 --- -- -- - + Change in Employment Rate 55-64
Portugal 0 0 -- + 0 0 0 ++ +++ +/- 5-10% change Slovenia 0 0 0 + 0 0 ++ 0 0 0 ++/-- 10,01-20% change Slovakia ++ ++ - 0 0 ++ 0 - +++/--- More than 20,01% change
Finland + 0 0 0 + + +++ ++ 0 ++ Change in Social Protection Benefit
Sweden - - + 0 + + 0 0 +/- 5,1-10% change United Kingdom + 0 + + 0 0 + + 0 0 ++/-- 10,1-15% change Bulgaria 0 0 + + ++ +++ +++/--- More than 15% change
Croatia + ++ In all Variable
Romania 0 0 + ++ --- --- --- --- 0 No Significant Change Turkey -- -- -- - empty cell Lack of Data

Social Situation Observatory – Social inclusion and Income distribution Final report
Social Situation Observatory – Social inclusion and Income distribution 54
Table 4. Classification of EU Member States and candidate countries by level of inequality
Clusters according to the Gini coefficient, Data 2003 EU15 NMS CC
Greece Estonia Turkey United Kingdom Latvia
Unequal countries (x>31,9)
Portugal* Belgium Hungary (TARKI Data) Croatia Germany Lithuania Romania Spain Poland Ireland Slovakia Luxembourg Malta*
Moderately-equal countries (31.9<x>27,9)
Italy* Denmark Czech Republic Bulgaria France Hungary Netherlands Slovenia Austria Cyprus Finland
Equal countries (x<27,9)
Sweden*
Notes:
Source of Gini coefficient: EUROSTAT NewCronos Database, download 9 June 2006.
Data: All data refer to 2003, except for Sweden (2002); Italy (2001); Portugal (2001); Malta (2000)
Between 2000 and 2003, a marked increase in income inequalities and relative poverty is
evident in Germany and Austria. For the other countries, the change was negligible or marginal.
At the same time, GDP showed much more volatility. (Note that it is the relative change in GDP
which is recorded and classified here - for example, a change in the position of a country
relative to the EU25 average is defined to be significant if it exceeds 2 percentage points either
up or down. Note that this adjusts for changes in the overall EU25 average.) An increase in
relative GDP can be observed in Greece and Luxembourg but also in the Czech Republic,
Estonia, Spain, Ireland Latvia, Lithuania, Hungary, Slovakia and Croatia, resulting in some
convergence of GDP levels between old and new Members States. Those losing out in relative
terms over this period included Denmark, Germany, Italy, Malta, Austria, Portugal and Turkey.
A reduction in employment rates occurred in Poland, Romania and Turkey (countries with low
overall employment rates). The other countries showed either no change or some rise
(especially in Estonia, Spain, Italy, Cyprus, Latvia and Bulgaria). The share of social protection
expenditure in GDP increased most especially in Ireland, Luxembourg and Portugal, but it also
increased in Belgium, Malta and Finland.
The combined changes in inequality and relative poverty, which are here regarded as dependent
variables, on the one hand, and the relative GDP change, employment change and change in
social expenditure are presented in two dimensional form in Figures 1 to 9. The most important
conclusion is that no clear pattern of the interaction between GDP and inequality can be

Social Situation Observatory – Social inclusion and Income distribution Final report
Social Situation Observatory – Social inclusion and Income distribution 55
observed. Although there are examples of GDP growth being associated with an increase in
inequality (Greece, Ireland, Hungary) there are also counter examples of it being associated
with a reduction (Spain, Bulgaria, Belgium and the Netherlands).
The association between the relative poverty rate and GDP growth also seems puzzling (Fig.
2.). GDP growth is associated both with increased relative poverty (Ireland, Hungary) and a
decrease (UK and Lithuania, for example). When, however, there was a reduction in relative
GDP, there is no example of poverty declining. The most striking result is that of Germany,
where a relative reduction in GDP is accompanied by a large increase in relative poverty.
Changes in the Gini coefficient and the poverty rate are not always in the same direction,
however. As it is shown in Fig. 3, in certain cases a large increase in the Gini coefficient is
accompanied (as can be expected) with a large increase in relative poverty (as, for example, in
the case of Germany), but it also goes together with a decline in poverty (as in Luxemburg). The
same type of contradiction holds for declining inequalities, which can go together with both
declining (France and Lithuania) and increasing (Netherlands, Belgium) relative poverty rates.
When (absolute) growth rates in GDP (rather than relative changes in relative levels) are
compared to changes in inequality (Fig. 4) and relative poverty (Fig. 5), a diverse picture
emerges once again. A high GDP growth rate may be accompanied by a relatively large fall in
the Gini coefficient (in Estonia, for example, annual average growth of over 7% was
accompanied by a 5% fall in the Gini) or by an increase in inequality. However, again it should
be emphasised that the largest increase in inequality were associated with the lowest rates of
GDP growth.
The same holds for comparisons of relative poverty. The only generalisation that can be made
in this regard concerns the variance of changes on poverty with GDP growth: the higher the
growth of GDP, the smaller the variation in changes in (relative) rates of poverty between
countries. Conversely, countries with relative low rates of GDP growth had more widely differing
patterns of change in poverty rates.
Comparisons of changes in the Gini coefficient and in relative poverty rates with changes in
overall employment rates also shows a mixed picture. While there were large falls in the
employment rate in Romania and Poland, which both showed increases in the Gini coefficient,
there were also countries with an increase in the Gini where the employment rate rose (Greece,
for example) and countries where increasing employment was accompanied by a falling Gini
(like the Netherlands) (Fig. 6).
Similarly, the relationship between employment growth and the poverty rate also shows a
varying picture (Fig. 7). The large increase in the German poverty rate was in the context of no
change in employment. Rising poverty can be associated with growth, no change or a fall in the

Social Situation Observatory – Social inclusion and Income distribution Final report
Social Situation Observatory – Social inclusion and Income distribution 56
employment rate (Spain, Germany and Poland, respectively). However, it is rare that a fall in
employment is accompanied by a decline in poverty (the only example is Lithuania in this
period).
In stochastic terms, as also pointed out in our 2005 report, there is a negative correlation
between social expenditure (as a percentage of GDP) and poverty rates. This, however, does not
seem in general to hold over time when changes in social expenditure are compared with
change in the poverty rate. On the contrary, increases in social expenditure seem to coincide
more with increasing inequality and poverty rates at least in the short-term (Fig. 8 and 9). We
do not, however, know from these data what the result of not increasing social expenditure in a
period of growing inequality would have been. At the same time, there is again no example of
falling social protection expenditures AND falling inequality and poverty rates.
Fig. 1. The change in Gini coefficient (2000-2003) and the change in GDP PPS per capita (1999-2002)
Notes:
Source: EUROSTAT NewCronos Database, download: 9th of June 2006.
Average GDP PPS per capita in the EU25=100. Data: 1999-2002.
Gini coefficient. Data: 2000-2003. HU00T – Hungarian data from TARKI, 2000. HU03T – Hungarian data from TARKI, 2003.

Social Situation Observatory – Social inclusion and Income distribution Final report
Social Situation Observatory – Social inclusion and Income distribution 57
Fig. 2.The change in the Poverty rate (2000-2003) and the change in GDP PPS per capita (1999-2002)
Notes: Average GDP PPS per capita in the EU25=100. Data: 1999-2002.
Poverty rate: the share of persons with an equivalised disposable income below 60% of the national median equivalised disposable income. Data: 2000-2003.
Source: EUROSTAT NewCronos Database, download: 9th of June 2006.
Fig. 3. The % change in the Gini coefficient (2000-2003) and the % change in the Poverty rate (2000-
2003) in European countries
Notes: Change in Poverty rate: ((Poverty rate 2003/ Poverty rate 2000) *100) – 100
Change in Gini coefficient: ((Gini 2003/Gini 2000) *100) – 100
Source: EUROSTAT NewCronos Database, download: 9th of June 2006.

Social Situation Observatory – Social inclusion and Income distribution Final report
Social Situation Observatory – Social inclusion and Income distribution 58
Fig. 4. The % change in real GDP (1999-2002) and the % change in the Gini coefficient (2000-2003)
Notes: Change in GDP: The average annual GDP growth rates in percentage terms between 1999-2002.
Change in Gini coefficient: ((Gini 2003/Gini 2000) *100) – 100
Source: EUROSTAT NewCronos Database, download: 9th of June 2006.
Fig. 5. The % change in real GDP (1999-2002) and the % change in the Poverty rate (2000-2003)
Notes:Change in GDP: The average of annual GDP growth rates in percentage, between 1999-2002.
Change in Poverty rate: ((Poverty rate 2003/ Poverty rate 2000) *100) – 100
Source: EUROSTAT NewCronos Database, download: 9th of June 2006.

Social Situation Observatory – Social inclusion and Income distribution Final report
Social Situation Observatory – Social inclusion and Income distribution 59
Fig. 6. The change in Gini coefficient (2000-2003) and the change in Employment rate (1999-2002)
Notes: Employment rate: employed persons aged 15-64 as a share of the total population of the same age group. Data: 1999-2002.
Gini coefficient. Data: 2000-2003. HU00T – Hungarian data from TARKI, 2000. HU03T – Hungarian data from TARKI, 2003.
Source: EUROSTAT NewCronos Database, download: 9th of June 2006.
Fig. 7. The change in Poverty rate (2000-2003) and the change in Employment rate (1999-2002)
Notes: Employment rate: employed persons aged 15-64 as a share of the total population of the same age group. Data: 1999-2002.
Poverty rate: the share of persons with an equivalised disposable income below the 60% of the national median equivalised disposable income. Data: 2000-2003.

Social Situation Observatory – Social inclusion and Income distribution Final report
Social Situation Observatory – Social inclusion and Income distribution 60
Source: EUROSTAT NewCronos Database, download: 9th of June 2006.
Fig. 8. The change in Gini coefficient (2000-2003) and the change Social protection benefits in the % of
GDP (1999-2002)
Notes: Gini coefficient. Data: 2000-2003. HU00T – Hungarian data from TARKI, 2000. HU03T – Hungarian data from TARKI, 2003.
Source: EUROSTAT NewCronos Database, download: 9th of June 2006.
Fig. 9. The change in the Poverty rate (2000-2003) and the change in Social protection benefits as a % of
GDP (1999-2002)
Notes: Gini coefficient. Data: 2000-2003. HU00T – Hungarian data from TARKI, 2000. HU03T – Hungarian data from TARKI, 2003.

Social Situation Observatory – Social inclusion and Income distribution Final report
Social Situation Observatory – Social inclusion and Income distribution 61
Source: EUROSTAT NewCronos Database, download: 9th of June 2006.
Summary
To summarize our findings from the analysis so far, the following conclusions emerge:
From the analysis of overall trends in inequality, slightly more countries were seen to
experience an increase in inequality than a decline. No sign of “path dependencies” was evident
nor was any convergence of inequality observable over the EU29 as a whole (the 25 Member
States plus the four candidate countries). Within this period, there were no large differences
between EU15 countries and NMSs. Furthermore, the most marked changes could be observed
among the “old” member states, symbolising to some extent the end of the turbulent transition
periods of the New Member States.
An increase in GDP may result in increasing or decreasing inequalities and relative poverty rates
(depending, most likely, on the social policies followed). However, there is no example of a
reduction in GDP in relative terms being accompanied by a decline in poverty or inequality.
Changes in employment rates may result in either poverty increases or decreases, depending, it
can be assumed, on the functioning of the labour market and unemployment policies. However,
there is no example of a fall in employment resulting in a fall in poverty. A rise in employment,
therefore, seems to be a precondition for alleviating poverty but it does not seem to be a
sufficient condition.
Short-term increases in social expenditure can be associated with an increase, no change or a
decline in poverty and inequality. However, no country experienced a decline poverty cannot
and a reduction in social expenditure.
From the analysis, therefore, it follows that the distributional effects of growth may vary
greatly, depending on the nature of growth itself (which sectors drive it, how it affect
employment, etc) and the nature of social welfare system (the extent and structure of social
expenditure as well as perhaps the social and labour market legislation in place). This accords
with the results of recent studies suggesting that the performance of various European social
models differ in terms of efficiency and equity (Boeri, 2002; Sapir, 2005).
The next step of the analysis is to examine the experience in five different countries that have
different welfare regimes and other institutional features.

Social Situation Observatory – Social inclusion and Income distribution Final report
Social Situation Observatory – Social inclusion and Income distribution 62
3. DECOMPOSITION OF INEQUALITIES IN HOUSEHOLD INCOME IN
THE EU13
Introduction
This paper investigates inter-country differences in the effect of age, education and
employment on the distribution of household incomes by applying static and dynamic
decomposition analysis. The main aim is to provide a cross-country comparison of the overall
effect of age, education and employment on the distribution of household incomes. The effects
of these factors are largely mediated by the labour market. The effect of education and age on
the distribution of wage has been extensively studied by social scientists, a major result being
that higher educated people earn more than those with less education, which −according to
human capital theory− reflects their higher productivity. Evidence shows that earnings generally
rise with age until the years immediately preceding retirement, when it reaches a peak and then
either remains unchanged or even declines. According to human capital theory, earnings of
workers with a given level of education increase as they get older because the experience
acquired through working makes them more productive.
Age-earnings profiles tend to differ according to the level of education: Higher educated people
enjoy not only higher starting salaries but also more rapid wage increases and so a steeper
age-earnings profile, which tends to decline less after reaching a peak than for the lower
educated. It is often argued that increasing inequality of earnings in developed countries is a
result of technological change which uniformly increases the productivity of higher educated
workers relative to the lower educated. If in the short-run the supply of educated people fails to
match the increase in the demand, the premium for education will increase. Sudden
technological changes might also cause a change in the steepness of the age-earnings profile,
in that the education of younger people may be more adapted to requirements of new
technology than the education and skills of older workers. In such cases demand will grow
more for the young who are well educated and less for the older which will result in a less steep
age-earnings profile.
It should be kept in mind that the analysis here is conducted on the basis of data on net
household income rather than wages. This enables the influence of the labour market to be
examined along with effects of redistribution through the tax and benefit system.
Redistribution affects the distribution of household income in multiple ways. As incomes are
13 Márton Medgyesi, István György Tóth, Tárki

Social Situation Observatory – Social inclusion and Income distribution Final report
Social Situation Observatory – Social inclusion and Income distribution 63
measured here net of direct taxes, the equalizing effect of these taxes is already taken into
account. On the other hand, social transfers are an important income source for a large
proportion of households. For example, income differences between those in employment and
the retired reflect average pension levels relative to average earnings.
It should also be emphasised that the analysis is carried out in terms of the characteristics of
the head of households (as defined below) rather than for households as such. This simplifies
the analysis but it needs to be kept firmly in mind that the characteristics of the household
head – specifically, their age, education level and employment status – do not necessarily reflect
those of other members of the household. The fact that, for example, the head has a low level
of education does not necessarily mean that other members have a similarly low level - though
this may be the case in many instances – or if they are unemployed that other members are also
not working, The results need to be interpreted with this in mind.
In the following, the overall effects of the age, education level and employment status of he
heads of households on the distribution of household disposable income are compared across
countries. The next section explains the methodology adopted and describes the data used in
the analysis before the results are presented.
Decomposition methodology and data
The approach adopted is, first, to group population according to a given characteristic -
specifically, age, education and employment status - , and then to distinguish income
dispersion between these groups attributable to this characteristic, from dispersion within the
groups (which is assumed to be independent of the characteristic in question). Some inequality
indices are additively decomposable, which means that they can be written as the sum of two
components: a weighted sum of within-group inequalities and between-group inequality, that
is the inequality which would be observed if incomes of all individuals were replaced by their
respective group means. A convenient family of additively decomposable inequality indices is
the Generalized Entropy family14, which comprises well-known inequality indices such as the
Theil statistic15, the mean log deviation16 (MLD), and the square of the coefficient of variation17.
14 Any inequality index that satisfies properties of weak principle of transfers, mean independence, population homogeneity and additive decomposability is a member of the Generalized Entropy family of indices (Shorrocks 1980).
15 The Theil index is defined as Theil=(1/n)Σi(yi/µ)ln(yi/µ), where n is population size, i:=1…..n, yi az income of person i and µ, mean income (Burniaux et al. 1998).
16 The mean log deviation index (MLD) is defined MLD=(1/n)Σiln(µ/yi), where n is population size, i:=1…..n, yi az income of person i and µ, mean income (Burniaux et al. 1998).
17 The squared coefficient of variation is SCV=var(yi)/µ2 , where var means variance.

Social Situation Observatory – Social inclusion and Income distribution Final report
Social Situation Observatory – Social inclusion and Income distribution 64
The concern is to investigate the effect of a given variable on the distribution of incomes. The
relevant question to consider in this regard can be formulated in two ways. The first is how
much inequality would be observed if age (or education or employment) were the only source of
income dispersion. The second is by how much would income inequality fall if, starting from
the actual distribution, income dispersion due to age (or education, employment etc.) were
eliminated by making age group means identical while preserving within-group inequality.
Shorrocks (1980) argues for the decomposition of indices such as the Theil statistic and the
MLD index, because in these cases answers to the two formulations coincide18. The MLD index
is selected here to perform the calculations. In this case, decomposition weights are simply
population shares of different groups; the within group component is, therefore, the sum of
within group MLD indices weighted by the population shares of the respective groups19. The
same methodology has been used by a number of authors to investigate the effect of various
individual or household attributes on income inequality (for example, Jenkins, 1995). Since the
sum of between group and within group inequalities equals total measured inequalities, we can
express the various components in percentage terms. In chapter 3 we compare the percentage
of within group inequalities among European countries using age, education and employment
of the household head as grouping variables.
In addition to this static decomposition, a decomposition of intertemporal change of inequality
was also carried out following the methodology used in Mookherjee–Shorrocks [1982]20. This
method decomposes the change in inequality in three components. The first is a "pure" effect of
inequality increase, that is, the effect attributable to increase in within group components. The
second component is the effect of structural change due to change in relative population shares
18 If in the second approach we eliminate between-group dispersion by equalizing group means we also change the decomposition weights (if they are mean dependent) and thus within-group inequality. Thus by the second approach we only arrive at the same between-group effect if the decomposition weights do not depend on the group means, like in the case of the Theil or the MLD indices. 19 Formally, Let vk be the share of k subgroups in total population, vk =nk/n, and let λk be the ratio of average incomes of a k subgroup to the average incomes of the total population, λk=µk/µ, and let θk be the share of k subpopulation from total incomes in the population, θk= vkλk. Total inequality as measured by MLD index, can be decomposed as a sum of two components:
MLD=ΣkvkMLDk + Σkvk log(1/λk).
The first part of the right hand side is for “within group” inequalities: it denotes weighted average of inequalities within the subgroups. The second part of the expression denotes "between group inequalities": that part of inequalities that would be measured, should we replace each individual income in a subgroup by the average of the subgroup.
20 The change in the MLD index between two time periods, t and t + 1 can be written, following Jenkins [1995] and
∆MLD≡MLD(t+1) – MLD(t)
≅ Σkvk∆MLD(k) + ΣkMLD(k)∆vk – Σk[λk – log(λk)]∆vk + Σk(θk – vk)∆log(µk).
[A component] [B component] [C component ] [D component],

Social Situation Observatory – Social inclusion and Income distribution Final report
Social Situation Observatory – Social inclusion and Income distribution 65
of the various subgroups, while the third component measures the effect of change in relative
mean incomes of the various subgroups. For a clearer understanding of decompositions by
various dimensions, it is useful to show changes in relative terms: the change of inequality
between the two periods as a percent of the value measured in period.
The data used are from the EU Statistics on Income and Living Conditions (EU-SILC) for the year
2004, which has a cross-sectional sample size of 121000 households in the 13 countries
covered. We compare these data to the European Community Household Panel (ECHP), year
2000 in the case of countries where both surveys have been carried out. It is important to keep
in mind that the two surveys differ to some extent in their methodologies21 thus results
regarding changes should be interpreted with caution. The analysis is carried out on the
distribution of equivalised22 household income. Variables used for grouping in the
decomposition analysis are based on the attributes of the (assumed) head of the household in
which respondents live. Since no household head is defined in EU-SILC, this is taken to be the
oldest man of active age (between 18 and 64 years). If there is no active age man, then the
oldest active age woman is taken as the household head instead. If there are no active age
members in the household, the oldest man of 65 or older is taken as the household head, or
the oldest woman if there is no man. The same definition of household head has been applied
to ECHP database. For simplicity of the analysis, attributes of the household head are assumed
to apply to all household members. The qualifications to the findings, which this implies have
been emphasised above.
Extent and evolution of inequalities in European countries
The first chart shows the ranking of the countries for which data are available by the MLD
inequality index. This shows a familiar pattern: Sweden and Denmark exhibit the lowest
inequality, while Portugal, Estonia, Greece, Italy, Spain and Ireland are the most unequal. As the
MLD index is more sensitive to income changes at the bottom of the income scale than further
up, values of the Gini-coefficient, which is a more commonly used measure of inequality, is also
plotted.23 This is less sensitive to income changes at the bottom or the top of the distribution.
The ranking of countries according to the Gini-index is the same except, that France and
Norway change places.
21 On the difference between the methodologies of the surveys see Eurostat (2005). 22 The OECD II equivalence scale is used. First household member older than 14 years of age equals one consumption unit. Additional houshold members older than 14 years of age count as 0,5 consumption unit, while household members younger than 14 equal 0,3 consumption unit. 23 Gini={(2/µn2 )Σiyi*i}-{(n+1)/n)}, where n is population size, i:=1…..n, yi is income of person i and µ is mean income.

Social Situation Observatory – Social inclusion and Income distribution Final report
Social Situation Observatory – Social inclusion and Income distribution 66
Fig. 1. Inequality according to the MLD and Gini-indexes in 2004
0.00
0.05
0.10
0.15
0.20
0.25
0.30
0.35
0.40
SE DK AT LU FI BE FR NO IE ES IT GR EE PT
MLD Gini
Recent changes in the income distribution were investigated by the comparison of inequality
indices between 2000 and 2004. Measuring inequality changes by the MLD index shows that
during the first years of the millennium the most important increase in inequality has occurred
in low or middle inequality countries Denmark and Austria, where the value of the index has
grown by more than 20%. In Italy and Ireland, which already had considerable inequality at the
beginning of this period the MLD index has grown by 16-17%. Moderate increase in inequality
has occurred in Portugal and Finland where the MLD index has grown by a rate close to ten
percent. In France and Luxembourg inequality has not changed during this period. In four
countries inequality has decreased: in Belgium, Greece and Sweden the value of the index has
decreased by approximately 10%, while in Spain the decrease has been even more important.
Fig. 2. MLD indices in 2000 and 2004
0%
5%
10%
15%
20%
25%
30%
ES SE GR BE LU FR FI PT IT IE AT DK
2000 2004
Note: countries are ordered according to the percentage change in the MLD index.

Social Situation Observatory – Social inclusion and Income distribution Final report
Social Situation Observatory – Social inclusion and Income distribution 67
Results of static decomposition analysis
The grouping variables considered in the analysis are age, education and employment of the
household head.
DECOMPOSITION BY AGE OF HOUSEHOLD HEAD
Respondents are classified into four groups according to the age of the head of the household
in which they live. The age groups chosen are: 18-34, 35-49, 50-64, and 65 or older. The
following chart shows the share of between group inequality in total inequality24. The chart
shows that the age grouping accounts for only a small percentage of total inequality in most of
the countries. In 2004 the between-group component is under 4% in all countries apart from
the Nordic ones plus Ireland. It is in the low income-inequality countries, Denmark and Sweden,
that the age of the household head explains the largest part of household income dispersion. In
these two countries, the between-group component is 9-11% of total inequality, while in the
other two Nordic countries and Ireland it is between 4,5%. It can be seen that the percentage of
inequality that can be attributed to between age-group dispersion is even increasing between
2000 and 2004 in Finland and Denmark.
Fig. 3. The share of between-group inequality in total inequality, by the age of the household head
0%
2%
4%
6%
8%
10%
12%
PT IT LU AT ES FR GR BE EE IE FI NO SE DK2000 2004
Table 1b in the Annex shows details of the age-decomposition of household income inequality
in 2004. As described above, decomposition is based on the population shares of different
groups, within-group inequality and relative incomes of the sub-groups. As regards the
population structure according to the age of the household head, it is evident that differences
between countries are relatively small. Sweden, Denmark and France have the largest share of
24 The remaining part of inequality is accounted for by inequality within groups.

Social Situation Observatory – Social inclusion and Income distribution Final report
Social Situation Observatory – Social inclusion and Income distribution 68
population living in elderly households (15-16%), while this is only 9% for Ireland. The
percentage of those living with a young household head (18-34) is related to the age structure
of the population, the age when young people tend to leave the parental home and form a new
household, and, underlying the latter, the age of marriage and fertility rates among the young.
The share of those living in young households is the smallest in Greece, Italy and Luxembourg
(16-18%), while the largest percentages are recorded in Estonia and Norway (25-26%).
The second component of the decomposition – which is obviously closely related to between-
group inequality - is relative incomes of different subgroups. Mean incomes relative to overall
mean are generally highest in those households where the head is between 50 and 64 years of
age, reflecting (among other factors) the age-earnings profile. In Nordic countries, where the
between age-group component of inequality is the most important, the incomes of the near-
retirement households exceed considerably that of young households. In Denmark, Finland,
Sweden and Norway, mean income is around 30% higher in the case of those who live in
households with a head aged 50-64 than for those living in households where the head is aged
18-34. By contrast, in high inequality countries, such as Estonia and Spain, the difference is
below 5%. Mean income of the elderly is 15-20% lower than the national average in most of the
countries. Income of the elderly is highest in Luxembourg and France, where it is only 2-3%
below the national average. Also in Austria and Italy, mean income of the elderly is only slightly
lower than the overall mean. The other extreme country is Ireland where –perhaps because of
very rapid growth over the past decade – mean income in elderly-headed households is only
67% of the national average.
The third component of the decomposition is within-group inequality. Inequality among those
living in elderly households is generally smaller than inequality in the overall population. The
largest difference is in Estonia where the MLD index for the elderly population is only 96
compared to 246 for the entire population, but the pattern is similar in most of the countries.
Only three countries show the opposite pattern, Austria –where inequality among those living in
elderly-headed households is more than 40% greater than in the overall population– and France
and Portugal.
Inequality among households headed by a young person aged 18-34 is significantly greater
than in the overall population in Estonia, Sweden and Italy and significantly lower in Greece,
Ireland, Portugal , while elsewhere it is relatively similar.
DECOMPOSITION BY EDUCATION OF HOUSEHOLD HEAD
The following chart shows the share of total inequality “explained” by the education level of the
household head. The maximum level of education attained is divided into three categories:

Social Situation Observatory – Social inclusion and Income distribution Final report
Social Situation Observatory – Social inclusion and Income distribution 69
primary and lower secondary education, upper secondary and tertiary. The chart indicates
considerable differences between countries in the relative importance of the education of the
household head. In Portugal, Greece and Luxembourg, it accounts for around 20% of total
inequality while in Sweden and Austria, only 5%. Interestingly, there are low- and high-
inequality countries at both ends of the ranking, though with slightly more high-inequality
countries at the top end – ie the education level of the household head being more important as
a factor underlying inequality – than at the bottom. In the case of Portugal and Luxembourg we
see an important decrease in the share of between-group inequality, which does not affect their
position in the ranking of countries. In the case of France, on the other hand, the decrease is
such that it’s position in the ranking of countries is also affected.
Fig. 4. The share of between-group inequality in total inequality, by household head’s education
0%
5%
10%
15%
20%
25%
30%
35%
SE AT DK NO FR IT EE FI BE ES IE LU GR PT2000 2004
Table 2b in the Annex shows details of the decomposition according to the education level of
the household head in 2004. The proportion of the population with different education levels
varies considerably across countries. In Norway, Estonia and Sweden the percentage of those
living in households where the head has only primary or lower secondary education is around
one fifth, while in Spain, in Italy and especially in Portugal is well above 50%. The proportion is
also just over a quarter in Spain, Ireland, Italy and Luxembourg. At the same time, almost 30%
of the population live in households headed by a person with tertiary education in Belgium ,
Finland and Norway, as opposed to 10% in Italy and Portugal.
Differences in income between households with different education levels are largest in
countries with a large proportion of people living in households where the head’s education is
low, such as Portugal, Greece and Italy. In Portugal, the mean income of those living in
households where the head has tertiary education is twice as high as the mean income for the
overall population. Conversely, income differences between education groups are relatively

Social Situation Observatory – Social inclusion and Income distribution Final report
Social Situation Observatory – Social inclusion and Income distribution 70
small in countries where education levels are comparatively high. In Sweden and Denmark,
mean income of households with tertiary education is only 40%higher than the average for
households with primary or lower secondary education education. The differences in Denmark,
Finland and Austria are only slightly higher.
These differences between countries partly reflect a high wage premium to education in labour
markets where the supply of well-educated labour is relatively scarce and low wage premium
where it is more abundant. Contradicting this relationship, income differences by education
level are also relatively wide in Estonia, which has a relatively well -educated population. It
might be that the rapid economic growth over the past decade led to greater increase in
demand for educated labor than could be matched on the supply side. It is also the case, of
course, that in countries with well-developed social welfare systems, such as the Nordic
countries, the extent of income redistribution is also important in reducing differences in
disposable income.
The combined effect of household heads age and education
In order to examine the relationship between age, education and income, households can be
grouped by age and education combined, with three age group (18-34 years, 35-64 years, 65
years or more) and three education categories (the same as above) being distinguished. The
following chart shows the proportion of overall inequality accounted for by mean income
differences between the age-education groups. It is evident that the ranking of countries is
similar to that shown above where only the education level of the household head was taken
into account. Inequality between the groups distinguished accounts for the largest share of
overall inequality in Portugal, Greece Luxembourg, and Ireland, as before, and the smallest
share in Austria Italy, France and Sweden. The main feature in relation to the previous ranking
is that Denmark moves up in the ranking as a result of the age of the head of household being
a relatively important factor underlying inequality between households. Countries where
important intertemporal changes occur in the between-group component of inequality are the
same as countries where the between-group component for education alone has changed:
France, Luxembourg and Portugal.

Social Situation Observatory – Social inclusion and Income distribution Final report
Social Situation Observatory – Social inclusion and Income distribution 71
Fig. 5. The share of between-group inequality in overall inequality, by household head’s combined age
and education
0%
5%
10%
15%
20%
25%
30%
35%
AT IT FR SE NO EE ES BE DK FI IE LU GR PT
2000 2004
DECOMPOSITION OF INEQUALITY ACCORDING TO EMPLOYMENT STATUS OF HOUSEHOLD HEAD
The employment status of household heads is classified into three groups: employed full-time
or part-time, unemployed or inactive (not retired) and retired. As the following chart shows
there are three groups of countriesin the ranking by between-group component in inequality.
The is a first group with Ireland, where differences in the employment status of the head
accounts for 19% of overall inequality, Esxtonia and Belgium, where it accounts for around 15% .
By contrast, employment status accounts for under 5% of inequality in Portugal, Italy, Greece,
Finland and Austria. The Nordic countries occupy an intermediate position between these two
groups, with the employment status of the household head explaining approximately 10% of
the overall inequality. Regarding intertemporal changes in between-group inequality it seems
that in Ireland and Belgium the share of between-group component of inequality was increasing
during the four years following the Millennium. Smaller increase can bet detected in the case of
Finland and a smaller decrease in the case of Denmark.

Social Situation Observatory – Social inclusion and Income distribution Final report
Social Situation Observatory – Social inclusion and Income distribution 72
Fig. 6. The share of between-group inequality in overall inequality, by household head’s employment
status
0%
5%
10%
15%
20%
25%
PT IT LU AT GR FR ES SE NO FI DK BE EE IE
2000 2004
Table 3b. in the Annex gives details of the decomposition for the year 2004. The share of
population in each work status category differs between countries reflecting differences in
employment rates, age structure, patterns of cohabitation and other factors. The share of those
living in households where the head is working is highest in Luxembourg, Norway, Portugal and
Ireland, in each of which the proportion is 70% or higher. By contrast, in Italy only 63% live in
households where the head is working and the figure is only slightly higher in Belgium, Finland
and France. The proportion of people living in households where the head is unemployed or
inactive (but not retired) is largest in Ireland (22%), Spain and Finland (both 18%) and smallest in
Austria (9%). The proportion living in households where the head is retired is largest Italy,
Austria and France (22-23%%) and smallest in Ireland (8%)..
The relative income of those in households where the head is employed is always higher than
100% (ie always greater than the average of all households). Highest ratios are found in Ireland,
Estonia and Belgium where the mean income of such households is more than 10% higher than
the mean for the overall population. Those living in households where the head is not working
(or retired) have generally the lowest relative income. Their relative income is tho lowest in the
above three countries (under 70% of the average), while in Finland, Sweden and Spain, where
their relative income is highest, it is still more than 20% less than the average. For households
where the head is retired, relative income is equal or slightly above the average in Austria,
France, Italy, Luxembourg, while in the other countries, it is below, most especially in Estonia
where it is only 67% and in Ireland where it is 81% of the national mean.

Social Situation Observatory – Social inclusion and Income distribution Final report
Social Situation Observatory – Social inclusion and Income distribution 73
Results of dynamic decomposition analysis
We investigated the role of different explanatory factors in the evolution of income inequality by
dynamic decomposition analysis. As detailed in the methodological section of the paper this
method decomposes the change in the MLD index in three terms: the effect of changes in
between group inequality, the effect of change in the population structure and the effect of the
change of within group inequality. Our main interest is the percentage of change in overall
inequality explained by change of between group inequality, where grouping variables are age,
education and employment of the head of household. The detailed results are displayed in the
Annex. In case of France and Luxembourg no significant change in inequality occurred, thus
determinants of change are not commented.
As we have seen before, between 2000 and 2004 the most important changes in inequality
have been detected in Austria and Denmark. In Austria change in inequality between age
groups does not play a role in the increase of inequalities. Inequality between groups with
different education levels has changed in a way that even lowers overall inequality. If we
consider the combined age and education grouping, it can also be seen that the change in
between group inequality lowers overall inequality. The effect of employment on the overall
increase of inequality in Austria is also moderate. Thus in Austria overall inequality increase has
been driven by growing within-group inequality and changes in the population structure rather
than an increase in between group inequality. In Denmark, growing between age-group
inequalities account for 25% of the increase in overall inequality. Changes in inequalities
between households with different education level has no important effect, but the combined
effect of age and schooling – obviously driven by the age effect – is also inequality enhancing.
The change in inequality between employment groups has a moderate inequality reducing
effect.
According to our results inequality has increased also in Italy and Ireland. In Italy age does not
play a role in the increase in inequalities but the change in income differences between
education-groups (and the combined effect of age and education) is moderately inequality
enhancing. Inequality between employment groups has a moderate inequality reducing effect.
In Ireland the effect of a change in inequality between the employed/inactive/retired is very
important, it explains 47% of the increase in overall inequality. The change in between age-
group inequality has no effect, while change in inequality according to education level has a
moderate inequality reducing effect.
Portugal and Finland have experienced a slight increase in overall inequality during the period
considered. In Portugal the important decrease in between education levels inequality was
counterbalanced by a strong increase in within group inequalities and the change in population

Social Situation Observatory – Social inclusion and Income distribution Final report
Social Situation Observatory – Social inclusion and Income distribution 74
structure had an inequality enhancing effect as well. In Finland growing inequalities between
age-groups explain 35% of the increase in inequalities. Schooling or employment have only a
moderate effect.
Inequality has been declining in Greece, Belgium, Sweden and Spain. Overall inequalities in
Greece have been moderately declining. Decreasing inequalities between groups with different
education levels has contributed significantly to this decrease: it explains 45% of the change in
overall inequality. Age and employment have no important effect. In Belgium change in between
group inequalities according to age and education explain around 15% of the decrease in
overall inequality. In Sweden change in between group inequalities according to schooling and
employment explain around 10% of the decrease in overall inequalities. In Spain the 35% of the
overall decrease in inequality is accounted for by the decrease in inequalities between education
groups.
The following table summarises our results of decomposition of inequality changes. It shows
that changes in income differences according to education were a driving force of inequality
change for seven out of the twelve countries considered. In each of the cases this had an
inequality reducing effect. The change in between age-group inequality contributed to
inequality change in four cases, mainly with inequality increasing effect. The change in between
employment-group inequality had significant effect in only two cases. Differences in important
drivinig forces between country groups can also be seen. In the case of Nordic countries
Denmark and Finland, where age is an important explanatory factor of inequality, change in
age-related inequalities have an important effect on overall inequality change. Similarly, in
Mediterranean countries, where education is important in explaining income differences at one
point of time it is also an important driving force of intertemporal changes in inequality.
Table 1. The role of explanatory factors in inequality change Change in overall inequality Age Education Employment Important increase (AT, DK, IT, IE)
DK(++) AT(-), IE(-) IE(++), DK(-)
Moderate increase (PT, FI)
FI(++), PT(+) PT(--)
No change (FR, LU)
Small decrease (BE, GR, SE)
BE(-) GR(--), BE(-), SE(-)
Important decrease (ES)
ES(--)
Note: meaning of signs in parentheses are the following. ++/--: strong inequality increasing/decreasing effect (contribution to inequality change is more than 25%), +/- moderate inequality increasing/decreasing effect (contribution to inequality change is between 10 and 25%).

Social Situation Observatory – Social inclusion and Income distribution Final report
Social Situation Observatory – Social inclusion and Income distribution 75
Conclusion
The concern here has been to investigate the effect of the age, education and employment of
the heads of households on the degree of inequality of household disposable income, using the
MLD index as a measure of the latter. In terms of country groupings, the results indicate that in
the Nordic countries with relative low inequality, the age of the household head is more
important in explaining income inequality than elsewhere, mainly due to considerable
differences in average incomes between those close to retirement (50-64 years) and younger
people aged 18-34. On the other hand, education accounts for smaller share of overall
inequality in these countries than others, reflecting their relatively well educated population and
modest income differences between those with different education levels. Income differences
by employment status of the head of household are relatively important in Sweden but less so
in the other countries.
The southern European countries, with a relatively high degree of inequality, in many cases
display opposite characteristics to the Nordic ones. The age of the household head is relatively
unimportant in explaining inequality of household incomes, while their education level accounts
for a significant share of overall income inequality, especially in the case of Greece and
Portugal. As these countries are also those with a relatively poorly educated labour force, this
may reflect an inadequate supply of highly educated workers relative to demand and
accordingly these being able to command relatively high wages. The employment status of the
head of household is not very important in determining income inequality in these countries.
In Ireland, where income inequality is also high, education and employment are important in
explaining inequality. The age of heads of households also accounts for a relatively large share
of overall inequality mainly because the average income of the elderly is much lower than that
in younger age groups. The elderly therefore seem to have been left behind as real income has
risen rapidly over the past decade. The employment status of the head of household is also an
important factor underlying inequalities, which also reflects low incomes of the retired but also
relatively low level of unemployment benefits. Education is also important, despite the relatively
large proportion with tertiary education.
In the case of Austria, on the other hand, none of the explanatory factors considered seems
important in explaining income dispersion. For. Belgium, on the other hand, with a similar
degree of income inequality, the education level of heads of households and, even more, their
employment status, seem to be important factors.
The following figure summarises our results of static decomposition of inequalities groups by
countries. In Mediterranean countries education is an important factor in explaining
inequalities, while age and employment are not important. In continental countries education is

Social Situation Observatory – Social inclusion and Income distribution Final report
Social Situation Observatory – Social inclusion and Income distribution 76
the most important among the factors studied, but it is less important than in the case of
Mediterranean countries, while employment is more important. In the case of the Nordic
countries the three factors are equally important determinants. Age of household head plays
the most important role in case of Nordic countries. Ireland and Estonia are not members of any
of the groups considered. In these countries employment is the most important determinant of
inequality among the factors studies but education clearly plays an important role as well.
As we have seen in our decomposition of inequality changes education is the factor, which
plays an important role in inequality changes for the biggest number of countries. Changes in
income differences according to education unanimously had an inequality reducing impact
between 2000 and 2004 in these countries. Education played a role in inequality change in all
Mediterranen countries where –as we have seen – education is an important determinant of
inequalities at a specific point in time. Age and especially employment had more rarely an effect
on change of inequality.
Fig. 7. Percent of inequalities explained by various dimensions in different country groups in 2004
2%
5%
2%4%
9%
17%
15%
12%11%
9%
4%
7%
15%
11%
19%
0%
2%
4%
6%
8%
10%
12%
14%
16%
18%
20%
Mediterranean(ES, GR, IT, PT)
Ireland Continental (AT, BE, FR, LU)
Estonia Nordic (DK, FI, NO, SE)
head's age head's education head's employment

Social Situation Observatory – Social inclusion and Income distribution Final report
Social Situation Observatory – Social inclusion and Income distribution 77
References
Burniaux, J.-M.-Dang, T.-Fore D.- Förster M.- Mira d’Ercole, M.- Oxley, H.(1998): Income Distribution and Poverty in Selected OECD Countries. Economics Department Working Papers No.189, OECD Paris.
Eurostat (2005) The continuity of indicators during the transisiotn between ECHP and EU-SILC. Eurostat, Theme Population and Social Conditions, European Communities 2005.
Jenkins, S. P. (1995): Accounting for Inequality Trends: Decomposition Analyses for the UK, 1971-86, Economica, vol.62, pp.29-63.
Mookherjee, D–Shorrocks, A. F. (1982): A decomposition analysis of the trend in UK income inequality. Economic Journal, 92. 886–992.
Shorrocks, A.F. (1982): Inequality Decomposition by Factor Components Economterica, Vol. 50, No.1.

Social Situation Observatory – Social inclusion and Income distribution Final report
Social Situation Observatory – Social inclusion and Income distribution 78
Annex
Table 1a.Decomposition of MLD by age of household head, 2000
Population share (%) Relative means (%) Within-group inequality (1000*MLD) 18/34 35/49 50/64 65/max 18/34 35/49 50/64 65/max 18/34 35/49 50/64 65/max Total pop Austria 21 40 28 10 95 99 111 83 96 102 103 130 107 Belgium 18 41 27 15 105 96 114 78 139 86 191 161 142 Denmark 25 34 26 14 94 106 110 78 94 46 74 133 84 Spain 18 38 34 10 106 93 109 85 200 205 207 175 206 Finland 22 36 30 12 90 108 106 78 128 87 109 70 107 France 22 38 27 13 89 99 114 91 115 105 172 129 133 Greece 15 34 36 14 103 105 102 79 177 176 198 212 194 Ireland 24 39 29 8 94 102 111 68 113 153 142 148 147 Italy 14 37 37 11 96 99 105 90 199 170 159 120 166 Luxembourg 22 39 27 11 103 97 105 91 130 115 114 82 116 Portugal 19 38 34 9 96 99 110 75 191 234 244 233 235 Sweden 27 32 25 16 86 101 122 87 129 82 113 67 110

Social Situation Observatory – Social inclusion and Income distribution Final report
Social Situation Observatory – Social inclusion and Income distribution 79
Table 1b.Decomposition of MLD by age of household head, 2004
Population share (%) Relative means (%) Within-group inequality (1000*MLD) 18/34 35/49 50/64 65/max 18/34 35/49 50/64 65/max 18/34 35/49 50/64 65/max Total popAustria 20 40 28 12 93 98 111 93 130 97 148 187 131 Belgium 21 38 26 14 99 101 110 80 129 121 139 98 129 Denmark 23 36 26 15 85 103 121 80 109 84 99 82 105 Estonia 26 35 25 13 110 100 105 70 296 248 232 96 246 Spain 22 36 29 13 107 100 104 80 163 182 154 135 168 Finland 22 35 28 14 89 100 119 80 97 83 150 80 114 France 23 36 26 15 91 98 113 97 124 110 173 144 138 Greece 18 36 32 14 97 105 105 79 138 176 185 171 176 Ireland 20 38 33 9 97 100 110 67 139 162 193 121 172 Italy 16 37 33 13 96 96 110 91 221 194 194 136 193 Luxembourg 18 42 29 11 93 97 109 98 111 117 108 85 111 Norway 25 37 25 13 87 103 119 79 119 118 115 90 124 Portugal 21 36 30 12 96 99 110 84 207 257 280 266 258 Sweden 23 35 26 16 88 101 120 83 129 70 82 69 96

Social Situation Observatory – Social inclusion and Income distribution Final report
Social Situation Observatory – Social inclusion and Income distribution 80
Table 2a.Decomposition of MLD by education of household head, 2000
Population share (%) Relative means (%) Within group inequality (1000*MLD)
primary secondary tertiary primary secondary tertiary primary secondary tertiary Total
populationAustria 18 74 8 79 102 131 93 97 137 107 Belgium 33 33 34 77 96 126 100 152 113 142 Denmark 20 52 28 84 98 116 76 74 82 84 Spain 63 15 23 86 107 151 162 165 192 206 Finland 28 42 29 85 91 128 96 90 91 107 France 67 9 23 85 109 139 95 135 140 133 Greece 53 29 18 75 109 158 155 153 129 194 Ireland 53 33 14 82 107 149 116 123 147 147 Italy 59 31 10 85 115 140 157 134 149 166 Luxembourg 40 39 21 77 99 148 81 86 80 116 Portugal 82 8 10 80 143 234 166 156 134 235 Sweden 22 48 29 87 94 120 75 82 156 110

Social Situation Observatory – Social inclusion and Income distribution Final report
Social Situation Observatory – Social inclusion and Income distribution 81
Table 2b.Decomposition of MLD by education of household head, 2004
Population share (%) Relative means (%) Within group inequality (1000*MLD)
primary secondary tertiary primary secondary tertiary primary secondary tertiary Total
populationAustria 24 59 17 83 100 125 143 104 159 131 Belgium 34 37 29 80 97 127 117 107 111 129 Denmark 29 47 24 85 99 120 86 87 110 105 Estonia 18 58 24 68 93 139 182 208 268 246 Spain 55 20 25 82 106 135 137 148 148 168 Finland 29 43 28 83 94 128 84 101 112 114 France 23 53 23 87 93 129 121 113 149 138 Greece 49 32 19 77 103 153 147 135 127 176 Ireland 48 28 24 81 96 142 148 114 180 172 Italy 59 32 10 85 110 157 175 160 201 193 Luxembourg 38 41 21 81 98 139 84 93 92 111 Norway 15 58 27 78 96 120 79 117 121 124 Portugal 77 12 11 81 127 206 199 218 188 258 Sweden 21 54 25 85 99 116 92 77 117 96

Social Situation Observatory – Social inclusion and Income distribution Final report
Social Situation Observatory – Social inclusion and Income distribution 82
Table3a. Decomposition of MLD by employment status of household head, 2000
Population share (%) Relative means (%) Within group inequality (1000*MLD)
employed inactive retired employed inactive retired employed inactive retired Total
population Austria 73 8 19 103 74 99 97 132 120 107 Belgium 69 10 22 110 68 82 118 130 158 142 Denmark 74 8 18 108 71 78 60 108 101 84 Spain 71 19 10 108 76 85 206 199 123 206 Finland 70 8 22 108 73 84 92 181 84 107 France 70 10 20 105 74 96 115 190 135 133 Greece 70 10 20 108 74 87 176 222 201 194 Ireland 73 19 8 110 68 80 125 124 157 147 Italy 68 11 22 105 72 98 159 273 100 166 Luxembourg 74 4 22 104 73 90 116 153 78 116 Portugal 75 10 14 105 81 90 231 240 229 235

Social Situation Observatory – Social inclusion and Income distribution Final report
Social Situation Observatory – Social inclusion and Income distribution 83
Table3b. Decomposition of MLD by employment status of household head, 2004
Population share (%) Relative means (%) Within group inequality (1000*MLD)
employed inactive retired employed inactive retired employed inactive retired Total
population Austria 69 9 23 104 68 100 112 131 162 131 Belgium 64 16 20 113 67 86 104 141 105 129 Denmark 68 15 17 110 73 84 86 123 89 105 Estonia 67 17 15 117 61 67 203 330 90 246 Spain 68 18 14 109 77 86 158 175 133 168 Finland 65 18 17 111 76 83 100 122 83 114 France 65 14 21 106 72 100 114 195 136 138 Greece 69 13 18 108 73 90 166 167 171 176 Ireland 70 22 8 115 60 81 143 115 165 172 Italy 63 15 22 106 74 102 185 265 130 193 Luxembourg 74 13 13 103 77 103 106 129 91 111 Norway 72 16 13 110 72 80 110 131 92 124 Portugal 72 12 16 105 73 97 241 294 263 258 Sweden 68 15 17 109 77 84 80 124 74 96

Social Situation Observatory – Social inclusion and Income distribution Final report
Social Situation Observatory – Social inclusion and Income distribution 84
Table 4a. Decomposition of inequality change according to age of household head
delta MLD
% of change due to changes in within group
inequality
% of change due to changes in population
structure
% of change due to changes in between
group inequality Austria 24 100 5 -5 Belgium -13 88 -5 17 Denmark 21 77 -2 25 Spain -38 98 1 1 Finland 7 70 -5 35 France 5 114 11 -25 Greece -18 94 7 -1 Ireland 25 91 10 -1 Italy 27 97 -1 5 Luxembourg -4 108 6 -13 Portugal 23 116 -4 -12 Sweden -14 82 14 5
Table 4b. Decomposition of inequality change according to schooling of household head
delta MLD
% of change due to changes in within group inequality
% of change due to changes in population
structure
% of change due to changes in between
group inequality Austria 24 78 39 -16 Belgium -13 83 4 13 Denmark 17 94 0 6 Spain -40 70 -5 35 Finland 8 101 -7 6 France 4 202 101 -203 Greece -19 51 4 45 Ireland 27 73 41 -14 Italy 27 89 -1 12 Luxembourg -3 -192 18 273 Portugal 22 171 27 -98 Sweden -15 64 23 13
Table 4c. Decomposition of inequality change according to age&schooling of household head
delta MLD
% of change due to changes in within group inequality
% of change due to changes in population
structure
% of change due to changes in between
group inequality Austria 24 92 36 -28 Belgium -13 89 7 4 Denmark 17 82 -7 25 Spain -40 68 -1 33 Finland 8 109 10 -20 France 4 302 94 -295 Greece -19 44 8 49 Ireland 27 72 47 -19 Italy 27 88 0 12 Luxembourg -3 -155 21 235 Portugal 22 179 22 -101 Sweden -15 60 28 12

Social Situation Observatory – Social inclusion and Income distribution Final report
Social Situation Observatory – Social inclusion and Income distribution 85
Table 4d. Decomposition of inequality change according to employment of household head
delta MLD
% of change due to changes in within group
inequality
% of change due to changes in population
structure
% of change due to changes in between
group inequality Austria 24 83 8 9 Belgium -13 143 -36 -7 Denmark 21 84 27 -12 Spain -39 95 6 0 Finland 8 -35 124 11 France 6 -4 96 8 Greece -18 106 -7 1 Ireland 27 45 8 47 Italy 27 83 25 -8 Luxembourg -3 237 -241 105 Portugal 23 85 5 10

Social Situation Observatory – Social inclusion and Income distribution Final report
Social Situation Observatory – Social inclusion and Income distribution 86
4. SELECTED CASE STUDIES OF CHANGES IN INCOME DISTRIBUTION
The analysis in the previous chapter examined the factors underlying relative poverty rates and
inequalities in income distribution and changes in these over time. The concern here is to throw
further light on these and other factors by considering recent developments in four EU Member
States in more detail than is possible on the basis of the macro approach adopted above.
The four countries In question are Ireland, Sweden, Spain and Hungary, which have experienced
very different economic and social developments over recent years and the detailed study of
which accordingly may provide additional insights into key issues – in particular, the effect of
economic growth and differing rates of net job creation on the distribution of income.
Ireland
Ireland is the first cohesion country25 whose GDP per head has reached and surpassed the EU
average level. Table A1 (in the Appendix) shows the path of this index during the past decade.
Between 1995 and 2000 the Irish economy grew at around 10% annually, and 5% since 2000.
Nowadays the level of GDP per head in Ireland is one of the highest in Europe. This rapid
expansion was mainly due to foreign-owned, export-oriented multinational firms in the
chemical, pharmaceutical and electronic machinery industries (for a more detailed see e.g.
Murphy [2000]) Meanwhile the employment rate rapidly increased in the past decade, and the
unemployment rate decreased from 16.8% in 1986 to 4.4% in 200526. Because of the
progressing economic performance, it is a question of great interest whether it has been
accompanied by widening or narrowing of earnings and income inequalities.
Ireland inherited a modest social welfare system from the UK at the time of its independence in
1922, and followed the Anglo-Saxon model in the years after (see Callan-Nolan [1997]).
Different indicators show that in the last 30 years Ireland has been characterised by a high and
rather stable degree of income and earnings inequality, while this latter also showed some
favourable patterns.
Barrett et al. [2000] investigate the evolution of wage inequalities between 1987 and 1997.
They report rapidly increasing wage inequality between 1987 and 1994 but a slowdown of this
process between 1994 and 1997. They also examined - by means of Mincer-type regressions -
the returns to education during the same period. They found that only the return on university
education increased between 1987 and 1994, and then mainly among older workers. Between
25 The cohesion countries are Ireland, Greece, Portugal and Spain. 26 According to EUROSTAT.

Social Situation Observatory – Social inclusion and Income distribution Final report
Social Situation Observatory – Social inclusion and Income distribution 87
1994 and 1997, when the Irish economy grew rapidly, the return on education (and earnings
inequalities) seems not to have changed. According to the authors, in many countries like the
UK and the US, the increasing demand for skilled labor and the increase in the return to
education are the major factors underlying widening inequalities. Barrett et al. [2000] concluded
that in Ireland an important reason for the return to education and earnings inequalities
remaining unchanged – despite the increasing demand for skilled labor - was the large inflow
of skilled workers into the Irish labour market in the 1990s.
Nolan-Russel [2001] reports on the recent trends in gender wage gap. The female-male hourly
wage ratio has risen from 80.1% in 1987 to 84.5% in 1997. According to EUROSTAT this ratio
has increased further to 85% in 2002. Besides these ratios, what is more meaningful is that part
of the wage gap that we cannot explain by different individual characteristics therefore we
attribute it (at least partially) to discrimination. Nolan-Russel [2001] say that in the ‘90s the
unexplained part of the gap severely reduced (from around 50 to 26%), that means that the
difference among men and woman are mainly due to difference in their important individual
characteristics, especially more years out-of-the labor market and less experience.
As we mentioned above, regarding the distribution of total household disposable income,
Ireland was characterized by relatively high and stable inequalities. In 2004, the Gini
coefficient27 for the population as a whole was around 0.32, (see Table A2) which is higher than
the EU average (0.3), but very similar to the coefficients in the southern European cohesion
countries as well as in the UK.
The P90/P10 index28 (Table A3) and the other indicators of income distribution (like S80/S20,
see Table A4) are also in line with the Gini coefficient. In 2004, just like in 1995, the ratio of the
average disposable income of the top to bottom quintiles (S80/S20) stood at about 5, which is
among the highest in Europe. Table A5 shows the OECD estimates of the change in income
distribution after 1987. While the S80/S20 index remained unchanged, the shares of both
quintiles declined as the share of the middle income groups increased. Moreover, Nolan-Maitre
[2000] have shown that it were mainly the upper-middle income groups (6-8 deciles) whose
income increased the most in the ‘990s (see Table 5. below). However, these changes are not
major ones, and it might be the case that they do not represent any long-run transformation in
the distribution of income. Furthermore, as Table A5 shows, during the 1990s the share of
earnings of the bottom quintile rose significantly, but this increase is not evident in the
disposable income of households.
27 The Gini coefficient is defined as the area between the Lorenz curve of incomes and the 45°-line, taken as a ratio of the whole triangle. The coefficient ranges between 0 (perfect equality) and 1 (perfect inequality). 28 The P90/P10 decile ratio is calculated as the ratio of the upper bound value of the ninth income decile to the upper bound value of the first income decile.

Social Situation Observatory – Social inclusion and Income distribution Final report
Social Situation Observatory – Social inclusion and Income distribution 88
Table 5: Decile Shares in Equivalised Disposable Income Among Households, (%)
1987 1994 1997Bottom quintile 7.7 8.4 8.1 3-5 deciles 19.8 18.7 18.7 6-8 deciles 30.8 31.4 32.2 Top quintile 41.7 41.4 41.1 S80/S20 5.4 4.9 5.1 Source: Own calculation after Nolan-Maitre [2000]
So far as the risk of social exclusion is concerned, different thresholds are used to determine
the relative number of people with income below a critical level. The most commonly used
threshold indicates that almost a one-fifth of the population had income below 60% of the
national median and therefore were at risk of poverty in 2004. (see Table A6) It is also evident
from this table that social transfers reduce the proportion in poverty by slightly more than the
EU average, but leave the poverty rate well above the average.
Data from the Central Statistics Office of Ireland (henceforth CSO [2005]) enable a breakdown
by type of household to be made. Fig. 10 show that members of lone parent households (with
a poverty rate of 48%), and those living alone (36%) are most at risk.
Fig. 10: The effect of household composition on poverty rate (households where the equivalised income is
less than 60% of median at an individualised level, after social transfers, 2004)
0,0
10,0
20,0
30,0
40,0
50,0
60,0
1 adult, nochildren
2 adults, nochildren
3 or moreadults, nochildren
1 adult withchildren
2 adults with 1-3 children
otherhousehold with
children
MaleFemaleTotal
Source: CSO[2005]
In the CSO study also includes different indicators of deprivation. They report that among
households at risk of poverty, households with children had higher deprivation rates than those
without. Lone parent households experienced the greatest deprivation, almost two-thirds of

Social Situation Observatory – Social inclusion and Income distribution Final report
Social Situation Observatory – Social inclusion and Income distribution 89
those at risk of poverty experiencing deprivation according to at least one of the eight basic
indicators used.
Sweden
To many people, Sweden is one of the most equal societies in Europe where, in addition, the average standard of living is also perceived to be exceptionally high in international terms. Cohen et al. [2002, p. viii] assert that at the beginning of the twentieth century the extent of Swedish inequality was not at all different from that of other European countries and so raises the question whether this equality has been attained by the different fundamentals of the society or by the special institutes, i.e. the so called Scandinavian type welfare state reforms. Roine-Waldenström [2006] argues that it is due to the egalitarian society as most of the reduction in inequalities occurred before the 1950s, the expansion of welfare state reforms. The authors claim that the reduction of income inequalities were first due to the fall in capital incomes of the richest and to the wage compression favouring the less rich.
In the first part of the ’90s Sweden went through a severe economic recession. Between 1991-
1993 the real GDP growth was negative, the unemployment rose from 1.6 to 8.2%, and got
stuck at around 8% until 1997, when Swedish labor participation started to increase again, and
the unemployment rate decreased to around 4%. Holmlund [2003] found that the major factors
for the severe recession and the amazing recovery were mainly domestic and foreign origin
macroeconomic shocks. But how did the inequalities change in this economic circumstance?
After several decades of wage compression wage inequality in Sweden started to increase in the
mid 1980s. The increase was only modest – from 2,21 P90/P10 ratio to 2,26 - between 1986
and 1995, but accelerated after that, and by the year 2000 the attained 2,38.
One important aspect of the wage distribution is inequality by education level. During the
recession years the return on different levels of education unevenly reduced according to the
Mincer-type OLS estimates of Gustavsson [2004] from the period 1992-2001. In Table 7 we can
see that in the whole period, after controlling for potential experience, gender and immigrant
status,29 the university wage premium started to increase after 1997, while the gymnasium
wage premium remained unchanged. In line with the international trends, the expansion of
university students reduced the wage premium of the skilled in the ‘70s. The modest increase
in the ‘80s, according to Gustavsson [2004], can also be fairly explained by changes in relative
labor supply of the higher educated. In contrast, he found that the main trends in the past 15
years was rather due to changes in labor demand, that on the whole caused widening earning
inequalities among those with different levels of education.
29 Among population of age between 20 and 64.

Social Situation Observatory – Social inclusion and Income distribution Final report
Social Situation Observatory – Social inclusion and Income distribution 90
Table 6: Return on different levels of education (percentage difference compared to primary school) in
Sweden, 1992-2001* 1992 1993 1994 1995 1996 1997 1998 1999 2000 2001 2-year gymnasium (~vocational) 4.8 5.2 5.1 4.4 3.7 3.4 4.0 4.4 4.1 3.7 3-year gymnasium 14.1 15.0 15.0 13.9 12.9 12.0 13.1 13.9 13.3 13.2 Some university (one or two years) 17.9 19.1 18.6 17.8 16.9 17.4 20.2 22.5 22.8 23.6 University 32.3 34.4 33.7 32.6 32.1 32.4 34.5 37.0 37.1 38.3 Doctorate 49.0 53.1 50.9 49.8 49.9 50.8 52.0 58.3 58.7 59.6
Source: Gustavsson [2004]
* OLS log(wage) equations; after controlling for potential experience, its square, gender and immigrant status
Another important aspect of labor market inequality is gender inequality in employment and wages. Sweden is famous for its gender equality measured in employment gap. Although the difference of the employment rates of men and women is steadily around 3%30 and in international comparison Swedish women have the largest, 86% probability of labor force participation , the Swedish gender (log)wage gap31 is not by far among the lowest with its 25 per cent (Mandel-Semyonov [2005]). Authors claim that this is implied by the fact that woman employment is enhanced by the state, hence women are more likely to be employed in low-wage social and public sector jobs (e.g. teachers, nurses).32 This kind of inequality is not necessary undesirable (in case that women choose these kind of jobs to maximize their utility reflecting their preferences, in order to accommodate work and family/maternity, which is the case according to Mandel-Semyonov [2005]). On the contrary, however, if women are forced into this choice (if they have no other choice because of childbearing or if there exists labor market discrimination against them), it is a field where the state might intervene. This latter is the reason for introducing parental leave with daddy’s months in Sweden. (See Andersson-Duvander [2005])
Table 7: Inequality of the distribution of household disposable income in Sweden, 1980s-2004 Capital gains included Capital gains excluded Mid ’80s 1991 1995 2000 2004 1991 1995 2000 2004 Gini coefficient 19.8 22,6 22,7 29,4 25,8 20.8 21.3 24.0 23.1 P90/P10 2.4 2.49 2.50 2.86 2.75 2.45 2.46 2.69 2.68 S80/S20 3.38 3.09 3,17 4,15 3,63 2.88 2.95 3.34 3.24 Source: OECD [2005], SCB [2006a]
30 75 vs. 71.8% in favor of men. (SCB [2006b]) 31 Among population of age between 25 and 60, after controlling for age, education, marrital status and weekly working hours. 32 Surprisingly, the secret of the low employment gap in Sweden does not lie in part-time but rather in the above mentioned low-wage though full time employment. Part-time employment ratio is not that much higher in the Nordic country (16% among total population and 25% among women aged between 15 and 64) than in the EU (11.6% among total population and 18.8% among women aged between 15 and 64). (EUROSTAT-LFS [2003])

Social Situation Observatory – Social inclusion and Income distribution Final report
Social Situation Observatory – Social inclusion and Income distribution 91
Table 7 shows the basic tendencies of inequalities in household disposable income in Sweden
during the past twenty years. The effects became clearly evident in the second half of the
decade, and by 2000, the inequality indices had grown near to those of continental Europe. As
it can be seen the increase in inequality is much slower when capital gains are excluded, thus it
seems that the temporary increase in inequalities at the end of the ’90s (see Table 6) was
mostly caused by profitable investments. (Roine-Waldenström [2006])
Table 8: Relative disposable income in Sweden, by age groups Age 0-17 Age 18-25 Age 26-40 Age 41-50 Age 50-65 Age 66-75 Age 76- 2000 98.3 91.7 99.1 111.8 125.3 88.3 68.6 Change 1983-1995
-2.2 -10.5 -4.7 0.8 7.7 5.8 8.8
Change 1995-2000
2.9 0.7 1.4 -2.8 2.9 -5.0 -7.5
Source: OECD [2006]
Through unemployment and reduced family allowances, it was the relatively young, active population, and indirectly their dependent children, who were struck by the recession the most in the first ten years. Table 7 shows that the relative income of the young decreased substantially from 1983-1995 and this decline passed through onto the elderly by 2000. (These changes in the relative incomes can not be explained by the changes in the population shares of the age groups. [OECD, 2005]) The relative improvement in the situation of the young is due to the recovery of the labor market33 and the active and harmonized family and gender policy of the state.
According to data, the Swedish state plays the biggest role in the income redistribution among EU25 countries, taking the before and after social transfer poverty rates into account. According to EUROSTAT, the before transfer poverty rate in Sweden was 43%34 in 2004 (30% with pensions), which is among the highest in Europe, while the after transfer poverty rate was only 11%. The two-earner model is encouraged not just to make it possible for women to accommodate childbearing and career, as mentioned above, but it is also a priority not to let into poverty a divorced mother and her child; in other words, to secure financial independence for both of the parents. This policy is partly apparent from the data of Table 9: the poverty rate, measured as the percentage of population below the 50% of the median income, is a bit lower for singles with child than for singles without child, though if we raise the threshold to 60% of the median, this turns to a serious disadvantage for single child bearers.35 There is little difference between the poverty rates of cohabiting couples with no, one or two children, and if we assess the poverty threshold as 50% of the median income, even bearing three children
33 While the unemployment rate was 1.6% in 1990, it evolved to 7.7 by 1995. It fell back to 4.7 per cent by 2000 and stagnates (fluctuates somewhere around) ever since. In 2004, it was 5.5 per cent. (SCB [2006b]) 34%age of the population with less then 60% of the median income. 35 These data also tell us about the recession of the last decade of the twentieth century, as poverty rates of singles with child caught up with and passed those of without child in the late ’90s.

Social Situation Observatory – Social inclusion and Income distribution Final report
Social Situation Observatory – Social inclusion and Income distribution 92
seems to make no significant difference. If the threshold is 60%, however, even the Swedish poverty rates of three-child couples jumps up, which in 2004 meant that one fifth of large families dispose of less than 60% of the median income. From Table 9, we can also see that childbearers, particularly couples with three or more children were struck the most (beyond average) by the recession of the ‘90s. It might be true that the incomes of this latter group increased the most (a bit beyond average) in the past 5 years but neither this increase can offset their threateningly growing poverty rate of 12.2%.
Table 9: Poverty rate (percentage of population above 20 years of age below the 50 and 60% of the
median income) in Sweden, 1991-2004 Below 50% Below 60% 1991 1995 2000 2004 1991 1995 2000 2004 Total population 3.1 3.6 4.4 4.2 7.1 6.5 8.5 8.5 Single without child 5.8 6.4 7.6 7.3 13.5 10.4 15.1 14.7 Single with child 5.1 5.3 8.3 6.9 11.1 12.2 15.8 20 Cohabiting without child 1.8 2.2 2.5 2.4 3.9 4.4 4.7 4.6 Cohabiting with 1 child 1.7 2.5 2.6 3.9 3.1 5 5 6.6 Cohabiting with 2 children 2.2 2 3 2.8 4.3 5.4 6.1 5.4 Cohabiting with 3 or more children 4.7 5.6 5 6.4 10.2 11.4 11.3 12.2 Population above 65 years of age 3.3 1.8 3.8 2.8 12.3 5.1 11 8.3
Source: SCB [2006a]
The two-earner model is encouraged not just to make it possible for women to accommodate childbearing and career, as mentioned above, but it is also a priority not to let into poverty a divorced mother and her child; in other words, to secure financial independence for both of the parents. This policy is partly apparent from the data of Table 9: the poverty rate, measured as the percentage of population below the 60% of the median income (after social transfers), is a bit lower for singles with child than for the total number of singles. There is little difference between the poverty rates of cohabiting couples with one or two children. From Table 9, we can also see that childbearers, particularly couples with three or more children were struck the most (beyond average) by the recession of the ‘90s. It might be true that the incomes of this latter group increased the most (a bit beyond average) in the past 5 years but neither this increase can offset their threateningly growing poverty rate of 14%.
Table 10: The share of persons with an equivalised disposable income below 60% of the national median
equivalised disposable income (after social transfers) in Sweden, % 1997 1999 2001 2002 2004 Total population 8 8 9 .. .. Single .. .. 21 25 23 Single with dependent child .. .. 13 22 19 Cohabiting under 65 years of age 4 2 6 Cohabiting at least one over 65 years of age 6 5 6 Cohabiting with 1 child .. .. 5 5 8 Cohabiting with 2 children .. .. 4 4 5 Cohabiting with 3 or more children .. .. 8 12 14 One adult above 65 years of age .. .. 27 27 24 Population above 65 years of age .. .. 16 15 14
Note: In 2002, there was a break in series.
Source: EUROSTAT

Social Situation Observatory – Social inclusion and Income distribution Final report
Social Situation Observatory – Social inclusion and Income distribution 93
In Table 8 we have already seen that in 2000 population above 65 years of age disposed of only 70-90% of the median income. A piece of bad news appears again in Table 9: the poverty rates defined above are approximately twice as much higher than among the total population. In addition, single people of this age group are the social group among whom the poverty ratio is the highest in Swedish society.
Although in Table 8 we saw that in 2000 population above 65 years of age disposed of only 70-90% of the median income, the good news is that poverty rates defined above are not anymore significantly higher than among the total population and also, this is the only social group whose disposable income has been continuously rising during the past one and the half decade.
Spain
Spain is a Mediterranean country where, stereotypically, the participation rate in the labour force has been historically low reflecting traditional values and the role expected of women of taking care of the family. Things have changed dramatically over the past decades of EU membership, however, as GDP per head in Spain has coinverged towards the EU average and employment has risen markedly. Participation in the labour force and employment rates have both increased along with growth rates of GDP (see Table 12 and 13).
Table 12: Growth of real GDP in Spain, 1997-2005 (%) 1997 1998 1999 2000 2001 2002 2003 2004 2005
3.9 4.5 4.7 5.0 3.6 2.7 3.0 3.2 3.5
Source: EUROSTAT
The cohesion country inherited a greatly regulated economy from the Franco era and the industrial crisis after the oil price explosion called the attention to the need of accession to the European Community (legal predecessor of European Union). Structural reforms required and supported by the Community resulted in peak economic growth in the ‘80s, until Spain experienced a recession around 1992. The recovery restarted with the reforms of the Aznar administration and up until now, the country has managed to make up quite a big part of its leeway from the Union. This closing-up process was not only due to EU-subsidies; luckily, those and the increasing labor demand induced by the inflow of FDI coincided with a great volume of labor force reserves. Henceforth, Spain experienced a miraculous growth in employment and however, it used to be the country bearing the largest unemployment, it was successful to cut this back. So that in 2005 the latter index was just above the EU-average (8.8 %).
Table 13: Employment and unemployment rates in Spain, 1995-2005 (%)

Social Situation Observatory – Social inclusion and Income distribution Final report
Social Situation Observatory – Social inclusion and Income distribution 94
1995 2000 2005
Total Employment rate 46.9 56.3 63.3 Unemployment rate 18.4 11.1 9.2 Women Employment rate 31.7 41.3 51.2 Unemployment rate 24.6 16 12.2 Men Employment rate 62.5 71.2 75.2 Unemployment rate 14.8 7.9 7.0
Source: EUROSTAT
The total employment rate equals exactly with the EU-average, which, on the one hand is good news, as it signals somewhat the competitiveness of the country, while on the other hand it is bad news, as severe (but also improving) inequalities hide behind this satisfying and dynamically increasing index.
Table 14: Labour participation rate by education and gender in Spain, 2002 (%) Less than secondary school Secondary school Tertiary education Total Men 83.5 90.9 91.9 72.6 Women 42.3 67.6 83.1 44.4
Source: de la Rica et al. [2006], EUROSTAT
Table 13 points at two of these at once: gender and education. Although the educational gap alone is not very serious36 as we can see from the data of men, it is magnified by the gender dimension: the participation rate of the least educated women is hardly larger than half of the most educated or half of the men with the same education. The gender employment gap is 8-9 percent wider than the EU-average, and however the great change in the total level must be acknowledged, it must be admitted as well that the gender gap has not narrowed significantly so far. (In 1994 the female and male employment rates were 30.7 vs. 61.8 percent, while in 2005 they happened to be 51.2 vs.75.2 percent.37) This phenomenon might be related to traditional gender and family roles and at the same time to education as well. The question whether this extremely low rate of employment of low educated women reflects the preferences of these people or it tells us about the scarce opportunities, or possibly about discrimination needs further analysis. The fact that gender inequality also reflects in wages suggests – in a
36 The huge increase in Spanish employment shows that the growth is driven by labor intensive industries and we must also call the attention to the fact that Spain is one of the countries where the participation rate among the lower educated is the highest (around 50 percent). However, this is good news, it can result in serious problems: if Spain does not improve the level of education among the population in parallel, with labor costs increasing along with the development, substitution between labor and capital may start leaving masses without job.
37 The slowly decreasing gender gap data suggest that female employment grew at a higher rate than that of men. This may be due to a structural realignment along the develpment among sectors (e.g. towards light industries typically employing female labor force, or health and education – typically low-wage sectors). This fact, however, together with the significant gender wage gap, might suggest a considerable occupational segregation between sexes.

Social Situation Observatory – Social inclusion and Income distribution Final report
Social Situation Observatory – Social inclusion and Income distribution 95
non-decreasing way – that it is not only the differing preferences of women which cause such a big inequity.38
As far as the inequality of the wage distribution is concerned the evolution followed an inverted U-shape form in the past two decades. Between 1980 and 1995 inequalities of wages were increasing and the major driving force was the increase of returns to education (Pereira and Martins [2004]). Researchers attribute growing returns to education to technological development in all sectors of the economy. Fast technological development brought about a depreciation of existing stock of human capital, and the demand for skilled labour with up-to-date knowledge increased. In the short run even increasing supply of educated labour was not able to match growing demand and therefore technological development was accompanied by rapidly rising returns to education and increase in unemployment of the unskilled. From the middle of the nineties inequalities have slightly started to fall (Budria, S. – Moro-Egido [2004], Izquierdo-Lacuesta [2006]). Extensive labor market regulations and wage compression in the middle of the wage distribution have had their impact. Returns to education have decreased and the depreciation of out-of-date human capital have continued. (Izquierdo-Lacuesta [2006]). Researchers interpret this process as consequence of rapidly increasing supply of educated labor which even exceeded the rate of growth of demand for skilled labor (Budria, S. – Moro-Egido [2004]).
Thus tendencies of increasing wage inequality between 1980 and 1995 turned somewhat back from the middle of the nineties until 2002. No such change has taken place in the evolution of inequality of household disposable income. Inequalities in household DPI were decreasing from 1980 to 1995 (Jimeno et al. [2000]) and continued to fall afterwards. The quintile share of disposable income fell gradually but continuously from its 1997 value of 6.5 to 5.1 by 2004. (EUROSTAT). This can be regarded partly as the evidence of within-family wage inequalities, and is partly supposed to be due to the articulation of a welfare state close to meeting European standards at that time (increased social expenditure, e.g. unemployment benefits) (Jimeno et al. [2000], Oliver-Alonso [2001]).
Discussing inequality some words about poverty should definitely be raised. Especially as the unpleasant news is that however inequalities have eased somewhat, this has not passed through to poverty yet, moreover the last data from 2004 raise the possibility of a new upward movement. The poverty rate (shown in Table 15) stagnates; the ratio of population below the 60 percent of the median income stabilized around 20 percent.
38 Gender pay gap given as the difference between average gross hourly earnings of male paid employees and of female paid employees as a percentage of average gross hourly earnings of male paid employees followed the path below:
1995 1996 1997 1998 1999 2000 2001 2002 2003 2004 2005
10 13 14 14 16 14 15 17 21 18 15
The population consists of all paid employees aged 16-64 that are 'at work 15+ hours per week'.
Source: EUROSTAT

Social Situation Observatory – Social inclusion and Income distribution Final report
Social Situation Observatory – Social inclusion and Income distribution 96
Table 15: Poverty rate (percentage of population below the 60 percent of the median income) in Spain,
1995-2004
1995 1996 1997 1998 1999 2000 2001 2002 2003 2004 Total (before public transfers) 27 26 27 25 23 22 23 22 22 25 Total (after public transfers) 19 18 20 18 19 18 19 19 19 20 ...-15 24 23 26 24 25 25 26 21 19 24 16-24 22 22 25 21 23 20 20 20 21 19 25-49 17 16 19 17 17 14 15 15 14 16 50-64 18 17 18 16 17 17 17 17 16 17 65-… 16 14 16 15 16 19 22 28 28 30 Single 15 12 12 12 14 20 31 38 34 39 single parent with dependent children 37 32 29 38 53 57 42 32 24 40 two adults+1 child 14 14 15 15 15 16 18 12 12 14 two adults+2 child 17 17 21 19 20 20 23 19 14 24 Two adults+ at least 3 child 31 34 31 30 32 35 34 38 35 39 households with dependent children 22 21 24 21 22 21 22 19 18 23 Source: EUROSTAT
Having a look at the two kinds of total poverty rates in the first two rows of Table 15, we capture evidence on the role of welfare measures. We can see that redistributive transfers reduce poverty substantially, though the degree is intensively decreasing. The decrease might signal the inefficiency of the transfers (it is not the most in need who benefit from them) or a new wave of general draw back of the welfare system.
Poverty rates by different dimensions show a quite typical picture: the young the old and large
families are the masses significantly above the average poverty rate. What is striking is that it is
almost exactly these groups whose situation draws a negative tendency. The case of the elderly
seems evident in the light of the above mentioned depreciating human capital and being aware
of the crisis of almost all pension systems. The situation of the young (children under 15) and
the big families hang together and call the attention to a targeted family policy.
HUNGARY
To understand the relationship between growth and inequalities in Hungary, there is a need to
adopt a long-term perspective. Starting from the beginning of the 1960s, the share of GDP
going to households, that is, per capita disposable income, showed a rapid increase in real
terms between 1962 and 1972 (Fig. 11). Since it was considered possible to protect the
economy from the effects of the downturn in the world economy from 1973 on, structural
adjustments were delayed, allowing real incomes to grow further between 1972 and 1982 and
even up to 1987, when recession began. Growth was maintained at the expense of a serious
build-up in foreign indebtedness and macroeconomic imbalances were already significant when
political reforms started in 1989-90.As a consequence, the unavoidable recession (Kornai
[1994]) resulting from structural adjustment, the collapse of trade and the implementation of
institutional reforms was deeper than expected. The first freely elected government in 1990

Social Situation Observatory – Social inclusion and Income distribution Final report
Social Situation Observatory – Social inclusion and Income distribution 97
chose a combined strategy of radicalism and gradualism. Radical strategies in economic
restructuring (relatively fast privatisation policies, stringent bankruptcy laws and fairly quick
withdrawal of the state from economic intervention) were accompanied by gradual and
sometimes hesitant social policy reforms (slow adjustment of pensions and health policies, the
extension of social benefits to a rapidly growing number of people rather than concentrating
them on the most needy). An austerity package to correct macroeconomic imbalances had to
wait until 1995, implemented by the (then) socialist government. (Bokros and Dethier [1998]).
This package, comprising currency devaluation and some real and symbolic social expenditure
cuts, however, led to a reduction in inflation t, resulting in a further sharp decline in real
incomes in the mid-1990s. As economic stagnation (rather than a contraction) had already
begun in 1993, this austerity package opened the way to relatively strong economic growth
between 1998 and 2001. This was further boosted by pro-growth and pro-employment policies
of the (then) conservative government. In terms of social policy, this period was characterised
by tax-based incentives rather than cash handouts, a strengthening of state pension and health
policies rather than further privatisation and cuts in social expenditure.
In general, trends in income dispersion (as measured by the ratio of the per capita income of
the top decile to the bottom) can be divided into distinct periods. Between 1962 and 1982,
there was a declining general trend in income inequality, with a temporary jump in 1972.
(perhaps attributable to some short-lived economic reforms at the end of the 1960s) This trend
may be a result of economic growth, accompanied by continuous efforts of communist
governments to present their success in achieving basic commitments to equality. However,
this must be understood within the context of supply shortages, the relatively small role of
money in social inequalities, a high level of benefits and services provided in kind, with all sorts
of rationing having questionable and controversial effects on overall inequality. As mounting
foreign debt imposed pressure on the governments around 1980, some economic liberalisation
started at that time. New forms of private incentives were allowed (while not affecting the basic
economic structure), a gradual withdrawal of in-kind provisions started and these together led
to an increasing trend in inequality between 1982 and 1987. A relatively large widening of
income dispersion took place between 1987 and 1992, followed by a smaller increase between
1992 and 1996 and a levelling off between 1996 and 2001.
It is also interesting to look at changes in inequality, employment and real incomes over
different periods (Fig. 12.). The changes in the activity rate and in real income show a very
similar pattern. Increasing employment is always paralleled by growing real income and vice
versa. The actual rate of increase or decrease may be different but the general direction is the
same. Analysis of trends in income distribution, however, requires more consideration. There
are periods, when real incomes and activity rates both increased but income dispersion

Social Situation Observatory – Social inclusion and Income distribution Final report
Social Situation Observatory – Social inclusion and Income distribution 98
narrowed (between 1962-1967 and 1972-1977). In other periods employment, real incomes
and inequalities all rose (1967-1972 and 1996-2001), and there is a period of declining
inequality and employment in the context of a general (though slowing) increase in real
incomes. However, between 1982 and 2001, the trends seem to be more clear-cut: the larger
the reduction in employment and real incomes, the greater the increase in income inequality,
while recovery of real income and employment growth was accompanied by a moderation of
increases in income inequality.

Social Situation Observatory – Social inclusion and Income distribution Final report
Social Situation Observatory – Social inclusion and Income distribution 99
Fig. 11. Employment, real incomes and dispersion of incomes,
1962-2001, %
Fig. 12. Change in employment, real incomes and dispersion of incomes,
1962-2001, 1962=100
0
50
100
150
200
250
300
1962 1967 1972 1977 1982 1987 1992 1996 2001
index of per capita real income(1960=100)economic activity in totalpopulation, 1962=100S10/S1 decile share, 1962=100
-30
-20
-10
0
10
20
30
40
1967 1972 1977 1982 1987 1992 1996 2001
%change in real income(current and previous twoyears)%change in ratio of active pop.
%change in S10/S1 decileshares
Source: for employment and real incomes: Statistical Yearbook for inequality: 1962-1982: Atkinson–Micklewright ([1992. Table HI1]), 1987: CSO Income Survey, 1992 and 1996: Hungarian Household Panel (B), 2001: TÁRKI Household Monitor, own computations

Social Situation Observatory – Social inclusion and Income distribution Final report
Social Situation Observatory – Social inclusion and Income distribution 100
Table 6. Selective inequality measures of personal distribution of per capita household incomes in
Hungary 1987-2005 1987 1992 1996 2000 2003 2005Selected inequality measures P10 61 60 48 51 49 51 P90 173 183 191 193 192 192 P90/P10 2.81 3.07 3.95 3.78 3.90 3.78 S1 4.5 3.8 3.2 3.3 3.2 3.3 S5+S6 17.9 17.4 17.5 17.3 17.1 17.1 S10 20.9 22.7 24.3 24.8 25.7 25.1 S10/S1 4.6 6.0 7.5 7.6 8.1 7.6 Robin Hood index 17.0 18.5 20.7 21.2 21.8 21.4 Gini 0.244 0.266 0.300 0.306 0.316 0.308
Memo: overall average, Fts 5262 9587 17627 32517 53900 63117 N 56459 5538 4972 5253 5909 5209 Source: 1987: KSH Income distribution survey. 1992, 1996: HHP (B), 2000, 2003, 2005: TÁRKI Household Monitor surveys. Between 1992 and 2005: date refers to year of fieldwork. Reference period for incomes: April of previous year to March of current year between 1992 and 2000, October-September in 2003 and 2005.
From examining the various inequality measures, several periods of the long Hungarian
transition can be distinguished.
From 1982 to 1987, all measures of inequality measures showed a widening dispersion. The
ratio of the top decile of per capita household income to the bottom increased from 3.8 to 4.6,
followed by a further and larger increase to 6.0 by 1992 (Table 6). This latter period is very
important in the history of the Hungarian transition. The introduction of new company laws and
the installation of a completely new tax system in 1988 marked a real take off of the
competitive market economy. “Spontaneous” privatisation and management buyouts between
1987 and 1990 were followed by a larger scale, government initiated and (to the extent
possible) state controlled privatisation process starting from 1991, with massive sell-outs of
the remains of state enterprises (resulting in a large inflow of FDI into the country during the
1990s). The price for the increase in efficiency was massive job destruction throughout the
economy: over a quarter of all jobs were lost in just a few years between 1987 and 1992.
The widening of income dispersion (despite government efforts to spread the costs of the
transition over the whole of society) continued between 1992 and 1996, with a further increase
in the ratio between the top and bottom deciles of per capita income (to 7.5) and in the Gini
coefficient (from 26.6% in 1992 to 30% in 1996). The widening of income dispersion and the
increase in the poverty rate in this period can partly be linked to the austerity package the
government introduced in early 1995. Currency devaluation ,and cuts in social expenditure led
to a sharp deterioration in the relative position of the poorest sections of society (the bottom
decile, P10, declining from 60% to 48% of the median, see Table 1), while the relative position

Social Situation Observatory – Social inclusion and Income distribution Final report
Social Situation Observatory – Social inclusion and Income distribution 101
of the top decile improved (P90 up to 183% of the median in 1992 and to 191% by 1996 from
173% in 1987) .
While, in general, substantial changes have occurred in many respects in the country, overall
inequality measures have shown slight changes only between the mid-1990s and 2005. As
estimates from alternative income surveys show, the ratio of the top to the bottom decile of per
capita income was maintained at 7.5 in 2005.
Conclusion
The purpose of the case studies presented here is to complement the general analysis of
inequalities in income distribution across Europe.
In Ireland, where formerly income inequality was among the highest in Europe, the high rate of
economic growth since the mnid-1990s has been accompanied by little change in inequality.
A key question now is whether greater attention will be paid to social issues and to reducing
inequality and, if so, whether this will adversely affect economic performance.39
Hungary is a case of rapid transition from a centrally planned economy to a market economy.
During this transition income inequality increased significantly. A first period witnessed a
dramatic transition in the labour market (a fall in employment rates and polarisation of
employment possibilities), a second period a radical revaluation of skills and competencies. As
a result, the returns to higher education increased and this, together with a differential
expansion of the education system, led to a revaluation of educational attainment levels in
terms of the income gained from different occupations. In addition, the social benefit system
had an important effect in different periods on income inequalities.
39 The possibility of the reverse relationship, i.e. social equality having a positive effect on economic performance, and there being an endogenous relationship between the two rather than a trade-off might also be an interesting topic to research.

Social Situation Observatory – Social inclusion and Income distribution Final report
Social Situation Observatory – Social inclusion and Income distribution 102
References
Atkinson, A. B. 1999: In Rising Inequality Inevitable? A Critique of the Transatlantic Consensus. WIDER Annual Lectures 3. The United Nations University.
Atkinson, A.B. – B. Cantillon – E. Marlier – B. Nolan 2002: Social indicators. The EU and social inclusion. Oxford: Oxford University Press.
Atkinson, A.B. – B. Cantillon – E. Marlier – B. Nolan 2005: Taking Forward the EU Social Inclusion Process. Pre-final version, 31 May 2005. Luxembourg.
Atkinson, A.–Micklewright, J. [1992]: Economic Transformation in Eastern Europe and the Distribution of Income. Cambridge University Press, Cambridge.
Barrett, A – FitzGerald, J. – Nolan, B. [2000]: Earnings Inequality, Returns to Education and Immigration into Ireland, IZA Discussion Paper Series, 167.
Bean, C. – Bentolila, S. – Bertola, G. and Dolado, J. [1998]: Social Europe. One for All? Monitoring European Integration, CEPR
Bénabou, R. 1996: Inequality and Growth. In: Bernanke B. S. – J. Rotemberg (szerk.): NBER Macroeconomics. Annual MIT Press, Cambridge, pp. 11–74.
Boeri, T. 2002: Let Social Policy Models Compete and Europe Will Win. John F. Kennedy School of Government. April 11-12., Conference Draft.
Bokros, L.–J.-J. Dethier [1998]: Public Finance Reform During the Transition: The experience of Hungary. The World Bank, Washington.
Budria, S. – Moro-Egido, A.: Education, Educational Mismatch and Wage Inequality: Evidence for Spain, MPRA Paper no. 93, 2004, source: http://mpra.ub.uni-muenchen.de/93/01/MPRA_paper_93.pdf, downloaded: October 30th, 2006
Callan, T – Nolan, B – O’Neill, D. and Sweetman, O. [1998]: Female Labor Supply and Income Inequality in Ireland,http://economics.nuim.ie/research/workingpapers/ documents/N790698.pdf, downloaded: 18/08/2006
Callan, T. – Nolan, B. [1997]: Income Inequality and Poverty in Ireland in the 1970s and the 1980s, in Gottschalk – Gustafsson and Palmer: Changing Patterns in the Distribution of Economic Welfare, Cambridge University Press, 1997
Clarke, R. [1995]: More Evidence on Income Distribution and Growth, Journal of Development Economics 47, pp. 403-427
Cohen, D. – Piketty, T. – Saint-Paul, G. [2002]: The Economics of Rising Inequalities, Oxford Univ. Press, New York, pp. vii-xii.
Cole, H. – Mailath, G. and Postlewaite, A. [1992]: Social Norms, Savings Behavior, and Growth, Journal of Political Economy 100, pp. 1092-1125.
Cornia, G.A. – Court, J. 2001: Inequality, Growth and Poverty in the Era of Liberalization and Globalization. Policy Brief No. 4. Helsinki: UNU/WIDER.
CSO [2005]: EU Survey on Income and Living Conditions (EU-SILC), Central Statistics Office, Ireland, http://www.cso.ie/eusilc/documents/eusilc.pdf, downloaded: 12/08/2006

Social Situation Observatory – Social inclusion and Income distribution Final report
Social Situation Observatory – Social inclusion and Income distribution 103
Deininger, K. – L. Squire 1997: Economic Growth and Income Inequality. Reexamining the links Finance and Development, March, 1997. pp. 38–41.
Dollar, D. – A. Kraay 2002: Growth is good for the poor. The World Bank, mimeo. 2002 March version,
Esping-Andersen, G. 1990: The Three Worlds of Welfare Capitalism. Princeton, New Jersey: Princeton University Press.
Förster, M. – M. M. d’Ercole 2005: Income Distribution and Poverty in OECD Countries in the Second Half of the 1990s. OECD Social, Employment and Migration Working Papers No. 22. Paris: OECD. http://www.oecd.org/dataoecd/48/9/34483698.pdf, 6th of July 2005.
Galor, O. – Zeira, J [1993]: Income Distribution and Macroeconomics, Review of Economic Studies, 60/1: pp. 35-52.
Gangji, A. – Orsini, K. – Sissoko, S. [2004]: Does unobserved Heterogeneity Matter? A Panel Data Analysis of the Gender Pay Gap, http://www.iser.essex.ac.uk/epunet/2005/ docs/pdf/papers/sissoko.pdf, downloaded: 03/08/2006
Gottschalk, P. – Smeeding, T. M. [1997]: Cross-National Comparisons of Earnings and Income Inequality, Journal of Economic Literature, 35.
Gottschalk, P. – T. M. Smeeding 2000: Empirical evidence on income inequality in industrialized countries. In.: Atkinson, A. B. – F- Bourguignon (eds.), Handbook of income distribution Handbooks in Economics. Amsterdam: North Holland, pp. 261-308.
Gustavsson, M. [2004]: Changes in Educational Wage Premiums in Sweden: 1992-2001, Uppsala University Working Papers, 2004:10.
Holmlund, B. [2003]: The Rise and Fall of Swedish Unemployment, Uppsala University Working Papers 2003:13.
Juhn, C. – Murphy, K .M. – Pierce, B. [1991]: Accounting for the slowdown in Black-White wage convergence, in M.H. Kosters (Ed): Workers and their wages, AEI Press, pp. 107-143.
Kornai [1994]: Transformational Recession: The Main Causes. Journal of Comparative Economics, 19, No. 1., pp. 39–63.
Kuznets, S. 1955: Economic Growth and Income Inequality. American Economic Review Vol. 65, pp. 1–25.
Li, H. – H. Zou – Squire 1998: Explaining international and intertemporal variations in income inequality The Economic Journal 108. (January) pp 26-43. http://www.worldbank.org/research/inequality/pdf/squire.pdf
Murphy, A. E. [2000]: The ‘Celtic Tiger’ – An Analysis of Ireland’s Economic Growth Performance, EUI Working Papers, RSC No. 2000/16
Nielsen, F. – Alderson, A. S. [1997]: The Kuznets Curve and the Great U-Turn: Patterns of Income Inequality in U.S. Counties, 1970-1990, American Sociological Review, 62: 12-33.
Nolan, B and Maitre, B. [2000]: A Comparative Perspective on Trends in Income Inequality in Ireland, The Economic and Social Review, 31/4
Nolan, B. – Russel, H. [2001]: Pay Inequality and Economic Performance in Ireland: A Review of the Applied Literature, The Economic and Social Research Institute, Dublin, 2001

Social Situation Observatory – Social inclusion and Income distribution Final report
Social Situation Observatory – Social inclusion and Income distribution 104
O’Donnell, N. [1998]: Why did earnings inequality increase in Ireland: 1987-1994?, The Economic and Social Review, 31/4
Pereira, Pedro T.-Martins, Pedro S. (2000): Does Eductaion Reduce Wage Inequality? Quantile Regression Evidence From Fifteen European Countries. Discussion Paper no.120. IZA, Bonn.
Ravallion, M. 2001: Growth, Inequality and Poverty: Looking Beyond Averages. World Development. Vol 29. n11, November, pp 1803-15.
Ravallion, M. 2004: Pro-Poor Growth: A Primer. World Bank Policy Research Working Paper 3242.
Ravallion, Martin & Chen, Shaohua, 1997. "What Can New Survey Data Tell Us about Recent Changes in Distribution and Poverty?," World Bank Economic Review, Oxford University Press, vol. 11(2), pages 357-82, May.
Sapir, A. 2005: Globalisation and the Reform of the European Social Models. Background document for presentation at ECOFIN Informal Meeting in Manchester, 9 September, 2005.
Singh, A. [2001]: Income Inequality in Advanced Economies: A Critical Examination the Trade and Technology Theories and an Alternative Perspective, University of Cambridge Working Paper, 219
SSO 2005: Final Annual Monitoring Report . European Observatory on the Social Situation LOT 2., Network on Social Inclusion and Income Distribution. Mimeo. http://ec.europa.eu/employment_social/social_situation/docs/sso2005_social_inclusion_report.pdf
Tóth, I. Gy. 2006: “Measured and Perceived Income Distribution Shifts: in Search for Explaining Differences in Hungary, 1987-2003” paper prepared for the 29th International Conference of the IARIW, Joensu, Finland. Mimeo.
Weber, A. [2001]: Income Inequality in Ireland, Lehigh University Working Paper
World Bank 2005a: Equity and development. World Development report 2006. Washington: The World Bank
World Bank 2005b: Growth, Poverty, and Inequality. The World Bank.
Zweimüller, J. [2000]: Inequality, Redistribution and Economic Growth, Empirica, 2000/27, pp. 1-20.

Social Situation Observatory – Social inclusion and Income distribution Final report
December 2006 105
Appendix
Table A1: GDP per capita index compared to the EU-25 average, 1997-2005
1997 1998 1999 2000 2001 2002 2003 2004 2005Hungary 49.5 50.7 51.8 54.0 56.9 59.1 60.1 60.9 61.4 Ireland 111.7 116.3 122.1 126.3 128.5 132.3 133.7 135.8 137.5 Spain 87.0 88.6 92.3 92.3 93.2 95.2 97.4 97.7 98.6 Sweden 114.6 113.6 118.0 119.0 115.2 113.6 115.6 116.8 114.4 EU-25 100.0 100.0 100.0 100.0 100.0 100.0 100.0 100.0 100.0
Source: EUROSTAT
Table A2: Gini coefficients, 1995-2004, %
1995 1996 1997 1998 1999 2000 2001 2002 2003 2004Hungary .. .. .. .. .. 26 25 24 27 .. Ireland 33 .. 33 34 32 30 29 .. 31 32 Spain 34 34 35 34 33 32 33 31 31 31 Sweden .. .. 21 .. 22 .. 24 23 .. 23 EU-25 .. .. .. 29 29 29 29 .. 29 30 Source: EUROSTAT
Table A3: P90/P10 ratios, Mid 70s-2000
Changes in the absolute values Absolute levels in 2000
Mid-70s to Mid 80s Mid-80s to Mid 90s Mid-90s to 2000 Hungary 3.6 .. 0.3 0.1 Ireland 4.4 .. -0.1 0.3 Spain .. .. -0.8 .. Sweden 2.8 -0.2 -0.2 0.3 Source: Förster-d’Ercole [2005]
Table A4: S80/S20 ratios, 1995-2004
1995 1996 1997 1998 1999 2000 2001 2002 2003 2004 Hungary .. .. .. .. .. 3,3 3,1 3,0 3,3 .. Ireland 5.1 5.1 5.0 5.2 4.9 4.7 4.5 .. 5.1 5.0 Spain 5.9 6.0 6.5 5.9 5.7 5.4 5.5 5.1 5.1 5.1 Sweden .. .. 3.0 .. 3.0 .. 3.4 3.3 .. 3.3 EU-25 .. .. .. 4.6 4.6 4.5 4.5 .. 4.6 4.8 Source: EUROSTAT
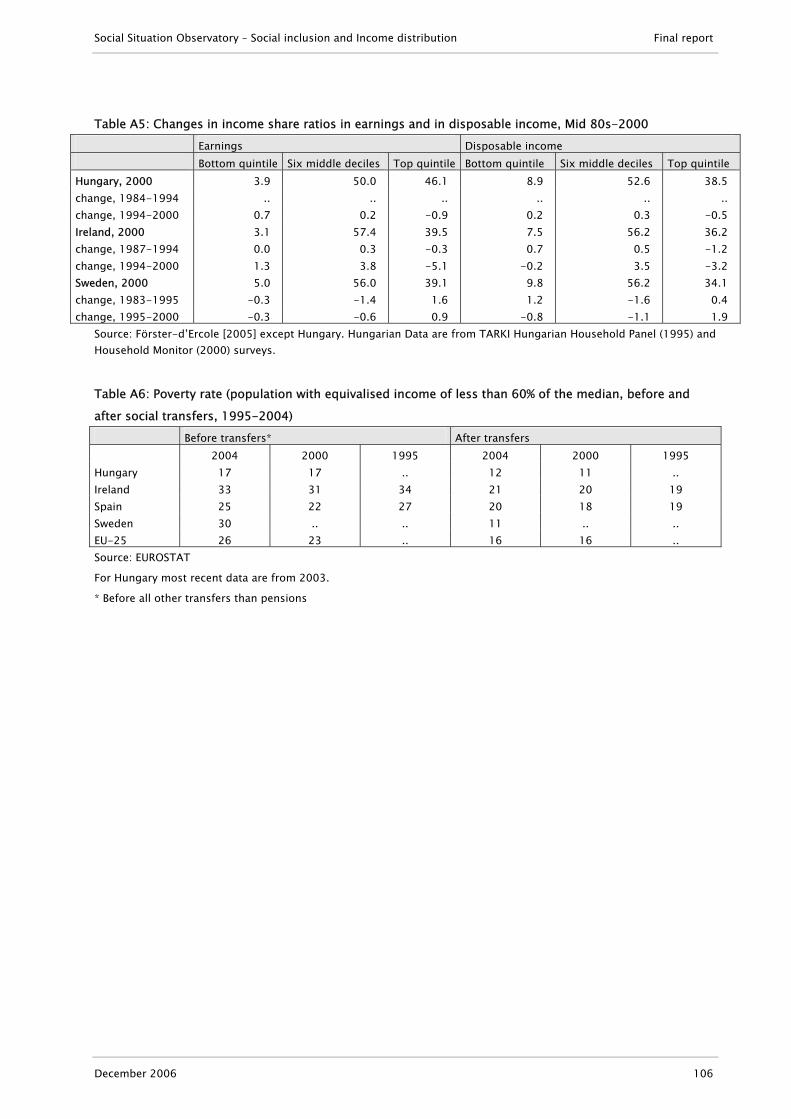
Social Situation Observatory – Social inclusion and Income distribution Final report
December 2006 106
Table A5: Changes in income share ratios in earnings and in disposable income, Mid 80s-2000
Earnings Disposable income Bottom quintile Six middle deciles Top quintile Bottom quintile Six middle deciles Top quintile Hungary, 2000 3.9 50.0 46.1 8.9 52.6 38.5 change, 1984-1994 .. .. .. .. .. .. change, 1994-2000 0.7 0.2 -0.9 0.2 0.3 -0.5 Ireland, 2000 3.1 57.4 39.5 7.5 56.2 36.2 change, 1987-1994 0.0 0.3 -0.3 0.7 0.5 -1.2 change, 1994-2000 1.3 3.8 -5.1 -0.2 3.5 -3.2 Sweden, 2000 5.0 56.0 39.1 9.8 56.2 34.1 change, 1983-1995 -0.3 -1.4 1.6 1.2 -1.6 0.4 change, 1995-2000 -0.3 -0.6 0.9 -0.8 -1.1 1.9
Source: Förster-d’Ercole [2005] except Hungary. Hungarian Data are from TARKI Hungarian Household Panel (1995) and Household Monitor (2000) surveys.
Table A6: Poverty rate (population with equivalised income of less than 60% of the median, before and
after social transfers, 1995-2004)
Before transfers* After transfers 2004 2000 1995 2004 2000 1995 Hungary 17 17 .. 12 11 .. Ireland 33 31 34 21 20 19 Spain 25 22 27 20 18 19 Sweden 30 .. .. 11 .. .. EU-25 26 23 .. 16 16 .. Source: EUROSTAT
For Hungary most recent data are from 2003.
* Before all other transfers than pensions

Social Situation Observatory – Social inclusion and Income distribution Final report
December 2006 107
5. THE EFFECT OF TAXES AND BENEFITS ON INCOME DISTRIBUTION
IN THE EU40
One of the main ways in which governments can influence income distribution is through the
system of cash benefits and personal taxes. Taxes tend to be progressive in the sense that
people with higher incomes pay a higher proportion in tax. Benefits may be targeted on the
poor, or even if flat rate will narrow the proportional difference between the incomes of the rich
and the poor. When benefits are paid to people in particular circumstances these tend to be
those that are correlated with low income or greater needs (such as childhood, disability,
unemployment etc). As was pointed out in the Annual Report of the Social Inclusion and Income
Distribution Network for 2005 (Chapter 6), the scale of this redistribution varies significantly
across countries, depending not only on the extent of social security arrangements and the
total personal tax burden but also on how benefits are targeted and the progressivity of the tax
and contribution systems.
The intention is to extend the analysis included in the 2005 Report to examine in more detail,
first, the distribution of income before taxes and benefits for the EU15 Member States (since
the EUROMOD model of household income on which the analysis is based at present covers
only these countries). Selected results are also provided for Hungary and Poland using national
tax-benefit models.41 Secondly, the effect of taxes and benefits in transferring income to and
from households with varying levels of original is analysed to bring out the nature of the
redistributive process in different countries.
Variations in the distribution of original income
The distribution of in pre-tax and pre-benefit income (here referred to as “original” income)
and the extent of inequality between households in these terms varies across countries in the
EU as much as taxes and benefits42. Measured using the Gini co-efficient the EU-15 countries
with the lowest original income inequality in 2001 are the Netherlands (0.39), Sweden (0.44)
and Austria (0.44). See Figure 6.1, where the original income Gini is indicated by a blue square.
The countries with the greatest original income inequality are Ireland (0.52), Portugal (0.51) and
40 Holly Sutherland, Horacio Levy and Alari Paulus, Institute for Social and Economic Research, University of Essex 41 Simulations for Hungary and Poland were undertaken, respectively, by Tarki using the microsimulation model TARSZIM2005 (developed by TARKI for the Hungarian Ministry of Finance and Ministry of Social Affaires) and by Olivier Bargain using the Polish microsimulation model, SIMPL (described in Bargain, Morawski, Myck and Socha (2006)). 42 Estimates of the distribution of original income and of the incidence of benefits and taxes on income of differing levels presented here are derived, as noted above, from the EUROMOD model of household income described in the annex.

Social Situation Observatory – Social inclusion and Income distribution Final report
December 2006 108
the UK (0.50). (These calculations ignore cases of zero household income which are quite
prevalent, especially among the elderly in countries with pension systems mainly organised
through the public sector, and here counted as benefits rather than original incomes. The 2005
report considered the role of public pensions in some detail. In this report we consider further
how to assess inequality of incomes, taking account of those starting with no original income at
all.)
Throughout the analysis, “original income” refers to income before taxes are deducted or cash benefits added. It includes earnings from employment, income from self-employment, income from capital, private pension income and transfers from other households (such as alimony and child maintenance). “Gross income” is original income plus cash benefits and “disposable income” is gross income less taxes. “Taxes” include income taxes and employee and self-employed social contributions together with other taxes customarily included in the concept of disposable household income, such as Council tax in the UK and Church taxes in Finland. Locally-administered income taxes are included along with national taxes. “Benefits” include all the main cash benefits and public pensions received by households.
Variations in the equalising effects of taxes and benefits
In order for countries with high inequality before taxes and benefits to achieve low inequality of
disposable income, the tax and benefit systems must “work harder” than in countries that start
with low inequality. Figure 6.1 shows the contribution of first, benefits and secondly, taxes to
reducing inequality, measured as the lowering of the Gini coefficient. Gross income inequality –
that is, income after taking account of benefits – is always substantially lower than original
income inequality due to benefits having an equalising effect on incomes. Benefits have the
most powerful effect in France and Luxembourg (with Ginis falling by 0.18 and 0.17
respectively) and the weakest effect in this respect in Portugal and the Netherlands (with both
Ginis falling by 0.10). The contribution of income taxes (and social contributions) to reducing
inequality measured in this way is in every country smaller than the contribution of benefits,
but is always positive (se Figure 6.2). Taxes contribute most in Belgium and Denmark (0.07
reduction in Gini in both cases) and least in Italy and Greece (0.04 in each case). Taken
together, taxes and benefits reduce the Gini coefficient by most in Luxembourg (0.23), France
(0.23), Denmark (0.23) and Finland (0.22) and least in the four Southern countries – Italy,
Portugal, Spain and Greece with Gini reductions of between 0.14 and 0.16 - and the
Netherlands (0.16).

Social Situation Observatory – Social inclusion and Income distribution Final report
December 2006 109
The end result is that the inequality in household disposable income is, according to EUROMOD,
highest in Greece, Italy and Portugal and lowest in Austria, Denmark and Sweden.43 There is
little positive or negative correlation between the extent of original income inequality and the
reduction in inequality resulting from taxes and/or benefits.
However, these calculations have made use of the Gini coefficient in a particular way. Other
assumptions or methods might produce different results. In particular, any observations with
zero (or negative) incomes have been excluded at each stage. The prevalence of these is likely
to be much larger for original incomes than for income with benefits and pensions added in. If
we had calculated the Gini including the zeros then its value would have been larger. Whether it
is uniformly larger across countries is a matter for further investigation. The second issue is the
order in which we calculate the effects of benefits and taxes. We have effectively assumed a
natural order: that benefits are added first and taxes deducted in a second stage. This has the
effect of inflating the inequality reducing properties of benefits relative to taxes. Both these
issues are considered in the box below.
Using the Gini coefficient to measure the effects of taxes and benefits on inequality
The treatment of zero and negative incomes
The Gini coefficient can take into account zero and negative incomes unlike the most inequality measures. However, there are still some issues to consider in using the Gini to assess the inequality-reducing properties of tax and benefit systems which might lead analysts to exclude such observations.
First, zeros might not correspond to “real” zero incomes: incomes might be mis-reported or assigned to zero by data providers due to missing values. These are arguments for excluding the zero and negative observations from the calculation.
Secondly, when other inequality measures are used in parallel, which are not defined for zero incomes (e.g. logarithmic measures), it is often convenient to avoid different sample sizes according to the inequality measure used. This is not relevant for the present analysis.
An alternative to the inclusion of zeros is to use bottom-coding. This refers to assigning a standardised low positive value to the observations below chosen threshold.
When using original income, the prevalence of zeros is greater. In this case the sample size could be still limited, e.g. to the working-age population.
The order of the decomposition
The order of the decomposition matters. It is quite natural to add benefits first and then deduct taxes due to the fact that some taxes are levied on benefits. On the other hand there are few examples of benefits which depend on the income net of taxes. If one deducts taxes before adding benefits then taxes would appear to be more redistributive than they would otherwise. A way to avoid the ordering
43 It should be emphasised here that the estimates presented here are derived from EUROMOD (version C9) and relate to 2001. They may, therefore, differ from those presented elsewhere in this report which are based in some cases on different sources. The concern here is not so much with the estimates of income inequality in different countries per se but on the effect of benefits and taxes on these.

Social Situation Observatory – Social inclusion and Income distribution Final report
December 2006 110
issue while measuring the effect of taxes and benefits is by comparing disposable income to the case where respective instruments (taxes or benefits) are “switched off”. See Immervoll et al., 2006 for an example.
Since the use of the Gini coefficient may be misleading in summarising the relative effects of
taxes and benefits across countries on income inequality we also examine the effect of taxes
and benefits on another commonly-used indicator of income inequality: the quintile share ratio.
Similar issues apply, since of the bottom quintile group contains many zero incomes the ratio
will be very high and hence the indicator will be very sensitive to the extent of zero incomes.
For example the quintile share ratio for original income in Ireland calculated in this way is of
the order of 600, whereas for most other countries it is around 50 to 100 whereas the values
for disposable income are of the order of 3 or 4.
Another approach is to rank households by a constant income measure (here using disposable
income) and calculate the share of original, gross and disposable income for the same groups
(bottom and top quintile groups) each time. This is shown in Figure 6.3. Ireland is still the
outlier with a quintile share ratio of more than 35 for original income. The UK has the next
highest value, followed by Denmark, Belgium, Portugal and Finland. Benefits reduce the ratios
of income shares to between 3.2 (in Austria and Sweden) and 6.1 (in Italy and Portugal). Almost
all of the effect is through benefits, except in Poland where there is a small additional effect
through taxes. The size of the inequality reduction can be seen more clearly in Figure 6.4 where
Ireland and the UK stand out and the smallest reduction is in Austria and Poland.
The Gini (excluding zeros and re-ranking at each stage) and the quintile share ratio (including
zeros and ranking by disposable income at each stage) show different results for the inequality
reducing properties of taxes and benefits. A ranking of countries by the size of the (absolute)
reduction in inequality using the two measures is quite different: for example France has the
second lowest reduction using the quintile share ratio but the second highest using the Gini.
The UK has the second largest reduction using the quintile share ratio and the 7th from bottom
(of 16 countries) using the Gini.
Clearly, care must be taken in selecting ways of measuring the contribution of taxes and
benefits to inequality reduction, and careful interpretation is also needed.
So far we have considered taxes and benefits as aggregates. Of course, the tax and benefit
systems are different in each country. First of all the overall size of the systems, in terms of
expenditure or receipts in relation to gross incomes, varies. Secondly, the shares of each
income component vary according to income quantile, and the patterns of the variation are not
the same across countries. We consider each aspect in turn.

Social Situation Observatory – Social inclusion and Income distribution Final report
December 2006 111
Among the EU-15 countries benefits (including public pensions) make up between 26% (in
France) and 15% (in the Netherlands) of gross income (see Figure 6.5). In both the New Member
States (NMS) shown, Hungary and Poland, the proportion of income made up of benefits and
pensions is higher than in France: 29% and 33% respectively. Taxes and contributions represent
deductions from gross income of between 39% (in Denmark) and 17% (in Ireland). In the cases
of these direct taxes the two NMS have tax burdens that are in the mid-range for the EU-15
countries: 19% for Hungary and 24% for Poland.
Countries with large tax and benefit systems will tend to be those that redistribute most, but
this is not necessarily the case as the extent of redistribution also depends on the
characteristics of the taxes and benefits: how progressive the taxes are and to what extent
benefits are targeted - directly or indirectly – on those with low incomes will tend to have a
significant influence on the results. Some indication is provided by Figures 6.6 and 6.7 which
show the same information as Figure 6.5 but for the bottom and top quintiles of the national
disposable income distributions respectively.
For the lowest income groups, that is those in the bottom quintile, social benefits and public
pensions are not only more important than for those further up the income scale, as would be
expected, but are also more variable across countries (Figure 6.6). The proportion of disposable
income of households in the bottom quintile which is made up of income from social benefits
and pensions ranges from a low of 44% in Greece to between 45% and 60% in the majority of
countries, over 60% in the Nordic countries and Belgium, up to 70% in the UK and as high as
85% in Ireland. While Poland has the highest proportion of benefits and pensions on average, of
the 17 countries considered, the proportion in the bottom quintile group is similar to that in a
mid-range EU-15 country (51%), while the proportion in Hungary is similar to that in Denmark
and the UK (67%).
The tax levied on this group, as also would be expected, is small, but it is not non-existent. It
is particularly large in Denmark and Sweden and also Poland, where over 20% of the gross
income of the poorest quintile group in each of these countries is deducted as taxes. Taxes
represent much more of a burden, unsurprisingly, for those at the other end of the scale, for
the 20% of households with the highest income levels (Figure 6.7). In this case, however, the
variation across countries in the amount of tax paid is similar to that for households as a whole
– ranging from 40-45% in Denmark and Sweden to around 25% in Ireland and Portugal. In both
NMS countries considered, the direct tax burden on this high income group is relatively low
(27%) compared with than in the EU-15 countries and is comparable with the tax burdens in
Italy and the UK.
More surprisingly perhaps, even for households with this level of income, a significant share is
made up of social benefits in a number of countries – just over 20% in Austria and just under

Social Situation Observatory – Social inclusion and Income distribution Final report
December 2006 112
20% in France and Poland. At the other extreme, benefits account for only 2-3% of gross
income of the top 20% of income recipients in the UK and Ireland, where social transfers are
more deliberately concentrated on those in most need of income support.
Another perspective on the extent and nature of redistribution can be gained by considering
the shares of total personal income in the different Member States received by households at
varying points across the income distribution as a whole - or, more specifically, by examining
the position of households in this regard by decile group of disposable income.
The effect of taxes and benefits means that the shares of disposable income are, of course, less
unequal than shares of original (or gross) income. The size of this effect, however, varies
between countries as does the incidence of benefits less taxes on each decile group of the
distribution, as can be seen for each of the EU-15 Member States, Hungary and Poland in Figure
6.8. The countries with low redistribution – such as Greece, Italy and Portugal - tend to have
share curves that are relatively similar for both original and disposable income. Those with
more redistributive systems have curves for disposable income that are significantly flatter than
those for original income –Denmark, Luxembourg and the UK, in particular. The curve for gross
income is everywhere more flat than that for original income and less flat than disposable
income. Taxes seem to have the most noticeable effect in the top decile group and particularly
in Finland, Sweden, the UK and Poland. In Hungary taxes seem to be particularly effective at
increasing the share of decile groups 2 to 4.
The effect of the tax-benefit system on shares can be seen more clearly in Figure 6.9 which
plots the change in the share of incomes due to the tax-benefit system. Here, again, it is clear
that benefits and pensions play a bigger role than taxes and contributions, except in the top
decile group for some countries (Belgium, Austria and Portugal) and the 8th and 9th decile
groups in Hungary. The break-even point, where taxes and benefits have no net effect in
income shares, occurs between the 6th and 8th decile groups in all countries, except Poland
where it is in the 9th decile group. In some countries the transfer from rich to poor is a gradual
process across the income groups, with higher income households gradually receiving less of a
share of the benefits less taxes. This would characterise the shape of the graphs for Belgium,
Denmark, Germany, Ireland, the Netherlands, Finland, Sweden and the UK. However, a
noticeable feature in many of these countries is that the change in share is smaller for the
bottom decile group than it is for the next one up. Possible reasons for this include the fact that
households with the very lowest of disposable incomes are those who do not qualify for
benefits (or pensions), especially where these depend on characteristics or contributions rather
than income. We return to the composition of benefits and taxes in the next section.
In another group of countries the increase in share is rather flat across the bottom and middle
part of the distribution, with a large decrease in the top one or two decile groups. This

Social Situation Observatory – Social inclusion and Income distribution Final report
December 2006 113
characterises the situation in the four Southern countries, France and especially Luxembourg
and Poland. These are cases where pensions and other non means-tested benefits are typically
received by people in households at all levels of income except the very top.
Differences in the composition of taxes and benefits
Taxes and benefits can each be decomposed and classified into broad types in order to
understand the relative role of each type of instrument across countries. Since their nature and
redistributive effects differ, it is useful to distinguish between public pensions, other non-
means-tested benefits and means-tested benefits, and between income taxes and social
contributions. Of course, contributions and contributory benefits, particularly pensions, do not
simply have the function of redistributing between persons. They also re-distribute individual
income over each person’s lifecycle. However, it would be misleading to downplay or ignore
them in this context as they do have some intra-personal redistribution role through their
social protection function. We therefore distinguish public pensions although we do not make
the distinction between contributory and non-contributory pensions and benefits explicitly.
Instead, we identify those benefit components for which entitlement depends on an income (or
assets) test: known as means-tested benefits. These are of interest because they might be
expected to have a particularly strong effect on income inequality. The remainder of benefits,
including those which depend on contributions or on particular household characteristics or
contingencies apart from income (such as child, disability or unemployment benefits) and are
not pensions are categorised as non-meanstested benefits, The typology is defined in more
detail in the box and Annex 1 lists the components of each category by country.
Figures 6.10 to 6.12 show that countries with the largest benefit systems, in terms of overall
expenditure on social transfers as a proportion of gross incomes, tend to have large public
pension transfers. They also tend to have relatively large transfers of non-meanstested
benefits, as is particularly the case in Denmark, Sweden, Finland and Austria (Figure 6.10).
France is one exception, in that some 12% of all benefit incomes, including public pensions, are
means-tested which is higher than in all countries except two. These are: Ireland, where
meanstested benefits account for 59% of total transfers, and the UK, where they account for
38%, substantially more than elsewhere in the EU15, emphasising the different nature of the
social welfare system in these two countries than elsewhere.
Naturally, the role of means-testing is greatest in the bottom quintile group (by disposable
income) and such benefits makes up 62% of all social transfers in Ireland and 56% in the UK.
The country with the next largest proportion is Portugal, where they account for 28% of total

Social Situation Observatory – Social inclusion and Income distribution Final report
December 2006 114
transfers. By contrast, means-tested benefits are of minimal importance in the other three
Southern Member States (accounting for only 3% of transfers in Greece as well as in Austria.
Public pension income is defined to be restricted to those aged 65 or more and to benefits specifically intended to provide income during old age or to replace earnings during retirement. Any other pensions paid to younger people or other benefits paid to the elderly are included in one or other of the cash benefit categories rather than as pension income. We do not consider means tested old age schemes as pensions, unless they are an integral part of the pension system. If low pensions are topped up to reach a certain minimum, we count these supplements as pension income. This distinction can be somewhat arbitrary in practice. Other meanstested schemes for the elderly are included as meanstested benefits
Meanstested benefits are defined as all benefits that depend on an assessment of current income. It includes all benefits with an earnings or income test, even if the limit does not confine entitlement to the poor or near-poor. Thus it includes “affluence-tested” benefits as well as those targeted on the lowest incomes. Similarly, benefits that are more generous to people with low income than to people with high income are included in the means tested category, even if the “rich” are in principle eligible for some amount. So benefits with non means tested basic amounts plus means tested supplements are defined here as means-tested. In practice the distinction can be rather arbitrary since there are examples of benefits that are essentially universal, with relatively small means-tested top-ups. Or benefits that apply in a similar way to different groups with means-testing only operating in some variants (the Belgian child benefit is an example).
Non-meanstested benefits is a category containing all remaining benefits.
Elsewhere, they are much also less important than in Ireland or the UK, but not insignificant,
especially in France, the Netherlands and but Sweden (where they account for 20-25% of
transfers).
Non-meanstested benefits, on the other hand, account for a similar proportion of income for
households in the bottom quintile as for households in general in Belgium, Germany, Spain,
Italy and Austria, while in most other countries, the proportion is smaller. The main exception
is Luxembourg where the proportion is larger for those in the bottom quintile than for those
further up the income scale. Accordingly, non-means tested benefits play only a limited role in
redistributing income to lower income households.
At the same time, non-meanstested benefits are a much less important source of household
income for households in the top quintile in all countries (Figure 6.12), though transfers in the
form of pensions are relatively important in France, Poland and Austria as well as in Italy and
Spain.
So far as deductions from income are concerned, social contributions (which in most countries
are a fixed proportion of income up to a maximum level) are more important than income taxes
(which tend to more progressive in relation to income) in Greece, the Netherlands, Poland and
France (Figure 6.10). It is not surprising perhaps that countries that have large pension and non

Social Situation Observatory – Social inclusion and Income distribution Final report
December 2006 115
means-tested systems also tend to have high levels of social contribution, though not all non
means-tested benefits, of course, are contributory.
For households in the bottom quintile, income taxes represent a significant deduction from
income in Denmark, Sweden and Finland (around 20% in the first two and around 10% in the
last), where many benefits are taxable and amount to around 5% of income in the UK and Italy
(Figure 6.11). Social contributions represent a significant deduction from income in most other
countries, amounting to 10% or more in Germany, Greece, France, Luxembourg, the
Netherlands and Austria.
For households in the top quintile, income taxes are much more important than social
contributions in all countries except France, reflecting the fact that in most countries an upper
limit is set on payments of the latter (Figure 6.12).
Horizontal equity
As well as having an effect on inequality by level of income (vertical equity) taxes and benefits
also have an effect on horizontal equity: the treatment of people at the same income level but
with different circumstances. Her we consider an important particular case: the treatment of
children and parents by the tax-benefit system. First we compare the size of child contingent
benefits and tax concessions across the countries of the EU-15. We then explore how these
incomes are distributed according to household income level. Finally, we address horizontal
equity itself by asking to what extent the presence of children is compensated by the tax and
benefit systems of the EU-15. In each case the effects are explored for young children (aged 0-
5) and older children (aged 6-17) separately. On the one hand one might expect younger
children to be supported to a greater extent because, to achieve horizontal equity with non-
parents, parents either need compensation for not working to care for them, or help with child
care costs. On the other hand, older children have consumption needs more like adults and we
might expect them to be targeted with greater resources for this reason.
In all the analysis which follows we consider only the parts of the tax and benefit system that
are due by virtue of presence of children. This can be more than benefits simply labelled as
family benefits since some other benefits contain complements for children. It includes tax
concessions as well as benefit payments. But it is typically less than all cash benefits paid to a
household (which might include pensions and unemployment benefits and so on), and does not
include non-cash benefits. On the one hand this allows us to focus on compensation intended
for children. On the other it does ignore some policies that are intended to make employment
consistent with caring responsibilities as well as others that are designed to support adults
whether or not they have children.

Social Situation Observatory – Social inclusion and Income distribution Final report
December 2006 116
In nearly all countries the net amount of child targeted cash support is higher for children aged
0-5 than for older children (comparing Figures 6.13 and 6.14). The exceptions are Belgium and
France and in both cases the difference is small. The figures show the average per child
payment (normalised as a proportion of national per capita income) through benefits together
with an amount for tax that is positive if there are tax concessions acting like benefits or
negative if more taxes are paid by virtue of the presence of children (typically this is explained
by child targeted benefits being taxable). Countries are ranked by the net amounts (benefits
and tax concessions less taxes paid) and the ranking is slightly different for the two age groups
of children. For the younger age group (Figure 6.13) Luxembourg has the largest payments
relative to per capita incomes in that country; and Spain the smallest. Tax concessions are
relatively important in Luxembourg, France, Belgium, Italy and Spain. Tax deductions are
important in Finland and Germany.
The average amount of support is substantially lower for older children in Luxembourg, Finland
and Denmark. Generally we would expect the parents of older children to have higher earned
incomes and to pay higher taxes. Where tax concessions increase in value with the marginal tax
rate, they deliver more of the support for the older age group and this is apparently the case in
Luxembourg and Spain. In Italy, however, the effect of tax concessions is lower for older
children. In Austria the net effect of taxes is positive for younger children and negative for older
children. In Finland and Germany the taxation of benefits has a smaller effect for older children
than younger, and the effect is the other way around in Sweden.
These average effects may not be the same at different points in the income distribution,
especially, although not exclusively, if they are delivered through taxes or meanstested
benefits. In some countries support for children is targeted on children in low income
households. This is particularly the case In Ireland, the UK and Germany (when the net effect of
benefits less taxes is considered) and to some extent in Denmark, Portugal, Finland and France:
see Figure 6.15 for children aged under 6.44 In Austria, Belgium, the Netherlands, Greece and
Sweden the effect is rather uniform by income. In Spain and to some extent in Luxembourg the
value of the child support package increases with household income. In France children in the
top decile group benefit substantially more than children in middle income households, mainly
because of tax concessions while in Germany benefits are worth more to top income
households but the net effect is reduced substantially by higher taxes.
The picture is somewhat different for older children (Figure 6.16). As we have seen the
aggregate value of child targeted benefits and tax concessions is lower in most countries for
44 The child contingent payment is calculated as an average per child in each decile group and then normalised by average per capita income across all deciles.

Social Situation Observatory – Social inclusion and Income distribution Final report
December 2006 117
this older age group. The shape of the graphs is also different in some countries. Taxes are
lower for children in the top decile group in Germany (compared with the case for younger
children). Benefits are generally lower in Finland for the older age group and taxes play a larger
role in the top decile group in reducing their net value, but a smaller role lower down the
distribution. Benefits are more highly targeted on the bottom decile group in Ireland and taxes
play more of a role in reducing the vale of benefits for the richest households in Sweden.
Overall, the picture is one of some diversity in the level of support, the way it is distributed by
income and the age of the child, and whether it is delivered through benefits or the tax system.
The next question to which we turn is whether this diversity leads to differences in the extent to
which the extra needs of children are recognised by the tax and benefit systems.
Assessing the degree of horizontal equity is difficult because it requires us to be able to
compare the effect of the system on households that are like in all respects except one. In
reality households with children can differ from childless households in many ways, both
directly and indirectly (eg through labour market behaviour). To provide a simple way of making
comparisons we ask what if the households with children in the EUROMOD database were not to
be recognised by the tax-benefit system, and what if their needs were also ignored. Our
approach is to compare equivalised income for households with children with those for exactly
the same household, assuming there were no children, but all other things remaining the
same.45
Comparing equivalised disposable incomes with and without children involves making two
distinct calculations. First, we take no account of children in the calculation of household
needs. Then, we remove the income received by virtue of the presence of children. Its main
components are the net transfers and tax concessions received because of the presence of
children. Taking the children out of the needs assessment causes household equivalised
income to rise. The amount if this increase for young children (0-5) is indicated by the green
bar in Figure 6.17. Here equivalised incomes without children (in the 0-5 age group) are
expressed relative to equivalised incomes with children, where these are set as =100 and
calculated across all households. So a bar with height 104 indicates that the needs of children
aged 0-5 as represented in the equivalence scale46 are equivalent to 4% of total (national)
household disposable income. Deducting the components of income due to the presence of
children causes equivalised income to fall: indicated by the yellow bars.
The results of this exercise are highly dependent on the equivalence scale used, and should not
be interpreted as absolute measures of need or the extent it is met. However, this approach is
45 See Corak el al (2005) for more discussion. 46 Here as elsewhere we use the modified OECD scale.

Social Situation Observatory – Social inclusion and Income distribution Final report
December 2006 118
still of value because our focus is comparative and the extent to which having children makes
households (financially) worse off varies with the tax and benefit system. Countries are ranked
by the proportion of the needs (i.e. the green bars) covered by the child contingent incomes
(i.e. the difference between the green and yellow bars) and this is shown by the line (against the
righthand axis). The ranking is similar to that for the average payment, shown in Figure 6.13,
which is not particularly surprising. The proportion of young children’s extra needs that are met
by the tax benefit system is more than six times higher in the most generous country,
Luxembourg, than in the least, Spain.
An equivalent picture is shown for children aged 6-17 in Figure 6.18. This shows that on
average child needs are much higher (partly because there are more children aged 6-17 than
0-5 and partly because the equivalence scale credits children aged 14 or more with a higher
weight). On the other hand, the proportion of the needs that are met is lower and the ratio of
the highest and lowest proportion of needs met (Austria and Spain) is lower: around 5:1.

Social Situation Observatory – Social inclusion and Income distribution Final report
December 2006 119
Fig. 6.1 Income inequality (Gini coefficient) 2001
Fig. 6.2 Original income inequality reduction due to taxes and benefits 2001 (absolute changes in the
Gini coefficient)
0.00
0.10
0.20
0.30
0.40
0.50
BE DK DE EL ES FR IE IT LU NL AT PT FI SE UK
Originalincome
Grossincome
Disposableincome
0.00 0.02 0.04
0.06 0.08 0.10 0.12 0.14
0.16 0.18 0.20
BE DK DE EL ES FR IE IT LU NL AT PT FI SE UK PL
Benefits
Taxes andcontributions

Social Situation Observatory – Social inclusion and Income distribution Final report
December 2006 120
Fig. 6.3 Income inequality (S80/S20 ratio), 2001
Fig. 6.4 Original income inequality reduction due to taxes and benefits, 2001
(changes in S80/S20 ratio)
0.20
5.20
10.20
15.20
20.20
25.20
30.20
35.20
40.20
BE DK DE EL ES FR IE IT LU NL AT PT FI SE UKPL
Original income
Gross income
Disposableincome
0.00
5.00
10.00
15.00
20.00
25.00
30.00
35.00
BE DK DE EL ES FR IE IT LU NL AT PT FI SE UK PL
Benefits
Taxes andcontributions

Social Situation Observatory – Social inclusion and Income distribution Final report
December 2006 121
Fig. 6.5 Taxes and benefits as a proportion of gross incomes 2001: all households
Benefits including public pensions
-50%
-40%
-30%
-20%
-10%
0%
10%
20%
30%
40%
BE DK DE EL ES FR IE IT LU NL AT PT FI SEUK HU PL
Taxes and contributions
% g
ross
inco
me
Fig. 6.6 Taxes and benefits as a proportion of gross incomes 2001: bottom quintile
Benefits including public pensions
-40%
-20%
0%
20%
40%
60%
80%
100%
BEDK DE EL ES FR IE IT LUNL AT PT FI SEUKHU PL
Taxes and contributions
% g
ross
inco
me
Fig. 6.7 Taxes and benefits as a proportion of gross incomes 2001: top quintile
Benefits including public pensions
-50%
-40%
-30%
-20%
-10%
0%
10%
20%
30%
BEDK DE EL ES FR IE IT LUNL AT PT FI SEUK HU PL
Taxes and contributions
% g
ross
inco
me

Social Situation Observatory – Social inclusion and Income distribution Final report
December 2006 122
Fig. 6.8 Share of household original, gross and net income by decile in 2001
AT
0%5%
10%15%20%25%30%35%
1 2 3 4 5 6 7 8 9 1
origgrossnet
PT
0%5%
10%15%20%25%30%35%
1 2 3 4 5 6 7 8 9 1
origgrossnet
FI
0%5%
10%15%20%25%30%35%
1 2 3 4 5 6 7 8 9 1
origgrossnet
SE
0%5%
10%15%20%25%30%35%
1 2 3 4 5 6 7 8 9 1
origgrossnet
UK
0%5%
10%15%20%25%30%35%
1 2 3 4 5 6 7 8 9 1
origgrossnet
IE
0%5%
10%15%20%25%30%35%
1 2 3 4 5 6 7 8 9 1
origgrossnet
IT
0%5%
10%15%20%25%30%35%
1 2 3 4 5 6 7 8 9 1
origgrossnet
LU
0%5%
10%15%20%25%30%35%
1 2 3 4 5 6 7 8 9 1
origgrossnet
NL
0%5%
10%15%20%25%30%35%
1 2 3 4 5 6 7 8 9 1
origgrossnet
BE
0%5%
10%15%20%25%30%35%
1 2 3 4 5 6 7 8 9 1
origgrossnet
DK
0%5%
10%15%20%25%30%35%
1 2 3 4 5 6 7 8 9 1
origgrossnet
DE
0%5%
10%15%20%25%30%35%
1 2 3 4 5 6 7 8 9 1
origgrossnet
EL
0%5%
10%15%20%25%30%35%
1 2 3 4 5 6 7 8 9 1
origgrossnet
ES
0%5%
10%15%20%25%30%35%
1 2 3 4 5 6 7 8 9 1
origgrossnet
HU
0%5%
10%15%20%25%30%35%
1 2 3 4 5 6 7 8 9 1
origgrossnet
FR
0%5%
10%15%20%25%30%35%
1 2 3 4 5 6 7 8 9 1
origgrossnet
PL
0%5%
10%15%20%25%30%35%
1 2 3 4 5 6 7 8 9 1
origgrossnet
Source: EUROMOD

Social Situation Observatory – Social inclusion and Income distribution Final report
December 2006 123
Fig. 6.9 Change (percentage points) in share of overall household income due to benefits and taxes in 2001, by decile
HU
-10%
-5%
0%
5%
1 2 3 4 5 6 7 8 9 1
ben tax
BE
-10%
-5%
0%
5%
1 2 3 4 5 6 7 8 9 1
ben tax
DK
-10%
-5%
0%
5%
1 2 3 4 5 6 7 8 9 1
ben tax
DE
-10%
-5%
0%
5%
1 2 3 4 5 6 7 8 9 1
ben tax
EL
-10%
-5%
0%
5%
1 2 3 4 5 6 7 8 9 1
ben tax
ES
-10%
-5%
0%
5%
1 2 3 4 5 6 7 8 9 1
ben tax
FR
-10%
-5%
0%
5%
1 2 3 4 5 6 7 8 9 1
ben tax
IE
-10%
-5%
0%
5%
1 2 3 4 5 6 7 8 9 1
ben tax
IT
-10%
-5%
0%
5%
1 2 3 4 5 6 7 8 9 1
ben tax
LU
-10%
-5%
0%
5%
1 2 3 4 5 6 7 8 9 1
ben tax
NL
-10%
-5%
0%
5%
1 2 3 4 5 6 7 8 9 1
ben tax
AT
-10%
-5%
0%
5%
1 2 3 4 5 6 7 8 9 1
ben tax
PT
-10%
-5%
0%
5%
1 2 3 4 5 6 7 8 9 1
ben tax
FI
-10%
-5%
0%
5%
1 2 3 4 5 6 7 8 9 1
ben tax
SE
-10%
-5%
0%
5%
1 2 3 4 5 6 7 8 9 1
ben tax
UK
-10%
-5%
0%
5%
1 2 3 4 5 6 7 8 9 1
ben tax
PL
-10%
-5%
0%
5%
1 2 3 4 5 6 7 8 9 1
ben tax
Source: EUROMOD

Social Situation Observatory – Social inclusion and Income distribution Final report
December 2006 124
Fig. 6.10 Taxes and benefits by type, as a proportion of gross incomes 2001: all households
-50%
-40%
-30%
-20%
-10%
0%
10%
20%
30%
40%BE D
K DE EL ES FR IE IT LU NL
AT PT FI SE UK PL
% o
f gro
ss in
com
e social contributions
taxes
public pensions
non means-tested benefits
means-tested benefits
Fig. 6.11 Taxes and benefits by type, as a proportion of gross incomes 2001: bottom quintile
-40%
-20%
0%
20%
40%
60%
80%
100%
BE DK DE EL ES FR IE IT LU NL
AT PT FI SE UK PL
% o
f gro
ss in
com
e social contributions
taxes
public pensions
non means-tested benefits
means-tested benefits

Social Situation Observatory – Social inclusion and Income distribution Final report
December 2006 125
Fig. 6.12 Taxes and benefits by type, as a proportion of gross incomes 2001: top quintile
-50%
-40%
-30%
-20%
-10%
0%
10%
20%
30%BE D
K DE EL ES FR IE IT LU NL
AT PT FI SE UK PL
% o
f gro
ss in
com
e social contributions
taxes
public pensions
non means-tested benefits
means-tested benefits
Fig. 6.13 Spending per child on child contingent cash payments as a % of per capita income 2001
Children aged 0-5
-5%
0%
5%
10%
15%
20%
25%
30%
LU FR AT BE FI DK IE DE UK SE PT IT NL EL ES
BenefitsTaxes

Social Situation Observatory – Social inclusion and Income distribution Final report
December 2006 126
Fig. 6.14 Spending per child on child contingent cash payments as a % of per capita income 2001
Children aged 6-17
-5%
0%
5%
10%
15%
20%
25%
30%
FR LU BE AT DE UK IE FI SE DK NL PT IT ES EL
BenefitsTaxes

Social Situation Observatory – Social inclusion and Income distribution Final report
December 2006 127
Fig. 6.15 Spending per child on child contingent cash payments as a % of per capita income 2001by decile group
Children aged 0-5
AT
-10%
0%
10%
20%
30%
40%
1 2 3 4 5 6 7 8 9 10
Benefits
Taxes
DE
-10%
0%
10%
20%
30%
40%
1 2 3 4 5 6 7 8 9 10
Benefits
Taxes
NL
-10%
0%
10%
20%
30%
40%
1 2 3 4 5 6 7 8 9 10
Benefits
Taxes
BE
-10%
0%
10%
20%
30%
40%
1 2 3 4 5 6 7 8 9 10
Benefits
Taxes
EL
-10%
0%
10%
20%
30%
40%
1 2 3 4 5 6 7 8 9 10
Benefits
Taxes
PT
-10%
0%
10%
20%
30%
40%
1 2 3 4 5 6 7 8 9 10
Benefits
Taxes
DK
-10%
0%
10%
20%
30%
40%
1 2 3 4 5 6 7 8 9 10
Benefits
Taxes
IE
-10%
0%
10%
20%
30%
40%
1 2 3 4 5 6 7 8 9 10
Benefits
Taxes
ES
-10%
0%
10%
20%
30%
40%
1 2 3 4 5 6 7 8 9 10
Benefits
Taxes
FI
-10%
0%
10%
20%
30%
40%
1 2 3 4 5 6 7 8 9 10
Benefits
Taxes
IT
-10%
0%
10%
20%
30%
40%
1 2 3 4 5 6 7 8 9 10
Benefits
Taxes
SE
-10%
0%
10%
20%
30%
40%
1 2 3 4 5 6 7 8 9 10
Benefits
Taxes
FR
-10%
0%
10%
20%
30%
40%
1 2 3 4 5 6 7 8 9 10
Benefits
Taxes
LU
-10%
0%
10%
20%
30%
40%
1 2 3 4 5 6 7 8 9 10
Benefits
Taxes
UK
-10%
0%
10%
20%
30%
40%
1 2 3 4 5 6 7 8 9 10
Benefits
Taxes

Social Situation Observatory – Social inclusion and Income distribution Final report
December 2006 128
Fig. 6.16 Spending per child on child contingent cash payments as a % of per capita income 2001by decile group
Children aged 6-17
AT
-5%0%5%
10%15%20%25%30%
1 2 3 4 5 6 7 8 9 10
Benefits
Taxes
DE
-5%0%5%
10%15%20%25%30%
1 2 3 4 5 6 7 8 9 10
Benefits
Taxes
NL
-5%0%5%
10%15%20%25%30%
1 2 3 4 5 6 7 8 9 10
Benefits
Taxes
BE
-5%0%5%
10%15%20%25%30%
1 2 3 4 5 6 7 8 9 10
Benefits
Taxes
EL
-5%0%5%
10%15%20%25%30%
1 2 3 4 5 6 7 8 9 10
Benefits
Taxes
PT
-5%0%5%
10%15%20%25%30%
1 2 3 4 5 6 7 8 9 10
Benefits
Taxes
DK
-5%0%5%
10%15%20%25%30%
1 2 3 4 5 6 7 8 9 10
Benefits
Taxes
IE
-5%0%5%
10%15%20%25%30%
1 2 3 4 5 6 7 8 9 10
Benefits
Taxes
ES
-5%0%5%
10%15%20%25%30%
1 2 3 4 5 6 7 8 9 10
Benefits
Taxes
FI
-5%0%5%
10%15%20%25%30%
1 2 3 4 5 6 7 8 9 10
Benefits
Taxes
IT
-5%0%5%
10%15%20%25%30%
1 2 3 4 5 6 7 8 9 10
Benefits
Taxes
SE
-5%0%5%
10%15%20%25%30%
1 2 3 4 5 6 7 8 9 10
Benefits
Taxes
FR
-5%0%5%
10%15%20%25%30%
1 2 3 4 5 6 7 8 9 10
Benefits
Taxes
LU
-5%0%5%
10%15%20%25%30%
1 2 3 4 5 6 7 8 9 10
Benefits
Taxes
UK
-5%0%5%
10%15%20%25%30%
1 2 3 4 5 6 7 8 9 10
Benefits
Taxes

Fig. 6.17 Incomes with and without children and child-contingent incomes and the proportion of child
needs covered in EU15 in 2001
Children aged 0-5
100
103
106
109
112
115
LU FR BE AT FI DK DE IE UK SE PT IT NL EL ES0%
10%
20%
30%
40%
50%
60%
70%
baseline incomes, no children no children, no child-contingent incomes needs covered
Fig. 6.18 Incomes with and without children and child-contingent incomes and the proportion of child
needs covered in EU15 in 2001
Children aged 6-17
100
103
106
109
112
115
AT FR LU BE UK FI DE SE DK IE NL PT IT EL ES0%
10%
20%
30%
40%
50%
60%
70%
baseline incomes, no children no children, no child-contingent incomes needs covered

Social Situation Observatory – Social inclusion and Income distribution Draft final report
December 2006 130
Appendix 1: Effects of Tax-benefit Changes on Inequality Trends in Europe: a
Microsimulation Analysis47
Tax-benefit reforms could well explain some of the observed trend in inequality and poverty.
However, there is little systematic evidence about the impact of policy changes on
inequality/poverty over time, both in absolute terms and compared to other explanatory factors
(change in pre-tax income distribution, change in income composition, etc.). In this note, we
first provide an absolute measure of the impact of policy changes on inequality, which
combines changes in policy structure (rules, rates, etc.) and changes in monetary parameters
(benefit amounts, tax bands, etc.) against a distributionally-neutral benchmark. We apply this
measure to analyze the effect of recent policy changes on inequality in ten European countries
over the 1998-2001 period. Second, we focus on two countries (France and Germany) to assess
the relative role of policy changes compared to changes in gross income inequality.
I. ABSOLUTE EFFECT OF TAX-BENEFIT POLICIES: AN APPLICATIONS TO SOME EUROPEAN COUNTRIES
We rely on the European microsimulation model EUROMOD, which allows to simulate the tax-
benefit systems of the EU15 countries. The model computes all direct taxes and monetary
transfers affecting households of a representative dataset for each country, and hence
simulates their level of disposable income (see description in Sutherland, 2001). Choices of
period and data are guided by what is made available by the most recent version of EUROMOD.
Tax-benefit simulations can be performed for years 1998 (initial year) and 2001 (final year). In
2007, we will be able to simulate also the year 2003, so that the period of analysis can be
extended.
The data used for all countries are described in Table 1. They are all representative of each
population. However, data are collected in year 1998 only for Austria, Finland and Germany. For
other countries, datasets are a bit older so that adjustments are required: 1998 data are
obtained by updating monetary variables (possible changes in income distribution, composition
or demographics between the year of data collection and 1998 are implicitly ignored).
47 Olivier Bargain (UCD), Tim Callan (ESRI)

Social Situation Observatory – Social inclusion and Income distribution Draft final report
December 2006 131
Table 1: Data Description
Country Data Year no. of observations
no. households (weighted)
1998-2001 updating factor
Austria European Community Household Panel 1998 7,386 3,238,520 5.7%Belgium Panel Survey on Belgium Households 1997 7,057 4,028,723 7.2%Denmark European Community Household Panel 1995 7,044 2,531,183 6.2%Finland Income Distribution Survey 1998 25,010 2,355,000 7.4%Germany German Socio-Economic Panel 1998 18,227 38,259,778 4.1%Greece European Community Household Panel 1995 15,062 3,720,085 15.5%Italy Survey of Households Income and Wealth 1996 23,924 19,816,115 14.2%Portugal European Community Household Panel 1996 14,468 3,211,572 9.8%Spain European Community Household Panel 1996 18,991 12,347,454 23.9%UK Family Expenditure Survey 1995/6 16,586 24,490,138 6.8%
We simulate the tax-benefit systems of each country for 1998 using the “1998” data (as
described above) and produce the distribution of disposable income in each population. For
most countries, 2001 data are not available so that a full evaluation of the inequality trend over
the 1998-2001 period is not possible. This is the subject of the next section on a sub-group of
countries where two years of data are available.
However, it is still possible to assess the effect of policy changes on inequalities over the
period. To do so, we update incomes in 1998 data to nominal levels of 2001, using the average
income growth rate over the period (coefficient are reported in the last column of Table 1). This
way, we obtain a 2001* scenario where income levels are those of 2001 but the underlying
gross income distribution is still that of 1998. Simulating the new policy (2001 system) on this
adjusted dataset is then consistent and allow to assess the pure effect of the policy change. In
other words, the distribution of disposable income obtained this way reflects only the change in
policy and not the change in gross income distribution, which is held constant.
We simply use the Gini coefficient to measure inequalities. In the next report, we shall extend
this exercise to a broader range of indices of inequality/poverty to obtain a more refined
analysis of the policy effects. Results are presented in Table 2, that is, the 1998 Gini and the
Gini obtained for the 2001* scenario. The difference provides the absolute effect of the policy
changes over time.
As shown in Bargain and Callan (2006), the 1998 distribution of disposable income is
approximately equal to the one obtained if incomes are nominally adjusted to 2001 and
monetary tax-benefit parameters (benefit amounts, threshold levels of tax brackets, etc.) are
also adjusted to 2001 by the same coefficient. Therefore, the 1998 Gini is identical to a 2001*
Gini where parameters catch up with income growth over the period - a distributionally-neutral
benchmark (see Callan, 2006) -- while the 2001* Gini reflects the true changes in monetary
parameters that occurred over the period. Therefore, the difference between the 2001* Gini and
1998 Gini measures not only the effect of changes in policy structure (change in rules,

Social Situation Observatory – Social inclusion and Income distribution Draft final report
December 2006 132
introduction or abolishment of instruments, change in non-monetary parameters like
withdrawal rates of benefits, tax or contribution rates, etc.) but also nominal changes in
monetary tax-benefit parameters vis-à-vis parameters in line with income growth (a
distributionally neutral situation). The actual adjustments of monetary parameters made by
policy makers will then have an impact on inequalities. For instance, amounts of social
assistance may not be adjusted by policy makers over the period (or less than the income
growth). This is a policy choice that will contribute to increase the Gini in 2001 since the
position of the poorest is made relatively worse.
Table 2 then measures the change in inequality due to the change in tax-benefit systems over
1998-2001 (not the actual inequality trends). It seems that substantial policy effects are to be
found in Finland, Greece and the UK. In Greece, the large decrease in inequality reflects changes
in policy structure (e.g. social contribution rebate for low earners in 2000) but also nominal
adjustment (e.g. large increase in real terms of the social pensions, farmers' basic pension and
pensioner social solidarity benefit). In the UK, it may reflect important structural changes (e.g.
the extension of the refundable tax credit for low-earner families, the Family Credit, to the
more generous Working Family Tax Credit in 1999; introduction of a minimum wage) but also
nominal changes (e.g. council taxes have been regularly raised above inflation, affecting more
families with high incomes; the minimum wage has been consistently raised above earnings
growth; Income Support for pensioners has been increased ). In Finland, inequalities have
increase, maybe as a result of a reduction in the progressivity of the tax scheme. Indeed, the
(flat-rate) State tax has been increased while (progressive) municipal taxation has been
decreased.
Table 2 : absolute effect of policy change
Country
1998 2001* policy effect in %
Austria 24.5 24.2 -0.3 -1.1%Belgium 25.3 25.3 0.0 0.1%Denmark 25.4 25.1 -0.3 -1.2%Finland 25.8 26.5 0.7 2.8%
Germany 26.5 26.6 0.1 0.4%Greece 35.3 34.2 -1.1 -3.0%
Italy 35.1 34.7 -0.4 -1.1%Portugal 38.1 38.6 0.5 1.2%
Spain 33.1 33.7 0.5 1.6%UK 31.9 30.7 -1.1 -3.6%
Gini are based on equivalized income (modified OECD scale) - zeros are included and treated as 10E-9* Disposable income for 2001 are simulated on the basis of 1998 incomes, nominally adjusted to 2001
Gini on disposable income

Social Situation Observatory – Social inclusion and Income distribution Draft final report
December 2006 133
II. RELATIVE EFFECT OF TAX-BENEFIT POLICIES: EXAMPLE FOR FRANCE AND GERMANY
We now focus on two countries for which the data for the final year (2001) are also available:
France, for the period 1995-2001, and Germany, for the period 1998-2001. Thus it is possible
to decompose the role of policy changes versus changes in the distribution of gross income.
Table 3 presents the result. Inequality, as measured by the Gini coefficient, has slightly
decreased in France (-0.7 points or -2.4%) and increased in Germany (+0.3 points or +1%).
These results are line with previous analyses on inequality trends (Förster and Mira d'Ercole,
2005). In France, little change has occurred at the end of the 90s but housing benefits have
been reformed in 2000-2001 while a refundable tax credit for low-earning households has
been introduced in 2001, two policy measures which have benefited more to the lower part of
the distribution. In Germany, the period coincides with the beginning of the tax reform under
Schröder's government, including noticeable tax cuts which must have contributed to increase
inequalities (see Haan and Steiner, 2004). In addition, the bracket creep has been weaker for
top incomes (the higher fringe of top income is taxed at the top rate and does not shift into
higher rate bracket). As a result, the regressive effect of the reform on real incomes was even
more pronounced than in the case of nominal incomes (Corneo, 2005). Tax cuts have also
started in France in the early 2000s but must have had much less regressive effect since the tax
base in France is more narrow (less representative) than in Germany so that the tax system
does not have as much equivalising effect (Immervoll et al., 2005).
In France and Germany, policy changes explain respectively 54% and 38% of the inequality
change over the periods considered in this example. The rest is due to changes in gross income
distribution and, to some degree, to change in demographics. A lot of different factors may
affect gross income distribution: changes in the composition of income, changes in
productivity, unemployment dynamics, wage bargaining, other types of policy (unemployment
support, minimum wage, etc.), etc. Behavioral responses (labor supply, fertility, etc.) to the tax-
benefit policies can themselves affect the distribution of gross income.
Interpreting the (small) changes in gross income distribution in France and Germany is beyond
our scope. However, we can conjecture that for France, much has to do with the strong
decrease in unemployment rate over the period (11.3% in 1995 up to 11.8% in 1997 then
consistent decrease down to 8.5% in 2001).

Social Situation Observatory – Social inclusion and Income distribution Draft final report
December 2006 134
Table 2: decomposition and relative effect of policy change
data 0 / policy 0 data 0* / policy 1 data 1 / policy 1 policy change in % change in income distribution in %
France 29.9 29.5 29.2 -0.39 -1.3% -0.32 -1.1%
Germany 26.5 26.6 26.8 0.10 0.4% 0.17 0.6%
Gini on equivalized income (modified OECD scale) - zeros are included and treated as 10E-9Year 0 is 1995 for France and 1998 for Germany, year 1 is 2001 for both countries* Disposable income for year 1 simulated on the basis of year 0 incomes, nominally adjusted to year 1 levels (hence keeping year 0 underlying distribution constant)
Countrycontributions ofGini on disposable income
References
Bargain, O., and T. Callan (2006): “Effects of Tax-benefit Changes on Inequality Trends in Europe: A Decomposition Approach”, mimeo.
Callan, T. and J. Walsh (2006): "Assessing the Impact of Tax-Transfer Policy Changes on Poverty: Methodological Issues and Some European Evidence", in `Microsimulation in action: policy analysis in Europe using EUROMOD' (O. Bargain ed.), Reasarch in labor Economics, 25, Elsevier, North-Holland.
Cornero, G. (2005): The Rise and Likely Fall of the German Income Tax, 1958--2005, CESifo Econmic Studies, Vol. 51, 1/2005, 159--186
Förster, M. and M. Mira d'Ercole (2005) : Income Distribution and Poverty in OECD Countries in the Second Half of the 1990s, OECD Social, Employment and Migration Working, Papers, n˚ 22.
Haan, P. and V. Steiner (2004): Distributional and fiscal effects of the German Tax Reform 2000, a behavioral microsimulation analysis, DIW working paper.
Immervoll, H., H. Levy, C. Lietz , D. Mantovani, C. O'Donoghue, H. Sutherland and G. Verbist (2005): "Household Incomes and Redistribution in the European Union: Quantifying the Equalising Properties of Taxes and Benefits", IZA discussion paper, 1824.

Social Situation Observatory – Social inclusion and Income distribution Draft final report
December 2006 135
Appendix 2: EUROMOD48
EUROMOD is a tax-benefit microsimulation model covering the countries of EU15 in a
comparable and consistent manner. The analysis using EUROMOD therefore covers only EU15.
The simulation features of EUROMOD allow it to answer a range of ‘what if’ questions, as well
as permitting the calculation of income tax and social contribution liabilities (or payments),
which are often absent from household survey data.
The datasets that are used in the current version of EUROMOD are shown in the table below.
The choice of dataset is based on judgement of the national EUROMOD experts of the most
suitable dataset available for scientific research. Throughout the features of tax-benefit
systems and related policies are incorporated in the model as they existed on 30 June 2001.49
In most cases the input datasets of household circumstances refer to a period a few years prior
to this and the original incomes derived from them are updated to this date. This process relies
on indexing each income component (which is not simulated) by appropriate growth factors,
based on actual changes over the relevant period.50 In general no adjustment is made for
changes in population composition.
The basic output from EUROMOD is household disposable income and the micro-level change
in the value of this as a result of changes to any of the determinants of direct personal taxes
including contributions or cash transfers: for example, policy rules, levels of original income,
household composition. The analysis is based on the following definitions and assumptions.
Children are defined as individuals younger than 18 years and the elderly as people aged 65 or
more. It is generally assumed that income is shared within the household and the modified
OECD scale is used to equivalise the income of individuals when comparing across households.
Household disposable income is defined as original income added up over each household
member plus between-household transfers (maintenance and alimony), minus taxes (income
tax, social contributions and other direct personal taxes) plus cash social benefits. These,
unless otherwise stated, include public pensions in payment but do not include regulated
private pensions that may substitute for these. Non-monetary benefits are not included. Gross
incomes are defined as original incomes plus social benefits.
48 See Immervoll et al. (1999) and Sutherland (2000) for general descriptions. Sutherland (2001 and 2005) provides descriptions and discussions of technical issues. The version of EUROMOD used in this paper is 31A. 49 It is necessary to specify a precise date because the timing within the year of regular uprating and other adjustments to tax-benefit systems varies across countries. 50 This process is documented in EUROMOD Country Reports. See: http://www.iser.essex.ac.uk/msu/emod/countries/

Social Situation Observatory – Social inclusion and Income distribution Draft final report
December 2006 136
Risk-of-poverty is defined as living in a household with equivalised household disposable
income below 60 per cent of the median (where the median is calculated across individuals).
The model does not account for any non-take up of benefits or tax avoidance or evasion. It is
assumed, therefore, that the legal rules apply and that the costs of compliance are zero. This
can result in the over-estimation of taxes and benefits.51 For a comparison of poverty rates
estimated using simulated incomes from EUROMOD with those calculated directly from survey
data by the OECD or available through the Luxembourg Income Study, see Corak, Lietz and
Sutherland (2005).
Country Base Dataset for EUROMOD Date of collection
Reference time period for incomes
Austria Austrian version of European Community Household Panel
1998+1999 annual 1998
Belgium Panel Survey on Belgian Households 1999 annual 1998
Denmark European Community Household Panel 1995 annual 1994
Finland Income distribution survey 2001 annual 2001
France Budget de Famille 2000/1 annual 1999/2000
Germany German Socio-Economic Panel 2001 annual 2000
Greece European Community Household Panel 1995 annual 1994
Ireland Living in Ireland Survey 1994 month in 1994
Italy Survey of Households Income and Wealth 1996 annual 1995
Luxembourg PSELL-2 2001 annual 2000
Netherlands Sociaal-economisch panelonderzoek 2000 annual 1999
Portugal European Community Household Panel 2001 annual 2000
Spain European Community Household Panel 2000 annual 1999
Sweden Income distribution survey 2001 annual 2001
UK Family Expenditure Survey 2000/1 month in 2000/1
51 It can also result in the under-estimation of poverty rates although this depends on the relationship between the level of income provided by benefits and the poverty line (potential claimants may be poor whether or not they receive the benefits to which they are entitled).

Social Situation Observatory – Social inclusion and Income distribution Draft final report
December 2006 137
References
Bargain, O., L. Morawski, M. Myck, M. Socha (2006): "SIMPL: A Microsimulation Model for Poland", University of Warsaw
Corak M., C. Lietz and H. Sutherland, 2005, “The Impact of Tax and Transfer Systems on Children in the European Union”, Innocenti Working Paper No. 2005-04. Florence, UNICEF Innocenti Research Centre. http://www.unicef.org/irc [Also published as EUROMOD Working Paper EM4/05]
Immervoll H, H Levy, C Lietz, D Mantovani, C O’Donoghue, H Sutherland and G Verbist (2005) Household incomes and redistribution in the European Union: quantifying the equalising properties of taxes and benefits, EUROMOD working paper EM9/05.
Immervoll H., C. O’Donoghue and H. Sutherland, 1999, “An Introduction to EUROMOD”, EUROMOD Working Paper EM0/99.
Lietz C. and H. Sutherland, 2005, “Social Indicators and other Income Statistics using EUROMOD: an assessment of the 2001 baseline and changes 1998-2001” EUROMOD Working Paper No. EM6/05
Sutherland H., 2000, “EUROMOD: A tax-benefit model for the European Union”, Transfer, 6 (2) 312-316.
Sutherland H. (ed), 2001, “EUROMOD: an integrated European Benefit-tax model, Final Report”, EUROMOD Working Paper EM9/01.
Sutherland H. (ed), 2005, “Micro-level analysis of the European Social Agenda: combating poverty and social exclusion through changes in social and fiscal policy” EUROMOD Working Paper No. EM8/05
EUROMOD Working Papers available from: http://www.iser.essex.ac.uk/msu/emod/emodwp.php

Social Situation Observatory – Social inclusion and Income distribution Draft final report
December 2006 138
Appendix 3: definitions of public pensions, means-tested benefits and non-
means-tested benefits used in EUROMOD, by country
PUBLIC PENSIONS
AUSTRIA
minimum pension (ausgleichszulage)
minimum pension for civil servants (ergaenzungszulage)
child bonus for pensioners (kinderzuschuss)
child bonus for civil service pensioners (kinderzulage)
civil servant's pension (ruhebezuege)
early retirement pension (vorzeitige alterspension)
invalidity pension (invalidenpension)
old age pension (alterspension)
other old age related schemes or benefits
survivor pension (witwen- u. waisenpension)
BELGIUM
anticipated pension (prépension)
other public pension income
retirement pension (pension de retraite)
survivor pension (pension de survie)
DENMARK
disability pension - basic amount plus supplement (taxable, tapered)
disability pension - special supplement plus incapacity amount (taxable, not tapered)
disability pension - invalidity amount plus 'augmentation' plus special benefit for disabled with substantial earnings (not taxable, not tapered)
old age pension
supplementary pension
survivor pension
FINLAND
gross state pension income
national (basic) pension increases

Social Situation Observatory – Social inclusion and Income distribution Draft final report
December 2006 139
FRANCE
minimum old age pension (minimum vieillesse)
pension benefits
alimony (pension de reversion)
pre-retirement pension
GERMANY
own old age pension
miners' own pension
civil servants' own pension
farmers' own pension
widow/orphan old-age pension
miners' widow/orphan pension
civil servants' widow/orphan pension
farmers' widow/orphan pension
accident widow/orphan pension
GREECE
farmers' pension
ekas social solidarity benefit
state pension
invalidity pension (contributory)
state survivor's pension
IRELAND
deserted wife contributory benefits
occupational injury contributory pension
old age contributory benefits
retirement contributory benefits
survivor's contributory benefits
ITALY
supplementary pension
excluding supp. pension: inps (national institute of social insurance): old age, retirement pension
excluding supp. pension: inps: disability pension

Social Situation Observatory – Social inclusion and Income distribution Draft final report
December 2006 140
excluding supp. pension: inps: widow's pension
excluding supp. pension: ipat (institute of treasury-managed insurance): old age, retirement pension
excluding supp. pension: ipat: disability pension
excluding supp. pension: ipat: widow's pension
excluding supp. pension: state: old age, retirement pension
other pension
foreign pension
state widow's pension
LUXEMBOURG
disability pension
early retirement pension
pension received from employment in private sector
pension received from employment in public sector
private sector reversion pension
public sector reversion pension
NETHERLANDS
state pension
survivors' benefit (anw) (formerly widow benefit)
PORTUGAL
old-age insurance
survivors related benefits
invalidity pension
SPAIN
old age pension supplement
widow pension supplement
old-age (insurance an early retirement)
survivors (widows or orphans, insurance)
SWEDEN
other taxable pensions
non-taxable pension

Social Situation Observatory – Social inclusion and Income distribution Draft final report
December 2006 141
UK
retirement pension
state earnings related pension (serps)
widow benefit
MEANS-TESTED BENEFITS
AUSTRIA
maternity allowance supplement (zuschuss zum karenzgeld oder zur teilzeitbeihilfe)
new born health check bonus (mutter-kind-pass-bonus)
provincial family bonus (familienzuschuss der bundeslaender)
social assistence (sozialhilfe)
small children benefit (kleinkindbeihilfe)
unemployment benefit (notstandshilfe)
housing benefits
Simulated Long term maternity benefit Kaernten ("Kaerntner Kinderbetreuungsgeld")
BELGIUM
income support (revenu minimum de moyen d’existence, minimex)
income support for the elderly (revenu garanti aux personnes agees)
DENMARK
housing benefit
day care subsidy
housing allowance
social assistance
FINLAND
housing benefit
home child care benefit
social assistance benefit
pensioners housing benefit

Social Situation Observatory – Social inclusion and Income distribution Draft final report
December 2006 142
FRANCE
disabled benefit (allocation aux adultes handicapes)
young children allowance (allocation pour jeunes enfants)
education related family benefits (allocation de rentree scolaire)
family complement (complement familial)
housing benefits (allocation logement)
lone parent benefit (allocation de parent isole)
minimum income (revenu minimum d'insertion)
GERMANY
housing benefit
federal child raising benefit (bundeserziehungsgeld)
direct housing support (wohneigentumsfoerderung / eigenheimzulagengesetz)
provincial child raising benefit (landeserziehungsgeld)
social assistence (sozialhilfe)
GREECE
large family benefit
third child benefit
unprotected child benefit
social pension
IRELAND
housing benefit
blind persons non-contributory benefits
carer's non-contributory benefits
short term disabled contributory benefits
long term disabled non-contributory benefits
deserted wives non-contributory benefits
family income supplement
long term invalidity contributory benefits
lone parent non-contributory benefits
long term unemployed non-contributory benefits
old age non-contributory benefits
pre-retirement non-contributory benefits
short term unemployed non-contributory benefits

Social Situation Observatory – Social inclusion and Income distribution Draft final report
December 2006 143
social minimum non-contributory benefits
widow's non-contributory benefits
Home Carers Tax Credit
ITALY
family allowances for single persons with no children
family allowances for single person with children
family allowances for couples with no children
family allowances for couples with children
LUXEMBOURG
education allowance (allocation d'éducation)
housing benefit
maternity allowance (allocation de maternité)
social assistence (minimum income)
NETHERLANDS
housing benefit
ioaw-sab: for unemployed aged 50-64 and disabled unemployed younger than 64 with children
general social assistance for families with children
ioaw-sab: for unemployed aged 50-64 and disabled unemployed younger than 64 without children
general social assistance for families w/o children
general social assistance, self-employed (ubz)
PORTUGAL
child benefits
income supplement to ensure minimum income
old-age social pension
social assistence
SPAIN
child benefit
old age social assistance
unemployed social assistance for those with family charges
social assistance benefits

Social Situation Observatory – Social inclusion and Income distribution Draft final report
December 2006 144
SWEDEN
housing benefits
housing benefit supplement for pensioners
social assistance
UK
housing benefit
council tax benefit
working family tax credit
income support
NON MEANS-TESTED BENEFITS
AUSTRIA
child benefit (familienbeihilfe)
addition to child benefit for disabled children (erhoehte familienbeihilfe)
caring benefit (pflegegeld)
child care benefit (kinderbetreuungshilfe)
maternity allowance / allowance for parental leave (wochengeld / karenzgeld)
sickness benefit (kranken- und unfallversorgung)
unemployment payment (arbeitslosengeld)
student payments
other irregular lump sum benefits
BELGIUM
child benefit
child birth benefit
career break allocation (indemnité de pause-carrière)
allocation for handicaped persons (allocations aux handicapés)
learning allocation (allocation de formation)
long sickness allocation (allocation d’invalidité)
professionnal illness allocation and work accident allocation (indemnité de maladie professionnel et indemnité d’accident du travail)
allocation from a special funds (allocation du fonds de sécurité d’existence)
short-sickness allocation (allocation de maladie)

Social Situation Observatory – Social inclusion and Income distribution Draft final report
December 2006 145
unemployement benefit (allocation de chômage)
young unemployed allocation (allocation d’attente)
student payments
housing benefits
other irregular lump sum benefits
maternity payments
DENMARK
student payments
maternity payments
dk: simulated unemployment benefit
dk: child benefit (incl. "ordinary", "extra", "special" and "multi children" benefit)
family allowance
early retirement benefit ('efterløn')
sickness benefit
FINLAND
student payments
other irregular lump sum benefits
maternity payments
child benefit
lone parent child benefit
basic unemployment benefit
earnings related unemployment benefit
labour market support (an unemployment benefit)
military injury compensation
sickness benefit
training subsidy for unemployed
FRANCE
student payments
other irregular lump sum benefits
maternity payments
family allowance (allocation familial)
education related family benefits (aide a la scolaire)

Social Situation Observatory – Social inclusion and Income distribution Draft final report
December 2006 146
social benefit for dependent elderly adults (aide aux personnes agees dependentes (originally apad))
social benefit for special education (allocation d'education speciale…destinee aux enfants handicapes)
social benefit for parental education (allocation parental d'education)
social benefit for lone parents with certain characteristics (allocation de soutien familial)
invalidity pension
invalidity benefit
aide sociale
war pension
help for child guard (aide a la garde d'enfant)
gross unemployment compensation
GERMANY
student payments
other irregular lump sum benefits
child benefit
post natal benefit for non-earning mothers (entbindungsgeld)
unemployment payment
unemployment benefit
retraining payment
old atransition payment
war victims' own pension
accident own pension
war victims' widow/orphan pension
nursing home insurance payment (pflegeversicherung)
GREECE
student payments
housing benefits
other irregular lump sum benefits
maternity payments
oaed child allowance
civil servant child allowance
disability benefit (non-contributory)
unemployment benefit

Social Situation Observatory – Social inclusion and Income distribution Draft final report
December 2006 147
IRELAND
student payments
other irregular lump sum benefits
child benefit
occupational injury disablement contributory benefits
maternity contributory benefits
orphan's contributory benefits
unemployed contributory benefits
back to work allowance
constant attendance allowance
other welfare allowances
unemployability supplement
ITALY
student payments
housing benefits
other irregular lump sum benefits
maternity payments
social insurance unemployment cig
social insurance unemployment compensation
state disability non contributory pension
inail disability non contributory pension
social insurance unemployment mobility benefit
social security: national administrations
social security: regional administrations
social security: provincial administrations
social security: municipal administrations
social security: local health centre
social security: other local p.a.
social security: other private institutions
social pension (inps)*
war pension
LUXEMBOURG
student payments
other irregular lump sum benefits

Social Situation Observatory – Social inclusion and Income distribution Draft final report
December 2006 148
maternity payments
child benefit (family benefit)
prenatal-; postnatal-; and child birth allowance (allocation prenatale; allocation postnatale; allocation de naissance)
handicapped child benefit (allocation speciale supplementaire)
annual beginning of school allowance (allocation de rentrée scolaire)
seriously disabled persons (allocation speciale pour personnes handicapés)
care benefits
other benefits from the fonds national de solidarité (fns)
orphan allowance
other public benefits
permanent accident benefit
unemployment benefit
NETHERLANDS
student payments
other irregular lump sum benefits
maternity payments
dutch child benefit
basic disability benefit (aaw)
disability insurance (former civil servants)
dutch disability insurance (wao)
unemployment benefit for civil servants
unemployment benefit(ww)
sickness insurance (zw)
PORTUGAL
student payments
housing benefits
other irregular lump sum benefits
maternity payments
unemployment related benefits
sickness benefits
family benefits

Social Situation Observatory – Social inclusion and Income distribution Draft final report
December 2006 149
SPAIN
student payments
housing benefits
other irregular lump sum benefits
unemployment insurance benefit
sickness and invalidity benefits
family benefits
SWEDEN
other irregular lump sum benefits
child benefits
parental allowance
swbensjp='sick benefits'
swbenunt='unemploment benefits total'
resid. tax free educational benefits
residual tax-free benefits
university grants
study grants for high school
UK
student payments
other irregular lump sum benefits
maternity payments
job seekers allowance (simulated contributory unemployment benefit)
child benefit
attendance allowance
disability working allowance
invalid care allowance
incapacity benefit
industrial injury
mobility allowance (now "disability living allowance (mobility)")
severe disablement allowance
statutory sick pay
training allowance
war pension
pensioner's annual heating allowance

Social Situation Observatory – Social inclusion and Income distribution Draft final report
December 2006 150
6. DYNAMICS OF POVERTY IN THE EU15 (1994-2001)52
Introduction
This study provides an overview of the dynamics of poverty in the EU 15 Member States using
data from the European Community Household Panel (ECHP) for the years 1994 to 2001. A
dynamic analysis of poverty complements the static analysis of the incidence of poverty and its
depth in a given year, since it focuses on the impact of the time spent in different states (in
poverty vs. non poverty) on the transitions into and out of such states, on the factors
underlying such transitions and on the policy instruments that can affect the persistence of
these states.
The methodology of the study of poverty dynamics is now well consolidated. It developed
originally from an approach initiated by Bane and Elwood (1986), which focused on the
identification of a number of hierarchically ordered and mutually exclusive "trigger events"
associated with transitions into and out of poverty. The pioneering work by Bane and Elwood
was improved by Huff-Stevens (1989), who was the first to model the time spent in (or out of)
poverty as a function of both observable and unobservable individual characteristics and to
study their influence on the probability of leaving poverty (or falling back into it).
The study of poverty dynamics is relevant for both researchers and policy makers to better
understand issues like: how the expected time spent in poverty by different household types is
affected by events such as the birth of a new child, the loss of a job by the head of the
household, divorce, the death of a spouse or a reduction increase in income from benefits.
The analysis below attempts to address such issues. The first section presents the data and
some basic definitions which are adopted; the second illustrates some key descriptive statistics
associated with the dynamics of poverty in the EU15 Member States; the third describes the
methodology adopted for estimating the duration of poverty; the fourth presents the main
results of such estimations and the last section sets out conclusions.
DATA AND DEFINITIONS
The analysis here is based on the ECHP, a longitudinal survey based on a standardised
questionnaire involving annual interviews with a representative panel of households and
individuals in them on household and personal incomes as well as a range of other features.
The ECHP includes yearly data for some 60,500 households for the period 1994-2001. For the
52 Mattia Makovec, European Centre for Social Welfare Policy and Research

Social Situation Observatory – Social inclusion and Income distribution Draft final report
December 2006 151
UK, Germany and Luxembourg, data from, respectively, the British Household Panel, the
German Socio-economic Panel and the Luxembourg Household Panel are used in the analysis.
(For an overview of the main features of the ECHP, including sample attrition and rotation, see
Nicoletti and Peracchi (2002).
The definition of poverty adopted here the standard one of equivalised household income
below 60% of the national median, with all household members assigned the same equivalised
income level (i.e. assuming that income is equally shared within the household). The modified-
OECD equivalence scale is used for equivalisation purposes (i.e. weights of 1 being assigned to
the household head, 0.5 to every other adult in the household and 0.3 to each child below 14).
Given the nature of the data and the methodology of income measurement in the ECHP, poverty
(or out-of-poverty) spells lasting less than a year cannot be observed and it is worth
emphasising that in the reality, transitions into and out of poverty can occur during periods
shorter than a year.
Descriptive results of poverty duration (1994-2001)
The first set of descriptive results presented relate to the number of non consecutive years
spent in poverty out of the 8 years for which panel data are available. These are presented in
Table 1. The total population is therefore divided between those who never experience poverty
over the whole period and those who experience poverty at least once. This latter group is
further broken down between individuals who have been in poverty for just one year, for
between 2 and 4 years and for five years or more, so providing a measure of the persistency of
poverty.
The results suggest that countries with the highest poverty rates are also the countries with the
highest incidence of persistent poverty. In Southern European countries (mainly Greece, Spain,
Portugal) nearly half of the population experienced poverty at least once over the period
considered and around 15% of the population for at least five out of the 8 years. By contrast, in
countries such as Finland, Denmark, Netherlands and Luxembourg, poverty exhibited a more
transient pattern, with nearly two-thirds of the population never poor and with an incidence of
persistent poverty only just over a third of that in the three Southern European countries.
It is worth noting that an analysis based on a balanced panel might, however, be affected by
some shortcomings. In particular, the figures are not adjusted to take account of sample
attrition and since existing empirical evidence has shown that poor individuals are more likely
to drop out of longitudinal panels than the non poor, one can expect shorter poverty spells to
be under-represented in a balanced sample.

Social Situation Observatory – Social inclusion and Income distribution Draft final report
December 2006 152
This type of measure is akin to a commonly used indicator of poverty persistence included
among the “Laeken Indicators”, which defines this as affecting individuals who have income
below the poverty line both in the survey year and in two of the three preceding years.
Table 2a and Table 2b show the same information as Table 1 broken down for two population
subgroups at particular high risk of social exclusion, the elderly (those aged 65 or more and
children (those aged 0-15). For these subgroups, differences across countries are more
marked. Denmark, Finland and Sweden are the only countries for which the proportion of
children never experiencing poverty is greater than the corresponding proportion of the total
population. For the elderly population, the composition of the best performing countries is
different, with the Netherlands, Luxembourg, Italy, Spain and Sweden being those in which the
proportion of the elderly never experiencing poverty exceeds that of the total population, while
in Finland it is substantially smaller.
There are two other perspectives from which it is possible to analyse chronic poverty. One, for
which the results are shown in Table 3, focuses on a long-term definition of income obtained
by averaging real incomes53 across the 8 waves and computing poverty indicators based on the
distribution of the average income so calculated This is similar to the approach adopted by
Rodgers and Rodgers (1993) and Valletta (2006), the rationale being that smoothing incomes
over time might provide a better approximation of permanent income than simply the income
for a single year. From this approach, UK and Portugal stand out as the countries with the
highest long-run child poverty rates. The ranking in terms of persistent elderly poverty is
different from that in Table 2b in the case of Denmark, but in this case there is a significant
questionmark over the reliability of the data on which this analysis is based. Both Danish
national data and the statistics collected by the EU-SILC indicate substantially lower levels of
poverty among the elderly than the ECHP.
The other exercise is to look at the evolution of poverty when the poverty line is anchored at
one point in time. In this case, we consider the poverty line fixed at the 1994 level and compare
the dynamics of real incomes (inflation-adjusted) over time with this threshold. The advantage
of such an exercise is to highlight – from a comparison with Table 1 - the cases where real
incomes decline over time. Table 4 shows that this is the case for Greece, for example, where
the number of people never experiencing poverty falls by half when a fixed 1994 poverty line is
taken. Portugal also experiences a worsening, which is reflected in addition by a corresponding
increase in the incidence of persistent poverty (income below the poverty line for at least 5
years). On the other hand, countries such as Italy, Germany and Austria seem to have
53 Real equivalised household incomes have been obtained by deflating yearly equivalised household income at current prices by a consumer price index at 1995 constant prices.

Social Situation Observatory – Social inclusion and Income distribution Draft final report
December 2006 153
experienced a moderate improvement according to this measure, which might however be
affected by economic developments and shocks affecting different countries asymmetrically.
Finally, Table 5 reports mean poverty duration for different subgroups of the population,
averaging the number of years spent in poverty only for those for whom the beginning of a
poverty spell can be observed. Table 6 shows instead the composition of poverty spells by
different durations for those who have experienced poverty; the table reflects the patterns with
which poverty is experienced and shows, not surprisingly, that countries with a high incidence
of persistent poverty normally have longer average poverty spells. Spain, however, is an
exception, since here above average incidence of persistent poverty is combined with relatively
short spells of poverty.
Estimating poverty spells: methodology
The methodology adopted below follows closely the work by Jenkins and Rigg (2001) and
Devicienti (2001) and is based on the concept of a hazard rate, which can be intuitively
considered as a conditional probability: of leaving poverty at time t conditional on having been
in poverty until time t-1 and on the first poverty spell being observable. The relevant sample
considered consists of all individuals of working age (above 15) beginning a non left-censored
spell54.
A number of explanatory factors likely to influence exit from poverty conditional on past
poverty experience are considered, and we focus on their joint impact on the average poverty
duration in different countries:
i) demographic factors: gender, age, a series of dummy variables to indicate whether
individuals live alone; in a 2-person household, where both individuals are aged below 65, or in
a two-persons household, where one or both are 65 or older; a number of dummies to indicate
the individual’s marital status and a dummy for primary education being the highest level
attained;
ii) labour market factors: a dummy variable capturing economic activity status, specifically
being employed as opposed to non employed and a dummy to take account of whether there
are other people employed living in the household;
54 Left-censored spells are those spells whose beginning cannot be observed in the sample during the period of observation. Their treatment is problematic especially in short panels as the ECHP, since it is difficult to infer the true time spent into poverty before the observation period by individuals who are observed poor the first time they appear in the sample. Therefore for estimation purposes it is standard practice in the presence of short panels, to exclude left-censored spells from the sample of interest.

Social Situation Observatory – Social inclusion and Income distribution Draft final report
December 2006 154
iii) non-monetary factors, such as health factors: a dummy to indicate whether the individual
has health problems, illness or disability; a dummy for tenure status, indicating whether the
person rents or owns their current residence;
iv) factors relating to the composition of household income (income from work, from benefits
or from capital or other private sources) and its change over time.
Main results
By estimating the hazard (or risk) of leaving poverty during each year of the poverty spell, we
can obtain for different types of individuals the expected time that will be spent in poverty at
the beginning of the spell. The results of this exercise are presented in Figure 1, where we
report the mean poverty duration for selected household types potentially at risk of social
exclusion (single women, elderly - aged 65 or over - couples, unemployed persons with
primary education and households with two or more children) in comparison with couples
without children55.
The main results include the following:
• Single women in Ireland display a striking long expected poverty duration (over 3 years)
once they enter poverty compared with both those in other countries and with other
population subgroups, while nearly all other countries considered exhibit mean poverty
duration of between one and one and a half years.
• Unemployed persons with low educational attainment are the second population
subgroup with the highest expected poverty duration, in particular in Belgium (over two
years) followed by, France and Finland.
• Among households without children, couples where at least one household member is
aged 65 or above, exhibit longer (between two and three times longer) expected time in
poverty than younger couples in all the countries considered, the most severe cases
being Ireland, UK and Portugal, countries also showing high poverty head-count rates
among the elderly.
Conclusions
This analysis above gives an overview of the time spent in and out of poverty by different
sections of the population according to different measures of poverty persistence and chronic
55 We do not report the details of the estimation, since this would imply listing for each country the coefficients of 30 explanatory variables. Estimation details will be provided in a separate Appendix.

Social Situation Observatory – Social inclusion and Income distribution Draft final report
December 2006 155
poverty for the EU 15 Member States in the second half of the 1990s. Using a consolidated
methodology for analysing the dynamics of poverty, it also gives estimates of the mean
duration of poverty in the different countries for different types of households entering poverty.

Social Situation Observatory – Social inclusion and Income distribution Draft final report
December 2006 156
7. WHY ARE THE POOR POOR? THE ROLE OF LABOUR MARKET AND
DEMOGRAPHIC FACTORS, INCLUDING HEALTH AND
IMMIGRATION56
Introduction
Why are the poor poor? The main factors which are likely to influence the level of household
income and the risk of poverty can be listed as follows:
The level of earnings, and labour market participation.
Lack of employment, and in particular unemployment tends to have a high risk of poverty. On
the other hand, employment as such is no guarantee against poverty either, as low paid
workers might also be exposed to the risk of poverty. Earnings depend on hourly wages and
hours worked, and labour economics has traditionally focussed on the latter. A related
important topic is the employment of women, and the gender wage gap.
Social security system, social assistance and the tax system
Income redistribution by the State typically includes the provision of cash benefits and the
levying of taxes, including taxes on incomes and taxes on consumption. Although recorded as
elements of the tax system, tax allowances, which are actually unpaid taxes, may be regarded
as alternatives to cash benefits. For example, support to families may be provided both as cash
benefit or as tax credit. The fiscal and distributional effects of tax allowances, however, are
often neglected by policy-makers. (The redistributive effect of taxes and benefits on incomes
and the risk of poverty is discussed later, in chapter 6, in this Report).
Household composition
The incomes of members other than the head of the household play a crucial role in raising
household income above the poverty line. Key questions in this regard concern whether both
the spouse or partner of the household head is employed or not; whether the dominant
household model is a dual or single earner one; whether and how far unemployment is
concentrated among specific households, creating a division between “work-poor” and “work-
rich” households.
56 Orsolya Lelkes, European Centre for Social Welfare Policy and Research, Vienna

Social Situation Observatory – Social inclusion and Income distribution Draft final report
December 2006 157
Needs
Greater needs imply that more resources are necessary to avoid deprivation. Specific needs,
such as health problems, disability, a large number of children and so on, affect the basic
minimum resources necessary to avoid deprivation. The concept of poverty currently used to
identify those at risk is income based and takes explicit account only of differences in
household size. Alternative, outcome-based measures can take account of differences in needs.
This issue is considered in more detail later in the report.
The analysis here explores the relative importance of demographic and labour market factors as
causes of (relative) poverty - ie 1) and 3) above. Earlier sections of the report have shown that
the unemployed and the economically inactive tend to have a relatively high incidence of
poverty, along with lone parents and households with three or more children. The analysis
presented there, however, does not shed light on the net effect of these factors taken together.
Conceptual framework: the measure of poverty and its implications for the
analysis
The measure of poverty used throughout this report is household based. It is – often implicitly –
assumed that individuals living in a household share their resources with each other, and
therefore the risk of poverty concerns the household as a whole: a household can be poor or
non-poor, and if the household is poor, all of its members are poor. “For better, for worse”:
couples and children share their fate. From the point of view of understanding the causes of
poverty, this suggests that an individual’s income level depends on the structure of the
household in which they live and the incomes of other members. The analysis here, therefore,
starts with the household level. Later, analysis of individuals also considers household factors.
The measure of poverty is resource-based. Poverty is interpreted as a lack of income, rather
than a lack of particular goods or access to public services. The focus is on assessing resources
rather than outcomes. Outcome-based concepts of equity include capabilities, equality of
opportunity, and social exclusion (Sen 1985, for a review see Burchardt 2006). One of the
arguments in favour of using capabilities is that it accounts for differences in needs, in other
words, the varying ability of individuals to convert resources into outcomes. A person with
disabilities, for example, needs more resources than someone without to move around freely,
or to achieve a minimum standard of living.
There is growing interest among policy-makers of these concepts. The German government’s
National Action Plan on Poverty and Social Inclusion adopted a capabilities framework (European
Commission 2003). The UK Government’s Social Exclusion Unit (set up in 1997) and the recent
appointment of a Minister for Social Exclusion also reflect a shift in the focus of government

Social Situation Observatory – Social inclusion and Income distribution Draft final report
December 2006 158
policies. Similarly, the Human Development Reports by the United Nations Development
Programme present a wider view on development and poverty. The forthcoming 2006
publication of the global report, for example, will focus on access to water and its impact on
inequalities.
Needs seem to be relevant for the study of poverty. Even though poverty is a resource-based
measure, there are two particular aspects of needs which are explicitly taken into account:
household size and ill health. Bigger households need more resources in order to achieve the
same standard of living as smaller ones, though the relationship between the income of
different sized households and living standards is not a linear one. Economies of scale as
households expand are allowed for through the use of equivalence scales. We also account for
the impact of ill health on poverty. This is in the spirit of the pioneering approach of Zaidi and
Burchardt (2005), who estimated equivalence scales for disability.
The measure of poverty is income-based. It considers only cash components of income,
ignoring social services, as well as access to health care and education, and wealth, in the form
for example of the value of housing. Access to these services, the level of user charges and the
effective use made of these services might well vary significantly across households and
countries. This is especially relevant for comparisons of living standards both nationally and
internationally and could be taken into account if an outcome-based measure of inequality
were used.
Data and methodology
The data used come from the first release of EU-SILC (Community Statistics on Income and
Living Conditions), which provides cross sectional multidimensional micro data on income
poverty and social exclusion. Fourteen countries are included in the sample: AT, BE, DK, EE, ES,
FI, FR, GR, IE, IT, LU, NO, PT and SE57. Norway, though not a member of the European Union, is
included in the analysis as it may still provide an interesting comparison.
The target population of EU-SILC is all persons living in private households within the national
territory of the country concerned. People living in collective households and institutions are
excluded from the target population. The survey includes information on households and
demographic information on all their members. Income data and other detailed information is
collected from household members aged 16 and over. The income reference period is 1 January
57 EU-SILC was launched in 2004 in 13 MS (all except NL, DE, UK and the 10 new MS except EE), plus NO and IS. This first release of the cross sectional data refers mainly to income reference year 2003 and fieldwork carried out in 2004. EU-SILC will reach its full scale covering the 25 MS + NO and IS in 2005. Later, TR, RO, BG and CH will also be included. The current release, therefore, provides cross sectional data for only a limited set of countries.

Social Situation Observatory – Social inclusion and Income distribution Draft final report
December 2006 159
– 31 December 2003 for all countries, except Ireland, where the period is 12 months prior to
the date of interview.
The launch of EU-SILC foresees a transition period up until 2007 during which national
statistical institutes can adapt their methods to a common standard in relation, for instance, to
imputed rent, employer social contributions and income components measured in gross terms.
The sample for the first survey covers 114.771 households and 235.033 individuals, which falls
to 192.071 in the regressions due to the exclusion of missing values. The number of
households included in the different countries vary between about 3,500 (Luxembourg) and
24,000 (Italy).
Weights have been used to take account of the units’ probability of selection, non-response
and, as appropriate, to adjust the sample to the distribution of households and individuals in
the target population as a whole.
The methodology adopted entails estimating how the probability of being poor (at both the
individual and household level) is affected by demographic and labour market characteristics
together with specific individual attributes. Simple bivariate associations of individual or
household level characteristics with the risk of poverty as presented in section on trends above
do not, in fact, enable account to be taken of the joint effect of a larger number of observable
characteristics on poverty. Adopting a regression approach therefore has the advantage of
allowing account to be taken not only of the effect of single explanatory factors on the
probability of individuals or households having income below the poverty line, but also the
combined effect of different factors. It accordingly enables answers to be given to questions
such as: what is the probability of having income below the poverty line for a low-educated
young woman with children in different countries, given her age, household circumstances and
so on?
The household level analysis below examines, the relative importance of labour market and
demographic factors on the poverty of households. Demographic factors are measured in terms
of household composition and labour market factors by work intensity within the household.
The estimated equation takes the form:
Povertyi = f(hhtypet, workintensityi)
Povertyi is a dummy variable, indicating whether or not household has income below the
poverty line (below 60% of the national median), hhtypei is a series of dummy variables,
indicating the specific household type, workintensityi is a categorical variable, indicating either
none, partial employment or full employment of members of the household of working age.

Social Situation Observatory – Social inclusion and Income distribution Draft final report
December 2006 160
The approach adopted hereby is based on the EUROSTAT definition of work intensity: the work
intensity of the household is defined by the ratio between the number of months spent in
employment during a year by household members in working age (i.e. aged 16-64) and the
number of months during which household members are observed in an economically active
status. Therefore, a work intensity index equal to 0 corresponds to jobless households, which
means that none of the household members in working age is employed during a year. By the
same token, a work intensity index equal to 1 corresponds to a situation in which all household
members in working age are employed during the full length of the year, while a work intensity
index between 0 and reflects a situation in which either only one of the adult household
members is working for the full year length or all household members are working but not for
the full-length.
Probit regressions are estimated for the total sample, including all 14 countries, and then for
individual ones.
Most model specifications include country dummies. These account for all country-specific
characteristics, including institutional, demographic, and cultural characteristics, some of which
may be unobservable. The interpretation of these country coefficients is therefore not
straightforward, because they do not only refer e.g. to the role of the state in alleviating
poverty, but include many other factors.
The output tables present both the estimated coefficients and the marginal effect, that is the
change in the probability of poverty for an infinitesimal change in each independent,
continuous variable and for a discrete change in the dummy variables. Given their
straightforward interpretation as probability changes, marginal effects will be discussed, rather
than the coefficients.
The relationship between poverty on the one hand, and household structure or labour market
involvement, on the other, needs to be interpreted as a correlation rather than as a causal
relationship. This is due to the nature of the data, which relate to a single point in time only. In
other words, there is no certainty that household composition and work intensity are
endogenous variables. While there is considerable evidence that household composition and
work intensity determine the risk of poverty, to some extent the direction of causation might
also run in the reverse direction as well. Poverty might lead to change in household structure
(e.g. as a result of divorce), or it might lead to long-term unemployment. In a few years time,
with the use of longitudinal data from EU-SILC, it should be possible to analyse the causal
relationship between household characteristics and poverty, as well as the effect of external
shocks and policy changes on poverty.

Social Situation Observatory – Social inclusion and Income distribution Draft final report
December 2006 161
Secondly, in the individual level analysis, we control for a larger set of factors which vary
between members of the same household and can therefore affect their individual risk of
poverty. These factors include gender, age, educational attainment and detailed labour market
status. This type of analysis therefore extends the household-level analysis adding robustness
to the findings as regards the causes of poverty. The larger in fact the number of significant
explanatory variables included in the specification, the lower the risk that the estimation results
are affected by potentially relevant variables which have been omitted.
The estimated equation takes the form of:
Povertyi = f(empi, hhtypei,, sexi, agei, edui, healthi)
Poverty is a dummy variable, indicating whether or not individual i has poverty-level income,
empi indicates labour market status and hhtypei is a series of dummy variables, indicating the
specific household type, sexi is a dummy, taking the value of 1 when i is female, agei is a
categorical variable, edui is also a categorical variable, indicating the educational attainment of
individual i,. Healthi refers to health problems which hamper daily activities.
Two specific themes are also explored in greater depth: ill health and immigrant status.
For ill health, three alternative definitions are considered: (1) self-assessed health on a scale
from “very good” to “very bad”, (2) the prevalence of chronic illness, and (3) health problems
which hamper daily activities. Immigrant status is defined in two alternative ways: (1) a person
with citizenship of another country, (2) someone is born elsewhere than the country of
residence. The analyses compare the specific impact of these alternative measures, and
contrast them to the previously used demographic and labour market variables.
Causes of poverty at the household level
FOURTEEN EUROPEAN COUNTRIES
Results of the probit regressions show that labour market participation has a major effect on
the risk of poverty: when none of the working-age members of a household are in employment,
the poverty risk of the household increases by 36-38%, after controlling for differences in
household composition and country specific effects. This suggests that social benefits,
including unemployment insurance and social assistance, often do not prevent people from
falling into poverty. This also seems to be the case, though to a lesser extent, when only one
household member is employed. The partial employment of household members increases the
poverty risk by 15-17% as compared with the reference group, where all members of working
age are in full-time employment.

Social Situation Observatory – Social inclusion and Income distribution Draft final report
December 2006 162
Table 1. Poverty risk among households, probit estimates
(1) (2) (3) Coefficients Marginal effects Coefficients Marginal effects Coefficients Marginal effectsHousehold composition 2 adults, no children, <65 yrs -0.573** -0.091** -0.922** -0.129** -0.585** -0.088** (29.13) (29.13) (23.63) (23.63) (29.33) (29.33) 2 adults, no children, >65 yrs -0.587** -0.083** -0.939** -0.108** -0.685** -0.086** (22.35) (22.35) (21.86) (21.86) (25.57) (25.57) Other hh no children -0.610** -0.089** -1.218** -0.134** -0.767** -0.098** (26.56) (26.56) (19.27) (19.27) (32.37) (32.37) Single parent, 1+ children 0.383** 0.091** -0.091 -0.017 0.366** 0.083** (15.06) (15.06) (1.73) (1.73) (14.21) (14.21) 2 adults, 1 child -0.333** -0.056** -0.887** -0.115** -0.410** -0.063** (15.16) (15.16) (15.34) (15.34) (18.32) (18.32) 2 adults, 2 children -0.127** -0.023** -0.827** -0.113** -0.198** -0.034** (6.21) (6.21) (11.72) (11.72) (9.48) (9.48) 2 adults, 3+ children 0.034 0.007 -0.811** -0.100** 0.037 0.007 (1.31) (1.31) (9.48) (9.48) (1.42) (1.42) Other hh with children -0.209** -0.037** -1.001** -0.114** -0.344** -0.053** (8.46) (8.46) (12.43) (12.43) (13.59) (13.59) Hh size, ln 0.507** 0.099** (10.36) (10.36) Work intensity Not a single adult working (WI=0) 1.301** 0.381** 1.300** 0.380** 1.279** 0.364** (79.57) (79.57) (79.40) (79.40) (76.82) (76.82) Not fully working (0<WI<1) 0.765** 0.167** 0.759** 0.165** 0.733** 0.153** (54.02) (54.02) (53.48) (53.48) (50.60) (50.60) Country fixed effects No No No No Yes Yes Constant -1.404** -1.403** -1.292** (91.77) (91.68) (68.40) Pseudo R2 0.1283 0.1298 0.1532 Observations 87419 87419 87419 87419 87419 87419 Source: Authors calculations based on EU-SILC 2004
Countries include: AT, BE, DK, EE, ES, FI, FR, GR, IE, LU, NO, PT, SE
Notes:
Dependent variable: household in poverty, using the 60% of median income as a threshold
Absolute value of z statistics in parentheses
* indicates that estimates are significant at 5% level ; ** significant at 1% level
Reference categories: Work intensity=All working age persons in the household are fully employed (WI=1), Household type=One adult without children
Household composition also explains part of the variation in poverty risk, over and above the
impact of the labour market involvement of household members. Compared with the reference
group of single-person households, most other households have a lower risk of poverty, with
the exception of single parents. Being a single parent increases the probability of having
income below the poverty line by 9%. In addition, as expected, household size is positively

Social Situation Observatory – Social inclusion and Income distribution Draft final report
December 2006 163
correlated with the probability of them having poverty level income: larger households are more
likely to be in this position.
Institutional or cultural differences across countries are also expected to affect the influence of
demography and labour market status on poverty. One specification of the model includes a
series of dummy variables for each country (see column (3)). As Table 1 shows, this does not
change the results qualitatively. At a multi-country level, the relationship between household
work intensity and household composition. on the one hand, and the risk of poverty, on the
other, are not altered. The results indicate how the risk of poverty varies between countries.
Compared with the reference country, Italy, households in most countries tend to have a lower
risk of poverty (see Table A2 in the appendix, which shows details of the estimation
summarised in Table 1). The poverty risk is higher only in four countries out of the fourteen: in
Estonia, Spain, Portugal, and Greece. This specification, however, allows a single level difference
per country and does not explore whether these country effects are specific to the labour
market situation or to household composition (interaction effects). These effects are explored
in the next section.
EVIDENCE IN SPECIFIC COUNTRIES
In order to analyse country-specific variations in the link between poverty, on one hand, and
household structure and labour market involvement, on the other, the above analysis is
repeated for each country separately. The estimated probit regressions, therefore, have the
same specification as before. Demographic factors are measured as household composition,
and labour market involvement is measured as work intensity within the household.
The following graphs present the estimated marginal effects for social groups with specific
demographic or labour market characteristics, controlling for the impact of the other variables.
Positive marginal effects indicate a higher poverty risk for the specific group, while negative
marginal effects indicate a lower probability of having poverty-level income. This provides a
possible way of comparing differences in the risk of poverty across countries.
Labour market involvement, or rather the lack of it, seems to bring a much higher risk of
poverty than, for example, having a large family. Moreover, the scale of the risk varies markedly
across countries. Jobless households face the highest risk of poverty in Ireland, Spain and, to a
lesser extent, in France and Italy. On the other hand, in countries such as Finland, Luxembourg,
Sweden and Norway, jobless households are relatively well protected by the State from the risk
of poverty and face only about a 20% higher risk than households where all working-age
members are employed. The explanation for these cross-country differences is not
straightforward. Although some of the high-risk countries, Italy and Spain, tend to have low

Social Situation Observatory – Social inclusion and Income distribution Draft final report
December 2006 164
replacement rates for long-term unemployed, this is not the case for some other high-risk
countries, such as France and Ireland, which tend to be generous with the unemployed,
according to OECD calculations58. On the other hand, countries which were labelled as low-risk
tend to have high average net replacement rates for the long-term unemployed, which may
explain their advantageous situation.
As seen above, the poverty risk of households declined significantly when at least one
household member is employed. The poverty risk ranges between 3% and 24% for these
households, other things being equal, with Denmark scoring lowest and Estonia the highest. As
compared with the poverty risk of entirely and partly jobless households, the risk is at least
halved in the majority of countries. The relative reduction is 60% or more in Denmark, Ireland,
Belgium, Spain France, and Finland. Since in Finland and Denmark the poverty risk of jobless
households is relatively low and in the other countries relatively high, this suggests that it is not
necessarily in countries with high-poverty jobless households where partly employed
households fare much better.
The net effect of household composition on the risk of poverty tends to be lower than that of
involvement in employment once e work intensity of t households is controlled for. Single
parent households have a 10% higher chance of having poverty-level income poor than single
households in Belgium, Estonia, Spain, France, and Italy. In Spain and Greece, however, the
effect is around 20%. Interestingly, some of the results for the total sample of countries do not
hold for specific countries. In Table 1 above, large families (2 adults, 3+ children) did not have
a significantly different poverty risk than single persons, and “traditional” 2-parent 2-children
families had a lower risk. In the country-specific analysis, large families are found to have a
much greater risk in some countries, including Greece and Spain, and “traditional” families are
more exposed to poverty in Ireland.
An issue for further research is the relationship between low pay and the risk of poverty. While
low pay is a potential source of i poverty, countries vary a great deal in this respect, partly
according to the structure of the labour market. Wage determination policies, including the role
of trade unions and minimum wage policies strongly affect the prevalence of low pay. Not all
low-paid workers, however, are poor. Using UK data, Gardiner and Millar (2006) highlight the
importance of family structure in helping low-paid workers avoid the risk of poverty, in relation
to working long hours or social transfers.
58 Average of Net Replacement Rates over 60 months of unemployment, 2002 (OECD 2004)

Social Situation Observatory – Social inclusion and Income distribution Draft final report
December 2006 165
Causes of poverty among individuals
The dependent variable, the risk of poverty, is measured at the household level. The estimates
show how the probability of having a poverty level of income depends on specific individual and
household characteristics and the relative importance of these, when other factors are held
constant. The estimates are based on the sample of individuals in the fourteen countries.
Where relevant, household characteristics are also included in the model. As above, positive
marginal effects indicate a higher poverty risk for the group in question, while negative
marginal effects indicate a lower risk.
Joblessness appears to be the main risk of poverty, while demographic factors play a lesser
role. Unemployment increases the probability of being poor by 26%, other things being equal.
“Other inactive” (inactive other than students or the retired), who are primarily women with
caring responsibilities, face a risk 17% higher than employed. Pensioners have only a 6% higher
probability of being poor than those in employment, other things being equal. The poverty risk
associated with specific household types tends to be somewhat lower in general. Single parents
face the highest risk: they have 12% higher chance of being poor than 2-parent-2-children
families (our reference group in the analysis). Having children clearly raises the risk of poverty
in case of all household types. For example, two adult households with no children have 4-5%
lower poverty risk than two adult households with two children. Note, however, that single
person households tend to have a comparatively higher poverty risk, 8% higher than the
reference group, over and above the impact of age, education, employment status and other
characteristics.
The coefficients of education are statistically significant and negative, which suggests that
higher educational level decreases the risk of poverty. This is likely to reflect the wage premium
of more skilled labour, rather than the impact of education per se. The poverty risk seems to be
declining with age, ceteris paribus. Those aged under 30 have a lower risk, while those of 45
and over have a higher poverty risk than the reference group, those aged 30-44. The effect,
however, is relatively small and varies between 1% and 3%.
Women tend to have lower risk of poverty than man, once other factors are controlled for. The
effect is rather small, but statistically significant. This seems to imply that the income
disadvantage of women tends to stem from lower employment first of all, and also from
differences in household structure. Women are three times more likely to be single parents, and
the occurrence of one person households is also higher among women, and as shown before
both household types are typically associated with higher poverty risk.
The models included controls for health situation. The impact of health problems on poverty
will be explored in more depth in a following section.

Social Situation Observatory – Social inclusion and Income distribution Draft final report
December 2006 166
Table 2. Poverty risk among individuals, probit estimates
Coefficients Marginal effects Unemployed 0.879** 0.263** (61.69) (61.69) Student 0.452** 0.116** (28.37) (28.37) Retired 0.260** 0.060** (17.34) (17.34) Other inactive 0.664** 0.175** (57.98) (57.98) 1 person hh 0.333** 0.080** (21.65) (21.65) 2 adults, no children, <65 yrs -0.265** -0.050** (17.09) (17.09) 2 adults, no children, >65 yrs -0.224** -0.043** (12.50) (12.50) Other hh no children -0.513** -0.089** (33.65) (33.65) Single parent, 1+ children 0.456** 0.120** (21.21) (21.21) 2 adults, 1 child -0.210** -0.040** (13.53) (13.53) 2 adults, 3+ children 0.193** 0.045** (10.69) (10.69) Other hh with children -0.117** -0.023** (7.86) (7.86) Education: Female -0.112** -0.024** (14.10) (14.10) Age: 16-29 yrs 0.072** 0.016** (5.61) (5.61) Age: 45-59 yrs -0.037** -0.008** (3.26) (3.26) Age: 60+ yrs -0.128** -0.026** (7.90) (7.90) Education: secondary -0.324** -0.070** (34.71) (34.71) Education: post-secondary non tertiary -0.549** -0.085** (21.95) (21.95) Education: tertiary -0.759** -0.121** (55.25) (55.25)
Health hampers: yes, strongly 0.090** 0.020** (6.73) (6.73) Health hampers: yes 0.079** 0.017** (7.43) (7.43) Country fixed effects included Yes Source: Authors calculations based on EU-SILC 2004, N=192.071 Dependent variable: households in poverty, using the 60% of median income as a threshold Absolute value of z statistics in parentheses; * indicates that estimates are significant at 5% level; ** significant at 1% level Reference categories: Age=30-44 yrs, Education=primary, Employment status=employee, Household type=Two adults two children

Social Situation Observatory – Social inclusion and Income distribution Draft final report
December 2006 167
Ill health: increased risk of poverty, but mostly indirectly
The EU-SILC dataset used here allows us address to what extent health problems are likely to
increase the risk of poverty. The data includes three alternative definitions of health. As part of
the first, subjective health, question people assess their health as very bad, bad, fair, good or
very good. The second question asks people whether they suffer from any long standing illness
or condition. The third variable explores whether the individual has limitations in daily activities
due to health problems. We limited our analysis to the population under the age of 60, as we
are primarily interested on the impact of health problems among the working age group.
First we looked at the direct relationship of bad health and poverty occurrence. Then we
analysed this relationship with a multivariate model, controlling for demographic and labour
market characteristics of the individual and for country specific effects.
Health problems increase the risk of poverty by 2-12%, depending on the measure of health
used (Table 3). Interestingly, the impact of long standing illness is relatively small, 2%,
compared to other indicators of health problems. Strongly hampering health problems increase
the risk of poverty by 7%, while very bad health by 12%. This latter seems to suggest that
people’s self assessed health is the strongest correlate with poverty risk. This subjective
measure is often used in the literature, and appears to be a good proxy for actual health
condition, especially when we consider that health includes not only physical, but mental
aspects as well.
Table 3. Health problems and the risk of poverty among the working age population, bivariate probit
estimates
(1) (2) (3)
CoefficientMarginal
effect CoefficientMarginal
effect Coefficient Marginal
effect Health: fair 0.151** 0.037** (14.87) (14.87) Health: bad 0.372** 0.101** (21.60) (21.60) Health: very bad 0.430** 0.122** (13.01) (13.01) Long standing illness 0.089** 0.022** (9.04) (9.04) Health hampers: yes, strongly 0.277** 0.073** (16.41) (16.41) Health hampers: yes 0.124** 0.031** (9.93) (9.93) Individual control variables included No No No Country dummies included No No No Source: Authors calculations based on EU-SILC 2004, N= 142.711
Dependent variable: households in poverty, using the 60% of median income as a threshold

Social Situation Observatory – Social inclusion and Income distribution Draft final report
December 2006 168
Absolute value of z statistics in parentheses
* indicates that estimates are significant at 5% level ; ** significant at 1% level
Reference categories: Health: good or very good, No long standing illness, Health does not hamper
Sickness may be an impediment of labour market participation, and therefore it may indirectly
cause higher poverty. The impact of health on incomes is also influenced by the household
structure, in particular whether the incomes of other members can buffer the impact of health
related negative income shocks. How much is the effect of health, once we account for (lower)
labour market participation and variation in demographic characteristics?
Table 4. Health problems and the risk of poverty among the working age population, multivariate probit
estimates
(1) (2) (3)
Coefficient Marginal effect Coefficient
Marginal effect Coefficient
Marginal effect
Health: fair 0.083** 0.017** (7.37) (7.37) Health: bad 0.209** 0.047** (11.14) (11.14) Health: very bad 0.210** 0.047** (5.94) (5.94) Long standing illness 0.046** 0.009** (4.21) (4.21) Health hampers: yes, strongly 0.116** 0.025** (6.25) (6.25) Health hampers: yes 0.079** 0.016** (5.76) (5.76) Individual control variables included Yes Yes Yes Country dummies included Yes Yes Yes Source: Authors calculations based on EU-SILC 2004, N= 142.711
Dependent variable: households in poverty, using the 60% of median income as a threshold
Absolute value of z statistics in parentheses
* indicates that estimates are significant at 5% level ; ** significant at 1% level
Reference categories: Health: good or very good, No long standing illness, Health does not hamper
All the models include individual control variables (demographic, labour market characteristics), and country controls, as in Table 2.
The results of the multivariate probit estimation show that health has a relatively small effect on
poverty risk, over and above the impact of labour market, age, education, household
composition and country of residence. Comparing the marginal effects in Table 4 and the
earlier, bivariate results in Table 3, we can see that the relationship between health status and
poverty is much weaker in the multivariate model. “Very bad health”, for example increases the
risk of poverty by 5%, when controlling for employment and other personal characteristics, in

Social Situation Observatory – Social inclusion and Income distribution Draft final report
December 2006 169
contrast to 13% when no such controls are used. This suggests that health problems cause
poverty primarily via other factors: through lower labour market participation, first of all.
According to our calculations, unemployment is about twice as high among those who report
very bad health than among those with good health, and inactivity (other than retired or
students) is nearly three times as high.
The direct effect of health on poverty seems to be relatively small. While ill health itself
increases the risk of poverty by 2-5%, depending on the measure used, unemployment for
example increases the risk by 26%, ceteris paribus (see Table 2).
Immigrants from other EU states often face higher risk of poverty
The survey allows us to identify two different, but overlapping, groups of the immigrant
population. One definition captures people who are born in a different country than their
country of residence. Their share may be as low as 3% of the population (Finland), or may reach
20% (Estonia), or even 37% (Luxembourg). The other definition identifies those who have
citizenship which differs from the country where they live. This group tends to be smaller than
the previous, which is not surprising, as many of those who were born elsewhere have already
received the citizenship of their country of residence. Note, however, that these definitions do
not make a distinction on the basis of arrival to the country, and therefore will include people
who have been residing in the country for decades.
The number of immigrants in the sample is small at times (see Table 5), which means that the
number of poor immigrants is even smaller, falling under 50 observations in the specific
countries. This limits the possibility of exploring the characteristics of poor immigrants in
specific countries. Such analysis would require larger, and more specifically designed surveys.

Social Situation Observatory – Social inclusion and Income distribution Draft final report
December 2006 170
Table 5. Share of immigrants within countries in the sample population
Ratio of immigrants, % Ratio of immigrants, %
Number of observations in the
sample
Number of observations in the
sample Country of birth Citizenship Country of birth Citizenship (other) EU Other (other) EU Other (other) EU Other (other) EU Other AT 6.91 6.96 6.91 6.96 597 603 284 390 BE 5.34 6.08 5.34 6.08 589 718 505 300 DK 1.96 4.35 1.96 4.35 236 507 236 507 EE 0.00 20.33 0.00 20.33 - 1.340 - 1.287 ES 1.50 3.34 1.50 3.34 425 953 339 659 FI 1.10 1.61 1.10 1.61 249 295 103 188 FR 4.42 8.06 4.42 8.06 785 1.503 508 608 GR 2.18 5.60 2.18 5.60 277 695 146 492 IE 6.73 2.40 6.73 2.40 708 235 339 158 IT 1.49 3.63 1.49 3.63 711 1.624 286 1.095 LU 30.22 6.87 30.22 6.87 2.284 518 2.436 351 NO 2.89 4.38 2.89 4.38 346 565 244 227 PT 1.57 4.67 1.57 4.67 164 453 73 202 SE 5.04 7.00 5.04 7.00 557 842 257 290
Source: Authors calculations based on EU-SILC 2004, N= 232.164
Note: the data refers to people who are born elsewhere than the country of residence, or have other citizenship
To what extent are these two groups exposed to poverty, and how does it differ from the non-
immigrant population? We expect that immigrants face higher risks of poverty. This might not
hold in case immigrants are dominantly consist of highly skilled workforce, which exploits the
opportunity of free movement of labour within Europe.
Do the two immigrant groups imply different poverty risks? Assuming that citizenship of the
country of residence is a sign of integration, we expect poverty to be lower among the broader
group, which includes those who already have the citizenship (and are born elsewhere).
In most countries, the risk of poverty is significantly higher among immigrants, especially
among people who are coming from outside the European Union. The EU-non-EU gap among
immigrants if particularly marked in Belgium, France, Luxembourg, and Norway (see Figure 2).
In Belgium, over half of those who have non-EU citizenship, live in poverty. The ratio reaches
45% in France and Luxembourg. In Portugal, which is a country with relatively high poverty,
immigrants do not seem to fare worse than the non-immigrant population. Estonia seems to be
also egalitarian in this respect. Note that here no less than one fifth of the population has a
foreign citizenship, dominantly consisting of Russians. In 2003, the survey year, Estonia was
not yet member of the European Union, which explains the lack of EU citizens in the country.
The existing gap in terms of poverty risk between EU and non-EU is largely attributable to the
characteristics of these two groups. As hypothesised, immigrants from EU countries tend to
have a higher educational attainment and higher labour market involvement, often surpassing

Social Situation Observatory – Social inclusion and Income distribution Draft final report
December 2006 171
even that of the non-immigrant population. As our calculations suggest, 30% of people with EU
citizenship have tertiary education degree on average, which is greater than the ratio for the
non-immigrant population (19%). Employment is also higher among EU immigrants in these
countries on average (59% versus 50% of the non-immigrants, in % of the total population59).
Some countries seem to be exceptions: in particular Austria, Spain, Finland, France,
Luxembourg and Sweden, where immigrants with EU citizenship tend to have higher risk of
poverty than non-immigrants. It might be attributable to the social welfare system, or the
special attributes of immigrant groups in these countries. The situation of these specific groups
could be a subject of further, in-depth research, based on labour force surveys, for example.
The second, alternative definition of immigrants refers to people who are born elsewhere than
the country of residence. This approach captures a larger group, as shown in Table 5 before,
and over one third of them already possess the citizenship of the country of residence (see
Table A4 in the Annex.) This group is therefore more heterogenous, including those who are
more integrated (acquired citizenship) and those who are less so. In addition, this definition
refers to people who are likely to be staying in the country for longer on average.
The difference between EU and non-EU immigrants prevails, and poverty rates tend to be
higher among the latter group. On the other hand, average poverty rates are lower according to
this definition, than the alternative one, based on citizenship. In Austria, Belgium, Denmark,
Finland, France, Luxemburg, Norway, and Sweden immigrants who were not born in an EU
country face poverty risks which are over twice as high as among the non-immigrant
population. Austria seems to have a specific situation, as poverty among EU citizens tends to be
also nearly twice as high as among non-immigrants. Note, however, that this cannot be the
impact of EU enlargement, and the resulting influx from Central-Eastern Europe, as the date of
the survey (2003) precedes this.
Is it possible that the poverty rates presented above are erroneous, and strongly biased by the
relatively small number of observations? How does the number of the observations in the
sample population influence the reliability of the results? In order to respond to such possible
challenges, we estimated confidence intervals of specific immigrant groups in each of the
fourteen countries. These confidence intervals show with 95% probability how much the extent
of poverty is likely to be in the original population. Poverty among the specific immigrant
groups discussed above is maximum 1% higher or lower in the original population with 95%
probability than the values presented so far, as shown by Table A5 in the Annex. For example,
59 Note that this ratio is not calculated as a per cent of the labour force, which is normally a measure of employment
ratio. This calculation, however, seemed more appropriate for the sake of the argument presented above.

Social Situation Observatory – Social inclusion and Income distribution Draft final report
December 2006 172
poverty rate of EU immigrants in Austria is expected to be between 19.0 and 20.6% among
those who are not born in Austria, while it is between 23.8% and 25.5% among non-Austrian EU
citizens. The point estimates presented in the graphs are 19.8% and 24.6% respectively, which
is by definition the middle point of the range. The width of the confidence interval, 1%, is
relatively small compared to the poverty ratios. From this, it follows that the inter-group
differences discussed above in details are statistically significant.
Immigrants might fact higher poverty due to lower levels of education, lower labour market
participation, linguistic barriers, social discrimination, and a number of other reasons. As
mentioned before, due to small cell sizes we cannot conduct country specific multivariate
analysis. Instead, we explored how much of the relatively greater poverty among immigrant
groups cannot be explained by demographic and labour market characteristics.
Table 6. Poverty risk among immigrants, probit estimates
Coefficient Marginal effect Coefficient Marginal effect Born in (other) EU country 0.247** 0.059** (12.01) (12.01) Born in (other) non-EU country 0.456** 0.118** (28.74) (28.74) (Other) EU citizen 0.320** 0.079** (12.95) (12.95) Non-EU citizen (of other country) 0.551** 0.149** (28.62) (28.62) Individual control variables included Yes Yes Country dummies included Yes Yes Source: Authors calculations based on EU-SILC 2004, N= 191.989
Dependent variable: households in poverty, using the 60% of median income as a threshold
Absolute value of z statistics in parentheses
* indicates that estimates are significant at 5% level ; ** significant at 1% level
Reference categories: Born in country of residence, Citizen of the country of residence
All models include individual control variables (demographic, labour market characteristics), and country controls, as in Table 2.
The risk of poverty is 6-15% higher among immigrants, depending on the definition of this
group, controlling for individual differences and country fixed effects (Table 6). This suggests
that these groups are exposed to greater poverty, over and above the impact of age, education,
labour market participation, household composition and health. This higher poverty risk might
be due to differences in access to cash benefits, or might be due to lower wages (if
discrimination exists). This kind of analysis typically cannot answer such questions, but can
highlight the magnitude of the problem.

Social Situation Observatory – Social inclusion and Income distribution Draft final report
December 2006 173
Results of the multivariate regression analysis also highlight that (1) non-EU immigrants tend to
have nearly twice as high risk of poverty than EU-immigrants, (2) people who are not citizens of
the country of resident tend to have higher poverty on average than those who are born outside
of the country. The difference between these specific groups (EU, non-EU on the one hand, and
citizenship and country of birth on the other) is not simply attributable to differences in labour
force status, education attainment and household composition, since immigrant status tends to
be associated with higher poverty in the regression results, which control for the potential
impact of all these factors.
From the point of view of free movement of labour within the European Union, the situation of
arrivals from other EU countries deserve special attention. As mentioned before, in a number of
countries these people face higher risk of poverty than the non-immigrant population. The
causes of this problem need to be explored. This issue needs to be also assessed with data,
which refers to the enlarged European Union, as situation may have significantly altered after
May 2004.
Conclusion
The paper provides new evidence based on the first release of EU-SILC (Community Statistics on
Income and Living Conditions), including fourteen countries: AT, BE, DK, EE, ES, FI, FR, GR, IE,
IT, LU, NO, PT and SE. Norway, though not a member of the European Union, is included in the
analysis as it may still provide an interesting comparison. The data refers to incomes of 2003.
The methodology adopted entails estimating how the probability of being poor (at both the
individual and household level) is affected by demographic and labour market characteristics
together with specific individual attributes. Adopting a regression approach allows us to
compare the importance of specific factors as causes of poverty.
Joblessness appears to be the main risk of poverty, while demographic factors play a lesser
role. Unemployment increases the probability of being poor by 26%, after controlling for
personal characteristics, household structure and country of residence. The impact of
unemployment is greater when other family members are also out of work. The household level
analysis shows that when none of the working-age members of a household are in
employment, the poverty risk of the household increases by 36-38%, after controlling for
differences in household composition and country specific effects. This suggests that social
benefits, including unemployment insurance and social assistance, often do not prevent people
from falling into poverty.
The poverty risk associated with specific household types tends to be somewhat lower in
general. Single parents face the highest risk: they have 8-12% higher chance of being poor than

Social Situation Observatory – Social inclusion and Income distribution Draft final report
December 2006 174
2-parent-2-children families, even when control for employment, education, age group, health
status, country of residence and other characteristics. Having children clearly raises the risk of
poverty in case of all household types.
Ill health has a relatively small direct effect on poverty risk, other things being equal. Health
problems increase the risk of poverty by 2-5% among the working age population, depending
on the measure of health used, when individual and country differences are controlled for.
Interestingly, the impact of long standing illness is relatively small, 2%, compared to other
indicators of health problems. Strongly hampering health problems increase the risk of poverty
by 3%, while very bad health by 5%. This suggests that people’s self assessed health is the
strongest correlate with poverty risk, and as such, it appears to be a meaningful measure.
Ill health causes poverty primarily via other factors: through lower labour market participation,
first of all. According to our calculations, unemployment is about twice as high among those
who report very bad health than among those with good health, and inactivity (other than
retired or students) is nearly three times as high.
We also explored the relative poverty risks of specific immigrant groups, defined on the basis of
either citizenship or country of birth. Regression results show that (1) non-EU immigrants tend
to have nearly twice as high risk of poverty than EU-immigrants, (2) people who are not citizens
of the country of residence tend to have higher poverty on average than those who are born
outside of the country. The difference between these specific groups (EU, non-EU on the one
hand, and citizenship and country of birth on the other) is not simply attributable to differences
in labour force status, education attainment and household composition, since immigrant
status tends to be associated with higher poverty in the regression results, which control for
the potential impact of all these factors.From the point of view of free movement of labour
within the European Union, the situation of arrivals from other EU countries deserve special
attention. As mentioned before, in a number of countries these people face higher risk of
poverty than the non-immigrant population. The causes of this problem need to be explored.
This issue needs to be also assessed with more recent data, which refers to the enlarged
European Union, as situation may have significantly altered after May 2004.

Social Situation Observatory – Social inclusion and Income distribution Draft final report
December 2006 175
References
Burchardt, T. (2006). Foundations for Measuring Equality: A discussion paper for the Equalities Review. CASEpaper 111. London, Centre for Analysis of Social Exclusion, London School of Economics.
European Commission (2003). Strategies to enhance social integration: National Action Plan against poverty and social exclusion 2003-2005. Germany", Directorate-General for Employment, Social Affairs and Equal Opportunities.
Gardiner, K. and J. Millar (2006). "How Low-Paid Employees Avoid Poverty: An Analysis by Family Type and Household Structure." Journal of Social Policy 35(3): 351-369.
Maitre, B., B. Nolan, et al. (2005). "Research Note: Welfare regimes and household income packaging in the European Union." Journal of European Social Policy 15(2): 157-171.
Mogstad, M., A. Langørgen, et al. (2006 forthcoming). "Region-specific versus country-specific poverty lines in analysis of poverty." Journal of Economic Inequality preprint: 1-8.
OECD (2004). Benefits and Wages. OECD Indicators. Paris: OECD
Sen, A. K. (1985). Commodities and Capabilities. Amsterdam, North-Holland.Zaidi, A. and T. Burchardt (2005). "Comparing incomes when needs differ: Equivalization for the extra costs of disability in the UK." The Review of Income and Wealth 51(1): 89-11

Social Situation Observatory – Social inclusion and Income distribution Draft final report
December 2006 176
Appendix
Table A1. Main sample characteristics, EU-SILC 2004
Household level
Individual level
Country Freq. Percent Freq. Percent AT 4.521 4.02 9.263 3.98 BE 5.264 4.68 10.126 4.35 DK 6.817 6.06 13.419 5.76 EE 3.919 3.48 8.784 3.77 ES 14.347 12.75 29.761 12.78 FI 11.198 9.95 22.747 9.77 FR 10.244 9.10 19.259 8.27 GR 6.244 5.55 13.977 6.00 IE 5.466 4.86 10.978 4.71 IT 24.204 21.51 51.911 22.29 LU 3.571 3.17 7.600 3.26 NO 6.020 5.35 12.037 5.17 PT 4.981 4.43 11.684 5.02 SE 5.739 5.10 11.340 4.87 Total 112.535 100.00 232.886 100.00 Source: Authors calculations based on EU-SILC 2004
Table A2 Risk of poverty by country
Freq. (of poor in
the sample)
Poverty ratio, using national thresholds
(60% of median)
Poverty headcount in the total population,
1000s, estimates with 95% confidence interval
Lower Upper AT 1.019 12 964 977 BE 1.513 14 1.580 1.602 DK 606 11 315 317 EE 259 19 250 254 ES 8.704 21 9.852 9.947 FI 590 11 484 487 FR 7.867 13 7.953 8.028 GR 2.250 20 2.391 2.424 IE 810 21 941 956 IT 10.863 18 9.128 9.186 LU 44 10 49 49 NO 518 11 338 341 PT 2.204 20 2.273 2.307 SE 1.031 11 783 792 Total 232.219 16 - - Source: Authors calculations based on EU-SILC 2004

Social Situation Observatory – Social inclusion and Income distribution Draft final report
December 2006 177
Table A3 a-d) Risk of poverty by specific social groups (a) Age (years)
16-29 30-44 45-59 60+ AT 12.6 11.5 10.1 14.9 BE 14.6 12.0 11.9 19.4 DK 23.4 7.2 4.4 13.6 EE 19.5 17.1 19.6 19.5 ES 18.6 18.2 18.1 29.0 FI 16.6 7.7 7.7 14.3 FR 16.8 10.6 11.6 14.8 GR 19.1 15.8 17.8 26.9 IE 16.0 14.4 18.6 37.7 IT 22.2 18.6 16.1 15.2 LU 11.0 13.2 8.6 5.6 NO 22.3 7.2 3.4 15.0 PT 17.4 17.4 17.7 27.6 SE 20.6 8.3 5.1 12.1 Total 18.7 14.7 13.8 18.9
(b) Employment status
Employed Unemployed Student Retired Other inactive AT 7.8 31.8 18.5 13.3 21.9 BE 5.5 30.6 19.3 17.5 29.2 DK 5.1 19.6 34.6 14.4 12.6 EE 10.0 45.9 23.9 22.2 40.1 ES 12.1 33.6 26.4 24.8 32.4 FI 4.7 28.9 21.6 15.3 14.2 FR 6.1 29.7 23.2 13.2 30.7 GR 13.5 29.5 26.1 26.2 25.1 IE 7.0 36.9 22.9 34.7 41.0 IT 11.3 45.1 23.1 11.6 27.3 LU 8.9 37.0 9.2 4.9 12.5 NO 4.8 24.1 33.8 18.8 12.4 PT 14.3 26.2 21.5 25.7 34.5 SE 6.4 21.9 23.9 14.1 14.0 Total 9.2 34.2 24.0 16.1 28.7

Social Situation Observatory – Social inclusion and Income distribution Draft final report
December 2006 178
(c) Household structure
One person household
2 adults, no
children, <65 yrs
2 adults, no
children, >65 yrs
Other hh no children
Single parent, 1+
children 2 adults, 1
child 2 adults, 2 children
2 adults, 3+ children
Other hh with
children
AT 21.1 11.0 14.4 4.8 23.9 10.5 8.5 22.3 8.8
BE 20.7 10.6 19.8 5.3 32.7 10.4 9.5 17.9 13.9
DK 24.1 5.1 12.8 2.6 13.6 3.9 3.7 12.4 3.9
EE 36.9 15.0 11.1 9.1 41.2 15.5 16.4 24.3 11.4
ES 37.4 12.9 30.9 1.,7 37.4 15.2 25.1 36.1 22.4
FI 27.1 6.6 6.9 4.3 15.7 4.6 5.4 10.7 8.0
FR 19.1 9.2 13.4 9.3 27.5 10.0 9.7 17.3 16.5
GR 29.2 14.4 28.7 14.5 38.9 15.6 18.6 32.4 24.9
IE 55.3 19.0 28.9 9.2 53.1 13.8 10.6 22.4 11.5
IT 22.7 11.3 12.4 11.5 34.6 14.9 24.3 36.0 23.8
LU 12.6 7.2 5.3 4.9 15.5 6.7 16.3 14.5 9.7
NO 29.7 5.8 6.1 1.5 14.0 3.6 4.5 6.9 2.1
PT 35.9 18.3 30.7 12.8 26.6 14.7 25.1 30.6 16.3
SE 23.0 5.9 6.0 0.8 18.8 7.5 5.1 12.3 8.2
Total 24.3 10.4 17.5 11.2 29.0 12.4 16.8 22.7 19.7
(d) Health
Strongly hampered by health in daily
activities
Hampered by health in daily
activities
Not hampered by health in daily
activities AT 19.0 14.6 10.8 BE 20.6 16.2 13.0 DK 0.0 13.5 14.0 EE 27.2 21.2 16.4 ES 29.8 26.8 19.0 FI 19.0 15.9 13.3 FR 19.6 17.4 11.9 GR 29.8 23.9 18.7 IE 40.9 34.1 16.6 IT 17.7 21.0 17.4 LU 14.1 12.2 8.9 NO 17.4 16.9 15.5 PT 32.2 25.6 15.9 SE 16.8 14.1 13.6
Total 23.04 20.73 15.6 Source: Authors calculations based on EU-SILC 2004

Social Situation Observatory – Social inclusion and Income distribution Draft final report
December 2006 179
Table A4. Two definitions of immigrants: overlap between population groups defined by country of birth
and citizenship
Citizenship
EU Country of residence Other Total
Country of birth EU 63.7 35.9 0.4 100.0 Country of residence 0.3 99.4 0.3 100.0 Other 2.3 41.6 56.1 100.0 Total 2.5 94.6 2.9 100.0
Table A5 Confidence intervals of the poverty ratios of immigrant population groups (a) Country of birth EU Other Lower Upper Lower Upper AT 19.0 20.6 23.7 25.4 BE 17.2 18.7 41.9 43.9 DK 5.1 5.9 15.7 17.0 EE 17.7 19.3 ES 28.8 29.8 36.9 38.0 FI 15.2 16.1 24.5 25.6 FR 16.4 17.5 27.2 28.5 GR 18.8 20.2 28.9 30.4 IE 19.2 20.7 27.2 28.9 IT 22.6 23.3 27.1 27.8 LU 14.0 15.6 36.4 38.5 NO 7.0 8.0 20.0 21.4 PT 20.6 22.1 20.0 21.5 SE 12.8 14.1 23.2 24.8 Note: 95% confidence level
(b) Citizenship EU Other Lower Upper Lower Upper AT 23.8 25.5 26.3 28.1 BE 17.3 18.8 53.7 55.6 DK 5.1 5.9 15.7 17.0 EE 0.0 0.0 19.6 21.3 ES 29.0 30.0 37.6 38.7 FI 20.8 21.9 31.8 33.1 FR 16.8 17.9 44.5 45.9 GR 17.2 18.4 29.7 31.3 IE 20.2 21.7 29.5 31.2 IT 22.0 22.7 32.6 33.4 LU 15.0 16.6 44.2 46.4 NO 6.9 7.8 26.1 27.7 PT 17.1 18.5 21.0 22.5 SE 16.8 18.2 32.6 34.3 Note: 95% confidence level

Social Situation Observatory – Social inclusion and Income distribution Draft final report
December 2006 180
Table A6. Poverty risk among households, probit estimates, including country effects
(1) (2) (3) (4) (5) (6) Coefficients Marginal effects Coefficients Marginal effects Coefficients Marginal effects2 adults, no children, <65 yrs -0.573** -0.091** -0.922** -0.129** -0.585** -0.088** (29.13) (29.13) (23.63) (23.63) (29.33) (29.33) 2 adults, no children, >65 yrs -0.587** -0.083** -0.939** -0.108** -0.685** -0.086** (22.35) (22.35) (21.86) (21.86) (25.57) (25.57) Other hh no children -0.610** -0.089** -1.218** -0.134** -0.767** -0.098** (26.56) (26.56) (19.27) (19.27) (32.37) (32.37) Single parent, 1+ children 0.383** 0.091** -0.091 -0.017 0.366** 0.083** (15.06) (15.06) (1.73) (1.73) (14.21) (14.21) 2 adults, 1 child -0.333** -0.056** -0.887** -0.115** -0.410** -0.063** (15.16) (15.16) (15.34) (15.34) (18.32) (18.32) 2 adults, 2 children -0.127** -0.023** -0.827** -0.113** -0.198** -0.034** (6.21) (6.21) (11.72) (11.72) (9.48) (9.48) 2 adults, 3+ children 0.034 0.007 -0.811** -0.100** 0.037 0.007 (1.31) (1.31) (9.48) (9.48) (1.42) (1.42) Other hh with children -0.209** -0.037** -1.001** -0.114** -0.344** -0.053** (8.46) (8.46) (12.43) (12.43) (13.59) (13.59) WI=0 1.301** 0.381** 1.300** 0.380** 1.279** 0.364** (79.57) (79.57) (79.40) (79.40) (76.82) (76.82) 0<WI<1 0.765** 0.167** 0.759** 0.165** 0.733** 0.153** (54.02) (54.02) (53.48) (53.48) (50.60) (50.60) Hh size, ln 0.507** 0.099** (10.36) (10.36)

Table A.6 cont’ed AT -0.181** -0.030** (5.91) (5.91) BE -0.176** -0.030** (6.13) (6.13) DK -0.569** -0.077** (16.88) (16.88) EE 0.215** 0.045** (7.07) (7.07) ES 0.309** 0.067** (16.01) (16.01) FI -0.269** -0.044** (11.96) (11.96) FR -0.225** -0.037** (9.70) (9.70) GR 0.203** 0.042** (8.11) (8.11) IE 0.143** 0.029** (5.29) (5.29) LU -0.191** -0.032** (5.78) (5.78) NO -0.412** -0.061** (13.11) (13.11) PT 0.333** 0.074** (12.51) (12.51) SE -0.279** -0.044** (9.01) (9.01) Constant -1.404** -1.403** -1.292** (91.77) (91.68) (68.40) Pseudo R2 0.1283 0.1298 0.1532 Observations 87419 87419 87419 87419 87419 87419 Source: Authors calculations based on EU-SILC 2004
Countries include: AT, BE, DK, EE, ES, FI, FR, GR, IE, LU, NO, PT, SE Notes:
Dependent variable: household in poverty, using the 60% of median income as a threshold Absolute value of z statistics in parentheses * indicates that estimates are significant at 5% level; ** significant at 1% level Reference categories: Work Intensity=1 (all working age persons in the household are fully employed) Household type=One adult without children, Country=Italy

Social Situation Observatory – Social inclusion and Income distribution Draft final report
December 2006 182
Fig. 1 a-c Poverty risk among households in specific countries (estimated probabilities)
Probability of being poor (household level)
-0.20
-0.10
0.00
0.10
0.20
0.30
0.40
0.50
0.60
2 adults, nochildren, <65 yrs
2 adults, nochildren, >65 yrs
Other hh nochildren
Single parent,1+ children
2 adults, 1 child 2 adults, 2children
2 adults, 3+children
Other hh withchildren
WI=0 0<WI<1
Mar
gina
l effe
cts
ES FI FR GR
Note: Work intensity: Not a single adult working (WI=0), Not fully working (0<WI<1)
Probability of being poor (household level)
-0.20
-0.10
0.00
0.10
0.20
0.30
0.40
2 adults, nochildren, <65 yrs
2 adults, nochildren, >65 yrs
Other hh nochildren
Single parent,1+ children
2 adults, 1 child 2 adults, 2children
2 adults, 3+children
Other hh withchildren
WI=0 0<WI<1
Mar
gina
l effe
cts
NO PT SE
P ro bability o f being po o r (ho useho ld level)
-0.30
-0.20
-0.10
0.00
0.10
0.20
0.30
0.40
0.50
0.60
0.70
0.80
2 adul ts , no
chi l dr en, <65
yr s
2 adul ts, no
chi l dr en, >65
yr s
Other hh no
chi l dr en
Si ngl e par ent ,
1+ chi l dr en
2 adul ts, 1
chi l d
2 adul ts, 2
chi l dr en
2 adul ts, 3+
chi l dr en
Other hh wi th
chi l dr en
WI=0 0<WI<1
IE IT LU

Social Situation Observatory – Social inclusion and Income distribution Draft final report
December 2006 183
Fig. 2. The risk of poverty among immigrants (defined as citizenship of another country)
0%
10%
20%
30%
40%
50%
60%
AT BE DK EE ES FI FR GR IE IT LU NO PT SE
Pove
rty
rate
EU country outside EU same as country of residenceCitizenship:
Note: * other than the country of residence, if country is an EU member state
Source: Authors calculations based on EU-SILC 2004
Fig. 3. The risk of poverty among immigrants (defined as born in other country)
0%
10%
20%
30%
40%
50%
60%
AT BE DK EE ES FI FR GR IE IT LU NO PT SE
People bor n in an EU countr y* People bor n outside EU People bor n in the countr y
Note: * other than the country of residence, if country is an EU member state
Source: Authors calculations based on EU-SILC 2004

Social Situation Observatory – Social inclusion and Income distribution Draft final report
December 2006 184
8. NON-INCOME MEASURES OF DEPRIVATION60
Introduction
As is well documented, monetary income, however defined, is liable to be an incomplete and,
therefore, not fully satisfactory measure of living standards and, accordingly, of the risk of
social exclusion. This is recognised by the compilation of a range of indicators (launched by the
Laeken Council at the end of 2001) to monitor social inclusion across EU Member States rather
than relying solely on income as a measure of deprivation or, more specifically, of relative
poverty. Nevertheless, although these indicators include other aspects of living conditions –
employment status, especially – they are still very much focused on disposable income, defined
moreover in relative rather than absolute terms. The potential shortcomings of income as a
measure of deprivation, however – the fact, for example, that it ignores accumulated wealth and
its effect on living standards, non-monetary benefits of various kinds, the scale of largely
unavoidable costs, such as for housing or for childcare and so on – have raised questions about
its adequacy for this purpose.
These questions have been given added weight by the entry into the EU of Central and Eastern
European countries with much lower levels of income per head. This is not least the case
because according to the measure of poverty which is the main focus of policy attention – ie the
relative number of people in each country with income below 60% of the national median on an
equivalised basis - their entry has not only failed to increase this but has served to reduce it
slightly. Because the new Member States, therefore, have, on average at least, a more equal
distribution of income than in the EU15 and accordingly a smaller proportion of people with
income below the poverty line as defined, the effect of their entry has been to lower the relative
number of people considered to be at risk of poverty in the EU as a whole by the measure used.
Accordingly, the fact that average income per head in the new Member States, even measured
in purchasing power parity terms, is in many of the countries concerned only around half or
less of the level in the EU15 does not enter the assessment of the risk of poverty at all and,
indeed, is irrelevant in this regard. The entry of Bulgaria and Romania, which have average
levels of income of only around a third of the EU average will also leave the aggregate indicator
of poverty risk largely unchanged since in both countries, the proportion of the population with
income of under 60% of the median does not differ significantly from the EU average (in
Bulgaria, it is about the same, in Romania, only marginally higher according to the latest
estimates).
60 Mayya Hristova and Terry Ward (Applica)

Social Situation Observatory – Social inclusion and Income distribution Draft final report
December 2006 185
This is not to criticise the indicator as such, but simply to highlight the limitations of a relative
measure of income distribution which focuses on those with low income as compared with the
average in the country in which they live. While the measure may give an indication of the
extent of inequalities in a particular society and of the proportion of people whose income falls
below what is deemed to be a critical level in relation to people in general, it says nothing about
their standard of living as such or about how this compares with that of people elsewhere in the
EU. This limitation has prompted growing interest in the development of other indicators which
throw light on these latter aspects which are not without relevance for policy at EU-level.
Measures of deprivation
There are a number of possible options for indicators which give an insight into t absolute
poverty or deprivation in different parts of the EEU. One is a direct measure of the income
required in different parts of the EU to achieve an acceptable standard of living, which avoids
people going hungry or not being able to afford essentials. This, however, is difficult to define,
especially given the differences in climate, consumption patterns and so on which exist across
the EU.
Another is to retain a relative approach but to relate incomes to median income at the EU rather
than the national level, expressing income in terms of purchasing power parities rather than
euros or national currencies. The level of income chosen as the poverty threshold could in this
case reflect what is regarded as a minimum acceptable level.
While this seems less problematic than the first option, it still requires a judicious choice of the
poverty threshold and it is does not entirely avoid the difficulties of accounting for variations in
local circumstances. Although measuring income in purchasing power standard (PPS) – or parity
- terms is intended to take account of such variations, it does so only to the extent that they
are reflected in the relative price levels of a common basket of goods and services and it cannot
easily allow adequately for significant differences in the composition of such a basket in terms
of the goods and services which are required to provide an adequate, or acceptable, standard of
living. PPS corrections, therefore, are inevitably approximate. This is even more the case in
relation to measuring different income levels in different regions of the EU and not just
different countries, given the often wide differences which exist in prices (especially for
housing) as well as patterns of consumption within Member States as well as between them.
A third option is to try to measure deprivation directly through collecting information about
relevant aspects of living conditions by means of surveys. This is an approach advocated, for
example, by Atkinson, Cantillon, Marlier and Nolan (2005) in their report produced in 2005
under the Luxembourg Presidency of the EU on Taking forward the EU social inclusion process,

Social Situation Observatory – Social inclusion and Income distribution Draft final report
December 2006 186
as a follow-up to their report to the Belgian Presidency in 2001 (Atkinson, Cantillon, Marlier
and Nolan, 2001) which was the basis for the compilation of the ‘Laeken’ indicators at present
being used to monitor social inclusion across the Union. Their suggestion is to use a range of
indicators bearing on living and housing conditions as well as on the financial circumstances of
households which would reflect the multi-dimensional nature of deprivation as well as
supplementing the use of income as an indicator and so help to take account of instances
where this gives a misleading impression of living standards. It would equally help to identify,
at least in terms of their characteristics, those recorded as being at risk of poverty on the
existing measure who suffer most from deprivation and are in most need of assistance, so
informing the formulation of policy.
This suggestion follows extensive literature on the concept and measurement of material
deprivation, which was initiated by Townsend some 27 years ago (Townsend, 1979), who
interpreted deprivation In the wide sense of not being able to live a decent life. The concept has
been subsequently refined to refer to not having adequate resources to lead a minimum
acceptable way of life in the country in the question (Callan et al., 1993; Nolan and Whelan,
1996; Kangas and Ritakallio, 1998; Layte et al. 2001; Whelan et al. 2002; Perry, 2002) or,
alternatively, to lack the necessities which society regards as essential (Bradshaw and Finch,
2003; Nolan and Whelan, 1996).
The focus of studies has been not only on trying to measure material deprivation so defined –
starting from Townsend who based his analysis on 60 different aspects of living standards – but
on identifying the goods and services which should be included in the measurement and the
relative importance to be given to subsets of them. A number of criteria have been proposed to
determine what should be incorporated, including their relevance in terms of capturing the
disadvantage suffered by not being able to afford the item in question or living under particular
conditions(Townsend, 1988); their clarity in distinguishing between individual preferences and
deprivation stemming from a lack of resources as such; and their comparability across
countries, in the sense that the deprivation concerned is equally relevant in the different
countries being considered.
A number of empirical studies of material deprivation have been undertaken in the EU as well as
in other developed countries in recent years (see (Boarini and Mira d’Ercole, 2006, for a
summary of these). Two findings of these are of particular relevance:
- across all OECD countries, an aggregate measure of the relative numbers suffering
material deprivation is only weakly related to measures of relative income poverty but is
more closely related to GDP per head. If the analysis is limited, however, to the more
prosperous countries, the reverse is the case;

Social Situation Observatory – Social inclusion and Income distribution Draft final report
December 2006 187
- longitudinal data which track the circumstances of households over a number of years
indicate that deprivation tends to persist over prolonged periods of time.
The implication of the first is that an analysis of material deprivation across the enlarged EU is
not only likely to give different general results than one across the EU15 but might well be
more useful in reflecting the effect of absolute, rather than relative, income levels on living
standards. In other words, the value of a measure of material deprivation is enhanced if it does
not simply replicate the conclusions which can be drawn from measures of relative income
levels.
The implication of the second is that a measure of material deprivation is all the more useful in
a context where longitudinal data are not available to monitor the position of individuals over
time. In other words, an indicator of this kind is particularly useful in the period before data
from the EU-SILC covering a number of years for selected households become available.
A recent Statistics in Focus produced by Eurostat at the end of 2005 (Material deprivation in the EU) came to conclusions which were broadly in line with these findings. The study, based on
data from the ECHP for EU15 Member States and for 6 of these countries on preliminary data
for 2003 from the EU-SILC, covered three aspects of material deprivation – access to household
durables, specifically a car, colour TV and telephone; financial strain in terms of not being able
to afford certain things, such as an annual holiday, and being in arrears on payments; and
housing conditions.
A main finding was that while there was some overlap between having an income below the
poverty line and being materially deprived (defined in terms of reporting not being able to
afford at least two of the household durables and/or things included in the ‘financial strain’
list), in most of the countries (ie most of which had relatively high average levels of income per
head), only a small minority of those with a poverty level of income reported being deprived.
Significantly, however, in three of the four southern Member States, Greece, Spain and Portugal,
the three countries with the lowest levels of income per head in PPS terms in the EU15, a large
majority of those with income below the poverty line reported being deprived. Moreover, the
relative number concerned was larger in Greece and Portugal, where income per head was the
lowest in the EU,15, than in Spain, where income was somewhat higher.
Equally significantly, a substantial proportion of those in these two countries who were
recorded as not having a poverty level of income reported being deprived as defined in the
study. This was particularly the case in Portugal, where some 35% of the population are
estimated to fall into this category (25% in Greece, 20% in Spain), which meant that together
with those with income below the poverty line who were deprived, over half of the population

Social Situation Observatory – Social inclusion and Income distribution Draft final report
December 2006 188
are estimated to experience material deprivation. By contrast, in the Netherlands and
Luxembourg, with much higher levels of income per head, the figure was only 4-5%.
Although Portugal, along with Greece and Spain, also has a significantly larger proportion of
people with (relative) poverty levels of income – ie below 60% of the national median – than the
Netherlands or Luxembourg, a deprivation indicator seems to provide an additional dimension
to the assessment of living standards and the potential extent of social exclusion.
The concern here is to extend the analysis in the Statistics in Focus in a number of ways:
- it covers the 14 countries included in the EU-SILC for 2004, which means the 6 EU15
countries covered on the basis of the preliminary 2003 EU-SILC plus 6 others, making 12
EU15 countries in all (all apart from Germany, the Netherlands and the UK), plus a new
Member State, Estonia, and Norway (which though not an EU Member State is included
here for the sake of comparison – and to have a larger number of countries to include in
the analysis);
- it focuses explicitly on the relationship between the indicators of financial strain and
housing conditions which are used as measures of material deprivation and average
disposable income per head in the countries covered as well as their relationship with
relative poverty and income distribution in these countries – the latter examined across
the whole range and not just at the bottom end of the scale. The intention, therefore, is to
see how far these indicators provide an insight into the effect of differences in absolute
measures of income as well as relative ones;
- in so doing, it attempts to assess the relative value, or relevance, of the different
measures of financial strain and housing conditions on which data are collected by the
EU-SILC as indicators of deprivation in order to determine which of them might most
usefully included in an aggregate index. This contrasts with the Statistics in Focus
approach which tends to treat each measure as of equal value to one another – ie they are
effectively given equal weight in the construction of an aggregate index. Since, however,
as indicated below, the measures seem to differ significantly in the results they show, a
simple approach of assigning equal weights is liable to lead to misleading results – or at
least, results which are not as clear-cut as they might be through an informed choice of
what to include in an aggregate indicator;
- it examines environmental aspects, in addition to measures of financial strain and
housing conditions, particular, noise, pollution and crime or vandalism, to see how far
material deprivation goes together with living in a neighbourhood affected by problems of
this kind.

Social Situation Observatory – Social inclusion and Income distribution Draft final report
December 2006 189
The analysis, however, does not cover differences between households in their ability to afford
particular durable goods (specifically, a TV, car or telephone), partly in order to limit the
analysis, partly because of doubts about how far the goods in question are reliable indicators
of deprivation given the potentially low cost of these items if bought second-hand.
The analysis, in addition, is conducted solely at a household level and no account is taken of
differences in the characteristics of households in terms of their composition (ie whether they
consist of someone living alone, of a couple with children, of couple with out children and so
on). The income of households, however, is equivalised to take explicit account of differences
in their size and composition.
It should be noted that household characteristics have been included in a study on material
deprivation also based on the new EU-SILC data carried by Anne-Catherine Guio and Isabelle
Engsted Maquet at the same time as the present study was being undertaken (Guio and Maquet,
2006). Among other issues, this considers specifically the position of households with children.
In addition, it examines the relative value of the various measures in more detail through the
use of factor analysis and correlates the indicators derived with relative poverty. The results of
the present analysis are broadly consistent with the findings of this study.
The results
INDICATORS OF FINANCIAL STRAIN
Variations across countries
The SILC includes a number of indicators of the financial strain on households, specifically
whether they are in arrears in paying housing costs, utility bills or hire purchase or similar
instalments, their ability to afford a one week’s annual holiday and a meal of meat or fish (or
the vegetarian equivalent) every other day and to make ends meet and their capacity to cope
with unexpected financial expenses. The concern here is to examine how the proportion of
households reporting financial strains in these terms varies, first, between the countries
covered and, secondly, between households within countries. In both cases, the primary aim is
to see how far these variations are in line with differences in disposable income in order to
determine the extent to which the measure concerned reflects such differences.
The proportion of households reporting having arrears on rent or mortgage payment varies
from only 2% in Denmark, Luxembourg and Austria to 11% in Italy. While the proportion is
slightly larger in Greece (9%) than average, it is not much different from elsewhere in Portugal
(7%) or Estonia (6%), so that only a weak relationship is evident between this proportion and the

Social Situation Observatory – Social inclusion and Income distribution Draft final report
December 2006 190
level of income per head across countries (Fig. 1, in which the countries, except for Norway, are
ranked in terms of the average disposable income per head – or, more accurately, equivalised
head measured in purchasing power parity terms).
0
2
4
6
8
10
12
14
16
18
20
22
24
26
LU AT DK BE FR IE FI SE IT ES EL PT EE NO0
2
4
6
8
10
12
14
16
18
20
22
24
26
Arrears on mortgage or rent payments
Arrears on utility bills% of households
Fig. 1 Arrears on mortgage or rent payments and utility bills
Source: EUSILC XUDB 2004 - version of February 2006
There is more variation in the relative number of households reporting being behind on
payments of utility bills, which ranges from 2% in Austria and 3% in Denmark to 25% in Greece.
Since the figure for Estonia is 14%, there is also more evidence of a variation with income levels,
though this is far from being systematic since the figure for Portugal is only 5% and for Spain
4%. The proportion in arrears on hire purchase and other instalments (not shown in the graph)
is also relatively large in Greece (11%) and Estonia (9%) but it is equally large in Austria (11%)
and even higher in Italy (14%), so does not seem to add much to the overall picture shown by
the other two measures.
There is a considerably more variation in the ability to afford one week’s holiday a year and a
much more systematic relationship between this and income levels across countries. The
proportion reporting not being able to do so ranges from only just over 10% in Luxembourg
and Denmark to 41% in Spain, 50% in Greece, 61% in Portugal and as much as 73% in Estonia
(Fig. 2, in which countries are again ranked, as throughout the present analysis, by average
disposable income per head in PPP terms). This suggests that this is a reasonable indicator of
relative levels of purchasing power in different countries, at least in broad terms. The main
exceptions to the relationship are the Nordic countries and Ireland, in each of which the
proportion unable to afford an annual holiday is lower than the average relationship suggests.

Social Situation Observatory – Social inclusion and Income distribution Draft final report
December 2006 191
0
10
20
30
40
50
60
70
80
LU AT DK BE FR IE FI SE IT ES EL PT EE NO0
10
20
30
40
50
60
70
80
Capacity to afford paying for one week annual holiday away from home
Capacity to afford a meal with meat, chicken, fish (or vegetarian equivalent) every second day% of households
Fig. 2 Capacity to afford paying for one week annual holiday away from home and to afford a meal with meat, chicken, fish (or vegetarian equivalent) every second day
Source: EUSILC XUDB 2004 - version of February 2006
The capacity to afford a meal with meat or fish every other day also varies across countries but
far less so – from 2%% being unable to do so in Denmark and Luxembourg but also in Spain to
10% in Greece but also in Austria and to 20% in Estonia. It is also only weakly related to income
levels. Indeed, the fact that Estonia is the only country falling above a comparatively narrow
range suggests that the relationship may not be continuous and that it is perhaps only when
income falls below a particular level that households have problems in affording to eat properly
at least every other day.
The capacity to meet unexpected financial costs varies more across countries but in a way
which is not altogether in line with income levels. The proportion of households reporting such
a capacity, therefore, ranges from 89% in Luxembourg and Estonia to 61% in Greece and Spain,
with the proportion in Portugal (79%) being marginally larger than that in Austria (78%) (Fig. 3).
This raises a serious questionmark over the use of this variable as an indicator of financial
hardship, at least between countries, and suggests perhaps that countries vary in terms of the
ability of people to make do with having a relatively low level of income or the extent of
precautions they take to avoid financial problems – such as, for example, going without an
annual holiday. Accordingly, it perhaps tells us more about these characteristics than about
financial strain as such.
Similar arguments apply to the ability to make ends meet, which while it might reflect the
purchasing power which households have access to also reflects they capacity to manage the
resources they have at their disposable. Although, therefore, the proportion of households
reporting great difficulty in making ends meet is largest in Portugal and Greece (15-16%), as
well as Italy, it is smallest in Estonia together with Luxembourg (2%) (Table 1). At the other end
of the scale, very few households in most countries report being able to make ends meet very
easily (the proportion is over 15% only in Denmark and Luxembourg), reflecting perhaps a

Social Situation Observatory – Social inclusion and Income distribution Draft final report
December 2006 192
natural reluctance to admit to this. However, the relative number reporting that they can do so
either easily or very easily varies relatively closely with income levels – from 63% in Denmark to
only 7-8% in Estonia and Portugal, as well as Italy – suggesting that this end of the scale is
perhaps a more relevant indicator than the other.
0
10
20
30
40
50
60
70
80
90
100
LU AT DK BE FR IE FI SE IT ES EL PT EE NO0
10
20
30
40
50
60
70
80
90
100% of households
Fig. 3 Capacity to face unexpected financial expenses
Source: EUSILC XUDB 2004 - version of February 2006
Variations within countries
Most of the potential indicators of financial strain examined above show a significant variation
with the disposable income of households within countries. This applies both in broad terms to
households with income above and below the poverty line and to those at different points on
the income distribution curve. The extent of the variation, however, differs between the
indicators, implying that some are better than others in revealing financial hardship. At the
same time, there are also differences in the extent of variation of individual indicators with
income levels across countries, which complicates the choice of variable to focus on.
In the case of payment of rent or mortgage or of utility bills, the proportion of households with
income below the poverty line reporting being behind with payments is larger than for those
with income above the line in all countries, as it is for arrears on payments of hire purchase in
all except Greece. This is especially the case for the first two items in France and Italy; for
housing costs but less so for utility bills, in Spain and Ireland, and for utility bills, but less so
for housing costs, in Estonia and Greece (Table 2). Arrears on hire purchase or similar payments
show a different picture with the gap between the proportion of households below the poverty
line reporting being behind on payments and the proportion above being especially wide in
Italy, Austria, Portugal and Finland (wider than for the other two items) and comparatively
narrow in most of he other countries. This suggests that evidence of financial strain may not be
satisfactorily captured by looking at one of these indicators alone.

Social Situation Observatory – Social inclusion and Income distribution Draft final report
December 2006 193
The capacity to afford an annual holiday shows an even greater variation between households
with income above and below the poverty line, with a considerably larger proportion of
households below the line being unable to meet this expense than above in all countries, with
the sole exception of Denmark, where the gap is only 10 percentage points. Here, less than 20%
of households with poverty levels of income are unable to afford this, whereas in Greece and
Portugal, the proportion exceeds 80% and in Estonia, 90%. In the last, it is also the case that
two-thirds of households with income above the poverty line report not being able to afford a
holiday and In Portugal, some 55%.
The capacity to afford a meal of meat or fish at least every other day shows much less variation
between the two groups of households. Although in Estonia, 40% of households below the
poverty line report not being able to do so as against only 14% above the line, in Portugal, the
proportion falling into the first category is just 11%, only 8 percentage points larger than for
those above the line and in Spain, it is 5%, just 3 percentage points above the figure for those
above the line.
As in the case of the ability to afford a holiday, the proportion of households with poverty
income levels who report not being able to meet unexpected financial expenses is substantially
larger in most countries than the proportion with higher income so reporting. This contrasts
with the lack of any systematic variation between this indicator and income levels across
countries. In 9 of the 13 countries, therefore, the difference between the two proportions was
around 25 percentage points or more, with the proportion of households below the poverty line
unable to meet such expenses exceeding 50% in 6 of them. Nevertheless, in Estonia, although
the difference between the two household groups is some 20 percentage points, only around a
quarter of households with poverty income levels report being in this position.
The ability to make ends meets also differs significantly between households above and below
the poverty line in all cases, though countries vary as to whether the ease or the difficulty of
doing so gives the greater distinction between the two groups. In the lower income countries,
however, it is invariably the proportion reporting difficulties which shows the largest difference,
mainly because only a relatively few households even with income above the poverty line report
being able to do so easily (Table 3). In a number of the higher income countries, the reverse is
the case, with relatively few households with low incomes reporting difficulties (under 25% in
the three Nordic countries and Luxembourg).
Whereas, therefore, for comparisons across countries, the ease of making ends meet seems to
show up inter-country differences more markedly, this is not the case for comparisons within
countries where the difficulty of so doing appears to give the most differentiated results.

Social Situation Observatory – Social inclusion and Income distribution Draft final report
December 2006 194
More disaggregated data show that the extent of financial strain as indicated by the range of
aspects covered in the EU-SILC varies in a continuous way with income. The proportion of
households in the top quintile of income distribution (ie the 20% with the highest levels of
disposable income in equivalised terms) reporting financial difficulties on almost all of the
measures is generally smaller than in the second quintile (the next 20%), which in turn is
generally smaller than in the third quintile and so on, with the proportion in the bottom quintile
being largest of all in nearly all cases (Figs 4-6 and Tables 4 and 5).
This is less so, however, for arrears on hire purchase or similar instalments than for arrears on
housing costs or utility bills. In Greece and Estonia, therefore, the proportion reporting being
behind in paying such instalments was larger for households in the third quintile than in the
first two. Moreover, although the capacity to afford a decent meal every other day varies with
income, the extent of the variation, as implied above, is relatively small in most countries, the
exception being Estonia, in particular, though also Greece, France and Austria.
THE FINANCIAL BURDEN IMPOSED BY HOUSING AND DEBT REPAYMENTS
The EU-SILC, like the ECHP before it, also contains information on the extent to which the costs
of housing and hire purchase and loan repayments represent a financial burden on households,
which potentially provides a further insight into the financial difficulties experienced by
households in different countries with differing levels of income. This, however, is arguably less
directly linked to deprivation or financial hardship than most of the indicators discussed above,
being affected not only by the purchasing power which households have at their disposal but
also by lifestyles and attitudes to debt, the ease or difficulty of borrowing, and by the level of
rents or mortgages as such, which varies both between countries and between regions and local
areas within countries. (It is equally affected, of course, by individual interpretations of the
concept of ‘burden’, though this also applies to the ease or difficulty of making ends meet
examined above.)
The survey responses on this issue bear this out. The proportion of households considering
that both housing costs and debt repayments impose a heavy burden is larger in Luxembourg
than in Greece and in Spain and Italy than in Estonia, while a significant proportion of
households in the top quintile express the same view in a number of countries, most especially
in Belgium (just under 20%), Spain (almost 30% in respect of housing costs and almost 40% in
respect of loan repayments) and Italy (around a third in respect of both) (Table 6). Accordingly,
it is not clear that these results add to our understanding of the extent of financial hardship
across the EU.

Social Situation Observatory – Social inclusion and Income distribution Draft final report
December 2006 195
0
3
5
8
10
13
15
18
20
23
25
LU AT DK BE FR IE FI SE IT ES EL PT EE0
3
5
8
10
13
15
18
20
23
25
1st Quintile 2nd Quintile 3rd Quintile 4th Quintile 5th Quintile% of households
Fig. 4
Number of households, by income quintile, reporting arrears on mortgage or rent payments
Source: EU-SILC XUDB 2004 - version of February 2006
0
10
20
30
40
50
60
70
80
90
100
LU AT DK BE FR IE FI SE IT ES EL PT EE0
10
20
30
40
50
60
70
80
90
100
1st Quintile 2nd Quintile 3rd Quintile 4th Quintile 5th Quintile% of households
Fig. 5 Number of households, by income quintile, unable to afford one week's annual holiday away from home
Source: EU-SILC XUDB 2004 - version of February 2006
0
10
20
30
40
50
60
70
LU AT DK BE FR IE FI SE IT ES EL PT EE0
10
20
30
40
50
60
70
1st Quintile 2nd Quintile 3rd Quintile 4th Quintile 5th Quintile% of households
Fig. 6
Number of households, by income quintile, unable to face unexpected financial expences
Source: EU-SILC XUDB 2004 - version of February 2006

Social Situation Observatory – Social inclusion and Income distribution Draft final report
December 2006 196
INDICATORS OF HOUSING CONDITIONS
The conditions in which people live are an important aspect of their living standards and a
significant indicator of deprivation and social exclusion. While the state of the housing which
people occupy tends to reflect their relative levels of income, this is not necessarily the case if
income, measured on an annual basis, fails to reflect accumulated wealth or purchasing power,
and/or differences across countries in absolute income levels, as well as in the cost and
availability of decent housing. The inclusion of housing conditions in addition to income in any
overall assessment of living standards or the extent of deprivation is, therefore, of importance.
This is all the more the case since those experiencing the most severe housing problems, those
who are homeless, will not typically be included in the households surveys from which
information on poverty and deprivation are derived for the simple reason that the people
concerned do not live in households as such. The indicator used to measure relative poverty
across the EU, therefore, understates the proportion of people with income below the poverty
line to the extent that the homeless are excluded – as are people, mainly the elderly, living in
communal housing, such as nursing homes, which is liable to add to the degree of
underestimation. The scale of the understatement is difficult to assess from the data on
homelessness available. Although national surveys and enquiries exist, it tends to be difficult to
assess the quality of the data collected and even more so their comparability across countries.
There is, accordingly, a need – as pointed out in Atkinson et al (op. cit.) – for harmonised data
on this issue and the construction of a suitable indicator on the proportion of the population
affected in different countries to supplement the indicators derived from household surveys.
Nevertheless, despite the exclusion of this important socially excluded section of the
population, data collected by the EU-SILC enables housing conditions for those who are covered
to be taken into account alongside household income. The survey, therefore, includes questions
on the physical state of housing – whether the roof leaks, the walls are damp or the window
frames or floors are rotten – the ability to keep the house warm (which partly reflects financial
resources and fuel costs but also how far the heating system and the state of the house
facilitates this), and whether it has a bath or shower and an indoor flushing toilet (for the
exclusive use of the household concerned).
Variations across countries
The proportion of households reporting housing with a leaking roof, damp walls and so on
varies from 31% in Estonia and 24% in Portugal to only 5% in Finland and Sweden. It,
accordingly, shows some tendency to vary with income levels, though the latter two countries,
along with Denmark and Norway, have significantly smaller proportions indicating such

Social Situation Observatory – Social inclusion and Income distribution Draft final report
December 2006 197
problems than a number of other countries with similar or higher income levels, such as
Luxembourg, France or Belgium (14-15% in each case) (Fig. 7).
0
5
10
15
20
25
30
35
40
LU AT DK BE FR IE FI SE IT ES EL PT EE NO0
5
10
15
20
25
30
35
40% of households
Fig. 7 Number of fouseholds with leaking roofs, damp walls/floors/foundation, or rot in window frames or floor
Source: EUSILC XUDB 2004 - version of February 2006
The proportion reporting difficulties in keeping the house warm, by contrast, shows relatively
little variation across countries. Apart from Greece, France and, above all, Portugal (42%), only
around 10% or fewer households in every country, including Estonia, indicate such problems.
This is even more the case for baths and indoor flushing toilets, hardly any households in all
the countries except one not having access to such basic amenities. The exception is Estonia,
where some 22% of all households do not have access to a bath or shower and 19% to an indoor
flushing toilet. This suggests that in the EU15 countries at least, the inclusion of this indicator
would add very little to an assessment of deprivation, but that perhaps in the enlarged Union
and in the new Member States, especially – to the extent that Estonia is at all representative of
the situation in these – it is relevant.
Data from the European Foundation’s Quality of Life Survey (cited in the Eurostat Statistics in Focus referred to above) suggest that Estonia is not alone in these respects, but that the lack of
an indoor flushing toilet is relatively widespread as well in Latvia (affecting 20% of households),
Lithuania (25%) and, to a lesser extent, Poland (115), and even more so in Bulgaria (30%) and
Romania (39%). Problems with leaking roofs, damp walls and so, seem equally widespread.
Variations within countries
As indicated above, even among households with income below the poverty line, very few do
not have access to a bath, shower or indoor toilet in most EU15 countries. The largest numbers
are in Greece and Portugal, as might be expected, but even here only around 10% of
households with poverty level incomes do not have such basic amenities. In Estonia, however, a

Social Situation Observatory – Social inclusion and Income distribution Draft final report
December 2006 198
third of households with income below the poverty line do not have a bath or shower for the
exclusive use of household members and 29% do not have an indoor flushing toilet. Even
among households further up the income scale, the proportion lacking these amenities is
significant – over 20% for those in the third quintile and over 15% for those in the fourth (Fig. 8
and Table 7).
0
5
10
15
20
25
30
35
40
Estonia Portugal Greece0
5
10
15
20
25
30
35
40
No bath or shower No indoor flushing toilet% of households
Fig. 8 Number of households, by income quintile, with no bath or shower/no indoor flushing toilet in the dwelling - Estonia, Portugal and Greece
From left to right: 1st, 2nd, 3rd, 4th and 5th income quintile Source: EU-SILC XUDB 2004 - version of February 2006
The situation in Estonia in this respect seems to be repeated in a number of the new Member
States with relatively low income levels. According to the European Foundation, Quality of life
survey cited above (Social dimensions of housing), carried out in 2003-2004 and published in
2006, 45% of households in the bottom quartile of income distribution in Lithuania, and 31% in
Latvia do not have an indoor flushing toilet (the figure reported for Estonia is 21%), and this is
also the case for 17% of such households in Hungary and 16% in Poland. The proportions for
lower income households are even higher in Bulgaria (55% of those in the bottom quartile) and
Romania (63%). In the latter, the figure was also significant (20%) even for households in the top
quartile.
There is more widespread variation with income in the relative number of households reporting
problems of leaking roofs, damp walls and so on, including in the EU15 countries. The extent of
variation between those above the poverty line and those below, however, is relatively small in
many countries. Only in Greece, Italy and Estonia does the difference in the proportion between
the two groups of households reporting such problems exceed 10 percentage points, and in
the last two countries, as well as in Portugal, the proportion of those above the poverty line
with problems of this kind is over 20% (Fig. 9).

Social Situation Observatory – Social inclusion and Income distribution Draft final report
December 2006 199
0
5
10
15
20
25
30
35
40
45
LU AT DK BE FR IE FI SE IT ES EL PT EE NO0
5
10
15
20
25
30
35
40
45
below the poverty line above the poverty line% of households
Fig. 9 Number of households, below and above the poverty line, with leaking roofs, damp walls/floors/foundation, or rot in window frames or floor
Source: EUSILC XUDB 2004 - version of February 2006
A more disaggregated breakdown of households shows that while the proportion reporting
housing defects tends to decline as income rises in all countries – with the partial exception of
Portugal, where the proportion is higher for households in the next but bottom quintile ranked
by income than for those in the bottom one – the extent to which this occurs is again small in
most cases (Table 8). In a number of countries, therefore, especially in those with relatively high
levels of income per head, there is little if any difference in the proportion with such problems
between households in the top three quintiles (ie those among the top 60% ranked by income).
This is the case in all three Nordic countries as well as Luxembourg and Austria. By contrast, in
the lower income countries, there tends to be a more pronounced difference. Nevertheless,
there is still a questionmark over how far these data can be used as an indicator of deprivation,
in the light not only of the pattern of variation in the households reporting problems but also of
the fact that even in countries which are not among those with the lowest income levels, such
as France, Ireland, Italy and Luxembourg, 10% or more of the households in the top income
quintile – the 20% most prosperous in the country – report such problems.
Environmental factors
Data from the EU-SILC also enable environmental problems affecting households to be
examined, specifically the extent to which they are subject to excessive noise either from
neighbours or from the street, pollution or grime, or crime, violence or vandalism. Such
problem would exacerbate those which arise from low levels of income or the other aspects of
deprivation considered above.
In practice, there is little sign of any systematic variation across countries in the proportion of
households reporting problems of noise in the area they live and income levels. The proportion
concerned is much the same – between 23% and 26% - in Belgium, France, Italy, Luxembourg

Social Situation Observatory – Social inclusion and Income distribution Draft final report
December 2006 200
and Austria as well as in Spain and Portugal and larger than in Greece (19%). Only Estonia (51%)
stands out as having a substantially larger proportion of households with this problem (Fig. 10).
0
5
10
15
20
25
30
35
40
45
50
55
LU AT DK BE FR IE FI SE IT ES EL PT EE NO0
5
10
15
20
25
30
35
40
45
50
55
Noise from neighbours or from the streetPollution, grime or other environmental problemsCrime violance or vandalism in the area% of households
Fig. 10 Number of households reporting problems with noise, pollution and crime
Source: EUSILC XUDB 2004 - version of February 2006
Much the same is the case for the proportion of households reporting pollution or grime in the
area caused by traffic or industry. Although this is again much larger in Estonia (40%) than in
other countries, there is comparatively little difference in the proportion between many of the
other countries. It is very similar in Luxembourg as in Portugal (19-20%) and larger than in
Greece or Spain (15-16%). At the same time, the proportion is smaller in Denmark and Sweden
(6-7%) than elsewhere, which is not unexpected.
The proportion of households reporting crime, violence or vandalism in the area is also larger
in Estonia than in the other countries (27%), but elsewhere it does not seem to reflect income
levels in any systematic way. It is relatively large in Belgium and France (20% or more) and
smallest of all in Greece (8%).
Equally, there is little evidence of any relationship between these various problems and income
levels within countries. The proportion of households with income below the poverty line
reporting problems of noise is more than 4 percentage larger than for those above the line only
in Denmark and Luxembourg and in Greece and Portugal, the reverse is the case with noise
being more of a problem for households above the line than for those below. The same is also
true in the latter two countries in respect of both pollution or grime and crime or vandalism.
Indeed, for both of these kinds of problem, only in Denmark and Luxembourg – though in the
latter only for pollution – do significantly more households with poverty income levels report
their existence than others.
The absence of any clear tendency for problem of noise, pollution or crime to decline with
income in most countries is confirmed by more disaggregated data. Only in Denmark is such a

Social Situation Observatory – Social inclusion and Income distribution Draft final report
December 2006 201
tendency evident in respect of all three kinds of problem and in most cases, the proportion of
households reporting such problems does not vary systematically across income quintiles (Fig.
11 and Table 9). Moreover, in Greece, Portugal and to a lesser extent in Spain, the tendency
goes in the opposite direction, with more households in the upper quintiles reporting problems
than those in the lower ones.
0
5
10
15
20
25
30
35
40
45
LU AT DK BE FR IE FI SE IT ES EL PT EE0
5
10
15
20
25
30
35
40
45
1st Quintile 2nd Quintile 3rd Quintile 4th Quintile 5th Quintile% of households
Fig. 11 Number of households, by income quintile, reporting problems wth polluation, grime or other environmental problems
Source: EU-SILC XUDB 2004 - version of February 2006
The latter may reflect a tendency perhaps for more prosperous households to be more
conscious of such problems than poorer ones or, at least, to perceive them as being more
acute, which is a general difficulty of making comparisons of subjective views of reality between
individuals. It tends to be even more of a problem if they live in different places – in rural areas
as opposed to inner city ones, for example – where attitudes towards noise, pollution or even
crime may differ because of differing experiences and norms. The difficulty might be greater
again if the people concerned live in different countries.
In sum, therefore, it is not evident what conclusions can be drawn from the above analysis,
other than that the extent of the environmental problems considered seem to be more country
specific than related to income, and it is hard to assess how far they reflect genuine differences
in living conditions.
Concluding remarks
Much of the analysis above of financial strains seems to support the use of other indicators of
living standards and the risk of deprivation or social exclusion to supplement those based on
relative household income. This is particularly the case if the concern is with absolute problems
rather than relative ones. From the examination of potential candidates, some appear more
promising than others – the ability to afford an annual holiday, for example, more than a decent

Social Situation Observatory – Social inclusion and Income distribution Draft final report
December 2006 202
meal or being in arrears in paying rent, mortgage or utility bills more than in paying hire
purchase instalments.
On the other hand, the use of indicators of housing conditions seems to be capable of
providing little insight into deprivation in most of the EU15 countries but appears to be more
relevant in an enlarged Union to identify problems in the new Member States, where a
significant number of households still lack basic amenities and where surveys suggest that the
housing stock is badly in need of repair and renovation.
Similarly, indicators of environmental problems based on individual perceptions seem to be of
questionable use for assessing the real extent of these and their effect on standards of living.
Nevertheless, a final assessment of the usefulness of the various indicators in this context has
to await until a complete set of data from the EU-SILC become available for all Member States.

Social Situation Observatory – Social inclusion and Income distribution Draft final report
December 2006 203
Table 1. Ability to make ends meet
with great difficulty
with difficulty
with some difficulty
fairly easily easily very easily
BE 8 12 21 28 26 5DK 4 5 10 20 42 21EE 2 16 29 46 6 1EL 15 31 25 16 11 2ES 11 17 32 28 11 1FR 6 12 16 29 32 4IE 8 16 29 33 10 4IT 15 19 40 19 6 1LU 2 4 12 27 38 16AT 4 7 26 34 22 7PT 16 21 37 18 7 1FI 3 7 20 37 20 13SE 4 7 22 36 17 15NO 3 6 15 38 25 13
Source: EU-SILC XUDB 2004 - version of February 2006
Ability to make ends meet
% of households

Social Situation Observatory – Social inclusion and Income distribution Draft final report
December 2006 204
Table 2. Selected indicators of financial strains for households below and above the poverty line
Arrears on mortgage or rent
payments
Arrears on utility bills
Arrears on hire purchase
instalments or other loan payments
Lack of capacity to afford paying for one week annual holiday away from
home
Lack of capacity to afford a meal with meat, chicken, fish
(or vegetarian equivalent) every
second day
Lack of capacity to face unexpected
financial expenses
below poverty line 13 12 8 55 14 56above poverty line 4 4 3 25 4 25below poverty line 7 8 8 19 6 34above poverty line 2 2 3 9 2 17below poverty line 12 22 11 92 40 26above poverty line 4 11 8 67 14 6below poverty line 12 41 10 82 24 59above poverty line 8 21 11 41 7 33below poverty line 18 8 11 69 5 60above poverty line 6 3 5 37 2 33below poverty line 21 17 14 67 23 65above poverty line 8 6 6 29 7 30below poverty line 21 13 8 40 8 39above poverty line 6 5 2 16 2 15below poverty line 25 21 32 70 18 51above poverty line 7 6 11 32 5 22below poverty line 7 11 11 36 9 45above poverty line 2 3 3 8 2 7below poverty line 6 4 22 49 23 45above poverty line 2 1 9 20 8 18below poverty line 14 8 19 81 11 38above poverty line 5 4 6 55 3 16below poverty line 9 11 17 43 10 52above poverty line 4 6 8 16 3 22below poverty line 16 13 17 32 9 23above poverty line 5 4 8 14 4 13below poverty line 15 11 18 22 11 36above poverty line 7 8 10 9 3 21
Source: EU-SILC XUDB 2004 - version of February 2006
SE
NO
AT
PT
FI
% of households
IE
IT
LU
ES
FR
BE
DK
EE
EL

Social Situation Observatory – Social inclusion and Income distribution Draft final report
December 2006 205
Table 3. Ability to make ends meet for households below and above the poverty line
with great difficulty
with difficulty
with some difficulty fairly easily easily very easily
below poverty line 20 24 26 18 12 2above poverty line 5 10 21 29 29 6below poverty line 12 11 12 21 30 14above poverty line 2 4 9 19 44 22below poverty line 6 31 31 29 3 0above poverty line 1 11 29 51 7 1below poverty line 32 40 19 8 1 0above poverty line 11 29 27 18 14 2below poverty line 21 24 33 17 4 0above poverty line 8 15 31 31 13 1below poverty line 20 20 22 22 15 1above poverty line 4 10 15 31 35 4below poverty line 16 23 31 23 6 2above poverty line 5 13 28 37 12 4below poverty line 34 26 30 7 2 0above poverty line 11 17 42 22 7 1below poverty line 8 13 34 27 15 2above poverty line 1 3 10 27 41 18below poverty line 12 14 35 25 10 3above poverty line 2 6 25 36 24 8below poverty line 30 26 32 9 2 1above poverty line 12 19 38 21 9 1below poverty line 8 14 30 30 13 5above poverty line 3 5 19 38 21 14below poverty line 8 12 28 33 13 6above poverty line 3 6 20 37 18 16below poverty line 8 11 20 39 18 5above poverty line 3 5 14 38 27 14
Source: EU-SILC XUDB 2004 - version of February 2006
Ability to make ends meet
BE
DK
EE
% of households
EL
ES
FR
IE
SE
NO
IT
LU
AT
PT
FI

Social Situation Observatory – Social inclusion and Income distribution Draft final report
December 2006 206
Table 4. Selected indicators of financial strains for households by income quintile
Arrears on mortgage or rent
payments
Arrears on utility bills
Arrears on hire purchase
instalments or other loan payments
Lack of capacity to afford paying for one week annual holiday away from
home
Lack of capacity to afford a meal with meat, chicken, fish
(or vegetarian equivalent) every
second day
Lack of capacity to face unexpected
financial expenses
Quintile1 13 12 9 56 13 562 8 5 6 43 6 393 5 5 5 27 4 294 2 3 2 16 2 175 1 1 0 8 1 101 6 7 7 18 5 332 3 3 5 21 4 313 2 2 4 9 2 204 1 1 2 4 0 115 1 1 2 1 0 41 13 24 13 91 41 272 5 14 12 90 31 153 3 14 15 82 18 74 6 11 6 67 8 35 4 7 6 36 4 11 12 41 10 82 25 602 11 33 12 70 13 503 9 27 14 56 9 434 9 19 10 31 3 285 4 8 8 11 1 111 19 8 12 70 5 612 9 5 7 59 4 503 7 4 6 46 2 414 6 3 3 32 1 305 3 1 3 12 1 141 19 15 14 65 21 632 13 10 10 49 12 473 8 7 6 31 6 324 4 4 3 18 4 225 5 3 3 10 3 121 22 14 8 41 10 402 16 10 5 35 5 323 7 6 3 22 2 204 5 4 1 11 1 105 2 3 1 3 1 61 24 20 31 70 17 502 12 10 17 50 9 353 7 7 11 37 6 254 5 5 8 24 4 165 5 3 7 13 2 101 6 8 8 30 8 342 4 4 4 14 3 123 1 2 2 7 0 84 1 2 3 4 1 25 0 1 3 2 0 11 6 4 19 47 22 442 3 2 15 32 13 293 2 2 11 21 9 194 1 1 6 16 5 125 1 0 3 7 3 91 16 9 19 81 11 382 7 5 12 82 6 323 7 5 9 70 5 194 5 3 4 50 1 125 3 3 4 21 1 61 9 11 16 42 9 502 7 9 17 32 7 403 5 7 8 16 3 254 2 3 5 8 1 145 1 1 3 3 1 61 15 12 17 31 9 242 10 9 17 27 8 253 7 5 8 14 4 154 3 3 5 7 1 85 1 1 1 2 1 31 15 11 18 22 10 362 13 12 20 15 5 293 8 9 12 8 3 204 6 8 8 6 3 185 2 2 3 2 1 14
Source: EU-SILC XUDB 2004 - version of February 2006
% of households
SE
NO
LU
AT
PT
FI
ES
FR
IE
IT
BE
DK
EE
EL

Social Situation Observatory – Social inclusion and Income distribution Draft final report
December 2006 207
Table 5. Ability to make ends meet by income quintile
with great difficulty
with difficulty
with some difficulty fairly easily easily very easily
Quintile1 19 23 27 17 12 12 9 16 27 29 17 23 6 10 26 29 26 44 3 7 18 34 33 65 2 3 9 28 43 141 9 10 13 21 33 152 5 7 14 22 36 163 2 5 11 22 43 184 1 2 6 19 46 255 1 1 3 14 50 311 6 32 29 29 4 02 2 22 41 33 1 13 1 14 37 45 3 04 0 9 28 58 5 05 0 2 12 64 19 31 32 40 19 7 1 02 21 42 25 10 3 03 14 38 28 16 5 04 7 26 32 21 13 15 2 11 22 24 33 81 22 24 33 17 4 02 13 22 37 23 5 03 10 19 35 27 9 14 7 14 32 33 13 15 2 7 22 39 26 31 18 20 24 23 15 12 6 19 24 28 21 13 4 11 17 37 31 24 2 6 11 34 44 35 2 3 6 25 52 121 17 23 31 21 6 22 12 21 33 27 5 23 6 17 34 33 8 24 4 11 29 41 13 35 1 5 19 45 20 91 33 26 31 7 2 02 18 26 42 12 3 03 13 19 48 16 4 04 8 14 46 25 6 15 5 8 34 35 15 31 6 12 30 25 22 42 2 4 15 33 40 63 1 1 9 35 39 154 0 1 5 25 48 215 1 0 4 16 43 361 11 15 36 26 10 32 5 7 34 34 17 33 2 6 26 41 19 64 1 4 22 36 29 85 0 2 13 33 34 171 31 25 32 9 2 12 21 29 38 8 4 03 15 22 43 16 3 04 9 19 40 25 6 15 3 8 32 33 21 21 8 13 28 30 14 62 6 10 26 37 14 73 3 5 22 40 18 124 1 3 16 40 25 155 1 1 10 35 29 241 8 12 28 34 12 72 7 10 30 31 13 93 3 7 23 41 16 114 2 3 18 41 20 175 1 1 11 33 25 301 8 10 20 38 18 52 5 7 18 37 23 93 2 6 18 41 22 114 1 4 13 41 28 135 0 2 5 33 35 25
Source: EU-SILC XUDB 2004 - version of February 2006
SE
NO
Ability to make ends meet (% of households)
% of households
LU
AT
PT
FI
ES
FR
IE
IT
BE
DK
EE
EL

Social Situation Observatory – Social inclusion and Income distribution Draft final report
December 2006 208
Table 6. Financial burden of housing costs and loand by income quintile
A heavy burden
Somewhat a burden
Not burden at all
A heavy burden
Somewhat a burden
Not burden at all
Quintile1 44 35 22 53 31 162 34 38 28 48 36 163 30 36 35 35 39 264 21 36 43 22 51 285 18 29 54 19 34 471 11 18 71 16 23 612 7 19 74 11 27 623 5 17 79 7 20 734 4 19 77 4 20 775 2 13 84 2 10 881 52 36 11 35 53 122 48 44 8 39 49 123 37 52 10 35 55 104 28 57 15 21 66 135 11 60 28 18 70 121 30 63 7 36 53 112 25 69 6 30 63 73 21 73 7 26 66 84 16 76 8 20 64 165 11 75 14 16 65 201 55 41 3 66 32 22 52 45 3 59 39 23 48 49 3 59 37 34 40 56 4 51 45 45 28 67 5 39 55 61 31 32 37 41 25 352 23 33 43 29 26 453 17 30 53 21 27 534 14 27 59 18 21 605 11 21 68 13 18 691 30 44 26 36 49 152 25 46 28 32 49 193 23 50 27 19 56 254 17 51 31 19 49 325 12 44 44 14 46 411 66 32 2 68 31 12 58 40 1 51 47 23 52 46 1 46 52 34 46 53 2 39 58 45 35 62 3 32 63 61 50 36 14 50 40 92 30 55 14 20 58 213 25 51 24 27 48 254 21 55 24 15 47 385 15 46 39 10 50 401 23 52 25 50 44 62 16 58 27 40 54 63 12 61 27 35 53 134 9 58 33 20 64 165 6 55 39 16 56 281 39 50 11 37 51 122 34 52 14 28 59 143 30 52 17 36 51 124 22 58 20 23 62 155 13 50 37 11 55 341 25 51 24 26 40 332 28 50 22 27 42 313 21 54 24 17 51 324 18 54 27 9 51 395 11 53 36 6 44 501 20 37 43 36 31 332 21 37 43 27 37 363 13 40 48 14 42 444 10 37 53 11 37 525 4 30 65 5 30 641 13 35 52 18 35 482 9 38 53 15 46 383 6 39 55 11 40 494 6 36 58 7 42 515 2 27 71 3 31 66
Source: EU-SILC XUDB 2004 - version of February 2006
SE
NO
Financial burden of the total housing cost
Financial burden of the repayment of debts from hire purchases or loans
% of households
LU
AT
PT
FI
ES
FR
IE
IT
BE
DK
EE
EL

Social Situation Observatory – Social inclusion and Income distribution Draft final report
December 2006 209
Yes No Yes NoQuintile
1 66 34 71 292 73 27 76 243 76 24 78 224 82 18 84 165 93 7 94 61 92 8 88 122 97 3 95 53 98 2 96 44 99 1 99 15 100 0 100 01 88 12 89 112 91 9 93 73 96 4 97 34 97 3 97 35 99 1 99 1
Source: EU-SILC XUDB 2004 - version of February 2006
Table 7. Number of households with bath/shower and indoor toilet in the dwelling for Estonia, Greece and
Bath or shower in dwelling
Indoor flushing toilet for sole use of household
% of households
PT
EE
EL
1 2 3 4 5
BE 19 14 14 13 9
DK 10 9 8 7 7
EE 42 35 33 29 18
EL 32 24 22 16 9
ES 26 24 20 18 13
FR 21 17 12 13 11
IE 22 19 13 10 10
IT 33 26 23 19 15
LU 19 18 13 12 13
AT 15 11 9 8 8
PT 30 33 23 19 16
FI 6 5 4 4 4
SE 5 5 5 4 4NO 9 9 7 9 5
Source: EU-SILC XUDB 2004 - version of February 2006
% of households
quintile
Table 8. Number of households with leaking roofs, damp walls/floors/foundation, or rot in window

Social Situation Observatory – Social inclusion and Income distribution Draft final report
December 2006 210
Noise from neighbours or from
the street
Pollution, grime or other environmental
problems
Crime violance or vandalism in the
areaQuintile
1 28 18 212 25 15 193 24 16 214 23 16 205 25 17 211 28 10 172 21 9 153 20 6 154 19 7 145 16 6 141 51 40 262 50 42 243 51 43 294 53 41 285 49 36 311 14 10 52 17 14 83 19 13 94 21 18 85 21 20 101 23 13 162 25 13 183 26 17 184 26 18 215 27 17 201 27 20 232 26 18 233 24 20 224 21 20 205 22 21 211 15 9 172 14 10 143 11 8 124 11 8 155 10 10 141 26 21 162 27 22 143 26 22 144 27 23 155 26 25 151 32 20 152 29 23 193 26 21 164 25 16 125 21 13 171 24 9 132 21 9 113 24 11 104 21 9 115 23 12 121 19 16 112 25 20 103 24 20 144 29 22 165 28 22 161 17 14 202 18 14 193 17 15 204 18 14 195 15 13 151 15 6 112 14 6 113 13 6 104 11 6 85 9 5 91 16 10 62 14 8 53 13 9 74 15 10 65 11 8 6
Source: EU-SILC XUDB 2004 - version of February 2006
IE
IT
BE
DK
EE
EL
% households
Table 9. Number of households reporting problems with noise, pollution and crime by income quintile
SE
NO
LU
AT
PT
FI
ES
FR

Social Situation Observatory – Social inclusion and Income distribution Draft final report
December 2006 211
References
Atkinson, A.B, B. Cantillon E. Marlier and B. Nolan (2002), Indicators: the EU and Social Inclusion, Oxford University Press, Oxford
Atkinson, A.B, B. Cantillon E. Marlier and B. Nolan (2005), Taking forward the EU Social Inclusion Process, Final report, August 2005, http://www.ceps.lu/eu2005_lu/inclusion
Boarini, R. and M. Mira d’Ercole (2006)., Measures of Material Deprivation in OECD countries, Social, Employment and Migration Working Paper No. 37, OECD, Paris
Bradshaw J. and N. Finch (2003), “Overlaps in Dimensions of Poverty”, Journal of Social Policy, 32, 4, pp. 513-525
Callan T., B. Nolan and C. Whelan (1993), “Resources, deprivation and the measurement of poverty”, Journal Soc. Pol., 22, 2
Callan, T., B. Nolan, B. J. Whelan, C. J. Whelan, J. Williams (1996), Poverty, Evidence from the 1994 in the Living in Ireland Survey 1990s, Oak Tree Press, Dublin
Eurostat (2005) “Material deprivation in the EU”, Statistics in Focus, 21/05
Guio, A-C. and I.E. Maquet (2006), “Material deprivation and poor housing”, Draft paper for the conference Comparative EU Statistics on Income and Living conditions: issues and Challenges, Helsinki, November 2006.
Kangas, O. and V-M. Ritakallio (1998), “Different Methods- Different Results? Approaches to Multidimensional Poverty”, in H-J Andress (ed.), Empirical Poverty Research in a Comparative Perspective, Aldershot: Ashgate, pp. 167-203
Layte, R., B. Maître, B. Nolan, and C. T. Whelan (2001), “Persistent and Consistent Poverty in the 1994 and 1995 Waves of the European Community Household Panel^, Review of Income and Wealth,Series 47, 4
Nolan, B. and C. Whelan (1996), Resources, Deprivation and Poverty, Oxford University Press, Oxford
Perry, B. (2002), “The mismatch between income measures and direct outcome measures of poverty”. Social Policy Journal of New Zealand, 19, pp. 101-127
Townsend P. (1979), Poverty in United Kingdom, Harmondsworth, Penguin
Townsend, P. (1988), “Deprivation” Journal of Social Policy, 16, pp. 125-146
Whelan, C.T., R. Layte, B. Maître (2002), .Persistent Deprivation in European Union., Schmollers Jahrbuch: Journal of Applied Social Sciences, 122, 1:3

Social Situation Observatory – Social inclusion and Income distribution Draft final report
December 2006 212
9. THE SITUATION OF ROMA IN CENTRAL AND EASTERN EUROPE61
Introduction
Roma62 who, according to experts, are supposed to originate from India, live almost all around
the world. A large part of this heterogeneous ethnic group live in Europe, in nearly all European
countries with an estimated number of around 7-8 million63. Most of them reside in Central and
Eastern Europe, an estimated number of the Roma in the new Member States is between 1.2–
1.4 million, while further 2.0–2.8 million Roma will become citizens of the EU with the
accession of Romania and Bulgaria in 2007.
In all Central and Eastern European countries Roma fall far behind the majority of the
population in many aspects of everyday life. Living conditions, housing, income, employment
status, poverty, access to services and education are all areas in which the situation of Roma is
significantly worse than that of the majority population who live in the same places as Roma –
ie as their neighbours. The extent of poverty and inequalities in income depends on a number
of underlying socio-economic factors, and this applies more to such disadvantaged social
groups as the Roma than others. The analysis here considers issues relating to poverty and
income in a broad sense, including living conditions. The aim is to describe the situation of
Roma in Central and Eastern Europe in terms of a number of key socio-economic indicators in
order to give a realistic picture of the present conditions and future possibilities as regards one
of the largest ethnic minorities in the EU.
Certainly, the situation of Roma cannot only be discussed by means of socio-economic
indicators since one of the most important problems they face is discrimination and
persecution in many areas of everyday life. Discrimination of Roma is widespread in many EU
countries and this has become a focus of particular attention so far as Roma are concerned.
The implementation of anti-discrimination laws and the establishment of equality bodies in EU
Member States have given all ethnic minorities, including Roma, more recourse against
discrimination. In addition, the monitoring activities of the EUMC (European Monitoring Centre
on Racism and Xenophobia), the launching of the Decade of Roma Inclusion and the increased
efforts of NGOs to fight for the rights of Roma and improve opportunities for them have all
61 Anikó Bernát and Márton Medgyesi, TÁRKI Social Research institute 62 Roma are also known as Gypsies, but the term Roma is usually used as an autonym (a self-assignment) and Gypsy as an exonym (ie a term used by other people but not Roma themselves). Gypsy is often considered as a pejorative term by Roma, therefore it is better to refer to this ethnic group as Roma. Despite their homogenous designation, Roma are a heterogeneous group with different origins, languages and traditional trades and lifestyles. 63 Estimates vary greatly, for ranges of the estimates which have been made by country see Table 1.
Social Situation Observatory – Social inclusion and Income distribution Draft final report
December 2006 213
serve to raise awareness of the position of Roma across Europe. The main focus, however, has
been on combating discrimination, though the EU, especially through the Structural Funds and
the PHARE programme, have also provided practical support for improving the situation of
ROMA (for more on this see European Commission 2005).
Since previous studies and reports have tended to concentrate on the issue of discrimination
and equal opportunities, the analysis here is focused less on this and more on the social and
economic aspects of the situation of Roma.
SOURCES OF DATA, METHODOLOGICAL CONSIDERATIONS
There are Roma living in all the Central and Eastern European (CEE) countries, and in all of these
countries their living conditions and the opportunities open to them are appreciably worse than
those of the majority population. Nevertheless, this everyday experience cannot easily be
examined in systematic ways by means of statistical data, since there are few country-specific,
let alone cross-country comparable, data sources available which can be used for this purpose.
The lack of data is, therefore, one of the most important issues surrounding any study on the
Roma in the EU and one which makes it difficult to obtain a complete understanding of their
current situation.
Among the various available sources, the United Nations Development Programme (UNDP)
provides the most appropriate database on this: in 2004, UNDP compiled the largest set of data
ever gathered on the Roma entitled Vulnerable Groups in Central and South Eastern Europe (for
the publication Faces of Poverty, Faces of Hope and downloadable dataset see UNDP 2005). The
survey was conducted in numerous Central Eastern European (CEE) and South Eastern European
(SEE) countries (Bulgaria, Croatia, Czech Republic, Hungary, Macedonia, Romania, Slovakia, and
Serbia, Montenegro and Kosovo are included separately) among Roma and the people living in
close proximity to them. The idea behind the survey design was that the majority population
living in the same neighbourhoods as Roma ought to face the same socio-economic
environment and therefore serve as a benchmark against which to assess the situation of Roma.
An additional advantage was that it surveyed a sample of both households and individuals and
examined a wide range of topics relating to the social and economic situation of Roma
population, in particular, their living conditions, income, employment, education and schooling,
housing and health conditions etc.
Before the above-mentioned research, UNDP published a remarkable study on the same topic in
2002 entitled The Roma in Central and Eastern Europe: Avoiding the Dependency Trap (for the
publication and downloadable dataset see UNDP 2002.) This covered five CEE and SEE countries
(Bulgaria, Czech Republic, Hungary, Romania and Slovakia), each of which as surveyed on the

Social Situation Observatory – Social inclusion and Income distribution Draft final report
December 2006 214
socio-economic situation of the Roma population living there. The content of the research was
very similar to that in 2004, focusing on all the relevant issues relating to Roma, their
demographic characteristics, employment and unemployment, income, extent of poverty,
education, health status, interactions with other ethnic groups and political representation.
Other relevant studies on the topic have been published by the World Bank (e.g. Revenga et al
2002, Ringold et al 2005), the European Union and the European Roma Rights Centre (e.g.
European Commission 2004). However, the information contained in these studies seems less
comprehensive than in the UNDP database, partly because they tend not to cover all the
countries which are relevant, though they do provide some additional information and deal with
a few other aspects.
Demography, language, segregation
THE SIZE OF THE ROMA POPULATION IN CENTRAL EASTERN AND SOUTH EASTERN EUROPE
It is often difficult to determine the number of people belonging to any ethnic minority, partly
because of problems of obtaining data, partly because of problems of deciding who should be
included. This problem is even more acute in the case of such a heterogeneous group as the
Roma in CEE and SEE. Various estimates can be obtained according to different methods. The
ways are through self-declaration (which is, for example, used by censuses), assessments of
the group itself and estimates of others (such as, for example, on the basis of the assessment
of interviewers in surveys).
According to census data, which are based on self-declaration, the total number of the Roma in
Central Eastern and South Eastern Europe (CEE and SEE) is less than 1.5 million. However, it is
usual for censuses to underestimate the size of disadvantaged minority groups, such as the
Roma. There is, therefore, a need to consider other sources. According to expert estimates the
real figure can reach, or even, exceed 5 million. The largest Roma population in CEE and SEE is
in Romania, where the most reliable expert estimates put their number between 1.5 and 2
million, which is 7-9% of the total population. This means that 4 out of 10 CEE and SEE Roma
live in Romania and that accordingly the country is host to the largest, or at least one of the
largest, Roma communities in the world.
Nevertheless, the largest number of Roma within the population in CEE and SEE is in Slovakia
and Bulgaria, where, according to expert estimates, they make up nearly 10% of the resident
population, which corresponds to 480-520 thousand in the case of Slovakia and 550–800
thousand in that of Bulgaria. (Table 1)

Social Situation Observatory – Social inclusion and Income distribution Draft final report
December 2006 215
Table 1 Number and proportion of Roma population in Central Eastern and South Eastern Europe by
census and estimation (in thousands and percent)
Roma population by census (in thousands)a)
Estimation for Roma population (in thousands)b)
Proportion of Roma population (%)b)
Distribution of the Roma population in the region by countries (%)c)
Romaniag) 535 1500–2000 2–8 38 Bulgaria 371 550–800 8–10 14 Hungary 190 520–650 5–8 13 Serbia 108 450–500 6 10 Slovakiag) 90 480–520 8–10 10 Czech Republic 12 175–200 1.7–2 4 Albaniad) – 120–150 5 3 Kosovo 43 100–150 – 3 Macedoniaf) 54 135 3–8 3 Croatia 9 40–100 1–2.5 2 Bosnia-Herzegovinae) 9 50–60 1 1 Montenegrog) 3 20–28 4–5 1 Total 1434 4040–5293 – 100 Source: a) UNDP 2005, except for: Bosnia-Herzegovina (Needs Assessment: Roma Education Fund 2005) and Slovakia (UNDP 2002). Census data date back to 1991 in Bosnia-Herzegovina and Kosovo, 2001 in Bulgaria, Czech Republic, Croatia, Hungary and Slovakia, 2002 in Macedonia, Romania and Serbia and 2003 in Montenegro. b) Needs Assessment: Roma Education Fund (2005); except for Slovakia (UNDP 2002); data relate to 2001–2003 c) Own calculation based on the means of the estimated number of Roma population by country d) ERRC (1997) e) ERRC (2004) f) Together with internally displaced persons (IDPs) g Census and estimation together
MAIN DEMOGRAPHIC CHARACTERISTICS
Surveys report (UNDP 2002, UNDP 2005) that the Roma population differs from the majority
population in terms of the main demographic trends, in particular, birth rates (higher than
average), the timing of marriage (earlier than the average), family structure (larger families and
households) and age profile (lower rates of Roma among older age groups and higher rates
among the younger cohorts).
In Romania, Slovakia, Hungary and the Czech Republic Roma households have on average 3-4
children, but it can be much higher in some cases, for example, in poor Roma settlements in
Slovakia, the average number of children per family is nearly 8. The number of children per
Roma mother is also higher than that of the majority of women across the region. In Romania,
the total fertility rate, i.e. births per woman, for Roma is 2.6, while the corresponding figure for
others is 1.2 (and 1.3 for ethnic Hungarian women living in Romania). In the Czech Republic,

Social Situation Observatory – Social inclusion and Income distribution Draft final report
December 2006 216
married Roma women have on average 5 children by the end of their reproductive lives (at age
45-49) compared with an average of 2.2 children for other women in the country.
Parallel to this, there is much evidence that life expectancy, infant mortality and morbidity are
significantly worse for Roma than for the majority population in CEE countries. (UNDP 2002) For
instance infant mortality rates are roughly double the national averages in the Czech Republic,
Slovakia and Hungary, and nearly three times higher in Romania. (Puporka and Zádori 1998,
UNDP 2002)
As a result, the shape of the age pyramids for Roma in the region (Bulgaria, Czech Republic,
Hungary, Romania, and Slovakia) is similar to the shapes in developing countries (a large
number of children and young people and fewer people in the older age groups). It also means
that the Roma population, on average, is very young in the region, with a median age of 19.3
years, while the corresponding figure is 33.6 years for the total population. (UNDP 2002)
Further demographic characteristics in line with the above features are a different family
structure and household size than those of the majority population. In Romania, Hungary and
Slovakia at least 4 out of 10 Roma in the 16 to 19 age group are already married and at least 7
out of 10 in the 20 to 24 age group. In Bulgaria, though the proportions are slightly lower, the
pattern is similar (33% being married among 16 to 19 year-old and 69% among 20 to 24 year-
olds). In the Czech Republic, however, the proportions are significantly lower, though still high
(15% and 54%, respectively) (UNDP 2002). Certainly, large numbers of children and large sizes
of family are a corollary of early marriage.
Various effects results from these basic characteristics, such an increasing number of Roma in
these countries and a growing proportion of Roma in the population as a whole, and even more
so among the population of working age in the coming decades. However, unless the current
level of education of the Roma improves rapidly much of this additional potential labour force is
likely to be unemployable or employable only as unskilled workers with low productivity and
low wages. A further effect is that having families at a young age reduces the chances of
women being able to stay in the education system for longer.
INTEGRATION, SEGREGATION
Spatial segregation and language are among the most apparent indicators of the extent of
integration or separation of a minority group. If spatial segregation is measured by the
proportion of Roma households living in a settlement with a dominant Roma population (where
at least 50% of the population is considered Roma), there are marked differences in the extent
of this across the region. Among the CEE and SEE countries examined here, the largest share of
segregated Roma households is in Montenegro (62%), whereas the smallest is in the Czech

Social Situation Observatory – Social inclusion and Income distribution Draft final report
December 2006 217
Republic (7%). There is a considerable difference in this across the new EU Member States, with
five times more Roma households living in segregated communities in Hungary (35%) than in
the Czech Republic, but also across the candidate countries, with nearly 50% of Roma families
living in a segregated community, as against under 20% in Bulgaria and Romania (data based on
Faces of Poverty survey) (Fig. 1).
The use of a minority language in the family is another indicator of integration and segregation.
On the one hand, using a minority language is a key aspect of ethnic identity and the cultural
heritage, but, on the other, its use can heighten problems of integration into mainstream
society.
Examining the differences between countries on the language used at home, from the evidence
collected by the Faces of Poverty UNDP survey, a dichotomy can be seen between those in the
north and those in the south of the region, which in practice means a difference between the
developed and less developed countries. In most of the Balkan countries, the majority of Roma
use a Roma language at home, while in Central Europe, Roma predominantly speak the majority
language, except for Slovakia, where around half do (Table 2).
Fig. 1 Share of Roma households living in a settlement with a dominant
Roma population (%)
62
46
35
2420 19 16 16
11 7
0
20
40
60
80
100
Montenegro Croatia Hungary Bosnia-Herzegovina
Macedonia Bulgaria Serbia Romania Albania CzechRepublic

Social Situation Observatory – Social inclusion and Income distribution Draft final report
December 2006 218
Table 2. The most frequent used language at home among Roma households (%) language Roma population (%)
Albanian 0 Albania
Roma 100 Serbian 23
Serbia Roma 73 Serbian 2
Montenegro Roma 72 Croat 18
Croatia Roma 71 Macedonian 21
Macedonia Roma 64 Bulgarian 21
Bulgaria Roma 55 Romanian 41
Romania Roma 54 Bosnian 39
Bosnia-Herzegovina Roma 46 Slovakian 41
Slovakia Roma 45 Czech 62
Czech Republic Roma 32 Hungarian 93
Hungary Roma 7 Albanian 95
Kosovo Roma 5
Kosovo represents a more marked exception, with only 5 out of 100 families using Roma at
home and all the others speaking Albanian. This is in stark contrast to the Roma respondents in
Albania participating in the survey, so that the situation in Kosovo seems not only to differ from
the pattern in neighbouring Balkan countries, but is also the reverse of that in Albania itself. A
possible explanation might be the special and strong relationship between the two countries,
since the majority of the population in Kosovo is Albanian, and given Kosovo’s ambition for
independence, getting closer to Albania by using the Albanian language seems to override
consideration of ethnic affiliations.
Although both of the indicators above are intended to measure the extent of segregation or
integration of Roma in the countries concerned, this seems to differ between them. The
language indicator suggests that the more developed a country, the smaller the proportion of
people speaking Roma at home, but the residential segregation indicator does not fit this
pattern and is much more country specific than region specific.

Social Situation Observatory – Social inclusion and Income distribution Draft final report
December 2006 219
Education
The level of education of the Roma in the region is extremely low compared with the EU25-
average in general, with the majority population in the candidate countries or with the majority
population living in close proximity to Roma. According to the data from the UNDP survey Faces of Poverty, almost 90% of Roma aged 15 or over have at most 8 years elementary schooling as
the highest level of education attained in Albania, Kosovo, Montenegro and Bulgaria. Moreover,
the proportion is 70-80% in most of the other countries examined. The Czech Republic has the
lowest proportion, but even here the figure is 64%.
The share of the low educated among Roma is 2 to 9 times larger than among the majority
population. In this regard, the most extreme situation is in Montenegro, where elementary
schooling was the highest level of education the majority population living in close proximity to
them. A smaller but still substantial gap is also evident in Serbia, Bosnia-Herzegovina and
Bulgaria, where this is the highest education level for around four times more Roma than non-
Roma. The smallest difference between the Roma and the neighbouring population in this
respect is in Hungary, where the gap is less than two to one, but where this is primarily because
of the larger proportion of non-Roma with low education (57%) rather than because of a small
number of Roma with only elementary schooling (Fig. 2).
Fig. 2 Share of population 15 years old and above with 8 years elementary school as highest
attained education level (% of among Roma and majority population in close proximity
to Roma)
30
49
25
10
37
21
57
34
17
32 24 21
89 89 87 86 83 82 80 79 74
64
92 94
0
20
40
60
80
100
Albania Kosovo Bulgaria Montenegro Macedonia Bosnia-Herzegovina
Hungary Romania Serbia Slovakia Croatia CzechRepublic
Majority population in close proximity to Roma Roma population

Social Situation Observatory – Social inclusion and Income distribution Draft final report
December 2006 220
Segregation within schools and the education system is a major issue underlying the very low
education level of Roma, which is of key importance for their vulnerability in the region as well
as for their chances of social inclusion. The data from the UNDP’s Faces of Poverty survey
shows that a significantly large proportion of Roma children attend a class or school in which
the majority of pupils are of the same ethnic origin.
School segregation occurs most frequently in Bulgaria, where every second Roma pupil attends
a school in which the majority are Roma. The proportion is smaller in other countries but is still
significant in many of them. Every third Roma child in Hungary and every fourth in Macedonia
and the Czech Republic, therefore, are effectively separated from class mates who are not of
Roma origin. At the same time, an even larger proportion of non-Roma children living in the
same neighbourhoods as the Roma attend schools where the majority is from the same, ie non-
Roma, ethnic group, which follows the same logic but which ends up in segregation (Fig. 3).
A special form of segregation in education is when Roma children are directed to a so-called
school or class with a special curriculum, usually designed for those with learning difficulties.
This “method” has been frequently used in most of the countries of the region, to an increasing
extent over the past 10-15 years. In Hungary for example the number of children in special
schools or classes established for the mentally disabled or disadvantaged students increased
over the decade following after the transition and in 2003, every fifth Roma child was attending
such a school or class (Kemény–Janky–Lengyel 2004).
Fig. 3 Share of Roma and non-Roma living in close proximity to Roma aged 6 to 22
attending schools or colleges where the majority have the same ethnic affiliation (%)
84 76
84 73 70
8880
69
38
92
47
26 25 15 13 13 12 12 8 6
50
32
0
20
40
60
80
100
Bulgaria Hungary Macedonia CzechRepublic
Romania Albania Croatia Bosnia-Herzegovina
Montenegro Kosovo Serbia
Majority population in close proximity to Roma Roma population

Social Situation Observatory – Social inclusion and Income distribution Draft final report
December 2006 221
According to a report published by the European Roma Rights Centre (ERRC), the same applies
in the Czech Republic, Slovakia and Bulgaria: Roma children are over-represented in schools or
classes which are for the mentally disabled or disadvantaged children. This situation can be
regarded as a parallel education system operated for Roma children in many areas of the
region. With the exception of Hungary, concrete government action aimed at desegregation of
the school system has yet to be initiated. (Stigmata 2005)
Employment, unemployment, labour market
The situation in the labour market is similar to that in education. The dataset from the Faces of Poverty survey indicates that activity rates among the Roma population are extremely low in the
region: only 1-2 out of 10 Roma aged 15 or over have earnings from economic activity
(defining activity to include that in both the formal and informal economy). The situation is
better only in the Czech Republic and Albania, where somewhat higher proportions of Roma are
in paid employment, though only slightly so. The proportion is smallest in the less developed
countries in the former Yugoslavia (Bosnia-Herzegovina, Macedonia, Kosovo) (Fig. 4).
In general, activity rates among the majority living in the same neighbourhoods as Roma are
also very low, but, for the most part, there are greater differences in this respect between
countries than in the case of Roma. The smallest difference between the activity rate of Roma
and the neighbouring non-Roma population can be observed in Hungary and Kosovo, though in
both cases this reflects the low level of activity among the non-Roma rather than a high rate
among the Roma. In these cases, therefore, as well as more generally, employment problems
cannot be attributed to discrimination alone but also have to do with the underdevelopment of
the regions in which the Roma live and with a lack of jobs. In contrast, the majority population
in the Czech Republic, Croatia, Serbia, Montenegro and Bosnia-Herzegovina have an activity
rate 30 percentage points or so higher than that of the Roma (Fig. 4).

Social Situation Observatory – Social inclusion and Income distribution Draft final report
December 2006 222
On a broad definition of unemployment, every fourth Roma of working age was unemployed in
Hungary and Romania, every third in the Czech Republic, every second in Bulgaria and two out
of three in Slovakia in 2001. A great many Roma who are in paid employment work in the black
economy: at least 4 out of every 10 of those in Hungary, Bulgaria and Slovakia and 7 out of
every 10 in Romania. The situation is somewhat better in the Czech Republic, where the figure
is around two out of every. Moreover, here as well as in Hungary, this is coupled with a lower
rate of unemployment. While unemployment among Roma is lowest in Romania, this is
combined with an extremely large number working illegally which implies that the situation is
much less favourable than the unemployment figures suggest (UNDP 2002).
Poverty, income and living conditions
The small share of active earners among Roma leads directly to a lower level of income and
poor living standards. Poverty can be measured in different ways. Both a subjective and
objective, or absolute, poverty indicator is used below and additional information is provided by
indicators on access to basic services.
According to a subjective indicator of poverty, as measured by a survey covering Hungary,
Romania and Bulgaria conducted in 2000, the Roma seem to have passed through the decade
following the transition with a greater sense of pessimism than the non-Roma population, who
also experienced a decline in living standards. The smallest proportion of people reporting a
decline in living standards was in Hungary, where this, nevertheless, amounted to more than 5
out of every 10 non-Roma and 7 out of 10 Roma (Table 3).
Fig. 4 Share of active earners aged 15 and above among Roma and majority population in close proximity to Roma (%)
45
55
42 46 43
21
3543
2128
37 35
21 15 14 13 13 13 11 8 7 5
25
37
0
20
40
60
80
100
Albania CzechRepublic
Bulgaria Croatia Serbia Hungary Romania Montenegro Kosovo Macedonia Slovakia Bosnia-Herzegovina
Majority population in close proximity to Roma Roma population

Social Situation Observatory – Social inclusion and Income distribution Draft final report
December 2006 223
Table 3. Self-evaluation of the change in living standard between 1988 and 2000 (%)
got better or remained the
same a bit worse
got much worse
total
non-Roma 17 24 59 100 Bulgaria
Roma 12 13 75 100 non-Roma 46 36 17 100
Hungary Roma 30 29 41 100
non-Roma 29 27 45 100 Romania
Roma 13 19 68 100 Source: Ladányi–Szelényi 2002
Income of under USD 4.30 a day in purchasing power parity64 terms can be used as a measure
of absolute poverty. According to the Faces of Poverty survey, the proportion of Roma with
income of less than in Albania, Kosovo and Romania (at least two-thirds of the Roma in each
case), while around half of the Roma have income below this in Serbia, Macedonia and Bulgaria
and the proportion is slightly smaller in Montenegro and Bosnia-Herzegovina. The smallest
proportions are in the economically more developed Central European countries and Croatia
(Table 4).
Poverty rate ratio (the share of Roma with poverty-level income relative to non-Roma with this
level of income) is the highest in Montenegro and Bulgaria, where eight times more Roma are
living under the poverty line than non-Roma, despite the fact they live in the same locality.
Wide differences are also evident in the other Balkan countries, while the gap is narrowest in
the Central European countries. (Table 4) This pattern is similar to that shown by labour market
indicators and suggests that disparities in income levels (or labour market conditions) between
countries are more important in explaining differences between the situation of Roma and that
of the majority population than other factors.
64 Using USD 4.30/day as an absolute poverty threshold is based on the practice of the UN and UNDP, which suggest this methodology in Millennium Development Goals. For instance see MDG Reports 2004:16. We apply this indicator because cross-country poverty figures for Roma in the countries examined here are available only from UNDP's survey

Social Situation Observatory – Social inclusion and Income distribution Draft final report
December 2006 224
Table 4. Income based poverty among Roma and majority population in close proximity to Roma (percent
of the respondents under the USD 4.30 PPP income based poverty line)
Majority population in close proximity to Roma
Roma population
Poverty rate ratio (poverty rate of
Roma/neighbouring majority)
Albania 14 79 5,6 Kosovo 49 72 1,5 Romania 20 67 3,4 Serbia 9 58 6,4 Macedonia 11 52 4,7 Bulgaria 6 49 8,2 Montenegro 4 33 8,3 Bosnia-Herzegovina 3 26 8,7 Croatia 2 11 5,5 Hungary 5 8 1,6 Czech Republic (11 USD) 9 25 2,8
Other indicators, specifically of relative poverty, confirm the overrepresentation of Roma among
the lowest income households. For instance, according to the TARKI Household Monitor survey
for Hungary, 12% of the population in the country as a whole have income below 60% of median
income according to the latest data for 2004. In households where the head is a Roma, this
proportion rises to 37%. This proportion, however, seems to have declined significantly in
recent years, from 70% in 2000 and 51% in 2003 (Gábos–Szivós 2006). (It should be noted that
it is difficult to estimate similar figures for other countries because of lack of data on median
income.)
The poor living conditions of Roma can also be seen through such indicators as the number of
people per room. According to this (based on the Faces of poverty UNDP survey) in all the
countries examined, Roma live in worse conditions than the majority population living in close
proximity to the Roma, which is almost a consequence of their lower level of income situation
and larger number of household members. The UNDP survey reports that on the number of
rooms per household member for Roma is below 1 in all the countries examined, so in every
country there is on average more than one person per room in such households. Roma in
Albania, Kosovo and Hungary have the poorest housing conditions, with at least two people
living in every room in Roma households. Conditions are best in the Czech Republic, where the
average is close to one person per room and where there is only a marginal difference between
the Roma and the majority population (Fig. 5).

Social Situation Observatory – Social inclusion and Income distribution Draft final report
December 2006 225
Indicators on access to basic services show perhaps the most depressing picture of the
disadvantaged situation of Roma across the region as compared with the neighbouring majority
population. Roma, therefore, have far less access to essential drugs, secure housing (defined by
the condition of the dwelling), acceptable sanitation (defined by the existence of a bathroom or
toilet within the dwelling), and a supply of clean running water than their non-Roma neighbours
(Table 5 - data based on Faces of Poverty survey).
Fig. 5 Rooms per household member in the households of Roma andmajority population in close proximity to Roma
0,79 0,72
0,95 1,16 1,25
1,1
1,421,58
1,09 1,04 1,1
1,36
0,980,84 0,77 0,76
0,680,670,670,660,66 0,49 0,49
0,38
0
0,5
1
1,5
2
Albania Kosovo Hungary Macedonia Croatia Bosnia-Herzegovina
Slovakia Romania Bulgaria Serbia Montenegro CzechRepublic
Majority population in close proximity to Roma Roma population

Social Situation Observatory – Social inclusion and Income distribution Draft final report
December 2006 226
Table 5. Access to basic services: share of Roma and majority households in close proximity to Roma not
having access essential drugs, secure housing, improved sanitation and improved water source (%)
Majority population in close proximity to Roma
Roma population
Albania – essential drugs
12 41
– secure housing 0 7 – improved sanitation 4 72 – improved water source 3 28 Bosnia-Herzegovina – essential drugs
29 71
– secure housing 5 36 – improved sanitation 11 68 – improved water source 1 11 Bulgaria – essential drugs
32 75
– secure housings 4 33 – improved sanitation 26 81 – improved water sources 0 10 Croatia – essential drugs
13 50
– secure housing 2 10 – improved sanitation 4 60 – improved water source 1 29 Czech Republic – essential drugs
8 27
– secure housing 4 14 – improved sanitation 6 10 – improved water source 5 8 Hungary – essential drugs
50 74
– secure housing 19 36 – improved sanitation 24 46 – improved water source 9 34 Kosovo – essential drugs
47 86
– secure housing – – – improved sanitation 45 72 – improved water source – – Macedonia – essential drugs
42 79
– secure housing 5 36 – improved sanitation 12 59 – improved water source 0 1 Montenegro – essential drugs
9 64
– secure housing 2 11 – improved sanitation 2 68 – improved water source 0 18

Social Situation Observatory – Social inclusion and Income distribution Draft final report
December 2006 227
Table 5 cont’d Romania – essential drugs
42 77
– secure housing 4 29 – improved sanitation 53 88 – improved water source 33 68 Serbia – essential drugs
22 60
– secure housing 5 50 – improved sanitation 6 50 – improved water source 1 8
The same is true of access to telecommunications, which nowadays is perhaps as essential as
the housing aspects mentioned above. In terms of the number of telephone lines or cellular
subscribers per 100 people, Roma are, therefore, in a much worse situation than the majority
population living close to them. The smallest differences are in Kosovo and Hungary, where
again this largely reflects the poor level of provision for the non-Roma population rather than a
high level of access of Roma themselves (Fig. 6 - UNDP 2005).
Source: UNDP 2005
Fig. 6 Telephone lines or cellular subscribers per 100 people among Romaand non-Roma living in close proximity to Roma
30
46
30
17
47 5058
4047 51
76
611 11 15 15 16 18 19 22
3532
4 50
20
40
60
80
100
Albania Romania Bulgaria Hungary Kosovo Bosnia-Herzegovina
Serbia Croatia MacedoniaMontenegro CzechRepublic
Slovakia
Majority population in close proximity to Roma Roma population

Social Situation Observatory – Social inclusion and Income distribution Draft final report
December 2006 228
Conclusions
From the surveys carried out and the statistical data which have been compiled, the situation of
Roma in CEE and SEE countries is in virtually every aspect of life significantly worse than that of
the majority population in the countries concerned, including that of those living in the same
neighbourhood or in close proximity to them. At the same time, these differences cannot be
attributed to just one or two factors alone, such as discrimination or a generally low level of
education among the Roma community. It is equally the case that regional disparities, the
economic difficulties of the CEE and SEE countries and demographic characteristics are also
factors underlying the survey findings.
In general, in terms of many aspects, the Balkan countries are in most cases not only
disadvantaged compared with the new EU Member States but also have more disadvantaged
Roma populations than in the other countries. Since Roma for a number of reasons have higher
fertility and mortality rates and a lower level of education than non-Roma in the region, they
are also characterised by a larger number of children and young people, lower levels of pay and
productivity and larger proportion working in the black economy.
Further and more detailed analysis of their relative situation in the countries concerned has to
await the availability of more complete and reliable data which are comparable across countries,
which as emphasised at the outset are difficult to obtain. Nevertheless, such data and the
research into key economic, social and political issues which they make possible are of major
importance if Roma are to be satisfactorily integrated into the societies of the countries in
which they live and if they are both to contribute to and enjoy the benefits of the economic
development of the region.

Social Situation Observatory – Social inclusion and Income distribution Draft final report
December 2006 229
References
Bárány, Z. (2002), The East European Gypsies: Regime Change, Marginality and Ethnopolitics. Cambridge: Cambridge University Press.
CEDIME-SE 2000: Roma of Bulgaria. Minorities in Southeast Europe. Center for Documentation and Information on Minorities in Europe – Southeast Europe. http://www.greekhelsinki.gr/english/reports/CEDIME-Reports-Minorities-in-Bulgaria.html (Date of download: 18/08/2006)
ERRC 1997: No Record of the Case. Roma in Albania. European Roma Rights Centre, Country Report Series No. 5, June 1997. http://www.errc.org/db/00/13/m00000013.pdf. (Date of download: 30/07/2006)
ERRC 2004: The Non-Constituents: Rights Deprivation of Roma in Post-Genocide Bosnia and Herzegovina. European Roma Rights Centre, Country Report Series No. 13, February 2004. http://www.errc.org/db/00/06/m00000006.pdf. (Date of download: 30/07/2006.)
European Commission (2004) DG for Employment and Social Affairs 2004: The situation of Roma in an enlarged European Union. European Commission Directorate-General for Employment and Social Affairs Unit D3. http://ec.europa.eu/employment_social/publications/2005/ke6204389_en.pdf (Date of download: 30/06/2006.)
European Commission (2005) DG for Employment and Social Affairs 2004: Equality and non-discrimination. Annual report 2005. European Commission Directorate-General for Employment and Social Affairs Unit D3. http://ec.europa.eu/employment_social/fundamental_rights/pdf/pubst/poldoc/annualrep05_en.pdf (Date of download: 11/09/2006.)
Gábos András – Szivós Péter: Child poverty and some of its characteristics in Hungary (A gyermekszegénység és néhány jellemzője Magyarorságon. Only available in Hungarian). In: Kolosi Tamás – Tóth István György – Vukovich György (ed):Társadalmi Riport 2006 pp 204-228.
Kemény István – Janky Béla – Lengyel Gabriella 2004: Gypsies in Hungary 1971–2003. (A magyarországi cigányság 1971–2003. Only available in Hungarian). Budapest: Gondolat – MTA Etnikai-nemzeti Kisebbségkutató Intézet.
Ladányi János – Szelényi Iván 2002: Gypsies and Poor in Hungary, Romania and Bulgaria. (Available in Hungarian: Cigányok és szegények Magyarországon, Romániában és Bulgáriában) In: Szociológiai Szemle, Budapest, Vol. 4. pp 72–95.
Needs Assessment: Roma Education Fund 2005: Needs Assessment: Summary Report. A Background Document prepared for the Roma Education Fund Donors’ Conference, Paris, December 2–3, 2004. World Bank. http://siteresources.worldbank.org/ EXTROMA/Resources/REF_Needs_Assessment.pdf (Date of download: 30/07/2006)
Puporka Lajos – Zádori Zsolt 1998: The Health Status of Romas in Hungary. Budapest: Roma Press Centre. http://siteresources.worldbank.org/INTROMA/Resources/multi0page.pdf. (Date of download: 03/09/2006)

Social Situation Observatory – Social inclusion and Income distribution Draft final report
December 2006 230
Revenga, A. – Ringold, D. – Tracy, W. M. 2002: Poverty and Ethnicity. A Cross-Country Study of Roma Poverty in Central Europe. World Bank Technical Paper No. 531. Washington D.C.: The World Bank. http://siteresources.worldbank.org/EXTROMA/ Resources/ethnicity.pdf (Date of download: 30/06/2006)
Ringold, D. – Orenstein, M. A. – Wilkens, E. 2005: Roma in an Expanding Europe. Breaking the Poverty Cycle. Washington D.C.: The World Bank. http://siteresources.worldbank.org/ EXTROMA/Resources/roma_in_expanding_europe.pdf (Date of download: 30/06/2006)
Stigmata 2005: Segregated Schooling of Roma in Central and Eastern Europe. Budapest: European Roma Rights Centre, 2005. http://www.errc.org/db/00/04/m00000004.pdf. Date of download: 30/06/2006).
UNDP 2002: Avoiding the Dependency Trap. Bratislava: United Nations Development Programme. (Dataset and study is downloadable from: http://roma.undp.sk/ (Date of dowload: 30/07/2006)
UNDP 2005: Faces of Poverty, Faces of Hope. Vulnerability Profiles for the Decade of Roma Inclusion Countries. Bratislava: United Nations Development Programme. (Dataset and study is downloadable from: http://vulnerability.undp.sk/. Date of download: 30/07/2006)
UNDP 2004: Millennium Development Goals. Reducing Poverty and Social Exclusion. Hungary, Slovenia, Slovak Republic and Czech Republic.
Bratislava: United Nations Development Programme.

Social Situation Observatory – Social inclusion and Income distribution Draft final report
December 2006 231
10. THE POSITION OF ETHNIC MINORITIES ACROSS THE EU65
Introduction
Assessing the relative position of those belonging to ethnic minorities in different parts of the
EU in terms of their access to education, employment, decent housing and a similar standard of
living as the population at large is by no means easy. Although there is piecemeal evidence that
many of the people concerned suffer significant disadvantage in all these areas, data are
lacking to formulate anything close to a complete and reliable picture of the actual situation.
This is partly because of the understandable reluctance of many governments, given the use to
which such data have been put historically, to countenance the inclusion in official surveys or
statistical enquiries generally of questions on the ethnic or racial origin of respondents. It is
also, however, because of the inherent difficulty of collecting the necessary information from
people who have little incentive to reveal that they belong to a minority group in a context
where the group concerned might be subject to discrimination and unequal treatment.
Accordingly, any assessment of their position has to rely either on indirect means of compiling
the data required or on special surveys and case studies targeted specifically on this particular
issue. The surveys carried out in the recent past into the position of Roma in central and
southern eastern European countries, which are described elsewhere in this report, are
examples of the latter.
The concern here is twofold. First, it is to set out what can be learned from the indirect data
available on the position of ethnic minorities, in this case on their access to employment and
jobs suited to their qualifications from the statistics collected by the EU Labour Force Survey
which distinguish nationality. Secondly, it is to review recent studies which have been carried
out on this issue and to present the data which they have compiled to illustrate the extent of
the disadvantage experienced by ethnic minorities in different areas across the EU. This is
intended to compliment the analysis of the position of Roma in particular countries presented
elsewhere, though unlike this analysis, it is often not possible to distinguish between different
minorities and all of the groups concerned are implicitly assumed to be in the same position,
which is usually not the case in practice.
65 Applica, Terry Ward and Silvia Di Sante

Social Situation Observatory – Social inclusion and Income distribution Draft final report
December 2006 232
The employment circumstances of non-nationals
The only data which exist across the EU which relate to the ethnic origin of those in
employment are the statistics distinguishing nationality collected as part of the EU Labour Force
Survey. From these it is possible to identify those living and working in different Member States
who are nationals of countries outside the EU. Such people can be regarded as belonging to an
ethnic minority, though in many cases they are predominantly made up of those who have
migrated into the EU in the recent past and indeed the data concerned are often used to
examine the position of immigrants. They give an incomplete picture of ethnic minorities – or
even of recent immigrants – to the extent that these are not necessarily non-nationals of the
Member State in which they live since many will have taken nationality of the country
concerned. Indeed, many are likely to be second or even third generation migrants who were
born in the EU but still belong to an ethnic minority. The Roma, who have lived in Europe for
many centuries, illustrate this point very well
The extent to which non-nationals can reasonably be regarded as a proxy for ethnic minorities
varies considerably across the EU, according in part to the regulations governing nationality in
different countries. In some Member States, therefore, it is relatively quick and easy for
migrants to assume the nationality of the country they have moved to, in others, such as
Germany, it is more difficult and more protracted. In the latter countries, therefore, there is
likely to be a closer correspondence between non-nationals and ethnic minorities. In the
former, a very loose one. Nevertheless, the position of non-nationals (or more specifically of
nationals from countries outside Europe) might still reflect, or at least be indicative of, the
position of ethnic minorities, to the extent that they are likely to be a subset of the latter. This
is essentially the assumption adopted here, primarily because there is little practical alternative
if the aim is to build up a picture of the employment circumstances of ethnic minorities across
the EU. It should be emphasised, however, that it is an assumption and one which is based on
no real evidence of how far the two groups correspond in reality. This should be kept firmly in
mind when interpreting the results of the analysis.
ACCESS TO EMPLOYMENT OF NON-NATIONALS
The average employment rate of non-nationals living in the EU – the proportion of those aged
15-64 in employment – is considerably lower than that of nationals. (The term ‘non-nationals’
is used here and below to denote those who are nationals of countries outside Europe and
‘nationals’ to denote those with EU nationality.) In 2005, it was 55.5% as against a rate of
almost 65% for those of EU nationality. The difference, however, was very much concentrated
among women, for whom the gap was over 13 percentage points as opposed to one of 5.5% for
men. The difference was also larger in the EU15 countries taken separately than in the EU as a

Social Situation Observatory – Social inclusion and Income distribution Draft final report
December 2006 233
whole (almost 12 percentage points as against just 9 points), reflecting the as yet relatively few
non-nationals living in the new Member States (which are, therefore, excluded from the present
analysis) coupled with their low employment rate among nationals (which accordingly pulls
down the EU average for nationals without altering the rate for non-nationals) (Table 1).
These differences in employment rates are common to all EU15 Member States except those in
the south. In Greece, Spain and Portugal (there are no data for Italy), in stark contrast to
elsewhere, the proportion of non-nationals of working age who are in employment is
significantly larger than that of nationals, among men as well as women. In the rest of the
EU15, the employment rate in 2005 of men and women taken together ranged from being
around 10 percentage points lower than that of nationals in Ireland and Austria and 15
percentage points lower in the UK to just under 20 percentage points lower in Germany and
France, around 25 parentage points lower in Belgium and the three Nordic countries and over
30 points lower in the Netherlands.
These differences have tended to narrow over recent years. In the EU15 as a whole, the gap
between the employment rate of nationals and non-nationals was reduced from just over 15
percentage points to just under 12 between 2000 and 2005. The reduction, however, was partly
a result of a widening difference in the opposite direction in the three southern countries and
was not common to all Member States in the rest of the EU15. In Germany, the gap widened by
around 2.5 percentage points and in the Netherlands by 4 points. Only in Belgium and the UK
did the gap narrow by more than 2 percentage points.
Similarly large differences are found in average unemployment rates between nationals and
non-nationals. In 2005, the average rate of unemployment among nationals in the EU15 was
just under 8%. The average rate for non-nationals was almost 17%, with the gap being much the
same for women as for men. (It should be noted that employment rates tend to give a more
complete picture of the relative access of non-nationals to employment since they take account
of differences in participation rates as well as in unemployment and, as such, any tendency for
non-nationals to be discouraged from actively seeking work at all because of the problems
involved in finding a job.)
It is also relevant that people from other European countries who are resident in the EU do not
have a similarly lower employment (or unemployment) rate than nationals. In 2005, therefore,
the average employment rate of those from another part of Europe living in an EU15 Member
State was much the same as that of nationals, as it was in nearly all of the countries.
Social Situation Observatory – Social inclusion and Income distribution Draft final report
December 2006 234
DIFFERENCES IN EDUCATION LEVELS
These differences in employment and unemployment rates do not necessarily reflect underlying
differences in access to employment. They could, in particular, be a consequence of differences
in the age composition of non-nationals as opposed to nationals or in education levels. Since
the gap between nationals and non-nationals is evident across the age range, differences in age
composition are not a major factor, although the gap tends to be relatively wide among
younger age groups which might reflect a greater tendency for non-nationals among these to
be in full-time education. This could well be the case since the latter are likely to include a
large number of recently-arrived migrants who have moved to the EU with the specific intention
of studying or receiving training. Differences in education levels are a more plausible source of
the gap in employment rates given that the likelihood of someone being in work is closely
related to their level of education and given also that the average education level of non-
nationals in the EU tends to be significantly lower than of nationals.
In the EU15 as a whole in 2005, therefore, around 28% of men aged 25-64 with EU nationality
had only a basic level of education, in the sense of no qualifications beyond lower secondary
level – or compulsory schooling. This compares with a figure for non-nationals of 42%.
Similarly, some 28% of men in this age group had tertiary education (a university degree or the
equivalent), while the figure for non-nationals was only 19%. The difference for women was
much the same in respect of the proportion with basic schooling (just under 33% as opposed to
almost 47%) and only slightly smaller for those with tertiary education (almost 26% as against
just under 20%) (Table 2).
This difference is repeated in varying degree across EU15 Member States, though less so in
Spain and Portugal, where a relatively large proportion of nationals have only basic schooling,
as well as Ireland and Sweden – and in Denmark for men – where a relatively large proportion of
non-nationals have tertiary education (reaching over 40% for men in Ireland and over 50% for
women).
EMPLOYMENT RATES BY EDUCATION LEVEL
Although these differences in education levels might explain some of the gap in employment
rates between nationals and non-nationals, they are only part of the explanation. This can be
seen in the fact that for each education level, the proportion of nationals of working age in
employment is significantly larger than for non-nationals in most EU15 countries. The gap,
moreover, is especially pronounced for those with the highest education level.
In the EU15 countries taken together, therefore, the proportion of men aged 25-64 with EU
nationality and only basic schooling who were in employment in 2005 averaged just under 71%,

Social Situation Observatory – Social inclusion and Income distribution Draft final report
December 2006 235
over 5 percentage points more than non-nationals with the same level of education. For men
with tertiary education – university graduates or the equivalent – the proportion in employment
was 88% for nationals and just 75% for non-nationals (Table 3).
For women, the gap in employment rates between nationals and non-nationals was much the
same for those with basic schooling (7 percentage points instead of 6) but for those with
tertiary education, it was even wider (almost 22 percentage points – only just over 60% for non-
nationals as opposed to 82% for nationals).
These differences are repeated in the majority of EU15 Member States. With the exception of
the three southern countries, Greece, Spain and Portugal, non-nationals with a given level of
education had a significantly lower employment rate than nationals with the same level. In most
Member States, moreover, the gap between employment rates was wider for those with tertiary
education than for those with lower education. This is particularly the case for women. In
Belgium, Germany, France and the Netherlands, therefore, women non-nationals with tertiary
education had an employment rates that was over 30 percentage points lower than for
nationals. (The gap is equally wide in Finland and Sweden, though here the numbers involved
are relatively small so the data may not be reliable.) By contrast, in the UK, the gap is only 6
percentage points, much lower than elsewhere in the EU15, which may be a reflection of a
difference in the nationality, or ethnic origin, of the non-nationals concerned from that in other
countries rather than, or as well as, a more favourable context for integration.
A gap also exists for women with tertiary education in the three southern countries. Although
for those with lower education levels, non-nationals have a higher employment rate on average
than nationals, this is not the case for those with tertiary education. In all three countries, non-
nationals with this level of education have a lower employment rate than nationals and while
the difference is smaller than in the countries listed above, it was still substantial in 2005
(almost 20 percentage points in Greece and Spain and around 13 percentage points in
Portugal).
It is arguable that these differences in employment rates reflect different attitudes and cultural
norms towards women working among non-nationals – even among those with university
education – than among EU nationals more than any obstacles to them accessing employment.
This possibility, however, does not seem consistent with the much higher unemployment rate
among non-nationals with tertiary education who are actively seeking work than among
nationals. In 2005, therefore, whereas unemployment among non-nationals with this level of
education averaged under 5% for non-nationals it was 13%. (For those with basic education, the
rates were 11% and 20%, respectively).

Social Situation Observatory – Social inclusion and Income distribution Draft final report
December 2006 236
It is equally the case, as noted, that employment rates among men from outside Europe with
tertiary education, for whom the same argument about attitudes and cultural norms does not
hold, also tend to be significantly lower than for EU nationals and this holds in nearly all
Member States. In Germany, the employment of non-nationals with this education level was
some 15 percentage points lower, in France and the Netherlands, around 25 percentage points
lower and in Belgium, 30 points lower. Even in the UK, where the gap was smaller than
elsewhere in the north of the EU, the difference was still 10 percentage points. Moreover, as for
women, non-nationals with tertiary education in Spain and Portugal, unlike those with lower
education, also had a lower employment rate than nationals (in Spain, 8 percentage points
lower, in Portugal 16 points lower). Only in Greece were a larger proportion of non-nationals
with this education level in employment than nationals.
Examining the situation by broad age group indicates that the gap in employment rates
between nationals and non-nationals tends to be wider for the younger members of the
potential work force with tertiary education than the older members. In the EU15 as a whole,
some 92%of men aged 25-64 with EU nationality and tertiary education were in work in 2005 as
opposed to only just under 76% of non EU nationals, a difference of some 16 percentage points
as against one of 11 percentage points for men aged 40-64 with this education level. (For
those with basic education, the difference was around 9 percentage points for men aged 25-39
and just under 7 percentage points for those aged 40-64.)
For women, the difference is even more pronounced. Whereas the employment rate of nationals
aged 25-39 with tertiary education averaged around 84% in the EU15, for non-national, it
averaged only 57%, a gap of 27 percentage points and over twice the difference for women
aged 40-64 (13 percentage points). These differences are broadly repeated in nearly all
Member States.
A potential qualification to the above findings should, however, be borne in mind. Although an
attempt has been made in the LFS, from which these data derive, to harmonise education levels,
in the sense of assigning the level attained in countries outside Europe to the equivalent level in
the EU, this is by no means straight-forward. Tertiary qualifications obtained in other countries,
therefore, may not be equivalent to those obtained in the EU. It is questionable, however,
whether they are systematically of a lower level in terms of the competencies and skills that
they are associated with. Nevertheless, there is a need for caution when interpreting the results
presented here.

Social Situation Observatory – Social inclusion and Income distribution Draft final report
December 2006 237
THE KINDS OF JOB WHICH NON EU NATIONALS ARE EMPLOYED IN
In view of the lower average education level of non-nationals than of EU national, it is only to
be expected in those moving into the EU from third countries, it would be expected that they
would be employed disproportionately in relatively low skilled activities. This indeed seems to
be the case. In EU15 Member States as a whole, non-nationals accounted for 25% of total
employment in private households (working as domestic servants and so on) in2005, for
around 13% of employment in hotels and restaurants and for 8% of employment in
construction. In Spain, almost half of those employed in private households were non-EU
nationals and in Greece, just over 60%, while in the former as well as in Austria, non-EU
nationals made up around 20% of employment in hotels and restaurants.
Perhaps a more relevant question from the perspective of the social integration of non-
nationals is not so much whether they are employed disproportionately in low-skill jobs per se,
but whether the jobs concerned are in line with their abilities, as indicated in particular by their
educational levels. This can be considered by examining the jobs – or occupations – which non-
nationals with particular education levels perform and how far they differ from those performed
by nationals. The most interest in this regard is in those with high education levels and how far
they tend to be employed in jobs which either accord with or fall short of their apparent
capabilities or level of education.
The evidence suggests that a significant proportion of non-nationals with tertiary education
occupy jobs which do not match their qualifications (though the above observation on the
comparability of the qualifications obtained in other countries with those obtained in the EU
should be kept in mind). Under 10% of men aged 25-64 of non-EU nationality and with tertiary
education were employed in managerial positions, under two-thirds the proportion of nationals
with this education level, while some 32% were employed as professionals, three-quarters of
the proportion of nationals (Table 4).
Much the same is also true of women. In particular, the proportion of non-nationals working as
professionals was only just over half the proportion of nationals. Conversely, a much larger
proportion of both men and women with non-European nationality with this level of education
were employed in elementary occupations (ie low skill manual jobs) than nationals – an average
of 13% of men and almost 17% of women as opposed to only just over 1% in the case of
nationals. Equally, the proportion of non-nationals with tertiary education employed in sales
and service jobs (as shop assistants for example) in the EU15 was almost 3 times as large as for
nationals in the case of women and twice as large in the case of men. Over a third of women
from outside the EU with university degrees or the equivalent and almost 20% of men,

Social Situation Observatory – Social inclusion and Income distribution Draft final report
December 2006 238
therefore, worked in relatively low skill manual or non-manual jobs. These figures are over four
times as high as for nationals.
A similar pattern holds in individual Member States. In France, for example, almost 17% of men
who were nationals of countries outside Europe and had university degrees of the equivalent
worked in low skill manual jobs in 2005 as against under 1% of nationals with the level of
education, while in Spain, the figure was over 20% as against only 2% of nationals. In Spain, the
difference in the pattern of employment for women graduates between national and non-
nationals was even more stark. While only just over 2% of nationals with tertiary education
worked in low skill manual jobs, the figure for non-nationals was 36%. In Greece, almost 42% of
women from outside Europe with this education level worked in this type of job in contrast to
under 1% of nationals. In addition, over 62% of women graduates with EU nationality were
employed as professionals but under 11% of non-nationals.
More direct evidence on the relative position of ethnic minorities
As emphasised at the outset, the above analysis of the position of non-nationals in the labour
market is a relatively tenuous means of examining the situation of ethnic minorities across the
EU. It is, however, because of lack of data on ethnicity, the only way to cover the EU as whole,
and although a significant number, perhaps even the large majority, of people belonging to an
ethnic minority are nationals of the country in which they live and, accordingly not included in
the statistics for non-nationals, the latter may, nevertheless, give an indication of their relative
position.
The concern here is examine more direct evidence on the situation of ethnic minorities across
the EU from recent studies and surveys of the most important aspects of their position,
including education and housing as well as employment, though employment is considered first
in order to complement – and support – the analysis above.
EMPLOYMENT AND UNEMPLOYMENT
Because of the unwillingness of governments across the EU to collect such data, relatively few
statistics exist on employment or unemployment rates of ethnic minorities. There are, however,
some data for Denmark, the Netherlands and the UK – Member States which not only collect
such statistics but which have set explicit objectives to reduce the apparent disadvantage on
the labour market which ethnic minorities experience. The national data available broadly
confirm the results of the above analysis.
In Denmark, therefore, the activity rate (ie the number employed plus unemployed as a
percentage of working-age population) of immigrants from countries outside Europe, or more

Social Situation Observatory – Social inclusion and Income distribution Draft final report
December 2006 239
specifically, non-Western countries, averaged just 53% in 2004, some 25 percentage points
lower than the rate for those of Danish origin (see table). Although the rate for descendants of
former migrants from outside Europe was higher than for immigrants, at 63%, it was still some
15 percentage points below the rate for ethnic Danes. Moreover, although the latter gap
narrowed in the late 1990s in the context of economic growth, it widened again between 2001
and 2004 as economic growth slowed down.
Economic activity rate in Denmark by ancestry, 1997-2004
1997 1998 1999 2000 2001 2002 2003 2004Persons of danish origin 78.9 79 79.2 79.2 79.5 79.6 78.6 78.4Immigrants 54.8 55.3 56.2 55.6 56.3 56.1 55.6 56.6Immigrants from western countries 65.8 65.6 65.3 65 65.5 65.3 64.3 63.7Immigrants from non-western countries 47.9 49.1 50.8 50.3 51.4 51.4 51.3 53.2Descendants 67.3 67.9 69.4 70.3 71.1 70.7 68.3 66.8Descendants from western countries 75.9 76.2 76.4 77.1 77.4 77 75.1 74.7Descendants from non-western countries 59.3 61 64.2 65.7 67.1 67 64.6 62.9
In the Netherlands, unemployment among ethnic minorities is officially estimated to have
averaged 16% in 2004 as opposed to an overall rate of only just over 6% (data published in the
Employment Reform Programme for 2006 for the Netherlands) Both the unemployment rate for
ethnic minorities and the gap with the overall rate were greater than in 2003 (when the rate for
the former was just over 14% and the overall rate just over 5%).
In the UK, the difference in the average employment rate for the population as a whole and that
for ethnic minorities was 15.7 percentage points in 2003, according to official figures, the gap
for women – in line with the above analysis being wider than for men (see table). The gap
narrowed slightly between 2001 and 2003.
Employment rate gaps in the UK: difference in the rate for ethnic minorities relative to the overall rate(percentage point difference)
2001 2002 2003Total population -16.7 -16.5 -15.7Women -19.7 -19.8 -18.8Men -13 -12.7 -12
EDUCATION
Ensuring equal access to education can play a major part in reducing the risk of social exclusion
among ethnic minorities, not least because it has an important influence on employment
prospects and earning capacity. (Despite the fact, as shown above, that the employment rate of
non-nationals with tertiary education is substantially below that of nationals, it is still
significantly higher than for those with lower education.) The evidence from studies carried out
on the position of children from ethnic minority groups across the EU in respect of education

Social Situation Observatory – Social inclusion and Income distribution Draft final report
December 2006 240
indicates that their attainment levels tend to be significantly lower and their drop-out rates
higher. Moreover, the evidence also suggests that segregation of such children in special
schools, or, more generally, in schools in which there are relatively few children of the majority
population, is marked in many countries. This, therefore, is not just a feature of the treatment
of Roma children, as indicated elsewhere in this report, but applies to ethnic minorities more
widely.
Effective segregation is a result both of a growing concentration of ethnic minorities into
certain areas, such as in inner cities, or of the policy of some authorities to concentrate
foreign-born children in certain schools, with the intention in part of catering for their language
difficulties. Whatever the intention, parents of other children tend to avoid placing them in such
schools. (OECD, 2006).
It is also the case that children from ethnic minorities, not just Roma, are over-represented in
special schools in many EU countries. For example, in Austria, while children of non-Austrian
origin made up just over 9% of pupils in schools in the academic year 2001-2002, they
accounted for almost 21% of children in special schools (Caritas Europe, 2006). In the French
community in Belgium, over 18% of foreign children are reported to be in special schools.
(According to the EUMC report on Belgium, special schools are intended for children ‘with
character and/or personality problems’. Children are assessed for referral to such schools and
recommendations are made to parents in this regard, who have the right to agree or not. In
practice, those from ethnic minorities tend to be deterred from disagreeing so that
recommendations are invariably followed – EUMC comparative study, June 2004).
In Germany, too, foreign children are systematically disadvantaged, according to a study by the
German Union for Education and Science. Since the 1980s, twice as many foreign children have
attended special schools than German children (German Union for Education and Science,
2006). In addition, children from immigrant families finish school at an earlier age with
significantly lower qualifications than German children. In 2001, over 20% of the 75 thousand of
so children of foreign nationality finishing school left without formal qualifications as compared
with under 9% of German children, while 29% obtained the general certificate of secondary
education as opposed to 42% of Germans. Moreover, only around 11% of foreign children
attained the right to study at university as compared with almost 26% of German children.
Equally, some 39% of young people from countries outside Germany leaving vocational schools
in 2001 did not receive a school-leaving certificate compared with just under 20% of Germans
(EUMC comparative study, June 2004).
Similarly, in Denmark, children from ethnic minorities are twice as likely to drop out of school
as Danes, while in vocational education, their drop-out rate is around 60% higher and even at

Social Situation Observatory – Social inclusion and Income distribution Draft final report
December 2006 241
universities, their drop-out rates is almost 25% as against 13% for Danes (EUMC comparative
study, June 2004).
The same is true in the Netherlands, where more children from ethnic minorities leave school
without qualifications than Dutch children, the tendency being especially marked among
Turkish and Moroccan children (EUMC comparative study, June 2004).
In France, the probability of a 6th-form student leaving the education system without
qualifications is around 15% in the case of those from immigrant families as compared with
under 9% for those from French students. In the Flemish part of Belgium, just over 42% of non-
Belgians left secondary school without obtaining a certificate in 2000 as opposed to just 18% of
Belgians(Etude et Direction de l’Evaluation et de la Prospective, 2003).
HOUSING
In many European countries, the housing market has undergone considerable change over
recent decades. In particular, access to housing has become more market-driven, in part as a
result of the process of privatisation of public housing in many countries as well as in Central
and Eastern Europe and the reduction or removal of housing subsidies. The stock of public
housing available for those with low income levels and in need of accommodation has,
therefore, diminished significantly. This has hit migrant families in particular, not only directly
but indirectly as a result of increased pressure on the low end of the rental market.
In a number of areas across the EU, property owners have taken advance of the situation of
immigrants, especially those who have no legal right to stay in the country, and demand
unreasonably high rents for r poor quality dwellings. In Germany, for example, various studies
of the housing market have shown that immigrants pay considerably higher rents than German
nationals for poorer housing because of landlords demanding ‘discrimination supplements’
(Edgar, Doherty and Meert, 2004). A similar study for Austria found the same thing (Biffl and
Bock-Schappelwein, 2003).
In Spain, a 2004 study found that 10% of Portuguese, Algerians and Moroccans lived in sub-
standard private rental accommodation, while this was also the case of 12% of Turks and 16% of
those from sub-Sahara Africa (Edgar, Doherty and Meert, 2004). In Belgium, hundreds of
premises that have been declared uninhabitable are being let to illegal immigrants at very high
rents. In Italy, immigrants are often forced by the difficulty of acquiring a deposit or references
into the informal rental sector where over-crowding, poor quality housing and excessive rents
are the norm (Sunia Ancab – Lega Coop 2000).
The lack of access to decent housing for many immigrants leads to concentrations of
immigrants and ethnic minorities in specific areas. In the UK, for example, more than 50% of

Social Situation Observatory – Social inclusion and Income distribution Draft final report
December 2006 242
Pakistani and Bangladeshi households in England are in the 10% most deprived wards and a
third of Black Caribbean households are in these areas as opposed to only 14% of white
households (Edgar and Meert, 2005). In France, 58% of all immigrants live in just three French
regions – 37% in the Paris region, 11% in Rhone-Alpes and 10% in Provence-Alpes-Cote d’Azur.
The concentration is even greater in some municipalities: in Bobigny, Montreuil and
Aubervilliers, 50% of the people living there are immigrants and in Mureaux, Val-Fourré and
Trappes on the outskirts of Paris or in Minguettes outside Lyon, around 75% of the population
are of African origin. (Caritas, 2006, Conseil Economique et Social, 2003).
Many women immigrants are at particular risk of homelessness because of domestic abuse or
abandonment. In Denmark, a survey conducted in 2000 found that 32% of women at crisis
centres were of non-Danish origin and 35% were from minority ethnic groups (Research and
Information Centre for Social Work, 2000), while in Germany, statistics from the women’s
housing coordination authority showed that some 50% to 80% of the occupants of women’s
shelters in large cities such as Berlin, Hamburg and Munich in the early part of the present
decade were immigrants (Busch-Geetsema 2003).

Social Situation Observatory – Social inclusion and Income distribution Draft final report
December 2006 243
References
Biffl, G., Bock-Schappelwein, J. (2003), Austrian Migration and Integration report, 2003.
Busch-Geetsema, V., Immigration and Homelessness in Germany, Report for the European Observatory on Homelessness, FEANTSA, Brussels, (2003).
Caritas Europe (2006), Migration, a journey into poverty?, a Caritas Europe study on poverty and exclusion of immigrants in Europe, 3rd Report on poverty in Europe – 2006.
Conseil Economique et Social (Economic and Social Council): Les defies de l’immigration future, (The challenges of the future immigration), (2003).
URL: http://www.conseil-economique-et-social.fr/ces_dat2/2-3based/base.htm
Edgar, B. Doherty, J. and Meert, H. (2004), Immigration and homelessness in Europe, FEANTSA European Observatory on Homelessness, Brussels, October 2004.
Edgar, B. Doherty, J. and Meert, H. (2004), “Homelessness Research in the European Union”, FEANTSA, European Federation of National Organisations Working with the Homeless, October, 2004.
Edgar, B. and Meert, H. (2005), in collaboration with the correspondents of the European Observatory on Homelessness, “Fourth Review of Statistic on Homelessness in Europe”, FEANTSA, European Federation of National Organisations Working with the Homeless, November, 2005.
Etude Direction de l’evaluation et de la prospective (2003), Les inegalités de scolarisation: disparités et/ou terroriales, France, 2003.
European Monitoring Centre on Racism and Xenophobia (2003): “Migrants, minorities and employment: Exclusion, discrimination and antidiscrimination in 15 member states of the European Union”, Equality and Diversity for an inclusive Europe, EUMC Comparative Studies. Vienna, October 2003,
European Monitoring Centre on Racism and Xenophobia (2004), “Racism and Xenophobia in the EU Member States, trends, developments and good practice”, EUMC Annual Report 2003/2004
European Monitoring Centre on Racism and Xenophobia (2004): Migrants, Minorities and Education – documenting discrimination and integration in 15 member states of the European Union, Equality and diversity for an inclusive Europe, EUMC comparative studies, EUMC, Vienna, June 2004.
German Union for Education and Science (2006), Gewerkschaft Erziehung und Wissenschaft, Auslanderkinder warden systematisch benachteiligt. (Migrant children are systematically discriminated against), 2006.
OECD (2006), “Where immigrant students succeed - A comparative review of performance and engagement in PISA 2003”, Programme for international Student Assessment (PISA), OECD 2006.
Research and Information Centre for Social Work: “Women from ethnic minorities at crisis centres in Denmark”, Esbjerg, RICSW, 2000.
Sunia Ancab – LegaCoop: Condizioni abitative degli immigrati in Italia (Housing conditions of migrants in Italy), Rome, 2000.

Social Situation Observatory – Social inclusion and Income distribution Draft final report
December 2006 244
Tables
Table 1. Employment rates by nationality of men and women aged 15-64, 2005 1)
BE DK DE EL ES FR IE IT LU NL AT PT FI SE UK EU 15Total 61.0 75.5 65.3 60.3 63.2 62.8 67.1 : : 73.2 67.6 67.6 69.2 72.6 71.5 66.4men 67.7 80.1 71.1 74.5 75.0 68.4 76.2 : : 80.0 73.5 73.4 70.9 74.6 77.3 73.2women 54.1 70.8 59.3 46.2 51.2 57.4 58.0 : : 66.4 61.8 61.9 67.4 70.5 65.8 59.5Nationals 61.9 76.3 66.7 59.8 62.5 63.5 67.0 : : 74.1 68.3 67.5 69.5 73.5 72.1 67.0men 68.3 80.5 72.1 73.8 74.5 68.6 75.9 : : 80.7 74.1 73.3 71.1 75.3 77.8 73.6women 55.4 72.0 61.2 46.0 50.2 58.5 58.1 : : 67.5 62.5 61.8 67.8 71.6 66.5 60.4Non-EU nationals 35.1 51.1 48.2 69.0 70.5 44.5 56.9 : : 41.4 57.7 72.7 45.2 46.0 57.9 55.3men 49.2 61.9 58.9 85.1 79.8 58.7 68.0 : : 54.0 64.8 79.4 54.0 50.9 65.8 65.7women 20.6 43.9 37.0 50.8 61.2 29.8 44.9 : : 29.1 50.4 66.3 37.7 41.7 50.5 44.7
Source: Eurostat, EU Labour Force Survey1) Data for new Member States and accession countries because the number of observations is too small to be reliable.
Table 2. Population aged 25-64 by education level, 2005 1)
BE DK DE EL ES FR IE IT LU NL AT PT FI SE UK EU 15WomenNationalsLow 35.1 19.8 16.7 42.4 52.8 33.8 33.4 : : 31.6 27.8 72.2 18.7 14.1 34.1 29.6Medium 33.1 44.9 62.8 38.0 18.9 39.6 37.5 : : 40.6 57.4 13.0 41.6 52.0 36.5 46.3High 31.8 35.3 20.4 19.6 28.3 26.6 29.1 : : 27.9 14.8 14.8 39.7 33.9 29.4 24.1Non-EU nationalsLow 54.1 33.9 54.2 41.4 42.6 64.4 13.7 : : 45.2 49.0 59.0 31.3 26.4 22.5 45.5Medium 23.0 37.3 31.0 42.1 32.4 19.8 32.6 : : 37.7 36.6 28.1 44.7 36.6 51.7 34.5High 23.0 28.7 14.7 16.6 25.0 15.7 53.8 : : 17.0 14.4 12.9 24.0 37.1 25.8 20.0
MenNationalsLow 34.3 17.5 10.1 43.0 52.4 30.1 39.8 : : 24.7 14.5 76.4 22.8 18.1 24.8 25.4Medium 35.9 52.5 59.8 34.9 19.2 45.9 34.0 : : 42.1 64.5 13.3 47.5 57.2 45.2 49.4High 29.8 30.0 30.1 22.0 28.5 24.0 26.2 : : 33.2 21.0 10.3 29.7 24.7 30.0 25.2Non-EU nationalsLow 49.0 27.7 40.9 53.4 48.6 58.3 19.8 : : 37.6 37.1 63.1 28.9 27.1 20.4 41.3Medium 27.8 31.2 42.9 35.8 30.1 24.3 38.6 : : 43.2 51.0 23.2 49.3 38.9 55.4 39.4High 23.2 41.0 16.1 10.8 21.4 17.5 41.6 : : 19.2 11.9 13.7 21.8 34.0 24.2 19.3
Source: Eurostat, EU Labour Force Survey1) Data for new Member States and accession countries because the number of observations is too small to be reliable.

Social Situation Observatory – Social inclusion and Income distribution Draft final report
December 2006 245
Table 3. Employment rates of men and women by nationality and education level for selcted age groups 1)
BE DK DE EL ES FR IE NL AT PT FI SE UK EUMen25-39Nationals Low 76.3 73.9 68.4 87.6 84.7 76.9 79.1 85.7 74.7 88.0 69.8 76.5 66.1 79.8
Medium 90.2 89.1 83.8 89.0 87.2 89.1 92.8 93.3 90.0 82.0 85.9 87.8 89.9 87.6High 94.5 91.6 93.8 88.0 88.2 88.8 94.7 94.0 93.4 91.2 93.7 89.2 94.8 91.7
non-EU nationals Low 48.1 76.1 54.7 95.1 82.8 62.7 75.0 55.1 41.6 85.6 48.1 34.0 57.0 70.8Medium 21.6 73.4 53.8 95.6 89.6 66.7 68.0 58.2 100.0 89.8 76.9 54.4 78.0 73.7High 55.5 26.3 76.1 100.0 83.6 68.7 78.2 62.9 70.4 57.4 78.4 58.5 79.2 75.7
40-64
Nationals Low 57.0 66.3 60.0 74.0 72.9 61.8 72.5 71.6 56.4 74.7 58.8 73.5 57.5 66.6Medium 77.7 81.9 72.2 82.2 84.2 75.3 86.2 79.0 71.3 81.3 73.7 83.2 82.3 77.0High 85.0 88.1 83.7 87.8 87.4 83.4 91.6 84.7 80.7 89.2 82.8 88.2 86.6 85.1
non-EU nationals Low 54.7 38.1 51.0 87.0 84.3 51.6 54.6 23.8 7.3 79.4 79.0 46.2 47.0 60.1Medium 77.8 92.1 64.9 72.0 89.7 65.2 69.9 61.0 77.5 100.0 67.5 49.3 80.5 75.2High 68.1 58.5 69.2 100.0 73.7 75.5 75.4 66.6 76.6 84.1 66.6 65.9 83.5 74.2
25-64
Nationals Low 61.9 68.3 62.9 77.8 77.1 66.0 74.3 75.8 61.2 79.7 61.1 74.1 59.6 70.7Medium 83.2 84.6 76.5 85.7 85.7 80.7 89.7 84.8 79.2 81.7 78.8 85.1 85.2 81.2High 89.3 89.6 87.0 87.9 87.8 86.2 93.3 88.3 85.5 90.2 86.7 88.6 90.0 87.9
non-EU nationals Low 50.4 72.4 53.2 93.2 83.2 55.8 66.6 45.8 28.8 83.3 60.3 40.2 52.8 66.4Medium 41.8 79.5 58.2 89.1 89.6 66.2 68.2 59.0 93.2 92.0 74.8 52.2 78.9 74.2High 59.9 47.0 72.5 100.0 79.8 71.4 77.5 64.4 73.1 74.8 72.5 62.9 80.6 75.1
Women25-39Nationals Low 45.5 55.8 52.5 46.3 48.7 53.1 46.0 60.4 64.8 72.8 64.1 55.7 37.5 52.8
Medium 75.9 79.8 71.6 60.3 66.5 72.6 71.1 81.3 78.9 78.8 71.5 80.7 72.8 72.6High 91.6 88.1 82.6 77.9 79.2 81.9 86.8 91.4 88.6 91.1 82.0 86.9 87.5 83.9
non-EU nationals Low 16.4 11.6 30.7 70.5 58.5 28.4 19.1 23.8 46.1 82.7 15.7 24.6 19.1 40.7Medium 30.9 46.8 43.4 51.1 74.4 34.4 40.1 34.1 57.0 60.0 53.3 36.3 51.6 53.9High 30.5 69.9 36.4 39.9 59.7 37.0 63.3 44.1 38.5 77.0 46.4 34.8 78.6 57.0
40-64
Nationals Low 36.1 52.3 46.0 34.9 33.3 52.0 38.2 44.7 41.4 58.4 53.4 57.5 53.1 45.0Medium 59.7 71.4 62.2 46.1 58.6 67.5 60.5 65.5 58.9 74.0 72.4 76.8 78.5 66.7High 74.9 83.0 78.2 76.2 78.8 76.0 79.5 76.6 79.6 84.3 82.9 89.6 86.3 80.2
non-EU nationals Low 15.1 36.9 29.3 50.7 56.7 33.1 26.8 11.0 8.5 70.1 40.7 34.4 32.0 38.2Medium 0.0 81.4 49.6 84.0 84.7 44.0 47.9 37.9 86.1 65.5 43.5 53.9 62.6 63.9High 26.3 84.3 56.1 70.1 62.7 61.0 57.1 44.8 78.8 71.7 48.6 63.5 84.3 67.0
25-64
Nationals Low 37.9 53.1 47.6 37.1 37.5 52.2 40.1 48.2 46.4 63.0 54.9 57.2 49.6 46.9Medium 66.8 74.6 65.6 53.5 62.6 69.6 65.6 72.3 67.1 77.1 72.1 78.3 76.1 69.1High 83.0 85.2 79.9 77.2 79.0 79.2 83.8 83.4 84.1 88.3 82.5 88.5 86.9 82.1
non-EU nationals Low 15.8 21.8 30.1 57.9 57.8 31.4 21.0 19.1 28.4 78.5 23.5 27.8 24.1 39.6Medium 25.4 54.7 45.7 65.3 78.0 37.5 41.6 35.5 67.2 61.3 50.2 44.1 55.2 57.2High 29.3 73.9 43.2 59.2 60.7 45.7 62.2 44.3 57.1 75.5 47.4 44.5 80.7 60.5
Source: Eurostat, EU Labour Force Survey1) Where data are not shown, they are not available or too small to be reliable.

Social Situation Observatory – Social inclusion and Income distribution Draft final report
December 2006 246
Nationals non-EU nationals Nationals non-EU nationalsArmed forces 1.0 0.1 0.1 0.0Managers 16.3 9.7 8.3 6.8Professionals 43.5 32.3 42.8 23.8Technicians 19.2 13.8 27.9 23.2Office staff 4.2 4.0 11.3 9.8Sales+service 3.2 6.5 6.7 17.2Agricultural 1.3 0.7 0.4 0.1Craft+related 7.3 14.8 0.7 1.4Machine operators 2.5 5.3 0.5 1.0Elementary 1.4 12.8 1.2 16.7
Source: EU Labour Force Survey
Men Women
Table 4. Division of men and women with tertiary education between broad occupations by nationality in the EU15, 2005

Social Situation Observatory – Social inclusion and Income distribution Draft final report
December 2006 247
11. RECENT POLICY DEVELOPMENTS AFFECTING INCOME
DISTRIBUTION
Introduction
While fighting poverty and social exclusion are widely shared goals in the European Union,
responsibility for policy to achieve this lies firmly with Member States. While the latter have
pursued similar paths in many areas, the measures taken in respect of social benefits and
taxation to achieve particular objectives and the priority attached to different policy goals vary
significantly across countries. This variation reflects not only differences in the scale and nature
of problems encountered in this area (i.e. the extent and depth of poverty and social exclusion),
but also differences in underlying political and economic circumstances (e.g. in the resources
available and the state of public finances), institutional differences with respect to the design of
tax and benefit system, as well as differences in social values (e.g. towards redistribution and
poverty relief).
It is difficult, therefore, to detect common trends in the policy changes affecting income
distribution and the relative position of those on low incomes brought about by governments
across the EU and the four acceding and candidate countries in the last couple of years. This is
evident from the review of these changes presented below, which is based on information
provided by a network of country experts on the main developments in taxes, social benefits
and other relevant aspects of policy, as well as on their assessment of the effects of these on
the relative position of population groups with differing levels of income and in different
circumstances. The purpose of the review was on the one hand to examine the policy efforts
being made by governments across Europe to tackle the problems of low incomes identified in
this report, and on the other hand to assess how far the picture presented in earlier chapters,
which in most cases is based on data relating to the position a few years ago, is likely to have
changed in the intervening period.
The policy measures which have taken place mainly involve changes to income tax schedules,
social contributions and social benefits, though they also include changes in minimum wages
and social services. A widespread tendency has been to seek to increase incentives to work and
to restrain public expenditure, in particular to ensure the viability of social insurance schemes,
while at the same time trying to avoid reducing support for those on very low incomes by
extending minimum income guarantees. This is especially the case as regards those in

Social Situation Observatory – Social inclusion and Income distribution Draft final report
December 2006 248
retirement. Income tax rates have been cut and/or allowances increased in many countries,
along with attempts to simplify the tax system, and although those on low incomes have
tended to benefit, those on high incomes have usually benefited more. Moreover, any beneficial
effects at the bottom end of the scale have been tempered by the fact that many of the people
concerned do not pay tax and therefore receive no gain. The introduction of refundable tax
credits in a number of countries has gone some way towards addressing this problem.
The main policy changes since 2005 are outlined below country by country, starting with the
EU-25 countries, followed by the four acceding and candidate countries. Tables in the annex to
the chapter summarise the effect of the changes on the bottom 20% and top 20% of income
earners.
The EU-25 countries
In Belgium, the minimum income guarantee for the elderly GRAPA (Garantie de revenue aux personnes agées), introduced in 2004, was substantially increased by €90 per month for single
persons in 2005, bringing the guaranteed minimum income to €776 per month (i.e. a mere €1
below the 2004 official poverty line). The corresponding increase was €60 per month for those
cohabiting. An estimated 70,000 individuals were expected to benefit, at a budgetary cost of
€57 million per year.
On the other hand, in 2006 the terms and conditions under which a surviror’s pension can be
combined with income from work were redefined. In the new system, a joint income test will be
applied to the sum of surviror’s pension plus earnings, and a lower withdrawal rate of 50% will
take effect for incomes above the threshold.
More generally, a consensus has been established on the need to link future increases in the
value of pensions to the growth in wellbeing among the working population, rather than merely
to inflation as is currently the case. Nevertheless, the exact nature of the relevant mechanism is
still to be decided.
In August 2006, child benefits were supplemented by a lump sum for back-to-school costs
(Allocation de rentrée scolaire). The allowance, paid once per year on top of the standard child
benefit, varies by age. Families receive €50 for each child at primary school (aged 6-12), and
€70 per child at secondary school (aged 12-18). The allowance is universal, paid to all children
irrespective of income or employment status of parents, at an estimated cost to the budget of
€87.6 million.
With respect to in-work benefits, the social security contributions rebate for low earners (Bonus à l'emploi / Werkbonus) became more generous, while at the same time the rate at which the

Social Situation Observatory – Social inclusion and Income distribution Draft final report
December 2006 249
rebate diminishes as earnings rise, known as taper, was reduced. Under the new scheme, low-
paid workers are entitled to a maximum rebate of €105 per month, which means that those
working for the minimum wage will be fully exempted from social security contributions. The
level of the rebate is then gradually reduced until gross earnings reach a level of about €2,000
monthly, when it is fully withdrawn.
Finally, the phasing-in of the 2001 tax reform was completed in 2005, when the tax credit for
earnings from self employment was increased, the middle tax brackets were broadened further,
the value of the single person allowance was aligned to that of the married person allowance,
and the tax deductibility of work-related expenses was enhanced. The latter, which has taken
immediate effect as of 2006, is estimated to boost the net income of those earning less than
€1,500 a month by €32 per year.
In the Czech Republic most of the changes affecting the income distribution concerned
taxation. In 2005, the tax allowance for dependent children (CzK 25,560 or €917) has been
replaced by a tax credit (CzK 6,000 or €215). Those earning too little to pay any tax are now
entitled to a refundable “child tax bonus”. At the same time, married couples with dependent
children may opt for joint taxation. In 2006, the base rate and the second lowest tax rate were
reduced from 15% to 12% and from 20% to 19% respectively. Moreover, all other tax allowances
became tax credits (e.g. the single person’s tax allowance of CzK 38,040 or €1,364 became a
tax credit of CzK 7,200 or €258). Note that the difference between tax allowances and tax
credits is that the former reduce taxable income, while the latter reduce the amount of tax due.
Another important development has been the faster rise of the minimum wage vis-à-vis the
subsistence minima used to determine social assistance benefits. While in January 2005 a
couple with two children were marginally better off on benefits and out of work than if both
adults were employed on the minimum wage, since July 2006 a small work incentive had been
restored.
Finally, most benefits in the period under consideration were adjusted in line with inflation,
with the exception of the birth grant which was greatly increased in April 2006 (by 100% for
single births, by 150% for twins).
In Denmark the income distribution remained rather stable. The general tax freeze, in force
since 2001, capping all tax rates and ad valorem taxes, continued slowly to reduce the tax
pressure (i.e. tax receipts as a proportion of gross national income). Other than that,
adjustments to the tax system have been marginal.
No major changes have taken place as regards income transfers. In an effort to tighten work
incentives, the calculation of social assistance entitlements for long-term recipients has
become more unfavourable, which must have worsened the material circumstances of some

Social Situation Observatory – Social inclusion and Income distribution Draft final report
December 2006 250
recipients. On the other hand, efforts to support elderly persons on low incomes, such as the
increases to the supplement paid to those relying on the state old age pension alone, and to
the special help for heating costs, have worked in the opposite direction.
Social services remained free of charge or heavily subsidised. Child care fees have recently been
reduced from 33% of provider costs to 25%.
In Estonia tax-benefit policies operated against a background of rapid growth (10.5% in 2005),
falling unemployment (5.4% in the third quarter of 2006), and a budget surplus. In this context,
the standard tax rate has been gradually reduced from 26% in 2004 to 23% in 2006, and is
scheduled to reach 20% in 2009. Furthermore, the personal tax allowance was increased from
EEK 16,800 (€1,074) in 2004 to EEK 24,000 (€1,534) per year in 2006. At the same time, the
tax allowance for dependent children was increased to EEK 24,000 (€1,534) per child per year
and became payable from the second child (rather than the third, as was previously the case).
There was no change to social contributions, except for unemployment insurance contributions
which were in 2006 reduced to 0.6% and 0.3% of earnings for employees and employers
respectively (from 1% and 0.5% respectively).
In terms of social benefits, the minimum income guarantee used to calculate entitlement to
means-tested social assistance, after a period of 7 years when it was left unchanged in nominal
terms, was increased in 2005 from EEK 500 (€32) to EEK 750 (€48) per month. In 2006 a
supplement of EEK 200 (€13) per month was introduced for single parents in receipt of social
assistance.
Pension benefits increased in real terms by ad hoc improvements on top of indexation, (based
on a formula taking into account consumer prices and social contribution receipts). In 2005 the
increase was 18.2% (6.7% through indexation + 11.5% ad hoc), while in 2006 it was 14.3% (9.7%
+ 4.6%).
Standard child benefits were in the period under consideration left unchanged in nominal terms
at EEK 300 (€19) per month. However, additional benefits for numerous families were
considerably increased, from EEK 50 (€3) to EEK 100 (€6) per child in the case of families with 3
children, from EEK 50 (€3) to EEK 150 (€10) per child in the case of families with 4 or more
children. Benefits for disabled children, paid as supplements to the standard child benefit, were
also increased by 25% in 2006. In the same year, birth grants were increased from EEK 3,750
(€240) to EEK 5,000 (€320), while the duration of parental leave was prolonged from 11 to 14
months. On the other hand, unemployment assistance, payable on a means-tested basis to
those no longer eligible for unemployment insurance, has remained unchanged at its 1999 level
of EEK 400 (€26).

Social Situation Observatory – Social inclusion and Income distribution Draft final report
December 2006 251
Finally, in 2005 the minimum wage was about 33% of the average wage, while in 2006 it was
increased by 12% to EEK 3,000 (€192) a month – a rise that may have protected its relative
value vis-à-vis the average wage, although reliable estimates are not yet available.
In Germany the tax reform phased in between 2000 and 2005 gradually reduced the base rate
from 22.9% to 15% and the top rate from 51% to 42%, while the personal allowance was raised
by nearly a quarter. As a result of the reform, disposable incomes increased throughout the
income distribution, although those at the top gained far more in relative and especially
absolute terms.
To compensate for the loss in tax revenue, the standard rate of VAT is set to increase to 19%,
up from its current level of 16%. Critics have argued that this amounts to poorest households
paying for the earlier tax cuts from which they did not benefit.
On the other hand, the abolition of the home-owner cash grant, the introduction of a top rate
of 45% for incomes over €250,000 and improvements to the child care tax allowance and the
tax credit for domestic services are expected to have a mildly progressive effect.
Furthermore, social contributions for health insurance were raised by 0.5 percentage point in
2006.
In terms of social benefits, no significant changes followed the completion of the controversial
Hartz reforms, providing among other things for tighter eligibility conditions for access to
unemployment benefits and social assistance, as described in last year’s Annual Report.
In Greece the most notable change was a law enacted in April 2006 extending the benefits
received by the so-called “multi-children families”, hitherto defined as those with at least four
children, to families with three children. “Multi-children families” are eligible for comparatively
generous cash benefits, while enjoying favourable tax treatment and preferential access to
higher education, public sector jobs, licences for setting up a small business etc. Note that
public support to families with one or two children (i.e. the families where the overwhelming
majority of all children in the country live) remains meagre at the extreme.
In terms of cash benefits, non-contributory retirement benefits such as ΕΚΑΣ (the income-
tested supplement to low pensions), means-tested social pensions, and basic farmer pensions
were all revalued by 7% in nominal terms. In contrast, contributory social insurance pensions
were raised by 4% in nominal terms. Since the progressive revaluation of pension benefits was
terminated in 2005, the same rate of increase applies across the board.
Moreover, the contributory unemployment benefit, left unchanged at €311.25 monthly since
2004, is to be raised to €367.50 in 2007, and to a further €404 monthly in 2008. Finally, a
lump-sum birth grant of €2,000 was introduced for mothers giving birth to a 3rd child.

Social Situation Observatory – Social inclusion and Income distribution Draft final report
December 2006 252
In Spain, no significant policy innovations took place in the period under consideration.
However, differential revaluation of taxes and benefits could have some impact on the
distribution of incomes. Specifically, income tax brackets and other elements of the system
(such as tax allowances and tax credits) were not fully updated in line with inflation. On the
other hand, the lower thresholds for social contributions were increased above inflation.
In terms of cash benefits, the minimum pensions were also increased in real terms. That was
also the case with unemployment assistance, which is indexed to the minimum wage and was
therefore revalued by 11.4% in 2005 and a further 5.4% in 2006 in nominal terms, compared to
an inflation rate of 3% to 4%.
In terms of social services, where public provision is inadequate, beneficiaries can have their
private expenses reimbursed. The level of reimbursement varies with beneficiaries’ income and
level of dependence.
In France the most significant policy change affecting income distribution was the income tax
reforms introducing tax cuts and the refundable tax credit Prime Pour l’Emploi. In 2006 the
lowest and highest marginal tax rates stood at 6.8% and 48% respectively, down from 10.5%
and 54% respectively in 2000. The effect of the cuts, combined with the shift to the
proportional elements in the tax system (for example, the Contribution Sociale Généralisée),
has been unambiguously regressive.
The introduction of Prime Pour l’Emploi has only partly mitigated this effect, although the
amount of the tax credit has been raised to 4.6% of full time earnings at the minimum wage in
2005 (up from 2.2% in 2001). In 2006 a tax cap was introduced, refunding any tax paid by
individuals in excess of 60% of their income (adding up income, wealth and local taxes).
Tax changes to take effect in 2007 involve among much else a reduction in the number of
income brackets, a further cut of marginal rates, as well as a significant improvement to the
Prime Pour l’Emploi, at an estimated fiscal cost of almost €5 billion. These changes will increase
disposable incomes throughout the income distribution, although higher incomes are expected
to benefit disproportionally in absolute as well as relative terms.
With respect to social benefits, a significant recent development concerns the guaranteed
minimum income programme Revenu Minimum d’Insertion. For several reasons, including
earlier changes in unemployment insurance and unemployment assistance restricting eligibility
to the relevant benefits, the number of RMI recipients has risen by over 20% over the last few
years, reaching 1.27 million in 2005. Until now, RMI recipients returning to work could combine
earnings with full benefit for 3 months and 50% of benefit for another 9 months. From 2007
this arrangement, intended to preserve work incentives, will be replaced by a lump sum
payment of €1000 on taking up a new full-time job (i.e. at least 78 hours per month) plus a

Social Situation Observatory – Social inclusion and Income distribution Draft final report
December 2006 253
monthly payment of €150 for a year. The change is expected to reduce the incomes of most
persons affected, especially those living in large families.
In Ireland the main changes were incremental. The income band at the standard rate of tax
increased faster than wage growth, affecting better paid workers. On the other hand, the basic
state pension was increased relative to earnings, while the early childcare supplement (i.e. the
child benefit for families with children under 6), unemployment and illness payment rates, and
the Family Income Supplement were all increased in real terms.
The net overall effect of the above changes was to reduce the risk of relative poverty (at 60% of
median income) by about 1.5 percentage points. This represented an 8% reduction in the
overall risk of poverty. Moreover, the aggregate poverty gap was reduced by about 15%,
indicating that the effectiveness of policy in improving the incomes of those in poverty was
somewhat greater than in reducing the head count.
In Italy no substantial changes to the tax-benefit system took place recently, despite the
change in government following the general election of April 2006.
Tax credits to support low-income families were reinstated in place of tax allowances, family
allowances were improved, and the personal income tax schedule was redesigned. Under the
latter, those with an annual taxable family income of over €35,000 face an increased tax
burden, while dependent workers in large households with children earning between €10,000
and €35,000 are set to gain.
Otherwise, the duration of unemployment benefit was in 2006 increased to 7 months for
jobless workers aged below 50, and to 10 months for those above that age (up from 6 months
prior to the change).
Finally, employers hiring unemployed workers who had been previously covered by the Cassa integrazione guadagni have been made eligible for a 50% reduction in social contributions for a
period of 36 months.
In Cyprus, the minimum wage was raised by 6% in nominal terms to CY₤384 (€664) per month
on engagement and to CY₤408 (€706) after six months of employment. Further increases are
envisaged raising the value of the minimum wage to 50% of the median national wage by 2008.
The public assistance scheme was reformed in 2006. Recipients can now continue to draw
benefit for 12 months after taking up employment (100% of benefit in the first four months,
66% in the subsequent four, and 33% of benefit in the remaining four months). Moreover, extra
lump sum payments (for house repairs, for purchase of tools and equipment, or for vocational
training) and income disregards have been raised. Finally, male single parents can now become
eligible, while emergency benefits to non-recipients of ordinary public assistance may also be

Social Situation Observatory – Social inclusion and Income distribution Draft final report
December 2006 254
paid. Note that the annual rate for a couple with two children aged below 14 is currently
CY₤5,435 (€9,403) per annum.
As this Annual Report was drafted, a government “emergency plan to improve social cohesion”
was still debated in parliament. If approved, the plan will be immediately effective and 95% of
its total cost (CY£17.8 million or €30.8 million) will be financed out of the 2006 Budget. The
plan provides for targeted assistance to low-income elderly households, additional help to
families receiving public assistance, extra help to public assistance recipients aged 65+ living
alone, as well as emergency assistance to those living in mountainous areas.
In Latvia tax rates remained constant in recent years, but tax allowances were increased since
2005. In 2006 the personal allowance was fixed at LVL 384 (€551), while that for dependents at
LVL 264 (€379). Further increases are envisaged for 2007. Similarly, social security
contributions were unaltered, although the upper earnings ceiling was increased from LVL
19,900 in 2004 (€28,539) to 20,700 LVL (€29,686) in 2006.
Child benefit rates remained constant in nominal terms since 2003. Since over that period
inflation fluctuated around the 7% mark, the real value of child benefit was substantially eroded.
Furthermore, in response to a Constitutional Court ruling declaring unconstitutional the
previous practice limiting provision of infant care benefit to non-working mothers, half the
benefit will also be paid to mothers returning to work. Infant care benefit is payable to families
with a child aged less than 12 months.
The guaranteed minimum income monthly level was also gradually increased from LVL 18 (€26)
in 2004 to LVL 24 (€34) in 2006. Finally, the minimum wage was raised from LVL 80 (€115) in
2004 to LVL 90 (€129) in 2006, protecting its real value over the two-year period.
In Lithuania the flat income tax rate was significantly reduced in July 2006 from 33% to 27%.
Moreover, the share of social insurance contributions compulsorily placed in private pension
funds was increased from 2.5% in 2004 to 4.5% of earnings in 2006, while further increases are
envisaged for the future.
In 2006 the basic contributory pension was raised from LTL 200 (€58) to LTL 230 (€67), while
the earnings-related component of the public pension, indexed to the average wage, also
increased correspondingly. Furthermore, a non-contributory old age pension was also
introduced in 2006, payable to elderly persons lacking sufficient contributions. A similar
arrangement applied since 2005 with respect to disability pensions.
With respect to other social benefits, a range of changes took place. The upper age limit for
payment of non-contributory child benefit was gradually increased from 3 years in 2004 to 9
years in 2006. Unemployment benefit was increased and linked to previous earnings in 2005.
Those without a work record may be eligible for the flat-rate component only. The heating

Social Situation Observatory – Social inclusion and Income distribution Draft final report
December 2006 255
allowance within housing benefit was also increased in 2006. Moreover, the level of the
minimum income guarantee was raised to LTL 185 (€54), up from LTL 155 (€45) a year earlier.
Finally, the minimum wage was significantly increased from LTL 500 (€145) in 2004 to LTL 600
(€174) in 2006.
In Luxembourg, the minimum wage, pensions and other social benefits are all indexed to
inflation, while tax brackets and allowances are generally not. Other than that, a notable policy
change was the increase of social contributions for health insurance from 2.55% to 2.7% in
2005.
In Hungary family benefits were reformed in 2006. The previous system, comprising of a
universal family allowance, a means-tested child benefit and a child tax credit, was
amalgamated to a significantly improved family allowance, while the means-tested child benefit
was abolished and the child tax credit was restricted to families with three or more children up
to a certain level of income. Associated in-kind benefits, such as free or subsidized school
meals and textbooks, continued to be available on a means-tested basis and on the same terms
as before.
Amendments to the regular social benefit (similar to a minimum income guarantee) took place
in the period under consideration. In September 2005 eligibility criteria were widened to include
inactive groups with no previous employment. In July 2006 the income threshold for eligibility
was raised from 80% to 90% of the minimum pension. Beneficiaries taking up a job are allowed
to receive 50% of the benefit during the first three months and 25% of the benefit, while in the
next three months.
In 2006 the payment of a 13th monthly pension a year was fully phased in. partly as a result of
this, pensions increased on an annual basis by 5.5% in 2005 and 4.2% in 2006, compared to
2.5% in 2004.
In a bid to reduce the budget deficit, currently at 5.4% of GDP, an austerity package was
introduced in autumn 2006. Income taxes, VAT rates and social contributions will all go up,
while user fees will be charged for access to health care and higher education. Social benefits
will not be affected in the first instance.
In Malta, the most significant development is the pension reform about to come into force
(January 2007). The reform is projected to improve the relative position of elderly persons on
low incomes, especially the disabled and those with a long record of unpaid work. In terms of
other cash benefits, maternity grants, child benefits, unemployment benefits and sickness
benefits, as well as existing old age pensions, have all been revalued slightly above the rate of
inflation. Finally, in terms of tax, a reduced rate of 15% for part-time work was introduced,
expected to benefit working women in particular.

Social Situation Observatory – Social inclusion and Income distribution Draft final report
December 2006 256
In the Netherlands, there have been important changes affecting health insurance. Under the
2006 Health Insurance Act (ZVW), the two systems (public insurance and private insurance) were
amalgamated into one mandatory privatised system. The reform implies higher contributions
for those who were eligible for subsidized private insurance or for low-cost public insurance
under the old system (i.e. mainly employees, part-time workers and the elderly).
On the other hand, the overall tax burden diminished substantially due to increased tax
allowances (algemene heffingskorting), the abolition of one property tax (gebruikersdeel OZB),
and the reduction of social contributions for special health costs (AWBZ-premie). Moreover, the
introduction of a care allowance (zorgtoeslag), changes to child care finance and the abolition
of school fees for 16- to 17-year olds also increased disposable income, although their effect
on the income distribution was more ambiguous.
However, for the first time in several years the incomes of poor households also increased
substantially in real terms in 2006. That was mostly because indexation of minimum social
benefits was restored, after several years in which they had been allowed to fall behind in
relation to prices and wages. At the same time, stricter rules for all social benefit claimants
were also introduced.
In Austria, the tax reform initiated in 2004 was fully phased in a year later. Additional tax
reductions worth €1.0 billion (0.4% of GDP) took effect in 2005. As a result, those earning less
than €15,770 a year paid no tax. Hence, more than 2.5 million tax units (or 43% of the total)
were exempted. Moreover, the income threshold for entitlement to the refundable tax credit or
negative tax worth up to €110 per year was also raised. Compared to the 2003 baseline, the
absolute tax reduction was highest (€671) for those with an annual taxable income of €11,000.
On the whole, the 2004/5 reform may have made the Austrian tax system more progressive.
With respect to social contributions, a general increase of 0.1 percentage points for health
insurance was introduced in 2005, while the corresponding increase for pensioners in was 0.6
percentage points. Moreover, the upper earnings threshold was raised to €52,500 annually in
2006, or by 8.7% compared to 2004.
In terms of social benefits, pensions were revalued by less than the rate of inflation, and
therefore lost some of their value in real terms. However, in a context of low inflation, the
amounts involved were small. Moreover, distributional effects were mitigated by the fact that
lower and average pensions increased faster than higher ones, while the supplement to
minimum pensions was fully protected from inflation. Otherwise, the benefit to carers
(Pflegegeld) was in 2005 raised by 2%, the first such increase since 1995.
Finally, it is worth noting that in 2005 Austrian provinces were granted authorisation to
increase hospital charges to in-patients from €8 to €10 daily.

Social Situation Observatory – Social inclusion and Income distribution Draft final report
December 2006 257
The combined effect of the above changes could be a small deterioration of the relative position
of those at the bottom of the income distribution.
In Poland benefit-tax policies operated against a background of good economic performance
marked by a high rate of growth and low inflation, political change following the general
election of 2005, and the continuing emigration of thousands of young persons to other EU
countries.
Specifically, a top marginal tax rate of 50% was introduced in 2005 for incomes over PLN
600,000 (€157,800). However, the effect of this measure may be largely symbolic, as it is
expected to affect no more than about 4,000 tax payers. In the run-up to the election, the
conservative coalition that emerged victorious had pledged to lower income tax rates, but no
change has yet taken place. In 2006, the government also pledged to increase social
expenditure, mainly on family benefits, by over PLN 1.6 billion (€420 million or 0.2% of GDP).
In an effort to reverse, or at least halt, the decline of the minimum wage relative to average
earnings to 35% in 2005, new indexation rules were introduced. The new formula is the sum of
forecast inflation rate plus two-thirds of forecast GDP growth. Note that the minimum wage is
currently fixed at PLN 850 monthly (€224). Employers are allowed to pay young workers and the
long-term unemployed less than the minimum wage.
Finally, Poland has recently signed an agreement to end the punishing double taxation of Polish
nationals working in the UK. Approximately 240,000 Poles have migrated to Britain since May
2004. Polish migrant workers are taxed in Britain, usually at the standard rate. Before the
agreement, their remittances were also taxed in Poland, typically at the 40% marginal tax rate,
since the lower bound of the relevant income bracket (PLN 74,048 or €19,500 a year)
corresponds to only about ₤250 a week in the UK. Ending double taxation is expected to
remove disincentives to Polish workers sending remittances to their families back home.
In Portugal, the most significant recent policy changes were the introduction of a means-tested
supplement to pensions (CSI), the introduction of an additional tax bracket with a marginal rate
of 42% for annual incomes in excess of €60,000, the substantial revaluations of minimum
guaranteed incomes and social pensions relative to average earnings, and of minimum wages
relative to inflation. Moreover, changes to the minimum guaranteed income scheme in 2005
extended the requirement of registering at an employment centre to unemployed claimants
aged over 30. Overall, these changes are expected to have a mildly progressive redistributive
effect.
In Slovenia the center-right government, which had assumed power in autumn 2004, proposed
in November 2005 a set of reforms, the centrepiece of wich was the introduction of a flat tax.
Following massive demonstrations organized by the trade unions, the flat tax proposal was

Social Situation Observatory – Social inclusion and Income distribution Draft final report
December 2006 258
quietly abandoned. In August 2006 the government announced it planned changes to personal
income tax. The number of tax brackets will be reduced from 5 to 3, while the top marginal tax
rate will be cut from 50% to 39%. The plan could be revised during the parliamentary process. If
enacted, it will be effective as of January 2007. Tax changes are expected to increase
disposable incomes throughout the income distribution, although higher incomes are expected
to benefit disproportionally more.
With respect to social benefits, since September 2006 the right to social assistance has become
conditional on agreeing to accept a work offer. Moreover, a draft law currently debated in
parliament provides for regular indexation of all benefits except pensions to changes in the
cost of living. Note that since July 2005 pensions are indexed to the growth of net wages.
Preparations are also under way for legislation aimed to unify income testing procedures across
all relevant social benefits. Finally, the allowance paid to large families was increased in April
2006 to SIT 82,000 (€342) for families with 3 children and to SIT 100,000 (€417) for families
with 4 children. Prior to the change, the benefit was paid at a single rate of SIT 70,000 (€292)
to all families with 3 or more children.
In Slovakia major reforms with respect to taxation, labour market policies, social assistance,
pensions and family benefits had taken place in 2004 and were described in last year’s Annual
Report. Later changes were less significant, despite the fact that the general election of August
2006 brought about a change in government.
In the run-up to the general election campaign, one of the issues highest on the political
agenda was the flat tax introduced in 2004, fixing at 19% the rate of personal income tax,
corporate tax and VAT. The victorious coalition, led by the social democrats, had pledged to
abolish flat rate taxation. However, once sworn in, the new government seems to have settled
for a more modest programme of adjustments to VAT (a lower rate of 10% applies to
prescription medicines and health services), and the abolition of user charges for medical tests
(SKK 20 or €0.60) and hospital treatment (SKK 50 or €1.45 daily).
Ways to inject an element of progressivity without altering the general structure of the flat tax
are also sought. One such measure would be to grant personal tax allowances selectively, on
the basis of an income test. For instance, the government is considering the gradual reduction
of personal allowances (at SKK 95,616 or €2,750 per year in 2007) for those with an annual
gross income above SKK 678,000 (€19,500), and their complete withdrawal from those earning
more than SKK 1,062,000 (€30,540).
Other measures under consideration include the plan to abolish the existing option of
earmarking 2% of corporate tax for NGOs and civil society organizations, as well as the
favourable treatment of NGOs which can currently have up to SKK 300,000 (€8,625) per year

Social Situation Observatory – Social inclusion and Income distribution Draft final report
December 2006 259
exempted from tax. NGOs providing social care could be negatively affected by these changes,
should they be introduced.
A Christmas bonus to old age pensions has also been introduced in 2006. This time round its
amount varied between SKK 1,500 (€43) and SKK 2,000 (€58). Future amounts will be decided
as resources permit.
With respect to disability pensions, a recent ruling of the Constitutional Court declared earlier
cuts affecting over 24,000 pensioners in violation of the Constitution. Following that, the
eligibility rules in force until the end of 2003 were reinstated as of November 2006. Those
affected have been given a three-year period to apply for a reassessment of their disability
status. No decision has been made so far on compensation for losses caused by the 2004
reform.
Support to families with children has also been made more substantial. The birth grant has
been increased from its current level of SKK 4,460 (€128) to SKK 15,460 (€445) as of January
2007. Note that the grant is universal, but covers the first child only. Moreover, eligibility for
parental benefit, paid at a rate of SKK 4,440 (€127) monthly to families with a child aged up to
3 years, will be extended to working parents who place their child in public day care. Child
allowance, paid on a universal basis at a rate of SKK 540 (€16) per child per month, has not
been revalued.
On the contrary, social assistance benefits are indexed to prices. In June 2006, the subsistence
minimum for a single person was fixed at SKK 4,980 (€143) per month. Note that some
population groups, such as pensioners and the long-term unemployed, may receive benefits
below the subsistence minimum.
In October 2006 the government proposed to social partners an increase to the minimum wage
to SKK 7,500 (€216), up from its current rate of SKK 6,900 (€198). Trade union experts
estimate that up to 10% of all workers are affected by the measure. In-work and activation
benefits will also increase in line with the minimum wage.
In Finland the tax reform initiated around the start of the decade continued its course. The
Finnish tax system is dual: a proportional tax schedule operates at the municipal level, a
progressive one by central government. In 2005 and 2006 the marginal rates at which income
is taxed by central government fell further by 1 to 2 percentage points. The top rate now stands
at 32.5%, down from 38% in 2000.
For their part, municipal governments have gradually raised the personal tax allowance from
€925 in 1999 to €3,850 in 2005. However, to compensate for that, at the same time they have
had to increase their flat tax rate. The recent shift away from central government (progressive)

Social Situation Observatory – Social inclusion and Income distribution Draft final report
December 2006 260
taxation and towards municipal (proportional) taxation must have reduced the progressivity of
the tax system viewed as a whole.
The 2005 reform of capital taxation may turn out to be as important as income tax reform. The
imputation method, introduced in 1993, that had made dividends practically tax-free and had
contributed to the growth of income inequality, was replaced by a partial return to the double
taxation of dividends. On the other hand, the capital gains tax rate was reduced to 28% and the
corporation tax rate to 26% (both from 29%). Moreover, the wealth tax, paid at 0.8% of net
assets in excess of €250,000 in 2005, was entirely abolished in 2006. Taken together, the
effect of changes in capital taxation may well prove regressive.
In terms of social benefits, a major pension reform took effect in 2005. The reform aims to
lengthen average working lives by 2-3 years in order to improve the long-term viability of the
system. It provides for a higher accrual rate for workers aged 63-67, the abolition of the cap on
the maximum pension for those with a long employment record, and the calculation of
pensionable earnings over the entire career rather than over the last 10 years, as was previously
the case. Furthermore, in an effort to ease pressure on social contributions, social partners and
the government agreed in 2006 to relax restrictions on investing pension fund reserves.
In Sweden, the most significant policy change was that tax allowances were extended in 2005,
as both the allowance for pension contributions to the statutory system and the basic allowance
for low- and middle-income earners were increased. Moreover, the threshold below which no
wealth tax is due was also raised substantially, while inheritance and gift taxes were abolished.
With respect to social benefits, minimum parental leave benefits became more generous and
eligibility was extended, while the ceiling for eligibility to sickness cash benefits was also raised
substantially. Under the terms of the 2006 budget, the government increased public spending
on families with children in the form of higher child supplements for students, higher housing
allowances, higher advance maintenance allowances, and a new supplement for the second
child.
Following the general election of September 2006, there has been a shift in direction. The
incoming centre-right coalition government introduced a number of benefit reductions and tax
cuts. Those out of work stand to lose out, while working families are expected to be better off
as a result of these changes. In view of that, the relative position of those at the bottom of the
income distribution is projected to deteriorate.
In the UK several elements of the benefit-tax system are linked to the change in average
earnings. In the period under consideration that implied an increase of 4.4%. This was applied
to the rate of means-tested benefit for pensioners (the guarantee credit in the Pension Credit)
and the child amount in the child tax credit. In 2006 the family and baby elements of the child

Social Situation Observatory – Social inclusion and Income distribution Draft final report
December 2006 261
tax credit were not indexed and neither were the maximum payments for childcare within the
working tax credit, nor the income thresholds within these two tax credit programmes.
However, the proportion of childcare costs covered by the working tax credit rose form 70% to
80%. In most cases the effect of this would have outweighed the non-indexation of the
maximum payment.
On the other hand, the council tax (a lump sum tax depending on a one-off property valuation)
increases as part of a political process: local authorities set the tax within centrally imposed
effective limits. The average increase in 2006 was about 5%. Council tax benefit covers the cost
of this tax for many in the bottom 20%. With respect to income tax and national insurance
contributions, there were no major changes except that allowances and thresholds are indexed
to prices, which led to some fiscal drag increasing the tax burden somewhat.
In terms of social benefits, there was very little change except via the differential updating
described above and the fact that uprating uses an index from the previous year. In times of
rising inflation this has a detrimental effect on the real level of benefits and thresholds. The
effect is very small in the period considered. Indeed, since inflation and earnings growth are
relatively low, the differences between (a) no uprating, (b) price uprating and (c) earnings
uprating have a rather small impact on poverty and income inequality in a single year. One
notable change has been the massive increase in the income disregard for child tax credit /
working tax credit assessment from £2,500 to £25,000 (i.e. from approximately €3,720 to
€37,200).
Finally, in 2006 the minimum wage increased in real terms by 5.9% for those aged 22+, by 4.7%
for those aged 18-21 and by 10.0% for those aged 16-17.
The net overall effect of the above changes on poverty and inequality is estimated to be very
small.
The acceding and candidate countries
In Bulgaria a series of policy changes have been recently implemented or announced. In 2005
the corporate tax rate was lowered from 19.5% to 15%. Income tax rates were also cut (the base
rate from 12% to 10%, the top rate from 29% to 24%). Tax allowances for dependent children
were raised to BGN 360 (€184) for one child, BGN 780 (€399) for two children and BGN 1,140
(€583) for three or more children. Pension contributions were also significantly reduced, from
29% of earnings in 2005 to 23% in 2006. Most of the advantage of the lower fiscal burden
accrued to employers.
With respect to benefits, pensions were increased by 7% in 2006 (i.e. twice as fast as the
forecast rate of inflation). The minimum income guarantee, used to calculate eligibility for

Social Situation Observatory – Social inclusion and Income distribution Draft final report
December 2006 262
means-tested benefits, was raised to BGN 55 (€28) in 2005, having been frozen at BGN 40
(€20) since 2001. The period of eligibility for unemployed recipients of social assistance was in
2006 limited to 18 months. The child benefit rate was also adjusted in 2005. The nominal
increase was 20%, but this benefit corresponds to no more than 7% of the net wage, so its
contribution to total family income is limited.
A variety of active labour market policies involved just over 50% of the registered unemployed
in public work programmes. The largest such programme offered temporary, low-skill
employment to 92,000 unemployed recipients of social assistance benefits. The main objectives
of these programmes are to transfer income to the jobless poor and to promote work
incentives.
Finally, the minimum wage was raised rather substantially from BGN 120 (€61) in 2004 to BGN
180 (€92) in 2006, and therefore gained in value relative to average earnings.
In Croatia, no significant changes have taken place recently with respect to taxes and/or social
contributions. Exemptions from profit tax in war-affected areas have been abolished, indirect
taxes on cigarettes and coffee have been increased, and a lower rate of VAT at 10% has been
introduced in tourist areas – a measure that would be illegal under EU law.
In terms of cash benefits, the basic level of social assistance remained unchanged at kuna 400
(€54) per month. Moreover, changes to maternity allowances and child benefits were
announced in September 2006 and are to be implemented from January 2007. Finally, as of
February 2006, pensions are again indexed according to the Swiss formula: benefits are
uprated twice a year by the average of the growth of wages and prices. This replaces the more
generous full wage indexation introduced only 14 months earlier.
In Romania significant changes to income tax, especially the introduction of a flat rate at 16%,
had already taken place in 2005 and were reported in last year’s Annual Report.
Other measures sought to compensate for the effects of tax reform on low-income groups. An
earnings-related second tier was added to the base rate of unemployment benefit in 2005.
Note that, compared to other population groups, households headed by unemployed persons
have the lowest income per capita.
Due to better indexation and the application of a more generous formula, pension benefits
improved relative to average wages in 2006. However, at 36% of average wages and 82% of the
minimum wage, average pensions remain low.
The parental leave benefit, paid at a flat rate, was removed from social insurance and is now
funded by tax. Benefit take-up seems to have improved as a result, especially among the self-
employed and farmers. Moreover, worth twice as much as the minimum wage, parental leave

Social Situation Observatory – Social inclusion and Income distribution Draft final report
December 2006 263
benefit is more popular among lower-income parents, while higher-income parents tend to
shun the benefit in favour of a swifter return to employment.
User charges for access to publicly-provided medical care have also become more extensive.
This has given rise to concerns about the health and employment effects on those at the
bottom of the income scale.
The eligibility threshold for heating benefit was raised by 50% in 2006, which resulted in a
better coverage of low- to medium-income families. The impact of this policy may be
significant for families struggling to remain above the poverty line.
In Turkey the most significant change involved the enactment of the Social Security and
Universal Health Insurance Law, aimed to reduce the social security deficit and eliminate
discrepancies between different types of workers. The law provides for a unitary penson regime
for those first employed after 1 January 2007, a minimum retirement age 58 for women and 60
for men, a minimum contribution requirement of 9,000 days, a lower accrual rate and improved
benefits for those remaining in employment after the minimum retirement age. Otherwise, it
also introduces universal health insurance to fill in the gaps of the existing system, as well as a
range of temporary benefits such as sick pay.
Tax policy changes included a reduction in the corporate tax rate to 20% (from 30%), a schedule
of lump-sum taxes for those earning less than 2.5 times the minimum wage, tax relief for
those building their own home or taking out a mortgage, and a reduction of the VAT rate for
textiles from 18% to 8%.
In terms of social benefits, in June 2006 social assistance was extended to poor families with
disabled children, poor persons over 65, and unemployed, blind or severely disabled persons
earning no income, receiving no social benefits or alimony and owning no assets.
Moreover, the value of scholarships provided to 150,000 poor students will be raised by 27% in
January 2007.
Finally, in January 2006 the minimum wage was raised by 8.65% in nominal terms, compared to
an inflation rate of 9.4%.

Social Situation Observatory – Social inclusion and Income distribution Draft final report
December 2006 264
Summary tables of policy changes
Belgium
Change in policy When? (year)
Groups affected Likely effect on income of bottom 20%
(increase/ decrease/ little change/
uncertain)
Likely effect on income of top 20% (increase/
decrease/ little change/
uncertain)
Income share of bottom 20% relative to top 20%
(increase/ decrease/ little change/
uncertain) Increase of GRAPA 2006 Elderly (65+) Increase No change Little change
Indexing of social benefits 2005 All households collecting social benefits
Increase Little change Increase
School bonus (allocation de rentrée scolaire) 2006 All household with young children
Increase Little change Little change
Werkbonus: Reduction of employees SSC 2005-2006 low paid workers Increase No change Little change
Tax reform – tax exempted quotas/brackets 2005 All taxpayers Little change Increase Decrease
Tax reform – increase in tax exempted quota 2005 Married couples Increase Increase Little change
Earned income tax credit (self employment income only)
2005 low paid workers Increase Little change Little change
Lump sum deductions for work related expenses
2006 Employees Increase Little change Little change
Survivor pensioner regime 2006 Working age survivor pensioners
No change Small decrease Little change
Net overall effect of the above changes n/a Increase Increase Little change

Social Situation Observatory – Social inclusion and Income distribution Draft final report
December 2006 265
Czech Republic
Change in policy When? (year)
Groups affected Likely effect on income of bottom 20%
(increase/ decrease/ little change/
uncertain)
Likely effect on income of top 20% (increase/
decrease/ little change/
uncertain)
Income share of bottom 20% relative to top 20%
(increase/ decrease/
little change/ uncertain)
Change in calculation of income tax for family with children
2005 low income family with children
little change very little change uncertain
Change in income tax policy 2005 married couples who take care at least of one child at household
little change little change uncertain
Change in income tax rate of employees and self - employed
2006 low paid employees- self-employed with low income
increase very little change very little change
Change in calculation of income tax for all taxpayers
2006 all taxpayers little change very little change uncertain
Increase in minimum wage relative to subsistence minimum and to gross average earning
2005 1.1.2006 1.7.2006
low paid-unemployed beneficiaries of social benefits
little change no change uncertain
Increase in birth grant 1.4.2006 family with newborn child very little change no change uncertain
Decrease in rates of income tax of business companies
2004-2006 rates of tax base66: year rates in %
2004: 28 2005: 26 2006: 24
business companies uncertain uncertain
66 Tax base of business companies being duty pay income after deduction of expenses

Social Situation Observatory – Social inclusion and Income distribution Draft final report
December 2006 266
Czech Republic
Change in policy When? (year)
Groups affected Likely effect on income of bottom 20%
(increase/ decrease/ little change/
uncertain)
Likely effect on income of top 20% (increase/
decrease/ little change/
uncertain)
Income share of bottom 20% relative to top 20%
(increase/ decrease/
little change/ uncertain)
Net overall effect of the above changes increase little change uncertain

Social Situation Observatory – Social inclusion and Income distribution Draft final report
December 2006 267
Denmark
Change in policy When? (year)
Groups affected Likely effect on income of bottom 20%
(increase/ decrease/ little change/
uncertain)
Likely effect on income of top 20% (increase/
decrease/ little change/
uncertain)
Income share of bottom 20% relative to top 20%
(increase/ decrease/ little change/
uncertain) Social assistance ceiling 2003 Persons receiving social
assistance for more than 6 months
decrease No change decrease
Tax reduction in middleincome tax and increased in tax deduction for employed
2004 All but employed most Little increase increase Little change
Increase in pensions supplement to state old age pension
2005 Pensioners with only state old age pension
Increase No change Small increase
Net overall effect of the above changes No change Little increase No change
Germany
Change in policy When? (year)
Groups affected Likely effect on income of bottom 20%
(increase/ decrease/ little change/
uncertain)
Likely effect on income of top 20% (increase/
decrease/ little change/
uncertain)
Income share of bottom 20% relative to top 20%
(increase/ decrease/ little change/
uncertain) Cuts in income tax 2000–2005 All tax payer Little change increase decrease
Increase in income tax allowance 2000 -2005 Low-income tax payer Little change Little change Little change
VAT increase 2007 All decrease decrease Small decrease
Last reform (tax credits abolished, additional top tax rate)
2007 All tax payer Little change decrease increase
Changes in capital income tax 2001 Mostly high incomes Little change increase decrease
Other recent reform:
SSC deduction – mini-job reform 2003 Low-income workers increase No change increase
Unemployment benefit I 2005 unemployed decrease No change decrease

Social Situation Observatory – Social inclusion and Income distribution Draft final report
December 2006 268
Unemployment benefit II 2005 long term unemployed decrease? Little change ?
Estonia
Change in policy When? (year)
Groups affected Likely effect on income of bottom 20%
(increase/ decrease/ little change/
uncertain)
Likely effect on income of
top 20% (increase/ decrease/
little change/ uncertain)
Income share of bottom 20%
relative to top 20% (increase/ decrease/
little change/ uncertain)
Income tax rate decreased from 24% to 23% 2006 all income earners increase increase little change
Income tax annual allowance increased from EEK 20400 to EEK 24000
2006 all income earners increase increase small increase
Supplementary non-taxable allowance extended to families with 2 children
2006 families with 2 or more children
small increase increase little change
Unemployment insurance contribution reduced from 1% of wage to 0.6%
2006 all wage earners increase increase little change
Increase in state pensions 2005-2006 recipients of old age, invalidity and survivors pensions
increase little change small increase
Increase in supplementary quarterly benefits for families with 3+ children
2006 large families increase little change increase
Payment of parental benefit extended by 3 months
2006 families with small children
increase increase little change
Increase of benefits for disabled children 2006 families with a disabled child
increase increase little change
Increase in minimum wage 2006 low paid increase no change increase
Net overall effect of the above changes n/a n/a n/a

Social Situation Observatory – Social inclusion and Income distribution Draft final report
December 2006 269
Greece
Change in policy When? (year)
Groups affected Likely effect on income of bottom 20%
(increase/ decrease/ little change/
uncertain)
Likely effect on income of top 20% (increase/
decrease/ little change/
uncertain)
Income share of bottom 20% relative to top 20%
(increase/ decrease/ little change/
uncertain) Contributory unemployment benefit, left unchanged at €311.25 monthly since 2004, to be raised to €367.50 monthly in 2007, and to a further €404 monthly in 2008.
Jan 2007 Jan 2008
jobless workers with the necessary contributions
increase no change small increase
ΕΚΑΣ (the income-tested supplement to low pensions) revalued by 7% in nominal terms.
Jan 2006 low-income recipients of social insurance pensions
increase no change small increase
Income-tested social pension raised by 7% in nominal terms.
Jan 2006
old age persons on low income and no access to a social insurance pension
increase no change small increase
Non-contributory basic farmer pension raised by 7% in nominal terms.
Jan 2006 pensioners in rural areas increase no change small increase
Social insurance pensions raised by 4% in nominal terms. Since the progressive revaluation of pension benefits was terminated (in 2005), the rise applies across the board.
Jan 2006 all social insurance pensioners
little change in real terms little change in real terms no change
3rd child birth grant introduced. Mothers giving birth to a 3rd child receive a lump sum of €2,000.
Jan 2006 families with a newborn 3rd child
uncertain uncertain uncertain
Benefits in kind to “multi-children families” extended to families with three children only.
Jan 2007 families with three children
uncertain uncertain uncertain
Net overall effect of the above changes small increase no change little change

Social Situation Observatory – Social inclusion and Income distribution Draft final report
December 2006 270
Spain
Change in policy When? (year)
Groups affected Likely effect on income of bottom 20%
(increase/ decrease/ little change/
uncertain)
Likely effect on income of top 20% (increase/
decrease/ little change/
uncertain)
Income share of bottom 20% relative to top 20%
(increase/ decrease/ little change/
uncertain) Income tax: failure to index in line with real inflation
2005 2006
Tax payers and those just below exemption limit
Little reduction reduction Small increase
Social contributions: increase of higher and lower limits
2005 2006
Employees and self-employed
Some reduction Some increase Reduction?
Minimum pension: increase above inflation 2005 2006
Pensioners with low pension
Increase unchanged probable increase
Unemployment assistance: increase above inflation
2005 2006
Long-term and young unemployed
Slight increase No change Probable slight increase
Net overall effect of the above changes n/a
France
Change in policy When? (year)
Groups affected Likely effect on income of bottom 20%
(increase/ decrease/ little change/
uncertain)
Likely effect on income of top 20% (increase/
decrease/ little change/
uncertain)
Income share of bottom 20% relative to top 20%
(increase/ decrease/ little change/
uncertain) Cut in income tax rate cuts / tax credit (PPE) 2000 – 2006 Tax liable households Little change increase Decrease
New tax reform (tax shield, new tax schedule) 2007 Tax liable households Little change increase Decrease
Introduction and extension of the tax credit (PPE)
2001-2007 Employed households
Increase Little increase Increase
reduced period of entitlement to unemployment benefits
2003-2005 Unemployed workers decrease Little change decrease
back to work” plan 2004-2006 Low-skill workers increase Little change increase
Other recent reforms:

Social Situation Observatory – Social inclusion and Income distribution Draft final report
December 2006 271
Social assistance / RMA 2004 Low-income households Little change No change Uncertain
Child benefits 2004 Families with children Increase Increase Small increase
Sickness insurance 2004+ all Decrease Decrease Small decrease
Ireland
Change in policy When? (year)
Groups affected Likely effect on income of bottom 20%
(increase/ decrease/ little change/
uncertain)
Likely effect on income of top 20% (increase/
decrease/ little change/
uncertain)
Income share of bottom 20% relative to top 20%
(increase/ decrease/ little change/
uncertain) Increase in basic state pension relative to earnings
2005, 2006 elderly (60+) increase little change increase
Early childcare supplement (= increase in child benefit for families with child(ren) under 6)
2006 families with children aged under 6
increase increase increase
Unemployment & illness payment rates 2005-6 unemployed, ill, disabled, lone parents
increase no change increase
Family Income Supplement, increases greater than indexation
2005-6 low paid workers with children
no change no change no change
Std rate tax band increased faster than wage growth
2005-6 higher paid workers no change increase reduce
Net overall effect of the above changes 2005-6 All increase++ increase+ increase

Social Situation Observatory – Social inclusion and Income distribution Draft final report
December 2006 272
Italy
Change in policy When? (year)
Groups affected Likely effect on income of bottom 20%
(increase/ decrease/ little change/
uncertain)
Likely effect on income of top 20% (increase/
decrease/ little change/
uncertain)
Income share of bottom 20% relative to top 20%
(increase/ decrease/ little change/
uncertain) Personal income tax reform 2007 All taxpayers Slight increase Slight decrease Little change
Cash transfers to families with children 2007 Households with children with income below a given threshold
Slight increase Slight decrease Little change
Tax deductions 2007
Households with children and dependent spouse with income below a given threshold
Slight increase Slight decrease Little change
Minimum Income Guarantee (RMI) 2005
In a selected number of municipalities the experiment of RMI was extended until April 2006.
Little chance No change No change
Increase in the duration of unemployment benefits
2006
Increase in the unemployment benefit duration from 6 to 7 months for the unemployed below 50 and from 6 to 10 months for workers aged 50 and above.
Little change No change No change
Reduction in employers contributions 2006
Employers hiring unemployed or long term unemployed workers in CIG (Cassa integrazione guadagi): 50% reduction in contribution rates for 36 months.
Little change No change No change
Net overall effect of the above changes n/a n/a Slight increase Slight decrease Little change

Social Situation Observatory – Social inclusion and Income distribution Draft final report
December 2006 273
Cyprus
Change in policy When? (year)
Groups affected Likely effect on income of bottom 20%
(increase/ decrease/ little change/
uncertain)
Likely effect on income of
top 20% (increase/ decrease/
little change/ uncertain)
Income share of bottom 20%
relative to top 20% (increase/ decrease/
little change/ uncertain)
Minimum wage raised by 6% in nominal terms to CY₤384 (€664)* on engagement and to CY₤408 (€706) per month after six months of employment. Further increases envisaged so that by 2008 the minimum wage should reach 50% of the median national wage.
January 2006
minimum wage earners increase no change increase
Public assistance scheme reformed (Law 95(I) 2006). Recipients are now permitted to continue to claim benefit for 12 months after taking up employment (100% of benefit in the first four months, 66% in the subsequent four, and 33% of benefit in the remaining four months). Moreover, the income disregards applied when calculating the amount of benefit recipients are eligible for have been raised. Lump sum payments under the scheme (for house repairs, purchase of tools and equipment, and for vocational training) have also been raised. Finally, male single parents may now be eligible for the scheme, while emergency payments to non-recipients of ordinary public assistance may be paid. Note that currently the annual rate for a single person is CY₤2,678 (€4,633) per annum, and for a couple with two children aged below 14 is CY₤5,435 (€9,403) per annum.
January 2006
recipients of public assistance increase no change increase

Social Situation Observatory – Social inclusion and Income distribution Draft final report
December 2006 274
Government “emergency plan to improve social cohesion” debated in parliament (discussed in more detail in part 3).
November 2006 (if approved)
low-income groups increase no change increase
Net overall effect of the above changes increase no change small increase
* CY₤1 = €1.73 (1 November 2006).
Latvia
Change in policy When? (year)
Groups affected Likely effect on income of bottom 20%
(increase/ decrease/ little change/
uncertain)
Likely effect on income of
top 20% (increase/ decrease/
little change/ uncertain)
Income share of bottom 20%
relative to top 20% (increase/ decrease/
little change/ uncertain)
Increase in the personal exemption 2006 Income earners Increase Increase Increase
Dependents allowance 2006 Income earners Increase Increase Increase
Increase in maximum taxable income for social security
2006 Top income earners No change Little change Little change
Reduction in real child benefit 2006 Families with children Decrease Decrease Uncertain
Infant care benefit for working mothers 2006 Working mothers with infants Increase Increase Uncertain
Increase in guaranteed minimum income level 2006 Families in poverty Increase No change Increase
Increase in minimum wage 2006 Low income earners Increase Little change Increase

Social Situation Observatory – Social inclusion and Income distribution Draft final report
December 2006 275
Lithuania
Change in policy When? (year)
Groups affected Likely effect on income of bottom 20%
(increase/ decrease/ little change/
uncertain)
Likely effect on income of
top 20% (increase/ decrease/
little change/ uncertain)
Income share of bottom 20%
relative to top 20% (increase/ decrease/
little change/ uncertain)
Unemployment benefit was increased and related to the previous wage of unemployed person
2005 Unemployed Increase No change little increase
Since mid of year 2005 Social (non-contributory) disability pension is paid to disabled (I and II group) people who are not eligible to contributory disability pension.
2005 Disable Little increase No change little increase
Reduce income tax rate on wages 2006 Employees Little increase Increase decrease
Increase in basic contributory pension component
2006 Pensioners Increase No change little increase
Social (non-contributory) old age pension is paid to retired people who are not eligible to contributory old age pension.
2006 Old age pensioners Little increase No change little increase
Age limit for non-contributory child benefit was increased.
2006 Families with children Little increase Little increase No change
Compensation of expenditures no apartments heating was increased
2006 Poor families Little increase No change Little increase
State supported income was increased 2006 Poor families Little increase No change Little increase
Minimum wage was increased 2006 Low wage earners Little increase No change Little increase
Salaries for public medical care employees was increased
2006 Medical staff No change No change No change
Net overall effect of the above changes n/a

Social Situation Observatory – Social inclusion and Income distribution Draft final report
December 2006 276
Luxembourg
Change in policy When? (year)
Groups affected Likely effect on income of bottom 20%
(increase/ decrease/ little change/
uncertain)
Likely effect on income of top 20% (increase/
decrease/ little change/
uncertain)
Income share of bottom 20% relative to top 20%
(increase/ decrease/ little change/
uncertain) Increase of health care social contributions (from 2.55% in 2004 to 2.7% in 2005)
01/01/2005
Nearly everybody Little decrease Little decrease Uncertain
Increase of the pension, the social assistance (RMG) and the minimum wage (2%) in line with the increase of the wages between 2001 and 200367
01/01/2005
60 years and more and low income
Increase Little increase Little increase
Failure to index tax allowances/ rates band not in line with inflation
01/01/2005
All “tax households” that pay income tax
Little change (decrease) Little change (decrease) Little change
Failure to index tax allowances/ rates band not in line with inflation
01/01/2006
All “tax households” that pay income tax
Little change (decrease) Little change (decrease) Little change
Net overall effect of the above changes Little change Little change Little change
67 Every two years, pensions (old age, survivor, and disability), the minimum wage and the minimum guaranteed income (social assistance) are indexed on the increase of the wage observed between t-4 and t-2.

Social Situation Observatory – Social inclusion and Income distribution Draft final report
December 2006 277
Hungary
Change in policy When? (year)
Groups affected Likely effect on income of bottom 20%
(increase/ decrease/ little change/
uncertain)
Likely effect on income of
top 20% (increase/ decrease/
little change/ uncertain)
Income share of bottom 20%
relative to top 20% (increase/ decrease/
little change/ uncertain)
Income tax rate decrease 2006 Middle income none increase increase
VAT rate 25-20, 15-20 2006
Social contribution increase, health 4-6, unemployment1.0-1.5
2006 None
Combination of work and child care allowance 2005/ 2006
Mothers with no previous employment
Little increase No change Little increase
13th month pension 2003-2006
Pensioners Increase No change None
Reform of the family support system 2006 All families with children Increase Decrease Little increase
Changes in the regular social benefit 2006 Deprived families Little increase No change Little increase

Social Situation Observatory – Social inclusion and Income distribution Draft final report
December 2006 278
Malta
Change in policy When? (year)
Groups affected Likely effect on income of bottom 20%
(increase/ decrease/ little change/
uncertain)
Likely effect on income of
top 20% (increase/ decrease/
little change/ uncertain)
Income share of bottom 20%
relative to top 20% (increase/ decrease/
little change/ uncertain)
Capital gains tax 2003 all reduction reduction probable reduction
Adjustment in property values 2004 all increase increase probable increase
One year tax holiday 2005 working women increase increase increase
Exclusion from social contributions 2004 Unemployed+inactive decrease decrease probable decrease
Entitlement to 1 week unpaid maternity leave 2001 pregnant women decrease decrease no change
Increase in child allowance 2005 large families increase increase increase
Entitlement to 3 months unpaid parental leave 2002 all income earners decrease decrease no change
Increase in unemployment assistance 2003 Low income increase no change increase
Disability pension 2005 Low income increase No change increase
Increase in rent subsidy 2005 Low income families increase No change No change
Supplementary allowance 2003 Low income Increase No change increase

Social Situation Observatory – Social inclusion and Income distribution Draft final report
December 2006 279
Tax credits 2001 women Increase increase increase
Public-private partnership 2002 elderly Increase increase Probable increase
Pension contribution 2004 elderly decrease decrease decrease
Personalised action plan 2004 Low income increase No change increase
Medical assistance 2003 Low income increase No change increase
Benefit entitlement to part-timers 2002 Part-timers largely women increase increase increase
Tax deduction 2005 High income No change increase Decrease
Netherlands
Change in policy When? (year)
Groups affected Likely effect on income of bottom 20% (increase/
decrease/ little change/ uncertain)
Likely effect on income of top 20% (increase/
decrease/ little change/
uncertain)
Income share of bottom 20% relative to top 20% (increase/
decrease/ little change/
uncertain) Indexation of minimum benefit levels and minimum wages
2006
Minimum income beneficiaries and minimum wage earners
Increase little change increase
Abolition of user’s part in immovable property taxation
2006 All households Increase increase Little change
New Health Insurance act 2006 All citizens Decrease Little change decrease
Care allowance 2006 Low income groups Increase Little change increase
Decrease of special health costs contribution 2006 All citizens Decrease decrease Little change
Change in financing of child care 2006 Households with children Increase increase Little change
Abolition of school fee for the 16-17 years old 2006 Families with 16-17 year old children
Little change increase decrease
General tax reduction measures 2006 All citizens Little change increase increase
More strict rules for all social benefit claimants 2006 Minimum income beneficiaries, unemployed, disabled workers
Decrease Little change decrease
Net overall effect of the above changes n/a Increase increase Little change

Social Situation Observatory – Social inclusion and Income distribution Draft final report
December 2006 280
Austria
Change in policy When? (year)
Groups affected Likely effect on income of bottom 20%
(increase/ decrease/ little change/
uncertain)
Likely effect on income of
top 20% (increase/ decrease/
little change/ uncertain)
Income share of bottom 20%
relative to top 20% (increase/ decrease/
little change/ uncertain)
2nd stage of income tax reform 2004/05 2005 all tax-payers little increase little increase No change
Increase upper-contribution limit for social contributions
2005, (2006)
Higher paid No change little decrease little increase
Increase health insurance contributions pensioners
2005 Pensioners little decrease No change little decrease
Indexation pensions 2005, 2006
Pensioners little decrease No change little decrease
Indexation minimum pension-top-up singles 2006 Pensioners, social assistance recipients above 60 (females)/ 65 (males)68
little increase No change little increase
Indexation of care benefit 2005, 2006
People in need for care little decrease No change little decrease
Increase for out-of-pockets payments for stay in hospital
2005 People staying in hospital little decrease No change little decrease
Net overall effect of the above changes n/a little decrease No change little decrease
68 Benefit amounts tied to minimum pension-top-up.

Social Situation Observatory – Social inclusion and Income distribution Draft final report
December 2006 281
Poland
Change in policy When? (year)
Groups affected Likely effect on income of bottom 20%
(increase/ decrease/ little change/
uncertain)
Likely effect on income of
top 20% (increase/ decrease/
little change/ uncertain)
Income share of bottom 20%
relative to top 20% (increase/ decrease/
little change/ uncertain)
Additional top income tax rate 2005 High incomes No change Little change Little change
New minimum wage indexation 2005 Low paid increase Little change increase
Changes in family and social policies 2004-2006
all increase Little change increase
Tighter conditions for disability benefits 2006+ all Small decrease Small decrease Little change
Portugal
Change in policy When? (year)
Groups affected Likely effect on income of bottom 20%
(increase/ decrease/ little change/
uncertain)
Likely effect on income of
top 20% (increase/ decrease/
little change/ uncertain)
Income share of bottom 20%
relative to top 20% (increase/ decrease/
little change/ uncertain)
Creation of the Solidarity Supplement for the elderly (CSI)
2006 Poor elderly (65+) increase No change Increase
Changes in the Minimum Income Programme (RSI )
2005 Poor Little increase No change Little increase

Social Situation Observatory – Social inclusion and Income distribution Draft final report
December 2006 282
New additional personal income tax bracket for the highest incomes
2006 Top Incomes No change Little decrease Little increase
Changes in the Social Security Contributions of self-employed workers.
2005 Self-employed workers. No change Little decrease Little increase
Real increase in Minimum Income Transfers (RSI)
2005 / 2006
Poor increase No change Little increase
Increase in minimum wage relative to average earnings
2005 / 2006
Low Paid Workers increase No change Little increase
Increase in social pensions relative to earnings 2005 / 2006
Poor Eldery (65+) increase No change Little increase
Reduction in IRS specific deductions for the highest pensions income
2007 Richer Pensions No change Decrease Increase
Net overall effect of the above changes n/a Increase Little decrease Increase
Slovenia
Change in policy When? (year)
Groups affected Likely effect on income of bottom 20%
(increase/ decrease/ little change/
uncertain)
Likely effect on income of
top 20% (increase/ decrease/
little change/ uncertain)
Income share of bottom 20%
relative to top 20% (increase/ decrease/
little change/ uncertain)
Change in indexation rule for pensions 2005 pensioners increase Increase increase
Increase in large family allowance for families with 3+ children
2006 large families increase Increase increase
Net overall effect of the above changes n/a
Note: the effect of the second policy measure on the income of the target group (group affected) is very small, almost negligible.

Social Situation Observatory – Social inclusion and Income distribution Draft final report
December 2006 283
Slovakia
Change in policy When? (year)
Groups affected Likely effect on income of bottom 20%
(increase/ decrease/ little change/
uncertain)
Likely effect on income of
top 20% (increase/ decrease/
little change/ uncertain)
Income share of bottom 20%
relative to top 20% (increase/ decrease/
little change/ uncertain)
Abolishment of payment for health check and hospital care (20 and 50 SKK) in combination with decrease of VAT for drugs and health care services
2006 2007
elderly (60+) large sized families with children
increase little change increase
Decrease of 2% earmark corporate tax for NGOs
2007 clients of social NGOs decrease no change decrease
Increase in minimum wage relative to average earnings
2006 Low paid Increase No change increase
extension of parental benefits to working parents who place their children to public care facilities
2006 low paid working parents increase no change increase
increase in minimum wage in combination with increase of some labour market benefits
2006 low paid and registered unemployed
increase no change increase
Net overall effect of the above changes n/a increase no change increase
Note: majority of reforms in tax system, labour market policies, social assistance, pensions and family benefits took place in 2004. Throughout 2005 no major changes as compare to 2004 were introduced that would have significant impact on income distribution. After the new government took power in August 2006, its focus has been mainly on making adjustments to the existing system, in some cases (disability pensions) going back to the situation prior January 2004.

Social Situation Observatory – Social inclusion and Income distribution Draft final report
December 2006 284
Finland
Change in policy When? (year)
Groups affected Likely effect on income of bottom 20%
(increase/ decrease/ little change/
uncertain)
Likely effect on income of
top 20% (increase/ decrease/
little change/ uncertain)
Income share of bottom 20%
relative to top 20% (increase/ decrease/
little change/ uncertain)
Increased income allowance in municipal taxation
2000 – 2005
Wage workers Little change No change increase
Increase in municipal (flat) income tax 2000-2006
Tax payers Little change decrease increase
Cut in State (progressive) income tax 2001-2006
Tax payers little change increase decrease
partial double taxation of dividends 2005 Mostly high incomes little change decrease increase
Decrease in capital income tax and corporate tax, Wealth tax abolished
2005-2006
high incomes little change increase decrease
Other recent reforms:
Change in tax on voluntary pensions 2005 Pensioners Little change decrease Little change
Major pension reform 2005+ pensioners Little change Little change Little change
Social service and health care improvements 2004-2007
Low-income households in need of social services
Increase Little change Increase

Social Situation Observatory – Social inclusion and Income distribution Draft final report
December 2006 285
Sweden
Change in policy When? (year)
Groups affected Likely effect on income of bottom 20%
(increase/ decrease/ little change/
uncertain)
Likely effect on income of
top 20% (increase/ decrease/
little change/ uncertain)
Income share of bottom 20%
relative to top 20% (increase/ decrease/
little change/ uncertain)
Increase in parental leave benefits 2005 Families with small children Increase Some increase Increase
increase in the allowance for pension contributions to the statutory system
2005 All groups with taxable incomes
Increase Increase Unchanged. Some low income earners do not benefit but ceiling on allowance limits the benefit for high income earners
increase of basic allowance for low and middle income earners
2005 Low and middle income earners
Increase No change Some increase but not all with low income pay tax
introduction in 2003 of 2 % indexing of level when central state income tax starting to be paid only by 1 % in 2005
2005 Above median to high income earners
unchanged Some decrease Minimal increase
7. increase of level at which wealth tax is paid to 3 000 000 SEK for a couple
2005 Wealthy people Unchanged Increased somewhat Decreased somewhat
Net overall effect of the above changes 2002-2005
All Increase Increase Increase
introduction in 2003 of 2 % indexing of level when central state income tax starting to be paid only by 1 % in 2005 and in 2006
2006 Low and middle income earners
No change Some decrease Negligible increase
Increased basic allowance 2006 All households Modest increase Modest increase No change
Increased benefits to families with children; child benefits, housing benefits etc
2006 Families with children increase Some increase increase
Net overall effect of above changes 2005-2006
Famililes with children increase Some increase increase
Tax deductions for union and unemployment 2007 All trade union members and Some decrease Some decrease Negligible change

Social Situation Observatory – Social inclusion and Income distribution Draft final report
December 2006 286
insurance membership fees abolished members
Reduced ceiling for benefit purposes in sickness insurance
2007 Sick high income persons No change Possible slight decrease Negligible increase
Earned income tax allowance 2007 All with earnings Very modest increase increase Decrease
Reduced wealth and property tax 2007 Wealth and property owners Negligible increase Decrease
Increased housing allowance for pensioners 2007 Pensioners Little increase No change Little increase
Reductions in unemployment benefits 2007 Unemployed decrease No change Decrease
Change in parental leave insurance: Home care allowance and special bonus for families sharing the parental leave benefits equally
2007 Families with small children Difficult to identify Difficult to identify No change
Net overall effect of the above changes 2007 Unemployed and employed decrease increase decrease
Shaded rows refer to measures already reported in 2005 with relevance for the present
UK
Change in policy When? (year)
Groups affected Likely effect on income of bottom 20%
(increase/ decrease/ little change/
uncertain)
Likely effect on income of
top 20% (increase/ decrease/
little change/ uncertain)
Income share of bottom 20%
relative to top 20% (increase/ decrease/
little change/ uncertain)
Price indexation of most elements 2006 all Depends on growth in original incomes: little change
Depends on growth in original incomes: little change
Little change/uncertain
Earnings indexation of pension credit 2006 60+ women; 65+ men Increase (small) No change Small increase
Earnings indexation of child tax credit maximum child amounts
2006 Low/middle income families with children
Small increase No change Small increase
Freezing of family and baby elements in CTC 2006 Low/middle income families with children. Biggest net effect in small families, and those with babies
Small decrease No change Small decrease
Freezing of childcare limits in WTC 2006 Low/middle income families with children and at least one parent in employment. Biggest
Small decrease No change Small decrease

Social Situation Observatory – Social inclusion and Income distribution Draft final report
December 2006 287
net effect on those with expensive childcare
Increasing proportion of childcare costs met by WTC from 70% to 80%
2006 Low/middle income families with children and at least one parent in employment
Increase No change Small increase
Council tax increases above inflation 2006 All but low income Small decrease for those not taking up/eligible for council tax benefit
Decrease Increase
Increase in income that is disregarded during the year for CTC/WTC assessment from £2,500 to £25,000 (sic)
2006* All except high income families
Uncertain – will increase payments and hence income for some but timing and incidence are unclear
Uncertain – will increase payments and hence income for some but timing and incidence are unclear
Uncertain: on average an increase, probably
Minimum wage increases by more than inflation
2006 Low paid employees Increase (small because tax credits are withdrawn except for young/single childless people)
No change (except for low paid partners of high income people)
No change
Net overall effect of the above changes Uncertain
* The policy is introduced in 2006 but won’t have an effect until 2007 or 2008 since it relates to the amount of CTC/WTC that families must pay back if their incomes rise.
Acceding and candidate countries
Bulgaria
Change in policy When? (year)
Groups affected Likely effect on income of bottom 20%
(increase/ decrease/ little change/
uncertain)
Likely effect on income of
top 20% (increase/ decrease/
little change/ uncertain)
Income share of bottom 20%
relative to top 20% (increase/ decrease/
little change/ uncertain)
Decrease of income tax rates 2005 Tax payers Little increase Increase Decrease
Decrease of corporate tax rate 2005 Entrepreneurs No change Increase Decrease
Increase in minimum wage relative to average earnings
2005 Low paid workers Increase No change Increase

Social Situation Observatory – Social inclusion and Income distribution Draft final report
December 2006 288
Increase in Guaranteed Minimum Income 2005 Low income persons Increase No change Increase
Increase in child benefit relative to average income
2005 Families with children Little increase Little increase No change
New criteria for universal disability benefit 2005 Disabled Increase Increase Little increase
Significant decrease of pension contribution 2006 Employed, self-employed and employers
Little increase Increase Decrease
Tax deductions in income tax for families with children
2006 Families with children Increase Little increase Increase
The state guarantee health insurance contributions for low income groups
2006 Uninsured low income persons
Increase No change Increase
Increase in average pension relative to average income
2006 Old-age persons Increase No change Increase
Increase in maternity benefit for uninsured mothers
2006 Uninsured mothers Increase No change Increase
Increase of child benefit for second child 2006 Families with children Little increase Little increase No change
Limits on the period of receipt of means-tested social assistance
2006 Low income persons Decrease No change Decrease
In kind assistance for children at school 2006 Families with children Increase No change Increase
Net overall effect of the above changes N/a N/a Increase Little increase Increase
Croatia
Change in policy When? (year)
Groups affected Likely effect on income of bottom 20%
(increase/ decrease/ little change/
uncertain)
Likely effect on income of
top 20% (increase/ decrease/
little change/ uncertain)
Income share of bottom 20%
relative to top 20% (increase/ decrease/
little change/ uncertain)
Repayment of pensioners’ debt 2006 Pensioners Slight increase Increase Decrease
Pension indexation 2006 Pensioners Little change Little change Little change
Net overall effect of the above changes n/a Little change Little change Little change

Social Situation Observatory – Social inclusion and Income distribution Draft final report
December 2006 289
Romania
Change in policy When? (year)
Groups affected Likely effect on income of bottom 20%
(increase/ decrease/ little change/
uncertain)
Likely effect on income of
top 20% (increase/ decrease/
little change/ uncertain)
Income share of bottom 20%
relative to top 20% (increase/ decrease/
little change/ uncertain)
Change in the formula for unemployment allowance corresponding to an increase of the amount
2005 unemployed increase No change increase
Increase in average pension relative to average wage
2006 pensioners Slight increase No change slight increase
Change in eligibility criteria for parental leave benefit from insurance based to income tax payment
2006 Parents with children up to 2 yrs old
increase little change increase
Reduction in the basic medical services covered by public health insurance**
2006 Insured persons decrease decrease decrease
Raise in eligibility income level for means tested Heating Benefit
2006 Low income families increase No change increase
Net overall effect of the above changes n/a Slight increase No change increase

Social Situation Observatory – Social inclusion and Income distribution Draft final report
December 2006 290
Turkey
Change in policy When? (year)
Groups affected Likely effect on income of bottom 20%
(increase/ decrease/ little change/
uncertain)
Likely effect on income of
top 20% (increase/ decrease/
little change/ uncertain)
Income share of bottom 20%
relative to top 20% (increase/ decrease/
little change/ uncertain)
Minimum wage raised by 8.65% in nominal terms (inflation for 2006: 9.4%).
January 2006
minimum wage earners decrease in real terms no change little change
Salaries of government employees to be raised by 4% + 4% in January and July 2007. A compensatory pay rise may be granted if that turns out to be below inflation.
January 2007
government workers no change no change in real terms no change
A fixed sum income tax schedule introduced for those earning less than 2.5 times the minimum wage.
January 2007
poor increase no change little change
Corporate tax reduced to 20% (from 30%). January 2006
corporations no change increase decrease
Building tax exemption for pensioners owning a house smaller than 200m2 and earning in 2005less than 150,000 YTL (€79,500)* from real estate.
December 2005
pensioners no change increase decrease
Building tax exemption extended to the disabled, provided their only house is smaller than 200 m2.
January 2006
disabled people small increase uncertain little change
Mortgage interest on house loans up to 100,000 YTL (€53,000) made tax deductable.
April 2006
home buyers no change increase decrease
VAT on textiles reduced to 8% (from 18%). March 2006
textile consumers and producers
uncertain uncertain uncertain
Social assistance paid to (a) poor families with disabled children, (b) poor persons over 65, (c) the unemployed, blind or severely disabled
June 2006
low income disabled, elderly and unemployed persons
increase no change increase / little change

Social Situation Observatory – Social inclusion and Income distribution Draft final report
December 2006 291
earning no income, receiving no social benefits or alimony and owning no assets.
Social Security & Universal Health Insurance Law, discussed in detail in part 3.
January 2007
whole population uncertain uncertain uncertain
Debts of social health insurance schemes to state hospitals cancelled, causing the latter serious financial difficulties.
February 2006
patients in state hospitals uncertain uncertain uncertain
Price of pharmaceuticals raised by 5% monthly for 6 months (pharmaceuticals indexed to exchange rates by law, enacted in 2004).
July 2006
the uninsured decrease no change little change
Housing loan-purchase scheme on favourable terms for low- and middle-income families introduced in Istanbul. 3,116 houses handed over in 2005.
December 2005
the poor, the low and the middle income groups
increase no change increase / little change
Eligibility rules for access to the Istanbul housing loan-purchase scheme relaxed with respect to both age and income of applicants to increase the number of applications.
April 2006
the poor, the low and the middle income groups
increase no change increase / little change
Scholarships provided to 150,000 poor students raised by 27%.
January 2007
poor students increase no change little change
Home tuition provided to sick children staying at home for at least 6 months.
January 2006
sick children increase uncertain little change
Net overall effect of the above changes small increase increase little change
* 1 YTL = €0.53 (1 November 2006).