Social Development in Pakistan. Annual Review 2002-03: The State of Education
264
SOCIAL SOCIAL DEVEL DEVEL OPMENT OPMENT IN P IN P AKIST AKIST AN AN ANNUAL REVIEW 2002-03 SOCIAL POLICY AND DEVELOPMENT CENTRE The State of Education
Transcript of Social Development in Pakistan. Annual Review 2002-03: The State of Education
SOCIALSOCIALDEVELDEVELOPMENTOPMENT
IN PIN PAKISTAKISTANAN
ANNUAL REVIEW2002-03
S O C I A L P O L I C Y A N D D E V E L O P M E N T C E N T R E
The State of Education
SOCIALDEVELOPMENT
IN PAKISTAN
ANNUAL REVIEW
2002-03
SOCIAL POLICY ANDDEVELOPMENT CENTRE
KARACHI
© 2003 by the Social Policy and Development Centre (SPDC)Karachi, Pakistan
All rights reserved. No part of this publication may be reproduced, stored in a retrieval system, or transmitted, in any form or by any means,
electronic, mechanical, photocopying, recording, or otherwise without prior permission of the
Social Policy and Development Centre.
ISBN 969-8407-01-4
Published by Social Policy and Development CentrePhotographs by Rizwan Tabassum and Hasan Zaheer
Printed in Karachi by The Times Press (Pvt) Ltd.
FOR
EWO
RD
So
cia
l D
eve
lop
me
nt
in P
aki
sta
n,
20
02
-03
III
The world has entered the age of the knowledge-based economy. Technologicalchanges and globalization of markets has ushered in an unprecedentedprocess of transformation of the economies of the world from the traditional
'resource' to a 'knowledge' basis. Knowledge is now the engine of growth and it is theproduction of ideas rather than the production of goods that provides comparativeadvantage and the impetus for economic development. The most importantcomponents of a knowledge-based economy are human and institutional capital. Aknowledge-based economy necessarily requires a higher average standard ofeducation. However, such an economy does not merely need a skilled workforce. Itnecessitates a populace with a more multi-disciplinary and holistic body ofinstitutionalized knowledge to be economically productive and to ensure culturallyenriched life-styles.
The historic change that is under way presupposes certain sociopoliticalconditions. Throughout history, the changes in production relations as aconsequence of the transformation of world economies from one phase to anotherhas also seen a corresponding adaptation and change in social and politicalinstitutions of governance at societal and state levels. Thus, while thepastoral/agricultural age saw the dominance of the tribal/feudal systems, the adventof the Industrial Revolution saw its replacement by the capitalist order. The place ofeducation has changed accordingly. Education, which was more of a ‘consumptiongood’ in the feudal/tribal age became a 'production good' in the industrial age and isnow the basis on which the knowledge-based economy can be built.
Pakistan appears to have failed to develop its human resources over the lasthalf a century and presents a rather unfortunate picture with respect to the need forchange to meet the requirements of time. However, the importance and urgency ofa transformation of societal and state values and structures and the development ofhuman resources cannot be ignored, given the challenges posed by the emergingknowledge-based economies in the world and in the region itself.
SPDC's Annual Review of Social Development for 2002-03 focuses on certainfundamental questions of educational development in Pakistan. Chapter 1documents the state of education in its various dimensions. Chapter 2 highlights therelationships between education and human resources, on one hand, and growthand development, on the other. Chapter 3 outlines the structural and policy factorsthat have tended to inhibit the advancement of education. Chapter 4 examines theproblems in primary education beyond the much-discussed issue of enrolment rates.Chapter 5 analyzes the state of science education and the problems therein. Andchapter 6 underlines the effect that multiple streams of education have had onnational cohesion and identity.
The theme of the Annual Review for 2002-03 is State of Education. It is anattempt to present an independent and objective assessment of the problems ofeducation in Pakistan and is intended to open a debate on this critical prerequisite ofsocial and economic development. It is hoped that the publication will be of interestand value to policy makers parliamentarians, academics, development practitioners,civil society activists, and people at large in the country and abroad, who share aconcern for human and social development in the country.
FOREWORD
Moeen Qureshi Kaiser BengaliChairman Acting Managing Director

So
cia
l D
eve
lop
me
nt
in P
aki
sta
n,
20
02
-03
V
Kaiser BengaliHaroon Jamal
Qazi Masood AhmedMuhammad Asif Iqbal
Abu NasarSehar RizviZehra Aftab
Zehra Fatima HaiderMuhammad SabirImran Ashraf Toor
Farhan Sami KhanAurangzaib
Amir Jahan KhanNaveed AamirTabinda Areeb
Surkhab JavaidSaima Ismail
Naushaba KhatoonNaeema Kazmi
Iffat Ara
Linda O'NeilSehar RizviRafea Anis
The SPDC Team
Editing Team
TEAM FOR THEPREPARATION OF
THE REPORT
Rizwanullah KhanKamran Shaikh
Zakir HussainHamid Ali
Design and Layout
Tariq RahmanZia Niazi
Saiqa KhanS. Khurshid Hasnain
Abdul Hamid ToorAtiya Kaleem
Farzana Latif AnsariRumana Qureshi
Consultants
TEAM
FO
R T
HE
PREP
ARAT
ION
OF
THE
REP
OR
T


So
cia
l D
eve
lop
me
nt
in P
aki
sta
n,
20
02
-03
VII
Established in 1995, the Social Policy and Development Centre(SPDC) is a private sector research organization that serves as afocal point for policy-relevant research on social sector
development. Using a multidisciplinary approach, the Centre assists bothpublic and private sector institutions and non-governmental organizationsto plan, design, finance, execute and manage social sector programmesin a cost-effective manner. The results of its research are made availableto policy makers, interested groups and the general public to promoteinformed discussion and action on vital social sector issues.
SPDC is independent and non-partisan and cooperates with a widerange of organizations working in related areas, within Pakistan andinternationally. It determines its own pace-setting research agenda withinthe parameters of its mandate and objectives, and maintains autonomy,flexibility and balance between responsive and proactive social sectorresearch. Key activities include research and policy analysis; socialsector government database support; pilot project monitoring andevaluation; training of government, private sector and non-governmentalorganizations; and information dissemination through publications,conferences, seminars and workshops.
SPDC receives core funding from the Canadian InternationalDevelopment Agency (CIDA). The Canadian Advisory Agency (CAA)provides advisory services and support to strengthen SPDC and help itachieve its mandate. In addition, SPDC undertakes a significantcomponent of self-financing.
The SPDC Board of Directors consists of eminent personalitiesselected for their commitment to social sector development and theirbelief that the use of analytical tools in developing public policy isnecessary to ensure sustainable social sector development. Themembers are:
Moeen Qureshi, ChairmanSartaj Aziz, Vice ChairmanKaiser Bengali, Managing DirectorJaved JabbarQuratul Ain BakhtiariRafiq A. AkhundSaeed A. QureshiS. Babar AliShahnaz Wazir Ali
Social Policy and Development Centre15-Maqbool Co-operative Housing SocietyBlock 7 & 8, Karachi 75350, PakistanTel: (92-21) 111-113-113Fax: (92-21) 4534285Website: http://www.spdc-pak.comE-mail: [email protected]
THE SOCIALPOLICY AND
DEVELOPMENT CENTRE
THE
SOC
IAL
POLI
CY
AND
DEV
ELO
MEN
TC
ENTR
E

Education and literacy: Where does Pakistan stand?
Trends in literacy rates
Trends in enrolment rates
Trends in dropout rates
Availability of public schools and teachers
District profile of inequality
Benefit incidence of public educationexpenditure
Foreword
Team
The Social Policy and Development Centre
Acronyms / Non-English Terms
Views of A Leading Social Sector Personality
CO
NTE
NTS
So
cia
l D
ev
elo
pm
en
t in
Pa
kis
tan
, 2
00
2-0
3
IX
CONTENTS
C H A P T E R 1
III
V
VII
XIX
XXIII
2Status of Educationin Pakistan
8
13
14
21
40
The education-development relationship
The challange of knowledge-basedeconomics
Measuring the knowledge-basedeconomy
Impact of expenditure shift
Returns to education
Social returns to education
C H A P T E R 3Education andDevelopment
42
44
49
52
60
5
C H A P T E R 2EducationInequalities
34
CO
NTE
NTS
So
cia
l D
ev
elo
pm
en
t in
Pa
kis
tan
, 2
00
2-0
3
X
Stablizing the economy, destablizingeducation
Education policy making
Socio-political environment
C H A P T E R 4Factors InhabitingEducation 70
86
93
Learning dynamics of young children
The official approach to learning
National objectives of education
The pedagaogical approach to learning
Management structure of education
C H A P T E R 5
The state ofprimary education
118
Test results: Defining the problem
Determinants of poor performance
C H A P T E R 6State of ScienceEducation
97
102
A.1 Chronology of key events in the socialsectors: 2002-03
A.2 Selected book reviews
A.3 An integrated social policy andmacroeconomic planning model
A.4 Monetory block update to the ISPM Model
A.5 SPDC publications
A P P E N D I C E S
158
167
173
177
181
The Historical legacy
Income and schooling
Role of textbooks
Diverging worldviews
C H A P T E R 7Citizens of AlienWorlds

CO
NTE
NTS
So
cia
l D
ev
elo
pm
en
t in
Pa
kis
tan
, 2
00
2-0
3
XI
Population
Demographic profile
Education
Health
Labour force and employment
Public finance
Shelter
Bibliography
S E L E C T E D S O C I A LD E V E L O P M E N T I N D I C A T O R S
186
187
189
193
194
197
200
Box 1.1 Physical condition of public schools
Box 2.1 How is the district education index constructed?
Box 2.2 How is the district development indexconstructed?
Box 2.3 Measures of inequality
Box 3.1 A historic imperative for change
Box 3.2 What could persistently high rates of return mean?
Box 3.3 A model of private returns to education
Box 3.4 How is school life expectancy computed
Box 3.5 Macro fertility response
Box 4.1 Stabilizing and poverty
Box 4.2 The ladder of poverty reduction
Box 4.3 Land inequality and schooling
Box 4.4 The case of Dr. Z. A.
Box 5.1 Our home
Box 5.2 Our school
Box 5.3 Respect for parents
Box 5.4 Good girls
B O X E S16
19
20
21
43
53
58
62
16
19
20
21
43
53
58
62
62
198
Box 5.5 Martyr
Box 5.6 Freedom or death
Box 5.7 The learning process
Box 5.8 The Sour Goat
Box 5.9 That’s Quite Alright
Box 5.10 Organogram of provincial education structure in Sindh
Box 5.12 Zohra: a true story
Box 6.1 Operational details of the test
Box 6.2 Test results by province
Box 6.3 A cry of despair
Box 6.4 Case of a DC generator diagram
Box 6.5 Instances of descriptive questions
Box 6.6 Cases of repeated of questions
Box 6.7 Case of repeated questions withsame numerical values
Box 6.8 Case of repeated questions fromtextbooks
Box 7.1 Identifying elite versus non-elite english-medium schools
Box 7.2 Sample reproductions from this ssctextbook
Box 7.3 Syllabus of wafaq-ul-madaris madrassahs
Box 7.4 Selected radd tests
Box 7.5 Diverging views on governance
CO
NTE
NTS
So
cia
l D
ev
elo
pm
en
t in
Pa
kis
tan
, 2
00
2-0
3
XII
21
43
53
58
117
97
107
112
111
107
Table 1.1 Where does Pakistan stand in the region?
Table 1.2 Trends in adult literacy rates
Table 1.3 Adult literacy rates, 2001-02
Table 1.4 Trends in gross primary enrolment rates (%)
03
06
07
09
10
11
13
T A B L E S
14
15
15
15
15
97
107
Table 1.5 Growth in gross primary enrolment
Table 1.6 Trends in net primary enrolmentrates (%)
Table 1.7 Secondary enrolment rate, 2002
Table 1.8 Trends in dropout rates within publicprimary schools
Table 1.9 Availability of public schools and teachers
Table 2.1 Average value of components of DEI
Table 2.2 Estimates of dispersion in components of DEI
Table 2.3 District education index: National scenario
Table 2.4 District education index: Provincial scenario[all areas]
Table 2.5 District education index: Provincial scenario[rural areas]
Table 2.6 District education index: Provincial scenario[urban areas]
Table 2.7 Distribution of districts by DEI by top and bottom quintiles (%)
Table 2.8 Unit subsidies on education (1998-99)
Table 2.9 Distribution of benefit incidence of public subsidy on education (1998-99)
Table 2.10 Distribution of benefit incidence of public subsidy on education (1998-99)
Table 2.11 Distribution of gender segregated benefitincidence of subsidy on education
Table 3.1 Average adult literacy rate
Table 3.2 Keys to the old and new economies
Table 3.3 Components of the technology achievment index
Table 3.4 The knowledge economy index
Table 3.5 Technology achievement index: Countryranking
Table 3.6 Knowledge economy index: Country ranking
CO
NTE
NTS
So
cia
l D
ev
elo
pm
en
t in
Pa
kis
tan
, 2
00
2-0
3
XIII
03
06
09
10
11
13
14
42
46
15
15
15
15
46
15
15
46
15
15
15
15
15
Table 3.7 Provincial development expenditures (Rs. Million)
Table 3.8 Dynamic shifts in development expenditurefrom 'other expenditures' to education
Table 3.9 Impact of development and educationvariables on growth
Table 3.10 Labour force composition by educationalattainment (%)
Table 3.11 Change in structure of educationalattainment of wage earners (%)
Table 3.12 Composition of labour force and wage earners provincial scenario (%)
Table 3.13 Sectoral composition of wage earners
Table 3.14 Average wage by educational leveland sector
Table 3.15 Estimates of private annual rate of returns to education (%)
Table 3.16 Effect of education quality on returns to education (%)
Table 3.17 Incidence of diarrhoea by educationof mother (%)
Table 3.18 Immunization of children under 5 and mother’s education (%)
Table 3.19 Reproductive health care behaviour and mother’s education (%)
Table 4.1 Who is bearing the burden of stabilization ?
Table 4.2 Burden of fiscal deficit on provinces
Table 4.3 Average growth in real expenditure on education in Pakistan
Table 4.4 Average growth in recurring expenditure in different levels of education
Table 4.5 Average growth in province-wise real recurring expenditure on education
Table 4.6 Average growth in province-wise real development expenditure on education
Table 4.7 Average growth in province-wise real recurring expenditure by level of education
CO
NTE
NTS
So
cia
l D
ev
elo
pm
en
t in
Pa
kis
tan
, 2
00
2-0
3
XIV
15
46
15
15
46
15
15
15
15
15
46
15
15
46
15
15
15
15
46
15

Table 4.8 Average growth in level-wise gross enrolment
Table 4.9 Reasons for never attending schools for children aged 10-18
Table 4.10 School enrolment rates by income groups
Table 4.11 Household annual expenditure on education by income groups
Table 4.12 Patterns of land and education inequality in Punjab
Table 4.13 Quantifying impacts on schooling
Table 4.14 List of education policies, plans programmes and schemes
Table 4.15 Literacy targets: Shifting goal posts
Table 4.16 Universal primary education targets
Table 4.17 Primary enrolment rate targets
Table 4.18 National target for education sector reforms action plan 2001-05
Table 4.19 Development expenditure requirements for ESRAP 2001-05
Table 4.20 Expenditure requirements and allocations: 2002-2004
Table 5.1 Percentage of out-of-school an in-schoolschildren classes 1-5 with basic
Table 5.2 Profile of special education schools staffand enrolment
Table 5.3 Profile of disabled children by natureof disabilities
Table 6.1 Test results by subject
Table 6.2 performance of students by level of difficulty of question
Table 6.3 Test results by province
Table 6.4 Test results by city size
Table 6.5 Test results by gender
Table 6.6 Percentage of teachers with science qualifications
CO
NTE
NTS
So
cia
l D
ev
elo
pm
en
t in
Pa
kis
tan
, 2
00
2-0
3
XV
15
46
15
15
46
15
15
15
15
15
46
15
15
46
15
46
46
46
46
46
46
46
Table 6.7 Profile of science teachers in schools
Table 6.8 Profile of student- teacher ratio
Table 7.1 Distribution of primary enrolment, 2002
Table 7.2 Distribution of school enrolment by education system and by income
Table 7.3 Central boards of madrassahs in Pakistan
Table 7.4 Growth in number of madrassahs
Table 7.5 Level of education in wafaq-ul-madaris
Table 7.6 Divergent opinions of students from different education streams
Chart 1.1 Ratio of female to male combined enrolment rates
Chart 1.2 Percentages of GDP spent on education
Chart 1.3 Trends in male and female literacy rates
Chart 1.4 Trends in urban and rural literacy ratesChart 1.5 Disparities in literacy rates, 2001-02
Chart 1.6 Trends in stock of illiterate population
Chart 1.7 Proportion of females in illiterate population
Chart 1.8 Gross primary enrolment rates
Chart 1.9 Growth in gross primary enrolment
Chart 1.10 Trends in the share of girls’ enrolment (%)
Chart 1.11 Number of out of school children aged 5-9 (Million)
Chart 1.12 Development level and inequality in adult literacy rate
Chart 2.2 Unit subsidies in education, 1998-99
Chart 2.3 Share of heights quintile in public education subsidy (%)
Chart 2.4 Share of lowest quintile in public education spending (%)
CO
NTE
NTS
So
cia
l D
ev
elo
pm
en
t in
Pa
kis
tan
, 2
00
2-0
3
XVI
15
46
15
15
46
15
15
15
15
46
15
15
46
15
15
15
15
46
15
15
15
C H A R T S
15
Chart 2.5 Share of highest and lowest quintile in public subsidy on primary education (%)
Chart 2.6 Share of highest and lowest quintile in public subsidy on secondary education (%)
Chart 2.7 Share of highest and lowest quintile in public subsidy on tertiary education (%)
Chart 2.8 Ratio of unit subsidy of the lowest to the highest quintile
Chart 2.9 Ratio of female to male per capita subsidy
Chart 3.1 Average adult literacy rate by development quintiles
Chart 3.2 Technology achievement index (TAI)
Chart 3.3 Knowledge economy index (KEI)
Chart 3.4 Impact of shift in expenditures
Chart 3.5 Fertility rate and educational attainment of married women
Chart 3.6 Infant mortality rates by mother's education level
Chart 3.7 Incidence of diarrhoea in rural areas by education of mother
Chart 3.8 Education level of women who married at 18 years or below (%)
Chart 4.1 Burden of stabilization on provinces
Chart 4.2 Average growth in total real expenditures on education
Chart 4.3 Distribution of land ownership by size in Punjab
Chart 4.4 Inequality in and ownership by region
CO
NTE
NTS
So
cia
l D
ev
elo
pm
en
t in
Pa
kis
tan
, 2
00
2-0
3
XVII
15
15
15
15
15
15
15
15
15
15
15
15
15
15
15
15
15
ADB Asian Development BankBHU Basic Health UnitCRCP Consumer Rights Commission of PakistanCV Coefficient of Variation DEI District Education Index DDI District Development Index DOTS Directly Observed Short CourseEFA Education For All EMIS Education Management Information SystemESR Education Sector Reforms ESRA Education Sector Reforms AssistanceFATA Federally Administered Tribal Areas ESRAP Education Sector Reforms Action Plan FY Fiscal Year (FY)GC Gini coefficientGCSE General Certificate of School Education GPER Gross Primary Enrolment RatesGST General Sales Tax GNI Gross National IncomeHDI Human Development Index HRCP Human Rights Commission of Pakistan ICT Islamabad Capital TerritoryIDB Islamic Development BankIFI International Financial InstitutionIMF International Monetary Fund I-PRSP Interim Poverty Reduction Strategy Paper ISPM Integrated Social Policy & Macroeconomic (model)JICA Japan International Cooperation AgencyKEI Knowledge Economy Index (KEI)KPP Kushal Pakistan ProgrammeMCQ Multiple Choice Question MMR Maximum to Minimum ratioNCO Net Credit to OthersNEMIS National Education Management Information SystemNFA Net Foreign AssetsNFC National Finance Commission NGC Net Credit to the Government SectorNISTE National Institute of Science and Technical Education NPER Net Primary Enrolment Rate NPO Non Profit OrganizationsNSS National Saving SchemeOPP Orangi Pilot ProjectOCT Orangi Charitable TrustPIHS Pakistan Integrated Household SurveyPPAF Pakistan Poverty Alleviation FundPPP Purchasing Power ParityPRGF Poverty Reduction Growth FacilityPSBR Public Sector Borrowing RequirementPSDP Public Sector Development Programme
CO
NTE
NTS
So
cia
l D
ev
elo
pm
en
t in
Pa
kis
tan
, 2
00
2-0
3
XVIII
ACRONYMS
RCC/RBC Roofing with reinforced concrete/bricks with cement bonding
R&D Research and DevelopmentRHC Rural Health CentreRs. RupeesTAI Technology Achievement Index TB TuberculosisSAP Social Action Programme SBP State Bank of Pakistan SEMIS Sindh Education Management Information SystemSLE School Life Expectancy SDO Social Development OrganizationSPDC Social Policy and Development Centre SSC Secondary School Certificate STI Sexually Transmitted InfectionsUNDP United Nations Development Program UNFPA United Nations Fund for Population ActivitiesVAD Vitamin A DeficiencyWHO World Health Organization
CO
NTE
NTS
So
cia
l D
ev
elo
pm
en
t in
Pa
kis
tan
, 2
00
2-0
3
XIX
Aqai'd BeliefsChaudhry LordFiqah Islamic jurispruidenceHadith Sayings of the Prophet (PBUH)Hadr Rapid recitation of the Qur'anHaj Holy pilgrimageHaveli HouseHifz Memorization of the Qur'anJirga Tribal courtHisaab Arithmetic Ibadaats Acts of worshipIlm-ul-Arud Prosody Ilm al Balaghah RhetoricIlm al-Faraid Science of inheritanceIlm-e-Hindsa GeometryIlm-e-Hae'at AstronomyIlm-ul-Jadi DebateIlm-ul-Kalam Philosophy of religion;scholasticsIlm-e-Tabiaat Physical sciencesIlm-e-Tajweed The science of Qur'anic phonetics Islamiat Teaching of the Qur'an and Hadith Islamic
history and jurisprudence Jehad Religious struggleKutcha house Housing made of wood, bamboo and other
materialsKatchi Abadi Squatter settlementKhuda ki basti A land and shelter project that imitates the
way illegal squatters provide housing forthemselves
Lughat DictionaryMadrassahs Institutions of Islamic religious learningMaktabs Persian schoolsMantiq LogicManqoolat Revealed learningMa'aqoolat Intellectual endeavourMausiqi MusicMu'amalat Business practice, transactions Munazaras Theological debatesNai Roshni Schools Non-formal education schemeNahw SyntaxNazirah Quran Kareem Recitation of QuranNoorani Qa'idah Beginners' textbook for Arabic languagePucca house Housing made of concrete roof and walls of
baked bricks and blocksQirr'ah, Qirat Phonetically modulated recitation of the Qur'anQuran Islamic holy book Radd RefutationSarf MorphologyShariah Islamic lawTafseer al-Qur'an Exegesis of the Quran
CO
NTE
NTS
So
cia
l D
ev
elo
pm
en
t in
Pa
kis
tan
, 2
00
2-0
3
XX
NON ENGLISH TERMS
Tajweed Correct recitation of the QuranTalukas TownsTasawuf Mysticism Usul-e-Fiqah Islamic jurisprudence and its principlesZakat Religiously-mandated poor tax C
ON
TEN
TSS
oc
ial
De
ve
lop
me
nt
in P
ak
ista
n,
20
02
-03
XXI
So
cia
l D
eve
lop
me
nt
in P
aki
sta
n,
20
02
-03
XXIII
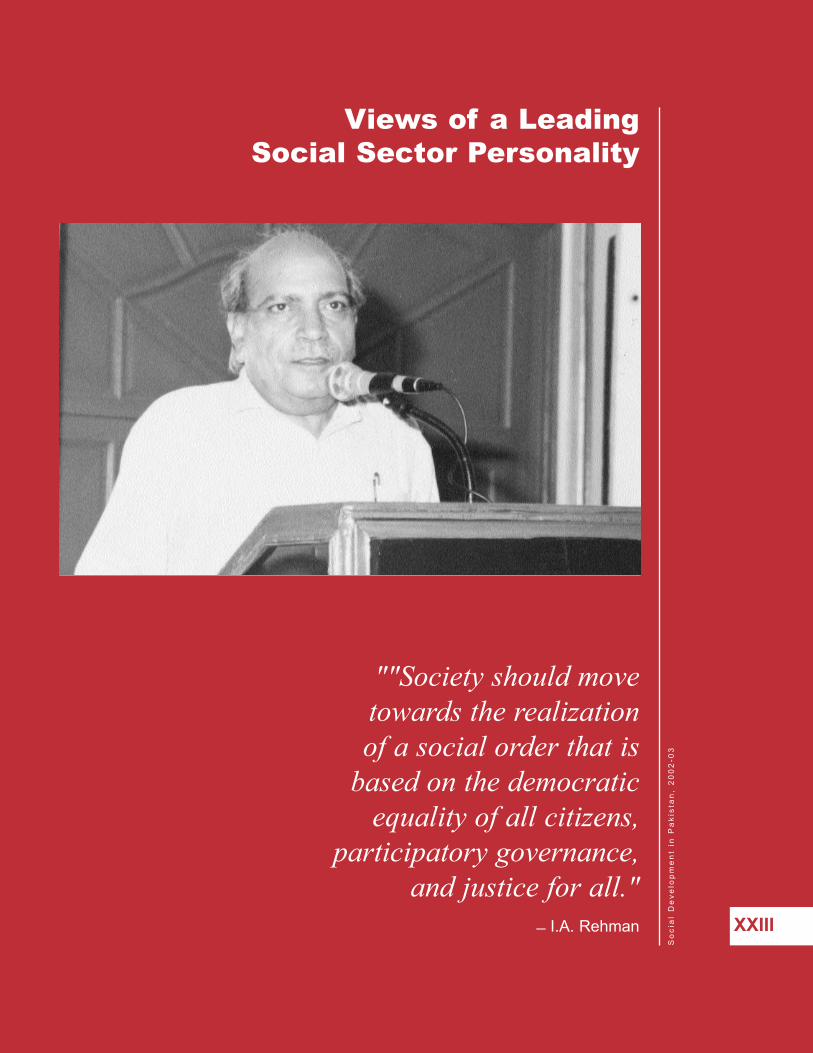
Views of a LeadingSocial Sector Personality
_ I.A. Rehman
""Society should move towards the realizationof a social order that is
based on the democraticequality of all citizens,
participatory governance,and justice for all."
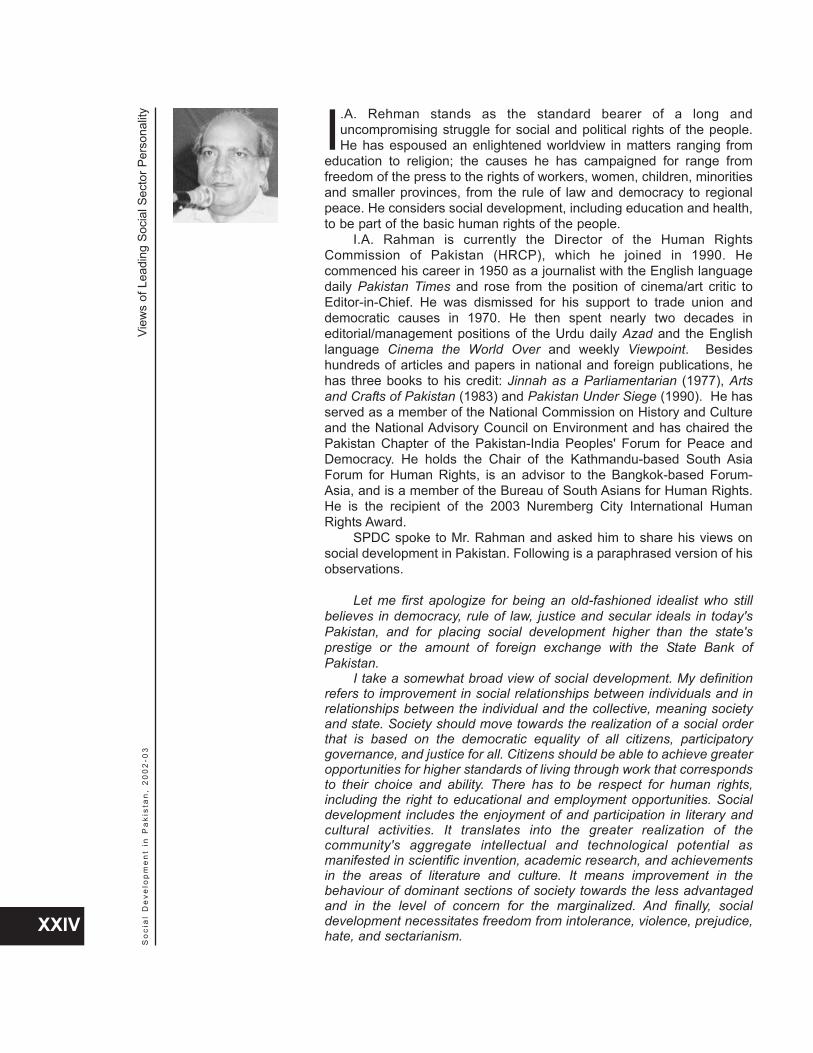
I.A. Rehman stands as the standard bearer of a long anduncompromising struggle for social and political rights of the people.He has espoused an enlightened worldview in matters ranging from
education to religion; the causes he has campaigned for range fromfreedom of the press to the rights of workers, women, children, minoritiesand smaller provinces, from the rule of law and democracy to regionalpeace. He considers social development, including education and health,to be part of the basic human rights of the people.
I.A. Rahman is currently the Director of the Human RightsCommission of Pakistan (HRCP), which he joined in 1990. Hecommenced his career in 1950 as a journalist with the English languagedaily Pakistan Times and rose from the position of cinema/art critic toEditor-in-Chief. He was dismissed for his support to trade union anddemocratic causes in 1970. He then spent nearly two decades ineditorial/management positions of the Urdu daily Azad and the Englishlanguage Cinema the World Over and weekly Viewpoint. Besideshundreds of articles and papers in national and foreign publications, hehas three books to his credit: Jinnah as a Parliamentarian (1977), Artsand Crafts of Pakistan (1983) and Pakistan Under Siege (1990). He hasserved as a member of the National Commission on History and Cultureand the National Advisory Council on Environment and has chaired thePakistan Chapter of the Pakistan-India Peoples' Forum for Peace andDemocracy. He holds the Chair of the Kathmandu-based South AsiaForum for Human Rights, is an advisor to the Bangkok-based Forum-Asia, and is a member of the Bureau of South Asians for Human Rights.He is the recipient of the 2003 Nuremberg City International HumanRights Award.
SPDC spoke to Mr. Rahman and asked him to share his views onsocial development in Pakistan. Following is a paraphrased version of hisobservations.
Let me first apologize for being an old-fashioned idealist who stillbelieves in democracy, rule of law, justice and secular ideals in today'sPakistan, and for placing social development higher than the state'sprestige or the amount of foreign exchange with the State Bank ofPakistan.
I take a somewhat broad view of social development. My definitionrefers to improvement in social relationships between individuals and inrelationships between the individual and the collective, meaning societyand state. Society should move towards the realization of a social orderthat is based on the democratic equality of all citizens, participatorygovernance, and justice for all. Citizens should be able to achieve greateropportunities for higher standards of living through work that correspondsto their choice and ability. There has to be respect for human rights,including the right to educational and employment opportunities. Socialdevelopment includes the enjoyment of and participation in literary andcultural activities. It translates into the greater realization of thecommunity's aggregate intellectual and technological potential asmanifested in scientific invention, academic research, and achievementsin the areas of literature and culture. It means improvement in thebehaviour of dominant sections of society towards the less advantagedand in the level of concern for the marginalized. And finally, socialdevelopment necessitates freedom from intolerance, violence, prejudice,hate, and sectarianism.
View
s of
Lea
ding
Soc
ial S
ecto
r Per
sona
lity
So
cia
l D
eve
lop
me
nt
in P
aki
sta
n,
20
02
-03
XXIV
In addition to broadening the definition of social development tofacilitate progress towards it, one must also recognize that socialdevelopment is a basic human right. Many of the elements constitutingsocial development have been recognized in the Universal Declaration ofHuman Rights and the International Covenant on Economic, Social andCultural Rights. Some of these are also recognized in the fundamentalrights chapter of the Constitution of Pakistan. Many societies in the worldalso now recognize that the rights of communities are comparable to therights of individuals.
During the last five decades, Pakistan has not been able to achievethe level of success in social development that it should have attainedand its citizens have been deprived of this right. The problem ismultifaceted and its rectification demands a broader analysis than isusually attempted.
When Pakistan came into being, it was assumed that a state hadbeen created, whereas a new state had yet to be structured. There wasthe view that the colonial system inherited from the British was too goodto be given up and was, thus, not abandoned and has not beenabandoned to this day. This has meant the retention, to a large extent, ofpre-independence political, economic and social relationships. Theabsence, at inception, of any meaningful exercise to define the ideals ofsociety, failed to open the doors to social development. Since then, thecontinued determination of social and cultural norms almost entirely bytraditional and conservative feudal, tribal and religious leaders has alsobeen responsible for impeding social development. In a country where amajority of the population is still employed in the agriculture sector, thecontinuation of feudalism, its mores and norms, has made socialdevelopment nearly impossible. The drift towards theocratization of thestate has also had a divisive impact and disrupted the integration of apluralistic society into a nation of equal citizens.
The result is that whereas fifty years ago we had considerablefreedom to think, this is no longer the case. Over the years the space forthe 'unthinkable' has expanded, while the space for the 'thinkable' hascontracted. This is the main barrier to social development, whichdemands not only development on the basis of present day wisdom butalso the formulation of new social values. In a socially dynamic collective,tradition is subject to evolution. Only that part of tradition that is of eternalvalue is worth retaining. Therefore, to achieve any degree of socialdevelopment, the features of tradition acquired in periods of feudal andcolonial domination have to be shed.
The problem of social and cultural domination has been aggravatedin Pakistan due to the lack of participation by civil society. Since socialdevelopment and democracy are interchangeable concepts, thepersistent denial of democratic rights to Pakistanis has amounted todenial of social progress. The state has curtailed the space for civilsociety, particularly political parties, trade unions, academics, and theyouth, all of whom could have contributed to social development. Weneed to accept the philosophy that Quaid-e-Azam bequeathed to us.There has to be commitment to democratic governance and acceptancethat democratization is a process. One aspect of repudiation ofdemocracy has been non-acceptance of federalism in its essence. Thecompromise of the rights of the federating units has suppressed socialdynamics and stalled social development. We need to resurrect civil
View
s of
a L
eadi
ng S
ocia
l Sec
tor P
erso
nalit
yS
oci
al
De
velo
pm
en
t in
Pa
kist
an
, 2
00
2-0
3
XXV
society's right to regulate public affairs through recognized organs of thestate _ the legislature and the judiciary.
The state stands accused of keeping a majority of the populationilliterate and in poor health, of failing to recognize the right to work, andof failing to end discrimination against women and minorities, thusundermining the accumulation of social capital. To attain social normsbased on the ideals of equality and justice, the state has to treatindividuals as citizens and not as subjects. A move towards the ideal ofequality can begin by dismantling the provisions of laws that sanctioninequality, particularly those that affect less populous provinces, womenand minorities. All forms of discrimination must be erased, a system ofequal entitlements enforced, and justice established for all. The colonialpractice of establishing justice between subjects of the state and notbetween the state and its subjects must give way to a system in whichthere can be justice not only between citizens but also between the stateand the individual. Justice has to be guaranteed to the poor and thesocially vulnerable rather than a commodity that only the rich and theresourceful can hope to secure. This may require not only a change inlaws, but also a change in the class character of the judiciary and, indeed,of the state itself.
The role of education is important in social development. Publicschools and education contributed to social and economic developmentwhen the government enforced its compulsory education law in Punjab inthe 1930s, when education could be afforded by the poorest. The poorcould join elite institutions, share benches with the rich and the powerful,and the doors of colleges were not closed to anyone. Now, however,schools are closed shops of different income groups and there is littlescope for intermingling.
Problems in the education sector can only retard efforts to achievesocial development, and the current state of this sector is not satisfactory.Today, education in Pakistan is in the hands of bureaucrats and educatorswho have no role in its planning and administration. There are sharpvariations between institutions in big cities and in the countryside. Thecurricula revision exercises are myopic and lopsided. Over the pastdecades, the objective of education has become oriented more and moretowards careerism. The development of all-round personalities andconsciousness of civic responsibilities appears to have been discarded.Education institutions are conceived as a tax-free means of accumulatingwealth. Students are taught to think of their own interests and not abouttheir fellow citizens. The decline of public sector education has given riseto a private sector that is largely inspired by the profit motive. Schools andother educational institutions can only become centers of change anddevelopment when no child is denied quality education for want of meansand committed professionals replace bureaucratic cabals.
The contribution of education to broader social development must beseen in perspective. For example, the nexus between education andwomen's empowerment is generally exaggerated. There are moreeducated Pakistanis today than there were in 1947, but the process ofempowerment, including that of women, has not kept pace with improvingeducation statistics. It is impossible to deny the role education has playedin the uplift of women, but their empowerment demands changes in thestate system and laws, demolition of feudalism and its practices,relaxation of the rigours of dogma, and recognition of the right to
View
s of
Lea
ding
Soc
ial S
ecto
r Per
sona
lity
So
cia
l D
eve
lop
me
nt
in P
aki
sta
n,
20
02
-03
XXVI
economic independence. Pakistan is supposed to be a modern republicand there is a lot of talk about attaining the heights of scientificknowledge. However, at the same time, the nation seems determined tolive in the past and be governed by an age old dogma. The premisesunderlying these two assertions are irreconcilable and give rise to asituation where agreement on what constitutes social developmentbecomes impossible.
Thus, reforms in education alone will not achieve socialdevelopment. After all, the educated are not always free of feudalmindsets, which will not change until production relations change; untilthe monopoly of religious leaders on interpreting religion is done awaywith; until curbs on the freedom of thought and participation are doneaway with.
Similarly, universalizing literacy and education alone will not lead tothe establishment of a democratic state in Pakistan. Most argumentsalong these lines are based less on the merits of education and more ona desire to justify deviations from democracy. Education plays a role inthe democratic process, but it is not a decisive element. On the one hand,there are examples like France, England and the USA, which madeprogress in terms of democratization while a majority of their populations,had not attained high levels of literacy and education. On the other hand,there are examples of fascist states with high levels of education.Pakistan's own history shows that a largely illiterate electorate did notmake wrong choices whenever free and fair elections were held.
The deliberate 'mistake' made by those who wish to deferdemocracy until education is universalized is to suppose that these twogoals are sequential rather than concurrent. However, not only are bothprocesses interdependent, but they also share common prerequisites.Thus, at present, Pakistan is at a stage where education is needed tosupplement democratization by attacking impediments to theestablishment of a legitimate democracy _ problems of feudalism,'beradari', social inequality, poverty, discrimination and sectarianism.Those who stand for democracy must also press to universalizeeducation/literacy and those who campaign for education must havedemocracy on their agenda.
When a society is neither educated nor democratic, democratizationis required to catalyze social development. In subsequent stages ofdemocratization, education helps because a literate and educatedcitizenry can make better choices, which is the essence of democracy.Democratic progress should lead to better education, in terms of quantumand content, and better education should make higher forms ofdemocracy possible. The equation does not permit an 'either/or'proposition.
Social development is an individual and collective right and the statemust acknowledge it. If this is done, the direction of the collectiveendeavor will have a new dimension and efforts at defining national goalswill acquire greater clarity and sharpness of focus. This will also provideus with a new measure to judge the country's progress. What I amsuggesting is a broader indicator than what is available in present socialaction plans or even in human development indices. Social developmentcan be recognized as a right by defining it as such in the constitution, withnecessary changes in laws, policies and practices.
View
s of
a L
eadi
ng S
ocia
l Sec
tor P
erso
nalit
yS
oci
al
De
velo
pm
en
t in
Pa
kist
an
, 2
00
2-0
3
XXVII

CH
APTE
R 1
So
cia
l D
eve
lop
me
nt
in P
aki
sta
n,
20
02
-03
1
1STATUS OF EDUCATION
IN PAKISTAN
“The Constitution ofPakistan has placedthe responsibility for
basic education onthe State.”
The Constitution of Pakistan has placed the responsibility for basiceducation on the State. This obligation is reflected in the principlesof policy in Article 37, which declares:
"The State shall: (a) Promote, with special care, the educational and economic
interests of backward classes or areas.(b) Remove illiteracy and provide free and compulsory secondary
education within minimum possible period."
Various governments have, over the years, formulated anassortment of policies and plans to fulfill the constitutional commitment ofproviding education to the people and removing inequalities. Success hasbeen limited, though, with the result that the current state of education inPakistan is deplorable. Education in Pakistan has suffered from a myriadof issues, as reflected by various educational indicators including lowlevels of public spending, literacy and enrolments, high levels of dropoutfrom the schooling system, acute regional and gender inequalities, andinequities in the distribution of budgetary allocations to education.
Both demand and supply factors explain this state of affairs. On thedemand side, poverty and illiteracy appear to be significant factorsadversely affecting household decisions to send children to school. Onthe supply side, high population growth rates and lack of sufficientfinancial commitment has caused illiteracy to rise. There have beencommendable efforts in the private and non-government sectors, but thescale of these efforts has not been sufficient to make a difference to theaggregate situation. Clearly, there is no alternative to public education,which is the focus of this Review.
Pakistan has been placed at the 144th position out of 175 countries interms of the Human Development Index. In other words, Pakistan
ranks among the bottom 30 countries of the world. With respect to theEducation Index, Pakistan ranks among the bottom 15 countries. Bycomparing selected educational indicators, table 1.1 presents a reflectionof Pakistan's poor educational performance in relation to other countriesin the region.
Comparative data reveals that Pakistan is at the bottom of theranking of countries in the region, with an adult illiteracy rate of 56 percent, well above the average of 37 per cent for Sub-Saharan Africa and44 per cent for South Asia. Net primary enrolment rate in Pakistan is at46 per cent, the lowest in South Asia. Similarly, the combined enrolmentrate for primary, secondary and tertiary education is 36 per cent, which is
CH
APTE
R 1
So
cia
l D
eve
lop
me
nt
in P
aki
sta
n,
20
02
-03
2
STATUS OF EDUCATIONIN PAKISTAN
Net primaryenrolment rate inPakistan is at 46per cent, thelowest in SouthAsia.
EDUCATION AND LITERACY:WHERE DOES PAKISTAN STAND?
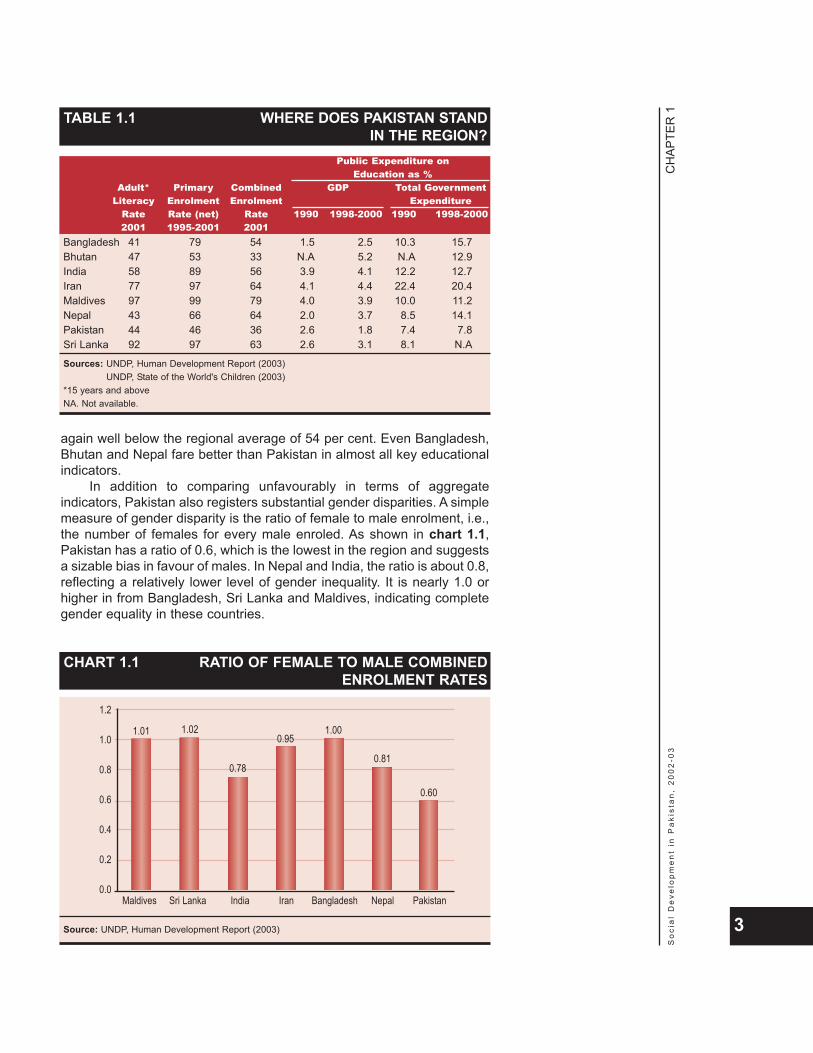
again well below the regional average of 54 per cent. Even Bangladesh,Bhutan and Nepal fare better than Pakistan in almost all key educationalindicators.
In addition to comparing unfavourably in terms of aggregateindicators, Pakistan also registers substantial gender disparities. A simplemeasure of gender disparity is the ratio of female to male enrolment, i.e.,the number of females for every male enroled. As shown in chart 1.1,Pakistan has a ratio of 0.6, which is the lowest in the region and suggestsa sizable bias in favour of males. In Nepal and India, the ratio is about 0.8,reflecting a relatively lower level of gender inequality. It is nearly 1.0 orhigher in from Bangladesh, Sri Lanka and Maldives, indicating completegender equality in these countries.
CH
APTE
R 1
So
cia
l D
eve
lop
me
nt
in P
aki
sta
n,
20
02
-03
3
TABLE 1.1 WHERE DOES PAKISTAN STANDIN THE REGION?
Public Expenditure onEducation as %
Adult* Primary Combined GDP Total GovernmentLiteracy Enrolment Enrolment Expenditure
Rate Rate (net) Rate 1990 1998-2000 1990 1998-20002001 1995-2001 2001
Bangladesh 41 79 54 1.5 2.5 10.3 15.7Bhutan 47 53 33 N.A 5.2 N.A 12.9India 58 89 56 3.9 4.1 12.2 12.7Iran 77 97 64 4.1 4.4 22.4 20.4Maldives 97 99 79 4.0 3.9 10.0 11.2Nepal 43 66 64 2.0 3.7 8.5 14.1Pakistan 44 46 36 2.6 1.8 7.4 7.8Sri Lanka 92 97 63 2.6 3.1 8.1 N.A
Sources: UNDP, Human Development Report (2003)UNDP, State of the World's Children (2003)
*15 years and aboveNA. Not available.
CHART 1.1 RATIO OF FEMALE TO MALE COMBINEDENROLMENT RATES
1.2
1.0
0.8
0.6
0.4
0.2
0.0Maldives
1.01 1.02
0.78
0.95
Sri Lanka India Iran Bangladesh Nepal
1.00
0.81
0.60
Pakistan
Source: UNDP, Human Development Report (2003)

The level of public spending is an important indicator of agovernment's commitment to the cause of education. The educationsector in Pakistan has suffered from persistent and severe underinvestment by the government throughout the last half-century. Asshown in table 1.1, public spending on education in Pakistan as apercentage of GDP is 1.8, which is the lowest in the region and hasactually declined from 2.6 per cent in 1990. According to the UNDP,there are 12 countries in the world that spend less than 2 per cent ofGDP on education, of which Pakistan is one (see chart 1.2). In termsof public expenditure on education as a percentage of total publicspending, Pakistan ranks among the bottom five nations of the world.The share of public expenditure on education in Pakistan is posted at7.8 per cent, placing the country just ahead of Greece, Jordan,Mongolia and Guinea-Bissau.
Although there is no evidence in the international literature of astrong and consistent correlation between public expenditure oneducation and enrolment rates, low public expenditure is a commonfeature of almost all low-enrolment countries. The negative impact ofreducing public expenditure on access, equity and quality is however,well documented. For example, a common feature in newlyindustrializing countries is high public expenditure on education bothas a proportion of GDP and of total public expenditure. It has also beensuggested that government expenditure on education is stronglyassociated with indicators of entry into the first grade. It is therefore notsurprising that Pakistan, with its declining public sector investment ineducation, should compare dismally with other countries in terms of itseducation and literacy indicators.
CH
APTE
R 1
So
cia
l D
eve
lop
me
nt
in P
aki
sta
n,
20
02
-03
4
CHART 1.2 PERCENTAGES OF GDP SPENTON EDUCATION
Myanmar
Equatorial Guinea
Sierra Leone
Haiti
Swaziland
Ecuador
Guatemala
Pakistan
United Arab Emirates
Cambodia
Guinea
Central African Republic0 0.2 0.4 0.6 0.8 1 1.2 1.4 1.6 1.8 2
Source: UNDP, Human Development Report (2003)
1.9
1.9
1.9
1.9
1.8
1.7
1.6
1.5
1.1
1
0.6
0.5
Public spendingon education inPakistan as apercentage ofGDP is 1.8, whichis the lowest inthe region.

Adult literacy rates in Pakistan seem to be improving, but at a slowpace. During the last 30 years, the literacy rate has increased from
21 to 43 per cent _ or less than 1 per cent per annum. Plotting the growthin literacy produces a rather flat curve for males and an even flatter curvefor females (see chart 1.3). The same is true for urban and rural literacygrowth rates (see chart 1.4). Substantial disparities exist between the
CH
APTE
R 1
So
cia
l D
eve
lop
me
nt
in P
aki
sta
n,
20
02
-03
5
TRENDS IN LITERACY RATES
CHART 1.3 TRENDS IN MALE AND FEMALELITERACY RATES
100.0
90.0
80.0
70.0
60.0
50.0
40.0
30.0
20.0
10.0
0.0
Sources: Population Census Reports (1972, 1981 and 1998)Pakistan Integrated Household Survey (PIHS) (2002)
1972 1974 1976 1978 1980 1982 1984 1986 1988 1990 1992 1994 1996 1998 2000 2002
Male Female
CHART 1.4 TRENDS IN URBAN AND RURALLITERACY RATES
100.0
90.0
80.0
70.0
60.0
50.0
40.0
30.0
20.0
10.0
0.0
Sources: Population Census Reports (1972, 1981 and 1998)PIHS (2002)
1972 1974 1976 1978 1980 1982 1984 1986 1988 1990 1992 1994 1996 1998 2000 2002Urban Rural
genders, both within regions on an urban-rural basis between and withinthe provinces. As indicated in table 1.2, literacy rates for males arealmost twice as high as for females. According to estimates based on theprimary data of the Pakistan Integrated Household Survey 2001-02, maleand female literacy rates are 57 and 29 per cent, respectively.
Similar gaps also exist between urban and rural areas. While theurban literacy rate is 63 per cent, it is 34 per cent for rural areas. Betweenprovinces, the literacy rate ranges from 32 per cent in Balochistan to 44 percent in Punjab (see table 1.3). The lowest literacy rate at 7 per cent prevails
CH
APTE
R 1
So
cia
l D
eve
lop
me
nt
in P
aki
sta
n,
20
02
-03
6
TABLE 1.2 TRENDS IN ADULT LITERACY RATESYear Total Male Female Urban Rural1972 21 30 11 41 14
1981 26 36 15 53 17
1998 41 53 29 61 31
2002 43 57 29 63 34
Sources: Pakistan Census Reports (1972, 1981 and 1998)
PIHS (2002)
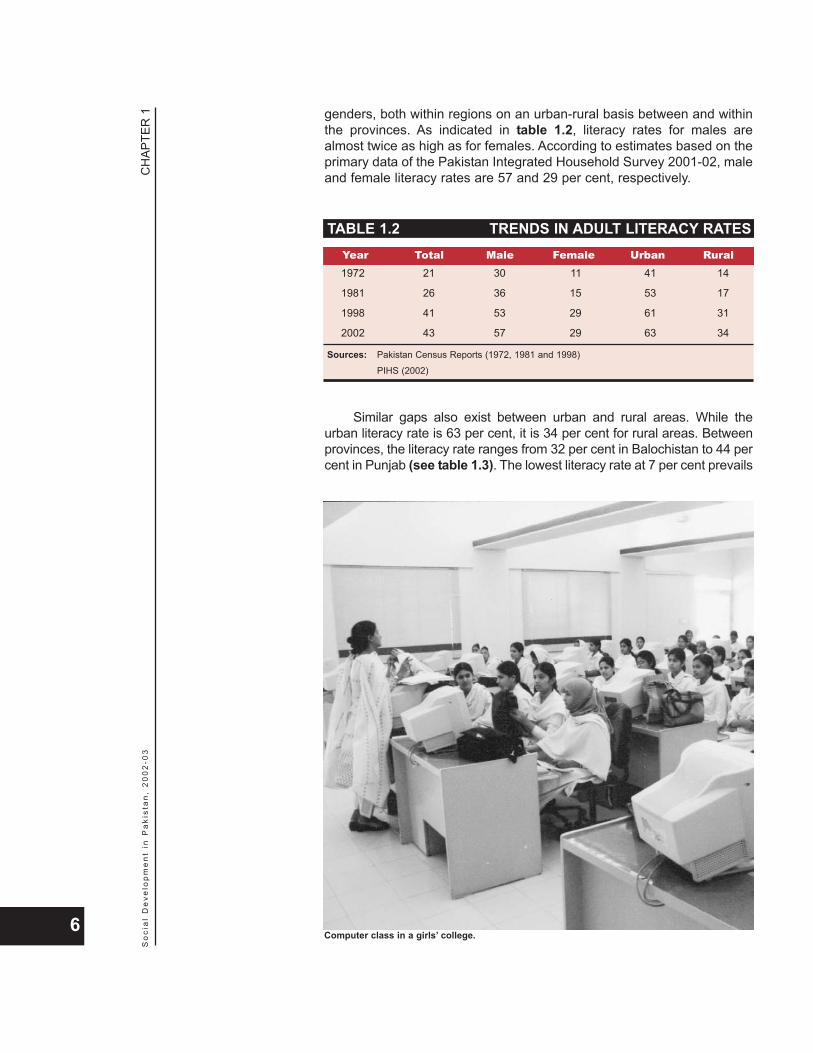
Computer class in a girls’ college.
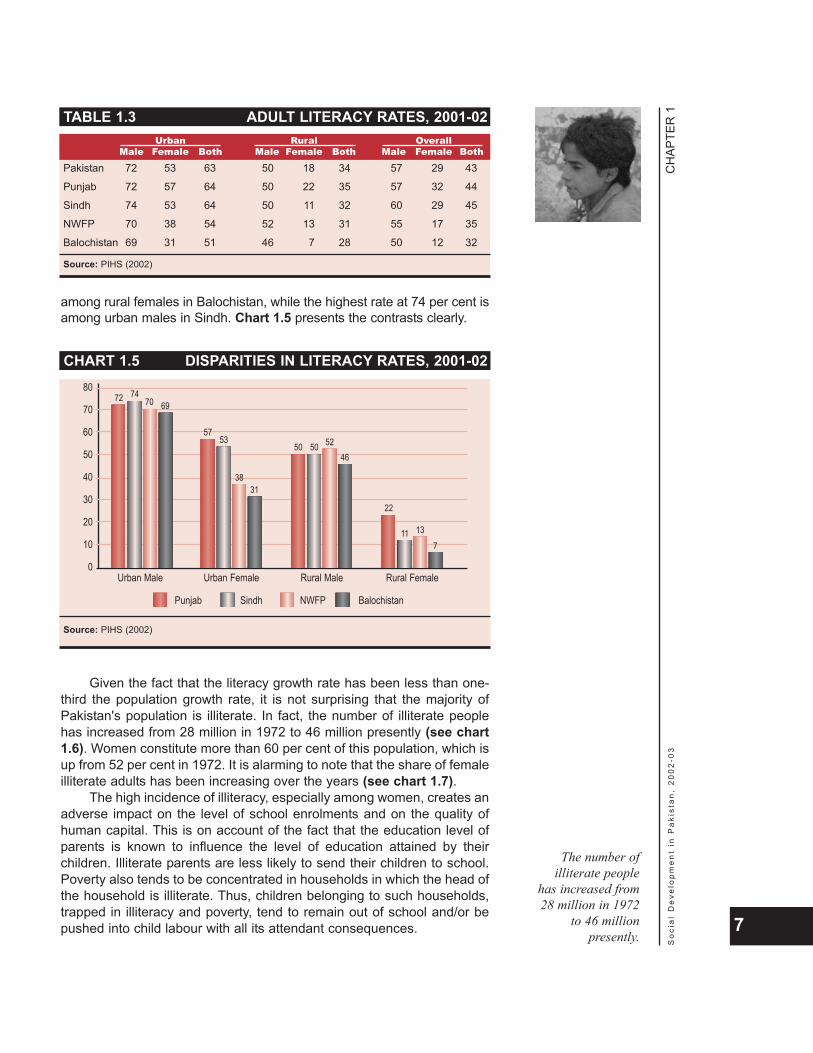
among rural females in Balochistan, while the highest rate at 74 per cent isamong urban males in Sindh. Chart 1.5 presents the contrasts clearly.
Given the fact that the literacy growth rate has been less than one-third the population growth rate, it is not surprising that the majority ofPakistan's population is illiterate. In fact, the number of illiterate peoplehas increased from 28 million in 1972 to 46 million presently (see chart1.6). Women constitute more than 60 per cent of this population, which isup from 52 per cent in 1972. It is alarming to note that the share of femaleilliterate adults has been increasing over the years (see chart 1.7).
The high incidence of illiteracy, especially among women, creates anadverse impact on the level of school enrolments and on the quality ofhuman capital. This is on account of the fact that the education level ofparents is known to influence the level of education attained by theirchildren. Illiterate parents are less likely to send their children to school.Poverty also tends to be concentrated in households in which the head ofthe household is illiterate. Thus, children belonging to such households,trapped in illiteracy and poverty, tend to remain out of school and/or bepushed into child labour with all its attendant consequences.
CH
APTE
R 1
So
cia
l D
eve
lop
me
nt
in P
aki
sta
n,
20
02
-03
7
CHART 1.5 DISPARITIES IN LITERACY RATES, 2001-0280
70
60
50
40
30
20
10
0
72 7470 69
Urban Male
Punjab Sindh NWFP Balochistan
5753
3831
Urban Female
50 50 5246
Rural Male
22
11 137
Rural Female
Source: PIHS (2002)
TABLE 1.3 ADULT LITERACY RATES, 2001-02Urban Rural Overall
Male Female Both Male Female Both Male Female Both
Pakistan 72 53 63 50 18 34 57 29 43
Punjab 72 57 64 50 22 35 57 32 44
Sindh 74 53 64 50 11 32 60 29 45
NWFP 70 38 54 52 13 31 55 17 35
Balochistan 69 31 51 46 7 28 50 12 32
Source: PIHS (2002)
The number ofilliterate people
has increased from28 million in 1972
to 46 millionpresently.

Growth in enrolment rates has also been stagnant, as reflected by theseries of flat curves shown in chart 1.8. During the last decade,
gross primary enrolment rates (GPER) have shown sluggish growth (seetable 1.4). GPER increased by 5 percentage points _ at less than 1 percent per annum _ from 69 per cent in 1993 to 74 per cent in 2000. Growthin primary enrolments declined during the 1990s when compared to the 1980s.
CH
APTE
R 1
So
cia
l D
eve
lop
me
nt
in P
aki
sta
n,
20
02
-03
8
CHART 1.6 TRENDS IN STOCK OF ILLITERATE POPULATION
50.00
40.00
30.00
20.00
10.00
0.001972
Male Female
1981 1998 2002
Sources: Population Census Reports (1972, 1981 and 1998)PIHS (2002)
CHART 1.7 PROPORTION OF FEMALES IN ILLITERATEPOPULATION
0.65
0.60
0.55
0.50
0.451972
0.520.54
0.59
0.61
1981 1998 2002
Sources: Population Census Reports (1972, 1981 and 1998)PIHS (2002)
TRENDS IN ENROLMENT RATES

CH
APTE
R 1
So
cia
l D
eve
lop
me
nt
in P
aki
sta
n,
20
02
-03
9
CHART 1.8 GROSS PRIMARY ENROLMENT RATES
100
90
80
70
60
50
40
30
Sources: Provincial EMIS, NEMIS, Development Statistics and Education Statistics (various issues)SPDC Estimates
1993 1994 1995 1996 1997 1998 1999 2000
FemaleMaleTotal
TABLE 1.4 TRENDS IN GROSS PRIMARYENROLMENT RATES (%)
1992-93 1993-94 1994-95 1995-96 1996-97 1997-98 1998-99 1999-2000 2000-01
Total
Pakistan 69 69 70 71 72 72 71 74 74
Punjab 73 71 72 73 75 76 74 80 79
Sindh 65 69 69 70 65 65 67 64 62
NWFP 66 68 70 72 76 78 69 78 81
Balochistan 50 48 50 50 57 55 58 58 58
Male
Pakistan 85 82 83 84 85 86 82 88 84
Punjab 83 79 81 82 84 85 82 90 86
Sindh 84 87 87 88 82 81 82 78 73
NWFP 95 89 91 92 96 105 90 105 100
Balochistan 73 66 67 65 69 66 67 67 65
Female
Pakistan 52 55 56 57 58 58 58 60 63
Punjab 62 63 63 64 66 67 67 69 71
Sindh 45 49 49 51 47 48 50 48 50
NWFP 35 45 47 51 54 48 45 48 61
Balochistan 22 26 29 32 42 42 46 47 48
Sources: Provincial EMIS, NEMIS, Development Statistics and Education Statistics (various issues)
SPDC Estimates
M a l e
F e m a l e
T o t a l
Growth inenrolment rates
has also beenstagnant.
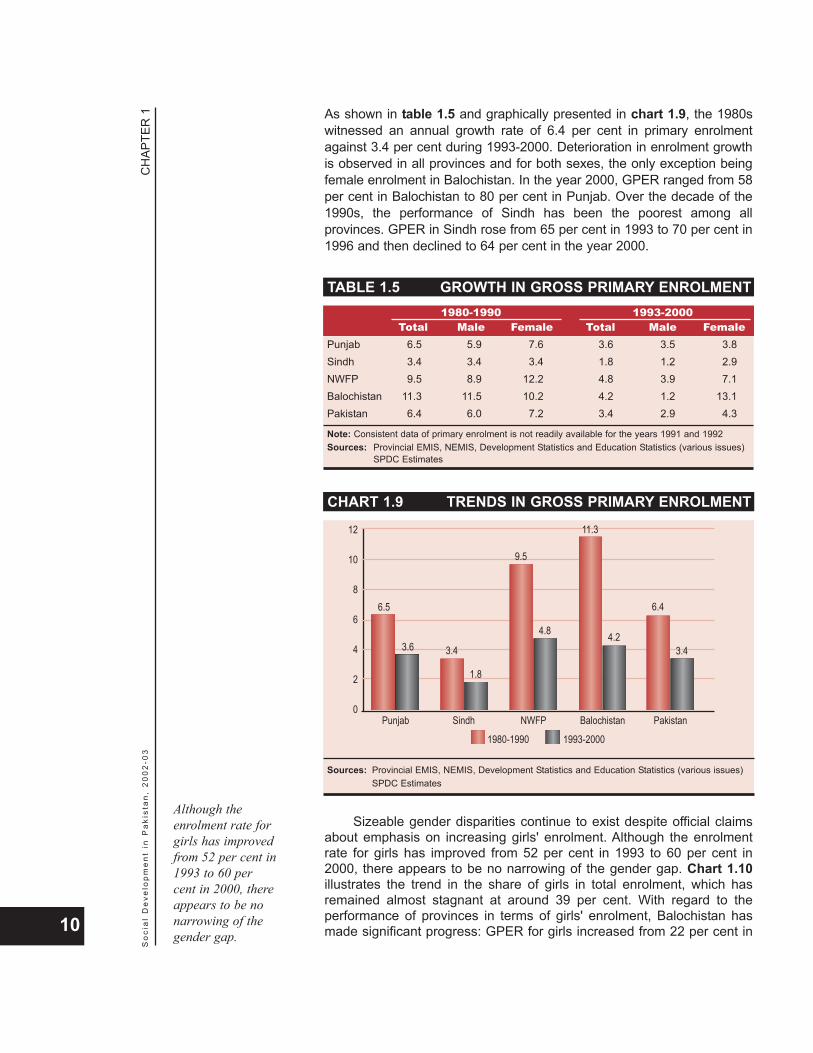
As shown in table 1.5 and graphically presented in chart 1.9, the 1980switnessed an annual growth rate of 6.4 per cent in primary enrolmentagainst 3.4 per cent during 1993-2000. Deterioration in enrolment growthis observed in all provinces and for both sexes, the only exception beingfemale enrolment in Balochistan. In the year 2000, GPER ranged from 58per cent in Balochistan to 80 per cent in Punjab. Over the decade of the1990s, the performance of Sindh has been the poorest among allprovinces. GPER in Sindh rose from 65 per cent in 1993 to 70 per cent in1996 and then declined to 64 per cent in the year 2000.
Sizeable gender disparities continue to exist despite official claimsabout emphasis on increasing girls' enrolment. Although the enrolmentrate for girls has improved from 52 per cent in 1993 to 60 per cent in2000, there appears to be no narrowing of the gender gap. Chart 1.10illustrates the trend in the share of girls in total enrolment, which hasremained almost stagnant at around 39 per cent. With regard to theperformance of provinces in terms of girls' enrolment, Balochistan hasmade significant progress: GPER for girls increased from 22 per cent in
CH
APTE
R 1
So
cia
l D
eve
lop
me
nt
in P
aki
sta
n,
20
02
-03
10
TABLE 1.5 GROWTH IN GROSS PRIMARY ENROLMENT1980-1990 1993-2000
Total Male Female Total Male FemalePunjab 6.5 5.9 7.6 3.6 3.5 3.8Sindh 3.4 3.4 3.4 1.8 1.2 2.9NWFP 9.5 8.9 12.2 4.8 3.9 7.1Balochistan 11.3 11.5 10.2 4.2 1.2 13.1Pakistan 6.4 6.0 7.2 3.4 2.9 4.3
Note: Consistent data of primary enrolment is not readily available for the years 1991 and 1992Sources: Provincial EMIS, NEMIS, Development Statistics and Education Statistics (various issues)
SPDC Estimates
CHART 1.9 TRENDS IN GROSS PRIMARY ENROLMENT
12
10
8
6
4
2
0Punjab
1980-1990 1993-2000
6.5
3.6 3.4
Sindh
1.8
9.5
NWFP
4.8
11.3
Balochistan
4.2
6.4
Pakistan
3.4
Sources: Provincial EMIS, NEMIS, Development Statistics and Education Statistics (various issues)SPDC Estimates
Although theenrolment rate forgirls has improvedfrom 52 per cent in1993 to 60 percent in 2000, thereappears to be nonarrowing of thegender gap.
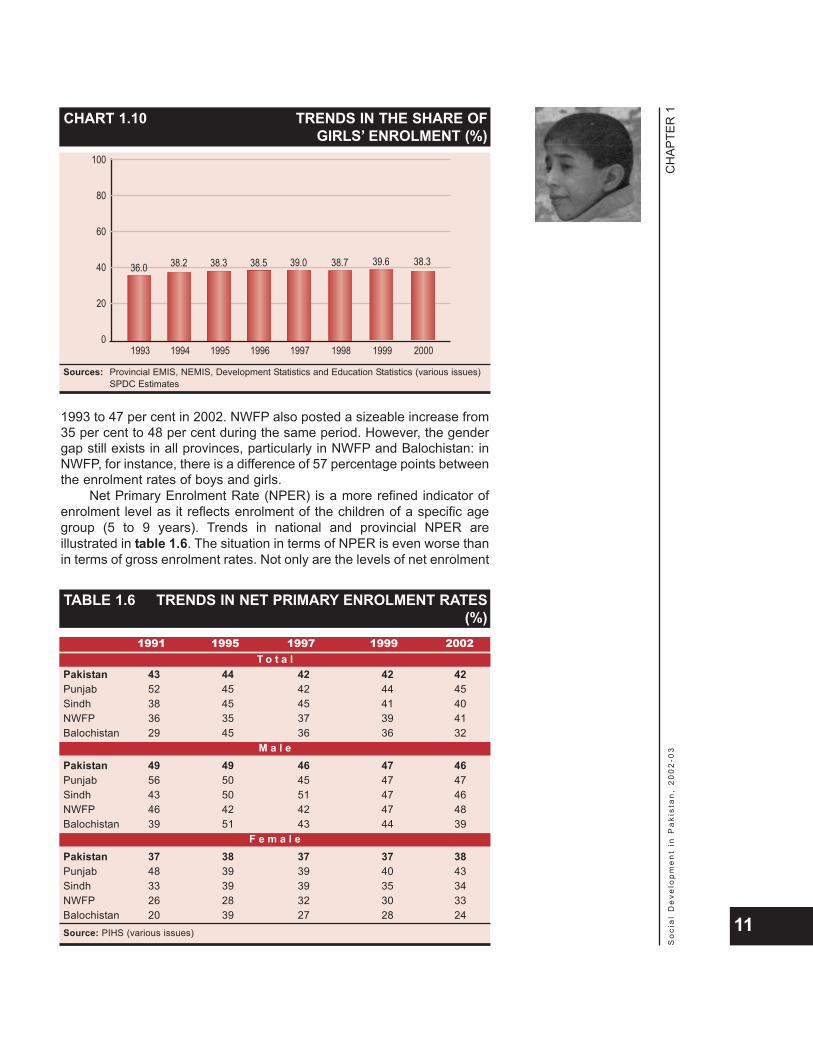
1993 to 47 per cent in 2002. NWFP also posted a sizeable increase from35 per cent to 48 per cent during the same period. However, the gendergap still exists in all provinces, particularly in NWFP and Balochistan: inNWFP, for instance, there is a difference of 57 percentage points betweenthe enrolment rates of boys and girls.
Net Primary Enrolment Rate (NPER) is a more refined indicator ofenrolment level as it reflects enrolment of the children of a specific agegroup (5 to 9 years). Trends in national and provincial NPER areillustrated in table 1.6. The situation in terms of NPER is even worse thanin terms of gross enrolment rates. Not only are the levels of net enrolment
CH
APTE
R 1
So
cia
l D
eve
lop
me
nt
in P
aki
sta
n,
20
02
-03
11
CHART 1.10 TRENDS IN THE SHARE OFGIRLS’ ENROLMENT (%)
100
80
60
40
20
0
Sources: Provincial EMIS, NEMIS, Development Statistics and Education Statistics (various issues)SPDC Estimates
36.0
1993
38.2
1994
38.3
1995
38.5
1996
39.0
1997
38.7
1998
39.6
1999
38.3
2000
TABLE 1.6 TRENDS IN NET PRIMARY ENROLMENT RATES(%)
1991 1995 1997 1999 2002TotalPakistan 43 44 42 42 42Punjab 52 45 42 44 45Sindh 38 45 45 41 40NWFP 36 35 37 39 41Balochistan 29 45 36 36 32MalePakistan 49 49 46 47 46Punjab 56 50 45 47 47Sindh 43 50 51 47 46NWFP 46 42 42 47 48Balochistan 39 51 43 44 39Female
Pakistan 37 38 37 37 38Punjab 48 39 39 40 43Sindh 33 39 39 35 34NWFP 26 28 32 30 33Balochistan 20 39 27 28 24Source: PIHS (various issues)
M a l e
F e m a l e
T o t a l
rates low but they also exhibit a declining trend over the years. NationalNPER declined from 44 per cent in 1995 to 42 per cent in 1997 and thenremained stagnant until 2002. The current rate of NPER is even lowerthan it was in 1991. It is important to note that a substantial decline hastaken place in Punjab, where NPER has dropped from 52 per cent to 45per cent. Trends in gender-wise rates are no different. National NPER forboys has declined from 49 per cent in 1991 to 46 per cent in 2002, whilethat for girls has remained almost stagnant, varying between 37 and 38per cent during this period.
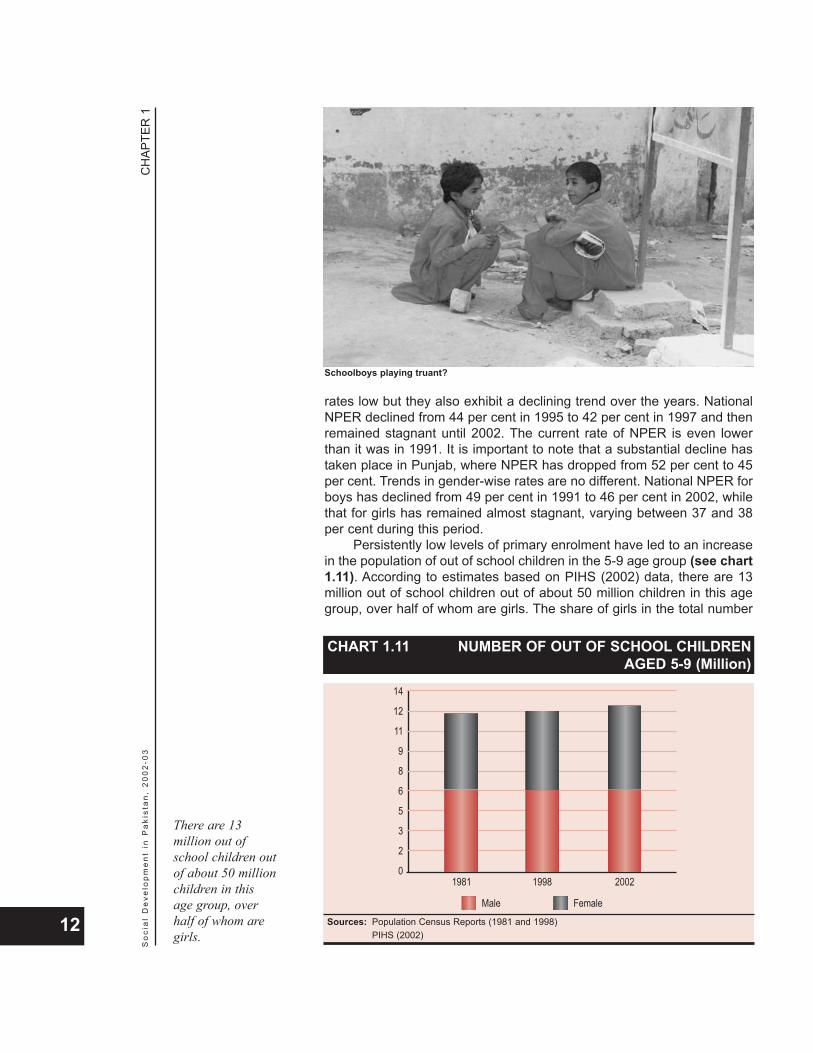
Persistently low levels of primary enrolment have led to an increasein the population of out of school children in the 5-9 age group (see chart1.11). According to estimates based on PIHS (2002) data, there are 13million out of school children out of about 50 million children in this agegroup, over half of whom are girls. The share of girls in the total number
CH
APTE
R 1
So
cia
l D
eve
lop
me
nt
in P
aki
sta
n,
20
02
-03
12
CHART 1.11 NUMBER OF OUT OF SCHOOL CHILDRENAGED 5-9 (Million)
14
12
11
9
8
6
5
3
2
01981
Male Female
1998 2002
Sources: Population Census Reports (1981 and 1998)PIHS (2002)
Schoolboys playing truant?
There are 13million out ofschool children outof about 50 millionchildren in thisage group, overhalf of whom aregirls.
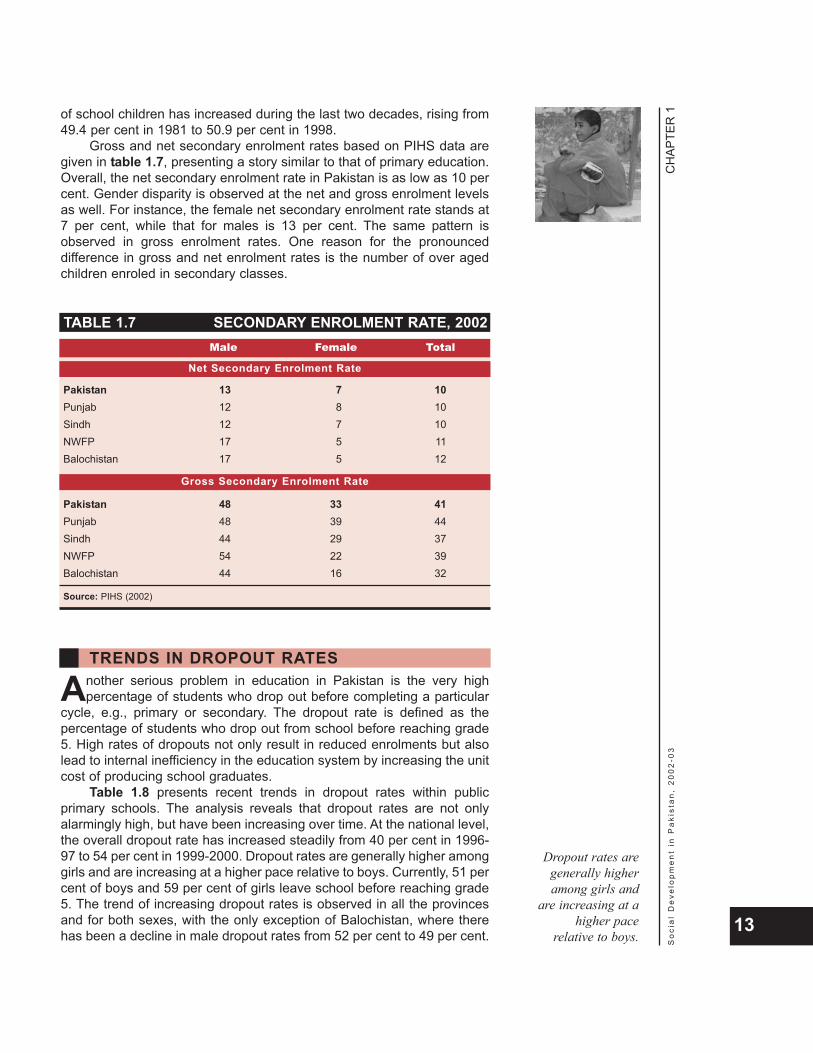
of school children has increased during the last two decades, rising from49.4 per cent in 1981 to 50.9 per cent in 1998.
Gross and net secondary enrolment rates based on PIHS data aregiven in table 1.7, presenting a story similar to that of primary education.Overall, the net secondary enrolment rate in Pakistan is as low as 10 percent. Gender disparity is observed at the net and gross enrolment levelsas well. For instance, the female net secondary enrolment rate stands at7 per cent, while that for males is 13 per cent. The same pattern isobserved in gross enrolment rates. One reason for the pronounceddifference in gross and net enrolment rates is the number of over agedchildren enroled in secondary classes.
Another serious problem in education in Pakistan is the very highpercentage of students who drop out before completing a particular
cycle, e.g., primary or secondary. The dropout rate is defined as thepercentage of students who drop out from school before reaching grade5. High rates of dropouts not only result in reduced enrolments but alsolead to internal inefficiency in the education system by increasing the unitcost of producing school graduates.
Table 1.8 presents recent trends in dropout rates within publicprimary schools. The analysis reveals that dropout rates are not onlyalarmingly high, but have been increasing over time. At the national level,the overall dropout rate has increased steadily from 40 per cent in 1996-97 to 54 per cent in 1999-2000. Dropout rates are generally higher amonggirls and are increasing at a higher pace relative to boys. Currently, 51 percent of boys and 59 per cent of girls leave school before reaching grade5. The trend of increasing dropout rates is observed in all the provincesand for both sexes, with the only exception of Balochistan, where therehas been a decline in male dropout rates from 52 per cent to 49 per cent.
CH
APTE
R 1
So
cia
l D
eve
lop
me
nt
in P
aki
sta
n,
20
02
-03
13
TABLE 1.7 SECONDARY ENROLMENT RATE, 2002Male Female Total
Net Secondary Enrolment Rate
Pakistan 13 7 10Punjab 12 8 10Sindh 12 7 10NWFP 17 5 11Balochistan 17 5 12
Gross Secondary Enrolment Rate
Pakistan 48 33 41Punjab 48 39 44Sindh 44 29 37NWFP 54 22 39Balochistan 44 16 32
Source: PIHS (2002)
Gross Secondary Enrolment Rate
Net Secondary Enrolment Rate
TRENDS IN DROPOUT RATES
Dropout rates aregenerally higheramong girls and
are increasing at ahigher pace
relative to boys.

The dropout rate within public primary schooling clearly indicatesinefficiency and the inability of public schools to retain children within thesystem. By comparison, private schools have performed better.
The availability of schools and teachers plays a vital role in theeducation system. Table 1.9 reveals that at the national level,
availability of public schools has worsened during the last decade.According to estimates, in 1992-93 one public school was available for248 children in the 5-14 age group. This increased to 264 children in1999-2000, indicating a relative decline in the availability of schools.
In addition to availability, access to schools is an importantdimension of the quality of the education system. In rural areas, accesshas always been an issue, particularly for girls whose families generallydo not allow them to attend school unless it is situated within or very neartheir village. According to PIHS (2002), only 66 per cent of villages had aschool for girls within one kilometer of the village centre. Considerablevariation exists among the provinces: rural areas of NWFP and Punjabregister better accessibility rates of 84 and 80 per cent respectively, whileSindh and Balochistan suffer in comparison, with rates of 45 and 34 percent. In other words, over half the girls in rural Sindh and two-thirds in
CH
APTE
R 1
So
cia
l D
eve
lop
me
nt
in P
aki
sta
n,
20
02
-03
14
TABLE 1.8 TRENDS IN DROPOUT RATES WITHIN PUBLICPRIMARY SCHOOLS
Punjab Sindh NWFP Balochistan Pakistan
Total
1996-97 40 45 27 48 40
1997-98 46 47 31 45 44
1998-99 54 45 31 45 48
1999-00 58 51 42 47 54
Male
1996-97 41 46 26 52 41
1997-98 44 48 29 49 43
1998-99 53 47 28 50 48
1999-00 53 53 39 49 51
Female
1996-97 38 42 29 30 38
1997-98 48 45 35 34 46
1998-99 54 41 37 27 49
1999-00 64 47 49 41 59
Sources: Provincial EMIS, NEMIS, Development Statistics and Education Statistics (various issues)SPDC Estimates
M a l e
F e m a l e
T o t a l
AVAILABILITY OF PUBLIC SCHOOLSAND TEACHERS
In 1992-93 onepublic school wasavailable for 248children in the 5-14 age group. Thisincreased to 264children in 1999-2000, indicating arelative decline inthe availability ofschools.
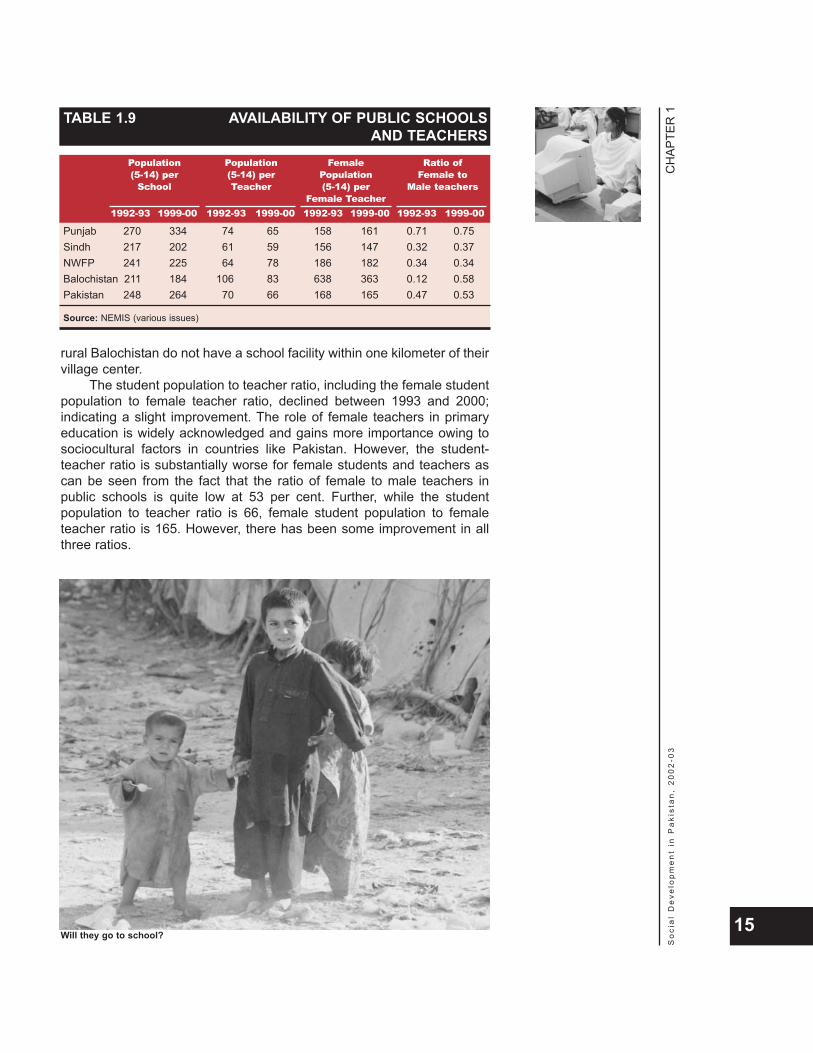
rural Balochistan do not have a school facility within one kilometer of theirvillage center.
The student population to teacher ratio, including the female studentpopulation to female teacher ratio, declined between 1993 and 2000;indicating a slight improvement. The role of female teachers in primaryeducation is widely acknowledged and gains more importance owing tosociocultural factors in countries like Pakistan. However, the student-teacher ratio is substantially worse for female students and teachers ascan be seen from the fact that the ratio of female to male teachers inpublic schools is quite low at 53 per cent. Further, while the studentpopulation to teacher ratio is 66, female student population to femaleteacher ratio is 165. However, there has been some improvement in allthree ratios.
CH
APTE
R 1
So
cia
l D
eve
lop
me
nt
in P
aki
sta
n,
20
02
-03
15
TABLE 1.9 AVAILABILITY OF PUBLIC SCHOOLSAND TEACHERS
Population Population Female Ratio of(5-14) per (5-14) per Population Female to
School Teacher (5-14) per Male teachersFemale Teacher
1992-93 1999-00 1992-93 1999-00 1992-93 1999-00 1992-93 1999-00
Punjab 270 334 74 65 158 161 0.71 0.75Sindh 217 202 61 59 156 147 0.32 0.37NWFP 241 225 64 78 186 182 0.34 0.34Balochistan 211 184 106 83 638 363 0.12 0.58Pakistan 248 264 70 66 168 165 0.47 0.53
Source: NEMIS (various issues)
Will they go to school?
CH
APTE
R 1
So
cia
l D
eve
lop
me
nt
in P
aki
sta
n,
20
02
-03
16
BOX 1.1 PHYSICAL CONDITION OF PUBLIC SCHOOLS
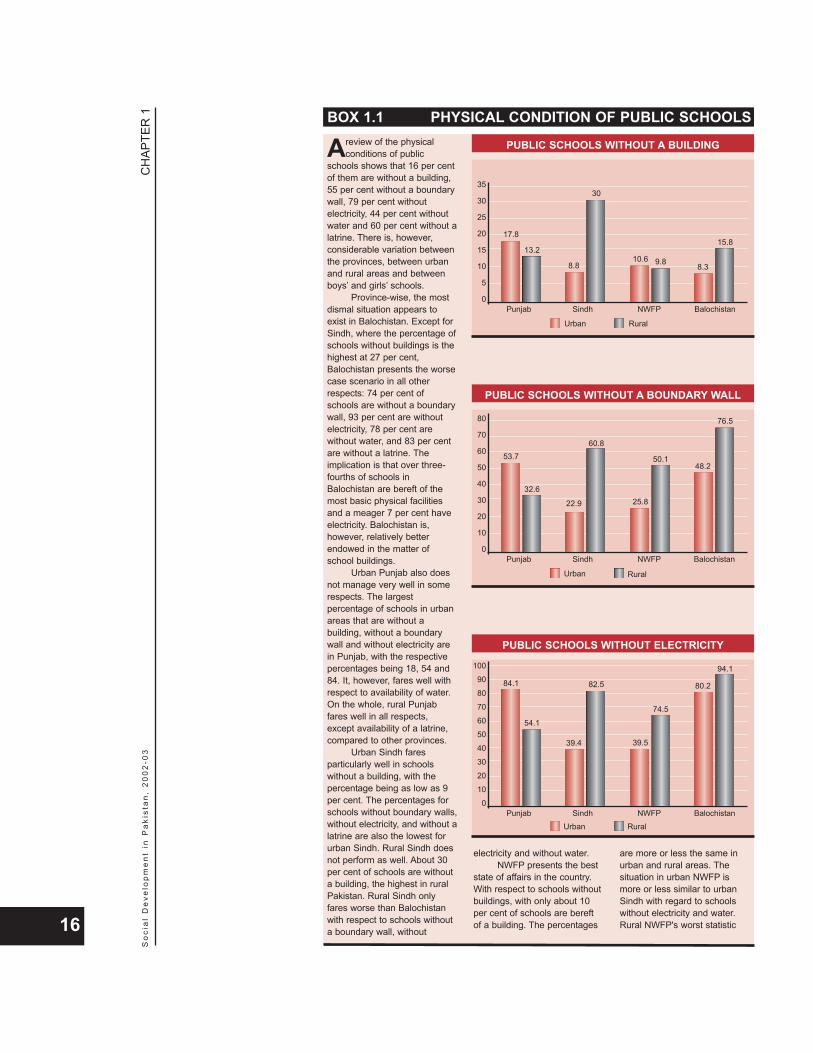
Areview of the physicalconditions of public
schools shows that 16 per centof them are without a building,55 per cent without a boundarywall, 79 per cent withoutelectricity, 44 per cent withoutwater and 60 per cent without alatrine. There is, however,considerable variation betweenthe provinces, between urbanand rural areas and betweenboys’ and girls’ schools.
Province-wise, the mostdismal situation appears toexist in Balochistan. Except forSindh, where the percentage ofschools without buildings is thehighest at 27 per cent,Balochistan presents the worsecase scenario in all otherrespects: 74 per cent ofschools are without a boundarywall, 93 per cent are withoutelectricity, 78 per cent arewithout water, and 83 per centare without a latrine. Theimplication is that over three-fourths of schools inBalochistan are bereft of themost basic physical facilitiesand a meager 7 per cent haveelectricity. Balochistan is,however, relatively betterendowed in the matter ofschool buildings.
Urban Punjab also doesnot manage very well in somerespects. The largestpercentage of schools in urbanareas that are without abuilding, without a boundarywall and without electricity arein Punjab, with the respectivepercentages being 18, 54 and84. It, however, fares well withrespect to availability of water.On the whole, rural Punjabfares well in all respects,except availability of a latrine,compared to other provinces.
Urban Sindh faresparticularly well in schoolswithout a building, with thepercentage being as low as 9per cent. The percentages forschools without boundary walls,without electricity, and without alatrine are also the lowest forurban Sindh. Rural Sindh doesnot perform as well. About 30per cent of schools are withouta building, the highest in ruralPakistan. Rural Sindh onlyfares worse than Balochistanwith respect to schools withouta boundary wall, without
electricity and without water. NWFP presents the best
state of affairs in the country.With respect to schools withoutbuildings, with only about 10per cent of schools are bereftof a building. The percentages
are more or less the same inurban and rural areas. Thesituation in urban NWFP ismore or less similar to urbanSindh with regard to schoolswithout electricity and water.Rural NWFP's worst statistic
PUBLIC SCHOOLS WITHOUT A BUILDING
17.8
13.2
8.8
30
10.6 9.8 8.3
15.8
BalochistanNWFPSindh
Urban Rural
Punjab
35
30
25
20
15
10
5
0
PUBLIC SCHOOLS WITHOUT A BOUNDARY WALL
53.7
32.6
22.9
60.8
25.8
50.148.2
76.5
BalochistanNWFPSindh
Urban Rural
Punjab
80
70
60
50
40
30
20
10
0
PUBLIC SCHOOLS WITHOUT ELECTRICITY
84.1
54.1
39.4
82.5
39.5
74.5
80.2
94.1
BalochistanNWFPSindhUrban Rural
Punjab
100
90
80
70
60
50
40
30
20
10
0

The previous discussion suggests that the educational performanceof Pakistan is far from being satisfactory. In terms of education indicators,Pakistan does not compare favourably with other countries of the region,and even with many countries that have relatively low levels of humandevelopment. Low levels of public spending, lack of access to educationfacilities, low levels of literacy and enrolment, and high dropout ratescharacterize the education sector in Pakistan. Substantial disparities existamong the provinces, regions (both urban and rural) and genders.Furthermore, the physical condition of schools in the public sector addsto the already dismal qualitative situation of education in the country (seebox 1.1). As mentioned earlier, governments have, over the years,formulated various policies and plans, which have so far not beensuccessful in achieving the desired objectives.
CH
APTE
R 1
So
cia
l D
eve
lop
me
nt
in P
aki
sta
n,
20
02
-03
17
BOX 1.1 (Contd.) PHYSICAL CONDITION OF PUBLIC SCHOOLSrelates to about 75 per cent ofschools being withoutelectricity.
Gender-wise, the physicalcondition of girls’ schoolsappears to be significantlybetter than that of boys’schools, barring a fewexceptions: schools without aboundary wall in urbanBalochistan and schoolswithout electricity in urbanPunjab and urban NWFP. Thebest statistic relates to NWFP,where less than 2 per cent ofrural girls’ schools and lessthan 3 per cent of urban girls’schools are without a building.The three worst statisticsrelate to Balochistan, where 91per cent of rural girls’ schoolsand 79 per cent of urban girlsschools are without electricity,and to Punjab, where 87 percent of urban girls schools arewithout electricity. A somewhatdisturbing situation is thatbetween one-fifth and one-quarter of girls’ schools inurban areas are without wateror a latrine. The situation isworse in rural areas, whereabout 40 per cent of girls’schools are bereft of these twobasic facilities.
Source: NEMIS (2001)
PUBLIC SCHOOLS WITHOUT WATER
18.925.2 27.5
57.2
28.7
54.5
37.7
87.4
BalochistanNWFPSindhUrban Rural
Punjab
100
90
80
70
60
50
40
30
20
10
0
PUBLIC SCHOOLS WITHOUT A LATRINE
42.0
64.2
23.1
60.9
31.0
51.1
70.2
84.4
BalochistanNWFPSindhUrban Rural
Punjab
100
90
80
70
60
50
40
30
20
10
0
CH
APTE
R 2
So
cia
l D
eve
lop
me
nt
in P
aki
sta
n,
20
02
-03
19
2EDUCATION
INEQUALITIES
“Inequalities ineducational levels
are high, indicatingthat some sectionsof the populationare significantly
worse off.”
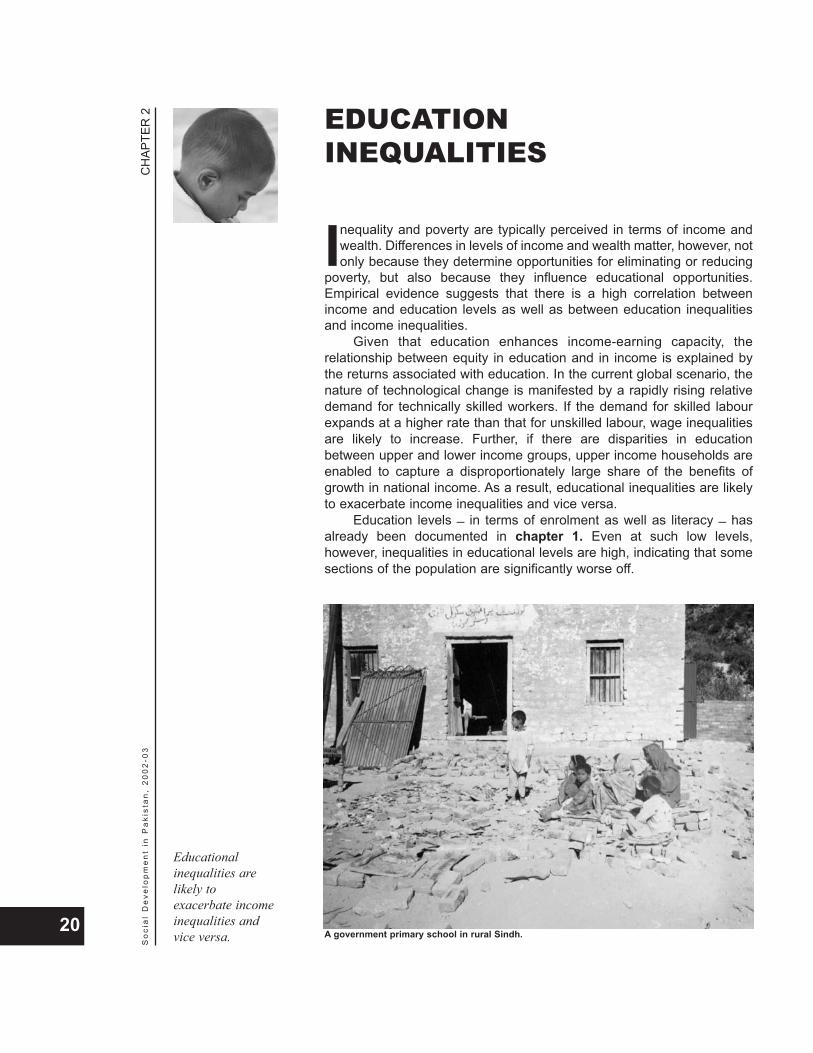
Inequality and poverty are typically perceived in terms of income andwealth. Differences in levels of income and wealth matter, however, notonly because they determine opportunities for eliminating or reducing
poverty, but also because they influence educational opportunities.Empirical evidence suggests that there is a high correlation betweenincome and education levels as well as between education inequalitiesand income inequalities.
Given that education enhances income-earning capacity, therelationship between equity in education and in income is explained bythe returns associated with education. In the current global scenario, thenature of technological change is manifested by a rapidly rising relativedemand for technically skilled workers. If the demand for skilled labourexpands at a higher rate than that for unskilled labour, wage inequalitiesare likely to increase. Further, if there are disparities in educationbetween upper and lower income groups, upper income households areenabled to capture a disproportionately large share of the benefits ofgrowth in national income. As a result, educational inequalities are likelyto exacerbate income inequalities and vice versa.
Education levels _ in terms of enrolment as well as literacy _ hasalready been documented in chapter 1. Even at such low levels,however, inequalities in educational levels are high, indicating that somesections of the population are significantly worse off.
CH
APTE
R 2
So
cia
l D
eve
lop
me
nt
in P
aki
sta
n,
20
02
-03
20 A government primary school in rural Sindh.
Educationalinequalities arelikely toexacerbate incomeinequalities andvice versa.
EDUCATIONINEQUALITIES

Adistrict level analysis, undertaken to measure educational disparities,confirms the relationship between inequality in education and
developmental levels in Pakistan. It is evident that disparities in literacyrates are correlated with the level of development. As seen in chart 2.1,as the coefficient of variation between adult literacy rate and femaleliteracy rate is decreasing, development levels are rising, implying that asthe inequality level in the literacy rate falls, development levels rise.
The first step in the analysis is the construction of two indices: theDistrict Education Index (DEI) and the District Development Index (DDI).DEI is designed to measure educational status, as reflected in enrolmentand literacy levels. DDI measures the status of developmental variablesother than those relating to education. Components of DEI include adultliteracy rate and enrolment in the 5-9, 10-14, and 15-24 age cohorts andtotal student population. The age distributions are stated to be broadrepresentatives of primary, secondary and tertiary levels, and are onlylargely indicative because the three levels do not correlate exactly withthe given age brackets. For example, cases of children older than nineyears of age enroled in the primary section are common. The last agebracket is split into those enroled in general and in professionaldisciplines. Components of DDI include extent of mechanization andmodernization of agriculture, housing quality, access to basic residentialservices, and development of transport and communications. Theconstruction of the DEI and DDI is explained in boxes 2.1 and 2.2respectively.
The degree of inequality in DEI is assessed through three measures:(1) Maximum to Minimum Ratio (MMR), (2) Coefficient of Variation (CV),and (3) Gini Index (GI). The measures have been estimated for eachquintile to determine the extent of spatial inequality in education. Thehigher the value of MMR, CV or Gini, the greater the inequality. Thedefinitions and methodology of computing the indices and inequalitymeasures and issues relating to data are shown in box 2.3.
CH
APTE
R 2
So
cia
l D
eve
lop
me
nt
in P
aki
sta
n,
20
02
-03
21
CHART 2.1 DEVELOPMENT LEVEL AND INEQUALITYIN ADULT LITERACY RATE
Source: SPDC estimates based on Population and Housing Census (1998)
80
70
60
50
40
30
20
10
0III III IV V
Development Level Inequality Level Adult Literacy Rate Inequality Level Female Literacy Rate
DISTRICT PROFILE OF INEQUALITY

CH
APTE
R 2
So
cia
l D
eve
lop
me
nt
in P
aki
sta
n,
20
02
-03
22
BOX 2.1 HOW IS THE DISTRICT EDUCATION INDEXCONSTRUCTED?
The construction of the DEI isbased on indicators related to
education data available in thePopulation and Housing Census of1998. No other published orunpublished information is used inthe analysis to render the exerciseless disputable or debatable as faras the data source is concerned.While this approach makes theanalysis somewhat restrictive, it ispreferred in order to avoid anyreservations regarding the qualityof data.
Five indicators are derivedfrom the Census data:
Student population andenrolment in age cohort 5-9yearsStudent population andenrolment in age cohort 10-14yearsStudent population and
enrolment in generaldisciplines in age cohort 15-24 yearsStudent population andenrolment in professionaldisciplines in age cohort 15-24 years, andAdult literacy rate. The three age cohorts _ 5-9,
10-14 and 15-24 years roughlyrepresent primary, secondary andtertiary grades. At the tertiary level,the general disciplines includeenrolment in arts or sciencesubjects, while the technicaldisciplines include engineering,medicine, public health, commerceand business administration,teaching, agriculture, and lawprogrammes. Adult literacy rate isdefined as the ratio of literatepersons (who can read anewspaper and write a simple
letter in any language) to thepopulation aged 10 years andolder.
The above five indicators aresimple rates and can be combinedby assigning them equal weight.This would, however, not takeaccount of the relative (statistical)importance of the differentindicators. As such, the PrincipalComponent Technique of FactorAnalysis is used to generateweights. This statistical procedureassigns the highest weight tothose variables that have thegreatest variance (or dispersion)while indicators with a lower levelof variation are assigned lowerweights. After assigning theseweights to selected indictors, DEIis computed separately for malesand females, for urban and ruralareas and for provinces.
BOX 2.2 HOW IS THE DISTRICT DEVELOPMENT INDEXCONSTRUCTED?
Various attributes or indicatorshave been employed to
represent the development level ofa district. These attributes relateto:
Income and wealthModernization of agricultureHousing quality and services,andTransport and communications.
The District development score isobtained by applying the statisticaltechnique of Factor Analysis to theselected indicators. This score isthen used to construct the DistrictDevelopment Index (DDI). A briefdescription of the developmentindicators follows.
Income and WealthDirect income data at the districtlevel are not available. As such,various proxies are used toestimate the income and wealthposition of a district. For the ruraleconomy, the cash value ofagricultural produce per ruralperson and livestock per ruralperson are used. All 43 major andminor crops, including fruits andvegetables, are considered toestimate a district's cash valuefrom agriculture. For the urbaneconomy, per capita value addedin large-scale manufacturing isused to proxy the level of urban
income. On the assumption thatthere may be a direct link betweenthe number of bank branches in adistrict and the volume of bankdeposits, bank branches per capitaare used as a crude measure of adistrict's wealth. Per capita carownership is also used to proxythe district's income and wealth inthe urban areas.
Modernization of AgricultureModernization of agriculture isanother area of developmentwhich has direct and indirecteffects on the prosperity andstandard of living of ruralpopulations. Three measures areused here: tractors per 1000 acresof cropped area as a measure ofmechanization, consumption offertilizer per 1000 acres of croppedarea as a measure of the extent offertilizer use, and irrigated areaper 1000 acres of cropped area asa measure of access to canalirrigation systems and tube wells.
Housing Quality and HousingServicesShelter is one of the basic needs,and housing conditions are one ofthe key determinants of the qualityof life. Three measures are usedhere: proportion of houses withRCC/RBC roofing and cementedouter walls as a measure of thequality of housing stock, rooms per
person as a measure of adequacyof housing, and proportion ofhouseholds with inside pipedwater, and with electricity and gasas a measure of availability ofhousing services.
Transport and CommunicationsRoads and the transportationnetwork have a significant impacton socialization andmodernization. Three indicatorshave been included to portray thelevel of development of thetransport and communicationsector in a district: metalled roadmileage per 100 square kilometersof geographical area of a district,passenger load carrying capacityas a measure of availability oftransport vehicles; and number offixed telephone connections per1000 persons.
Note: Diverse sources are used togather data for the above indicators.Major sources include: District CensusReports, 1998; Provincial CensusReports, 1998; Agriculture Statistics ofPakistan, 1998-99; ProvincialDevelopment Statistics, Crop AreaProduction 1997-98; Census ofManufacturing Industries, 1995-96 etc.To fulfill the missing gaps or for updatingvarious information, unpublished dataare also obtained from the provincialBureaus of Statistics, State Bank ofPakistan and the Ministry of Agriculture.

Table 2.1 shows the overall status of each of the DEI components.The average school enrolment rates for children aged 5-9 and 10-14 arerather low at 34 and 44 per cent respectively. The enrolment in generaldisciplines for the population aged 15-24 is even lower at 18 per cent, andthat for technical disciplines is almost negligible at 0.3 per cent. Table 2.2provides an indication of the extent of disparity. Disparities between districtsare also substantial. The enrolment rate for the population aged 5-9 rangesfrom less than 4 per cent in Jhal Magsi, Balochistan to 75 per cent in Gujrat,
CH
APTE
R 2
So
cia
l D
eve
lop
me
nt
in P
aki
sta
n,
20
02
-03
23
BOX 2.3 MEASURES OF INEQUALITY
The measurement of disparities is an arduoustask and no single statistical measure is able
to capture its myriad dimensions. Recognizingthese challenges, various measures are used tohighlight the diverse dimensions of inequality.Four measures _ Maximum-to-Minimum Ratio,Coefficient of Variation the Gini Index, and theConcentration Curve _ are widely used and aredescribed here.
Maximum to Minimum Ratio The MMR is derived simply by dividing themaximum value by the minimum value. If MMRis equal to 1, it would imply a situation of perfectequality. In reality, the MMR is usually greaterthan 1. The highest to lowest ratio of DEIprovides a measure of the range of national orprovincial educational disparities. If this ratio issmall (close to 1), it would mean that the districtshave a relatively equal level of education. Thegreater than 1 this ratio is, the higher the degreeof inequality in the level of education.
Coefficient of VariationThe CV is a measure of distance from theaverage or dispersion around the mean. Thisdispersion can be calculated in several differentways. The simple coefficient of variation is anun-weighted measure as given below:
where,CV is coefficient of variationu implies un-weightedIi is the value of DEI
is the mean value of DEIand n is the number of districts.
CVu varies from zero for perfect equality ton _ 1 for perfect inequality.
Although this measure can be used forcomparisons of regional disparities across time, itis problematic for comparisons betweenprovinces because the inequality value issensitive to the number of districts in theprovince. Therefore, a 'weighted coefficient ofvariation' is used, thus:
where is the regional weight or share in
the national or provincial population. This isbetter than the un-weighted CVu for provincialcomparison, as the measure of inequalitydepends not on the number of districts, but onthe population proportion.
Gini IndexThe Gini Index provides a measure of resourceinequality within a population. It summarizes theextent to which actual distribution of resourcesdiffers from a hypothetical distribution of eachperson/unit receiving an identical share. The Giniis a dimensionless index scaled to vary from aminimum of zero to a maximum of 1: zerorepresenting no inequality and 1 representing themaximum possible degree of inequality. The Giniis computed as follows:
To compute the Gini for land inequality, groupdata from Agricultural Census 2000 is used. Thestandard formula for computing the Giini forgrouped data is furnished below.
where,N is the number of farm size categories(less than 1 acre, 1-2.5 acres ….. morethan 150 acres)
σ represents the cumulative distribution ofvalues
Y is the proportion of farms owned
and X is the proportion of land area owned.
CVu1
n
i = 1I Σ i(I I )21/2
I
CVw1
n
i = 1I
piPΣ i(I I )2
1/2
piP
( )
Gini
m
j = 1Ii _ IjΣ
n
i = 1Σ1
2 I( ) 1n(n _ 1)( )
Gini = 1 (σYi-1 + σYi)(σXi-1 σXi)N
i = 1Σ

Punjab. In the case of the population aged 10-14, it varies from 7 per centin Kohlu, Balochistan to 85 per cent in Rawalpindi, Punjab. For thepopulation aged 15-24 enroled in general disciplines, it varies from 2 percent in Jhal Magsi to 44 per cent in Peshawar, NWFP. And for the same agebracket enroled in professional disciplines, it varies from zero in KilaSaifullah, Balochistan, to 3 per cent in Peshawar. The literacy rate rangesfrom 10 per cent in Musa Khel, Balochistan, to 70 per cent in Rawalpindi. Itis noteworthy that the three districts with the lowest enrolment and literacyrates are all in Balochistan and the three districts with the highest levels ofenrolment and literacy are in the northern provinces of Punjab and NWFP.
Table 2.3 shows the DEI status and disparity with respect to genderand urban-rural areas. The DEI score for any district can range from 1 to100. The closer the value of the DEI is to 100, the better endowed it is withrespect to education variables. Thus, the population weighted averageDEI value of 36 for Pakistan implies that the country is 64 points behindthe 'ideal' value of 100. Males are relatively better off, with an average DEIof 44 and lower levels of disparity, as reflected by an MMR of 8. Femalesare relatively worse off, with an average DEI of 30 and an MMR of 29.
Rural areas are relatively worse off on all counts. Rural males registeran average DEI of 41, with an MMR of 11, while rural females report anaverage DEI of 23 and an MMR of 48. Urban areas are relatively better off:the average DEI for urban males is 56, with an MMR of just 3, while theaverage DEI for urban females is 44, with an MMR of 21. It appears,therefore, that urban males rank highest in terms of educationalendowment while rural females rank the lowest.
CH
APTE
R 2
So
cia
l D
eve
lop
me
nt
in P
aki
sta
n,
20
02
-03
24
TABLE 2.1 AVERAGE VALUE OF COMPONENTS OF DEIMean Minimum Maximum
Enrolment 5-9 years [Primary] 33.56 3.74 74.78
Enrolment 10-14 years [Secondary] 43.93 6.81 84.61
Enrolment 15-24 years [Tertiary General] 17.53 2.14 44.18
Enrolment 15-24 years [Tertiary Professional] 0.34 0.00 3.28
Adult Literacy Rate 34.90 10.37 70.45
Source: SPDC estimates based on Population and Housing Census (1998)
TABLE 2.2 ESTIMATES OF DISPERSION INCOMPONENTS OF DEI
Maximum Coefficient Ginito of Index
Minimum Variation (%)Ratio (%)
Enrolment 5-9 years [Primary] 20 62.58 29.79
Enrolment 10-14 years [Secondary] 12 43.75 23.43
Enrolment 15-24 years [Tertiary-General] 21 47.46 22.85
Enrolment 15-24 years [Tertiary-Professional] 3 166.63 43.13
Adult Literacy Rate 7 51.46 23.34
Source: SPDC estimates based on Population and Housing Census (1998)
The three districtswith the lowestenrolment andliteracy rates areall in Balochistan.
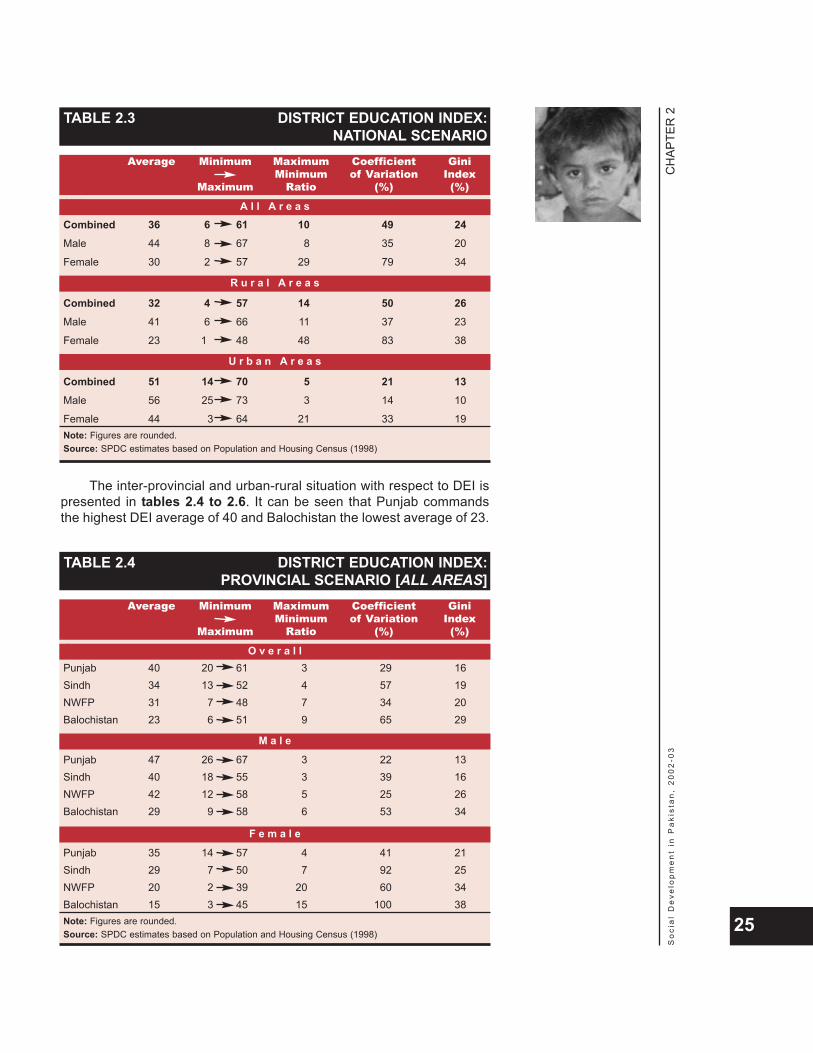
The inter-provincial and urban-rural situation with respect to DEI ispresented in tables 2.4 to 2.6. It can be seen that Punjab commandsthe highest DEI average of 40 and Balochistan the lowest average of 23.
CH
APTE
R 2
So
cia
l D
eve
lop
me
nt
in P
aki
sta
n,
20
02
-03
25
TABLE 2.3 DISTRICT EDUCATION INDEX:NATIONAL SCENARIO
Average Minimum Maximum Coefficient GiniMinimum of Variation Index
Maximum Ratio (%) (%)All Areas
Combined 36 6 61 10 49 24Male 44 8 67 8 35 20
Female 30 2 57 29 79 34
Rural Areas
Combined 32 4 57 14 50 26Male 41 6 66 11 37 23
Female 23 1 48 48 83 38
Urban Areas
Combined 51 14 70 5 21 13Male 56 25 73 3 14 10
Female 44 3 64 21 33 19Note: Figures are rounded.Source: SPDC estimates based on Population and Housing Census (1998)
R u r a l A r e a s
U r b a n A r e a s
A l l A r e a s
TABLE 2.4 DISTRICT EDUCATION INDEX:PROVINCIAL SCENARIO [ALL AREAS]
Average Minimum Maximum Coefficient GiniMinimum of Variation Index
Maximum Ratio (%) (%)Overall
Punjab 40 20 61 3 29 16Sindh 34 13 52 4 57 19NWFP 31 7 48 7 34 20Balochistan 23 6 51 9 65 29
Male
Punjab 47 26 67 3 22 13Sindh 40 18 55 3 39 16NWFP 42 12 58 5 25 26Balochistan 29 9 58 6 53 34
FemalePunjab 35 14 57 4 41 21Sindh 29 7 50 7 92 25NWFP 20 2 39 20 60 34Balochistan 15 3 45 15 100 38Note: Figures are rounded.Source: SPDC estimates based on Population and Housing Census (1998)
M a l e
F e m a l e
O v e r a l l
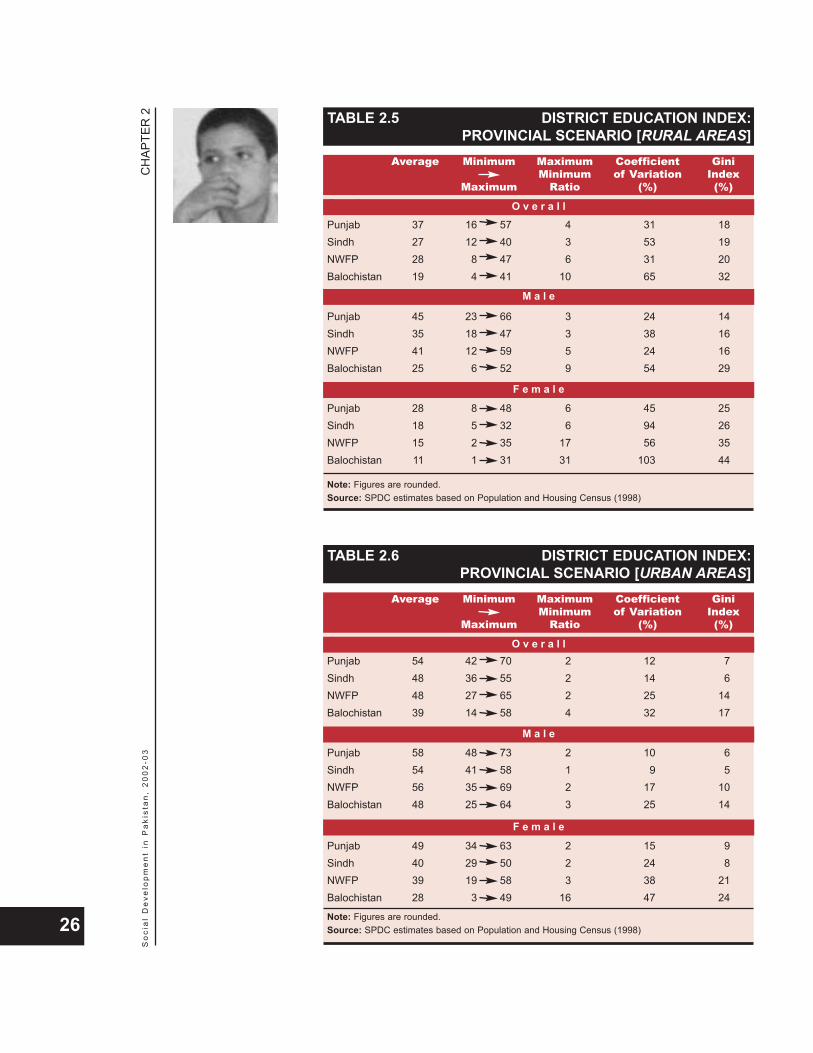
CH
APTE
R 2
So
cia
l D
eve
lop
me
nt
in P
aki
sta
n,
20
02
-03
26
TABLE 2.5 DISTRICT EDUCATION INDEX:PROVINCIAL SCENARIO [RURAL AREAS]
Average Minimum Maximum Coefficient GiniMinimum of Variation Index
Maximum Ratio (%) (%)Overall
Punjab 37 16 57 4 31 18Sindh 27 12 40 3 53 19NWFP 28 8 47 6 31 20Balochistan 19 4 41 10 65 32
Male
Punjab 45 23 66 3 24 14Sindh 35 18 47 3 38 16NWFP 41 12 59 5 24 16Balochistan 25 6 52 9 54 29
Female
Punjab 28 8 48 6 45 25Sindh 18 5 32 6 94 26NWFP 15 2 35 17 56 35Balochistan 11 1 31 31 103 44
Note: Figures are rounded.Source: SPDC estimates based on Population and Housing Census (1998)
M a l e
F e m a l e
O v e r a l l
TABLE 2.6 DISTRICT EDUCATION INDEX:PROVINCIAL SCENARIO [URBAN AREAS]
Average Minimum Maximum Coefficient GiniMinimum of Variation Index
Maximum Ratio (%) (%)Overall
Punjab 54 42 70 2 12 7Sindh 48 36 55 2 14 6NWFP 48 27 65 2 25 14Balochistan 39 14 58 4 32 17
Male
Punjab 58 48 73 2 10 6Sindh 54 41 58 1 9 5NWFP 56 35 69 2 17 10Balochistan 48 25 64 3 25 14
Female
Punjab 49 34 63 2 15 9Sindh 40 29 50 2 24 8NWFP 39 19 58 3 38 21Balochistan 28 3 49 16 47 24
Note: Figures are rounded.Source: SPDC estimates based on Population and Housing Census (1998)
M a l e
F e m a l e
O v e r a l l

Or, in other words, Punjab is 60 points behind the 'ideal' DEI value of 100and Balochistan is 77 points behind. A comparison of MMRs shows thatinequality is lowest in Punjab and highest in Balochistan. Sindh has ahigher DEI average (34) than NWFP (31) and inequality is also higher inNWFP than in Sindh. Inequality, as shown by all three indicators, MMR,CV and Gini Coefficient, is the highest in Balochistan for both males andfemales, with the sole exception being the case of NWFP females, whohave the highest MMR of 20.
The DEI averages for males are higher than for females across allprovinces, confirming lower levels of educational attainment amongwomen. For the male population, Punjab and Balochistan maintain theirtop and bottom rankings, respectively, as in the case of the aggregateDEI averages presented in tables 1.13 to 1.15. However, Sindh andNWFP rankings are reversed, with NWFP registering an average DEI of42 compared to 40 in Sindh. However, inequality in NWFP continues tobe higher than in Sindh. For the female population, again, Punjab andBalochistan maintain their rankings at the top and bottom. Sindh,however, leads NWFP by a wide margin of 9 points. In fact, the analysisexposes the vastly inferior position of NWFP females, with their DEIaverage of 20 being less than half that of NWFP males (42). Inequality infemale DEI is the highest in NWFP as well, with an MMR of 20. However,the Coefficient of Variation and Gini Coefficient are higher for Balochistanthan for NWFP, implying that inequality in Balochistan is higher than inNWFP.
The rural situation is more or less the same, though inequalities aresharper. In rural Punjab, males have the highest DEI average of 45 whilein rural Balochistan, females have the lowest DEI average of 11. In otherwords, rural Punjab males are 55 points and rural Balochistan femalesare 89 points behind the ‘ideal’ DEI value of 100. The DEI averages forrural Sindh and Balochistan females are about half those of their malecounterparts. The situation of rural NWFP females is worse, with their DEIaverage being almost one-third of their male counterparts’. Inequality with
CH
APTE
R 2
So
cia
l D
eve
lop
me
nt
in P
aki
sta
n,
20
02
-03
27
The situationof rural NWFP
females is worse,with their DEIaverage being
almost one-third oftheir male
counterparts’.
Out of school children engaged in child labour.
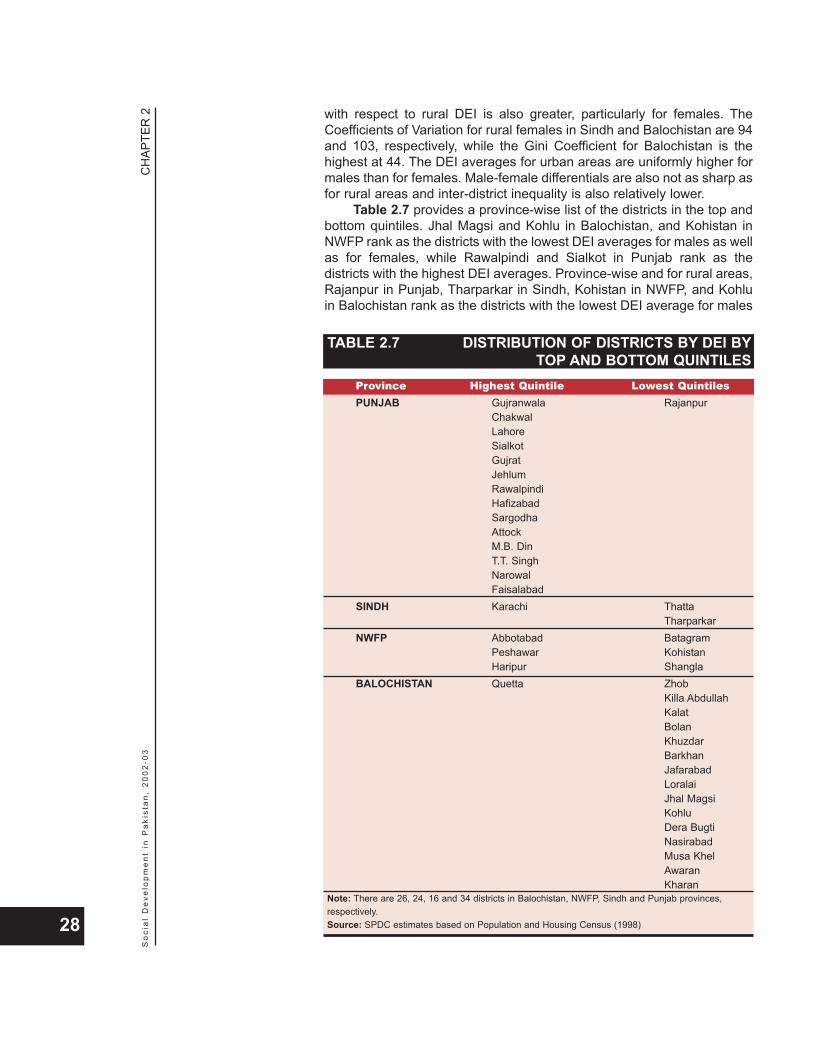
with respect to rural DEI is also greater, particularly for females. TheCoefficients of Variation for rural females in Sindh and Balochistan are 94and 103, respectively, while the Gini Coefficient for Balochistan is thehighest at 44. The DEI averages for urban areas are uniformly higher formales than for females. Male-female differentials are also not as sharp asfor rural areas and inter-district inequality is also relatively lower.
Table 2.7 provides a province-wise list of the districts in the top andbottom quintiles. Jhal Magsi and Kohlu in Balochistan, and Kohistan inNWFP rank as the districts with the lowest DEI averages for males as wellas for females, while Rawalpindi and Sialkot in Punjab rank as thedistricts with the highest DEI averages. Province-wise and for rural areas,Rajanpur in Punjab, Tharparkar in Sindh, Kohistan in NWFP, and Kohluin Balochistan rank as the districts with the lowest DEI average for males
CH
APTE
R 2
So
cia
l D
eve
lop
me
nt
in P
aki
sta
n,
20
02
-03
28
TABLE 2.7 DISTRIBUTION OF DISTRICTS BY DEI BYTOP AND BOTTOM QUINTILES
Province Highest Quintile Lowest QuintilesPUNJAB Gujranwala Rajanpur
ChakwalLahoreSialkotGujratJehlumRawalpindiHafizabadSargodhaAttockM.B. DinT.T. SinghNarowalFaisalabad
SINDH Karachi ThattaTharparkar
NWFP Abbotabad BatagramPeshawar KohistanHaripur Shangla
BALOCHISTAN Quetta ZhobKilla AbdullahKalatBolanKhuzdarBarkhan JafarabadLoralaiJhal MagsiKohluDera BugtiNasirabadMusa KhelAwaranKharan
Note: There are 26, 24, 16 and 34 districts in Balochistan, NWFP, Sindh and Punjab provinces,respectively.Source: SPDC estimates based on Population and Housing Census (1998)
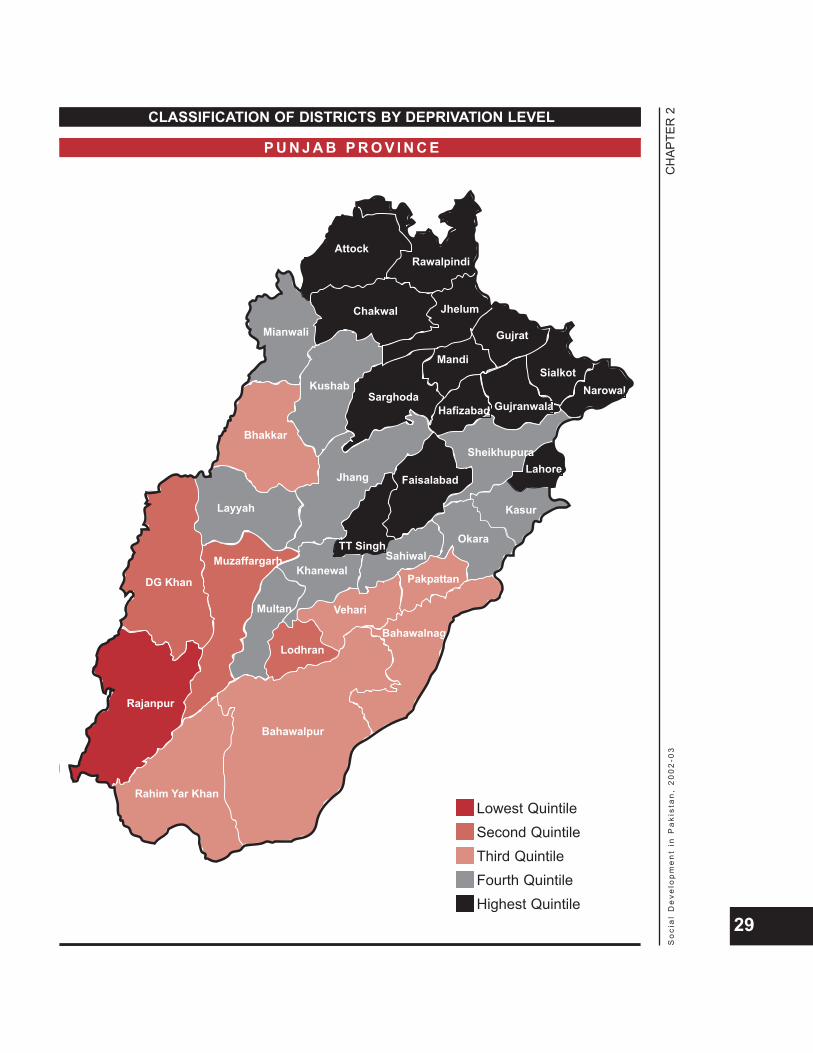
CH
APTE
R 2
So
cia
l D
eve
lop
me
nt
in P
aki
sta
n,
20
02
-03
29
������������
���������
������ ����
��������
�����
����
������
�����������
�����������������
������
������
������ �������
�� ��
�������
!���
����"
����� �
#�����
��������
$���� �"��
%�����"��
����
&�'���� �(�����
��� ���
&�'���
���� ����)���*�
����
������ ���
��'����
�� ��
+&���
!�� ��
CLASSIFICATION OF DISTRICTS BY DEPRIVATION LEVEL
������������
���������
������ ����
��������
�����
����
������
�����������
�����������������
������
������
������ �������
�� ��
�������
!���
����"
����� �
#�����
��������
$���� �"��
%�����"��
����
&�'���� �(�����
��� ���
&�'���
���� ����)���*�
����
������ ���
��'����
�� ��
+&���
!�� ��
P U N J A B P R O V I N C E
Lowest QuintileSecond QuintileThird QuintileFourth QuintileHighest Quintile
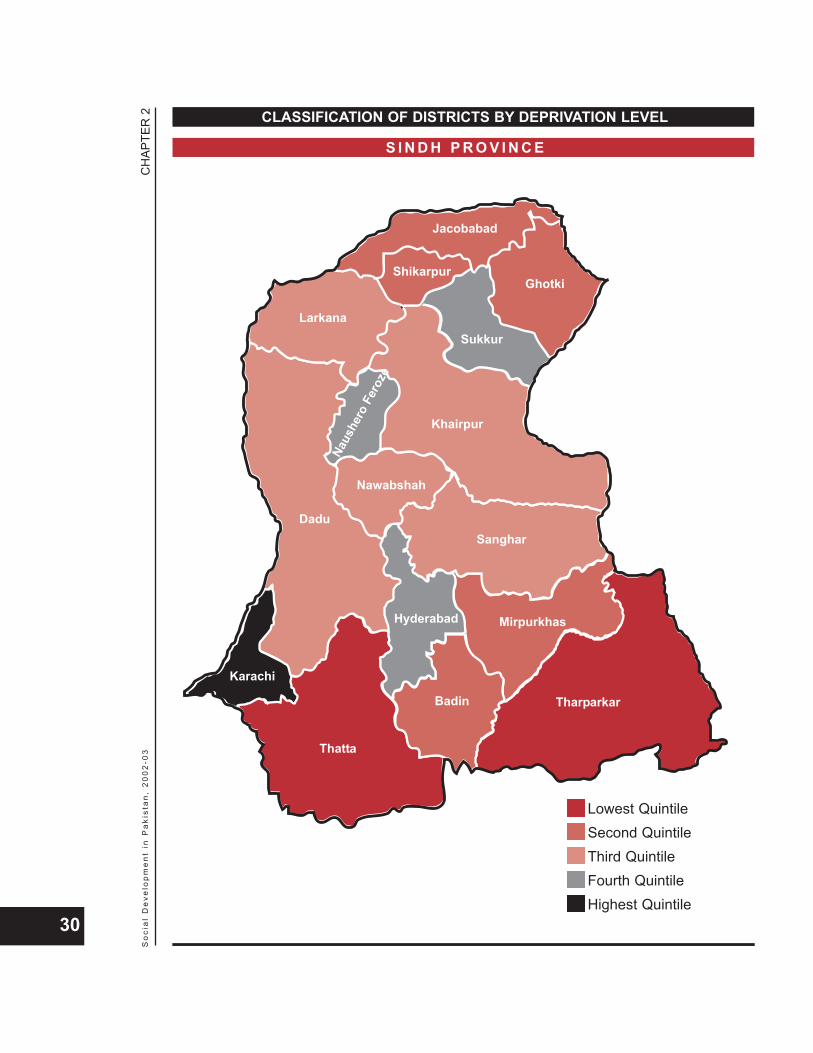
CH
APTE
R 2
So
cia
l D
eve
lop
me
nt
in P
aki
sta
n,
20
02
-03
30
CLASSIFICATION OF DISTRICTS BY DEPRIVATION LEVEL
������
���� ����������
����������% ����"��
+���
������
(���"����
�������
(��������$�����
������
&�����
!�*�"�"��
������
���������
���*��
S I N D H P R O V I N C E
Lowest QuintileSecond QuintileThird QuintileFourth QuintileHighest Quintile
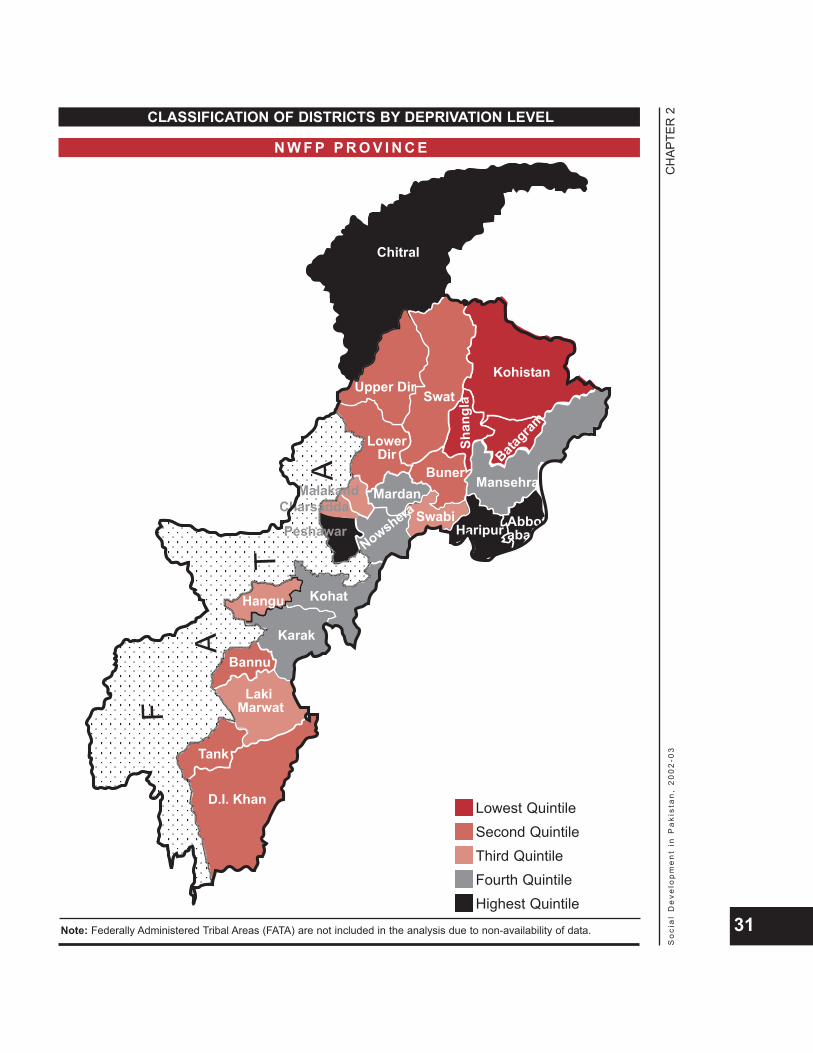
CH
APTE
R 2
So
cia
l D
eve
lop
me
nt
in P
aki
sta
n,
20
02
-03
31
CLASSIFICATION OF DISTRICTS BY DEPRIVATION LEVEL
+-.-���
���
�����������
���
����
%��� ����
(�������
�
�
�
�
/�����+������
�������
� �
������
��������
�������
���"�
������� ����#��������
#�����
�������� %������)""���"��
�����+��
N W F P P R O V I N C E
Note: Federally Administered Tribal Areas (FATA) are not included in the analysis due to non-availability of data.
Lowest QuintileSecond QuintileThird QuintileFourth QuintileHighest Quintile
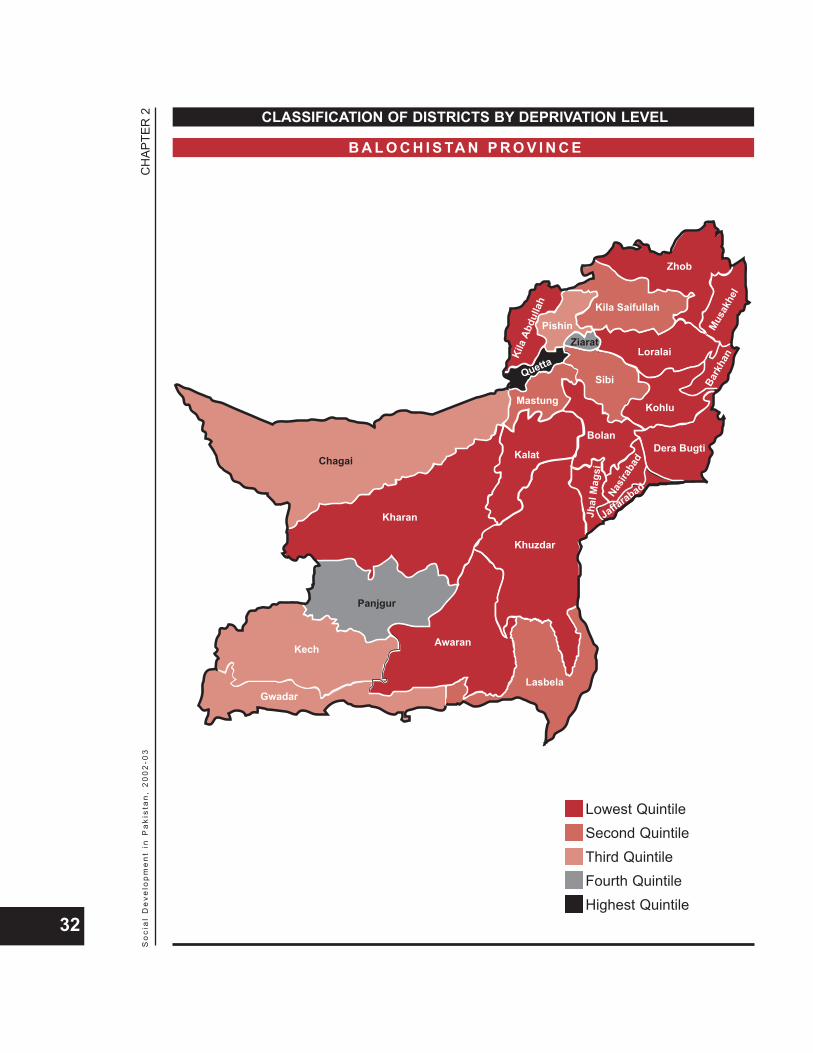
CH
APTE
R 2
So
cia
l D
eve
lop
me
nt
in P
aki
sta
n,
20
02
-03
32
CLASSIFICATION OF DISTRICTS BY DEPRIVATION LEVEL
���"� �
)����
������
� ��
������
����
#�����
��'���
�*�
&�����
,�����
� ��)"�
� ��
�����
0�����
��"�
+����������� �
(�����"��
!������"
��
!�� ����
��
�� �
���� ��
� ������� ��
0��"
������
�������
B A L O C H I S TA N P R O V I N C E
Lowest QuintileSecond QuintileThird QuintileFourth QuintileHighest Quintile
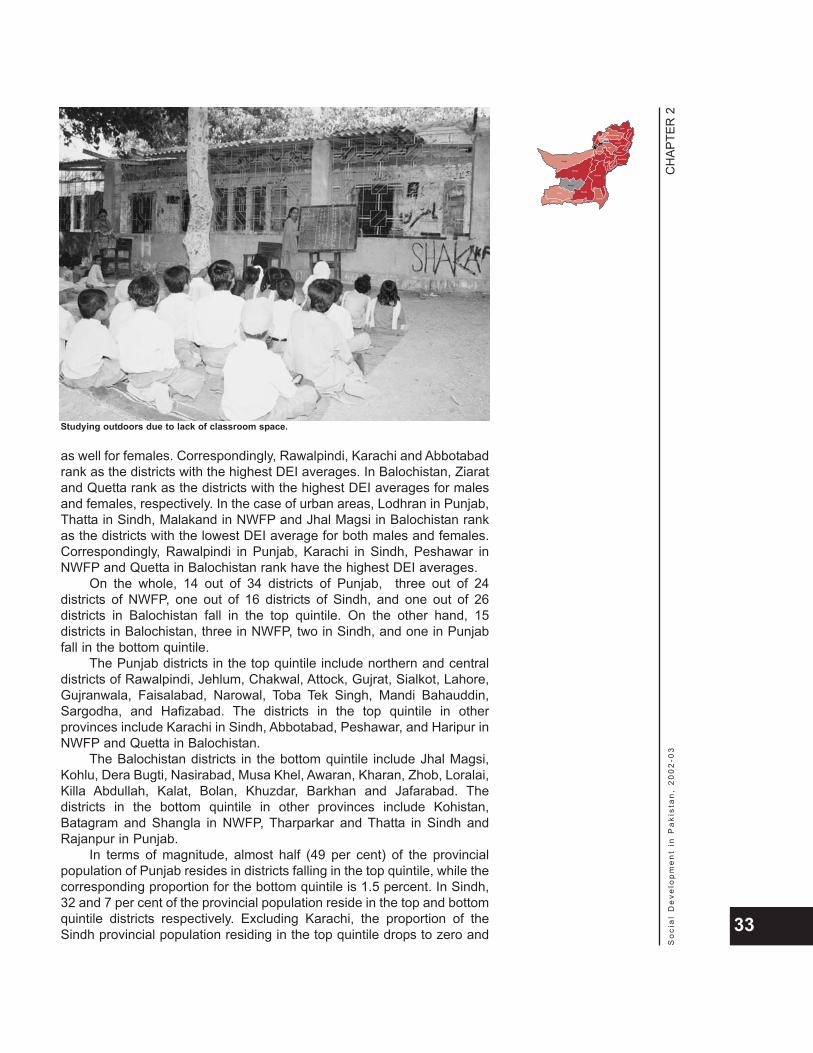
as well for females. Correspondingly, Rawalpindi, Karachi and Abbotabadrank as the districts with the highest DEI averages. In Balochistan, Ziaratand Quetta rank as the districts with the highest DEI averages for malesand females, respectively. In the case of urban areas, Lodhran in Punjab,Thatta in Sindh, Malakand in NWFP and Jhal Magsi in Balochistan rankas the districts with the lowest DEI average for both males and females.Correspondingly, Rawalpindi in Punjab, Karachi in Sindh, Peshawar inNWFP and Quetta in Balochistan rank have the highest DEI averages.
On the whole, 14 out of 34 districts of Punjab, three out of 24districts of NWFP, one out of 16 districts of Sindh, and one out of 26districts in Balochistan fall in the top quintile. On the other hand, 15districts in Balochistan, three in NWFP, two in Sindh, and one in Punjabfall in the bottom quintile.
The Punjab districts in the top quintile include northern and centraldistricts of Rawalpindi, Jehlum, Chakwal, Attock, Gujrat, Sialkot, Lahore,Gujranwala, Faisalabad, Narowal, Toba Tek Singh, Mandi Bahauddin,Sargodha, and Hafizabad. The districts in the top quintile in otherprovinces include Karachi in Sindh, Abbotabad, Peshawar, and Haripur inNWFP and Quetta in Balochistan.
The Balochistan districts in the bottom quintile include Jhal Magsi,Kohlu, Dera Bugti, Nasirabad, Musa Khel, Awaran, Kharan, Zhob, Loralai,Killa Abdullah, Kalat, Bolan, Khuzdar, Barkhan and Jafarabad. Thedistricts in the bottom quintile in other provinces include Kohistan,Batagram and Shangla in NWFP, Tharparkar and Thatta in Sindh andRajanpur in Punjab.
In terms of magnitude, almost half (49 per cent) of the provincialpopulation of Punjab resides in districts falling in the top quintile, while thecorresponding proportion for the bottom quintile is 1.5 percent. In Sindh,32 and 7 per cent of the provincial population reside in the top and bottomquintile districts respectively. Excluding Karachi, the proportion of theSindh provincial population residing in the top quintile drops to zero and
CH
APTE
R 2
So
cia
l D
eve
lop
me
nt
in P
aki
sta
n,
20
02
-03
33
���"� �
)����
������
� ��
������
����
#�����
��'���
�*�
&�����
,�����
� ��)"�
� ��
�����
0�����
��"�
+����������� �
(�����"��
!������"
��
!�� ����
��
�� �
���� ��
� ������� ��
0��"
������
�������
Studying outdoors due to lack of classroom space.
the proportion in the bottom quintile rises to 10 per cent. In NWFP, thecorresponding percentages for the top and bottom quintiles are 22 and 7per cent. In Balochistan the corresponding percentages are 12 and 54 percent, respectively.
The starkness of the pattern of regional inequality in educationalendowments emerges from the analysis presented above. Punjabemerges as the only province in which nearly half the population isaccounted for in the districts in the top quintile and less than 2 per cent ofits population resides in the bottom quintile districts. Balochistan is theonly province where the majority of the population falls in the bottomquintile. Sindh, excluding Karachi, emerges as the only province whereno part of the population resides in the top quintile districts. The analysisestablishes the case for a greater and more broad-based spread ofeducational opportunities in order to reduce the disparity betweendistricts and raise their development levels.
The objective of public spending in education is to enhance the incomeearning capacity of the poor. This objective is not always realized and
the benefits of public expenditure are often pre-empted by upper incomegroups, defeating the very purpose of redistributing income, promotingequity and reducing poverty. Benefit incidence analysis is a means ofquantifying the distribution of benefits of public expenditure amongdifferent groups, classified by income, region, gender, etc.
The benefit incidence analysis of public expenditure in education inthe four provinces of Pakistan shows a mixed pattern of distribution ofbenefits. The analysis is carried out in terms of the distribution of unitsubsidy in education, defined as the recurring cost to the government ofa student studying at a particular level in a public institution minus thecorresponding revenue accrued. Given that expenditure exceedsrevenue, the net result is a subsidy. Unit subsidy, therefore, impliesannual per student net cost to the public sector of providing education.
CH
APTE
R 2
So
cia
l D
eve
lop
me
nt
in P
aki
sta
n,
20
02
-03
34
After school play.
BENEFIT INCIDENCE OF PUBLICEDUCATION EXPENDITURE
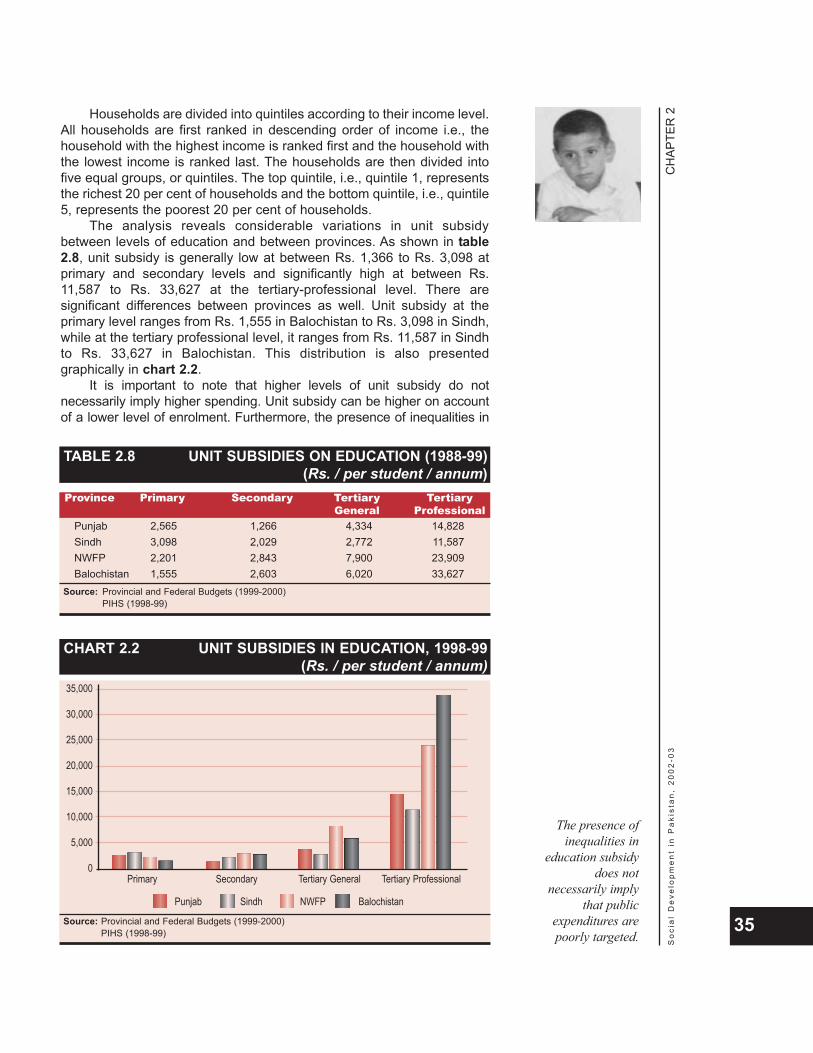
Households are divided into quintiles according to their income level.All households are first ranked in descending order of income i.e., thehousehold with the highest income is ranked first and the household withthe lowest income is ranked last. The households are then divided intofive equal groups, or quintiles. The top quintile, i.e., quintile 1, representsthe richest 20 per cent of households and the bottom quintile, i.e., quintile5, represents the poorest 20 per cent of households.
The analysis reveals considerable variations in unit subsidybetween levels of education and between provinces. As shown in table2.8, unit subsidy is generally low at between Rs. 1,366 to Rs. 3,098 atprimary and secondary levels and significantly high at between Rs.11,587 to Rs. 33,627 at the tertiary-professional level. There aresignificant differences between provinces as well. Unit subsidy at theprimary level ranges from Rs. 1,555 in Balochistan to Rs. 3,098 in Sindh,while at the tertiary professional level, it ranges from Rs. 11,587 in Sindhto Rs. 33,627 in Balochistan. This distribution is also presentedgraphically in chart 2.2.
It is important to note that higher levels of unit subsidy do notnecessarily imply higher spending. Unit subsidy can be higher on accountof a lower level of enrolment. Furthermore, the presence of inequalities in
CH
APTE
R 2
So
cia
l D
eve
lop
me
nt
in P
aki
sta
n,
20
02
-03
35
TABLE 2.8 UNIT SUBSIDIES ON EDUCATION (1988-99)(Rs. / per student / annum)
Province Primary Secondary Tertiary TertiaryGeneral Professional
Punjab 2,565 1,266 4,334 14,828Sindh 3,098 2,029 2,772 11,587NWFP 2,201 2,843 7,900 23,909Balochistan 1,555 2,603 6,020 33,627
Source: Provincial and Federal Budgets (1999-2000)PIHS (1998-99)
CHART 2.2 UNIT SUBSIDIES IN EDUCATION, 1998-99(Rs. / per student / annum)
35,000
30,000
25,000
20,000
15,000
10,000
5,000
0Primary
Punjab Sindh NWFP Balochistan
Secondary Tertiary General Tertiary Professional
Source: Provincial and Federal Budgets (1999-2000)PIHS (1998-99)
The presence ofinequalities in
education subsidydoes not
necessarily implythat public
expenditures arepoorly targeted.
education subsidy does not necessarily imply that public expenditures arepoorly targeted. Mainly, it reflects the possibility that, due to income or otherconstraints, the poor tend not to use education facilities and are thusdeprived of benefiting from public spending on education.
The estimates of the benefit incidence on education by incomegroups are shown in table 2.9. A graphical representation is also providedas indicated in charts 2.3 and 2.4. It appears that the incidence of publiceducation expenditure in Punjab is by and large neutral, with the top 20per cent of households utilizing 16 per cent of the subsidy and the bottom20 per cent utilizing 23 per cent. The corresponding incidence is relativelymore progressive in Sindh, where the share of the bottom quintile is twiceas high as that of the top quintile. In NWFP, the major beneficiariesappear to be the second, third and fourth quintiles. It appears that the richdo not access public education and the poor, perhaps, cannot do so. InBalochistan, the incidence appears to be regressive. The first and thirdquintiles accrue more than their proportionate share of benefits, while thepoorest 20 per cent of households accrue the least and less than theirproportionate share.
CH
APTE
R 2
So
cia
l D
eve
lop
me
nt
in P
aki
sta
n,
20
02
-03
36
TABLE 2.9 DISTRIBUTION OF BENEFIT INCIDENCE OF PUBLIC SUBSIDY ON EDUCATION (1998-99) (%)
Income Primary Secondary Tertiary Tertiary AggregateGroup General Professional
PUNJABQuintile - 1 9.9 17.3 44.3 37.4 16.1Quintile - 2 14.7 21.4 25.9 42.9 18.4Quintile - 3 19.6 22.6 16.1 13.1 19.6Quintile - 4 27.6 21.1 7.2 2.4 23.1Quintile - 5 28.2 17.7 6.5 4.2 22.8
All Groups 100.0 100.0 100.0 100.0 100.0SINDH
Quintile - 1 7.8 9.7 17.8 49.0 12.0Quintile - 2 14.9 19.0 28.5 22.1 18.0Quintile - 3 22.8 23.6 21.5 10.9 22.1Quintile - 4 26.4 23.5 18.8 10.1 23.8Quintile - 5 28.1 24.2 13.4 7.9 24.1
All Groups 100.0 100.0 100.0 100.0 100.0NWFP
Quintile - 1 10.5 16.0 38.4 51.4 18.2Quintile - 2 17.8 22.6 28.1 23.9 20.9Quintile - 3 23.9 24.7 19.1 10.5 22.7Quintile - 4 26.4 19.7 6.7 7.5 20.7Quintile - 5 21.5 17.1 7.7 6.7 17.5
All Groups 100.0 100.0 100.0 100.0 100.0BALOCHISTAN
Quintile - 1 16.9 18.6 41.5 57.2 23.0Quintile - 2 14.9 18.1 21.7 8.1 16.7Quintile - 3 25.4 28.2 21.7 25.7 25.8Quintile - 4 24.7 18.3 8.3 0.0 18.8Quintile - 5 18.2 16.8 6.8 9.0 15.6
All Groups 100.0 100.0 100.0 100.0 100.0
Source: SPDC estimates based on PIHS (1998-99) and Provincial Demand for Grants (1999-2000)

The incidence of public spending in the case of primary educationfavours the bottom two quintiles. This is particularly true in Punjab and Sindh,where the bottom two quintiles, accounting for 40 per cent of the households,utilize more than half the share of benefits. By contrast, the top two quintilesin both the provinces, accounting for 40 per cent of the households, utilizeless than 25 per cent of the benefits. In NWFP and Balochistan, the benefitincidence is somewhat less progressive, given that the third and fourthquintiles utilize a higher share of benefits than the fifth quintile. However, thebenefit share of the top two quintiles is less than their share in terms ofpercentage of households. The shares of the highest and lowest quintiles inthe primary education subsidy are presented graphically in chart 2.5.
CH
APTE
R 2
So
cia
l D
eve
lop
me
nt
in P
aki
sta
n,
20
02
-03
37
CHART 2.3 SHARE OF HIGHEST QUINTILE IN PUBLICEDUCATION SUBSIDY (%)
70.0
60.0
50.0
40.0
30.0
20.0
10.0
0.0Punjab
9.9
17.3
44.3
37.4
7.8 9.7
17.8
49.0
10.516.0
25.1
51.4
16.9 18.6
40.4
57.2
Sindh NWFP Balochistan
Source: Provincial and Federal Budgets (1999-2000)PIHS (1998-99)
Primary Secondary Tertiary General Tertiary Professional
CHART 2.4 SHARE OF LOWEST QUINTILE IN PUBLICEDUCATION SUBSIDY (%)
30.0
25.0
20.0
15.0
10.0
5.0
0.0Punjab
28.2
17.7
6.5
4.2
28.1
24.2
13.4
7.9
21.5
17.1
7.76.7
18.216.8
6.89.0
Primary Secondary Tertiary General Tertiary ProfessionalSindh NWFP Balochistan
Source: Provincial and Federal Budgets (1999-2000)PIHS (1998-99)

The incidence of benefits with respect to secondary education issomewhat neutral in Punjab, with the share of benefits for any onequintile ranging within a narrow band of 17 to 23 per cent (see chart 2.6and table 2.9). In NWFP and Balochistan, the middle quintiles appear tobe the principal beneficiaries at the expense of the top and bottomquintiles. By contrast, the benefit incidence is the most progressive inSindh, with the least benefit accruing to the top quintile and the maximumbenefit accruing to the bottom quintile.
The benefit incidence turns regressive in the case of tertiaryeducation, particularly with respect to professional education, where thedisparity is sharper. As indicated in chart 2.7, the benefits of public
CH
APTE
R 2
So
cia
l D
eve
lop
me
nt
in P
aki
sta
n,
20
02
-03
38
CHART 2.5 SHARE OF HIGHEST AND LOWEST QUINTILEIN PUBLIC SUBSIDY ON PRIMARY EDUCATION (%)
30.0
25.0
20.0
15.0
10.0
5.0
0.0Punjab
Highest Quintile Lowest Quintile
9.9
28.8
Sindh
7.8
28.1
NWFP
10.5
21.5
Balochistan
16.918.2
Source: Provincial and Federal Budgets (various issues)PIHS (1998-99)
CHART 2.6 SHARE OF HIGHEST AND LOWEST QUINTILEIN PUBLIC SUBSIDY ON SECONDARY EDUCATION (%)
30.0
25.0
20.0
15.0
10.0
5.0
0.0Punjab
Highest Quintile Lowest Quintile
17.3 17.7
Sindh
9.7
24.2
NWFP
16.0 17.1
Balochistan
18.6 16.8
Source: Provincial and Federal Budgets (1999-2000)PIHS (1998-99)
The benefitincidence turnsregressive in thecase of tertiaryeducation,particularly withrespect toprofessionaleducation, wherethe disparity issharper.
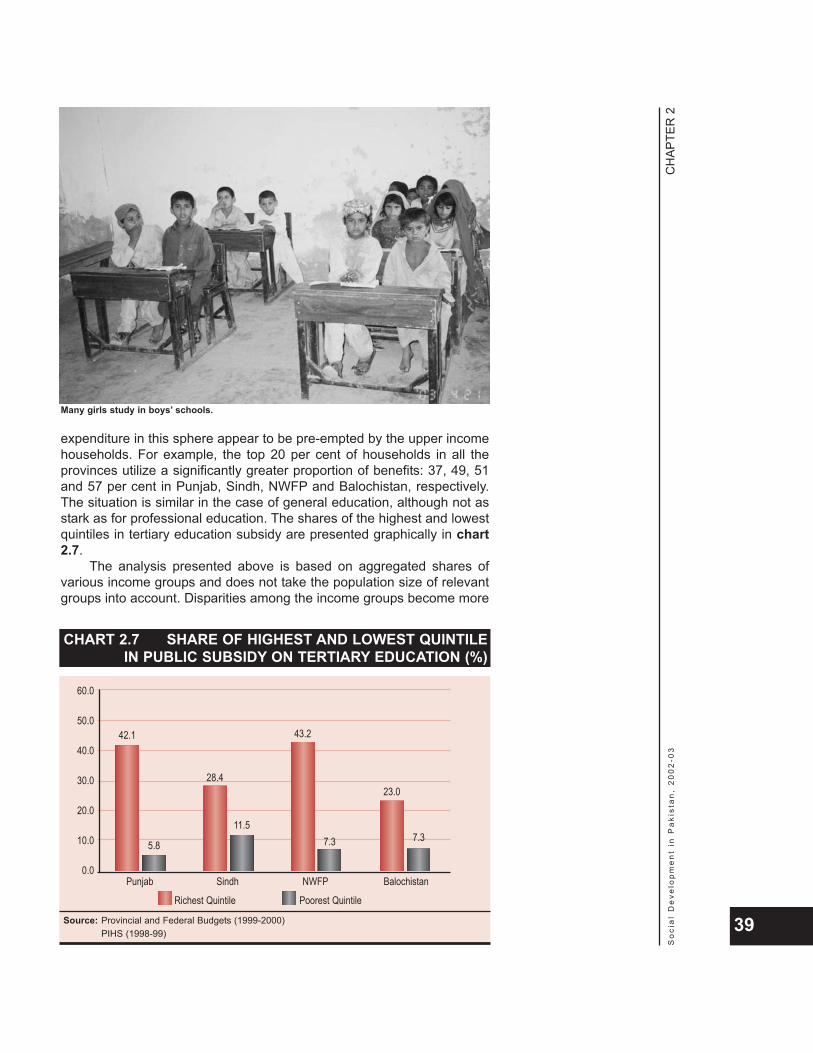
expenditure in this sphere appear to be pre-empted by the upper incomehouseholds. For example, the top 20 per cent of households in all theprovinces utilize a significantly greater proportion of benefits: 37, 49, 51and 57 per cent in Punjab, Sindh, NWFP and Balochistan, respectively.The situation is similar in the case of general education, although not asstark as for professional education. The shares of the highest and lowestquintiles in tertiary education subsidy are presented graphically in chart2.7.
The analysis presented above is based on aggregated shares ofvarious income groups and does not take the population size of relevantgroups into account. Disparities among the income groups become more
CH
APTE
R 2
So
cia
l D
eve
lop
me
nt
in P
aki
sta
n,
20
02
-03
39
CHART 2.7 SHARE OF HIGHEST AND LOWEST QUINTILEIN PUBLIC SUBSIDY ON TERTIARY EDUCATION (%)
60.0
50.0
40.0
30.0
20.0
10.0
0.0Punjab
Richest Quintile Poorest Quintile
42.1
5.8
Sindh
28.4
11.5
NWFP
43.2
7.3
Balochistan
23.0
7.3
Source: Provincial and Federal Budgets (1999-2000)PIHS (1998-99)
Many girls study in boys’ schools.
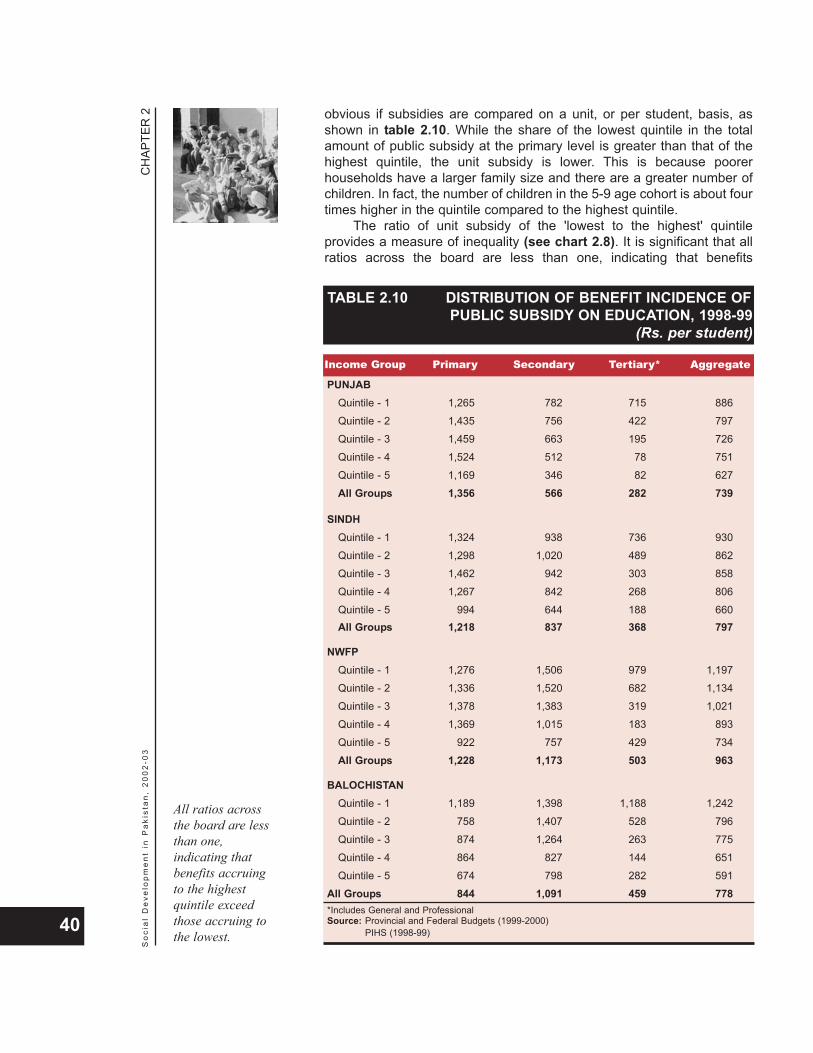
obvious if subsidies are compared on a unit, or per student, basis, asshown in table 2.10. While the share of the lowest quintile in the totalamount of public subsidy at the primary level is greater than that of thehighest quintile, the unit subsidy is lower. This is because poorerhouseholds have a larger family size and there are a greater number ofchildren. In fact, the number of children in the 5-9 age cohort is about fourtimes higher in the quintile compared to the highest quintile.
The ratio of unit subsidy of the 'lowest to the highest' quintileprovides a measure of inequality (see chart 2.8). It is significant that allratios across the board are less than one, indicating that benefits
CH
APTE
R 2
So
cia
l D
eve
lop
me
nt
in P
aki
sta
n,
20
02
-03
40
TABLE 2.10 DISTRIBUTION OF BENEFIT INCIDENCE OF PUBLIC SUBSIDY ON EDUCATION, 1998-99
(Rs. per student)
Income Group Primary Secondary Tertiary* Aggregate
PUNJABQuintile - 1 1,265 782 715 886Quintile - 2 1,435 756 422 797Quintile - 3 1,459 663 195 726Quintile - 4 1,524 512 78 751Quintile - 5 1,169 346 82 627All Groups 1,356 566 282 739
SINDHQuintile - 1 1,324 938 736 930Quintile - 2 1,298 1,020 489 862Quintile - 3 1,462 942 303 858Quintile - 4 1,267 842 268 806Quintile - 5 994 644 188 660All Groups 1,218 837 368 797
NWFPQuintile - 1 1,276 1,506 979 1,197Quintile - 2 1,336 1,520 682 1,134Quintile - 3 1,378 1,383 319 1,021Quintile - 4 1,369 1,015 183 893Quintile - 5 922 757 429 734All Groups 1,228 1,173 503 963
BALOCHISTANQuintile - 1 1,189 1,398 1,188 1,242Quintile - 2 758 1,407 528 796Quintile - 3 874 1,264 263 775Quintile - 4 864 827 144 651Quintile - 5 674 798 282 591
All Groups 844 1,091 459 778*Includes General and ProfessionalSource: Provincial and Federal Budgets (1999-2000)
PIHS (1998-99)
All ratios acrossthe board are lessthan one,indicating thatbenefits accruingto the highestquintile exceedthose accruing tothe lowest.
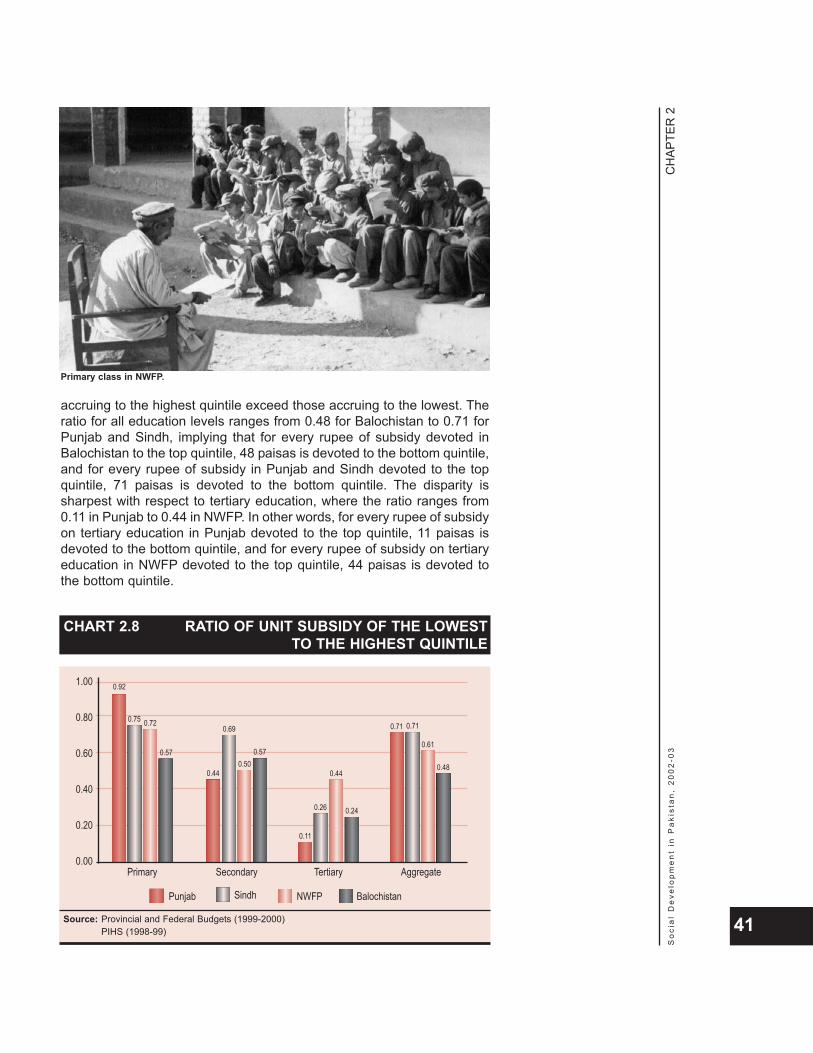
accruing to the highest quintile exceed those accruing to the lowest. Theratio for all education levels ranges from 0.48 for Balochistan to 0.71 forPunjab and Sindh, implying that for every rupee of subsidy devoted inBalochistan to the top quintile, 48 paisas is devoted to the bottom quintile,and for every rupee of subsidy in Punjab and Sindh devoted to the topquintile, 71 paisas is devoted to the bottom quintile. The disparity issharpest with respect to tertiary education, where the ratio ranges from0.11 in Punjab to 0.44 in NWFP. In other words, for every rupee of subsidyon tertiary education in Punjab devoted to the top quintile, 11 paisas isdevoted to the bottom quintile, and for every rupee of subsidy on tertiaryeducation in NWFP devoted to the top quintile, 44 paisas is devoted tothe bottom quintile.
CH
APTE
R 2
So
cia
l D
eve
lop
me
nt
in P
aki
sta
n,
20
02
-03
41
CHART 2.8 RATIO OF UNIT SUBSIDY OF THE LOWESTTO THE HIGHEST QUINTILE
1.00
0.80
0.60
0.40
0.20
0.00Primary
0.92
0.75 0.72
0.57
0.44
0.69
0.500.57
0.11
0.26
0.44
0.24
0.71 0.71
0.61
0.48
Secondary Tertiary Aggregate
Source: Provincial and Federal Budgets (1999-2000)PIHS (1998-99)
Punjab Sindh NWFP Balochistan
Primary class in NWFP.
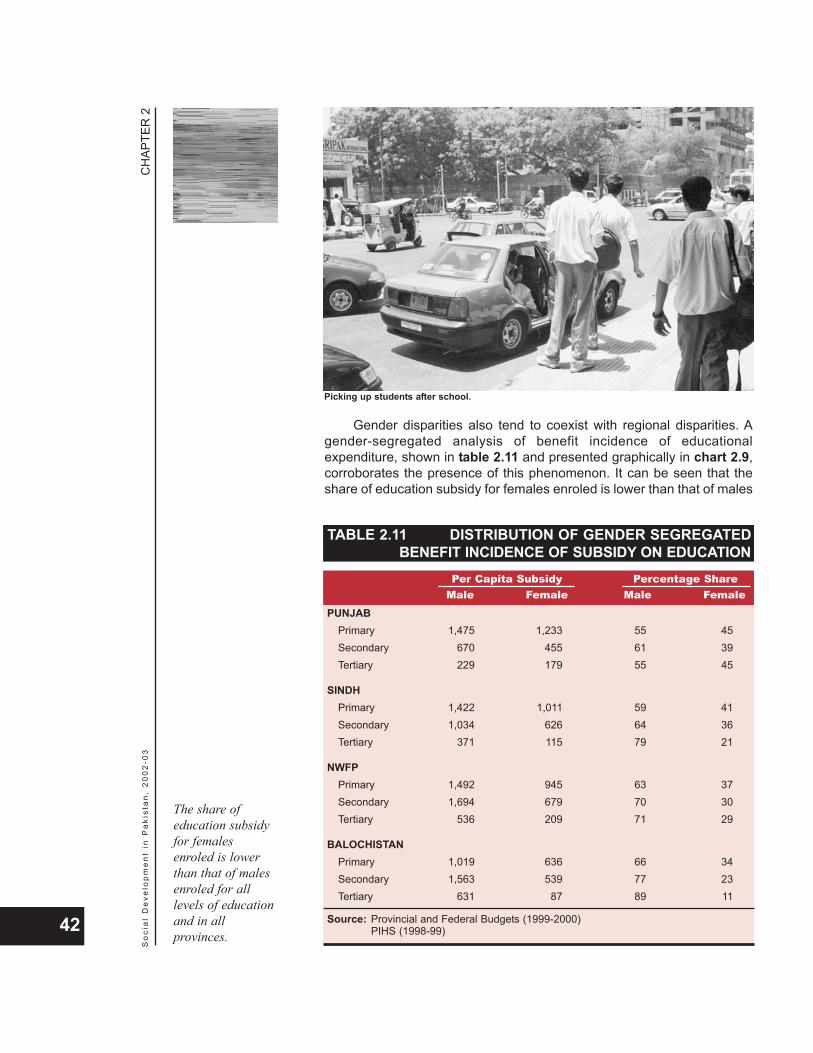
Gender disparities also tend to coexist with regional disparities. Agender-segregated analysis of benefit incidence of educationalexpenditure, shown in table 2.11 and presented graphically in chart 2.9,corroborates the presence of this phenomenon. It can be seen that theshare of education subsidy for females enroled is lower than that of males
CH
APTE
R 2
So
cia
l D
eve
lop
me
nt
in P
aki
sta
n,
20
02
-03
42
TABLE 2.11 DISTRIBUTION OF GENDER SEGREGATEDBENEFIT INCIDENCE OF SUBSIDY ON EDUCATION
Per Capita Subsidy Percentage ShareMale Female Male Female
PUNJABPrimary 1,475 1,233 55 45Secondary 670 455 61 39Tertiary 229 179 55 45
SINDHPrimary 1,422 1,011 59 41Secondary 1,034 626 64 36Tertiary 371 115 79 21
NWFPPrimary 1,492 945 63 37Secondary 1,694 679 70 30Tertiary 536 209 71 29
BALOCHISTANPrimary 1,019 636 66 34Secondary 1,563 539 77 23Tertiary 631 87 89 11
Source: Provincial and Federal Budgets (1999-2000)PIHS (1998-99)
Picking up students after school.
The share ofeducation subsidyfor femalesenroled is lowerthan that of malesenroled for alllevels of educationand in allprovinces.
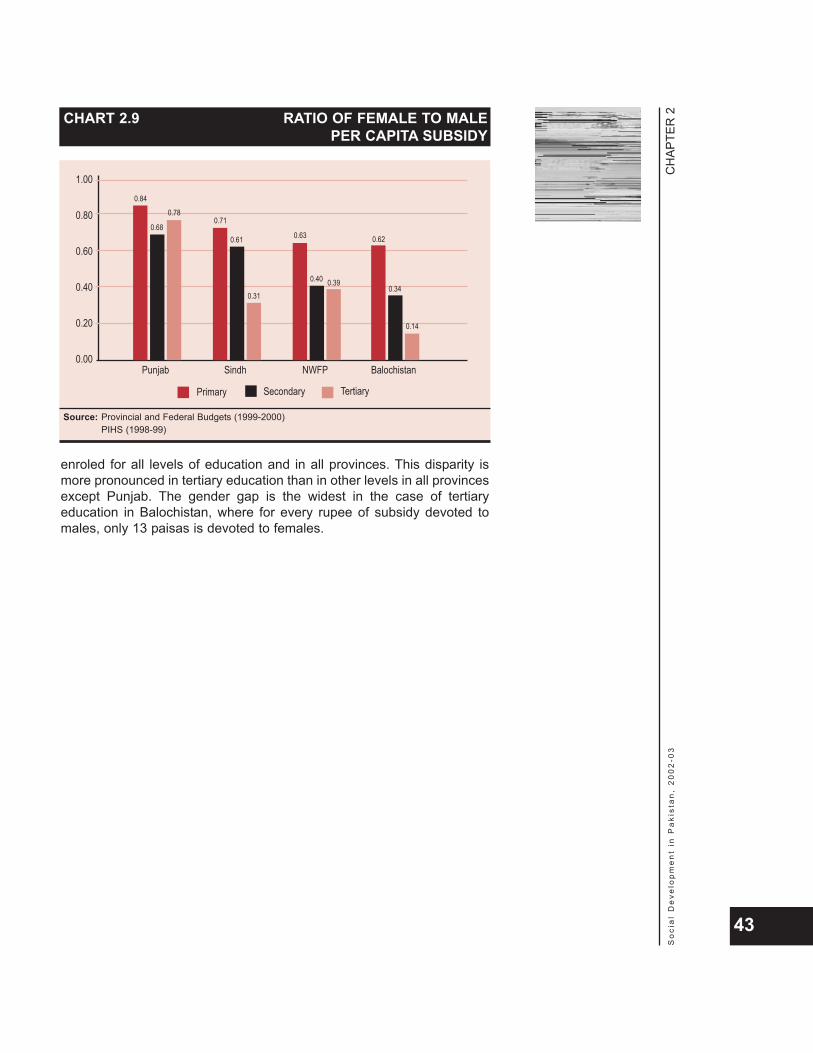
enroled for all levels of education and in all provinces. This disparity ismore pronounced in tertiary education than in other levels in all provincesexcept Punjab. The gender gap is the widest in the case of tertiaryeducation in Balochistan, where for every rupee of subsidy devoted tomales, only 13 paisas is devoted to females.
CH
APTE
R 2
So
cia
l D
eve
lop
me
nt
in P
aki
sta
n,
20
02
-03
43
CHART 2.9 RATIO OF FEMALE TO MALE PER CAPITA SUBSIDY
1.00
0.80
0.60
0.40
0.20
0.00Punjab
0.84
0.68
0.78
Sindh
0.71
0.61
0.31
NWFP
0.63
0.40 0.39
Balochistan
0.62
0.34
0.14
Source: Provincial and Federal Budgets (1999-2000)PIHS (1998-99)
Primary Secondary Tertiary


CH
APTE
R 3
So
cia
l D
eve
lop
me
nt
in P
aki
sta
n,
20
02
-03
45
3EDUCATION AND
DEVELOPMENT
“It is notthe production of
goods, but theproduction of ideas
that now provides theimpetus for economic
development.”
The establishment of a centrally planned economy in Russia in 1917placed economic growth and development at the centre stage ofthe modern state's functions. Analysts and researchers began to
search for the factors that determined growth. One influential set oftheories put forward scarcity of capital as the principal bottleneck togrowth, leading to the creation of a whole edifice of foreign economicassistance with the purpose of injecting capital into poor countries to helpthem build infrastructure and economic assets. The impulse for growthwas largely exogenous. Another set of theories focused more onendogenous factors, particularly the technological endowments thatcombine capital and labour to produce goods and services. Endogenousgrowth models emphasized the key role of human capital, particularly theexternalities factors related to the accumulation of knowledge inengendering growth and development.
Education has a wide range of advantages and benefits: economic,social and political. The positive relationship between economicdevelopment and education levels and the impact of investment ineducation on economic growth are well established. The transition of theworld towards a knowledge-based economy is adding to the importanceof human resources in general, and of education in particular. Humanresources are poised to command an increasingly important role in thebalance of world economics and, hence, political power. In addition toeconomic and political impacts, and also because of them, educationleads to social spill-overs as well.
This chapter documents the case for investment in education ongrounds of economic gains as well as social benefits. It investigates therelationship between education and development levels on the basis of adistrict level analysis and examines the emerging role of the knowledgeeconomy. It also quantifies the gains in terms of higher economic growthfrom a shift of expenditure towards education and examines the benefitsof education that accrue to private individuals as well as to society as awhole.
The role of education and of research and development (R&D) inproduction is now fairly well established. The average level of
education in society is shown to extend benefits (i.e., externalities) acrossfirms to raise their overall level of productivity. Education is stated to be akey factor in enhancing total factor productivity and inducing technicalchange towards higher economic growth. Skill development througheducation has also been identified as a key determinant of comparativeadvantage and manufacturing export performance. Economies that havebeen relatively more successful have been shown to owe much of their
CH
APTE
R 3
So
cia
l D
eve
lop
me
nt
in P
aki
sta
n,
20
02
-03
46
EDUCATIONANDDEVELOPMENT
THE EDUCATION-DEVELOPMENT RELATIONSHIP

achievements to their human capital in general, and to their educationallevels in particular.
A wide range of international studies has established that, by andlarge, human resource development impacts economic developmentpositively. Of course, higher levels of economic development enablehigher allocations of resources to attain higher levels of human resourcedevelopment. However, human resource development remains the basicstep to economic development.
Within Pakistan, the examination of this link between educationvariables, represented by the District Education Index (DEI), anddevelopment variables, represented by the District Development Index(DDI), reveals that districts with a higher literacy level have a higher levelof development. The hypothesis tested is as follows: development level ispositively associated with education variables, i.e., literacy and enrolmentlevels. The association between education variables and thedevelopment level has been determined by first ranking the 100 districtsin ascending order of their DDI and then clustering them into five equalgroups, or quintiles, of 20 districts each. The average value of the DDIhas then been derived for each quintile. Corresponding quintile averageshave also been obtained for the education variables.
The value of the correlation coefficient between DEI and DDI emergesas high as 0.871, implying that districts which rank high in terms ofeducation variables also rank high in terms of development variables. Table3.1 further explains the nature of this relationship. It can be seen that lowerlevels of literacy are associated with lower levels of development and thatdevelopment levels go up as male and female literacy levels rise. Thisrelationship is also presented graphically in chart 3.1.
CH
APTE
R 3
So
cia
l D
eve
lop
me
nt
in P
aki
sta
n,
20
02
-03
47
An English-medium private school.
Human resourcedevelopment
remains the basicstep to economic
development.
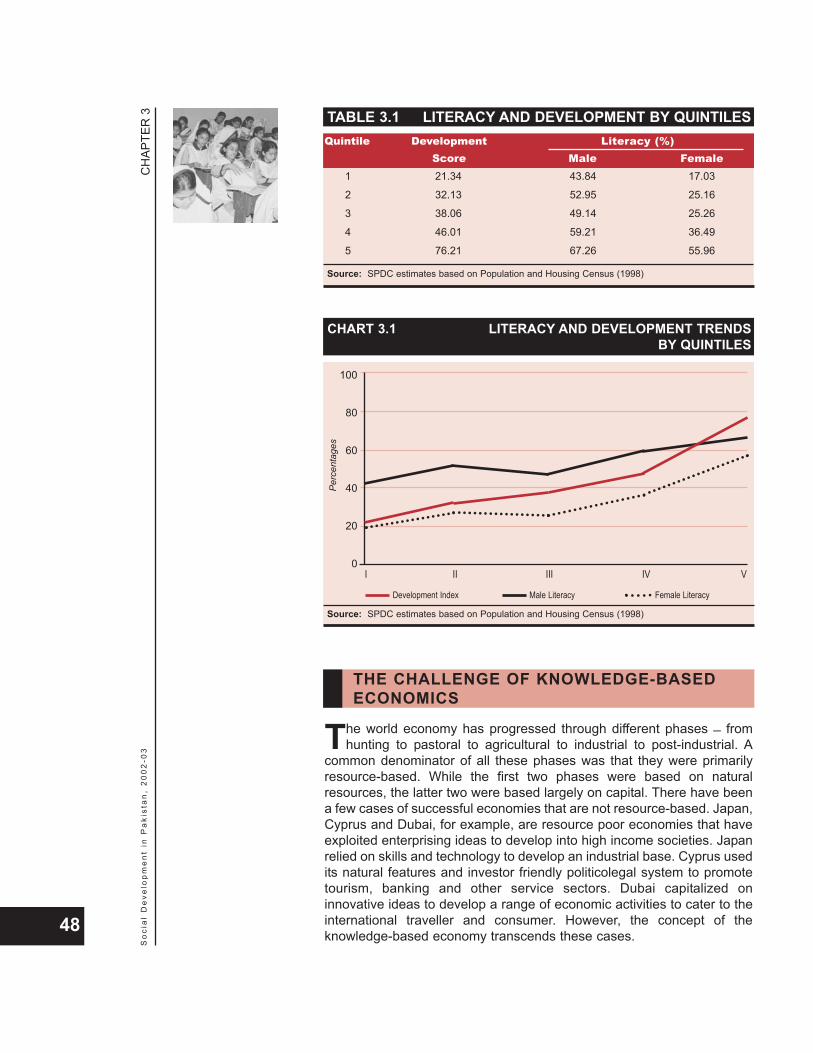
The world economy has progressed through different phases _ fromhunting to pastoral to agricultural to industrial to post-industrial. A
common denominator of all these phases was that they were primarilyresource-based. While the first two phases were based on naturalresources, the latter two were based largely on capital. There have beena few cases of successful economies that are not resource-based. Japan,Cyprus and Dubai, for example, are resource poor economies that haveexploited enterprising ideas to develop into high income societies. Japanrelied on skills and technology to develop an industrial base. Cyprus usedits natural features and investor friendly politicolegal system to promotetourism, banking and other service sectors. Dubai capitalized oninnovative ideas to develop a range of economic activities to cater to theinternational traveller and consumer. However, the concept of theknowledge-based economy transcends these cases.
CH
APTE
R 3
So
cia
l D
eve
lop
me
nt
in P
aki
sta
n,
20
02
-03
48
TABLE 3.1 LITERACY AND DEVELOPMENT BY QUINTILESQuintile Development Literacy (%)
Score Male Female1 21.34 43.84 17.03
2 32.13 52.95 25.16
3 38.06 49.14 25.26
4 46.01 59.21 36.49
5 76.21 67.26 55.96
Source: SPDC estimates based on Population and Housing Census (1998)
CHART 3.1 LITERACY AND DEVELOPMENT TRENDSBY QUINTILES
Source: SPDC estimates based on Population and Housing Census (1998)
100
80
60
40
20
0III III IV V
Development Index Male Literacy Female Literacy
Perc
enta
ges
THE CHALLENGE OF KNOWLEDGE-BASEDECONOMICS
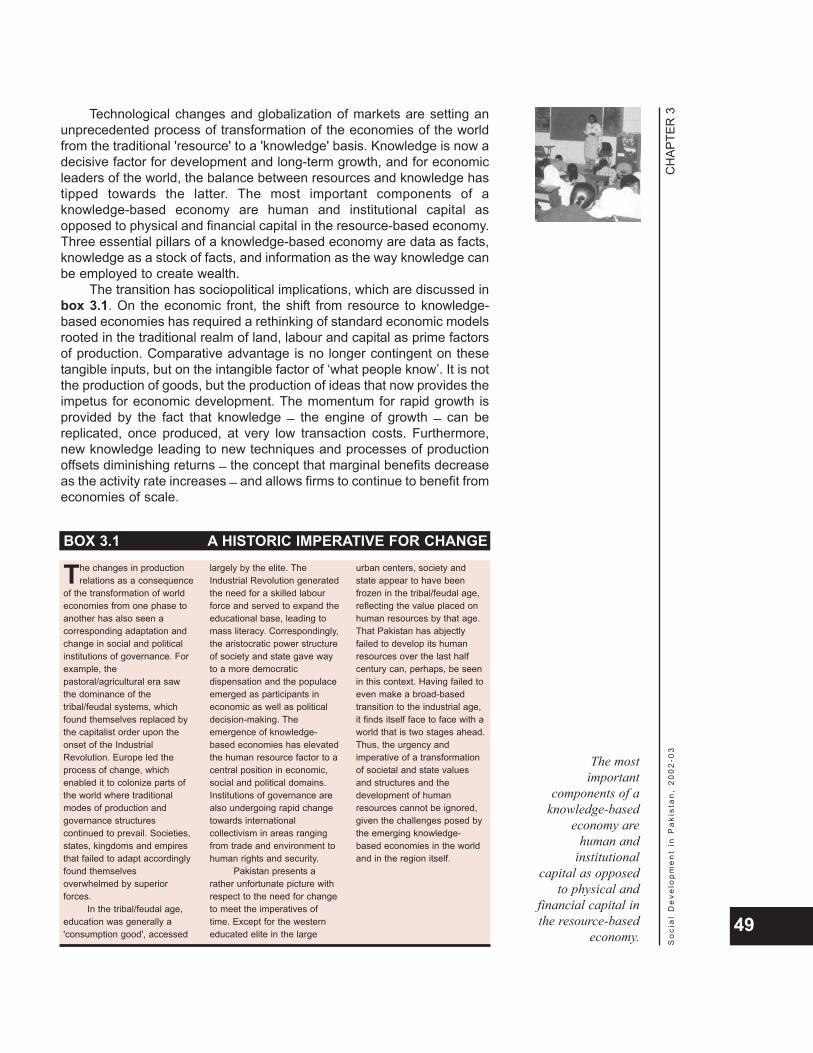
Technological changes and globalization of markets are setting anunprecedented process of transformation of the economies of the worldfrom the traditional 'resource' to a 'knowledge' basis. Knowledge is now adecisive factor for development and long-term growth, and for economicleaders of the world, the balance between resources and knowledge hastipped towards the latter. The most important components of aknowledge-based economy are human and institutional capital asopposed to physical and financial capital in the resource-based economy.Three essential pillars of a knowledge-based economy are data as facts,knowledge as a stock of facts, and information as the way knowledge canbe employed to create wealth.
The transition has sociopolitical implications, which are discussed inbox 3.1. On the economic front, the shift from resource to knowledge-based economies has required a rethinking of standard economic modelsrooted in the traditional realm of land, labour and capital as prime factorsof production. Comparative advantage is no longer contingent on thesetangible inputs, but on the intangible factor of ‘what people know’. It is notthe production of goods, but the production of ideas that now provides theimpetus for economic development. The momentum for rapid growth isprovided by the fact that knowledge _ the engine of growth _ can bereplicated, once produced, at very low transaction costs. Furthermore,new knowledge leading to new techniques and processes of productionoffsets diminishing returns _ the concept that marginal benefits decreaseas the activity rate increases _ and allows firms to continue to benefit fromeconomies of scale.
CH
APTE
R 3
So
cia
l D
eve
lop
me
nt
in P
aki
sta
n,
20
02
-03
49
BOX 3.1 A HISTORIC IMPERATIVE FOR CHANGE
The changes in productionrelations as a consequence
of the transformation of worldeconomies from one phase toanother has also seen acorresponding adaptation andchange in social and politicalinstitutions of governance. Forexample, thepastoral/agricultural era sawthe dominance of thetribal/feudal systems, whichfound themselves replaced bythe capitalist order upon theonset of the IndustrialRevolution. Europe led theprocess of change, whichenabled it to colonize parts ofthe world where traditionalmodes of production andgovernance structurescontinued to prevail. Societies,states, kingdoms and empiresthat failed to adapt accordinglyfound themselvesoverwhelmed by superiorforces.
In the tribal/feudal age,education was generally a'consumption good', accessed
largely by the elite. TheIndustrial Revolution generatedthe need for a skilled labourforce and served to expand theeducational base, leading tomass literacy. Correspondingly,the aristocratic power structureof society and state gave wayto a more democraticdispensation and the populaceemerged as participants ineconomic as well as politicaldecision-making. Theemergence of knowledge-based economies has elevatedthe human resource factor to acentral position in economic,social and political domains.Institutions of governance arealso undergoing rapid changetowards internationalcollectivism in areas rangingfrom trade and environment tohuman rights and security.
Pakistan presents arather unfortunate picture withrespect to the need for changeto meet the imperatives oftime. Except for the westerneducated elite in the large
urban centers, society andstate appear to have beenfrozen in the tribal/feudal age,reflecting the value placed onhuman resources by that age.That Pakistan has abjectlyfailed to develop its humanresources over the last halfcentury can, perhaps, be seenin this context. Having failed toeven make a broad-basedtransition to the industrial age,it finds itself face to face with aworld that is two stages ahead.Thus, the urgency andimperative of a transformationof societal and state valuesand structures and thedevelopment of humanresources cannot be ignored,given the challenges posed bythe emerging knowledge-based economies in the worldand in the region itself.
The mostimportant
components of aknowledge-based
economy arehuman and
institutionalcapital as opposed
to physical andfinancial capital inthe resource-based
economy.
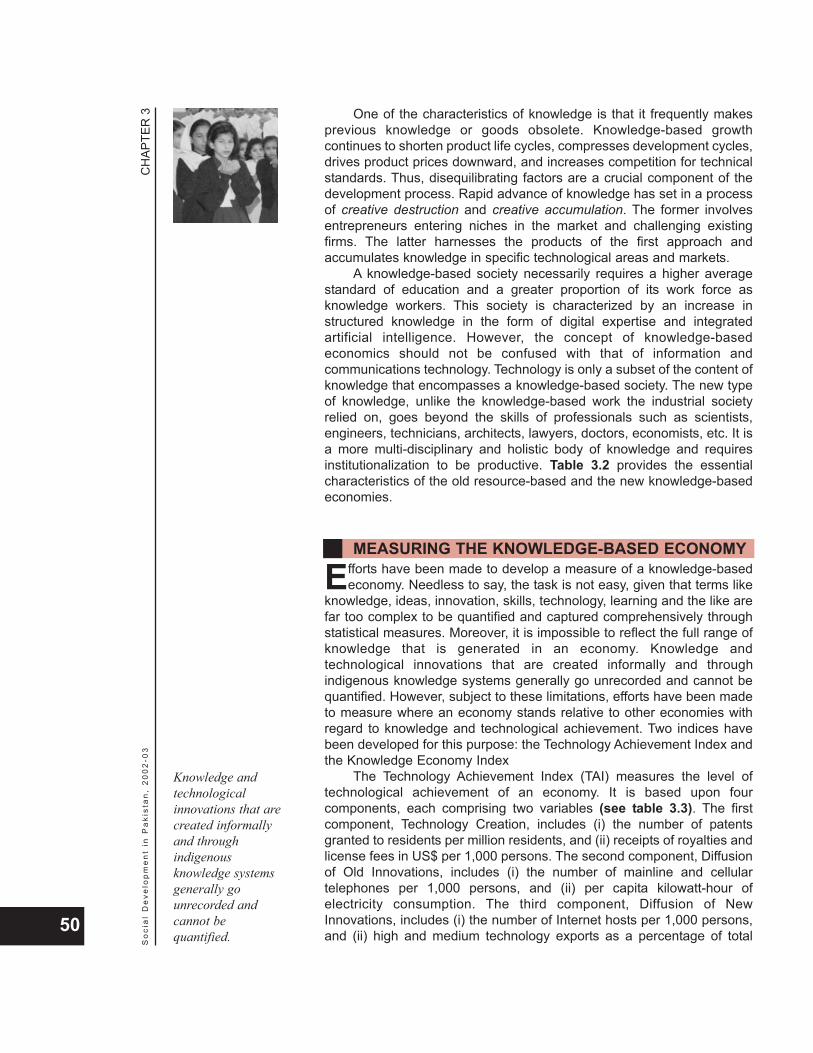
One of the characteristics of knowledge is that it frequently makesprevious knowledge or goods obsolete. Knowledge-based growthcontinues to shorten product life cycles, compresses development cycles,drives product prices downward, and increases competition for technicalstandards. Thus, disequilibrating factors are a crucial component of thedevelopment process. Rapid advance of knowledge has set in a processof creative destruction and creative accumulation. The former involvesentrepreneurs entering niches in the market and challenging existingfirms. The latter harnesses the products of the first approach andaccumulates knowledge in specific technological areas and markets.
A knowledge-based society necessarily requires a higher averagestandard of education and a greater proportion of its work force asknowledge workers. This society is characterized by an increase instructured knowledge in the form of digital expertise and integratedartificial intelligence. However, the concept of knowledge-basedeconomics should not be confused with that of information andcommunications technology. Technology is only a subset of the content ofknowledge that encompasses a knowledge-based society. The new typeof knowledge, unlike the knowledge-based work the industrial societyrelied on, goes beyond the skills of professionals such as scientists,engineers, technicians, architects, lawyers, doctors, economists, etc. It isa more multi-disciplinary and holistic body of knowledge and requiresinstitutionalization to be productive. Table 3.2 provides the essentialcharacteristics of the old resource-based and the new knowledge-basedeconomies.
Efforts have been made to develop a measure of a knowledge-basedeconomy. Needless to say, the task is not easy, given that terms like
knowledge, ideas, innovation, skills, technology, learning and the like arefar too complex to be quantified and captured comprehensively throughstatistical measures. Moreover, it is impossible to reflect the full range ofknowledge that is generated in an economy. Knowledge andtechnological innovations that are created informally and throughindigenous knowledge systems generally go unrecorded and cannot bequantified. However, subject to these limitations, efforts have been madeto measure where an economy stands relative to other economies withregard to knowledge and technological achievement. Two indices havebeen developed for this purpose: the Technology Achievement Index andthe Knowledge Economy Index
The Technology Achievement Index (TAI) measures the level oftechnological achievement of an economy. It is based upon fourcomponents, each comprising two variables (see table 3.3). The firstcomponent, Technology Creation, includes (i) the number of patentsgranted to residents per million residents, and (ii) receipts of royalties andlicense fees in US$ per 1,000 persons. The second component, Diffusionof Old Innovations, includes (i) the number of mainline and cellulartelephones per 1,000 persons, and (ii) per capita kilowatt-hour ofelectricity consumption. The third component, Diffusion of NewInnovations, includes (i) the number of Internet hosts per 1,000 persons,and (ii) high and medium technology exports as a percentage of total
CH
APTE
R 3
So
cia
l D
eve
lop
me
nt
in P
aki
sta
n,
20
02
-03
50
MEASURING THE KNOWLEDGE-BASED ECONOMY
Knowledge andtechnologicalinnovations that arecreated informallyand throughindigenousknowledge systemsgenerally gounrecorded andcannot bequantified.
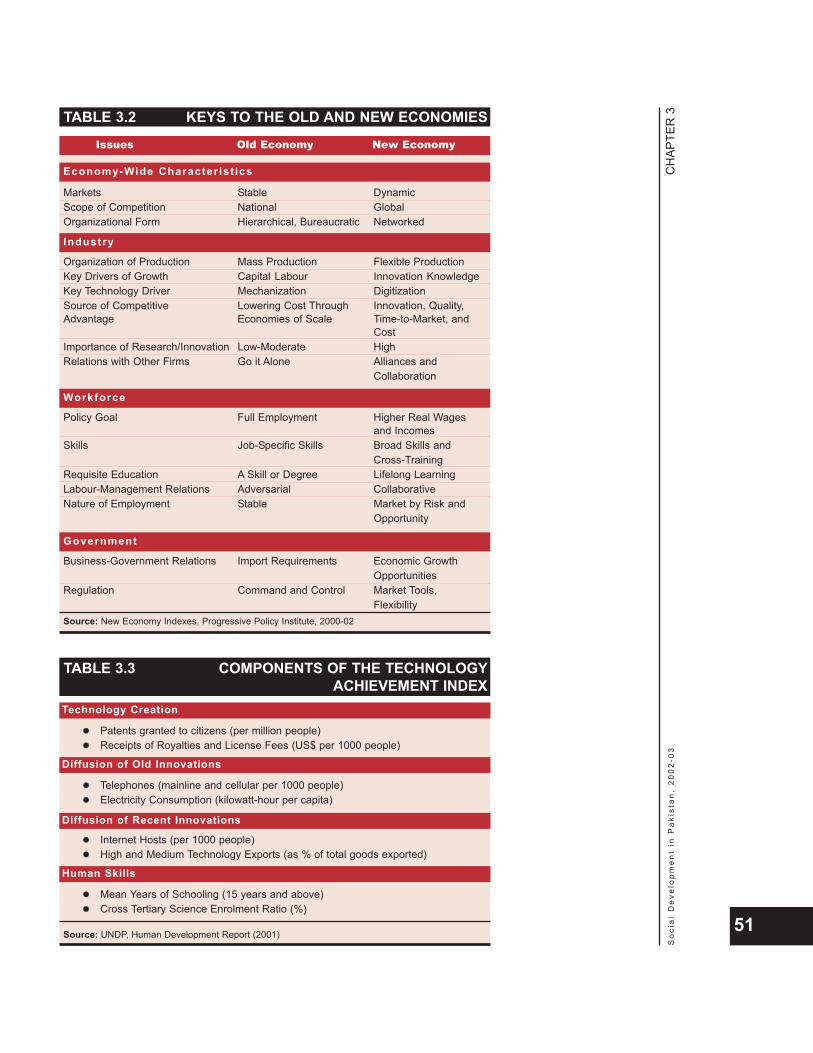
CH
APTE
R 3
So
cia
l D
eve
lop
me
nt
in P
aki
sta
n,
20
02
-03
51
TABLE 3.2 KEYS TO THE OLD AND NEW ECONOMIES
Issues Old Economy New Economy
Markets Stable DynamicScope of Competition National GlobalOrganizational Form Hierarchical, Bureaucratic Networked
Industry:Organization of Production Mass Production Flexible ProductionKey Drivers of Growth Capital Labour Innovation KnowledgeKey Technology Driver Mechanization DigitizationSource of Competitive Lowering Cost Through Innovation, Quality, Advantage Economies of Scale Time-to-Market, and
CostImportance of Research/Innovation Low-Moderate HighRelations with Other Firms Go it Alone Alliances and
Collaboration
Workforce:Policy Goal Full Employment Higher Real Wages
and IncomesSkills Job-Specific Skills Broad Skills and
Cross-TrainingRequisite Education A Skill or Degree Lifelong LearningLabour-Management Relations Adversarial CollaborativeNature of Employment Stable Market by Risk and
Opportunity
Government:Business-Government Relations Import Requirements Economic Growth
OpportunitiesRegulation Command and Control Market Tools,
FlexibilitySource: New Economy Indexes, Progressive Policy Institute, 2000-02
Economy-Wide Character ist ics
Industry
Workforce
Government
TABLE 3.3 COMPONENTS OF THE TECHNOLOGYACHIEVEMENT INDEX
Technology Creation
Patents granted to citizens (per million people)Receipts of Royalties and License Fees (US$ per 1000 people)
Diffusion of Old Innovations
Telephones (mainline and cellular per 1000 people)Electricity Consumption (kilowatt-hour per capita)
Diffusion of Recent Innovations
Internet Hosts (per 1000 people)High and Medium Technology Exports (as % of total goods exported)
Human Skills
Mean Years of Schooling (15 years and above)Cross Tertiary Science Enrolment Ratio (%)
Source: UNDP, Human Development Report (2001)
Diffusion of Recent Innovations
Human Skills
Diffusion of Old Innovations
Technology Creation
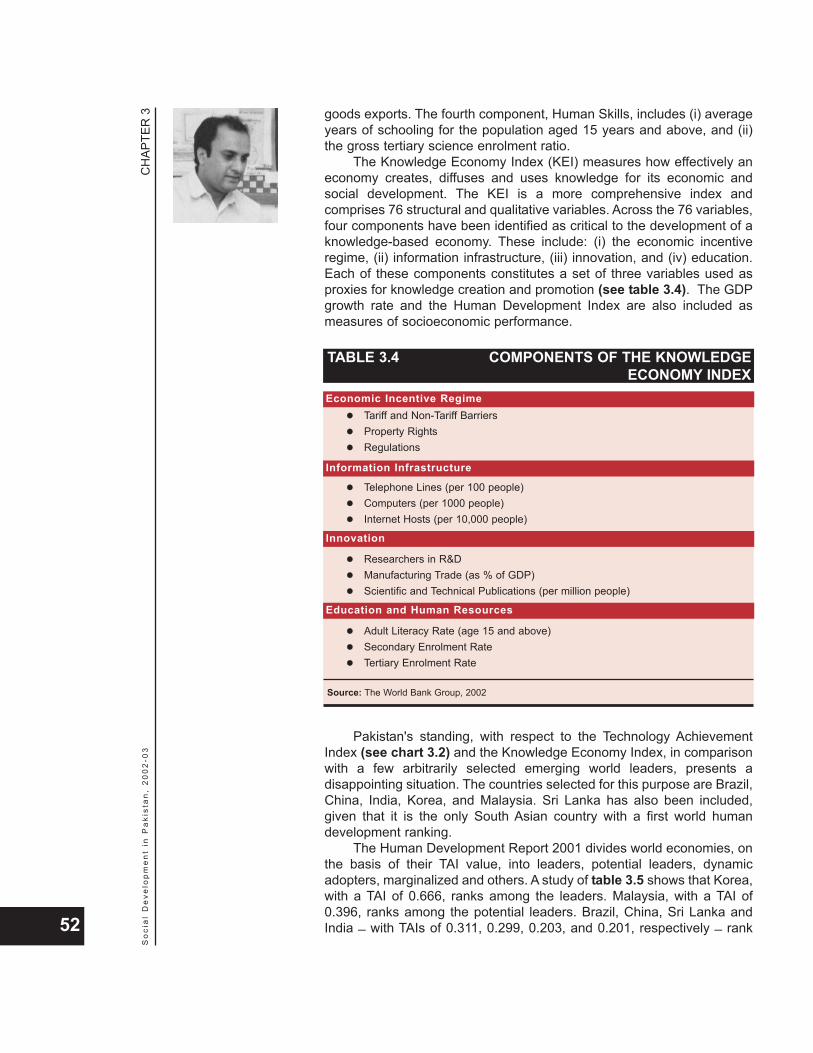
goods exports. The fourth component, Human Skills, includes (i) averageyears of schooling for the population aged 15 years and above, and (ii)the gross tertiary science enrolment ratio.
The Knowledge Economy Index (KEI) measures how effectively aneconomy creates, diffuses and uses knowledge for its economic andsocial development. The KEI is a more comprehensive index andcomprises 76 structural and qualitative variables. Across the 76 variables,four components have been identified as critical to the development of aknowledge-based economy. These include: (i) the economic incentiveregime, (ii) information infrastructure, (iii) innovation, and (iv) education.Each of these components constitutes a set of three variables used asproxies for knowledge creation and promotion (see table 3.4). The GDPgrowth rate and the Human Development Index are also included asmeasures of socioeconomic performance.
Pakistan's standing, with respect to the Technology AchievementIndex (see chart 3.2) and the Knowledge Economy Index, in comparisonwith a few arbitrarily selected emerging world leaders, presents adisappointing situation. The countries selected for this purpose are Brazil,China, India, Korea, and Malaysia. Sri Lanka has also been included,given that it is the only South Asian country with a first world humandevelopment ranking.
The Human Development Report 2001 divides world economies, onthe basis of their TAI value, into leaders, potential leaders, dynamicadopters, marginalized and others. A study of table 3.5 shows that Korea,with a TAI of 0.666, ranks among the leaders. Malaysia, with a TAI of0.396, ranks among the potential leaders. Brazil, China, Sri Lanka andIndia _ with TAIs of 0.311, 0.299, 0.203, and 0.201, respectively _ rank
CH
APTE
R 3
So
cia
l D
eve
lop
me
nt
in P
aki
sta
n,
20
02
-03
52
TABLE 3.4 COMPONENTS OF THE KNOWLEDGEECONOMY INDEX
Economic Incentive RegimeTariff and Non-Tariff BarriersProperty RightsRegulations
Information Infrastructure
Telephone Lines (per 100 people)Computers (per 1000 people)Internet Hosts (per 10,000 people)
Innovation
Researchers in R&DManufacturing Trade (as % of GDP)Scientific and Technical Publications (per million people)
Education and Human Resources
Adult Literacy Rate (age 15 and above)Secondary Enrolment RateTertiary Enrolment Rate
Source: The World Bank Group, 2002
Innovation
Education and Human Resources
Information Infrastructure
Economic Incentive Regime
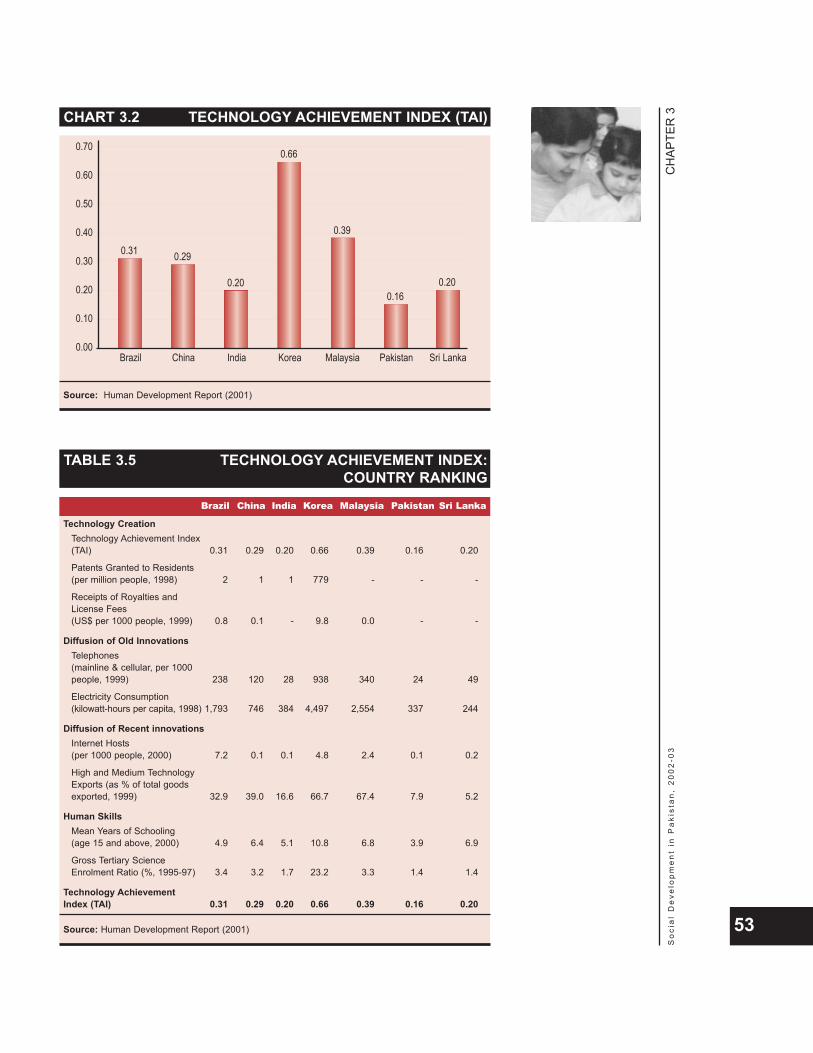
CH
APTE
R 3
So
cia
l D
eve
lop
me
nt
in P
aki
sta
n,
20
02
-03
53
CHART 3.2 TECHNOLOGY ACHIEVEMENT INDEX (TAI)
0.70
0.60
0.50
0.40
0.30
0.20
0.10
0.00
Source: Human Development Report (2001)
0.31
Brazil
0.29
China
0.20
India
0.66
Korea
0.39
Malaysia
0.16
Pakistan
0.20
Sri Lanka
TABLE 3.5 TECHNOLOGY ACHIEVEMENT INDEX:COUNTRY RANKING
Brazil China India Korea Malaysia Pakistan Sri Lanka
Technology CreationTechnology Achievement Index(TAI) 0.31 0.29 0.20 0.66 0.39 0.16 0.20
Patents Granted to Residents(per million people, 1998) 2 1 1 779 - - -
Receipts of Royalties andLicense Fees(US$ per 1000 people, 1999) 0.8 0.1 - 9.8 0.0 - -
Diffusion of Old InnovationsTelephones(mainline & cellular, per 1000people, 1999) 238 120 28 938 340 24 49
Electricity Consumption(kilowatt-hours per capita, 1998) 1,793 746 384 4,497 2,554 337 244
Diffusion of Recent innovationsInternet Hosts(per 1000 people, 2000) 7.2 0.1 0.1 4.8 2.4 0.1 0.2
High and Medium TechnologyExports (as % of total goodsexported, 1999) 32.9 39.0 16.6 66.7 67.4 7.9 5.2
Human SkillsMean Years of Schooling(age 15 and above, 2000) 4.9 6.4 5.1 10.8 6.8 3.9 6.9
Gross Tertiary Science Enrolment Ratio (%, 1995-97) 3.4 3.2 1.7 23.2 3.3 1.4 1.4
Technology AchievementIndex (TAI) 0.31 0.29 0.20 0.66 0.39 0.16 0.20
Source: Human Development Report (2001)
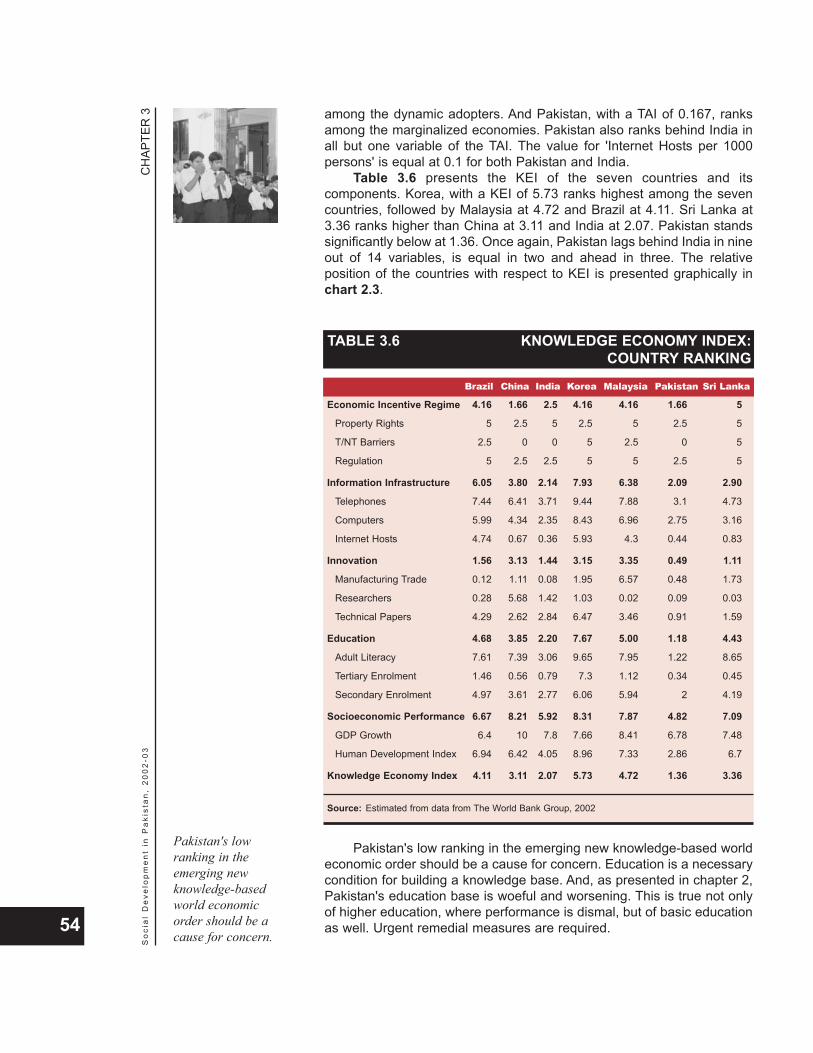
among the dynamic adopters. And Pakistan, with a TAI of 0.167, ranksamong the marginalized economies. Pakistan also ranks behind India inall but one variable of the TAI. The value for 'Internet Hosts per 1000persons' is equal at 0.1 for both Pakistan and India.
Table 3.6 presents the KEI of the seven countries and itscomponents. Korea, with a KEI of 5.73 ranks highest among the sevencountries, followed by Malaysia at 4.72 and Brazil at 4.11. Sri Lanka at3.36 ranks higher than China at 3.11 and India at 2.07. Pakistan standssignificantly below at 1.36. Once again, Pakistan lags behind India in nineout of 14 variables, is equal in two and ahead in three. The relativeposition of the countries with respect to KEI is presented graphically inchart 2.3.
Pakistan's low ranking in the emerging new knowledge-based worldeconomic order should be a cause for concern. Education is a necessarycondition for building a knowledge base. And, as presented in chapter 2,Pakistan's education base is woeful and worsening. This is true not onlyof higher education, where performance is dismal, but of basic educationas well. Urgent remedial measures are required.
CH
APTE
R 3
So
cia
l D
eve
lop
me
nt
in P
aki
sta
n,
20
02
-03
54
TABLE 3.6 KNOWLEDGE ECONOMY INDEX:COUNTRY RANKING
Brazil China India Korea Malaysia Pakistan Sri Lanka
Economic Incentive Regime 4.16 1.66 2.5 4.16 4.16 1.66 5
Property Rights 5 2.5 5 2.5 5 2.5 5
T/NT Barriers 2.5 0 0 5 2.5 0 5
Regulation 5 2.5 2.5 5 5 2.5 5
Information Infrastructure 6.05 3.80 2.14 7.93 6.38 2.09 2.90
Telephones 7.44 6.41 3.71 9.44 7.88 3.1 4.73
Computers 5.99 4.34 2.35 8.43 6.96 2.75 3.16
Internet Hosts 4.74 0.67 0.36 5.93 4.3 0.44 0.83
Innovation 1.56 3.13 1.44 3.15 3.35 0.49 1.11
Manufacturing Trade 0.12 1.11 0.08 1.95 6.57 0.48 1.73
Researchers 0.28 5.68 1.42 1.03 0.02 0.09 0.03
Technical Papers 4.29 2.62 2.84 6.47 3.46 0.91 1.59
Education 4.68 3.85 2.20 7.67 5.00 1.18 4.43
Adult Literacy 7.61 7.39 3.06 9.65 7.95 1.22 8.65
Tertiary Enrolment 1.46 0.56 0.79 7.3 1.12 0.34 0.45
Secondary Enrolment 4.97 3.61 2.77 6.06 5.94 2 4.19
Socioeconomic Performance 6.67 8.21 5.92 8.31 7.87 4.82 7.09
GDP Growth 6.4 10 7.8 7.66 8.41 6.78 7.48
Human Development Index 6.94 6.42 4.05 8.96 7.33 2.86 6.7
Knowledge Economy Index 4.11 3.11 2.07 5.73 4.72 1.36 3.36
Source: Estimated from data from The World Bank Group, 2002
Pakistan's lowranking in theemerging newknowledge-basedworld economicorder should be acause for concern.

The positive relationship between literacy and development level andthe imperatives of the emerging knowledge-based world economy
establish the case for investment in education. Empirical evidence isalso available to show that greater investment in education is likely toaccelerate economic growth. Simulations for Pakistan, using SPDC's116-equation macro-econometric module of the 263-equation IntegratedSocial Policy and Macroeconomic (ISPM) Model (see appendix A.3),show that switching public expenditure to education accelerates GDPgrowth in the medium term. Thus, an absolute increase in resources forthe whole economy is not a necessary condition _ reallocation of existingresources can also achieve substantial results.
The simulation exercise was carried out for the combined provincialdevelopment expenditures, as specified in the four provincial AnnualDevelopment Plans during the 1991-2001 period. Provincialdevelopment expenditure is allocated to the following categories:economic sectors, education, health, public health, grants to localgovernments, and ‘other’ sectors1. During the 1991-2001 period,economic sectors received about half of the development allocations,ranging from 40 to 55 per cent. Education received about one-sixth ofthe allocations, ranging from 11 to 18 per cent over the same period.‘Other’ sectors' expenditure varied widely, but has been about 13 percent in recent years (see table 3.7).
CH
APTE
R 3
So
cia
l D
eve
lop
me
nt
in P
aki
sta
n,
20
02
-03
55
CHART 3.3 KNOWLEDGE ECONOMY INDEX (KEI)
7.0
60.
5.0
4.0
3.0
2.0
1.0
0.0
Source: Estimated from data from The World Bank Group, 2002
4.1
Brazil
3.1
China
2.1
India
5.7
Korea
4.7
Malaysia
1.4
Pakistan
3.4
Sri Lanka
IMPACT OF EXPENDITURE SHIFT
1Other Sectors include Forestry, Wildlife, Culture, Tourism, Social Welfare, Manpower, Law and Order,Regional Planning, Rural Development, Statistical Research, Science and Technology, Women’sWelfare, Transport and Communications, Environment, etc.

The simulation carried out a 'laboratory-like' exercise in which allcomponents of the federal and provincial current and developmentexpenditures, except for education and other sectors, were kept constant.A three step exercise was carried out, during which Rs. 1, Rs. 2 and Rs.3 billion were transferred, respectively, from other sectors to educationand their respective impacts on GDP were measured (see table 2.8).
CH
APTE
R 3
So
cia
l D
eve
lop
me
nt
in P
aki
sta
n,
20
02
-03
56
TABLE 3.7 PROVINCIAL DEVELOPMENT EXPENDITURES(Rs. Million)
Years Education Health Public Economic Grants to Other TotalHealth Sector Local Sectors
Governments1991-92 3,562 2,053 5,172 13,647 1,033 2,515 27,982
(12.73) (7.34) (18.48) (48.77) (3.69) (8.99) (100.00)
1992-93 3,318 2,354 5,844 12,552 1,224 2,119 27,411(12.10) (8.59) (21.32) (45.79) (4.47) (7.73) (100.00)
1993-94 4,369 2,278 4,706 10,364 1,103 1,009 23,830(18.33) (9.56) (19.75) (43.49) (4.63) (4.24) (100.00)
1994-95 6,377 3,052 6,030 21,428 1,140 918 38,947(16.37) (7.84) (15.48) (55.02) (2.93) (2.36) (100.00)
1995-96 6,743 3,002 7,459 23,637 1,232 967 43,039(15.67) (6.98) (17.33) (54.92) (2.86) (2.25) (100.00)
1996-97 6,186 2,202 6,336 12,790 1,330 2,304 31,147(19.86) (7.07) (20.34) (41.06) (4.27) (7.40) (100.00)
1997-98 6,033 2,484 7,579 13,304 1,436 2,937 33,774(17.86) (7.36) (22.44) (39.39) (4.25) (8.70) (100.00)
1998-99 5,764 2,253 9,457 13,365 1,489 4,422 36,751(15.68) (6.13) (25.73) (36.37) (4.05) (12.03) (100.00)
1999-00 6,079 2,027 9,531 13,515 1,546 4,860 37,557(16.18) (5.40) (25.38) (35.99) (4.12) (12.94) (100.00)
2000-01 4,748 1,739 7,790 19,248 1,669 5,674 40,868(11.62) (4.25) (19.06) (47.10) (4.08) (13.88) (100.00)
Note: Figures in parentheses are percentage sharesSource: Provincial Budgets (various issues)
TABLE 3.8 IMPACT OF SHIFT FROM ‘OTHEREXPENDITURES’ TO EDUCATION
Estimated GDP Change in GDP At At At At At At
Years Base 1 Billion 2 Billion 3 Billion 1 Billion 2 Billion 3 BillionShift Shift Shift Shift Shift Shift
1991-92 542,613 542,622 542,629 542,632 10 16 19
1992-93 546,226 546,195 546,152 546,098 -31 -74 -128
1993-94 572,579 572,479 572,357 572,212 -100 -222 -367
1994-95 598,372 598,255 598,088 597,873 -117 -284 -499
1995-96 618,508 618,397 618,202 617,924 -110 -305 -583
1996-97 631,833 631,780 631,608 631,320 -52 -225 -512
1997-98 631,381 636,387 636,236 635,936 6 -145 -445
1998-99 652,609 652,750 652,681 652,418 140 72 -192
1999-00 690,114 690,421 690,458 690,245 307 344 131
2000-01 702,820 703,295 703,434 703,262 475 614 443
Source: SPDC estimates
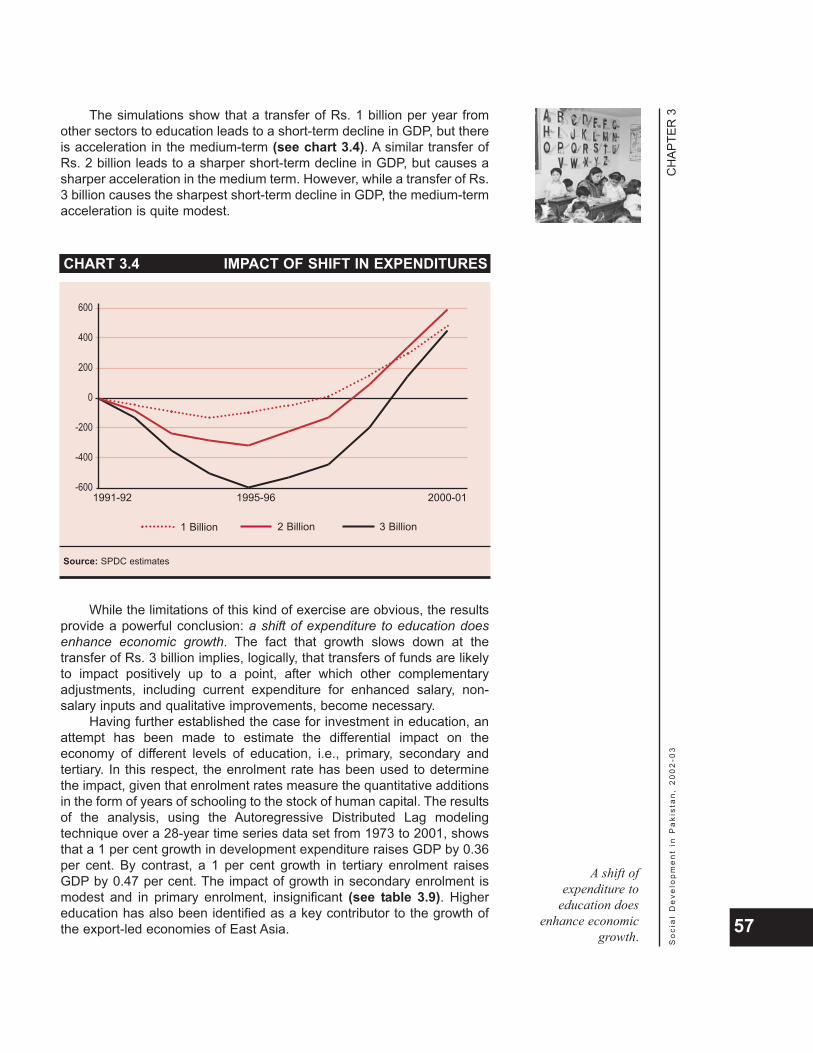
The simulations show that a transfer of Rs. 1 billion per year fromother sectors to education leads to a short-term decline in GDP, but thereis acceleration in the medium-term (see chart 3.4). A similar transfer ofRs. 2 billion leads to a sharper short-term decline in GDP, but causes asharper acceleration in the medium term. However, while a transfer of Rs.3 billion causes the sharpest short-term decline in GDP, the medium-termacceleration is quite modest.
While the limitations of this kind of exercise are obvious, the resultsprovide a powerful conclusion: a shift of expenditure to education doesenhance economic growth. The fact that growth slows down at thetransfer of Rs. 3 billion implies, logically, that transfers of funds are likelyto impact positively up to a point, after which other complementaryadjustments, including current expenditure for enhanced salary, non-salary inputs and qualitative improvements, become necessary.
Having further established the case for investment in education, anattempt has been made to estimate the differential impact on theeconomy of different levels of education, i.e., primary, secondary andtertiary. In this respect, the enrolment rate has been used to determinethe impact, given that enrolment rates measure the quantitative additionsin the form of years of schooling to the stock of human capital. The resultsof the analysis, using the Autoregressive Distributed Lag modelingtechnique over a 28-year time series data set from 1973 to 2001, showsthat a 1 per cent growth in development expenditure raises GDP by 0.36per cent. By contrast, a 1 per cent growth in tertiary enrolment raisesGDP by 0.47 per cent. The impact of growth in secondary enrolment ismodest and in primary enrolment, insignificant (see table 3.9). Highereducation has also been identified as a key contributor to the growth ofthe export-led economies of East Asia.
CH
APTE
R 3
So
cia
l D
eve
lop
me
nt
in P
aki
sta
n,
20
02
-03
57
CHART 3.4 IMPACT OF SHIFT IN EXPENDITURES
600
400
200
0
-200
-400
-600
Source: SPDC estimates
1 Billion
1991-92 1995-96 2000-01
2 Billion 3 Billion
A shift ofexpenditure to
education doesenhance economic
growth.
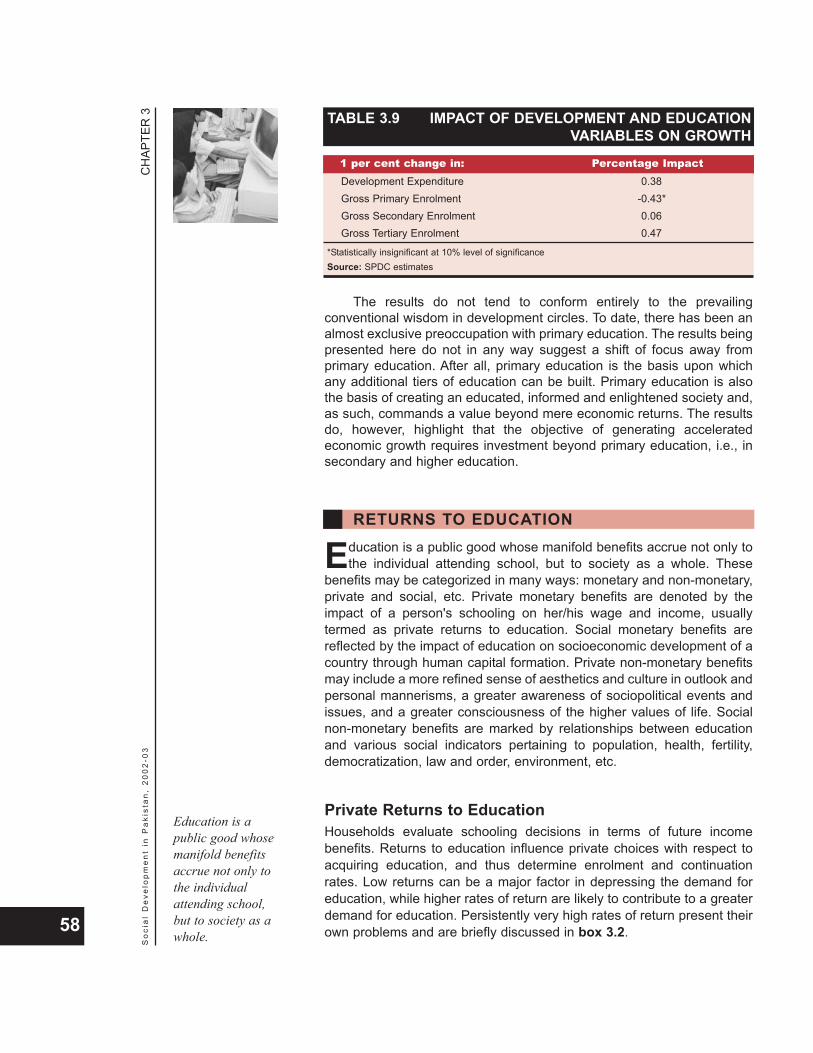
The results do not tend to conform entirely to the prevailingconventional wisdom in development circles. To date, there has been analmost exclusive preoccupation with primary education. The results beingpresented here do not in any way suggest a shift of focus away fromprimary education. After all, primary education is the basis upon whichany additional tiers of education can be built. Primary education is alsothe basis of creating an educated, informed and enlightened society and,as such, commands a value beyond mere economic returns. The resultsdo, however, highlight that the objective of generating acceleratedeconomic growth requires investment beyond primary education, i.e., insecondary and higher education.
Education is a public good whose manifold benefits accrue not only tothe individual attending school, but to society as a whole. These
benefits may be categorized in many ways: monetary and non-monetary,private and social, etc. Private monetary benefits are denoted by theimpact of a person's schooling on her/his wage and income, usuallytermed as private returns to education. Social monetary benefits arereflected by the impact of education on socioeconomic development of acountry through human capital formation. Private non-monetary benefitsmay include a more refined sense of aesthetics and culture in outlook andpersonal mannerisms, a greater awareness of sociopolitical events andissues, and a greater consciousness of the higher values of life. Socialnon-monetary benefits are marked by relationships between educationand various social indicators pertaining to population, health, fertility,democratization, law and order, environment, etc.
Private Returns to EducationHouseholds evaluate schooling decisions in terms of future incomebenefits. Returns to education influence private choices with respect toacquiring education, and thus determine enrolment and continuationrates. Low returns can be a major factor in depressing the demand foreducation, while higher rates of return are likely to contribute to a greaterdemand for education. Persistently very high rates of return present theirown problems and are briefly discussed in box 3.2.
CH
APTE
R 3
So
cia
l D
eve
lop
me
nt
in P
aki
sta
n,
20
02
-03
58
TABLE 3.9 IMPACT OF DEVELOPMENT AND EDUCATIONVARIABLES ON GROWTH
1 per cent change in: Percentage ImpactDevelopment Expenditure 0.38Gross Primary Enrolment -0.43*Gross Secondary Enrolment 0.06Gross Tertiary Enrolment 0.47
*Statistically insignificant at 10% level of significanceSource: SPDC estimates
RETURNS TO EDUCATION
Education is apublic good whosemanifold benefitsaccrue not only tothe individualattending school,but to society as awhole.

International studies on private returns to education report positiveeffects of education to individual wages and income. Some studies haveindicated that the average rate of return in terms of income to anadditional year of schooling is as high as 10 per cent. The highest returnsare recorded for low and middle-income countries and private returns tohigher education are shown to be increasing. Studies in Pakistan haveshown the rate of return to an additional year of schooling to be 7 percent. Higher earnings are also associated with higher levels of education.A detailed analysis of data for Pakistan confirms the above findings.
A review of the education-specific profile of the labour force showsthat more than 50 per cent of the labour force has no formal schooling, 4per cent has obtained higher secondary, and 5 per cent has obtainedtertiary-general education, while only 0.6 per cent of workers possesstertiary-professional education. In the case of wage earners (salariedemployees), the proportion of each category of educational attainment ishigher than that of the overall labour force. The percentage of wageearners with no schooling drops to 40 per cent, while the percentage ofwage earners with higher secondary and tertiary-general educationqualifications rises to 6 and 9 per cent, respectively. The percentage ofwage earners with tertiary-professional almost doubles to 1.1 per cent(see table 3.10).
CH
APTE
R 3
So
cia
l D
eve
lop
me
nt
in P
aki
sta
n,
20
02
-03
59
BOX 3.2 WHAT COULD PERSISTENTLY HIGH RATES OFRETURN MEAN?
Long-term persistence ofhigh rates of return for any
level of education can be anindication of constrainedsupply, caused either byrestrictions on entry or barriersto entry. The former may takethe form of high entryrequirements for certain typesof education, e.g., in medicaleducation. The latter may takethe form of inability of the poorto access certain types ofeducation, e.g., higher level
professional qualifications. Theinability of the poor to acquirebasic education also excludesthem from accessing highereducation. In Pakistan, forexample, a situation ofeducational apartheid exists, inwhich the upper income groupssend their wards to English-medium schools and the lowerincome groups send theirwards, if at all, to Urdu-medium schools or to religiousmadrassahs. Given that
proficiency in English isnecessary for entry into mostprofessional schools and foreducation abroad, the lattergroups stand effectively'debarred' from access tohigher education.
TABLE 3.10 LABOUR FORCE COMPOSITION BYEDUCATIONAL ATTAINMENT (%)
Education Level Overall Labour Force Wage EarnersNo Schooling 53 40.3
Primary 14.4 16.9
Secondary 23 27
Higher Secondary 5 5.9
Tertiary-General 4 8.8
Tertiary-Professional 0.6 1.1
Source: Pakistan Integrated Household Survey (PIHS) (2001-02)
The education-specific profile of
the labour forceshows that more
than 50 per cent ofthe labour force
has no formalschooling.
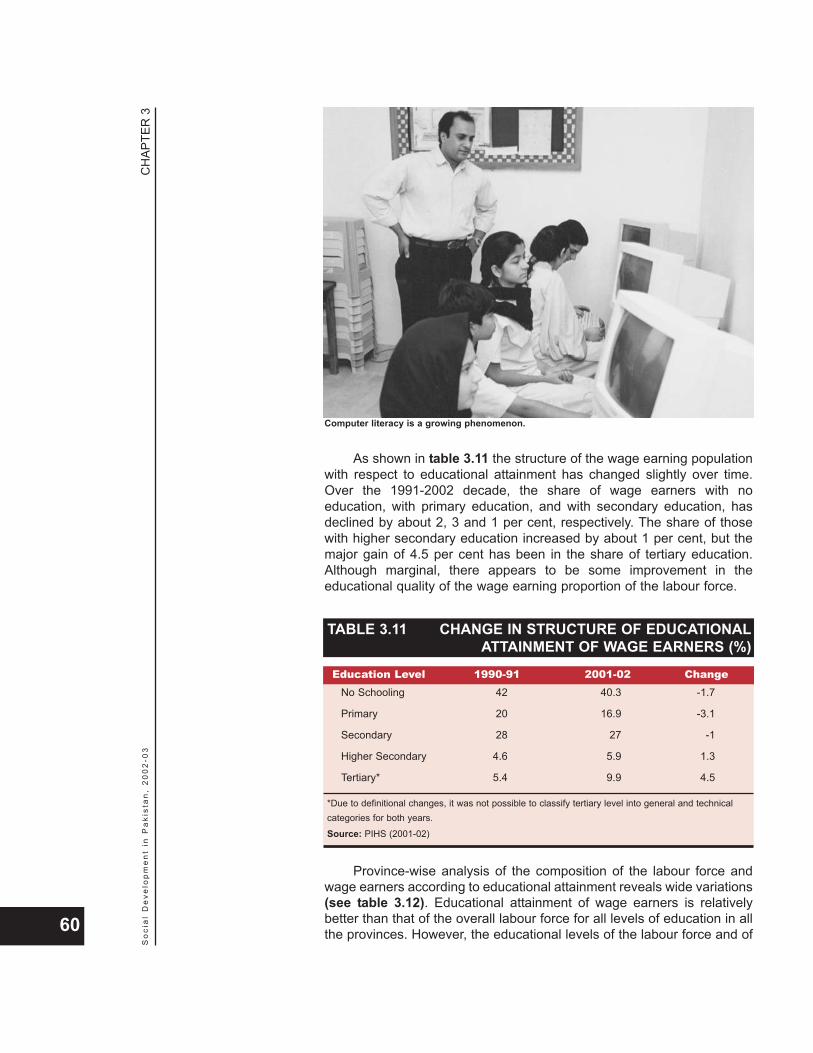
As shown in table 3.11 the structure of the wage earning populationwith respect to educational attainment has changed slightly over time.Over the 1991-2002 decade, the share of wage earners with noeducation, with primary education, and with secondary education, hasdeclined by about 2, 3 and 1 per cent, respectively. The share of thosewith higher secondary education increased by about 1 per cent, but themajor gain of 4.5 per cent has been in the share of tertiary education.Although marginal, there appears to be some improvement in theeducational quality of the wage earning proportion of the labour force.
Province-wise analysis of the composition of the labour force andwage earners according to educational attainment reveals wide variations(see table 3.12). Educational attainment of wage earners is relativelybetter than that of the overall labour force for all levels of education in allthe provinces. However, the educational levels of the labour force and of
CH
APTE
R 3
So
cia
l D
eve
lop
me
nt
in P
aki
sta
n,
20
02
-03
60
Computer literacy is a growing phenomenon.
TABLE 3.11 CHANGE IN STRUCTURE OF EDUCATIONALATTAINMENT OF WAGE EARNERS (%)
Education Level 1990-91 2001-02 ChangeNo Schooling 42 40.3 -1.7
Primary 20 16.9 -3.1
Secondary 28 27 -1
Higher Secondary 4.6 5.9 1.3
Tertiary* 5.4 9.9 4.5
*Due to definitional changes, it was not possible to classify tertiary level into general and technicalcategories for both years.
Source: PIHS (2001-02)

wage earners are comparatively better in Punjab, relative to otherprovinces, up to secondary education. The situation is mixed at the post-secondary levels, with Sindh reporting twice as high a share of the labourforce with tertiary-general education and of the share of wage earnerswith tertiary-professional education. This can be attributed to Karachi,which is the hub of commercial and industrial activities in the country. Allthe other provinces also report a higher share than Punjab with respectto wage earners with tertiary-general education.
Sectoral composition of wage earners and average wages shows arelatively higher percentage of educated wage earners in the servicessector, with 20 per cent possessing post-secondary qualifications. Thecorresponding percentage for the manufacturing sector is 9 per cent, andfor the agriculture sector, 2 per cent. The high share of the services sectorand the low share of the agriculture sector are understandable. In fact,the share of the services sector is likely to increase significantly ifestimated separately for the formal sector component of services.However, the low share of the manufacturing sector is inexplicable, giventhe high rate of capital intensification of this sector in recent years and theconcomitant replacement of unskilled labour with skilled labour (see table3.13).
CH
APTE
R 3
So
cia
l D
eve
lop
me
nt
in P
aki
sta
n,
20
02
-03
61
TABLE 3.12 COMPOSITION OF LABOUR FORCE ANDWAGE EARNERS: PROVINCIAL SCENARIO (%)
Education Level Labour Force Wage EarnersPunjab Sindh NWFP Balochistan Punjab Sindh NWFP Balochistan
No Schooling 49 52 60 67 41 39 36 52
Primary 16 15 10 8 17 18 15 10
Secondary 25 19 21 18 29 23 30 24
Higher Secondary 5 6 4 3 5 7 7 5
Tertiary-General 3 6 3 3 7 11 9 8
Tertiary-Technical 1 1 1 0 1 2 1 0
Source: PIHS (2001-02)
TABLE 3.13 SECTORAL COMPOSITION OFWAGE EARNERS
Education Level Overall Sectors (%)Agriculture Manufacture Services
No Schooling 40 73 42 32
Primary 17 14 20 17
Secondary 27 10 29 30
Higher Secondary 6 1 4 8
Tertiary-General 9 1 4 11
Tertiary-Professional 1 0 1 1
Source: PIHS (2001-02)

Table 3.14 presents a sectoral summary of average wages,categorized according to levels of education, for wage earners. The levelof average wages of workers conforms to the notion that education playsan important role in an individual's earning. Overall, an improvement inthe level of education of wage earners is associated with a considerableincrease in average wages. For example, the average wage of workerswith primary education is 23 per cent higher than that of workers with noeducation. Individuals with secondary education earn 32 per cent morethan those with primary education. The wage differential between tertiary-general and higher secondary is 54 per cent. Wages of workers withtertiary-professional education are 42 per cent higher than those ofworkers with tertiary-general education and five times higher than ofworkers with no education.
Sectorally, the comparative wage differential between different levelsof education provides interesting insights. In agriculture, the averagewage of workers with primary education is 37 per cent higher than that ofworkers with no education. However, individuals with secondaryeducation earn only 9 per cent more than those with primary education.Thus, there is not much of a premium for secondary education. Thosewith higher secondary education, though, command 34 per cent higherwages than workers with lower secondary education. Earnings for thosewith tertiary-general education are almost twice as high as for those withhigher secondary qualifications.
In manufacturing, the average wage of workers with primaryeducation is 17 per cent higher than workers with no education.Individuals with secondary education earn 40 per cent more than thosewith primary education. The implication is that the premium for primaryeducation is significantly lower in manufacturing than in agriculture, butthe reverse is true with respect to secondary education. The wagedifferential between higher secondary, tertiary-general and tertiary-professional is progressively higher by about 60 per cent at every stage.Wages of workers with tertiary-professional education are 6.5 timeshigher than for workers with no education.
CH
APTE
R 3
So
cia
l D
eve
lop
me
nt
in P
aki
sta
n,
20
02
-03
62
TABLE 3.14 AVERAGE WAGES BY EDUCATION LEVELAND SECTOR
Education Level Overall Average Wages (Rs. Per month)
(%) Agriculture (%) Manufacture (%) Services (%)Increment Increment Increment Increment
No Schooling 1738 - 1160 - 1653 - 2089 -
Primary 2135 22.8 1585 36.6 1928 16.6 2321 11.1
Secondary 2809 31.6 1729 9.1 2693 39.7 2930 26.2
Higher Secondary 3829 36.3 2320 34.2 4321 60.5 3823 30.5
Tertiary-General 5893 53.9 4574 97.1 6842 58.3 5804 51.8
Tertiary-Professional 8358 41.8 - - 10740 57.0 8012 38.0
Source: PIHS (2001-02)
In services, wage differentials between different levels of educationare more modest, perhaps on account of the fact that the data for thesector includes a large proportion of informal workers. Thus, the averagewage of workers with primary education is only 11 per cent higher thanthat of workers with no education. It appears that the formal servicessector does not view those with primary education to be in possession ofsignificantly superior skills compared to those with no education. At thesame time, the informal services sector views primary education to beunnecessary to its needs. The average wage increments at subsequentlyhigher levels of education are also relatively moderate, reaching amaximum of 52 per cent for those with tertiary-general education overthose with higher secondary qualifications. There is a four-fold wagedifferential between those with tertiary-professional education and thosewithout education.
Determinants to Private Returns to EducationThe level of education is the most important, but not the only variabledetermining wages or private returns to education. Some of the othervariables comprise quality of education, experience, gender, sector, andprovince of work. The results of the regression analysis in estimating thecontribution of each of the factors are summarized in table 3.15. Themethodology and detailed regression results are provided in box 3.3. Theresults confirm the positive role of education in determining payoffs in thelabour market.
CH
APTE
R 3
So
cia
l D
eve
lop
me
nt
in P
aki
sta
n,
20
02
-03
63
TABLE 3.15 ESTIMATES OF PRIVATE ANNUAL RATEOF RETURNS TO EDUCATION (%)
Province Primary Secondary Higher Tertiary TertiarySecondary General Professional
Overall Average 3 4 16 11 13
Inter-Provincial
Punjab 3 5 18 13 10
Sindh 2 3 15 9 13
NWFP 2 1 17 13 13
Balochistan 3 4 9 9 18
Inter-Sectoral
Agriculture 2 3 7 7 7
Manufacturing 1 4 14 9 13
Services 2 4 15 10 12
Inter-Regional
Urban 2 4 18 11 13
Rural 3 4 14 8 5
Source: PIHS (2001-02)
There is a four-fold wage
differentialbetween those with
tertiary-professional
education andthose without
education.

CH
APTE
R 3
So
cia
l D
eve
lop
me
nt
in P
aki
sta
n,
20
02
-03
64
BOX 3.3 A MODEL OF PRIVATE RETURNS TO EDUCATION
Mincer's (1974) human capital earningsfunction is estimated to quantify the private
rate of returns to education, duly extended tocontrol for a number of other variables that relateto location of living, quality of education andlabour market status. A semi logarithmicframework is applied of the following form:
lnWi = f (Si, Xi, Zi) + µi ... ... ... (1)
where,lnWi is the log of the labour market earnings,defined as monthly gross wages of workersbetween the age of 15 and 65 years.Si stands for completed years of schooling.Xi is a matrix of personal characteristics otherthan schooling, namely, labour marketexperience, experience squared, gender andquality of education.Zi represents a matrix of provincial dummiesand other labour market characteristics, e.g.,sectors.µi is a random disturbance term that capturesunobserved characteristics.
Labour market experience is constructedas a function of age and schooling year (age 5being the entrance age to primary education).Experience is defined as the age less theentrance age less the years of educationcompleted. However, minimum age is taken as15 to exclude child labour.
Two proxies are used to account for qualityof education. It is hypothesized, although yet tobe proved, that private schools provide bettereducation than public institutions. Further, it isalso believed that the labour market is more
responsive, in term of wages, to workers whograduate from institutions where the medium ofinstruction is English. Therefore, dummyvariables to reflect private schooling and Englishas a medium of instruction are used in the returnto education regressions.
A spline form of years of schooling ispreferred to quantify returns of schooling to oneadditional level. Therefore, Si is replaced(equation 2) with the dummy variables for variouslevels of education, i.e., p (primary, 1-5 years), s(secondary, 6-10 years), hs (higher secondary,11-12 years), tg (tertiary general, 13-16 years ofschooling with general subjects of Arts andScience) and tt (tertiary technical, 13-18 years ofschooling with technical education). Tertiarytechnical education refers to degrees inengineering, medicine, agriculture, law, M.Philand Ph.D. No schooling is treated as a referencecategory.
lnWi = βο + βp Sp + βs Ss + βhs Shs + βtg Stg+ βtt Stt + Xiβx + Ziβz + µi ... ... ... (2)
The sample is purged of self-employedpersons and pensioners. The analysis is,therefore, confined to paid employees or wageearners aged 15 to 65 years with positiveincome. The estimates for the year 2001-02appear below.
REGRESSION RESULTVariables Coefficient t-statistic Prob.
Primary Level 0.137 6.99 0.00Secondary Level 0.336 19.96 0.00Higher Secondary Level 0.661 25.38 0.00Tertiary-General 1.077 43.89 0.00Tertiary-Technical 1.157 19.27 0.00Experience 0.066 32.02 0.00Experience Squared -0.001 -24.00 0.00Medium of Instruction - English 0.338 7.33 0.00Type of School - Private 0.181 3.56 0.00Male Employee 1.316 45.04 0.00Working in Manufacturing Sector 0.218 7.48 0.00Working in Services Sector 0.402 18.60 0.00Resident - Urban 0.221 15.70 0.00Resident - Punjab -0.436 -24.84 0.00Resident - Sindh -0.221 -14.06 0.00Resident - NWFP -0.464 -20.61 0.00(Constant) 5.368 142.79 0.00R-squared 0.52 F-statistic 869Adjusted R-squared 0.52 D-W Statistics 1.58
Notes: Prob. reflects the level of significanceData are obtained from PIHS (2001-02)Total number of observations is 12638
The highestincremental returnis associated withhigher secondaryeducation.
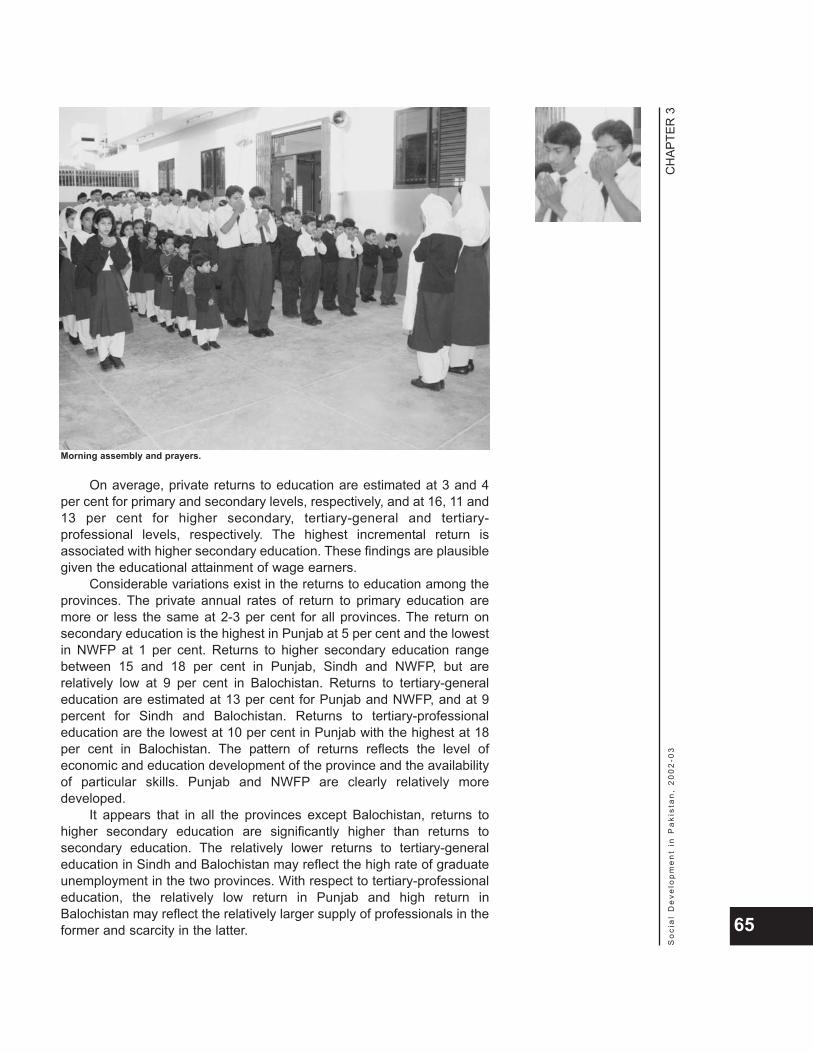
On average, private returns to education are estimated at 3 and 4per cent for primary and secondary levels, respectively, and at 16, 11 and13 per cent for higher secondary, tertiary-general and tertiary-professional levels, respectively. The highest incremental return isassociated with higher secondary education. These findings are plausiblegiven the educational attainment of wage earners.
Considerable variations exist in the returns to education among theprovinces. The private annual rates of return to primary education aremore or less the same at 2-3 per cent for all provinces. The return onsecondary education is the highest in Punjab at 5 per cent and the lowestin NWFP at 1 per cent. Returns to higher secondary education rangebetween 15 and 18 per cent in Punjab, Sindh and NWFP, but arerelatively low at 9 per cent in Balochistan. Returns to tertiary-generaleducation are estimated at 13 per cent for Punjab and NWFP, and at 9percent for Sindh and Balochistan. Returns to tertiary-professionaleducation are the lowest at 10 per cent in Punjab with the highest at 18per cent in Balochistan. The pattern of returns reflects the level ofeconomic and education development of the province and the availabilityof particular skills. Punjab and NWFP are clearly relatively moredeveloped.
It appears that in all the provinces except Balochistan, returns tohigher secondary education are significantly higher than returns tosecondary education. The relatively lower returns to tertiary-generaleducation in Sindh and Balochistan may reflect the high rate of graduateunemployment in the two provinces. With respect to tertiary-professionaleducation, the relatively low return in Punjab and high return inBalochistan may reflect the relatively larger supply of professionals in theformer and scarcity in the latter.
CH
APTE
R 3
So
cia
l D
eve
lop
me
nt
in P
aki
sta
n,
20
02
-03
65
Morning assembly and prayers.
Sectorally, returns to primary and secondary education are more orless the same across sectors. The sectoral differential is highest withrespect to higher secondary education, where returns in manufacturingand services are about twice as high as in agriculture. The correspondingdifferential is lower with respect to tertiary-general.
Furthermore, while returns to primary and secondary education aremore or less the same in urban and rural areas, returns to post-secondarylevels of education are uniformly higher in urban areas relative to ruralareas and the differential increases with the level of education.
The quality of education is also presumed to impact rates of return.Ideally, the quality of education should be represented through somemeasure of achievement or ability score of individual workers. However,since the requisite data is not readily available, two variables have beenselected as proxies for quality of education: English, as a medium ofinstruction, and private schooling. The results, presented in table 3.16,show that returns for wage earners with education up to higher secondarylevel are not significantly affected by the medium of instruction or byprivate schooling. However, at the tertiary levels, there is a 16 to 22 percent increase in returns for those who have obtained their education in anEnglish medium and/or in a private school.
Social Returns to EducationThe non-monetary social benefits of education are characterized byrelationships between education and various social indicators pertaining topopulation, fertility, health, democratization, law and order, environment,etc. Data constraints do not permit a comprehensive analysis of the socialreturns of education. Nevertheless, an attempt can be made to illustratesome of them. These include the relationship of education to fertility, childand maternal health, infant mortality, and early age marriage andmotherhood. Most of these variables demonstrate the social benefits ofwomen's education.
CH
APTE
R 3
So
cia
l D
eve
lop
me
nt
in P
aki
sta
n,
20
02
-03
66
TABLE 3.16 EFFECT OF EDUCATION QUALITY ONRETURNS TO EDUCATION (%)
Quality Proxy
English as Medium of Private SchoolingInstruction
Primary * *
Secondary * *
Higher Secondary * 45
Tertiary-General 20 16
Tertiary-Technical 22 19
Note: Effects on returns are estimated using interactive dummies (quality multiplied by level of education)
*Regression coefficient is statistically insignificantSource: PIHS (2001-02)
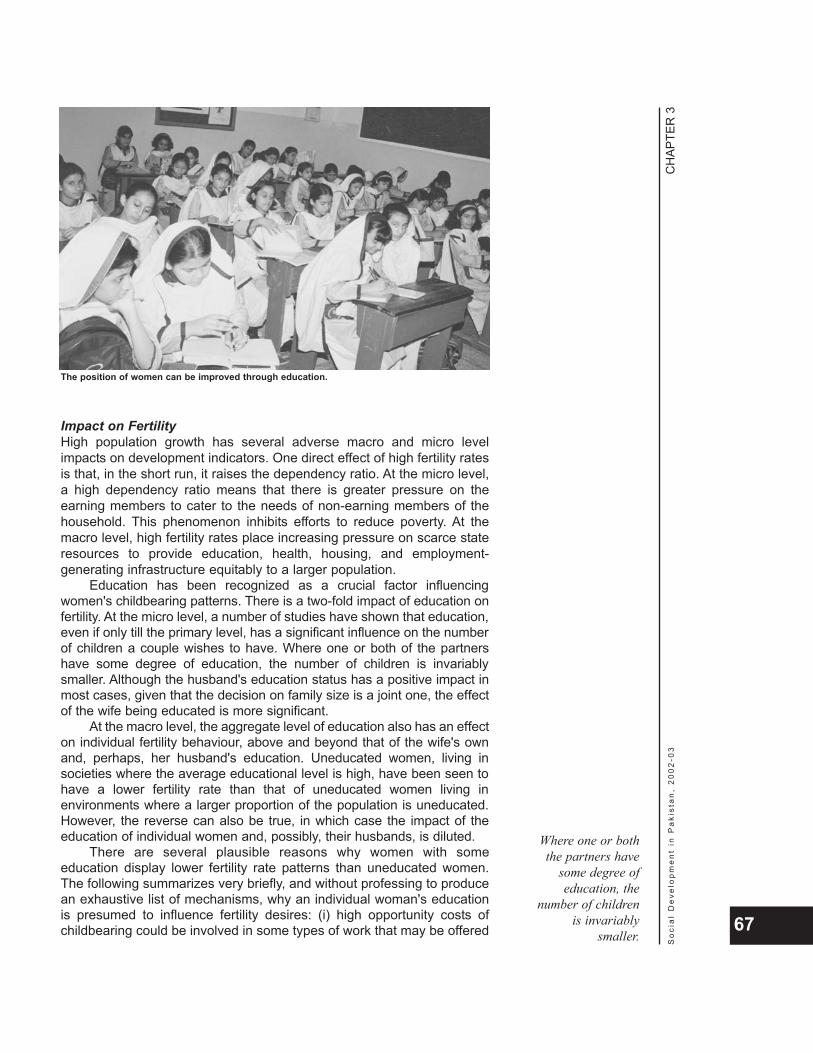
Impact on FertilityHigh population growth has several adverse macro and micro levelimpacts on development indicators. One direct effect of high fertility ratesis that, in the short run, it raises the dependency ratio. At the micro level,a high dependency ratio means that there is greater pressure on theearning members to cater to the needs of non-earning members of thehousehold. This phenomenon inhibits efforts to reduce poverty. At themacro level, high fertility rates place increasing pressure on scarce stateresources to provide education, health, housing, and employment-generating infrastructure equitably to a larger population.
Education has been recognized as a crucial factor influencingwomen's childbearing patterns. There is a two-fold impact of education onfertility. At the micro level, a number of studies have shown that education,even if only till the primary level, has a significant influence on the numberof children a couple wishes to have. Where one or both of the partnershave some degree of education, the number of children is invariablysmaller. Although the husband's education status has a positive impact inmost cases, given that the decision on family size is a joint one, the effectof the wife being educated is more significant.
At the macro level, the aggregate level of education also has an effecton individual fertility behaviour, above and beyond that of the wife's ownand, perhaps, her husband's education. Uneducated women, living insocieties where the average educational level is high, have been seen tohave a lower fertility rate than that of uneducated women living inenvironments where a larger proportion of the population is uneducated.However, the reverse can also be true, in which case the impact of theeducation of individual women and, possibly, their husbands, is diluted.
There are several plausible reasons why women with someeducation display lower fertility rate patterns than uneducated women.The following summarizes very briefly, and without professing to producean exhaustive list of mechanisms, why an individual woman's educationis presumed to influence fertility desires: (i) high opportunity costs ofchildbearing could be involved in some types of work that may be offered
CH
APTE
R 3
So
cia
l D
eve
lop
me
nt
in P
aki
sta
n,
20
02
-03
67
The position of women can be improved through education.
Where one or boththe partners have
some degree ofeducation, the
number of childrenis invariably
smaller.
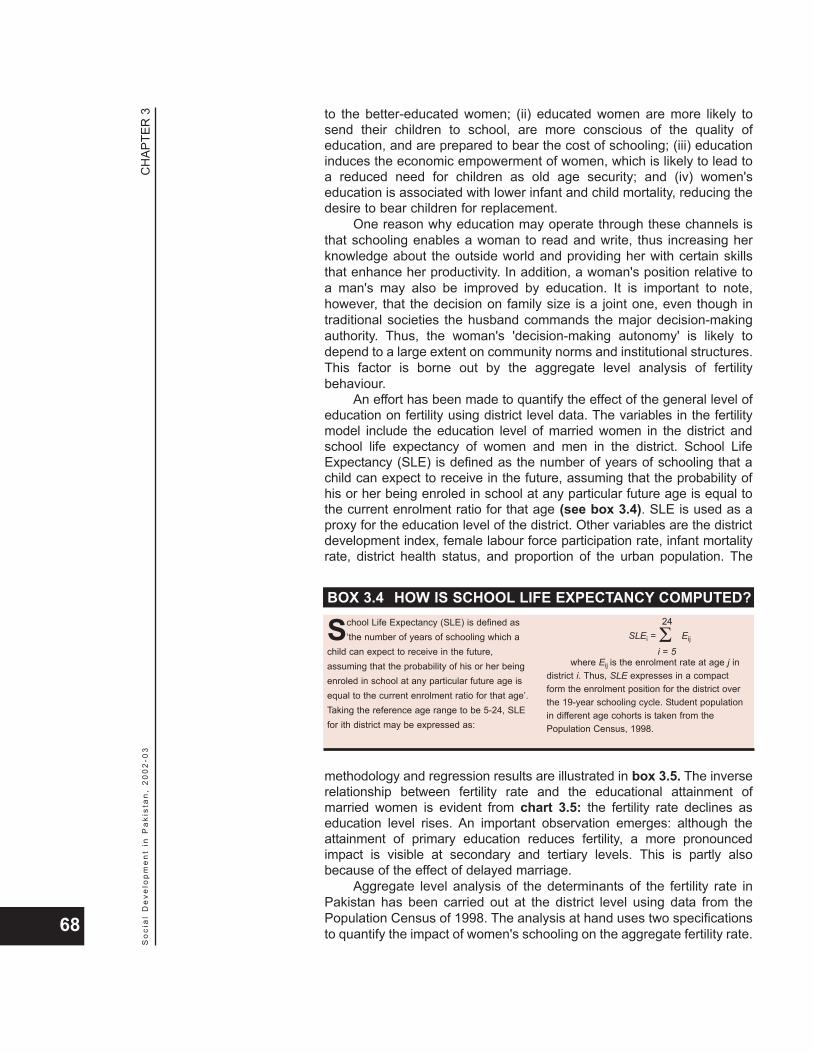
to the better-educated women; (ii) educated women are more likely tosend their children to school, are more conscious of the quality ofeducation, and are prepared to bear the cost of schooling; (iii) educationinduces the economic empowerment of women, which is likely to lead toa reduced need for children as old age security; and (iv) women'seducation is associated with lower infant and child mortality, reducing thedesire to bear children for replacement.
One reason why education may operate through these channels isthat schooling enables a woman to read and write, thus increasing herknowledge about the outside world and providing her with certain skillsthat enhance her productivity. In addition, a woman's position relative toa man's may also be improved by education. It is important to note,however, that the decision on family size is a joint one, even though intraditional societies the husband commands the major decision-makingauthority. Thus, the woman's 'decision-making autonomy' is likely todepend to a large extent on community norms and institutional structures.This factor is borne out by the aggregate level analysis of fertilitybehaviour.
An effort has been made to quantify the effect of the general level ofeducation on fertility using district level data. The variables in the fertilitymodel include the education level of married women in the district andschool life expectancy of women and men in the district. School LifeExpectancy (SLE) is defined as the number of years of schooling that achild can expect to receive in the future, assuming that the probability ofhis or her being enroled in school at any particular future age is equal tothe current enrolment ratio for that age (see box 3.4). SLE is used as aproxy for the education level of the district. Other variables are the districtdevelopment index, female labour force participation rate, infant mortalityrate, district health status, and proportion of the urban population. The
methodology and regression results are illustrated in box 3.5. The inverserelationship between fertility rate and the educational attainment ofmarried women is evident from chart 3.5: the fertility rate declines aseducation level rises. An important observation emerges: although theattainment of primary education reduces fertility, a more pronouncedimpact is visible at secondary and tertiary levels. This is partly alsobecause of the effect of delayed marriage.
Aggregate level analysis of the determinants of the fertility rate inPakistan has been carried out at the district level using data from thePopulation Census of 1998. The analysis at hand uses two specificationsto quantify the impact of women's schooling on the aggregate fertility rate.
CH
APTE
R 3
So
cia
l D
eve
lop
me
nt
in P
aki
sta
n,
20
02
-03
68
BOX 3.4 HOW IS SCHOOL LIFE EXPECTANCY COMPUTED?
School Life Expectancy (SLE) is defined as‘the number of years of schooling which a
child can expect to receive in the future,assuming that the probability of his or her beingenroled in school at any particular future age isequal to the current enrolment ratio for that age’.Taking the reference age range to be 5-24, SLEfor ith district may be expressed as:
SLEi = Eij
where Eij is the enrolment rate at age j indistrict i. Thus, SLE expresses in a compactform the enrolment position for the district overthe 19-year schooling cycle. Student populationin different age cohorts is taken from thePopulation Census, 1998.
24
i = 5Σ
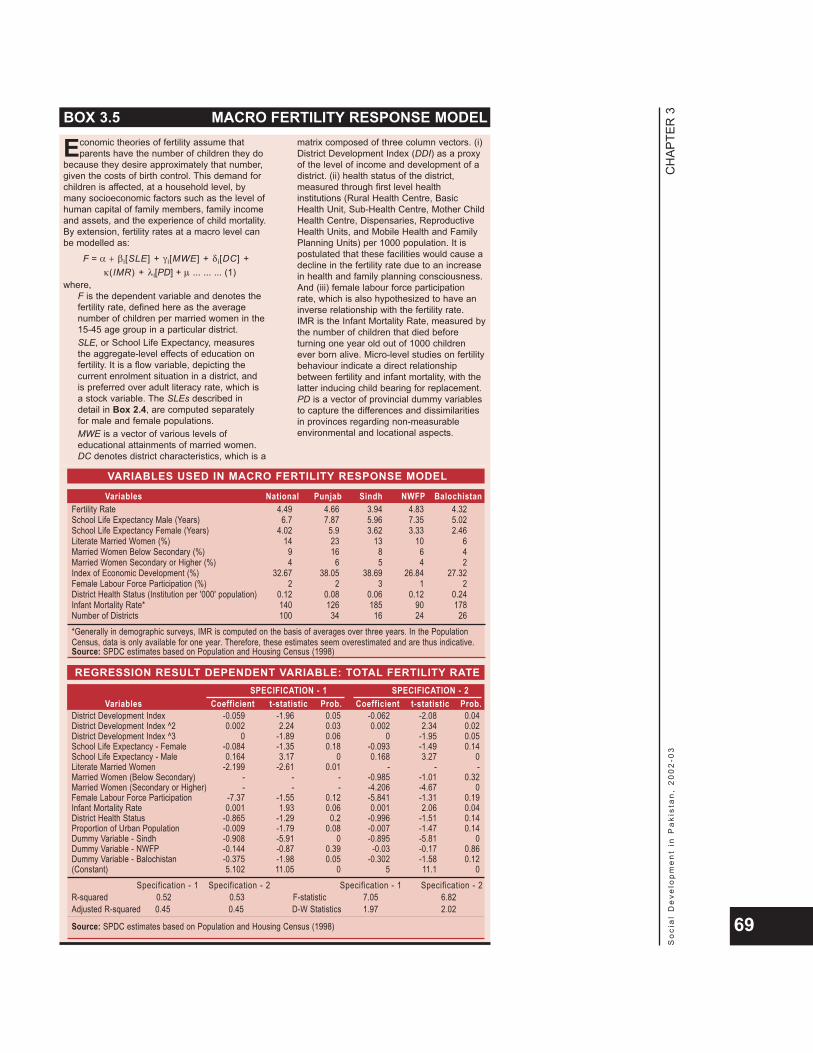
CH
APTE
R 3
So
cia
l D
eve
lop
me
nt
in P
aki
sta
n,
20
02
-03
69
BOX 3.5 MACRO FERTILITY RESPONSE MODEL
Economic theories of fertility assume thatparents have the number of children they do
because they desire approximately that number,given the costs of birth control. This demand forchildren is affected, at a household level, bymany socioeconomic factors such as the level ofhuman capital of family members, family incomeand assets, and the experience of child mortality.By extension, fertility rates at a macro level canbe modelled as:
F = α + β i[SLE] + γ i[MWE] + δ i[DC] +κ(IMR) + λ i[PD] + µ ... ... ... (1)
where,F is the dependent variable and denotes thefertility rate, defined here as the averagenumber of children per married women in the15-45 age group in a particular district.SLE, or School Life Expectancy, measuresthe aggregate-level effects of education onfertility. It is a flow variable, depicting thecurrent enrolment situation in a district, andis preferred over adult literacy rate, which isa stock variable. The SLEs described indetail in Box 2.4, are computed separatelyfor male and female populations.MWE is a vector of various levels ofeducational attainments of married women.DC denotes district characteristics, which is a
matrix composed of three column vectors. (i)District Development Index (DDI) as a proxyof the level of income and development of adistrict. (ii) health status of the district,measured through first level healthinstitutions (Rural Health Centre, BasicHealth Unit, Sub-Health Centre, Mother ChildHealth Centre, Dispensaries, ReproductiveHealth Units, and Mobile Health and FamilyPlanning Units) per 1000 population. It ispostulated that these facilities would cause adecline in the fertility rate due to an increasein health and family planning consciousness.And (iii) female labour force participationrate, which is also hypothesized to have aninverse relationship with the fertility rate.IMR is the Infant Mortality Rate, measured bythe number of children that died beforeturning one year old out of 1000 childrenever born alive. Micro-level studies on fertilitybehaviour indicate a direct relationshipbetween fertility and infant mortality, with thelatter inducing child bearing for replacement. PD is a vector of provincial dummy variablesto capture the differences and dissimilaritiesin provinces regarding non-measurableenvironmental and locational aspects.
VARIABLES USED IN MACRO FERTILITY RESPONSE MODEL
Variables National Punjab Sindh NWFP BalochistanFertility Rate 4.49 4.66 3.94 4.83 4.32School Life Expectancy Male (Years) 6.7 7.87 5.96 7.35 5.02School Life Expectancy Female (Years) 4.02 5.9 3.62 3.33 2.46Literate Married Women (%) 14 23 13 10 6Married Women Below Secondary (%) 9 16 8 6 4Married Women Secondary or Higher (%) 4 6 5 4 2Index of Economic Development (%) 32.67 38.05 38.69 26.84 27.32Female Labour Force Participation (%) 2 2 3 1 2District Health Status (Institution per '000' population) 0.12 0.08 0.06 0.12 0.24Infant Mortality Rate* 140 126 185 90 178Number of Districts 100 34 16 24 26*Generally in demographic surveys, IMR is computed on the basis of averages over three years. In the PopulationCensus, data is only available for one year. Therefore, these estimates seem overestimated and are thus indicative.Source: SPDC estimates based on Population and Housing Census (1998)
REGRESSION RESULT DEPENDENT VARIABLE: TOTAL FERTILITY RATESPECIFICATION - 1 SPECIFICATION - 2
Variables Coefficient t-statistic Prob. Coefficient t-statistic Prob.District Development Index -0.059 -1.96 0.05 -0.062 -2.08 0.04District Development Index ^2 0.002 2.24 0.03 0.002 2.34 0.02District Development Index ^3 0 -1.89 0.06 0 -1.95 0.05School Life Expectancy - Female -0.084 -1.35 0.18 -0.093 -1.49 0.14School Life Expectancy - Male 0.164 3.17 0 0.168 3.27 0Literate Married Women -2.199 -2.61 0.01 - - -Married Women (Below Secondary) - - - -0.985 -1.01 0.32Married Women (Secondary or Higher) - - - -4.206 -4.67 0Female Labour Force Participation -7.37 -1.55 0.12 -5.841 -1.31 0.19Infant Mortality Rate 0.001 1.93 0.06 0.001 2.06 0.04District Health Status -0.865 -1.29 0.2 -0.996 -1.51 0.14Proportion of Urban Population -0.009 -1.79 0.08 -0.007 -1.47 0.14Dummy Variable - Sindh -0.908 -5.91 0 -0.895 -5.81 0Dummy Variable - NWFP -0.144 -0.87 0.39 -0.03 -0.17 0.86Dummy Variable - Balochistan -0.375 -1.98 0.05 -0.302 -1.58 0.12(Constant) 5.102 11.05 0 5 11.1 0
Specification - 1 Specification - 2 Specification - 1 Specification - 2R-squared 0.52 0.53 F-statistic 7.05 6.82Adjusted R-squared 0.45 0.45 D-W Statistics 1.97 2.02
Source: SPDC estimates based on Population and Housing Census (1998)
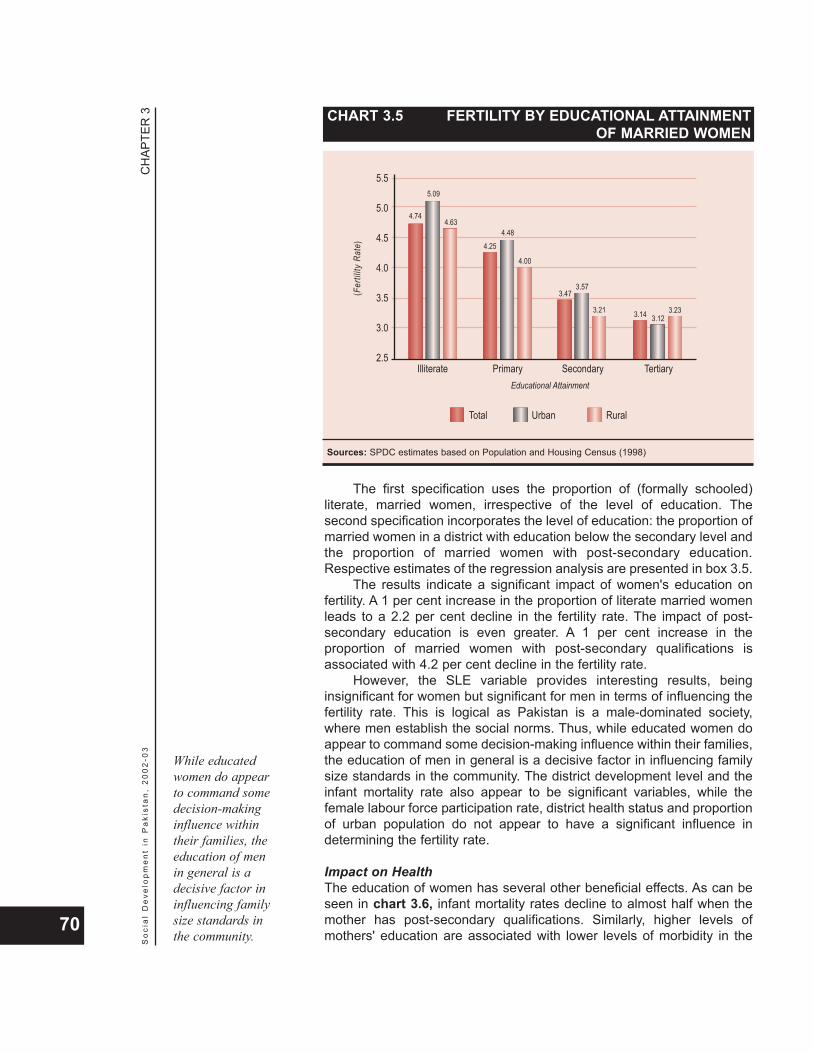
The first specification uses the proportion of (formally schooled)literate, married women, irrespective of the level of education. Thesecond specification incorporates the level of education: the proportion ofmarried women in a district with education below the secondary level andthe proportion of married women with post-secondary education.Respective estimates of the regression analysis are presented in box 3.5.
The results indicate a significant impact of women's education onfertility. A 1 per cent increase in the proportion of literate married womenleads to a 2.2 per cent decline in the fertility rate. The impact of post-secondary education is even greater. A 1 per cent increase in theproportion of married women with post-secondary qualifications isassociated with 4.2 per cent decline in the fertility rate.
However, the SLE variable provides interesting results, beinginsignificant for women but significant for men in terms of influencing thefertility rate. This is logical as Pakistan is a male-dominated society,where men establish the social norms. Thus, while educated women doappear to command some decision-making influence within their families,the education of men in general is a decisive factor in influencing familysize standards in the community. The district development level and theinfant mortality rate also appear to be significant variables, while thefemale labour force participation rate, district health status and proportionof urban population do not appear to have a significant influence indetermining the fertility rate.
Impact on HealthThe education of women has several other beneficial effects. As can beseen in chart 3.6, infant mortality rates decline to almost half when themother has post-secondary qualifications. Similarly, higher levels ofmothers' education are associated with lower levels of morbidity in the
CH
APTE
R 3
So
cia
l D
eve
lop
me
nt
in P
aki
sta
n,
20
02
-03
70
CHART 3.5 FERTILITY BY EDUCATIONAL ATTAINMENTOF MARRIED WOMEN
5.5
5.0
4.5
4.0
3.5
3.0
2.5Illiterate
4.74
5.09
4.63
4.254.48
4.00
3.473.57
3.21 3.14 3.123.23
Educational Attainment
(Fer
tility
Rat
e)
Total Urban Rural
Primary Secondary Tertiary
Sources: SPDC estimates based on Population and Housing Census (1998)
While educatedwomen do appearto command somedecision-makinginfluence withintheir families, theeducation of menin general is adecisive factor ininfluencing familysize standards inthe community.
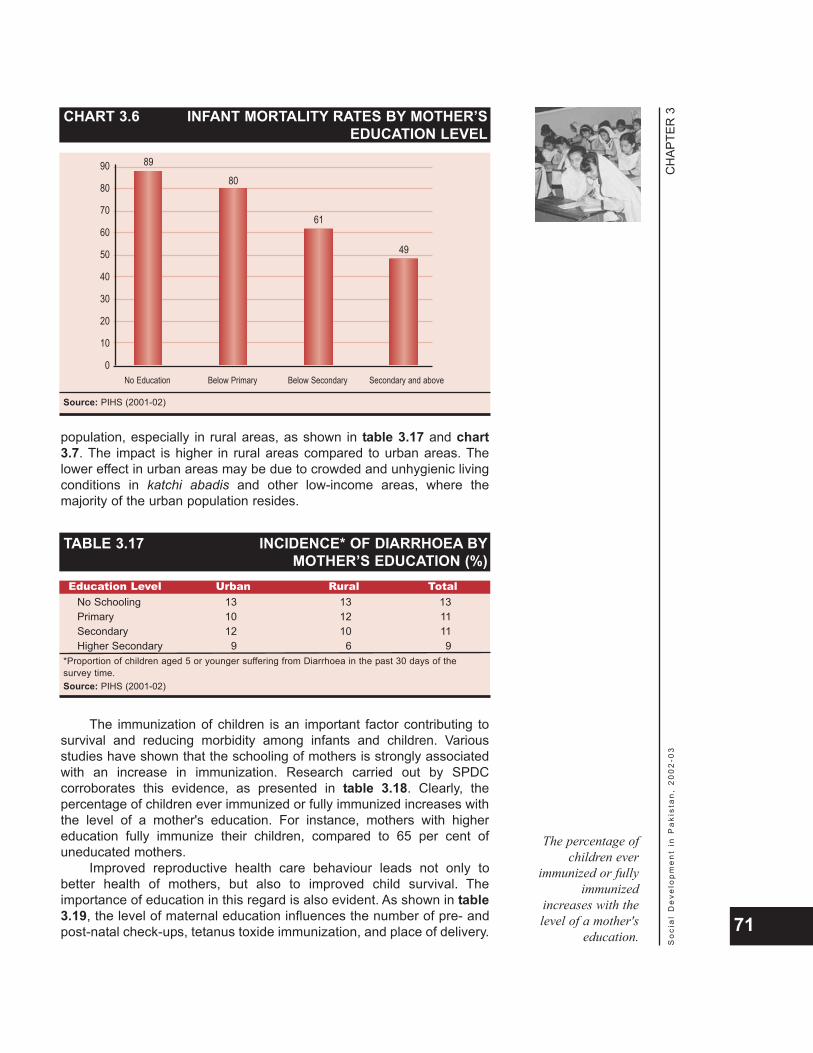
population, especially in rural areas, as shown in table 3.17 and chart3.7. The impact is higher in rural areas compared to urban areas. Thelower effect in urban areas may be due to crowded and unhygienic livingconditions in katchi abadis and other low-income areas, where themajority of the urban population resides.
The immunization of children is an important factor contributing tosurvival and reducing morbidity among infants and children. Variousstudies have shown that the schooling of mothers is strongly associatedwith an increase in immunization. Research carried out by SPDCcorroborates this evidence, as presented in table 3.18. Clearly, thepercentage of children ever immunized or fully immunized increases withthe level of a mother's education. For instance, mothers with highereducation fully immunize their children, compared to 65 per cent ofuneducated mothers.
Improved reproductive health care behaviour leads not only tobetter health of mothers, but also to improved child survival. Theimportance of education in this regard is also evident. As shown in table3.19, the level of maternal education influences the number of pre- andpost-natal check-ups, tetanus toxide immunization, and place of delivery.
CH
APTE
R 3
So
cia
l D
eve
lop
me
nt
in P
aki
sta
n,
20
02
-03
71
CHART 3.6 INFANT MORTALITY RATES BY MOTHER’SEDUCATION LEVEL
90
80
70
60
50
40
30
20
10
0No Education
89
Below Primary
80
Below Secondary
61
Secondary and above
49
Source: PIHS (2001-02)
TABLE 3.17 INCIDENCE* OF DIARRHOEA BYMOTHER’S EDUCATION (%)
Education Level Urban Rural TotalNo Schooling 13 13 13Primary 10 12 11Secondary 12 10 11Higher Secondary 9 6 9
*Proportion of children aged 5 or younger suffering from Diarrhoea in the past 30 days of thesurvey time.Source: PIHS (2001-02)
The percentage ofchildren ever
immunized or fullyimmunized
increases with thelevel of a mother's
education.
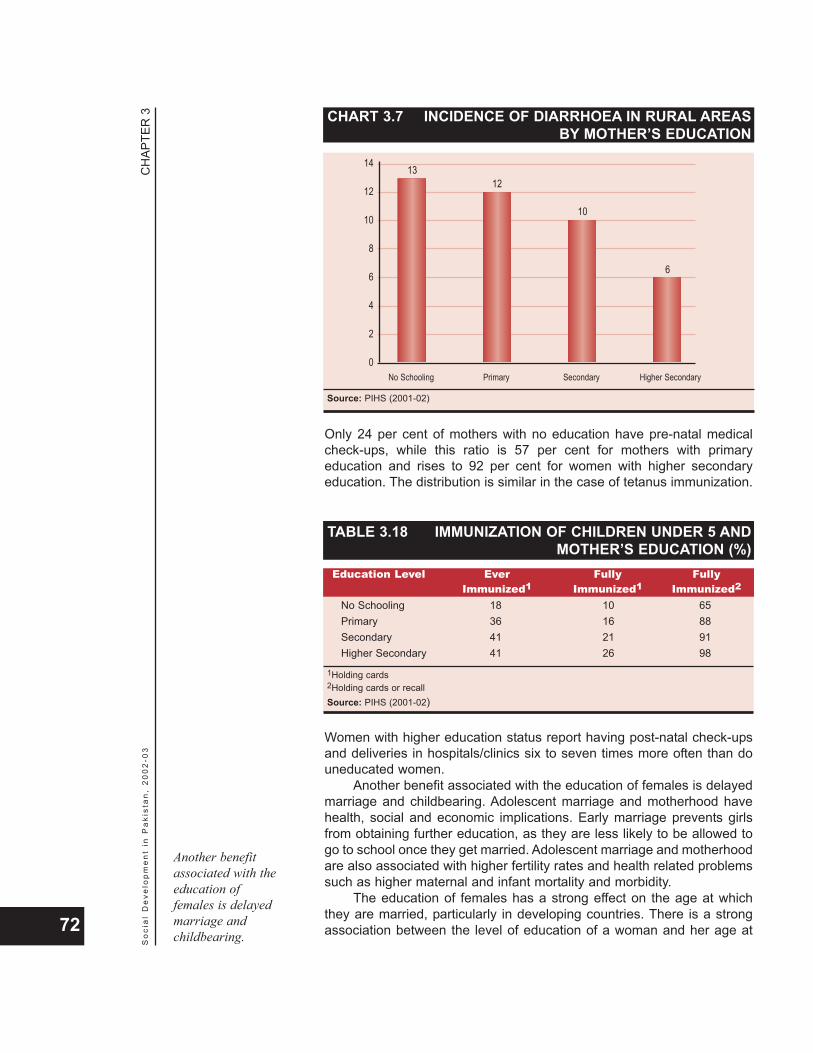
Only 24 per cent of mothers with no education have pre-natal medicalcheck-ups, while this ratio is 57 per cent for mothers with primaryeducation and rises to 92 per cent for women with higher secondaryeducation. The distribution is similar in the case of tetanus immunization.
Women with higher education status report having post-natal check-upsand deliveries in hospitals/clinics six to seven times more often than douneducated women.
Another benefit associated with the education of females is delayedmarriage and childbearing. Adolescent marriage and motherhood havehealth, social and economic implications. Early marriage prevents girlsfrom obtaining further education, as they are less likely to be allowed togo to school once they get married. Adolescent marriage and motherhoodare also associated with higher fertility rates and health related problemssuch as higher maternal and infant mortality and morbidity.
The education of females has a strong effect on the age at whichthey are married, particularly in developing countries. There is a strongassociation between the level of education of a woman and her age at
CH
APTE
R 3
So
cia
l D
eve
lop
me
nt
in P
aki
sta
n,
20
02
-03
72
CHART 3.7 INCIDENCE OF DIARRHOEA IN RURAL AREASBY MOTHER’S EDUCATION
14
12
10
8
6
4
2
0No Schooling
13
Primary
12
Secondary
10
Higher Secondary
6
Source: PIHS (2001-02)
TABLE 3.18 IMMUNIZATION OF CHILDREN UNDER 5 ANDMOTHER’S EDUCATION (%)
Education Level Ever Fully FullyImmunized1 Immunized1 Immunized2
No Schooling 18 10 65Primary 36 16 88Secondary 41 21 91Higher Secondary 41 26 98
1Holding cards2Holding cards or recallSource: PIHS (2001-02)
Another benefitassociated with theeducation offemales is delayedmarriage andchildbearing.

association between the level of education of a woman and her age atmarriage. Women who complete at least primary education tend to bemarried later than those who have had no education. Chart 3.8 comparesthe pattern of early marriage and the level of education of women inPakistan. Overall, 82 per cent of the girls who were married at age 18 orbelow had no education. The proportion of girls being married at an early
age declines as the level of education rises. Similarly, adolescentchildbearing declines with increasing education levels. Among womenaged 18 years or younger giving birth to their first child, 79 per cent hadno education, 19 per cent had primary or secondary education, and only1.5 per cent had higher secondary education.
CH
APTE
R 3
So
cia
l D
eve
lop
me
nt
in P
aki
sta
n,
20
02
-03
73
TABLE 3.19 REPRODUCTIVE HEALTH CARE BEHAVIOURAND MOTHER’S EDUCATION (%)
Education Pre-natal Post-natal Immunization Delivery atLevel Check-up Check-up (TT) Hospital/Clinic
No Schooling 24 6 29 13
Primary 57 12 56 28
Secondary 73 19 75 52
Higher Secondary 92 41 90 74
Source: PIHS (2001-02)
CHART 3.8 EDUCATION LEVEL OF WOMEN WHOMARRIED AT 18 YEARS OR BELOW (%)
90
80
70
60
50
40
30
20
10
0Urban
No Schooling
67
Primary Secondary Higher Secondary
21
93
Rural
89
92 0.3
Total
82
13
4 1
Source: PIHS (2001-02)
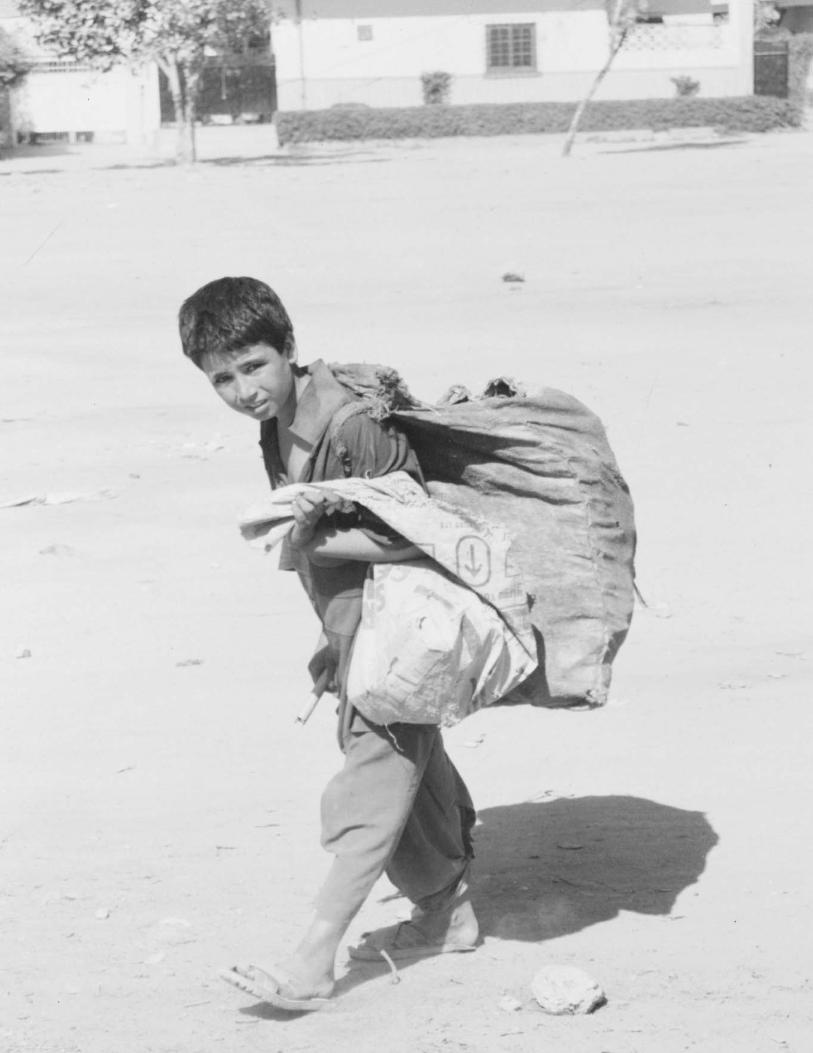
CH
APTE
R 4
So
cia
l D
eve
lop
me
nt
in P
aki
sta
n,
20
02
-03
75
4FACTORS INHIBITING
EDUCATION
“It would seem thatthe sociopolitical
milieu does notaccord sufficient
weight toeducation.”
The fact that education has failed to find its place in the matrix ofpolicy priorities and targets have remained unrealized is the resultof certain binding constraints, rooted in a number of factors at the
societal and state levels. There have certainly been consistent efforts onthe part of governments to expand education. These efforts, however,appear to be stymied by structural and policy factors such asmacroeconomic and fiscal stabilization policies, poverty, rural landinequality, weak implementation of education policies, and above all, thesociopolitical environment. The rise of income inequality and poverty hasserved to restrict access to education for the poor; unequal rural landownership has contributed to unequal access to schooling; macro-economic stabilization policy has tended to encroach on provincialfinances and compromise resource availability for education; andeducation policies have suffered from a lack of success on theimplementation front. Taken together, it would seem that the sociopoliticalmilieu does not accord sufficient weight to education.
Undoubtedly, macroeconomic stabilization has been contributing topoverty. This has been shown in a number of SPDC studies over the
last three years. This fact has now begun to be acknowledged by donorsas well as official circles. Evidence is available that the policy has alsocontributed to the problems of education by economizing on human andsocial development.
The unbridled pursuit of stabilization policies has claimed twovictims: the poor, as outlined in box 4.1, and the provinces.Consequently, financing and provision of education, health and othersocial sector services has also been directly affected, given that theseexpenditures fall in the provincial domain. Simply put, the burden offinancing the federal fiscal deficit has been steadily shifted to theprovinces. The mechanism for this process has been the increasing'provincialization' of the overall federal fiscal deficit, which has increasedthe provincial share of the containment of fiscal deficit from about 20 percent in the early 1990s to over 50 per cent in Fiscal Year (FY) 2003.
The overall, fiscal deficit is the difference between (i) total federalexpenditure and total federal revenues, and (ii) total combined provincialexpenditures and total combined provincial revenues. There are severalrevenue and expenditure entries between the federal and provincialgovernments that cancel each other out and a net deficit figure emerges.This is shown in table 4.1, which presents a comprehensive fiscal deficitbalance sheet and details of the provincial components. It shows that ifthe provincial component is removed, the fiscal deficit increases by the
CH
APTE
R 4
So
cia
l D
eve
lop
me
nt
in P
aki
sta
n,
20
02
-03
76
FACTORS INHIBITINGEDUCATION
STABILIZING THE ECONOMY, DESTABILIZINGEDUCATION
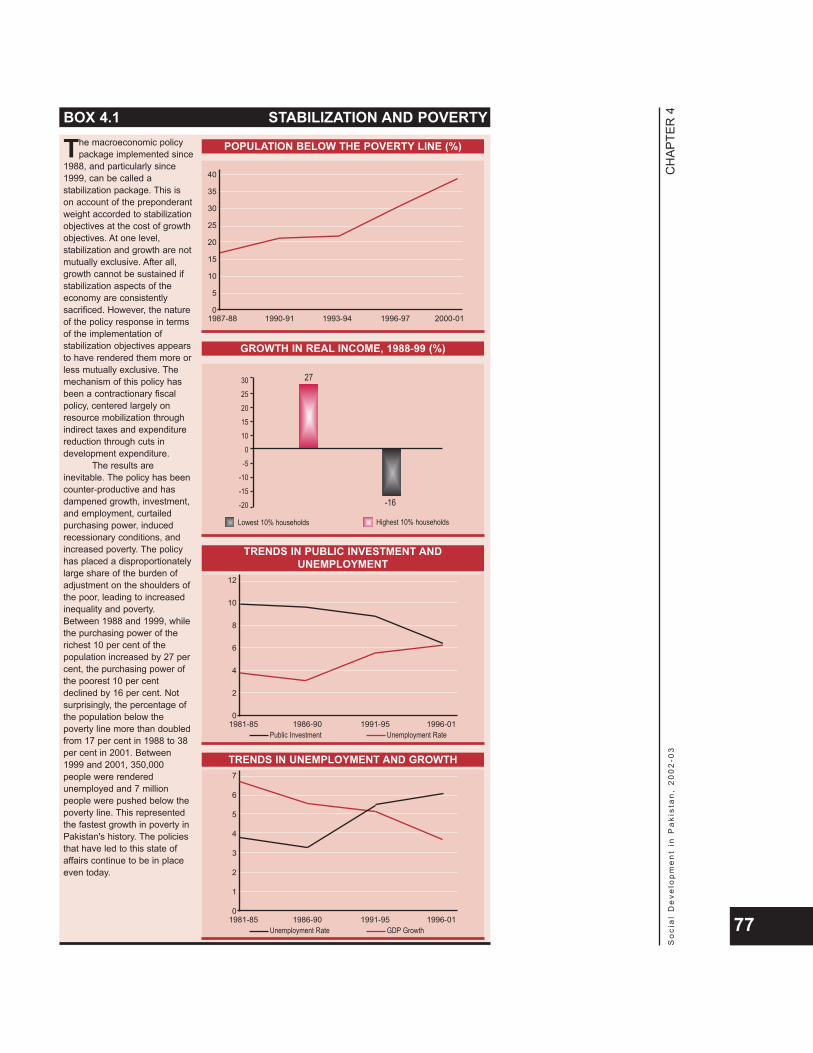
CH
APTE
R 4
So
cia
l D
eve
lop
me
nt
in P
aki
sta
n,
20
02
-03
77
BOX 4.1 STABILIZATION AND POVERTY
The macroeconomic policypackage implemented since
1988, and particularly since1999, can be called astabilization package. This ison account of the preponderantweight accorded to stabilizationobjectives at the cost of growthobjectives. At one level,stabilization and growth are notmutually exclusive. After all,growth cannot be sustained ifstabilization aspects of theeconomy are consistentlysacrificed. However, the natureof the policy response in termsof the implementation ofstabilization objectives appearsto have rendered them more orless mutually exclusive. Themechanism of this policy hasbeen a contractionary fiscalpolicy, centered largely onresource mobilization throughindirect taxes and expenditurereduction through cuts indevelopment expenditure.
The results areinevitable. The policy has beencounter-productive and hasdampened growth, investment,and employment, curtailedpurchasing power, inducedrecessionary conditions, andincreased poverty. The policyhas placed a disproportionatelylarge share of the burden ofadjustment on the shoulders ofthe poor, leading to increasedinequality and poverty.Between 1988 and 1999, whilethe purchasing power of therichest 10 per cent of thepopulation increased by 27 percent, the purchasing power ofthe poorest 10 per centdeclined by 16 per cent. Notsurprisingly, the percentage ofthe population below thepoverty line more than doubledfrom 17 per cent in 1988 to 38per cent in 2001. Between1999 and 2001, 350,000people were renderedunemployed and 7 millionpeople were pushed below thepoverty line. This representedthe fastest growth in poverty inPakistan's history. The policiesthat have led to this state ofaffairs continue to be in placeeven today.
POPULATION BELOW THE POVERTY LINE (%)
40
35
30
25
20
15
10
5
01987-88 1990-91 1993-94 1996-97 2000-01
TRENDS IN PUBLIC INVESTMENT ANDUNEMPLOYMENT
12
10
8
6
4
2
01981-85 1986-90 1991-95 1996-01
GROWTH IN REAL INCOME, 1988-99 (%)
30252015100
-5-10-15-20
Lowest 10% households
Public Investment
Highest 10% households
27
-16
Unemployment Rate
TRENDS IN UNEMPLOYMENT AND GROWTH7
6
5
4
3
2
1
01981-85 1986-90 1991-95 1996-01
Unemployment Rate GDP Growth
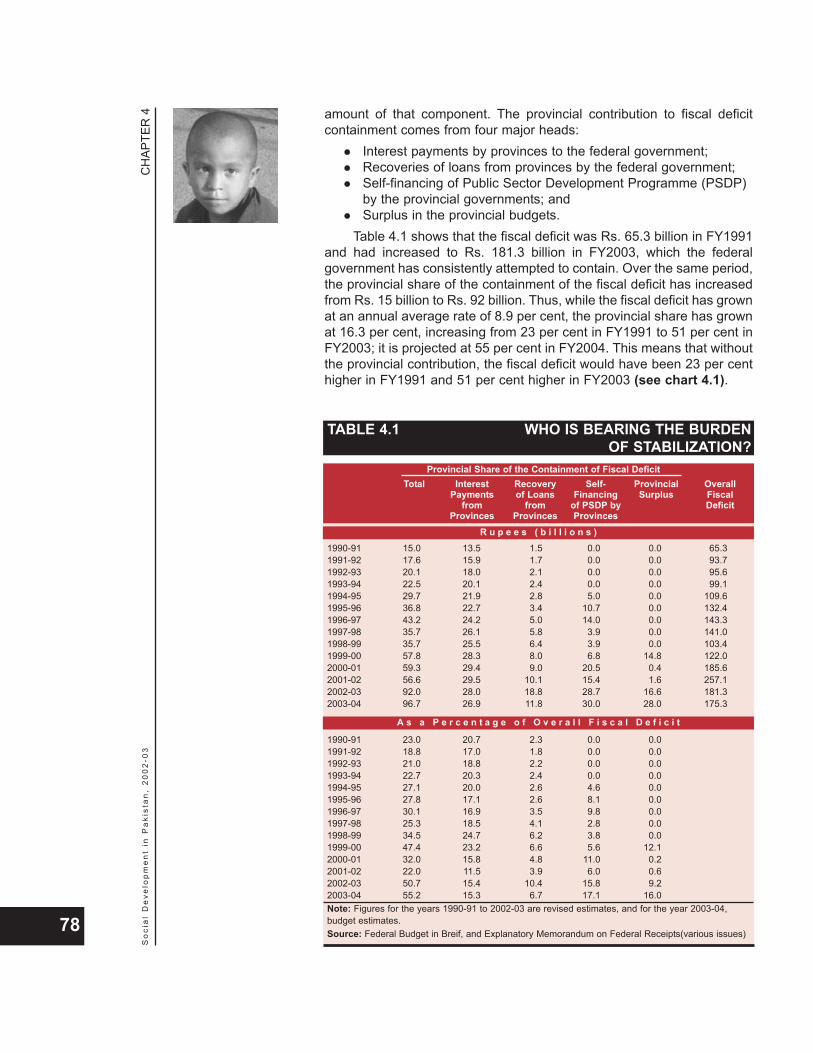
amount of that component. The provincial contribution to fiscal deficitcontainment comes from four major heads:
Interest payments by provinces to the federal government;Recoveries of loans from provinces by the federal government;Self-financing of Public Sector Development Programme (PSDP)by the provincial governments; andSurplus in the provincial budgets.
Table 4.1 shows that the fiscal deficit was Rs. 65.3 billion in FY1991and had increased to Rs. 181.3 billion in FY2003, which the federalgovernment has consistently attempted to contain. Over the same period,the provincial share of the containment of the fiscal deficit has increasedfrom Rs. 15 billion to Rs. 92 billion. Thus, while the fiscal deficit has grownat an annual average rate of 8.9 per cent, the provincial share has grownat 16.3 per cent, increasing from 23 per cent in FY1991 to 51 per cent inFY2003; it is projected at 55 per cent in FY2004. This means that withoutthe provincial contribution, the fiscal deficit would have been 23 per centhigher in FY1991 and 51 per cent higher in FY2003 (see chart 4.1).
CH
APTE
R 4
So
cia
l D
eve
lop
me
nt
in P
aki
sta
n,
20
02
-03
78
TABLE 4.1 WHO IS BEARING THE BURDENOF STABILIZATION?
Provincial Share of the Containment of Fiscal DeficitTotal Interest Recovery Self- Provincial Overall
Payments of Loans Financing Surplus Fiscalfrom from of PSDP by Deficit
Provinces Provinces Provinces
1990-91 15.0 13.5 1.5 0.0 0.0 65.31991-92 17.6 15.9 1.7 0.0 0.0 93.71992-93 20.1 18.0 2.1 0.0 0.0 95.61993-94 22.5 20.1 2.4 0.0 0.0 99.11994-95 29.7 21.9 2.8 5.0 0.0 109.61995-96 36.8 22.7 3.4 10.7 0.0 132.41996-97 43.2 24.2 5.0 14.0 0.0 143.31997-98 35.7 26.1 5.8 3.9 0.0 141.01998-99 35.7 25.5 6.4 3.9 0.0 103.41999-00 57.8 28.3 8.0 6.8 14.8 122.02000-01 59.3 29.4 9.0 20.5 0.4 185.62001-02 56.6 29.5 10.1 15.4 1.6 257.12002-03 92.0 28.0 18.8 28.7 16.6 181.32003-04 96.7 26.9 11.8 30.0 28.0 175.3
1990-91 23.0 20.7 2.3 0.0 0.01991-92 18.8 17.0 1.8 0.0 0.01992-93 21.0 18.8 2.2 0.0 0.01993-94 22.7 20.3 2.4 0.0 0.01994-95 27.1 20.0 2.6 4.6 0.01995-96 27.8 17.1 2.6 8.1 0.01996-97 30.1 16.9 3.5 9.8 0.01997-98 25.3 18.5 4.1 2.8 0.01998-99 34.5 24.7 6.2 3.8 0.01999-00 47.4 23.2 6.6 5.6 12.12000-01 32.0 15.8 4.8 11.0 0.22001-02 22.0 11.5 3.9 6.0 0.62002-03 50.7 15.4 10.4 15.8 9.22003-04 55.2 15.3 6.7 17.1 16.0Note: Figures for the years 1990-91 to 2002-03 are revised estimates, and for the year 2003-04,budget estimates.Source: Federal Budget in Breif, and Explanatory Memorandum on Federal Receipts(various issues)
R u p e e s ( b i l l i o n s )
A s a P e r c e n t a g e o f O v e r a l l F i s c a l D e f i c i t
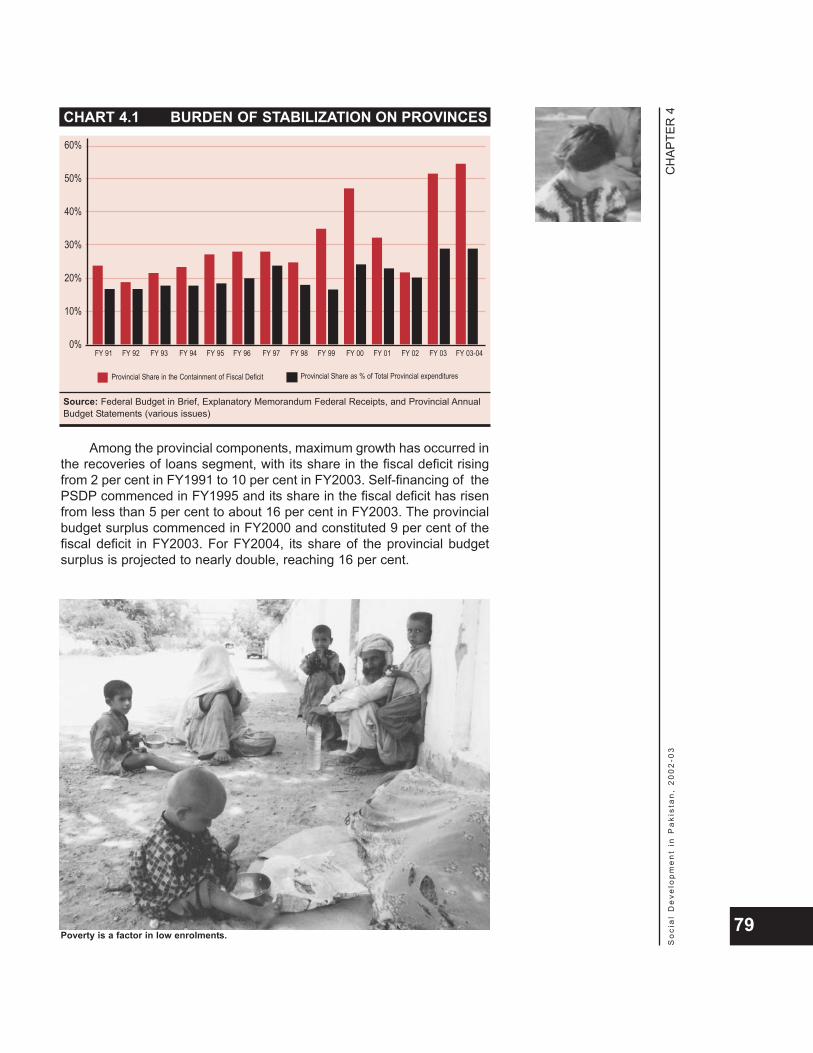
Among the provincial components, maximum growth has occurred inthe recoveries of loans segment, with its share in the fiscal deficit risingfrom 2 per cent in FY1991 to 10 per cent in FY2003. Self-financing of thePSDP commenced in FY1995 and its share in the fiscal deficit has risenfrom less than 5 per cent to about 16 per cent in FY2003. The provincialbudget surplus commenced in FY2000 and constituted 9 per cent of thefiscal deficit in FY2003. For FY2004, its share of the provincial budgetsurplus is projected to nearly double, reaching 16 per cent.
CH
APTE
R 4
So
cia
l D
eve
lop
me
nt
in P
aki
sta
n,
20
02
-03
79
CHART 4.1 BURDEN OF STABILIZATION ON PROVINCES
60%
50%
40%
30%
20%
10%
0%FY 91 FY 92 FY 93 FY 94 FY 95 FY 96 FY 97 FY 98 FY 99 FY 00 FY 01 FY 02 FY 03 FY 03-04
Provincial Share in the Containment of Fiscal Deficit Provincial Share as % of Total Provincial expenditures
Source: Federal Budget in Brief, Explanatory Memorandum Federal Receipts, and Provincial AnnualBudget Statements (various issues)
Poverty is a factor in low enrolments.
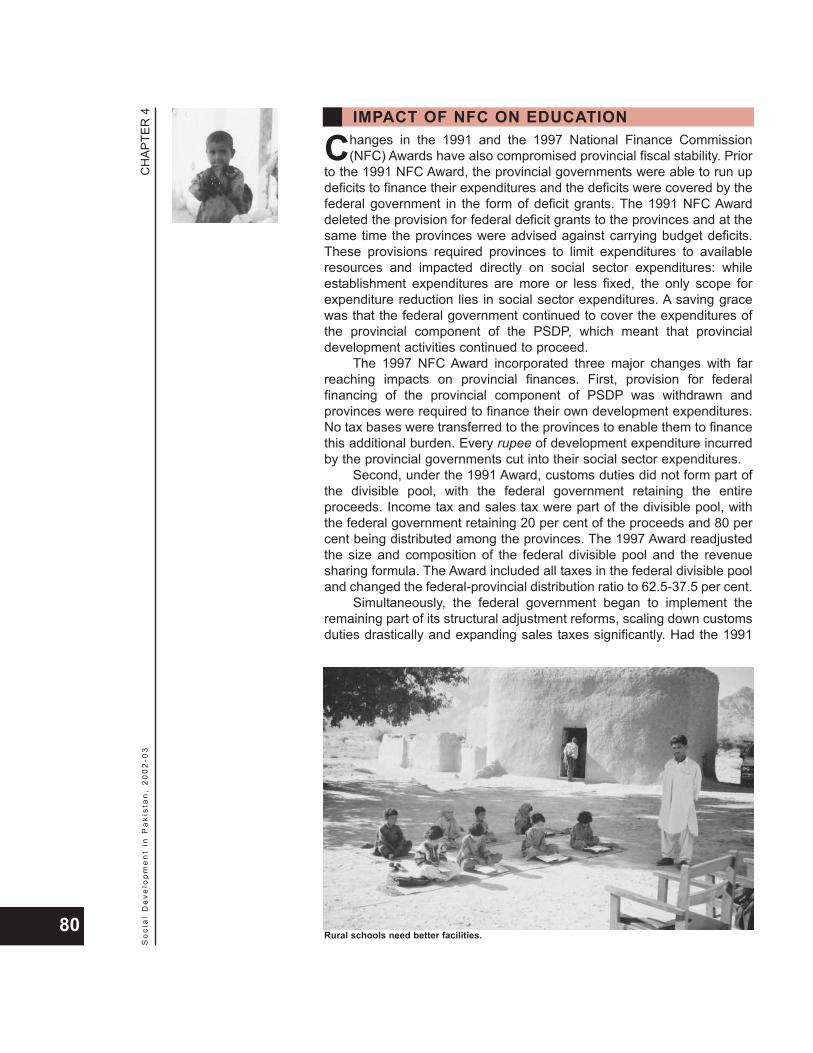
Changes in the 1991 and the 1997 National Finance Commission(NFC) Awards have also compromised provincial fiscal stability. Prior
to the 1991 NFC Award, the provincial governments were able to run updeficits to finance their expenditures and the deficits were covered by thefederal government in the form of deficit grants. The 1991 NFC Awarddeleted the provision for federal deficit grants to the provinces and at thesame time the provinces were advised against carrying budget deficits.These provisions required provinces to limit expenditures to availableresources and impacted directly on social sector expenditures: whileestablishment expenditures are more or less fixed, the only scope forexpenditure reduction lies in social sector expenditures. A saving gracewas that the federal government continued to cover the expenditures ofthe provincial component of the PSDP, which meant that provincialdevelopment activities continued to proceed.
The 1997 NFC Award incorporated three major changes with farreaching impacts on provincial finances. First, provision for federalfinancing of the provincial component of PSDP was withdrawn andprovinces were required to finance their own development expenditures.No tax bases were transferred to the provinces to enable them to financethis additional burden. Every rupee of development expenditure incurredby the provincial governments cut into their social sector expenditures.
Second, under the 1991 Award, customs duties did not form part ofthe divisible pool, with the federal government retaining the entireproceeds. Income tax and sales tax were part of the divisible pool, withthe federal government retaining 20 per cent of the proceeds and 80 percent being distributed among the provinces. The 1997 Award readjustedthe size and composition of the federal divisible pool and the revenuesharing formula. The Award included all taxes in the federal divisible pooland changed the federal-provincial distribution ratio to 62.5-37.5 per cent.
Simultaneously, the federal government began to implement theremaining part of its structural adjustment reforms, scaling down customsduties drastically and expanding sales taxes significantly. Had the 1991
CH
APTE
R 4
So
cia
l D
eve
lop
me
nt
in P
aki
sta
n,
20
02
-03
80Rural schools need better facilities.
IMPACT OF NFC ON EDUCATION
Award distribution arrangement continued, the provinces would haveborne no burden of the decline in customs duty revenues and would haveaccrued 80 per cent of the additional revenues from sales taxes. Underthe 1997 Award, the federal government shifted one-third of the loss fromcustoms duties to the provinces and increased its share of the largersales tax revenues by over 60 per cent. Viewed from the provincialperspective, the provinces had to bear one-third of the burden ofreduction in customs duties revenues and accrued only one-third of theadditional sales tax revenues.
Third, in view of the reduced provincial receipts from the federal pooland the additional PSDP expenditure burden on the provinces, provincialgovernments were allowed to take loans from the federal government tofinance their deficits. However, the federal government retained apremium on the interest rate charged. In other words, the federalgovernment borrowed money at lower rates and lent it to provincialgovernments at higher rates. In most cases, this premium was significant.
Over the years, these developments have shrunk the fiscal space forthe provinces, leaving little to spend on the provision of social services.The provincial share of financing the federal fiscal deficit, as a percentageof total provincial expenditures, has risen from 17 per cent in FY1991 to29 per cent in FY2003 (see table 4.2). The transfer of provincialresources to the federal treasury has increased from Rs. 87 billion inFY1991 to Rs. 318 billion in FY2003. Had the provinces not beenburdened with the responsibility of sharing the federal fiscal deficit, theywould have had Rs. 92 billion, or 29 per cent, more at their disposal inFY2003.
CH
APTE
R 4
So
cia
l D
eve
lop
me
nt
in P
aki
sta
n,
20
02
-03
81
TABLE 4.2 BURDEN OF FISCAL DEFICIT ON PROVINCES(Rs. in billion)
Years Provincial Total ProvincialShare of Provincial Share as % of
Containment Expenditure Total Provincialof Fiscal Deficit Expenditure
1990-91 15.0 86.5 17.31991-92 17.6 103.4 17.01992-93 20.1 114.0 17.61993-94 22.5 124.1 18.11994-95 29.7 155.6 19.11995-96 36.8 185.0 19.91996-97 43.2 182.2 23.71997-98 35.7 197.9 18.01998-99 35.7 208.9 17.11999-00 57.8 243.9 23.72000-01 59.3 259.3 22.92001-02 56.6 283.8 19.92002-03 92.0 318.2 28.92003-04 96.7 337.2 28.7
Note: Figures for the years 1990-91 to 2002-03 are revised estimates, and for the year 2003-04,budget estimates.
Source: Federal Budget in Breif, Explanatory Memorandum on Federal Receipts, and ProvincialAnnual Budget Statements (various issues)

The impact of the NFC Award on provincial finances can be seen from thetrends in expenditures on education. Education expenditure data for allthe provinces combined have been organized along four time periods:1975-85, 1986-89, 1990-96, and 1997-2002. The rationale for the timeperiods is determined by four events: the 1974 NFC Award, the launchingof the Five Point Programme1 in FY1986, the 1991 NFC Award, and the1997 NFC Award. As such, 1975-85 represents the pre-Five PointProgramme period; 1986-89 represents the post-Five Point Programmeand pre-1990 NFC Award period; 1990-96 represents the period underthe 1991 NFC Award; and 1997-2002 represents the period under the1997 NFC Award.
The trends in annual average growth rates in real educationexpenditures for the four provinces combined, presented in tables 4.3and 4.4, show that growth in expenditures for all levels of educationpeaked across the board _ for recurring and development expenditureand for all levels of education _ from 1986 to 1989, ranging from 9 percent in tertiary education to 17 per cent in development expenditure. Bycontrast, there were declines across the board during the 1990-96 period,and growth collapsed from 1997 to 2002, registering declines in a numberof cases. During the 1997-2002 period, real recurring expenditure oneducation increased by only 1 per cent, while real developmentexpenditure declined by 11 per cent. In primary and secondary education,growth was reduced from about 8 per cent during the 1990-96 period toless than 2 per cent for primary education and less than 1 per cent forsecondary education.
CH
APTE
R 4
So
cia
l D
eve
lop
me
nt
in P
aki
sta
n,
20
02
-03
821The Five Point Programme, launched in FY1986, was the first concerted effort to overcome social sectordeficiencies, including those in education, and led to significantly enhanced fiscal allocations for designatedsectors. The Programme was effectively abandoned in FY1988.
TABLE 4.3 AVERAGE GROWTH IN REAL EXPENDITURE ON EDUCATION (%)
Years Total Real Real Development Real RecurringExpenditure Expenditure Expenditure
1975-85 9.95 11.89 9.981986-89 11.81 17.01 11.731990-96 5.91 4.79 6.651997-02 -0.90 -10.83 0.56
Source: Federal Budget in Brief and Provincial Annual Budget Statements (various issues)
TABLE 4.4 AVERAGE GROWTH IN RECURRINGEXPENDITURE BY EDUCATION LEVEL (%)
Years Primary Secondary Tertiary1975-85 7.78 10.85 8.991986-89 14.80 12.43 9.101990-96 8.44 8.10 4.431997-02 1.61 0.60 -2.57
Source: Provincial Demands for Grants Current Expenditure (various issues)
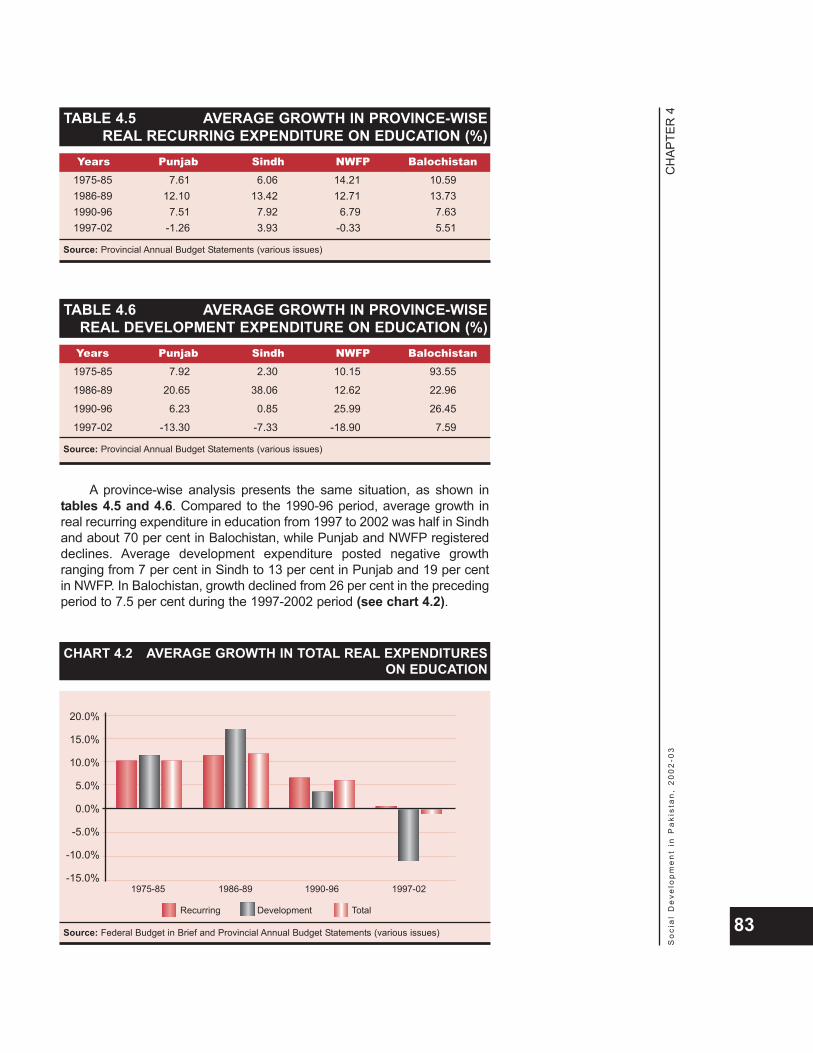
A province-wise analysis presents the same situation, as shown intables 4.5 and 4.6. Compared to the 1990-96 period, average growth inreal recurring expenditure in education from 1997 to 2002 was half in Sindhand about 70 per cent in Balochistan, while Punjab and NWFP registereddeclines. Average development expenditure posted negative growthranging from 7 per cent in Sindh to 13 per cent in Punjab and 19 per centin NWFP. In Balochistan, growth declined from 26 per cent in the precedingperiod to 7.5 per cent during the 1997-2002 period (see chart 4.2).
CH
APTE
R 4
So
cia
l D
eve
lop
me
nt
in P
aki
sta
n,
20
02
-03
83
TABLE 4.5 AVERAGE GROWTH IN PROVINCE-WISEREAL RECURRING EXPENDITURE ON EDUCATION (%)
Years Punjab Sindh NWFP Balochistan1975-85 7.61 6.06 14.21 10.591986-89 12.10 13.42 12.71 13.731990-96 7.51 7.92 6.79 7.631997-02 -1.26 3.93 -0.33 5.51
Source: Provincial Annual Budget Statements (various issues)
TABLE 4.6 AVERAGE GROWTH IN PROVINCE-WISEREAL DEVELOPMENT EXPENDITURE ON EDUCATION (%)
Years Punjab Sindh NWFP Balochistan1975-85 7.92 2.30 10.15 93.55
1986-89 20.65 38.06 12.62 22.96
1990-96 6.23 0.85 25.99 26.45
1997-02 -13.30 -7.33 -18.90 7.59
Source: Provincial Annual Budget Statements (various issues)
CHART 4.2 AVERAGE GROWTH IN TOTAL REAL EXPENDITURESON EDUCATION
Source: Federal Budget in Brief and Provincial Annual Budget Statements (various issues)
20.0%
15.0%
10.0%
5.0%
0.0%
-5.0%
-10.0%
-15.0%1975-85 1986-89 1990-96 1997-02
Recurring Development Total
Different provinces responded in their own way to the resourcecrunch (see table 4.7). Punjab failed to protect its educationexpenditures, registering declines in primary, secondary and tertiaryeducation. Sindh protected primary and secondary education at theexpense of tertiary education. NWFP curtailed expenditures across theboard, with the maximum burden being placed on tertiary education.Balochistan protected primary education, allowing expenditure onsecondary and tertiary education to fall. This decline in educationexpenditure growth adversely affected growth in enrolment, with primaryenrolment growth declining steadily since 1986-89 and secondary andtertiary enrolment growth collapsing to 2 per cent and less than 2 percent, respectively (see table 4.8).
It appears that the thrust of macroeconomic policy, with its excessivestress on stabilization objectives, has seriously compromised thecapacity of the provincial governments to invest in education. Clearly, achange of direction is in order. It is imperative that macroeconomic policynot contradict the objectives of social and economic growth.
CH
APTE
R 4
So
cia
l D
eve
lop
me
nt
in P
aki
sta
n,
20
02
-03
84
TABLE 4.7 AVERAGE GROWTH IN PROVINCE-WISE REALRECURRING EXPENDITURE BY LEVEL OF EDUCATION (%) Years Punjab Sindh NWFP Balochistan
Pr imar y Educat ion
Secondar y Educat ion
1975-85 7.26 6.34 13.15 12.111986-89 13.12 16.29 19.54 19.251990-96 9.82 8.21 6.21 5.301997-02 -0.89 7.91 1.55 5.52
1975-85 10.81 8.26 15.60 13.121986-89 13.18 13.07 10.52 12.351990-96 6.51 9.59 9.46 16.921997-02 -2.09 12.54 2.47 7.03
Ter t iar y Educat ion1975-85 8.73 8.08 14.3 11.91986-89 9.07 7.65 12.46 14.101990-96 3.46 4.59 9.25 8.551997-02 -1.21 -0.56 -8.00 3.18
Source: Provincial Demands for Grants Current Expenditure (various issues)
TABLE 4.8 AVERAGE GROWTH IN LEVEL-WISEGROSS ENROLMENT (%)
Years Primary Secondary Tertiary
1975-85 3.38 4.55 5.781986-89 8.01 7.12 6.481990-96 6.83 6.85 5.921997-02 5.10 2.07 1.84
Source: Economic Survey (various issues)
While the contraction of resources for education constitutes a supply-side constraint, poverty constitutes a demand-side constraint. The
contribution of macroeconomic and fiscal stabilization policies toincreasing poverty has been referred to earlier in the chapter. It is,however, important to examine the contribution of poverty in restrictingschool enrolment. Tables 4.9 to 4.11 highlight this relationship.
Table 4.9 documents the reasons for not attending school.Interestingly, the result is significantly gender-specific, with differencesbetween provinces as well. The single largest reason for boys, 40 per cent,is that education is too expensive. This reason is cited by fewerrespondents in NWFP and Balochistan because of the high share of 'other'reasons, which have not been specified. Table 4.10 shows a progressiveincrease in boys’ and girls’ school enrolment rates with the increase inincome level. The enrolment ratio for boys in the highest income quintile is
more than twice that of boys in the lowest quintile. The ratio for girls isthree times as much. Similarly table 4.11 shows a progressive increase intotal annual household expenditure on education with an increase inincome level; moreover, expenditure in the highest quintile households isabout four and a half times higher than in the lowest quintile.
CH
APTE
R 4
So
cia
l D
eve
lop
me
nt
in P
aki
sta
n,
20
02
-03
85
TABLE 4.9 REASONS FOR NEVER ATTENDING SCHOOLSFOR CHILDREN AGED 10 - 18 (%)
Pakistan Punjab Sindh NWFP BalochistanBoys Girls Boys Girls Boys Girls Boys Girls Boys Girls
Parents didn’t allow 3 36 3 33 0 30 8 48 6 55
Too expensive 40 26 42 35 42 17 35 20 28 9
Too far (distance) 8 14 5 12 11 20 3 11 19 9
Had to help atwork/home 7 7 8 6 4 7 8 4 5 12
Child not willing 29 7 26 5 33 9 28 8 22 2
Others 13 10 16 9 10 17 18 9 20 13
Source: PIHS (2002)
TABLE 4.10 SCHOOL ENROLMENT RATES BYINCOME GROUPS
Income Net Enrolment Ratio Ratio ofQuintile Boys Girls Girls to Boys
1 21.0 13.9 60.92 27.2 20.4 70.23 31.6 23.4 67.34 35.9 31.8 82.75 45.1 44.7 89.4
Source: PIHS (2002)
POVERTY AND EDUCATION

The result for girls is significantly different. The principal reason fornot attending school is parental permission. This stands at 36 per cent,well above all the other factors affecting attendance. The exception is inPunjab, where poverty and parental permission are accorded more orless equal weight. About half the girls in NWFP and Balochistan arerecorded as not attending school because of parental permission. Incomewise, while the ratio of girls’ to boys’ enrolment does increase withincome, it is notable that within no income quintile does expenditure oneducation of girls exceed that of boys. The statistics point to serioussociological problems in the way of promoting education and arediscussed in further detail later in the chapter.
To return to the question of poverty, being poor is not a randomoccurrence. There are distinct demographic, social and economic factorsthat create unequal distribution of income or force a household into a
CH
APTE
R 4
So
cia
l D
eve
lop
me
nt
in P
aki
sta
n,
20
02
-03
86
BASEa
Employment
Education
Transfers
FamilySupport
Assets
URBAN
-9
-9
-11
-12
-45
100 75 50 25 0
100
55
Incidence of Poverty
43
32
22
13
Assets
Employment
Transfers
Education
FamilySupport
RURAL
Probability of Being Poor (%)
-1
-8
-15
-18
-55
100 75 50 25 0
100
45
Incidence of Poverty
27
12
4
3
BASEa
aThe head of the household is illiterate and unemployed, receives neither transfers nor assets, and has no familysupportSource: Social Development in Pakistan: Annual Review, 2000
BOX 4.2 THE LADDER OF POVERTY REDUCTION
TABLE 4.11 HOUSEHOLD ANNUAL EXPENDITURE ONEDUCATION BY INCOME GROUPS
(Rs. per pupil)Income Boys Girls Ratio ofQuintile Girls to Boys
1 954 851 0.89
2 1140 1052 0.92
3 1393 1315 0.94
4 1831 1745 0.95
5 4367 3877 0.89
Source: PIHS (2002)

state of poverty. To a substantial extent, poverty is a product of unequaldistribution of assets and income. Box 4.2 identifies the factors thatdetermine the probability of being poor in urban and rural areas. Theprincipal factor in urban areas is shown to be employment, which canreduce urban poverty by as much as 45 per cent. The principal factor inrural areas is shown to be asset redistribution, which can reduce ruralpoverty by as much as 55 per cent.
Land inequality is not only shown to be a principal factor in poverty, butis also a major factor in education inequality, which in turn sustains
poverty. This is highlighted by an empirical analysis of the relationshipbetween land and education inequality. The former is measured on thebasis of available farm size data and the latter is represented by ameasure of School Life Expectancy (SLE) of students 5-24 years of age(see box 3.4 in earlier chapter for methodology of constructing SLE andbox 4.3 for regression results of land inequality and schooling). Theanalysis shows that districts with high land inequality report low rural SLE.
CH
APTE
R 4
So
cia
l D
eve
lop
me
nt
in P
aki
sta
n,
20
02
-03
87
BOX 4.3 LAND INEQUALITY AND SCHOOLING
SLE is considered a key primary determinantof human capital formation through formal
schooling. The impact of land concentration onschooling is then estimated by regressing SLEagainst developmental and land concentrationvariables. The specific equation is given belowwith µ, which is a standard stochastic term of themodel.
SLEi = α + βi (DDI)i + β2 (Gini)i + β3 (T)i +β4 (Nl)i + β5 (SP)i + µi
where, DDI is the level of district economicdevelopment, Gini is the index of land
ownership, T is the proportion of tenanthouseholds, and Nl is the proportion ofhouseholds with no access to land. A dummyvariable (SP), which takes the value of 1 fordistricts of southern Punjab and 0 otherwise, isalso included. The inclusion of the dummyvariable is supported by the fact that districts ofsouthern Punjab are in sharp contrast to otherareas of the province in terms of a higherconcentration of land ownership and a strongerpolitical presence of powerful landowners. Theregression results for males, females and overallare given below.
REGRESSION RESULTS FOR RURAL PUNJABRural Overall Rural Male Rural Female
Variables Coefficients t-Statistic Coefficients t-Statistic Coefficients t-StatisticIndex of Economic Development (%) 0.04 1.87* 0.03 1.09 0.05 2.23*
Gini - Land Ownership (%) -0.12 -1.74* -0.10 -1.78* -0.17 -2.35*
Tenant Households (%) -0.19 -2.10* -0.16 -1.79* -0.24 -2.53*
No Access to Land (%) -0.06 -1.71* -0.05 -1.52 -0.07 -1.94*
Dummy for South Punjab -1.17 -1.87* -1.20 -2.11* -1.00 -1.52
(Constant) 16.05 3.41* 15.73 4.63* 18.10 3.66*
R-squared 0.46 0.39 0.53
F-statistic 4.84 3.55 6.30
Probability (F-statistic) 0.00 0.01 0.00
Note: *Coefficients are statistically significant at least at the 10% level
Source: SPDC estimates based on Population and Housing Census (1998) and Agriculture Census (2000)
LAND INEQUALITY AND SCHOOLING
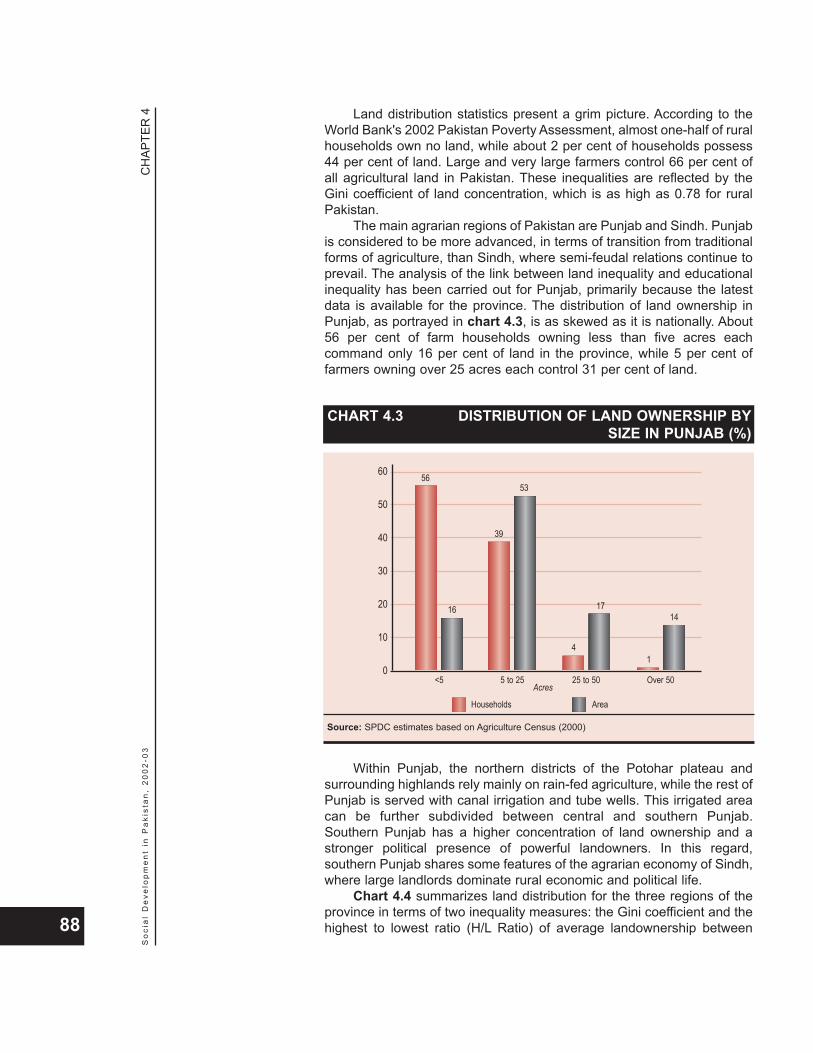
Land distribution statistics present a grim picture. According to theWorld Bank's 2002 Pakistan Poverty Assessment, almost one-half of ruralhouseholds own no land, while about 2 per cent of households possess44 per cent of land. Large and very large farmers control 66 per cent ofall agricultural land in Pakistan. These inequalities are reflected by theGini coefficient of land concentration, which is as high as 0.78 for ruralPakistan.
The main agrarian regions of Pakistan are Punjab and Sindh. Punjabis considered to be more advanced, in terms of transition from traditionalforms of agriculture, than Sindh, where semi-feudal relations continue toprevail. The analysis of the link between land inequality and educationalinequality has been carried out for Punjab, primarily because the latestdata is available for the province. The distribution of land ownership inPunjab, as portrayed in chart 4.3, is as skewed as it is nationally. About56 per cent of farm households owning less than five acres eachcommand only 16 per cent of land in the province, while 5 per cent offarmers owning over 25 acres each control 31 per cent of land.
Within Punjab, the northern districts of the Potohar plateau andsurrounding highlands rely mainly on rain-fed agriculture, while the rest ofPunjab is served with canal irrigation and tube wells. This irrigated areacan be further subdivided between central and southern Punjab.Southern Punjab has a higher concentration of land ownership and astronger political presence of powerful landowners. In this regard,southern Punjab shares some features of the agrarian economy of Sindh,where large landlords dominate rural economic and political life.
Chart 4.4 summarizes land distribution for the three regions of theprovince in terms of two inequality measures: the Gini coefficient and thehighest to lowest ratio (H/L Ratio) of average landownership between
CH
APTE
R 4
So
cia
l D
eve
lop
me
nt
in P
aki
sta
n,
20
02
-03
88
CHART 4.3 DISTRIBUTION OF LAND OWNERSHIP BYSIZE IN PUNJAB (%)
60
50
40
30
20
10
0<5 5 to 25 25 to 50 Over 50
Households
Acres
56
16
39
53
4
17
1
14
Area
Source: SPDC estimates based on Agriculture Census (2000)

small farmers (defined as farmers with less than five acres) and largefarmers (defined as farmers with over 100 acres). Except for threedistricts in central Punjab _ Faisalabad, Lahore and Toba Tek Singh _ thevalue of the Gini coefficient for all districts is more than 50 per cent,indicating a considerable extent of land inequality. The lowest inequalityappears in central Punjab and the highest in northern Punjab. However,the maximum Gini coefficient of 67 per cent is computed for Muzaffargarhin southern Punjab, implying that the distribution of land is the mostunequal in that district.
Northern Punjab deserves to be mentioned separately from thecentral and southern irrigated regions. This is because, despite a higher
CH
APTE
R 4
So
cia
l D
eve
lop
me
nt
in P
aki
sta
n,
20
02
-03
89
CHART 4.4 INEQUALITY IN LAND OWNERSHIPIN PUNJAB BY REGION (%)
60
50
40
30
20
10
0Northern Punjab Central Punjab Southern Punjab
FarmsAcres
47.0
51.7
40.0 38.5
44.046.5
Area
Source: SPDC estimates based on Agriculture Census (2000)
Private schools are increasing their share of enrolment.

degree of land inequality, northern Punjab reports a higher SLE as well.For instance, the rural SLE for northern Punjab is 6.7 as compared to 4.9for southern Punjab. Similarly, the rural literacy rate of northern Punjab issignificantly higher by over 20 per cent than that of southern Punjab. Thiscould be due to the barani nature of agriculture, in which land in theregion does not command the same premium as in irrigated areas andmay not be a focus for the emergence of a feudal class. Lowerproductivity and the absence of sufficient opportunities in agriculture, onaccount of the adverse 'land-man' ratio, also compels the regional labourforce to opt for employment in services, particularly in the armed forces.Given that employment in the services sector requires some degree ofliteracy and numeric ability and that employment in the armed forcescarries minimum educational requirements, these factors may haveinduced greater access to education.
The comparison of the two irrigated regions in central and southernPunjab, as presented in table 4.12, clearly shows the inverse relationshipbetween land inequality and education. Inequality measures are higher insouthern Punjab relative to central Punjab. The Gini coefficient for land insouthern Punjab is 44 per cent as against 40 per cent in central Punjab.
The corresponding Gini coefficient for education is also higher at 16 percent for southern Punjab compared to 12 per cent for central Punjab. Therural SLE and literacy rates for southern Punjab are 5 and 24 per cent,respectively, compared to 7 and 29 per cent in central Punjab.
A more formal examination of the impact of patterns of landownership on the SLE of students of 5-24 years of age has been carriedout through regression analysis and shows the link between land andeducation inequality. The regression equation measures SLE as afunction of the District Development Index (DDI), Gini coefficient of landownership, proportion of tenant households, and proportion ofhouseholds with no access to land.
The results of regression analysis, summarized in table 4.13, showthat school life expectancy is positively related to level of development,but negatively to land inequality, proportion of tenant households andproportion of households with no access to land. It is shown that SLE incentral Punjab is higher at 6.9 compared to 5.0 in southern Punjab. Table4.13 shows that, holding district development constant, a 10 percentage-point decrease in land inequality index leads to an increase of 1.2 yearsin SLE. Similarly, a 10 point decrease in tenancy is associated with an
CH
APTE
R 4
So
cia
l D
eve
lop
me
nt
in P
aki
sta
n,
20
02
-03
90
TABLE 4.12 PATTERN OF LAND AND EDUCATIONINEQUALITY IN PUNJAB
Gini (%)
Regions Land Education
Northern Punjab 47 18
Central Punjab 40 12
Southern Punjab 44 16
Sources: SPDC estimates based on Population and Housing Census (1998)Agriculture Census (2000)
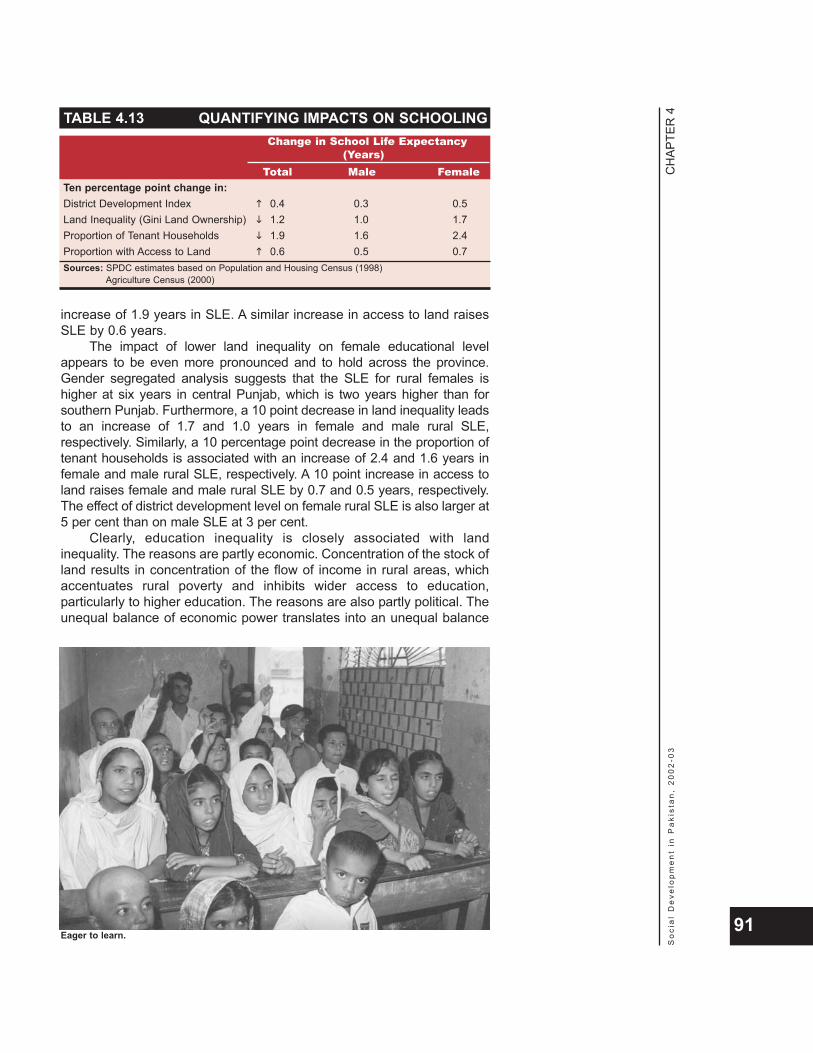
increase of 1.9 years in SLE. A similar increase in access to land raisesSLE by 0.6 years.
The impact of lower land inequality on female educational levelappears to be even more pronounced and to hold across the province.Gender segregated analysis suggests that the SLE for rural females ishigher at six years in central Punjab, which is two years higher than forsouthern Punjab. Furthermore, a 10 point decrease in land inequality leadsto an increase of 1.7 and 1.0 years in female and male rural SLE,respectively. Similarly, a 10 percentage point decrease in the proportion oftenant households is associated with an increase of 2.4 and 1.6 years infemale and male rural SLE, respectively. A 10 point increase in access toland raises female and male rural SLE by 0.7 and 0.5 years, respectively.The effect of district development level on female rural SLE is also larger at5 per cent than on male SLE at 3 per cent.
Clearly, education inequality is closely associated with landinequality. The reasons are partly economic. Concentration of the stock ofland results in concentration of the flow of income in rural areas, whichaccentuates rural poverty and inhibits wider access to education,particularly to higher education. The reasons are also partly political. Theunequal balance of economic power translates into an unequal balance
CH
APTE
R 4
So
cia
l D
eve
lop
me
nt
in P
aki
sta
n,
20
02
-03
91
TABLE 4.13 QUANTIFYING IMPACTS ON SCHOOLINGChange in School Life Expectancy
(Years)Total Male Female
Ten percentage point change in:District Development Index 0.4 0.3 0.5Land Inequality (Gini Land Ownership) 1.2 1.0 1.7Proportion of Tenant Households 1.9 1.6 2.4Proportion with Access to Land 0.6 0.5 0.7Sources: SPDC estimates based on Population and Housing Census (1998)
Agriculture Census (2000)
Eager to learn.
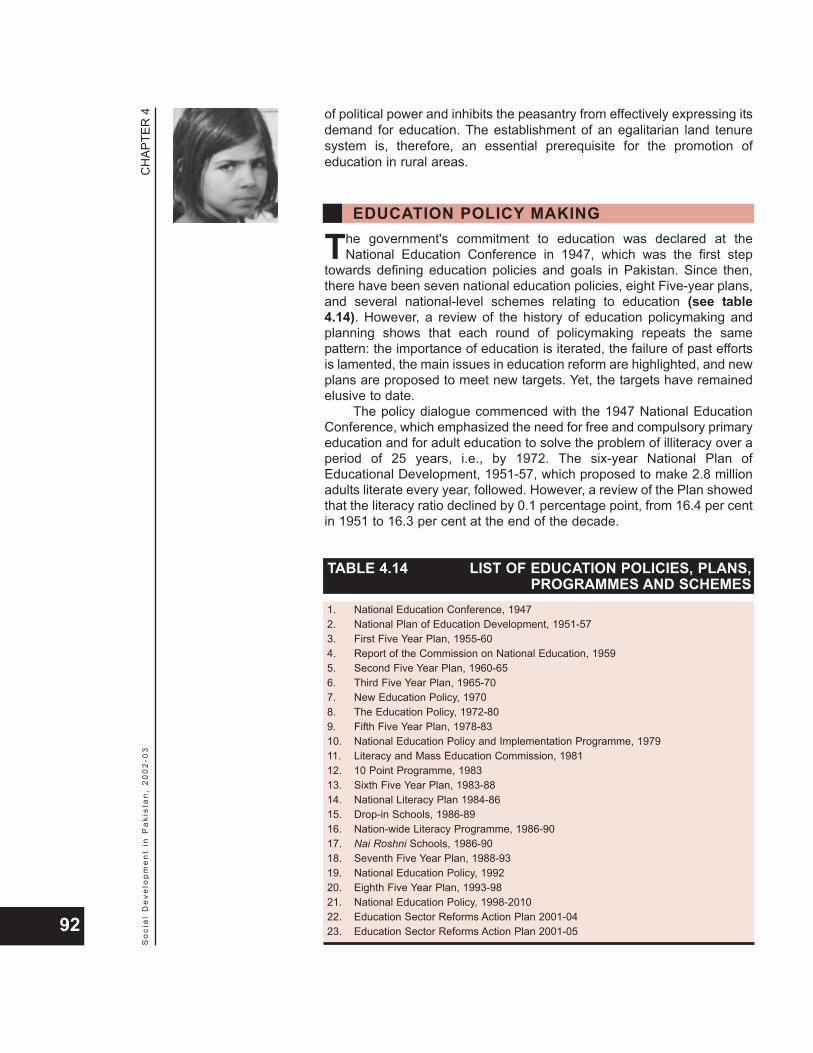
of political power and inhibits the peasantry from effectively expressing itsdemand for education. The establishment of an egalitarian land tenuresystem is, therefore, an essential prerequisite for the promotion ofeducation in rural areas.
The government's commitment to education was declared at theNational Education Conference in 1947, which was the first step
towards defining education policies and goals in Pakistan. Since then,there have been seven national education policies, eight Five-year plans,and several national-level schemes relating to education (see table4.14). However, a review of the history of education policymaking andplanning shows that each round of policymaking repeats the samepattern: the importance of education is iterated, the failure of past effortsis lamented, the main issues in education reform are highlighted, and newplans are proposed to meet new targets. Yet, the targets have remainedelusive to date.
The policy dialogue commenced with the 1947 National EducationConference, which emphasized the need for free and compulsory primaryeducation and for adult education to solve the problem of illiteracy over aperiod of 25 years, i.e., by 1972. The six-year National Plan ofEducational Development, 1951-57, which proposed to make 2.8 millionadults literate every year, followed. However, a review of the Plan showedthat the literacy ratio declined by 0.1 percentage point, from 16.4 per centin 1951 to 16.3 per cent at the end of the decade.
CH
APTE
R 4
So
cia
l D
eve
lop
me
nt
in P
aki
sta
n,
20
02
-03
92
EDUCATION POLICY MAKING
TABLE 4.14 LIST OF EDUCATION POLICIES, PLANS,PROGRAMMES AND SCHEMES
1. National Education Conference, 19472. National Plan of Education Development, 1951-573. First Five Year Plan, 1955-604. Report of the Commission on National Education, 19595. Second Five Year Plan, 1960-656. Third Five Year Plan, 1965-707. New Education Policy, 19708. The Education Policy, 1972-809. Fifth Five Year Plan, 1978-8310. National Education Policy and Implementation Programme, 197911. Literacy and Mass Education Commission, 198112. 10 Point Programme, 198313. Sixth Five Year Plan, 1983-8814. National Literacy Plan 1984-8615. Drop-in Schools, 1986-8916. Nation-wide Literacy Programme, 1986-9017. Nai Roshni Schools, 1986-9018. Seventh Five Year Plan, 1988-9319. National Education Policy, 199220. Eighth Five Year Plan, 1993-9821. National Education Policy, 1998-201022. Education Sector Reforms Action Plan 2001-0423. Education Sector Reforms Action Plan 2001-05
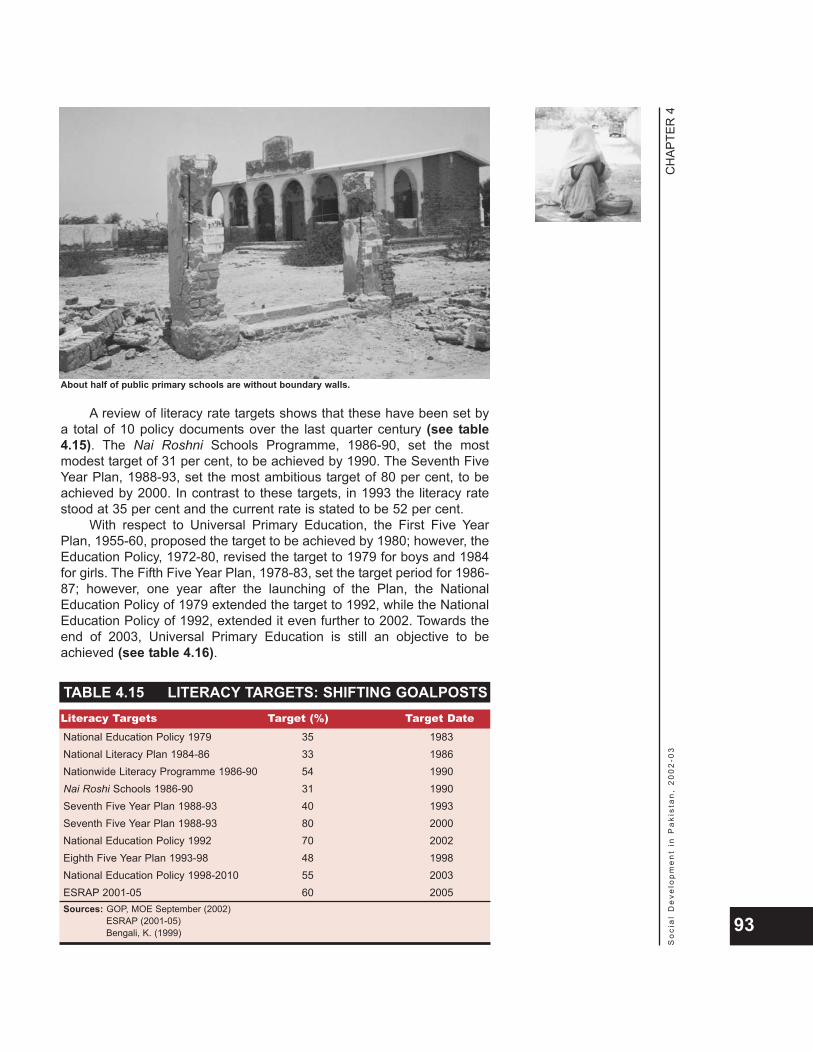
A review of literacy rate targets shows that these have been set bya total of 10 policy documents over the last quarter century (see table4.15). The Nai Roshni Schools Programme, 1986-90, set the mostmodest target of 31 per cent, to be achieved by 1990. The Seventh FiveYear Plan, 1988-93, set the most ambitious target of 80 per cent, to beachieved by 2000. In contrast to these targets, in 1993 the literacy ratestood at 35 per cent and the current rate is stated to be 52 per cent.
With respect to Universal Primary Education, the First Five YearPlan, 1955-60, proposed the target to be achieved by 1980; however, theEducation Policy, 1972-80, revised the target to 1979 for boys and 1984for girls. The Fifth Five Year Plan, 1978-83, set the target period for 1986-87; however, one year after the launching of the Plan, the NationalEducation Policy of 1979 extended the target to 1992, while the NationalEducation Policy of 1992, extended it even further to 2002. Towards theend of 2003, Universal Primary Education is still an objective to beachieved (see table 4.16).
CH
APTE
R 4
So
cia
l D
eve
lop
me
nt
in P
aki
sta
n,
20
02
-03
93
TABLE 4.15 LITERACY TARGETS: SHIFTING GOALPOSTSLiteracy Targets Target (%) Target Date
National Education Policy 1979 35 1983National Literacy Plan 1984-86 33 1986Nationwide Literacy Programme 1986-90 54 1990Nai Roshi Schools 1986-90 31 1990Seventh Five Year Plan 1988-93 40 1993Seventh Five Year Plan 1988-93 80 2000National Education Policy 1992 70 2002Eighth Five Year Plan 1993-98 48 1998National Education Policy 1998-2010 55 2003ESRAP 2001-05 60 2005Sources: GOP, MOE September (2002)
ESRAP (2001-05)Bengali, K. (1999)
About half of public primary schools are without boundary walls.
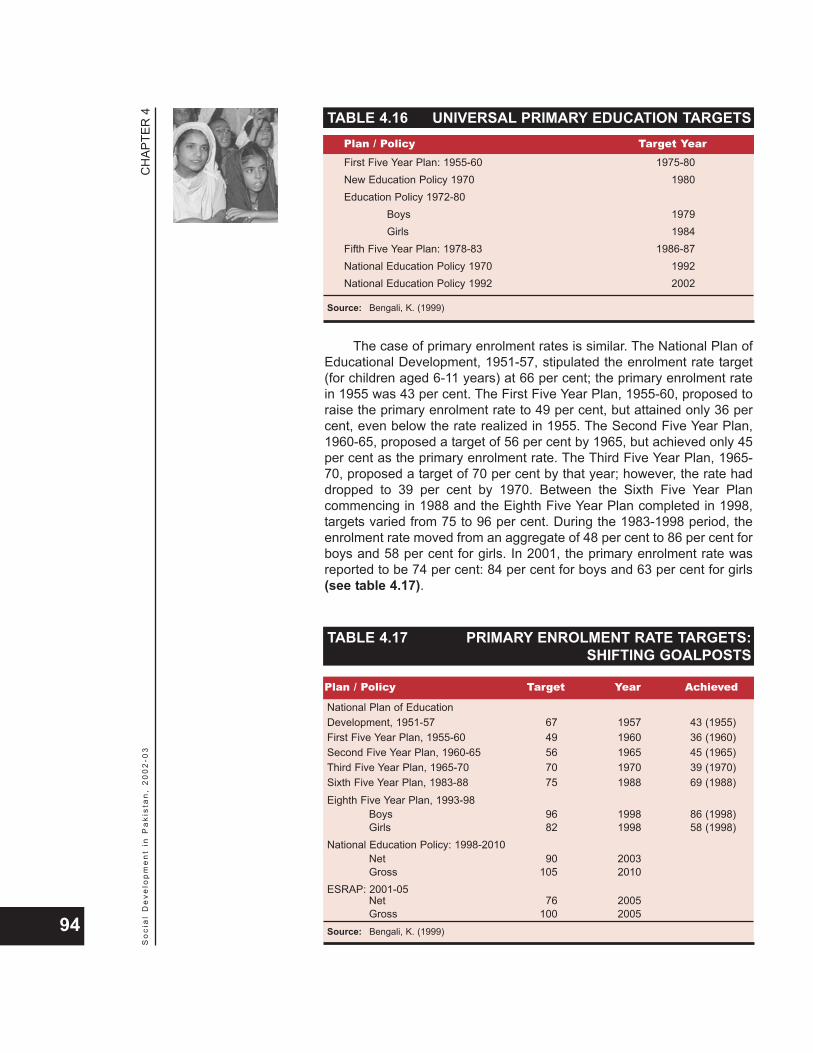
The case of primary enrolment rates is similar. The National Plan ofEducational Development, 1951-57, stipulated the enrolment rate target(for children aged 6-11 years) at 66 per cent; the primary enrolment ratein 1955 was 43 per cent. The First Five Year Plan, 1955-60, proposed toraise the primary enrolment rate to 49 per cent, but attained only 36 percent, even below the rate realized in 1955. The Second Five Year Plan,1960-65, proposed a target of 56 per cent by 1965, but achieved only 45per cent as the primary enrolment rate. The Third Five Year Plan, 1965-70, proposed a target of 70 per cent by that year; however, the rate haddropped to 39 per cent by 1970. Between the Sixth Five Year Plancommencing in 1988 and the Eighth Five Year Plan completed in 1998,targets varied from 75 to 96 per cent. During the 1983-1998 period, theenrolment rate moved from an aggregate of 48 per cent to 86 per cent forboys and 58 per cent for girls. In 2001, the primary enrolment rate wasreported to be 74 per cent: 84 per cent for boys and 63 per cent for girls(see table 4.17).
CH
APTE
R 4
So
cia
l D
eve
lop
me
nt
in P
aki
sta
n,
20
02
-03
94
TABLE 4.16 UNIVERSAL PRIMARY EDUCATION TARGETSPlan / Policy Target Year
First Five Year Plan: 1955-60 1975-80New Education Policy 1970 1980Education Policy 1972-80
Boys 1979Girls 1984
Fifth Five Year Plan: 1978-83 1986-87National Education Policy 1970 1992National Education Policy 1992 2002
Source: Bengali, K. (1999)
TABLE 4.17 PRIMARY ENROLMENT RATE TARGETS:SHIFTING GOALPOSTS
Plan / Policy Target Year Achieved
National Plan of EducationDevelopment, 1951-57 67 1957 43 (1955)First Five Year Plan, 1955-60 49 1960 36 (1960)Second Five Year Plan, 1960-65 56 1965 45 (1965)Third Five Year Plan, 1965-70 70 1970 39 (1970)Sixth Five Year Plan, 1983-88 75 1988 69 (1988)Eighth Five Year Plan, 1993-98
Boys 96 1998 86 (1998)Girls 82 1998 58 (1998)
National Education Policy: 1998-2010Net 90 2003Gross 105 2010
ESRAP: 2001-05Net 76 2005Gross 100 2005
Source: Bengali, K. (1999)

Current InitiativesThe current action plan in the education sector is framed in the EducationSector Reforms Action Plan: 2001-05 (ESRAP) of the government ofPakistan. ESRAP is designed to operationalize several governmentpolicy statements and international commitments towards povertyreduction, human development and improvements in the educationsector. These comprise mainly the National Education Policies of 1992and 1998-2010, and the National Plan of Action on Education For All:2000-15 (EFA). ESRAP is an integral part of Interim Poverty ReductionStrategy Paper (I-PRSP), which is now a prerequisite for obtainingconcessional lending, particularly from the World Bank and theInternational Monetary Fund.
The Education Sector Reforms (ESR) objectives contained in theESRAP 2001-05 document have been delineated as follows:
Universalization of primary education and adult literacy;Mainstreaming madaris for diversifying employmentopportunities for their graduates;Improvement in the quality of education through better teachers,upgraded training options, curriculum and textbook reforms, anda competency based examination system;Introducing a third stream of gender and area specific technicaland vocational education at the secondary level with innovativeapproaches for counselling students; andSetting up monotechnics/polytechnics at the District and Tehsillevels.
A review of ESRAP reveals several problems with respect to federal-provincial coordination, monitoring of targets, and financing. It appearsthat the targets and planned financial allocations are no longer feasible.The primary problem, it emerges, is that ESRAP is a centrally designedplan with insufficient recognition of the implementation and financingconstraints and capabilities of the provincial and local governments.
CH
APTE
R 4
So
cia
l D
eve
lop
me
nt
in P
aki
sta
n,
20
02
-03
95Going to school.
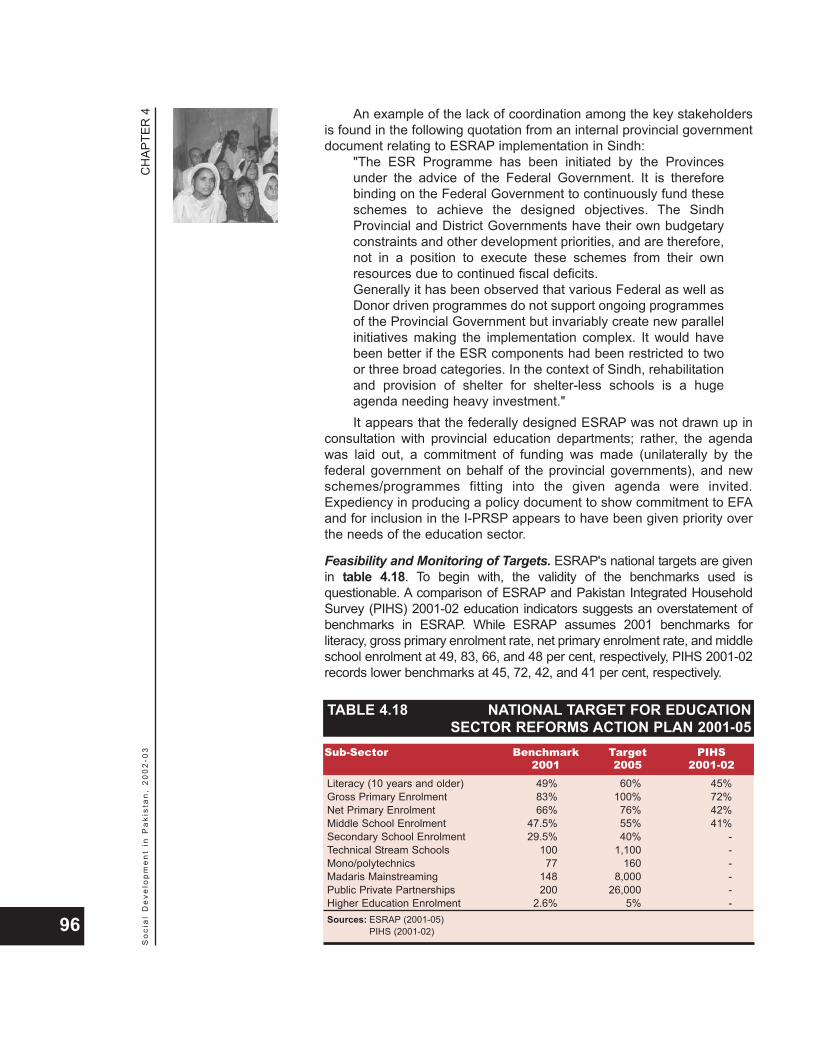
An example of the lack of coordination among the key stakeholdersis found in the following quotation from an internal provincial governmentdocument relating to ESRAP implementation in Sindh:
"The ESR Programme has been initiated by the Provincesunder the advice of the Federal Government. It is thereforebinding on the Federal Government to continuously fund theseschemes to achieve the designed objectives. The SindhProvincial and District Governments have their own budgetaryconstraints and other development priorities, and are therefore,not in a position to execute these schemes from their ownresources due to continued fiscal deficits. Generally it has been observed that various Federal as well asDonor driven programmes do not support ongoing programmesof the Provincial Government but invariably create new parallelinitiatives making the implementation complex. It would havebeen better if the ESR components had been restricted to twoor three broad categories. In the context of Sindh, rehabilitationand provision of shelter for shelter-less schools is a hugeagenda needing heavy investment."It appears that the federally designed ESRAP was not drawn up in
consultation with provincial education departments; rather, the agendawas laid out, a commitment of funding was made (unilaterally by thefederal government on behalf of the provincial governments), and newschemes/programmes fitting into the given agenda were invited.Expediency in producing a policy document to show commitment to EFAand for inclusion in the I-PRSP appears to have been given priority overthe needs of the education sector.
Feasibility and Monitoring of Targets. ESRAP's national targets are givenin table 4.18. To begin with, the validity of the benchmarks used isquestionable. A comparison of ESRAP and Pakistan Integrated HouseholdSurvey (PIHS) 2001-02 education indicators suggests an overstatement ofbenchmarks in ESRAP. While ESRAP assumes 2001 benchmarks forliteracy, gross primary enrolment rate, net primary enrolment rate, and middleschool enrolment at 49, 83, 66, and 48 per cent, respectively, PIHS 2001-02records lower benchmarks at 45, 72, 42, and 41 per cent, respectively.
CH
APTE
R 4
So
cia
l D
eve
lop
me
nt
in P
aki
sta
n,
20
02
-03
96
TABLE 4.18 NATIONAL TARGET FOR EDUCATIONSECTOR REFORMS ACTION PLAN 2001-05
Sub-Sector Benchmark Target PIHS2001 2005 2001-02
Literacy (10 years and older) 49% 60% 45%Gross Primary Enrolment 83% 100% 72%Net Primary Enrolment 66% 76% 42%Middle School Enrolment 47.5% 55% 41%Secondary School Enrolment 29.5% 40% -Technical Stream Schools 100 1,100 -Mono/polytechnics 77 160 -Madaris Mainstreaming 148 8,000 -Public Private Partnerships 200 26,000 -Higher Education Enrolment 2.6% 5% -Sources: ESRAP (2001-05)
PIHS (2001-02)
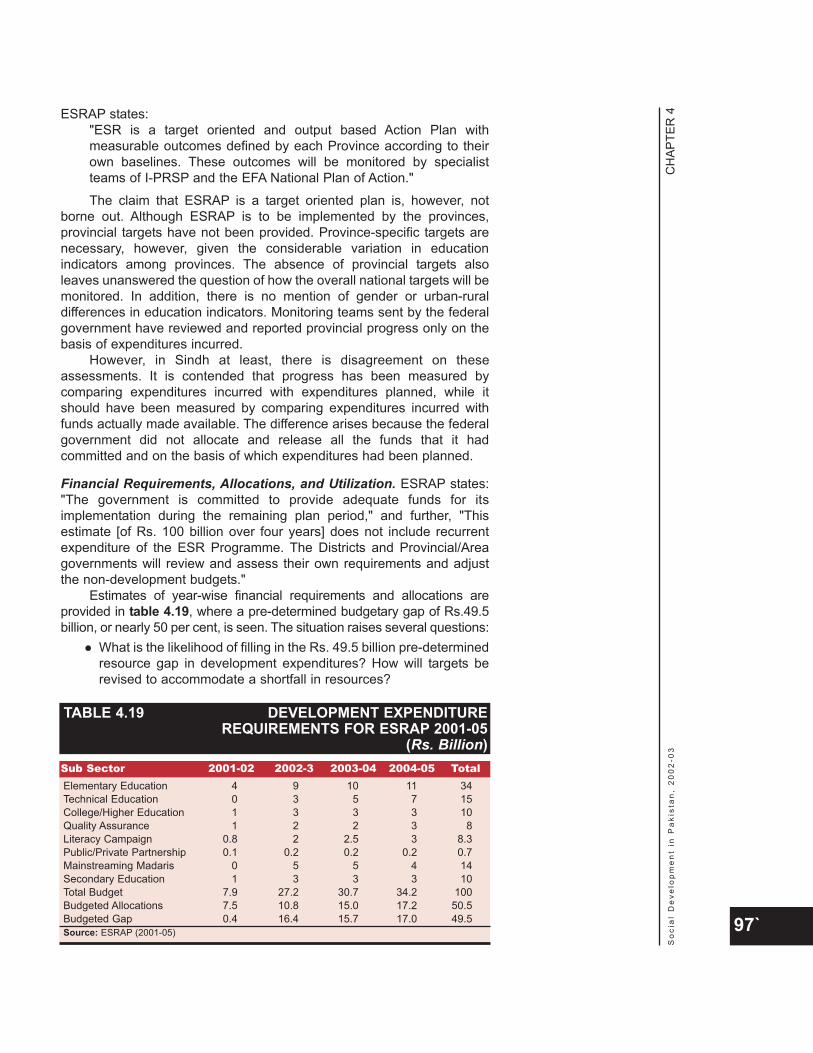
ESRAP states:"ESR is a target oriented and output based Action Plan withmeasurable outcomes defined by each Province according to theirown baselines. These outcomes will be monitored by specialistteams of I-PRSP and the EFA National Plan of Action."The claim that ESRAP is a target oriented plan is, however, not
borne out. Although ESRAP is to be implemented by the provinces,provincial targets have not been provided. Province-specific targets arenecessary, however, given the considerable variation in educationindicators among provinces. The absence of provincial targets alsoleaves unanswered the question of how the overall national targets will bemonitored. In addition, there is no mention of gender or urban-ruraldifferences in education indicators. Monitoring teams sent by the federalgovernment have reviewed and reported provincial progress only on thebasis of expenditures incurred.
However, in Sindh at least, there is disagreement on theseassessments. It is contended that progress has been measured bycomparing expenditures incurred with expenditures planned, while itshould have been measured by comparing expenditures incurred withfunds actually made available. The difference arises because the federalgovernment did not allocate and release all the funds that it hadcommitted and on the basis of which expenditures had been planned.
Financial Requirements, Allocations, and Utilization. ESRAP states:"The government is committed to provide adequate funds for itsimplementation during the remaining plan period," and further, "Thisestimate [of Rs. 100 billion over four years] does not include recurrentexpenditure of the ESR Programme. The Districts and Provincial/Areagovernments will review and assess their own requirements and adjustthe non-development budgets."
Estimates of year-wise financial requirements and allocations areprovided in table 4.19, where a pre-determined budgetary gap of Rs.49.5billion, or nearly 50 per cent, is seen. The situation raises several questions:
What is the likelihood of filling in the Rs. 49.5 billion pre-determinedresource gap in development expenditures? How will targets berevised to accommodate a shortfall in resources?
CH
APTE
R 4
So
cia
l D
eve
lop
me
nt
in P
aki
sta
n,
20
02
-03
97`
TABLE 4.19 DEVELOPMENT EXPENDITUREREQUIREMENTS FOR ESRAP 2001-05
(Rs. Billion)Sub Sector 2001-02 2002-3 2003-04 2004-05 TotalElementary Education 4 9 10 11 34Technical Education 0 3 5 7 15College/Higher Education 1 3 3 3 10Quality Assurance 1 2 2 3 8Literacy Campaign 0.8 2 2.5 3 8.3Public/Private Partnership 0.1 0.2 0.2 0.2 0.7Mainstreaming Madaris 0 5 5 4 14Secondary Education 1 3 3 3 10Total Budget 7.9 27.2 30.7 34.2 100Budgeted Allocations 7.5 10.8 15.0 17.2 50.5Budgeted Gap 0.4 16.4 15.7 17.0 49.5Source: ESRAP (2001-05)

What are the estimated recurrent expenditures necessary toachieve a sustained (even if partial) improvement in targetedindicators, with or without the full allocation of requireddevelopment expenditures? How will development expenditureallocations change if interim targets do not show improvements?What is the likelihood that provinces and districts will be able to providethe development and recurrent expenditures necessary to achievetargets, given that the above estimates are based on the ratherquestionable assumption that ‘District Governments will allocateadequate funds for the on-going Education Reform Programmes’?
A review of total Federal and Provincial development expendituresfor education over the three years that ESRAP has been in place revealsthat Rs. 37.8 billion have been allocated compared to the budgetedrequirement of Rs. 65.4 billion, reflecting a shortfall of about Rs. 28 billionor 42 per cent (see table 4.20). Interestingly, the shortfall had beenforeseen as the Economic Survey 2002-03 stated, "Given the existinglevel of financing through PSDP, it is unlikely that the resources requiredfor achieving the above targets would become available.”
The provincial capability and commitment to mobilize necessaryresources is reflected by the following statement:
"During 2002-03 no separate funds could be allocated byMinistry of Education for the ESR Programme. InsteadProvinces were asked to continue funding ESR schemes fromGeneral Sales Tax (GST) share of 2.5 per cent. However, all theProvincial Governments have shown their inability to allocatethe requisite funds through 2.5 per cent GST refunds as theyhave their own priorities and other development expenditures tomeet.The Federal Government has released so far a sum of Rs.4.579 billion. Out of this, Sindh has received an amount of Rs.803.103 million. If this process of paltry funding is continued,the ESR scheme will definitely receive a serious set back andthe Provinces will not be able to attain objectives."With only one year of allocations left, there are large shortfalls in the
ESRAP development expenditure budget. Federal and provincial leveldifferences on targets, finances and implementation are still outstanding,while districts are spending funds on ad hoc schemes and programmes.Given that benchmark estimates are incorrect, gender, urban/rural, orprovince-specific targets have not been defined, provincial education
CH
APTE
R 4
So
cia
l D
eve
lop
me
nt
in P
aki
sta
n,
20
02
-03
98
TABLE 4.20 EXPENDITURE REQUIREMENTS ANDALLOCATIONS: 2002-2004
(Rs. Billion)
Sub Sector 2001-02 2002-03 2003-04 Total
Total Budget 7.9 27.2 30.7 65.8Actual Allocations 7.8 10.8 19.2 37.8Actual Gap 0.1 16.4 11.5 28.0Sources: ESRAP (2001-05)
Federal PSDP (2001-02, 2002-03 and 2003-04)Provincial PSDP (2001-02, 2002-03 and 2003-04)
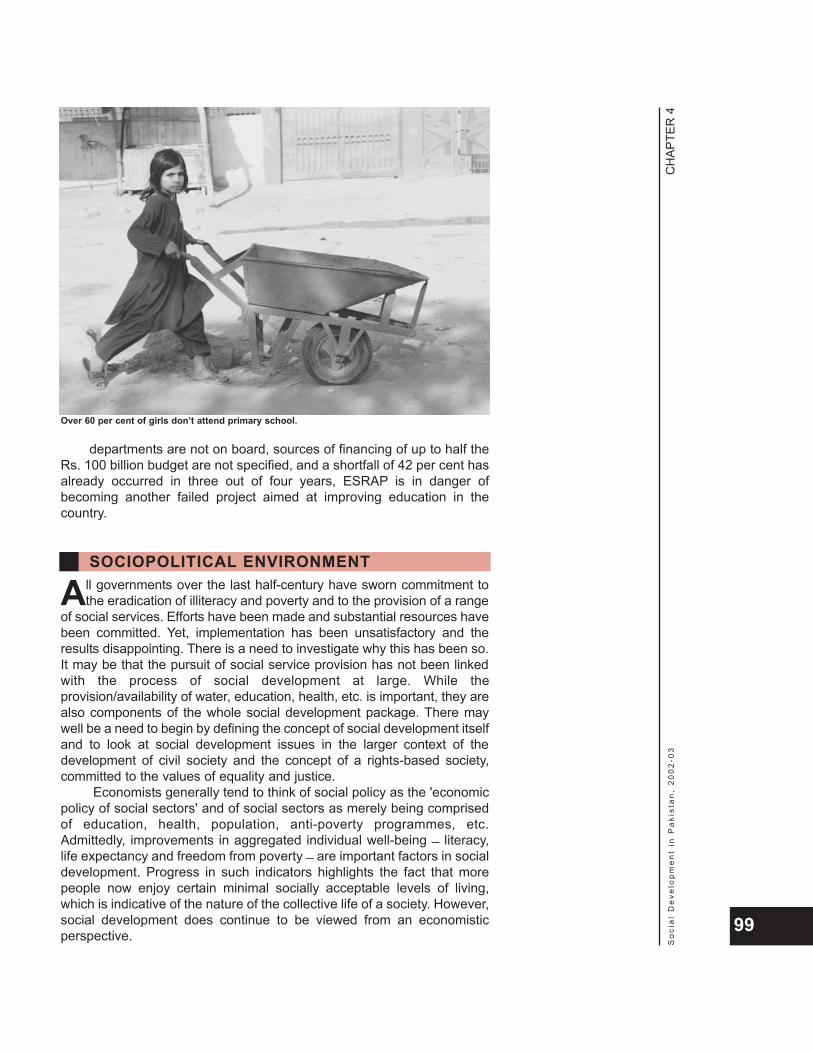
departments are not on board, sources of financing of up to half theRs. 100 billion budget are not specified, and a shortfall of 42 per cent hasalready occurred in three out of four years, ESRAP is in danger ofbecoming another failed project aimed at improving education in thecountry.
All governments over the last half-century have sworn commitment tothe eradication of illiteracy and poverty and to the provision of a range
of social services. Efforts have been made and substantial resources havebeen committed. Yet, implementation has been unsatisfactory and theresults disappointing. There is a need to investigate why this has been so.It may be that the pursuit of social service provision has not been linkedwith the process of social development at large. While theprovision/availability of water, education, health, etc. is important, they arealso components of the whole social development package. There maywell be a need to begin by defining the concept of social development itselfand to look at social development issues in the larger context of thedevelopment of civil society and the concept of a rights-based society,committed to the values of equality and justice.
Economists generally tend to think of social policy as the 'economicpolicy of social sectors' and of social sectors as merely being comprisedof education, health, population, anti-poverty programmes, etc.Admittedly, improvements in aggregated individual well-being _ literacy,life expectancy and freedom from poverty _ are important factors in socialdevelopment. Progress in such indicators highlights the fact that morepeople now enjoy certain minimal socially acceptable levels of living,which is indicative of the nature of the collective life of a society. However,social development does continue to be viewed from an economisticperspective.
CH
APTE
R 4
So
cia
l D
eve
lop
me
nt
in P
aki
sta
n,
20
02
-03
99
Over 60 per cent of girls don’t attend primary school.
SOCIOPOLITICAL ENVIRONMENT
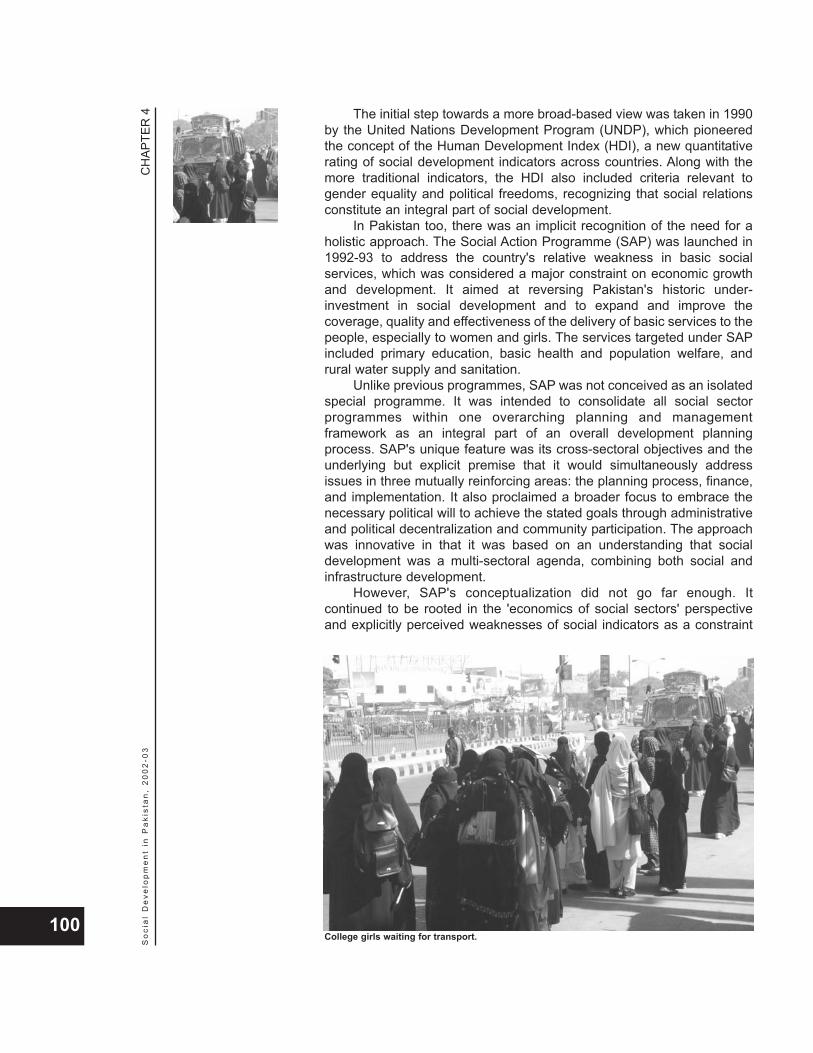
The initial step towards a more broad-based view was taken in 1990by the United Nations Development Program (UNDP), which pioneeredthe concept of the Human Development Index (HDI), a new quantitativerating of social development indicators across countries. Along with themore traditional indicators, the HDI also included criteria relevant togender equality and political freedoms, recognizing that social relationsconstitute an integral part of social development.
In Pakistan too, there was an implicit recognition of the need for aholistic approach. The Social Action Programme (SAP) was launched in1992-93 to address the country's relative weakness in basic socialservices, which was considered a major constraint on economic growthand development. It aimed at reversing Pakistan's historic under-investment in social development and to expand and improve thecoverage, quality and effectiveness of the delivery of basic services to thepeople, especially to women and girls. The services targeted under SAPincluded primary education, basic health and population welfare, andrural water supply and sanitation.
Unlike previous programmes, SAP was not conceived as an isolatedspecial programme. It was intended to consolidate all social sectorprogrammes within one overarching planning and managementframework as an integral part of an overall development planningprocess. SAP's unique feature was its cross-sectoral objectives and theunderlying but explicit premise that it would simultaneously addressissues in three mutually reinforcing areas: the planning process, finance,and implementation. It also proclaimed a broader focus to embrace thenecessary political will to achieve the stated goals through administrativeand political decentralization and community participation. The approachwas innovative in that it was based on an understanding that socialdevelopment was a multi-sectoral agenda, combining both social andinfrastructure development.
However, SAP's conceptualization did not go far enough. Itcontinued to be rooted in the 'economics of social sectors' perspectiveand explicitly perceived weaknesses of social indicators as a constraint
CH
APTE
R 4
So
cia
l D
eve
lop
me
nt
in P
aki
sta
n,
20
02
-03
100College girls waiting for transport.
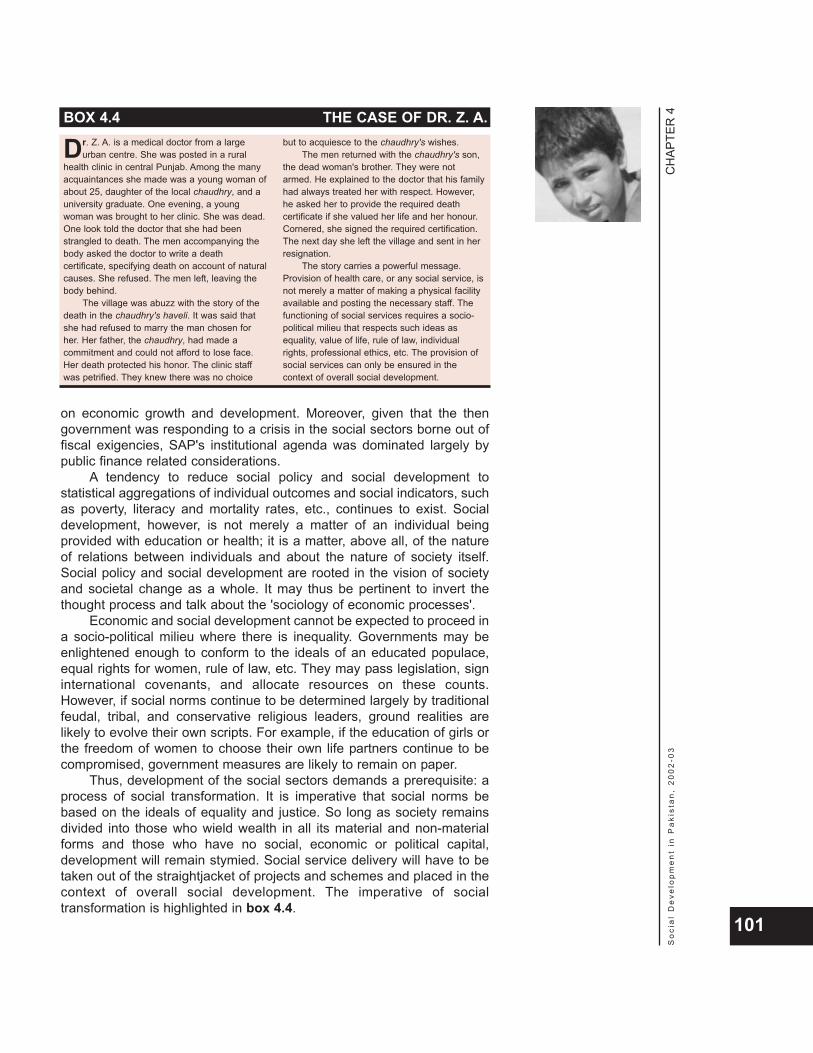
on economic growth and development. Moreover, given that the thengovernment was responding to a crisis in the social sectors borne out offiscal exigencies, SAP's institutional agenda was dominated largely bypublic finance related considerations.
A tendency to reduce social policy and social development tostatistical aggregations of individual outcomes and social indicators, suchas poverty, literacy and mortality rates, etc., continues to exist. Socialdevelopment, however, is not merely a matter of an individual beingprovided with education or health; it is a matter, above all, of the natureof relations between individuals and about the nature of society itself.Social policy and social development are rooted in the vision of societyand societal change as a whole. It may thus be pertinent to invert thethought process and talk about the 'sociology of economic processes'.
Economic and social development cannot be expected to proceed ina socio-political milieu where there is inequality. Governments may beenlightened enough to conform to the ideals of an educated populace,equal rights for women, rule of law, etc. They may pass legislation, signinternational covenants, and allocate resources on these counts.However, if social norms continue to be determined largely by traditionalfeudal, tribal, and conservative religious leaders, ground realities arelikely to evolve their own scripts. For example, if the education of girls orthe freedom of women to choose their own life partners continue to becompromised, government measures are likely to remain on paper.
Thus, development of the social sectors demands a prerequisite: aprocess of social transformation. It is imperative that social norms bebased on the ideals of equality and justice. So long as society remainsdivided into those who wield wealth in all its material and non-materialforms and those who have no social, economic or political capital,development will remain stymied. Social service delivery will have to betaken out of the straightjacket of projects and schemes and placed in thecontext of overall social development. The imperative of socialtransformation is highlighted in box 4.4.
CH
APTE
R 4
So
cia
l D
eve
lop
me
nt
in P
aki
sta
n,
20
02
-03
101
BOX 4.4 THE CASE OF DR. Z. A.
Dr. Z. A. is a medical doctor from a largeurban centre. She was posted in a rural
health clinic in central Punjab. Among the manyacquaintances she made was a young woman ofabout 25, daughter of the local chaudhry, and auniversity graduate. One evening, a youngwoman was brought to her clinic. She was dead.One look told the doctor that she had beenstrangled to death. The men accompanying thebody asked the doctor to write a deathcertificate, specifying death on account of naturalcauses. She refused. The men left, leaving thebody behind.
The village was abuzz with the story of thedeath in the chaudhry's haveli. It was said thatshe had refused to marry the man chosen forher. Her father, the chaudhry, had made acommitment and could not afford to lose face.Her death protected his honor. The clinic staffwas petrified. They knew there was no choice
but to acquiesce to the chaudhry's wishes.The men returned with the chaudhry's son,
the dead woman's brother. They were notarmed. He explained to the doctor that his familyhad always treated her with respect. However,he asked her to provide the required deathcertificate if she valued her life and her honour.Cornered, she signed the required certification.The next day she left the village and sent in herresignation.
The story carries a powerful message.Provision of health care, or any social service, isnot merely a matter of making a physical facilityavailable and posting the necessary staff. Thefunctioning of social services requires a socio-political milieu that respects such ideas asequality, value of life, rule of law, individualrights, professional ethics, etc. The provision ofsocial services can only be ensured in thecontext of overall social development.
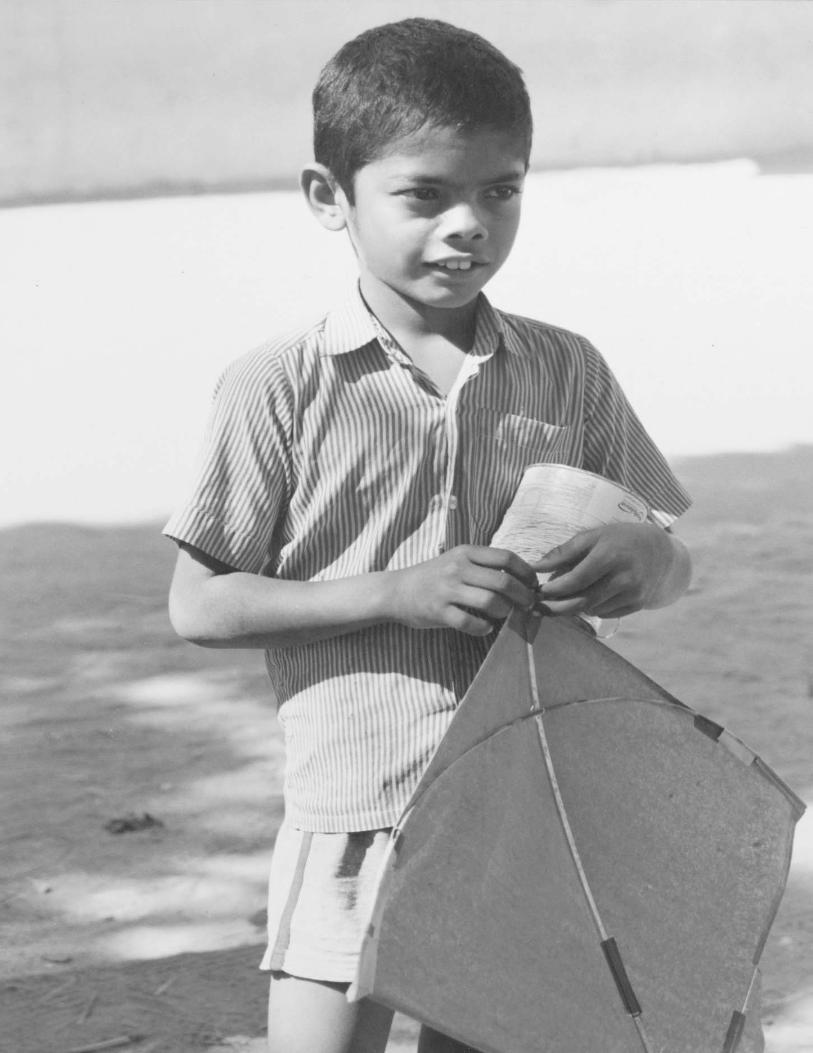

CH
APTE
R 5
So
cia
l D
eve
lop
me
nt
in P
aki
sta
n,
20
02
-03
103
5STATE OF
PRIMARY EDUCATION
“The basic problemwith the primary
education curriculum isthat the learningprocess does not
conform to pedagogicalrequirements.”
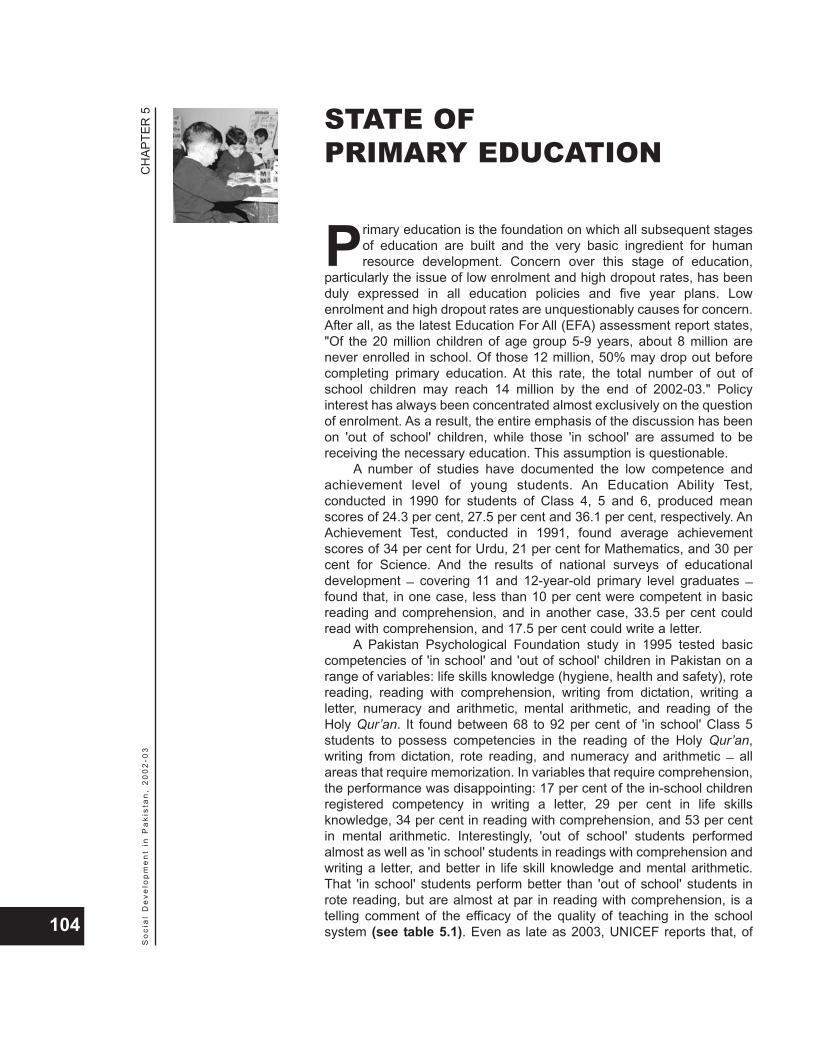
Primary education is the foundation on which all subsequent stagesof education are built and the very basic ingredient for humanresource development. Concern over this stage of education,
particularly the issue of low enrolment and high dropout rates, has beenduly expressed in all education policies and five year plans. Lowenrolment and high dropout rates are unquestionably causes for concern.After all, as the latest Education For All (EFA) assessment report states,"Of the 20 million children of age group 5-9 years, about 8 million arenever enrolled in school. Of those 12 million, 50% may drop out beforecompleting primary education. At this rate, the total number of out ofschool children may reach 14 million by the end of 2002-03." Policyinterest has always been concentrated almost exclusively on the questionof enrolment. As a result, the entire emphasis of the discussion has beenon 'out of school' children, while those 'in school' are assumed to bereceiving the necessary education. This assumption is questionable.
A number of studies have documented the low competence andachievement level of young students. An Education Ability Test,conducted in 1990 for students of Class 4, 5 and 6, produced meanscores of 24.3 per cent, 27.5 per cent and 36.1 per cent, respectively. AnAchievement Test, conducted in 1991, found average achievementscores of 34 per cent for Urdu, 21 per cent for Mathematics, and 30 percent for Science. And the results of national surveys of educationaldevelopment _ covering 11 and 12-year-old primary level graduates _found that, in one case, less than 10 per cent were competent in basicreading and comprehension, and in another case, 33.5 per cent couldread with comprehension, and 17.5 per cent could write a letter.
A Pakistan Psychological Foundation study in 1995 tested basiccompetencies of 'in school' and 'out of school' children in Pakistan on arange of variables: life skills knowledge (hygiene, health and safety), rotereading, reading with comprehension, writing from dictation, writing aletter, numeracy and arithmetic, mental arithmetic, and reading of theHoly Qur’an. It found between 68 to 92 per cent of 'in school' Class 5students to possess competencies in the reading of the Holy Qur’an,writing from dictation, rote reading, and numeracy and arithmetic _ allareas that require memorization. In variables that require comprehension,the performance was disappointing: 17 per cent of the in-school childrenregistered competency in writing a letter, 29 per cent in life skillsknowledge, 34 per cent in reading with comprehension, and 53 per centin mental arithmetic. Interestingly, 'out of school' students performedalmost as well as 'in school' students in readings with comprehension andwriting a letter, and better in life skill knowledge and mental arithmetic.That 'in school' students perform better than 'out of school' students inrote reading, but are almost at par in reading with comprehension, is atelling comment of the efficacy of the quality of teaching in the schoolsystem (see table 5.1). Even as late as 2003, UNICEF reports that, of
CH
APTE
R 5
So
cia
l D
eve
lop
me
nt
in P
aki
sta
n,
20
02
-03
104
STATE OFPRIMARY EDUCATION
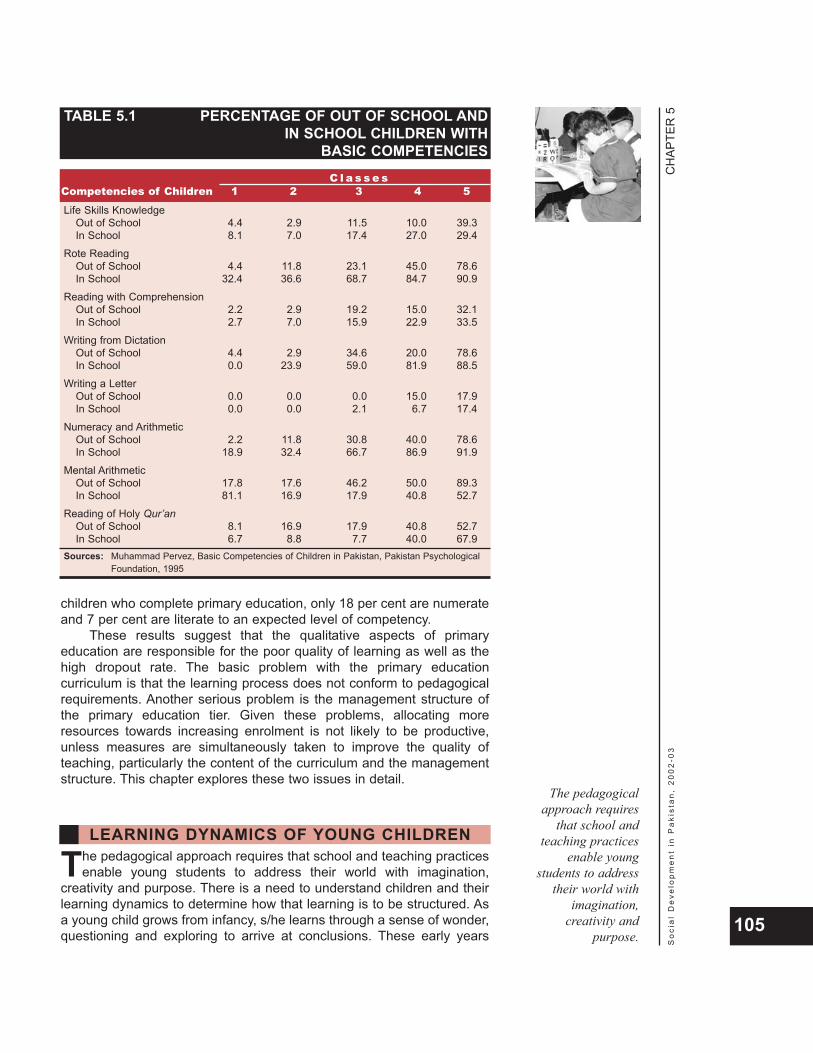
children who complete primary education, only 18 per cent are numerateand 7 per cent are literate to an expected level of competency.
These results suggest that the qualitative aspects of primaryeducation are responsible for the poor quality of learning as well as thehigh dropout rate. The basic problem with the primary educationcurriculum is that the learning process does not conform to pedagogicalrequirements. Another serious problem is the management structure ofthe primary education tier. Given these problems, allocating moreresources towards increasing enrolment is not likely to be productive,unless measures are simultaneously taken to improve the quality ofteaching, particularly the content of the curriculum and the managementstructure. This chapter explores these two issues in detail.
The pedagogical approach requires that school and teaching practicesenable young students to address their world with imagination,
creativity and purpose. There is a need to understand children and theirlearning dynamics to determine how that learning is to be structured. Asa young child grows from infancy, s/he learns through a sense of wonder,questioning and exploring to arrive at conclusions. These early years
CH
APTE
R 5
So
cia
l D
eve
lop
me
nt
in P
aki
sta
n,
20
02
-03
105
TABLE 5.1 PERCENTAGE OF OUT OF SCHOOL ANDIN SCHOOL CHILDREN WITH
BASIC COMPETENCIESC l a s s e s
Competencies of Children 1 2 3 4 5
Life Skills KnowledgeOut of School 4.4 2.9 11.5 10.0 39.3In School 8.1 7.0 17.4 27.0 29.4
Rote ReadingOut of School 4.4 11.8 23.1 45.0 78.6In School 32.4 36.6 68.7 84.7 90.9
Reading with ComprehensionOut of School 2.2 2.9 19.2 15.0 32.1In School 2.7 7.0 15.9 22.9 33.5
Writing from DictationOut of School 4.4 2.9 34.6 20.0 78.6In School 0.0 23.9 59.0 81.9 88.5
Writing a LetterOut of School 0.0 0.0 0.0 15.0 17.9In School 0.0 0.0 2.1 6.7 17.4
Numeracy and ArithmeticOut of School 2.2 11.8 30.8 40.0 78.6In School 18.9 32.4 66.7 86.9 91.9
Mental ArithmeticOut of School 17.8 17.6 46.2 50.0 89.3In School 81.1 16.9 17.9 40.8 52.7
Reading of Holy Qur’anOut of School 8.1 16.9 17.9 40.8 52.7In School 6.7 8.8 7.7 40.0 67.9
Sources: Muhammad Pervez, Basic Competencies of Children in Pakistan, Pakistan Psychological Foundation, 1995
LEARNING DYNAMICS OF YOUNG CHILDREN
The pedagogicalapproach requires
that school andteaching practices
enable youngstudents to address
their world withimagination,
creativity andpurpose.
provide the basis for language development, physical dexterity, socialunderstanding, and emotional development. It is marked by ardentcuriosity and fertile imagination and by the desire to touch and feel. Theprogression from intuitive to explicit knowledge takes place in play.Learning is an end in itself, irrespective of the nature of the contentlearned.
Meaningful learning takes place when students feel a genuineinterest and curiosity about the concepts they encounter and approachlearning with confidence and delight in their abilities. How students learnis as important as what they learn."What makes the wind blow?" A five-year-old child was asked. "The trees," replied the child. "How do you know?" "I saw them waving their arms." "How does that make the wind blow?"The child waved her hands about. "Like this. Only they are bigger. Andthere are lots of trees.""Then, what makes the wind blow on the ocean?""The waves." The child moved her body in the motions of a wave. "And on the mountain tops?" "The clouds...?"
Beliefs of five-year-olds, while not 'correct' by adult criterion, are not'incorrect' from the viewpoint of a learning process. Children'sperceptions are entirely sensible and coherent within the framework ofthe child's way of knowing and learning. Classifying them as 'right' or'wrong' is not relevant. In a rational learning process, children arrive atanswers by themselves.
Learning starts with objects and issues within a child's immediateaudio-visual range, as children are constantly trying to construct meaning
CH
APTE
R 5
So
cia
l D
eve
lop
me
nt
in P
aki
sta
n,
20
02
-03
106Learning can be fun!
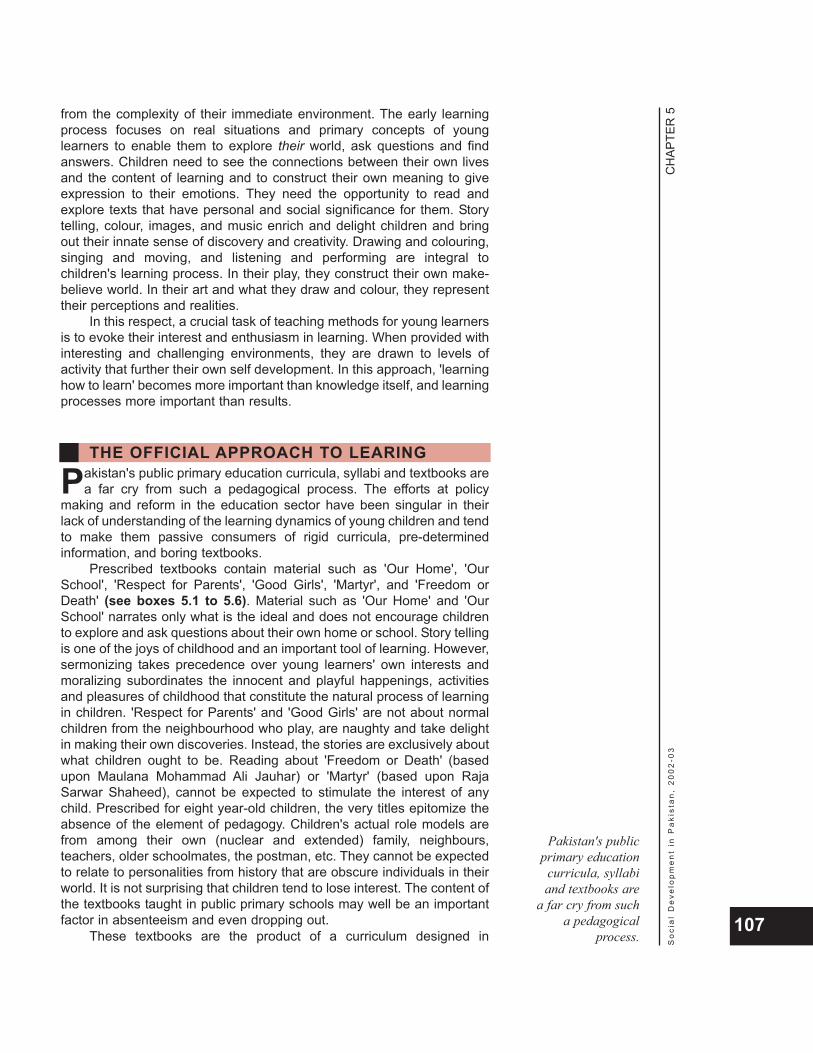
from the complexity of their immediate environment. The early learningprocess focuses on real situations and primary concepts of younglearners to enable them to explore their world, ask questions and findanswers. Children need to see the connections between their own livesand the content of learning and to construct their own meaning to giveexpression to their emotions. They need the opportunity to read andexplore texts that have personal and social significance for them. Storytelling, colour, images, and music enrich and delight children and bringout their innate sense of discovery and creativity. Drawing and colouring,singing and moving, and listening and performing are integral tochildren's learning process. In their play, they construct their own make-believe world. In their art and what they draw and colour, they representtheir perceptions and realities.
In this respect, a crucial task of teaching methods for young learnersis to evoke their interest and enthusiasm in learning. When provided withinteresting and challenging environments, they are drawn to levels ofactivity that further their own self development. In this approach, 'learninghow to learn' becomes more important than knowledge itself, and learningprocesses more important than results.
Pakistan's public primary education curricula, syllabi and textbooks area far cry from such a pedagogical process. The efforts at policy
making and reform in the education sector have been singular in theirlack of understanding of the learning dynamics of young children and tendto make them passive consumers of rigid curricula, pre-determinedinformation, and boring textbooks.
Prescribed textbooks contain material such as 'Our Home', 'OurSchool', 'Respect for Parents', 'Good Girls', 'Martyr', and 'Freedom orDeath' (see boxes 5.1 to 5.6). Material such as 'Our Home' and 'OurSchool' narrates only what is the ideal and does not encourage childrento explore and ask questions about their own home or school. Story tellingis one of the joys of childhood and an important tool of learning. However,sermonizing takes precedence over young learners' own interests andmoralizing subordinates the innocent and playful happenings, activitiesand pleasures of childhood that constitute the natural process of learningin children. 'Respect for Parents' and 'Good Girls' are not about normalchildren from the neighbourhood who play, are naughty and take delightin making their own discoveries. Instead, the stories are exclusively aboutwhat children ought to be. Reading about 'Freedom or Death' (basedupon Maulana Mohammad Ali Jauhar) or 'Martyr' (based upon RajaSarwar Shaheed), cannot be expected to stimulate the interest of anychild. Prescribed for eight year-old children, the very titles epitomize theabsence of the element of pedagogy. Children's actual role models arefrom among their own (nuclear and extended) family, neighbours,teachers, older schoolmates, the postman, etc. They cannot be expectedto relate to personalities from history that are obscure individuals in theirworld. It is not surprising that children tend to lose interest. The content ofthe textbooks taught in public primary schools may well be an importantfactor in absenteeism and even dropping out.
These textbooks are the product of a curriculum designed in
CH
APTE
R 5
So
cia
l D
eve
lop
me
nt
in P
aki
sta
n,
20
02
-03
107
THE OFFICIAL APPROACH TO LEARING
Pakistan's publicprimary education
curricula, syllabiand textbooks are
a far cry from sucha pedagogical
process.

CH
APTE
R 5
So
cia
l D
eve
lop
me
nt
in P
aki
sta
n,
20
02
-03
108
BOX 5.1 HAMARA GHAR
Our Home
This is our house. My father and mother live here. My grandfather and grandmother also live here. Us brothers andsisters also live here. Mother, father, grandfather and grandmother love us very much.
There are two rooms in our house. One is the kitchen. In the kitchen are the cooking utensils. My mother cooks inthe kitchen. My elder sister helps mother in cooking. We do all our own work. It is good to do work.
There is a big courtyard in our house. In the courtyard there is a flowerbed. There are flowering plants in theflowerbed. We water these plants every day.
We also keep a cow and a goat. We get milk from them. We also make lassi and butter from the milk.
We keep our home neat and clean. We keep our things in their place. We work together. Our house is very nice.
Amjad is my friend. His house is close to our house. Amjad's father is a doctor. He is a very good man. He takesgood care of the neighbours. He treats poor patients free of charge.
Exercise:1. Who lives in your house?
2. Who is your neighbour?
3. What things can you see in the picture of the kitchen? What are these things used for?
4. What animals do you have in your house?
5. Join alphabets to make words:6. Activity:
Make a picture of your house on your slate.
Source: Meri Kitab, Pehli Jamat Kay Liay [(Urdu) My Book, for Class 1], Lahore: Punjab Textbook Board, 1996
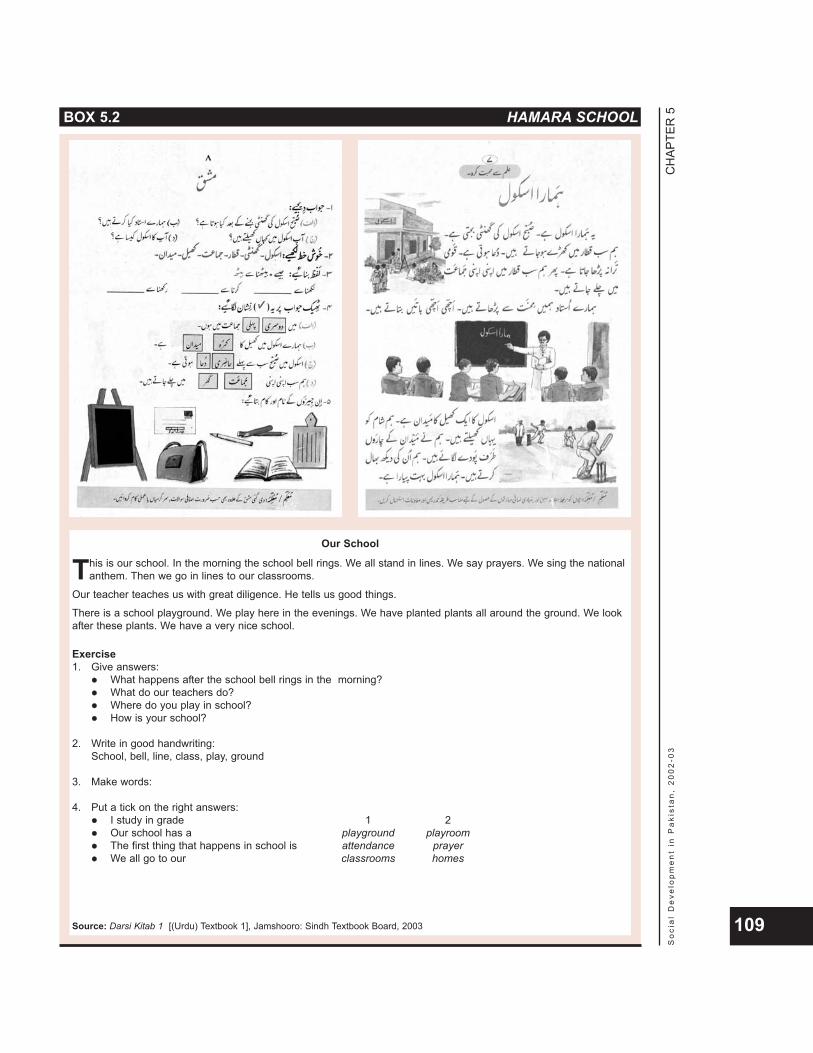
CH
APTE
R 5
So
cia
l D
eve
lop
me
nt
in P
aki
sta
n,
20
02
-03
109
BOX 5.2 HAMARA SCHOOL
Our School
This is our school. In the morning the school bell rings. We all stand in lines. We say prayers. We sing the nationalanthem. Then we go in lines to our classrooms.
Our teacher teaches us with great diligence. He tells us good things.
There is a school playground. We play here in the evenings. We have planted plants all around the ground. We lookafter these plants. We have a very nice school.
Exercise1. Give answers:
What happens after the school bell rings in the morning?What do our teachers do?Where do you play in school?How is your school?
2. Write in good handwriting:School, bell, line, class, play, ground
3. Make words:
4. Put a tick on the right answers:I study in grade 1 2Our school has a playground playroomThe first thing that happens in school is attendance prayerWe all go to our classrooms homes
Source: Darsi Kitab 1 [(Urdu) Textbook 1], Jamshooro: Sindh Textbook Board, 2003

CH
APTE
R 5
So
cia
l D
eve
lop
me
nt
in P
aki
sta
n,
20
02
-03
110
BOX 5.3 WALIDAIN KAA EHTERAM
Respect for parents
Abid was the eldest among all his brothers and sisters. He was a very goodand intelligent person. He always obeyed his parents and loved his brothers
and sisters. He was always the first to greet his elders and respected everyone fromthe depth of his heart. He regularly went to the mosque for prayers. Once he wasthrough with school, he would help his mother in household chores.
One day his friend invited him to his house. He had thought he would go to hisfriend's house after the asar prayers. Suddenly for some reason he got upset with hismother. Coming home from the mosque he changed his clothes, took his bicycle andquietly went off to his friend's house. He rode his bicycle with a heavy heart.
It was only yesterday that he had heard this hadith in the mosque after jumaprayers. A companion (ra) had asked Prophet Muhammad (SA) whom he shouldserve the most in the world. The Prophet had replied, “Your mother”. The companionthen asked. “And after this whom should I serve the most”. The Prophet had replied.“Your mother”. When the companion asked the same question a third time, theProphet said, “Serve your mother the most”. When the companion asked the questionfor the fourth time, the Prophet said, “Your father”.
Abid was feeling very bad for having been upset with his mother. He was alreadyhalf way to his friend's house. He decided to turn back. He came home andapologized to his mother for his disrespect. His mother lovingly hugged him. He nowtook permission from his mother and went off to his friend's house.
Source: Meri Kitab, Teesri Jamat Key Liay [(Urdu) My Book, for Class 3], Lahore: PunjabTextbook Boards, 2003
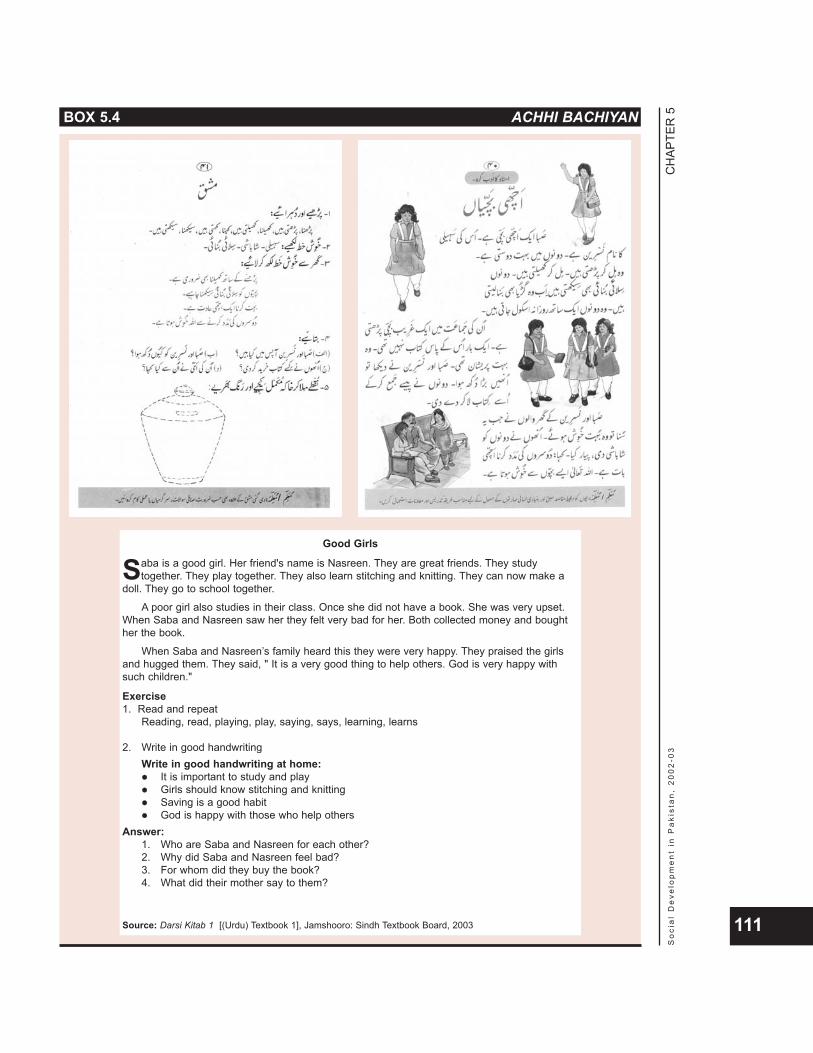
CH
APTE
R 5
So
cia
l D
eve
lop
me
nt
in P
aki
sta
n,
20
02
-03
111
BOX 5.4 ACHHI BACHIYAN
Good Girls
Saba is a good girl. Her friend's name is Nasreen. They are great friends. They studytogether. They play together. They also learn stitching and knitting. They can now make a
doll. They go to school together.
A poor girl also studies in their class. Once she did not have a book. She was very upset.When Saba and Nasreen saw her they felt very bad for her. Both collected money and boughther the book.
When Saba and Nasreen’s family heard this they were very happy. They praised the girlsand hugged them. They said, " It is a very good thing to help others. God is very happy withsuch children."
Exercise1. Read and repeat
Reading, read, playing, play, saying, says, learning, learns
2. Write in good handwritingWrite in good handwriting at home:
It is important to study and playGirls should know stitching and knittingSaving is a good habitGod is happy with those who help others
Answer:1. Who are Saba and Nasreen for each other?2. Why did Saba and Nasreen feel bad?3. For whom did they buy the book?4. What did their mother say to them?
Source: Darsi Kitab 1 [(Urdu) Textbook 1], Jamshooro: Sindh Textbook Board, 2003
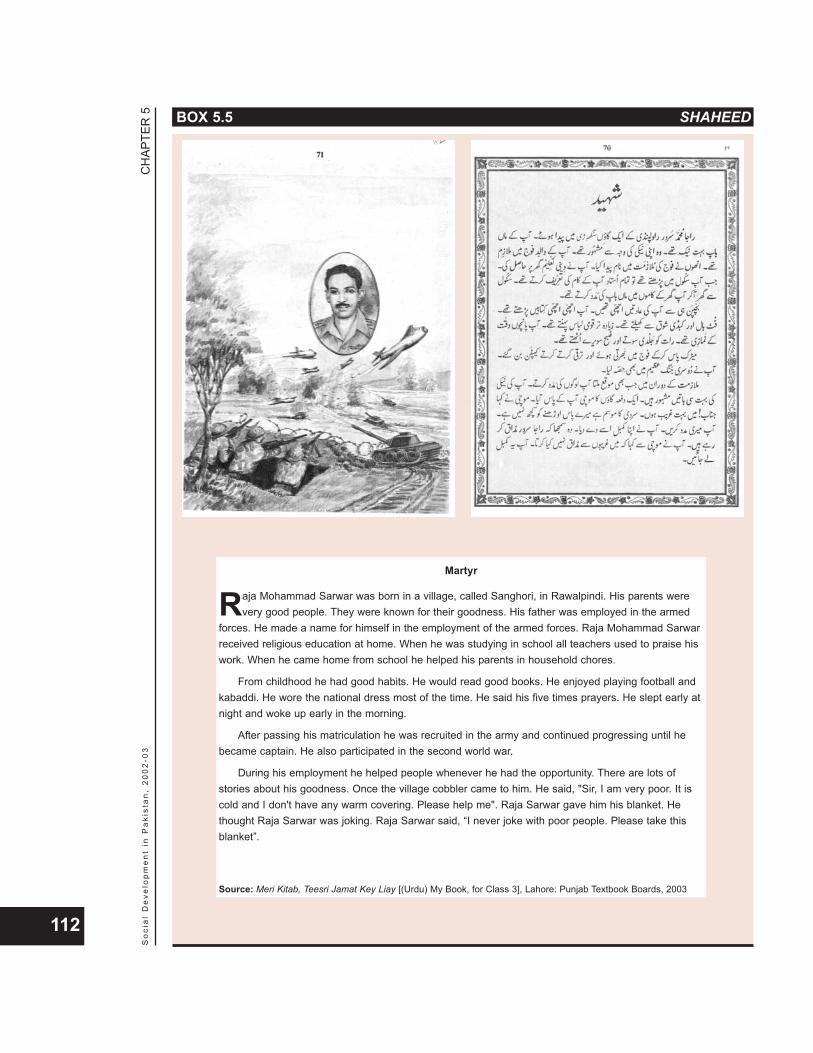
CH
APTE
R 5
So
cia
l D
eve
lop
me
nt
in P
aki
sta
n,
20
02
-03
112
BOX 5.5 SHAHEED
Martyr
Raja Mohammad Sarwar was born in a village, called Sanghori, in Rawalpindi. His parents werevery good people. They were known for their goodness. His father was employed in the armed
forces. He made a name for himself in the employment of the armed forces. Raja Mohammad Sarwarreceived religious education at home. When he was studying in school all teachers used to praise hiswork. When he came home from school he helped his parents in household chores.
From childhood he had good habits. He would read good books. He enjoyed playing football andkabaddi. He wore the national dress most of the time. He said his five times prayers. He slept early atnight and woke up early in the morning.
After passing his matriculation he was recruited in the army and continued progressing until hebecame captain. He also participated in the second world war.
During his employment he helped people whenever he had the opportunity. There are lots ofstories about his goodness. Once the village cobbler came to him. He said, "Sir, I am very poor. It iscold and I don't have any warm covering. Please help me". Raja Sarwar gave him his blanket. Hethought Raja Sarwar was joking. Raja Sarwar said, “I never joke with poor people. Please take thisblanket”.
Source: Meri Kitab, Teesri Jamat Key Liay [(Urdu) My Book, for Class 3], Lahore: Punjab Textbook Boards, 2003
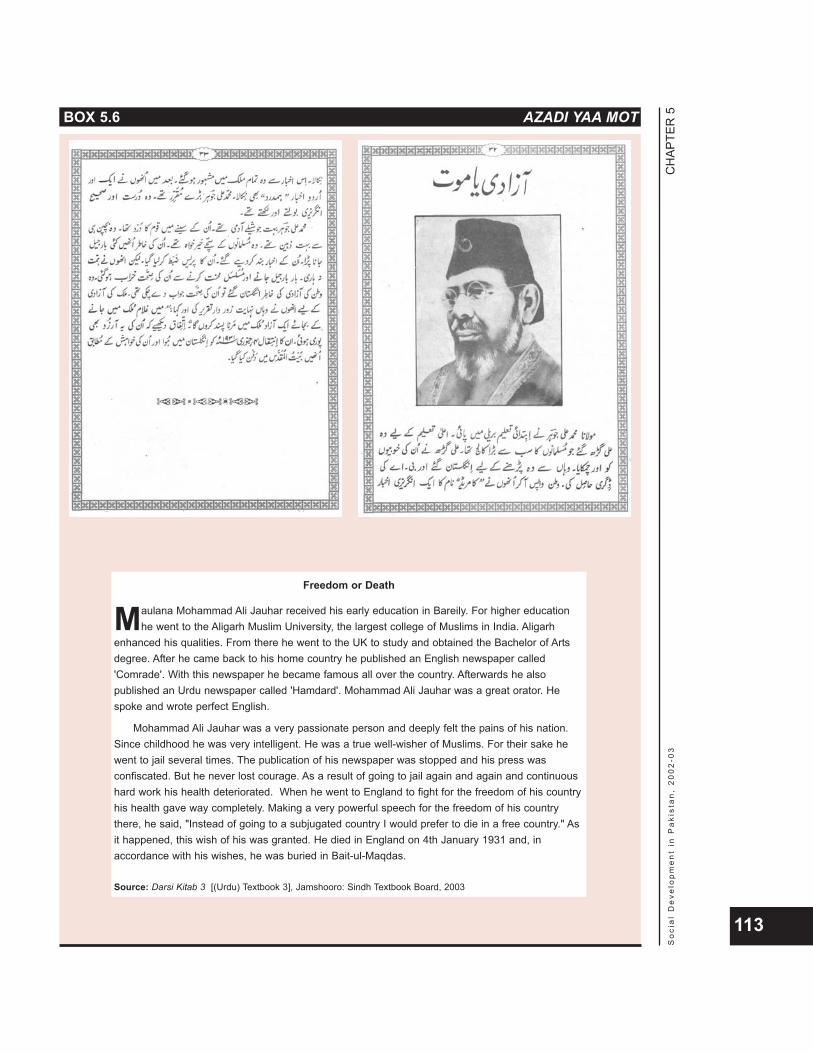
CH
APTE
R 5
So
cia
l D
eve
lop
me
nt
in P
aki
sta
n,
20
02
-03
113
BOX 5.6 AZADI YAA MOT
Freedom or Death
Maulana Mohammad Ali Jauhar received his early education in Bareily. For higher educationhe went to the Aligarh Muslim University, the largest college of Muslims in India. Aligarh
enhanced his qualities. From there he went to the UK to study and obtained the Bachelor of Artsdegree. After he came back to his home country he published an English newspaper called'Comrade'. With this newspaper he became famous all over the country. Afterwards he alsopublished an Urdu newspaper called 'Hamdard'. Mohammad Ali Jauhar was a great orator. Hespoke and wrote perfect English.
Mohammad Ali Jauhar was a very passionate person and deeply felt the pains of his nation.Since childhood he was very intelligent. He was a true well-wisher of Muslims. For their sake hewent to jail several times. The publication of his newspaper was stopped and his press wasconfiscated. But he never lost courage. As a result of going to jail again and again and continuoushard work his health deteriorated. When he went to England to fight for the freedom of his countryhis health gave way completely. Making a very powerful speech for the freedom of his countrythere, he said, "Instead of going to a subjugated country I would prefer to die in a free country." Asit happened, this wish of his was granted. He died in England on 4th January 1931 and, inaccordance with his wishes, he was buried in Bait-ul-Maqdas.
Source: Darsi Kitab 3 [(Urdu) Textbook 3], Jamshooro: Sindh Textbook Board, 2003
These textbooks are the product of a curriculum designed inaccordance with the official education policy. National educationalobjectives are based on a conspicuous lack of understanding of thepedagogical and emotional requirements of young learners. A striking andcommon feature of all educational policies is the emphasis on thepreservation and inculcation of national 'ideology' as the overarchingeducational aim; this renders the primary education process an exercisein indoctrination rather than pedagogy. The educational policy frameworkhas led to a curriculum design that is narrow and didactic, and whichleads to learning by rote and rigid classroom control. The function ofeducation has been reduced to what policy makers think young childrenought to know, instead of promoting the spirit of inquiry, which is thenatural process of learning. The transformation of the nation's childreninto patriotic and religious individuals has been pursued at the cost ofdeveloping their innate skills and their ability to reflect, analyze anddeduce rationally. Bereft of a reasonable level of competency in thepopulace, it is questionable whether even the aim of inculcating its'ideology' can be adequately achieved by the state within the currenteducation set up.
An example of the way in which national educational policyobjectives inform the curriculum is provided in the following introductionto the current Urdu Curriculum for Grades 4-5, i.e., for children under 11years of age:
National Objectives of EducationThe basic aim of the education system of every nation is to produceindividuals who are beneficial and efficacious in attaining and executingnational ideals, values and traditions. The content of educational materialand the total programme of schools are, therefore, related to thesenational objectives. But it is in the teaching of language that theseeducational objectives can be presented most prominently and clearly. Itis particularly in the first two grades that more time is spent on teachinglanguage and the basic concepts of other disciplines are also instilled bythe use of language. Therefore, it is absolutely essential thatdevelopment of textbooks, selection of content of learning, topics forteaching, debate and discussion and the teaching methodology reflectthe national objectives everywhere. Therefore:
1. Students should be made aware that they are members of theMuslim nation and, that is why according to Islamic values theymust aim to become honest, virtuous, patriotic, serving humanityand daring mujahids.
2. Students should be made to have love and respect for allPakistanis.
3. Students should be made aware of respect and ceremonyregarding the national anthem and the national flag and made tofollow these.
4. Students should be made to respect national and regionallanguages.
5. Students should be encouraged to propagate products andnational dress of Pakistan.
6. Students should be made to study national literature and culture.
CH
APTE
R 5
So
cia
l D
eve
lop
me
nt
in P
aki
sta
n,
20
02
-03
114
The educationalpolicy frameworkhas led to acurriculum designthat is narrow anddidactic, and whichleads to learning byrote and rigidclassroom control.
7. Students should be made to inculcate respect for labour, simpleliving, self-confidence and hardy living.
8. Students should be made to have feelings of sacrifice for theprotection of the territory, unity and traditions of Pakistan.
9. The topics for speeches should be those in which studentsexpress their willingness to dedicate their lives to achieving highideals and, in this way, their attention remains fixed uponreligious and national needs.
10. Ceremonies should be arranged on important national festivals inwhich pledge be taken from children according to the occasionand their adherence to their pledge be emphasized
11. The ideology of Pakistan should be presented as the absolutetruth and never made subject to dispute or debate.
12. There should be no concept of distinction between the worldlyand religious way of life, instead learning material should beproduced according to the Islamic point of view.
Three comments are in order. First, none of the 12 points in thestatement of objectives can be considered relevant from the point of viewof the child's immediate environment and, as such, from a pedagogicalperspective. Second, there is no reference to the development of learningabilities _ cognitive, affective and psychomotor skills _ in children. Andthird, the operative phrase throughout is 'should be made to', whichclearly leaves little room for independent inquiry and discovery, anessential element of learning, and betrays an authoritarian mindset on thepart of the policy makers.
This last point is corroborated by the fact that the FederalSupervision of Curricula Textbooks, Maintenance of Standards ofEducation Act, 1976, entrusts the task of preparing schemes of studies,curricula, and manuscripts of textbooks exclusively to the CurriculumWing of the Federal Ministry of Education. The Curriculum Wing has alsobeen empowered to approve textbooks and to "direct any person oragency in writing to delete, amend or withdraw any portion, or the whole,of the curriculum, textbook or reference material prescribed for any classof an institution". Failure to carry out the directive is punishable withimprisonment for a term extending to one year. Clearly, the law does notleave much room for intellectual autonomy of school heads and teachers.
The introduction to the National Curriculum for Social Studies forClasses 1-5, i.e., for children under 11 years of age, states: "The subjectof Social Studies is offered as a compulsory subject in the scheme ofstudies at elementary level of education in Pakistan … the contents aresuggested in the cognitive, affective and psychomotor domains for eachtarget group … The concept of the ideology of Pakistan is rehearsed andoutlined, aiming at behavioral and attitudinal change … the curriculum ismodernized in such a way that it encourages the students to be critical ofthings in the context of Islamic heritage, attracting the personal and sociallife. It would inculcate among students a sense of gratitude towardsAlmighty Allah, the feeling of national integrity, cohesion and self-reliancepatronizing the behaviour pattern of national character, it will develop apositive attitude towards the study of Social Studies."
An examination of the list of objectives to be achieved by developingcognitive, affective and psychomotor skills as identified in this Curriculum,however, betrays a lack of understanding of the meaning and essence of
CH
APTE
R 5
So
cia
l D
eve
lop
me
nt
in P
aki
sta
n,
20
02
-03
115
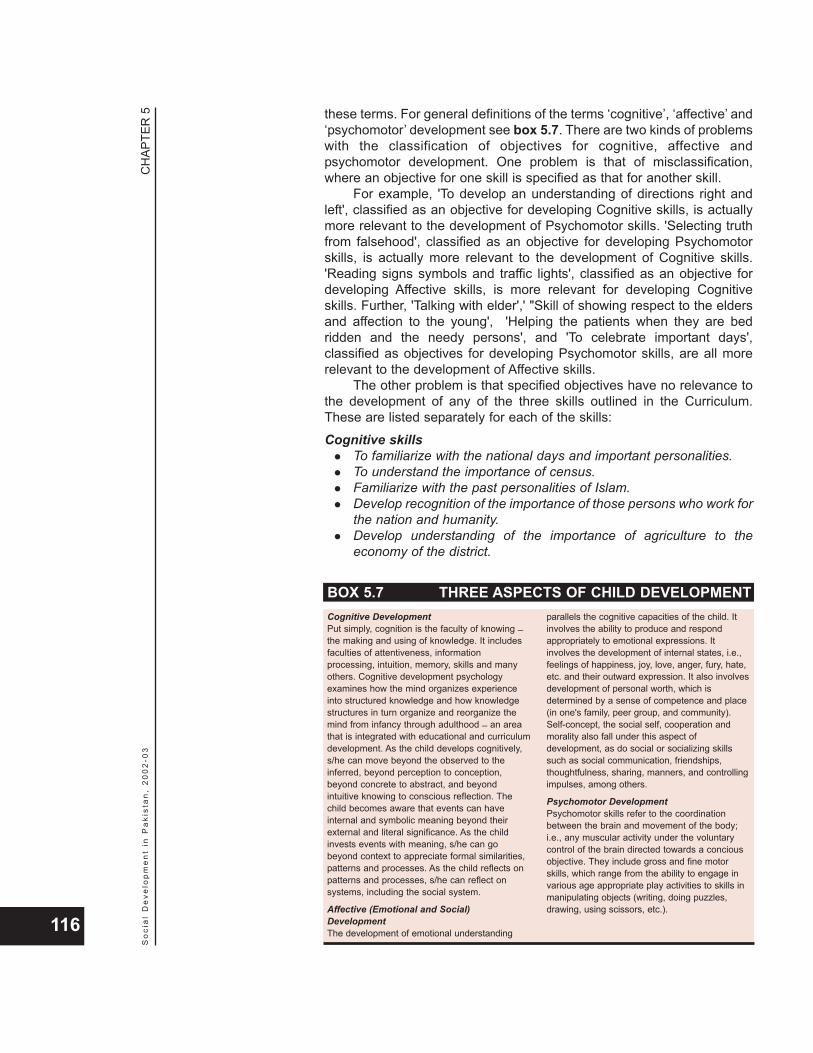
these terms. For general definitions of the terms ‘cognitive’, ‘affective’ and‘psychomotor’ development see box 5.7. There are two kinds of problemswith the classification of objectives for cognitive, affective andpsychomotor development. One problem is that of misclassification,where an objective for one skill is specified as that for another skill.
For example, 'To develop an understanding of directions right andleft', classified as an objective for developing Cognitive skills, is actuallymore relevant to the development of Psychomotor skills. 'Selecting truthfrom falsehood', classified as an objective for developing Psychomotorskills, is actually more relevant to the development of Cognitive skills.'Reading signs symbols and traffic lights', classified as an objective fordeveloping Affective skills, is more relevant for developing Cognitiveskills. Further, 'Talking with elder',' "Skill of showing respect to the eldersand affection to the young', 'Helping the patients when they are bedridden and the needy persons', and 'To celebrate important days',classified as objectives for developing Psychomotor skills, are all morerelevant to the development of Affective skills.
The other problem is that specified objectives have no relevance tothe development of any of the three skills outlined in the Curriculum.These are listed separately for each of the skills:Cognitive skills
To familiarize with the national days and important personalities. To understand the importance of census.Familiarize with the past personalities of Islam.Develop recognition of the importance of those persons who work forthe nation and humanity.Develop understanding of the importance of agriculture to theeconomy of the district.
CH
APTE
R 5
So
cia
l D
eve
lop
me
nt
in P
aki
sta
n,
20
02
-03
116
BOX 5.7 THREE ASPECTS OF CHILD DEVELOPMENTCognitive DevelopmentPut simply, cognition is the faculty of knowing _the making and using of knowledge. It includesfaculties of attentiveness, informationprocessing, intuition, memory, skills and manyothers. Cognitive development psychologyexamines how the mind organizes experienceinto structured knowledge and how knowledgestructures in turn organize and reorganize themind from infancy through adulthood _ an areathat is integrated with educational and curriculumdevelopment. As the child develops cognitively,s/he can move beyond the observed to theinferred, beyond perception to conception,beyond concrete to abstract, and beyondintuitive knowing to conscious reflection. Thechild becomes aware that events can haveinternal and symbolic meaning beyond theirexternal and literal significance. As the childinvests events with meaning, s/he can gobeyond context to appreciate formal similarities,patterns and processes. As the child reflects onpatterns and processes, s/he can reflect onsystems, including the social system.
Affective (Emotional and Social)DevelopmentThe development of emotional understanding
parallels the cognitive capacities of the child. Itinvolves the ability to produce and respondappropriately to emotional expressions. Itinvolves the development of internal states, i.e.,feelings of happiness, joy, love, anger, fury, hate,etc. and their outward expression. It also involvesdevelopment of personal worth, which isdetermined by a sense of competence and place(in one's family, peer group, and community).Self-concept, the social self, cooperation andmorality also fall under this aspect ofdevelopment, as do social or socializing skillssuch as social communication, friendships,thoughtfulness, sharing, manners, and controllingimpulses, among others.
Psychomotor DevelopmentPsychomotor skills refer to the coordinationbetween the brain and movement of the body;i.e., any muscular activity under the voluntarycontrol of the brain directed towards a conciousobjective. They include gross and fine motorskills, which range from the ability to engage invarious age appropriate play activities to skills inmanipulating objects (writing, doing puzzles,drawing, using scissors, etc.).

To develop an idea of the implications of over population/underpopulation.Enhance learning about the lives and achievements of thedistinguished persons of the province who worked for the bettermentof the people of Pakistan.Develop understanding of Hindu Muslim differences and need forPakistan.To get acquainted with the personalities who worked for theindependence of Pakistan.To enhance understanding of the forces working against Pakistan.Create awareness about the freedom movement.Promote realization about the Kashmir issue and Indian role.Finalize about the institutions and organizations concerned with thewelfare of society. Develop clear comprehension of the nature, causes, and remediesof major social problems in Pakistan.Familiarize with the obstacles in the way of national and theirsolutions.Create awareness about the great personalities who contributedtowards the making of Pakistan.
Affective skillsSafety and security for private on the public property.Develop a sense of working hard and honestly to become abeneficial personality for the fellow beings.Develop a sense of respect and recognition towards importantpersonalities.Develop the sense of recognition and respect for the greatpersonalities of the past.Love for the ideology of Pakistan.Develop the sense of preservation of ideology, integrity and securityof Pakistan.Enhance a sense of respect for cooperation and preservation of theideology of Pakistan. Develop a sense of appreciation for the Muslim heroes.
CH
APTE
R 5
So
cia
l D
eve
lop
me
nt
in P
aki
sta
n,
20
02
-03
117Abandoned classroom
Develop the feelings of development of the country through makingbetter utilization of climate.Enhance a sense of respect and reverence for the Muslim heroes.
Psychomotor skillsTo clean family and school transport.To develop the skills of listening to the stories of great personalities.Listening to the radio and watching television.Making map and flag.Helping needy people.
There appears to be an excessive preoccupation with 'great'personalities, whose recognition and reverence is specified as anobjective for Cognitive, Affective and Psychomotor skills.
Furthermore, to include the following as serving the objectives ofdeveloping cognitive skills in children below 11 years of age is difficult tocomprehend:
To understand the importance of census.To develop an idea of the implications of over population/underpopulation.Develop understanding of Hindu Muslim differences and need forPakistan. To enhance understanding of the forces working against Pakistan.Promote realization about the Kashmir issue and Indian role.Develop clear comprehension of the nature, causes, and remediesof major social problems in Pakistan.Familiarize with the obstacles in the way of national and theirsolution.
Even more difficult to understand is the requirement for the contentof teaching to include 'Relationship between the various administrativeunits of the district' and 'Introduction to the devolution plan' to eight-year-old children in Class 3 for development of cognitive skills. Equallyinexplicable is the Learning Outcome for Affective skills for the sameclass: "Write some sentences on how better relations betweenprovinces/area and center can develop with reference to nationalcohesion and state integrity".
The curriculum framework has little room for the intrinsic interests ofchildren, making the content of learning alien to their process ofunderstanding. The only way to 'learn' is by rote and teachers areexpected to require students to give answers, which are 'acceptable'within the curriculum framework. Clearly, this process does not qualify aspedagogy.
Children learn best when the content of learning is appropriate to theirdevelopment level, relevant to their immediate interests and
presented in a manner that they find enjoyable. If the syllabus andteaching materials are stimulating, children learn freely and without theuse of coercion. These precepts have been recognized by thegovernment and incorporated in the Conceptual Framework of theNational Curriculum 2000, prepared by the National Committee on
CH
APTE
R 5
So
cia
l D
eve
lop
me
nt
in P
aki
sta
n,
20
02
-03
118
THE PEDAGOGICAL APPROACH TO LEARNINGChildren learn bestwhen the content oflearning isappropriate to theirdevelopment level,relevant to theirimmediate interestsand presented in amanner that theyfind enjoyable.

Education (NCE) of the Federal Ministry of Education with participativecontribution from a large body of education experts from civil society. Aremarkably enlightened document, it is also frank in admitting that:
Pakistan's educational system has so far been based on the pre-Froebalian belief that the primary role of education is to producegood citizens through repeated sermonizing and regimentation ofthe school environment. While few would disagree that studentsshould become good citizens, sermonizing is the anti-thesis ofmeaningful learning and of intellectual growth.
This conflict between sermonizing and academic regimentation, onthe one hand, and the need for facilitating cognitive and emotionaldevelopment of individual learners on the other, has continued totrouble policy makers in Pakistan. Despite good intentions and hugeresources, and despite eight education policies in 50 years,schooling has yet to become an attractive proposition and a happyexperience for our children.With a focus on primary education, the Conceptual Framework
proposes a learning process schema that covers objectives, premisesand methods and meets the criteria of sound pedagogy (see chart 5.1).It calls for fundamental paradigm shifts on a number of fronts. It suggestsa shift of focus from more schools to better schools, from recruitment ofmore teachers to improving teaching content and methods, fromsermonizing and regimentation of the school environment to thecognitive, emotional, social and spiritual development of children, andfrom rote learning to a rational and intellectually stimulating learningprocess. It recognizes the need for intellectual autonomy and the role ofeducation in creating an environment of free inquiry and debate andrespect for diversity.
CH
APTE
R 5
So
cia
l D
eve
lop
me
nt
in P
aki
sta
n,
20
02
-03
119
Objectives
SocialDevelopment
EmotionalDevelopment
CognitiveDevelopment
SpiritualDevelopment
Premise
Method
Intellectual AutonomyFacilitation
of the InnateCompulsion to Learn
Development of ConceptsThrough Children’sImmediate Context
Integrated Learning Analysis OrientedExamination System
Less is More: Learning How to Learn
CHART 5.1 THE LEARNING PROCESS
Source: Government of Pakistan, Ministry of Education, National Curriculum 2002: A ConceptualFramework
Independent citizens' groups have also taken the initiative toproduce alternative textbooks designed to facilitate a way of teaching thatallows for spontaneity, individuality and creativity by tapping into thechild's inner compulsion to learn. These books are colourfully designedand contain material that can at once evoke the interest and enthusiasmof a child. That some of the content may be considered 'nonsensical' isirrelevant, as it serves the purpose of triggering the child's imagination(see boxes 5.8 and 5.9).
The alternative textbooks and teaching methodology provide forintegrated concept development rather than the teaching of isolated facts.They emphasize spontaneity and self-activity and stimulate the child'sown powers of seeing, judging, reasoning and experimentation in realisticcontexts. The process of learning begins with the child's immediatesurroundings and slowly moves out into the wider world _ from the knownto the unknown, from the simple to the complex, and from the concrete tothe abstract. Child-centered learning tools and activities allow them toexplore the essential elements of mathematics, science, language andsocial studies.
The problem solving and explorations of mathematics and scienceempower students to imagine the unimagined, see patterns and analyzesituations, and appreciate the harmonies of the natural world. Use oflanguage underpins the whole learning process, as it is the major meansof understanding and communicating. Social studies allow exploration ofissues and formation of understandings about concepts in relation to thesocietal environment. The importance of art, colour, images, and play isrecognized, not only as a means of understanding, but also as a meansof self expression and creativity.
The teacher takes on the role of a facilitator rather than an all-knowing instructor. This relationship is the first building block of ameaningful learning environment. Rather than telling students or evenguiding them as to what facts they should remember and memorize, theteacher's role becomes one of asking questions and helping studentsinterpret and make sense of their world and their fantasies. Topics forstudy are captured from the talk of children as well as the known interestsof children _ pictures and colours, animals and plants, playing and make-believe, naughtiness and laughter. Children's language skills and critical
CH
APTE
R 5
So
cia
l D
eve
lop
me
nt
in P
aki
sta
n,
20
02
-03
120
BOX 5.8 KOI BAAT NAHI
Koi Baat Naheen, Published in 2001-02, isreproduced here as an illustration of the
shift from moralizing to teaching throughchildren’s real situations.
That’s Quite AlrightYou may be fat or thinshort or tallor very tallYou may be dark or fairThat’s quite alright
Sometimes you make mistakesSometimes you are leftbehind in a raceYour do not do well in examsSometimes you feel like cryingThat’s quite alright
You only want to wearclothes you likeThe food cooked at homesometimes you don’t likeSometimes you want to be on your own
Your room is often in a meesYou sleep lateon holidaysThat’s quite alright
Sometimes you are naughty tooAnd that’s quite alright too
You are wonderfulJust the way you are
Source: Koi Baat Nahi (Urdu: That’s Quite Alright),Karachi: The Book Group, 2002.
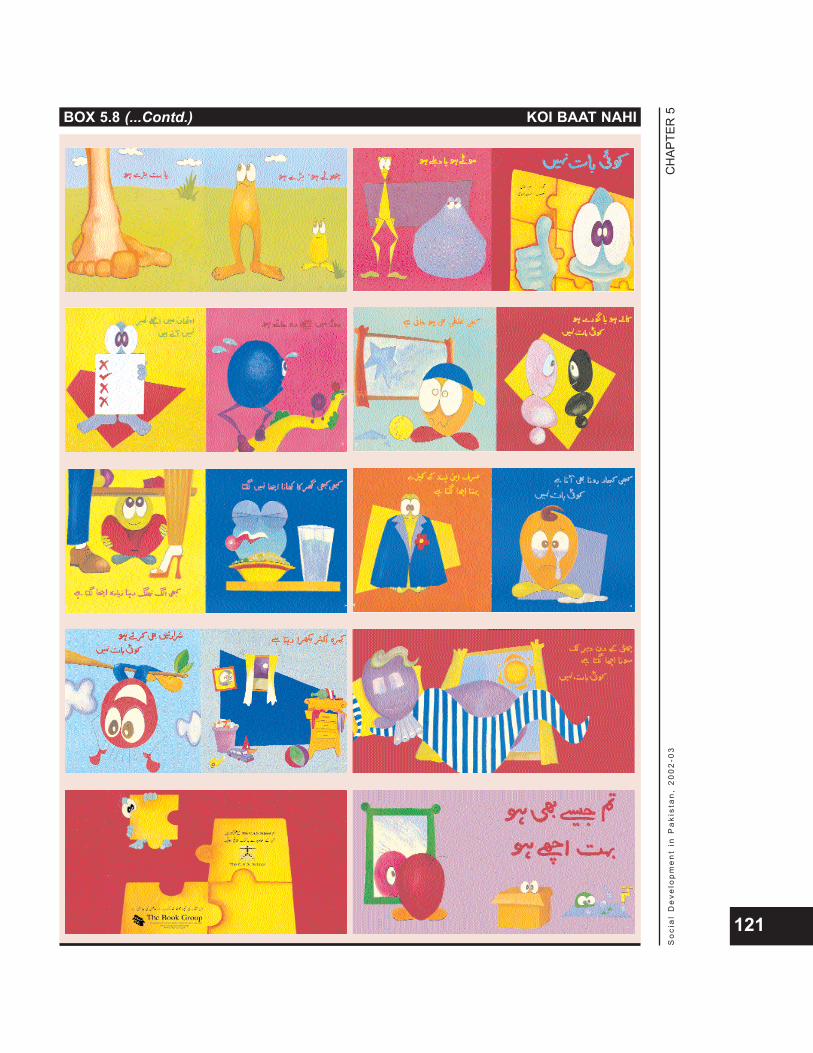
CH
APTE
R 5
So
cia
l D
eve
lop
me
nt
in P
aki
sta
n,
20
02
-03
121
BOX 5.8 (...Contd.) KOI BAAT NAHI
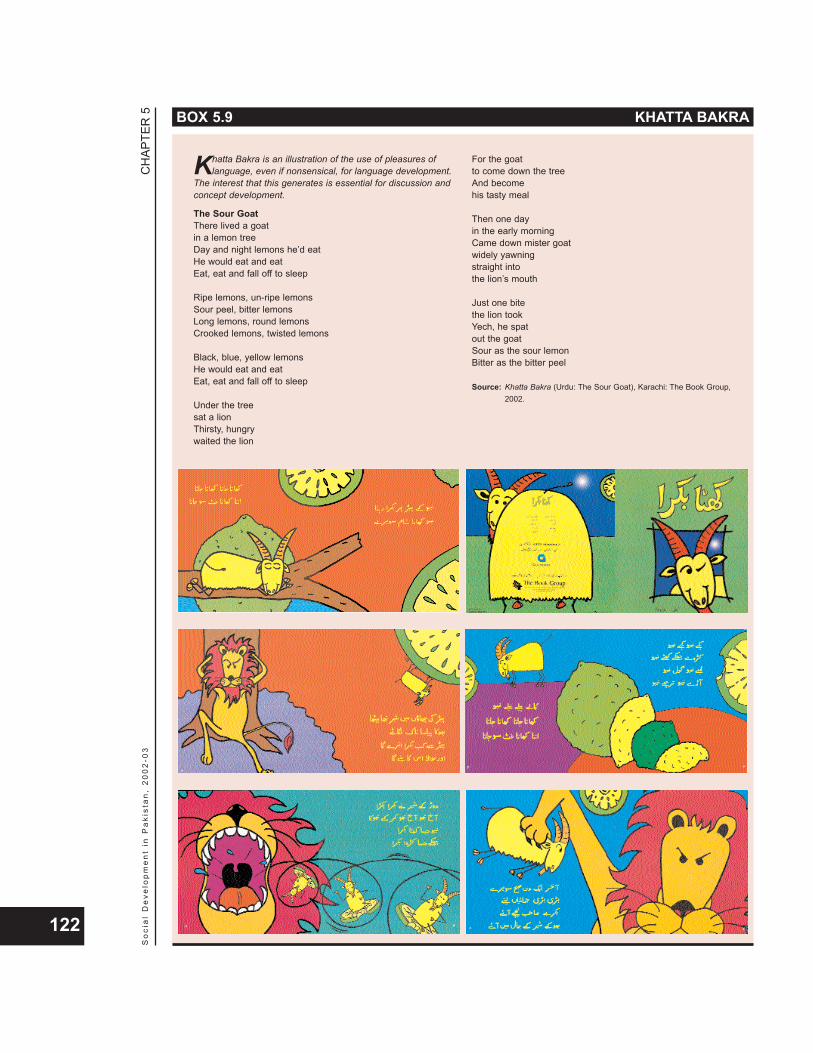
CH
APTE
R 5
So
cia
l D
eve
lop
me
nt
in P
aki
sta
n,
20
02
-03
122
BOX 5.9 KHATTA BAKRA
Khatta Bakra is an illustration of the use of pleasures oflanguage, even if nonsensical, for language development.
The interest that this generates is essential for discussion andconcept development.
The Sour GoatThere lived a goatin a lemon treeDay and night lemons he’d eatHe would eat and eatEat, eat and fall off to sleep
Ripe lemons, un-ripe lemonsSour peel, bitter lemonsLong lemons, round lemonsCrooked lemons, twisted lemons
Black, blue, yellow lemonsHe would eat and eatEat, eat and fall off to sleep
Under the treesat a lionThirsty, hungrywaited the lion
For the goatto come down the treeAnd becomehis tasty meal
Then one dayin the early morningCame down mister goatwidely yawningstraight intothe lion’s mouth
Just one bitethe lion tookYech, he spatout the goatSour as the sour lemonBitter as the bitter peel
Source: Khatta Bakra (Urdu: The Sour Goat), Karachi: The Book Group,2002.
faculties improve when they are encouraged to read and explore a varietyof fiction, non-fiction and informative text. The emphasis on the real-life ormake-believe world of children allows social and emotional learning. Thedirect involvement of learners in activities produces deeperunderstanding of the content through the development of skills that arereadily transferable to life and work. This is the process by which childrengrow up to be individuals capable of creativity and scholarship.
Though the actual knowledge gained is important, the emphasis isplaced firmly on the innate curiosity of children. Since learning isinherently interdisciplinary, the only valuable way to measure learning isto make child-specific assessment part of the learning process. Thispresupposes dialogue, provides time for thinking and allows mistakes asessential to long-term development objectives.
The above sections highlight the fact that issues of low enrolmentand high dropouts at the primary level are indicators of a fundamentalflaw: inputs to the primary education system are incompatible with thelearning dynamics of children. After a brief overview of the universalconsensus on learning processes, it has been shown that the nationalapproach to education is largely devoid of pedagogical imperatives,driven as it is by a national curriculum that aims more to indoctrinate thanto facilitate learning, and textbooks that allow little room for developmentby the teachers or for the students. However, positive developments havealso been taking place. As mentioned above, the Conceptual Frameworkof the National Curriculum 2000 clearly attempts to move the policydebate towards pedagogy. Alternative textbooks produced by citizens'groups are available to facilitate this transition. Results of this gradualprocess can be seen in the case of officially prescribed textbooks as well(see box 5.10).
Inputs to primary education, in terms of textbooks, teachers andteaching methods, are not only determined by policy choices betweenpedagogy and indoctrination, but also by the management structure ofeducation in the country, which does not give teachers and principalsprimary responsibility in influencing what is taught and how it is taught.
Though education is a provincial subject, the Federal Ministry ofEducation gives broad outlines regarding curricula and textbooks to
provincial Education departments and textbook boards. A CabinetMinister, assisted by a Secretary from the federal civil services, heads theFederal Ministry of Education. The Ministry is composed of six wings andthere are numerous attached departments and autonomous bodies. Inaddition to the Secretary, there are over 100 other officers: AdditionalSecretaries, Joint Secretaries, Deputy Secretaries, Educational Advisors,Joint Educational Advisors, Deputy Educational Advisors, AssistantEducational Advisors, Educational Officers, Research Officers, AssistantResearch Officers, Section Officers, Project Managers, Project In-charges, etc. The salary grades of these officers range from 22 to 17.
At the provincial level, the Department of Education is headed by aprovincial Minister, assisted by the provincial Secretary from theprovincial civil services, who presides over a staff of over 50 officers. In
CH
APTE
R 5
So
cia
l D
eve
lop
me
nt
in P
aki
sta
n,
20
02
-03
123
MANAGEMENT STRUCTURE OF EDUCATION
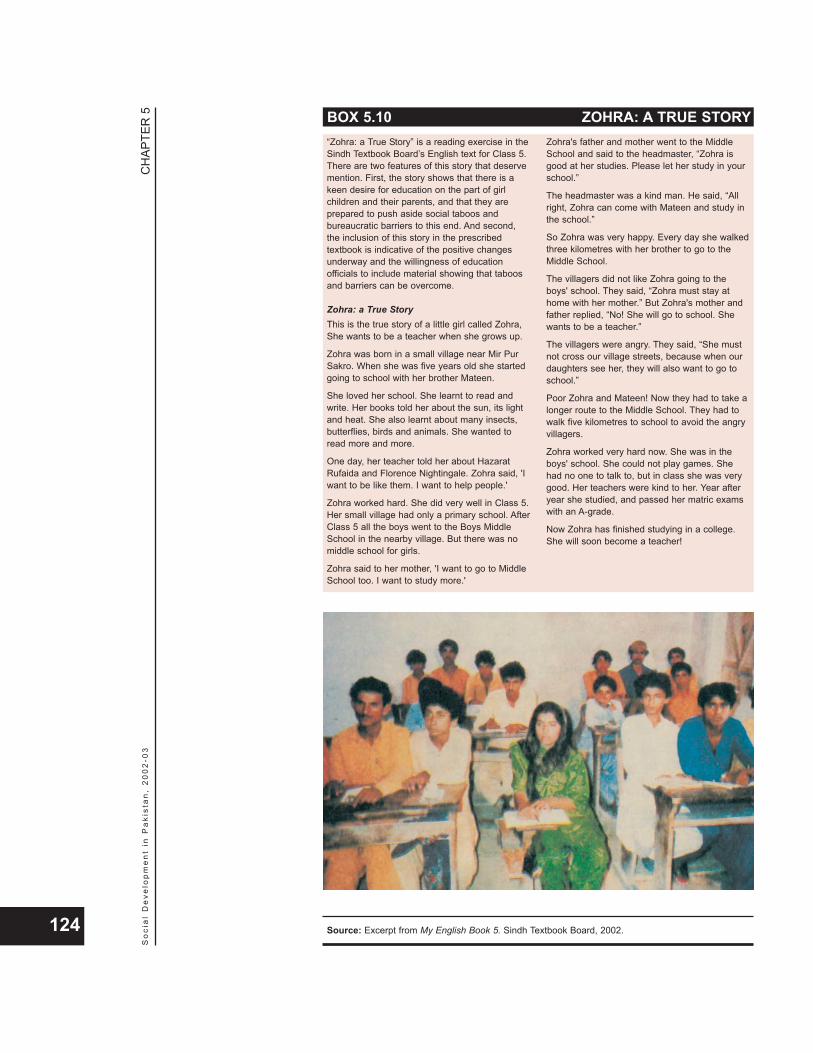
CH
APTE
R 5
So
cia
l D
eve
lop
me
nt
in P
aki
sta
n,
20
02
-03
124
BOX 5.10 ZOHRA: A TRUE STORY“Zohra: a True Story” is a reading exercise in theSindh Textbook Board’s English text for Class 5.There are two features of this story that deservemention. First, the story shows that there is akeen desire for education on the part of girlchildren and their parents, and that they areprepared to push aside social taboos andbureaucratic barriers to this end. And second,the inclusion of this story in the prescribedtextbook is indicative of the positive changesunderway and the willingness of educationofficials to include material showing that taboosand barriers can be overcome.
Zohra: a True StoryThis is the true story of a little girl called Zohra,She wants to be a teacher when she grows up.
Zohra was born in a small village near Mir PurSakro. When she was five years old she startedgoing to school with her brother Mateen.
She loved her school. She learnt to read andwrite. Her books told her about the sun, its lightand heat. She also learnt about many insects,butterflies, birds and animals. She wanted toread more and more.
One day, her teacher told her about HazaratRufaida and Florence Nightingale. Zohra said, 'Iwant to be like them. I want to help people.'
Zohra worked hard. She did very well in Class 5.Her small village had only a primary school. AfterClass 5 all the boys went to the Boys MiddleSchool in the nearby village. But there was nomiddle school for girls.
Zohra said to her mother, 'I want to go to MiddleSchool too. I want to study more.'
Zohra's father and mother went to the MiddleSchool and said to the headmaster, “Zohra isgood at her studies. Please let her study in yourschool.”
The headmaster was a kind man. He said, “Allright, Zohra can come with Mateen and study inthe school.”
So Zohra was very happy. Every day she walkedthree kilometres with her brother to go to theMiddle School.
The villagers did not like Zohra going to theboys' school. They said, “Zohra must stay athome with her mother.” But Zohra's mother andfather replied, “No! She will go to school. Shewants to be a teacher.”
The villagers were angry. They said, “She mustnot cross our village streets, because when ourdaughters see her, they will also want to go toschool.”
Poor Zohra and Mateen! Now they had to take alonger route to the Middle School. They had towalk five kilometres to school to avoid the angryvillagers.
Zohra worked very hard now. She was in theboys' school. She could not play games. Shehad no one to talk to, but in class she was verygood. Her teachers were kind to her. Year afteryear she studied, and passed her matric examswith an A-grade.
Now Zohra has finished studying in a college.She will soon become a teacher!
Source: Excerpt from My English Book 5. Sindh Textbook Board, 2002.
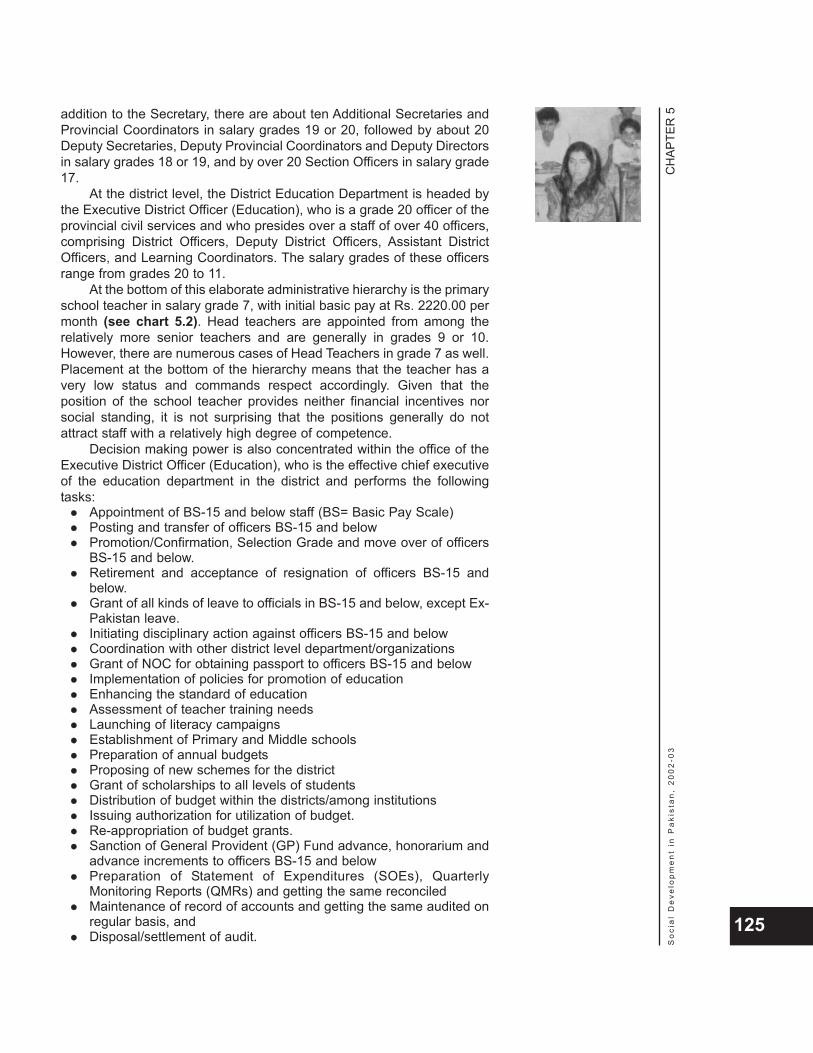
addition to the Secretary, there are about ten Additional Secretaries andProvincial Coordinators in salary grades 19 or 20, followed by about 20Deputy Secretaries, Deputy Provincial Coordinators and Deputy Directorsin salary grades 18 or 19, and by over 20 Section Officers in salary grade17.
At the district level, the District Education Department is headed bythe Executive District Officer (Education), who is a grade 20 officer of theprovincial civil services and who presides over a staff of over 40 officers,comprising District Officers, Deputy District Officers, Assistant DistrictOfficers, and Learning Coordinators. The salary grades of these officersrange from grades 20 to 11.
At the bottom of this elaborate administrative hierarchy is the primaryschool teacher in salary grade 7, with initial basic pay at Rs. 2220.00 permonth (see chart 5.2). Head teachers are appointed from among therelatively more senior teachers and are generally in grades 9 or 10.However, there are numerous cases of Head Teachers in grade 7 as well.Placement at the bottom of the hierarchy means that the teacher has avery low status and commands respect accordingly. Given that theposition of the school teacher provides neither financial incentives norsocial standing, it is not surprising that the positions generally do notattract staff with a relatively high degree of competence.
Decision making power is also concentrated within the office of theExecutive District Officer (Education), who is the effective chief executiveof the education department in the district and performs the followingtasks:
Appointment of BS-15 and below staff (BS= Basic Pay Scale)Posting and transfer of officers BS-15 and belowPromotion/Confirmation, Selection Grade and move over of officersBS-15 and below.Retirement and acceptance of resignation of officers BS-15 andbelow.Grant of all kinds of leave to officials in BS-15 and below, except Ex-Pakistan leave.Initiating disciplinary action against officers BS-15 and below Coordination with other district level department/organizationsGrant of NOC for obtaining passport to officers BS-15 and belowImplementation of policies for promotion of educationEnhancing the standard of educationAssessment of teacher training needsLaunching of literacy campaignsEstablishment of Primary and Middle schoolsPreparation of annual budgetsProposing of new schemes for the districtGrant of scholarships to all levels of studentsDistribution of budget within the districts/among institutionsIssuing authorization for utilization of budget.Re-appropriation of budget grants.Sanction of General Provident (GP) Fund advance, honorarium andadvance increments to officers BS-15 and below Preparation of Statement of Expenditures (SOEs), QuarterlyMonitoring Reports (QMRs) and getting the same reconciledMaintenance of record of accounts and getting the same audited onregular basis, andDisposal/settlement of audit.
CH
APTE
R 5
So
cia
l D
eve
lop
me
nt
in P
aki
sta
n,
20
02
-03
125
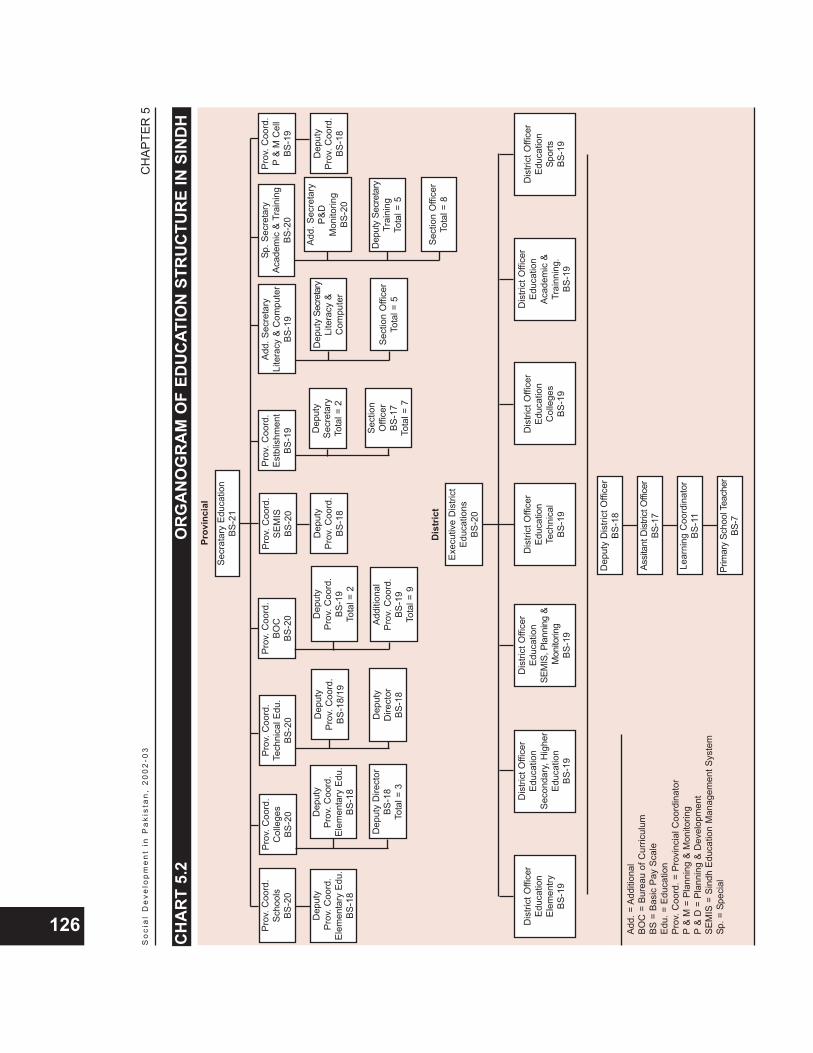
CH
APTE
R 5
So
cia
l D
eve
lop
me
nt
in P
aki
sta
n,
20
02
-03
126 Prov
. Coo
rd.
Scho
ols
BS-2
0
Prov
. Coo
rd.
Col
lege
sBS
-20
Prov
. Coo
rd.
Tech
nica
l Edu
.BS
-20
Prov
. Coo
rd.
BOC
BS
-20
Prov
. Coo
rd.
SEM
ISBS
-20
Prov
. Coo
rd.
Estb
lishm
ent
BS-1
9
Add.
Sec
reta
ryLi
tera
cy &
Com
pute
rBS
-19
Sp. S
ecre
tary
Acad
emic
&Tr
aini
ngBS
-20
Prov
. Coo
rd.
P&
MC
ell
BS-1
9
CH
AR
T 5.
2O
RG
AN
OG
RA
M O
F ED
UC
ATIO
N S
TRU
CTU
RE
IN S
IND
H
Dep
uty
Prov
. Coo
rd.
Elem
enta
ry E
du.
BS-1
8
Dep
uty
Prov
. Coo
rd.
Elem
enta
ry E
du.
BS-1
8
Dep
uty
Dire
ctor
BS
-18
Tota
l = 3
Dep
uty
Prov
. Coo
rd.
BS-1
8/19
Dep
uty
Dire
ctor
BS
-18
Dep
uty
Prov
. Coo
rd.
BS-1
9To
tal =
2
Addi
tiona
l Pr
ov. C
oord
.BS
-19
Tota
l = 9
Dep
uty
Prov
. Coo
rd.
BS-1
8
Dep
uty
Secr
etar
yTo
tal =
2
Sect
ion
Offi
cer
BS-1
7To
tal =
7
Dep
uty
Secr
etar
yLi
tera
cy &
Com
pute
r
Sect
ion
Offi
cer
Tota
l = 5
Add.
Sec
reta
ry
P&D
M
onito
ring
BS-2
0
Dep
uty
Secr
etar
yTr
aini
ngTo
tal =
5
Sect
ion
Offi
cer
Tota
l = 8
Dep
uty
Prov
. Coo
rd.
BS-1
8
Secr
atar
y Ed
ucat
ion
BS-2
1
Exec
utiv
e D
istri
ctEd
ucat
ions
BS-2
0
Dis
trict
Offi
cer
Educ
atio
nTe
chni
cal
BS-1
9
Dis
trict
Offi
cer
Educ
atio
nEl
emen
tryBS
-19
Dis
trict
Offi
cer
Educ
atio
nSe
cond
ary,
Hig
her
Educ
atio
nBS
-19
Dis
trict
Offi
cer
Educ
atio
nSE
MIS
, Pla
nnin
g &
Mon
itorin
gBS
-19
Dis
trict
Offi
cer
Educ
atio
nC
olle
ges
BS-1
9
Dis
trict
Offi
cer
Educ
atio
nAc
adem
ic &
Trai
nnin
g.BS
-19
Dis
trict
Offi
cer
Educ
atio
nSp
orts
BS-1
9
Dep
uty
Dis
trict
Offi
cer
BS-1
8
Assit
ant D
istric
t Offi
cer
BS-1
7
Lear
ning
Coo
rdin
ator
BS-1
1
Prim
ary
Scho
ol T
each
erBS
-7
Add.
= A
dditi
onal
BOC
= B
urea
u of
Cur
ricul
umBS
= B
asic
Pay
Sca
leEd
u. =
Edu
catio
nPr
ov. C
oord
. = P
rovi
ncia
l Coo
rdin
ator
P&
M =
Pla
nnin
g &
Mon
itorin
gP
& D
= P
lann
ing
& D
evel
opm
ent
SEM
IS =
Sin
dh E
duca
tion
Man
agem
ent S
yste
mSp
. = S
peci
al
Prov
inci
al
Dis
tric
t
The Head Teacher does not possess any meaningful powers toensure that the inputs required to ensure quality teaching are in place.S/he has to make do with the physical facilities that have been madeavailable and with teachers who have been posted/transferred to theschool and has little choice but to accede to pressure for studentadmissions. Failure to honour the pressure can lead to transfer.
Most importantly, the Head Teacher does not have any authority withrespect to recruitment or transfer of teachers or initiating disciplinaryaction against any teacher. As a result, the Head Teacher is notempowered to enforce discipline, either with respect to attendance,punctuality or teaching. S/he can, of course, forward complaints to theappropriate quarters; however, the action taken, if any, is a function of theconcerned teacher's political 'connections'. Political appointees are amajor source of disturbance within the education management system. Inmany cases, they are either self-employed or employed elsewhere in theprivate sector and have, at best, a casual interest in teaching. A commonmodus operandi for obtaining employment as a schoolteacher is to beappointed in any district and then to make use of 'connections' to haveoneself transferred to the district of one's choice. In this process, theprevious teacher is transferred to another district and then endeavoursto arrange a transfer back to her/his original district. Dealing with transferrequests thus constitutes a major workload of the district education office.
The Head Teacher also does not command any meaningful powersto incur expenditures. Delays in disbursements of funds to schools _ ausual phenomenon _ implies that schools generally do not have funds forsuch petty cash expenditures as purchase of chalk, photocopying, andmaintenance of building, furniture and fixtures, e.g., changing light bulbs,effecting plumbing repairs, etc.
A proposal that is informally on the agenda, but not under formalconsideration, is to separate the administrative and teaching cadres ofthe Departments of Education, with the latter comprising Head Teachersand teachers, and to raise their salary grades to 17 and 16, respectively.
This would be an essential and welcome step. However, far moresubstantive changes are in order. Apart from fundamental reform of thesyllabus in line with the new Conceptual Framework of the NationalCurriculum 2000, there is primarily a need to change the learning cultureof schools, where a child-friendly teaching process replaces rote learning,coercion or corporal punishment. There is a need to change the currentregime of bureaucratic control by a system based on the principle ofacademic autonomy. This would require that the Head Teacher beprovided full powers in all matters relating to the management of theschool, including hiring and firing of teachers, thereby terminating thesystem of centralized recruitment and the issue of postings and transfers.It would also require ending the monopoly of prescribed textbooks andallowing teachers to use additional reading and teaching material. Itwould require granting schools a reasonable budget and financialautonomy to enable the purchase of necessary school supplies, therepair and maintenance of school facilities, etc. Commensurate withthese powers, the Head Teacher should be made fully responsible for thefunctioning of the school, attendance of teachers, quality of teaching, andstudent performance.
CH
APTE
R 5
So
cia
l D
eve
lop
me
nt
in P
aki
sta
n,
20
02
-03
127
There is a need tochange the learning
culture of schools,where a child-
friendly teachingprocess replaces
rote learning,coercion or corporal
punishment.
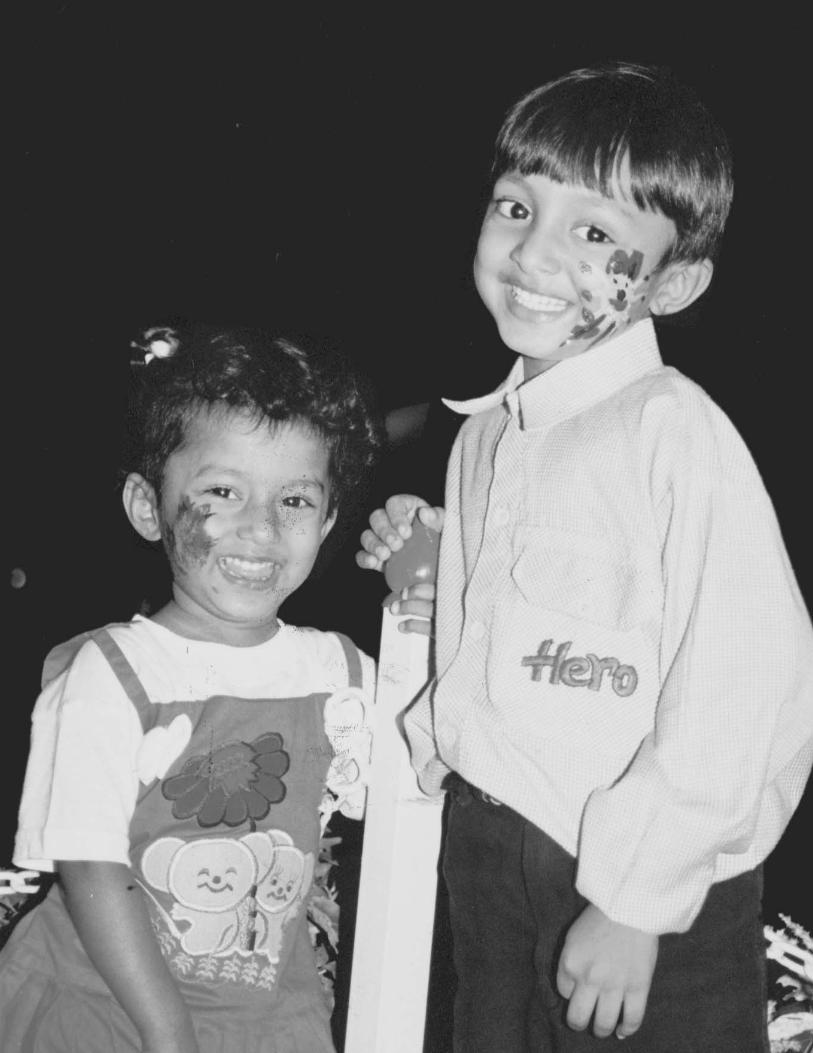

CH
APTE
R 6
So
cia
l D
eve
lop
me
nt
in P
aki
sta
n,
20
02
-03
129
6STATE OF
SCIENCE EDUCATION
“Examinations donot test ...
understanding,reasoning,
originality orcreativity.”

Mathematics is the basis of all sciences and science is thefountainhead of all technological development, be it in the field ofengineering, electronics, chemicals, biology or medicine. Science
and technology are the cornerstones of all modern economies, given thattechnology now drives productivity and growth in all areas: agriculture,manufacturing, energy, housing and construction, transportation andcommunication, banking and finance, and other tertiary services. Thenature of recent wars has also highlighted the crucial role of technology,adding a national security dimension to scientific knowledge.
Despite its importance, the state of science in Pakistan isdisappointing and the number and quality of scientists in the country isnot encouraging at all. Pakistan depends to a large extent on importedtechnology in almost all areas of life. Although there are specializedscientific institutions and several science departments in numerousuniversities in the country, their contribution to the invention of newprocesses and/or products and towards industrial innovation is negligible.
It is generally accepted that the state of science education inPakistan is problematic. To obtain a formal understanding of the nature ofthe problem in its various dimensions, a comprehensive nation-wideanalysis was carried out in 2003 encompassing the following: a test ofstudents in core science subjects; a survey of teachers' qualifications; ananalysis of officially prescribed textbooks; an appraisal of the pattern ofexaminations and question papers; an assessment of laboratory manualsand practices; a review of library lending records; school visitors; andinterviews with school and college principals, science teachers,laboratory supervisory staff and students.
CH
APTE
R 6
So
cia
l D
eve
lop
me
nt
in P
aki
sta
n,
20
02
-03
130
STATE OFSCIENCE EDUCATION
More science facilities are called for.
The in-depth analysis of the teaching of science from middle tohigher secondary school levels reveals that the root of the problem is notthe curriculum or the qualifications of teachers, but the method ofteaching, which in turn is driven by the pattern of examinations.
A strong caveat is necessary here. For reasons of economy of timeand resources, the study was necessarily limited in scope. The range oftests and surveys had to be restricted. The results and conclusionspresented here, therefore, are broad generalizations and should be readin that spirit. While there are many exceptions, the norms identified arepervasive enough to conclude that they do reflect the state of scienceeducation in the country.
The issue of poor quality teaching emerges in the results of a nation-wide test in mathematics, physics, chemistry and biology involving
223 science students in 22 colleges in all provinces of the country. Theoperational details of the tests are given in box 6.1. While the size of thesample and the scope of the tests are limited, they do accurately presentthe situation as it exists with respect to the intellectual abilities of sciencestudents in the country.
CH
APTE
R 6
So
cia
l D
eve
lop
me
nt
in P
aki
sta
n,
20
02
-03
131
TEST RESULTS: DEFINING THE PROBLEM
BOX 6.1 OPERATIONAL DETAILS OF THE TEST
To test the understanding ofbasic scientific concepts of
students who havematriculated from the Pakistanisystem, tests were conductedto quantify the achievementlevel of students who hadcompleted 11 years ofeducation, i.e., the SecondarySchool Certificate (SSC) plusone additional year. Thechoice of 11 years was meantto ensure that the studentswere at least at par with O'level requirements in terms ofyears of schooling.
The tests wereconducted in at least two citiesin each province _ one largeand one small city. Twocolleges _ one male and onefemale _ were selected ineach city and at least 10students tested in eachcollege.
To ensure that thestudents took the testseriously, a reward wasannounced for the beststudent in each subject ineach city. This was deemed
necessary in view of theadvice of the teachersconcerned, who wereapprehensive that the studentsmight not be willing toundertake a two hour test thathad no bearing on them.Nevertheless, it was observedthat the students whovolunteered for the tests tookthem seriously and made therequired effort to answer thequestions.
The tests wereconducted in the followingcore science subjects:mathematics, physics,chemistry and biology, andwere designed along the linesof an internationally acceptedexamination system, i.e., theGeneral Certificate of SchoolEducation (GCSE), alsoknown as the O' levels,conducted by CambridgeUniversity, UK. Theycomprised two parts (exceptfor mathematics): multiplechoice questions (MCQs) andtheory questions. A fairlysignificant part of the O' level
syllabus that was considereddifficult was not covered in thetests and the general level ofdifficulty of questions waslower compared to a typical O'level examination.Furthermore, more time wasallotted per question thannormally given in a typical O'level examination. The passingscore was set at 40 per cent.In the theory section, markswere given to students basedon the way they approachedthe problem, even if their finalanswer was not correct.Students were also allowed toanswer in the language theywere comfortable with, i.e.,English or Urdu.
Analysis of theteaching of science
from middle tohigher secondary
school levelsreveals that the root
of the problem isnot the curriculum
or the qualificationsof teachers, but themethod of teaching,
which in turn isdriven by the
pattern ofexaminations.
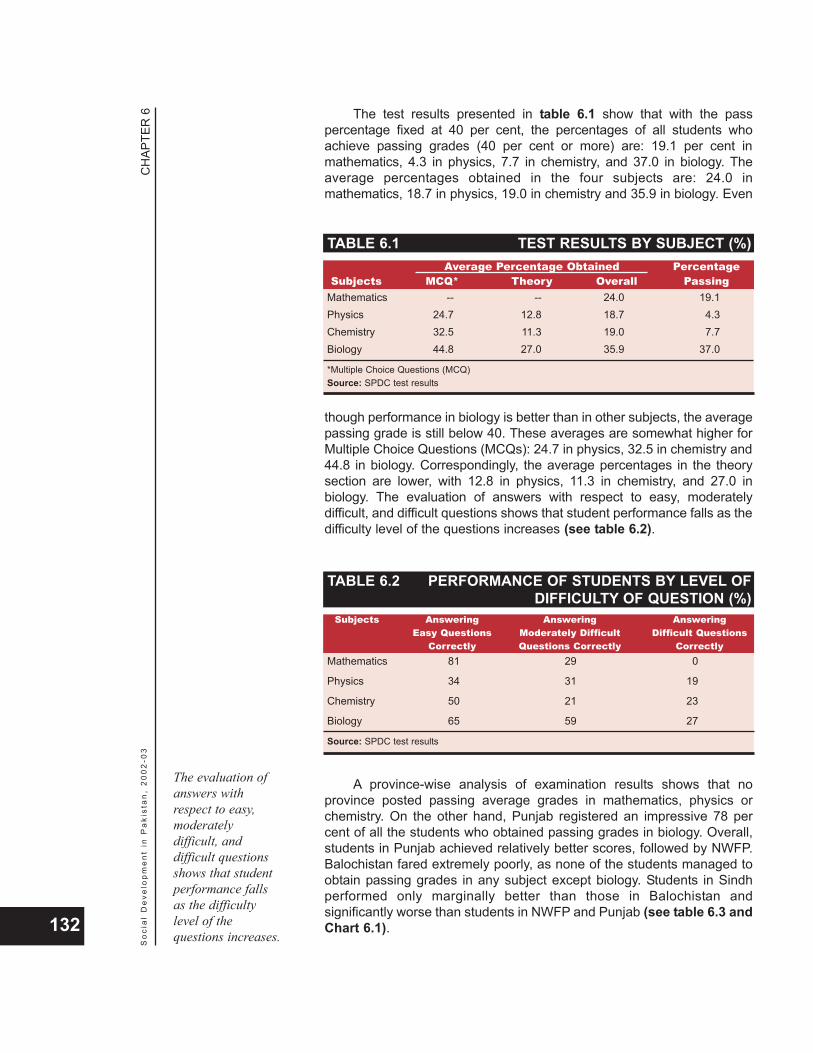
The test results presented in table 6.1 show that with the passpercentage fixed at 40 per cent, the percentages of all students whoachieve passing grades (40 per cent or more) are: 19.1 per cent inmathematics, 4.3 in physics, 7.7 in chemistry, and 37.0 in biology. Theaverage percentages obtained in the four subjects are: 24.0 inmathematics, 18.7 in physics, 19.0 in chemistry and 35.9 in biology. Even
though performance in biology is better than in other subjects, the averagepassing grade is still below 40. These averages are somewhat higher forMultiple Choice Questions (MCQs): 24.7 in physics, 32.5 in chemistry and44.8 in biology. Correspondingly, the average percentages in the theorysection are lower, with 12.8 in physics, 11.3 in chemistry, and 27.0 inbiology. The evaluation of answers with respect to easy, moderatelydifficult, and difficult questions shows that student performance falls as thedifficulty level of the questions increases (see table 6.2).
A province-wise analysis of examination results shows that noprovince posted passing average grades in mathematics, physics orchemistry. On the other hand, Punjab registered an impressive 78 percent of all the students who obtained passing grades in biology. Overall,students in Punjab achieved relatively better scores, followed by NWFP.Balochistan fared extremely poorly, as none of the students managed toobtain passing grades in any subject except biology. Students in Sindhperformed only marginally better than those in Balochistan andsignificantly worse than students in NWFP and Punjab (see table 6.3 andChart 6.1).
CH
APTE
R 6
So
cia
l D
eve
lop
me
nt
in P
aki
sta
n,
20
02
-03
132
TABLE 6.1 TEST RESULTS BY SUBJECT (%)Average Percentage Obtained Percentage
Subjects MCQ* Theory Overall PassingMathematics -- -- 24.0 19.1Physics 24.7 12.8 18.7 4.3Chemistry 32.5 11.3 19.0 7.7Biology 44.8 27.0 35.9 37.0
*Multiple Choice Questions (MCQ)Source: SPDC test results
TABLE 6.2 PERFORMANCE OF STUDENTS BY LEVEL OFDIFFICULTY OF QUESTION (%)
Subjects Answering Answering AnsweringEasy Questions Moderately Difficult Difficult Questions
Correctly Questions Correctly CorrectlyMathematics 81 29 0
Physics 34 31 19
Chemistry 50 21 23
Biology 65 59 27
Source: SPDC test results
The evaluation ofanswers withrespect to easy,moderatelydifficult, anddifficult questionsshows that studentperformance fallsas the difficultylevel of thequestions increases.

CH
APTE
R 6
So
cia
l D
eve
lop
me
nt
in P
aki
sta
n,
20
02
-03
133
TABLE 6.3 TEST RESULTS BY PROVINCEPunjab Sindh NWFP Balochistan
Subjects Percentage Average Percentage Average Percentage Average Percentage AveragePassing Marks Passing Marks Passing Marks Passing Marks
Mathematics 34.8 33.7 8.5 17.8 19.2 28.5 zero 8.1
Physics 6.9 24.0 1.4 14.6 11.5 18.7 zero 14.2
Chemistry 15.9 23.9 1.5 14.5 11.5 24.9 zero 12.6
Biology 78.3 52.9 11.8 25.6 44.0 37.4 2.6 22.3
Source: SPDC test results
CHART 6.1 TEST RESULTS BY PROVINCE: A GRAPHICAL VIEW
Source: SPDC test results
BIOLOGY
78.3
52.9
BalochistanNWFPSindh
Percentage Passing Average Marks
Punjab
90
80
70
60
50
40
30
20
10
0
11.8
25.6
44.0
37.4
2.6
22.3
CHEMISTRY
15.9
23.9
BalochistanNWFPSindh
Percentage Passing Average Marks
Punjab
90
80
70
60
50
40
30
20
10
01.5
14.511.5
24.9
Zero
12.6
MATHEMATICS
34.8 33.7
BalochistanNWFPSindh
Percentage Passing Average Marks
Punjab
90
80
70
60
50
40
30
20
10
0
8.5
17.8 19.2
28.5
Zero
8.1
PHYSICS
6.9
24.0
BalochistanNWFPSindh
Percentage Passing Average Marks
Punjab
90
80
70
60
50
40
30
20
10
01.4
14.511.5
18.7
Zero
14.2
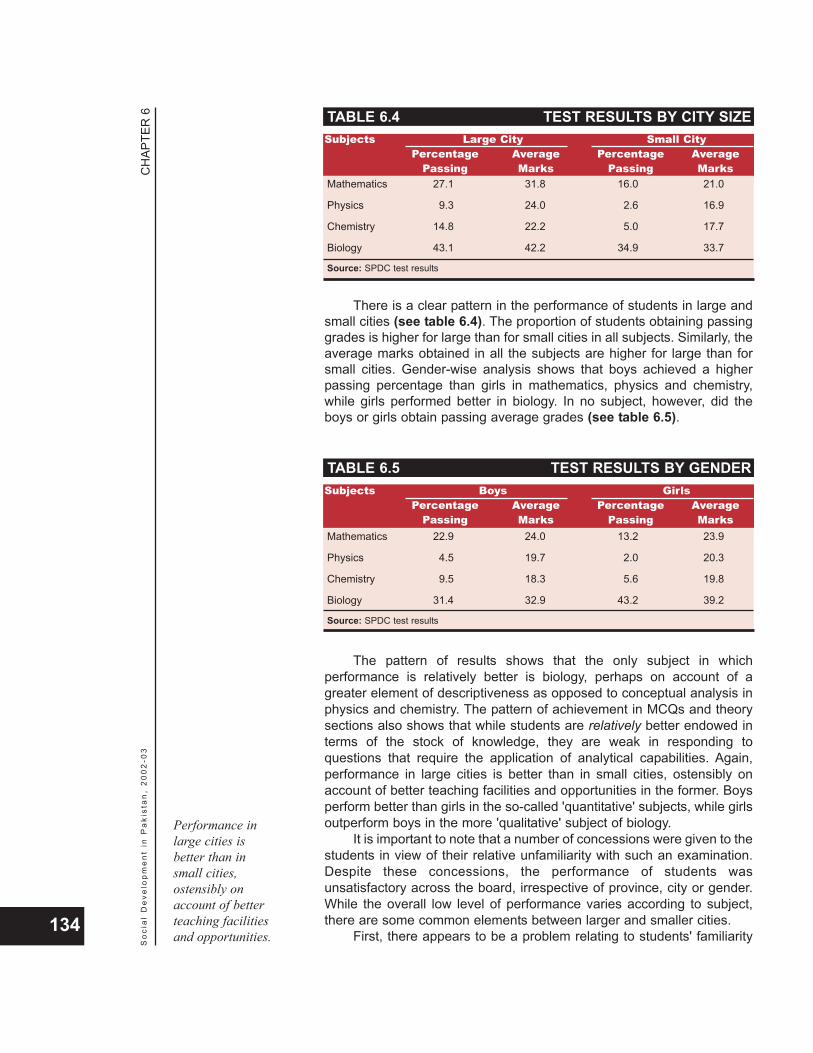
There is a clear pattern in the performance of students in large andsmall cities (see table 6.4). The proportion of students obtaining passinggrades is higher for large than for small cities in all subjects. Similarly, theaverage marks obtained in all the subjects are higher for large than forsmall cities. Gender-wise analysis shows that boys achieved a higherpassing percentage than girls in mathematics, physics and chemistry,while girls performed better in biology. In no subject, however, did theboys or girls obtain passing average grades (see table 6.5).
The pattern of results shows that the only subject in whichperformance is relatively better is biology, perhaps on account of agreater element of descriptiveness as opposed to conceptual analysis inphysics and chemistry. The pattern of achievement in MCQs and theorysections also shows that while students are relatively better endowed interms of the stock of knowledge, they are weak in responding toquestions that require the application of analytical capabilities. Again,performance in large cities is better than in small cities, ostensibly onaccount of better teaching facilities and opportunities in the former. Boysperform better than girls in the so-called 'quantitative' subjects, while girlsoutperform boys in the more 'qualitative' subject of biology.
It is important to note that a number of concessions were given to thestudents in view of their relative unfamiliarity with such an examination.Despite these concessions, the performance of students wasunsatisfactory across the board, irrespective of province, city or gender.While the overall low level of performance varies according to subject,there are some common elements between larger and smaller cities.
First, there appears to be a problem relating to students' familiarity
CH
APTE
R 6
So
cia
l D
eve
lop
me
nt
in P
aki
sta
n,
20
02
-03
134
TABLE 6.4 TEST RESULTS BY CITY SIZESubjects Large City Small City
Percentage Average Percentage AveragePassing Marks Passing Marks
Mathematics 27.1 31.8 16.0 21.0
Physics 9.3 24.0 2.6 16.9
Chemistry 14.8 22.2 5.0 17.7
Biology 43.1 42.2 34.9 33.7
Source: SPDC test results
TABLE 6.5 TEST RESULTS BY GENDERSubjects Boys Girls
Percentage Average Percentage AveragePassing Marks Passing Marks
Mathematics 22.9 24.0 13.2 23.9
Physics 4.5 19.7 2.0 20.3
Chemistry 9.5 18.3 5.6 19.8
Biology 31.4 32.9 43.2 39.2
Source: SPDC test results
Performance inlarge cities isbetter than insmall cities,ostensibly onaccount of betterteaching facilitiesand opportunities.

First, there appears to be a problem relating to students' familiaritywith the stock of knowledge. For example, no student could correctlyanswer the relatively more difficult questions relating to, for example,trigonometry _ they simply did not have the required knowledge. Second,almost universally, students were unable to plot or even read simplegraphs (e.g., graphs of temperature and humidity) and to derive analyticalconclusions from them; or to answer questions based on diagramsdepicting a particular system (e.g., the digestive or cardiac system) andidentify the organs and their specific roles. Third, students were generallyunfamiliar with the working of basic instruments in a laboratory, e.g.,galvanometer, elementary circuits, or of basic chemistry or biologylaboratory methods and techniques. It appears that many students hadnever seen the inside of a laboratory, and therefore, it is not surprisingthat they were unable to answer simple questions based on experimentsthat are a routine part of laboratory work. Fourth, students appeared tolack the ability to answer simple questions based on conceptualizationand analysis. This last drawback, perhaps the most serious, is discussedfurther on.
An evaluation of student performance reveals three primaryweaknesses: (i) inability to apply their knowledge to answer questions; (ii)inability to reason out solutions when given a (previously) unseenproblem and a certain amount of information pertaining to it; and (iii)inability to apply their knowledge with required detail and precision. Theseweaknesses originate from the tendency to memorize formulae and theirapplications or information on the functioning of systems, and toreproduce these in examinations without developing an understanding ofthe concepts/processes.
For example, a problem was given in physics with data consisting ofthe positions of an airplane at successive times, and the students were
CH
APTE
R 6
So
cia
l D
eve
lop
me
nt
in P
aki
sta
n,
20
02
-03
135
Writing the SPDC science tests.
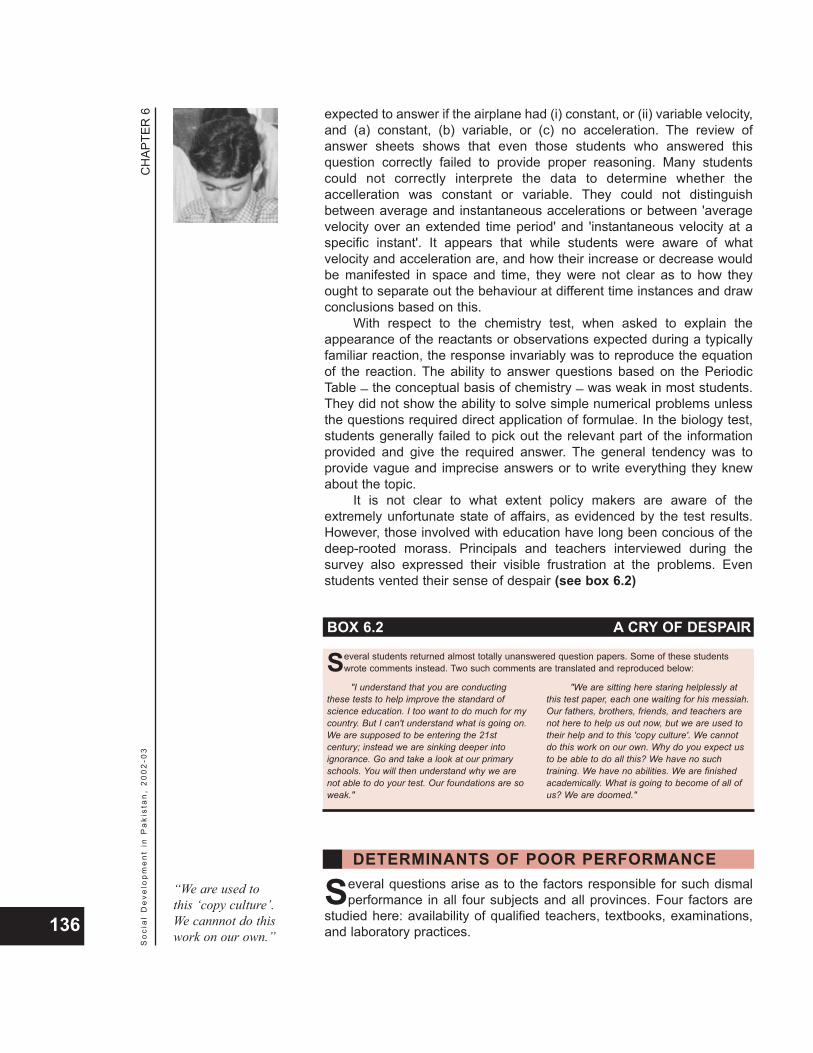
expected to answer if the airplane had (i) constant, or (ii) variable velocity,and (a) constant, (b) variable, or (c) no acceleration. The review ofanswer sheets shows that even those students who answered thisquestion correctly failed to provide proper reasoning. Many studentscould not correctly interprete the data to determine whether theaccelleration was constant or variable. They could not distinguishbetween average and instantaneous accelerations or between 'averagevelocity over an extended time period' and 'instantaneous velocity at aspecific instant'. It appears that while students were aware of whatvelocity and acceleration are, and how their increase or decrease wouldbe manifested in space and time, they were not clear as to how theyought to separate out the behaviour at different time instances and drawconclusions based on this.
With respect to the chemistry test, when asked to explain theappearance of the reactants or observations expected during a typicallyfamiliar reaction, the response invariably was to reproduce the equationof the reaction. The ability to answer questions based on the PeriodicTable _ the conceptual basis of chemistry _ was weak in most students.They did not show the ability to solve simple numerical problems unlessthe questions required direct application of formulae. In the biology test,students generally failed to pick out the relevant part of the informationprovided and give the required answer. The general tendency was toprovide vague and imprecise answers or to write everything they knewabout the topic.
It is not clear to what extent policy makers are aware of theextremely unfortunate state of affairs, as evidenced by the test results.However, those involved with education have long been concious of thedeep-rooted morass. Principals and teachers interviewed during thesurvey also expressed their visible frustration at the problems. Evenstudents vented their sense of despair (see box 6.2)
Several questions arise as to the factors responsible for such dismalperformance in all four subjects and all provinces. Four factors are
studied here: availability of qualified teachers, textbooks, examinations,and laboratory practices.
CH
APTE
R 6
So
cia
l D
eve
lop
me
nt
in P
aki
sta
n,
20
02
-03
136
BOX 6.2 A CRY OF DESPAIR
"I understand that you are conductingthese tests to help improve the standard ofscience education. I too want to do much for mycountry. But I can't understand what is going on.We are supposed to be entering the 21stcentury; instead we are sinking deeper intoignorance. Go and take a look at our primaryschools. You will then understand why we arenot able to do your test. Our foundations are soweak."
"We are sitting here staring helplessly atthis test paper, each one waiting for his messiah.Our fathers, brothers, friends, and teachers arenot here to help us out now, but we are used totheir help and to this 'copy culture'. We cannotdo this work on our own. Why do you expect usto be able to do all this? We have no suchtraining. We have no abilities. We are finishedacademically. What is going to become of all ofus? We are doomed."
Several students returned almost totally unanswered question papers. Some of these studentswrote comments instead. Two such comments are translated and reproduced below:
DETERMINANTS OF POOR PERFORMANCE
“We are used tothis ‘copy culture’.We cannnot do thiswork on our own.”
Availability of Qualified TeachersTeaching science at different levels requires different levels ofspecialization. The emphasis at earlier stages is on the pedagogicalability of the teacher to convey information and ideas. At higher levels,more technical expertise is required. However, the unanimous opinionamong the principals and teachers consulted is that a Bachelor's degreein science should be the minimum qualification required to teach sciencesubjects adequately up to the secondary level.
Official data on science teachers by qualifications is available onlyfor Punjab. The picture that emerges from official statistics is notencouraging with particular reference to the availability of scienceteachers.
Two statistics _ the ratio of number of science teachers (defined asthose with at least a BSc. degree) to total number of school teachers, andthe number of science teachers per school _ reveal a serious shortage ofscience teachers in the school system (see table 6.6). Science teachers,as defined above, constitute only 21 per cent of all school teachers. Inurban-rural terms, this ratio is 26 per cent for urban areas and 19 per centfor rural areas. In gender terms, this ratio is 26 per cent for males and 15per cent for females. The gender distribution in urban-rural terms showsthat the proportion of female science teachers in total female teachers is19 per cent in urban areas, while this share is a mere 12 per cent in ruralareas. The low proportion of science teachers is one indication of therelative importance attached to the teaching of science in the overalleducational plan. However, it is commendable to observe that almost 80per cent of all science teachers hold an MSc. degree.
Furthermore, the average number of science teachers per school isalarmingly low. There are only 3.1 science teachers per school, with awide urban-rural variation: 6.7 in urban areas and 2.3 in rural areas. Theaverage number of female science teachers per school is just 1.8 _ 4.4 inurban areas and 1.2 in rural areas. Given that at the secondary andhigher secondary levels, there are four science subjects _ mathematics,physics, chemistry and biology _ the average number of teacherstranslates to one or 1.5 teachers per subject in urban areas and less thanone in rural areas.
The available offical data do not enable an estimation of the student-teacher ratio, as it does not provide data on the number of students inscience classes. As such, a survey of 48 boys' and girls' schools andintermediate colleges in Punjab and Sindh was conducted to obtain the
CH
APTE
R 6
So
cia
l D
eve
lop
me
nt
in P
aki
sta
n,
20
02
-03
137
TABLE 6.6 PROFILE OF SCIENCE TEACHERS IN SCHOOLS
Urban Rural Total
Male Famale Total Male Female Total Male Female Total
Number of Science 33.8 18.5 26.3 23.2 12.3 19.0 26.2 14.6 21.3teachers as percentageof total number of teachers
Number of Science 9.2 4.4 6.7 3.2 1.2 2.3 4.2 1.8 3.1teachers per school
Note: Science teachers are defined as those with BSc. or higher qualificationsSource: SPDC Survey, 2003
required information. The survey could not be carried out in NWFP andBalochistan for logistical reasons, particularly the closure of collegesduring the period of the survey. The survey was carried out in Lahore,Rawalpindi, Layyah and Rahim Yar Khan in Punjab, and in Karachi,Thatta and Larkana in Sindh. Needless to say, the survey sample wassmall and non-random and, as such, the results should be read with duereservation.
Table 6.7 presents the results of the survey. The overall averageclass size for Punjab and Sindh is 55 and 65, respectively. However,these averages are somewhat misleading; the student-to-science-teacher ratio varies considerably according to school level. At the middleschool level (Class 6-8), the student-teacher ratio is 158 in Punjab and145 in Sindh. The situation improves at higher levels. The secondaryschool (Class 9-10) ratio is reported at 57 in Punjab and 85 in Sindh,while the ratio at the higher secondary level (Class 11-12) is lower still at35 in Punjab and 38 in Sindh.
The provincial averages also conceal the differential between largeand small cities. In Punjab, average class size in middle schools is 218 insmall cities as opposed to 103 in large cities. In Sindh, the correspondingclass size in Karachi (large city) is 88, while the same in smaller cities is103. Class size declines with higher levels of education, although itremains high in smaller cities in Sindh.
The shortage of teachers puts pressure on existing teachers in termsof the number of lectures they are expected to deliver each day. Forexample, in one college, the same teacher was found to be teachingbiology in all sections from Classes 8 to 12. This situation raises two kindsof issues. First, the teaching method and approach that is required at theClass 8 level is different from that required at the Class 12 level. Thesame teacher cannot be expected to shift from one mode to another on aday-to-day or morning-to-afternoon basis. And second, the teacher isrequired to put in over 20 hours of lecturing per week. Such a heavyteaching load cannot but lead to a situation where the teacher's primaryobjective is reduced to covering the required syllabi and preparing thestudents for examinations.
CH
APTE
R 6
So
cia
l D
eve
lop
me
nt
in P
aki
sta
n,
20
02
-03
138
TABLE 6.7 PROFILE OF STUDENT - TEACHER RATIOMiddle Secondary Higher Total
SecondaryOverall 150 71 36 60Punjab 158 57 35 55Sindh 145 85 38 65
PunjabLarge city 103 39 39 47Small City 218 71 31 62
SindhLarge city 88 80 32 43Small city 203 102 81 105
Source: NEMIS (2000)
The low proportionof science teachersis one indication ofthe relativeimportance attachedto the teaching ofscience in theoverall educationalplan.

The shortage of teachers is manifested in other ways as well. Anumber of schools and colleges reported that the non-availability ofscience teachers has forced them to entrust science classes to non-science graduates. One girls' college had to resort to hiring male teachersto teach science courses to female students, and so on. Since sciencesubjects require more individual attention than humanities subjects, it isinconceivable that a teacher can communicate effectively or impartknowledge adequately to a class exceeding 100 students, as is the casein middle schools, or even exceeding 200 students, as is the case insmaller cities. The shortage of science teachers constitutes one majorreason for the sub-standard quality of science education, as is evidentfrom the test results.
TextbooksPakistan's public education system prescribes textbooks for each levelfrom Class 1 to Class 12. The texbooks are prepared by the respectiveTextbook Boards of each province according to the curricula guidelinesset by the Curriculum Wing of the Federal Ministry of Education. Thesebooks are prepared by teams of authors and editors who are academicsfrom universities or their affiliated colleges. After review and final approvalby the respective Review Committees of the Curriculum Wing, they aregiven the status of 'prescribed sole textbook' for the subject and the level.
Textbooks have a crucial role in public education in Pakistan.Teachers and students generally understand that the questions asked inthe examinations will be from the prescribed textbook. The content,approach, questions, illustrations, solved examples, etc., of the textbooksconstitute and define the entire body of knowledge and understanding to
CH
APTE
R 6
So
cia
l D
eve
lop
me
nt
in P
aki
sta
n,
20
02
-03
139
Well equipped science labs are rare.

which the student is exposed. The only supplements to the textbooks arethe notes dictated by the teachers, which are again modelled on the linesof an appropriate answer to a prospective question in examinations.
Prescribed textbooks are the only reading material students access,and for reasons to be elaborated, use with an almost theological singlemindedness. Textbooks have acquired almost totalitarian control oflearning; students are neither encouraged to explore references, nor arethey personally willing to do so. This is in stark contrast to other countries,where students and teachers can refer to a variety of books and wherethe goal of developing understanding is achieved by recourse to differentinformation sources and teaching methods.
In the analysis presented here, prescribed science textbooks forclasses 6-12 from the Punjab, Sindh and NWFP Textbook Boards and theNational Institute of Science and Technical Education (NISTE), agovernment organization dedicated to science education, are analyzed.The main elements considered in the evaluation of textbooks and theircomparison with similar textbooks used in international systems, i.e., O'and A' levels, include: i) content, continuity, emphasis and relevance tothe educational level; ii) style of presentation, language and pedagogicalaspects; iii) type, quality and number of exercises, and solved as well asunsolved problems; and iv) illustrations and other supporting material,such as pictures.
General Science Textbooks. A review of General Science textbooks forClasses 6-8 shows that the level and depth of content, continuity ofthemes and presentation is adequate. However, they suffer from apaucity of good illustrations and diagrammatic representation ofprocesses, particularly in the case of biology. Illustration of the functioningof a process in various steps would give students a much clearerunderstanding of the role of various organs in the process and alsoenhance their interest in the subject. These weaknesses, relating tounderstanding, were particularly noticeable in biology tests, wherestudents appeared to know the general principles of a system, but wereunable to satisfactorily relate the roles of different component parts.
The textbooks are also weak in terms of solved examples that helpstudents to apply the concepts to different situations. End-of-chapterexercises do not cover the contents sufficiently and lack imagination inthe framing of questions. The questions are directed to the text in a veryto-the-point fashion and require students to merely quote from it.
NISTE textbooks are generally well written, well illustrated, andfollow an activity-based approach. Unfortunately, none of the schoolssurveyed used these books due to the lack of resources and training. TheUrdu translations of these books employ very difficult and complexterminology that the students _ and teachers _ find confusing.
Secondary and Higher Secondary School Textbooks. Anexamination of prescribed textbooks for secondary and higher secondaryschools reveals that they:
present science in a manner that is too abstract and formal;are deficient in content as well in presentation;are lacking in focus and precision that is essential inunderstanding and working with scientific phenomena; andare unsuitable in terms of developing concepts and creatingand maintaining the interest of the students.
CH
APTE
R 6
So
cia
l D
eve
lop
me
nt
in P
aki
sta
n,
20
02
-03
140
The content,approach,questions,illustrations, solvedexamples, etc., ofthe textbooksconstitute anddefine the entirebody of knowledgeand understandingto which the studentis exposed.
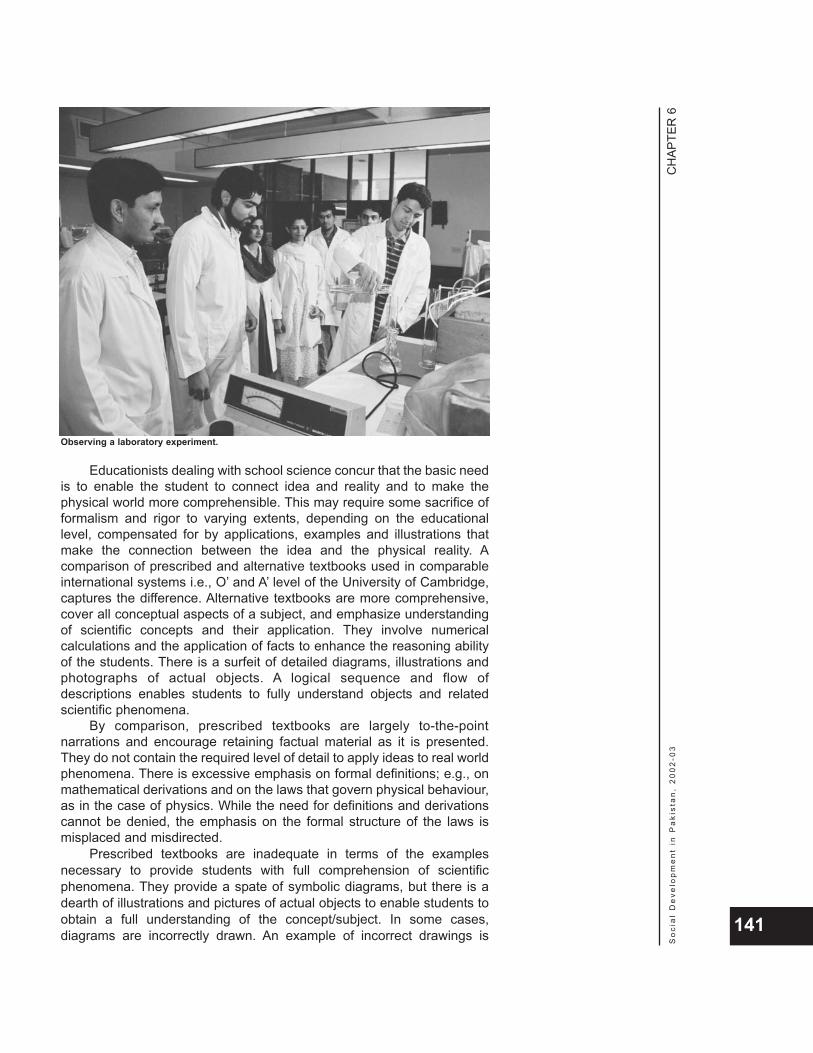
Educationists dealing with school science concur that the basic needis to enable the student to connect idea and reality and to make thephysical world more comprehensible. This may require some sacrifice offormalism and rigor to varying extents, depending on the educationallevel, compensated for by applications, examples and illustrations thatmake the connection between the idea and the physical reality. Acomparison of prescribed and alternative textbooks used in comparableinternational systems i.e., O’ and A’ level of the University of Cambridge,captures the difference. Alternative textbooks are more comprehensive,cover all conceptual aspects of a subject, and emphasize understandingof scientific concepts and their application. They involve numericalcalculations and the application of facts to enhance the reasoning abilityof the students. There is a surfeit of detailed diagrams, illustrations andphotographs of actual objects. A logical sequence and flow ofdescriptions enables students to fully understand objects and relatedscientific phenomena.
By comparison, prescribed textbooks are largely to-the-pointnarrations and encourage retaining factual material as it is presented.They do not contain the required level of detail to apply ideas to real worldphenomena. There is excessive emphasis on formal definitions; e.g., onmathematical derivations and on the laws that govern physical behaviour,as in the case of physics. While the need for definitions and derivationscannot be denied, the emphasis on the formal structure of the laws ismisplaced and misdirected.
Prescribed textbooks are inadequate in terms of the examplesnecessary to provide students with full comprehension of scientificphenomena. They provide a spate of symbolic diagrams, but there is adearth of illustrations and pictures of actual objects to enable students toobtain a full understanding of the concept/subject. In some cases,diagrams are incorrectly drawn. An example of incorrect drawings is
CH
APTE
R 6
So
cia
l D
eve
lop
me
nt
in P
aki
sta
n,
20
02
-03
141
Observing a laboratory experiment.
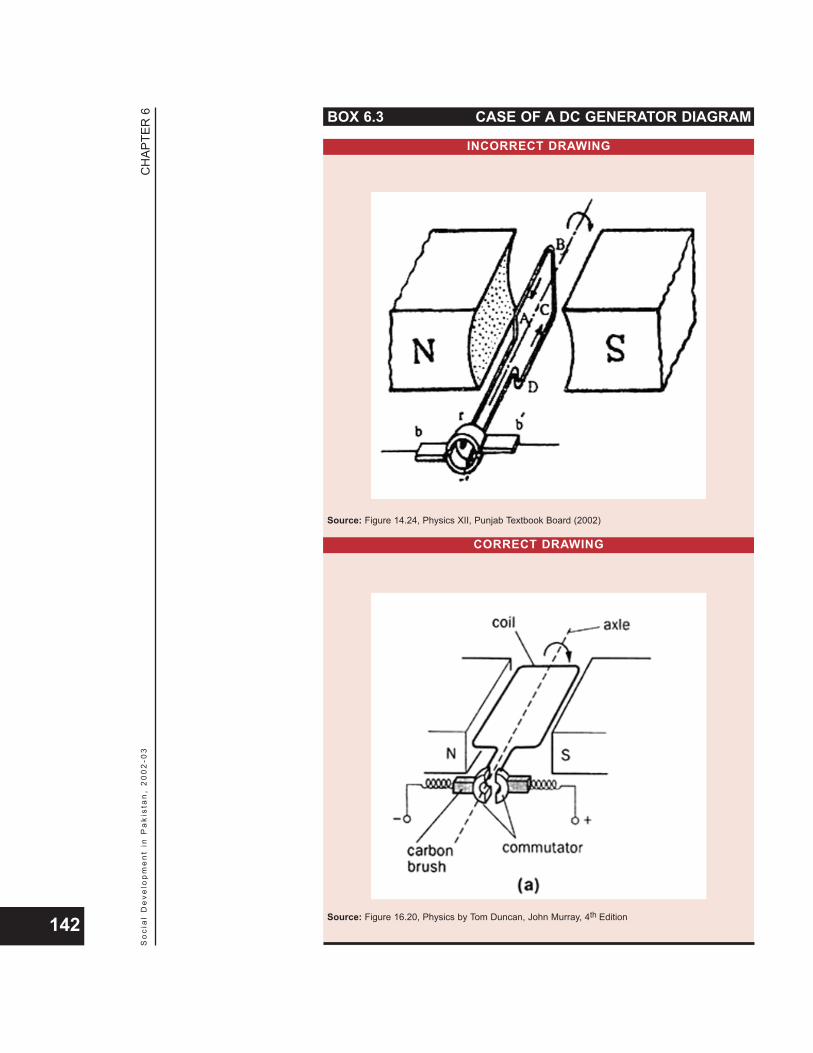
CH
APTE
R 6
So
cia
l D
eve
lop
me
nt
in P
aki
sta
n,
20
02
-03
142
BOX 6.3 CASE OF A DC GENERATOR DIAGRAM
INCORRECT DRAWING
CORRECT DRAWING
Source: Figure 14.24, Physics XII, Punjab Textbook Board (2002)
Source: Figure 16.20, Physics by Tom Duncan, John Murray, 4th Edition
depicted in Figure 14.24 of Physics XII (Punjab Text Book Board, 2002).The drawing is supposed to illustrate a DC generator. Contrary to the text,however, it shows a slip ring, which produces AC voltage, instead of asplit ring structure, which produces DC voltage. The correct figure isreproduced from Figure 16.20 of Physics, (Tom Duncan, 4th Edition, JohnMurray). See box 6.3 for the incorrect and correctly drawn diagrams.
In the prescribed textbooks, it is not uncommon to find statementsthat are misleading and sometimes plainly wrong. Two instances are citedfrom the review of selected prescribed physics textbooks to substantiatethis point.
The chapter on ‘Magnetism’ of the Class 10 physics textbookdescribes “the force between magnetic poles as proportional to1/r2, r being the distance between the poles." This is incorrect.The correct statement is, “the force between magnetic dipoles(isolated poles not being found in nature) varies as 1/r4."One Class 10 physics textbook defines a wave as "amechanism to transfer energy from one point to another withoutthe displacement of matter." First, the definition is highlyrestrictive, since it implies only one type of wave, i.e., travellingwaves as opposed to standing waves. Second, the statement isfaulty, as the propagation of waves can often lead to theoscillatory displacement of particles in the medium e.g., due tosound waves. A correct definition could read: "a mechanism totransfer energy from one point to another without net or timeaveraged displacement of matter" or, more accurately, “a waveis a mechanism for the transport of energy without the transportof matter...”. While the difference may seem trivial, it would betotally confusing to a student who sees, in one of the prescribedexperiments for the same class, the up and down movement(displacement) of a piece of cork riding on a wave. Thisillustrates the importance of precision.
Recently published chemistry textbooks by the Punjab TextbookBoard and NISTE for Classes 9 and 10 show marked improvement, withreasonably good concept development, sequencing and colouredillustrations. However, they are not problem-free. Some importantconcepts are incorrectly presented, not dealt with in sufficient detail, ormissed out altogether; the tables given are not comprehensive, and thenumber of examples is inadequate. The sequential arrangement ofmaterial is important to enable students to understand scientificphenomena logically. However, discontinuity is not uncommon in thetextbooks. For example:
The 'Periodic Table' is a logical consequence of 'atomicstructure' and should be discussed subsequently. However, thePeriodic Table is placed in chapter 5, while atomic structure isintroduced in chapter 6. An understanding of the placement of elements in the PeriodicTable facilitates comprehension of the concept of 'chemicalbonding'. However, 'electrochemistry' is discussed in chapter 3,before chemical bonding in chapter 7. This is not the correctsequence as it is illogical to discuss electrochemistry without a
CH
APTE
R 6
So
cia
l D
eve
lop
me
nt
in P
aki
sta
n,
20
02
-03
143
Prescribedtextbooks are
inadequate in termsof the examples
necessary to providestudents with full
comprehension ofscientific
phenomena.
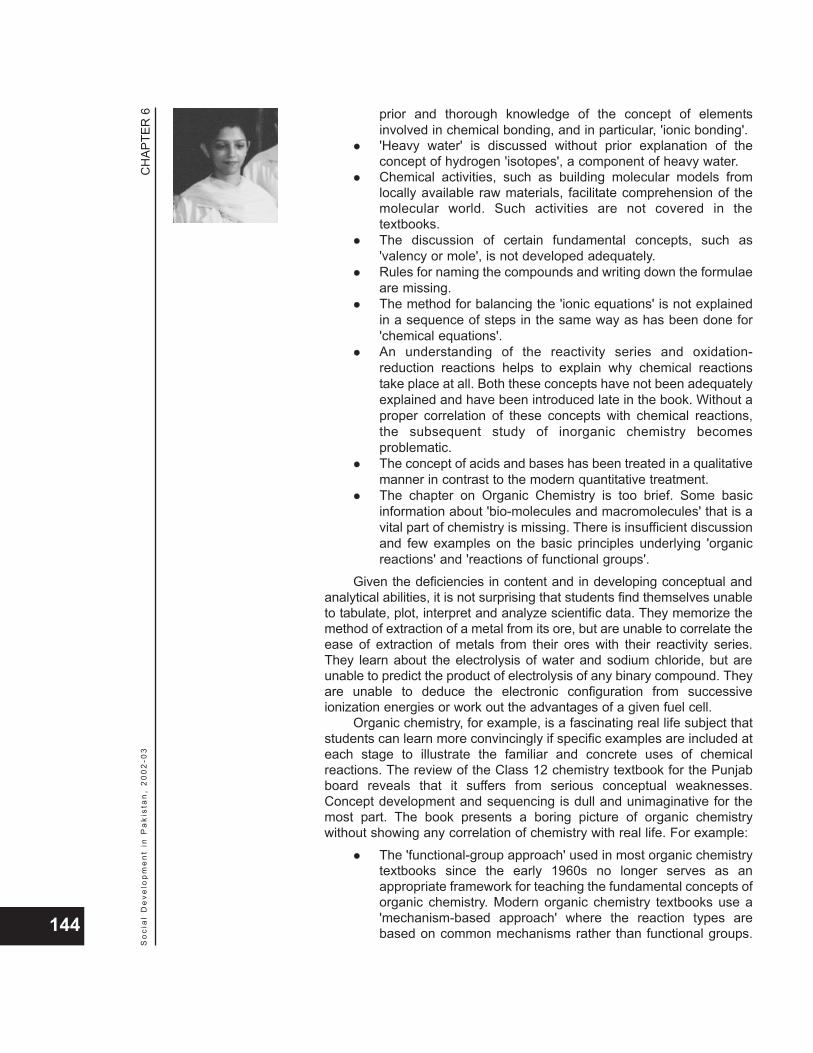
prior and thorough knowledge of the concept of elementsinvolved in chemical bonding, and in particular, 'ionic bonding'. 'Heavy water' is discussed without prior explanation of theconcept of hydrogen 'isotopes', a component of heavy water.Chemical activities, such as building molecular models fromlocally available raw materials, facilitate comprehension of themolecular world. Such activities are not covered in thetextbooks.The discussion of certain fundamental concepts, such as'valency or mole', is not developed adequately. Rules for naming the compounds and writing down the formulaeare missing.The method for balancing the 'ionic equations' is not explainedin a sequence of steps in the same way as has been done for'chemical equations'.An understanding of the reactivity series and oxidation-reduction reactions helps to explain why chemical reactionstake place at all. Both these concepts have not been adequatelyexplained and have been introduced late in the book. Without aproper correlation of these concepts with chemical reactions,the subsequent study of inorganic chemistry becomesproblematic.The concept of acids and bases has been treated in a qualitativemanner in contrast to the modern quantitative treatment. The chapter on Organic Chemistry is too brief. Some basicinformation about 'bio-molecules and macromolecules' that is avital part of chemistry is missing. There is insufficient discussionand few examples on the basic principles underlying 'organicreactions' and 'reactions of functional groups'.
Given the deficiencies in content and in developing conceptual andanalytical abilities, it is not surprising that students find themselves unableto tabulate, plot, interpret and analyze scientific data. They memorize themethod of extraction of a metal from its ore, but are unable to correlate theease of extraction of metals from their ores with their reactivity series.They learn about the electrolysis of water and sodium chloride, but areunable to predict the product of electrolysis of any binary compound. Theyare unable to deduce the electronic configuration from successiveionization energies or work out the advantages of a given fuel cell.
Organic chemistry, for example, is a fascinating real life subject thatstudents can learn more convincingly if specific examples are included ateach stage to illustrate the familiar and concrete uses of chemicalreactions. The review of the Class 12 chemistry textbook for the Punjabboard reveals that it suffers from serious conceptual weaknesses.Concept development and sequencing is dull and unimaginative for themost part. The book presents a boring picture of organic chemistrywithout showing any correlation of chemistry with real life. For example:
The 'functional-group approach' used in most organic chemistrytextbooks since the early 1960s no longer serves as anappropriate framework for teaching the fundamental concepts oforganic chemistry. Modern organic chemistry textbooks use a'mechanism-based approach' where the reaction types arebased on common mechanisms rather than functional groups.
CH
APTE
R 6
So
cia
l D
eve
lop
me
nt
in P
aki
sta
n,
20
02
-03
144
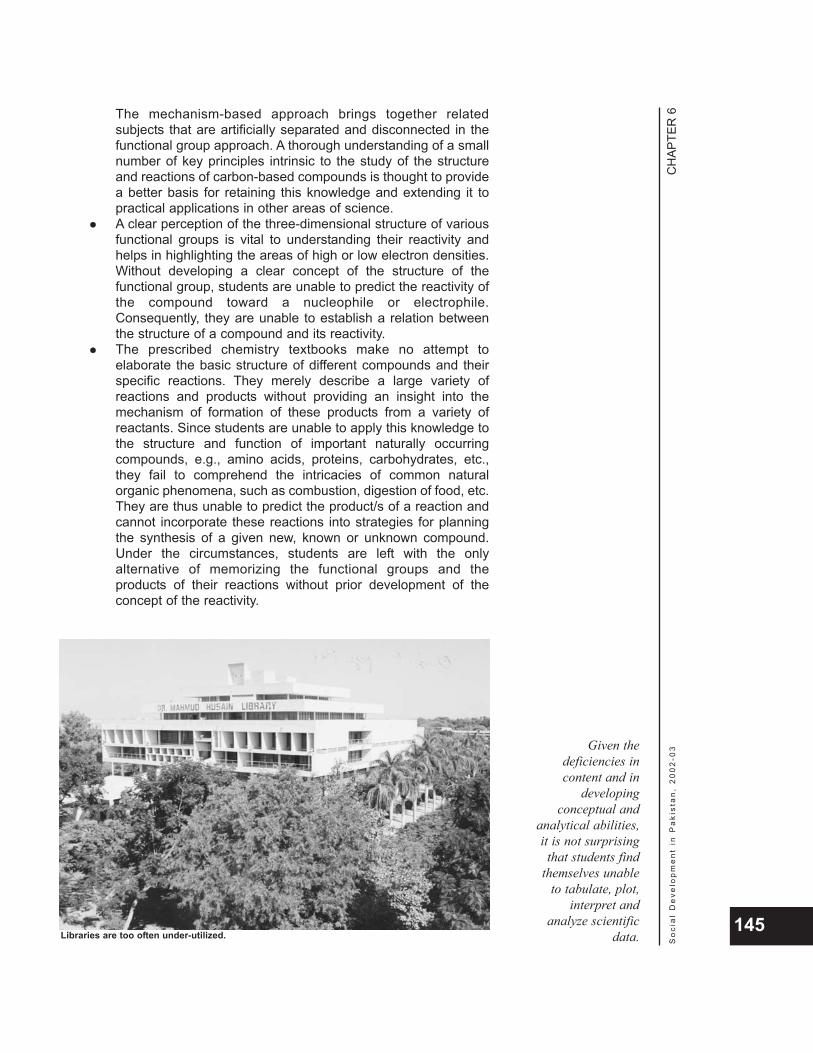
CH
APTE
R 6
So
cia
l D
eve
lop
me
nt
in P
aki
sta
n,
20
02
-03
145
Given thedeficiencies incontent and in
developingconceptual and
analytical abilities,it is not surprisingthat students find
themselves unableto tabulate, plot,
interpret andanalyze scientific
data.
The mechanism-based approach brings together relatedsubjects that are artificially separated and disconnected in thefunctional group approach. A thorough understanding of a smallnumber of key principles intrinsic to the study of the structureand reactions of carbon-based compounds is thought to providea better basis for retaining this knowledge and extending it topractical applications in other areas of science. A clear perception of the three-dimensional structure of variousfunctional groups is vital to understanding their reactivity andhelps in highlighting the areas of high or low electron densities.Without developing a clear concept of the structure of thefunctional group, students are unable to predict the reactivity ofthe compound toward a nucleophile or electrophile.Consequently, they are unable to establish a relation betweenthe structure of a compound and its reactivity.The prescribed chemistry textbooks make no attempt toelaborate the basic structure of different compounds and theirspecific reactions. They merely describe a large variety ofreactions and products without providing an insight into themechanism of formation of these products from a variety ofreactants. Since students are unable to apply this knowledge tothe structure and function of important naturally occurringcompounds, e.g., amino acids, proteins, carbohydrates, etc.,they fail to comprehend the intricacies of common naturalorganic phenomena, such as combustion, digestion of food, etc.They are thus unable to predict the product/s of a reaction andcannot incorporate these reactions into strategies for planningthe synthesis of a given new, known or unknown compound.Under the circumstances, students are left with the onlyalternative of memorizing the functional groups and theproducts of their reactions without prior development of theconcept of the reactivity.
Libraries are too often under-utilized.
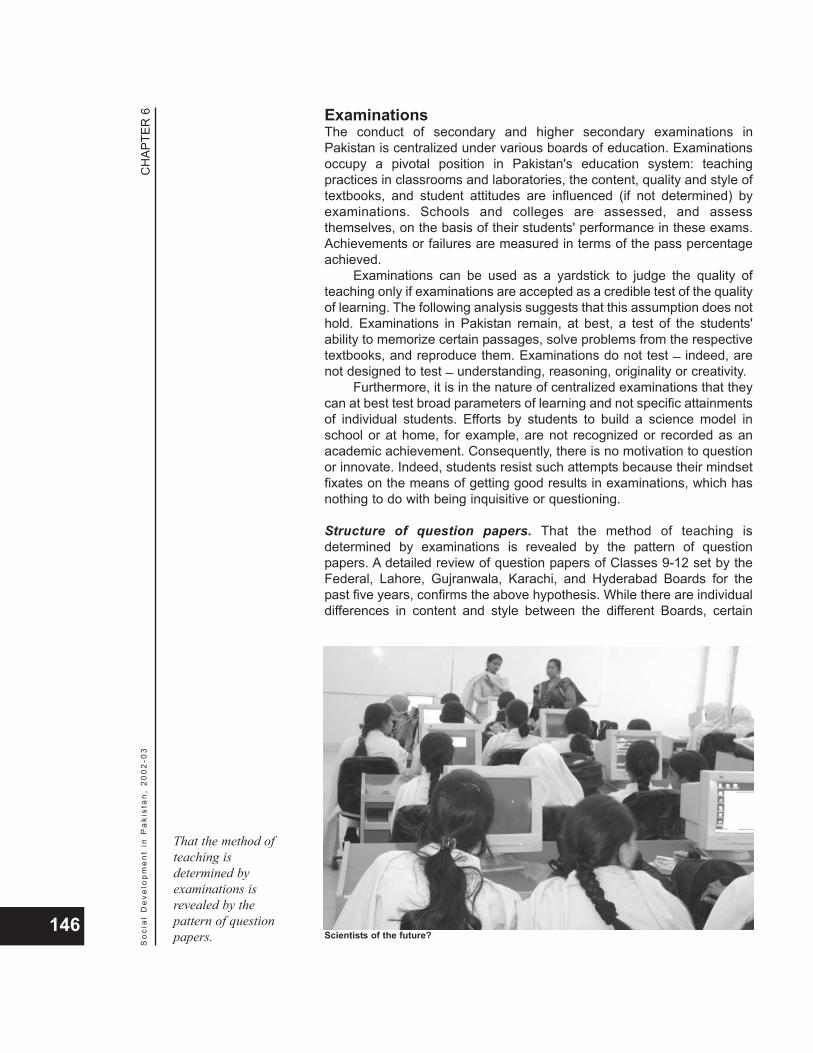
ExaminationsThe conduct of secondary and higher secondary examinations inPakistan is centralized under various boards of education. Examinationsoccupy a pivotal position in Pakistan's education system: teachingpractices in classrooms and laboratories, the content, quality and style oftextbooks, and student attitudes are influenced (if not determined) byexaminations. Schools and colleges are assessed, and assessthemselves, on the basis of their students' performance in these exams.Achievements or failures are measured in terms of the pass percentageachieved.
Examinations can be used as a yardstick to judge the quality ofteaching only if examinations are accepted as a credible test of the qualityof learning. The following analysis suggests that this assumption does nothold. Examinations in Pakistan remain, at best, a test of the students'ability to memorize certain passages, solve problems from the respectivetextbooks, and reproduce them. Examinations do not test _ indeed, arenot designed to test _ understanding, reasoning, originality or creativity.
Furthermore, it is in the nature of centralized examinations that theycan at best test broad parameters of learning and not specific attainmentsof individual students. Efforts by students to build a science model inschool or at home, for example, are not recognized or recorded as anacademic achievement. Consequently, there is no motivation to questionor innovate. Indeed, students resist such attempts because their mindsetfixates on the means of getting good results in examinations, which hasnothing to do with being inquisitive or questioning.
Structure of question papers. That the method of teaching isdetermined by examinations is revealed by the pattern of questionpapers. A detailed review of question papers of Classes 9-12 set by theFederal, Lahore, Gujranwala, Karachi, and Hyderabad Boards for thepast five years, confirms the above hypothesis. While there are individualdifferences in content and style between the different Boards, certain
CH
APTE
R 6
So
cia
l D
eve
lop
me
nt
in P
aki
sta
n,
20
02
-03
146Scientists of the future?
That the method ofteaching isdetermined byexaminations isrevealed by thepattern of questionpapers.
generalized conclusions regarding the pattern of question papers doemerge.
Examinations are entirely textbook-based _ questions correspondalmost verbatim to the contents of the respective textbook.Each paper is divided into sections covering different parts ofthe course and the number of questions from each part is pre-defined and constant over time. There is 100 per cent choice in all the subjective questions. Thestudent is required to attempt one out of two or two out of fromquestions in each section or sub-section.There is a fixed formula of distribution of marks. The 100 markspaper is divided into theory and practical, each carrying 75 and25 marks, respectively. The theory part has five sections, eachcarrying 15 marks. The first section is the MCQs, which iscompulsory. The other four sections contain questions fromspecified chapters. In physics, for example, there are twoquestions from Electromagnetism, one from Heat and one fromModern Physics. The MCQs involve fairly straightforwardchoices and no calculation or computing is involved. Bycontrast, MCQs in comparable international systems aredistinguished by subtle differences and the selection of thecorrect answer requires careful thought. The 15 marks for eachof the remaining four questions are further distributed as follows:8 marks are for description of theory, 4 marks for numericalanalysis, and 3 marks for reasoning. The first requiresreproduction from the text, the second taxes the student's mindto some extent, and the third requires a brief explanation orreasoning of a phenomenon.The passing percentage is 33 per cent.
The combination of the above factors turns preparing for andpassing an examination into a trivial exercise. For instance, consider astudent who prepares for the physics examination by studying only twoout of the four chapters of the Electromagnetic section. One questionfrom each of these chapters is certain to be included in the questionpaper. By attempting one question each from the two chapters, thestudent can expect to cover 30 (15+15) marks. The multiple-choicesection is also certain to include questions from these two chapters andcan account for another 5 marks. If the student receives only 25 out of the35 marks, s/he can pass the examination with the required minimum of33 per cent, i.e., 25 out of 75.
Similarly, a student can pass the Class 12 chemistry examination bystudying either Organic or Inorganic chemistry. This astonishing situationis made possible by the predictable pattern of the question paper, 100 percent choice, and 33 per cent pass percentage.
Style and repetition of questions. The trivialization of the process ofpreparing for the examination is also indicated by the predictable patternof the style of questions and of questions being repeated verbatim,sometimes in consecutive years. A review of all physics, chemistry andbiology question papers set by the Federal, Lahore and Karachi Boardsfrom 1998 to 2002 shows that the style of questions is such as to precludethe need to think and reason or to deliberate on a subject analytically.
CH
APTE
R 6
So
cia
l D
eve
lop
me
nt
in P
aki
sta
n,
20
02
-03
147
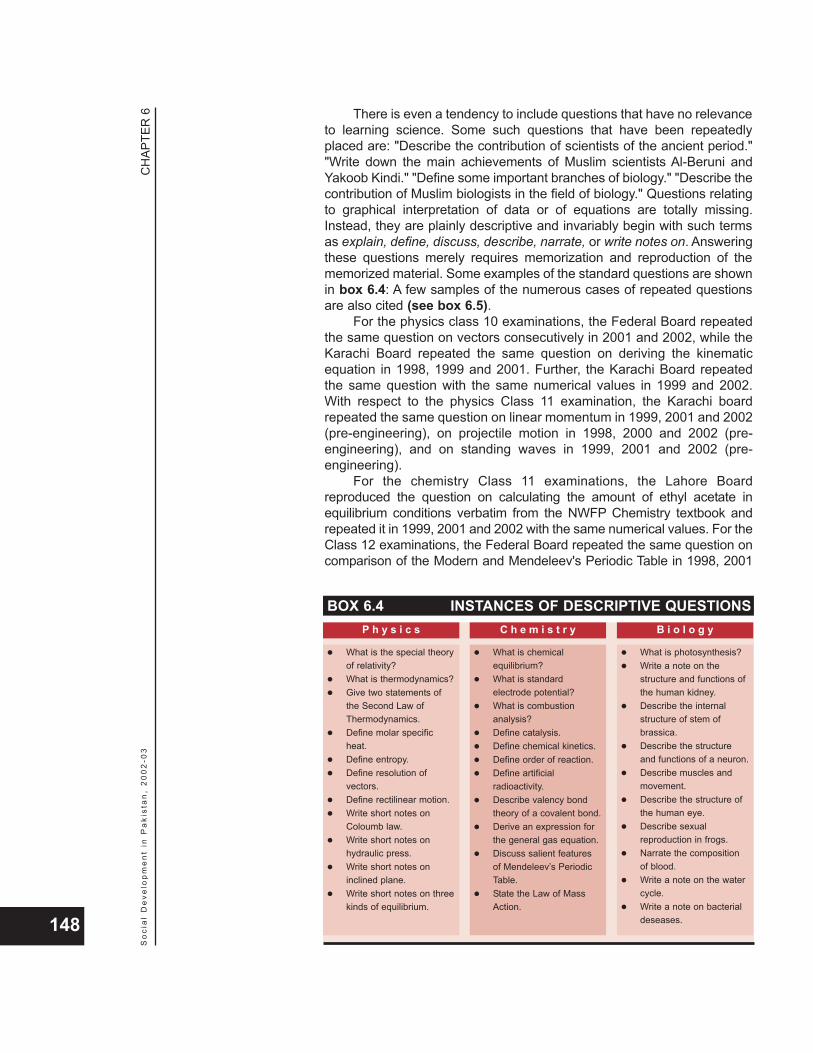
There is even a tendency to include questions that have no relevanceto learning science. Some such questions that have been repeatedlyplaced are: "Describe the contribution of scientists of the ancient period.""Write down the main achievements of Muslim scientists Al-Beruni andYakoob Kindi." "Define some important branches of biology." "Describe thecontribution of Muslim biologists in the field of biology." Questions relatingto graphical interpretation of data or of equations are totally missing.Instead, they are plainly descriptive and invariably begin with such termsas explain, define, discuss, describe, narrate, or write notes on. Answeringthese questions merely requires memorization and reproduction of thememorized material. Some examples of the standard questions are shownin box 6.4: A few samples of the numerous cases of repeated questionsare also cited (see box 6.5).
For the physics class 10 examinations, the Federal Board repeatedthe same question on vectors consecutively in 2001 and 2002, while theKarachi Board repeated the same question on deriving the kinematicequation in 1998, 1999 and 2001. Further, the Karachi Board repeatedthe same question with the same numerical values in 1999 and 2002.With respect to the physics Class 11 examination, the Karachi boardrepeated the same question on linear momentum in 1999, 2001 and 2002(pre-engineering), on projectile motion in 1998, 2000 and 2002 (pre-engineering), and on standing waves in 1999, 2001 and 2002 (pre-engineering).
For the chemistry Class 11 examinations, the Lahore Boardreproduced the question on calculating the amount of ethyl acetate inequilibrium conditions verbatim from the NWFP Chemistry textbook andrepeated it in 1999, 2001 and 2002 with the same numerical values. For theClass 12 examinations, the Federal Board repeated the same question oncomparison of the Modern and Mendeleev's Periodic Table in 1998, 2001
CH
APTE
R 6
So
cia
l D
eve
lop
me
nt
in P
aki
sta
n,
20
02
-03
148
BOX 6.4 INSTANCES OF DESCRIPTIVE QUESTIONS
What is the special theoryof relativity?What is thermodynamics?Give two statements ofthe Second Law ofThermodynamics.Define molar specificheat.Define entropy.Define resolution ofvectors.Define rectilinear motion.Write short notes onColoumb law.Write short notes onhydraulic press.Write short notes oninclined plane.Write short notes on threekinds of equilibrium.
P h y s i c s
What is chemicalequilibrium?What is standardelectrode potential?What is combustionanalysis?Define catalysis.Define chemical kinetics.Define order of reaction.Define artificialradioactivity.Describe valency bondtheory of a covalent bond.Derive an expression forthe general gas equation.Discuss salient featuresof Mendeleev’s PeriodicTable.State the Law of MassAction.
C h e m i s t r y
What is photosynthesis?Write a note on thestructure and functions ofthe human kidney.Describe the internalstructure of stem ofbrassica.Describe the structureand functions of a neuron.Describe muscles andmovement.Describe the structure ofthe human eye.Describe sexualreproduction in frogs.Narrate the compositionof blood.Write a note on the watercycle.Write a note on bacterialdeseases.
B i o l o g y
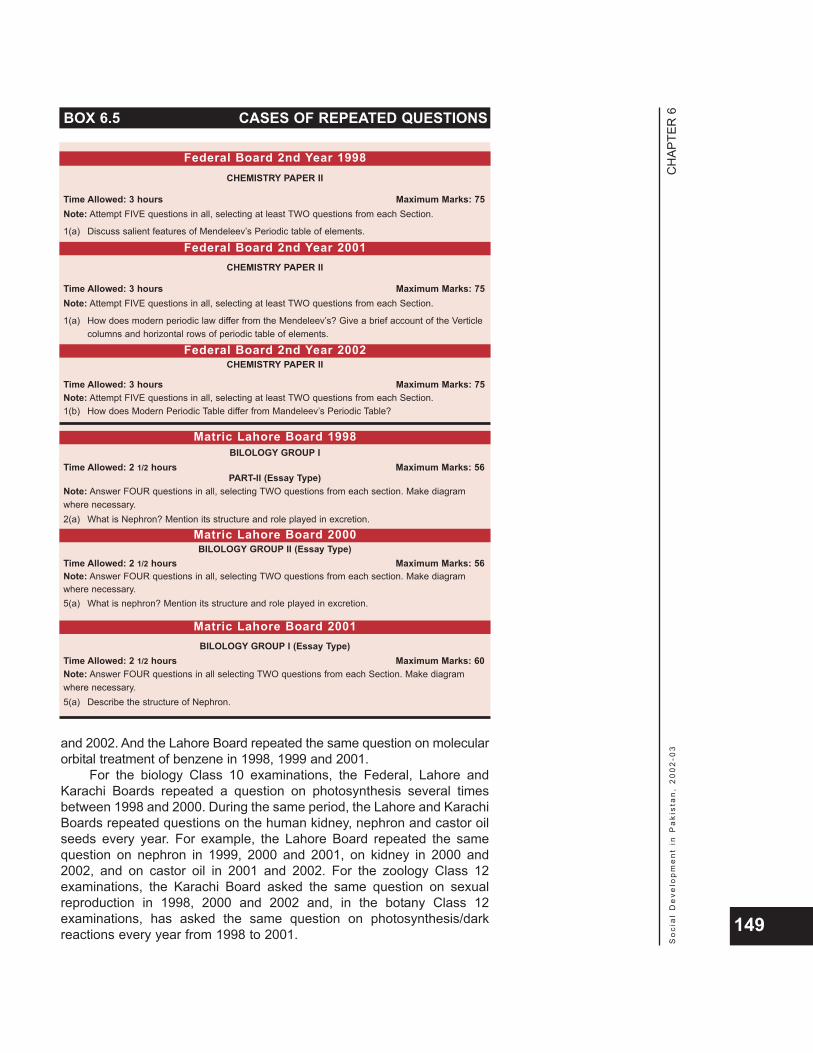
and 2002. And the Lahore Board repeated the same question on molecularorbital treatment of benzene in 1998, 1999 and 2001.
For the biology Class 10 examinations, the Federal, Lahore andKarachi Boards repeated a question on photosynthesis several timesbetween 1998 and 2000. During the same period, the Lahore and KarachiBoards repeated questions on the human kidney, nephron and castor oilseeds every year. For example, the Lahore Board repeated the samequestion on nephron in 1999, 2000 and 2001, on kidney in 2000 and2002, and on castor oil in 2001 and 2002. For the zoology Class 12examinations, the Karachi Board asked the same question on sexualreproduction in 1998, 2000 and 2002 and, in the botany Class 12examinations, has asked the same question on photosynthesis/darkreactions every year from 1998 to 2001.
CH
APTE
R 6
So
cia
l D
eve
lop
me
nt
in P
aki
sta
n,
20
02
-03
149
BOX 6.5 CASES OF REPEATED QUESTIONS
BILOLOGY GROUP ITime Allowed: 2 1/2 hours Maximum Marks: 56
PART-II (Essay Type)Note: Answer FOUR questions in all, selecting TWO questions from each section. Make diagramwhere necessary.2(a) What is Nephron? Mention its structure and role played in excretion.
BILOLOGY GROUP II (Essay Type)Time Allowed: 2 1/2 hours Maximum Marks: 56Note: Answer FOUR questions in all, selecting TWO questions from each section. Make diagramwhere necessary.5(a) What is nephron? Mention its structure and role played in excretion.
Matric Lahore Board 2000
BILOLOGY GROUP I (Essay Type)Time Allowed: 2 1/2 hours Maximum Marks: 60Note: Answer FOUR questions in all selecting TWO questions from each Section. Make diagramwhere necessary.5(a) Describe the structure of Nephron.
Matric Lahore Board 2001
CHEMISTRY PAPER II
Time Allowed: 3 hours Maximum Marks: 75Note: Attempt FIVE questions in all, selecting at least TWO questions from each Section.
1(a) Discuss salient features of Mendeleev’s Periodic table of elements.
Federal Board 2nd Year 1998
CHEMISTRY PAPER II
Time Allowed: 3 hours Maximum Marks: 75Note: Attempt FIVE questions in all, selecting at least TWO questions from each Section.
1(a) How does modern periodic law differ from the Mendeleev’s? Give a brief account of the Verticlecolumns and horizontal rows of periodic table of elements.
Federal Board 2nd Year 2001
CHEMISTRY PAPER II
Time Allowed: 3 hours Maximum Marks: 75Note: Attempt FIVE questions in all, selecting at least TWO questions from each Section.1(b) How does Modern Periodic Table differ from Mandeleev’s Periodic Table?
Federal Board 2nd Year 2002
Matric Lahore Board 1998
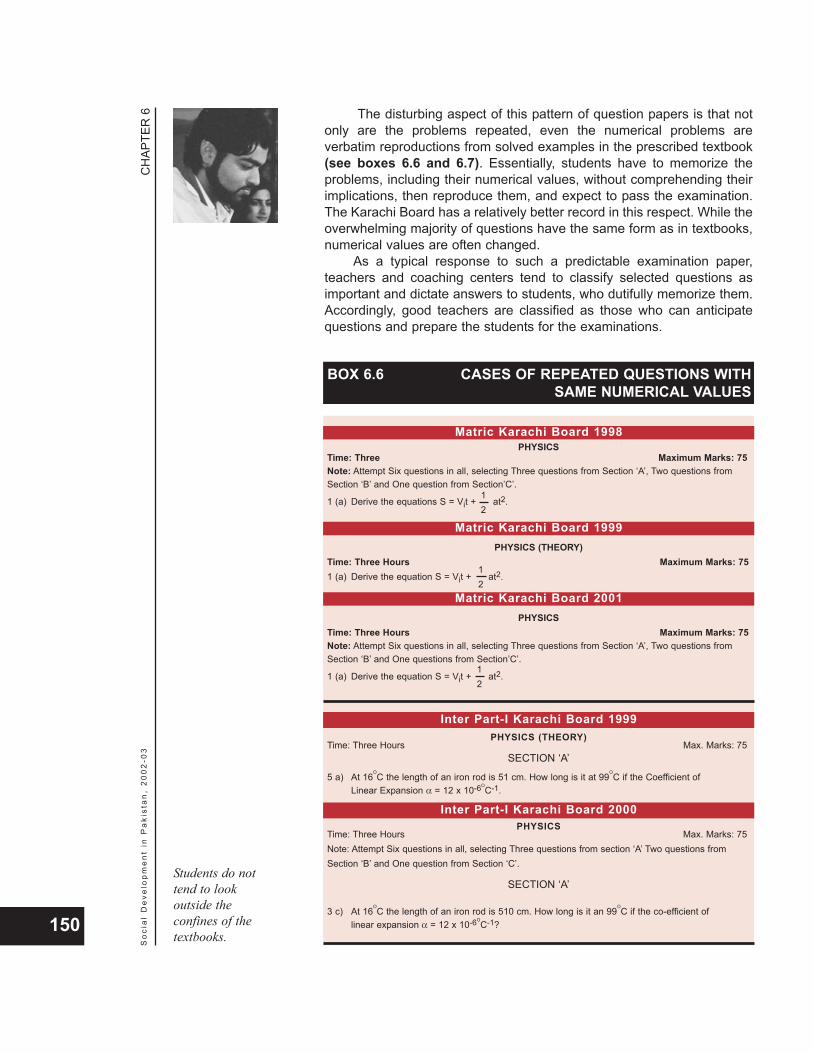
The disturbing aspect of this pattern of question papers is that notonly are the problems repeated, even the numerical problems areverbatim reproductions from solved examples in the prescribed textbook(see boxes 6.6 and 6.7). Essentially, students have to memorize theproblems, including their numerical values, without comprehending theirimplications, then reproduce them, and expect to pass the examination.The Karachi Board has a relatively better record in this respect. While theoverwhelming majority of questions have the same form as in textbooks,numerical values are often changed.
As a typical response to such a predictable examination paper,teachers and coaching centers tend to classify selected questions asimportant and dictate answers to students, who dutifully memorize them.Accordingly, good teachers are classified as those who can anticipatequestions and prepare the students for the examinations.
CH
APTE
R 6
So
cia
l D
eve
lop
me
nt
in P
aki
sta
n,
20
02
-03
150
BOX 6.6 CASES OF REPEATED QUESTIONS WITHSAME NUMERICAL VALUES
PHYSICS (THEORY)Time: Three Hours Max. Marks: 75
SECTION ‘A’
5 a) At 16OC the length of an iron rod is 51 cm. How long is it at 99
OC if the Coefficient of
Linear Expansion α = 12 x 10-6OC-1.
PHYSICSTime: Three Hours Max. Marks: 75Note: Attempt Six questions in all, selecting Three questions from section ‘A’ Two questions fromSection ‘B’ and One question from Section ‘C’.
SECTION ‘A’
3 c) At 16OC the length of an iron rod is 510 cm. How long is it an 99
OC if the co-efficient of
linear expansion α = 12 x 10-6OC-1?
Inter Part-I Karachi Board 1999
Inter Part-I Karachi Board 2000
PHYSICSTime: Three Maximum Marks: 75Note: Attempt Six questions in all, selecting Three questions from Section ‘A’, Two questions fromSection ‘B’ and One question from Section’C’.
1 (a) Derive the equations S = Vit + at2.
Matric Karachi Board 1998
12
PHYSICSTime: Three Hours Maximum Marks: 75Note: Attempt Six questions in all, selecting Three questions from Section ‘A’, Two questions fromSection ‘B’ and One questions from Section’C’.
1 (a) Derive the equation S = Vit + at2.12
PHYSICS (THEORY)Time: Three Hours Maximum Marks: 751 (a) Derive the equation S = Vit + at2.
Matric Karachi Board 1999
12
Matric Karachi Board 2001
Students do nottend to lookoutside theconfines of thetextbooks.
CH
APTE
R 6
So
cia
l D
eve
lop
me
nt
in P
aki
sta
n,
20
02
-03
151
BOX 6.7 CASES OF REPEATED QUESTIONS FROMTEXTBOOKS
Repeated question with same numerical values reproduced verbatim from solved example onpage 228 in NWFP Chemistry Textbook for Class XI.
CHEMISTRY Time Allowed: 2 hours and 40 minutesPAPER 1 (ESSAY TYPE) MAX. MARKS: 60
Attempt FOUR questions in all, selecting TWO questions from each section.
6 (b) 92 g of ethyl alcohol was mixed with 120 g of acetic acid to give equilibrium mixture. Calculatethe amount of ethyl acetate at equilibrium when Kc = 4.0 (Atomic weights C = 12, 0 = 16, H = 1).
CHEMISTRY Time Allowed: 2 hours and 40 minutesPAPER 1 (ESSAY TYPE) MAX. MARKS: 60
Attempt FOUR questions in all, selecting TWO questions from each section.
8 (b) Calculate the weight of uncreacted acetic acid when 92.0 g of ethyl alcohol and 120 g of aceticacid are mixed to give an equilibrium mixture. Kc = 4.
CHEMISTRY Time Allowed: 2 hours and 40 minutesPAPER 1 (ESSAY TYPE) MAX. MARKS: 60
Attempt FOUR questions in all, selecting TWO questions from each section.
6 (b) 92g of ethyl alcohol, were mixed with 120g of acetic acid to give equilibrium mixture. Calculatethe weight of ethyl acetate at equilibrium. Kc = 4.0
Inter (Part-I) Lahore Board 1999
Inter (Part-I) Lahore Board 2001
Inter (Part-I) Lahore Board 2002
Question reproduced verbatim with same numerical values from solved example 17.7 in PunjabPhysics Textbook for Class XII.
PHYSICS PAPER II Time Allowed: 3 hours
Note: Attempt Five questions in al, selecting ONE question from SECTION-I. TWO questions fromSECTION-II and ONE question from SECTION-III. Question NO:1 is compulsory.
8(b) A 50 Kev x-ray is scattered through an angle of 90o. What is the energy of the x-ray afterCompton scattering?
Question reproduced verbatim from Secondary School Biology, NISTE, FEP International (2000),page 171.
BIOLOGY Time Allowed: 21/2 hours(ESSAY TYPE) MAX. MARKS: 56
Answer FOUR questions in all, selecting TWO questions from each Section.SECTION I
2.(a) Write an essay on excretory system of human beings and explain how it helps in maintenanceof homeostasis.
FEDERAL BOARD 2ND YEAR 2001
Matric Lahore Board 1998

The cumulative effect of these factors is that students do not tend tolook outside the confines of the textbooks. This is confirmed by a perusalof library lending records for Class 11 and 12 students. The averageborrowing rate of relevant books that can be considered supplements oftextbooks, was found to be three times per 100 students in five years. Itis not clear whether on these rare occasions the book was loaned out toa teacher or to a student.
Laboratory practicesScience education requires that students actually perform experimentsand draw inferences from their observations. This is the core of thescientific method and constitutes the basic training of students so thatthey learn that nature reveals its secrets through systematic andorganized observation carried out under specific assumptions. However,laboratory training aspects of science education at all levels _ middle tohigher secondary _ are found to be seriously wanting.
A review of laboratory manuals shows that laboratory work suffersfrom poor conceptualization of specific skills that students are supposedto acquire by doing experiments. Guidance for developing low costexperiments aimed at attaining specific pedagogical objectives and thedevelopment of specific skills is readily available on the Internet, yet theprescribed experiments in the syllabus continue to suffer fromobsolescence.
Some newly prescribed textbooks encourage activity-based learningand require demonstrations during teaching. However, in cases where
CH
APTE
R 6
So
cia
l D
eve
lop
me
nt
in P
aki
sta
n,
20
02
-03
152More girls are studying science.
Laboratorytraining aspects ofscience educationat all levels _middle to highersecondary _ arefound to beseriously wanting.
new and modern experiments have been introduced in the syllabus, thereis a mismatch between the available resources _ both material andhuman _ and the goals to be achieved. Either the equipment required toperform experiments is not available or not available in sufficient quantity,or the supervisory skills are not available. With well over 50 students perclass, there are only about two or three sets of equipment forexperiments. Consequently, teachers or laboratory instructorsdemonstrate the experiment or activity, explaining the observations anddictating the results or conclusions to be drawn. In the case of biology, theexperiment is converted to a displaying activity, where the student isshown charts with images of the organisms. Students do not themselvesperform the experiments, but take notes that can be reproduced inexaminations.
The large number of students and the shortage of equipment alsonecessitates that the practical examination, in most cases, does notrequire students to actually perform the experiment, but to describe howan experiment would be carried out, what the observations obtainedwould be, and the result to be derived from it _ a thought experiment, soto speak.
Taken together, these factors lead to a situation where laboratorywork has become more of a ritual and does not act to illustrate theconcepts that have been learnt. Experiments are designed to makeinitiative and application unnecessary. Students have before them alaboratory manual that requires them to follow certain specified steps,obtain specified readings, plug them into certain given equations, andcalculate specified results to confirm a given proposition. Theexperimental work as defined becomes a series of instructions that are tobe followed to obtain pre-ordained results. Experiments are not activity-oriented, but are yet another exercise in memorization.
CH
APTE
R 6
So
cia
l D
eve
lop
me
nt
in P
aki
sta
n,
20
02
-03
153
Students donot themselves
perform theexperiments, but
take notes that canbe reproduced in
examinations.

CH
APTE
R 6
So
cia
l D
eve
lop
me
nt
in P
aki
sta
n,
20
02
-03
155
7CITIZENS OF
ALIEN WORLDS
“The imperative ofnational integration
and sociopoliticalharmony demands that
a uniform educationsystem be introduced.”
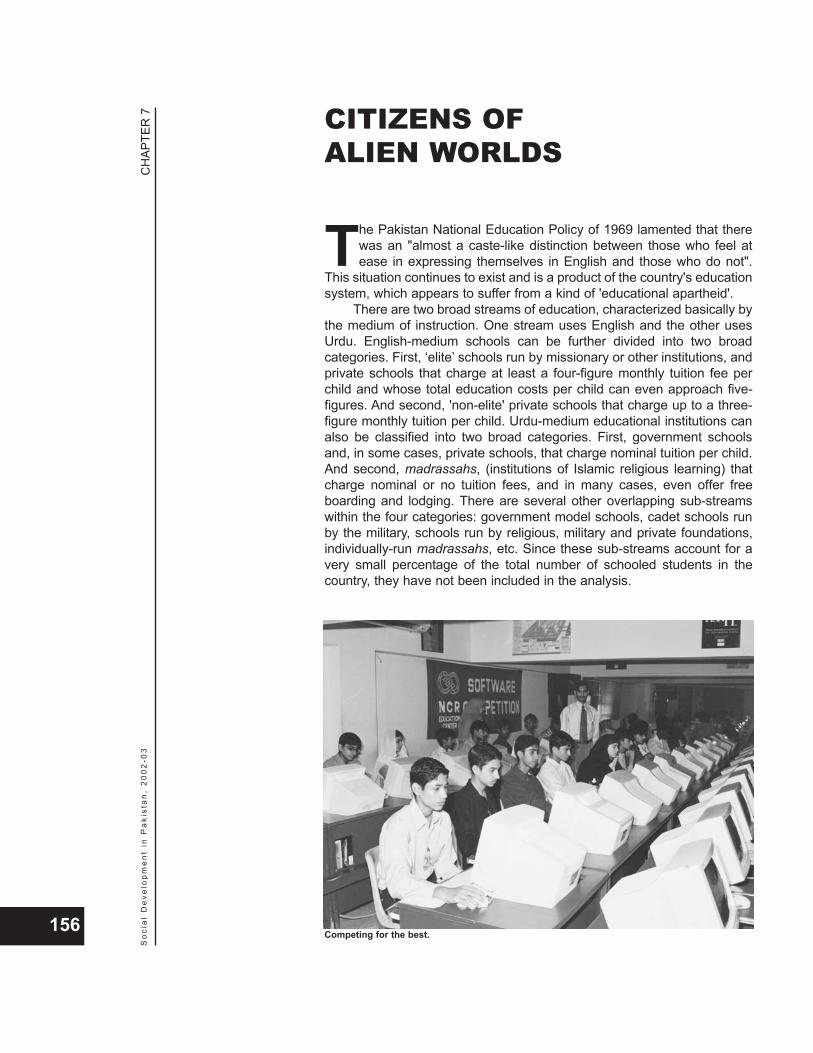
The Pakistan National Education Policy of 1969 lamented that therewas an "almost a caste-like distinction between those who feel atease in expressing themselves in English and those who do not".
This situation continues to exist and is a product of the country's educationsystem, which appears to suffer from a kind of 'educational apartheid'.
There are two broad streams of education, characterized basically bythe medium of instruction. One stream uses English and the other usesUrdu. English-medium schools can be further divided into two broadcategories. First, ‘elite’ schools run by missionary or other institutions, andprivate schools that charge at least a four-figure monthly tuition fee perchild and whose total education costs per child can even approach five-figures. And second, 'non-elite' private schools that charge up to a three-figure monthly tuition per child. Urdu-medium educational institutions canalso be classified into two broad categories. First, government schoolsand, in some cases, private schools, that charge nominal tuition per child.And second, madrassahs, (institutions of Islamic religious learning) thatcharge nominal or no tuition fees, and in many cases, even offer freeboarding and lodging. There are several other overlapping sub-streamswithin the four categories: government model schools, cadet schools runby the military, schools run by religious, military and private foundations,individually-run madrassahs, etc. Since these sub-streams account for avery small percentage of the total number of schooled students in thecountry, they have not been included in the analysis.
CH
APTE
R 7
So
cia
l D
eve
lop
me
nt
in P
aki
sta
n,
20
02
-03
156
CITIZENS OFALIEN WORLDS
Competing for the best.
Elite English-medium schools are relatively few in number, and low incoverage, as they operate mostly in urban areas. They are operated andmanaged professionally and focus on quality education. The privateschools among them are run as medium-scale corporations, with a strong'customer' focus and a ‘brand image’ commitment, and charge significantlyhigher tuition fees. Non-elite English-medium schools are generallyprivately owned and family-operated through a personalized managementsystem. Of the students enrolled in private English-medium schools, about2 per cent are in elite schools that charge annual fees of more than Rs.20,000, while over 67 per cent are in non-elite schools that charge lessthan Rs. 2,500. The classification of English medium schools as elite ornon-elite is explained in box 7.1.
Urdu-medium schools are largely government operated and provideeducation to about 70 per cent of the total school age population. In fact, thepublic sector is the main provider of education in Pakistan. In primaryeducation, the public sector constitutes 73 per cent of total primaryenrolment, with a larger proportion in rural areas. The share of public sectorenrolment in rural areas is 82 per cent compared to 62 per cent in urbanareas (see table 7.1). Public schools are administered by the provincialDepartments of Education, although their management has now beentransferred to the district governments. Madrassahs cater to about one percent of the student population and are regulated by their respective Boards.
Income is the primary determinant of whether a child goes to anEnglish-medium or Urdu-medium school or to a madrassah. Upperincome households generally send their children to English-mediumschools and lower income households send their children, if at all, toUrdu-medium schools or madrassahs. At a further level ofdisaggregation, it can be said that elite English-medium schools areaccessed by upper-income groups, non-elite English-medium schools bymiddle-income groups, and Urdu-medium schools and madrassahs bylower-middle and lower-income groups. However, the ideological contentof the curricula does not follow the English-Urdu dichotomy. There is aseparate division with respect to ‘ideology’. The elite and non-eliteEnglish-medium schools and the Urdu-medium schools follow a secularcurriculum, while the madrassahs offer religious education.
The objective of this analysis is not to present any stream ofeducation as superior to the others but to highlight an alarming implication:students of these different streams hold such different worldviews andopinions that they seem to be living in different worlds. This has occurredpartly because of differences in textbooks and methods of learning andpartly because of differences in the discourses students are exposed to
CH
APTE
R 7
So
cia
l D
eve
lop
me
nt
in P
aki
sta
n,
20
02
-03
157
Income is theprimary
determinant ofwhether a child
goes to anEnglish-medium or
Urdu-mediumschool or to a
madrassah.
TABLE 7.1 DISTRIBUTION OF PRIMARY ENROLMENT, 2002Urban Rural Overall
Government 62.4 81.8 73.0Private 36.9 17.1 26.1Madrassah 0.7 1.1 0.9Total 100 100 100Source: PIHS (2002)
inside and outside their schools. In many respects, these worldviews areeven hostile to each other to an extent that has polarized society andimpeded national cohesion.
The region in which Pakistan is located has an ancient tradition of bothformal and informal learning. However, this has varied between different
socioeconomic strata. Those at the bottom of the social ladder generallyreceived no formal education at all, while those in the upper echelonslearned languages, literature, theology and other subjects. During the pre-colonial era, there were hundreds of maktabs (Persian schools),madrassahs, and schools imparting education in local languages. Giventhat Persian was the language of the Court, there was a majority ofmaktabs, ostensibly because knowledge of Persian offered greateropportunities for employment as functionaries of the Court.
CH
APTE
R 7
So
cia
l D
eve
lop
me
nt
in P
aki
sta
n,
20
02
-03
158
THE HISTORICAL LEGACY
Language becamea symbol of theeducational castesystem.
BOX 7.1 IDENTIFYING ELITE VERSUS NON-ELITEENGLISH-MEDIUM SCHOOLS
The analysis of studentenrolment in different
education streams in terms ofincome groups is based ondata available from thePakistan Integrated HouseholdSurvey (PIHS), 1999. PIHSprovides the following datarelevant for this analysis:household income, informationon whether children go toUrdu-medium or English-medium schools or tomadrassahs, fees paid perchild, total expenditure oneducation, and ownership ofselected assets.
The analysis required anumber of definitionaldecisions. In this respect,income groups have beenclassified as follows:
Households earning lessthan Rs. 50,000 perannum are classified as'poor';Households earningbetween Rs. 50,000 andRs. 100,000 per annumare classified as 'lowermiddle income';Households earningbetween Rs. 100,000 andRs. 250,000 per annumare classified as 'middleincome';Households earning over
Rs. 250,000 per annumare classified as 'upperincome'.The classification of
schools poses somedefinitional challenges.English-medium schools, Urdu-medium schools andmadrassahs are self-defined.However, classifying English-medium schools into elite andnon-elite categories presentedsome problems of definition.One possible approach was toclassify households sendingtheir children to English-medium schools on the basisof fees per student charged byschools, and to classify caseswhere the monthly fees areabove Rs. 500 as elite, whilethose below Rs. 500 would becategorized as non-elite.Another possibility was to useper pupil householdexpenditure on education asthe determinant of whether achild went to an elite or non-elite school. For example,cases where the monthly perpupil expenditure on educationis above Rs. 1,000 could beclassified as elite, and where itis below Rs.1,000, could beclassfied as non-elite. Bothpossibilities appeared to beproblematic, as there are
institutionally run elite schoolsthat offer high quality educationcomparable to privately runhigh fees elite schools thatcharge fees that are more inline with non-elite schools. Athird possibility was to use acombination of per pupilhousehold expenditure oneducation and a householdasset measure that definesincome stratification.
The third option wasadopted and households thatsend their children to eliteEnglish-medium schools havebeen identified as those thatincur a per-pupil educationexpenditure of more than Rs.12,000 per annum and own acar; given that car ownership isa defining characteristic ofupper-income households.Households that do not meeteither condition and arereported to be sending theirchildren to English-mediumschools are considered to besending them to non-eliteschools.
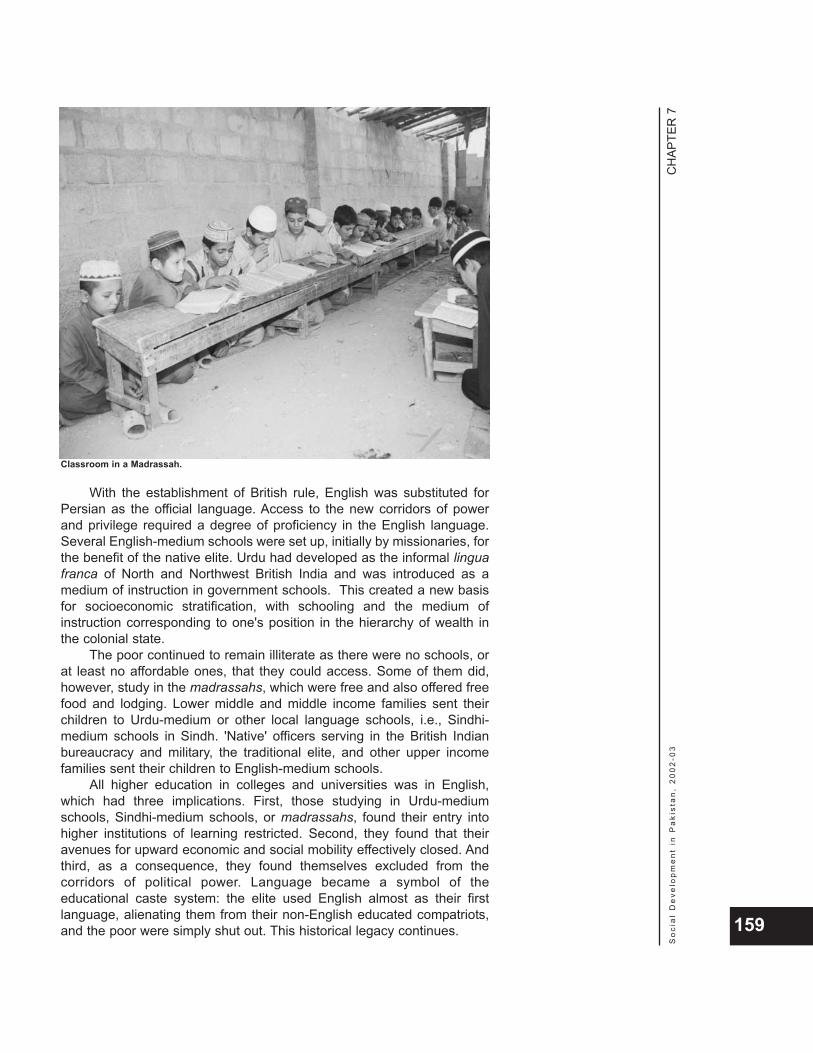
With the establishment of British rule, English was substituted forPersian as the official language. Access to the new corridors of powerand privilege required a degree of proficiency in the English language.Several English-medium schools were set up, initially by missionaries, forthe benefit of the native elite. Urdu had developed as the informal linguafranca of North and Northwest British India and was introduced as amedium of instruction in government schools. This created a new basisfor socioeconomic stratification, with schooling and the medium ofinstruction corresponding to one's position in the hierarchy of wealth inthe colonial state.
The poor continued to remain illiterate as there were no schools, orat least no affordable ones, that they could access. Some of them did,however, study in the madrassahs, which were free and also offered freefood and lodging. Lower middle and middle income families sent theirchildren to Urdu-medium or other local language schools, i.e., Sindhi-medium schools in Sindh. 'Native' officers serving in the British Indianbureaucracy and military, the traditional elite, and other upper incomefamilies sent their children to English-medium schools.
All higher education in colleges and universities was in English,which had three implications. First, those studying in Urdu-mediumschools, Sindhi-medium schools, or madrassahs, found their entry intohigher institutions of learning restricted. Second, they found that theiravenues for upward economic and social mobility effectively closed. Andthird, as a consequence, they found themselves excluded from thecorridors of political power. Language became a symbol of theeducational caste system: the elite used English almost as their firstlanguage, alienating them from their non-English educated compatriots,and the poor were simply shut out. This historical legacy continues.
CH
APTE
R 7
So
cia
l D
eve
lop
me
nt
in P
aki
sta
n,
20
02
-03
159
Classroom in a Madrassah.
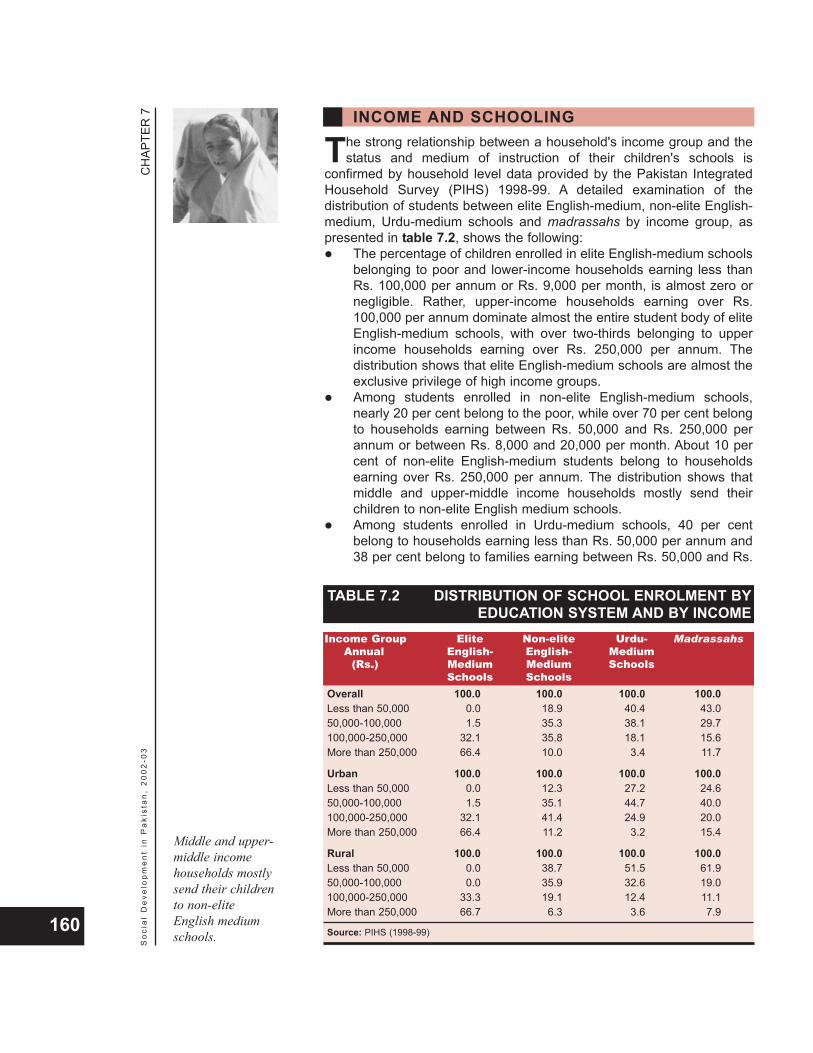
The strong relationship between a household's income group and thestatus and medium of instruction of their children's schools is
confirmed by household level data provided by the Pakistan IntegratedHousehold Survey (PIHS) 1998-99. A detailed examination of thedistribution of students between elite English-medium, non-elite English-medium, Urdu-medium schools and madrassahs by income group, aspresented in table 7.2, shows the following:
The percentage of children enrolled in elite English-medium schoolsbelonging to poor and lower-income households earning less thanRs. 100,000 per annum or Rs. 9,000 per month, is almost zero ornegligible. Rather, upper-income households earning over Rs.100,000 per annum dominate almost the entire student body of eliteEnglish-medium schools, with over two-thirds belonging to upperincome households earning over Rs. 250,000 per annum. Thedistribution shows that elite English-medium schools are almost theexclusive privilege of high income groups.Among students enrolled in non-elite English-medium schools,nearly 20 per cent belong to the poor, while over 70 per cent belongto households earning between Rs. 50,000 and Rs. 250,000 perannum or between Rs. 8,000 and 20,000 per month. About 10 percent of non-elite English-medium students belong to householdsearning over Rs. 250,000 per annum. The distribution shows thatmiddle and upper-middle income households mostly send theirchildren to non-elite English medium schools.Among students enrolled in Urdu-medium schools, 40 per centbelong to households earning less than Rs. 50,000 per annum and38 per cent belong to families earning between Rs. 50,000 and Rs.
CH
APTE
R 7
So
cia
l D
eve
lop
me
nt
in P
aki
sta
n,
20
02
-03
160
Middle and upper-middle incomehouseholds mostlysend their childrento non-eliteEnglish mediumschools.
INCOME AND SCHOOLING
TABLE 7.2 DISTRIBUTION OF SCHOOL ENROLMENT BYEDUCATION SYSTEM AND BY INCOME
Income Group Elite Non-elite Urdu- MadrassahsAnnual English- English- Medium
(Rs.) Medium Medium SchoolsSchools Schools
Overall 100.0 100.0 100.0 100.0Less than 50,000 0.0 18.9 40.4 43.050,000-100,000 1.5 35.3 38.1 29.7100,000-250,000 32.1 35.8 18.1 15.6More than 250,000 66.4 10.0 3.4 11.7
Urban 100.0 100.0 100.0 100.0Less than 50,000 0.0 12.3 27.2 24.650,000-100,000 1.5 35.1 44.7 40.0100,000-250,000 32.1 41.4 24.9 20.0More than 250,000 66.4 11.2 3.2 15.4
Rural 100.0 100.0 100.0 100.0Less than 50,000 0.0 38.7 51.5 61.950,000-100,000 0.0 35.9 32.6 19.0100,000-250,000 33.3 19.1 12.4 11.1More than 250,000 66.7 6.3 3.6 7.9
Source: PIHS (1998-99)

100,000 per annum. In other words, nearly 80 percent of studentsenrolled in Urdu-medium schools belong to households earning lessthan Rs. 9,000 per month. This percentage drops systematically asthe income bracket rises, with only 3 per cent of students in Urdu-medium schools belonging to households earning over Rs. 250,000per annum. Clearly, poor and lower middle income households sendtheir children to Urdu-medium schools.Among students enrolled in madrassahs, 43 per cent belong to poorhouseholds earning less than Rs. 50,000 per annum and about 30per cent belong to lower-middle income households earningbetween Rs. 50,000 and Rs. 100,000 per annum. In other words,nearly three-quarters of the students in madrassahs belong to pooror lower-middle class households. The remaining 27 per cent ofstudents belong to upper-middle and upper income householdsearning over Rs. 100,000 per annum. It is notable that about 12 percent of madrassah students belong to upper income householdsearning over Rs. 250,000 per annum.The urban-rural breakdown provides additional insights. While almost20 per cent of students enrolled in English-medium schools belong tothe poor on an aggregate level, this increases to almost 40 per centfor rural areas and less than 15 per cent in urban areas. Similarly, forUrdu-medium schools, the percentage of poor students is over 50 percent in rural areas and less than 30 per cent in urban areas. Thesame rural concentration is evident in the case of madrassahs aswell. On the other hand, the level stratification of students in eliteEnglish-medium schools is identical in urban and rural areas.Evidence that the madrassahs cater primarily to the poor and lower
income sections of the population is supported by other research.According to one survey of madrassah students, 89 per cent ofrespondents cited socioeconomic factors and 6 per cent cited religiousfactors for joining madrassahs. Another study found 80 per cent ofmadrassah students in Peshawar, Multan and Gujranwala to be sons of
CH
APTE
R 7
So
cia
l D
eve
lop
me
nt
in P
aki
sta
n,
20
02
-03
161
Urdu-medium graduates have limited opportunities.
small or landless peasants, rural artisans, rural labourers, smallshopkeepers, and imams of village mosques. SPDC's own investigationhas found that, in a majority of cases, parents admitted their children tomadrassahs as they could not afford to feed them or educate them evenin low-cost government schools.
Madrassahs are able to cater to the mass of poor students based ontwo factors. First, their own operating costs are extremely low comparedto other private or even government educational institutions. Averageannual cost of tuition, books, food and accommodation is reported to beas low as Rs. 6,000 per student or less. And second, madrassahs arefinanced liberally through philanthropy and, to some extent, governmentgrants. A major factor in the increasing popularity of madrassahs amongthe poor can also be attributed to the 'welfare state' role they perform.
The identity and value system of children is strongly shaped by thecontent of their curricula and textbooks. Elite and non-elite English-
medium and Urdu-medium schools follow curricula that may be describedas secular, despite a heavy stress on 'Islamic Ideology' in officiallyprescribed textbooks used by students appearing for examinations in thePakistani system. Madrassahs follow a curriculum that is distinctlyreligious. A comparison of the curriculum and textbooks of the differentsystems leads to disturbing conclusions.
Elite English-medium schools prepare students for the Ordinary andAdvanced level examinations conducted by the University of Cambridgein the UK. The curriculum, textbooks and teaching methods of theseschools are known to follow modern pedagogical standards and teachersare encouraged to be innovative and to promote thinking, exploring andquestioning on the part of students. This is partly ensured through thechoice of multiple textbooks and other reading materials. For example,the history component of Pakistan Studies comprises six recommendedtextbooks for students and 16 reference books for teachers. The teachingof classics _ albeit, abridged versions _ for English Literature, WorldHistory, etc., is extensive in order to broaden students' knowledge-baseand awareness.
Greater diversity in the use of textbooks creates opportunities fordiscussion, promotes diversity in thoughts and ideas, and tends to establishthe basis for a pluralistic and tolerant mindset. Elite English-medium schoolstudents are far more conversant with English language books and filmsand are exposed to discourses that are likely to give them a relatively moreinternationalist outlook. On the other hand, most such students appear tobe unenthusiastic about subjects such as Urdu and Islamiat (teaching ofthe Qur’an and Hadith; Islamic history and jurisprudence) and are generallyunfamiliar with Pakistani writers and poets and, in some cases, evenPakistani film and television stars.
Urdu-medium and non-elite English medium schools preparestudents for the Secondary and Higher Secondary School Certificatesexaminations conducted by the provincial Boards of Secondary andIntermediate Examinations. These schools are known to take a ratherstaid and rigid approach to curriculum, textbooks and teaching methods.
CH
APTE
R 7
So
cia
l D
eve
lop
me
nt
in P
aki
sta
n,
20
02
-03
162
The limiteddiscourses to whichUrdu-mediumstudents areexposed are likely tolead to a somewhatparochial outlookwith respect to bothdomestic andinternational socialand political issues.
ROLE OF TEXTBOOKS
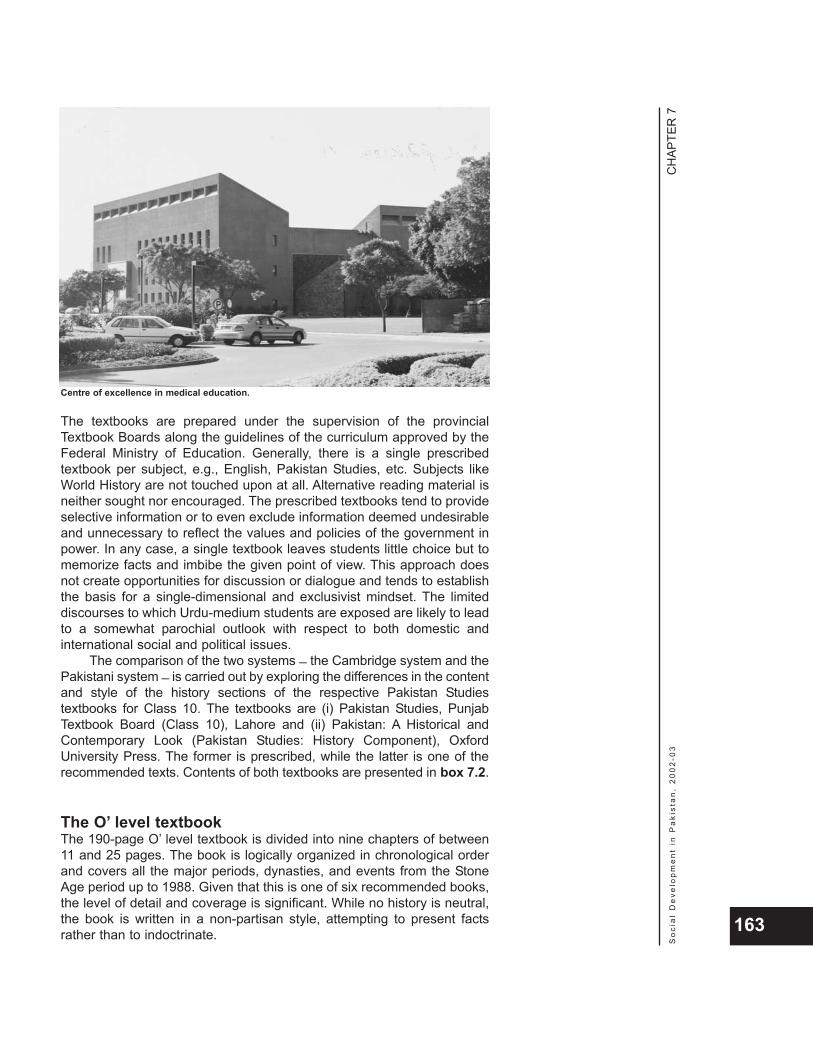
The textbooks are prepared under the supervision of the provincialTextbook Boards along the guidelines of the curriculum approved by theFederal Ministry of Education. Generally, there is a single prescribedtextbook per subject, e.g., English, Pakistan Studies, etc. Subjects likeWorld History are not touched upon at all. Alternative reading material isneither sought nor encouraged. The prescribed textbooks tend to provideselective information or to even exclude information deemed undesirableand unnecessary to reflect the values and policies of the government inpower. In any case, a single textbook leaves students little choice but tomemorize facts and imbibe the given point of view. This approach doesnot create opportunities for discussion or dialogue and tends to establishthe basis for a single-dimensional and exclusivist mindset. The limiteddiscourses to which Urdu-medium students are exposed are likely to leadto a somewhat parochial outlook with respect to both domestic andinternational social and political issues.
The comparison of the two systems _ the Cambridge system and thePakistani system _ is carried out by exploring the differences in the contentand style of the history sections of the respective Pakistan Studiestextbooks for Class 10. The textbooks are (i) Pakistan Studies, PunjabTextbook Board (Class 10), Lahore and (ii) Pakistan: A Historical andContemporary Look (Pakistan Studies: History Component), OxfordUniversity Press. The former is prescribed, while the latter is one of therecommended texts. Contents of both textbooks are presented in box 7.2.
The O’ level textbookThe 190-page O’ level textbook is divided into nine chapters of between11 and 25 pages. The book is logically organized in chronological orderand covers all the major periods, dynasties, and events from the StoneAge period up to 1988. Given that this is one of six recommended books,the level of detail and coverage is significant. While no history is neutral,the book is written in a non-partisan style, attempting to present factsrather than to indoctrinate.
CH
APTE
R 7
So
cia
l D
eve
lop
me
nt
in P
aki
sta
n,
20
02
-03
163
Centre of excellence in medical education.
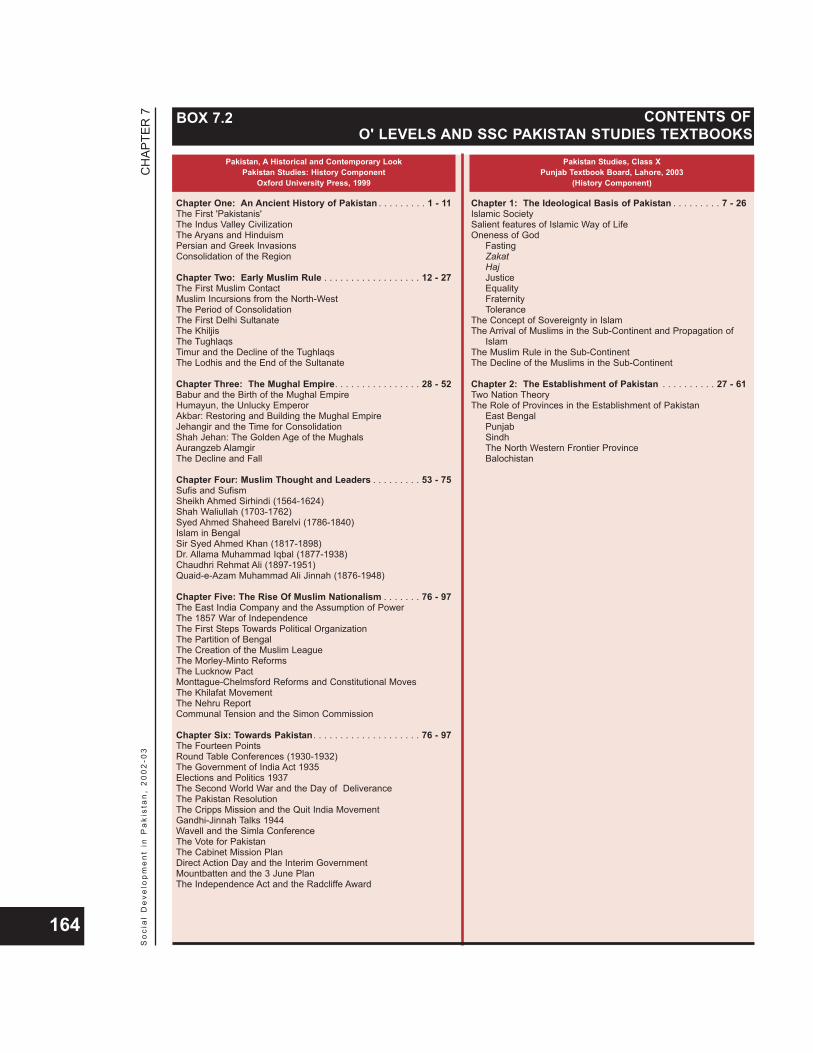
CH
APTE
R 7
So
cia
l D
eve
lop
me
nt
in P
aki
sta
n,
20
02
-03
164
BOX 7.2 CONTENTS OFO' LEVELS AND SSC PAKISTAN STUDIES TEXTBOOKS
Pakistan, A Historical and Contemporary LookPakistan Studies: History Component
Oxford University Press, 1999
Pakistan Studies, Class XPunjab Textbook Board, Lahore, 2003
(History Component)
Chapter One: An Ancient History of Pakistan . . . . . . . . . 1 - 11The First 'Pakistanis'The Indus Valley CivilizationThe Aryans and HinduismPersian and Greek InvasionsConsolidation of the Region
Chapter Two: Early Muslim Rule . . . . . . . . . . . . . . . . . . 12 - 27The First Muslim ContactMuslim Incursions from the North-WestThe Period of ConsolidationThe First Delhi SultanateThe KhiljisThe TughlaqsTimur and the Decline of the TughlaqsThe Lodhis and the End of the Sultanate
Chapter Three: The Mughal Empire. . . . . . . . . . . . . . . . 28 - 52Babur and the Birth of the Mughal EmpireHumayun, the Unlucky EmperorAkbar: Restoring and Building the Mughal EmpireJehangir and the Time for ConsolidationShah Jehan: The Golden Age of the MughalsAurangzeb AlamgirThe Decline and Fall
Chapter Four: Muslim Thought and Leaders . . . . . . . . . 53 - 75Sufis and SufismSheikh Ahmed Sirhindi (1564-1624)Shah Waliullah (1703-1762)Syed Ahmed Shaheed Barelvi (1786-1840)Islam in BengalSir Syed Ahmed Khan (1817-1898)Dr. Allama Muhammad Iqbal (1877-1938)Chaudhri Rehmat Ali (1897-1951)Quaid-e-Azam Muhammad Ali Jinnah (1876-1948)
Chapter Five: The Rise Of Muslim Nationalism . . . . . . . 76 - 97The East India Company and the Assumption of PowerThe 1857 War of IndependenceThe First Steps Towards Political OrganizationThe Partition of BengalThe Creation of the Muslim LeagueThe Morley-Minto ReformsThe Lucknow PactMonttague-Chelmsford Reforms and Constitutional MovesThe Khilafat MovementThe Nehru ReportCommunal Tension and the Simon Commission
Chapter Six: Towards Pakistan. . . . . . . . . . . . . . . . . . . . 76 - 97The Fourteen PointsRound Table Conferences (1930-1932)The Government of India Act 1935Elections and Politics 1937The Second World War and the Day of DeliveranceThe Pakistan ResolutionThe Cripps Mission and the Quit India MovementGandhi-Jinnah Talks 1944Wavell and the Simla ConferenceThe Vote for PakistanThe Cabinet Mission PlanDirect Action Day and the Interim GovernmentMountbatten and the 3 June PlanThe Independence Act and the Radcliffe Award
Chapter 1: The Ideological Basis of Pakistan . . . . . . . . . 7 - 26Islamic SocietySalient features of Islamic Way of LifeOneness of God
FastingZakatHajJusticeEqualityFraternityTolerance
The Concept of Sovereignty in IslamThe Arrival of Muslims in the Sub-Continent and Propagation of
IslamThe Muslim Rule in the Sub-ContinentThe Decline of the Muslims in the Sub-Continent
Chapter 2: The Establishment of Pakistan . . . . . . . . . . 27 - 61Two Nation TheoryThe Role of Provinces in the Establishment of Pakistan
East BengalPunjabSindhThe North Western Frontier ProvinceBalochistan
The first chapter is devoted to the ancient, pre-Islamic history of theregion that now comprises Pakistan. It covers the Indus Valley civilization,the arrival of the Aryans and the development of Hinduism, the Persianand Greek invasions, and the interplay of power dynamics between theGreeks and the emerging Mauryan Empire up to the year 630 AD.
The Muslim period from the arrival of Mohammed bin Qasim in 712AD to the founding of Pakistan in 1947 is covered in chapters 2 through6. The second chapter details early Muslim rule in the region. It chroniclesthe circumstances leading to the Arab invasion under Mohammed binQasim, and the invasions of Mahmud of Ghazni and their respectiveefforts and challenges to consolidate Muslim rule. It discusses theestablishment of the Delhi sultanate, and the reigns of the so-called SlaveDynasty, the Khiljis, the Tughluqs, and the Lodhis.
The third chapter covers the entire Mughal era from the EmperorsBabur to Aurangzeb over a 200-year period. It details the major events,achievements, conflicts, and failings of each emperor and the role eachplayed in shaping history. The circumstances and causes of the declineand fall of the Mughal Empire are also dealt with in some detail. Onewhole chapter is devoted to major thinkers, intellectuals and leaders ofthe region over a 300-year period from Shaikh Ahmad Sirhindi to Quaid-e-Azam, and documents their contribution to the development of socialand political thought and the various movements in the region.
Chapters 5 and 6 record a momentous era covering over 300 yearsin the history of the region. It describes the rise of the East India Companysince 1612 and the circumstances leading to the establishment of Britishcolonial rule, including the 1857 War of Independence and theconsequent rise of nationalist movements, leading to the founding of theMuslim League. It documents the torturous process of British governmentmeasures, the moves and counter-moves by the Congress and theMuslim League, and the numerous rounds of negotiations that had aprofound bearing on events leading to the establishment of Pakistan.These include events such as the Morley-Minto Reforms, the LucknowPact, the Khilafat Movement, Jinnah's Fourteen Points, the Roundtable
CH
APTE
R 7
So
cia
l D
eve
lop
me
nt
in P
aki
sta
n,
20
02
-03
165
Centre of higher learning in Balochistan.
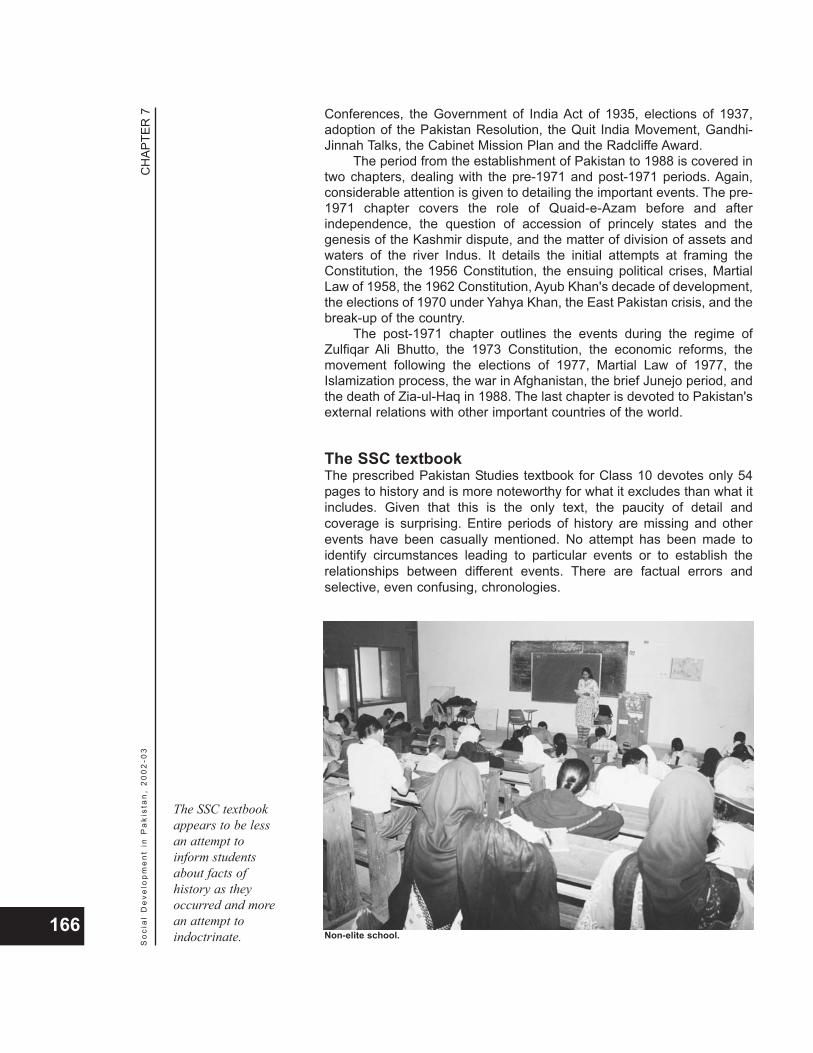
Conferences, the Government of India Act of 1935, elections of 1937,adoption of the Pakistan Resolution, the Quit India Movement, Gandhi-Jinnah Talks, the Cabinet Mission Plan and the Radcliffe Award.
The period from the establishment of Pakistan to 1988 is covered intwo chapters, dealing with the pre-1971 and post-1971 periods. Again,considerable attention is given to detailing the important events. The pre-1971 chapter covers the role of Quaid-e-Azam before and afterindependence, the question of accession of princely states and thegenesis of the Kashmir dispute, and the matter of division of assets andwaters of the river Indus. It details the initial attempts at framing theConstitution, the 1956 Constitution, the ensuing political crises, MartialLaw of 1958, the 1962 Constitution, Ayub Khan's decade of development,the elections of 1970 under Yahya Khan, the East Pakistan crisis, and thebreak-up of the country.
The post-1971 chapter outlines the events during the regime ofZulfiqar Ali Bhutto, the 1973 Constitution, the economic reforms, themovement following the elections of 1977, Martial Law of 1977, theIslamization process, the war in Afghanistan, the brief Junejo period, andthe death of Zia-ul-Haq in 1988. The last chapter is devoted to Pakistan'sexternal relations with other important countries of the world.
The SSC textbookThe prescribed Pakistan Studies textbook for Class 10 devotes only 54pages to history and is more noteworthy for what it excludes than what itincludes. Given that this is the only text, the paucity of detail andcoverage is surprising. Entire periods of history are missing and otherevents have been casually mentioned. No attempt has been made toidentify circumstances leading to particular events or to establish therelationships between different events. There are factual errors andselective, even confusing, chronologies.
CH
APTE
R 7
So
cia
l D
eve
lop
me
nt
in P
aki
sta
n,
20
02
-03
166Non-elite school.
The SSC textbookappears to be lessan attempt toinform studentsabout facts ofhistory as theyoccurred and morean attempt toindoctrinate.
Interfering with the chronological order of historical events istantamount to distorting the interpretation of history. No history, as statedearlier, is neutral; however, this book appears to be less an attempt toinform students about facts of history as they occurred and more anattempt to indoctrinate. A reading of the relevant portions of the book islikely to give the uninitiated reader the false view that the region's historywas marked exclusively by religious struggles without providing anyinsights into the interplay of social/political/economic forces engaged inany such struggle.
There are innumerable repetitive statements of little or no historicalsignificance. For example, on pages 17 and 18, it states: "The nativeinhabitants of the shore-lands embraced Islam as they were impressed bythe Islamic character of these traders." One sentence later, it states again,"A large number of local people embraced Islam as they were impressedby the social life, fair treatment and tolerance of Muslims." And yet again,five sentences later, it repeats, "A large number of Hindus embraced Islam,impressed by their pious life, high character and fair treatment."
The history section of the book dispenses with the entire history ofthe region before 712 AD and begins with the arrival of Muslims in thesub-continent and the propagation of Islam. However, Mohammed binQasim is mentioned nowhere in the account. The narrative then jumpsforward almost 300 years to Mahmud of Ghazni's incursions into Punjab.There follows a listing of Sufi saints from Islam Shaikh Islam Lahori toShah Abdul Latif Bhattai over a 700-year period from 1000 to 1700. Thenarrative then jumps backwards about 500 years to Qutubuddin Aibak.After a page on the resulting influence of Islam on the culture of theregion, the book almost omits the entire Mughal period from emperorsBabur to Shah Jehan and jumps forward by 450 years to the MughalEmperor Aurangzeb. There is no discussion of the causes of the declineand demise of the Mughal Empire. A brief mention of Nadar Shah, ShahWali Ullah Dehlvi, Syed Ahmad Brailvi, etc., concludes the chapter on thehistory of the region prior to the commencement of the movement forPakistan.
The book is completely silent on the British colonial period. Nor isthere any reference to the Renaissance in Europe, the development oflearning and growth of technology and industry, and the consequentialneed for cheap raw materials and captive markets as the motive forcolonialism. There is no reference to the superior social and politicalorganization that enabled a handful of small countries to occupy anddominate more than half the world. The omission deprives students fromgaining a crucial lesson that independence and affluence are based onthe power of knowledge and command over technology.
The chapter on the Pakistan Movement is also selective and omitskey events that shaped the nature of the struggle for Pakistan andcontinue to influence domestic and regional issues. Only the followingevents are mentioned during the half-a-century-long movement (in theorder presented in the book): the founding of the Muslim League in 1906,the founding of the Muhammedan Anglo-Oriental College in Aligarh in1875, the Khilafat Movement following World War I, the Nehru Report,Jinnah's Fourteen Points, the Government of India Act 1935 (erroneouslyreferred to as the ‘new constitution’), the 1937 elections, the PakistanResolution of 1940, the 1946 elections, the Cabinet Mission Plan, Direct
CH
APTE
R 7
So
cia
l D
eve
lop
me
nt
in P
aki
sta
n,
20
02
-03
167

Action, and the establishment of Pakistan. With the exception of theFourteen Points, which have been reproduced in full, all other eventshave been dealt with rather cursorily. There is a complete absence of anydiscussion or analysis on the forces that shaped social and politicalevents, the process of the formation and growth of the Muslim League,the alliances made and broken, the protracted negotiations with theCongress and other Muslim organizations, or the moves and countermoves of the British government, the Congress and the Muslim League.
The brief nine-page history section of the chapter on post-independence Pakistan, titled ‘The State and Government of Pakistan’,covering half a century of the country's life, begins thus:
"In the beginning man lived in family units. When these family unitscould not meet their defence, economic and other needs many familiesmerged themselves into a tribe. Later on, many tribes were united andformed a state. State means a country."
Thereafter, it describes the Objectives Resolution and constitutionmaking process from the 1950's to 1973. It mentions the military takeoverin 1977, the restoration of the amended constitution in 1985, and theelection and dismissal of the National Assembly in 1985 and 1986 withoutmentioning Prime Minister Mohammed Khan Junejo. It then lists the two-time elections and dismissals of Benazir Bhutto and Nawaz Sharif, andthe military takeover in 1999. The chapter's history section concludes:"Now the democracy has restorted (sic) in the country after the generalelection of 10th October 2002 …" . An eight-line section on the July 2001Pakistan-India summit meeting at Agra, India is erroneously included inthe chapter on "Pakistan's relations with Muslim countries" (see box 7.3).
On the whole, uninitiated readers without access to other readingmaterial are likely to remain ignorant of over a thousand years of thehistory of the region relating to the Aryans, Hindus, Buddhists, Mauryans,Mughals and British. They are unlikely to be cognizant of the interplay ofpolitical, social and economic forces that shaped events leading to thecreation of Pakistan in 1947, the breakup of the country in 1971, and therepeated suspensions of democracy and military takeovers. It isimprobable that they will be sufficiently aware of the profound and diverseinfluence of these eras and events on the culture and politics of theregion, and consequently unlikely that they could fully understand theintricate dynamics of events occurring today in the country and theregion. As a consequence, instead of being able to acknowledge diversityin points of view, they are likely to look at the world in over-simplified,uncritical, 'black and white' and 'us versus them' terms and to developsingle-dimensional, exclusivist mindsets. At the same time however,given the poor intellectual standard of the material and its presentation inthe textbook, students are also unlikely to be fully convinced of whateverposition they hold or able to defend their position in an intellectual debate.
The madrassah curriculumMadrassah is the Arabic word for school and first emerged as anorganized system of education in present-day Iraq in the 11th century. Theoriginal curriculum consisted of two main branches of learning: revealedknowledge (manqoolat) and knowledge acquired through intellectualendeavour (ma'aqoolat,) and encompassing the following topics:
CH
APTE
R 7
So
cia
l D
eve
lop
me
nt
in P
aki
sta
n,
20
02
-03
168
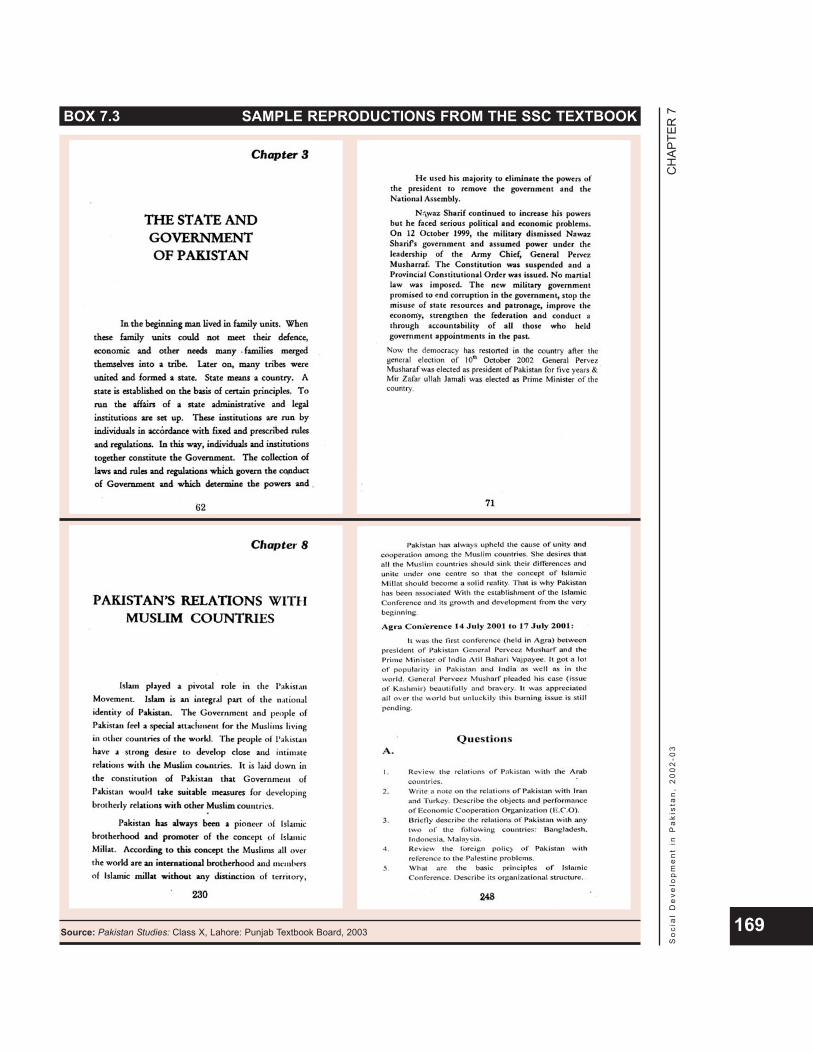
CH
APTE
R 7
So
cia
l D
eve
lop
me
nt
in P
aki
sta
n,
20
02
-03
169
BOX 7.3 SAMPLE REPRODUCTIONS FROM THE SSC TEXTBOOK
Source: Pakistan Studies: Class X, Lahore: Punjab Textbook Board, 2003

1. Qur’an: Tajweed, Qirat, Hifz and Tafseer (Correct recitation ofQur’an, Recitation of Qur’an, Memorization of Qur’an andExegesis of the Qur’an respectively)
2. Hadith (Sayings of the Prophet, Peace be upon Him)3. Fiqah and Usul-e-Fiqah (Islamic jurisprudence and its principles)4. Ilm-ul- Kalam (Philosophy of religion)5. Tasawuf (Mysticism)6. Nahw and Lughat (Syntax and grammar)7. Mantiq (Logic)8. Hisaab (Arithmetic)9. Ilm-e-Hindsa (Geometry)
10. Ilm-ul-Hae'at (Astronomy)11. Ilm-ul-Tabiaat (Physical Sciences)12. Mausiqi (Music)
The term 'madrassah' has now come to be used exclusively forinstitutions of classical Islamic religious learning. They stand apart fromother streams of education in the country, i.e., English-medium and Urdu-medium, in the sense that their curriculum is essentially religious.
The number of registered madrassahs in 2002 is reported to be9,880. Information on unregistered madrassahs is not available.Madrassahs are regulated by five central boards representing thedifferent sects/sub-sects: Barelvi, Deobandi, Ahl-e-Hadith, Shia andJamaat-e-Islami (see table 7.3). Interestingly, all the boards have theirheadquarters in Punjab.
The largest numbers of madrassahs, 7,000 or over 70 per cent, areunder the Deobandi Wafaq-ul-Madaris, followed by nearly 1,600madrassahs under the Barelvi Tanzim-ul-Madaris. There are over 400madrassahs under the Shia Wafaq-ul-Madaris Pakistan. The number ofmadrassahs has grown rapidly since 1988. The largest (nearly nine-fold)growth has occurred for madrassahs under the Shia Wafaq-ul-MadarisPakistan, albeit from a very small base, followed by four-fold growth underthe Deobandi Wafaq-ul-Madaris, from an already large base. The numberof madrassahs under the Barelvi Tanzim-ul-Madaris and Ahl-e-HadithWafaq-ul-Madaris-al-Salaria has doubled during this period (see table 7.4).
The Boards determine the curriculum and syllabus, collectregistration and examination fees, and prepare examination papers. The
CH
APTE
R 7
So
cia
l D
eve
lop
me
nt
in P
aki
sta
n,
20
02
-03
170
TABLE 7.3 CENTRAL BOARDS OF MADRASSAHSIN PAKISTAN
Name of Sect Head Date ofBoard Sub-sect Office Establishment
Wafaq-ul-Madaris Deobandi Multan 1985Tanzim-ul-Madaris Barelvi Lahore 1960Wafaq-ul-Madaris-al-Salafia Ahl-e-Hadith Faisalabad 1978Rabta-tul-Madaris-al-Islamia Jamat-i-tslami Lahore 1986Wafaq-ul-Madaris Pakistan Shia Lahore 1962
Source: Offices of respective Boards
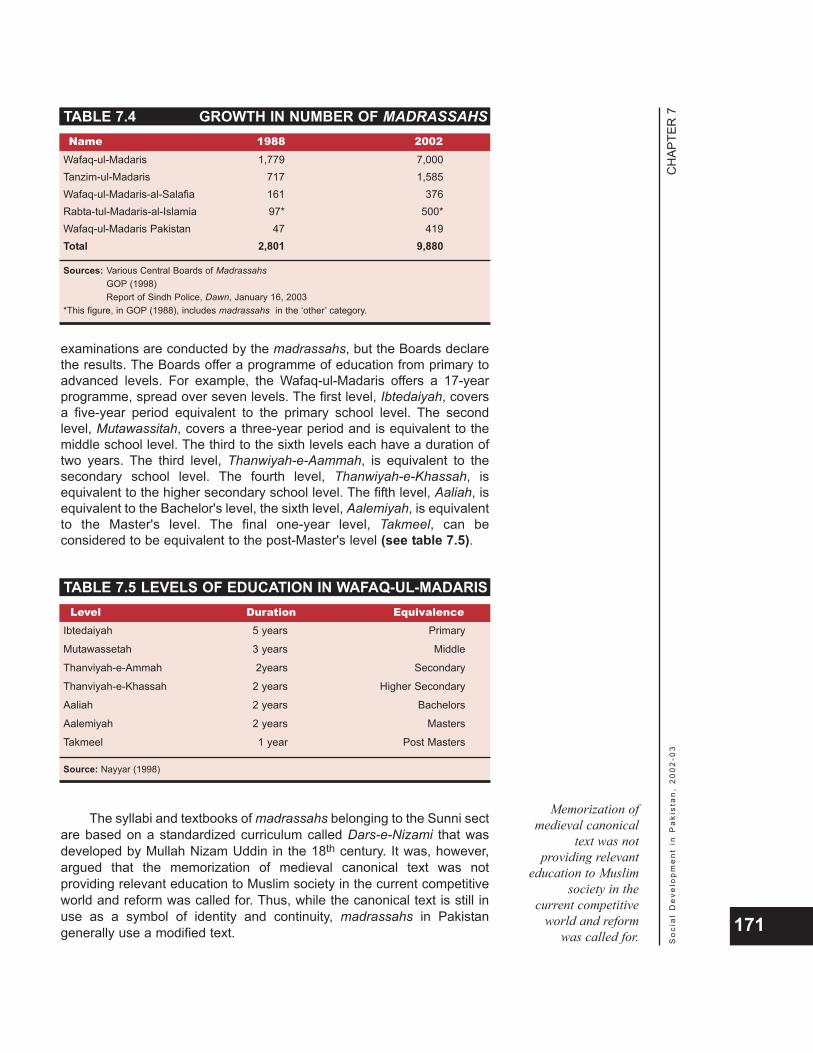
examinations are conducted by the madrassahs, but the Boards declarethe results. The Boards offer a programme of education from primary toadvanced levels. For example, the Wafaq-ul-Madaris offers a 17-yearprogramme, spread over seven levels. The first level, Ibtedaiyah, coversa five-year period equivalent to the primary school level. The secondlevel, Mutawassitah, covers a three-year period and is equivalent to themiddle school level. The third to the sixth levels each have a duration oftwo years. The third level, Thanwiyah-e-Aammah, is equivalent to thesecondary school level. The fourth level, Thanwiyah-e-Khassah, isequivalent to the higher secondary school level. The fifth level, Aaliah, isequivalent to the Bachelor's level, the sixth level, Aalemiyah, is equivalentto the Master's level. The final one-year level, Takmeel, can beconsidered to be equivalent to the post-Master's level (see table 7.5).
The syllabi and textbooks of madrassahs belonging to the Sunni sectare based on a standardized curriculum called Dars-e-Nizami that wasdeveloped by Mullah Nizam Uddin in the 18th century. It was, however,argued that the memorization of medieval canonical text was notproviding relevant education to Muslim society in the current competitiveworld and reform was called for. Thus, while the canonical text is still inuse as a symbol of identity and continuity, madrassahs in Pakistangenerally use a modified text.
CH
APTE
R 7
So
cia
l D
eve
lop
me
nt
in P
aki
sta
n,
20
02
-03
171
TABLE 7.4 GROWTH IN NUMBER OF MADRASSAHSName 1988 2002
Wafaq-ul-Madaris 1,779 7,000Tanzim-ul-Madaris 717 1,585Wafaq-ul-Madaris-al-Salafia 161 376Rabta-tul-Madaris-al-Islamia 97* 500*Wafaq-ul-Madaris Pakistan 47 419Total 2,801 9,880
Sources: Various Central Boards of MadrassahsGOP (1998)Report of Sindh Police, Dawn, January 16, 2003
*This figure, in GOP (1988), includes madrassahs in the ‘other’ category.
TABLE 7.5 LEVELS OF EDUCATION IN WAFAQ-UL-MADARISLevel Duration Equivalence
Ibtedaiyah 5 years Primary
Mutawassetah 3 years Middle
Thanviyah-e-Ammah 2years Secondary
Thanviyah-e-Khassah 2 years Higher Secondary
Aaliah 2 years Bachelors
Aalemiyah 2 years Masters
Takmeel 1 year Post Masters
Source: Nayyar (1998)
Memorization ofmedieval canonical
text was notproviding relevant
education to Muslimsociety in the
current competitiveworld and reform
was called for.
The curriculum includes understanding Qur’anic teachings,interpretation of the Qur’an and Hadith, Logic, Islamic Jurisprudence,Arabic Literature, and Arabic Grammar. Over the years, somemadrassahs have made changes in their curricula to accommodate theteaching of secular subjects, such as Pakistan Studies, Mathematics andGeneral Science. The extent of emphasis on these subjects variesconsiderably. For example, in some limited cases, madrassah studentsappear for the regular SSC examination conducted by the official Board,while in other cases, the examination for these subjects is conductedorally. The debate on reform of the madrassah curriculum continues todate, with one view being that madrassahs need to incorporate theteaching of physics, chemistry, biology, computer sciences andinformation technology as well. A syllabus of a madrassah affiliated to theDeobandi Wafaq-ul-Madaris is shown in box 7.4.
Two aspects of madrassah education are noteworthy from theperspective of the development of a mindset and worldview. One relatesto teaching at elementary levels and the other at advanced levels.
The madrassahs are well-organized institutions and students followa regulated, though somewhat regimented, schedule. While thereare substantial variations, a survey of over a dozen madrassahsenables the presentation of a generalized view of madrassahroutine. A typical day starts with Fajr (dawn) prayers, followed byrecitation of the Holy Qur’an. Regular classes commence soon afterbreakfast and continue until Zohr (afternoon) prayers and lunch.Classes may then continue or students may be allowed time for ashort siesta. There is a break for play after Asr (late afternoon)prayers. Magreb (at sunset) prayers are followed by a class untilIsha (night) prayers. Students then revise the day's learning beforegoing to bed around 11:00 p.m. The meals are modest and thestudents live, study and sleep on the floor together in the same hall,packing off their bedding in a corner during the day. Discipline isstrict. Deviations from rules, even by the younger students, aregenerally not tolerated and corporal punishment is the norm.
CH
APTE
R 7
So
cia
l D
eve
lop
me
nt
in P
aki
sta
n,
20
02
-03
172
School day is over.
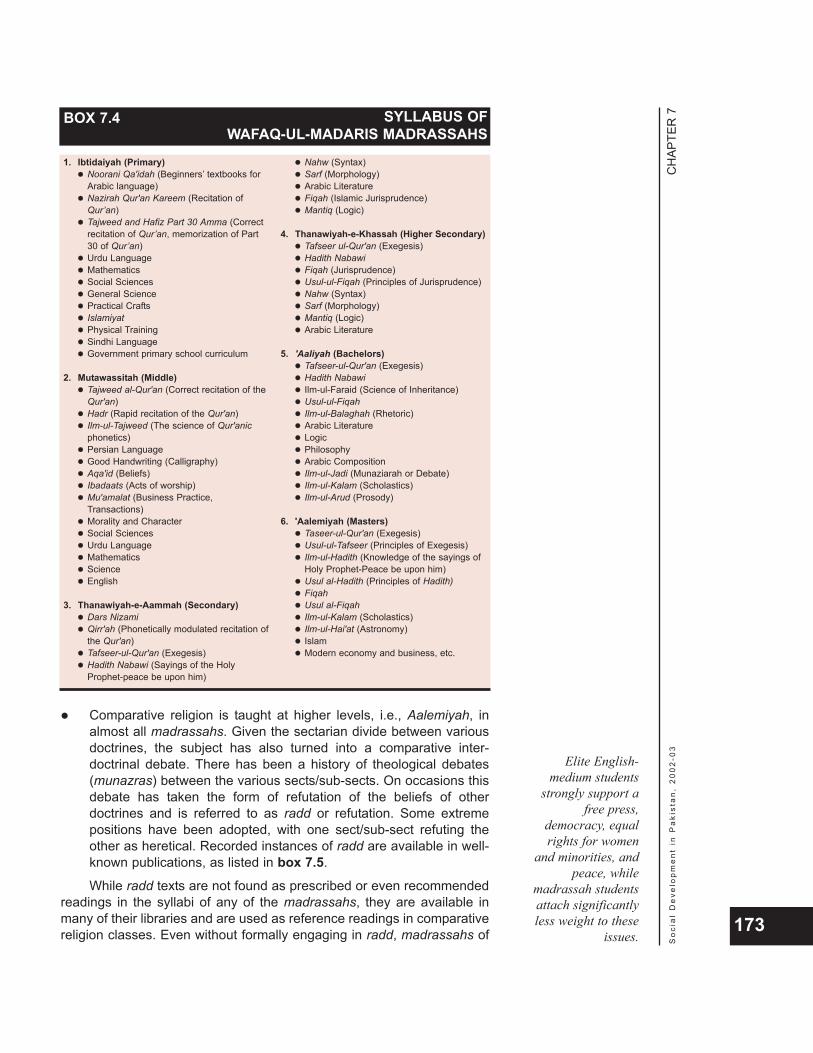
Comparative religion is taught at higher levels, i.e., Aalemiyah, inalmost all madrassahs. Given the sectarian divide between variousdoctrines, the subject has also turned into a comparative inter-doctrinal debate. There has been a history of theological debates(munazras) between the various sects/sub-sects. On occasions thisdebate has taken the form of refutation of the beliefs of otherdoctrines and is referred to as radd or refutation. Some extremepositions have been adopted, with one sect/sub-sect refuting theother as heretical. Recorded instances of radd are available in well-known publications, as listed in box 7.5.
While radd texts are not found as prescribed or even recommendedreadings in the syllabi of any of the madrassahs, they are available inmany of their libraries and are used as reference readings in comparativereligion classes. Even without formally engaging in radd, madrassahs of
CH
APTE
R 7
So
cia
l D
eve
lop
me
nt
in P
aki
sta
n,
20
02
-03
173
Elite English-medium students
strongly support afree press,
democracy, equalrights for women
and minorities, andpeace, while
madrassah studentsattach significantlyless weight to these
issues.
BOX 7.4 SYLLABUS OFWAFAQ-UL-MADARIS MADRASSAHS
1. Ibtidaiyah (Primary)Noorani Qa'idah (Beginners’ textbooks forArabic language)Nazirah Qur'an Kareem (Recitation ofQur’an)Tajweed and Hafiz Part 30 Amma (Correctrecitation of Qur’an, memorization of Part30 of Qur’an)Urdu LanguageMathematicsSocial SciencesGeneral SciencePractical CraftsIslamiyatPhysical TrainingSindhi LanguageGovernment primary school curriculum
2. Mutawassitah (Middle)Tajweed al-Qur'an (Correct recitation of theQur'an)Hadr (Rapid recitation of the Qur'an)Ilm-ul-Tajweed (The science of Qur'anicphonetics)Persian LanguageGood Handwriting (Calligraphy)Aqa'id (Beliefs)Ibadaats (Acts of worship)Mu'amalat (Business Practice,Transactions)Morality and CharacterSocial SciencesUrdu LanguageMathematicsScienceEnglish
3. Thanawiyah-e-Aammah (Secondary)Dars NizamiQirr'ah (Phonetically modulated recitation ofthe Qur'an)Tafseer-ul-Qur'an (Exegesis)Hadith Nabawi (Sayings of the HolyProphet-peace be upon him)
Nahw (Syntax)Sarf (Morphology)Arabic LiteratureFiqah (Islamic Jurisprudence)Mantiq (Logic)
4. Thanawiyah-e-Khassah (Higher Secondary)Tafseer ul-Qur'an (Exegesis)Hadith NabawiFiqah (Jurisprudence)Usul-ul-Fiqah (Principles of Jurisprudence)Nahw (Syntax)Sarf (Morphology)Mantiq (Logic)Arabic Literature
5. 'Aaliyah (Bachelors)Tafseer-ul-Qur'an (Exegesis)Hadith NabawiIlm-ul-Faraid (Science of Inheritance)Usul-ul-FiqahIlm-ul-Balaghah (Rhetoric)Arabic LiteratureLogicPhilosophyArabic CompositionIlm-ul-Jadi (Munaziarah or Debate)Ilm-ul-Kalam (Scholastics)Ilm-ul-Arud (Prosody)
6. 'Aalemiyah (Masters)Taseer-ul-Qur'an (Exegesis)Usul-ul-Tafseer (Principles of Exegesis)Ilm-ul-Hadith (Knowledge of the sayings ofHoly Prophet-Peace be upon him)Usul al-Hadith (Principles of Hadith)FiqahUsul al-FiqahIlm-ul-Kalam (Scholastics)Ilm-ul-Hai'at (Astronomy)IslamModern economy and business, etc.
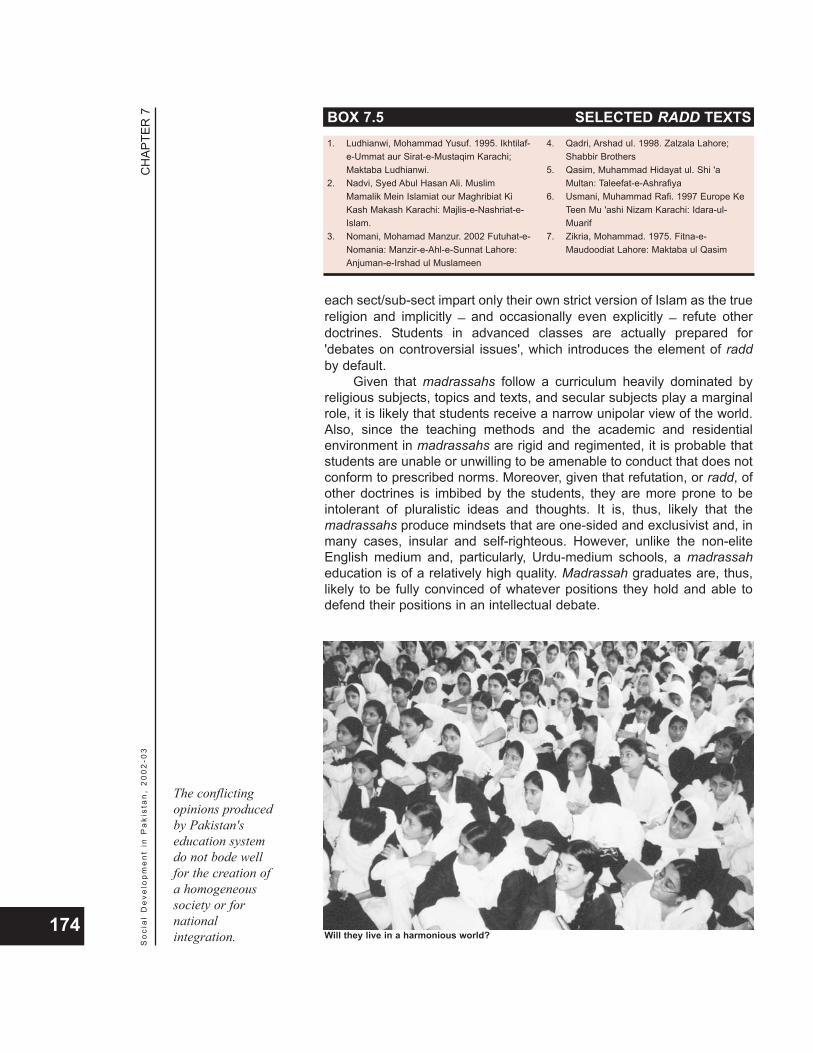
each sect/sub-sect impart only their own strict version of Islam as the truereligion and implicitly _ and occasionally even explicitly _ refute otherdoctrines. Students in advanced classes are actually prepared for'debates on controversial issues', which introduces the element of raddby default.
Given that madrassahs follow a curriculum heavily dominated byreligious subjects, topics and texts, and secular subjects play a marginalrole, it is likely that students receive a narrow unipolar view of the world.Also, since the teaching methods and the academic and residentialenvironment in madrassahs are rigid and regimented, it is probable thatstudents are unable or unwilling to be amenable to conduct that does notconform to prescribed norms. Moreover, given that refutation, or radd, ofother doctrines is imbibed by the students, they are more prone to beintolerant of pluralistic ideas and thoughts. It is, thus, likely that themadrassahs produce mindsets that are one-sided and exclusivist and, inmany cases, insular and self-righteous. However, unlike the non-eliteEnglish medium and, particularly, Urdu-medium schools, a madrassaheducation is of a relatively high quality. Madrassah graduates are, thus,likely to be fully convinced of whatever positions they hold and able todefend their positions in an intellectual debate.
CH
APTE
R 7
So
cia
l D
eve
lop
me
nt
in P
aki
sta
n,
20
02
-03
174
The conflictingopinions producedby Pakistan'seducation systemdo not bode wellfor the creation ofa homogeneoussociety or fornationalintegration. Will they live in a harmonious world?
BOX 7.5 SELECTED RADD TEXTS1. Ludhianwi, Mohammad Yusuf. 1995. Ikhtilaf-
e-Ummat aur Sirat-e-Mustaqim Karachi;Maktaba Ludhianwi.
2. Nadvi, Syed Abul Hasan Ali. MuslimMamalik Mein Islamiat our Maghribiat KiKash Makash Karachi: Majlis-e-Nashriat-e-Islam.
3. Nomani, Mohamad Manzur. 2002 Futuhat-e-Nomania: Manzir-e-Ahl-e-Sunnat Lahore:Anjuman-e-Irshad ul Muslameen
4. Qadri, Arshad ul. 1998. Zalzala Lahore;Shabbir Brothers
5. Qasim, Muhammad Hidayat ul. Shi 'aMultan: Taleefat-e-Ashrafiya
6. Usmani, Muhammad Rafi. 1997 Europe KeTeen Mu 'ashi Nizam Karachi: Idara-ul-Muarif
7. Zikria, Mohammad. 1975. Fitna-e-Maudoodiat Lahore: Maktaba ul Qasim
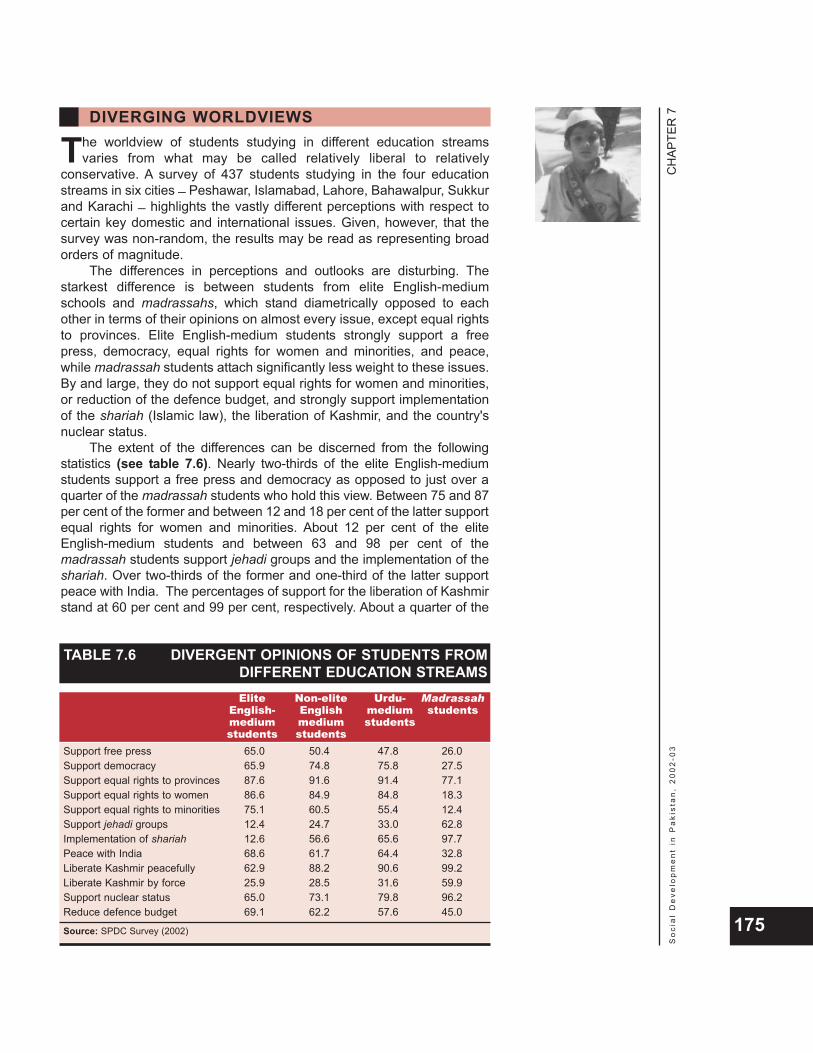
The worldview of students studying in different education streamsvaries from what may be called relatively liberal to relatively
conservative. A survey of 437 students studying in the four educationstreams in six cities _ Peshawar, Islamabad, Lahore, Bahawalpur, Sukkurand Karachi _ highlights the vastly different perceptions with respect tocertain key domestic and international issues. Given, however, that thesurvey was non-random, the results may be read as representing broadorders of magnitude.
The differences in perceptions and outlooks are disturbing. Thestarkest difference is between students from elite English-mediumschools and madrassahs, which stand diametrically opposed to eachother in terms of their opinions on almost every issue, except equal rightsto provinces. Elite English-medium students strongly support a freepress, democracy, equal rights for women and minorities, and peace,while madrassah students attach significantly less weight to these issues.By and large, they do not support equal rights for women and minorities,or reduction of the defence budget, and strongly support implementationof the shariah (Islamic law), the liberation of Kashmir, and the country'snuclear status.
The extent of the differences can be discerned from the followingstatistics (see table 7.6). Nearly two-thirds of the elite English-mediumstudents support a free press and democracy as opposed to just over aquarter of the madrassah students who hold this view. Between 75 and 87per cent of the former and between 12 and 18 per cent of the latter supportequal rights for women and minorities. About 12 per cent of the eliteEnglish-medium students and between 63 and 98 per cent of themadrassah students support jehadi groups and the implementation of theshariah. Over two-thirds of the former and one-third of the latter supportpeace with India. The percentages of support for the liberation of Kashmirstand at 60 per cent and 99 per cent, respectively. About a quarter of the
CH
APTE
R 7
So
cia
l D
eve
lop
me
nt
in P
aki
sta
n,
20
02
-03
175
DIVERGING WORLDVIEWS
TABLE 7.6 DIVERGENT OPINIONS OF STUDENTS FROMDIFFERENT EDUCATION STREAMSElite Non-elite Urdu- Madrassah
English- English medium studentsmedium medium studentsstudents students
Support free press 65.0 50.4 47.8 26.0Support democracy 65.9 74.8 75.8 27.5Support equal rights to provinces 87.6 91.6 91.4 77.1Support equal rights to women 86.6 84.9 84.8 18.3Support equal rights to minorities 75.1 60.5 55.4 12.4Support jehadi groups 12.4 24.7 33.0 62.8Implementation of shariah 12.6 56.6 65.6 97.7Peace with India 68.6 61.7 64.4 32.8Liberate Kashmir peacefully 62.9 88.2 90.6 99.2Liberate Kashmir by force 25.9 28.5 31.6 59.9Support nuclear status 65.0 73.1 79.8 96.2Reduce defence budget 69.1 62.2 57.6 45.0
Source: SPDC Survey (2002)
former and nearly 60 per cent of the latter support liberation of Kashmir byforce. About two-thirds of elite English-medium students and 96 per centof the madrassah students support the nuclear status. And nearly 70 percent of the former and less than half of the latter support a reduction in thedefence budget. Support for equal rights to provinces is lowest amongmadrassah students, perhaps reflecting the 'centralized state' view of thereligious political parties.
The positions held by students from non-elite English-medium andUrdu-medium schools are generally identical, although the outlooks of theUrdu-medium students are relatively more conservative than the non-eliteEnglish-medium school students. On the whole, the two categories ofstudents stand in the middle of the two extremes, with a tilt towards theviews held by elite English-medium school students. One difference iswith regard to support for jehadi groups and implementation of theshariah, where the views of the Urdu-medium students are significantlymore conservative. While a quarter of non-elite English-medium schoolstudents support jehadi groups, one-third of Urdu-medium students doso; and while over half of the former support implementation of theshariah, about two-thirds of the latter are of the same opinion.
On other counts, about half the non-elite English-medium and Urdu-medium students support a free press compared to nearly two-thirds ofelite English-medium students and over one-quarter of madrassahstudents. Both categories register the highest support for democracy atabout 75 per cent. The percentage of non-elite English and Urdu-mediumschool students supporting equal rights for women and the provinces, isabout the same as for elite English-medium students. Their support forequal rights to minorities is somewhat less than that expressed by eliteEnglish-medium school students, but significantly higher than that ofmadrassah students. While the non-elite English and Urdu-mediumschools students are closer to the madrassah students on the issue ofliberating Kashmir, they are closer to the elite English-medium schoolstudents with respect to doing so by force. They are also closer to eliteEnglish-medium school students on the questions of nuclear status anddefence budgeting.
The conflicting opinions produced by Pakistan's education systemdo not bode well for the creation of a homogeneous society or for nationalintegration. Different groups subscribe to different value systems and holdand cherish different perceptions of the kind of society they would likePakistan to be (see box 7.6). The resulting schisms have, perhaps, laidthe foundation for continuing political instability and conflict, manifestedby sectarian, ethnic, and other types of violence.
New nations that emerged after the era of colonialism embarked ona conscious and organized process of nation building. A uniformeducation system constituted the fountainhead of all such efforts.Pakistan, it appears, made no such effort. This is evident from the factthat society has been allowed to be divided into at least four very differentstrata and appears to exist on at least as many emotional and intellectualwavelengths.
The imperative of national integration and sociopolitical harmonydemands that a uniform education system be introduced. Threefundamental decisions are in order. Society must decide: (i) whether thecountry should have a curriculum that is basically, but not mutually
CH
APTE
R 7
So
cia
l D
eve
lop
me
nt
in P
aki
sta
n,
20
02
-03
176
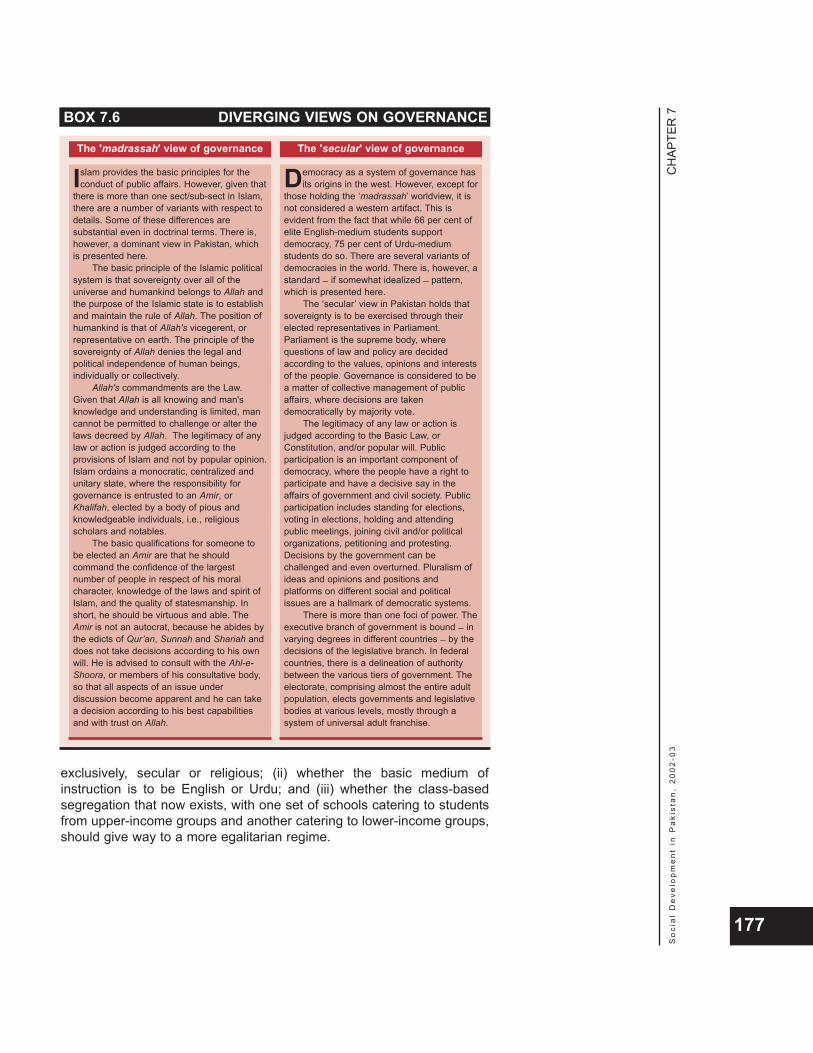
exclusively, secular or religious; (ii) whether the basic medium ofinstruction is to be English or Urdu; and (iii) whether the class-basedsegregation that now exists, with one set of schools catering to studentsfrom upper-income groups and another catering to lower-income groups,should give way to a more egalitarian regime.
CH
APTE
R 7
So
cia
l D
eve
lop
me
nt
in P
aki
sta
n,
20
02
-03
177
BOX 7.6 DIVERGING VIEWS ON GOVERNANCE
Islam provides the basic principles for theconduct of public affairs. However, given that
there is more than one sect/sub-sect in Islam,there are a number of variants with respect todetails. Some of these differences aresubstantial even in doctrinal terms. There is,however, a dominant view in Pakistan, whichis presented here.
The basic principle of the Islamic politicalsystem is that sovereignty over all of theuniverse and humankind belongs to Allah andthe purpose of the Islamic state is to establishand maintain the rule of Allah. The position ofhumankind is that of Allah's vicegerent, orrepresentative on earth. The principle of thesovereignty of Allah denies the legal andpolitical independence of human beings,individually or collectively.
Allah's commandments are the Law.Given that Allah is all knowing and man'sknowledge and understanding is limited, mancannot be permitted to challenge or alter thelaws decreed by Allah. The legitimacy of anylaw or action is judged according to theprovisions of Islam and not by popular opinion.Islam ordains a monocratic, centralized andunitary state, where the responsibility forgovernance is entrusted to an Amir, orKhalifah, elected by a body of pious andknowledgeable individuals, i.e., religiousscholars and notables.
The basic qualifications for someone tobe elected an Amir are that he shouldcommand the confidence of the largestnumber of people in respect of his moralcharacter, knowledge of the laws and spirit ofIslam, and the quality of statesmanship. Inshort, he should be virtuous and able. TheAmir is not an autocrat, because he abides bythe edicts of Qur’an, Sunnah and Shariah anddoes not take decisions according to his ownwill. He is advised to consult with the Ahl-e-Shoora, or members of his consultative body,so that all aspects of an issue underdiscussion become apparent and he can takea decision according to his best capabilitiesand with trust on Allah.
The 'madrassah' view of governance
Democracy as a system of governance hasits origins in the west. However, except for
those holding the ‘madrassah’ worldview, it isnot considered a western artifact. This isevident from the fact that while 66 per cent ofelite English-medium students supportdemocracy, 75 per cent of Urdu-mediumstudents do so. There are several variants ofdemocracies in the world. There is, however, astandard _ if somewhat idealized _ pattern,which is presented here.
The ‘secular’ view in Pakistan holds thatsovereignty is to be exercised through theirelected representatives in Parliament.Parliament is the supreme body, wherequestions of law and policy are decidedaccording to the values, opinions and interestsof the people. Governance is considered to bea matter of collective management of publicaffairs, where decisions are takendemocratically by majority vote.
The legitimacy of any law or action isjudged according to the Basic Law, orConstitution, and/or popular will. Publicparticipation is an important component ofdemocracy, where the people have a right toparticipate and have a decisive say in theaffairs of government and civil society. Publicparticipation includes standing for elections,voting in elections, holding and attendingpublic meetings, joining civil and/or politicalorganizations, petitioning and protesting.Decisions by the government can bechallenged and even overturned. Pluralism ofideas and opinions and positions andplatforms on different social and politicalissues are a hallmark of democratic systems.
There is more than one foci of power. Theexecutive branch of government is bound _ invarying degrees in different countries _ by thedecisions of the legislative branch. In federalcountries, there is a delineation of authoritybetween the various tiers of government. Theelectorate, comprising almost the entire adultpopulation, elects governments and legislativebodies at various levels, mostly through asystem of universal adult franchise.
The 'secular' view of governance
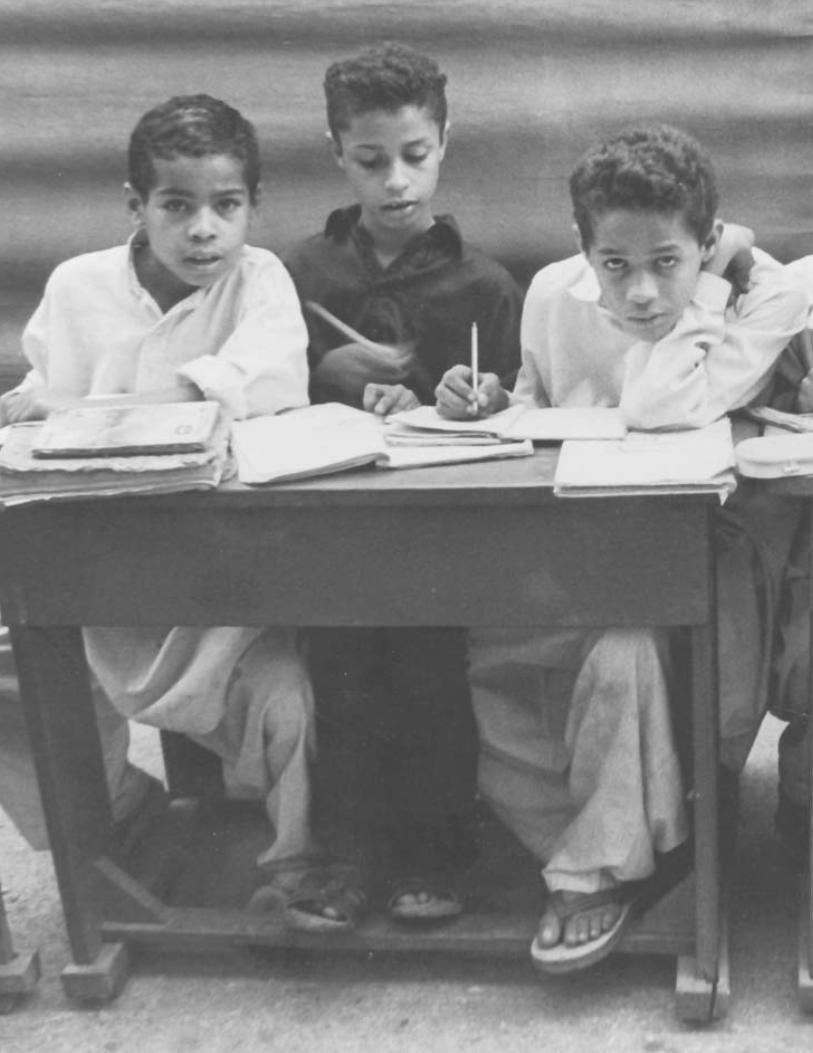
APPE
ND
ICES
So
cia
l D
eve
lop
me
nt
in P
aki
sta
n,
20
02
-03
179
APPENDICES

January 6, 2002 The Sindh Private Education Institutions (Regulation and Control)Ordinance 2001 is promulgated (see box A1.1).
March 6, 2002 The President promulgates an ordinance making primary educationcompulsory in the Islamabad Capital Territory (ICT).
June 20, 2002 The promulgation of the Madrassah Registration Ordinance 2002regulates schools by bringing them under the normal education system ofthe country.
September 25, 2002 The Asian Development Bank (ADB) approves a $75 million loan toimprove public elementary education in Sindh.
December 3, 2002 USAID grants a four-year $60 million award to the Research TriangleInstitute for the implementation of its Education Sector Reform Assistance(ESRA) Project for Pakistan.
January 05, 2003 The Punjab Cabinet resolves to provide free education up to secondaryschool level in all provincial and district government schools from the nextacademic session.
January 14, 2003 The Sindh Education Department reports that Sindh has 38,885 primaryschools in the public sector, of which 13,537 schools are without electricity,5,901 are without water, 12,791 are without toilets, and 1,131 schoolshave no boundary walls.
January 22, 2003 The NWFP Cabinet makes education up to matriculation free of cost ingovernment institutions.
February 06, 2003 Chitral district reports a 98 per cent literacy rate, the highest in the NWFP,in the 6-10 age group. According to a report prepared by the provincialeducation department, it also has the second lowest dropout rate in theprovince.
February 26, 2003 The Sindh Government reports an increase of about 0.1 million in primaryclass enrolments in the towns/talukas selected for implementation of thecompulsory primary education ordinance during the last eight months.
February 28, 2003 Balochistan Assembly adopts a resolution to provide free education up tomatriculation in the province.
March 05,2003 According to the Sindh Education Management Information System(SEMIS) school census report 2001-02, only about 20 per cent of the totalpopulation in the 4-9 year age group is enrolled in government run primaryschools.
April 05, 2003 The number of illiterate people in Pakistan has increased from 10 millionin 1951 to 50 million at present as revealed at a meeting of theInternational Partners Forum for Education For All in Dakar.
* Sources: Government, NGO and media reports.Note: Events in 2003 include reports upto and inclusive of June.
APPE
ND
ICES
So
cia
l D
eve
lop
me
nt
in P
aki
sta
n,
20
02
-03
180
EDUCATION
A.1CHRONOLOGY OF KEY EVENTS INTHE SOCIAL SECTORS: 2002-03*
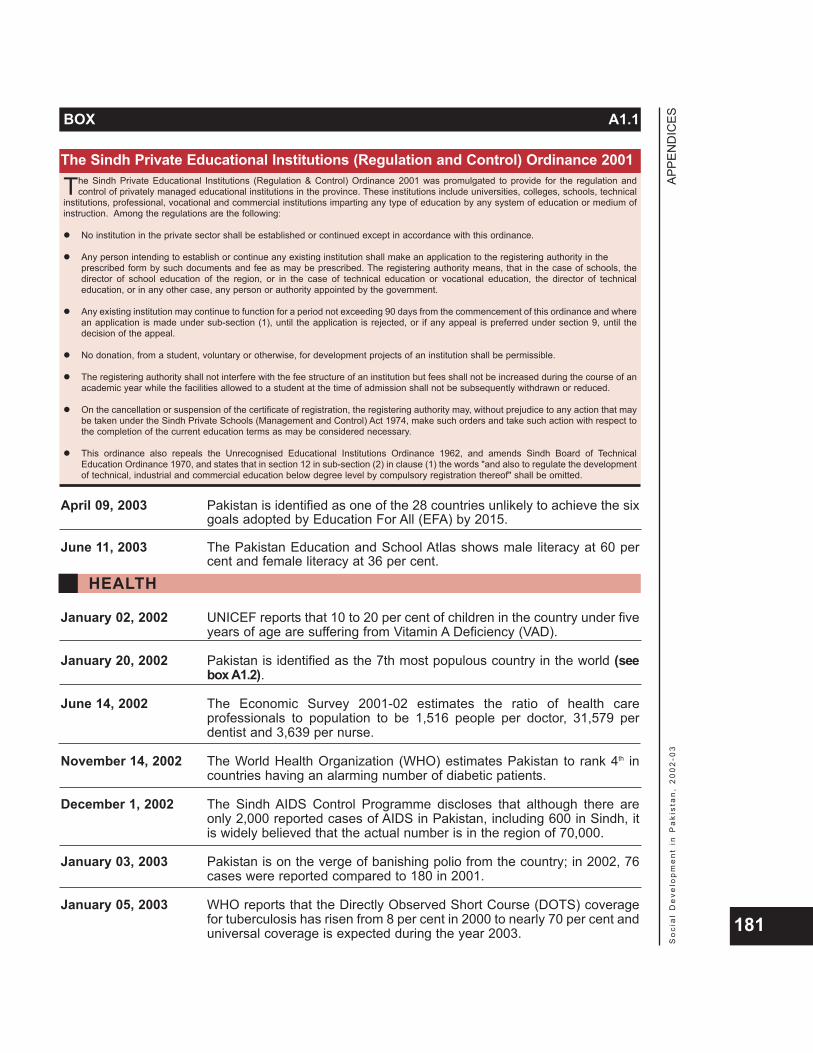
April 09, 2003 Pakistan is identified as one of the 28 countries unlikely to achieve the sixgoals adopted by Education For All (EFA) by 2015.
June 11, 2003 The Pakistan Education and School Atlas shows male literacy at 60 percent and female literacy at 36 per cent.
January 02, 2002 UNICEF reports that 10 to 20 per cent of children in the country under fiveyears of age are suffering from Vitamin A Deficiency (VAD).
January 20, 2002 Pakistan is identified as the 7th most populous country in the world (seebox A1.2).
June 14, 2002 The Economic Survey 2001-02 estimates the ratio of health careprofessionals to population to be 1,516 people per doctor, 31,579 perdentist and 3,639 per nurse.
November 14, 2002 The World Health Organization (WHO) estimates Pakistan to rank 4th incountries having an alarming number of diabetic patients.
December 1, 2002 The Sindh AIDS Control Programme discloses that although there areonly 2,000 reported cases of AIDS in Pakistan, including 600 in Sindh, itis widely believed that the actual number is in the region of 70,000.
January 03, 2003 Pakistan is on the verge of banishing polio from the country; in 2002, 76cases were reported compared to 180 in 2001.
January 05, 2003 WHO reports that the Directly Observed Short Course (DOTS) coveragefor tuberculosis has risen from 8 per cent in 2000 to nearly 70 per cent anduniversal coverage is expected during the year 2003.
APPE
ND
ICES
So
cia
l D
eve
lop
me
nt
in P
aki
sta
n,
20
02
-03
181
BOX A1.1
The Sindh Private Educational Institutions (Regulation & Control) Ordinance 2001 was promulgated to provide for the regulation andcontrol of privately managed educational institutions in the province. These institutions include universities, colleges, schools, technical
institutions, professional, vocational and commercial institutions imparting any type of education by any system of education or medium ofinstruction. Among the regulations are the following:
No institution in the private sector shall be established or continued except in accordance with this ordinance.
Any person intending to establish or continue any existing institution shall make an application to the registering authority in the prescribed form by such documents and fee as may be prescribed. The registering authority means, that in the case of schools, thedirector of school education of the region, or in the case of technical education or vocational education, the director of technicaleducation, or in any other case, any person or authority appointed by the government.
Any existing institution may continue to function for a period not exceeding 90 days from the commencement of this ordinance and wherean application is made under sub-section (1), until the application is rejected, or if any appeal is preferred under section 9, until thedecision of the appeal.
No donation, from a student, voluntary or otherwise, for development projects of an institution shall be permissible.
The registering authority shall not interfere with the fee structure of an institution but fees shall not be increased during the course of anacademic year while the facilities allowed to a student at the time of admission shall not be subsequently withdrawn or reduced.
On the cancellation or suspension of the certificate of registration, the registering authority may, without prejudice to any action that maybe taken under the Sindh Private Schools (Management and Control) Act 1974, make such orders and take such action with respect tothe completion of the current education terms as may be considered necessary.
This ordinance also repeals the Unrecognised Educational Institutions Ordinance 1962, and amends Sindh Board of TechnicalEducation Ordinance 1970, and states that in section 12 in sub-section (2) in clause (1) the words "and also to regulate the developmentof technical, industrial and commercial education below degree level by compulsory registration thereof" shall be omitted.
HEALTH
The Sindh Private Educational Institutions (Regulation and Control) Ordinance 2001

February 05, 2003 Save the Children and the Sindh Women Health Project stated that of the32 million local women that fall in the 15-49 reproductive age group, 30 dieevery minute due to childbirth complications.
February 12, 2003 The United Nations Integrated Regional Information Network reports thatabout 40 per cent of the annual 1.5 million blood transfusions in Pakistanare not screened for HIV.
March 22, 2003 Among the 22 high burden tuberculosis-affected countries in the world,Pakistan ranks 8th.
March 24, 2003 The United Nations Development Programme (UNDP) finds that onaverage 65 per cent of the extremely poor are ill, suffering from an illnesson average every 95 days.
March 29, 2003 About 30 per cent of all mortality recorded by hospitals is attributed toinfectious diseases.
April 06, 2003 WHO reveals that 177 people in every 100,000 die in Pakistan from TBevery year. Of these patients, 52 per cent are females and 48 percentmales.
May 07, 2003 Rs. 26.3 billion is earmarked for various health preventiveprogrammes in the next five to nine years, in response to the fact thatthe public health sector in Pakistan caters only to 20 per cent of thetotal 145 million population.
May 10, 2003 More than 1.5 million people suffer from epilepsy in the country with only30 per cent of such people knowing of their ailment.
February 8, 2002 ADB allocates $150,000 to help the government implement the NationalPolicy and Plan of Action to Eliminate Child Labour.
August 22, 2002 40 per cent of children under five are malnourished and 25 per cent ofbabies are born under weight according to standards established by WHOfor developing countries.
December 5, 2002 20 per cent of women in Pakistan die during childbirth (see box A1.3).
APPE
ND
ICES
So
cia
l D
eve
lop
me
nt
in P
aki
sta
n,
20
02
-03
182
BOX A1.2
The report, "State of the World's Newborn - Pakistan”, was conducted by Save the Children in 2002. Out of over 53 million babiesin the country, nearly 270,000 die before they are one month old, roughly ten times higher than that in the developed countries.
The report says that nearly 60 per cent of these deaths occur during the first few days after birth and a vast majority of them arepreventable through available and cost effective means. The risk factors contributing to the high neonatal mortality in the countryare the high percentage of home deliveries unattended by skilled care; the birth interval being less than 24 months; the number ofpregnancies being greater than 6 per women, and maternal or paternal illiteracy. Though Pakistan is the seventh most populous country in the world, it has the second highest number of newborn deaths and thefourth highest rate of neonatal mortality. The report says that emerging evidence of the relationship of low birth weight with long-term chronic diseases in adult life such as diabetes, hypertension and coronary artery disease, makes it one of the most importantand potentially preventable public health conditions. Other infections such as diarrhoea, acute respiratory infections, sepsis andmeningitis still represent potentially lethal problems for neonates.Save the Children (USA) is currently partnering with the Ministry of Health, UNICEF, WHO, and Japan International CooperationAgency (JICA) to immunize 5 million women in nearly 57 districts of the country against tetanus _ a disease that claims the lives ofmore than 20,000 newborns annually.
WOMEN & CHILDREN
State of The World’s Newborn - Pakistan
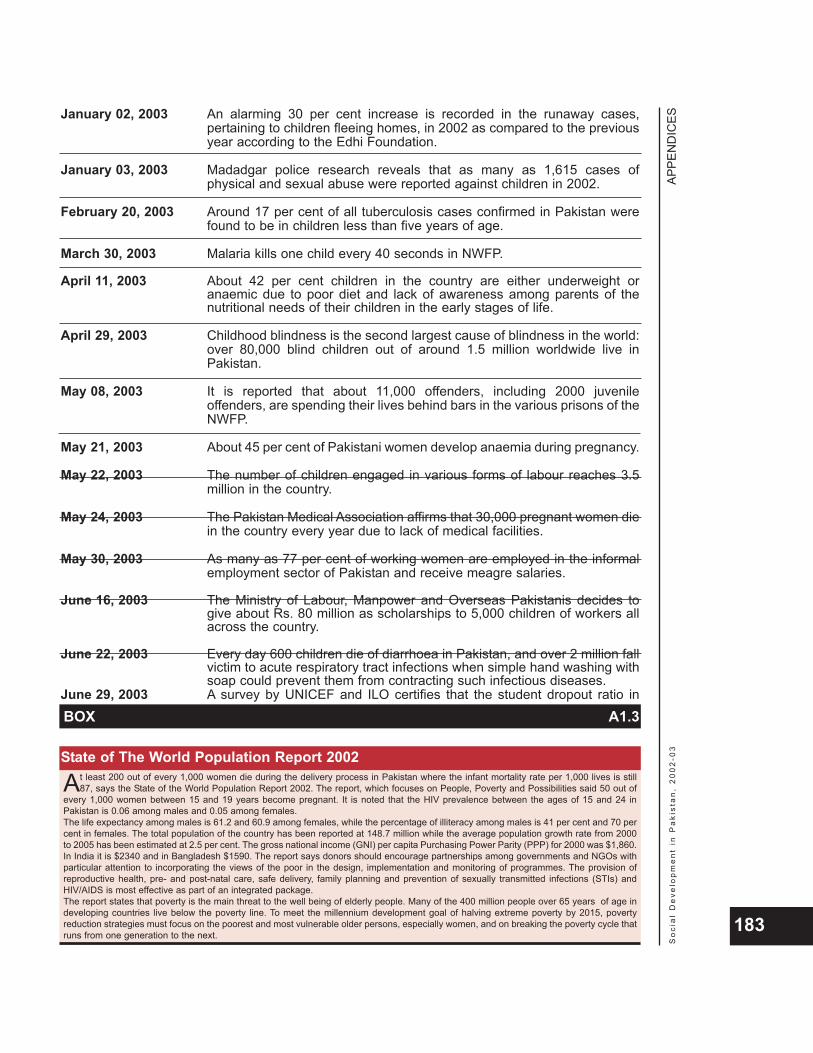
January 02, 2003 An alarming 30 per cent increase is recorded in the runaway cases,pertaining to children fleeing homes, in 2002 as compared to the previousyear according to the Edhi Foundation.
January 03, 2003 Madadgar police research reveals that as many as 1,615 cases ofphysical and sexual abuse were reported against children in 2002.
February 20, 2003 Around 17 per cent of all tuberculosis cases confirmed in Pakistan werefound to be in children less than five years of age.
March 30, 2003 Malaria kills one child every 40 seconds in NWFP.
April 11, 2003 About 42 per cent children in the country are either underweight oranaemic due to poor diet and lack of awareness among parents of thenutritional needs of their children in the early stages of life.
April 29, 2003 Childhood blindness is the second largest cause of blindness in the world:over 80,000 blind children out of around 1.5 million worldwide live inPakistan.
May 08, 2003 It is reported that about 11,000 offenders, including 2000 juvenileoffenders, are spending their lives behind bars in the various prisons of theNWFP.
May 21, 2003 About 45 per cent of Pakistani women develop anaemia during pregnancy.
May 22, 2003 The number of children engaged in various forms of labour reaches 3.5million in the country.
May 24, 2003 The Pakistan Medical Association affirms that 30,000 pregnant women diein the country every year due to lack of medical facilities.
May 30, 2003 As many as 77 per cent of working women are employed in the informalemployment sector of Pakistan and receive meagre salaries.
June 16, 2003 The Ministry of Labour, Manpower and Overseas Pakistanis decides togive about Rs. 80 million as scholarships to 5,000 children of workers allacross the country.
June 22, 2003 Every day 600 children die of diarrhoea in Pakistan, and over 2 million fallvictim to acute respiratory tract infections when simple hand washing withsoap could prevent them from contracting such infectious diseases.
June 29, 2003 A survey by UNICEF and ILO certifies that the student dropout ratio in
APPE
ND
ICES
So
cia
l D
eve
lop
me
nt
in P
aki
sta
n,
20
02
-03
183
BOX A1.3
At least 200 out of every 1,000 women die during the delivery process in Pakistan where the infant mortality rate per 1,000 lives is still87, says the State of the World Population Report 2002. The report, which focuses on People, Poverty and Possibilities said 50 out of
every 1,000 women between 15 and 19 years become pregnant. It is noted that the HIV prevalence between the ages of 15 and 24 inPakistan is 0.06 among males and 0.05 among females.The life expectancy among males is 61.2 and 60.9 among females, while the percentage of illiteracy among males is 41 per cent and 70 percent in females. The total population of the country has been reported at 148.7 million while the average population growth rate from 2000to 2005 has been estimated at 2.5 per cent. The gross national income (GNI) per capita Purchasing Power Parity (PPP) for 2000 was $1,860.In India it is $2340 and in Bangladesh $1590. The report says donors should encourage partnerships among governments and NGOs withparticular attention to incorporating the views of the poor in the design, implementation and monitoring of programmes. The provision ofreproductive health, pre- and post-natal care, safe delivery, family planning and prevention of sexually transmitted infections (STIs) andHIV/AIDS is most effective as part of an integrated package.The report states that poverty is the main threat to the well being of elderly people. Many of the 400 million people over 65 years of age indeveloping countries live below the poverty line. To meet the millennium development goal of halving extreme poverty by 2015, povertyreduction strategies must focus on the poorest and most vulnerable older persons, especially women, and on breaking the poverty cycle thatruns from one generation to the next.
State of The World Population Report 2002
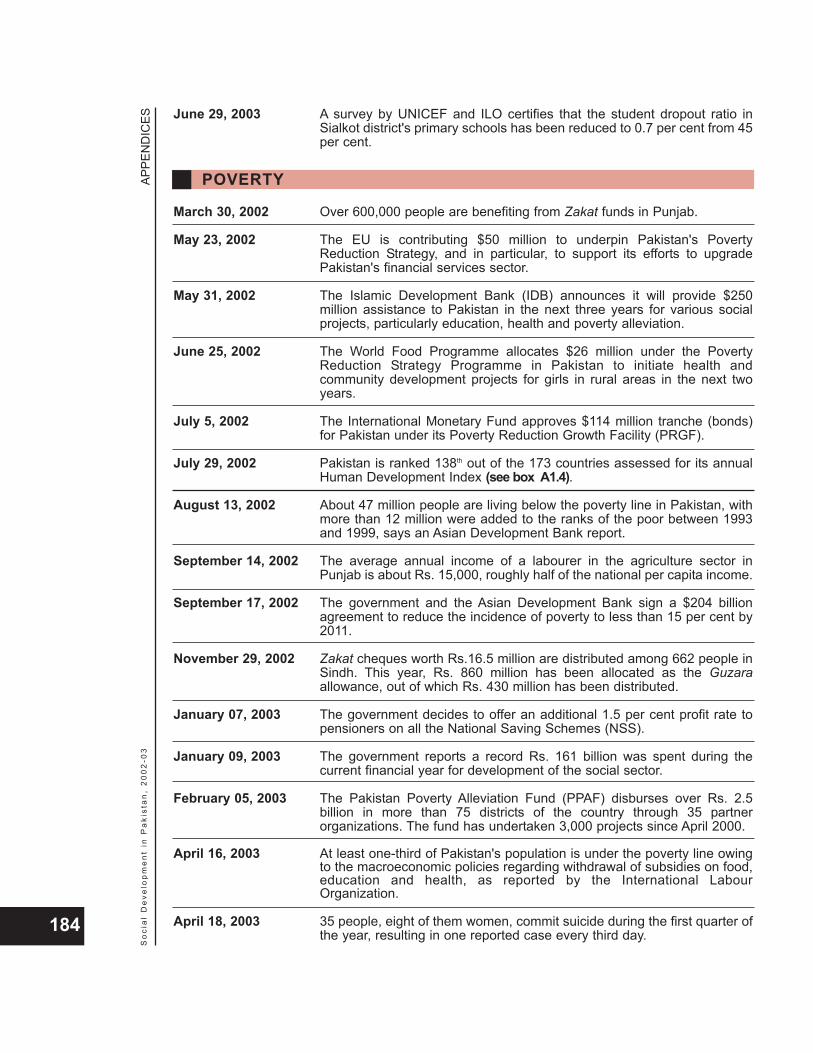
June 29, 2003 A survey by UNICEF and ILO certifies that the student dropout ratio inSialkot district's primary schools has been reduced to 0.7 per cent from 45per cent.
March 30, 2002 Over 600,000 people are benefiting from Zakat funds in Punjab.
May 23, 2002 The EU is contributing $50 million to underpin Pakistan's PovertyReduction Strategy, and in particular, to support its efforts to upgradePakistan's financial services sector.
May 31, 2002 The Islamic Development Bank (IDB) announces it will provide $250million assistance to Pakistan in the next three years for various socialprojects, particularly education, health and poverty alleviation.
June 25, 2002 The World Food Programme allocates $26 million under the PovertyReduction Strategy Programme in Pakistan to initiate health andcommunity development projects for girls in rural areas in the next twoyears.
July 5, 2002 The International Monetary Fund approves $114 million tranche (bonds)for Pakistan under its Poverty Reduction Growth Facility (PRGF).
July 29, 2002 Pakistan is ranked 138th out of the 173 countries assessed for its annualHuman Development Index (see box A1.4).
August 13, 2002 About 47 million people are living below the poverty line in Pakistan, withmore than 12 million were added to the ranks of the poor between 1993and 1999, says an Asian Development Bank report.
September 14, 2002 The average annual income of a labourer in the agriculture sector inPunjab is about Rs. 15,000, roughly half of the national per capita income.
September 17, 2002 The government and the Asian Development Bank sign a $204 billionagreement to reduce the incidence of poverty to less than 15 per cent by2011.
November 29, 2002 Zakat cheques worth Rs.16.5 million are distributed among 662 people inSindh. This year, Rs. 860 million has been allocated as the Guzaraallowance, out of which Rs. 430 million has been distributed.
January 07, 2003 The government decides to offer an additional 1.5 per cent profit rate topensioners on all the National Saving Schemes (NSS).
January 09, 2003 The government reports a record Rs. 161 billion was spent during thecurrent financial year for development of the social sector.
February 05, 2003 The Pakistan Poverty Alleviation Fund (PPAF) disburses over Rs. 2.5billion in more than 75 districts of the country through 35 partnerorganizations. The fund has undertaken 3,000 projects since April 2000.
April 16, 2003 At least one-third of Pakistan's population is under the poverty line owingto the macroeconomic policies regarding withdrawal of subsidies on food,education and health, as reported by the International LabourOrganization.
April 18, 2003 35 people, eight of them women, commit suicide during the first quarter ofthe year, resulting in one reported case every third day.
APPE
ND
ICES
So
cia
l D
eve
lop
me
nt
in P
aki
sta
n,
20
02
-03
184
POVERTY

June 13, 2003 The rate of unemployment in the country has increased from 5.89 per centin 1998 to 7.82 per cent in 2003 as per a labour force survey of theFederal Bureau of Statistics.
May 10, 2002 The UNDP announces it will provide $40 million for environment projects.
November 24, 2002 A World Bank study estimates the environmental cost to six sectors ofPakistan’s economy at $1.8 billion, and the cost of urban air pollution at$369 million per year.
June 14, 2002 The Economic Survey 2001-02 shows that Islamabad has registered thehighest population density increase in the country in recent years,estimated at 1026 persons per square kilometre.
November 29, 2002 One-third of the country's population lives in urban areas as indicated inthe Pakistan Human Condition Report. (see box A1.5).
February 05, 2003 The United Nations Fund For Population Activities (UNFPA)acknowledges that the population of the country reached 144.5 million inDecember 2002, with a growth rate of 2.1 per cent.
February 23, 2003 UNFPA, under its seventh country programme (2004-08), will provide $30million ($6 million per year) to the government of Pakistan.
January 01, 2003 A report on the Status of Safe Drinking Water Availability in Sindh revealsthat 25 to 80 per cent of the water supplied to the major cities of theProvince is not considered safe for drinking
January 02, 2003 About 10 to 12 million gallons of water is wasted in the capital every day,which is the highest among Pakistani cities, says the State of ConsumerRights Report 2001 launched by the Consumer Rights Commission ofPakistan (CRCP) in collaboration with Action Aid Pakistan.
APPE
ND
ICES
So
cia
l D
eve
lop
me
nt
in P
aki
sta
n,
20
02
-03
185
BOX A1.4
The UNDP Human Development Report 2002, entitled Deepening Democracy in a Fragmented World, found that 56.8 per cent ofPakistanis over 15 years of age are illiterate, that 84.6 per cent of the population earned less than $2 a day, and that the infant mortality
rate is 85 per 1000 live births. However, between 1990 and 1999 Pakistan climbed three places in the ranking. According to the UNDP index,during this period Pakistan had made headway in tackling under nourishment, but is far behind in reducing infant mortality rates. Pakistanis ranked in the bottom 36 countries grouped under ‘low human development’, along with Nepal, ranked 142 and Bangladesh, ranked 145.The majority of countries in the lowest group are African states. The report found new democratic hopes, unmet by elected governments, lead to public disgust for the system and regression to military rule.The example of Pakistan is often cited, where corrupt and inefficient elected governments in the 1990s were exposed and hammered by afree press.While 140 of the world's nearly 200 countries hold multi party elections, only 82 are fully democratic, with institutions such as a free pressand independent judiciary. The report calls for a new wave of democracy building to give ordinary people a greater say in both national andglobal policy making.
Deepening Democracy in A Fragmented World
ENVIRONMENT
POPULATION
WATER
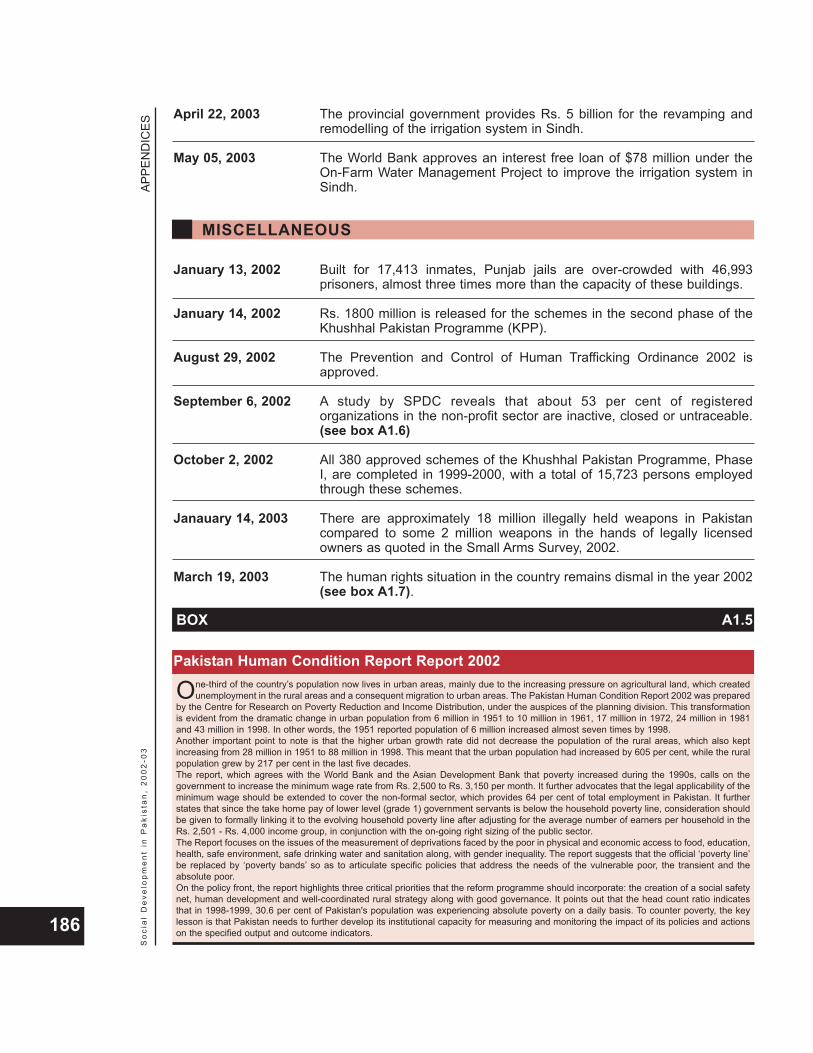
April 22, 2003 The provincial government provides Rs. 5 billion for the revamping andremodelling of the irrigation system in Sindh.
May 05, 2003 The World Bank approves an interest free loan of $78 million under theOn-Farm Water Management Project to improve the irrigation system inSindh.
January 13, 2002 Built for 17,413 inmates, Punjab jails are over-crowded with 46,993prisoners, almost three times more than the capacity of these buildings.
January 14, 2002 Rs. 1800 million is released for the schemes in the second phase of theKhushhal Pakistan Programme (KPP).
August 29, 2002 The Prevention and Control of Human Trafficking Ordinance 2002 isapproved.
September 6, 2002 A study by SPDC reveals that about 53 per cent of registeredorganizations in the non-profit sector are inactive, closed or untraceable.(see box A1.6)
October 2, 2002 All 380 approved schemes of the Khushhal Pakistan Programme, PhaseI, are completed in 1999-2000, with a total of 15,723 persons employedthrough these schemes.
Janauary 14, 2003 There are approximately 18 million illegally held weapons in Pakistancompared to some 2 million weapons in the hands of legally licensedowners as quoted in the Small Arms Survey, 2002.
March 19, 2003 The human rights situation in the country remains dismal in the year 2002(see box A1.7).
APPE
ND
ICES
So
cia
l D
eve
lop
me
nt
in P
aki
sta
n,
20
02
-03
186
BOX A1.5
One-third of the country’s population now lives in urban areas, mainly due to the increasing pressure on agricultural land, which createdunemployment in the rural areas and a consequent migration to urban areas. The Pakistan Human Condition Report 2002 was prepared
by the Centre for Research on Poverty Reduction and Income Distribution, under the auspices of the planning division. This transformationis evident from the dramatic change in urban population from 6 million in 1951 to 10 million in 1961, 17 million in 1972, 24 million in 1981and 43 million in 1998. In other words, the 1951 reported population of 6 million increased almost seven times by 1998. Another important point to note is that the higher urban growth rate did not decrease the population of the rural areas, which also keptincreasing from 28 million in 1951 to 88 million in 1998. This meant that the urban population had increased by 605 per cent, while the ruralpopulation grew by 217 per cent in the last five decades. The report, which agrees with the World Bank and the Asian Development Bank that poverty increased during the 1990s, calls on thegovernment to increase the minimum wage rate from Rs. 2,500 to Rs. 3,150 per month. It further advocates that the legal applicability of theminimum wage should be extended to cover the non-formal sector, which provides 64 per cent of total employment in Pakistan. It furtherstates that since the take home pay of lower level (grade 1) government servants is below the household poverty line, consideration shouldbe given to formally linking it to the evolving household poverty line after adjusting for the average number of earners per household in theRs. 2,501 - Rs. 4,000 income group, in conjunction with the on-going right sizing of the public sector.The Report focuses on the issues of the measurement of deprivations faced by the poor in physical and economic access to food, education,health, safe environment, safe drinking water and sanitation along, with gender inequality. The report suggests that the official ‘poverty line’be replaced by ‘poverty bands’ so as to articulate specific policies that address the needs of the vulnerable poor, the transient and theabsolute poor.On the policy front, the report highlights three critical priorities that the reform programme should incorporate: the creation of a social safetynet, human development and well-coordinated rural strategy along with good governance. It points out that the head count ratio indicatesthat in 1998-1999, 30.6 per cent of Pakistan's population was experiencing absolute poverty on a daily basis. To counter poverty, the keylesson is that Pakistan needs to further develop its institutional capacity for measuring and monitoring the impact of its policies and actionson the specified output and outcome indicators.
MISCELLANEOUS
Pakistan Human Condition Report Report 2002

April 07, 2003 According to the NGO Resource Centre, more than 45,000 socialdevelopment organizations (SDOs), with the help of their more than475,000 employees and volunteers, are carrying out development projectsinvolving nearly Rs.16.5 billion in the country annually.
June 16, 2003 The government earmarks Rs. 483 million under the Public SectorDevelopment Programme (PSDP) for police reforms for the fiscal year2003-2004.
June 20, 2003 The government decides to increase the pensions of disabled industrialworkers by 53 per cent, which will cost an additional expenditure of Rs.5.45 million to the national exchequer.
APPE
ND
ICES
So
cia
l D
eve
lop
me
nt
in P
aki
sta
n,
20
02
-03
187
BOX A1.6
Fifty-three percent of non-profit organizations are inactive, closed or untraceable, revealed a 2002 study titled Dimensions of the Non-profitSector in Pakistan conducted by the Social Policy and Development Centre (SPDC). The study was the first of a series of working papers
being produced by SPDC as part of an international research initiative _ the Johns Hopkins Comparative Non-profit Sector Project _spearheaded by the Centre for Civil Society Studies, Johns Hopkins University, USA. The study, which encompassed more than 2,000 non-profit organizations, was aimed at evaluating the size, structure and scope of this sector. The study also determined the relationship that thenon-profit sector had with the international community, local community and businesses. The study defined as non-profit organisations (NPOs) only those organisations that had an institutional presence and structure: "They areinstitutionally separate from the state. They do not return profits to (their) members, managers and directors. They are in control of theiraffairs. They attract some level of voluntary contribution." Twelve districts were selected for the primary survey: Faisalabad, Rawalpindi,Multan, Sargodha, Sialkot, Gujranwala, Lahore, Karachi, Hyderabad, Sukkur, Peshawar and Quetta, covering about 43 million people.Though various ordinances registered non-profit organizations in the past, three acts effectively cover approximately 80 to 90 per cent of theregistered domains. These acts are the Voluntary Social Welfare Agencies Ordinance 1961, the Societies Registration Act 1860 and theCompanies Ordinance (Section 42) 1984. The most important pattern of non-profit activity was shown to be the dominance of education. This sector retains 71 per cent of the totalestimated non-profit employment. Organizations that provide primary education alone have a share of 25 per cent of the total employmentin the non-profit sector. The share of organizations providing religious education is about 17 per cent, while the organizations providingsecondary and higher education employ nearly 28 per cent of the total labour force employed by the non-profit sector. The second largestsector in terms of paid employment was health, which provided about 11 per cent of non-profit sector employment. The domination ofeducation and health activities is evident from the data. Most of their revenues come from fees and user charges. The fee component alonehas a share of 34 per cent in the total non-profit sector cash revenue.
The Non-profit Sector in Pakistan
BOX A1.7
The Human Rights Commission of Pakistan (HRCP), in its annual report on the State of Human Rights in 2002, stated that legislative andexecutive measures were being taken which curtailed citizens' rights, such as amendments in the Anti Terrorism Act (ATA).
The report said that people's disenchantment with the judiciary was also contributing to the law and order situation in the country, and thatpeople were going back to primitive methods for settling their disputes. The past year was difficult for women and children, as a number ofwomen became victims of jirga decisions, acid burning, kidnapping and honour killings. The intensity of crime against women has increased,with a gang rape having been carried out on the orders of a tribal jirga. A woman was also sentenced to death by stoning for the first timein at least 15 years. In terms of law and order, the HRCP report said there were nine major incidents of terrorism, all directed at Western missions, or foreign orChristian places of worship or work. It said that extra-judicial killings increased as compared to the previous year. At least 236 people werekilled in such encounters. More than 50 fell victim to target killing.Regarding jail conditions, the report said that over 90,000 people remained behind bars at badly overcrowded jails. Hundreds accused ofinvolvement in militant activities were jailed, in almost all cases illegally. An amendment in the Anti-Terrorism Act permitted suspectedmilitants to be held for up to a year without charge.It said that the Christians in the country faced increased militant violence during a year in which at least 38 died in terrorist attacks. Ahmediscontinued to face severe discrimination and remained placed on a separate voting list. It said that blasphemy laws continued to be used tosettle petty disputes, with clerics in several cases inciting mobs against those whom they accused of blasphemy.The report also said restrictions remained imposed on freedom of movement, which was used as a means of preventing political gatherings.Movement of clerics was in many cases restricted as a means of preventing sectarian violence. It reported that journalists across the countrycomplained of increased harassment and intimidation, often by personnel of intelligence agencies, and at least four new laws were enactedto restrict press freedoms and prevent access to information.
The State of Human Rights in 2002
A.2
SELECTED BOOK REVIEWS
Continuity and Change: Socio-Political andInstitutional Dynamics in Pakistan, Zaidi S. Akbar (ed), City Press: Karachi 2003.
Continuity and Change consists of essays byPakistani authors that have been published in aspecial edition of the Economic and PoliticalWeekly. The essays vary from purely politicalperspectives on the country to issues as diverseas structural adjustment, urbanization and thestate's history curriculum. While the essays arenotable for having been penned by well-knownsocial scientists, their depth of analysis variesconsiderably. For instance, Hamza Alavi'sexcellently researched and well presentedarticle on the ideological and socialunderpinnings of the Pakistan Movement, is instark contrast to Ayesha Jalal's whimsical "ALetter to India, in Manto's Spirit", which is heavyon satire and short on substance. Overall, thereis often a tenuous connection between theseessays, though the editor S. Akbar Zaidi statesthat they all illustrate the "overbearing,omnipresent, role of Pakistan's military" in thechanging fortunes of the country.
The real value of this book lies in its abilityto present the views of eminent social scientistson subjects of their choice. For instance, oneessay delves purely into the problematic issueof the representation of pre-Partition history inthe national curriculum, given that thecustodians of the ‘Pakistan Ideology’ havemanipulated the official interpretation of thisperiod to suit their interests. Other essayshighlight reasons for the failure of democracy,stressing the powerful influence of the PakistanArmy, as well as the civil-military regime's needto perpetuate a federal system by repressingregional language and political movements.
Of particular interest to those in thedevelopment field will be Shahrukh Rafi Khan'sstudy of structural adjustment programmes aswell as an essay by Siddiqa Agha on the politicaleconomy of defence. Khan's essay describes
the genesis as well as a description of the latestPoverty Reduction And Growth Facilityprogramme undertaken by the Pakistanigovernment. He critiques various liberalizationmeasures imposed by International FinancialInstitutions (IFIs) as further contributing to thecountry's economic downturn. In his opinion, thegovernment's real focus should be on landreform, strengthening the revenue collectionsystem and eliminating vested interests from thesystem in order to allow competition to flourish.Ayesha Siddiqa Agha's piece on the "PoliticalEconomy of Defence" links the involvement ofthe Pakistani military in power politics with itsability to apportion a large chunk of the statefinancial pie for itself. In her view, resources arediverted from development into militaryexpenditure, which allows the army to indulge innot only pure defence expenditure, but also tointervene in construction, transportation andother sectors of the economy. She alsodisagrees with the present regime’s claims thatit was forced to seize power to protect theeconomic development of the country. She citesfigures to show that prior to 9/11 the economyhad already deteriorated under the militaryleadership.
An eclectic collection of essays, Continuityand Change will broaden the reader'sunderstanding of a range of selected issuesrelated to the politics and economics of thecountry.
Shelter for the Shelterless: The Story ofKhuda Ki Basti, Ismail, Aquila (ed), City Press: Karachi 2002.
Khuda Ki Basti is a successful public housingscheme, established in 1986 at a distance oftwo hours from Hyderabad City, which aims atproviding homes to urban low-income groups.Much of the scheme's success is attributed tothe flexible approach followed by the HyderabadDevelopment Authority, which recognized that
APPE
ND
ICES
So
cia
l D
eve
lop
me
nt
in P
aki
sta
n,
20
02
-03
188
APPE
ND
ICES
So
cia
l D
eve
lop
me
nt
in P
aki
sta
n,
20
02
-03
189
subsidized public housing schemes have beenhijacked by speculators in the past, and thusfound innovative ways to cater to the needs oflow-income groups.
The book focuses on two aspects of KhudaKi Basti or ‘God’s settlement’. First, it provides adescriptive account of the methodology andimplementation of the scheme. Second, itevaluates the scheme and contrasts it with otherlow income housing schemes in the country.Material for the book has largely been culledfrom documents and assessments by ‘expertsand development consultants’, including theman responsible for initiating the scheme,Tasneem A. Siddiqui.
Three key measures ensured that thescheme was ‘poor friendly'. Ease of access wasensured by providing virtually unserviced landand by eliminating house construction standardsfor the allottees. Permanent occupancy of theplot was made a necessary condition and fullownership documents were only granted whenthe allottees had built a house. Anotherinnovative feature was that services were to beprovided on an incremental basis, as and whenthe beneficiaries were able to pay for them. Thislast measure was intended to circumventproblems of cost recovery.
How successful has the scheme been intargeting lower income groups? It emerged fromthe evaluation that about 54 per cent of therespondents surveyed earned less thanRs.1500 a month, 32 per cent between Rs. l500and Rs. 3000, and 14 per cent above Rs. 3000.The author points out that while World Bankreports claim that their sites-and-servicesprojects have reached down to beneficiaries inthe 17th percentile of income distribution, Khudaki Basti has been able to reach out to peoplewho are in the 10th percentile, which is no meanfeat. However, replication of the scheme in otherparts of Pakistan would be a much harder taskfor two main reasons. First, it was felt that theofficial who initiated this scheme and his teamwere imbued with ‘missionary zeal’ which waslacking in other government officials. Thepioneering nature of their work was the result ofbeing able to understand "the issues [involved inproviding shelter for low-income groups], theircauses and their possible solutions". Second, it
was felt that land could only be provided at a lowprice if state land or wasteland was available,which would make this type of the schemeunfeasible for certain parts of the country.
Despite the reservations of some expertsabout the replicability of the scheme, the authorpoints to one successful replication in Karachiand feels that the concept of incrementaldevelopment is gaining recognition ingovernment circles. The book provides anaccessible account of the rationale underlyingthe scheme as well as the practical challengesfaced by planners in implementing an unusualand ultimately successful urban low-incomehousing scheme.
Social Impacts and the Constraints of Microcredit in the Alleviation of Poverty: A Qualitative Study of the Micro creditProgram Orangi Pilot Project-OrangiCharitable Trust, Karachi,Rehman, Naheed, and Ismail, Aquila (eds).OPP/OCT: Karachi 2003.
Rehman and Ismail’s study of the Micro creditprogramme for both the Orangi Pilot Project andthe Orangi Charitable Trust (OPP-OCT)attempts to place the scheme in the context ofboth its social impacts and social constraints.Although the sample size is rather small _ 44clients were interviewed between 1999 and2000 _ this does not detract from the fact thatqualitative assessments are invaluable inproviding necessary insights for practitionersand policymakers engaged in the field of povertyalleviation and micro credit.
OPP-OCT's Micro credit Programme is notmodelled on its famous counterpart, theGrameen Bank, as it does not lend to the‘poorest of the poor’. Instead the Programmmeseeks to reach out to the entrepreneuriallyminded ‘working poor’, in other words, familieswith ongoing business ventures who are in needof working capital, or families who possess skillsbut lack seed money to start a venture. As thedirector of OPP-OCT states, "Credit is not awelfare activity, but rather a market basedactivity and we need to make clients competentand self-reliant." The programme does envisagespill over benefits to poor labour in terms of
increased employment, due to the productivityenhancing nature of the loans on businessactivity.
The major social impacts of the micro creditprogramme were clear cut and positive despitethe fact that OPP-OCT had no built in social orcultural agenda of change in its mandate or asocial package to complement the provision ofloans. Borrowers had undertaken loans in timesof financial hardship. As a consequence, one ofthe major impacts of using the loans was theimproved nutrition and better emotional andmental health of the borrowers. Another benefitwas that the expansion of the business due tofurther loans widened the net of beneficiaries asmore labour was employed. By setting up theirown businesses, borrowers won for themselvesa measure of dignity that had eluded them whenthey worked as employees in other people'sbusinesses.
Even more striking was Rehman andIsmail’s identification of the ‘social constraints’under which the Programme operated. Politicalinstability, ranging from ethnic violence in theOrangi area to general countrywide instability,negatively impacted on the borrowers' businessventures and their ability to pay back loans.Poor employment prospects meant that childrenwere withdrawn from school to help at home,thus casting in doubt the link between microcredit and enhanced schooling. Equallyalarming has been the rise of rapid inflation:while the maximum loan amount has remainedfrozen throughout the period surveyed, thecosts of raw materials and household items hasincreased, leading to a decrease in repaymentrates. Illness or death in the family was a sourceof great concern to borrowers as it lowered theirincome and consequently their ability to payback loans, given that ‘every rupee counts’ andany pause in the work cycle can have adevastating impact on their finances. Thespectre of dowry also haunts these lowerincome families: it was estimated thatRs.100,000 was needed for an average dowry,without which daughters would be unable toattract suitors. Sadly there was a clear trade offbetween educational spending on girls and theirdowries. This study underlines the fact thatpoverty alleviation schemes need to be seen in
the context of the economic and socialconstraints that limit the ability of households torun the businesses successfully and use theircredit enhanced savings for the directamelioration of various forms of deprivation.
The Unplanned Revolution: Observationson the Process of Socioeconomic Changein Pakistan, Hasan, Arif, City Press: Karachi 2002.
The change in Pakistan since 1947 in terms ofdemographic composition, economy and socialstructure has been profound in nature and yetthis ‘revolutionary’ change remainsunacknowledged by the state. This has resultedin the creation of a disturbing dichotomy in thedevelopment process of the country, which ismanifested in the presence of a dualgovernance structure, amongst other things.This is the central premise of Arif Hasan’s book.To illustrate his theory, Hasan uses hisexperience of fieldwork to demonstrate thenature of change in rural and urban areas andpoints out that the state has failed to incorporatethe new sociopolitical ground realities into itspolicymaking.
Hasan chronicles the socioeconomicconditions prevailing in selected towns anddistricts of the country. His intention is toillustrate the changing patterns in thesecommunities, drawing attention to thereplacement of the subsistence economy withmodern modes of production. Since the state isunwilling or unable to help, small farmers,fishermen and the employees/self employed ofthe informal sector, are forced to depend onmiddlemen/private entrepreneurs for credit, hireof machinery, transportation and even theprovision of services traditionally the prerogativeof the government. This results in theexploitation of these classes, which have littlechoice but to acquiesce to this informalarrangement, as their very survival depends on it.
Hasan is of the view that it is imperative forthe state to reflect this new scenario in itspolitical and planning process, thereby meetingthe aspirations of the low/middle income urbanand rural classes and countering the influenceof the middlemen. While he does not propose a
APPE
ND
ICES
So
cia
l D
eve
lop
me
nt
in P
aki
sta
n,
20
02
-03
190

APPE
ND
ICES
So
cia
l D
eve
lop
me
nt
in P
aki
sta
n,
20
02
-03
191
blueprint for these changes, he does indicatethe broad parameters required for change.Political accommodation of these classes canbe achieved through genuine devolution (asopposed to the 2001 plan, which still gives theprovincial assemblies certain powers of vetoover the lower tiers).
Hasan also focuses on migration as one ofthe major causes of the changes in Pakistanisociety. He believes that Partition created anaggressive upwardly mobile migrant culture,which led to the ‘opportunistic political andsocial culture’ prevailing in Pakistan today, asmigrants had no roots and little respect fortraditional values. In Punjab this new migrantculture had already been introduced through thecreation of canal colonies between 1870 and1920.
Hasan's observations on life, livelihoodsand local economies, from Tharparkar to theNorthern Areas, adds a personal perspective tothe literature on development. However, hisbook suffers from the rather random nature ofthe communities chosen _ as well as the factthat many of the communities were visited onlyonce. The only major Pakistani city examined bythe author is Karachi, which cannot claim to berepresentative of other major cities. As well,Hasan's analysis of the causes of the‘unplanned revolution’ is at times simplistic andcontentious and is not substantiated by enoughresearch.
Green Pioneers: Stories from theGrassroots, City Press for UNDP: Karachi 2002.
Green Pioneers tells the story of twentyindividuals and organizations that are making adifference to Pakistan's rapidly eroding naturalresource base. Their interventions include savingendangered species, protecting agricultural landfrom overuse, saving the country's culturalheritage, and educating children about theenvironment. In this sense, Green Pioneerscovers an array of path breaking solutions toprotect the environment, often against greatodds. What these individuals and organizationsall share in common are funds received from theUNDP's Global Environmental Facility Small
Grants Programme.It is heartening to hear of efforts such as
those undertaken to protect the HimalayanBrown Bears, a little known species that wouldnever even have been heard of, had it not beenfor two enterprising environmentalists. Theirlove of trekking in the Deosai Plains led them tothe discovery that the bears were in danger ofextinction due to hunting and they lobbied tohave the Deosai Plains declared a national park.Their second step was to have an NGOappointed as an honorary warden of the parkthus enabling formal conservation efforts andthe setting up of protected areas for the bears.However, they also had to contend with thewrath of the local hunting ‘mafia’ who tried toturn the villagers against them. The success oftheir efforts will ultimately rest on increasedinvolvement of the Wildlife Department and thegoodwill of the villagers. Nonetheless, withoutthe dedication and sheer perseverance of thesetwo individuals, the world would never havebeen alerted to the endangered status of thebears.
The stories in this book frequently illustratehow crucial poverty alleviation or socialprograms are for environmental efforts tosucceed at the grassroots. The efforts of SUNGI(an NGO based in Hazara) to protect theregions' diminished timber resources werecombined with income generating activities forpoor people. Similarly, Zafar Iqbal Lund's Sufi-based advocacy of organic farming incorporatesthe practical dimension of setting up a savingsbank for small farmers so they can obtaininsecticides directly from manufacturers insteadof being exploited by middlemen.
While the interventions documented in thisbook encompassed many different areas ofnatural resource protection, they also highlighthow the success of these initiatives dependedso heavily on the unrelenting dedication of thepioneers themselves. Through their hard workand persistence, they attracted national andinternational attention to their causes, andconsequently, funds and assistance. While theirsingle minded devotion to their respectiveprojects is commendable, it raises questions asto the sustainability of their work in the future.Unless able successors are found, or

APPE
ND
ICES
So
cia
l D
eve
lop
me
nt
in P
aki
sta
n,
20
02
-03
192
institutional capacity is created to carry on theirwork, their struggle may be meaningless. Aninteresting finding is that local participation inconservation efforts may not only involve thelower and middle-income groups but may alsosometimes be supported and spearheaded bylocal leaders with a sense of pride in theirheritage. However, the latter phenomenonneeds to be extended to more areas of thecountry before it will make a sizeable impact onthe environment.
Green Pioneers is a valuable contributionto the development literature as it publicizes thepractical efforts undertaken to encouragesustainable development in the country. It isalso a tribute to the dedication and innovation ofthe pioneers themselves and each story isfascinating as well as heart warming.
Literacy Trends in Pakistan UNESCO: Islamabad 2002.
This draft report by UNESCO containsinformation on broad trends in literacy inPakistan, and by providing district-wisebreakdowns, attempts to locate the problem ofliteracy at the grassroots level. Much of the datahas been culled from government documentssuch as the 1989 Population Census andinternational publications.
UNESCO hopes that by providing Inter-district comparisons of literacy and participationrates at the primary level, it will help regionalplanners under the new devolution plan. Thereport contains some useful sections pertainingto definitions of literacy in Pakistan. It contraststhe changing definitions of literacy in thedifferent census years, noting that since 1951,this definition has improved and evolved. It alsoprovides comparisons with other countries andwith international standards. One interestingtable spells out the aims and target groups ofAdult Literacy Plans in Pakistan within differentFive Year Plans. As the Director of UNESCOmournfully notes in her preface to the report,"Pakistan is one of the countries of the worldwhere the highest number of illiterates areconcentrated." Therefore, the provision of anadult literacy component in the government'sEducation Sector Reforms is fully supported by
UNESCO.District wise data on literacy has been
provided for three years: 1981, 1998 and 2001(projected trends). In some districts, the data ismissing for 1981 as well as 2001. Neverthelesswith the 1998 data being available for alldistricts, UNESCO has been able to classifydistricts from Very Low Literacy to Very HighLiteracy, thus demonstrating which districtshave made progress between 1981 and 1998by shifting from one class to another. Notable inthis regard are the achievements of Jhelum andGujrat that have leapt from Low Level Literacyto Very High Level Literacy in two decades.While the report offers simple analysis of thestatistical information provided, an in-depthconsideration of the causes and consequencesof the state of literacy in the country is notforthcoming
The report also establishes that therelationship between a mother's education andher average number of children is negative.Illiterate women have 4.72 children, on average,as compared to literate and secondary schoolcertificate holders who have between 3.63 and3.24 children. The provision of data on fertilitytrends is a welcome addition, as it will provideplanners with a micro perspective on whichdistricts to target to promote female education inorder to lower fertility rates.
The report is an easily accessiblehandbook on selected district-wide educationaldata. The information is simply presented andUNESCO lets the facts speak for themselves byeschewing complex explanations and policyrecommendations.
APPE
ND
ICES
So
cia
l D
eve
lop
me
nt
in P
aki
sta
n,
20
02
-03
193
A.3
AN INTEGRATED SOCIAL POLICY ANDMACROECONOMIC PLANNING MODEL
Historically, Pakistan's development planningmodels have not explicitly recognized the
interdependence between social sectordevelopment, intergovernmental revenue-sharing transfers and the macroeconomy. Themacroeconometric model of the PakistanInstitute of Development Economics wasdeveloped primarily to address the policy issuesfacing the macroeconomy and was updated in1992 to include 97 equations. The model,developed by the Applied Economics ResearchCentre, explicitly incorporates linkages betweenfederal and provincial governments, but itsscope is limited to resource mobilization.
Recognizing this reality, the Social Policyand Development Centre (SPDC) has identifieda pressing need for Pakistan to develop amacroeconomic model that explicitlyincorporates the impact of public expenditure,which is close to 25% of the GDP. SPDC hasbeen working diligently over the past few yearsto develop such a model.
The Social Policy and Development Centrehas developed a unique economic model
which can be used as an effective planning toolfor social sector development. This modelintegrates the social, public finance andmacroeconomic dimensions of the economyunder one interrelated system.
Called the Integrated Social Policy andMacroeconomic (ISPM) Planning model, itprovides the basic framework for analyzing theimplications of SAP and numerous othereconomic and non-economic policy decisions
on the long-term development of Pakistan'ssocial sectors.
The model is highly disaggregated andcovers all three levels of government. It iscapable of predicting outcomes in great detail,even at the level of individual social serviceprovision. Such a disaggregation of the modelat the provincial level in terms of revenues andexpenditures on social services (e.g., schools,hospitals, doctors, teachers, enrolments, etc.)is required to analyze the impact of SAP on themacroeconomy.
The model is based on consistent nationallevel data from 1973 onwards and is estimatedby single equation regression techniques. Itconsists of 265 equations, of which 129 arebehavioural and the rest are identities. Theseequations are subsumed into 22 interrelatedblocks. The blocks, along with their size interms of equations and identities, are listed intable A3.1.
Although the model is broadly Keynesian inspirit, the specification of individual blocks andequations is based on a pragmatic approach. Itcaptures the reality and non-market clearingaspects of Pakistan's economy. Thus, themacroeconomic block is essentially supplydriven. In addition, the social sector indicatorsare also resource determined.
The model is both dynamic and rich inspecification. The nature of linkages across themodel varies. In some cases, the linkage issimultaneous, in which equations in a block notonly determine equations in another block, butare also determined by them. Examples includethe linkages between the macro production andinput block, the production and macroexpenditure blocks, and the fiscal revenues andexpenditure blocks.
THE NEED FOR ANINTEGRATED MODEL
STRUCTURE AND LINKAGESOF THE MODEL
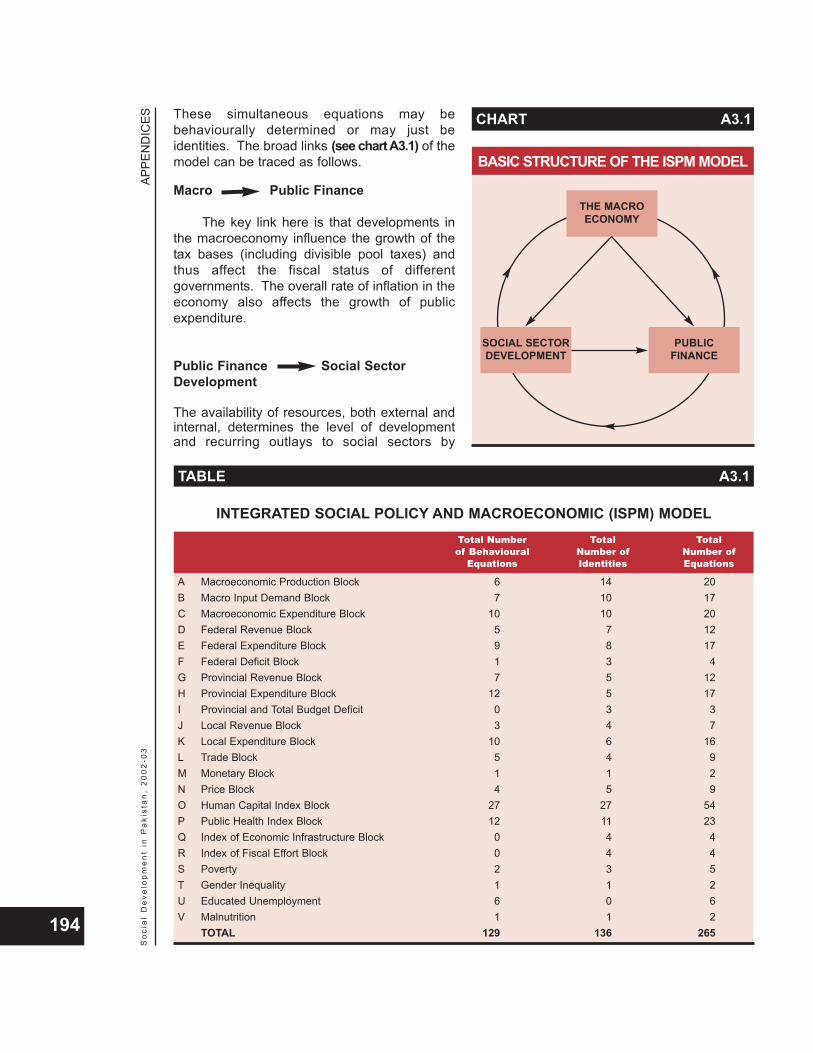
APPE
ND
ICES
So
cia
l D
eve
lop
me
nt
in P
aki
sta
n,
20
02
-03
194
These simultaneous equations may bebehaviourally determined or may just beidentities. The broad links (see chart A3.1) of themodel can be traced as follows.
Macro Public Finance
The key link here is that developments inthe macroeconomy influence the growth of thetax bases (including divisible pool taxes) andthus affect the fiscal status of differentgovernments. The overall rate of inflation in theeconomy also affects the growth of publicexpenditure.
Public Finance Social SectorDevelopment
The availability of resources, both external andinternal, determines the level of developmentand recurring outlays to social sectors by
BASIC STRUCTURE OF THE ISPM MODEL
SOCIAL SECTORDEVELOPMENT
PUBLICFINANCE
THE MACROECONOMY
CHART A3.1
INTEGRATED SOCIAL POLICY AND MACROECONOMIC (ISPM) MODEL
TABLE A3.1
Total Number Total Totalof Behavioural Number of Number of
Equations Identities Equations
A Macroeconomic Production Block 6 14 20B Macro Input Demand Block 7 10 17C Macroeconomic Expenditure Block 10 10 20D Federal Revenue Block 5 7 12E Federal Expenditure Block 9 8 17F Federal Deficit Block 1 3 4G Provincial Revenue Block 7 5 12H Provincial Expenditure Block 12 5 17I Provincial and Total Budget Deficit 0 3 3J Local Revenue Block 3 4 7K Local Expenditure Block 10 6 16L Trade Block 5 4 9M Monetary Block 1 1 2N Price Block 4 5 9O Human Capital Index Block 27 27 54P Public Health Index Block 12 11 23Q Index of Economic Infrastructure Block 0 4 4R Index of Fiscal Effort Block 0 4 4S Poverty 2 3 5T Gender Inequality 1 1 2U Educated Unemployment 6 0 6V Malnutrition 1 1 2
TOTAL 129 136 265
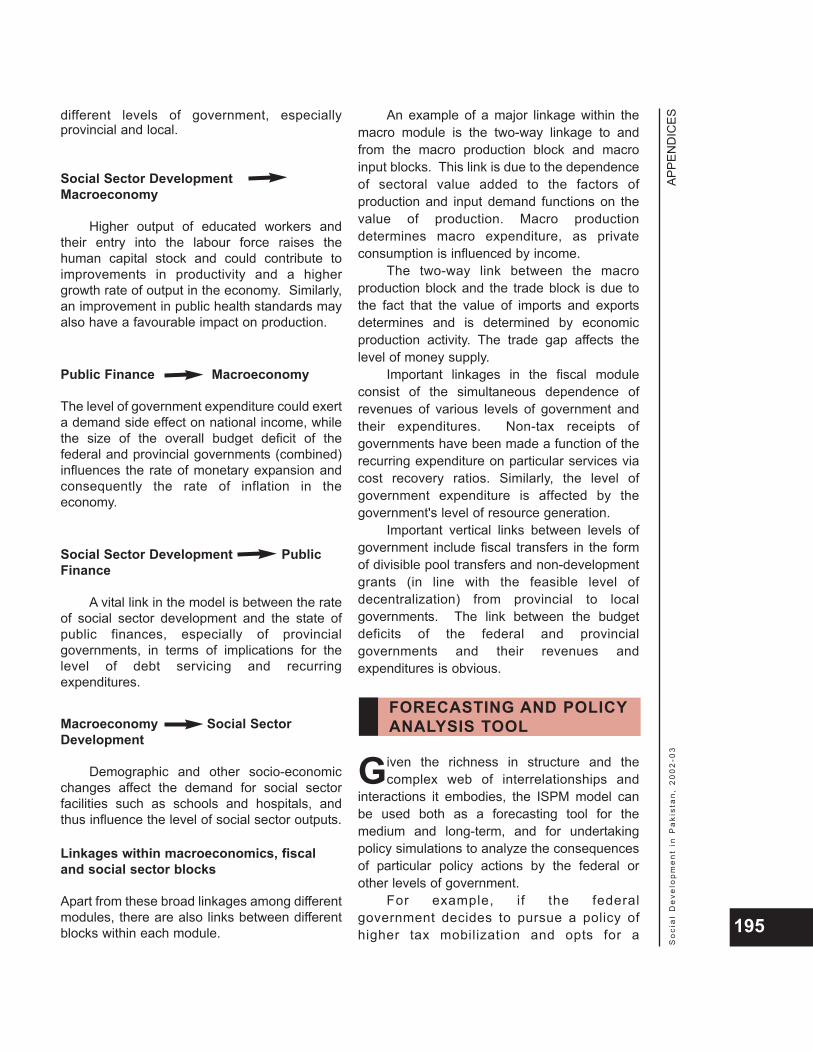
APPE
ND
ICES
So
cia
l D
eve
lop
me
nt
in P
aki
sta
n,
20
02
-03
195
different levels of government, especiallyprovincial and local.
Social Sector DevelopmentMacroeconomy
Higher output of educated workers andtheir entry into the labour force raises thehuman capital stock and could contribute toimprovements in productivity and a highergrowth rate of output in the economy. Similarly,an improvement in public health standards mayalso have a favourable impact on production.
Public Finance Macroeconomy
The level of government expenditure could exerta demand side effect on national income, whilethe size of the overall budget deficit of thefederal and provincial governments (combined)influences the rate of monetary expansion andconsequently the rate of inflation in theeconomy.
Social Sector Development PublicFinance
A vital link in the model is between the rateof social sector development and the state ofpublic finances, especially of provincialgovernments, in terms of implications for thelevel of debt servicing and recurringexpenditures.
Macroeconomy Social SectorDevelopment
Demographic and other socio-economicchanges affect the demand for social sectorfacilities such as schools and hospitals, andthus influence the level of social sector outputs.
Linkages within macroeconomics, fiscaland social sector blocks
Apart from these broad linkages among differentmodules, there are also links between differentblocks within each module.
An example of a major linkage within themacro module is the two-way linkage to andfrom the macro production block and macroinput blocks. This link is due to the dependenceof sectoral value added to the factors ofproduction and input demand functions on thevalue of production. Macro productiondetermines macro expenditure, as privateconsumption is influenced by income.
The two-way link between the macroproduction block and the trade block is due tothe fact that the value of imports and exportsdetermines and is determined by economicproduction activity. The trade gap affects thelevel of money supply.
Important linkages in the fiscal moduleconsist of the simultaneous dependence ofrevenues of various levels of government andtheir expenditures. Non-tax receipts ofgovernments have been made a function of therecurring expenditure on particular services viacost recovery ratios. Similarly, the level ofgovernment expenditure is affected by thegovernment's level of resource generation.
Important vertical links between levels ofgovernment include fiscal transfers in the formof divisible pool transfers and non-developmentgrants (in line with the feasible level ofdecentralization) from provincial to localgovernments. The link between the budgetdeficits of the federal and provincialgovernments and their revenues andexpenditures is obvious.
Given the richness in structure and thecomplex web of interrelationships and
interactions it embodies, the ISPM model canbe used both as a forecasting tool for themedium and long-term, and for undertakingpolicy simulations to analyze the consequencesof particular policy actions by the federal orother levels of government.
For example, if the federalgovernment decides to pursue a policy ofhigher tax mobilization and opts for a
FORECASTING AND POLICYANALYSIS TOOL
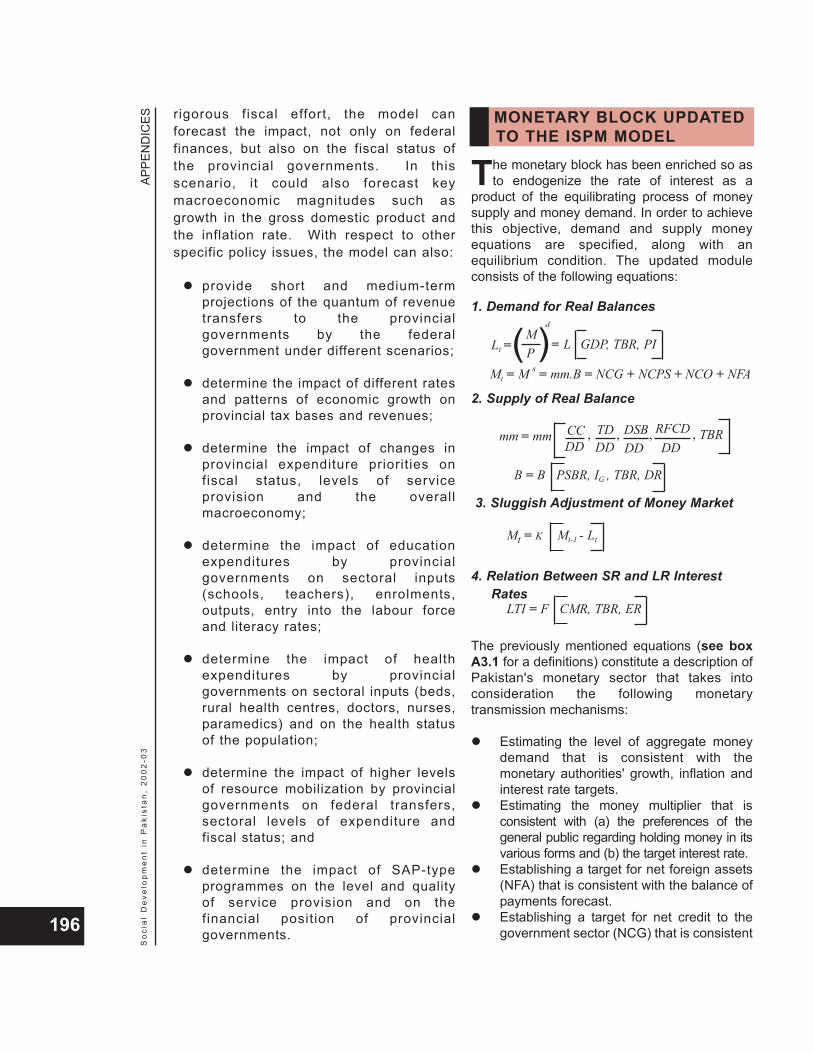
APPE
ND
ICES
So
cia
l D
eve
lop
me
nt
in P
aki
sta
n,
20
02
-03
196
rigorous fiscal effort, the model canforecast the impact, not only on federalfinances, but also on the fiscal status ofthe provincial governments. In thisscenario, it could also forecast keymacroeconomic magnitudes such asgrowth in the gross domestic product andthe inflation rate. With respect to otherspecific policy issues, the model can also:
provide short and medium-termprojections of the quantum of revenuetransfers to the provincialgovernments by the federalgovernment under different scenarios;
determine the impact of different ratesand patterns of economic growth onprovincial tax bases and revenues;
determine the impact of changes inprovincial expenditure priorities onfiscal status, levels of serviceprovision and the overallmacroeconomy;
determine the impact of educationexpenditures by provincialgovernments on sectoral inputs(schools, teachers), enrolments,outputs, entry into the labour forceand literacy rates;
determine the impact of healthexpenditures by provincialgovernments on sectoral inputs (beds,rural health centres, doctors, nurses,paramedics) and on the health statusof the population;
determine the impact of higher levelsof resource mobilization by provincialgovernments on federal transfers,sectoral levels of expenditure andfiscal status; and
determine the impact of SAP-typeprogrammes on the level and qualityof service provision and on thefinancial position of provincialgovernments.
The monetary block has been enriched so asto endogenize the rate of interest as a
product of the equilibrating process of moneysupply and money demand. In order to achievethis objective, demand and supply moneyequations are specified, along with anequilibrium condition. The updated moduleconsists of the following equations:
1. Demand for Real Balances
2. Supply of Real Balance
3. Sluggish Adjustment of Money Market
4. Relation Between SR and LR Interest Rates
The previously mentioned equations (see boxA3.1 for a definitions) constitute a description ofPakistan's monetary sector that takes intoconsideration the following monetarytransmission mechanisms:
Estimating the level of aggregate moneydemand that is consistent with themonetary authorities' growth, inflation andinterest rate targets.Estimating the money multiplier that isconsistent with (a) the preferences of thegeneral public regarding holding money in itsvarious forms and (b) the target interest rate. Establishing a target for net foreign assets(NFA) that is consistent with the balance ofpayments forecast.Establishing a target for net credit to thegovernment sector (NCG) that is consistent
MONETARY BLOCK UPDATED TO THE ISPM MODEL
Lt =M
= Ld
( ) GDP, TBR, PIP
Mt = M S = mm.B = NCG + NCPS + NCO + NFA
B = B PSBR, IG , TBR, DR
mm = mm , , , , TBRDD
RFCDDD
TDDD
CCDD
DSB
Mt = K Mt-1 - Lt
LTI = F CMR, TBR, ER
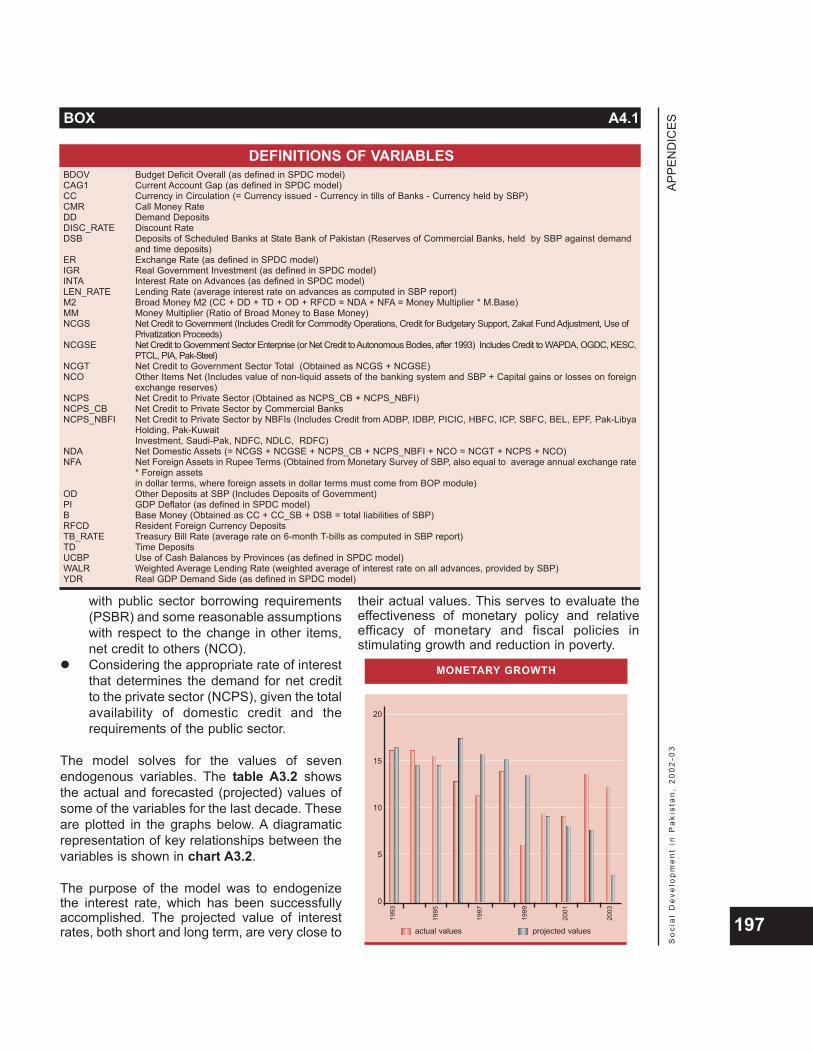
APPE
ND
ICES
So
cia
l D
eve
lop
me
nt
in P
aki
sta
n,
20
02
-03
197
with public sector borrowing requirements(PSBR) and some reasonable assumptionswith respect to the change in other items,net credit to others (NCO).Considering the appropriate rate of interestthat determines the demand for net creditto the private sector (NCPS), given the totalavailability of domestic credit and therequirements of the public sector.
The model solves for the values of sevenendogenous variables. The table A3.2 showsthe actual and forecasted (projected) values ofsome of the variables for the last decade. Theseare plotted in the graphs below. A diagramaticrepresentation of key relationships between thevariables is shown in chart A3.2.
The purpose of the model was to endogenizethe interest rate, which has been successfullyaccomplished. The projected value of interestrates, both short and long term, are very close to
their actual values. This serves to evaluate theeffectiveness of monetary policy and relativeefficacy of monetary and fiscal policies instimulating growth and reduction in poverty.
MONETARY GROWTH
1993
20
15
10
5
0
2001
1999
1997
1995
2003
projected valuesactual values
BOX A4.1
DEFINITIONS OF VARIABLESBDOV Budget Deficit Overall (as defined in SPDC model)CAG1 Current Account Gap (as defined in SPDC model)CC Currency in Circulation (= Currency issued - Currency in tills of Banks - Currency held by SBP) CMR Call Money RateDD Demand DepositsDISC_RATE Discount RateDSB Deposits of Scheduled Banks at State Bank of Pakistan (Reserves of Commercial Banks, held by SBP against demand
and time deposits) ER Exchange Rate (as defined in SPDC model)IGR Real Government Investment (as defined in SPDC model)INTA Interest Rate on Advances (as defined in SPDC model)LEN_RATE Lending Rate (average interest rate on advances as computed in SBP report) M2 Broad Money M2 (CC + DD + TD + OD + RFCD = NDA + NFA = Money Multiplier * M.Base) MM Money Multiplier (Ratio of Broad Money to Base Money)NCGS Net Credit to Government (Includes Credit for Commodity Operations, Credit for Budgetary Support, Zakat Fund Adjustment, Use of
Privatization Proceeds)NCGSE Net Credit to Government Sector Enterprise (or Net Credit to Autonomous Bodies, after 1993) Includes Credit to WAPDA, OGDC, KESC,
PTCL, PIA, Pak-Steel)NCGT Net Credit to Government Sector Total (Obtained as NCGS + NCGSE)NCO Other Items Net (Includes value of non-liquid assets of the banking system and SBP + Capital gains or losses on foreign
exchange reserves)NCPS Net Credit to Private Sector (Obtained as NCPS_CB + NCPS_NBFI)NCPS_CB Net Credit to Private Sector by Commercial BanksNCPS_NBFI Net Credit to Private Sector by NBFIs (Includes Credit from ADBP, IDBP, PICIC, HBFC, ICP, SBFC, BEL, EPF, Pak-Libya
Holding, Pak-Kuwait Investment, Saudi-Pak, NDFC, NDLC, RDFC)
NDA Net Domestic Assets (= NCGS + NCGSE + NCPS_CB + NCPS_NBFI + NCO = NCGT + NCPS + NCO) NFA Net Foreign Assets in Rupee Terms (Obtained from Monetary Survey of SBP, also equal to average annual exchange rate
* Foreign assetsin dollar terms, where foreign assets in dollar terms must come from BOP module)
OD Other Deposits at SBP (Includes Deposits of Government)PI GDP Deflator (as defined in SPDC model)B Base Money (Obtained as CC + CC_SB + DSB = total liabilities of SBP)RFCD Resident Foreign Currency Deposits TB_RATE Treasury Bill Rate (average rate on 6-month T-bills as computed in SBP report)TD Time DepositsUCBP Use of Cash Balances by Provinces (as defined in SPDC model)WALR Weighted Average Lending Rate (weighted average of interest rate on all advances, provided by SBP)YDR Real GDP Demand Side (as defined in SPDC model)
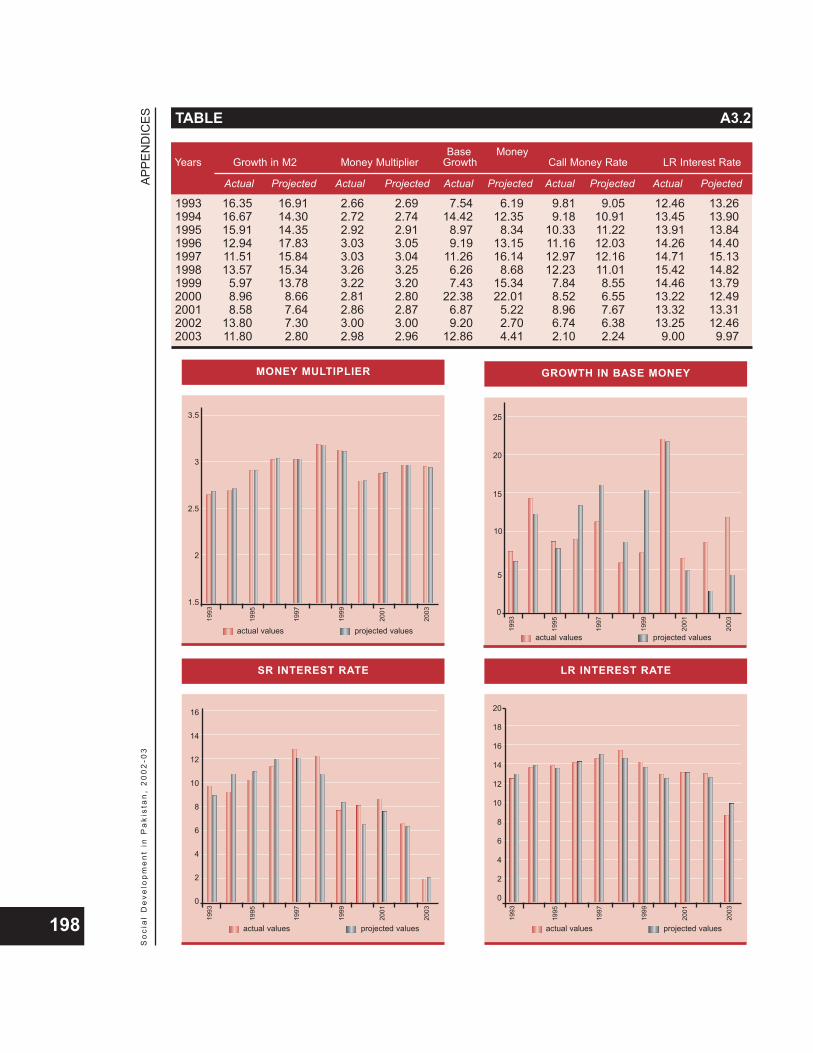
APPE
ND
ICES
So
cia
l D
eve
lop
me
nt
in P
aki
sta
n,
20
02
-03
198
TABLE A3.2
Base Money Years Growth in M2 Money Multiplier Growth Call Money Rate LR Interest Rate
Actual Projected Actual Projected Actual Projected Actual Projected Actual Pojected
1993 16.35 16.91 2.66 2.69 7.54 6.19 9.81 9.05 12.46 13.261994 16.67 14.30 2.72 2.74 14.42 12.35 9.18 10.91 13.45 13.901995 15.91 14.35 2.92 2.91 8.97 8.34 10.33 11.22 13.91 13.841996 12.94 17.83 3.03 3.05 9.19 13.15 11.16 12.03 14.26 14.401997 11.51 15.84 3.03 3.04 11.26 16.14 12.97 12.16 14.71 15.131998 13.57 15.34 3.26 3.25 6.26 8.68 12.23 11.01 15.42 14.821999 5.97 13.78 3.22 3.20 7.43 15.34 7.84 8.55 14.46 13.792000 8.96 8.66 2.81 2.80 22.38 22.01 8.52 6.55 13.22 12.492001 8.58 7.64 2.86 2.87 6.87 5.22 8.96 7.67 13.32 13.312002 13.80 7.30 3.00 3.00 9.20 2.70 6.74 6.38 13.25 12.462003 11.80 2.80 2.98 2.96 12.86 4.41 2.10 2.24 9.00 9.97
MONEY MULTIPLIER
1993
3.5
3
2.5
2
1.5
2001
1999
1997
1995
2003
projected valuesactual values
GROWTH IN BASE MONEY
1993
0
2001
1999
1997
1995
2003
projected valuesactual values
5
10
15
20
25
SR INTEREST RATE
1993
16
14
12
10
8
6
4
2
0
2001
1999
1997
1995
2003
projected valuesactual values
LR INTEREST RATE
1993
20
18
16
14
12
10
8
6
4
2
0
2001
1999
1997
1995
2003
projected valuesactual values
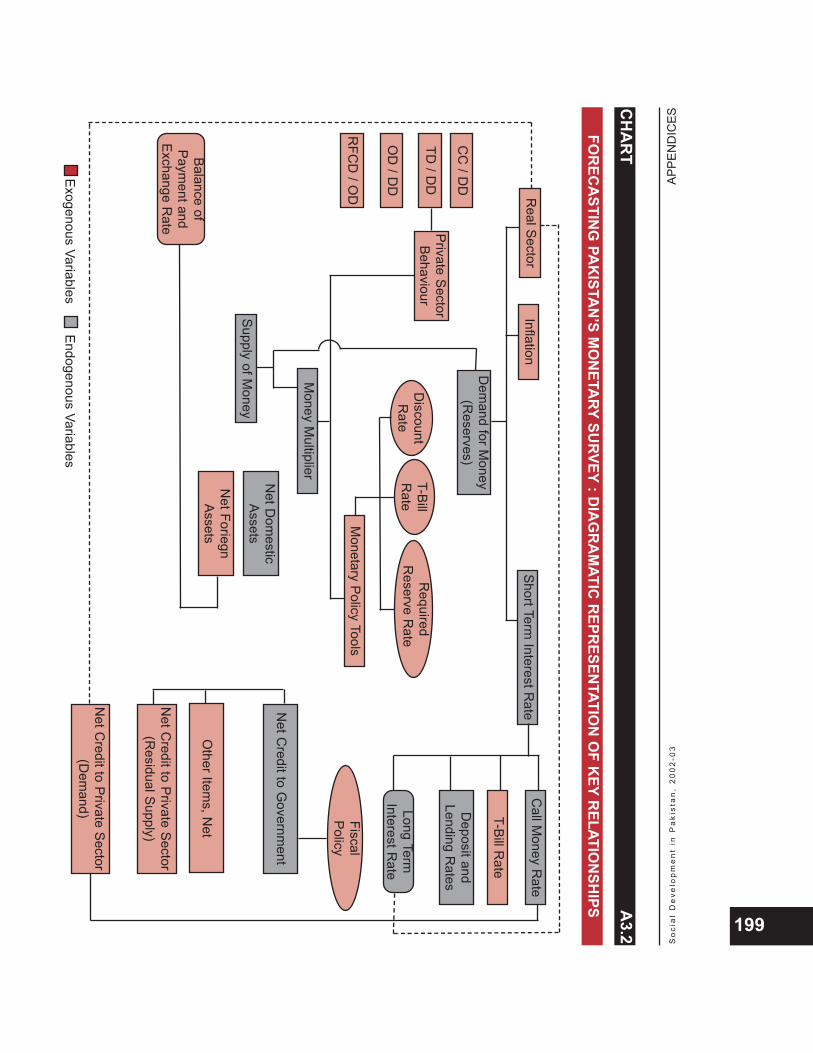
APPE
ND
ICES
So
cia
l D
eve
lop
me
nt
in P
aki
sta
n,
20
02
-03
199
Call M
oney Rate
Short Term Interest R
ate
Deposit and
Lending Rates
T-Bill Rate
Long TermInterest R
ate
InflationR
eal Sector
FiscalPolicy
Other Item
s, Net
Net C
redit to Private Sector(R
esidual Supply)
Net C
redit to Private Sector(D
emand)
CC
/ DD
Net C
redit to Governm
ent
OD
/ DD
TD / D
D
RFC
D / O
D
Private SectorBehaviour
Dem
and for Money
(Reserves)
Discount R
ateR
equiredR
eserve Rate
Monetary Policy Tools
T-Bill R
ate
Money M
ultiplier
Supply of Money
Net D
omestic
Assets
Net ForiegnAssets
Balance ofPaym
ent andExchange R
ate
Exogenous VariablesEndogenous Variables
CH
AR
TA
3.2
FOR
ECA
STING
PAK
ISTAN
’S MO
NETA
RYSU
RVEY: D
IAG
RA
MATIC
REPR
ESENTATIO
N O
F KEY
RELATIO
NSH
IPS
APPE
ND
ICES
So
cia
l D
eve
lop
me
nt
in P
aki
sta
n,
20
02
-03
200
RESEARCH REPORTS
Impact of the Afghan War on the Economy:Options for PakistanKaiser Bengali, Qazi Masood Ahmed and Kalim HyderRR 41, December 2001, Price Rs. 40
Macroeconomic Developments and PovertyHafiz A. PashaRR 33, April 2000, Price Rs. 70
A Medium-term Macroeconomic Frameworkfor PakistanHafiz A. PashaRR 31, February 2000, Price Rs. 60
Impact of Economic Adjustment on SocialDevelopment in PakistanHafiz A. Pasha, Aisha Ghaus-Pasha, Sajjad Akhtar, andZafar H. IsmailRR 28, September 1999, Price Rs. 60
Integrated Social Policy andMacroeconomic Planning Model forPakistanHafiz A. Pasha, M. Aynul Hasan, Aisha Ghaus-Pasha et al.RR 7, June 1995, Price Rs. 360
Specification of Integrated Social SectorRevenue and Expenditure Planning ModelHafiz A. Pasha, Aisha Ghaus-Pasha, M. Aynul Hasan, et al.RR 3, August 1993, Price Rs. 110
POLICY PAPERS
Statement to the Commonwealth DelegationHafiz A. PashaPP 17, October 1999, Price Rs. 35
Unsustainability of the Balance of PaymentsHafiz A. Pasha and Zafar H. IsmailPP 16, September 1999, Price Rs. 40
CONFERENCE PAPERS
The Long run and Short run Impact ofExchange Rate Devaluation on Pakistan’sTrade PerfomanceZehra Aftab and AurangzebCP 45, December 2002, Price Rs. 35
Crowding Out Hypothesis in a Vector Error Correction Framework: A Case Study ofPakistanKalim HyderCP 44, January 2002, Price Rs.35
The Political Economy of Tax Reforms in1990sQazi Masood Ahmed and Mahnaz FatimaCP 42, January 2002, Price Rs.35
Stabilization Policy vs Growth OrientedPolicy: Implications for the PakistanEconomyKaiser Bengali and Qazi Masood AhmedCP 41, January 2002, Price Rs.35
An Econometric Evaluation of Pakistan’sNational Education Policy, 1998-2010Sajjad Akhtar and M. Ajaz RasheedCP 28, July 1999, Price Rs. 35
Integrated Social Sector MacroeconomicModel for PakistanHafiz A. Pasha, M. Aynul Hasan, Aisha Ghaus-Pasha, andAjaz RasheedCP 25, December 1996, Price Rs. 35
Improved Health Status and EconomicGrowth: Some Co-integration Results fromDeveloping EconomiesM. Aynul Hasan, M. Rashid Ahmed, and Aisha BanoCP 19, July 1996, Price Rs. 60
Is There a Long-run Relationship BetweenEconomic Growth and HumanDevelopment? Some Cross-CountryEvidence from Developing CountriesM. Aynul Hasan, Nadeem Ahmed, and Nazia BanoCP 18, June 1996, Price Rs. 60Is Public Sector Investment Productive?
A.4
SPDC PUBLICATIONS
INTEGRATED SOCIAL POLICYAND MACRO MODELLING UNIT

APPE
ND
ICES
So
cia
l D
eve
lop
me
nt
in P
aki
sta
n,
20
02
-03
201
Is Public Sector Investment Productive?Some Evidence from PakistanHafiz A. Pasha, M. Aynul Hasan, Aisha Ghaus-Pasha, andAjaz RasheedCP 15, September 1995, Price Rs. 110
Results of Policy SimulationsAisha Ghaus-PashaCP 13, March 1995, Price Rs. 35
Specification of the Integrated Social PolicyMacroeconomic ModelM. Aynul HasanCP 11, March 1995, Price Rs. 35
Overview of Integrated Revenue andExpenditure Planning Model for SocialSectorsHafiz A. PashaCP 10, March 1995, Price Rs. 35
Investment Strategy and Expenditure Requirements for Social DevelopmentM. Aynul HasanCP 2, April 1993, Price Rs. 35
RESEARCH REPORTS
State of the Economy: Behind theAggregatesKaiser Bengali, Qazi Masood Ahmed, Zehra Aftab, et al.RR 56, June 2003, Price Rs. 110
Pakistan's External Debt Burden: Causes,Complexities and RemediesAsad Sayeed and Ejaz RashidRR 45, September 2003, Price Rs. 65
The Slowing Down of the Growth of TotalFactor Productivity in PakistanHafiz A. Pasha, Aisha Ghaus-Pasha and Kalim HyderRR 44, December 2002, Price Rs. 35
Cost of Living Index by City of PakistanHafiz A. Pasha and Aisha Ghaus-PashaRR 43, November 2002, Price Rs. 35
Recasting Sindh Budget (Expenditures)From Head of Account To Department BasisKaiser Bengali and Fauzia MukarramRR 42, January 2002, Price Rs. 110
Stabilization vs Growth: Federal Budget2001-02Kaiser Bengali, Qazi Masood Ahmed, Hari Ram Lohano et al.RR 40, June 2001, Price Rs. 125
Evaluation of the Federal Budget, 2000-2001Hafiz A. Pasha, Aisha Ghaus-Pasha, Zafar H. Ismail et al.RR 35, June 2000, Price Rs. 200
Analysis of Provincial Budgets, 1999-2000Hafiz A. Pasha, Aisha Ghaus-Pasha, Zafar H. Ismail, et al.RR 26, August 1999, Price Rs. 35
Evaluation of the Federal Budget, 1999-2000Hafiz A. Pasha, Aisha Ghaus-Pasha, Zafar H. Ismail et al.RR 23, June 1999, Price Rs. 60
Essays on the Federal Budget, 1998-99Aisha Ghaus-Pasha, Zafar H. Ismail, Sajjad Akhtar, AjazRasheed et al.RR 22, July 1998, Price Rs. 110
Fiscal Decentralization: Lesson From theAsian ExperienceHafiz A. PashaRR 19, January 1997, Price Rs. 60
Growth of Public Debt and Debt Servicingin PakistanHafiz A. Pasha and Aisha Ghaus-PashaRR 17, April 1996, Price Rs. 235
The Provincial Budgets, 1997-98Zafar H. Ismail, Ajaz Rasheed, M. Asif Iqbal et al.RR 15, July 1997, Price Rs. 60
An Evaluation of the Federal Budget,1997-98Zafar H. Ismail, Sajjad Akhtar, Asad U. Sayeed et al.RR 14, July 1997, Price Rs. 60
An Evaluation of the Budget, 1996-97Hafiz A. Pasha, Aisha Ghaus-Pasha, Zafar H. Ismail et al.RR 13, July 1996, Price Rs. 110
Resource Mobilization and ExpenditurePlanning for Social Sectors in PakistanAisha Ghaus-Pasha, M. Asif Iqbal, Rafia Ghaus, andNaeem AhmedRR 12, June 1996, Price Rs. 235
National Finance Commission: 1995 -Intergovernmental Revenue Sharing inPakistanAisha Ghaus-Pasha, Rafia Ghaus, A. Rauf Khan, and M.Asif IqbalRR 8, January 1996, Price Rs. 110
PUBLIC FINANCE UNIT

APPE
ND
ICES
So
cia
l D
eve
lop
me
nt
in P
aki
sta
n,
20
02
-03
202
A Study on Improving the Efficiency andEffectiveness of Spending in the SocialSectors and Increasing ResourceMobilization in the ProvincesHafiz A. Pasha, Aisha Ghaus-Pasha, M. Aynul Hasan et al.RR 2, September 1992, Price Rs. 360 per volume(Rs.1,800 for the full five volume set)
Fiscal Policy in PakistanHafiz A. Pasha, Aisha Ghaus-Pasha, and Rafia Ghaus RR 1, October 1991, Price Rs. 235
POLICY PAPERS
Hidden SubsidiesHafiz A. Pasha, Aisha Ghaus-Pasha and Naveed HanifPP 22, April 2002, Price Rs. 35
Why has the Tax-To-GDP Ratio Fallen?Hafiz A. Pasha, Aisha Ghaus-Pasha and Muhammad SabirPP 21, February 2002, Price Rs. 35
Macroeconomic Framework for DebtManagementAisha Ghaus-Pasha and Hafiz A. PashaPP 19, May 2000, Price Rs. 100
Broad-Basing of the GST: The Strategy forTransitionHafiz A. PashaPP 15, July 1999, Price Rs. 35
Provincial Resource MobilizationAisha Ghaus-Pasha, A. Rauf Khan, and Rafia GhausPP 14, June 1998, Price Rs. 35
Financial Sustainability of NGOs: Proposalfor 1998-99 Federal BudgetAisha Ghaus-Pasha, Zafar H. Ismail, et al. PP 13, May 1998, Price Rs. 35
Political Economy of Tax Reforms: ThePakistan ExperienceHafiz A. PashaPP 12, February 1997, Price Rs. 60
Fiscal Effort by Provincial Governments inPakistanRafia Ghaus and A. Rauf KhanPP 10, November 1995, Price Rs. 60
Implications of the TOR of the New NFCAisha Ghaus-PashaPP 9, June 1995, Price Rs. 35
Provincial Budgets of 1995-96Aisha Ghaus-Pasha, Rafia Ghaus, and A. Rauf KhanPP 8, July 1995, Price Rs. 35
Switchover to Ad Valorem Octroi Rates atDry PortsAisha Ghaus-Pasha, M. Asif Iqbal, and Naveed HanifPP 7, October 1994, Price Rs. 110
Rationalization of Octroi RatesAisha Ghaus-Pasha, A. Rauf Khan, and Naveed HanifPP 6, October 1994, Price Rs. 110
User Charges in HealthZafar H. Ismail and M. Asif IqbalPP 5, August 1994, Price Rs. 110
Sindh Government Budget of 1993-94Aisha Ghaus-Pasha, Rafia Ghaus, M. Asif Iqbal, and A.Rauf KhanPP 4, July 1994, Price Rs. 35
User Charges in EducationZafar H. Ismail and M. Asif IqbalPP 3, June 1994, Price Rs. 110
Sales Taxation of Services by ProvincialGovernmentsHafiz A. Pasha and Rafia GhausPP 2, June 1994, Price Rs. 110
Rationalization of Stamp Duties onFinancial Assets and TransactionsAisha Ghaus-Pasha and A. Rauf KhanPP 1, June 1994, Price Rs. 60
CONFERENCE PAPERS
Hidden SubsidiesHafiz A. Pasha, Aisha Ghaus-Pasha and Naveed AamirCP 49, January 2003, Price Rs. 35
Gender and Public Spending on Educationin Pakistan: A Case Study of DisaggregatedBenefit IncidenceMuhammad SabirCP 48, January 2003, Price Rs. 35
Dynamic Consequences of the 1997National Finance Commission Award onProvincial Social Sector ExpendituresMuhammad SabirCP 43, January 2002, Price Rs.35
Devolution and Fiscal DecentralizationHafiz A. Pasha and Aisha Ghaus-PashaCP 37, January 2001, Price Rs.60
APPE
ND
ICES
So
cia
l D
eve
lop
me
nt
in P
aki
sta
n,
20
02
-03
203
Issues in Fiscal DecentralizationAisha Ghaus Pasha and Hafiz A. PashaCP 33, August 2000, Price Rs. 60
Public Expenditure ReformHafiz A. PashaCP 32, July 2000, Price Rs. 40
Determinants of Rates of Octroi Tax inPakistanAisha Ghaus-Pasha, A. Rauf Khan, and Rafia GhausCP 24, April 1995, Price Rs. 60
Sustainability of Public Debt in PakistanHafiz A. Pasha and Aisha Ghaus-PashaCP 21, July 1996, Price Rs. 60
Municipal Finance in Small CitiesHafiz A. Pasha and Aisha Ghaus-PashaCP 17, December 1995, Price Rs. 60
Financial Development of MegacitiesHafiz A. Pasha and Aisha Ghaus-PashaCP 16, October 1995, Price Rs. 60
Is the Social Action Programme (SAP) inPakistan Financially Sustainable?Hafiz A. Pasha, M. Aynul Hasan, Aisha Ghaus-Pasha, andM. Ajaz RasheedCP 14, April 1995, Price Rs. 60
Development of Property TaxationAbdul Waheed KhanCP 9, March 1995, Price Rs. 35
Prospects of Resource Mobilization by theProvincial GovernmentsImtiaz Ahmed CheemaCP 8, March 1995, Price Rs. 35
Expenditure Planning IssuesTariq SultanCP 7, April 1993, Price Rs. 35
Local Government Resource MobilizationKashif MurtazaCP 6, April 1993, Price Rs. 35
Local Government Resource MobilizationHafiz A. Pasha and Aisha Ghaus-PashaCP 5, April 1993, Price Rs. 35
Problems in Resource Mobilization inPunjabImtiaz A. CheemaCP 4, April 1993, Price Rs. 35
Provincial Government ResourceMobilization in PunjabHafiz A. PashaCP 3, April 1993, Price Rs. 35
RESEARCH REPORTS
Poverty and Inequality During theAdjustment Decade: Empirical Findingsfrom Household SurveysHaroon JamalRR 55, April 2003, Price Rs. 35
Impact of Ownership and Concentration ofLand on Schooling: The Case of RuralPunjabHaroon Jamal and Amir Jahan KhanRR 54, April 2003, Price Rs. 35
Zakat As A Social Safety Net: Exploring theImpactImran Ashraf Toor and Abu NasarRR 53, April 2003, Price Rs. 35
Mapping the Spatial Deprivation of PakistanHaroon Jamal, Amir Jahan Khan, Imran Ashraf Toor andNaveed AamirRR 52, April 2003, Price Rs. 60
Price and Income Effects on UrbanUndernutritionHaroon JamalRR 51, April 2003, Price Rs. 35
Private Returns to Education: Evidence forPakistanHaroon Jamal, Imran Ashraf Toor and Farhan Sami KhanRR 50, April 2003, Price Rs. 35
Returns to Education: The Case of FertilityHaroon Jamal and Imran Ashraf ToorRR 49, April 2003, Price Rs. 35
Microfinancing: Fighting Against PovertyHari Ram Lohano and Haroon JamalRR 48, April 2003, Price Rs. 35
The Changing Profile of Regional InequalityHaroon Jamal and Amir Jahan KhanRR 47, April 2003, Price Rs. 35
P POVERTY UNIT
APPE
ND
ICES
So
cia
l D
eve
lop
me
nt
in P
aki
sta
n,
20
02
-03
204
The Knowledge Divide: Education Inequalityin PakistanHaroon Jamal and Amir Jahan KhanRR 46, April 2003, Price Rs. 35
Incidence of Income Poverty in PakistanAisha Ghaus-Pasha, Haroon JamalRR 39, March 2001, Price Rs. 50
Credit to the Poor: Consultations withBorrowersHari Ram Lohano, Fauzia Mukarram and Haroon JamalRR 38, February 2001, Price Rs. 45
Evaluation of Social Safety Nets in PakistanHafiz A. Pasha, Sumaira Jafarey, and Hari Ram LohanoRR 32, March 2000, Price Rs. 60
Social Impact of Economic Crisis: Lessonsfor PakistanAisha Ghaus-Pasha, Hafiz A. Pasha, Sumaira Jafarey, andRafea AneesRR 29, December 1999, Price Rs. 110
Modelling Poverty Trends in Pakistan: SomeAdditional Empirical EvidenceSajjad Akhtar and Mansoor AhmedRR 27, August 1999, Price Rs. 35
The 1998 Population CensusAisha Ghaus-Pasha, Zafar H. Ismail, Abu Nasar, andNaveed HanifRR 25, June 1999, Price Rs. 35
Gender Inequality in Developing Countries:A Case Study of PakistanHafiz A. Pasha, Aisha Ghaus-Pasha, and Abu NasarRR 24, June 1999, Price Rs. 35
Social and Economic Ranking of Districts ofPakistanAisha Ghaus-Pasha, Hafiz A. Pasha, Rafia Ghaus et al.RR 18, January 1998, Price Rs. 60
The World Summit for Social Development:Its Implications for Social SectorDevelopment in PakistanAsad U. Sayeed and Zafar H. Ismail RR 11, June 1996, Price Rs. 60
Social Development Ranking of Districts ofPakistanAisha Ghaus-Pasha, Hafiz A. Pasha, Rafia Ghaus et al.RR 10, June 1996, Price Rs. 60
POLICY PAPERS
On the Estimation of An Absolute PovertyLine: An Empirical AppraisalHaroon JamalPP 23, April 2003, Price Rs. 35
A National Poverty Reduction Strategy andthe Role of DonorsHafiz A. Pasha, Aisha Ghaus-Pasha, Zafar H. Ismail et al.PP 20, October 2000, Price Rs. 60
CONFERENCE PAPERS
Brief on Annual Review of Social Policy andDevelopment Centre for 2000: TowardsPoverty ReductionHafiz A. PashaCP 36, December 2000, Price Rs.25
Pakistan's Ranking in Social Development:Have We Always Been Backward?Aisha Ghaus-Pasha and Naeem AhmedCP 29, November 1999, Price Rs. 35
Gender Differentials in the Cost of PrimaryEducation: A Study of PakistanZafar H. IsmailCP 26, December 1996, Price Rs. 35
Social Development Ranking of Districts ofPakistanAisha Ghaus-Pasha, Hafiz A. Pasha, and Rafia Ghaus CP 23, December 1996, Price Rs. 60
Has Poverty Returned to Pakistan?Aisha Ghaus-Pasha and Asad U. SayeedCP 20, July 1996, Price Rs. 60
RESEARCH REPORTS
Social Development and Economic Growth:A Statistical ExplorationHaroon JamalRR 37, February 2001, Price Rs. 35
Alternative Delivery Mechanisms for SocialServices: Some Case Studies from PakistanZafar H. Ismail, Michael G. McGarry, John Davies, andJaved HasanRR 36, June 2000, Price Rs. 90
P GOVERNANCE & GENDER UNIT
APPE
ND
ICES
So
cia
l D
eve
lop
me
nt
in P
aki
sta
n,
20
02
-03
205
Public-Private Partnerships in the HealthSectorHafiz A. Pasha and Abu NasarRR 34, May 2000, Price Rs. 65
Elements of Good Economic GovernanceHafiz A. PashaRR 30, February 2000, Price Rs. 50
Decentralized Governance of Sindh KatchiAbadis AuthorityHafiz A. Pasha, Aisha Ghaus-Pasha, Zafar H. Ismail et al.RR 21, May 1998, Price Rs. 110
Review of the Social Action ProgrammeAisha Ghaus-Pasha, Micheal G. McGarry, Asad U. Sayeedet al.RR 16, August 1997, Price Rs. 500
Continuation Rates in Primary Education: SA Study of PakistanHafiz A. Pasha, Zafar H. Ismail, and M. Asif IqbalRR 9, May 1996, Price Rs. 60
Optimal Enrolment and Cost-EffectiveExpenditures for Public School SystemHafiz A. Pasha, M. Aynul Hasan, Ajaz Rasheed et al.RR 6, October 1994, Price Rs. 235
Optimal Mix of Health Sector ExpenditureHafiz A. Pasha, M. Aynul Hasan, Ajaz Rasheed et al.RR 5, September 1994, Price Rs. 110
POLICY PAPERS
Revamping the SAPHafiz A. Pasha, Aisha Ghaus-Pasha, Zafar H. Ismail, andSehar RizviPP 18, May 2000, Price Rs. 60
Ninth Five-Year Plan (1998-2003): Issues PaperHafiz A. Pasha, Aisha Ghaus-Pasha, Zafar H. Ismail et al.PP 11, April 1996, Price Rs. 110
CONFERENCE PAPERS
The Income Tax Regime and the Non-ProfitSector: The Case of Pakistan Zafar H. IsmailCP 46, January 2003, Price Rs.35
Nonprofit Sector in Pakistan: Government Policy and Future Issues Aisha Ghaus-Pasha and Muhammad Asif IqbalCP 47, January 2003, Price Rs.60
Internal Migration: A Case Study of SindhDistrictsAbu Nasar and Naveed AamirCP 40, October 2001, Price Rs.35
Governance, Decentralization and Poverty:The Case of PakistanZafar H. Ismail and Sehar RizviCP 38, January 2001, Price Rs.35
Policy Research and Its Implementation:Pakistan and CanadaZafar H. Ismail and Richard ShillingtonCP 35, September 2000, Price Rs.35
Issues in Institutional Reform forDevolutionKaiser BengaliCP 34, August 2000, Price Rs. 55
Some Issues of Governance in PakistanZafar H. Ismail and Sehar RizviCP 39, May 2000, Price Rs.35
Social Sector Policies Under SAPZafar H. IsmailCP 31, October 1999, Price Rs. 40
Impediments to Social Development inPakistanZafar H. IsmailCP 30, November 1999, Price Rs. 35
Impediments to Improvement of SocialSectors in PakistanZafar H. IsmailCP 27, March 1998, Price Rs. 35
The City of Karachi: Planning and Managingfor Urban DevelopmentZafar H. IsmailCP 22, August 1996, Price Rs. 60
The Implementation Environment of theSocial Action ProgrammeJaved Sadiq MalikCP 1, April 1993, Price Rs. 35
WORKING PAPERS
Dimensions of the Nonprofit Sector inPakistanAisha Ghaus-Pasha, Hafiz A. Pasha and M. Asif IqbalCNPSP 1, 2002
Nonprofit Sector in Pakistan: GovernmentPolicy and Future IssuesAisha Ghaus-Pasha, Hafiz A. Pasha and M. Asif IqbalCNPSP 2, 2002
Law and the Nonprofit Sector in PakistanZafar H. IsmailCNPSP 3, 2002
RESEARCH REPORTS
Database Development for Integrated SocialSector Revenue and Expenditure ModelAisha Ghaus-Pasha, Zafar H. Ismail, M. Asif Iqbal et al.RR 4, February 1994, Price Rs. 110
CONFERENCE PAPERS
Software Development and Use of the ModelAjaz RasheedCP 12, March 1995, Price Rs. 35
Database Report 1997: Education ModuleZafar H. Ismail, A. Rauf Khan, Abu Nasar et al.DB 3, November 1997, Price Rs. 220
Database Report 1997: Provincial FinanceModule Zafar H. Ismail, A. Rauf Khan, Abu Nasar et al.DB 2, September 1997, Price Rs. 350
Database Report 1997: Federal FinanceModuleZafar H. Ismail, A. Rauf Khan, and Naeem AhmedDB 1, July 1997, Price Rs. 120
Social Development in Pakistan: Growth,Inequality and Poverty. Annual Review 2001Kaiser Bengali, Haroon Jamal, Qazi Masood, et al.SPDCB-5, 2002, Price Rs. 395
Social Development in Pakistan: TowardsPoverty Reduction. Annual Review 2000Hafiz A. Pasha, Aisha Ghaus-Pasha, Zafar H. Ismail et al.SPDCB 4, 2000, Price Rs. 395
Social Development in Pakistan: SocialDevelopment in Economic Crisis. AnnualReview 1999Hafiz A. Pasha, Aisha Ghaus-Pasha, Zafar H. Ismail et al.SPDCB 3, 1999, Price Rs. 395
Social Development in Pakistan. AnnualReview 1998Aisha Ghaus-Pasha, Zafar H. Ismail, Sajjad Akhtar et al.RR 20, April 1998, Price Rs. 370
Provincial Governments and the SocialSectors in PakistanAisha Ghaus-Pasha, Hafiz A. Pasha, and Zafar H. IsmailSPDCB 2, 1997, Price Rs. 195
Resource Mobilization and ExpenditurePlanning in the Provinces of PakistanHafiz A.Pasha, Aisha Ghaus-Pasha, and M. Aynul HasanSPDCB 1, 1996, Price Rs. 395
Proceedings of the Seminar on Prospectsand Policies for the FutureCP 4, January 2000, Price Rs. 50
Proceedings of the Launching Ceremony ofSocial Development in Pakistan. AnnualReview 1998CP 3, April 1998, Price Rs. 110
Proceedings of the Second Conference onResource Mobilization and ExpenditurePlanningCP 2, March 1995, Price Rs. 1,200 for the full 4-volume set
Proceedings of the Conference onResource Mobilization and ExpenditurePlanningCP 1, April 1993, Price Rs. 360
COMPARATIVE NONPROFIT SECTOR PROJECT
P DATABASE REPORTS
P SPDC BOOKS
P CONFERENCE PROCEEDINGS
P INFORMATION SYSTEMS UNIT
APPE
ND
ICES
So
cia
l D
eve
lop
me
nt
in P
aki
sta
n,
20
02
-03
206

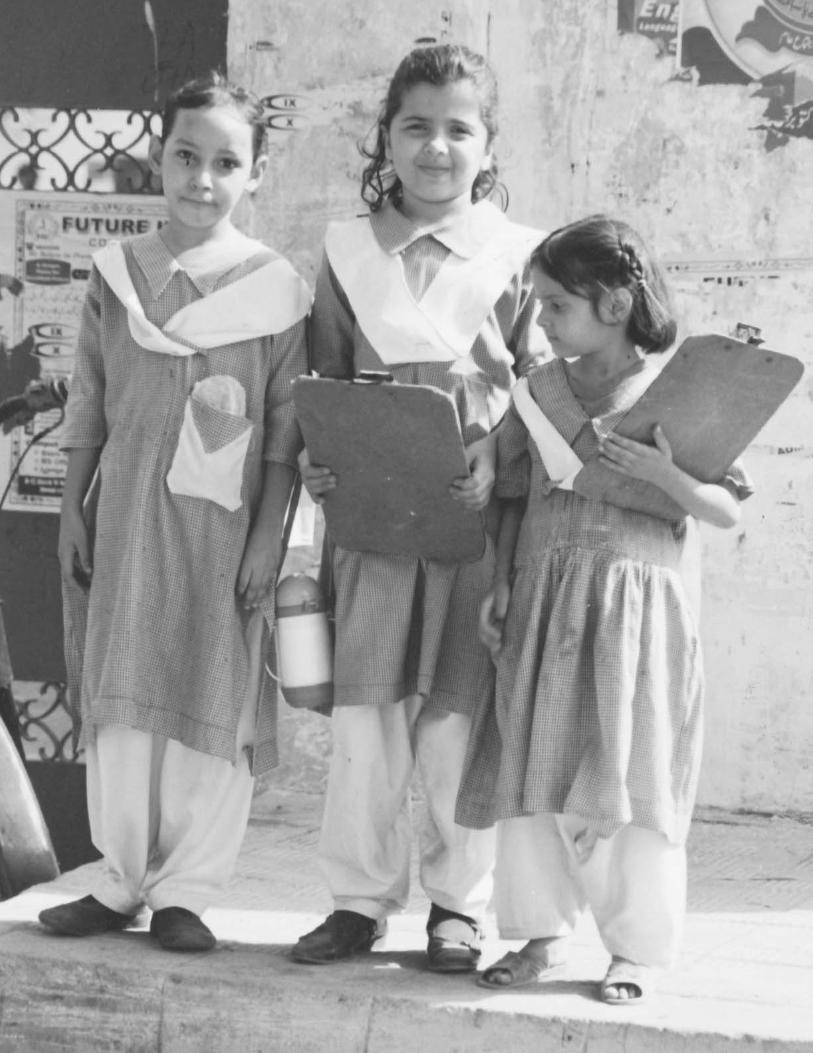
APPE
ND
ICES
So
cia
l D
eve
lop
me
nt
in P
aki
sta
n,
20
02
-03
208
SELE
CTE
D S
OC
IAL
DEV
ELO
PMEN
TIN
DIC
ATO
RS
So
cia
l D
eve
lop
me
nt
in P
aki
sta
n,
20
02
-03
209
SELECTEDSOCIAL DEVELOPMENT
INDICATORS
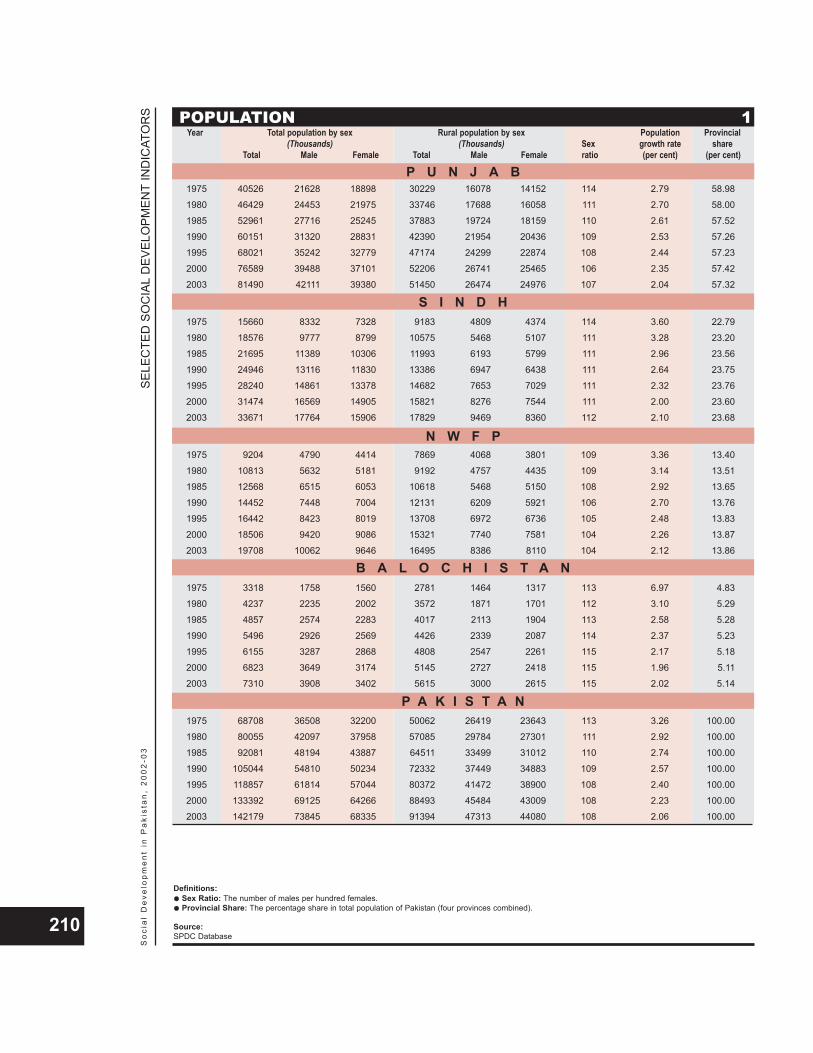
SELE
CTE
D S
OC
IAL
DEV
ELO
PMEN
TIN
DIC
ATO
RS
So
cia
l D
eve
lop
me
nt
in P
aki
sta
n,
20
02
-03
210
POPULATION 1Year Total population by sex Rural population by sex Population Provincial
(Thousands) (Thousands) Sex growth rate shareTotal Male Female Total Male Female ratio (per cent) (per cent)
1975 40526 21628 18898 30229 16078 14152 114 2.79 58.98
1980 46429 24453 21975 33746 17688 16058 111 2.70 58.00
1985 52961 27716 25245 37883 19724 18159 110 2.61 57.52
1990 60151 31320 28831 42390 21954 20436 109 2.53 57.26
1995 68021 35242 32779 47174 24299 22874 108 2.44 57.23
2000 76589 39488 37101 52206 26741 25465 106 2.35 57.42
2003 81490 42111 39380 51450 26474 24976 107 2.04 57.32
1975 15660 8332 7328 9183 4809 4374 114 3.60 22.79
1980 18576 9777 8799 10575 5468 5107 111 3.28 23.20
1985 21695 11389 10306 11993 6193 5799 111 2.96 23.56
1990 24946 13116 11830 13386 6947 6438 111 2.64 23.75
1995 28240 14861 13378 14682 7653 7029 111 2.32 23.76
2000 31474 16569 14905 15821 8276 7544 111 2.00 23.60
2003 33671 17764 15906 17829 9469 8360 112 2.10 23.68
1975 9204 4790 4414 7869 4068 3801 109 3.36 13.40
1980 10813 5632 5181 9192 4757 4435 109 3.14 13.51
1985 12568 6515 6053 10618 5468 5150 108 2.92 13.65
1990 14452 7448 7004 12131 6209 5921 106 2.70 13.76
1995 16442 8423 8019 13708 6972 6736 105 2.48 13.83
2000 18506 9420 9086 15321 7740 7581 104 2.26 13.87
2003 19708 10062 9646 16495 8386 8110 104 2.12 13.86
1975 3318 1758 1560 2781 1464 1317 113 6.97 4.83
1980 4237 2235 2002 3572 1871 1701 112 3.10 5.29
1985 4857 2574 2283 4017 2113 1904 113 2.58 5.28
1990 5496 2926 2569 4426 2339 2087 114 2.37 5.23
1995 6155 3287 2868 4808 2547 2261 115 2.17 5.18
2000 6823 3649 3174 5145 2727 2418 115 1.96 5.11
2003 7310 3908 3402 5615 3000 2615 115 2.02 5.14
1975 68708 36508 32200 50062 26419 23643 113 3.26 100.00
1980 80055 42097 37958 57085 29784 27301 111 2.92 100.00
1985 92081 48194 43887 64511 33499 31012 110 2.74 100.00
1990 105044 54810 50234 72332 37449 34883 109 2.57 100.00
1995 118857 61814 57044 80372 41472 38900 108 2.40 100.00
2000 133392 69125 64266 88493 45484 43009 108 2.23 100.00
2003 142179 73845 68335 91394 47313 44080 108 2.06 100.00
Definitions:Sex Ratio: The number of males per hundred females.Provincial Share: The percentage share in total population of Pakistan (four provinces combined).
Source:SPDC Database
P U N J A B
S I N D H
N W F P
B A L O C H I S T A N
P A K I S T A N
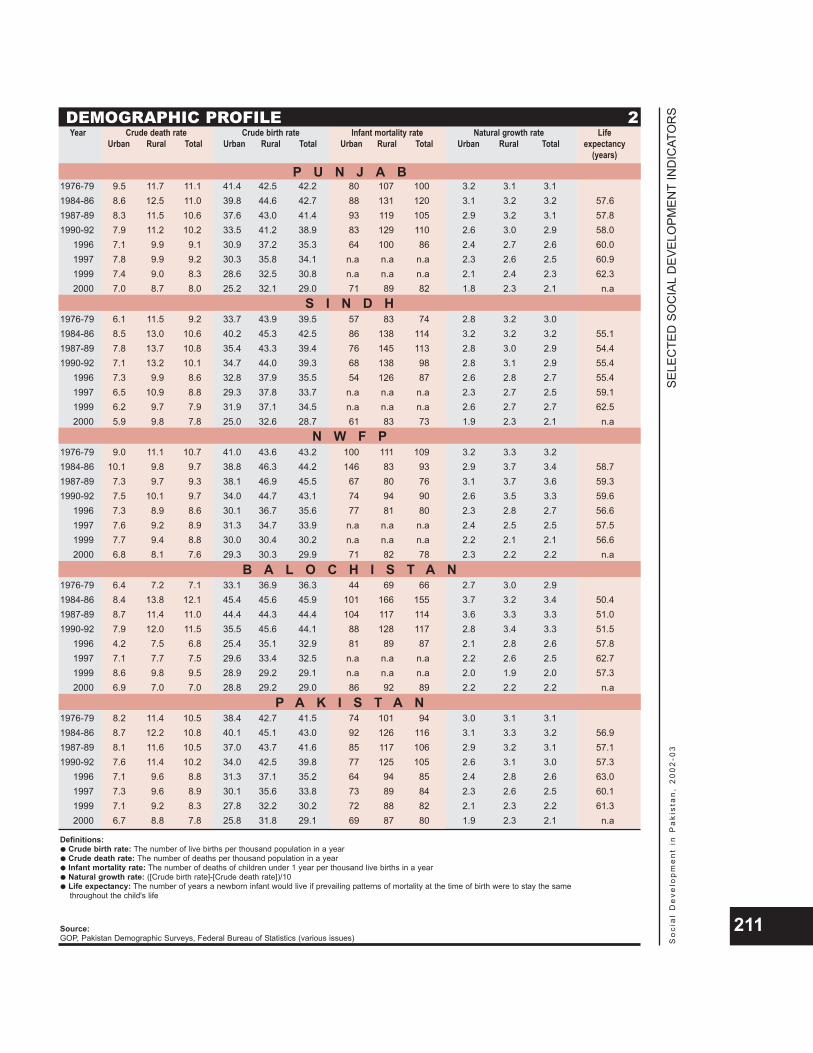
SELE
CTE
D S
OC
IAL
DEV
ELO
PMEN
TIN
DIC
ATO
RS
So
cia
l D
eve
lop
me
nt
in P
aki
sta
n,
20
02
-03
211
DEMOGRAPHIC PROFILE 2Year Crude death rate Crude birth rate Infant mortality rate Natural growth rate Life
Urban Rural Total Urban Rural Total Urban Rural Total Urban Rural Total expectancy(years)
1976-79 9.5 11.7 11.1 41.4 42.5 42.2 80 107 100 3.2 3.1 3.11984-86 8.6 12.5 11.0 39.8 44.6 42.7 88 131 120 3.1 3.2 3.2 57.61987-89 8.3 11.5 10.6 37.6 43.0 41.4 93 119 105 2.9 3.2 3.1 57.81990-92 7.9 11.2 10.2 33.5 41.2 38.9 83 129 110 2.6 3.0 2.9 58.0
1996 7.1 9.9 9.1 30.9 37.2 35.3 64 100 86 2.4 2.7 2.6 60.01997 7.8 9.9 9.2 30.3 35.8 34.1 n.a n.a n.a 2.3 2.6 2.5 60.91999 7.4 9.0 8.3 28.6 32.5 30.8 n.a n.a n.a 2.1 2.4 2.3 62.32000 7.0 8.7 8.0 25.2 32.1 29.0 71 89 82 1.8 2.3 2.1 n.a
1976-79 6.1 11.5 9.2 33.7 43.9 39.5 57 83 74 2.8 3.2 3.01984-86 8.5 13.0 10.6 40.2 45.3 42.5 86 138 114 3.2 3.2 3.2 55.11987-89 7.8 13.7 10.8 35.4 43.3 39.4 76 145 113 2.8 3.0 2.9 54.41990-92 7.1 13.2 10.1 34.7 44.0 39.3 68 138 98 2.8 3.1 2.9 55.4
1996 7.3 9.9 8.6 32.8 37.9 35.5 54 126 87 2.6 2.8 2.7 55.41997 6.5 10.9 8.8 29.3 37.8 33.7 n.a n.a n.a 2.3 2.7 2.5 59.11999 6.2 9.7 7.9 31.9 37.1 34.5 n.a n.a n.a 2.6 2.7 2.7 62.52000 5.9 9.8 7.8 25.0 32.6 28.7 61 83 73 1.9 2.3 2.1 n.a
1976-79 9.0 11.1 10.7 41.0 43.6 43.2 100 111 109 3.2 3.3 3.21984-86 10.1 9.8 9.7 38.8 46.3 44.2 146 83 93 2.9 3.7 3.4 58.71987-89 7.3 9.7 9.3 38.1 46.9 45.5 67 80 76 3.1 3.7 3.6 59.31990-92 7.5 10.1 9.7 34.0 44.7 43.1 74 94 90 2.6 3.5 3.3 59.6
1996 7.3 8.9 8.6 30.1 36.7 35.6 77 81 80 2.3 2.8 2.7 56.61997 7.6 9.2 8.9 31.3 34.7 33.9 n.a n.a n.a 2.4 2.5 2.5 57.51999 7.7 9.4 8.8 30.0 30.4 30.2 n.a n.a n.a 2.2 2.1 2.1 56.62000 6.8 8.1 7.6 29.3 30.3 29.9 71 82 78 2.3 2.2 2.2 n.a
1976-79 6.4 7.2 7.1 33.1 36.9 36.3 44 69 66 2.7 3.0 2.91984-86 8.4 13.8 12.1 45.4 45.6 45.9 101 166 155 3.7 3.2 3.4 50.41987-89 8.7 11.4 11.0 44.4 44.3 44.4 104 117 114 3.6 3.3 3.3 51.01990-92 7.9 12.0 11.5 35.5 45.6 44.1 88 128 117 2.8 3.4 3.3 51.5
1996 4.2 7.5 6.8 25.4 35.1 32.9 81 89 87 2.1 2.8 2.6 57.81997 7.1 7.7 7.5 29.6 33.4 32.5 n.a n.a n.a 2.2 2.6 2.5 62.71999 8.6 9.8 9.5 28.9 29.2 29.1 n.a n.a n.a 2.0 1.9 2.0 57.32000 6.9 7.0 7.0 28.8 29.2 29.0 86 92 89 2.2 2.2 2.2 n.a
1976-79 8.2 11.4 10.5 38.4 42.7 41.5 74 101 94 3.0 3.1 3.11984-86 8.7 12.2 10.8 40.1 45.1 43.0 92 126 116 3.1 3.3 3.2 56.91987-89 8.1 11.6 10.5 37.0 43.7 41.6 85 117 106 2.9 3.2 3.1 57.11990-92 7.6 11.4 10.2 34.0 42.5 39.8 77 125 105 2.6 3.1 3.0 57.3
1996 7.1 9.6 8.8 31.3 37.1 35.2 64 94 85 2.4 2.8 2.6 63.01997 7.3 9.6 8.9 30.1 35.6 33.8 73 89 84 2.3 2.6 2.5 60.11999 7.1 9.2 8.3 27.8 32.2 30.2 72 88 82 2.1 2.3 2.2 61.32000 6.7 8.8 7.8 25.8 31.8 29.1 69 87 80 1.9 2.3 2.1 n.a
Definitions:Crude birth rate: The number of live births per thousand population in a yearCrude death rate: The number of deaths per thousand population in a yearInfant mortality rate: The number of deaths of children under 1 year per thousand live births in a yearNatural growth rate: ([Crude birth rate]-[Crude death rate])/10Life expectancy: The number of years a newborn infant would live if prevailing patterns of mortality at the time of birth were to stay the same throughout the child's life
Source:GOP, Pakistan Demographic Surveys, Federal Bureau of Statistics (various issues)
P U N J A B
S I N D H
N W F P
B A L O C H I S T A N
P A K I S T A N
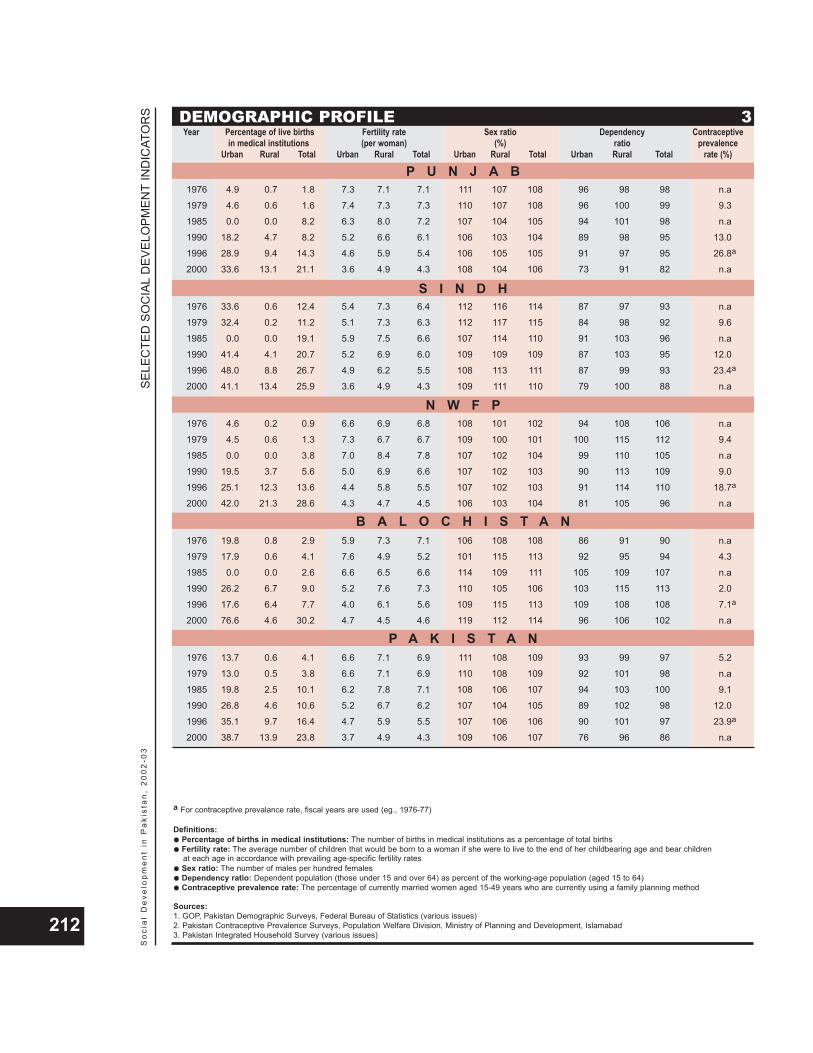
SELE
CTE
D S
OC
IAL
DEV
ELO
PMEN
TIN
DIC
ATO
RS
So
cia
l D
eve
lop
me
nt
in P
aki
sta
n,
20
02
-03
212
DEMOGRAPHIC PROFILE 3Year Percentage of live births Fertility rate Sex ratio Dependency Contraceptive
in medical institutions (per woman) (%) ratio prevalenceUrban Rural Total Urban Rural Total Urban Rural Total Urban Rural Total rate (%)
1976 4.9 0.7 1.8 7.3 7.1 7.1 111 107 108 96 98 98 n.a
1979 4.6 0.6 1.6 7.4 7.3 7.3 110 107 108 96 100 99 9.3
1985 0.0 0.0 8.2 6.3 8.0 7.2 107 104 105 94 101 98 n.a
1990 18.2 4.7 8.2 5.2 6.6 6.1 106 103 104 89 98 95 13.0
1996 28.9 9.4 14.3 4.6 5.9 5.4 106 105 105 91 97 95 26.8a
2000 33.6 13.1 21.1 3.6 4.9 4.3 108 104 106 73 91 82 n.a
1976 33.6 0.6 12.4 5.4 7.3 6.4 112 116 114 87 97 93 n.a
1979 32.4 0.2 11.2 5.1 7.3 6.3 112 117 115 84 98 92 9.6
1985 0.0 0.0 19.1 5.9 7.5 6.6 107 114 110 91 103 96 n.a
1990 41.4 4.1 20.7 5.2 6.9 6.0 109 109 109 87 103 95 12.0
1996 48.0 8.8 26.7 4.9 6.2 5.5 108 113 111 87 99 93 23.4a
2000 41.1 13.4 25.9 3.6 4.9 4.3 109 111 110 79 100 88 n.a
1976 4.6 0.2 0.9 6.6 6.9 6.8 108 101 102 94 108 106 n.a
1979 4.5 0.6 1.3 7.3 6.7 6.7 109 100 101 100 115 112 9.4
1985 0.0 0.0 3.8 7.0 8.4 7.8 107 102 104 99 110 105 n.a
1990 19.5 3.7 5.6 5.0 6.9 6.6 107 102 103 90 113 109 9.0
1996 25.1 12.3 13.6 4.4 5.8 5.5 107 102 103 91 114 110 18.7a
2000 42.0 21.3 28.6 4.3 4.7 4.5 106 103 104 81 105 96 n.a
1976 19.8 0.8 2.9 5.9 7.3 7.1 106 108 108 86 91 90 n.a
1979 17.9 0.6 4.1 7.6 4.9 5.2 101 115 113 92 95 94 4.3
1985 0.0 0.0 2.6 6.6 6.5 6.6 114 109 111 105 109 107 n.a
1990 26.2 6.7 9.0 5.2 7.6 7.3 110 105 106 103 115 113 2.0
1996 17.6 6.4 7.7 4.0 6.1 5.6 109 115 113 109 108 108 7.1a
2000 76.6 4.6 30.2 4.7 4.5 4.6 119 112 114 96 106 102 n.a
1976 13.7 0.6 4.1 6.6 7.1 6.9 111 108 109 93 99 97 5.2
1979 13.0 0.5 3.8 6.6 7.1 6.9 110 108 109 92 101 98 n.a
1985 19.8 2.5 10.1 6.2 7.8 7.1 108 106 107 94 103 100 9.1
1990 26.8 4.6 10.6 5.2 6.7 6.2 107 104 105 89 102 98 12.0
1996 35.1 9.7 16.4 4.7 5.9 5.5 107 106 106 90 101 97 23.9a
2000 38.7 13.9 23.8 3.7 4.9 4.3 109 106 107 76 96 86 n.a
a For contraceptive prevalance rate, fiscal years are used (eg., 1976-77)
Definitions:Percentage of births in medical institutions: The number of births in medical institutions as a percentage of total birthsFertility rate: The average number of children that would be born to a woman if she were to live to the end of her childbearing age and bear children at each age in accordance with prevailing age-specific fertility ratesSex ratio: The number of males per hundred femalesDependency ratio: Dependent population (those under 15 and over 64) as percent of the working-age population (aged 15 to 64)Contraceptive prevalence rate: The percentage of currently married women aged 15-49 years who are currently using a family planning method
Sources:1. GOP, Pakistan Demographic Surveys, Federal Bureau of Statistics (various issues) 2. Pakistan Contraceptive Prevalence Surveys, Population Welfare Division, Ministry of Planning and Development, Islamabad3. Pakistan Integrated Household Survey (various issues)
P U N J A B
S I N D H
N W F P
B A L O C H I S T A N
P A K I S T A N

SELE
CTE
D S
OC
IAL
DEV
ELO
PMEN
TIN
DIC
ATO
RS
So
cia
l D
eve
lop
me
nt
in P
aki
sta
n,
20
02
-03
213
EDUCATION 4Year Literacy Rate Mean years of schooling Combined enrolment rate Enrolment rate (Primary)
Male Female Total Male Female Total Male Female Total Male Female Total
1975 31.5 12.3 22.7 2.1 0.4 1.3 29.7 14.8 22.8 57.8 32.9 46.0
1980 35.6 15.7 26.3 2.7 0.6 1.7 26.9 14.9 21.2 54.5 34.1 44.8
1985 40.0 19.5 30.3 3.2 0.9 2.1 30.6 17.3 24.3 63.3 39.9 52.1
1990 45.5 24.2 35.4 3.3 1.0 2.2 36.4 23.6 30.3 74.1 53.8 64.3
1995 52.9 30.3 42.1 3.9 1.4 2.7 36.0 27.0 31.6 80.7 63.1 72.2
2001 61.8 40.0 51.1 9.0 4.7 3.5 38.2 30.7 34.5 86.1 71.2 78.9
1975 39.1 19.8 30.4 3.1 0.9 2.1 26.9 13.5 20.7 52.2 23.2 38.3
1980 39.3 21.2 31.0 3.1 0.9 2.2 29.1 14.9 22.5 58.2 25.5 42.3
1985 41.6 23.5 33.3 3.9 1.4 2.7 32.3 16.2 24.7 63.6 28.7 46.5
1990 45.6 26.9 36.9 4.4 1.5 3.0 32.5 13.1 23.3 63.7 20.8 42.9
1995 51.7 31.5 42.3 4.7 2.0 3.4 31.6 17.3 24.8 87.2 49.4 69.0
2001 57.6 37.8 48.3 10.4 5.9 4.3 34.5 24.0 29.4 73.4 50.0 62.2
1975 23.9 5.2 15.1 1.9 0.2 1.1 33.4 9.9 22.3 68.6 22.3 46.3
1980 25.3 6.2 16.3 2.5 0.4 1.5 32.1 8.9 21.3 69.9 20.5 46.1
1985 29.5 8.5 19.5 2.5 0.3 1.3 33.2 9.0 21.8 73.0 21.4 48.2
1990 36.1 12.0 24.5 2.6 0.3 1.5 43.5 12.1 28.5 93.9 27.9 62.1
1995 45.3 17.0 31.5 3.1 0.4 1.7 46.3 17.7 32.5 90.9 47.3 69.8
2001 58.0 22.7 40.4 8.0 1.7 2.5 41.1 32.9 37.2 100.1 60.9 81.3
1975 13.2 3.7 9.0 1.2 0.1 0.7 13.4 4.4 9.4 29.7 9.0 19.6
1980 14.6 4.0 9.8 1.9 0.4 1.2 13.4 4.2 9.3 30.7 8.0 19.6
1985 18.1 5.6 12.5 1.5 0.3 1.5 18.9 6.8 13.5 44.0 13.8 29.6
1990 23.1 8.2 16.3 1.9 0.3 1.1 26.0 9.1 18.4 59.9 19.9 41.2
1995 30.4 11.9 21.9 1.8 0.2 1.1 30.1 13.1 22.4 67.0 28.6 49.6
2001 42.6 18.7 31.4 5.3 1.0 1.7 31.0 19.7 25.8 65.4 47.8 57.6
1975 31.4 12.6 22.8 2.2 0.5 1.4 28.7 13.4 21.6 56.6 27.8 42.8
1980 34.0 15.1 25.2 2.7 0.6 1.8 27.3 13.5 20.8 56.2 28.5 42.8
1985 37.9 18.3 28.7 3.2 0.9 2.1 30.7 15.4 23.4 63.7 32.9 48.9
1990 43.2 22.4 33.3 3.4 1.0 2.3 35.9 18.8 27.7 73.7 40.0 57.5
1995 50.5 27.9 39.7 3.9 1.4 2.7 36.1 22.7 29.6 82.9 55.6 69.8
2001 63.0 38.0 50.5 8.2 3.4 3.0 37.3 28.9 33.2 83.9 63.5 74.2
Notes:1. Figures for Pakistan represent the four provinces combined2. Literacy rate is estimated using 1998 population census3. Primary and secondary school enrolment represents enrolment in the government sector only4. Tertiary enrolment is the sum of intermediate college, degree college, and university enrolment5. Degree college enrolment is the sum of general degree college, post graduate college and professional degree college enrolment
Definitions:Literacy rate: The number of literate persons as a percentage of population aged 10 and aboveMean year of schooling: Average number of years of schooling received per person aged 25 and aboveCombined enrolment rate: The number of students enroled in all levels as a percentage of the population aged 5 to 24Enrolment rate (primary): The number of students enroled in primary level classes (I to V) as a percentage of the population aged 5 to 9
Sources:1. Development Statistics of Provincial Governments (various issues)2. Education Statistics of Provincial Governments (various issues)3. GOP, Pakistan School Statistics, Central Bureau of Education (various issues)4. GOP, Pakistan Education Statistics, Central Bureau of Education (various issues)5. National and Provincial Education Management Information Systems (various issues)6. GOP, Labour Force Survey, Federal Bureau of Statistics (various issues)7. GOP, Census Report of Pakistan, Population Census Organization (various issues)8. Facts & Figures Pakistan 2002, Ministry of Education, EFA Wing
P U N J A B
S I N D H
N W F P
B A L O C H I S T A N
P A K I S T A N
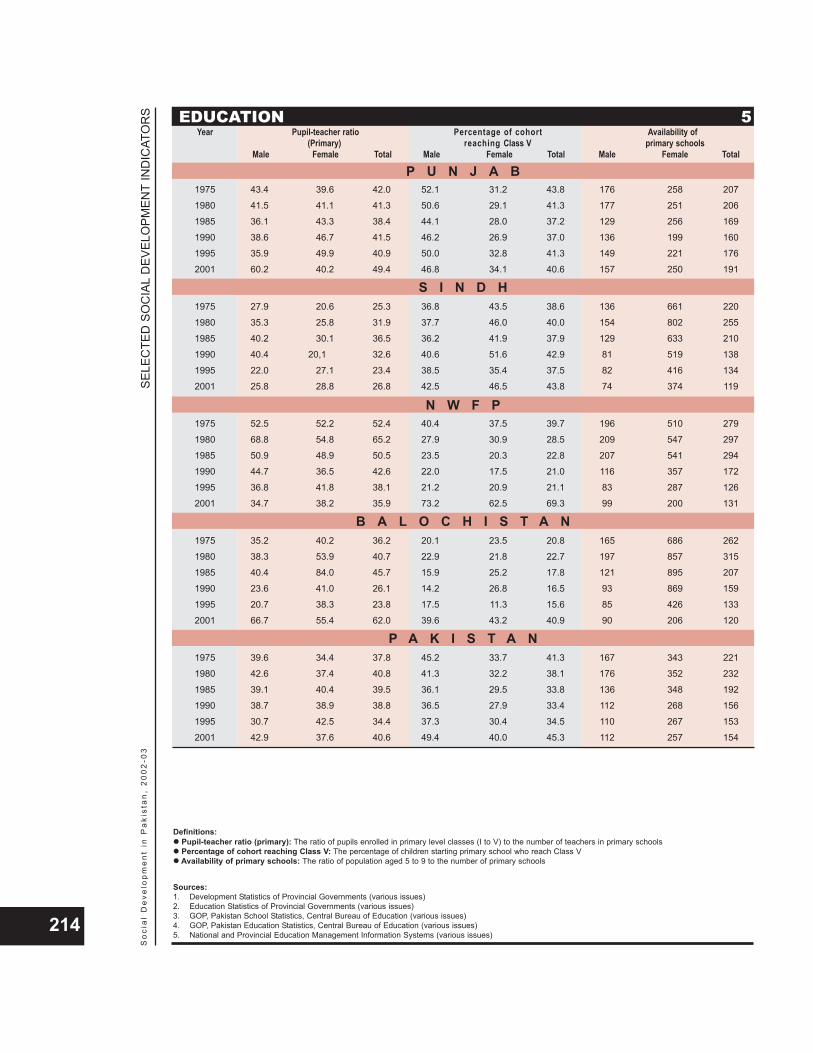
SELE
CTE
D S
OC
IAL
DEV
ELO
PMEN
TIN
DIC
ATO
RS
So
cia
l D
eve
lop
me
nt
in P
aki
sta
n,
20
02
-03
214
EDUCATION 5Year Pupil-teacher ratio Percentage of cohort Availability of
(Primary) reaching Class V primary schoolsMale Female Total Male Female Total Male Female Total
1975 43.4 39.6 42.0 52.1 31.2 43.8 176 258 207
1980 41.5 41.1 41.3 50.6 29.1 41.3 177 251 206
1985 36.1 43.3 38.4 44.1 28.0 37.2 129 256 169
1990 38.6 46.7 41.5 46.2 26.9 37.0 136 199 160
1995 35.9 49.9 40.9 50.0 32.8 41.3 149 221 176
2001 60.2 40.2 49.4 46.8 34.1 40.6 157 250 191
1975 27.9 20.6 25.3 36.8 43.5 38.6 136 661 220
1980 35.3 25.8 31.9 37.7 46.0 40.0 154 802 255
1985 40.2 30.1 36.5 36.2 41.9 37.9 129 633 210
1990 40.4 20,1 32.6 40.6 51.6 42.9 81 519 138
1995 22.0 27.1 23.4 38.5 35.4 37.5 82 416 134
2001 25.8 28.8 26.8 42.5 46.5 43.8 74 374 119
1975 52.5 52.2 52.4 40.4 37.5 39.7 196 510 279
1980 68.8 54.8 65.2 27.9 30.9 28.5 209 547 297
1985 50.9 48.9 50.5 23.5 20.3 22.8 207 541 294
1990 44.7 36.5 42.6 22.0 17.5 21.0 116 357 172
1995 36.8 41.8 38.1 21.2 20.9 21.1 83 287 126
2001 34.7 38.2 35.9 73.2 62.5 69.3 99 200 131
1975 35.2 40.2 36.2 20.1 23.5 20.8 165 686 262
1980 38.3 53.9 40.7 22.9 21.8 22.7 197 857 315
1985 40.4 84.0 45.7 15.9 25.2 17.8 121 895 207
1990 23.6 41.0 26.1 14.2 26.8 16.5 93 869 159
1995 20.7 38.3 23.8 17.5 11.3 15.6 85 426 133
2001 66.7 55.4 62.0 39.6 43.2 40.9 90 206 120
1975 39.6 34.4 37.8 45.2 33.7 41.3 167 343 221
1980 42.6 37.4 40.8 41.3 32.2 38.1 176 352 232
1985 39.1 40.4 39.5 36.1 29.5 33.8 136 348 192
1990 38.7 38.9 38.8 36.5 27.9 33.4 112 268 156
1995 30.7 42.5 34.4 37.3 30.4 34.5 110 267 153
2001 42.9 37.6 40.6 49.4 40.0 45.3 112 257 154
Definitions:Pupil-teacher ratio (primary): The ratio of pupils enrolled in primary level classes (I to V) to the number of teachers in primary schoolsPercentage of cohort reaching Class V: The percentage of children starting primary school who reach Class VAvailability of primary schools: The ratio of population aged 5 to 9 to the number of primary schools
Sources:1. Development Statistics of Provincial Governments (various issues)2. Education Statistics of Provincial Governments (various issues)3. GOP, Pakistan School Statistics, Central Bureau of Education (various issues)4. GOP, Pakistan Education Statistics, Central Bureau of Education (various issues)5. National and Provincial Education Management Information Systems (various issues)
P U N J A B
S I N D H
N W F P
B A L O C H I S T A N
P A K I S T A N
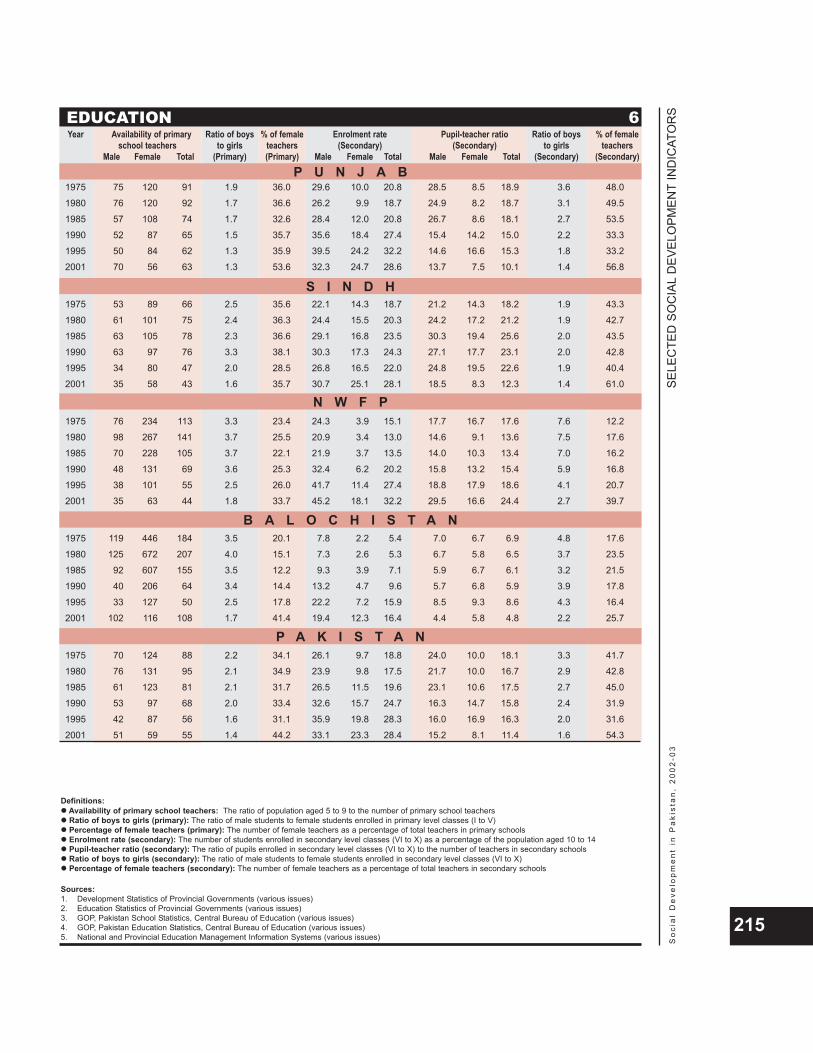
SELE
CTE
D S
OC
IAL
DEV
ELO
PMEN
TIN
DIC
ATO
RS
So
cia
l D
eve
lop
me
nt
in P
aki
sta
n,
20
02
-03
215
EDUCATION 6Year Availability of primary Ratio of boys % of female Enrolment rate Pupil-teacher ratio Ratio of boys % of female
school teachers to girls teachers (Secondary) (Secondary) to girls teachersMale Female Total (Primary) (Primary) Male Female Total Male Female Total (Secondary) (Secondary)
1975 75 120 91 1.9 36.0 29.6 10.0 20.8 28.5 8.5 18.9 3.6 48.0
1980 76 120 92 1.7 36.6 26.2 9.9 18.7 24.9 8.2 18.7 3.1 49.5
1985 57 108 74 1.7 32.6 28.4 12.0 20.8 26.7 8.6 18.1 2.7 53.5
1990 52 87 65 1.5 35.7 35.6 18.4 27.4 15.4 14.2 15.0 2.2 33.3
1995 50 84 62 1.3 35.9 39.5 24.2 32.2 14.6 16.6 15.3 1.8 33.2
2001 70 56 63 1.3 53.6 32.3 24.7 28.6 13.7 7.5 10.1 1.4 56.8
1975 53 89 66 2.5 35.6 22.1 14.3 18.7 21.2 14.3 18.2 1.9 43.3
1980 61 101 75 2.4 36.3 24.4 15.5 20.3 24.2 17.2 21.2 1.9 42.7
1985 63 105 78 2.3 36.6 29.1 16.8 23.5 30.3 19.4 25.6 2.0 43.5
1990 63 97 76 3.3 38.1 30.3 17.3 24.3 27.1 17.7 23.1 2.0 42.8
1995 34 80 47 2.0 28.5 26.8 16.5 22.0 24.8 19.5 22.6 1.9 40.4
2001 35 58 43 1.6 35.7 30.7 25.1 28.1 18.5 8.3 12.3 1.4 61.0
1975 76 234 113 3.3 23.4 24.3 3.9 15.1 17.7 16.7 17.6 7.6 12.2
1980 98 267 141 3.7 25.5 20.9 3.4 13.0 14.6 9.1 13.6 7.5 17.6
1985 70 228 105 3.7 22.1 21.9 3.7 13.5 14.0 10.3 13.4 7.0 16.2
1990 48 131 69 3.6 25.3 32.4 6.2 20.2 15.8 13.2 15.4 5.9 16.8
1995 38 101 55 2.5 26.0 41.7 11.4 27.4 18.8 17.9 18.6 4.1 20.7
2001 35 63 44 1.8 33.7 45.2 18.1 32.2 29.5 16.6 24.4 2.7 39.7
1975 119 446 184 3.5 20.1 7.8 2.2 5.4 7.0 6.7 6.9 4.8 17.6
1980 125 672 207 4.0 15.1 7.3 2.6 5.3 6.7 5.8 6.5 3.7 23.5
1985 92 607 155 3.5 12.2 9.3 3.9 7.1 5.9 6.7 6.1 3.2 21.5
1990 40 206 64 3.4 14.4 13.2 4.7 9.6 5.7 6.8 5.9 3.9 17.8
1995 33 127 50 2.5 17.8 22.2 7.2 15.9 8.5 9.3 8.6 4.3 16.4
2001 102 116 108 1.7 41.4 19.4 12.3 16.4 4.4 5.8 4.8 2.2 25.7
1975 70 124 88 2.2 34.1 26.1 9.7 18.8 24.0 10.0 18.1 3.3 41.7
1980 76 131 95 2.1 34.9 23.9 9.8 17.5 21.7 10.0 16.7 2.9 42.8
1985 61 123 81 2.1 31.7 26.5 11.5 19.6 23.1 10.6 17.5 2.7 45.0
1990 53 97 68 2.0 33.4 32.6 15.7 24.7 16.3 14.7 15.8 2.4 31.9
1995 42 87 56 1.6 31.1 35.9 19.8 28.3 16.0 16.9 16.3 2.0 31.6
2001 51 59 55 1.4 44.2 33.1 23.3 28.4 15.2 8.1 11.4 1.6 54.3
Definitions:Availability of primary school teachers: The ratio of population aged 5 to 9 to the number of primary school teachersRatio of boys to girls (primary): The ratio of male students to female students enrolled in primary level classes (I to V)Percentage of female teachers (primary): The number of female teachers as a percentage of total teachers in primary schoolsEnrolment rate (secondary): The number of students enrolled in secondary level classes (VI to X) as a percentage of the population aged 10 to 14Pupil-teacher ratio (secondary): The ratio of pupils enrolled in secondary level classes (VI to X) to the number of teachers in secondary schoolsRatio of boys to girls (secondary): The ratio of male students to female students enrolled in secondary level classes (VI to X)Percentage of female teachers (secondary): The number of female teachers as a percentage of total teachers in secondary schools
Sources:1. Development Statistics of Provincial Governments (various issues)2. Education Statistics of Provincial Governments (various issues)3. GOP, Pakistan School Statistics, Central Bureau of Education (various issues)4. GOP, Pakistan Education Statistics, Central Bureau of Education (various issues)5. National and Provincial Education Management Information Systems (various issues)
P U N J A B
S I N D H
N W F P
B A L O C H I S T A N
P A K I S T A N
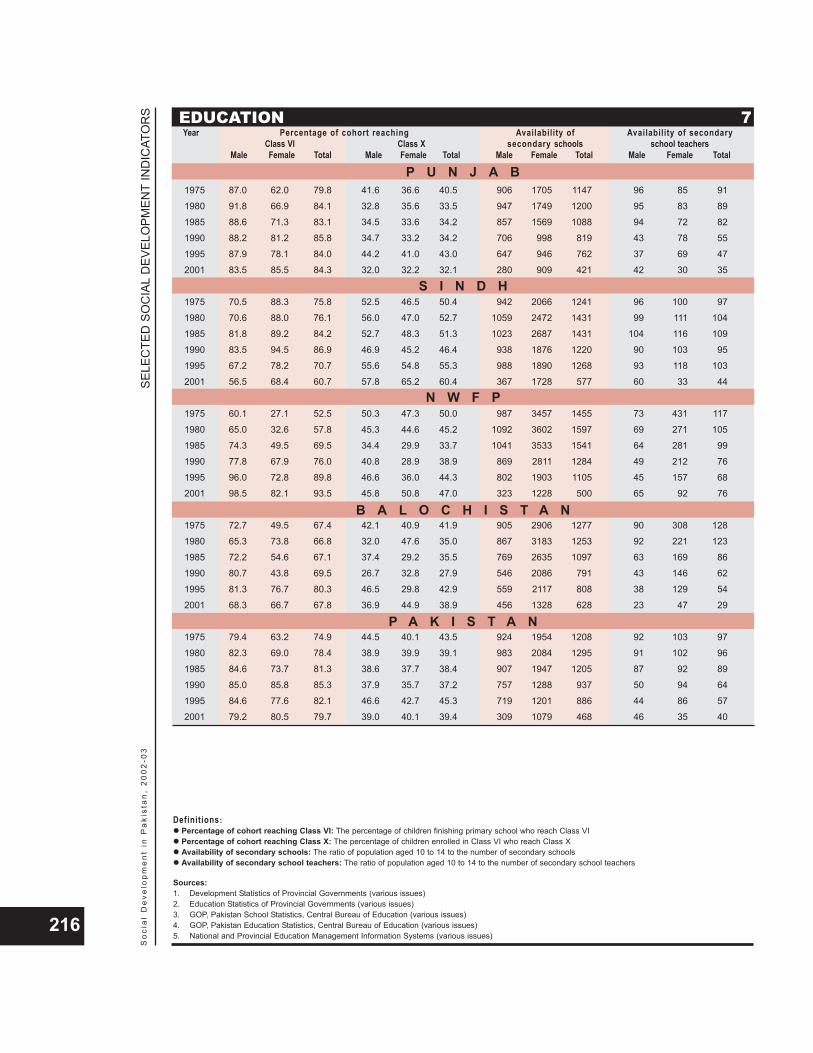
SELE
CTE
D S
OC
IAL
DEV
ELO
PMEN
TIN
DIC
ATO
RS
So
cia
l D
eve
lop
me
nt
in P
aki
sta
n,
20
02
-03
216
EDUCATION 7Year Percentage of cohort reaching Availability of Availability of secondary
Class VI Class X secondary schools school teachersMale Female Total Male Female Total Male Female Total Male Female Total
1975 87.0 62.0 79.8 41.6 36.6 40.5 906 1705 1147 96 85 91
1980 91.8 66.9 84.1 32.8 35.6 33.5 947 1749 1200 95 83 89
1985 88.6 71.3 83.1 34.5 33.6 34.2 857 1569 1088 94 72 82
1990 88.2 81.2 85.8 34.7 33.2 34.2 706 998 819 43 78 55
1995 87.9 78.1 84.0 44.2 41.0 43.0 647 946 762 37 69 47
2001 83.5 85.5 84.3 32.0 32.2 32.1 280 909 421 42 30 35
1975 70.5 88.3 75.8 52.5 46.5 50.4 942 2066 1241 96 100 97
1980 70.6 88.0 76.1 56.0 47.0 52.7 1059 2472 1431 99 111 104
1985 81.8 89.2 84.2 52.7 48.3 51.3 1023 2687 1431 104 116 109
1990 83.5 94.5 86.9 46.9 45.2 46.4 938 1876 1220 90 103 95
1995 67.2 78.2 70.7 55.6 54.8 55.3 988 1890 1268 93 118 103
2001 56.5 68.4 60.7 57.8 65.2 60.4 367 1728 577 60 33 44
1975 60.1 27.1 52.5 50.3 47.3 50.0 987 3457 1455 73 431 117
1980 65.0 32.6 57.8 45.3 44.6 45.2 1092 3602 1597 69 271 105
1985 74.3 49.5 69.5 34.4 29.9 33.7 1041 3533 1541 64 281 99
1990 77.8 67.9 76.0 40.8 28.9 38.9 869 2811 1284 49 212 76
1995 96.0 72.8 89.8 46.6 36.0 44.3 802 1903 1105 45 157 68
2001 98.5 82.1 93.5 45.8 50.8 47.0 323 1228 500 65 92 76
1975 72.7 49.5 67.4 42.1 40.9 41.9 905 2906 1277 90 308 128
1980 65.3 73.8 66.8 32.0 47.6 35.0 867 3183 1253 92 221 123
1985 72.2 54.6 67.1 37.4 29.2 35.5 769 2635 1097 63 169 86
1990 80.7 43.8 69.5 26.7 32.8 27.9 546 2086 791 43 146 62
1995 81.3 76.7 80.3 46.5 29.8 42.9 559 2117 808 38 129 54
2001 68.3 66.7 67.8 36.9 44.9 38.9 456 1328 628 23 47 29
1975 79.4 63.2 74.9 44.5 40.1 43.5 924 1954 1208 92 103 97
1980 82.3 69.0 78.4 38.9 39.9 39.1 983 2084 1295 91 102 96
1985 84.6 73.7 81.3 38.6 37.7 38.4 907 1947 1205 87 92 89
1990 85.0 85.8 85.3 37.9 35.7 37.2 757 1288 937 50 94 64
1995 84.6 77.6 82.1 46.6 42.7 45.3 719 1201 886 44 86 57
2001 79.2 80.5 79.7 39.0 40.1 39.4 309 1079 468 46 35 40
Definitions:Percentage of cohort reaching Class VI: The percentage of children finishing primary school who reach Class VIPercentage of cohort reaching Class X: The percentage of children enrolled in Class VI who reach Class XAvailability of secondary schools: The ratio of population aged 10 to 14 to the number of secondary schoolsAvailability of secondary school teachers: The ratio of population aged 10 to 14 to the number of secondary school teachers
Sources:1. Development Statistics of Provincial Governments (various issues)2. Education Statistics of Provincial Governments (various issues)3. GOP, Pakistan School Statistics, Central Bureau of Education (various issues)4. GOP, Pakistan Education Statistics, Central Bureau of Education (various issues)5. National and Provincial Education Management Information Systems (various issues)
P U N J A B
S I N D H
N W F P
B A L O C H I S T A N
P A K I S T A N

SELE
CTE
D S
OC
IAL
DEV
ELO
PMEN
TIN
DIC
ATO
RS
So
cia
l D
eve
lop
me
nt
in P
aki
sta
n,
20
02
-03
217
HEALTH 8Year P o p u l a t i o n ( i n t h o u s a n d s ) p e r
Hospital Doctor Doctor Other medical Nurse Paramedic Rural healthbed (Total) (Female) personnel facility
1975 2.6 14.0 27.0 11.3 12.1 10.6 414
1980 2.3 9.4 19.4 9.3 9.3 9.4 218
1985 2.1 4.1 8.7 7.6 5.6 9.6 92
1990 2.1 2.7 5.6 7.6 3.8 11.3 61
1995 2.2 2.4 4.4 7.9 3.3 12.5 62
2000 2.3 2.1 3.2 n.a. 2.6 n.a. 62
1975 3.1 7.9 11.9 39.5 59.3 19.7 340
1980 2.9 5.0 8.0 25.4 32.9 17.8 200
1985 2.9 1.9 3.0 25.8 35.7 15.9 180
1990 2.7 1.2 1.9 19.6 29.8 9.4 95
1995 2.8 1.0 1.5 14.5 22.1 6.8 71
2000 2.9 0.8 1.0 21.9 14.1 6.3 72
1975 1.6 8.7 26.1 17.2 29.0 5.5 437
1980 1.7 6.2 18.7 22.6 40.2 5.0 255
1985 1.5 3.6 10.3 7.0 11.5 2.5 76
1990 1.5 2.6 6.7 9.3 15.8 2.7 65
1995 1.6 2.2 5.0 6.0 9.1 2.9 63
2000 1.6 2.0 3.9 n.a. 6.2 n.a. 65
1975 2.9 19.5 30.0 14.6 24.9 4.3 253
1980 2.2 11.4 22.5 22.5 41.1 3.8 255
1985 1.9 4.7 11.5 17.0 30.9 3.0 122
1990 1.8 3.5 7.8 13.1 23.9 2.2 38
1995 1.7 2.8 5.7 13.1 24.4 1.8 35
2000 1.6 2.4 3.8 6.3 16.6 n.a. 35
1975 2.5 11.2 21.0 13.3 16.9 9.7 388
1980 2.3 7.4 14.6 11.0 13.5 8.6 221
1985 2.1 3.1 6.2 7.5 8.2 6.8 99
1990 2.1 2.1 4.0 6.3 5.9 6.7 64
1995 2.1 1.8 3.1 5.7 5.0 6.4 61
2000 2.2 1.5 2.2 n.a. 3.8 n.a. 62
Notes:1. Number of nurses and paramedics of provincial governments only2. Data representing institutions run by armed forces and private sector are not included
Definitions:Hospital Bed: Total population in thousands divided by total number of beds in hospitals and dispensaries.Doctor (total): Total population in thousands divided by total number of registered medical doctors.Doctor (female): The female population in thousands divided by total number of registered female medical doctors.Nurse: Total population in thousands divided by the total number of nurses.Paramedic: Total population in thousands divided by the total number of paramedic personnel;Rural Health Facilities: Rural population in thousands divided by [No. of RHCs] + [No. of BHUs/5].
Sources:1. Pakistan Statistical Yearbook (various issues)2. Pakistan Medical and Dental Council, Islamabad3. Development Statistics of Provincial Government (various issues)4. Pakistan Nursing Council, Islamabad
P U N J A B
S I N D H
N W F P
B A L O C H I S T A N
P A K I S T A N
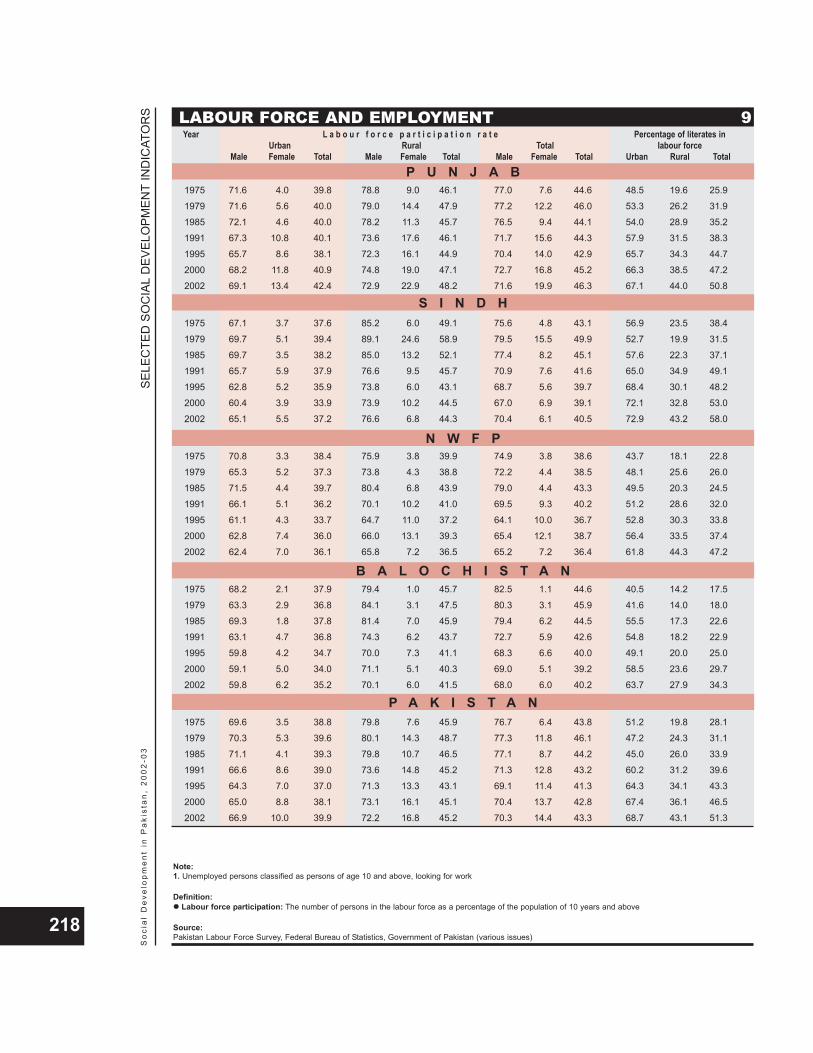
SELE
CTE
D S
OC
IAL
DEV
ELO
PMEN
TIN
DIC
ATO
RS
So
cia
l D
eve
lop
me
nt
in P
aki
sta
n,
20
02
-03
218
LABOUR FORCE AND EMPLOYMENT 9Year L a b o u r f o r c e p a r t i c i p a t i o n r a t e Percentage of literates in
Urban Rural Total Iabour forceMale Female Total Male Female Total Male Female Total Urban Rural Total
1975 71.6 4.0 39.8 78.8 9.0 46.1 77.0 7.6 44.6 48.5 19.6 25.9
1979 71.6 5.6 40.0 79.0 14.4 47.9 77.2 12.2 46.0 53.3 26.2 31.9
1985 72.1 4.6 40.0 78.2 11.3 45.7 76.5 9.4 44.1 54.0 28.9 35.2
1991 67.3 10.8 40.1 73.6 17.6 46.1 71.7 15.6 44.3 57.9 31.5 38.3
1995 65.7 8.6 38.1 72.3 16.1 44.9 70.4 14.0 42.9 65.7 34.3 44.7
2000 68.2 11.8 40.9 74.8 19.0 47.1 72.7 16.8 45.2 66.3 38.5 47.2
2002 69.1 13.4 42.4 72.9 22.9 48.2 71.6 19.9 46.3 67.1 44.0 50.8
1975 67.1 3.7 37.6 85.2 6.0 49.1 75.6 4.8 43.1 56.9 23.5 38.4
1979 69.7 5.1 39.4 89.1 24.6 58.9 79.5 15.5 49.9 52.7 19.9 31.5
1985 69.7 3.5 38.2 85.0 13.2 52.1 77.4 8.2 45.1 57.6 22.3 37.1
1991 65.7 5.9 37.9 76.6 9.5 45.7 70.9 7.6 41.6 65.0 34.9 49.1
1995 62.8 5.2 35.9 73.8 6.0 43.1 68.7 5.6 39.7 68.4 30.1 48.2
2000 60.4 3.9 33.9 73.9 10.2 44.5 67.0 6.9 39.1 72.1 32.8 53.0
2002 65.1 5.5 37.2 76.6 6.8 44.3 70.4 6.1 40.5 72.9 43.2 58.0
1975 70.8 3.3 38.4 75.9 3.8 39.9 74.9 3.8 38.6 43.7 18.1 22.8
1979 65.3 5.2 37.3 73.8 4.3 38.8 72.2 4.4 38.5 48.1 25.6 26.0
1985 71.5 4.4 39.7 80.4 6.8 43.9 79.0 4.4 43.3 49.5 20.3 24.5
1991 66.1 5.1 36.2 70.1 10.2 41.0 69.5 9.3 40.2 51.2 28.6 32.0
1995 61.1 4.3 33.7 64.7 11.0 37.2 64.1 10.0 36.7 52.8 30.3 33.8
2000 62.8 7.4 36.0 66.0 13.1 39.3 65.4 12.1 38.7 56.4 33.5 37.4
2002 62.4 7.0 36.1 65.8 7.2 36.5 65.2 7.2 36.4 61.8 44.3 47.2
1975 68.2 2.1 37.9 79.4 1.0 45.7 82.5 1.1 44.6 40.5 14.2 17.5
1979 63.3 2.9 36.8 84.1 3.1 47.5 80.3 3.1 45.9 41.6 14.0 18.0
1985 69.3 1.8 37.8 81.4 7.0 45.9 79.4 6.2 44.5 55.5 17.3 22.6
1991 63.1 4.7 36.8 74.3 6.2 43.7 72.7 5.9 42.6 54.8 18.2 22.9
1995 59.8 4.2 34.7 70.0 7.3 41.1 68.3 6.6 40.0 49.1 20.0 25.0
2000 59.1 5.0 34.0 71.1 5.1 40.3 69.0 5.1 39.2 58.5 23.6 29.7
2002 59.8 6.2 35.2 70.1 6.0 41.5 68.0 6.0 40.2 63.7 27.9 34.3
1975 69.6 3.5 38.8 79.8 7.6 45.9 76.7 6.4 43.8 51.2 19.8 28.1
1979 70.3 5.3 39.6 80.1 14.3 48.7 77.3 11.8 46.1 47.2 24.3 31.1
1985 71.1 4.1 39.3 79.8 10.7 46.5 77.1 8.7 44.2 45.0 26.0 33.9
1991 66.6 8.6 39.0 73.6 14.8 45.2 71.3 12.8 43.2 60.2 31.2 39.6
1995 64.3 7.0 37.0 71.3 13.3 43.1 69.1 11.4 41.3 64.3 34.1 43.3
2000 65.0 8.8 38.1 73.1 16.1 45.1 70.4 13.7 42.8 67.4 36.1 46.5
2002 66.9 10.0 39.9 72.2 16.8 45.2 70.3 14.4 43.3 68.7 43.1 51.3
Note:1. Unemployed persons classified as persons of age 10 and above, looking for work
Definition:Labour force participation: The number of persons in the labour force as a percentage of the population of 10 years and above
Source:Pakistan Labour Force Survey, Federal Bureau of Statistics, Government of Pakistan (various issues)
P U N J A B
S I N D H
N W F P
B A L O C H I S T A N
P A K I S T A N
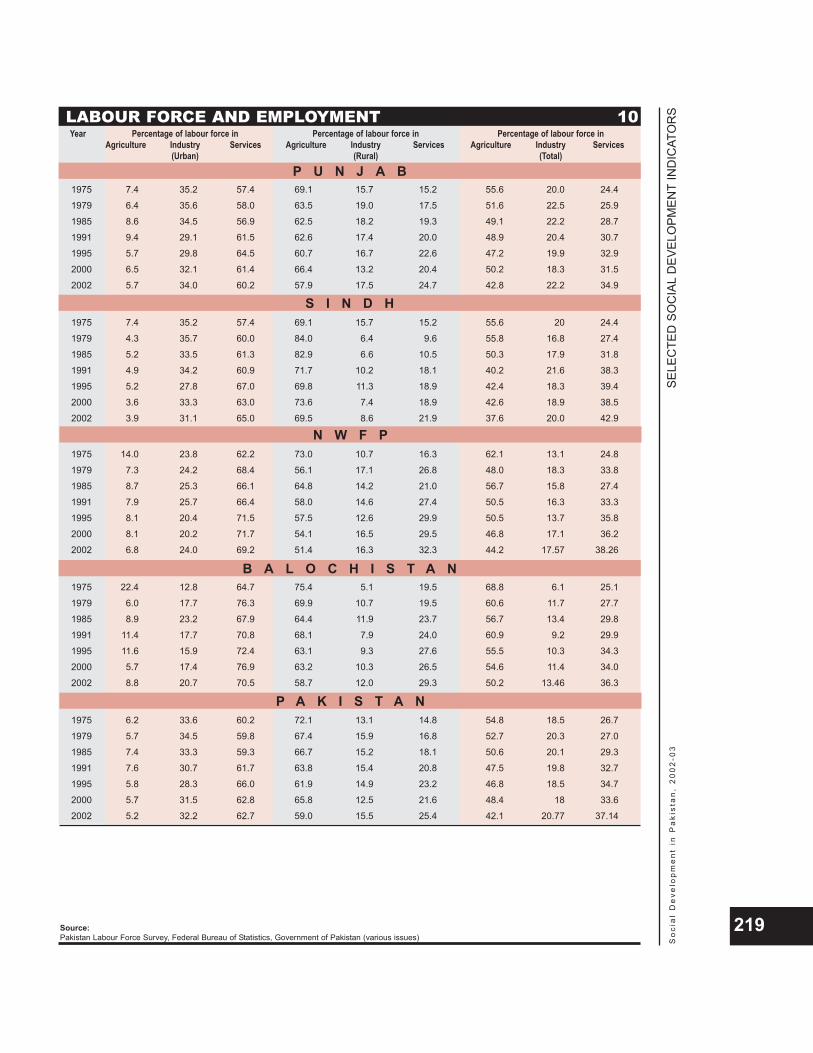
SELE
CTE
D S
OC
IAL
DEV
ELO
PMEN
TIN
DIC
ATO
RS
So
cia
l D
eve
lop
me
nt
in P
aki
sta
n,
20
02
-03
219
LABOUR FORCE AND EMPLOYMENT 10Year Percentage of labour force in Percentage of labour force in Percentage of labour force in
Agriculture Industry Services Agriculture Industry Services Agriculture Industry Services(Urban) (Rural) (Total)
1975 7.4 35.2 57.4 69.1 15.7 15.2 55.6 20.0 24.4
1979 6.4 35.6 58.0 63.5 19.0 17.5 51.6 22.5 25.9
1985 8.6 34.5 56.9 62.5 18.2 19.3 49.1 22.2 28.7
1991 9.4 29.1 61.5 62.6 17.4 20.0 48.9 20.4 30.7
1995 5.7 29.8 64.5 60.7 16.7 22.6 47.2 19.9 32.9
2000 6.5 32.1 61.4 66.4 13.2 20.4 50.2 18.3 31.5
2002 5.7 34.0 60.2 57.9 17.5 24.7 42.8 22.2 34.9
1975 7.4 35.2 57.4 69.1 15.7 15.2 55.6 20 24.4
1979 4.3 35.7 60.0 84.0 6.4 9.6 55.8 16.8 27.4
1985 5.2 33.5 61.3 82.9 6.6 10.5 50.3 17.9 31.8
1991 4.9 34.2 60.9 71.7 10.2 18.1 40.2 21.6 38.3
1995 5.2 27.8 67.0 69.8 11.3 18.9 42.4 18.3 39.4
2000 3.6 33.3 63.0 73.6 7.4 18.9 42.6 18.9 38.5
2002 3.9 31.1 65.0 69.5 8.6 21.9 37.6 20.0 42.9
1975 14.0 23.8 62.2 73.0 10.7 16.3 62.1 13.1 24.8
1979 7.3 24.2 68.4 56.1 17.1 26.8 48.0 18.3 33.8
1985 8.7 25.3 66.1 64.8 14.2 21.0 56.7 15.8 27.4
1991 7.9 25.7 66.4 58.0 14.6 27.4 50.5 16.3 33.3
1995 8.1 20.4 71.5 57.5 12.6 29.9 50.5 13.7 35.8
2000 8.1 20.2 71.7 54.1 16.5 29.5 46.8 17.1 36.2
2002 6.8 24.0 69.2 51.4 16.3 32.3 44.2 17.57 38.26
1975 22.4 12.8 64.7 75.4 5.1 19.5 68.8 6.1 25.1
1979 6.0 17.7 76.3 69.9 10.7 19.5 60.6 11.7 27.7
1985 8.9 23.2 67.9 64.4 11.9 23.7 56.7 13.4 29.8
1991 11.4 17.7 70.8 68.1 7.9 24.0 60.9 9.2 29.9
1995 11.6 15.9 72.4 63.1 9.3 27.6 55.5 10.3 34.3
2000 5.7 17.4 76.9 63.2 10.3 26.5 54.6 11.4 34.0
2002 8.8 20.7 70.5 58.7 12.0 29.3 50.2 13.46 36.3
1975 6.2 33.6 60.2 72.1 13.1 14.8 54.8 18.5 26.7
1979 5.7 34.5 59.8 67.4 15.9 16.8 52.7 20.3 27.0
1985 7.4 33.3 59.3 66.7 15.2 18.1 50.6 20.1 29.3
1991 7.6 30.7 61.7 63.8 15.4 20.8 47.5 19.8 32.7
1995 5.8 28.3 66.0 61.9 14.9 23.2 46.8 18.5 34.7
2000 5.7 31.5 62.8 65.8 12.5 21.6 48.4 18 33.6
2002 5.2 32.2 62.7 59.0 15.5 25.4 42.1 20.77 37.14
Source:Pakistan Labour Force Survey, Federal Bureau of Statistics, Government of Pakistan (various issues)
P U N J A B
S I N D H
N W F P
B A L O C H I S T A N
P A K I S T A N
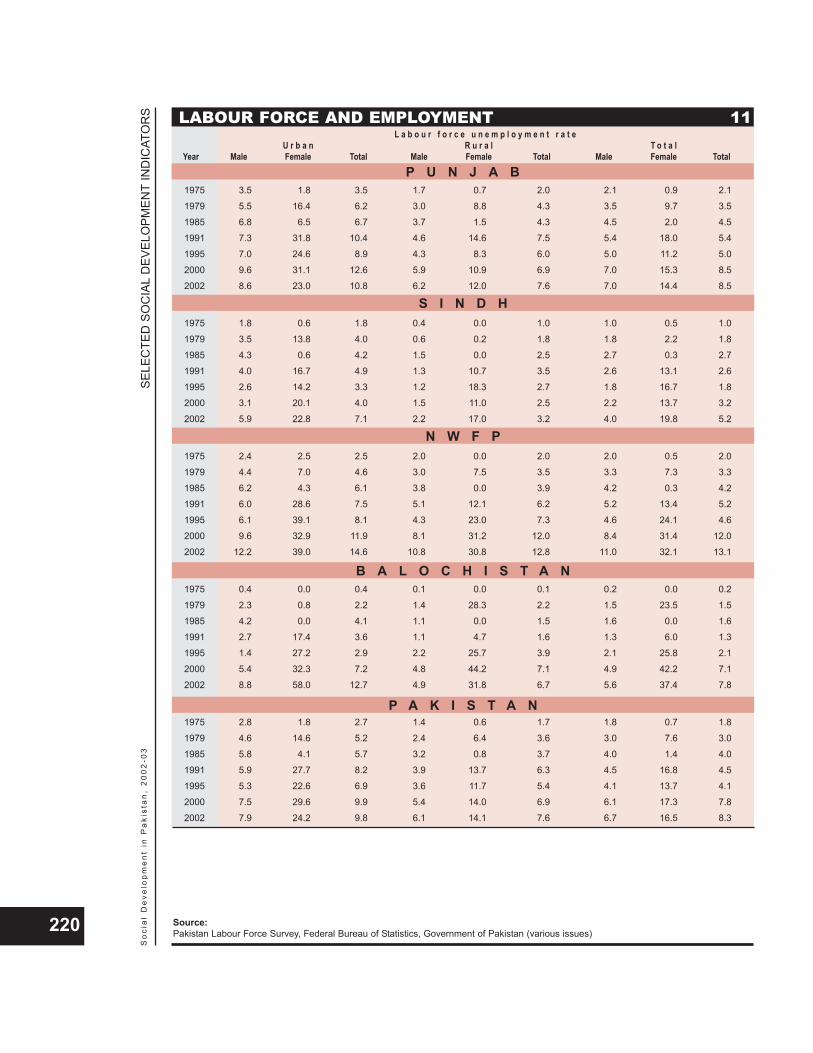
SELE
CTE
D S
OC
IAL
DEV
ELO
PMEN
TIN
DIC
ATO
RS
So
cia
l D
eve
lop
me
nt
in P
aki
sta
n,
20
02
-03
220
LABOUR FORCE AND EMPLOYMENT 11L a b o u r f o r c e u n e m p l o y m e n t r a t e
U r b a n R u r a l T o t a lYear Male Female Total Male Female Total Male Female Total
1975 3.5 1.8 3.5 1.7 0.7 2.0 2.1 0.9 2.1
1979 5.5 16.4 6.2 3.0 8.8 4.3 3.5 9.7 3.5
1985 6.8 6.5 6.7 3.7 1.5 4.3 4.5 2.0 4.5
1991 7.3 31.8 10.4 4.6 14.6 7.5 5.4 18.0 5.4
1995 7.0 24.6 8.9 4.3 8.3 6.0 5.0 11.2 5.0
2000 9.6 31.1 12.6 5.9 10.9 6.9 7.0 15.3 8.5
2002 8.6 23.0 10.8 6.2 12.0 7.6 7.0 14.4 8.5
1975 1.8 0.6 1.8 0.4 0.0 1.0 1.0 0.5 1.0
1979 3.5 13.8 4.0 0.6 0.2 1.8 1.8 2.2 1.8
1985 4.3 0.6 4.2 1.5 0.0 2.5 2.7 0.3 2.7
1991 4.0 16.7 4.9 1.3 10.7 3.5 2.6 13.1 2.6
1995 2.6 14.2 3.3 1.2 18.3 2.7 1.8 16.7 1.8
2000 3.1 20.1 4.0 1.5 11.0 2.5 2.2 13.7 3.2
2002 5.9 22.8 7.1 2.2 17.0 3.2 4.0 19.8 5.2
1975 2.4 2.5 2.5 2.0 0.0 2.0 2.0 0.5 2.0
1979 4.4 7.0 4.6 3.0 7.5 3.5 3.3 7.3 3.3
1985 6.2 4.3 6.1 3.8 0.0 3.9 4.2 0.3 4.2
1991 6.0 28.6 7.5 5.1 12.1 6.2 5.2 13.4 5.2
1995 6.1 39.1 8.1 4.3 23.0 7.3 4.6 24.1 4.6
2000 9.6 32.9 11.9 8.1 31.2 12.0 8.4 31.4 12.0
2002 12.2 39.0 14.6 10.8 30.8 12.8 11.0 32.1 13.1
1975 0.4 0.0 0.4 0.1 0.0 0.1 0.2 0.0 0.2
1979 2.3 0.8 2.2 1.4 28.3 2.2 1.5 23.5 1.5
1985 4.2 0.0 4.1 1.1 0.0 1.5 1.6 0.0 1.6
1991 2.7 17.4 3.6 1.1 4.7 1.6 1.3 6.0 1.3
1995 1.4 27.2 2.9 2.2 25.7 3.9 2.1 25.8 2.1
2000 5.4 32.3 7.2 4.8 44.2 7.1 4.9 42.2 7.1
2002 8.8 58.0 12.7 4.9 31.8 6.7 5.6 37.4 7.8
1975 2.8 1.8 2.7 1.4 0.6 1.7 1.8 0.7 1.8
1979 4.6 14.6 5.2 2.4 6.4 3.6 3.0 7.6 3.0
1985 5.8 4.1 5.7 3.2 0.8 3.7 4.0 1.4 4.0
1991 5.9 27.7 8.2 3.9 13.7 6.3 4.5 16.8 4.5
1995 5.3 22.6 6.9 3.6 11.7 5.4 4.1 13.7 4.1
2000 7.5 29.6 9.9 5.4 14.0 6.9 6.1 17.3 7.8
2002 7.9 24.2 9.8 6.1 14.1 7.6 6.7 16.5 8.3
Source:Pakistan Labour Force Survey, Federal Bureau of Statistics, Government of Pakistan (various issues)
P U N J A B
S I N D H
N W F P
B A L O C H I S T A N
P A K I S T A N
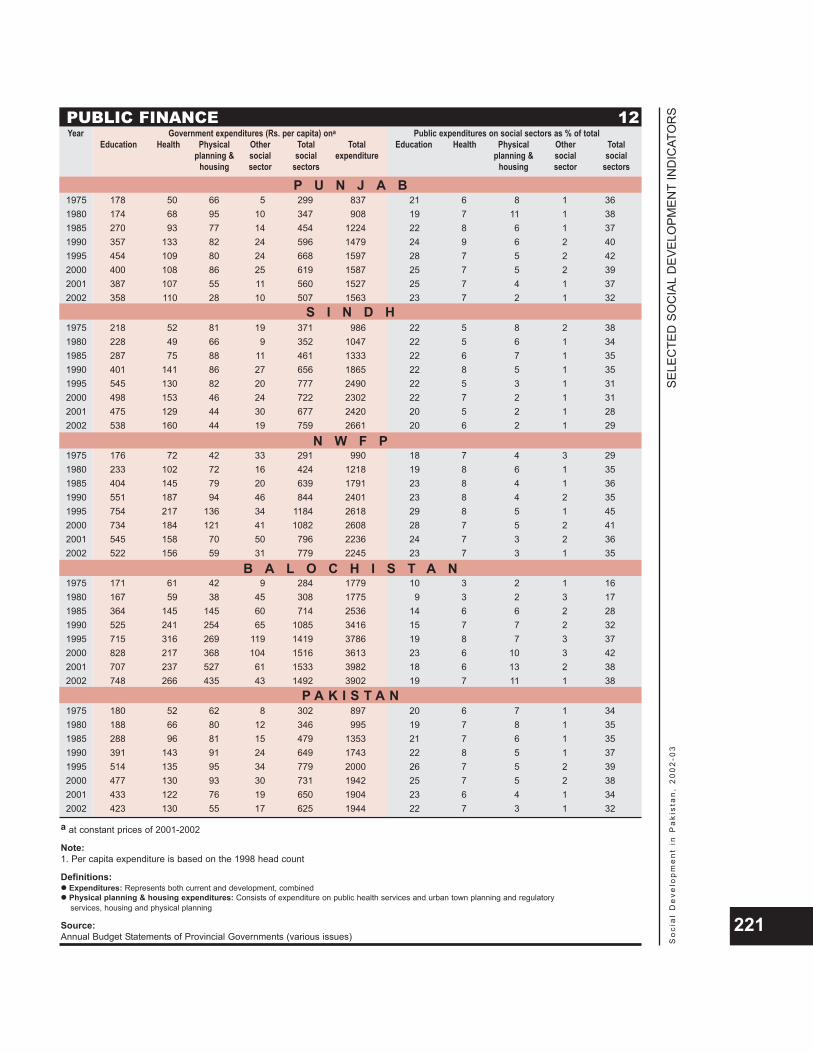
SELE
CTE
D S
OC
IAL
DEV
ELO
PMEN
TIN
DIC
ATO
RS
So
cia
l D
eve
lop
me
nt
in P
aki
sta
n,
20
02
-03
221
PUBLIC FINANCE 12Year Government expenditures (Rs. per capita) ona Public expenditures on social sectors as % of total
Education Health Physical Other Total Total Education Health Physical Other Totalplanning & social social expenditure planning & social social
housing sector sectors housing sector sectors
1975 178 50 66 5 299 837 21 6 8 1 361980 174 68 95 10 347 908 19 7 11 1 381985 270 93 77 14 454 1224 22 8 6 1 371990 357 133 82 24 596 1479 24 9 6 2 401995 454 109 80 24 668 1597 28 7 5 2 422000 400 108 86 25 619 1587 25 7 5 2 392001 387 107 55 11 560 1527 25 7 4 1 372002 358 110 28 10 507 1563 23 7 2 1 32
1975 218 52 81 19 371 986 22 5 8 2 381980 228 49 66 9 352 1047 22 5 6 1 341985 287 75 88 11 461 1333 22 6 7 1 351990 401 141 86 27 656 1865 22 8 5 1 351995 545 130 82 20 777 2490 22 5 3 1 312000 498 153 46 24 722 2302 22 7 2 1 312001 475 129 44 30 677 2420 20 5 2 1 282002 538 160 44 19 759 2661 20 6 2 1 29
1975 176 72 42 33 291 990 18 7 4 3 291980 233 102 72 16 424 1218 19 8 6 1 351985 404 145 79 20 639 1791 23 8 4 1 361990 551 187 94 46 844 2401 23 8 4 2 351995 754 217 136 34 1184 2618 29 8 5 1 452000 734 184 121 41 1082 2608 28 7 5 2 412001 545 158 70 50 796 2236 24 7 3 2 362002 522 156 59 31 779 2245 23 7 3 1 35
1975 171 61 42 9 284 1779 10 3 2 1 161980 167 59 38 45 308 1775 9 3 2 3 171985 364 145 145 60 714 2536 14 6 6 2 281990 525 241 254 65 1085 3416 15 7 7 2 321995 715 316 269 119 1419 3786 19 8 7 3 372000 828 217 368 104 1516 3613 23 6 10 3 422001 707 237 527 61 1533 3982 18 6 13 2 382002 748 266 435 43 1492 3902 19 7 11 1 38
1975 180 52 62 8 302 897 20 6 7 1 341980 188 66 80 12 346 995 19 7 8 1 351985 288 96 81 15 479 1353 21 7 6 1 351990 391 143 91 24 649 1743 22 8 5 1 371995 514 135 95 34 779 2000 26 7 5 2 392000 477 130 93 30 731 1942 25 7 5 2 382001 433 122 76 19 650 1904 23 6 4 1 342002 423 130 55 17 625 1944 22 7 3 1 32
a at constant prices of 2001-2002
Note:1. Per capita expenditure is based on the 1998 head count
Definitions:Expenditures: Represents both current and development, combinedPhysical planning & housing expenditures: Consists of expenditure on public health services and urban town planning and regulatory services, housing and physical planning
Source:Annual Budget Statements of Provincial Governments (various issues)
P U N J A B
S I N D H
N W F P
B A L O C H I S T A N
P A K I S T A N
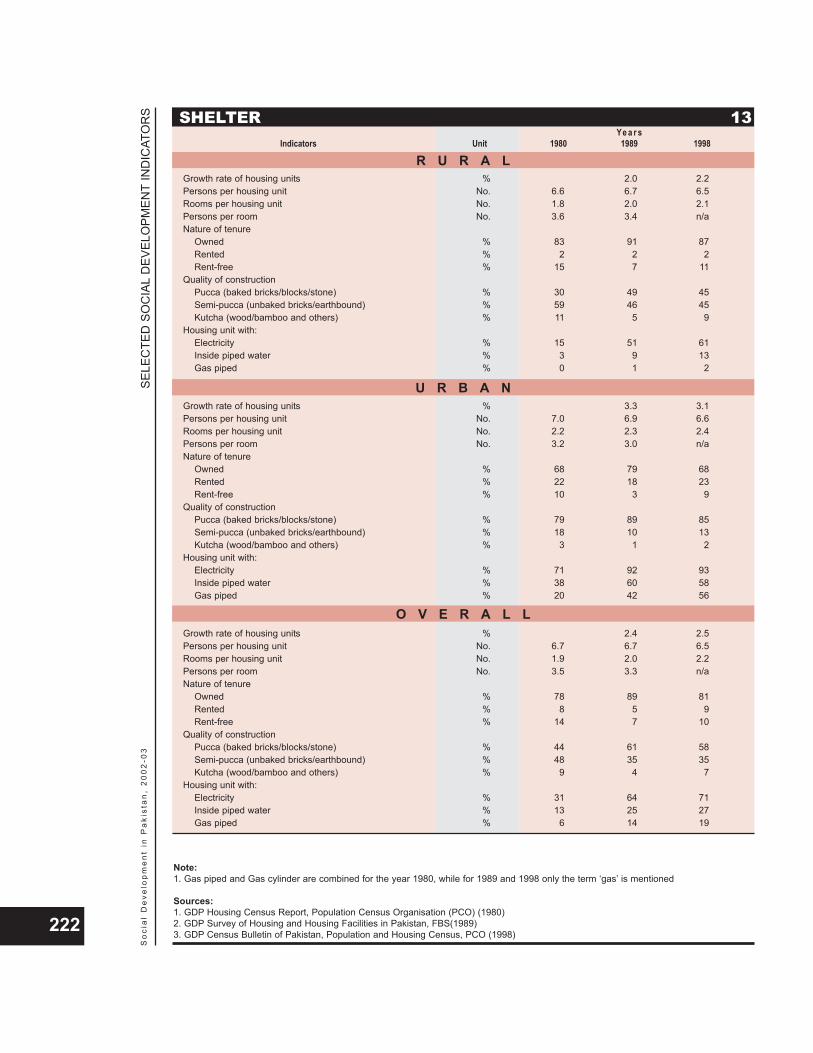
SELE
CTE
D S
OC
IAL
DEV
ELO
PMEN
TIN
DIC
ATO
RS
So
cia
l D
eve
lop
me
nt
in P
aki
sta
n,
20
02
-03
222
SHELTER 13Ye a r s
Indicators Unit 1980 1989 1998
Growth rate of housing units % 2.0 2.2Persons per housing unit No. 6.6 6.7 6.5Rooms per housing unit No. 1.8 2.0 2.1Persons per room No. 3.6 3.4 n/aNature of tenure
Owned % 83 91 87Rented % 2 2 2Rent-free % 15 7 11
Quality of constructionPucca (baked bricks/blocks/stone) % 30 49 45Semi-pucca (unbaked bricks/earthbound) % 59 46 45Kutcha (wood/bamboo and others) % 11 5 9
Housing unit with:Electricity % 15 51 61Inside piped water % 3 9 13Gas piped % 0 1 2
Growth rate of housing units % 3.3 3.1Persons per housing unit No. 7.0 6.9 6.6Rooms per housing unit No. 2.2 2.3 2.4Persons per room No. 3.2 3.0 n/aNature of tenure
Owned % 68 79 68Rented % 22 18 23Rent-free % 10 3 9
Quality of constructionPucca (baked bricks/blocks/stone) % 79 89 85Semi-pucca (unbaked bricks/earthbound) % 18 10 13Kutcha (wood/bamboo and others) % 3 1 2
Housing unit with:Electricity % 71 92 93Inside piped water % 38 60 58Gas piped % 20 42 56
Growth rate of housing units % 2.4 2.5Persons per housing unit No. 6.7 6.7 6.5Rooms per housing unit No. 1.9 2.0 2.2Persons per room No. 3.5 3.3 n/aNature of tenure
Owned % 78 89 81Rented % 8 5 9Rent-free % 14 7 10
Quality of constructionPucca (baked bricks/blocks/stone) % 44 61 58Semi-pucca (unbaked bricks/earthbound) % 48 35 35Kutcha (wood/bamboo and others) % 9 4 7
Housing unit with:Electricity % 31 64 71Inside piped water % 13 25 27Gas piped % 6 14 19
Note:1. Gas piped and Gas cylinder are combined for the year 1980, while for 1989 and 1998 only the term ‘gas’ is mentioned
Sources:1. GDP Housing Census Report, Population Census Organisation (PCO) (1980)2. GDP Survey of Housing and Housing Facilities in Pakistan, FBS(1989)3. GDP Census Bulletin of Pakistan, Population and Housing Census, PCO (1998)
R U R A L
U R B A N
O V E R A L L
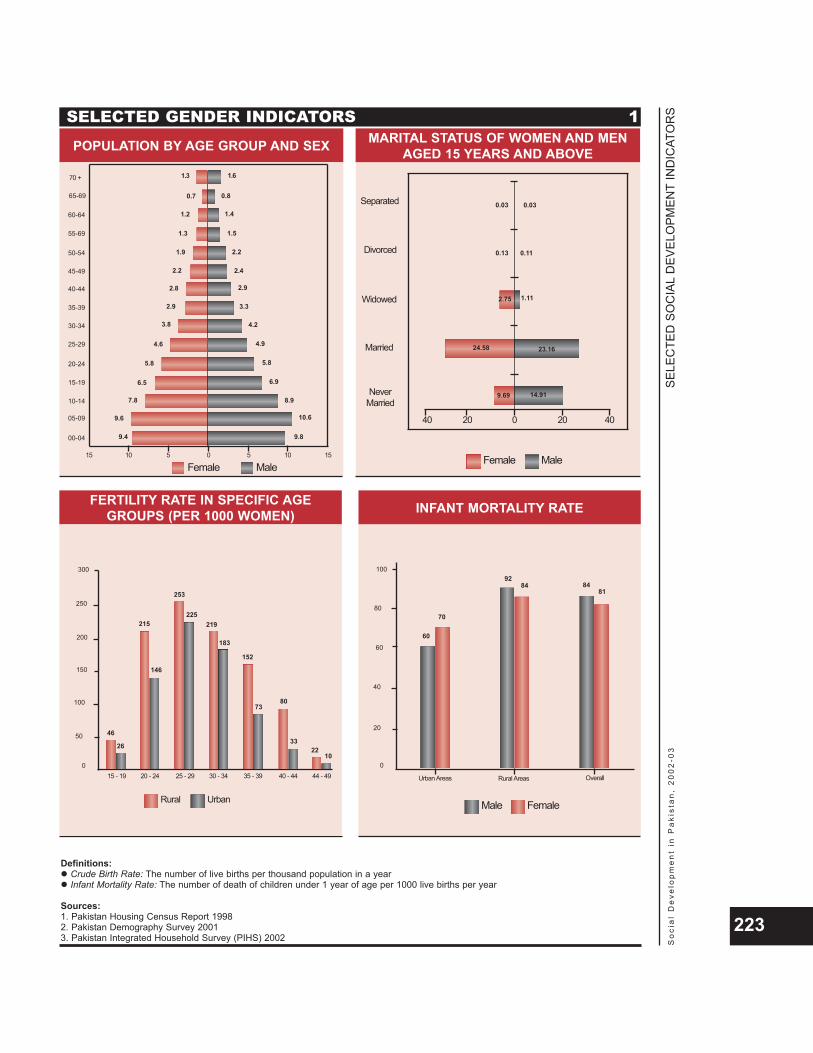
SELE
CTE
D S
OC
IAL
DEV
ELO
PMEN
TIN
DIC
ATO
RS
So
cia
l D
eve
lop
me
nt
in P
aki
sta
n,
20
02
-03
223
POPULATION BY AGE GROUP AND SEX MARITAL STATUS OF WOMEN AND MENAGED 15 YEARS AND ABOVE
70 +
65-69
60-64
50-54
45-49
40-44
35-39
30-34
25-29
20-24
15-19
10-14
05-09
00-04
55-69
10 1055 0 1515
Female Male
1.3
0.7
1.2
1.9
2.2
2.8
2.9
3.8
4.6
5.8
6.5
7.8
9.6
9.4
1.3
1.6
0.8
1.4
2.2
2.4
2.9
3.3
4.2
4.9
5.8
6.9
8.9
10.6
9.8
1.5
40 402020 0
Female Male
1.11
0.13 0.11
0.03 0.03Separated
Divorced
Widowed
Married
NeverMarried
2.75
23.1624.58
9.69 14.91
INFANT MORTALITY RATE
100
80
60
0
Urban Areas OverallRural Areas
FemaleMale
40
20
818484
92
70
60
Definitions:Crude Birth Rate: The number of live births per thousand population in a yearInfant Mortality Rate: The number of death of children under 1 year of age per 1000 live births per year
Sources:1. Pakistan Housing Census Report 19982. Pakistan Demography Survey 20013. Pakistan Integrated Household Survey (PIHS) 2002
FERTILITY RATE IN SPECIFIC AGEGROUPS (PER 1000 WOMEN)
300
200
150
015 - 19
UrbanRural
100
50
250
46
26
215
146
253
225219
183
152
7380
2210
33
20 - 24 25 - 29 30 - 34 35 - 39 40 - 44 44 - 49
SELECTED GENDER INDICATORS 1
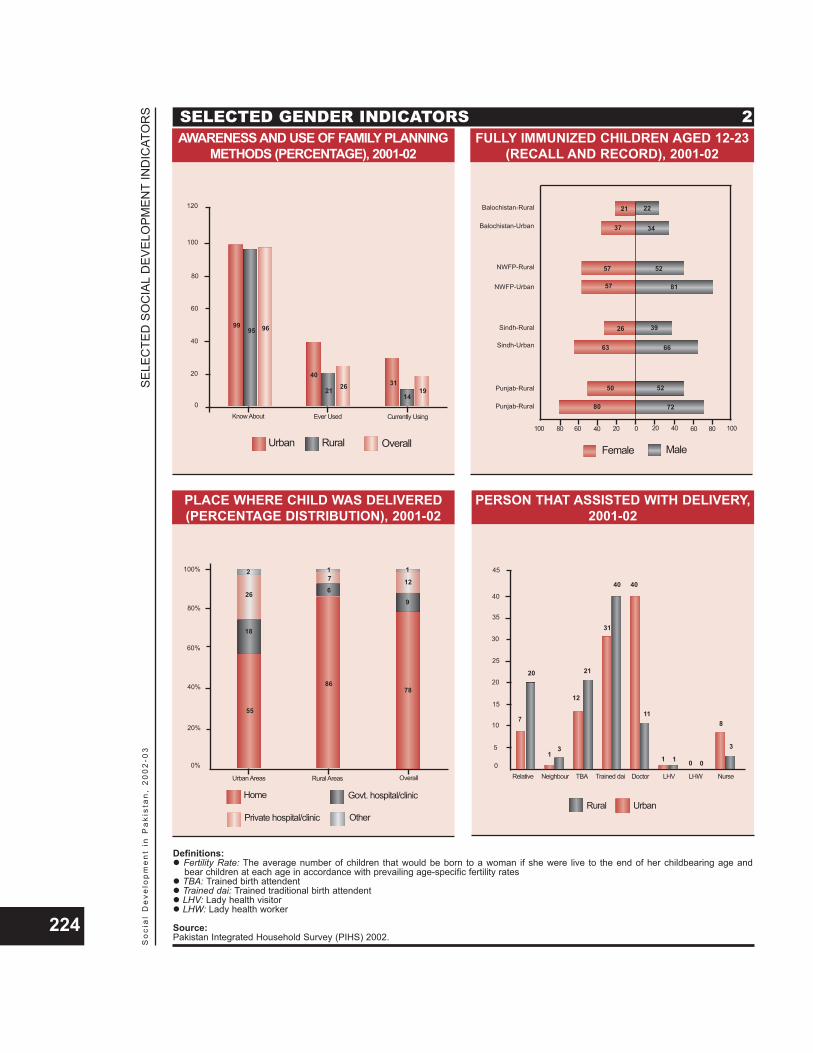
SELE
CTE
D S
OC
IAL
DEV
ELO
PMEN
TIN
DIC
ATO
RS
So
cia
l D
eve
lop
me
nt
in P
aki
sta
n,
20
02
-03
224
PERSON THAT ASSISTED WITH DELIVERY,2001-02
45
20
15
0Relative
UrbanRural
10
5
40
7
20
13
12
31
40 40
118
3
Neighbour TBA Trained dai Doctor LHV LHW Nurse
25
30
35
21
1 1 0 0
FULLY IMMUNIZED CHILDREN AGED 12-23(RECALL AND RECORD), 2001-02
Balochistan-Rural
Balochistan-Urban
NWFP-Urban
Sindh-Rural
Punjab-Rural
Sindh-Urban
NWFP-Rural
100 4020 0 80
Female Male
57 52
57 81
26 39
63 66
37 34
21 22
50 52
80 72
406080 20 60 100
Punjab-Rural
Definitions:Fertility Rate: The average number of children that would be born to a woman if she were live to the end of her childbearing age and bear children at each age in accordance with prevailing age-specific fertility ratesTBA: Trained birth attendentTrained dai: Trained traditional birth attendentLHV: Lady health visitorLHW: Lady health worker
Source:Pakistan Integrated Household Survey (PIHS) 2002.
PLACE WHERE CHILD WAS DELIVERED(PERCENTAGE DISTRIBUTION), 2001-02
100%
80%
60%
0%
Urban Areas OverallRural Areas
Govt. hospital/clinicHome
40%
20%
55
Private hospital/clinic Other
18
26
2 1
8678
1
9
76
12
AWARENESS AND USE OF FAMILY PLANNINGMETHODS (PERCENTAGE), 2001-02
Know About Currently UsingEver Used
RuralUrban Overall
1914
2621
40
969599
31
120
80
60
40
20
100
0
SELECTED GENDER INDICATORS 2
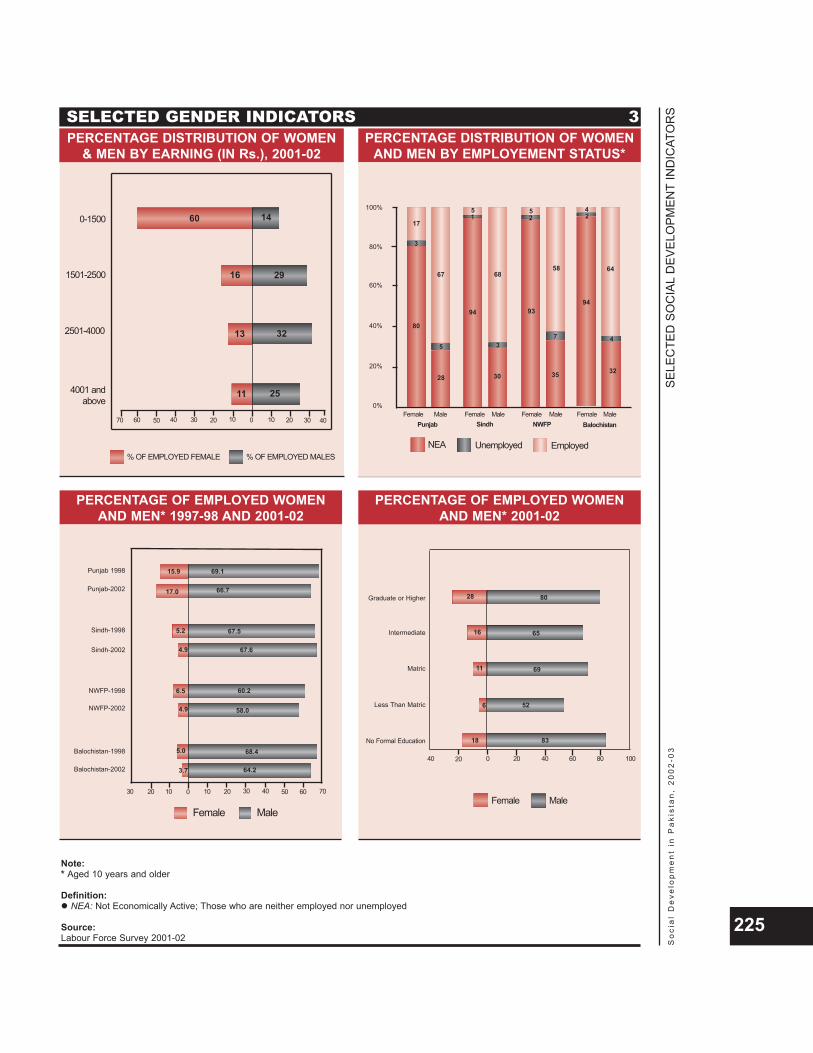
SELE
CTE
D S
OC
IAL
DEV
ELO
PMEN
TIN
DIC
ATO
RS
So
cia
l D
eve
lop
me
nt
in P
aki
sta
n,
20
02
-03
225
PERCENTAGE DISTRIBUTION OF WOMENAND MEN BY EMPLOYEMENT STATUS*
Female
NEA Unemployed
Male Female Male Female Male Female Male
100%
80%
60%
0%
40%
20%
80
3
17
5
28
67
15
94
30
68
3
25
93
58
7
94
35
24
64
4
32
Punjab Sindh NWFP Balochistan
Employed
PERCENTAGE OF EMPLOYED WOMENAND MEN* 1997-98 AND 2001-02
Punjab 1998
Punjab-2002
Sindh-2002
NWFP-1998
Balochistan-1998
NWFP-2002
Sindh-1998
30 4010 20 60
Female Male
5.2 67.5
4.9 67.6
6.5 60.2
4.9 58.0
17.0 66.7
15.9 69.1
5.0 68.4
3.7 64.2
01020 30 50 70
Balochistan-2002
Note:* Aged 10 years and older
Definition:NEA: Not Economically Active; Those who are neither employed nor unemployed
Source:Labour Force Survey 2001-02
PERCENTAGE OF EMPLOYED WOMENAND MEN* 2001-02
Graduate or Higher
Intermediate
Less Than Matric
No Formal Education
Matric
40
MaleFemale
4020020 60 80 100
8028
16 65
6911
526
8318
PERCENTAGE DISTRIBUTION OF WOMEN& MEN BY EARNING (IN Rs.), 2001-02
1501-2500
2501-4000
4001 andabove
16
3213
11 25
1040 30 10506070 20 0 20 30 40
0-1500
29
60 14
% OF EMPLOYED FEMALE % OF EMPLOYED MALES
SELECTED GENDER INDICATORS 3
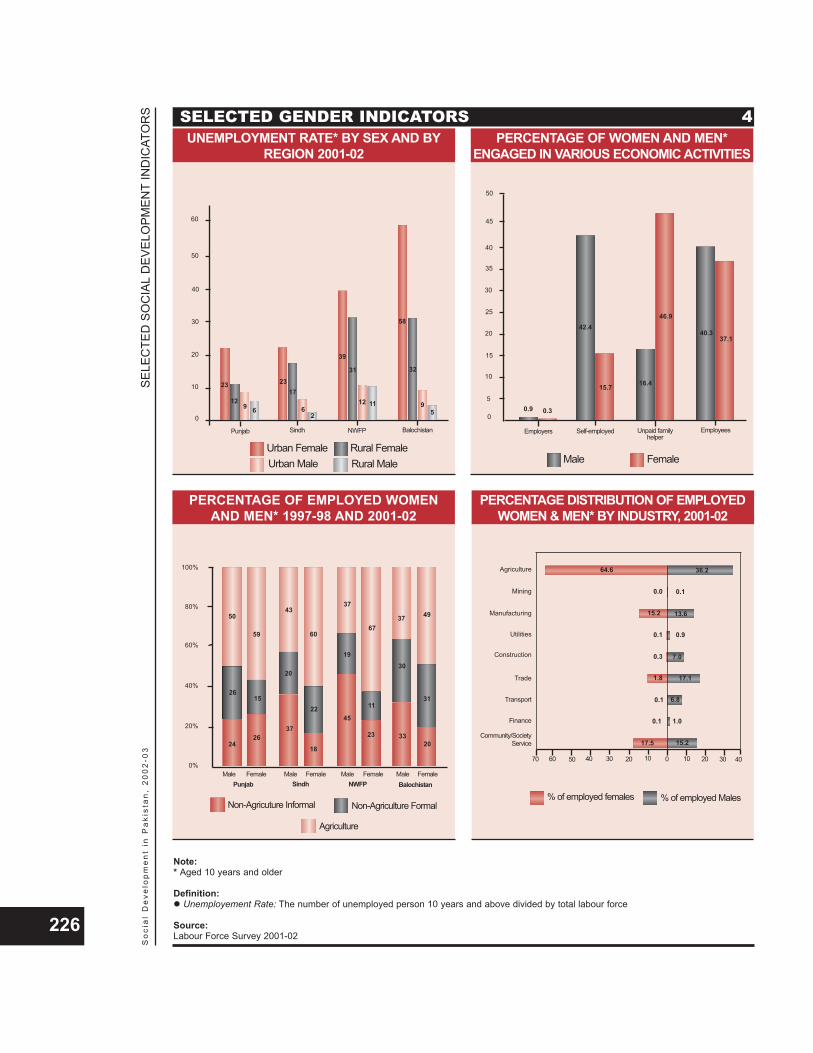
SELE
CTE
D S
OC
IAL
DEV
ELO
PMEN
TIN
DIC
ATO
RS
So
cia
l D
eve
lop
me
nt
in P
aki
sta
n,
20
02
-03
226
Note:* Aged 10 years and older
Definition:Unemployement Rate: The number of unemployed person 10 years and above divided by total labour force
Source:Labour Force Survey 2001-02
UNEMPLOYMENT RATE* BY SEX AND BYREGION 2001-02
Punjab BalochistanSindh
Rural FemaleUrban FemaleUrban Male
6
1723
912
31
60
40
30
20
10
50
0
12
26
23
11
39
59
32
58
NWFP
Rural Male
PERCENTAGE OF WOMEN AND MEN*ENGAGED IN VARIOUS ECONOMIC ACTIVITIES
Employers EmployeesSelf-employed
FemaleMale
15.7
42.4
0.3
46.9
0.9
16.4
37.140.3
Unpaid familyhelper
45
20
15
0
10
5
40
25
30
35
50
PERCENTAGE OF EMPLOYED WOMENAND MEN* 1997-98 AND 2001-02
Male
Non-Agricuture Informal
Agriculture
Female Male Female Male Female Male Female
100%
80%
60%
0%
40%
20%
50
15
26
59
43
20
18
60
22
19
37
45
67
11
23 33
37 49
31
20
Punjab Sindh NWFP Balochistan
Non-Agriculture Formal
24
26
37
30
PERCENTAGE DISTRIBUTION OF EMPLOYEDWOMEN & MEN* BY INDUSTRY, 2001-02
Agriculture
Manufacturing
Trade
Transport
Construction
% of employed Males% of employed females
1.8
6.8
0.1
17.5
1040 30 10506070 20 0 20 30 40
15.2
1.0
0.1
17.1
0.3 7.0
0.90.1
13.615.2
0.0 0.1
36.264.6
Mining
Utilities
Finance
Community/SocietyService
SELECTED GENDER INDICATORS 4
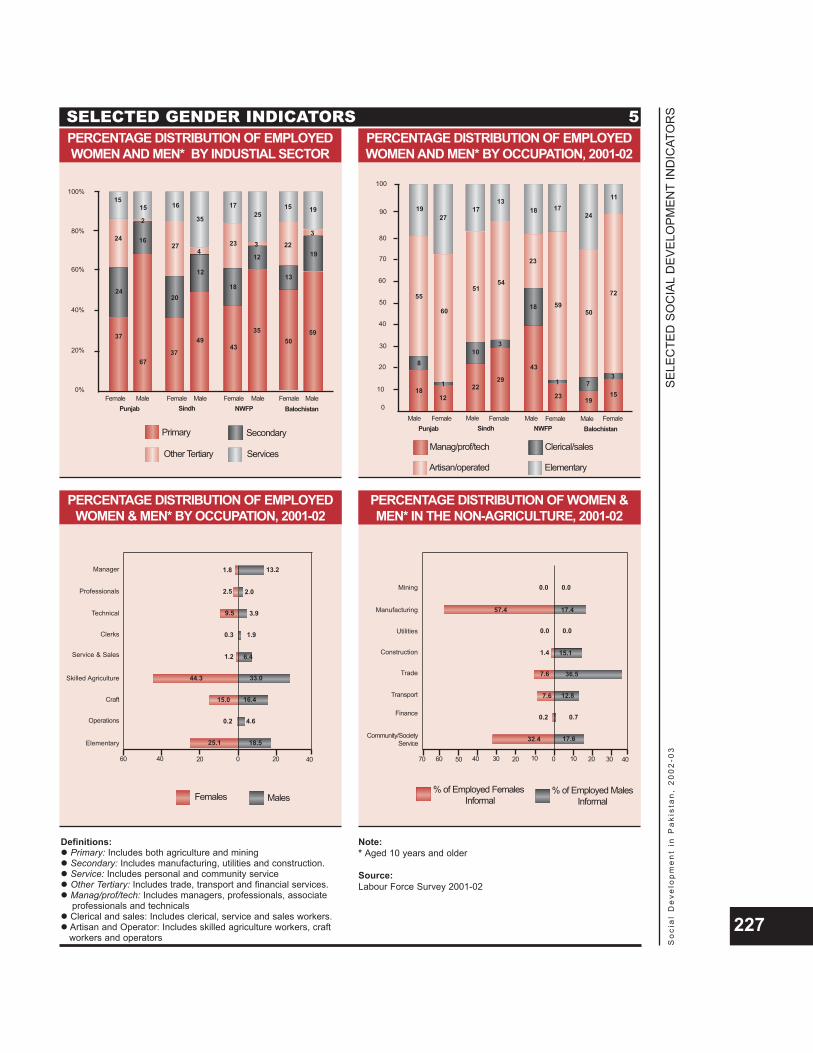
SELE
CTE
D S
OC
IAL
DEV
ELO
PMEN
TIN
DIC
ATO
RS
So
cia
l D
eve
lop
me
nt
in P
aki
sta
n,
20
02
-03
227
PERCENTAGE DISTRIBUTION OF WOMEN &MEN* IN THE NON-AGRICULTURE, 2001-02
Manufacturing
Trade
Transport
Construction
% of Employed MalesInformal
% of Employed FemalesInformal
7.6
12.8
0.2
32.4
1040 30 10506070 20 0 20 30 40
17.6
0.7
7.6
36.5
1.4 15.1
0.00.0
17.457.4
Mining
Utilities
Finance
Community/SocietyService
0.00.0
PERCENTAGE DISTRIBUTION OF EMPLOYEDWOMEN & MEN* BY OCCUPATION, 2001-02
Manager
Technical
Skilled Agriculture
Craft
Service & Sales
MalesFemales
44.3
16.4
0.2
25.1
4060 20 0 20 40
18.5
4.6
15.0
33.0
1.2 6.4
1.90.3
3.99.5
2.5 2.0
13.21.8
Professionals
Clerks
Operations
Elementary
Female
Primary Secondary
Male Female Male Female Male Female Male
100%
80%
60%
0%
40%
20%
37
24
24 16
67
20
27
37
12
49
18
23
43
12
5035
2219
59
Punjab Sindh NWFP Balochistan
Other Tertiary
PERCENTAGE DISTRIBUTION OF EMPLOYEDWOMEN AND MEN* BY INDUSTIAL SECTOR
1515
2
16
4
35
1725
3
13
15 19
3
Services
Definitions:Primary: Includes both agriculture and miningSecondary: Includes manufacturing, utilities and construction.Service: Includes personal and community serviceOther Tertiary: Includes trade, transport and financial services.Manag/prof/tech: Includes managers, professionals, associate professionals and technicalsClerical and sales: Includes clerical, service and sales workers.Artisan and Operator: Includes skilled agriculture workers, craft workers and operators
Note:* Aged 10 years and older
Source:Labour Force Survey 2001-02
SELECTED GENDER INDICATORS 5
Male
Manag/prof/tech Clerical/sales
Female Male Female Male Female Male Female
18
8
55
12
10
51
22
3
29
18
23
43
59
1923
50
3
15
Punjab Sindh NWFP Balochistan
Artisan/operated
PERCENTAGE DISTRIBUTION OF EMPLOYEDWOMEN AND MEN* BY OCCUPATION, 2001-02
1927
60
17
54
1318 17
1 7
24
11
72
Elementary
90
40
30
0
20
10
80
50
60
70
100
1
BIBLIOGRAPHY
Ablo, E. and Reinikka, R. 1998 Do budgets really matter? Evidence from public spending on education and health
in Uganda. World Bank Policy Research Working Paper 1926 (June).
Academy of Educational Planning and Management 1999 Measuring Learning Achievement At Primary Level In Pakistan. Ministry of
Education, Islamabad, in collaboration with UNESCO.
Ahmed, M. 2000 Continuity and Change in Traditional System of Islamic Education: The case of
Pakistan. In Pakistan 2000. Baxter, Craig and Kennedy, Charles H. (eds). OxfordUniversity Press, Karachi.
Alderman, H. et al.1995 Public Schooling Expenditures in Rural Pakistan: Efficiently Targeting Girls and a
Lagging Region. In Public Spending and the Poor: Theory and Evidence. Van deWale, Dominique and Nead K. (eds.), Johns Hopkins, Baltimore.
Amin, T.1988 Ethno-National Movements of Pakistan. Institute of Policy Studies, Islamabad.
Becker, G. S.1960 An Economic Analysis of Fertility in Demographic and Economic Changes in
Developed Countries. Princeton University Press, Princeton (USA).
Bengali K.1999 History of Education Policy Making and Planning in Pakistan. Working paper series
40, SDPI. Sustainable Development Policy Institute.
Bledsoe, C.H. and Cohen, B. 1993 Social dynamics of adolescent fertility in sub-Saharan Africa. National Academy
Press. Washington, D.C.
Brennan, G.1976 The Distributional Implications of Public Goods. Econometrica Vol. 44 pp. 391-399.
Buckland, P.2003 Making Quality Basic Education Affordable? What Have we Learned? UNICEF.
Caldwell, J.1980 Mass education as a determinant of the timing of fertility decline. Population and
Development Review. Vol 6 pp. 225-55.
Castro-Leal, F., Dayton J. et al.1999 Public Social Spending in Africa: Do the Poor Benefit? The World Bank Research
Observer 14(1), pp. 49-72.
Cincotta, H.Defining democracy. International Information Programmes, US Department ofState. Available at http://usinfo.state.gov/products/pubs/whatsdem/whatdm2.htm
SELE
CTE
D S
OC
IAL
DEV
ELO
PMEN
TIN
DIC
ATO
RS
So
cia
l D
eve
lop
me
nt
in P
aki
sta
n,
20
02
-03
228
Cleland, J. and Jejeebhoy, S.1996 Maternal schooling and fertility: Evidence from census and surveys. In R. Jeffery
and A. M. Basu (eds). Girls' Schooling, Women's Autonomy and Fertility Change inSouth Asia. Sage Publications, New Delhi.
Cornes, R.1995 Measuring the Distributional Impact of Public Goods. In Van de Walle and Nead
(1995), Chapter 4.
Crouch, L. A.1996 Public Education Equity and Efficiency in South Africa: Lessons for Other
Countries. Economics of Education Review 15(2), pp.125-137.
Demery, L.1996 Gender and Public Social Spending: Disaggregating Benefit Incidence. Poverty
and Social Policy Department, World Bank (unprocessed).
2000 Benefit Incidence: A practitioner's guide. Poverty and Social Development GroupAfrica Region, World Bank, Washington, D.C.
Farooq, M.2002 Islam and Democracy: Perceptions And Misperceptions. Available at
http://www.messageonline.org
Filmer, D. and Pritchett, L. 1999 The effect of household wealth on educational attainment: Evidence from 35
countries. Population and Development Review, 25(1) pp. 85-120.
Ghous A.1989 The Incidence of Public Expenditure in Karachi. Pakistan Journal of Applied
Economics, 8(1). Summer.
Govindasamy, P. and Ramesh, B. M.1997 Maternal Education and the Utilization of maternal and Child Health Services in
India. National Family Health Survey Subject Reports. No. 5. International Instituteof Population Sciences, Mumbai.
Government of Pakistan.
1979 Qaumi Committee Barae Madaris [Urdu]. Ministry of Religious Affairs, Islamabad.
1988 Deeni Madaris ki Jame Report [Urdu]. Islamic Education Research Cell, Ministry ofEducation, Islamabad.
1995 Elementary Teacher Education, Curriculum And Syllabus For Primary TeachingCertificate [PTC]. Curriculum Wing, Ministry of Education, Islamabad.
1998 National Education Policy, 1998-2010. Ministry of Education, Islamabad.
1998-1999 Pakistan Integrated Household Survey 1998-99. Federal Bureau of Statistics,Islamabad.
1998 District Census Reports. Pakistan Census Organisation, Islamabad.
1999 National Curriculum 2000, A Conceptual Framework. Ministry of Education incollaboration with The National committee on Education, Islamabad.
SELE
CTE
D S
OC
IAL
DEV
ELO
PMEN
TIN
DIC
ATO
RS
So
cia
l D
eve
lop
me
nt
in P
aki
sta
n,
20
02
-03
229
1999 National Bureau of Curriculum & Textbooks, Organization And Functions.Curriculum Wing, Ministry of Education, Islamabad.
1999-2000 Details of Demand for Grants and Appropriations 1999-00, Current Expenditure,Vol. 1. Finance Division, Islamabad.
1999-2000 Demands for Grants and Appropriations, Current Expenditures. FinanceDepartment, Islamabad.
1999-2000 Estimates of Receipts for 1999-2000. Finance Department, Balochistan.
1999-2000 Demands for Grants, Current Expenditures. Finance Department, NWFP.
1999-2000 Estimates of Receipts for 1999-2000. Finance Department, NWFP.
1999-2000 Estimates of Charged Expenditures and Demands for Grants, CurrentExpenditures. Finance Department, Islamabad.
1999-2000 Estimates of Receipts for 1999-2000. Finance Department, Islamabad.
1999-2000 Estimates of Charged Expenditures and Demands for Grants, CurrentExpenditures. Finance Department, Sindh.
1999-2000 Estimates of Receipts for 1999-2000. Finance Department, Sindh.
2000 Pakistan Health & Population Welfare Facilities Atlas. Planning and DevelopmentDivision, Pakistan.
2000 Agriculture Census 2000, Procedure and Data Tables. Agriculture CensusOrganization, Punjab.
2002 President's Task Force on Human Development Report. Islamabad.
2002 National Curriculum: Social Studies for Class VI-VIII. Ministry of Education,Islamabad.
2002 Fact and Figures, Pakistan 2002. EFA Wing, Ministry of Education, Islamabad andUNICEF.
2002 National Curriculum Social Studies For Classes I-V. Curriculum Wing, Ministry ofEducation, Islamabad.
2002 National Curriculum Early Childhood Education. Curriculum Wing, Ministry ofEducation, Islamabad
Hamid, S. and Siddiqui, R. 2002 Gender Differences in Demand for Schooling. Conference paper, presented in the
17th Annual General Meeting and Conference of the Pakistan Society ofDevelopment Economists, Islamabad.
Hammer, J., Nabi, I. and Cercon, J. A.1995 Distributional Effects of Social Sector Expenditures in Malaysia, 1974-89. In Van
de Walle and Nead (1995), Chapter 18.
Hobcraft, J.1993 Women's Education, Child Welfare and Child Survival: A Review of the Evidence.
Health Transition Review 3(2).
SELE
CTE
D S
OC
IAL
DEV
ELO
PMEN
TIN
DIC
ATO
RS
So
cia
l D
eve
lop
me
nt
in P
aki
sta
n,
20
02
-03
230
Holmes J.2003 Measuring the Determination of School Completion in Pakistan, Economic and
Education Review 22 (3), June 2003, pp 249-64, [forthcoming].
Howlader, A. A. and Bhuiyan, M. U.1999 Mothers' Health-Seeking Behaviour and Infant and Child Mortality in Bangledesh.
Asia-Pacific Population Journal 14(1). United Nations Economic and SocialCommission for Asia and the Pacific.
Hussain, F.1994 An Ethnographic Study of Jamia Ashrafia; A Religious School at Lahore with
Special Emphasis on Socio-practical Relevance of its Objectives. M.Sc.Dissertation, Department of Anthropology, Quaid-i-Azam University, Islamabad.
ICG. 2002 Pakistan: Madrassas, Extremism and the Military. International Advisory Group
Asia Report No. 36, Islamabad/Brussels.
IPS. 1987 Deeni Madaris ka Nizam-e-Taleem. [(Urdu): The System of Education of the
Religious Madrassahs] Institute of Policy Studies, Islamabad.
Idara Talifaat Ashrafia.1998 Islam Aur Seyasat [(Urdu): Islam and Politics]. Idara Talifaat Ashrafia, Multan.
Ismail, Z.H. and Iqbal, M.A.1994 User Charges in Education. Policy Paper No. 3. Social Policy and Development
Centre, Karachi.
Jafri, S.H.M. 2000 The Origins and Early Development of Shia Islam. Oxford University Press,
Karachi.
Jamat-e-Islami Pakistan.Essential features of Islamic Political Systems. Available athttp://www.jamaat.org
Jeheebhoy, S. J. 1995 Women's Education, Autonomy and Reproductive Behaviour: Experience from
Developing Countries. Clarendon Press, Oxford.
Jonson, P. M.A glossary of political economy terms. Department of political science, AuburnUniversity. Available at http://www.auburn.edu/~johnspm/gloss/index.html
Kakwani, N.1980 Inequality and Poverty _ Methods of Estimation and Policy Applications. World
Bank, Oxford University Press.
Kamal, F. M., Hadi, A. and Chowdhury, M. R.1999 Differentials of the Immunization Programme in Rural Bangladesh and the Issue of
User Fee. WHO Regional Office for South Asia.
Knutsen, J. F.Popular Sovereignty. Available at http://www.basiclaw.net/Principles/Popular%20sovereignty.htm
SELE
CTE
D S
OC
IAL
DEV
ELO
PMEN
TIN
DIC
ATO
RS
So
cia
l D
eve
lop
me
nt
in P
aki
sta
n,
20
02
-03
231
Kravdal, O.2000 A Search for Aggregate-Level Effects of Education on Fertility, using data from
Zimbabwe, Demographic Research (3).
Kumar, R.2000 Women and Education: Encyclopedia of Women and Development Series. Anmol
Publications Pvt. Ltd., New Delhi, India.
Leitner, G. W.1882 History of Indigenous Education in the Punjab Since Annexation and in 1882.
Republican Books, Lahore (1991 print).
Manda, D. K, Mwabu, G. and Kimenyi, M.2002. Human Capital Externalities and Returns to Education in Kenya. Discussion Paper
No. 13. Kenya Institute for Public Policy Research and Analysis.
Maududi, A. A.1974 Talimat [(Urdu): Education]. Islamic Publications, Lahore.
Sindalvi, M. I.1991 Islam ka Seyasi Nizam [(Urdu): Political System of Islam], Urdu Academy, Sindh.
Meerman, J.1979 Public Expenditures in Malaysia: Who Benefits and Why? Oxford University Press,
New York.
Mehmood, T. and Ahmed, A.S.1992 Does Education of Head of the Household Affect Intra-household Education Level
and Living Style? Pakistan Economic and Social Review 30(1). Department ofEconomics, University of Punjab, Lahore.
Mehrotra S. 1998 Education for All: Policy Lessons from High Achieving Nations. UNICEF, New York.
Mincer, J. 1974 Schooling, Experience and Earnings. National Bureau of Economic Research,
New York.
Montgomery, M. R and Casterline, J. B. 1996 Social Learning, Social Influence, and New Models of Fertility. Population and
Development Review (22).
Mutangadura, G.B. and Lamb, V.L.2003 Variations in Rates of Primary School Access and Enrolments in Sub-Saharan
Africa: A Pooled Cross-Country Time Series Analysis. International Journal ofEducational Development 23(4).
Nasir, Z. M. and Nazli, H.2000 Education and Earning in Pakistan. Research Report No. 177. Pakistan Institute of
Development Economics, Islamabad.
Nayyar, A. H.1998 Madrasah Education _ Frozen in Time. In Hoodbhoy, (ed). Education and State:
Fifty Years of Pakistan. Oxford University Press, Karachi.
Paralegal Advice Website and Education & Training Unit2003 Democracy and Public Participation. Available at
http://www.paralegaladvice.org.za/docs/chap06a/02.html
SELE
CTE
D S
OC
IAL
DEV
ELO
PMEN
TIN
DIC
ATO
RS
So
cia
l D
eve
lop
me
nt
in P
aki
sta
n,
20
02
-03
232
Pasha, H. A. 1995 Political Economy of Higher Education: A Study of Pakistan. Pakistan Economic
and Social Review, 33(1 & 2). pp. 19-36, Pakistan.
Pasha, H. A. and Hassan, T. 1982 Development Ranking of the Districts of Pakistan. Pakistan Journal of Applied
Economics, (12).
Pasha, H. A., Ismail, Z. and Iqbal, M. A. 1996 Continuation Rates in Primary Education: A Study of Pakistan. SPDC Research
Report No. 9. Social Policy and Development Centre, Karachi.
Pervez, M.1995 Basic Competencies of Children in Pakistan. Pakistan Psychological Foundation
sponsored by United Nations Children's Fund.
PNEP. 1969 Proposals for a New Educational Policy in Pakistan. Ministry of Education and
Scientific Research, Government of Pakistan, Islamabad.
Population Council 2003 Accelerating Girls' Education: A Priority for Governments. Available at
http://www.popcouncil.org/gfd/girlseducation.html
Progressive Policy Institute.2000-02 New Economy Indexes. Available at
http://www.neweconomyindex.org
Psacharopoulos, G. 1995 The Profitability of Investment in Education: Concepts and Methods. Mimeo.
Human Capital Development and Operational Policy Working Paper, December,World Bank, Washington.
Psacharopoulos, G. and Partrinos, A. 2002 Returns to Investment in Education: A Further Update. World Bank Policy
Research Paper 2881, September, World Bank, Washington.
Punjab Text Book Board.1996 Meri Kitab, Pehli Jamat Key Liay. [(Urdu): My book, for Class I]
2002 Meri Kitab, Teesri Jamat Key Liay. [(Urdu): My book, for Class III]
Ram, R.1999 Tropics, Income, and School Life Expectancy: An Inter-country Study. Economic
and Education Review (18).
Rahman, T. 1996 Language and Politics in Pakistan. Oxford University Press, Karachi.
2002 Language Ideology and Power: Language-Learning among the Muslims ofPakistan and North India. Oxford University Press, Karachi.
Ranja, P. N., Mishra, A. K. and Krishnamoorthy, S.1998 Impact of Maternal Education and Health Services on Child Mortality in Uttar
Pradesh, India. Asia-Pacific Population Journal 13(2). United Nations Economicand Social Commission for Asia and the Pacific.
SELE
CTE
D S
OC
IAL
DEV
ELO
PMEN
TIN
DIC
ATO
RS
So
cia
l D
eve
lop
me
nt
in P
aki
sta
n,
20
02
-03
233
Sabir, M.2003 Benefit Incidence Analysis of Public Spending on Education, The Journal NIPA,
September 8(3).
2003 Gender and Public Spending on Education: A Case Study of Disaggregated BenefitIncidence. Paper presented in the 18th Annual General Meeting and Conferenceof Pakistan Institute of Development Economics.
Selden, T. M. and Wasylenko, M. J. 1995 Measuring the Distributional Effects of Public Education in Peru. In: Public
Spending and the Poor: Theory and Evidence, Van de Wale, D and Nead, K.(eds.)Johns Hopkins, Baltimore.
Selowsky, M.1979 Who Benefits from Government Expenditure? Oxford University Press, New York.
Sindh Text Book Board.2002 Urdu Ki Teesri Kitab, Teesri Jamat Keliay. [(Urdu): My Third Urdu book, for Class III]
2003 Darsi Kitab (Marboot Nisab Ke Mutabiq), Pehli Jamat Key Liay.
SPDC. 2000 Social Development in Pakistan: Annual Review 2000. Oxford University Press,
Karachi.
Stanovnik, T. 1997 The Returns to Education. Economic and Education Review 16(4). Pergamon
Publications.
The Book Group.2002 Shararatain, Teesri Jamat Ki Darsi Kitab. [(Urdu): Playful activities, for Class III].
The Centre for Advanced (CAS) School.
The Free Dictionary.The free dictionary. Available at http://www.thefreedictionary.com/majority%20rule
Thomson, G.1998 Provision for Special Educational needs in Pakistan _ An Overview Report to the
United Kingdom Government's Department for International Development on aConsultancy Mission 28th September - 16th October.
Tulasidhar, V. B.1993 Maternal Education, Female Labour Force Participation and Child Mortality:
Evidence from the Indian Census. Health Transition Review 3(2).
UNESCO.1995 World Education Report. UNESCO and Oxford University Press, New York.
UNDP.2003 Human Development Report 2003. Oxford University Press, New York.
UNICEF.Pakistan Facts and Figures 2003.
Van de Walle, D. and Nead, K.1995 Public Spending and the Poor. Theory and Evidence. Johns Hopkins and World
Bank, Washington D.C.
SELE
CTE
D S
OC
IAL
DEV
ELO
PMEN
TIN
DIC
ATO
RS
So
cia
l D
eve
lop
me
nt
in P
aki
sta
n,
20
02
-03
234

Van de Walle, D.1995 The Distribution of Subsidies Through Public Health Services in Indonesia, 1978-
87. In Van de Walle and Nead (1995), Chapter 9.Van de Walle, D.1998 Assessing the Welfare Impacts of Public Spending. World Development 26(3),
pp.# 365-379.
Watkins, K.2001 The Oxfam Education Report. Oxfam.
White, H.1980 A Hetroskedasticity-consistent Covariance Matrix Estimator and a Direct Test for
Hetroskedasticity. Econometrica (48).
World Bank.1996 India: Second District Primary Education Project. Available at
http://www.worldbank.org/education/economicsed/project/projwork/good/india/po15496.htm
2002 Pakistan Poverty Assessment. World Bank, Islamabad
2002 Determinants of Child Mortality and Morbidity in China. Available athttp://www.worldbank.org/wbi/B-SPAN/sub_child_mortality_china.htm
2002 Knowledge and Assessment. Available athttp://www1.worldbank.org/gdIn-scripts/programs/kam2002/kamscript.exe
SELE
CTE
D S
OC
IAL
DEV
ELO
PMEN
TIN
DIC
ATO
RS
So
cia
l D
eve
lop
me
nt
in P
aki
sta
n,
20
02
-03
235
Social Policy and Development Centre15-Maqbool Co-operative Housing SocietyBlock 7 & 8, Karachi 75350, PakistanTel: (92-21) 111-113-113Fax: (92-21) 4534285E-mail: [email protected]://www.spdc-pak.com
The state of education in Pakistan is far from satisfactory. There hashowever, been some recognition of this problem and efforts have beenmade to improve the educational profile. The discussion has, however,
remained largely confined to the subjects of enrolment, particularly at theprimary level, and resource allocations. While both these topics areimportant, there are other crucial underlying problems that have generallynot found place in the debate on education. Several questions arise. Howcritical is the state of education in Pakistan? Where does Pakistan stand inrelation to other countries in the region? How unequal is the distribution ofeducational opportunities? Is land inequality a barrier to education? Why iseducation important for economic growth and development? Where doesPakistan stand with respect to knowledge-based economies? How hasmacroeconomic policy impacted education? Which level of education hashigher rates of return? What are the underlying problems with the primaryeducation curriculum? How are examinations the bane of scienceeducation? How have the different streams of education created divergentworldviews?
The State of Education, SPDC's fifth annual review of Social Developmentin Pakistan, endeavors to answer all these questions. It attempts an in-depthexamination and analysis of the global as well as sectoral aspects ofeducation in Pakistan and identifies the necessary areas of intervention witha view to raising the human resource level of the country.