Social capital and women’s reduced vulnerability to HIV infection in rural Zimbabwe
25
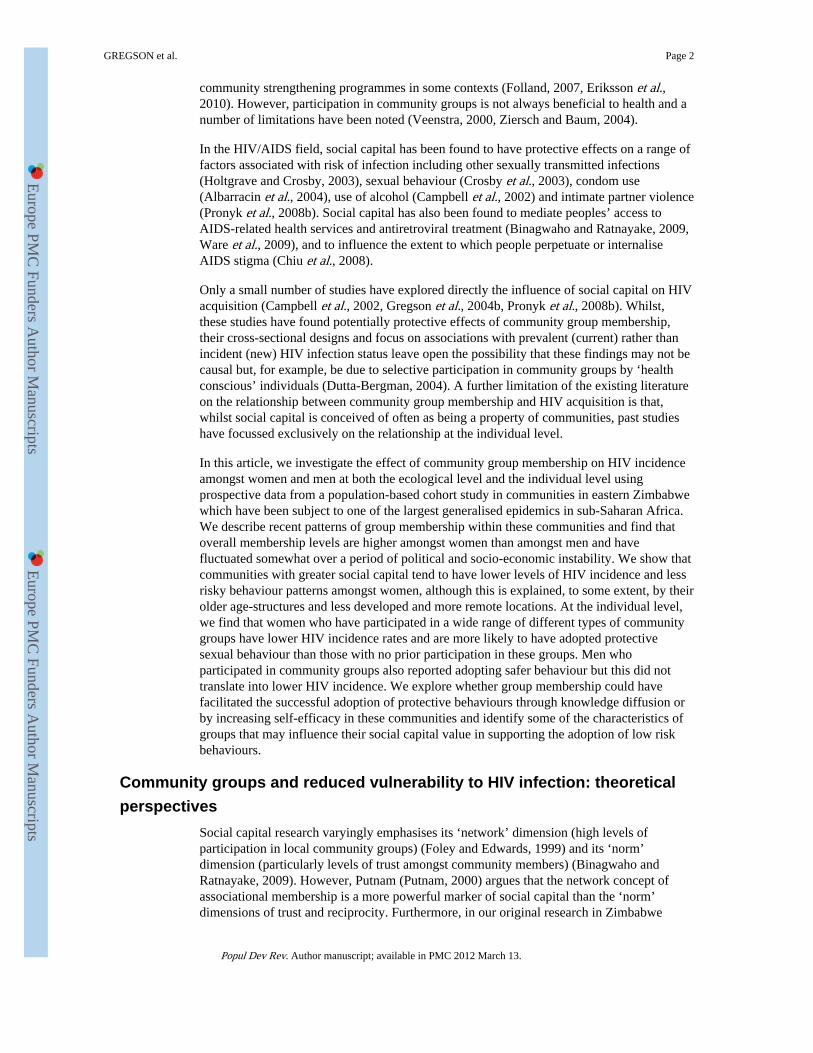
Social Capital and Women's Reduced Vulnerability to HIV infection in Rural Zimbabwe SIMON GREGSON, PHYLLIS MUSHATI, HARRY GRUSIN, MERCY NHAMO, CHRISTINA SCHUMACHER, MORTEN SKOVDAL, CONSTANCE NYAMUKAPA, and CATHERINE CAMPBELL Simon Gregson DPhil is Professor of Demography and Behavioural Science at Imperial College London (ICL) and Director of the Manicaland HIV/STD Prevention Project at the Biomedical Research and Training Institute (BRTI), Harare; Phyllis Mushati MSc is a Research Fellow at the BRTI; Harry Grusin MSc has no institutional affiliation; Mercy Nhamo MSc is a Post-Graduate Research Student at the London School of Economics and Political Science (LSE); Christina Schumacher PhD and Constance Nyamukapa PhD are Research Associates at ICL; Morten Skovdal is a Post-Doctoral Research Fellow at the LSE; Catherine Campbell PhD is Professor of Social Psychology at the LSE Abstract Social capital - especially through its ‘network’ dimension (high levels of participation in local community groups) - is thought to be an important determinant of health in many contexts. We investigate its effect on HIV prevention, using prospective data from a general population cohort in eastern Zimbabwe spanning a period of extensive behaviour change (1998-2003). Almost half of the initially uninfected women interviewed were members of at least one community group. In an ecological analysis of 88 communities, those with higher levels of community group participation had lower incidence of new HIV infections and more had adopted safer behaviours, although these effects were largely accounted for by differences in socio-demographic composition. Individual women in community groups had lower HIV incidence and more extensive behaviour change, even after controlling for confounding factors. Community group membership was not associated with lower HIV incidence in men, possibly reflecting a propensity amongst men to participate in groups that allow them to develop and demonstrate their masculine identities – often at the expense of their health. Support for women’s community groups could be an effective HIV prevention strategy in countries with large-scale HIV epidemics. SOCIAL CAPITAL refers to the community cohesion that results from positive aspects of community life, particularly from high levels of civic engagement as reflected in membership of local voluntary associations (Putnam, 2000). A growing amount of evidence suggests that social capital is an important determinant of health in many contexts (Kim et al., 2008), and that certain forms of community group membership might predispose people to make more effective use of HIV/AIDS prevention, care and treatment services. The high levels of interest in the concept of social capital in the HIV/AIDS field relate to growing consensus that the disappointing outcomes of many traditional biomedically and behaviourally oriented programmes may have been due in part to their failure to engage with pre-existing local community groups and resources, or to resonate with the perceived needs and interests of their target communities (Hawe and Shiell, 2000). In order to achieve such resonance, these programmes need to be supplemented by efforts to create ‘health-enabling community contexts’, social settings which support the likelihood that people will make optimal use of prevention, care and treatment services (Campbell et al., 2007, Campbell et al., 2009). Enhancing peoples’ opportunities for social participation in local community groups and networks is increasingly being put forward as a potential strategy for such Europe PMC Funders Group Author Manuscript Popul Dev Rev. Author manuscript; available in PMC 2012 March 13. Published in final edited form as: Popul Dev Rev. 2011 ; 37(2): 333–359. Europe PMC Funders Author Manuscripts Europe PMC Funders Author Manuscripts
Transcript of Social capital and women’s reduced vulnerability to HIV infection in rural Zimbabwe
Social Capital and Women's Reduced Vulnerability to HIVinfection in Rural Zimbabwe
SIMON GREGSON, PHYLLIS MUSHATI, HARRY GRUSIN, MERCY NHAMO, CHRISTINASCHUMACHER, MORTEN SKOVDAL, CONSTANCE NYAMUKAPA, and CATHERINECAMPBELLSimon Gregson DPhil is Professor of Demography and Behavioural Science at Imperial CollegeLondon (ICL) and Director of the Manicaland HIV/STD Prevention Project at the BiomedicalResearch and Training Institute (BRTI), Harare; Phyllis Mushati MSc is a Research Fellow at theBRTI; Harry Grusin MSc has no institutional affiliation; Mercy Nhamo MSc is a Post-GraduateResearch Student at the London School of Economics and Political Science (LSE); ChristinaSchumacher PhD and Constance Nyamukapa PhD are Research Associates at ICL; MortenSkovdal is a Post-Doctoral Research Fellow at the LSE; Catherine Campbell PhD is Professor ofSocial Psychology at the LSE
AbstractSocial capital - especially through its ‘network’ dimension (high levels of participation in localcommunity groups) - is thought to be an important determinant of health in many contexts. Weinvestigate its effect on HIV prevention, using prospective data from a general population cohortin eastern Zimbabwe spanning a period of extensive behaviour change (1998-2003). Almost halfof the initially uninfected women interviewed were members of at least one community group. Inan ecological analysis of 88 communities, those with higher levels of community groupparticipation had lower incidence of new HIV infections and more had adopted safer behaviours,although these effects were largely accounted for by differences in socio-demographiccomposition. Individual women in community groups had lower HIV incidence and moreextensive behaviour change, even after controlling for confounding factors. Community groupmembership was not associated with lower HIV incidence in men, possibly reflecting a propensityamongst men to participate in groups that allow them to develop and demonstrate their masculineidentities – often at the expense of their health. Support for women’s community groups could bean effective HIV prevention strategy in countries with large-scale HIV epidemics.
SOCIAL CAPITAL refers to the community cohesion that results from positive aspects ofcommunity life, particularly from high levels of civic engagement as reflected inmembership of local voluntary associations (Putnam, 2000). A growing amount of evidencesuggests that social capital is an important determinant of health in many contexts (Kim etal., 2008), and that certain forms of community group membership might predispose peopleto make more effective use of HIV/AIDS prevention, care and treatment services.
The high levels of interest in the concept of social capital in the HIV/AIDS field relate togrowing consensus that the disappointing outcomes of many traditional biomedically andbehaviourally oriented programmes may have been due in part to their failure to engage withpre-existing local community groups and resources, or to resonate with the perceived needsand interests of their target communities (Hawe and Shiell, 2000). In order to achieve suchresonance, these programmes need to be supplemented by efforts to create ‘health-enablingcommunity contexts’, social settings which support the likelihood that people will makeoptimal use of prevention, care and treatment services (Campbell et al., 2007, Campbell etal., 2009). Enhancing peoples’ opportunities for social participation in local communitygroups and networks is increasingly being put forward as a potential strategy for such
Europe PMC Funders GroupAuthor ManuscriptPopul Dev Rev. Author manuscript; available in PMC 2012 March 13.
Published in final edited form as:Popul Dev Rev. 2011 ; 37(2): 333–359.
Europe PM
C Funders A
uthor Manuscripts
Europe PM
C Funders A
uthor Manuscripts
community strengthening programmes in some contexts (Folland, 2007, Eriksson et al.,2010). However, participation in community groups is not always beneficial to health and anumber of limitations have been noted (Veenstra, 2000, Ziersch and Baum, 2004).
In the HIV/AIDS field, social capital has been found to have protective effects on a range offactors associated with risk of infection including other sexually transmitted infections(Holtgrave and Crosby, 2003), sexual behaviour (Crosby et al., 2003), condom use(Albarracin et al., 2004), use of alcohol (Campbell et al., 2002) and intimate partner violence(Pronyk et al., 2008b). Social capital has also been found to mediate peoples’ access toAIDS-related health services and antiretroviral treatment (Binagwaho and Ratnayake, 2009,Ware et al., 2009), and to influence the extent to which people perpetuate or internaliseAIDS stigma (Chiu et al., 2008).
Only a small number of studies have explored directly the influence of social capital on HIVacquisition (Campbell et al., 2002, Gregson et al., 2004b, Pronyk et al., 2008b). Whilst,these studies have found potentially protective effects of community group membership,their cross-sectional designs and focus on associations with prevalent (current) rather thanincident (new) HIV infection status leave open the possibility that these findings may not becausal but, for example, be due to selective participation in community groups by ‘healthconscious’ individuals (Dutta-Bergman, 2004). A further limitation of the existing literatureon the relationship between community group membership and HIV acquisition is that,whilst social capital is conceived of often as being a property of communities, past studieshave focussed exclusively on the relationship at the individual level.
In this article, we investigate the effect of community group membership on HIV incidenceamongst women and men at both the ecological level and the individual level usingprospective data from a population-based cohort study in communities in eastern Zimbabwewhich have been subject to one of the largest generalised epidemics in sub-Saharan Africa.We describe recent patterns of group membership within these communities and find thatoverall membership levels are higher amongst women than amongst men and havefluctuated somewhat over a period of political and socio-economic instability. We show thatcommunities with greater social capital tend to have lower levels of HIV incidence and lessrisky behaviour patterns amongst women, although this is explained, to some extent, by theirolder age-structures and less developed and more remote locations. At the individual level,we find that women who have participated in a wide range of different types of communitygroups have lower HIV incidence rates and are more likely to have adopted protectivesexual behaviour than those with no prior participation in these groups. Men whoparticipated in community groups also reported adopting safer behaviour but this did nottranslate into lower HIV incidence. We explore whether group membership could havefacilitated the successful adoption of protective behaviours through knowledge diffusion orby increasing self-efficacy in these communities and identify some of the characteristics ofgroups that may influence their social capital value in supporting the adoption of low riskbehaviours.
Community groups and reduced vulnerability to HIV infection: theoreticalperspectives
Social capital research varyingly emphasises its ‘network’ dimension (high levels ofparticipation in local community groups) (Foley and Edwards, 1999) and its ‘norm’dimension (particularly levels of trust amongst community members) (Binagwaho andRatnayake, 2009). However, Putnam (Putnam, 2000) argues that the network concept ofassociational membership is a more powerful marker of social capital than the ‘norm’dimensions of trust and reciprocity. Furthermore, in our original research in Zimbabwe
GREGSON et al. Page 2
Popul Dev Rev. Author manuscript; available in PMC 2012 March 13.
Europe PM
C Funders A
uthor Manuscripts
Europe PM
C Funders A
uthor Manuscripts
(Gregson et al., 2004b), we found no relationship between measures of trust and reciprocalhelp and support, the two ‘norm’ measures most frequently used in social capital research.Against this background, we define social capital in terms of peoples’ participation in localcommunity groups (Campbell et al., 2002, Gregson et al., 2004b).
Community groups are seen to facilitate psychosocial determinants of healthy behaviours,first, because they provide networks for the diffusion of health-related information(knowledge diffusion) and, second, because the solidarity that arises from membership of apositively valued social group, with all the associated benefits of group membership, leadsto higher levels of confidence in one’s ability to take control of one’s health (health-relatedagency or perceived self-efficacy (Bandura, 1977, Wallerstein, 1992)).
However, the influence of social capital on health is complex and varied and differentstudies have sometimes yielded apparently conflicting results. Social capital has been foundto have negative as well as positive effects on health (Portes and Landolt, 1996) and thesocial capital value of a given community group in a particular context may lie on acontinuum that ranges from the positive to the negative depending on its structuralproperties (Astone et al., 1999). Previously, we have suggested that this might be becausethe social capital ‘value’ of community groups in relation to improved health variesaccording to individual member and group characteristics (Gregson et al., 2004b).
At the individual level, the effect of group membership has been found to vary by gender(Norris and Inglehart, 2006, Pronyk et al., 2008b), ethnicity (Nhamo et al., In press), andeducational attainment (Gregson et al., 2004b). At the level of the community groupsthemselves, it is believed that intra-group, inter-group and beyond group characteristics allcan be important. Community groups can open up ‘social spaces’ for informal dialogue inwhich liked and trusted peers are able to ‘translate’ alien biomedical information into locallyappropriate language and terminology that makes sense to group members, and to debateany reservations they might have about the value of the knowledge (renegotiation of peernorms). Such dialogue provides opportunities for peer group members to formulate health-enhancing action plans which are realistic in the light of locally mediated social, economicand cultural constraints on behaviour. Community groups may be more likely to facilitateimprovements in health and healthcare when they create contexts for the development of asense of comradeship and solidarity which boosts members’ confidence, social skills andsense of perceived self-efficacy (‘bonding social capital’) (Putnam, 2000, Saegart et al.,2001, Campbell and MacPhail, 2002, Wouters et al., 2009). At the same time, groups with adegree of diversity in their membership could increase the likelihood of programme successby putting members in touch with diverse and more powerful social groupings who providesupport and assistance (‘bridging social capital’) (Campbell and Mzaidume, 2001, Skovdalet al., 2010). Other intra-group characteristics that could be important in determining thesocial capital value of a particular community group include whether the group functionseffectively, the frequency and timing of meetings, whether the group has a horizontal or ahierarchical structure (Collier, 1998), whether meetings are cooperative or conflictual, theformality of meeting structures, whether meeting agendas are open or narrowly focussed,meeting settings, alcohol consumption and whether the group has external sponsorship(Gregson et al., 2004b). Inter- and extra-group ties through overlapping memberships,interactions with similar and different groups (Putnam, 1993, Woolcock, 2001), andprovision of assistance for non-members also may be important.
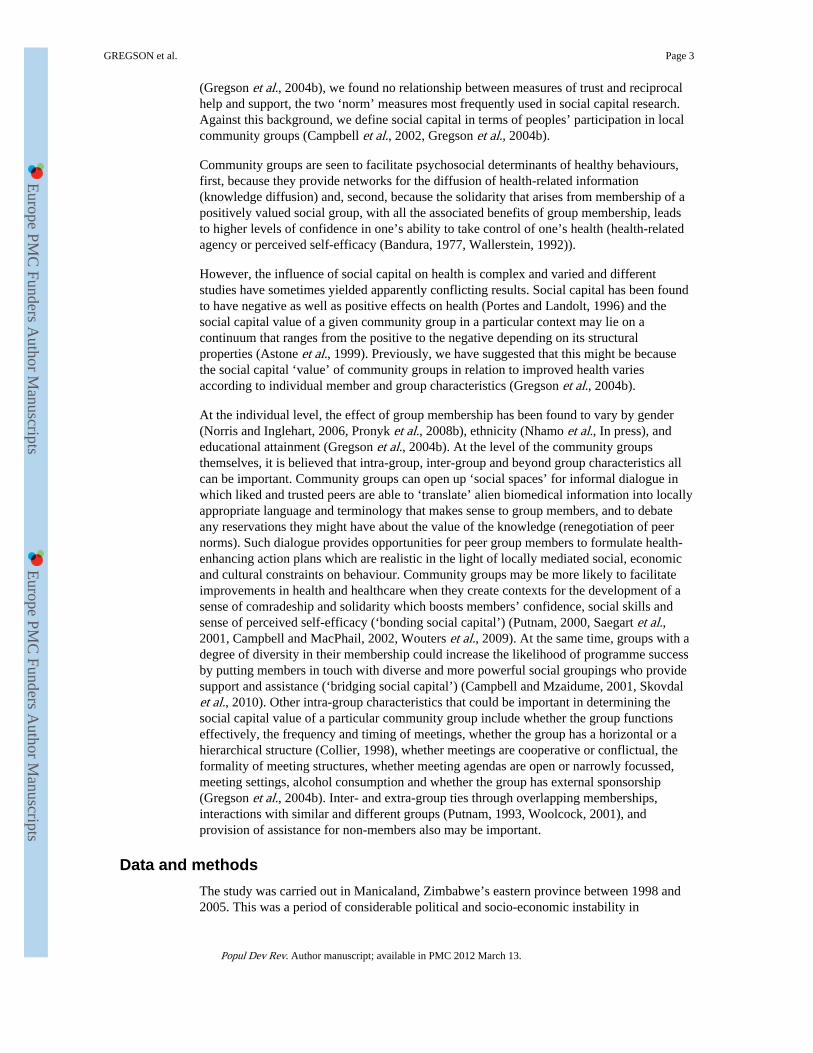
Data and methodsThe study was carried out in Manicaland, Zimbabwe’s eastern province between 1998 and2005. This was a period of considerable political and socio-economic instability in
GREGSON et al. Page 3
Popul Dev Rev. Author manuscript; available in PMC 2012 March 13.
Europe PM
C Funders A
uthor Manuscripts
Europe PM
C Funders A
uthor Manuscripts
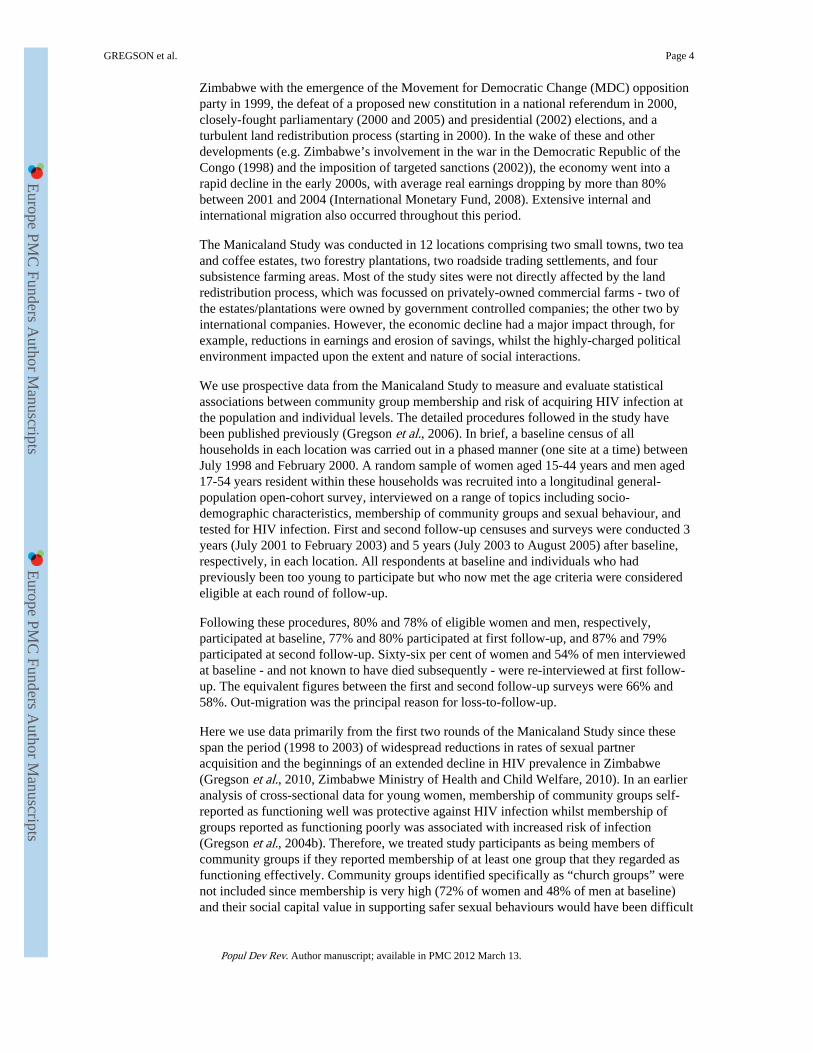
Zimbabwe with the emergence of the Movement for Democratic Change (MDC) oppositionparty in 1999, the defeat of a proposed new constitution in a national referendum in 2000,closely-fought parliamentary (2000 and 2005) and presidential (2002) elections, and aturbulent land redistribution process (starting in 2000). In the wake of these and otherdevelopments (e.g. Zimbabwe’s involvement in the war in the Democratic Republic of theCongo (1998) and the imposition of targeted sanctions (2002)), the economy went into arapid decline in the early 2000s, with average real earnings dropping by more than 80%between 2001 and 2004 (International Monetary Fund, 2008). Extensive internal andinternational migration also occurred throughout this period.
The Manicaland Study was conducted in 12 locations comprising two small towns, two teaand coffee estates, two forestry plantations, two roadside trading settlements, and foursubsistence farming areas. Most of the study sites were not directly affected by the landredistribution process, which was focussed on privately-owned commercial farms - two ofthe estates/plantations were owned by government controlled companies; the other two byinternational companies. However, the economic decline had a major impact through, forexample, reductions in earnings and erosion of savings, whilst the highly-charged politicalenvironment impacted upon the extent and nature of social interactions.
We use prospective data from the Manicaland Study to measure and evaluate statisticalassociations between community group membership and risk of acquiring HIV infection atthe population and individual levels. The detailed procedures followed in the study havebeen published previously (Gregson et al., 2006). In brief, a baseline census of allhouseholds in each location was carried out in a phased manner (one site at a time) betweenJuly 1998 and February 2000. A random sample of women aged 15-44 years and men aged17-54 years resident within these households was recruited into a longitudinal general-population open-cohort survey, interviewed on a range of topics including socio-demographic characteristics, membership of community groups and sexual behaviour, andtested for HIV infection. First and second follow-up censuses and surveys were conducted 3years (July 2001 to February 2003) and 5 years (July 2003 to August 2005) after baseline,respectively, in each location. All respondents at baseline and individuals who hadpreviously been too young to participate but who now met the age criteria were consideredeligible at each round of follow-up.
Following these procedures, 80% and 78% of eligible women and men, respectively,participated at baseline, 77% and 80% participated at first follow-up, and 87% and 79%participated at second follow-up. Sixty-six per cent of women and 54% of men interviewedat baseline - and not known to have died subsequently - were re-interviewed at first follow-up. The equivalent figures between the first and second follow-up surveys were 66% and58%. Out-migration was the principal reason for loss-to-follow-up.
Here we use data primarily from the first two rounds of the Manicaland Study since thesespan the period (1998 to 2003) of widespread reductions in rates of sexual partneracquisition and the beginnings of an extended decline in HIV prevalence in Zimbabwe(Gregson et al., 2010, Zimbabwe Ministry of Health and Child Welfare, 2010). In an earlieranalysis of cross-sectional data for young women, membership of community groups self-reported as functioning well was protective against HIV infection whilst membership ofgroups reported as functioning poorly was associated with increased risk of infection(Gregson et al., 2004b). Therefore, we treated study participants as being members ofcommunity groups if they reported membership of at least one group that they regarded asfunctioning effectively. Community groups identified specifically as “church groups” werenot included since membership is very high (72% of women and 48% of men at baseline)and their social capital value in supporting safer sexual behaviours would have been difficult
GREGSON et al. Page 4
Popul Dev Rev. Author manuscript; available in PMC 2012 March 13.
Europe PM
C Funders A
uthor Manuscripts
Europe PM
C Funders A
uthor Manuscripts
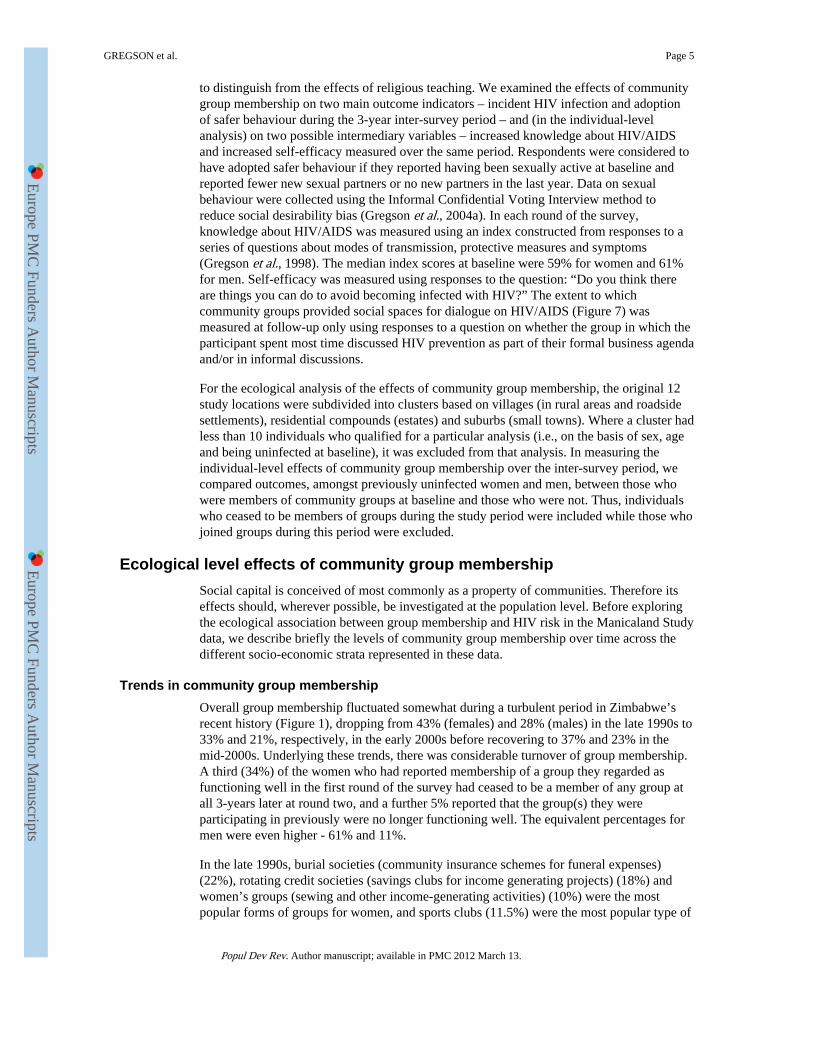
to distinguish from the effects of religious teaching. We examined the effects of communitygroup membership on two main outcome indicators – incident HIV infection and adoptionof safer behaviour during the 3-year inter-survey period – and (in the individual-levelanalysis) on two possible intermediary variables – increased knowledge about HIV/AIDSand increased self-efficacy measured over the same period. Respondents were considered tohave adopted safer behaviour if they reported having been sexually active at baseline andreported fewer new sexual partners or no new partners in the last year. Data on sexualbehaviour were collected using the Informal Confidential Voting Interview method toreduce social desirability bias (Gregson et al., 2004a). In each round of the survey,knowledge about HIV/AIDS was measured using an index constructed from responses to aseries of questions about modes of transmission, protective measures and symptoms(Gregson et al., 1998). The median index scores at baseline were 59% for women and 61%for men. Self-efficacy was measured using responses to the question: “Do you think thereare things you can do to avoid becoming infected with HIV?” The extent to whichcommunity groups provided social spaces for dialogue on HIV/AIDS (Figure 7) wasmeasured at follow-up only using responses to a question on whether the group in which theparticipant spent most time discussed HIV prevention as part of their formal business agendaand/or in informal discussions.
For the ecological analysis of the effects of community group membership, the original 12study locations were subdivided into clusters based on villages (in rural areas and roadsidesettlements), residential compounds (estates) and suburbs (small towns). Where a cluster hadless than 10 individuals who qualified for a particular analysis (i.e., on the basis of sex, ageand being uninfected at baseline), it was excluded from that analysis. In measuring theindividual-level effects of community group membership over the inter-survey period, wecompared outcomes, amongst previously uninfected women and men, between those whowere members of community groups at baseline and those who were not. Thus, individualswho ceased to be members of groups during the study period were included while those whojoined groups during this period were excluded.
Ecological level effects of community group membershipSocial capital is conceived of most commonly as a property of communities. Therefore itseffects should, wherever possible, be investigated at the population level. Before exploringthe ecological association between group membership and HIV risk in the Manicaland Studydata, we describe briefly the levels of community group membership over time across thedifferent socio-economic strata represented in these data.
Trends in community group membershipOverall group membership fluctuated somewhat during a turbulent period in Zimbabwe’srecent history (Figure 1), dropping from 43% (females) and 28% (males) in the late 1990s to33% and 21%, respectively, in the early 2000s before recovering to 37% and 23% in themid-2000s. Underlying these trends, there was considerable turnover of group membership.A third (34%) of the women who had reported membership of a group they regarded asfunctioning well in the first round of the survey had ceased to be a member of any group atall 3-years later at round two, and a further 5% reported that the group(s) they wereparticipating in previously were no longer functioning well. The equivalent percentages formen were even higher - 61% and 11%.
In the late 1990s, burial societies (community insurance schemes for funeral expenses)(22%), rotating credit societies (savings clubs for income generating projects) (18%) andwomen’s groups (sewing and other income-generating activities) (10%) were the mostpopular forms of groups for women, and sports clubs (11.5%) were the most popular type of
GREGSON et al. Page 5
Popul Dev Rev. Author manuscript; available in PMC 2012 March 13.
Europe PM
C Funders A
uthor Manuscripts
Europe PM
C Funders A
uthor Manuscripts
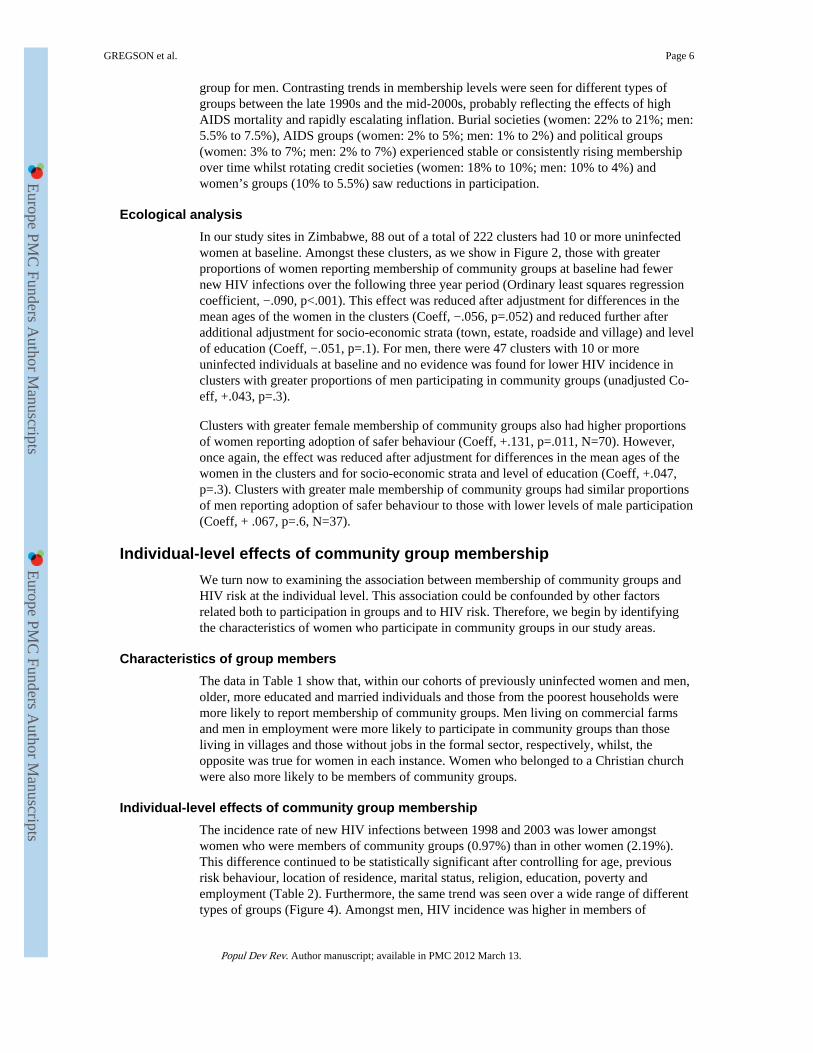
group for men. Contrasting trends in membership levels were seen for different types ofgroups between the late 1990s and the mid-2000s, probably reflecting the effects of highAIDS mortality and rapidly escalating inflation. Burial societies (women: 22% to 21%; men:5.5% to 7.5%), AIDS groups (women: 2% to 5%; men: 1% to 2%) and political groups(women: 3% to 7%; men: 2% to 7%) experienced stable or consistently rising membershipover time whilst rotating credit societies (women: 18% to 10%; men: 10% to 4%) andwomen’s groups (10% to 5.5%) saw reductions in participation.
Ecological analysisIn our study sites in Zimbabwe, 88 out of a total of 222 clusters had 10 or more uninfectedwomen at baseline. Amongst these clusters, as we show in Figure 2, those with greaterproportions of women reporting membership of community groups at baseline had fewernew HIV infections over the following three year period (Ordinary least squares regressioncoefficient, −.090, p<.001). This effect was reduced after adjustment for differences in themean ages of the women in the clusters (Coeff, −.056, p=.052) and reduced further afteradditional adjustment for socio-economic strata (town, estate, roadside and village) and levelof education (Coeff, −.051, p=.1). For men, there were 47 clusters with 10 or moreuninfected individuals at baseline and no evidence was found for lower HIV incidence inclusters with greater proportions of men participating in community groups (unadjusted Co-eff, +.043, p=.3).
Clusters with greater female membership of community groups also had higher proportionsof women reporting adoption of safer behaviour (Coeff, +.131, p=.011, N=70). However,once again, the effect was reduced after adjustment for differences in the mean ages of thewomen in the clusters and for socio-economic strata and level of education (Coeff, +.047,p=.3). Clusters with greater male membership of community groups had similar proportionsof men reporting adoption of safer behaviour to those with lower levels of male participation(Coeff, + .067, p=.6, N=37).
Individual-level effects of community group membershipWe turn now to examining the association between membership of community groups andHIV risk at the individual level. This association could be confounded by other factorsrelated both to participation in groups and to HIV risk. Therefore, we begin by identifyingthe characteristics of women who participate in community groups in our study areas.
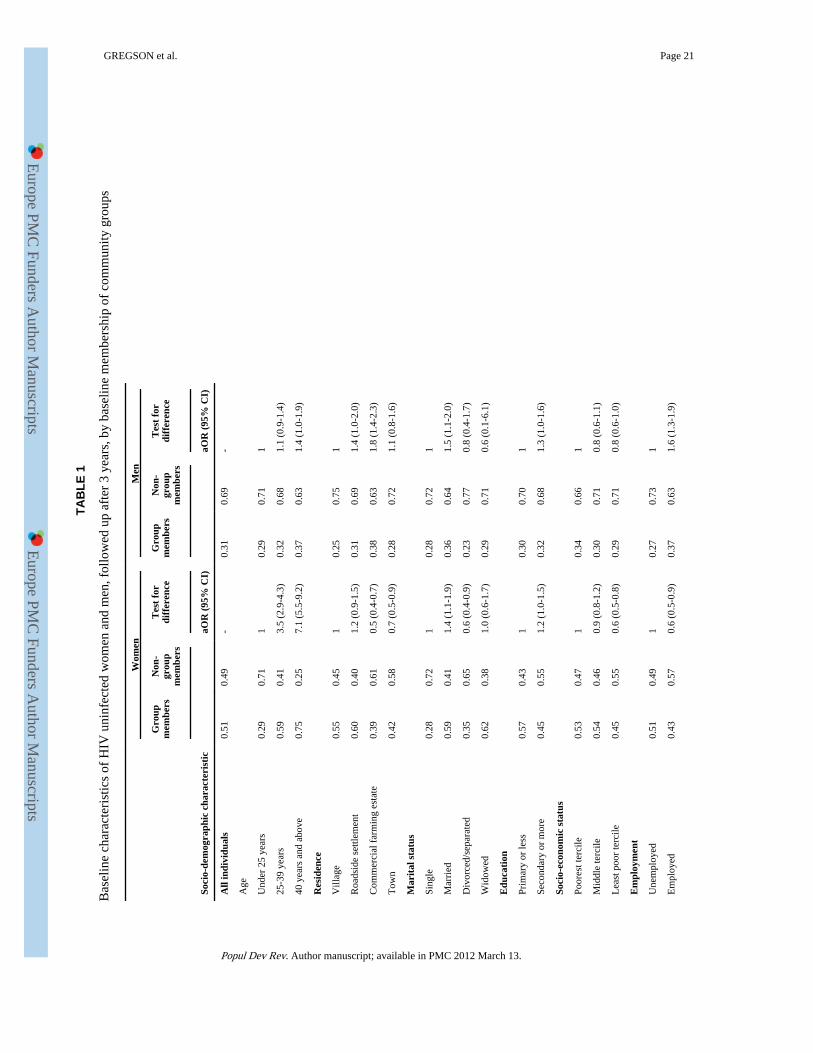
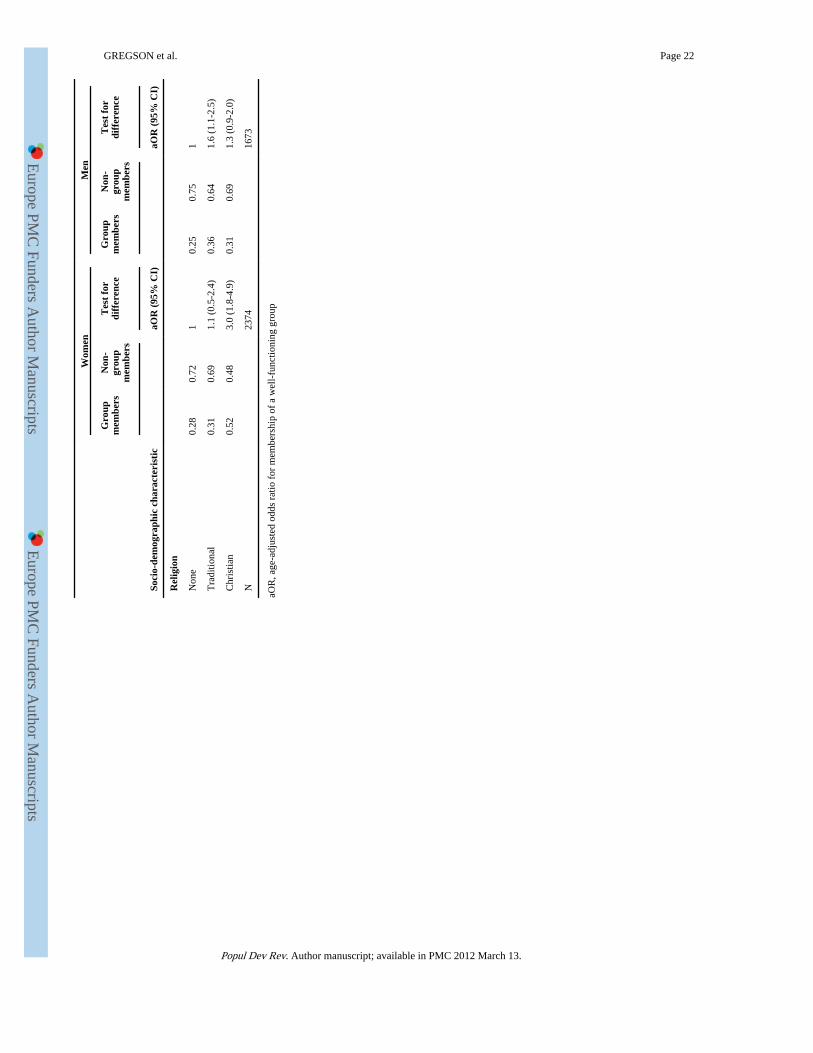
Characteristics of group membersThe data in Table 1 show that, within our cohorts of previously uninfected women and men,older, more educated and married individuals and those from the poorest households weremore likely to report membership of community groups. Men living on commercial farmsand men in employment were more likely to participate in community groups than thoseliving in villages and those without jobs in the formal sector, respectively, whilst, theopposite was true for women in each instance. Women who belonged to a Christian churchwere also more likely to be members of community groups.
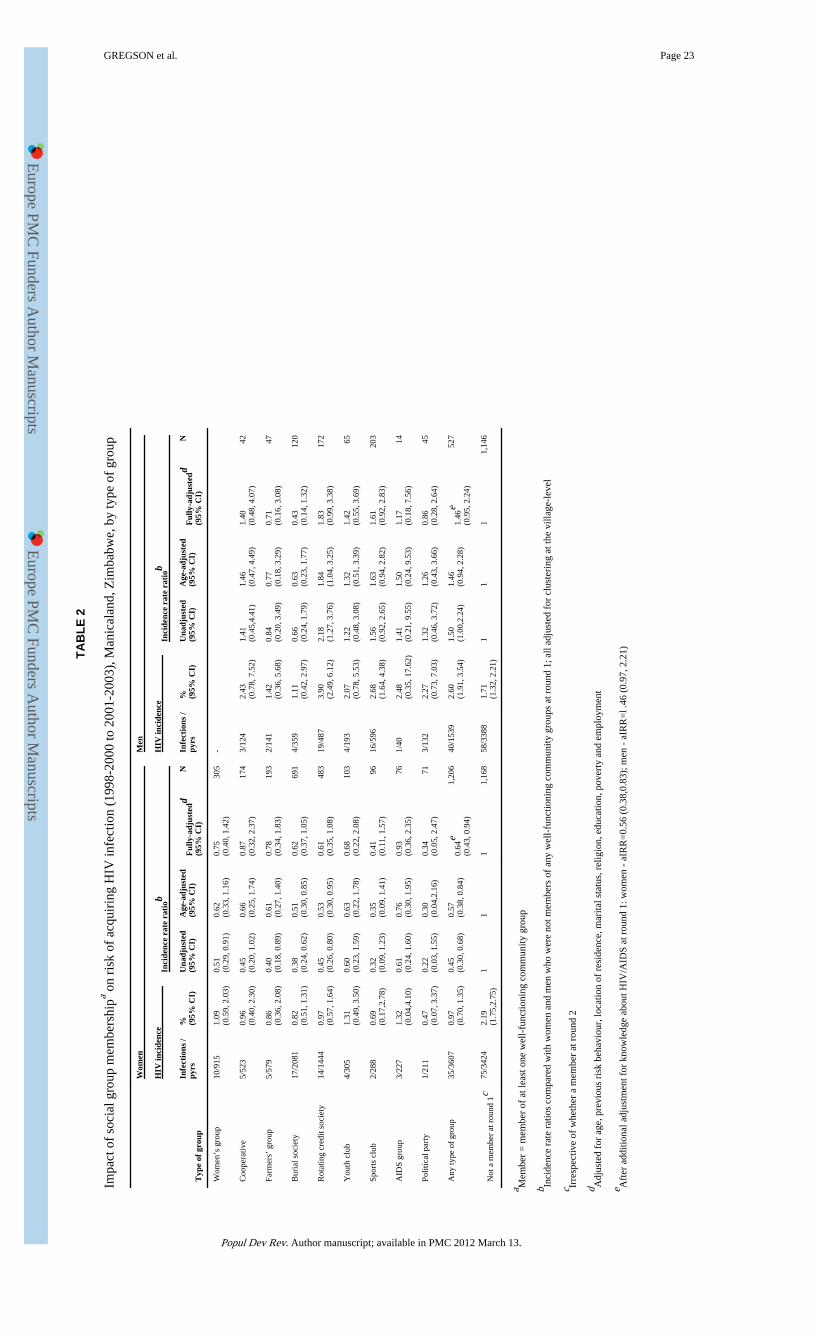
Individual-level effects of community group membershipThe incidence rate of new HIV infections between 1998 and 2003 was lower amongstwomen who were members of community groups (0.97%) than in other women (2.19%).This difference continued to be statistically significant after controlling for age, previousrisk behaviour, location of residence, marital status, religion, education, poverty andemployment (Table 2). Furthermore, the same trend was seen over a wide range of differenttypes of groups (Figure 4). Amongst men, HIV incidence was higher in members of
GREGSON et al. Page 6
Popul Dev Rev. Author manuscript; available in PMC 2012 March 13.
Europe PM
C Funders A
uthor Manuscripts
Europe PM
C Funders A
uthor Manuscripts
community groups (2.60% versus 1.71%) but this difference ceased to be statisticallysignificant after controlling for age (p=.1). The pattern of association between communitygroup membership and HIV incidence varied amongst the different types of groups with nosignificant effects being seen.
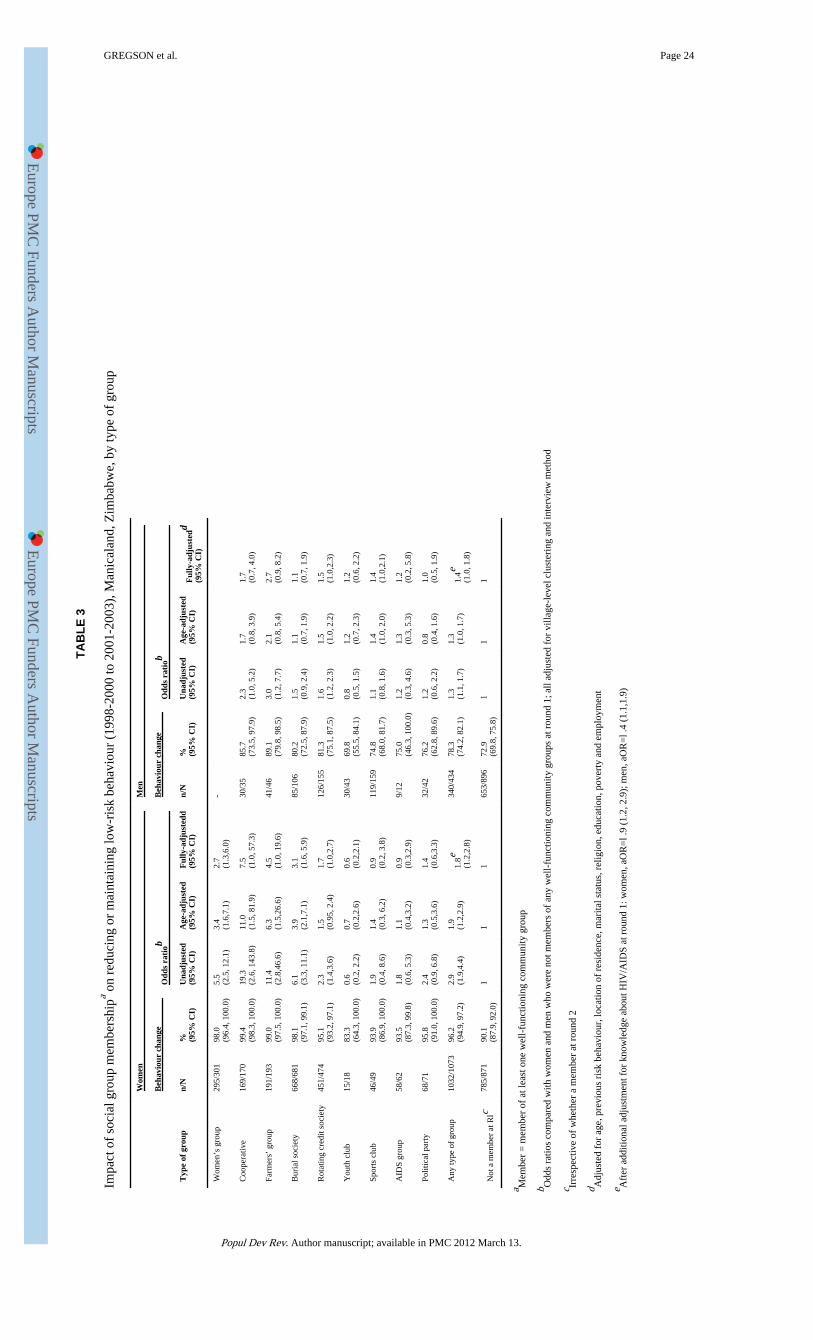
Adoption of less risky sexual behaviour was also more common in women who weremembers of community groups at baseline (Table 3). Amongst the sexually active women incommunity groups, 96.2% had either kept to a single partner or had reduced their number ofsexual partners in the last year compared to 90.1% of other sexually active women. Onceagain, this effect remained statistically significant after controlling for known confoundingfactors and was observed across a wide range of different types of community groups(Figure 5). Adoption of less risky behaviour was also reported more frequently by men whowere members of community groups than by other men (78.3% versus 72.9%. A similarpattern was seen in most types of groups.
Psychosocial determinants of healthy behaviourAccording to the theory on social capital, community group membership can lead toincreases in healthier behaviours by facilitating the development of individual psychosocialcharacteristics that support the adoption of these behaviours. In particular, this can occurthrough knowledge diffusion and increases in perceived self-efficacy.
In our study populations, women who were already members of community groups hadbetter knowledge about HIV/AIDS at baseline (Gregson et al., 2004b). However, we foundthat membership of community groups had led to only modest improvements in knowledgeabout HIV/AIDS during the follow-up period. Thirty-five percent of the women whoreported membership of community groups at baseline had improved their score on theknowledge index by 5% or more during the inter-survey period compared with 31% of thewomen who had not previously been members of these groups. Furthermore, the differencewas only statistically significant for members of burial societies (Figure 6a). In contrast, alarger increase in the proportion of women who believed there were things they could do toavoid becoming infected with HIV (self-efficacy) occurred between 1998 and 2003 amongstthose who were members of community groups than amongst those that were not (26%versus 15%). This trend was observed in all forms of groups except youth clubs (Figure 6b).
Similar proportions of men who were participating and not participating in communitygroups at baseline (37% in each case) had improved their score on the knowledge index by5% or more during the inter-survey period. There were no signs in the data of variations bytype of group. Most men in the cohort believed there were things they could do to avoidbecoming infected with HIV and the proportion increased over time from 93% to 97%;however, no difference was found between the increases in those who were members ofcommunity groups and those who were not.
Characteristics of community groups that may assist their members inreducing HIV risk
In the second round of the Manicaland Study (2001-2003), we collected data on groupcharacteristics suggested in the literature (Gregson et al., 2004b) as potentially enhancingthe effect of community groups in assisting their members to avoid HIV infection (Table 4).We found that community groups generally met on a regular basis (53% of membersreported meeting weekly and a further 40% said they met monthly). Two-thirds of therespondents (65%) reported discussing HIV/AIDS issues during their meetings either as partof the formal agenda or informally and there was evidence that this was the case not only in
GREGSON et al. Page 7
Popul Dev Rev. Author manuscript; available in PMC 2012 March 13.
Europe PM
C Funders A
uthor Manuscripts
Europe PM
C Funders A
uthor Manuscripts
AIDS groups but in groups as diverse as sports clubs and farmers groups (Figure 7). In mostcases, meetings were said to be cooperative (90%) rather than conflictual (10%).
There was considerable heterogeneity in the membership of the individual groups. Forexample, 52% of women and 45% of men reported that the group they spent most time inalso had members from the opposite sex. Most groups had members from differenteducational backgrounds. Teenagers participated to some extent in all groups but, as wouldbe expected, particularly so in youth groups and sports clubs.
Slightly less than half of the women and men in community groups reported that theirgroups received sponsorship – with non-governmental organisations (18%), churches (16%),political parties (15.5%), employers (8%) and schools (5%) being common sources ofassistance. Two-thirds (68%) of respondents reported that the community groups they spentmost time in assisted or met with other groups of the same or different types and half (54%)said their groups interacted with members of the wider community.
Comparison of characteristics of community groups joined by women andmen
As we noted earlier, women and men tended to join different types of community groups.Women were more likely to participate in rotating credit societies, burial societies andcooperatives and, to a lesser extent, farmers’ groups, AIDS groups and political parties. Menpredominated in sports clubs and youth groups.
More women than men reported that the community group they spent most time in heldmeetings at least once a month (Table 4) but fewer were in a group that discussed AIDS, agroup with young people, a group with a high proportion of more educated people, a groupwith external sponsorship, a group where members drank alcohol or a group that assisted ormet with other groups. Some of these differences reflected underlying differences in thetypes of groups that men and women participated in. The burial societies and rotating creditsocieties favoured by women rarely received external support or assisted other groups whilstthe sports clubs and youth clubs preferred by men generally had younger members and wereoften sponsored by schools or employers. Once contrasts between the types of groups thatwomen and men joined were taken into account, the only differences that remained were inAIDS discussions and alcohol consumption. When analysis is restricted to discussions heldas part of the formal meeting agenda, women were more likely than men to report discussingAIDS in the course of group meetings (42% versus 32%, age- and location-adjusted oddsratio (aOR), 1.50, 95% CI, 1.16, 1.94). This difference was explained by women’s greaterpropensity to join types of groups that hold formal discussions about AIDS (e.g. women’sgroups, youth clubs and AIDS groups).
DiscussionAs has been the case in the country as a whole (Gregson et al., 2010), HIV prevalence inadults has been falling in our study populations in eastern Zimbabwe since the late 1990s –from 23% to 18% over the period 1998 to 2005 (Gregson et al., 2007). This fall in HIVprevalence appears to have followed an acceleration in the rate of decline of new infectionsbetween 1999 and 2004 (Hallett et al., 2009) driven, in part, by reductions in rates of sexualpartner acquisition (Gregson et al., 2006). These changes in behaviour are believed to haveresulted from social changes driven by increased awareness of AIDS deaths aided by HIVprevention programs utilizing both mass media and church-based, workplace-based, andother interpersonal communication activities (Halperin et al., 2011). Our findings heresuggest that these social changes also may have been facilitated by high levels of social
GREGSON et al. Page 8
Popul Dev Rev. Author manuscript; available in PMC 2012 March 13.
Europe PM
C Funders A
uthor Manuscripts
Europe PM
C Funders A
uthor Manuscripts
capital in the form of female civic engagement. Almost half of the previously uninfectedwomen in our population-based cohort were members of community groups at recruitmentand a higher proportion of these women than of their peers who were not members of groupsreported adopting lower rates of sexual partner acquisition during the following three yearsand fewer became infected with HIV. Similar effects were seen also at the ecological levelof analysis although the associations were reduced after adjustment for differences in age,location and education.
Participation in community groups appears to have helped women to adopt safer behavioursand to avoid HIV infection primarily through increased self efficacy, an individual levelcharacteristic which is protective against HIV infection in this population (Gregson et al.).Amongst women who had previously said they did not know what to do to avoid becominginfected with HIV, those who were members of community groups were much more likelyto report feeling able to protect themselves from infection at follow-up. Thus, improvedhealth-related agency stemming from community group activities could have played a partin helping women to adopt safer behaviours.
Past studies on the effects of social capital on health sometimes have appeared to yieldconflicting results. Much of the complexity of social capital may lie in differences in how itis used, defined and measured. Indeed Pronyk and colleagues noted recently that “Despiteover a decade’s experience, there is no universally accepted way to measure social capital”(Pronyk et al., 2008b). In their own study of poor households in rural Limpopo province inSouth Africa, community group membership was associated with greater risk of HIVinfection in women (Pronyk et al., 2008b). However, the apparent discrepancy between thisfinding and the results for women in the current study may be explained by differences inthe way group membership was measured (intensity of membership versus quality of groupfunctioning; household level versus individual level reporting), in the biological specimensused to detect the presence of HIV infection (oral-mucosal transudate versus dried bloodspot specimens), and in the variables controlled for in the statistical analyses (prior historyof high risk sexual behaviour was not controlled for in the South Africa study), as well as bydifferences in some of the factors discussed in the following two paragraphs.
Differences in study methods notwithstanding, it seems clear that social capital does vary inthe effect it has on health outcomes (Portes and Landolt, 1996). We have suggested that thismay reflect differences in local context, local patterns of group membership, and group andindividual member characteristics (Gregson et al., 2004b). The contrasting effects on HIVincidence in women and men found in the current study may reflect gender differences insome of these factors.
The groups in which women participated in our study communities in eastern Zimbabweappear to have had a number of positive features. Almost all groups met at least once amonth and HIV prevention was discussed formally as well as informally by a wide varietyof different types of groups, indicating that community groups provide numerous socialspaces for dialogue about HIV prevention in the study areas. Meetings were reportedoverwhelmingly as being cooperative and the involvement of, for example, more and lesseducated individuals within the same groups, together with extensive interaction with othergroups and the wider community, testify to high levels of ‘bridging’ social capital.
In contrast to these findings for women, we found little evidence that membership ofcommunity groups had assisted men in avoiding HIV infection. We found somewhat greaterreductions in reported sexual risk behaviour amongst male group participants but these didnot translate into lower incidence of new HIV infections. Furthermore, group membershipwas not associated with larger increases in knowledge or self-efficacy in men. A number of
GREGSON et al. Page 9
Popul Dev Rev. Author manuscript; available in PMC 2012 March 13.
Europe PM
C Funders A
uthor Manuscripts
Europe PM
C Funders A
uthor Manuscripts
factors may help to explain the different findings for women and men. These include thegreater and longer-term participation of women in community groups, the pre-existing highlevels of self-efficacy seen amongst men, and the differences in the types and characteristicsof the groups joined by women and men. Men generally have been found to be less likely tojoin groups where AIDS is discussed (Lyttleton, 2004, Skovdal et al., In press) and this wastrue in the current study for formal discussions about AIDS. Men who did participate incommunity groups in Manicaland were more likely to join groups such as sports clubs andpolitical parties, groups that exhibit competitiveness and power rather than care andsustaining of household livelihoods (e.g. AIDS groups, burial societies and creditassociations), a tendency which is linked intrinsically to gender and local constructions ofmasculinities (Barker and Ricardo, 2005). For example, in South Africa, Ragnarsson andcolleagues (Ragnarsson et al., 2009) found that the kind of community groups and networksthat men typically engage with mirror masculinities that actively encourage multiple sexualpartners and related high risk behaviours. This, coupled with men’s greater propensity to bein groups that drink alcohol during or after meetings (69% of men versus 34% of women inthe current study), suggests that community groups are often used by men, not as a means toprotect their family, but as a way to develop and demonstrate their masculine identities –often at the expense of their health. Acknowledging social constructions of masculinity as abarrier to health and well-being, growing efforts are being made to document the pathwaysthrough which men can create social spaces to renegotiate and develop more health-enablingmasculinities (Barker and Ricardo, 2005, Colvin and Robins, 2009, Burke et al., 2010).
One of the main strengths of this study is its use of an actual health outcome (HIVincidence) rather than purely self-rated outcomes. However, a limitation is its reliance onself-reported data on group membership and characteristics (including whether or not thegroup functioned effectively). The data on sexual behaviour were also self-reports but werecollected using a confidential method that has been shown to reduce bias in the studypopulations and are credible since the results largely match those for HIV incidence(Lopman et al., 2008). Participation in community groups in Manicaland is selective.Differences in individual characteristics between group members and non-members atbaseline were controlled for in the main analyses and types of groups with different patternsof membership showed similar trends in reducing HIV incidence. However, we were notable to capture unobservable characteristics of respondents in the study so selectiveparticipation may have had some residual effect on the findings of the study. The evidencefor ecological associations between levels of group membership and HIV risk in women wasweak possibly because establishment of ecological evidence of impact of group membershipis more difficult when communities are loosely defined and groups are not specific toparticular communities as was the case in this study. We excluded community groupsidentified specifically as “church groups” from the analysis; if the effect of women’sparticipating in these groups (over and above any effect of religious teaching) is similar tothat observed for other forms of groups, the overall contribution of community groupmembership to reductions in HIV incidence could be even greater.
The effect of community group membership appears to have been particularly importantduring the period up to 2003. Whereas women who participated in these groups were atlower risk of having contracted HIV infection prior to baseline (1998-2000) (Gregson et al.,2004b) and experienced fewer new infections over the period 1998-2003, no effect on HIVincidence was observed in the following two years - i.e. between the second and third roundsof our survey (data not shown). Overall, there were fewer new infections during this period(resulting in less statistical power in our study to detect differences) and group members,having adopted less risky behaviours already, had less scope for further reductions.
GREGSON et al. Page 10
Popul Dev Rev. Author manuscript; available in PMC 2012 March 13.
Europe PM
C Funders A
uthor Manuscripts
Europe PM
C Funders A
uthor Manuscripts
Because of the potential for social capital to mitigate HIV risk, some efforts have been madeto explore whether social capital can be generated intentionally. Recent experiences fromgroup-based microfinance projects in South Africa (Pronyk et al., 2008a, Pronyk et al.,2008c) and Kenya (Skovdal et al., 2010) suggest that social capital indeed can be generatedand strengthened exogenously. Furthermore, we noted that many of the groups inManicaland received assistance from non-governmental organisations and other externalsources of support.
This study addresses an important gap in research on the effectiveness of social capital inreducing HIV vulnerability (Fisher and Thomas-Slayter, 2010) and found evidence forreductions in new cases of HIV infection amongst women who participated in communitygroups. Support for women’s community groups could be an effective HIV preventionstrategy in countries with large-scale HIV epidemics. However, further studies are needed,in a wide range of settings, to compare levels of community group activity and associationswith health outcomes, both measured on a consistent basis, to establish the generalisabilityof our findings, and to investigate the feasibility and effectiveness of generating socialcapital exogenously.
AcknowledgmentsWe thank the Wellcome Trust for financial support, the Manicaland Study team for assistance with data collection,and the people of Manicaland for their support and participation in the research.
ReferencesAlbarracin D, Kumkale GT, Al E. Influences of social power and normative support on condom use
decisions: a research synthesis. AIDS Care. 2004; 16:700–723. [PubMed: 15370059]
Astone NM, Nathanson CA, Schoen R, Kim YJ. Family demograohy, social theory and investment insocial capital. Population and Development Review. 1999; 25:1–31.
Bandura A. Self-efficacy: toward a unifying theory of behaviour change. Psychological Review. 1977;84:191–215. [PubMed: 847061]
Barker, G.; Ricardo, C. Young men and the construction of maculinity in sub- Saharan Africa:implications for HIV/AIDS, conflict and violence. Washington D.C.: 2005.
Binagwaho A, Ratnayake N. The role of social capital in successful adherence to antiretroviral therapyin Africa. Public Library of Science Medicine. 2009; 6:e18. [PubMed: 19175286]
Burke C, Maton K, Mankowski E, Anderson C. Healing men and community: predictors of outcome ina men’s initiatory and support organization. American Journal of Community Psychology. 2010;45:186–200. [PubMed: 20094770]
Campbell C, Macphail C. Peer education, gender and the development of critical consciousness:Participatory HIV prevention by South African youth. Social Science and Medicine. 2002; 55:331–345. [PubMed: 12144146]
Campbell C, Mzaidume Z. Grassroots participation, peer education, and HIV prevention by sexworkers in South Africa. American Journal of Public Health. 2001; 91:1978–1987. [PubMed:11726380]
Campbell C, Nair Y, Maimane S. Building contexts that support effective community responses toHIV/AIDS: a South African case study. American Journal of Psychology. 2007; 39:347–363.
Campbell, C.; Nair, Y.; Maimane, S.; Gibbs, A. Strengthening community responses to AIDS:possibilities and challenges. In: Rohleder, P.; Swarz, L.; Kalichman, S., editors. HIV/AIDS inSouth Africa 25 years on. Springer; London: 2009.
Campbell C, Williams B, Gilgen D. Is social capital a useful conceptual tool for exploring communitylevel influences in HIV infection? An exploratory case study from South Africa. AIDS Care. 2002;14:41–54. [PubMed: 11798404]
Chiu J, Grobbelaar J, Al E. HIV-related stigma and social capital in South Africa. AIDS Education andPrevention. 2008; 20:519–530. [PubMed: 19072527]
GREGSON et al. Page 11
Popul Dev Rev. Author manuscript; available in PMC 2012 March 13.
Europe PM
C Funders A
uthor Manuscripts
Europe PM
C Funders A
uthor Manuscripts
Collier, P. Social Capital and Poverty. Washington D.C.; 1998. Social Capital Initiative WorkingPaper Number 4
Colvin, C.; Robins, S. Positive men in hard, neoliberal times: engendering health citizenship in SouthAfrica. In: Boeston, J.; Poku, N., editors. Gender and HIV/AIDS: critical perspectives from thedeveloping world. Ashgate Publishing Limited; Farnham: 2009. p. 177-190.
Crosby RA, Holtgrave DR, Al E. Social capital as a predictor of adolescents’ sexual risk behavior.AIDS and Behaviour. 2003; 7:245–252.
Dutta-Bergman MJ. An alternative approach to social capital: exploring the linkage between healthconsciousness and community participation. Health Communication. 2004; 16:393–409. [PubMed:15465687]
Eriksson M, Dahlgren L, Al E. Social capital, gender and educational level - impact of self-ratedhealth. The Open Public Health Journal. 2010; 3:1–12.
Fisher, WF.; Thomas-Slayter, B. Mobilizing Social Capital in a World with AIDS. Worcester; MA,USA: 2010.
Foley M, Edwards B. Is it time to divest in social capital? Journal of Public Policy. 1999; 19:141–173.
Folland S. Does “community social capital” contribute to population health? Social Science andMedicine. 2007; 64:2342–2354. [PubMed: 17433512]
Gregson S, Garnett GP, Nyamukapa CA, Hallett TB, Lewis JJC, Mason PR, Chandiwana SK,Anderson RM. HIV decline associated with behaviour change in eastern Zimbabwe. Science.2006; 311:664–666. [PubMed: 16456081]
Gregson S, Gonese E, Hallett TB, Taruberekera N, Hargrove JW, Corbett EL, Dorrington R, Dube S,Dehne K-L, Mugurungi O. HIV decline due to reductions in risky sex in Zimbabwe? Evidencefrom a comprehensive epidemiological review. International Journal of Epidemiology. 2010;39:1311–1323. [PubMed: 20406793]
Gregson S, Mushati P, White PR, Mlilo M, Mundandi C, Nyamukapa CA. Informal confidentialvoting interview methods and temporal changes in reported sexual risk behaviour for HIVtransmission in sub-Saharan Africa. Sexually Transmitted Infections. 2004a; 80:36–42.
Gregson S, Nyamukapa CA, Lopman B, Mushati P, Garnett GP, Chandiwana SK, Anderson RM. Acritique of early models of the demographic impact of HIV/AIDS in sub-Saharan Africa based onempirical data from Zimbabwe. Proceedings of the National Academy of Sciences. 2007;104:14586–14591.
Gregson S, Nyamukapa CA, Schumacher C, Mugurungi O, Benedikt C, Mushati P, Campbell C,Garnett GP. Did national HIV prevention programmes contribute to HIV decline in easternZimbabwe? Evidence from a prospective community survey. Sexually Transmitted Infections. Inpress.
Gregson S, Terceira N, Mushati P, Nyamukapa CA, Campbell C. Community group participation: canit help young women to avoid HIV? An exploratory study of social capital and school education inrural Zimbabwe. Social Science and Medicine. 2004b; 58:2119–2132. [PubMed: 15047071]
Gregson S, Zhuwau T, Anderson R, Chandiwana S. Is there evidence for behaviour change in responseto AIDS in rural Zimbabwe? Social Science and Medicine. 1998; 46:321–330. [PubMed:9460814]
Hallett TB, Gregson S, Mugurungi O, Gonese E, Garnett GP. Is there evidence for behaviour changeaffecting the course of the HIV epidemic in Zimbabwe? A new mathematical modelling approach.Epidemics. 2009; 1:108–117. [PubMed: 21352758]
Halperin DT, Mugurungi O, Hallett TB, Muchini B, Campbell B, Magure T, Benedikt C, Gregson S. Asurprising prevention success: Why did the HIV epidemic decline in Zimbabwe? Public Library ofScience Medicine. 2011; 8:e1000414. [PubMed: 21346807]
Hawe P, Shiell A. Social capital and health promotion: a review. Social Science and Medicine. 2000;51:871–885. [PubMed: 10972431]
Holtgrave DR, Crosby RA. Social capital, poverty, and income equality as predictors of gonorrhoea,syphilis, chlamydia and AIDS case rates in the United States. Sexually Transmitted Infections.2003; 79:62–64. [PubMed: 12576618]
International Monetary Fund. World Economic Outlook Database. Washington DC: 2008.
GREGSON et al. Page 12
Popul Dev Rev. Author manuscript; available in PMC 2012 March 13.
Europe PM
C Funders A
uthor Manuscripts
Europe PM
C Funders A
uthor Manuscripts
Kim, D.; Subramanian, S.; Al, E. Social capital and physical health. A systematic review of theliterature. In: Kawachi, I.; Subramanian, S.; Kim, D., editors. Social Capital and Health. SpringerScience / Business Media LCC; New York: 2008. p. 139-190.
Lopman B, Nyamukapa CA, Mushati P, Wambe M, Mupambireyi Z, Mason PR, Garnett GP, GregsonS. Determinants of HIV incidence after 3 years follow-up in a cohort recruited between 1998 and2000 in Manicaland, Zimbabwe. International Journal of Epidemiology. 2008; 37:88–105.[PubMed: 18203774]
Lyttleton C. Fleeing the fire: transformation and gendered belonging in Thai HIV/AIDS supportgroups. Medical Anthropology: Cross-Cultural Studies in Health and Illness. 2004; 23:1–40.
Nhamo M, Campbell C, Gregson S. Contextual determinants of HIV prevention programme outcomes:obstacles to local-level AIDS competence in rural Zimbabwe. AIDS Care. In press.
Norris, P.; Inglehart, R. Gendering social capital. Bowling in women’s leagues?. In: O’neill, B.;Gidengil, E., editors. Gender and Social Capital. Routledge; New York: 2006. p. 73-98.
Portes A, Landolt P. The downside of social capital. The American Prospect. 1996; 26:18–21.
Pronyk PM, Harpman T, Al E. Can social capital be intentionally generated? A randomised trial fromSouth Africa. Social Science and Medicine. 2008a; 67:1559–1570. [PubMed: 18771833]
Pronyk PM, Harpman T, Al E. Is social capital associated with HIV risk in rural South Africa? SocialScience and Medicine. 2008b; 66:1999–2010. [PubMed: 18299168]
Pronyk PM, Kim J, Al E. A combined microfinance and training intervention can reduce HIV riskbehaviour in young female participants. AIDS. 2008c; 22:1659–1665. [PubMed: 18670227]
Putnam, R. Making Democracy Work. Princeton University Press; New Jersey: 1993.
Putnam, RD. Bowling Alone: The Collapse and Revival of American Community. Simon andSchuster; New York: 2000.
Ragnarsson A, Townsend L, Thorson A, Chopra M, Ekstraam AM. Social networks and concurrentsexual relationships - a qualitative study amongst men in an urban South African community.AIDS Care. 2009; 21:1253–1258. [PubMed: 20024701]
Saegart, S.; Thompson, JP.; Warren, MR. Social capital in poor communities. Russell SageFoundation; New York: 2001.
Skovdal M, Campbell C, Madanhire C, Mupambireyi Z, Nyamukapa CA, Gregson S. Masculinity as abarrier to men’s uptake of HIV services in Zimbabwe. Globalization and Health. In press.
Skovdal M, Mwasiaji W, Webale A, Tomkins AM. Building orphan competent communities:experiences from a community-based capital cash transfer initiative in Kenya. Health, Policy andPlanning. 2010
Veenstra G. Social capital, SES, and health: an individual level analysis. Social Science and Medicine.2000; 50:619. [PubMed: 10658843]
Wallerstein N. Powerlessness, empowerment and health: implications for health promotionprogrammes. American Journal of Health Promotion. 1992; 6:197–205. [PubMed: 10146784]
Ware NC, Idoko J, Al E. Explaining adherence success in sub-Saharan Africa: an ethnographic study.Public Library of Science Medicine. 2009; 6:e1000011.
Woolcock M. Microenterprise and social capital: a framework for theory, research and policy. Journalof Socio-Economics. 2001; 30:193–198.
Wouters E, Meulemans H, Van Rensburg HCJ. Slow to share: social capital and its role in public HIVdisclosure among public sector ART patients in the Free State province of South Africa. AIDSCare. 2009; 21:411–421. [PubMed: 19266407]
Ziersch AM, Baum FE. Involvement in civil society groups: is it good for your health? Journal ofEpidemiology and Community Health. 2004; 58:493–500. [PubMed: 15143118]
Zimbabwe Ministry of Health and Child Welfare. Zimbabwe National HIV and AIDS Estimates 2009.Harare; 2010.
GREGSON et al. Page 13
Popul Dev Rev. Author manuscript; available in PMC 2012 March 13.
Europe PM
C Funders A
uthor Manuscripts
Europe PM
C Funders A
uthor Manuscripts
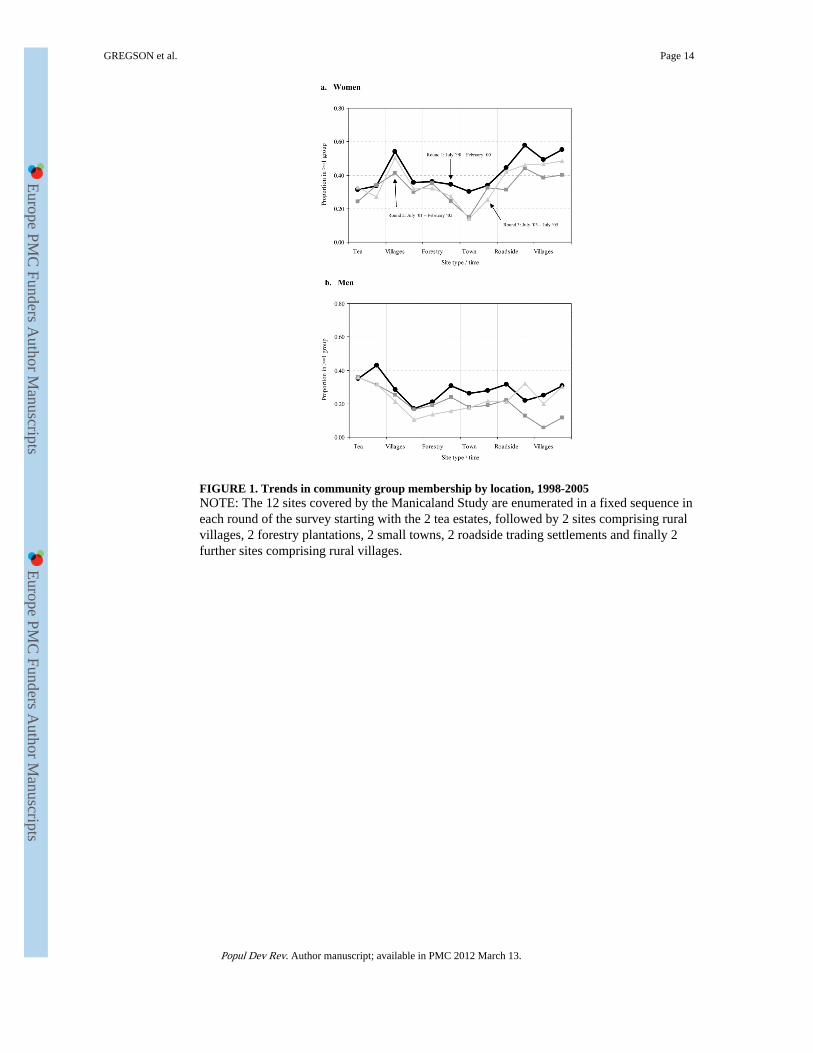
FIGURE 1. Trends in community group membership by location, 1998-2005NOTE: The 12 sites covered by the Manicaland Study are enumerated in a fixed sequence ineach round of the survey starting with the 2 tea estates, followed by 2 sites comprising ruralvillages, 2 forestry plantations, 2 small towns, 2 roadside trading settlements and finally 2further sites comprising rural villages.
GREGSON et al. Page 14
Popul Dev Rev. Author manuscript; available in PMC 2012 March 13.
Europe PM
C Funders A
uthor Manuscripts
Europe PM
C Funders A
uthor Manuscripts
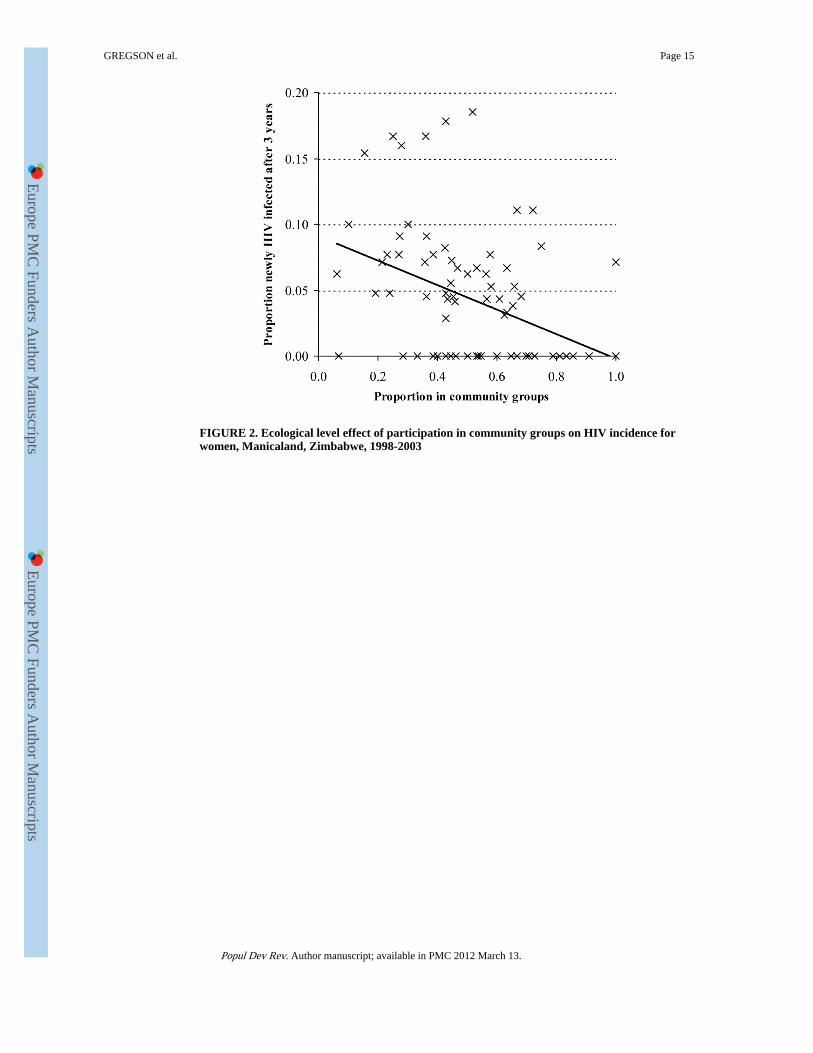
FIGURE 2. Ecological level effect of participation in community groups on HIV incidence forwomen, Manicaland, Zimbabwe, 1998-2003
GREGSON et al. Page 15
Popul Dev Rev. Author manuscript; available in PMC 2012 March 13.
Europe PM
C Funders A
uthor Manuscripts
Europe PM
C Funders A
uthor Manuscripts
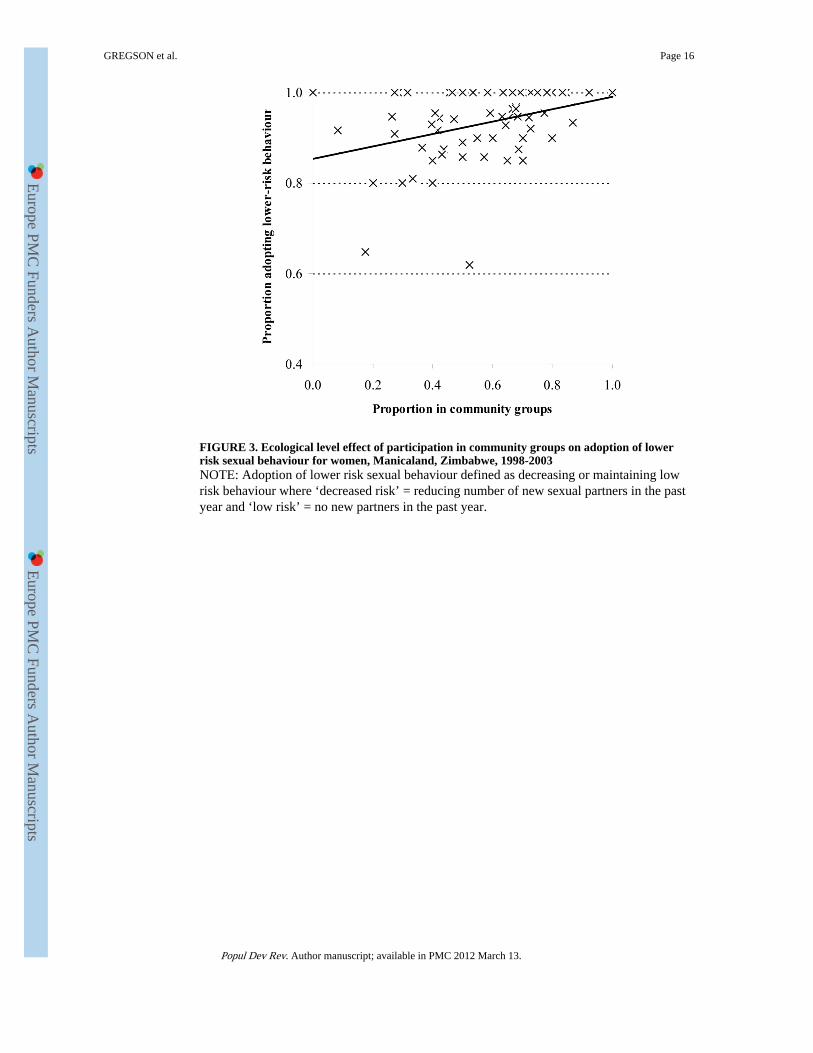
FIGURE 3. Ecological level effect of participation in community groups on adoption of lowerrisk sexual behaviour for women, Manicaland, Zimbabwe, 1998-2003NOTE: Adoption of lower risk sexual behaviour defined as decreasing or maintaining lowrisk behaviour where ‘decreased risk’ = reducing number of new sexual partners in the pastyear and ‘low risk’ = no new partners in the past year.
GREGSON et al. Page 16
Popul Dev Rev. Author manuscript; available in PMC 2012 March 13.
Europe PM
C Funders A
uthor Manuscripts
Europe PM
C Funders A
uthor Manuscripts
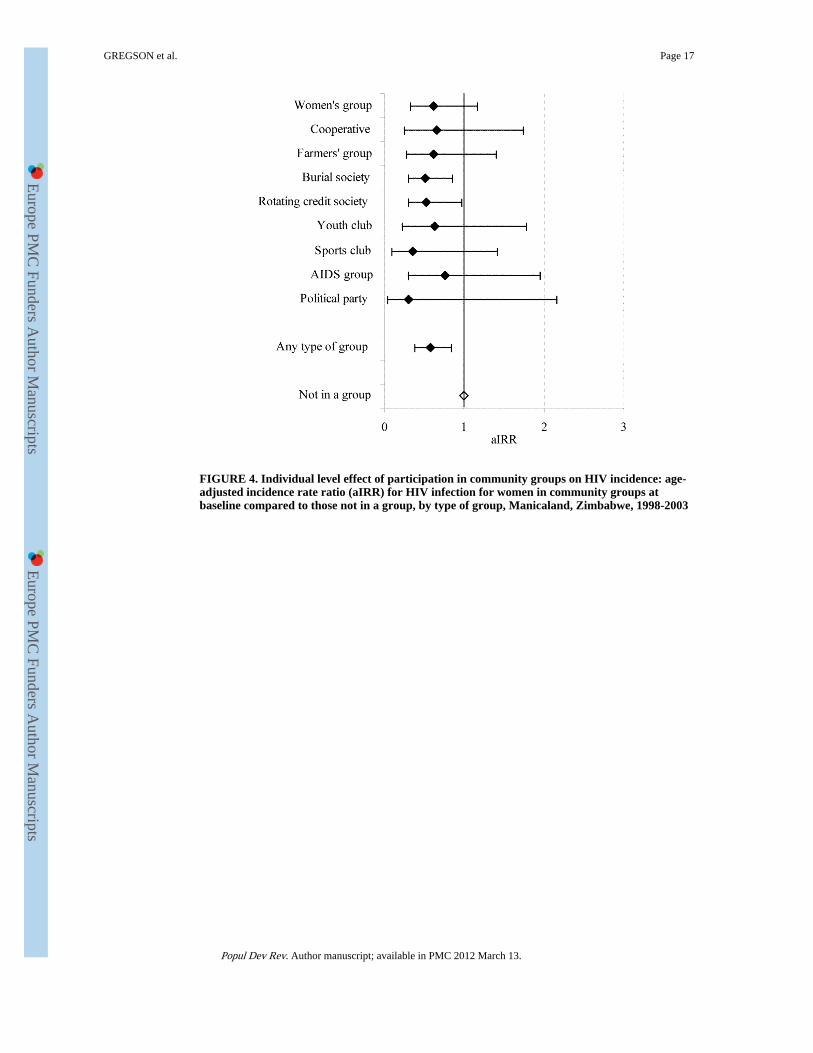
FIGURE 4. Individual level effect of participation in community groups on HIV incidence: age-adjusted incidence rate ratio (aIRR) for HIV infection for women in community groups atbaseline compared to those not in a group, by type of group, Manicaland, Zimbabwe, 1998-2003
GREGSON et al. Page 17
Popul Dev Rev. Author manuscript; available in PMC 2012 March 13.
Europe PM
C Funders A
uthor Manuscripts
Europe PM
C Funders A
uthor Manuscripts
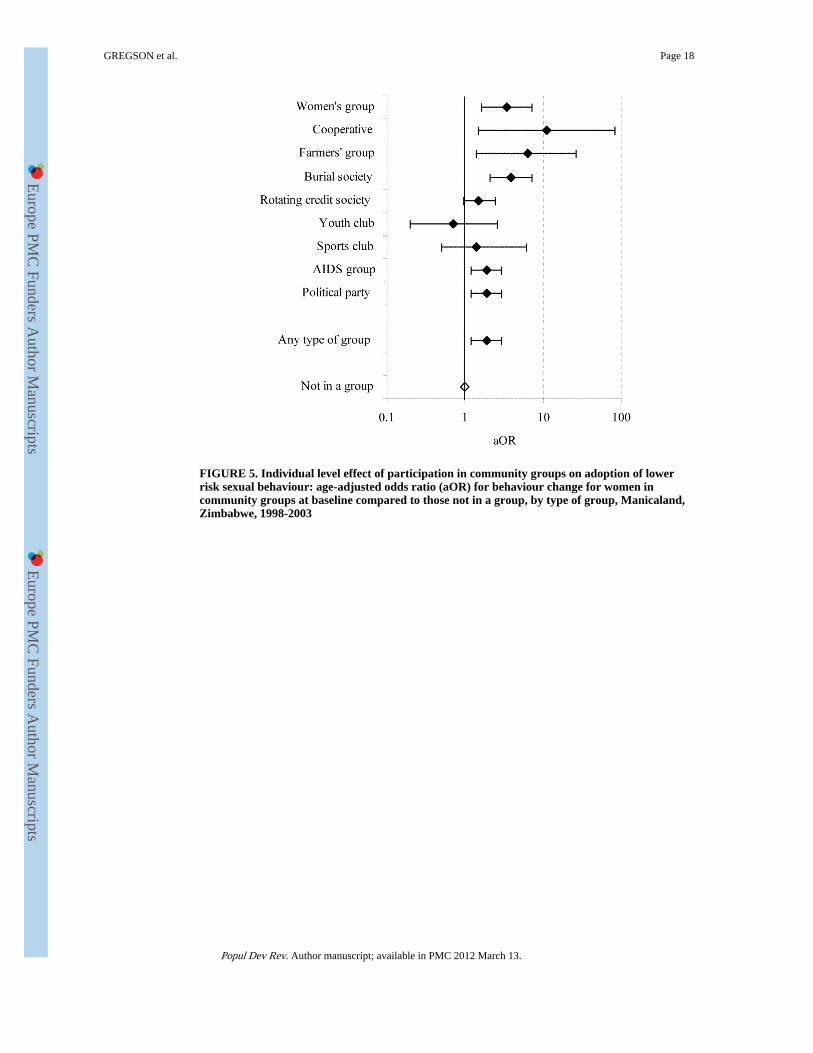
FIGURE 5. Individual level effect of participation in community groups on adoption of lowerrisk sexual behaviour: age-adjusted odds ratio (aOR) for behaviour change for women incommunity groups at baseline compared to those not in a group, by type of group, Manicaland,Zimbabwe, 1998-2003
GREGSON et al. Page 18
Popul Dev Rev. Author manuscript; available in PMC 2012 March 13.
Europe PM
C Funders A
uthor Manuscripts
Europe PM
C Funders A
uthor Manuscripts
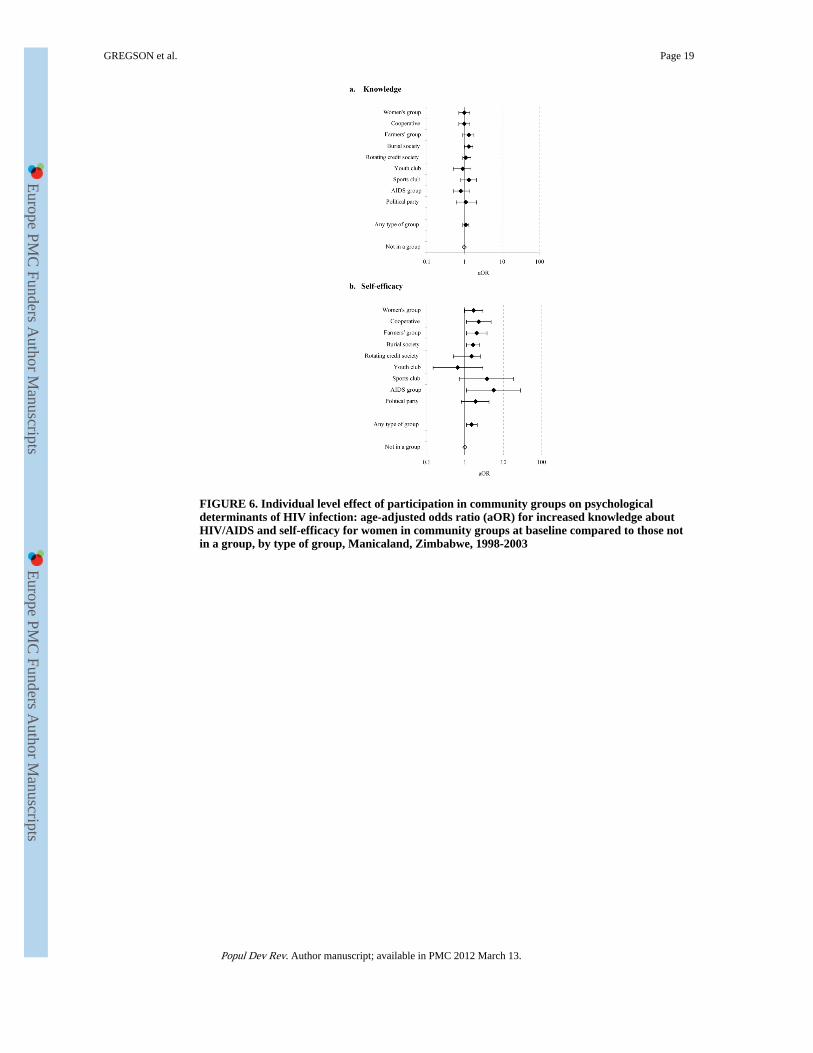
FIGURE 6. Individual level effect of participation in community groups on psychologicaldeterminants of HIV infection: age-adjusted odds ratio (aOR) for increased knowledge aboutHIV/AIDS and self-efficacy for women in community groups at baseline compared to those notin a group, by type of group, Manicaland, Zimbabwe, 1998-2003
GREGSON et al. Page 19
Popul Dev Rev. Author manuscript; available in PMC 2012 March 13.
Europe PM
C Funders A
uthor Manuscripts
Europe PM
C Funders A
uthor Manuscripts
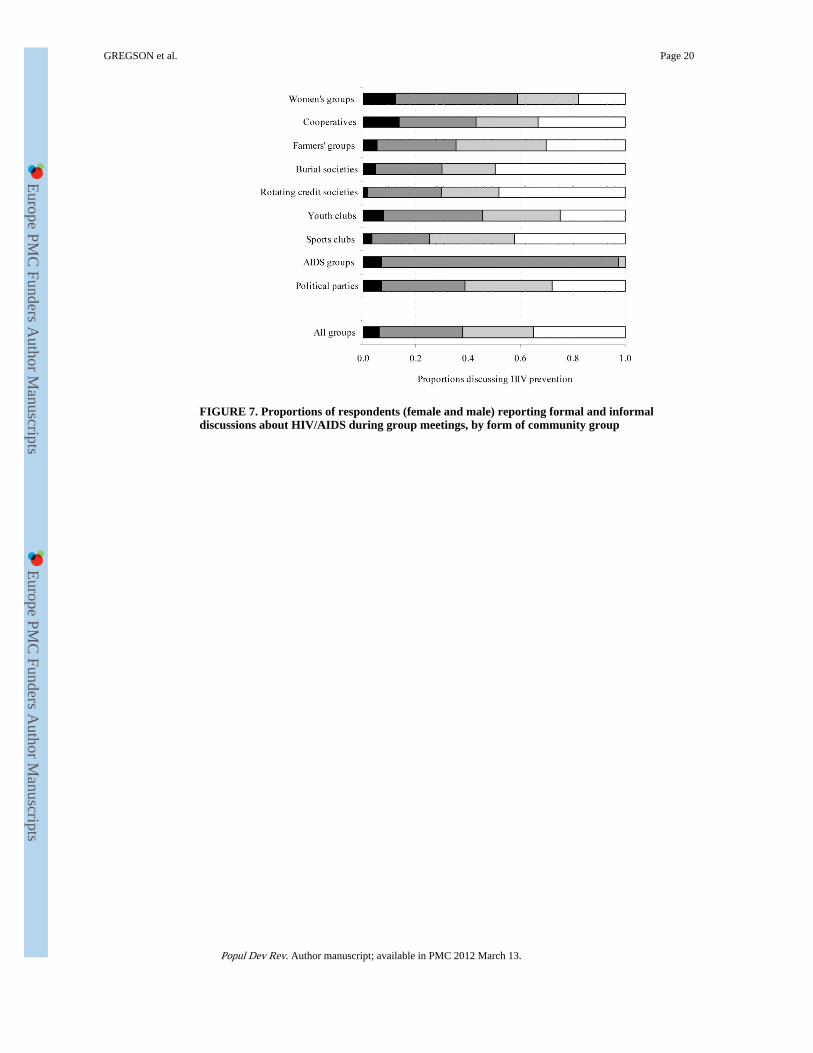
FIGURE 7. Proportions of respondents (female and male) reporting formal and informaldiscussions about HIV/AIDS during group meetings, by form of community group
GREGSON et al. Page 20
Popul Dev Rev. Author manuscript; available in PMC 2012 March 13.
Europe PM
C Funders A
uthor Manuscripts
Europe PM
C Funders A
uthor Manuscripts
Europe PM
C Funders A
uthor Manuscripts
Europe PM
C Funders A
uthor Manuscripts
GREGSON et al. Page 21
TAB
LE 1
Bas
elin
e ch
arac
teri
stic
s of
HIV
uni
nfec
ted
wom
en a
nd m
en, f
ollo
wed
up
afte
r 3
year
s, b
y ba
selin
e m
embe
rshi
p of
com
mun
ity g
roup
s
Wom
enM
en
Gro
upm
embe
rsN
on-
grou
pm
embe
rs
Tes
t fo
rdi
ffer
ence
Gro
upm
embe
rsN
on-
grou
pm
embe
rs
Tes
t fo
rdi
ffer
ence
Soci
o-de
mog
raph
ic c
hara
cter
isti
caO
R (
95%
CI)
aOR
(95
% C
I)
All
indi
vidu
als
0.51
0.49
-0.
310.
69-
Age
Und
er 2
5 ye
ars
0.29
0.71
10.
290.
711
25-3
9 ye
ars
0.59
0.41
3.5
(2.9
-4.3
)0.
320.
681.
1 (0
.9-1
.4)
40 y
ears
and
abo
ve0.
750.
257.
1 (5
.5-9
.2)
0.37
0.63
1.4
(1.0
-1.9
)
Res
iden
ce
Vill
age
0.55
0.45
10.
250.
751
Roa
dsid
e se
ttlem
ent
0.60
0.40
1.2
(0.9
-1.5
)0.
310.
691.
4 (1
.0-2
.0)
Com
mer
cial
far
min
g es
tate
0.39
0.61
0.5
(0.4
-0.7
)0.
380.
631.
8 (1
.4-2
.3)
Tow
n0.
420.
580.
7 (0
.5-0
.9)
0.28
0.72
1.1
(0.8
-1.6
)
Mar
ital
sta
tus
Sing
le0.
280.
721
0.28
0.72
1
Mar
ried
0.59
0.41
1.4
(1.1
-1.9
)0.
360.
641.
5 (1
.1-2
.0)
Div
orce
d/se
para
ted
0.35
0.65
0.6
(0.4
-0.9
)0.
230.
770.
8 (0
.4-1
.7)
Wid
owed
0.62
0.38
1.0
(0.6
-1.7
)0.
290.
710.
6 (0
.1-6
.1)
Edu
cati
on
Prim
ary
or le
ss0.
570.
431
0.30
0.70
1
Seco
ndar
y or
mor
e0.
450.
551.
2 (1
.0-1
.5)
0.32
0.68
1.3
(1.0
-1.6
)
Soci
o-ec
onom
ic s
tatu
s
Poor
est t
erci
le0.
530.
471
0.34
0.66
1
Mid
dle
terc
ile0.
540.
460.
9 (0
.8-1
.2)
0.30
0.71
0.8
(0.6
-1.1
)
Lea
st p
oor
terc
ile0.
450.
550.
6 (0
.5-0
.8)
0.29
0.71
0.8
(0.6
-1.0
)
Em
ploy
men
t
Une
mpl
oyed
0.51
0.49
10.
270.
731
Em
ploy
ed0.
430.
570.
6 (0
.5-0
.9)
0.37
0.63
1.6
(1.3
-1.9
)
Popul Dev Rev. Author manuscript; available in PMC 2012 March 13.
Europe PM
C Funders A
uthor Manuscripts
Europe PM
C Funders A
uthor Manuscripts
GREGSON et al. Page 22
Wom
enM
en
Gro
upm
embe
rsN
on-
grou
pm
embe
rs
Tes
t fo
rdi
ffer
ence
Gro
upm
embe
rsN
on-
grou
pm
embe
rs
Tes
t fo
rdi
ffer
ence
Soci
o-de
mog
raph
ic c
hara
cter
isti
caO
R (
95%
CI)
aOR
(95
% C
I)
Rel
igio
n
Non
e0.
280.
721
0.25
0.75
1
Tra
ditio
nal
0.31
0.69
1.1
(0.5
-2.4
)0.
360.
641.
6 (1
.1-2
.5)
Chr
istia
n0.
520.
483.
0 (1
.8-4
.9)
0.31
0.69
1.3
(0.9
-2.0
)
N23
7416
73
aOR
, age
-adj
uste
d od
ds r
atio
for
mem
bers
hip
of a
wel
l-fu
nctio
ning
gro
up
Popul Dev Rev. Author manuscript; available in PMC 2012 March 13.
Europe PM
C Funders A
uthor Manuscripts
Europe PM
C Funders A
uthor Manuscripts
GREGSON et al. Page 23
TAB
LE 2
Impa
ct o
f so
cial
gro
up m
embe
rshi
pa on
risk
of
acqu
irin
g H
IV in
fect
ion
(199
8-20
00 to
200
1-20
03),
Man
ical
and,
Zim
babw
e, b
y ty
pe o
f gr
oup
Wom
enM
en
HIV
inci
denc
eIn
cide
nce
rate
rat
iob
HIV
inci
denc
eIn
cide
nce
rate
rat
iob
Typ
e of
gro
up
Infe
ctio
ns /
pyrs
% (95%
CI)
Una
djus
ted
(95%
CI)
Age
-adj
uste
d(9
5% C
I)F
ully
-adj
uste
dd
(95%
CI)
NIn
fect
ions
/py
rs% (9
5% C
I)U
nadj
uste
d(9
5% C
I)A
ge-a
djus
ted
(95%
CI)
Ful
ly-a
djus
tedd
(95%
CI)
N
Wom
en’s
gro
up10
/915
1.09
(0.5
9, 2
.03)
0.51
(0.2
9, 0
.91)
0.62
(0.3
3, 1
.16)
0.75
(0.4
0, 1
.42)
305
-
Coo
pera
tive
5/52
30.
96(0
.40,
2.3
0)0.
45(0
.20,
1.0
2)0.
66(0
.25,
1.7
4)0.
87(0
.32,
2.3
7)17
43/
124
2.43
(0.7
8, 7
.52)
1.41
(0.4
5,4.
41)
1.46
(0.4
7, 4
.49)
1.40
(0.4
8, 4
.07)
42
Farm
ers’
gro
up5/
579
0.86
(0.3
6, 2
.08)
0.40
(0.1
8, 0
.89)
0.61
(0.2
7, 1
.40)
0.78
(0.3
4, 1
.83)
193
2/14
11.
42(0
.36,
5.6
8)0.
84(0
.20,
3.4
9)0.
77(0
.18,
3.2
9)0.
71(0
.16,
3.0
8)47
Bur
ial s
ocie
ty17
/208
10.
82(0
.51,
1.3
1)0.
38(0
.24,
0.6
2)0.
51(0
.30,
0.8
5)0.
62(0
.37,
1.0
5)69
14/
359
1.11
(0.4
2, 2
.97)
0.66
(0.2
4, 1
.79)
0.63
(0.2
3, 1
.77)
0.43
(0.1
4, 1
.32)
120
Rot
atin
g cr
edit
soci
ety
14/1
444
0.97
(0.5
7, 1
.64)
0.45
(0.2
6, 0
.80)
0.53
(0.3
0, 0
.95)
0.61
(0.3
5, 1
.08)
483
19/4
873.
90(2
.49,
6.1
2)2.
18(1
.27,
3.7
6)1.
84(1
.04,
3.2
5)1.
83(0
.99,
3.3
8)17
2
You
th c
lub
4/30
51.
31(0
.49,
3.5
0)0.
60(0
.23,
1.5
9)0.
63(0
.22,
1.7
8)0.
68(0
.22,
2.0
8)10
34/
193
2.07
(0.7
8, 5
.53)
1.22
(0.4
8, 3
.08)
1.32
(0.5
1, 3
.39)
1.42
(0.5
5, 3
.69)
65
Spor
ts c
lub
2/28
80.
69(0
.17,
2.78
)0.
32(0
.09,
1.2
3)0.
35(0
.09,
1.4
1)0.
41(0
.11,
1.5
7)96
16/5
962.
68(1
.64,
4.3
8)1.
56(0
.92,
2.6
5)1.
63(0
.94,
2.8
2)1.
61(0
.92,
2.8
3)20
3
AID
S gr
oup
3/22
71.
32(0
.04,
4.10
)0.
61(0
.24,
1.6
0)0.
76(0
.30,
1.9
5)0.
93(0
.36,
2.3
5)76
1/40
2.48
(0.3
5, 1
7.62
)1.
41(0
.21,
9.5
5)1.
50(0
.24,
9.5
3)1.
17(0
.18,
7.5
6)14
Polit
ical
par
ty1/
211
0.47
(0.0
7, 3
.37)
0.22
(0.0
3, 1
.55)
0.30
(0.0
4,2.
16)
0.34
(0.0
5, 2
.47)
713/
132
2.27
(0.7
3, 7
.03)
1.32
(0.4
6, 3
.72)
1.26
(0.4
3, 3
.66)
0.86
(0.2
8, 2
.64)
45
Any
type
of
grou
p35
/360
70.
97(0
.70,
1.3
5)0.
45(0
.30,
0.6
8)0.
57(0
.38,
0.8
4)0.
64e
(0.4
3, 0
.94)
1,20
640
/153
92.
60(1
.91,
3.5
4)1.
50(1
.00,
2.24
)1.
46(0
.94,
2.2
8)1.
46e
(0.9
5, 2
.24)
527
Not
a m
embe
r at
rou
nd 1
c75
/342
42.
19(1
.75,
2.75
)1
11
1,16
858
/338
81.
71(1
.32,
2.2
1)1
11
1,14
6
a Mem
ber
= m
embe
r of
at l
east
one
wel
l-fu
nctio
ning
com
mun
ity g
roup
b Inci
denc
e ra
te r
atio
s co
mpa
red
with
wom
en a
nd m
en w
ho w
ere
not m
embe
rs o
f an
y w
ell-
func
tioni
ng c
omm
unity
gro
ups
at r
ound
1; a
ll ad
just
ed f
or c
lust
erin
g at
the
villa
ge-l
evel
c Irre
spec
tive
of w
heth
er a
mem
ber
at r
ound
2
d Adj
uste
d fo
r ag
e, p
revi
ous
risk
beh
avio
ur, l
ocat
ion
of r
esid
ence
, mar
ital s
tatu
s, r
elig
ion,
edu
catio
n, p
over
ty a
nd e
mpl
oym
ent
e Aft
er a
dditi
onal
adj
ustm
ent f
or k
now
ledg
e ab
out H
IV/A
IDS
at r
ound
1: w
omen
- a
IRR
=0.
56 (
0.38
,0.8
3); m
en -
aIR
R=
l .46
(0.
97, 2
.21)
Popul Dev Rev. Author manuscript; available in PMC 2012 March 13.
Europe PM
C Funders A
uthor Manuscripts
Europe PM
C Funders A
uthor Manuscripts
GREGSON et al. Page 24
TAB
LE 3
Impa
ct o
f so
cial
gro
up m
embe
rshi
pa on
redu
cing
or
mai
ntai
ning
low
-ris
k be
havi
our
(199
8-20
00 to
200
1-20
03),
Man
ical
and,
Zim
babw
e, b
y ty
pe o
f gr
oup
Wom
enM
en
Beh
avio
ur c
hang
eO
dds
rati
obB
ehav
iour
cha
nge
Odd
s ra
tiob
Typ
e of
gro
upn/
N% (9
5% C
I)U
nadj
uste
d(9
5% C
I)A
ge-a
djus
ted
(95%
CI)
Ful
ly-a
djus
tedd
(95%
CI)
n/N
% (95%
CI)
Una
djus
ted
(95%
CI)
Age
-adj
uste
d(9
5% C
I)F
ully
-adj
uste
dd
(95%
CI)
Wom
en’s
gro
up29
5/30
198
.0(9
6.4,
100
.0)
5.5
(2.5
, 12.
1)3.
4(1
.6,7
.1)
2.7
(1.3
,6.0
)-
Coo
pera
tive
169/
170
99.4
(98.
3, 1
00.0
)19
.3(2
.6, 1
43.8
)11
.0(1
.5, 8
1.9)
7.5
(1.0
, 57.
3)30
/35
85.7
(73.
5, 9
7.9)
2.3
(1.0
, 5.2
)1.
7(0
.8, 3
.9)
1.7
(0.7
, 4.0
)
Farm
ers’
gro
up19
1/19
399
.0(9
7.5,
100
.0)
11.4
(2.8
,46.
6)6.
3(1
.5,2
6.6)
4.5
(1.0
, 19.
6)41
/46
89.1
(79.
8, 9
8.5)
3.0
(1.2
, 7.7
)2.
1(0
.8, 5
.4)
2.7
(0.9
, 8.2
)
Bur
ial s
ocie
ty66
8/68
198
.1(9
7.1,
99.
1)6.
1(3
.3, 1
1.1)
3.9
(2.1
,7.1
)3.
1(1
.6, 5
.9)
85/1
0680
.2(7
2.5,
87.
9)1.
5(0
.9, 2
.4)
1.1
(0.7
, 1.9
)1.
1(0
.7, 1
.9)
Rot
atin
g cr
edit
soci
ety
451/
474
95.1
(93.
2, 9
7.1)
2.3
(1.4
,3.6
)1.
5(0
.95,
2.4
)1.
7(1
.0,2
.7)
126/
155
81.3
(75.
1, 8
7.5)
1.6
(1.2
, 2.3
)1.
5(1
.0, 2
.2)
1.5
(1.0
,2.3
)
You
th c
lub
15/1
883
.3(6
4.3,
100
.0)
0.6
(0.2
, 2.2
)0.
7(0
.2,2
.6)
0.6
(0.2
,2.1
)30
/43
69.8
(55.
5, 8
4.1)
0.8
(0.5
, 1.5
)1.
2(0
.7, 2
.3)
1.2
(0.6
, 2.2
)
Spor
ts c
lub
46/4
993
.9(8
6.9,
100
.0)
1.9
(0.4
, 8.6
)1.
4(0
.3, 6
.2)
0.9
(0.2
, 3.8
)11
9/15
974
.8(6
8.0,
81.
7)1.
1(0
.8, 1
.6)
1.4
(1.0
, 2.0
)1.
4(1
.0,2
.1)
AID
S gr
oup
58/6
293
.5(8
7.3,
99.
8)1.
8(0
.6, 5
.3)
1.1
(0.4
,3.2
)0.
9(0
.3,2
.9)
9/12
75.0
(46.
3, 1
00.0
)1.
2(0
.3, 4
.6)
1.3
(0.3
, 5.3
)1.
2(0
.2, 5
.8)
Polit
ical
par
ty68
/71
95.8
(91.
0, 1
00.0
)2.
4(0
.9, 6
.8)
1.3
(0.5
,3.6
)1.
4(0
.6,3
.3)
32/4
276
.2(6
2.8,
89.
6)1.
2(0
.6, 2
.2)
0.8
(0.4
, 1.6
)1.
0(0
.5, 1
.9)
Any
type
of
grou
p10
32/1
073
96.2
(94.
9, 9
7.2)
2.9
(1.9
,4.4
)1.
9(1
.2,2
.9)
1.8e
(1.2
,2.8
)
340/
434
78.3
(74.
2, 8
2.1)
1.3
(1.1
, 1.7
)1.
3(1
.0, 1
.7)
1.4e
(1.0
, 1.8
)
Not
a m
embe
r at
Rlc
785/
871
90.1
(87.
9, 9
2.0)
11
165
3/89
672
.9(6
9.8,
75.
8)1
11
a Mem
ber
= m
embe
r of
at l
east
one
wel
l-fu
nctio
ning
com
mun
ity g
roup
b Odd
s ra
tios
com
pare
d w
ith w
omen
and
men
who
wer
e no
t mem
bers
of
any
wel
l-fu
nctio
ning
com
mun
ity g
roup
s at
rou
nd 1
; all
adju
sted
for
vill
age-
leve
l clu
ster
ing
and
inte
rvie
w m
etho
d
c Irre
spec
tive
of w
heth
er a
mem
ber
at r
ound
2
d Adj
uste
d fo
r ag
e, p
revi
ous
risk
beh
avio
ur, l
ocat
ion
of r
esid
ence
, mar
ital s
tatu
s, r
elig
ion,
edu
catio
n, p
over
ty a
nd e
mpl
oym
ent
e Aft
er a
dditi
onal
adj
ustm
ent f
or k
now
ledg
e ab
out H
IV/A
IDS
at r
ound
1: w
omen
, aO
R=
l .9
(1.2
, 2.9
); m
en, a
OR
=l .
4 (1
.1,1
.9)
Popul Dev Rev. Author manuscript; available in PMC 2012 March 13.
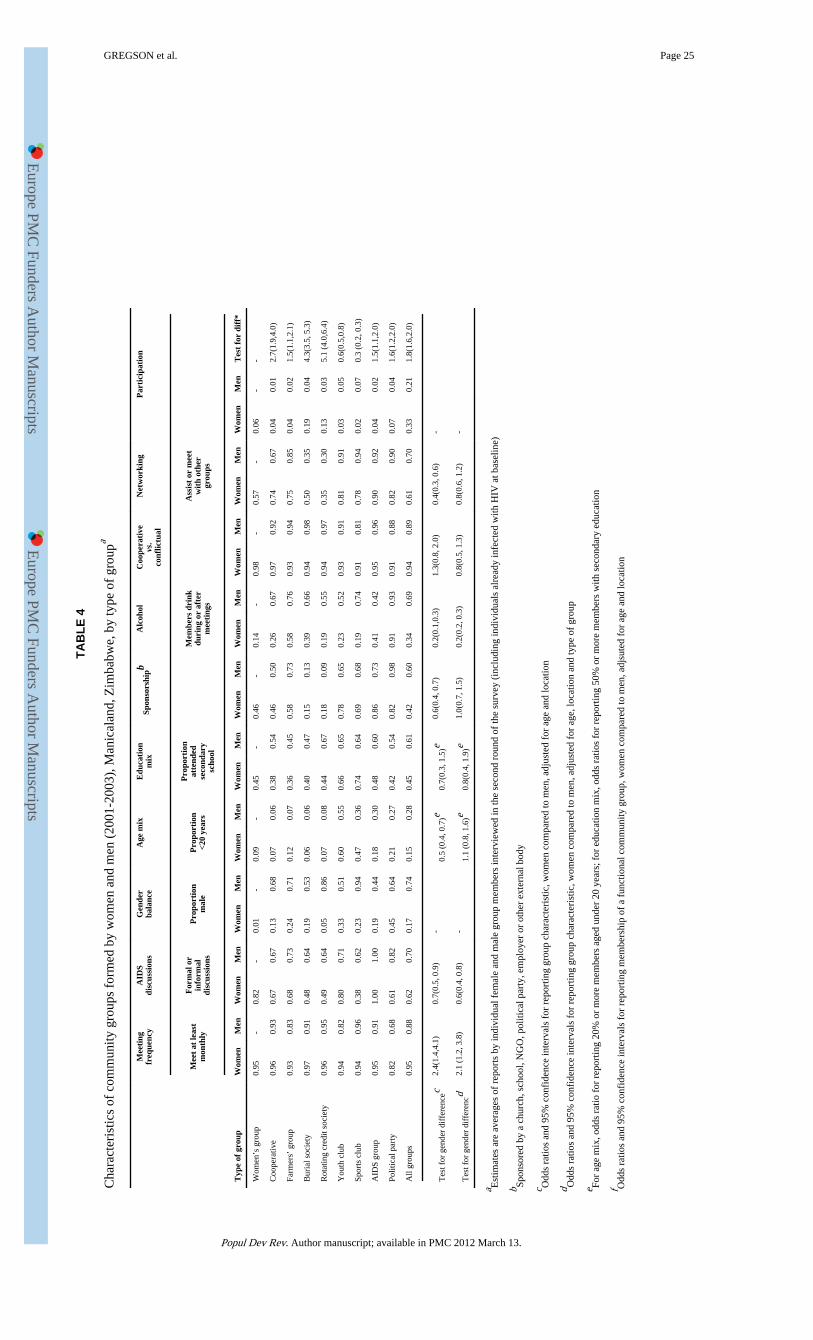
Europe PM
C Funders A
uthor Manuscripts
Europe PM
C Funders A
uthor Manuscripts
GREGSON et al. Page 25
TAB
LE 4
Cha
ract
eris
tics
of c
omm
unity
gro
ups
form
ed b
y w
omen
and
men
(20
01-2
003)
, Man
ical
and,
Zim
babw
e, b
y ty
pe o
f gr
oupa
Mee
ting
freq
uenc
yA
IDS
disc
ussi
ons
Gen
der
bala
nce
Age
mix
Edu
cati
onm
ixSp
onso
rshi
pbA
lcoh
olC
oope
rati
vevs
.co
nflic
tual
Net
wor
king
Par
tici
pati
on
Mee
t at
leas
tm
onth
ly
For
mal
or
info
rmal
disc
ussi
ons
Pro
port
ion
mal
eP
ropo
rtio
n<2
0 ye
ars
Pro
port
ion
atte
nded
seco
ndar
ysc
hool
Mem
bers
dri
nkdu
ring
or
afte
rm
eeti
ngs
Ass
ist
or m
eet
wit
h ot
her
grou
ps
Typ
e of
gro
upW
omen
Men
Wom
enM
enW
omen
Men
Wom
enM
enW
omen
Men
Wom
enM
enW
omen
Men
Wom
enM
enW
omen
Men
Wom
enM
enT
est
for
diff
*
Wom
en’s
gro
up0.
95-
0.82
-0.
01-
0.09
-0.
45-
0.46
-0.
14-
0.98
-0.
57-
0.06
--
Coo
pera
tive
0.96
0.93
0.67
0.67
0.13
0.68
0.07
0.06
0.38
0.54
0.46
0.50
0.26
0.67
0.97
0.92
0.74
0.67
0.04
0.01
2.7(
1.9,
4.0)
Farm
ers’
gro
up0.
930.
830.
680.
730.
240.
710.
120.
070.
360.
450.
580.
730.
580.
760.
930.
940.
750.
850.
040.
021.
5(1.
1,2.
1)
Bur
ial s
ocie
ty0.
970.
910.
480.
640.
190.
530.
060.
060.
400.
470.
150.
130.
390.
660.
940.
980.
500.
350.
190.
044.
3(3.
5, 5
.3)
Rot
atin
g cr
edit
soci
ety
0.96
0.95
0.49
0.64
0.05
0.86
0.07
0.08
0.44
0.67
0.18
0.09
0.19
0.55
0.94
0.97
0.35
0.30
0.13
0.03
5.1
(4.0
,6.4
)
You
th c
lub
0.94
0.82
0.80
0.71
0.33
0.51
0.60
0.55
0.66
0.65
0.78
0.65
0.23
0.52
0.93
0.91
0.81
0.91
0.03
0.05
0.6(
0.5,
0.8)
Spor
ts c
lub
0.94
0.96
0.38
0.62
0.23
0.94
0.47
0.36
0.74
0.64
0.69
0.68
0.19
0.74
0.91
0.81
0.78
0.94
0.02
0.07
0.3
(0.2
, 0.3
)
AID
S gr
oup
0.95
0.91
1.00
1.00
0.19
0.44
0.18
0.30
0.48
0.60
0.86
0.73
0.41
0.42
0.95
0.96
0.90
0.92
0.04
0.02
1.5(
1.1,
2.0)
Polit
ical
par
ty0.
820.
680.
610.
820.
450.
640.
210.
270.
420.
540.
820.
980.
910.
930.
910.
880.
820.
900.
070.
041.
6(1.
2,2.
0)
All
grou
ps0.
950.
880.
620.
700.
170.
740.
150.
280.
450.
610.
420.
600.
340.
690.
940.
890.
610.
700.
330.
211.
8(1.
6,2.
0)
Tes
t for
gen
der
diff
eren
cec
2.4(
1.4,
4.1)
0.7(
0.5,
0.9
)-
0.5
(0.4
, 0.7
)e0.
7(0.
3, 1
.5)e
0.6(
0.4,
0.7
)0.
2(0.
1,0.
3)1.
3(0.
8, 2
.0)
0.4(
0.3,
0.6
)-
Tes
t for
gen
der
diff
eren
cd2.
1 (1
.2, 3
.8)
0.6(
0.4,
0.8
)-
1.1
(0.8
, 1.6
)e0.
8(0.
4, 1
.9)e
1.0(
0.7,
1.5
)0.
2(0.
2, 0
.3)
0.8(
0.5,
1.3
)0.
8(0.
6, 1
.2)
-
a Est
imat
es a
re a
vera
ges
of r
epor
ts b
y in
divi
dual
fem
ale
and
mal
e gr
oup
mem
bers
inte
rvie
wed
in th
e se
cond
rou
nd o
f th
e su
rvey
(in
clud
ing
indi
vidu
als
alre
ady
infe
cted
with
HIV
at b
asel
ine)
b Spon
sore
d by
a c
hurc
h, s
choo
l, N
GO
, pol
itica
l par
ty, e
mpl
oyer
or
othe
r ex
tern
al b
ody
c Odd
s ra
tios
and
95%
con
fide
nce
inte
rval
s fo
r re
port
ing
grou
p ch
arac
teri
stic
, wom
en c
ompa
red
to m
en, a
djus
ted
for
age
and
loca
tion
d Odd
s ra
tios
and
95%
con
fide
nce
inte
rval
s fo
r re
port
ing
grou
p ch
arac
teri
stic
, wom
en c
ompa
red
to m
en, a
djus
ted
for
age,
loca
tion
and
type
of
grou
p
e For
age
mix
, odd
s ra
tio f
or r
epor
ting
20%
or
mor
e m
embe
rs a
ged
unde
r 20
yea
rs; f
or e
duca
tion
mix
, odd
s ra
tios
for
repo
rtin
g 50
% o
r m
ore
mem
bers
with
sec
onda
ry e
duca
tion
f Odd
s ra
tios
and
95%
con
fide
nce
inte
rval
s fo
r re
port
ing
mem
bers
hip
of a
fun
ctio
nal c
omm
unity
gro
up, w
omen
com
pare
d to
men
, adj
sute
d fo
r ag
e an
d lo
catio
n
Popul Dev Rev. Author manuscript; available in PMC 2012 March 13.