SOCIAL AND ECONOMIC DIMENSIONS OF AN AGING POPULATION
23
SEDAP A PROGRAM FOR RESEARCH ON SOCIAL AND ECONOMIC DIMENSIONS OF AN AGING POPULATION Use of Medicines by Community Dwelling Elderly in Ontario Peri J. Ballantyne Joan A. Marshman Philippa J. Clarke J. Charles Victor SEDAP Research Paper No. 103
Transcript of SOCIAL AND ECONOMIC DIMENSIONS OF AN AGING POPULATION

S E D A PA PROGRAM FOR RESEARCH ON
SOCIAL AND ECONOMICDIMENSIONS OF AN AGING
POPULATION
Use of Medicines by CommunityDwelling Elderly in Ontario
Peri J. BallantyneJoan A. MarshmanPhilippa J. ClarkeJ. Charles Victor
SEDAP Research Paper No. 103

For further information about SEDAP and other papers in this series, see our web site: http://socserv2.mcmaster.ca/sedap
Requests for further information may be addressed to:Secretary, SEDAP Research Program
Kenneth Taylor Hall, Room 426McMaster University
Hamilton, Ontario, CanadaL8S 4M4
FAX: 905 521 8232e-mail: [email protected]
July 2003
The Program for Research on Social and Economic Dimensions of an Aging Population (SEDAP)is an interdisciplinary research program centred at McMaster University with participants at theUniversity of British Columbia, Queen’s University, Univérsité de Montréal, and the University ofToronto. It has support from the Social Sciences and Humanities Research Council of Canada underthe Major Collaborative Research Initiatives Program, and further support from Statistics Canada,the Canadian Institute for Health Information, and participating universities. The SEDAP ResearchPaper series provides a vehicle for distributing the results of studies undertaken by those associatedwith the program. Authors take full responsibility for all expressions of opinion.
USE OF MEDICINES BY COMMUNITYDWELLING ELDERLY IN ONTARIO
PERI J. BALLANTYNEJOAN A. MARSHMANPHILIPPA J. CLARKEJ. CHARLES VICTOR
SEDAP Research Paper No. 103

Use of Medicines by Community Dwelling Elderly in Ontario
by
Peri J. Ballantyne*, PhD., Faculty of Pharmacy and Institute for Human Development, Life Course and Aging, University of Toronto; Joan A. Marshman, PhD., Faculty of
Pharmacy, University of Toronto; Philippa J. Clarke, PhD., Institute for Human Development, Life Course and Aging, University of Toronto, and J. Charles Victor,
MSc., Department of Public Health Science, University of Toronto.
Keywords: elderly, medicine-use, prescriptions medicines, over-the-counter medicines, natural health products Corresponding author (& reprint requests): Peri J. Ballantyne. Faculty of Pharmacy, University of Toronto, 19 Russell Street, Toronto, ON, M5S 2S2. Tel: (416) 946-5995. Fax: (416) 9781833. Email: [email protected] . This project was supported by the University of Toronto Connaught Fund start up grant (to P. Ballantyne).

2
Abstract Objective. Prescription medicine use by the elderly is of growing concern as indicated by a large literature focused on rising costs, patient compliance and the appropriateness of -use. However, prescriptions account for only a portion of medicines used by the elderly, who have increasing access to non-prescription medicines and natural health products. The objective of this paper is to describe overall medicine use among the elderly in Ontario. Methods. Using the National Population Health Survey (1996/97), we describe self-reported use of prescription, non-prescription and alternative medicines among elderly Ontarians aged 65+, and we compare use among four age sub-groups and by gender. Analysis is focused on the prevalence of, and the relative balance of use of different types of medicines. Results. About one quarter of the respondents reported using no prescription or non-prescription medicines in the two days prior to being surveyed; a large majority reported using two or fewer medicines only, and use of non-prescription medicines was reported more often than prescription medicines (56% vs 48%). Use of natural health products by seniors is relatively low, but we observe a trend toward increased use in younger age groups. Discussion. The findings place the consumption of prescription medicines by the elderly into a broader context that reveals that much of medicine use by the elderly involves non-prescribed products. We highlight the need to better understand seniors’ decision-making regarding the different types of medicines available, and the financial costs and health risks of the medicine regimes of elderly persons. (248 words)

3
Introduction A large literature on seniors and prescription medicines is focused on increasing use, appropriateness of use, and costs. Studies of prescription medicine are abundant because drug program databases provide the means to monitor prevalence of and cost of prescribing to seniors and other covered groups1, and have shown that prescription drug costs are growing faster than any other type of health care expenditure 2-3. Studies of the appropriateness of use of prescription medicines4-5 typically assess patient compliance with medication directives. These indicate that compliance rates vary from 33 to 50%6. Inappropriate prescribing, over-prescribing, and under-prescribing to the elderly have also been identified as significant problems for both patients and for the health care system, resulting in higher rates of morbidity and mortality, and increased costs 7-8. However, the capacity to estimate the full health and economic costs or benefits of medicine use by the elderly is limited when research is focused on prescription-use, to the exclusion of non-prescription products. One problem limiting the study of overall medicine use is a lack of comprehensive data 9-12. Yet, findings from smaller-scale studies on the use of non-prescription or over-the-counter medicines (OTC) and natural health products (NHP) reveal that these are used in conjunction with prescription medicines, not instead of them13-20. Markets in OTCs and NHPs are growing along with the market in prescription medicines, so the elderly have access to a drug market that is much broader than a province’s prescription drug formulary. In summary, there are many more medicines available for use than are included in provincial formularies, and there are few studies documenting overall medicine use by the elderly. Overall use of medicines by the elderly and the outcomes of use are, therefore, under-investigated and poorly understood. Methods The data presented here are drawn from the National Population Health Survey (NPHS) for 1996/97, and are representative of community-dwelling persons aged 65+ living in Ontario during that year. Details of the NPHS survey design have been documented elsewhere21. In this presentation, we focus on a set of questions about respondents’ use of medicines in the two days prior to the interview. The questions include: 1) how many medicines had been used; 2) what specific medicines were used; and 3) what additional health products were used. With respect to the latter two questions, and as a means to ensure data quality, telephone interviewers asked respondents to retrieve and read the exact name of each medicine or health product to the interviewer. Respondents could provide the names of up to 12 drugs and up to 12 health products; these were then assigned codes from the Anatomical Therapeutic Chemical Classification System for Human Medicines (ATC). We then constructed the variable “drug type”, allocating each drug or health product in

4
the ATC to one of four medicine categoriesa: 1) prescription 2) non-prescription 3) prescription or non-prescription (dose dependent) or 4) natural health product. We report summaries of the numbers of prescription and non-prescription medicines used by Ontarians aged 65 and over, and the distribution and combinations of types of medicines used in this population in total, by age-group and gender. Results The data presented in the tables reflect population parameters, based on estimation procedures provided by Statistics Canada 21. The total weighted N for data on quantity of use of medicines is 1,303,740 (57% female; 34% aged 65-69; 29% aged 70-74; 18.5% aged 75-79; and 18% aged 80 and over). The total weighted N for data on types of medicines reported (ATC classifications provided) is 850,975 (56.5% female; 36% aged 65-69; 28% aged 70-74; 19% aged 75-79; and 17% aged 80 and over). Table 1 About Here: Self Reported Number of OTC and Prescription Medicines Used in ‘Last Two Days’ (1996/97) by Population, Age-group and Gender (N=1303740) Table 1 illustrates the number of prescription (Rx) and over-the-counter (OTC) medicines used during the ‘past two days’b. About one quarter (26.6%) of the elderly population took no prescription or non-prescription medicine in the two days prior to the survey, 25% took one medicine, 20% took 2 medicines, 11% took 3 medicines, 7% took 4 medicines, and 9% took 5 or more medicines. This distribution is similar for men and women, where equal proportions took only one medicine (about one quarter), and most took two or fewer medicines during the preceding 2 days (74% and 70% respectively). However, men were significantly more likely than women to have taken no medicines (30% v 24%). Comparing age groups, persons aged 65-69 were the most likely to have taken no medicines (32%), and this group differed significantly from all other age groups. Those aged 80+ were the least likely to have taken no medicines (20%), differing significantly from those aged 65-69 and 70-74. The two youngest age groups were significantly less likely to have reported taking five or more medicines (7% of each group) than those aged 75-79 and 80+. The oldest group (80+) was most likely (13%) to report having used 5+ medications. These data indicate there is a relationship between age and gender, and quantity of prescription and over-the-counter medicine use. Table 2 About Here Types of Medicines Used in ‘Last Two Days’ (1996/97) by Population, Age-Group and Gender (N=850,975)
a Prescription designations vary by province. This classification was based on prescription/non-prescription designation in Ontario in 1996. b The table refers only to the number of Rx or OTC medicines reported. Therefore, the numbers of drugs reported by respondents is conservative, as natural health products are excluded.

5
Table 2 illustrates the types and combinations of medicines used, for the total population, and by age group and gender. In general, 48% of the elderly reported using prescription medicines, 56% reported using over-the-counter medicines, and 7% reported using natural health products. About one quarter of the elderly reported using none of these three medicine types, and about 3% reported using all three concurrently. Some age and gender differences are notable. For example, the youngest age group is the most likely to have reported using none of the medicines types (29%) in the two days prior to their interview, a significantly greater proportion than those aged 70-74 (23%) and 80+ (19%). Men were significantly more likely than women to have reported using none of the three medicine types (29% v 21%). Examining specific medicine types, respondents aged 65-69 were significantly less likely than those aged 70-74 to report using prescription medicines, and females were significantly more likely than males to do so. There were no differences in rates of use of non-prescription medicines by age or gender. Women were significantly more likely than men to report using natural health products and all three medicine types concurrently, while there were no significant age group differences in reported use of natural health products or concurrent use of three medicine types. Among all groups examined, similar distributions of use of the three types of medicines are evident: OTC use was more common than use of prescriptions, small proportions reported using any NHPs (< 8%), and even fewer reported using all three types of medicine concurrently (<3%). Figure 1 About Here Self Reported Types and Combinations of Medicines Used in ‘Last Two Days’ (1996/97) (N=850,975) In Figure 1, the distribution of types and combinations of medicines is illustrated. This figure shows that use of OTCs alone was more common than the use of prescriptions alone (21.1% and 15.1% respectively). The use of NHPs only was infrequently reported by the elderly (1.2%), although we observe a trend toward increasing use in younger age groups. The concurrent use of OTC and Rx medicines was more common than other combinations (29.2%). Concurrent use of OTCs and NHPs, and prescriptions and NHPs occurred infrequently (2.5% and .7%). Few elderly reported using all three types of medicines at the same time (3.0%). A small proportion reported using “other medicines only” (3.1%)c. Finally, a large proportion of the elderly reported that in the two days preceding their interview, they had been using no medicines at all (24.5%). Discussion
c We are unable to determine whether these medicines were prescribed or purchased “over-the-counter”, hence conceptually, we are uninterested in this category. The figure includes the “other only” category only to “round out” the pie chart (to account for all types of medicines reported).

6
The results suggest that to some extent age accounts for quantity and relative proportions of use of different medicine types in a community population of seniors, with the greatest differences noted between the youngest and oldest groups. Non-use varies by age in the direction one might predict (greater for youngest seniors, less non-use among the oldest-old). In general, there is stability in types and combinations of medicines used in all age groups. Similarly, some gender differences in non-use and types of use are observed. Women are less likely to be non-users than men and more inclined to concurrent use of different types of medicines, but there stable patterns of use observed for men and women, as for age (more OTC than Rx, few NHPs, fewer Rx/OTC/NHP). We suggest that observed gender differences in use of medicines may reflect gender differences in noticing symptoms, in seeking and in receiving health care22. Reported non-use of prescription medicines (52%) ‘in the past two days’ and the consistency of non-use across age groups and gender are in stark contrast to analysis of formulary data that show high rates of prescribing to the elderly. For example, one study reported that approximately 90% of Ontario elderly received prescription medications in each year, from 1993 to 199723. This difference may reflect the limitations of self-report data 24; it could be explained by the different time frames for the data (past two days v per year) or the different types of data (prescriptions filled and reimbursed by the ODB v self reported use of medicines). Given that studies consistently show high rates of non-adherence or non-compliance 6, it is reasonable to assume that receipt of a prescription is a poor estimate of actual use of medicines. There may be something to be learned from “low medication-use” seniors who report they are not using prescription or other types of medicines. In ongoing work, we are modeling the characteristics of non-use, low-use and high-use of medicines among the elderly. In our analysis, we will estimate potential under-treatment (based on disease categories and medicines available for their treatment) and discuss the possibility that some elderly may not be receiving medicines that could enhance and extend their lives. With respect to overall use of medicines, the finding of high rates of non-use (about 25%) and low rates of high use (<10%) is consistent with other data on health services utilization documenting a disproportionate share of health services utilization (hospital beds, physician visits, prescriptions) and costs by the elderly, largely accounted for by intensive use of services by a small proportion of the elderly, typically the very old and very sick 25-29. The question to be pursued, then, is whether the use and costs of medicines are justifiable in terms of positive contributions to quality of life and health among those elderly who are using prescription and non-prescription medicines. The findings have two central implications. First, given the extent of use of non-prescribed medicines (OTCs and NHPs), there is a need to know more about elderly self-care and self-medication 30-31, including how individuals make choices about OTC and NHPs use, and their sources of information. Our search of the literature revealed that little attention has been paid to how a socially and culturally diverse Canadian elderly population negotiates this broad market in medicinal products, or to the short- and long-term health effects of seniors’ selective use of the variety of available medicines. Further,

7
the role of the physician or pharmacist with respect to surveillance of, or counseling around the use of non-prescription medicines by the elderly requires further study. Second, given the extent of use of non-prescribed medicines that are commonly purchased out-of-pocket (OTCs and NHPs), there is a need to better understand the influence of cost of medicines on patient health outcomes (and of costs as deterrents to use). Further, an assessment of the extent to which elderly patients subsidize the provincial drug benefit programs when they engage in self care using non-prescribed medicines is in order. Such an evaluation (of health outcomes and costs) would make an important contribution to discussions in public health research of the value of drugs in the care of the elderly. (1977 words)

8
References 1. Anis A, Guh D, Wang X. A dog’s breakfast: prescription drug coverage varies widely across Canada. Med Care 2001; 39(4): 315-326. 2. Canadian Institute for Health Information. Health Care in Canada. 2002. 3. Glaxo Wellcome Inc and Brogan Inc. DELTA Report Summary of Findings 2000. 4. Coambs RB., Jepson M., Hao Her M, Ferguson BS, Jarry JL, Wong JSW, et al., Review of the Scientific Literature on the Prevalence, Consequences and Health Costs of Noncompliance and Inappropriate Use of Prescription Medication in Canada. Ottawa: Pharmaceutical Manufacturers Association of Canada, 1995. 5. Morris LS, Schultz RM. Patient compliance—an overview. J. Clin Pharm Ther 1992; 17: 283-95. 6. Nichols MB, Venturini F, Sung JC. A critical evaluation of the methodology of the literature on medical compliance. Ann Pharmacotherap 1999; 33: 351-40. 7.Tamblyn R.M. Editorial: Canadian Association on Gerontology Policy Statement: Seniors and Prescription Drugs. Canadian J Aging 2000; 19(1): vii-xiv. 8. Tamblyn RM, Perreault R. Encouraging the Wise Use of Prescription Medication by Older Adults. In Determinants of Health: Adults and Senior. National Forum on Health, 1998. Editions Multimondes. 1998. 9. Frank C, Godwin M, Verma S, Kelly A, Birenbaum A, Seguin R. What drugs are our frail elderly patients taking” Do drugs they take or fail to take put them at increased risk of interactions and inappropriate medication use? Can Fam Physician 2001; 47: 1198-1204. 10. Barat I, Andreasen F, Damsgaard EMS. Drug therapy in the elderly: what doctors believe and patients actually do. Br J Clin Pharmacol, 2001; 51: 615-622. 11. Sjahid SI, Van der Linden PD, Stricker BH. Agreement between the pharmacy medication history and patient interview for cardiovascular drugs: the Rotterdam elderly study. Br J Clin Pharmacol 1998; 45: 591-595. 12. Heerdink ER, Hurbert G, Leufkens CK, Bakker A. Information on drug use in the elderly: a comparison of pharmacy, general practitioner and patient data. Pharm World Sci 1995; 17(1): 20-4. 13. Mount JK. Quantity and appropriateness of nonprescribed drug use in a high risk elderly population: prevalence and correlates. J Soc Admin Pharm 1991; 8(1): 25-32.

9
14. Thomas KJ, Carr J, Westlake L, Williams BT. Use of non-orthodox and conventional health care in Great Britain. Br Med J 1991; 302(26): 207-10. 15. Vincent C, Furnham A. The perceived efficacy of orthodox and complementary medicine. Complement Ther Med 1994; 2:128-134. 16.Vincent C, Furnham A. Why do patients turn to complementary medicine? An empirical study. Br J Clin Psych 1996; 35: 37-48. 17. Lamy PP. Over-the-counter medications: the drug interactions we overlook. J Am Geriatr Soc 1982; 30: S69-75. 18. Stoller E. Prescribed and over-the-counter medicine use by the ambulatory elderly. Med Care 1988; 26(12): 1149-57. 19. Darnell J, Murray M, Martz B, Weinberger M. Medication use by ambulatory elderly: an in-home survey. J Am Geriatr Soc 1986; 34(1): 1-4. 20. Rantucci M. and Segal HJ. Hazardous non-prescription analgesic use by the elderly. J Soc Admin Pharm, 1991; 8(3): 108-120. 21. Tambay, JL, Catlin G. Sample Design of the National Population Health Survey. Health Reports 1995; 7(1): 29-38. 22. Verbrugge LM. Gender and Health: An Update on Hypothesis and Evidence”. J Health Soc Behav 1985; 26: 156-82. 23. Mamdani MM, Parikh SV, Austin PC, Upshur RE. "Use of antidepressants among elderly subjects: trends and contributing factors". Am J Psychiatry 2000; 157(3):360-7. 24. Klungel OH, de Boer A, Paes AHP, Herings RMC, Seidell JC, Bakker A. (2000) Influence of question structure on the recall of self-reported drug use. J Clin Epidemiol 53: 273-277. 25 Wolinsky, FD, Arnold CL. A different perspective on health and health services utilization. Ann Rev Gerontol Geriatr 1998; 8: 71-101. 26 Wolinsky, FD, Culler SD, Callahan CM, Johnson RJ. Hospital Resource Consumption Among Older Adults: A Prospective Analysis f Episodes, Length of Stay, and Charges Over a Seven-year Period. J Gerontol Psychol Sci Soc Sci 1994; 49 (5): S240-252. 27 Garfinkel, SA, Riley GF, Ianncchione VG. High Cost Users of Medical Care. Health Care Financing Review 1988; 9(4): 41-52.

10
28. Stump TE, Johnson RJ, Wolinsky FD. Changes in Physician Utilization over Time Among Older Adults. J Gerontol Psychol Sci Soc Sci 1995; 50B (1): S45-58. 29. Roos NP, Shapiro E, Tate R. Does a small minority of elderly account for a majority of health care expenditures? A Sixteen year perspective. Millbank Q 1989; 67: 347-369. 30. Haug MR, Wykle ML, Namazi KH Self Care Among Older Adults. Soc Sci Med 1989; 29(2): 171-183. 31. Wilkinson IF, Darby DN, Mant A. Self-care and self-medication: an evaluation of individuals’ health care decisions. Med Care 1987; 25: 965-78.

Distribution of Medicine by Type Among Ontario Seniors
24.5% none
3.0% Rx/OTC/NHP
15.1% Rx Only
29.2% Rx/OTC
21.1% OTC only
2.5% OTC/NHP
M1.2% NHP only
M0.7% Rx/NHP
3.1% other
Figure 1
M High sampling variability associated with these estimates
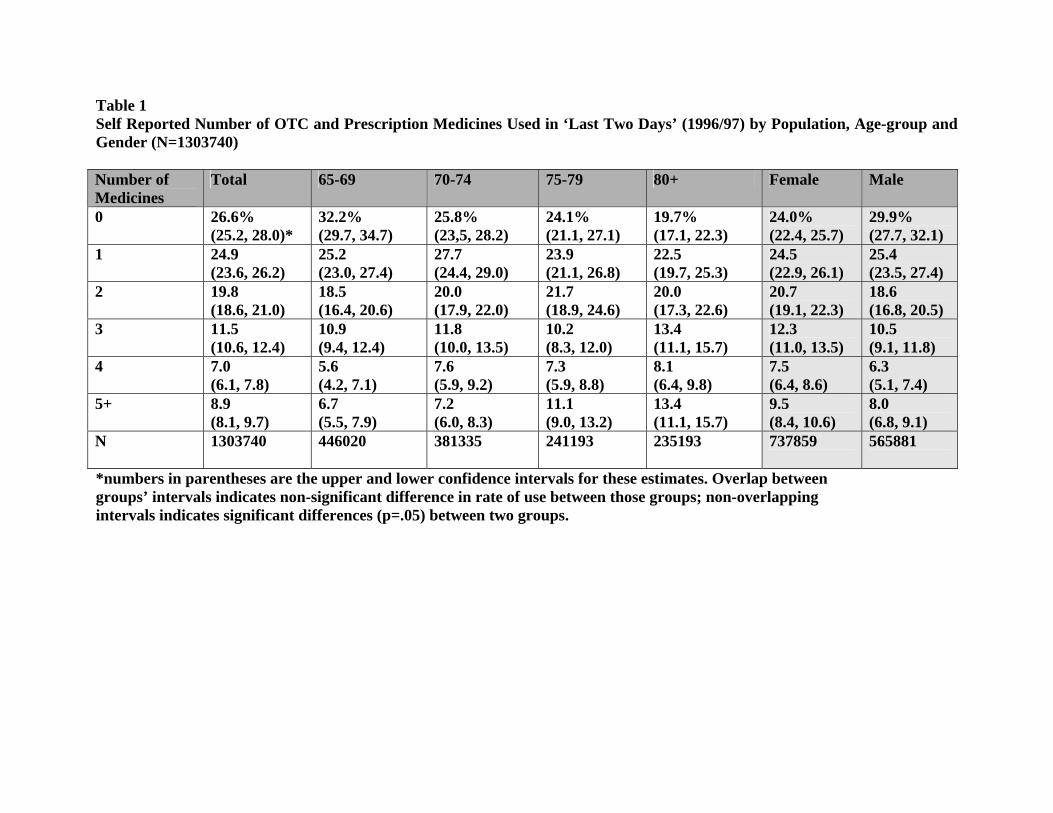
Table 1 Self Reported Number of OTC and Prescription Medicines Used in ‘Last Two Days’ (1996/97) by Population, Age-group and Gender (N=1303740) Number of Medicines
Total 65-69 70-74 75-79 80+ Female Male
0
26.6% (25.2, 28.0)*
32.2% (29.7, 34.7)
25.8% (23,5, 28.2)
24.1% (21.1, 27.1)
19.7% (17.1, 22.3)
24.0% (22.4, 25.7)
29.9% (27.7, 32.1)
1
24.9 (23.6, 26.2)
25.2 (23.0, 27.4)
27.7 (24.4, 29.0)
23.9 (21.1, 26.8)
22.5 (19.7, 25.3)
24.5 (22.9, 26.1)
25.4 (23.5, 27.4)
2
19.8 (18.6, 21.0)
18.5 (16.4, 20.6)
20.0 (17.9, 22.0)
21.7 (18.9, 24.6)
20.0 (17.3, 22.6)
20.7 (19.1, 22.3)
18.6 (16.8, 20.5)
3
11.5 (10.6, 12.4)
10.9 (9.4, 12.4)
11.8 (10.0, 13.5)
10.2 (8.3, 12.0)
13.4 (11.1, 15.7)
12.3 (11.0, 13.5)
10.5 (9.1, 11.8)
4
7.0 (6.1, 7.8)
5.6 (4.2, 7.1)
7.6 (5.9, 9.2)
7.3 (5.9, 8.8)
8.1 (6.4, 9.8)
7.5 (6.4, 8.6)
6.3 (5.1, 7.4)
5+
8.9 (8.1, 9.7)
6.7 (5.5, 7.9)
7.2 (6.0, 8.3)
11.1 (9.0, 13.2)
13.4 (11.1, 15.7)
9.5 (8.4, 10.6)
8.0 (6.8, 9.1)
N
1303740 446020 381335 241193 235193 737859 565881
*numbers in parentheses are the upper and lower confidence intervals for these estimates. Overlap between groups’ intervals indicates non-significant difference in rate of use between those groups; non-overlapping intervals indicates significant differences (p=.05) between two groups.

Table 2 Self Reported Types of Medicines Used in ‘Last Two Days’ by Population, Age Group and Gender† (N=850975) Type of Medicine
Total 65-69 70-74 75-79 80+ Female Male
Any Rx 47.9% (46.1, 49.7) ‡
43.3% (40.2, 46.5)
51.1% (47.9, 54.4)
47.4% 43.0, 51.8)
52.9% (40.2, 53.4)
52.0% (49.5, 54.6)
42.4% (39.7, 45.4)
Any OTC 55.7 (53.9, 57.6)
52.2 (49.1, 55.2)
56.5 (53.1, 59.8)
56.3 (51.9, 60.7)
61.6 (47.0, 62.0)
58.1 (55.6, 60.5)
52.7 (48.9, 55.6)
Any CAM 7.2 (6.3, 8.2)
8.3 (6.7, 10.0)
7.3 (5.7, 9.0)
6.0 (4.1, 7.9)
6.1 M (3.5, 7.4)
8.4 (7.0, 9.7)
5.8 (4.7, 6.9)
Rx/OTC/CAM 3.0 (2.4, 3.6)
3.1 (2.1, 4.1)
3.2 (2.2, 4.3)
2.6 M (1.3, 4.0)
2.9 M (1.1, 4.0)
3.9 (3.0, 4.9)
1.8 M (1.2, 2.4)
NONE* 24.3 (22.6, 26.0)
28.8 (25.7, 31.8)
22.5 (19.6, 25.4)
23.1 (19.2, 26.9)
19.3 (13.5, 20.6)
20.9 (18.7, 23.1)
28.8 (26.1, 31.5)
N 850975 30641 240858 11106 142549 480054 370920 *refers to no Rx, OTC, CAM or other. † multiple response categories: columns do not sum to 100% ‡ numbers in parentheses are the upper and lower confidence intervals for these estimates. Overlap between groups’ intervals indicates non-significant difference in rate of use between those groups; non-overlapping intervals indicates significant differences (p=.05) between two groups. M=High sampling variability associated with these estimates.

SEDAP RESEARCH PAPERS
Number Title Author(s)
14
No. 1: Population Aging and Its Economic Costs: A Survey of theIssues and Evidence
F.T. DentonB.G. Spencer
No. 2: How Much Help Is Exchanged in Families?Towards an Understanding of Discrepant Research Findings
C.J. RosenthalL.O. Stone
No. 3: Did Tax Flattening Affect RRSP Contributions? M.R. Veall
No. 4: Families as Care-Providers Versus Care-Managers? Gender andType of Care in a Sample of Employed Canadians
C.J. RosenthalA. Martin-Matthews
No. 5: Alternatives for Raising Living Standards W. Scarth
No. 6: Transitions to Retirement: Determinants of Age of SocialSecurity Take Up
E. Tompa
No. 7: Health and Individual and Community Characteristics: AResearch Protocol
F. BélandS. BirchG. Stoddart
No. 8: Disability Related Sources of Income and Expenses: AnExamination Among the Elderly in Canada
P. RainaS. Dukeshire M. DentonL.W. Chambers A. ScanlanA. GafniS. FrenchA. JoshiC. Rosenthal
No. 9: The Impact of Rising 401(k) Pension Coverage on FuturePension Income
W.E. EvenD.A. Macpherson
No. 10: Income Inequality as a Canadian Cohort Ages: An Analysis ofthe Later Life Course
S.G. Prus
No. 11: Are Theories of Aging Important? Models and Explanations inGerontology at the Turn of the Century
V.L. BengtsonC.J. RiceM.L. Johnson
No. 12: Generational Equity and the Reformulation of Retirement M.L. Johnson
No. 13: Long-term Care in Turmoil M.L. JohnsonL. CullenD. Patsios
No. 14: The Effects of Population Ageing on the Canadian Health CareSystem
M.W. Rosenberg

SEDAP RESEARCH PAPERS
Number Title Author(s)
15
No. 15: Projections of the Population and Labour Force to 2046: Canada F.T. DentonC.H. FeaverB.G. Spencer
No. 16: Projections of the Population and Labour Force to 2046: TheProvinces and Territories
F.T. DentonC.H. FeaverB.G. Spencer
No. 17: Location of Adult Children as an Attraction for Black and WhiteElderly Migrants in the United States
K.-L. LiawW.H. FreyJ.-P. Lin
No. 18: The Nature of Support from Adult Sansei (Third Generation)Children to Older Nisei (Second Generation) Parents in JapaneseCanadian Families
K.M. Kobayashi
No. 19: The Effects of Drug Subsidies on Out-of-Pocket PrescriptionDrug Expenditures by Seniors: Regional Evidence from Canada
T.F. CrossleyP. GrootendorstS. Korkmaz M.R. Veall
No. 20: Describing Disability among High and Low Income Status Older Adults in Canada
P. RainaM. WongL.W. ChambersM. DentonA. Gafni
No. 21: Parental Illness and the Labour Supply of Adult Children P.T.Léger
No. 22: Some Demographic Consequences of Revising the Definition of#Old& to Reflect Future Changes in Life Table Probabilities
F.T. DentonB.G. Spencer
No. 23: Geographic Dimensions of Aging: The Canadian Experience1991-1996
E.G. MooreD. McGuinnessM.A. PaceyM.W. Rosenberg
No. 24: The Correlation Between Husband’s and Wife’s Education:Canada, 1971-1996
L. MageeJ. BurbidgeL. Robb
No. 25: The Effect of Marginal Tax Rates on Taxable Income:A Panel Study of the 1988 Tax Flattening in Canada
M.-A. SillamaaM.R. Veall
No. 26: The Stability of Self Assessed Health Status T.F. CrossleyS. Kennedy
No. 27: How Do Contribution Limits Affect Contributions to Tax-Preferred Savings Accounts?
K. Milligan

SEDAP RESEARCH PAPERS
Number Title Author(s)
16
No. 28: The Life Cycle Model of Consumption and Saving M. BrowningT.F. Crossley
No. 29: Population Change and the Requirements for Physicians: TheCase of Ontario
F.T. DentonA. GafniB.G. Spencer
No. 30: Nonparametric Identification of Latent Competing Risks and RoyDuration Models
G. ColbyP. Rilstone
No. 31: Simplified Estimation of Multivariate Duration Models withUnobserved Heterogeneity
G. ColbyP. Rilstone
No. 32: Structural Estimation of Psychiatric Hospital Stays G. ColbyP. Rilstone
No. 33: Have 401(k)s Raised Household Saving? Evidence from theHealth and Retirement Study
G.V. Engelhardt
No. 34: Health and Residential Mobility in Later Life:A New Analytical Technique to Address an Old Problem
L.M. Hayward
No. 35: 2 ½ Proposals to Save Social Security D. FretzM.R. Veall
No. 36: The Consequences of Caregiving: Does Employment Make aDifference
C.L. KempC.J. Rosenthal
No. 37: Fraud in Ethnocultural Seniors' Communities P.J.D. Donahue
No. 38: Social-psychological and Structural Factors Influencing theExperience of Chronic Disease: A Focus on Individuals withSevere Arthritis
P.J. BallantyneG.A. HawkerD. Radoeva
No. 39: The Extended Self: Illness Experiences of Older MarriedArthritis Sufferers
P.J. BallantyneG.A. HawkerD. Radoeva
No. 40: A Comparison of Alternative Methods to Model Endogeneity inCount Models. An Application to the Demand for Health Careand Health Insurance Choice
M. Schellhorn
No. 41: Wealth Accumulation of US Households: What Do We Learnfrom the SIPP Data?
V. Hildebrand
No. 42: Pension Portability and Labour Mobility in the United States. New Evidence from SIPP Data.
V. AndriettiV. Hildebrand

SEDAP RESEARCH PAPERS
Number Title Author(s)
17
No. 43: Exploring the Effects of Population Change on the Costs ofPhysician Services
F.T. DentonA. GafniB.G. Spencer
No. 44: Reflexive Planning for Later Life: A Conceptual Model andEvidence from Canada
M.A. DentonS. FrenchA. GafniA. JoshiC. RosenthalS. Webb
No. 45: Time Series Properties and Stochastic Forecasts: SomeEconometrics of Mortality from the Canadian Laboratory
F.T. DentonC.H. FeaverB.G. Spencer
No. 46: Linear Public Goods Experiments: A Meta-Analysis J. Zelmer
No. 47: Local Planning for an Aging Population in Ontario: Two CaseStudies
L.M. Hayward
No. 48: Management Experience and Diversity in an AgeingOrganisation: A Microsimulation Analysis
T. WannellM. Gravel
No. 49: Resilience Indicators of Post Retirement Well-Being E. MarzialiP. Donahue
No. 50: Continuity or Change? Older People in Three Urban Areas J. PhillipsM. BernardC. PhillipsonJ. Ogg
No. 51: Intracohort Income Status Maintenance: An Analysis of the LaterLife Course
S.G. Prus
No. 52: Tax-Preferred Savings Accounts and Marginal Tax Rates:Evidence on RRSP Participation
K. Milligan
No. 53: Cohort Survival Analysis is Not Enough: Why Local PlannersNeed to Know More About the Residential Mobility of theElderly
L.M. HaywardN.M. Lazarowich
No. 54: Unemployment and Health: Contextual Level Influences on the Production of Health in Populations
F. BélandS. BirchG. Stoddart
SEDAP RESEARCH PAPERS
Number Title Author(s)
18
No. 55: The Timing and Duration of Women's Life Course Events: AStudy of Mothers With At Least Two Children
K.M. KobayashiA. Martin-MatthewsC.J. RosenthalS. Matthews
No. 56: Age-Gapped and Age-Condensed Lineages: Patterns ofIntergenerational Age Structure Among Canadian Families
A. Martin-MatthewsK. M. KobayashiC.L. RosenthalS.H. Matthews
No. 57: The Relationship between Age, Socio-Economic Status, andHealth among Adult Canadians
S.G. Prus
No. 58: Measuring Differences in the Effect of Social Resource Factorson the Health of Elderly Canadian Men and Women
S.G. PrusE. Gee
No. 59: APOCALYPSE NO: Population Aging and the Future of HealthCare Systems
R.G. EvansK.M. McGrailS.G. MorganM.L. BarerC. Hertzman
No. 60: The Education Premium in Canada and the United States J.B. BurbidgeL. MageeA.L. Robb
No. 61: Student Enrolment and Faculty Recruitment in Ontario:The Double Cohort, the Baby Boom Echo, and the Aging ofUniversity Faculty
B.G. Spencer
No. 62: The Social and Demographic Contours of ContemporaryGrandparenthood: Mapping Patterns in Canada and the UnitedStates
C.L. Kemp
No. 63: Changing Income Inequality and the Elderly in Canada 1991-1996: Provincial Metropolitan and Local Dimensions
E.G. MooreM.A. Pacey
No. 64: Mid-life Patterns and the Residential Mobility of Older Men L.M. Hayward
No. 65: The Retirement Incentive Effects of Canada’s Income SecurityPrograms
M. BakerJ. GruberK. Milligan
No. 66: The Economic Well-Being of Older Women Who BecomeDivorced or Separated in Mid and Later Life
S. DaviesM. Denton
No. 67: Alternative Pasts, Possible Futures: A “What If” Study of theEffects of Fertility on the Canadian Population and Labour Force
F.T. DentonC.H. FeaverB.G. Spencer

SEDAP RESEARCH PAPERS
Number Title Author(s)
19
No. 68: Baby-Boom Aging and Average Living Standards W. ScarthM. Souare
No. 69: The Invisible Retirement of Women L. McDonald
No. 70: The Impact of Reference Pricing of Cardiovascular Drugs onHealth Care Costs and Health Outcomes: Evidence from BritishColumbia – Volume I: Summary
P.V. GrootendorstL.R. DolovichA.M. HolbrookA.R. LevyB.J. O'Brien
No. 71: The Impact of Reference Pricing of Cardiovascular Drugs onHealth Care Costs and Health Outcomes: Evidence from BritishColumbia – Volume II: Technical Report
P.V. GrootendorstL.R. DolovichA.M. HolbrookA.R. LevyB.J. O'Brien
No. 72: The Impact of Reference Pricing of Cardiovascular Drugs onHealth Care Costs and Health Outcomes: Evidence from BritishColumbia – Volume III: ACE and CCB Literature Review
L.R. DolovichA.M. HolbrookM. Woodruff
No. 73: Do Drug Plans Matter? Effects of Drug Plan Eligibility on DrugUse Among the Elderly, Social Assistance Recipients and theGeneral Population
P. GrootendorstM. Levine
No. 74: Living Alone and Living with Children: The LivingArrangements of Canadian and Chinese-Canadian Seniors
M.A. Pacey
No. 75: Student Enrolment and Faculty Recruitment in Ontario:The Double Cohort, the Baby Boom Echo, and the Aging ofUniversity Faculty (Revised and updated version of No. 61)
B.G. Spencer
No. 76: Gender Differences in the Influence of Economic, Lifestyle, andPsychosocial Factors on Later-life Health
S.G. PrusE. Gee
No. 77: Asking Consumption Questions in General Purpose Surveys M. BrowningT.F. CrossleyG. Weber
No. 78: A Longitudinal Study of the Residential Mobility of the Elderlyin Canada
Y. Ostrovsky
No. 79: Health Care in Rural Communities: Exploring the Developmentof Informal and Voluntary Care
M.W. SkinnerM.W. Rosenberg
No. 80: Does Cognitive Status Modify the Relationship BetweenEducation and Mortality? Evidence from the Canadian Study ofHealth and Aging
J.C. BrehautP. RainaJ. Lindsay

SEDAP RESEARCH PAPERS
Number Title Author(s)
20
No. 81: Agreement Between Self-Reported and Routinely CollectedHealth Care Utilisation Data Among Seniors
P. RainaV. Torrance-RynardM. Wong C. Woodward
No. 82: Age, Retirement and Expenditure Patterns: An EconometricStudy of Older Canadian Households
F.T. DentonD.C. MountainB.G. Spencer
No. 83: Understanding the Relationship between Income Status and theRestrictions in Instrumental Activities of Daily Living amongDisabled Older Adults
P. RainaM. Wong
No. 84: Location of Adult Children as an Attraction for Black and WhiteElderly Return and Onward Migrants in the United States: Application of a Three-level Nested Logit Model with CensusData
K-L. LiawW.H. Frey
No. 85: Changing Income Inequality and Immigration in Canada 1980-1995
E.G. MooreM.A. Pacey
No. 86: The Dynamics of Food Deprivation and Overall Health: Evidence from the Canadian National Population Health Survey
L. McLeodM.R. Veall
No. 87: Quebec's Lackluster Performance in Interprovincial Migrationand Immigration: How, Why, and What Can Be Done?
K-L. LiawL. XuM. Qi
No. 88: Out-of-Pocket Prescription Drug Expenditures and PublicPrescription Drug Programs
S. AlanT.F. CrossleyP. GrootendorstM.R. Veall
No. 89: The Wealth and Asset Holdings of U.S.-Born and Foreign-BornHouseholds: Evidence from SIPP Data
D.A. Cobb-ClarkV. Hildebrand
No. 90: Population Aging, Productivity, and Growth in Living Standards W. Scarth
No. 91: A Life-course Perspective on the Relationship between Socio-economic Status and Health: Testing the Divergence Hypothesis
S.G. Prus
No. 92: Immigrant Mental Health and Unemployment S. Kennedy
No. 93: The Relationship between Education and Health in Australia andCanada
S. Kennedy
SEDAP RESEARCH PAPERS
Number Title Author(s)
21
No. 94: The Transition from Good to Poor Health: An EconometricStudy of the Older Population
N.J. BuckleyF.T. DentonA.L. RobbB.G. Spencer
No. 95: Using Structural Equation Modeling to Understand the Role ofInformal and Formal Supports on the Well-being of Caregivers ofPersons with Dementia
P. RainaC. McIntyreB. ZhuI. McDowellL. SantaguidaB. KristjanssonA. HendricksL.W. Chambers
No. 96: Helping to Build and Rebuild Secure Lives and Futures: Intergenerational Financial Transfers from Parents to AdultChildren and Grandchildren
J. PloegL. CampbellM. DentonA. JoshiS. Davies
No. 97: Geographic Dimensions of Aging in Canada1991-2001
E.G. MooreM.A. Pacey
No. 98: Examining the “Healthy Immigrant Effect” in Later Life: Findings from the Canadian Community Health Survey
E.M. GeeK.M. KobayashiS.G. Prus
No. 99: The Evolution of High Incomes in Canada, 1920-2000 E. SaezM.R. Veall
No. 100: Macroeconomic Implications of Population Aging and PublicPensions
M. Souare
No. 101: How Do Parents Affect the Life Chances of Their Children asAdults? An Idiosyncratic Review
J. Ermisch
No. 102: Population Change and Economic Growth: The Long-TermOutlook
F.T. DentonB.G. Spencer
No. 103: Use of Medicines by Community Dwelling Elderly in Ontario P.J. BallantyneJ.A. MarshmanP.J. ClarkeJ.C. Victor