SMiRT 13 SEISMIC EVALUA TION OF EXISTING NUCLEAR ...
436
— IOO Reproduced by IAEA XA9952643 - s i SMiRT 13 Post Conference Seminar 16 (Advanced Technology Seminar) SEISMIC EVALUA TION OF EXISTING NUCLEAR FACILITIES PROCEEDINGS OF THE SMiRT 13 POST CONFERENCE SEMINAR NO. 16 organized by the INTERNATIONAL ATOMIC ENERGY AGENCY and the NATIONAL UNIVERSITY OF CORDOBA (ARGENTINA) Iguazu, Argentina August 21 - 23, 1995 NOTE The material in this document has been supplied by the authors and has not been edited by the IAEA. The views expressed remain the responsibility of the named authors and do not necessarily reflect those of the government(s) of the designated Member State(s). In particular, neither the IAEA nor any other organization or body sponsoring the meeting can be held responsible for any material reproduced in this document. / 30-46
-
Upload
khangminh22 -
Category
Documents
-
view
0 -
download
0
Transcript of SMiRT 13 SEISMIC EVALUA TION OF EXISTING NUCLEAR ...

— IOO
Reproduced by IAEA XA9952643 - s i
SMiRT 13Post Conference Seminar 16
(Advanced Technology Seminar)
SEISMIC EVALUA TION OFEXISTING NUCLEAR
FACILITIES
PROCEEDINGS OF THESMiRT 13 POST CONFERENCE SEMINAR NO. 16
organized by theINTERNATIONAL ATOMIC ENERGY AGENCY
and theNATIONAL UNIVERSITY OF CORDOBA (ARGENTINA)
Iguazu, ArgentinaAugust 21 - 23, 1995
NOTEThe material in this document has been supplied by the authors and has not been edited by theIAEA. The views expressed remain the responsibility of the named authors and do notnecessarily reflect those of the government(s) of the designated Member State(s). In particular,neither the IAEA nor any other organization or body sponsoring the meeting can be heldresponsible for any material reproduced in this document.
/ 3 0 - 4 6

DISCLAIMER
Portions of this document may beillegible in electronic image products,Images are produced from the best
available original document.

Reproduced by IAEA Limited Distribution
SMiRT 13Post Conference Seminar 16
(Advanced Technology Seminar)
SEISMIC EVALUA TION OFEXISTING NUCLEAR
FA CILITIES
PROCEEDINGS OF THESMiRT 13 POST CONFERENCE SEMINAR NO. 16
organized by theINTERNATIONAL ATOMIC ENERGY AGENCY
and theNATIONAL UNIVERSITY OF CORDOBA (ARGENTINA)
Iguazu, ArgentinaAugust 21 -23 , 1995
NOTEThe material in this document has been supplied by the authors and has not been editedby the IAEA. The views expressed remain the responsibility of the named authors and donot necessarily reflect those of the government(s) of the designated Member State(s). Inparticular, neither the IAEA nor any other organization or body sponsoring the meeting canbe held responsible for any material reproduced in this document.

SMiRT-13, POST CONFERENCESEMINAR No. 16 on
"Seismic Evaluation of Existing NuclearFacilities "
ORGANIZERS
INSTITUTIONS:
* INTERNATIONAL ATOMIC ENERGY AGENCY
* NATIONAL UNIVERSITY OF CORDOBA (Argentina)
and the sponsorship of:
* SCIENCE AND TECHNOLOGY RESEARCH COUNCIL of CordobaProvince (Argentina)
ORGANIZING COMMITTEE:
Antonio R. GODOY and Aybars GURPINARInternational Atomic Energy AgencyDivision of Nuclear Installation SafetyEngineering Safety Section
Carlos A. PRATONational University of Cordoba (Argentina)
Heki SHIBATAYokohama National University (Japan)
Norbert KRUTZIKSiemens-KWU (Germany)
John D. STEVENSONStevenson and Associates (USA)

LOCAL ORGANIZING COMMITTEE:
Carlos A. PRATODepartment of StructuresNational University of CordobaCordoba, Argentina
Ricardo ROCCANational University of CordobaCordoba, Argentina
Emilio REDOLFINational University of CordobaCordoba, Argentina
Alejandro GIULIANONational Institute for Seismic Prevention (INPRES)San Juan, Argentina
Luis M. ALVAREZENACE S.A.Buenos Aires, Argentina
PREFACE
At the International Atomic Energy Agency the past twenty years has seen thedevelopment of an internationally recognized set of nuclear power plant safety standards (NUSS)consisting of 5 codes and 55 safety guides providing basic requirements and recommendationson governmental organization, siting, design, operation, and quality assurance. Since thebeginning of the process of standard development, the safety of nuclear power plants in relationto natural external events, mainly earthquakes, had a significant role and a number of the safetyguides refer to this topic.
Concurrent with the development of NUSS, the past six years has witnessed the increasein the safety review services as an element of Agency's national, regional and interregionaltechnical assistance and co-operation programmes. These review services have the main purposeto assist Member States for the implementation of requirements and recommendations of theIAEA codes and safety guides as well as standards of international practice to ensure consistentand uniform assessment and enhancement of safety. Issues mainly related to the seismic safetyof operating nuclear facilities resulted in the organization and performance of more than 120engineering safety review services between 1989-1996. Thus, after 1991 an increasing activitywas carried out regarding the evaluation and upgrading of the seismic safety of former Sovietdesign nuclear power plants. The vulnerability of WWER type reactors to earthquakes receivedspecial attention and consequently a large number of services were provided by the Agency incoordination with other international and national organizations (regulatory bodies,utilities/operators and engineering and consultants firms). Some of the common problemsencountered during these revisions led to the initiation of the Coordinated Research Program on"Benchmark study for the seismic analysis and testing of WWER type NPPs" in 1993, with 25participating institutions from 15 countries.
The need to provide transfer of information and experience in the evaluation of seismicsafety was recognized by the Member States in a Technical Committee Meeting held in Tokyo,Japan, in August 1991, following the SMiRT-11 International Conference. In that meeting it wasemphasized that effective exchange of information is essential for further development ofinternational co-operation in this field. It should also be mentioned that in the programme ofSMiRT-11 a special session on IAEA activities was included as part of the national andinternational research and standard programmes associated with SMiRT.
To respond to the request of Member States and to reflect the work done and theexperience gained, the Agency organized this post conference seminar on the subject as part ofthe activities of SMiRT. This is the second time that experts involved in seismic re-evaluationand upgrading of operating nuclear facilities convened to discuss the issues of mutual interest andthe experience that they had, first in Vienna in 1993 at the time of SMiRT-12 and then in Iguazuin 1995.
We are happy to have had the opportunity to contribute to this effort.
Antonio GODOY and Aybars GURPINAR

SMiRT-13, POST CONFERENCESEMINAR No. 16 on
"Seismic Evaluation of Existing NuclearFacilities "
CONTENTS
OBJECTIVES OF THE SEMINAR 1
SUMMARY 2
KEYNOTE PAPER: "An International Nuclear Safety Regime" 3Mr. Morris ROSENAssistant Director GeneralInternational Atomic Energy Agency
SESSION I: "EARTHQUAKE EXPERIENCE AND SEISMIC RE-EVALUATION"
(1.1) "Seismic re-evaluation of nuclear facilities worldwide: overview and status" 13Messrs. J. J. JOHNSON, R. D. CAMPBELL, G. S. HARDY, M. K. RAVINDRA and A. J.HOY (EQE International, USA)
(1.2) "On Southern Hyogo Prefecture Earthquake and some related activities in Japan" . . 37Mr. H. SHIBATA (Yokohama University, Japan)
(1.3) " L a t u r e a r t h q u a k e a n d i t s i m p a c t o n t h e a s e i s m i c d e s i g n o f s t r u c t u r e s i n I n d i a " . . . . 5 5Mr. P.C. BASU (Atomic Energy Regulatory Board, India)
SESSION II: "COUNTRY EXPERIENCE IN SEISMIC RE-EVALUATIONPROGRAMME"
(II. 1) "U.S. experience in seismic re-evaluation and verification programs" 77Mr. J. D. STEVENSON (Stevenson and Associates, USA)
(II.2) "A regulatory view of the seismic re-evaluation of existing nuclear power plants in theUnited Kingdom" 95Messrs. J. E. INKESTER and P. M. BRADFORD (HSE, HM Nuclear InstallationsInspectorate,U.K.)

(11.3) "Seismic re-evaluation of French Nuclear Power Plants" 105Mr. R. ANDRIEU (EdF, France)
(11.4) "Nuclear Power Plants - Seismic Review Programme in Spain" I l lMessrs. J. G. SANCHEZ CABANERO and A. JIMENEZ JUAN (Consejo deSeguridad Nuclear, Spain)
SESSION III: "GENERIC WWER STUDIES"
(III. 1) "Seismic safety of nuclear power plants in Eastern Europe" 129Messrs. A. GURPINAR and A. GODOY (Division of Nuclear Installation Safety, IAEA)
(111.2) "Comparison of ex-USSR norms and current international practice in design ofseismicaily resistant nuclear power plants" 155Mr. M. DAVID (Consulting, Engineering, Czech Republic) andMr. B. HAUPTENBUCHNER (Technical University Dresden, Germany)
(111.3) "Seismic PRA, Approach and Results" 167Mr. R. D. CAMPBELL (EQE-International, USA)
SESSION IV: "ANALYTICAL METHODS FOR SEISMIC CAPACITY RE-EVALUATION"
(IV. 1) "Seismic Design of Nuclear Power Plants: Where are we now?" 189Mr. J. M. ROESSET (The University of Texas at Austin, USA)
(IV.2) "Dynamic analysis of WWER type NPPs using different procedures forconsideration of soil-structure interaction affects" 207Messrs. L. HALBRITTER and N. J. KRUTZIK (Siemens-KWU, Germany)
(IV.3) "Dynamic analysis of WWER-1000 Nuclear Power Plants" 225Messrs. A. ASFURA and M. J. JORDANOV (EQE-International, USA)
(IV.4) "In-structure spectra generation for Kozloduy NPP, Bulgaria" 243Mr. M. KOSTOV (CLSMEE, Bulgaria)
(IV.5) "Applications of seismic damage hazard analysis for the qualification of existingnuclear and offshore facilities" 251Messrs. P. BAZZURRO, G.M. MANFREDINI and I. DIAZ MOLINA (D'AppoloniaS.p.a., Italy and Argentina)
11

SESSION V: "EXPERIMENTAL METHODS FOR SEISMIC CAPACITY RE-EVALUATION"
(V.I) "Full scale dynamic structural testing of Paks NPP" 281Messrs. E. M. DA RIN and F. P. MUZZI (ISMES Spa, Italy)
(V.2) "Full scale dynamic tests of Atucha II NPP" 289Messrs. T. KONNO and S. UCHIYAMA (KAJIMA, Japan), L. M. ALVAREZ(ENACE SA, Argentina), A. R. GODOY (IAEA), M.A. CEBALLOS and C. A.PRATO (University of Cordoba, Argentina)
(V.3) "Experimental and numerical determination of the dynamic properties of theReactor Building of Atucha II NPP" 311Messrs. M. A. CEBALLOS, E. J. CAR, T.A. PRATO, C. A. PRATO (University ofCordoba, Argentina), L. M. ALVAREZ (ENACE SA, Argentina), and A.R. GODOY(IAEA)
(V.4) "Shaking table testing of mechanical components" 329Messrs. D. JURUKOVSKI, L. TASKOV, D. MAMUCEVSKI and D. PETROVSKI(Institute of Earthquake Engineering and Engineering Seismology, Republic ofMacedonia)
(V.5) "Experimental and computer analyses of control rods drive systems seismiccapacity" 347Messrs. V. KOSTAREV, V. ABRAMOV, A. BERKOVSKI, P. S. VASILIEV and A.J.SCHUKIN (CKTI-Vibroseism, Russia)
(V.6) "Shaking table testing of electrical equipment in Argentina" 367Messrs. J. S. CARMONA, F. ZABALA, J. SANTALUCIA, C. SISTERNA, M.MAGRINI and L. OLDECOP (Universidad Nacional de San Juan, Argentina)
SESSION VI: "CASE STUDIES"
(VI. 1) "Design and Implementation Experience of Seismic upgrades at Kozloduy and PaksNPPs" 377Messrs. V. G. BOROV, V. TRICHKOV, A. ALEXANDROV and M. JORDANOV(EQE-Bulgaria, Bulgaria)
( V I . 2 ) " S e i s m i c u p g r a d i n g o f W W E R 4 4 0 - 2 3 0 s t r u c t u r e s , U n i t s J4, K o z l o d u y N P P " . . . 3 9 3Messrs. D. STEFANOV, M. KOSTOV, H. BONCHEVA and G. VARZANOV(Academy of Sciences, Bulgaria)
(VI.3) "Seismic upgrading of piping supports in WWER 1000 MWe" 401Mr. M. F. SCHMIDT (Stussi and Partner, Switzerland)
(VI.4) "Methodology and results of the seismic probabilistic safety assessment of KrskoNuclear Power Plant" 407Messrs. M. K. VERMAUT and Ph. MONETTE (Westinghouse Energy Systems Europe,
iii

Belgium) and R.D. CAMPBELL (EQE International, USA)
TIMETABLE 435
LIST OF PARTICIPANTS 439
IV

OBJECTIVES OF THE SEMINAR
Programmes for re-evaluation and upgrading of safety of existing nuclear facilities arepresently under way in a number of countries around the world. An important component ofthese programmes is the re-evaluation of the seismic safety through definition of new seismicparameters at the site and evaluation of seismic capacity of structures, equipment anddistribution systems following updated information and criteria.
The Seminar is intended to provide a forum for the exchange of information anddiscussion of the state-of-the-art on seismic safety of nuclear facilities in operation or underconstruction.
Both analytical and experimental techniques for the evaluation of seismic capacity ofstructures, equipment and distribution systems are discussed.
Full scale and field tests of structures and components using shaking tables, mechanicalexciters, explosive and shock tests, and ambient vibrations are included in the seminarprogramme with emphasis on recent case histories.
Presentations at the Seminar also include analytical techniques for the determination ofdynamic properties of soil-structure systems from experiments as well as calibration ofnumerical models.
Methods and criteria for seismic margin assessment based on experience data obtainedfrom the behaviour of structures and components in real earthquakes are discussed.
Guidelines for defining technical requirements for capacity re-evaluation (i.e. acceptablebehaviour limits), and design and implementation of structure and components upgrades are alsopresented and discussed.
SESSIONS PROGRAMME
Session I: Earthquake experience and seismic re-evaluation
Session II: Country experience in seismic re-evaluation programme
Session III: Generic WWER studies
Session IV: Analytical methods for seismic capacity re-evaluation
Session V: Experimental methods for seismic capacity re-evaluation
Session VI: Case studies
Session VII: Panel discussions.

SUMMARY
A summary in figures of the SMiRT-13 - Post Conference Seminar 16 on "SeismicEvaluation of Existing Facilities" is as follows:
26 papers presented;
a key note lecture by the IAEA Assistance General Director on Nuclear Safety;
52 participants;
from 17 countries:
* Argentina
* Armenia* Bulgaria* Belgium* Czech Republic* Finland* France* Germany* India* Japan* Korea* Macedonia* Russian Federation* Slovenia* Switzerland* UK* USA;
financial support to 9 participants.

XA9952644
Structural Mechanics in Reactor Technology
An International Nuclear Safety Regime
Morn's RosenAssistant Director General
for Nuclear SafetyInternational A tomic Energy Agency
For the many of us closely involved with the safe use of nuclear power, theopening for signature of the Convention on Nuclear Safety and the ongoing workto prepare a Convention on Radioactive Waste Safety are particularly importantmilestones. The Nuclear Safety Convention has been signed by almost 60countries and will likely come into force early next year. It is the first legalinstrument that directly addresses the safety of nuclear power plants worldwide.The Convention on Radioactive Waste Safety is presently in an early stage ofpreparation, but a political will exists for its early adoption and it may possibly beready late next year.
The two safety conventions are only one facet of international collaborationto enhance safety. A review of some cooperative efforts of the past decades andsome key provisions of the new safety conventions, will show how internationalcooperation is increasing nuclear safety worldwide.
International Nuclear Safety Regime
International collaboration has been continuously evident during nuclearpower's evolution. There have been a multitude of bilateral and multilateralcollaborative efforts which you will hear about in the course of this meeting. In theglobal governmental arena, the IAEA has supported this internationalization processthrough a number of initiatives which have led to what is now called aninternational nuclear safety regime. This regime encourages adherence to highstandards of safety through internationally agreed safety recommendations,through binding agreements, through an array of safety services and through awide range of international cooperative and assistance efforts.
At the IAEA, the past twenty years has seen the development of aninternationally recognized set of nuclear power plant safety standards consistingof 5 codes of practice and 55 supporting safety guides covering regulatoryorganizations, siting, design, operations, and quality assurance. These standardswere adopted in its entirety by China as a basis for its growing nuclear poweractivities and other countries have used them in part or as a reference for their ownstandards. There are additional international recommendations such as thosecontained in the Basic Safety Standards for Radiation Protection, and theRegulations for the Safe Transport of Radioactive Material. Important bindinginternational agreements cover the physical protection of nuclear materials ininternational transport, civil liability for damage following nuclear incidents, and
-2-
the early notification and assistance in the event of a serious nuclear accident orradiological emergency. There also exists formalized incident reporting proceduresand an international nuclear event scale for communicating the severity ofoperational events to the public.
A concurrent development at the IAEA of its widely used safety reviewservices has promoted a worldwide exchange of information and experience,particularly in the key operations area. International teams of experts organized bythe Agency have visited and provided advise to all countries with nuclear powerplants. There are peer review services also in siting, design and operations and anew service to promote an adequate safety culture at all organizations involvedwith nuclear power activities. The IAEA efforts have given incentive and supportto the current international nuclear safety regime.
The Convention on Nuclear Safety
Turning to the Nuclear Safety Convention itself, the substantial efforts toprepare the document date back four years. Although, many believed aninternational safety agreement was premature and others considered it unnecessaryor even undesirable, a major consensus supporting such an instrument developedat an international safety conference held at the IAEA headquarters in Vienna inSeptember 1991. After almost three years of intense negotiations and hard workat seven meetings of a Group of legal and technical experts from 53 countries, aDiplomatic Conference was held in June of last year to adopt the Nuclear SafetyConvention.
Structure and Contents
The Convention itself is relatively simple in structure. It consists of anintroductory preamble and four chapters consisting of 35 articles. The first chapterdelineates the principal objectives. The second and most substantive contains thevarious obligations. The third chapter deals with the required periodic meetings toreview national reports on the measures taken to implement each of theobligations, while the last contains the final clauses and other judicial provisionscommon to international agreements.
The fundamental principle of the Convention is that overall "...responsibilityfor safety rests with the State where a nuclear installation is located". Each nationwithin its own legislative and regulatory framework must govern safety. Bilateraland multilateral mechanisms are available to provide assistance and support.
For the purposes of the convention, a nuclear installation is defined as only,
"...any land based civil nuclear power plant...including such storage,handling and treatment facilities for radioactive materials as are on the samesite and are directly related to the operation of the plant. "

-3-
Nevertheless, the preamble supports the broad agreement which now exists for afuture binding convention to deal with the safety of radioactive waste managementalso suggests the future development of instruments for other parts of the nuclearfuel cycle.
The Convention seeks to achieve its objectives through adherence to generalas opposed to detailed binding technical standards. The fundamental safetyprinciples contained in the Convention are based largely on the IAEA document"The Safety of Nuclear Installations" (Safety Series No. 110) which present generalprinciples rather than detailed and prescriptive ones. The more specific detailedrequirements, which are continuously evolving and in a practical sense cannot beplaced into a treaty, would when necessary be dealt with on a plant by plant basisthrough the Convention's review process.
Individual obligations to meet these general objectives are contained in 16articles which are grouped under three headings. The first group covers theessential prerequisite for safety, that is the requirements for Legislation andRegulation. It calls on each country,
• to establish and maintain a legislative framework and anindependent regulatory body, separate from other bodies concernedwith promotion and utilization of nuclear energy, and
• t o govern safety through a system of licensing, inspection, andenforcement.
The second group of obligations concern a number of the more General SafetyConsiderations and contains requirements for each country,
• to ensure an effective safety management system maintainedthroughout the lifetime of the installation.
This is to be realized by steps to assure that all organizations involved with safetygive priority to safety through a number of measures such as,
• to provide adequate financial and human resources, trained staff,quality assurance programmes, safety assessments and verificationactivities, radiation protection of workers and the public, andemergency plans which are tested.
The final group of articles dealing with obligations addresses some specific aspectsof the Safety of Installations. They require appropriate steps,
• t o ensure that technical aspects of siting, design and construction, andoperation are considered and continuously assessed throughout the lifetimeof the installation.
These are to be achieved through a number of measures such as,

-4-
• comprehensive and systematic safety assessments, safety analyses todefine safe operating conditions, commissioning programmes, and thereporting and analyses of safety events.
In the Convention's obligations special attention is given not only to theresponsibilities for emergency planning within a State with nuclear power plants,but also to the responsibilities towards neighboring States. With regard toemergency planning,
"...(countries) must provide competent authorities of the States in thevicinity of their nuclear installations with appropriate information foremergency planning and response. "
There is also a complementary requirement,
"...(that countries) which do not have a nuclear installation on their territory,but are likely to be affected in the event of a radiological emergency in aneighboring State, take the appropriate steps to ensure that emergencyplans have been prepared and tested that cover the activities to be carriedout in the event of an emergency. "
In recognition of the general concerns of neighboring countries, there is alsoa specific obligation calling,
"...(for consultations with countries) in the vicinity of a proposed nuclearinstallation, insofar as they are likely to be affected by that installation and,upon request providing the necessary information ... , in order to enablethem to evaluate and form their own assessment of the likely safety impactof the installation. "
In concluding with the specific obligations spelled out in the Convention,there is one that deals with the current problem of existing reactors, such as thoseof Soviet design, with recognized safety deficiencies. It states,
"When necessary ... the Contracting Party shall ensure that all reasonablypracticable improvements are made as a matter of urgency to upgrade thesafety of the installation. If such upgrading cannot be achieved, plansshould be implemented to shut down the installations as soon as practicallypossible. The timing of the shut-down may take into account the wholeenergy context and possible alternatives as well as the social and economicimpact. "
There is no obligation for a State to shut down a plant immediately as this stepmay not be advisable when considering the overall social and economic impact.But, the Convention's review mechanism will bring the difficult plant intointernational and public discussion. The difficulties of dealing with deficientnuclear power plants is currently demonstrated by the situation in countriesoperating Soviet designed reactors. No country has yet decided to permanently

-5-
close any plant. Improvements are being made through national and internationalefforts.
Implementation and Peer Review Process
Turning now to the most vital issue for the Convention's success. Itssuccess is dependent on compliance with the agreed obligations. Thus, a principlefeature of the Convention is the implementation mechanism which requires eachcountry to demonstrate this compliance through written reports submitted forreview. There is a key requirement that,
"each Contracting Party (is to) submit for review ... a report on themeasures it has taken to implement each of the obligations of theconvention."
These reports will be dealt with through periodic review meetings. The first ofthese meetings would not be later than two and one-half years after theConvention enters into force. Future meeting intervals would not exceed threeyears. Extraordinary meetings could be held if a majority of countries request it.
Within 6 months of entry into force, a preparatory meeting is to be convenedto lay out the structure of the required national reports and the review process.The review process will have to be efficient, involve reasonable costs, and notplace an undue burden on national reporting. Reports cannot be a detailed item byitem review of national programmes, but it nevertheless will have to sufficientlydemonstrate compliance and how this was accomplished. The review process willhave to identify problems, concerns, uncertainties and omissions in nationalreports.
In order to begin an early exchange of opinion so as to be ready for theformal preparatory meeting, the Agency's Secretariat convened an informalmeeting of representatives of signatories in early March of this year. Forty eightcountries took part. The meeting concentrated on the review process and thecontents of national reports. A further meeting is to take place in November.
One review possibility is to create three sub-groups; one for governmentaland organizational matters, a second for siting design and construction, and a thirdfor operations. Another approach would create groups of countries which wouldreview only the reports of those in the group. Each group would consist ofcountries having a diverse number of nuclear power plants ranging from a highnumber to none. Among the advantages of this approach would be a more overalllook at safety, avoiding the difficulty of only examining a limited number of safetyareas. It could also bring increased quality of review through smaller groups. Adisadvantages would be the possible inconsistency of reviews between countrygroups. It would also conflict with the Convention's requirement that all partiescan comment on the national reports of all others.

-6-
There is some support for the right of each country to submit a report in theform and length it deems necessary. Others see the desirability of harmonizingreports to the extent possible, for the purpose of an efficient and effective review.Support exists for a report having an extended summary or introduction to identifymain themes followed by an article-by-article or more topical discussion. Arecently received proposal prepared by Japan and Germany calls for a six partdocument as follows:
A. Introduction providing an overview of national nuclear policy andnuclear programmes.
B. Legislative and regulatory framework covering nuclearinstallations.
C. Financial and human resources, human factors, quality assurance,radiation protection as well as safety principle covering siting designand construction.
D. Operational safety.
E. Planned activities to improve safety.
F. Annexes containing data on the installations, reference such asfor laws and standards, published reports including those ofinternational review missions.
The question of language is still open. One proposal calls for nationalreports to be prepared in the national language or in a single designated language.If it is not submitted in the designated language, a translation of the report wouldbe provided.
The review meeting itself could begin with a short plenary session withgeneral statements followed by work in sub-groups, composed by topic or bygroups of countries. The meeting would likely be limited to two or three weeks.A document addressing the safety issues discussed and the general conclusionsreached would be adopted by consensus and made available to the public.
The IAEA would be the Secretariat for the Convention. It would convene,prepare and service all meetings and transmit information received or prepared inaccordance with the provisions of the Convention. The IAEA could provide otherservices if requested.
Entry into Force
As for the date of entry into force, the Convention states that,
"...(it will) enter into force on the ninetieth day after the date of deposit withthe Depositary of the twenty second instrument of ratification, acceptance
8

-7-
or approval, including the instruments of seventeen States, each having atleast one nuclear installation which has achieved criticality in a reactor core.
When the Convention was opened for signing on 22 September, Canadawhich chaired the meetings of legal and technical experts was first to sign. Thiswas followed by 37 countries including 23 of the 30 countries with nuclear powerplants. At this point there are almost 60 signatures in place and eight countrieshave ratified the Convention, these being the Czech Rep., Japan, Norway, PolandRomania, Slovakia, Spain and Turkey. Five of these have nuclear power plants.The political will which enabled the preparation of the Convention in a relativelyshort time period may also help bring it into force early next year.
Concluding Remarks
The safety philosophy and practices involved with a formal legal frameworkfor the safe use of nuclear power will foster a collective international involvementand commitment. It will be a positive step towards increasing public confidence innuclear power. It will also be a valuable example for other potentially hazardousindustries of our industrial world including those involving other energy sources.
This brief scan of the nuclear safety convention will undoubtedly not havemade you an expert in the subject, but I hope it has given you an opportunity tomore fully appreciate the significance of the document. Further details of theConvention on Nuclear Safety can be found in the Legal Series No. 16 publicationof the IAEA.

CONTENTS OF THE NUCLEAR SAFETY CONVENTION
PREAMBLE
CHAPTER 1 . OBJECTIVES, DEFINITIONS AND SCOPE
ARTICLEARTICLEARTICLE
1.2.3.
OBJECTIVESDEFINITIONSSCOPE OF APPLICA TION
CHAPTER 2. OBLIGATIONS
(a) General Provisions
ARTICLE 4. IMPLEMENTING MEASURESARTICLE 5 REPORTING
ARTICLE 6 EXISTING NUCLEAR INSTALLATIONS
(b) Legislation and Regulation
ARTICLE 7. LEGISLATIVE AND REGULATORY FRAMEWORKARTICLE 8. REGULATORY BODY
ARTICLE 9. RESPONSIBILITY OF THE LICENSE HOLDER
(c) General Safety Considerations
ARTICLE 10. PRIORITY TO SAFETY
ARTICLE 11. FINANCIAL AND HUMAN RESOURCESARTICLE 12. HUMAN FACTORSARTICLE 13. QUALITY ASSURANCEARTICLE 14. ASSESSMENT AND VERIFICATION OF SAFETYARTICLE 15. RADIATION PROTECTIONARTICLE 16. EMERGENCY PREPAREDNESS
(d) Safety of Installations
ARTICLE 17. SITINGARTICLE 18. DESIGN AND CONSTRUCTIONARTICLE 19. OPERATION
CHAPTER 3. MEETINGS OF THE CONTRACTING PARTIES
ARTICLE 20. REVIEW MEETINGSARTICLE 21. TIMETABLEARTICLE 22. PROCEDURAL ARRANGEMENTSARTICLE 23. EXTRAORDINARY MEETINGSARTICLE 24. ATTENDANCEARTICLE 25. SUMMARY REPORTSARTICLE 26. OBSERVERS AT MEETINGS OF CONTRACTING PARTIESARTICLE 27. CONFIDENTIALITYARTICLE 28. SECRETARIAT
CHAPTER 4. FINAL CLAUSES AND OTHER PROVISIONS
ARTICLE 29. RESOL UTION OF A GREEMENTSARTICLE 30. SIGNATURE, RATIFICATION. ACCEPTANCE. APPROVAL. ACCESSIONARTICLE 31. ENTRY INTO FORCEARTICLE 32. AMENDMENTS TO THE CONVENTIONARTICLE 33. DENUNCIATIONARTICLE 34. DEPOSITARYARTICLE 35. AUTHENTIC TEXTS
10

SESSION I
"EARTHQUAKE EXPERIENCE ANDSEISMIC RE-EVALUATION"
NEXT PAGE(S)left BLANK
11
XA9952645III!
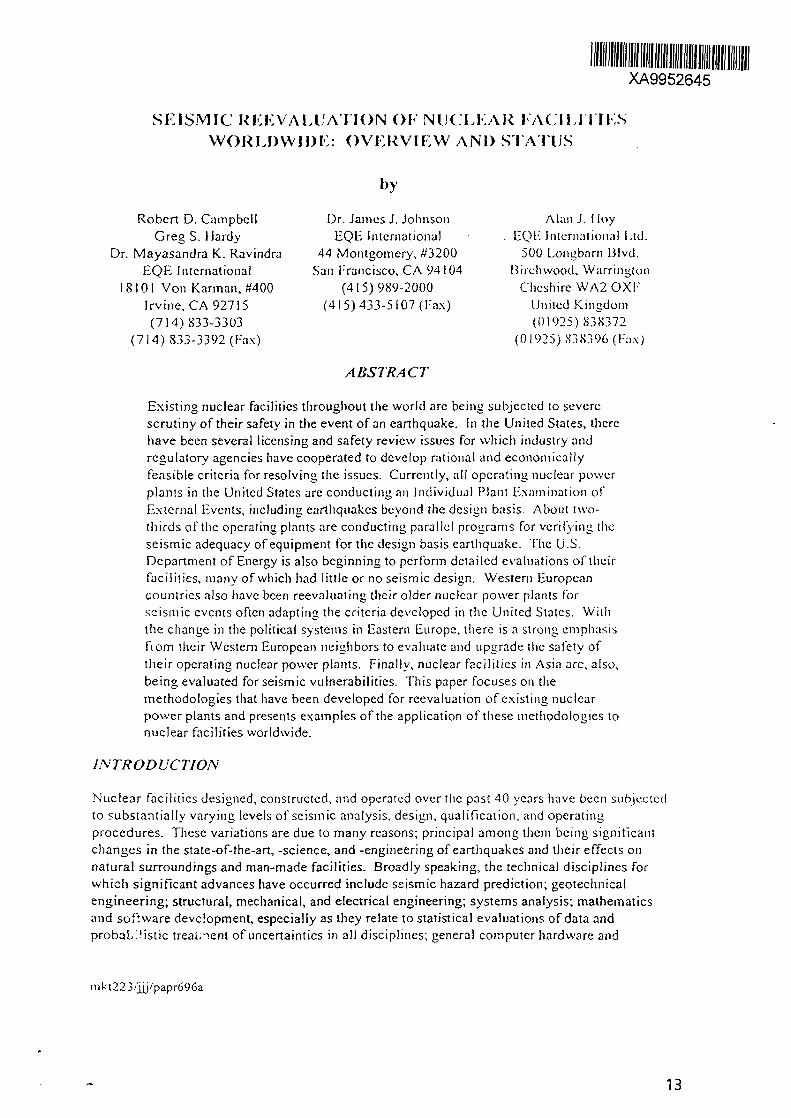
SEISMIC REEVALUA TION Ob NUCLEAR FACILITIESWORLDWIDE: OVERVIEW AND STATUS
by
Robert D. Campbell Dr. James J. Johnson Alan J. HoyGreg S. Hardy EQE International . EQE International Ltd.
Dr. Mayasandra K. Ravindra 44 Montgomery, #3200 500 Longbarn Blvd.EQE International San Francisco, CA 94104 Birehwood, Warrington
18101 Von Kantian, #400 (415)989-2000 Cheshire WA2 OXI"Irvine, CA 92715 (415) 433-5107 (Fax) United Kingdom(714)833-3303 (01925)838372
(714)833-3392(Fax) (01925) 838396(Fax)
ABSTRACT
Existing nuclear facilities throughout the world arc being subjected to severescrutiny of their safety in the event of an earthquake. In the United States, therehave been several licensing and safety review issues for which industry andregulatory agencies have cooperated to develop rational and economicallyfeasible criteria for resolving the issues. Currently, all operating nuclear powerplants in the United States are conducting an Individual Plant Examination ofExternal Events, including earthquakes beyond the design basis. About two-thirds of the operating plants are conducting parallel programs for verifying theseismic adequacy of equipment for the design basis earthquake. The U.S.Department of Energy is also beginning to perform detailed evaluations of theirfacilities, many of which had little or no seismic design. Western Europeancountries also have been reevaluating their older nuclear power plants forseismic events often adapting the criteria developed in the United States. Wilhthe change in the political systems in Eastern Europe, there is a strong emphasisftom their Western European neighbors to evaluate and upgrade the safety oftheir operating nuclear power plants. Finally, nuclear facilities in Asia are, also,being evaluated for seismic vulnerabilities. This paper focuses on themethodologies that have been developed for reevaluation of existing nuclearpower plants and presents examples of the application of these methodologies tonuclear facilities worldwide.
INTRODUCTION
Nuclear facilities designed, constructed, and operated over the past 40 years have been subjectedto substantially varying levels of seismic analysis, design, qualification, and operatingprocedures. These variations are due to many reasons; principal among them being significantchanges in the state-of-the-art, -science, and -engineering of earthquakes and their effects onnatural surroundings and man-made facilities. Broadly speaking, the technical disciplines forwhich significant advances have occurred include seismic hazard prediction; geotechnicalengineering; structural, mechanical, and electrical engineering; systems analysis; mathematicsand software development, especially as they relate to statistical evaluations of data andprobabilistic treatment of uncertainties in all disciplines; general computer hardware and
mkt223/jjj/papr696a
13

sol I \\ .nc. :nui cousin it 111 MI pi act ices. In all ol I hese a leas, obsci v;ilion;il dala. i|iialitat ivc ami(|II;)I)1)I;IIIVL -, has served lo substantially advance the piolcssion s slalc ot knowledge, l! is theseadvances in know ledge liasc along u ilh aging ol llie laeiliU and a l icighlcncd concct n lor saletv(hat have motivated the need tor periodic evaluations ol the stale oi nuclear facilities withrespect lo seismic risk.
Seismic hazard prediction is ihc single most influential factor in mot ivat ing the evaluation ol theseismic performance o f nuclear facilities. It is, likewise, the single most important factor indetermining a facil i ty's seismic design. Although there have been enormous gains in theunderstanding of seismic hazard over the past 40 years, there remains considerable uncertainty inseismic hazard prediction. Advances in all areas of seismic hazard prediction have occurred.Physical measurements ot' fault characteristics and plate movements aid in estimating activitytales, maximum earthquake potential on fnuIt systems, existence of previously unknown faultsystems, etc. Recorded slronu ground motions ol hundreds of earthquakes have expanded thedata base from which ground motion models are created. In fact, recorded ground motions overthe past 25 years have altered the profession's belief as to the maximum accelerations that can beproduced by an earthquake—recordings at and above l.Og clearly demonstrate the broad range otmotions possible dependent on earthquake magnitude, fault characteristics, site conditions,frequency content, etc. The important effect o f site soil conditions has been repeatedlyreinforced over the last few decades—qualitatively, in terms of built faci l i ty performance, andquantitatively, from comparative ground motion measurements. In spite o f these and many otheradvances in the profession's understanding, there remains considerable uncertainty in seismichazard predict ion. This uncertainty and the often accompanying ehaii i i inu perception o f theseismic hazard at specilie sites has been (he prime motivator m the evaluation and recvaluationo f nuclear facilities. In addition, it has forced seismic hazard to be characterizedprobabilistically, as it should, including an explicit treatment o f uncertainty. The uncertaintyassociated with flic seismic hazard, also strongly motivated the development o f the seismicmargin methodology, as described in the ensuing text. Seismic margin methodologies focus ondetermining earthquake ground motion levels at which one has high-confidence-of- low-prob;ibil ity-ol-fai!urcs (! IC1.PF) of the facility. One can then interpret the 11CLPF with respectto current and future estimates of the site seismic hazard for decision-making purposes.
Cieotechnical engineering advances have focused on ground motion transmission, soil materialbehavior, soil failure modes, buried structure and component performance, and foundationperformance. Substantial advances in understanding o f the variation in ground motion inrock/soil media have been made over the last 15 years (Johnson and Asfura, 1992). The increasein knowledge is due principally to extensive recordings of ground motion wi th in the soil and onpartially and fully buried structures. Whereas seismic hazard prediction is characterized byrapidly changing perceptions over the last several decades, the increased understanding ofground motion at the sile has permitted more realistic evaluations o! '.he impact of revised siteseismic hazard on facilities of interest.
Structural, mechanical, and electrical engineering have gained substantial experience andunderstanding of the performance of structures, equipment, components, and commodities whensubjected to strong earthquake ground motion. This experience is derived from laboratorytesting experience and facility performance during earthquakes. Capitalizing on this experiencehas led to the development of design-by-rule guidelines for equipment, components, andcommodities in a majority of typical applications. The ensuing text describes elements of thisevolution.
mkl223/jjj/p:ipr6%a
14

Systems analysis has evolved into an essential element in the design and evaluation of nuclearfacilities. The behavior of primary and support systems necessary for safe operation andshutdown of the facility arc modeled with respect to earthquake risk. Systems analysis extendsbeyond the facility boundaries when considering accident mitigation systems behavior for thesurrounding communities. Systems analysis has evolved into the decision tool for prioritizingthe various elements of the facility for evaluation.
The evolution of computer hardware and software has permitted one to examine individual andcombined phenomenon in increasing detail. In all cases, when used properly, results from theseevaluations enhance the decision-making process.
Given this background, three situations have arisen over the last 15 years which are addressed bymethods described herein.
(i) Seismic design basis has been established during the licensing process andremains in tact. Questions concerning the ability of structures, equipment,components, and/or commodities to meet the design basis have been postulatedand verification of seismic adequacy is required. For commercial nuclear powerplants within the United States, several unresolved safety issues (USI), are inthis category. Approaches to the resolution of these USIs are discussed in theensuing text.
(ii) Beyond design basis seismic events are considered as part of the IndependentPlant Examination of External Events (IPEEE) for U.S. commercial nuclearpower plants. Of the multiple purposes of the 1PE program, evaluation of plantrisk to beyond design basis events is principal. The several methods appropriatefor seismic IPEEE are discussed here.
(iii) Revised or newly implemented seismic design criteria. For facilities notoriginally designed for seismic events or for which the design ground motion haschanged substantially, requirements have often been instituted for verification ofthe seismic adequacy of these plants. Hybrid methods, combinations of seismicdesign, margin, and verification programs, have been effectively used to addressfacility concerns in this category. U.S. Department of Energy (DOE) facilitiesand many Eastern European nuclear power plants are in this category.
SEISMIC EVAL UA TIONMETHODOLOGIES IN THE UNITED STA TES
The evaluation of seismic vulnerabilities in earlier operating plants in the U.S. began in the late1970s during the Systematic Evaluation Program (SEP). Initial activities were conducted by aSenior Review Pane! funded by the USNRC, and consisted of the analytical evaluation ofselected structures, walkdowns and sample calculations for equipment. Subsequent activities bythe utilities and their contractors were in response to the findings of the USNRC consultants andfocused on piping analysis and evaluation of selected structures and equipment. Operability ofequipment was not verified during the SEP program. Unfortunately, these utility programs didnot always focus on priority issues, often..because of non risk based perceptions of governingvulnerabilities and excess conservatism contained in regulatory requirements at that time.
mkt223/jxj/papr696a
15

In general, the Sl-.P program allowed lor more liberal acceptance criteria tor MiucturcN byallowing the response to go beyond the elastic limit. Newmark and I lall (I 979) developedcriteria lor evaluation ot structures and equipment which included the use of inelastic responsespectra. For structural systems which undergo inelastic deformation, the effective dynamicresponse could be defined by a linear elastic rc^nonsc analysis using a reduced responsespectrum to define the input motion. The reduction in spectral acceleration was based upon theallowable inelastic deformation (ductility) and the frequency of the structural system and wasbased upon exhaustive analytical studies of structures subjected to real earthquake records andon observed behavior of structures during strong motion earthquakes.
The evaluation of structures in many cases utilized the inelastic spectra concept but this was notcarried over to piping systems. Piping evaluations were very conservatively conducted usingclassic linear clastic response spectrum analysis, low damping and conservatively defined inputmotion. Subsequently, some of these conservatisms have been reduced in efforts to developmore rational criteria for resolution of other seismic issues and for new design.' b 1
There were a number of unresolved seismic safety issues in the U.S. during the 1980s and early1990s. Many of these issues were consolidated into two major programs. The first of theseprograms is the demonstration of the operability of safety related equipment during and after thedesign basis earthquake. This activity is limited in scope to only address those issues which havenot previously been resolved for the design basis earthquake. The second major issue is theevaluation of the plant response to seismic events beyond the design basis.
The first issue is Unresolved Safety Issue (USI) A-46, dealing with operability of safe shutdownequipment in 72 of the earlier U.S. NPPs. The scope, however, was expanded to include longterm decay heat removal equipment (USI A-45), selected seismic design basis issues (US! A-40)and seismic spatial systems interactions (USI A-17). Some additional passive items have alsobeen included (cable raceways, tanks and heat exchangers. Structures and piping are notincluded in this program since they have been addressed in other programs. The second issue isthe Individual Plant Examination of External Events (IPEEE). In this program, all structures,piping and equipment essential for safe shutdown must be evaluated for seismic events greaterthan the design basis. This program also included seismic spatial systems interactions, scismic-fire and seismic-flood interactions, and to some extent Generic Issue (Gl)-57 which includes theconsequences of inadvertent activation of fire suppression systems during a seismic event.
The U.S. Department of Energy has numerous test and production reactors and process facilitieslocated on government reservations which have not been subject to the U.S. nuclear regulatoryprocess for power reactors. DOE Order 5840.28 (DOE, 1992) requires that these facilities bereevaluated for natural phenomena hazards and brought up to safety standards commensuratewith the public risk involved.
Resolution for USI A-46
A Generic Implementation Procedure (GIP), (SQUG, 1991), has been prepared over a severalyear period to provide criteria and methods to resolve most of the outstanding seismic issuesrelated to the design basis earthquake. The GIP is based heavily upon the use of earthquake andtesting experience in lieu of analysis and testing of components. A large database of earthquakeand testing experience has been reviewed by a Senior Seismic Review and Advisory Panel(SSRAP, 1991), and the USNRC and rules have been formulated to demonstrate survivability
mki223/jjj/papr6%a
16
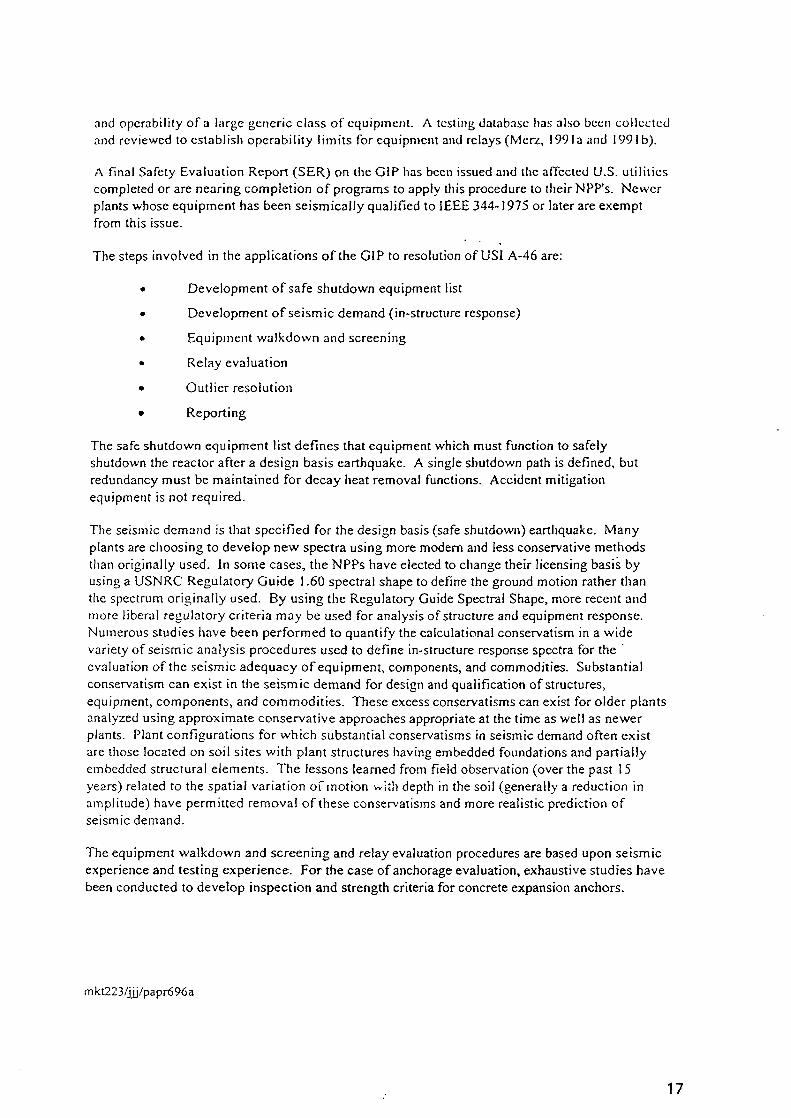
and opcrability of a large generic class of equipment. A testing database lias also been collectedand reviewed to establish operability limits for equipment and relays (Mcrz, 1991a and 1991 b).
A final Safety Evaluation Report (SER) on the GIP has been issued and the affected U.S. utilitiescompleted or are nearing completion of programs to apply this procedure to their NPP's. Newerplants whose equipment has been seismically qualified to IEEE 344-1975 or later are exemptfrom this issue.
The steps involved in the applications of the GIP to resolution of USI A-46 are:
• Development of safe shutdown equipment list
• Development of seismic demand (in-structure response)
• Equipment walkdown and screening
• Relay evaluation
• Outlier resolution
• Reporting
The safe shutdown equipment list defines that equipment which must function to safelyshutdown the reactor after a design basis earthquake. A single shutdown path is defined, butredundancy must be maintained for decay heat removal functions. Accident mitigationequipment is not required.
The seismic demand is that specified for the design basis (safe shutdown) earthquake. Manyplants are choosing to develop new spectra using more modern and less conservative methodsthan originally used. In some cases, the NPPs have elected to change their licensing basis byusing a USNRC Regulatory Guide 1.60 spectral shape to define the ground motion rather thanthe spectrum originally used. By using the Regulatory Guide Spectral Shape, more recent andmore liberal regulatory criteria may be used for analysis of structure and equipment response.Numerous studies have been performed to quantify the calculational conservatism in a widevariety of seismic analysis procedures used to define in-structure response spectra for theevaluation of the seismic adequacy of equipment, components, and commodities. Substantialconservatism can exist in the seismic demand for design and qualification of structures,equipment, components, and commodities. These excess conservatisms can exist for older plantsanalyzed using approximate conservative approaches appropriate at the time as well as newerplants. Plant configurations for which substantial conservatisms in seismic demand often existare those located on soil sites with plant structures having embedded foundations and partiallyembedded structural elements. The lessons learned from field observation (over the past 15years) related to the spatial variation of motion with depth in the soil (generally a reduction inamplitude) have permitted removal of these conservatisms and more realistic prediction ofseismic demand.
The equipment walkdown and screening and relay evaluation procedures are based upon seismicexperience and testing experience. For the case of anchorage evaluation, exhaustive studies havebeen conducted to develop inspection and strength criteria for concrete expansion anchors.
mkt223/jjj/papr696a
17

I <_>L I . \ ; > c i K - I I C C D;il ; i B a s e
SI re HI g-mot IDII earthquakes frequently occur in high seismic areas, such as Caliloi ma and LatinAmerican countries, where power planl.s or industrial tacilitics arc included in the affected areas.By studying the performance of these earthquake-affected (or data base) facilities, a largeinventory ol various types of equipment installations can be compiled that have experiencedsubstantial seismic motion.
The primary purposes of the seismic experience data base are summarized as follows:
• To determine the most common sources of seismic damage, or adverse effects,on equipment installations typical of industrial facilities
• To determine the thresholds ol seismic motion correspondinu to various types olseismic damage
• To determine the performance of equipment during earthquakes, regardless otthe levels of seismic motion
• To determine minimum standards in equipment construction and installation,based on past experience, to assure their ability to withstand anticipated seismicloads
To summarize, the primary assumption in compiling an experience data base is that the actualseismic hazard to industrial installations is best demonstrated by the performance of similarinstallations in past earthquakes.
FACILITIES SURVEYED IN COMPILING THE DATA BASE
The seismic experience data base is founded on studies of over 100 facilities located in thestrong motion areas of more than 60 earthquakes that have occurred worldwide since 1971
The data base was compiled through surveys of the following types of" facilities:
• Fossil-fueled power plants
• Hydroelectric power plants
• Electrical distribution substations
• Oil processing and refining facilities
• Water treatment and pumping stations
• Natural gas processing and pumping stations
• Manufacturing facilities
• Large commercial facilities (focusing on their} 1 VAC plants).
In general, data collection efforts focused on facilities located in the areas of strongest groundmotion for each earthquake investigated. Facilities were sought that contained substantialinventories of mechanical or electrical equipment, or control and instrumentation systems.Because of the number of earthquake-affected areas and types of facilities investigated, there is awide diversity in the types of installations included in the data base. For the types of equipment
mki223/hj/papr6%a
18
of focus, this includes a wide diversity in age, si/.e, configuration, application, operatingconditions, manufacturer, type of building, location within building, local soil conditions, qualityof maintenance, and quality of construction.
The data base includes more than 60 earthquakes, usually with several different sites investigatedin each earthquake-affected area. The earthquakes investigated range ii, Richter magnitude from5.7 to 8.1. Measured or estimated ground accelerations for data base sites range from 0.1 Og to0.85g. The bracketed duration of strong motion (on the order of 0. lOg or greater) ranges from 5seconds to over 40 seconds. Local soil conditions range from shallow soil over rock to deepalluvium to rock. The buildings housing the equipment of interest have a wide range in size, andtype of construction. As a result, the data base covers a wide diversity of seismic input toequipment, in terms of seismic motion amplitude, duration, and frequency content.
TYPE OF DATA COLLECTED
Information on each data base facility, its performance during the earthquake, and any damage oradverse effects caused by the earthquake were collected through the following sources:
• Interviews with the facility management and operating personnel usually providethe most reliable and detailed information on earthquake effects. At mostfacilities several individuals were consulted to confirm or enhance details. Inmost cases interviews are recorded on audio tape.
• Facility operating logs are a written record of the conditions of the operatingsystems before and after the earthquake. Operating logs list problems in systemoperation associated with the earthquake and usually tabulate earthquakedamage to the facility. Operating logs are useful in determining the amount oftime the facility may have been out of operation following the earthquake andany problems encountered in restarting the facility.
• The facility management often produces a report summarizing the effects of theearthquake following detailed inspections. These reports normally describecauses of any system malfunctions or damage, and typically include anyincipient or long term effects of the earthquake.
• If the facility can be surveyed immediately following the earthquake, as has beenthe case in many earthquakes included in the data base, earthquake damage canoften be inspected prior to repairs.
Standard procedures used in surveying data base faciiities focus on collecting all information ondamage or adverse effects of any kind caused by the earthquake. For a large majority of thefacilities surveyed in the data base, this is not a lengthy task. Except for sites that experiencedvery high seismic motion, seismic damage to well-engineered facilities is normally limited toonly a few items.
mk!223/jjj/papr696a
19

liarilu|iiake experience data procedures have been developed lor luenly classes ol equipment:
1. Motor Control Centers M. Low-voltage Swiiehgears
2. Medium-voltage Switchgcars 12. Transformers
1. Horizontal Pumps 13. Vertical Pumps
4. Fluid-operated Valves 14. Motor-operated and Solenoid-operated Valves
5. Fans 15. Air Handlers
6. Chillers 16. Air Compressors
7. Motor Generators 17. Distribution Panels
8. Batterv on Racks 18. Battery Chargers and Inverters
9. Engine Generators 19. Instruments on Racks
10. Temperature Sensors 20. Instrument and Control Panels and Cabinets
Beyond the twenty classes are others which were added to aid in the evaluations: cable trays,conduit, and raceway systems; tanks and heat exchangers.
IPEEE
Criteria for IPEEE have likewise been developed in parallel to the G1P but are applicable toseismic levels beyond the plant design basis. The USNRC has recently issued the GenericLetter, (USNRC, 1991a), and NUREG 1407 (USNRC, 1991b) for IPEEE. There are threemethodologies which may be used.
• Seismic Probabilistic Safety Assessment (USNRC, 1983)
• NRC Seismic Margins Method, (Budnit/. 1985 and Prassinos. 1986)
EPR1 Seismic Margins Method (EPR1, 1988)
For all of the methods, the goal is to determine the seismic shaking level at which there is a high-confidence-of-low-probability-of-failure (HCLPF). This HCLPF is mathematically defined as95% confidence of less than 5% probability of failure.
Seismic PSA
In the PSA method, fragility curves for essential equipment, piping and structures are defined asa conditional probability of failure versus a seismic input parameter (either peak groundacceleration or spectral acceleration within a defined frequency range). A seismic hazard isdefined as a frequency of occurrence versus seismic input parameters (peak ground accelerationor spectral acceleration). The plant systems are modeled as event trees and fault trees fromwhich Boolean equations are derived. Using the Boolean equations, the seismic hazard and thecomponent fragility curves, the frequencies of core damage and release from containment can bederived. Figure 1 shows the seismic PSA process from the modeling and input parameters upthrough the analysis of the consequences of an accident. As a by product of the risk modeling,the plant level HCLPF can be computed from the Boolean equations and the fragility curves.
mki223/jjj/papr696a
20

I Ins computation delines llic dominant accident sequences lhat lead (o core damage and releaseand the IICI.PF for each.
It a PSA is elected to satisfy the J 1*11111-1, ii is only required that core damage frequency (Level 1PSA) plus an evaluation of containment performance be performed. The computation of releasefrequency (Level 2 PSA) is not required but many utilities have elected to go to this extent. It ;.,further stipulated that only a point estimate of core damage frequency is required. This involvesthe use of a mean seismic hazard prediction and a single mean fragility curve (Figure 2). Theuse of the full uncertainty spread of the seismic hazard and fragility curves was not required but.many utilities have elected to carry out this uncertainty analysis.
NRC Seismic Margins Method
The NRC seismic margins method was developed by USNRC contractors and is a truncation ofPSA. The plant systems are modeled and seismic fragility curves are developed, just as in aPSA, and the plant level UCI.iM-' is computed. However, only the most important safetyfunctions are considered. The frequency of core melt and release are not determined. Inapplying the NRC margins method, seismic capacity screening is conducted to eliminate manycomponents from fragility computations. This capacity screening is based primarily on results ofpast seismic PSAs and on the successful performance of certain classes of equipment in paststrong motion earthquakes.
The NRC seismic margins method involves the following steps (Prassinos, 1986):
• Selection of the Review Level Earthquake
• Development of Systenis Models
• Initial Component Ruggcdness Screening
Plant Walkdown
• Development o! Component and Structural/Fragilities
• System Analysis
• Determination of Plant Level 11CLPF
The procedure is virtually identical to the PSA procedure except that the systems analysis stepdoes not involve the use of a seismic hazard for computation for core damage frequency. Thesystems models and fragility curves are used to determine the dominant accident sequences andthe plant level 1ICLPF.
F-PRi Seismic Margins Method
A deterministic seismic margins method was developed by Electric Power Research Institutecontractors and is very similar to the methodology contained in the GIP for resolution of USI A-46. This similarity was deliberate to minimize the required activity to resolve both USI A-46and IPEEE. In this method, safe shutdown paths are defined and components and structures inthe safe shutdown paths arc dctcrministically evaluated to calculate component HCLPFs. Theweakest component in a shutdown path then defines the plant level HCLPF for that path.
inkt223/|ij/p;ipr696a
21
1 he steps in the lil'RI seismic margins evaluation methodolouv are:
• Selection of the Review Level Earthquake
• Selection of the Assessment Team
• Preparatory Work Prior to the Walkdown
• Success Path Selection
• Seismic Capability Walkdown and Screening
• Seismic Evaluation of Unscreened Components
• Documentations
In this case, the success path selection must include a primary success path and an alternatesuccess path utilizing to the greatest extent possible, different equipment. One of the paths mustalso have the capability to mitigate a small pipe break. The process is virtually identical to theA-46 process except that the alternate success path and the small break mitigation are additionalrequirements. Also, since the review level earthquake is specified to be beyond the design basis,all structures and equipment including piping, that are important to the success paths must beincluded.
Selection of Method
One of the above three methods was applied to all U.S. operating plants. The choice of methodwas determined by the review level earthquake specified for the plant, the utility desire tocombine USI A-46 and IPEEE resolutions and the utility preference for methodology.
The plants have been placed into three review level earthquake (RLE) bins. Most plants are tobe evaluated for a 0.3g RLE and have elected to do an EPRI seismic margin methodologyevaluation, although some have elected to do PSA and a few are opting for the NRC marginsmethodology with the goal of expanding the margins evaluation to a PSA at some future date.There are a few plants which are placed in the 0.5g RLE level and most have elected seismicPSA for their IPEEE. Two California NPPs have RLEs exceeding 0.5g and arc required toconduct a PSA.
Even though the steps to perform tiie evaluation are summarized somewhat differently in thegoverning documents, all of the methods require similar procedures as does the resolution of USlA-46. The NRC has emphasized the integration of the A-46 and IPEEE programs for plantswhich must do both. Figure 3 compares the A-46 resolution process to the EPRI seismicmargins process. Figure 4 compares the A-46 resolution process to the seismic PSA process.The NRC seismic margins process follows the steps in Figure 4 to the point of seismic riskquantification. At that point the margins process involves the computation of the plant levelHCLPF using the systems models and fragility curves. As can be seen, the actual steps andscope of work are very similar.
Numerous seismic PSAs have been conducted in the U.S. prior to the IPEEE requirement. ThesePSAs will require enhancements, principally the performance of a detailed walkdown, theaddition of equipment associated with containment performance and the use of more recentestimates of seismic hazard.
mkt223/jij/papr696a
22

Pilot studies that have been conducted using the margins methodologies include: the NKCmethod for Maine Yankee, (Ravindra, 1987), the HPRI margins melliod lor Catawba, (Campbell,1989), and a combined IIPR1 margins and A-46 methodology for Plant 1 latch, (SouthernCompany Services, 1991).
Department of Energy Criteria
The U.S. Department of Energy has developed criteria for evaluation of DOE reactors andprocess facilities for natural phenomena hazards (UCRL, 1990). The criteria are structured withrespect to the performance goals and risk inherent in the process. There are four categories offacilities. The performance goal for each category is based upon a frequency of occurrence ofthe event and the probability of failure, given the event. The most critical of the facilities has aseismic hazard defined for a very low frequency of occurrence, similar to that for defining thesafe shutdown earthquake (SSE) for power reactors. The use categories and performance goalsare shown in Table 1.
There is ongoing effort to update and expand the DOE criteria. In particular, the DOE hasundertaken a program to develop a complete evaluation criteria parallel to the GenericImplementation Procedure for resolution of USI A-46. This procedure will be principally basedupon earthquake and testing experience with supplemental analysts for anchorage and strength ofsupports. Several DOE laboratories are currently in the process of evaluating their majorstructures and equipment. Some test and production reactors have completed PSAs.
APPLICA TIONS OUTSIDE OF THE UNITED STA TES
Some past and ongoing projects outside of the U.S. have utilized the methods described above asfull or partial resolution of seismic issues. Several PSAs which include external events havebeen performed for plants in Switzerland, Taiwan, Korea and Japan.
None of these PSAs have been conducted specifically to address seismic issues; external eventshave been a logical extension of the PSAs initiated to study internal event vulnerabilities. Someselected applications of the above described methodologies have been applied in Switzerland,Finland, Sweden, Belgium and Bulgaria. Finland and Sweden have low seismic hazard and as aresult, the emphasis on seismic events is somewhat limited. At the Tihange plant in Belgium andthe Beznau plant in Switzerland, the seismic design basis is similar to that of an eastern U.S. site.At the Kozloduy site in Bulgaria, the seismicity has been recently redefined and results in groundmotion input levels about two times the previously predicted level. Several earthquakes haveaffected the site. The largest earthquake was in 1977 resulting in approximately a 0. Ig peakground acceleration at the site which caused some structural damage. The currently specifiedearthquake for seismic reevaluation is 0.2g.
United Kingdom
The United Kingdom region is a region of low to moderate seismicity and the instances ofdamaging earthquakes are rare. In common with the worldwide trend of increasing safetystandards, seismic design of new nuclear facilities is now the practice. For older power stations,major studies to evaluate the seismic capability have been initiated in support of the periodicsafety reviews or continued operation safety cases. In the United Kingdom, nuclear powerstations are licensed by the Nuclear Installations Inspectorate (Nil). The licensing regime is
mkt223/iij/p?pr696a
23

i i o n - p r e s c r i p t i vc ruu i the o n u s is on I l ie opei a lor o i I l ie p lant to pi eseui the sa fe t y case \\ h i ch
mee ts the l i c e n s i n g c o i u l i l ions. I he a p p r o a c h lo the, se i sm ic e v a l u a t i o n of n u c l e a r p o w e r s t a t i o n s
not designed lor seismic loads has evolved lor more than a decade. The approach currentlyadopted, and beniii implemented lor the A(iR power stations and some of the older Maimoxpower stations, is outlined below, typically, the desnjn ol each power station is relativelyindividual and this had inhibited the adoption of uencne approaches. The seismic hazard at thesite is determined by a site-specific study to determine the peak ground acceleration with aprobability ofexecedance of 10 per year. The site ground motion is characterized by means ofa uniform risk spectra. This probability of exceedance represents an infrequent initiating event.The objective of the seismic evaluation is to demonstrate the capability of a safe shutdown andpost-trip coolinu path against the 10 ~ seismic event. I he buildings, plant, and equipmentassociated with, path are termed the Bottom Line Plant.
In order to demonstrate delense m depth a second, diverse path is assessed against a frequentinitiating event which is a 0.1 n seismic event characterized by the UK ground motion spectralshapes derived in the early I9S0S. The building plant and equipment associated with this pathare termed the Second Line Plant. The 0. Ig event corresponds approximately to a 10'"' event andis a convenient benchmark to compare between different plants. It also represents the minimumearthquake level recommended by the IAEA.
Safctv related buildums are sub|ected to dynamic analysis, taking account of soil-structureinteraction where site conditions dictate. These analyses arc used to determine member loadsand calculate in-sirueuue response spectra for subsequent plant and equipment evaluation.Major safety-related plan! items are subjected to structural analysis. For the assessment ofmechanical ami electrical equipment in the Bottom Line and Second Line systems, seismicwaikdowns are performed. The methods adopted are heavily based on the GIP, with some minormodifications lo suit UK conditions and practice. All the elements of the seismic evaluation arcdrawn together in a seismic safety report which forms part of the Periodic Safety Review whichis submitted to the NIL
Sweden
The older nuclear power plants in Sweden were not specifically designed to withstandearthquakes since Sweden has a relatively low seismicity. In the last several years, a number ofstudies have been conducted lo assess (he seismic hazard at the Swedish nuclear power plantsites and estimate the seismic margins of older plants.
The first study was to estimate the seismic margin of the mitigation systems at OskarshamnUnits I and 2. The mitigation concept developed by OKG to address the unlikely event of asevere accident at Oskarshamn consists of the filter vented containment and an independentcontainment spray system. These systems are designed lo meet seismic standards currently usedin Sweden. Some of the components of these systems interface with the existing systems inOskarshamn Units I and 2 which were not designed to current seismic criteria. A pilot study(Landelius, et a!., 1989) was performed lo assess the seismic margins of these interfacingsystems and to verify that they would perform successfully in a major earthquake.
The Swedish nuclear industry and the regulatory agency funded an investigation - PROJECTSEISMIC SAFETY - to develop a characterization of seismic ground motions for probabilisticanalyses of nuclear facilities in Sweden. The study (Engclbrcklson, 1989) has prodticed uniform
nikl223/jii/papi696a
24

hazard ground inolion spectra for hard rock and soft soil silcs al annual frequencies ol
exccedance of 10"^, 10'" an<l 10" . Currently, llie titiiilies are stud} ing ways of using theseground motion spectra in seismic evaluation of existing plants. A pilot study was conducted toevaluate the probabilistic response and capacity of ihe reactor/containment building atOskarshamn 2 and Barsebcck 1 and 2 (Asfura ci al., 1991). The objective was to demonstratethat probabilistic response analysis would lead to more realistic response prediction which couldbe used in seismic evaluation of existing plants. Application of seismic margin methodsdeveloped in the U.S. is currently ongoing at Oskarshamn 2 and similar projects at Oskarshamn1, and Forsmarks 1 and 2 are expected to start in iatc 1996. .
Finland
Imalran Voima Oy has performed a probabilistic safely assessment of l.oviisa Nuclear PowerPlant. This PSA is explicitly treated the seismic events. Loviisa plant was not designed lor anyspecific seismic criteria. Therefore, the seismic fragility evaluation had to rely on seismicwalkdowns and use of earthquake experience data in the development of seismic capacities ofstructures and equipment. An initial scoping study (Ravindra, Hardy and Hashimoto. 1989)identified certain components as needing further fragility evaluation. Imatran Voima Oyperformed the seismic hazard assessment and the probabilistic response analysis to developrealistic floor spectra (Varpasuo and Puttonen, 1991). Using these spectra and based on the plantinformation and walkdown findings, the seismic fragilities have been developed for selectedcomponents (Ravindra, ct al., 1991). The results of the seismic risk analysis show a very low (4X 10" /yr.) frequency of seismic induced core damage (Varpasuo, 1993). This low core damagefrequency resulted from the very low seismic hazard prediction (—0.05g PGA at 10"7yr.).
Teollisuuden Voima. Inc. (TVO) is performing a seismic probabilistic safety assessment of theBWR plant at Olkiluoto—two units of 710 M\V each. The objective is to verify seismicadequacy of the plants. This project was initiated in 1996 and is ongoing. The seismic PSAprocedure follows those developed in the United States.
Switzerland
Seismic PSAs have been conducted for Bcznau, Gosgcn and Muelburg in Switzerland. TheBeznau PSA was the first in Switzerland and was used to specify design requirements for adedicated safe shutdown facility which has been added to each of the two PWRs. AH newequipment in the safe shutdown facilities has been seismically qualified by currently specifiedU.S. standards (ASME, IEEE, etc.). The piping and equipment in the containment and the steamand fecdwater piping outside of containment ahead of their respective isolation valves wererequired to be rcqualificd. In this rcqualificatiou program a variety of methods were utilized(Sahgal, 1990). Large bore piping has been evaluated to current ASME standards using dynamicanalysis. Small bore piping has been evaluated using chart type screening methods based onASME code stress allowables, selected dynamic analyses with increased allowables and lo someextent, using seismic experience based criteria. All equipment (valves, heat exchangers, tanks,piping penetrations) and systems interaction issues have been resolved using deterministicseismic margins methods which rely heavily on seismic experience based screening and selectedcalculations. This program has worked weli to apply practical, yet technically justifiablemethods for seismic requalification of existing piping and components. In this program, theappiicabiiity of the seismic experience based screening criteria to European equipment had to be
mkt223/nj/papr696;i
25

d e m o n s t r a t e d . O n l y m i n o r m o d i f i c a t i o n s h a v e b e e n r e q u i r e d l o ( . l e i I U n i s i r . i l c i h e a b i l i t y o f
e x i s t i n g e q u i p m e n t t o w i t h s t a n d i h e s a f e s h u t d o w n e a r t h q u a k e .
Belgium
Die Belgian Utility, EJectrabcl, is a member ,>1 the Seismic Qualification Utility Group and hasapplied the G1P to the Tihange 1, 2 and 3 nuclear power plants. The Belgian work began beforethe finalization of the GIF. As reported in Lafaiile, 1990, the issues to be resolved with theBelgian authorities could mostly be addressed by use of the GIF methodology with some minorcharmes in procedures and some additional study for equipment that could not be demonstratedto be represented by the earthquake experience database which forms the basis for G1P screeningrules. This program appears to have been successful and was the first application of the GIP inEurope.
Bulgaria
Ko/loduy units 1-4 are Soviet designed VVER 440 model 230 I'WKs. In an initial IAEAmission, (Monette, et. al., 1991), a short walkdown was conducted and HCLPFs were calculatedfor the most seismically vulnerable components identified in the walkdown. The HCLPFcalculations were based upon the fragility method. The principal reason for selecting thefragility method was the ability lo treat uncertainties regarding incomplete information as to theseismic input, structural response and equipment construction. The deterministic methodrequires that these parameters be defined in accordance with stated rules.
Subsequent to this initial IAEA study, two follow on programs were simultaneously initialed.IAEA defined terms of reference for a VVANC) sponsored program to design priority seismicupgrades for Kozloduy I and 2. The scope of work for the terms of reference was developedbased upon the prior IAEA mission and risk priorities derived from results of a top level riskassessment of Kozloduy 1-4 (BEQE, 1992). The program was defined in four phases and thefirst two phases have been completed. They included the evaluation and upgrade design forequipment anchorage, the diesel generator building, and the service water pump house. Inaddition, the main building, which consists of the reactor confinement, the auxiliary building andturbine hall, have been analyzed and in-structurc spectra have been developed. Phases 3 and 4would include further evaluation and design of upgrades for the main building, evaluation andupgrade of the primary circuit, and a walkdown and experience based evaluation of piping andcable raceways. These phases have not yet begun.
A very similar program funded directly by the plant was carried out for Kozloduy units 3 and 4by local Bulgarian engineers with assistance from their U.S. counterparts. To date, mostequipment anchorage and many masonry wall upgrades have been completed. Structuralupgrades have not been initiated lo date. Upgrading of the unit 3 and 4 pumphouse is plannedfor the near future. The upgrade program must be compatible with outages and electricitydemand, thus the design of structural upgrades must minimize outage lime.
Slovakia
There are four WWER 440s at Bohinicc, two models 230s and two model 213s. The plants werenot originally designed to resist earthquakes, however, more recent seismic hazard assessmentsreveal (hat the hazard could be similar to that in Bulgaria. Major structural backfits have been
mki223/i.ij/p;ipr696a
26
conducted by ('/.celt and Slovak ciiiiineers. A Western huropenn contractor lt;is been sclcclc<l lodo safely upgrade design ol'ihe older model 230s. The seismic portit>u of this work will ulili/eU.S. developed experienced-based methodology tor evaluation of existing equipment. Thecontractor plans on joining SQUG to have access to all of the U.S. technology and seismicexperience data base for use in such projects.
Hungary
There are four WWER 440 model 213s at Paks in Hungary. Several ongoing programs areaddressing different aspects of the seismic issues. A unified criteria has evolved for applicationsat Paks which was merging of criteria being used by several contractors for structural evaluationsand easy fixes of equipment and masonry walls. The criteria are a combination of ihc SQUGGIF, Seismic Margins Methodology and DOE standard for structures. The easy fix project foranchorage of equipment and stabilization of masonry walls have been completed. The phase 1evaluation of piping and mechanical equipment is completed but actual backfit is notcommencing pending further refinement in the site seismicity.
The main building complex at PAKS consists of the reactor building and turbine hallinterconnected by gallery buildings with each building on a separate foundation mat. Thestructures are a combination of reinforced concrete and structural steel frames with concreteinfill panels. These structures were not designed for earthquakes, hence are potentiallyvulnerable to current estimates of the seismic hazard. Seismic evaluations of the existingstructures are being conducted based on current seismic hazard estimates and upgrades are beingdeveloped for identified deficiencies. The criteria being considered for the design of upgrades isthat defined in DOT, Standard 1020-94 with suitable restrictions placed on the ductility ofexisting precast structures.
Slovenia
The KRSKO NPP in Slovenia is a Weslinghousc PWR and was designed for a 0.3g peak groundacceleration. The site is quite seismically active and close in, high acceleration, low energy,earthquakes frequently occur. These close in low energy earthquakes are, however, notdamaging to engineered structures and equipment. Recent seismic hazard studies show that a 50percentile, 10,000-ycar return period earthquake producing low frequency damaging virbratorymotion is about 0.4g, which exceeds the design basis. This is a similar situation to that in manyU.S. plants where beyond design basis earthquakes must be addressed in IPEEE. The utility haselected to conduct IPE and IPEEE for the plant using the U.S. methodology. This work is beingcarried out by Western European and U.S. contractors.
A consortium of Spanish utilities have been long standing SQUG members and are beginningnow to implement their A-46 program.
In an NPP in Taiwan, seismic experience was utilized to resolve seismic qualification issues. Inthis case though, the plant was a turn key plant that utilized almost all US manufacturedequipment, thus there was little issue regarding the applicability of seismic experience.
mkl223/jjj/papr696a
27

In ;i Japanese PSA, where specific qualification data were not available, the database was used ina few instances to develop fragilities. In cases where there was a lot of data, especially at highacceleration sites, a technique known as survival analysis was used 'o develop probability offailure of specific classes of equipment at increasing acceleration levels. In conducting thisstudy, it was determined in a walkdown that the Japanese manufactured equipment was at leastas rugged as database equipment. Since Japan is a country that experiences frequent severeearthquakes, most products manufactured have good seismic resistance by way of properanchorage and attention to load path.
Eartiiquake experience has been used on a limited basis to qualify a new diese! generator to beinstalled in a WER. This was acceptable to the authorities on the basis that similar projects hadbeen conducted in the US for the qualification of Diesel Generator Systems.
Conclusions
Well defined criteria for evaluation of outstanding seismic issues in the U.S. have beendeveloped and are rapidly being applied to existing power reactors, test reactors and nuclearfacilities. Some limited applications of these methodologies have been made for Europeanplants. In Europe, there is a wide diversification of regulating authority and seismic hazard atplant sites so it is unlikely that U.S. requirements for IPEEE US1 A-46 and DOE will be appliedacross-the-board for all plants in all countries. There is merit in selecting practical aspects ofthese methodologies and methods for application to specific issues. Some limited applicationshave been presented to demonstrate the applicability.
Screening criteria associated with these methods must be used with caution. Some equipment inEuropean reactors is not adequately represented in the experience database to confidently applythe U.S. screening criteria. While most equipment is genericaily rugged, there are some uniqueconstructions that have been observed for which the screening criteria are cieariy not applicablewithout additional justification. In a SQUG training course held in Brussels, a trial plantwalkdown was conducted on a Belgian fossil power plant. In this brief training walkdown.several instances were found where the intent of the screening criteria was not satisfied. Inparticular, the 6.3 kv switchgear contained ceramic parts. The GIP criteria limit voltage to 4.1kv due to the fact that ceramics are often used in higher voltage switchgear. 6.3 kv is common inthe Eastern European plants and a similar design with ceramic parts has been observed inRussian supplied switchgear.
The seismic evaluation procedures as characterized by the GIP and earthquake experience data,in general, are becoming standardized by the IEEE and the ASME for electrical and mechanicalequipment, respectively. It is anticipated that such procedures will become industry standardsworldwide.
mkt223/Ijjj/papr696;i
28

Table ]PERFORMANCE GOALS FOR EACH USAGE CATEGORY
Usage Category
Genera! Use
Important or Low Hazard
Moderate Hazard
High Hazard
Performance GoalDescription
Maintain occupant safety
Occupant safety, continuedoperation with minimalinterruption
Occupant safety, continuedfunction, hazard confinement
Occupant safety, continuedfunction, very high confidenceof hazard confinement
Performance Goal AnnualProbability of Excccdancc
10"3 of the onset of majorstructural damage to the extentthat occupants are endangered
5x!0 of facility damage tothe extent that the facilitycannot perform its function
10~4 of facility damage to theextent that the facility cannotperform its function
10"-* of facility damage to theextent that the facility cannotperform its functionconfinement
mkt223/jjj/papr696a
29

Figure !: Risk Assessment Methodology for Seismic Events
3
I
1
06
0
A
• u
• 087s
-0.2S
-0.35
95%
Confidence
f
/
/
1
ax
' 0.7S
^ —
yConfkhKK*
^ ) i
^ ~
Mean
I
PEAK GROUND ACCELERATION (g)
2: Cotnponant FragMy Curves
Figure 2: Component Fragility Curves
mkt223/jjj/papr696a IS
30

Relay ChatterEvaluation
perGIP
YFcx A46 SSEL.
Follow GlP
and Coded Info
Resoive Outbers
Report
on A46 Review
Perform a
Plant Wai
A-46
T..Develop
Safe Shutdown
Equipment
. Y _ . .Devetop
Median Ffoor
Spectra lor SSE
R«v>ew Ptant
Safely Systems
a/KJ MoCify fP£
Event 4 FauM Tree*
i
-< *Perform Prooaoihsbc
Response Analyses
O«v«top
Compooems Ust
Modify Components
as Needed
Coolainment Systems
Oevefop Median
Flow Spectra
for RLE
For Other Components
Follow EPRf
.... . . .Y .Develop HCLPFS
Components.
Sodiqudtacb
Study
jerRi
Teai
A46 Review
Completed
Seis/TK
IP€EEComp4«r*o
r
EsUmattf Planl
Seisrmc Margtn
. . . . . . . Y . ...Prepare 1P6EE
Report
!
fnputto UUtty
Management 1
Figure 3: Seismic IPEEE Integrated Seismic Margin Assessment and A-46 Evaluation
mkt223/yj/papr696a
31

A-48
T
Sale Shutdown
IT
Develop
Spear? fw SS£
R r w w Pl»nt
Safety Sf5(«*ns
' £W«*T| & F«ul Trees!
j
Pertwm Probab«ic(»c
, espooie Aj**fyss
Comptxvemj. Let
Contawnent
Flow Spectra and
Sin^aursi Rezponse
Seyood Des^n Base
So-
>quel»cno
Sttxly
. . . . T .PCK A<6 SSEl.
FooowCiP
and Cotfed IntoPlant Wafcdown
l_
_.. iPtcpafe Repon
on A46
n Ou(
Compootots From
Total PRA Ltst
YDevf too £ecs.(n<
Fi»QM>t1, of
j - Fwl Tree*. I
lop Sequence I
qualKKtt I
O«vetop Sequence
Equ;
NRC Margin
I PSA
Quantificauon
Seanicl>U(g«i 1
1
1KlSfQtta Report 1
1i . _.
V£££ L
1T
PRAOutpmi
1
I
T If1
tnpu( to UUMy
1
Figure 4: Seismic IPEEE Integrated Seismic PSA and A-46 Evaluation
mkt223/jjj/papr696a
32

UKFKRKNCKS
1. Asfura, A.P., ct. al., 1991, "Pilot Study of Reactor/Containment Building: Oskarshamn 2and Barscbcck I and 2, Probabilistic Response and Capacity", Report prepared forSvdkraft and OKC Akticbolag by UQU Engineering, Inc. and Westinghouse EnergySystems International.
2. BEQE, 1992, "Top Level Risk Study For Kozloduy Units 1 to 4," Prepared for theCommittee on the Use of Atomic Energy for Peaceful Purposes by BEQE Ltd., April.
3. Budnitz, R.J., et. al., 1985, "An Approach to the Quantification of Seismic Margins inNuclear Power Plants," Lawrence Livermore National Laboratory. NUREG/CR-4334.
4. Campbell, R.D. et. al., 1991, "Seismic Fragility Methodology for Evaluation of LiquidMetal Reactors." Structural Mechanics in Reactor Technology, Paper Ml 1(11)/1.
5. Campbell, R.D., et. al., 1989, "Seismic Margin Assessment of the Catawba NuclearStation," EPRI NP-6359.
6. Electric Power Research Institute (EPRI), 1988, "A Methodology for Assessment ofNuclear Power Plant Seismic Margin," NP-6041.
7. Engelbrektson, A., 1989, "Characterization of Seismic Ground Motions for ProbabilisticSafety Analyses of Nuclear Facilities in Sweden," Vol. Kl, pp. 37-42, Transactions ofthe 10th International SMiRT Conference.
8. Lafaille, J.P., et. al., 1990, "Experience of Seismic Walkdowns of Belgian Plants,Proceedings of Third Symposium on Current Issues Related to Nuclear Power PlantStructures, Equipment and Piping," North Carolina State University, December.
9. Landclius, M., M.K. Ravindra, G.S. Hardy, P.S. Hashimoto, 1989, "Seismic MarginAssessment of Mitigation Systems in Oskarshamn,'' presented at the I Oth InternationalConference on Structural Mechanics in Reactor Technology, Anaheim, California.
10. Merz, K.L., 1991a, "Generic Seismic Ruggedness of Power Plant Equipment", Preparedby ANCO Engineers for the Electric Power Research Institute, EPRI NP-5223.
1 1. Merz, K.L., 1991b, "Seismic Ruggedness of Relays", EPRI NP-7147, Prepared byANCO Engineers for the Electric Power Research Institute.
12. Monette, P., R. Baltus, P. Yanev, R. Campbell, 1991, "Seismic Assessment of KozloduyVVER 440, Model 230 Nuclear Power Plant," Structural Mechanics in ReactorTechnology, Paper SD 006/5.
13. Newmark, N.M. and WJ. Hall, 1978, "Development of Criteria for Seismic Review ofSelected Nuclear Power Plants," NUREG/CR-0098, May.
14. Prassinos, P.G., M.K. Ravindra and J.D. Savay, 1986, "Recommendations to the NuclearRegulatory Commission on Trial Guidelines for Seismic Margin Reviews of NuclearPower Plants," Lawrence Livcrmore National Laboratory, NUREG/CR-4482.
inkl223/jjj/papr696a

I 5. Ravindra, M.K., cl. al.. )987, "Seismic Margin Review of the Main Yankee AtomicPower Station." NUREG/CR-4426, Vol. 3, Prepared by EQE Inc. for LawrenceLivcrmore National Laboratory.
16. Ravindra, M.K., et. al., 1991, "Seismic Fragilities of Selected Components in LoviisaNuclear Power Piant", Prepared for Imatran Voima Oy by EQE Engineering, Inc. andWestinghouse Energy Systems International.
! 7. Ravindra, M.K., G.S. Hardy and P.S. Hashimoto, 1989, "Scoping Study on SeismicFragilities for Seismic Risk Analysis of Loviisa Nuclear Power Plant", report preparedfor Iinatran Voima Oy by EQE Engineering, Inc. December 1989.
1 8. Sahgal, S., M. Culot, R. Campbell, P. Monette, 1990, "Application of Experience BasedMethodology to the Seismic Qualification of Beznau Nuclear Power Plant," ThirdSymposium on Current Issues Related to Nuclear Power Plant Structures, Equipmentand Piping," North Carolina State University.
19. Seismic Qualification Utility Group (SQUG) 1991, "Generic Implementation Procedure(G!P) for Seismic Verification of Nuclear Plant Equipment", Rev. 2.
20. Senior Seismic Review and Advisory Panel (SSRAP), 1991, "Use of Seismic Experienceand Test Data to Show Ruggedness of Equipment in Nuclear Power Plants", Rev. 4.
21. Southern Company Services, 1991, "Seismic Margin Assessment of the Edwin I. HatchNuclear Plant, Unit I," EPR1 NP-7217, Prepared by Southern Company Services forElectric Power Research Institute.
22. U.S. Department of Energy, December 1992, DOE Order 5480.28 Natural PhenomenonHazards Mitigation.
23. U.S. Nuclear Regulatory Commission, 1983, "PRA Procedures Guide," NUREG/CR-2300.
24. UCRL, 1990, "Design and Evaluation Guideline for Department of Energy FacilitiesSubjected to Natural Phenomena Hazards," UCRL-15910, University of California,Lawrence Livermore Laboratory.
25. USNRC, 1991 (a). Generic Letter 88-20, Supplement 4, "Individual Plant Examinationfor External Events (IPEEE) for Sever Accident Vulnerabilities - 10 CFR 50.54(0-
26. USNRC, 1991(b), "Procedural and Submitta! Guidance for the Individual PlantExamination of External Events (IPEEE) for Severe Accident Vulnerabilities," NUREG- 1407.
27. Varpasuo, P. and J. Puttonen (1991), "Development of Probabilistic Floor Spectra forLoviisa Nuclear Power Plant," 11th International Conference on Structural Mechanics inReactor Technology, Tokyo, Japan;
mkt223/jjj/papr696a
34

28. Varpasuo, P., J. I'uUoncn and M.K. Kavindra, "Seismic Probabilistic Safety Analysis ofLoviisaNPP, Unit I," Proceeding of Structural Mechanics in Reactor Technology, 12,Paper MKO5/3, August 1993.
29. Asfura, A.P. and Johnson, "Soil-structure Interaction (SSI): Observations, Data,and Correlative Analysis," In Proceedings of the NATO Advanced Study Instituteon Developments in Dynamic Soil-structure Interaction, Kemei, Antalya, Turkey,July 1992. ' ' '
inkt223/jju/papr696a
NEXT PAGE{S)left BLANK

XA9952646
SMiRTl3IAEA-WSAugust 1995Iguasu, Argentin
On Southern Hyogo-prefecture Earthquakeand Some Related Activities in Japan
Heki SHIBATA, Professor-Dr.
Mechanical Eng'g. and Materials Sci.Faculty of Engineering
Yokohama National University156 Tokiwadai, Hodogaya,Yokohama 240, JAPAN
Fax 81/45-331-6593
Abstract
This paper consists of three parts. At first the reporter discusses on the earthquake eventon January 17, 1995, and then on the summary of the report of examining the adequecy of theguideline of seismic design of nuclear power plants in Japan by the task group, Nuclear SafetyCommission. And also on the activity of "the sub-committee on the research of seismic safety"for the future research subjects during 1996 ~ 2000 F.Y.
Part 1 On the Southern Hyogo-prefecture Earthquake
1.1 Introduction
The event occured at 5:46 am on January 17, 1995 was one of the most seriousearthquake disasters since the Kwanto earthquake in 1923 in Japan. In the Kwantoearthquake, approximately 140,000 were killed in Tokyo and Yokohama area. Most ofcasualties were caused by the extended fires in Cities of Tokyo and Yokohama. The directdeaths are estimated as 10,000. In the earthquake disaster of this time, officially called as"Hanshin-Awaji Great Earthquake Disaster", approximately 5,500 were killed, and thosewere directly caused by structural failure mostly. One of the serious natural disasters,which caused such a big number of deaths is "Isewan Typhoon and High-tide" in 1959.
37

As seismic events, this earthquake is one of the greatest ones, may be once or twice everycentury through Japan.
In this area, we experienced several destructive seismic events since 8 Q. but theymight be not so serious ones according to historical records including 16 9 o n e : which isfamous. Some one estimated its return period might be more than 5,000 years (in Fig.8).The characteristics of its ground motion was very unique, that is, very high velocity aswell as high acceleration and short duration (Table 1). This caused many casualties andserious, very uneque structural failures.
The feature of the ground motion, damage of various kind of structures, and otherunique events will be described in the following chapters, which were presented at SMiRT13 in Porto Alegre last August.
Of course, this area is one of the most densely populated and highly industrializedareas. The western part of Kei-han-shin area, which is the second busiest area in Japan, iscentered by City of Kobe. This is the reason why this event is called as Kobe earthquake.Officialy. Southern Hyogo-prefecture earthquake 1995 and the disaster itself is called asHanshin-Awaji Great Earthquake Disaster.
1.2 Purpose of Field Survey
What are the purposes of the survey on seismic damages? How do we learn thelessons from the seismic event. Usually we start immeadately after the event from sur-veying what are happening and how they are. For this, video is a very powerful toolnow. The author started its recording a half hour later of the event when he recognizedthat the event had been very large scale event, and had been continuing for six hours.
The major items and purposes are as follows :
1) How are there any phenomenon or failure mode which has been never observed:'
In this case, they will be reported as examples in the field.
2) How adequate the models, which have been used for the design, are proven or verified
through their behaviors observed?
3) How the statistics of structures and other systems are, for example, damage ratio of
underground pipeline etc.?
4) How to recover structures and systems from their damaged state in a short range,
hours and day, and in long a range, month and year?
5) How did or does the event give the impact to individuals and the society?
1.3 Facts on the Event
Magnitude : M = 7.2
Focal Depth : H = 14 km
38

Time and Date : 05:46 , 1/17/1995 , JST
Casualties : 5,500 deaths + 35,000 injures
Damaged Buildings & Houses : App. 160,000
. Estimated Total Loss : $ 100 Billion
Those numbers on damages are still moving
1.4 Fault, Ground Motion and Intensity
The slips of related fault have been studied by seismologists, and various kind of new-facts have been being found. One of the features is high velocity ground motion.
Japanese Meteological Intensity Seale exceeded VI in this event. This lias been thefirst event since it was denned after Fukui earthquake in 1948.
The definition of Intensity VII is as follows :
/ = VII > 400 gal and
Damage rate of buildings > 30 %
There were several issues, for example, how to defined the damage rate and so onthis time, but JMA decided that in the area of the center of Kobe City the intensity wasVII.
Following issues on their feature of ground motions which were made immeadiatlyafter the event, now some of them are clear, for example :
How strong the effective PGA?
Is the recorded maximum ground velocity reliable?
Which faults did cause main shocks?
The short duration of ground motion, is very unique as Japanese eartuquake. Andinitial several peaks were significant to cause structural damages as shown in Fig.l. andTable 1. Main shock consits of three shocks, and the waves were focused into the easternpart of the City Fig.2. Distribution of peak ground accelerations is shown in Fig.3.And their attenation curves are shown in Figs.4 and 5.
Through the activities of the seismologists after the event, we feel the vecessity of theestablishment of the engineering seismology for estimatimation of local ground motions,that is, micro-zoning.
1.5 Damage State of Various Kind of Structures
i) Structures
Highway Bridge : collapsing and sliding
Building ;
High-rise Building : less damage
39

Reinforced Conventional Building : large damages, three modes ;
lower level collapse, one particular level collapse, and PS effect failure
Steel Building : large damages, especially degraded one and brittle
failure
Wooden house : collapsing (and burnt)
Piles ; failure by shear force mainly
Pier and Embankment : side slip and subsidence
Tower : less resonance-type failure in the area
Tank : liquefaction effect, and sloshing in outside of Kobe area
Comuter : overturn and cable failure
Lifelines : various mode
ii) Mechanism
Single shock failure
Resonance failure
P-<5 effect
Liquefaction
Brittle Failure
Mechanism of brittle failure has not been known well. However, the understandingon the phenomenon is diverged at each field as shown in Table 2.
1.6 Time-history and Damage
The time history, that is, the partterns of ground motion of this event are very unique,and it has been proved by seismologists that there are exact reasons to induce such groundmotions. The features of this event are quite different from other destructive earthquakeswhich have been recorded in Japan since 1880's instrumentally.
The most serious destructive earthquakes, which were recorded in the past, are inter-plate type huge earthquakes and their epi-centers were in the ocean and their epicenterdistances are usually more than 100 km. Durations of such earthquakes were over oneminute in general. They induced resonance type failure to structures and this S-phasewas followed by the surface wave period.
Main points are as follows :
i) Very short duration from initiation of ground motion to main peaks ;
approximately 2 sec as shown in Fig.l and Table 1.
ii) Similar wave form of acceleration to displacement :
40
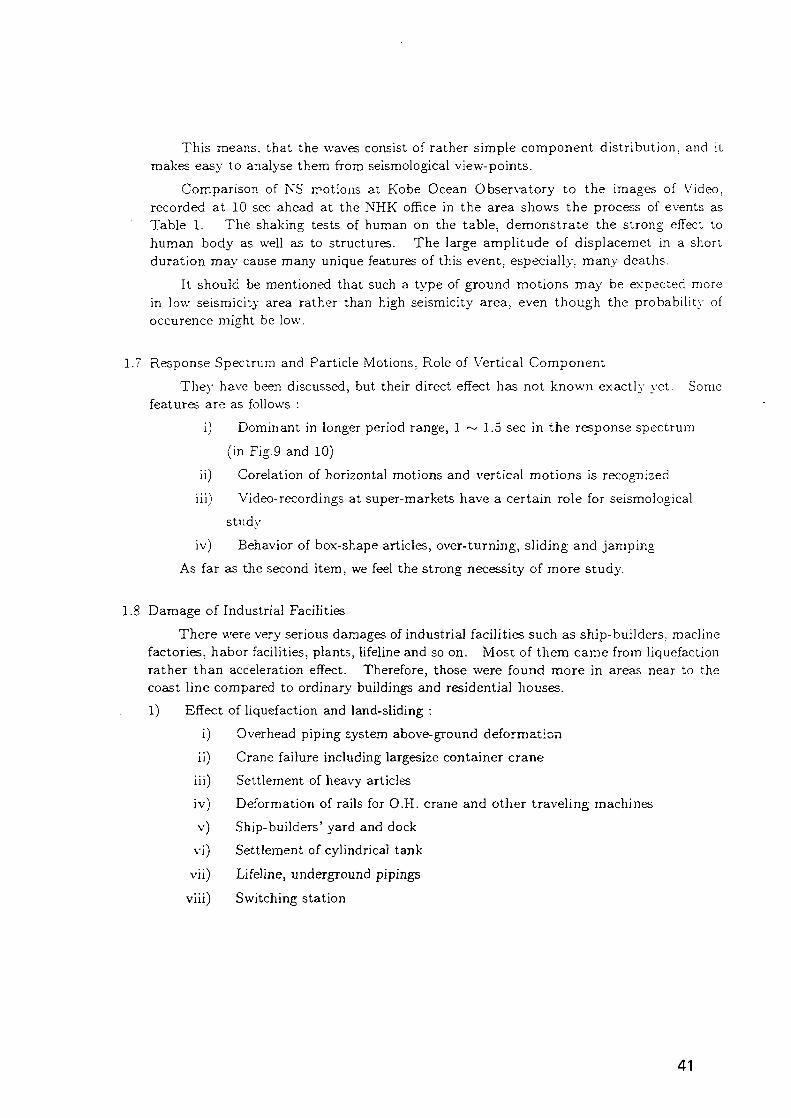
This means, that the waves consist of rather simple component distribution, and itmakes easy to analyse them from seismological view-points.
Comparison of NS motions at Kobe Ocean Observatory to the images of Video,recorded at 10 sec ahead at the NHK office in the area shows the process of events asTable 1. The shaking tests of human on the table, demonstrate the strong effect tohuman body as well as to structures. The large amplitude of displacemet in a shortduration may cause many unique features of this event, especially, many deaths.
It should be mentioned that such a type of ground motions may be expected morein low seismicity area rather than high seismicity area, even though the probability ofoccurence might be low.
1.7 Response Spectrum and Particle Motions. Role of Vertical Component
They have been discussed, but their direct effect has not known exactly yet. Somefeatures are as follows :
i) Dominant in longer period range, 1 ~ 1.5 sec in the response spectrum
(in Fig.9 and 10)
ii) Corelation of horizontal motions and vertical motions is recognized
iii) Video-recordings at super-markets have a certain role for seismological
study
iv) Behavior of box-shape articles, over-turning, sliding and jamping
As far as the second item, we feel the strong necessity of more study.
1.8 Damage of Industrial Facilities
There were very serious damages of industrial facilities such as ship-builders, maclinefactories, habor facilities, plants, lifeline and so on. Most of them came from liquefactionrather than acceleration effect. Therefore, those were found more in areas near to thecoast line compared to ordinary buildings and residential houses.
1) Effect of liquefaction and land-sliding :
i) Overhead piping system above-ground deformation
ii) Crane failure including largesize container crane
iii) Settlement of heavy articles
iv) Deformation of rails for O.H. crane and other traveling machines
v) Ship-builders' yard and dock
vi) Settlement of cylindrical tank
vii) Lifeline, underground pipings
viii) Switching station
41

2) Accerelation effect
i) Railway train derailing
ii) Power plant, boiler and pipings
iii) Switching station and transmission line
iv) Towers-type crane
v) Tower for micro-wave transmission and other purpose
1.9 Damage Modes. Newly Observed
The following modes were observed. Some of them, especially items ii) and v) arenot known on their exact reasons.
i) Land-slide in flat ground and coastal area
ii) Brittle failure of steel column
iii) One-direction shear failure of R.C. column
iv) New-type cracking of brittle material
v) Mid-story collapsing of building — propagation wave model
vi) Partial failure of structure, and electric equipment and distribution system
caused by other failed structural member or element
vii) Overturning of buildings by P-£ effect, especially R.C. buildings
viii) In some places vertical acceleration are higher than horizontal one, and both
are corelated
ix) Low acceleration near to surface fault and very high acceleration in regions
where slighty for from the fault where surface fault is not found.
Those items shall be studied intensively, and also their damage survey systems mustbe developed.
1.10 Standardization of Design Basis Earthquake
Central Commission for Disaster Prevention, Chairman : Prim-minister, issued "thenew fundamental principle for disaster prevention" on July 18, 1995 based on the factswhich we experienced. In this article, two levels of counter-measures, including DesignBasis Earthquake are stated.
1) For any events which are expected to occure several times through its life,
it must be remaining as functional without significant damage.
2) For any rare event, human lives must be kept without serious damage.
This comes from the original principle of our nuclear power plant design. Thereare approximately 40 seismic codes in Japan. These codes must be modified and unified
42

according to their fundamental concept and philosophy. Following items will be reviewednext two years.
i) Factor of Importance
ii) Concept of Zoning
iii) Final Protection for the Safety
iv) Standard Design Response Spectrum
v) Vertical Ground Motion for the Design
vi) Longer-period-range Ground Motion
vii) Duration of Ground Motion
viii) Measure for Rare Catastophic Event and its Level
ix) Active / Capable Fault Protective Practice
x) Liquefaction Protection
xi) Land-slide Protection in Flat Area near Coastal Line
xii) Land-slide Protection for Large Scale Slope
xiii) Allowable Damage and Loss in Various Cases
xiv) Insurance and Financial Back up by Official Organization
xv) Mitigation of Social Impact
1.11 Liquefaction and Sliding
Most of damages of industrial facilities were induced by liquefacion and sliding ofembankment and pier. Soil, mixed with gravel and silt, caused liquefaction phenomenonby very high response of soil layer, and sliding ground toward the sea. The phenomenonof liquefaction was said to occure with only uniform granular sand.
1.12 Conclusion and Recommendation
1) This event, Kobe earthquake, is a really rare event.
2) There are very unique and unexpected features in the view points of seismological
studies.
3) It is very difficult to predict its features.
4) Safety design must be done in consideration with two levels of events as described
in the previous chapter.
5) The level of the severer event must be settled based on the knowledge on rare events.
However, it is very difficult to develop it only by engineers, and they must ask the
positive assistance of scientists.
43

6) The design for safety systems under seismic conditions is very significant, and it
must be carefully examined in the sens^ of system dynamics.
7) P-6 effect of steel frame and ductile R.C. buildings were observed, and they are
some different from ordinary ones.
8) The cooperation between seismologists and engineers including safety engineers must
be encolleged.
a) Continuous efforts to improve models for design must be done
based on facts which we obser%'ed.
Part 2 The-State-of-the-Arts of Seismic Design of Nuclear Power Plants in Japan.
2.1 Introduction
After the event, the Nuclear Safety Commission organized a task group, chaired byProfessor Kojima. This TG consisted of nine specialists including the reporter. Theyexamined the following points to clarify that the Guideline for (examining) the SeismicDesign of Nuclear Power Plants in 1981 NSC, which has been used for the regulatorypurpose, is adequate:
i) If a nuclear power plant is constructed according to the Guideline in Kobe
Area, the design would be reasonable?
ii) How S2 ground motions would be strong?
iii) How the response spectrum of S2 would be conservative?
Nine meetings and one field survey were made.
2.2 Design Basis Earthquakes in Japan
Two levels of "Design Basis Earthquakes" have been employed in Japan since almostbeginnings, 1960's. In the Guideline, Si and S2 are defined as follow : Si, the strongestearthquakes, and S2, the limit earthquakes. The second one may be interpreted as theupper-bound earthquake.
Si earthquake may be the historical maximum earthquake in the site region. Thehistorical records on destructive earthquakes have been kept since 5C, and those since9 ~ 10$ can be listed in the seismic catalogue. The number of them from 416 to1882, non-instrumental era listed is 267 and from 1884 to 1993, instrumental era, is 163.Some compensations to decide Si earthquake are made based on seismological knowledge,because, their return periods in some regions may be more than 1000 years, for which wecan find historical written recods. And the periodical change of frequency of occurencemight be observed in some area.
44

So earthquake is the upper-bound earthquake, whose magnitude M can be estimatedin region by region as shown in Fig.6. According to the practice in Japan, the annualprobability of occurence of a certain earthquake doesn't follow the stochastic relation inthe stronger level, and there is the limitation as explained in Fig.7, and this value canbe estimated by the seismotechtonic structure of the region (in Fig.6). However, level ofintensity may be more diverged.
2.3 Comparison of Design Basis Earthquakes to the Kobe Earthquake
According to the requirement of the Guideline. S2 should be as follows :
M = 7 |
A = 7 km
If we assume that a nuclear power plant in the area M95 = 7.2 and A95 = 16 kmbased on Japan Meteorogical Agency. Those values, officially reported, are formalizedas the definition as to concentrate to one focus. The survey result by the seismologistthe situation is more complicated. The focal distance Rg^ can be defined not so clearly.The above value was decided under consideration of such a situation, and the value basedon original definition, it might be more than 50 km. A is the epicenter distance, andthe focal distance is the distance to the focus of the event. However, the definition of afocus is the point which the initial slip of a fault movement had started.
In the case of this event, its depth H is estimated as 14 km. S2 earthquake in theGuideline is defined in two ways : the maximum earthquake which might occure at thepoint estimated by seismological survey on active fault distribution, and that ; M = 6.5underneath of the site, that is A = 7 km, H = 7 km. In this case, the former definctionis applicable.
2.4 Response Spectrum of the Event
Even though there are many records of strong seismograph in the area, those of rocksite are limited. The site of a nuclear power plant in Japan must be rock site. Therefore,the records observed in the tunnel at the campus of Kobe University were only met tothis requirement.
These the design basis spectra, which are called as Ohsaki spectra based on approxi-mately 40 ground motion records in rock site observed in the world wide, are the standardspectrum which is recommended in the siipplimental explanation of the Guideline. Ac-cording to the response spectrum, in the lower frequency region, the response spectraof them are dominated compare to the design basis response spectra wliich are used forthe design (in Figs 9 and 10). The comparison of this standard spectra to the responsespectra of ground motions in the area was made, and the standard spectra are moreconservative than the spectra of the event at the Kobe University except in the lower fre-quency region than 06 sec. Eigen-periods of significant structures, piping systems and
45
equipment are generally shorter than this value. This means that the standard spectrafor the design are adequate in the view point of the margin.
2.5 Vertical Ground Motion
It seems to be that many evidences of domination of vertical ground motions ofthis event. One of the reason comes from nonlinear characteristics of soil layer fortransmission of S-wave, and linear for that of P-wave. The ratio of peak value of verticalground acceleration to that of horizontal one was less than a half, 1/2, in general. Also,that of peak velocity and spectral intensity are the same situation. This means that theratio used for the design is also adequate.
Even though, we could find many facts of behaviors showing the vertical groundmotion were dominated as mentioned above, and it might be induced by their corelation.Study on the corelation of both vertical and horizontal motions shall be necessary.
2.6 Remarks
The analyses of key structures and items in a typical power plant based on the spectrahad been made as a reference, and we could not find any critical issue.
The report on the new basic proposal prepared by the Central Commission of DisasterPrevention pointed out that all kind of structures, not only nuclear facilities, must bedesigned in two levels, such as the concept of Sj and $2- The draft of the sped?!committee, the Science Council of Japan recommended that the equalization of the conceptof seismic codes, whose number is approximately 40 kinds in Japan, must be made. In1981, only the concept of zoning had been established except for nuclear power plants,however, now there are opinions that the activity of local active or capable fault must beconsidered in the codes of others.
Also the continuous effort to improve the seismo-techtonic map like Omote map isnecessary.
Part 3. Future Researches on Seismic Design of Nuclear Power Plants in Japan
As a part of the safety study program, the subjects and programs of seismic safety studiesby various organizations will be reviewed every five years. For this, a sub-committee wasorganized under the chairmanship of Shibata, the reporter, and this belongs to the Committeeon Nuclear Safety Research, NSC. In this year, next five year projects, 1996 ~ 2000 F.Y. havebeen reviewed. This job was started in October 1994, therefore, on the way of process theSouthern Hyogo-prefecture earthquake occured. As a result, the sub-committee completedtheir Teport under the condition that the report will be reexamined in next one year, becausethere might be various topics arising based on facts which were observed in the event.
Some of them are as follows :
46

i) How is the distribution of the maximum velocity of ground motions surroundingthe fault line?
ii) How is the map of the upperbound magnitude through Japan?iii) How is the peak ground acceration of vertical motions affected by local
movement of the fault?iv) How is the structural response of buildings, piping systems and equipment to
such vertical ground motions, and how is related to the horizontal motions?v) How is the brittle failure of ordinary steel using for piping support and others7
Those subjects would be discussed in future meetings with other subjects newly arisingaccording to the impression of the reporter. And they will be discussed in other fields also.And more over, it might be necessary how the level of the serious but rare event shall be assumefor the safety study.
Acknoledgement
The manuscript for the Proceedings of Post Conference Seminar 16 of SMiRT 13 whichwas held on August 21 and 22 at Iguazu Argentina was required to he conpleted by the end ofNovember. Therefore, the author trys to rewrite it with new informations and his considerationbased on his paper distributed at the CSNI meeting, OECD which was held on November 29and 30, 1995 in Paris. And also this material was distributed at the IAEA-INS Workshop inTaejon, Korea, on December 6 and 7, 1995.
The author greatly appreciate the advices of Dr. Tcbioha, JAERI and Mr. Miller, 9ECD :
NEA secretriat, and related Task Groups.
47
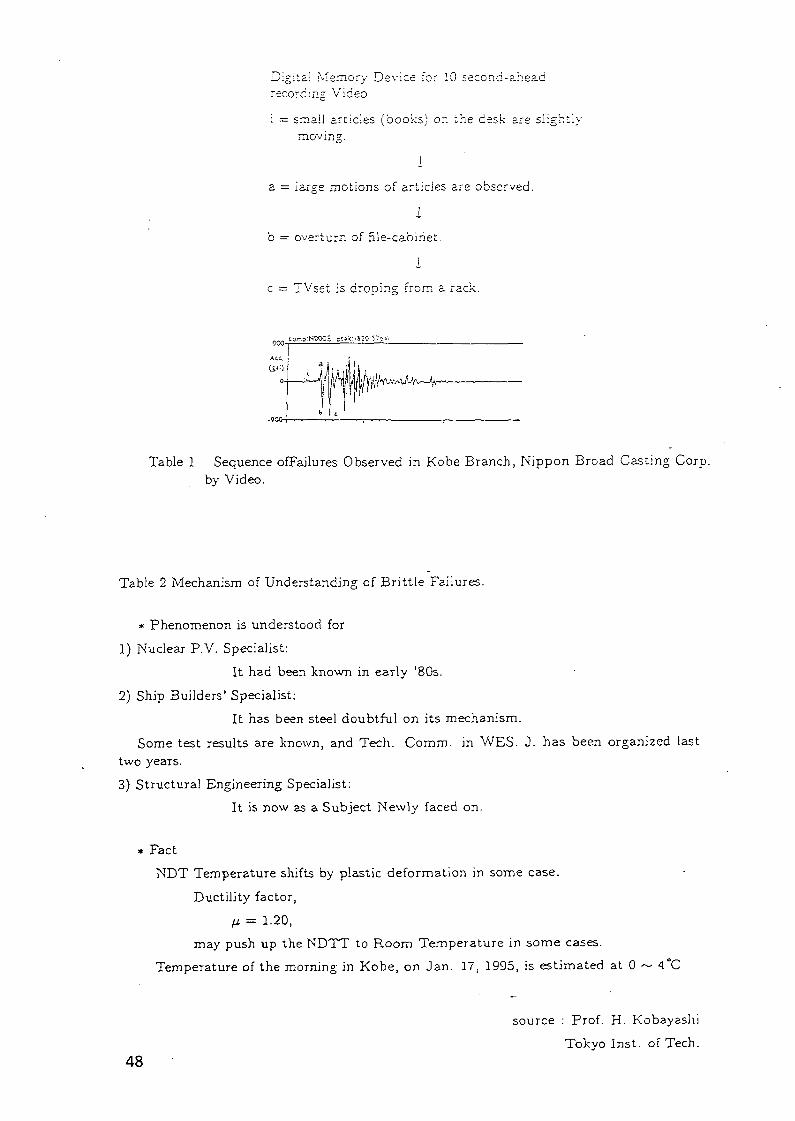
Digital Memory Device for 10 second-aheadrecording Video
i = small articles (books) on "he desk are slightlymoving.
a = large motions of articles are observed.
b = overturn of file-cabinet.
c = TVset is droning from a rack.
900 «~:N00C£.
AC1.
.900-
r-MflW
Table 1 Sequence ofFailures Observed in Kobe Branch, Nippon Broad Casting Corp.by Video.
Table 2 Mechanism of Understanding of Brittle Failures.
* Phenomenon is understood for
1) Nuclear P.V. Specialist:
It had been known in early '80s.
2) Ship Builders' Specialist:
It has been steel doubtful on its mechanism.
Some test results are known, and Tech. Comm. in WES. J. has been organized lasttwo years.
3) Structural Engineering Specialist:
It is now as a Subject Newly faced on.
* Fact
NDT Temperature shifts by plastic deformation in some case.
Ductility factor,
fi = 1.20,
may push up the NDTT to Room Temperature in some cases.
Temperature of the morning in Kobe, on Jan. 17, 1995, is estimated at 0 ~ 4°C
source : Prof. H. Kobayaslii
Tokyo Inst. of Tech.48

T,..i;: : . «^ i ; ;
Fig.l Time History observed at Kobe Ocean Meteorogical Observatory.
Hyogo 1995/01/17t-\a - 2.5 i iO"25 dync-cr : 5.9 Dtp:
Fig.2. Mechanisms of sequence of Main Shocks from Far-distance Record Analysis(AnaJized by Prof. Kikuchi, Yokohama City Univ.).
49

Unit gal
Fi°;-3 Distrubution of P.G.A.
50

LJt-J
; KSf.WCMIVA
SHIN-<C2£ E'.EC. / .' TA.V1GAMI / I
me
Kf
>
. !1
I
-
1
30. C
"•I
1 Q . Ci _
i !
i Ji i
I : : . . , I i--.-s. . 1C.2 0 . 5 1.0 2 . 0 5 .0 10.0 2 0 . 0 S C O 1C0.C 2 0 0 . 0 5 0 0 . 0
DISTANCE fXM3
Fig.4 Attenuation Curve of P.G.A.
f,'-:=7.0
2 :
0.2 0.5 !.O 2.9 5.0 !0.0 20.0 50.0 1C0.0 200.0 5C0.0
OISTP.vCE (KM)
Fi°;.5 Attenuation Curve of P.G.V.51
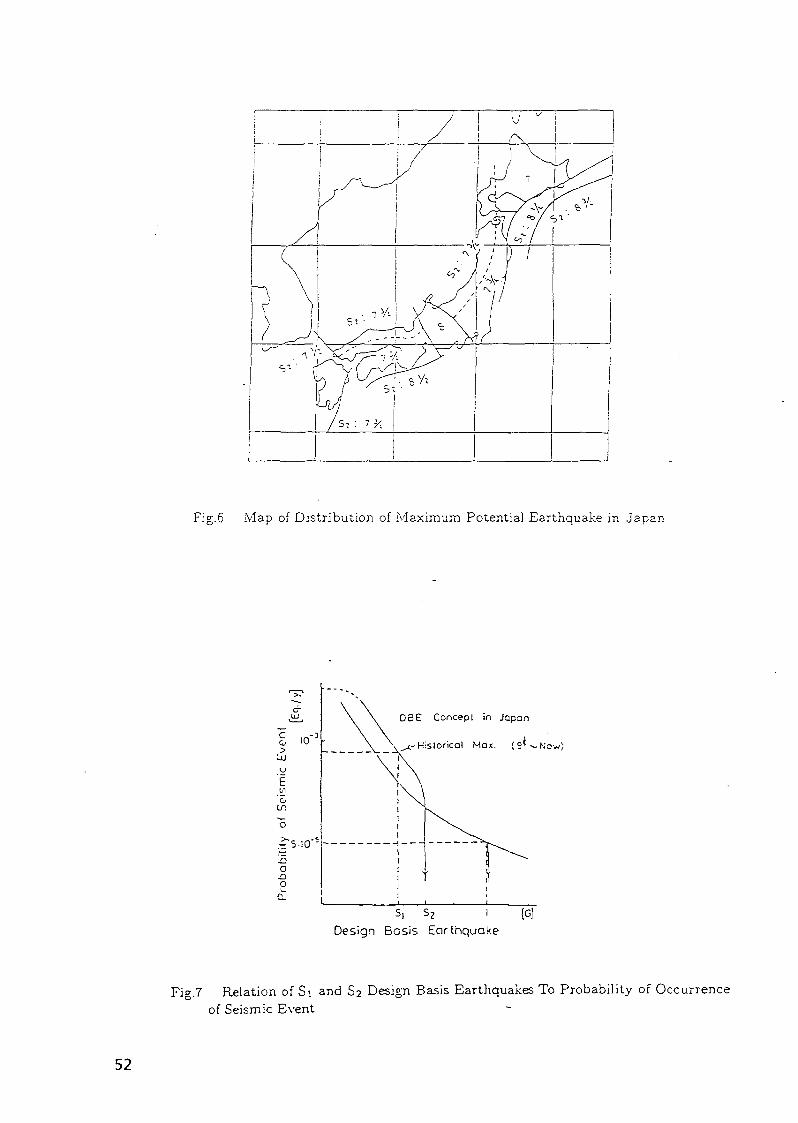
Fig.6 Map of Distribution of Maximum Potential Earthquake in Japan
DBE Concepl in Japan
t-Historical Max. { o* ^ Now)
S, S 2 1 {CJ
Design Basis Earthquake
Fig.7 Relation of Si and S2 Design Basis Earthquakes To Probability of Occurrenceof Seismic Event
52

9S- 9
99- 6
99- 5
<rQOcra.UJ
OUJUJ
- 500
1 200
- !00
iooa
ar.UJ
(X.
S 10 20 SOACCELERATION ( CflL )
100 200
500Aoo\ — f— — — I
200
NON-EXCEEOBNCe 58.
g
UJ
50
20
10
10 20 50 100r vcoo i
0.996?I 1 1 1 •
1
I~ I
11
> " -
I_ I
_ I
_ t
1
\ <
_ t
• ^ % ^
> ^
- j
- 1- i
I I I ! .
I
1I - .
11 ^s
1l_I1II
J i ' i-^ I i ' ' i t
^ ^
0 •
0- 95
CL 9
0- 8
^"^ ' r~ -\
- < C - ^ " ^ J 0 - 6
j S ^ ->^ ^ ^ 1 1
1 1
i >
i i_ i_
i i
i i
i t
i i
1 1
1 1
1 1 -
1 1 -1 I 1 ! 1 , 1 <
200 500
Fig. 8 Return Period of Earthquake vs. Estimated Acceleration in Kobe area
53
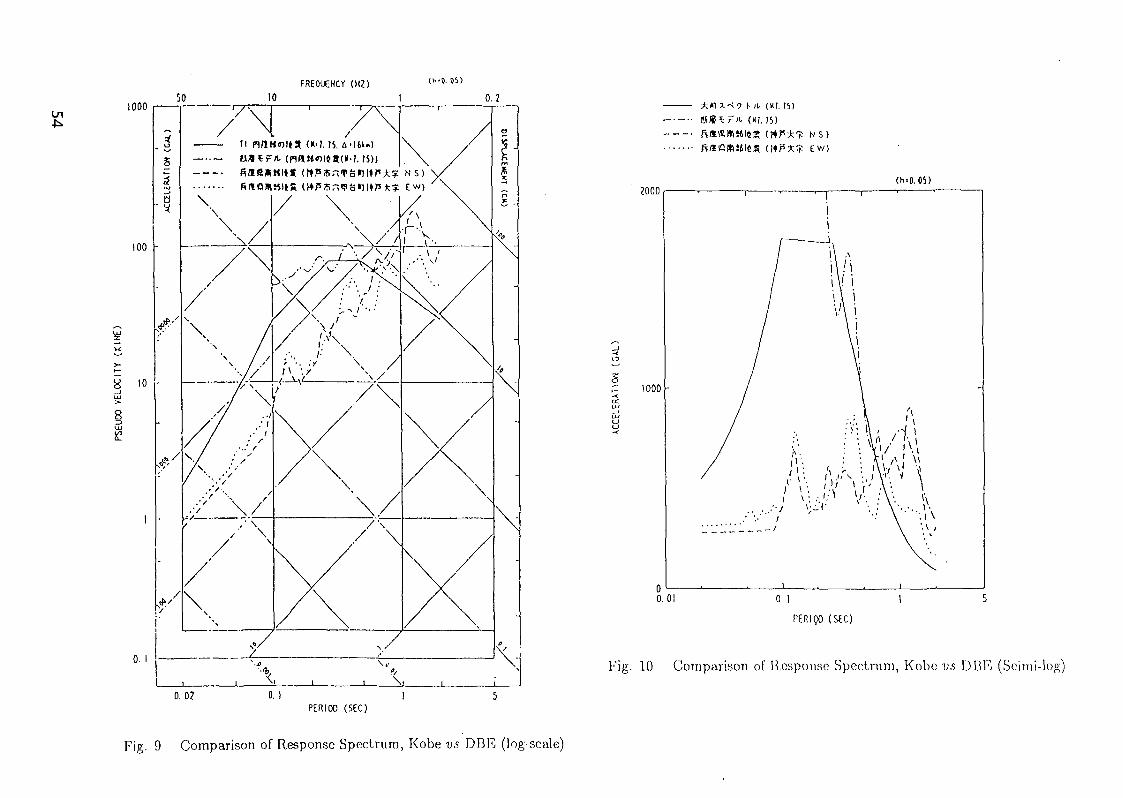
FREQUENCY 0<Z) (h-0. 05)
501000 i
8
0.1
0. 02PERIOO (SEC)
Fig. 9 Comparison of Response Spectrum, Kobe vs DBE (log-scale)
1.15)
(«M5)* ^ N S >
2000
1000 -
(h-0. 05>
0.01 0.1
PERIIJO (SEC)
Fig. 10 Comparison of Response Spectrum, Kobe v.s DBE (Scimi-log)

PROCEEDINGS OF SMiRT-13-POST CONFERENCE SEMINAR-16SEISMIC EVALUATION OF EXISTING NUCLEAR FACILITIES
LATUR EARTHQUAKE AND ITS IMPACT ON THE ASEISMIC DESIGNOF STRUCTURES IN INDIA
P.C. BASUAtomic Energy Regulatory Board, INDIA
XA9952647
ABSTRACT : The Latur earthquake occurred on September30, 1995. The epicentre was located near the Killarivillage of Latur District which is situated in thestable continental region of Southern Peninsular India.The earthquake caused a wide range of damage though itsmagnitude (MS) was 6.4. Intensive damage survey wascarried out and a number of geophysical andseismological studies had been undertaken. It was beenconcluded from the results, available so far from thesestudies, that the hypocentre of the earthquake was onthe lineament dipping NW-SE. The rock matrix in thehypocentral region was weakened due to the presence offluid and rupture of this weak region caused the event.The ground motion produced by the earthquake was ofcomplex nature comprising of horizontal and verticalcomponent. The ground acceleration in the epicentralregion was estimated as 0.2 g. Latur earthquake raisedseveral issues with respect to aseismic design ofstructures in India which need further deliberation.These issues are related to seismic zoning of India,determination of design basis ground motion, design/detailing of structures, etc.
INTRODUCTION
Latur Earthquake occurred in the early morning of30th September, 1993. The epicenter of the earthquakeis located in the Latur District of Maharashtra State,India. The epicentral area falls in the SouthernPeninsular India known to be seismically stable. Theevent was preceded by several foreshocks and followed bya number of aftershocks.
Field studies and damage surveys were carried outby a number of organizations following the earthquake.The Latur earthquake would go down in the history as thedeadliest earthquake to strike a stable continentalregion (SCR).
No significant past earthquake incidents are knownin the region surrounding Latur and as such noearthquake instruments were installed in this areabefore this earthquake. However, a number ofgeological, geophysical as well as seismological studieshave been undertaken in the earthquake affected regionsfollowing the event. All these studies are yet to be
55
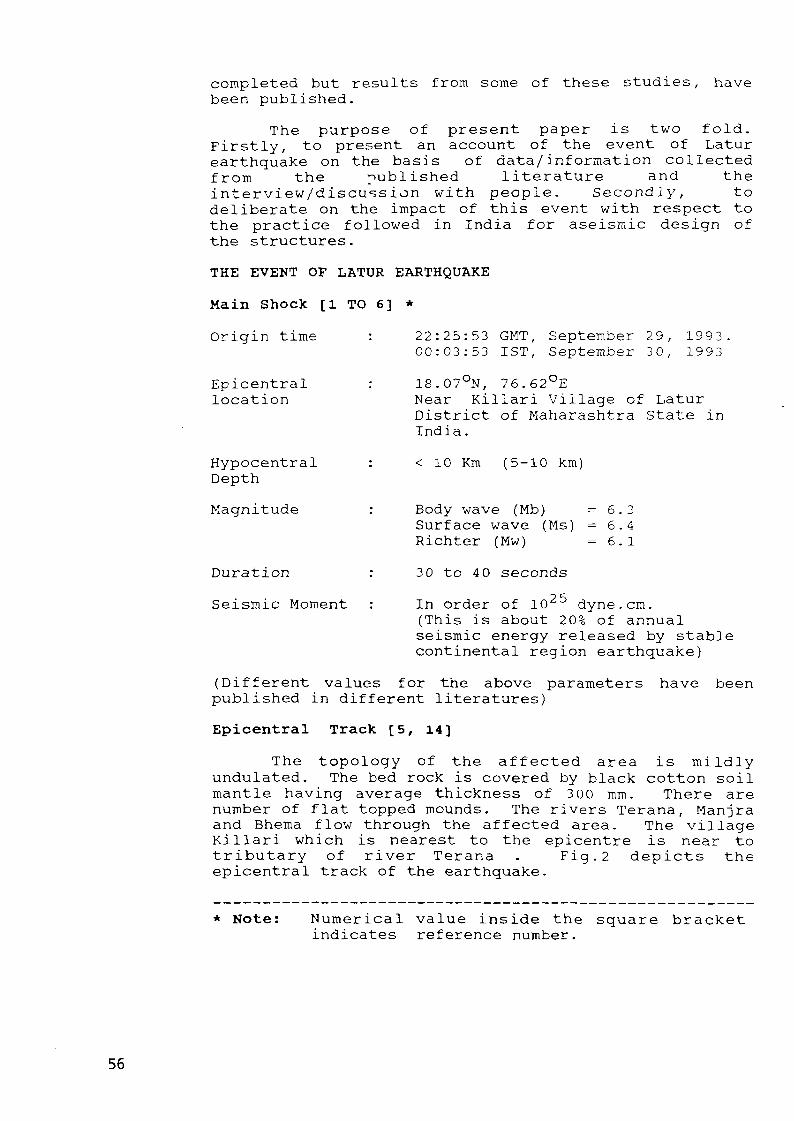
completed but results from some of these studies, havebeen published.
The purpose of present paper is two fold.Firstly, to present an account of the event of Laturearthquake on the basis of data/information collectedfrom the published literature and theinterview/discussion with people. Secondly, todeliberate on the impact of this event with respect tothe practice followed in India for aseisxnic design ofthe structures.
THE EVENT OF LATUR EARTHQUAKE
Main Shock [l TO 6] *
Origin time : 22:25:53 GMT, September 29, 1993.00:03:53 1ST, September 30, 1993
Epicentral : 18.07°N, 76.62°Elocation Near Killari Village of Latur
District of Maharashtra State inIndia.
Hypocentral : < 10 Km (5-10 km)Depth
Magnitude : Body wave (Mb) = 6.3Surface wave (Ms) = 6.4Richter (Mw) = 6.1
Duration : 30 to 40 seconds
Seismic Moment : In order of 10 dyne.cm.(This is about 20% of annualseismic energy released by stablecontinental region earthquake)
(Different values for the above parameters have beenpublished in different literatures)
Epicentral Track [5, 14]
The topology of the affected area is mildlyundulated. The bed rock is covered by black cotton soilmantle having average thickness of 300 mm. There arenumber of flat topped mounds. The rivers Terana, Manjraand Bhema flow through the affected area. The villageKillari which is nearest to the epicentre is near totributary of river Terana . Fig.2 depicts theepicentral track of the earthquake.
* Note: Numerical value inside the square bracketindicates reference number.
56

Foreshocks [1, 6, 7]
A number of foreshocks during October-November,1992 were reported. An earthquake of magnitude 4.0occurred on 18th October, 1992 in the vicinity ofKillari causing minor damages. There were about 25 feltearthquakes in the following week. On November 1 and 2,1992, four (4) earthquakes of magnitude 2.2 to 3.8occurred. Felt tremors were also reported in 1962,1967, 1983 and 1984.
aftershocks [6, 7]
The main shock was followed by 187 (one hundredand eighty seven) aftershocks, largest being magnitude4.4 occurred on 30the September, 1993. The aftershockactivities decreased rapidly but a shock exceedingmagnitude 4.0 occurred on November 12, 1993. Theaftershock zone is clustered near the point ofconfluence of the two tributaries of the Terana riversouth of Killari village (see Fig. 1). A detail accountof the foreshocks and aftershocks are given inreference - 7.
Probable cause of earthquake [3,6,7,8,9,10]
Indian plate is moving north word direction [9].Cluster of earthquakes have been observed due to thismovement along the main thrust zone below the Himalayanmountain range on the boundary of this plate. PeninsularIndia is a stable continental region on the Indian platewithin which the epicentral area of Latur earthquakefalls. The region comprising of the Deccan volcanicprovince (DVP) and a craton. Eight (8) majorearthquakes occurred in the stable continental region ofIndia. Fig.l shows the tectonic map of this stablecontinental region and the locations of these eightearthquakes. However, no major earthquake event wasrecorded in the epicentral region of Latur during thehistorical past.
A number of geological, geophysical,seismological studies were started following theearthquake [11]. In some literatures [1&2], questionwas raised whether the Latur earthquake was induced byreservoir, because of the presence of Terana river inthe epicentral track. Rastogi examined this aspectsfrom various considerations and concluded that the Laturearthquake is not a reservoir triggered one [12].Chetty and Rao studied the lineament pattern of Latur -Osmanabad area [13] and summarised that the area isconfluenced by the lineament system as shown in Fig. 3.The results so far obtained from the geophysical studiesindicate the presence of fluid in the hypocentral region[10]. It has also been revealed from these
57
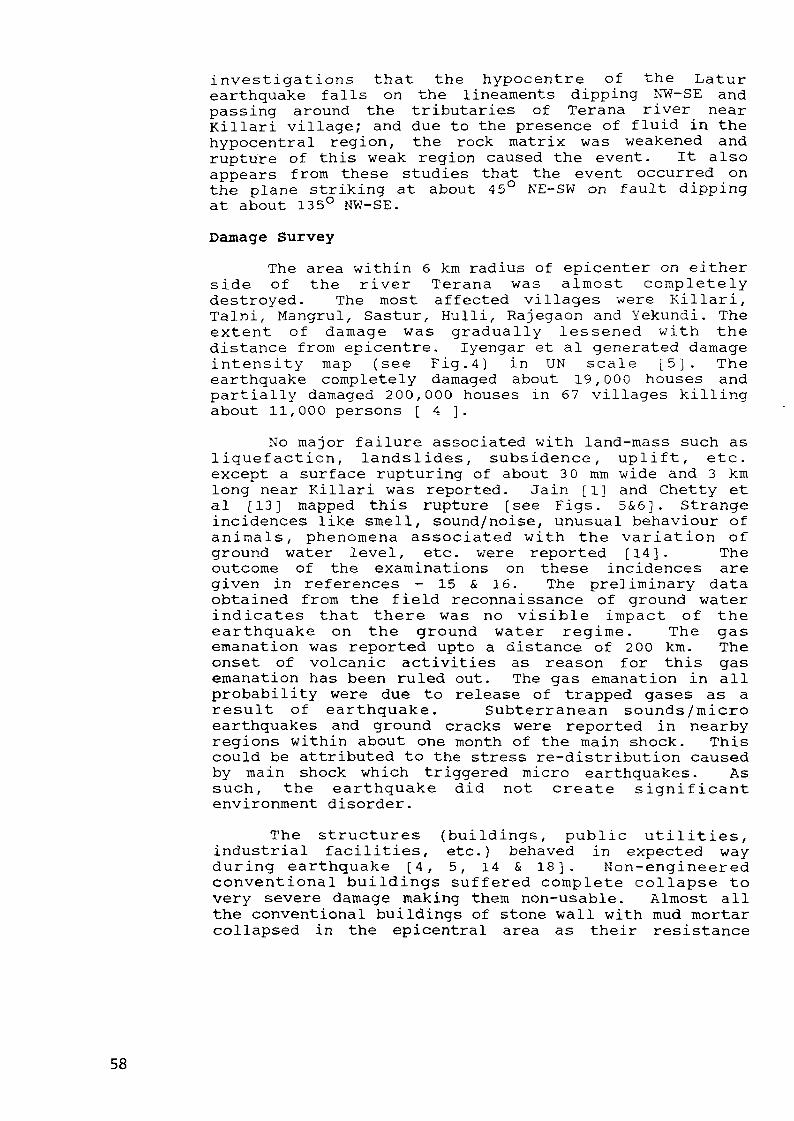
investigations that the hypocentre of the Laturearthquake falls on the lineaments dipping NW-SE andpassing around the tributaries of Terana river nearKillari village; and due to the presence of fluid in thehypocentral region, the rock matrix was weakened andrupture of this weak region caused the event. It alsoappears from these studies that the event occurred onthe plane striking at about 45° NE-SW on fault dippingat about 13 5° NW-SE.
Damage Survey
The area within 6 km radius of epicenter on eitherside of the river Terana was almost completelydestroyed. The most affected villages were Killari,Talni, Mangrul, Sastur, Hulli, Rajegaon and Yekundi. Theextent of damage was gradually lessened with thedistance from epicentre. Iyengar et al generated damageintensity map (see Fig.4) in UN scale [5]. Theearthquake completely damaged about 19,000 houses andpartially damaged 200,000 houses in 67 villages killingabout 11,000 persons [ 4 ].
No major failure associated with land-mass such asliquefaction, landslides, subsidence, uplift, etc.except a surface rupturing of about 3 0 mm wide and 3 kmlong near Killari was reported. Jain [1] and Chetty etal [13] mapped this rupture [see Figs. 5&6]. Strangeincidences like smell, sound/noise, unusual behaviour ofanimals, phenomena associated with the variation ofground water level, etc. were reported [14]. Theoutcome of the examinations on these incidences aregiven in references - 15 & 16. The preliminary dataobtained from the field reconnaissance of ground waterindicates that there was no visible impact of theearthquake on the ground water regime. The gasemanation was reported upto a distance of 2 00 km. Theonset of volcanic activities as reason for this gasemanation has been ruled out. The gas emanation in allprobability were due to release of trapped gases as aresult of earthquake. Subterranean sounds/microearthquakes and ground cracks were reported in nearbyregions within about one month of the main shock. Thiscould be attributed to the stress re-distribution causedby main shock which triggered micro earthquakes. Assuch, the earthquake did not create significantenvironment disorder.
The structures (buildings, public utilities,industrial facilities, etc.) behaved in expected wayduring earthquake [4, 5, 14 & 18]. Non-engineeredconventional buildings suffered complete collapse tovery severe damage making them non-usable. Almost allthe conventional buildings of stone wall with mud mortarcollapsed in the epicentral area as their resistance
58

against lateral force was very little (see Fig.7).Though the stone wall buildings with sand cement mortar(see Fig. 8) or those with wooden frame to support roof(see Fig. 9) responded in a better way than the stonewall with mud mortar but they also became unusable. Theengineered structures responded in expected way andsuffered generally acceptable pattern of damage.Performance of reinforced structures, in general, wasgood except one water tank (see Fig. 10). It wasreported that the reinforcement detailing of this tankmight not be in accordance with the accepted practice.
Iyengar et al observed that the earthquake wasfelt more widely and severely to the South of epicentrethan to the North [5]. They developed the damageintensity map (UN Scale) based on damage survey. Anintensity of VIII has been assigned to the mizoseismicarea. Another interesting feature is that intensity VIIhad also been observed in Unrani and Bhosgak which areat a large distance from the epicentral area (seeFig. 4). This may be due to the local geological and subsurface condition.
Ground Motion
The Latur earthquake was reported to be felt inlarge area, even at a distance of about 800 km from theepicentral region. This is an interesting feature ofan earthquake of magnitude in the range 6.4 and isattributed to two reasons; firstly, the focal depth isshallow and second one is the efficient wave propagationcharacteristics of the rock strata of the shield region.
No strong motion records are available of thisearthquake. Based on field survey, interviews of localresidents, Sinval et al reported that the ground motiongenerated by the earthquake was of complex type [14].The possibility of vertical and torsional componentalongwith the horizontal component, generated by theearthquake, was inferred from the information obtainedfrom the field survey, the pattern of damage anddeformation suffered by the structures, etc. Sliding ofheavy objects were also reported [5,14], Iyengar et alestimated ground acceleration near the epicentral areaas about 0.2g based on the information regardingsliding, tilting and toppling of objects (see Table-1).
IMPACT ON ASEISMIC DESIGN OF STRUCTURES
The Latur earthquake reveals a good deal ofinformation regarding the earthquake potential of thestable continental regions of Peninsular India. Theevent has raised a number of issues related to theaseismic design of structures in India. These arerelated to the seismic zoning of India, method to
59

determine the design basis ground motion (DBGM) anddesign of structures. Some of the present practicerelated to these activities are examined in thefollowing sections vis-a-vis the variousdata/information obtained from the field study and otherinvestigation carried out following the Laturearthquake.
Present Practice of Aseismic Design in India
1. General Buildings/Structures
In India, earthquake resistant design of generalbuildings/structures are carried out as per "IndianStandard, Criteria for Earthquake Resistant Design ofStructures", IS:1893-1984 [17]. In the standard, ithas been endeavored to ensure that, as far as possible,structures are able to respond, without structuraldamage to shocks of moderate intensities and withouttotal collapse to shocks of high intensities. Thestructures, which are designed as per this standard, areexpected to experience more severe ground motion thanthe one envisaged in design during its life time. Inview of this, the standard advocates to adopt theductile design considerations.
The standard divides entire India in five (5)seismic zones based on the probable earthquake intensity(see Fig.11). Table-2 contains the assigned intensityand earthquake potential of these zones. The standardprincipally deals with the horizontal motion in thedetail. However, vertical motion needs to be consideredwhen the stability is main criteria in the design. Thestandard specifies that the seismic coefficient forvertical motion should be 50% of that for horizontalmotion.
As per IS-1893, the horizontal seismic co-efficient (a^) , the design parameter of earthquakeexcitation for which structure is to be designed, isdetermined from the following expression :
ah = 61.a (1)
where, the values of £ depend on soi l foundation systemsand var ies from 1.5 to 1.0, while the range of I(importance factor) is given in IS1893 as 1.0 to 3. Thevalue of ground motion factor, x a ' , varies with seismiczones.
(i) Seismic Coefficient Method
In th i s method, xa ' i s the basic horizontalseismic coefficient (aQ), the values of which fordifferent seismic zones are given in Table-2.
60
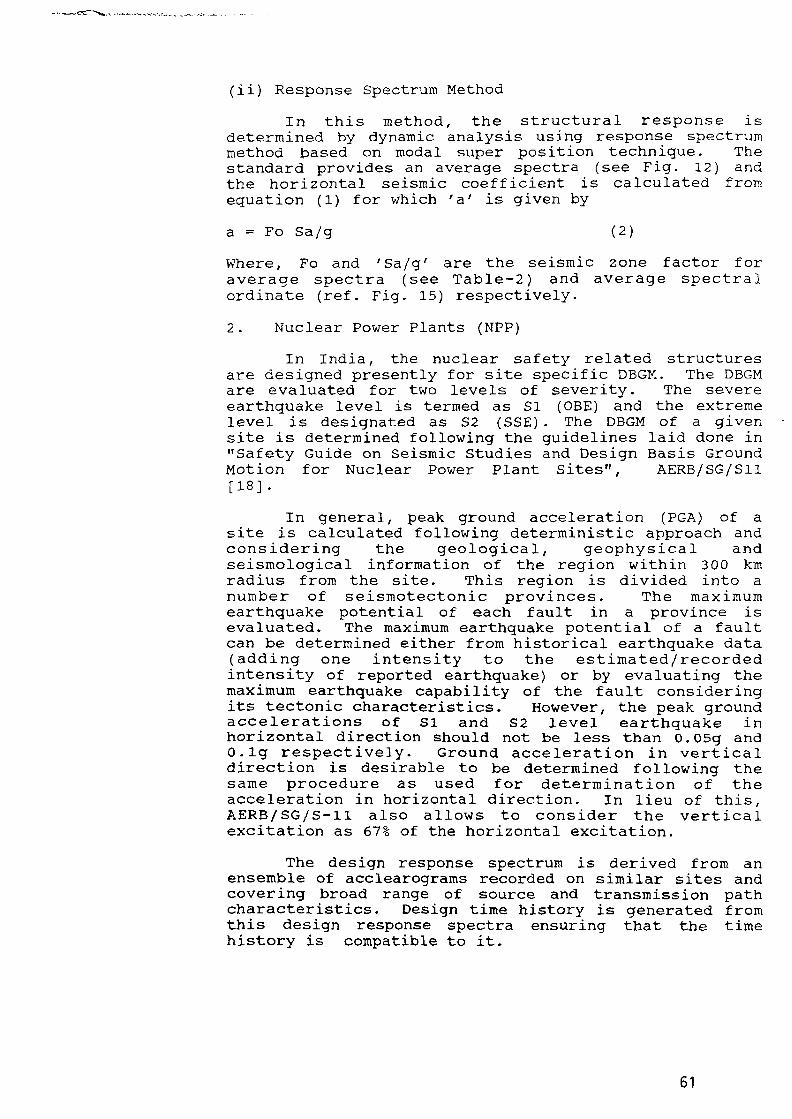
(ii) Response Spectrum Method
In this method, the structural response isdetermined by dynamic analysis using response spectrummethod based on modal super position technique- Thestandard provides an average spectra (see Fig. 12) andthe horizontal seismic coefficient is calculated fromequation (1) for which 'a' is given by
a = Fo Sa/g (2)
Where, Fo and 'Sa/g' are the seismic zone factor foraverage spectra (see Table-2) and average spectralordinate (ref. Fig. 15) respectively.
2. Nuclear Power Plants (NPP)
In India, the nuclear safety related structuresare designed presently for site specific DBGM. The DBGMare evaluated for two levels of severity. The severeearthquake level is termed as SI (OBE) and the extremelevel is designated as S2 (SSE) . The DBGM of a givensite is determined following the guidelines laid done in"Safety Guide on Seismic Studies and Design Basis GroundMotion for Nuclear Power Plant Sites", AERB/SG/S11[18].
In general, peak ground acceleration (PGA) of asite is calculated following deterministic approach andconsidering the geological, geophysical andseismological information of the region within 3 00 kmradius from the site. This region is divided into anumber of seismotectonic provinces. The maximumearthquake potential of each fault in a province isevaluated. The maximum earthquake potential of a faultcan be determined either from historical earthquake data(adding one intensity to the estimated/recordedintensity of reported earthquake) or by evaluating themaximum earthquake capability of the fault consideringits tectonic characteristics. However, the peak groundaccelerations of SI and S2 level earthquake inhorizontal direction should not be less than 0.05g and0-lg respectively. Ground acceleration in verticaldirection is desirable to be determined following thesame procedure as used for determination of theacceleration in horizontal direction. In lieu of this,AERB/SG/S-ll also allows to consider the verticalexcitation as 67% of the horizontal excitation.
The design response spectrum is derived from anensemble of acclearograms recorded on similar sites andcovering broad range of source and transmission pathcharacteristics. Design time history is generated fromthis design response spectra ensuring that the timehistory is compatible to it.
61

Seismic zoning
1. General Buildings/Structures
The seismic zone map of IS: 1893 has been developedprimarily on the basis of available strong motionseismic data/information. The seismic zone number of aregion is the representation of tht size of earthquakes(magnitude or intensity) which could occur in thatregion. Potential of earthquake primarily depends onthe strain of rock. The work of Gaur and others [9]indicates that strain is accumulated in the crust ofpeninsular India at a slow rate. For rupture of rock,threshold value of strain is in the order of 10 . Ifthe rate of strain accumulation is in the order of 10to 10~7 (as in the case of Southern part of peninsularIndia; see ref .9) , the return period of a typicalmoderate to higher size earthquake in this region may betaken in the order of 10 to 10 years. Therefore,current potential of earthquake in any area of thisregion depends on the value of accumulated strain tilldate. Again, if there is any weak spot due to thepresence of fluid or due to any other reason in alineament, the rock mass could rupture at lowerthreshold value.
Bureau of Indian Standard (BIS) has taken up aprogramme to revise the seismic zoning map of India. Theseismic zoning map would be revised considering theearthquake potential of different regions in India andtaking into account the geological, geophysical andseismological features of these regions alongwith strongmotion as well as micro earthquake data.
2. Nuclear Power Plants
Incidentally, no Indian NPP or sites of ongoingnuclear power projects are situated within 300 km radiusfrom the epicentral area of Latur earthquake. Since,the site specific DBGM of NPP-Site is determinedconservatively from the maximum earthquake potential ofall causative faults (falling on the area within 300 kmradius from the site) , change in seismic zonation ofIndia will not have any impact in the engineering ofIndian NPP.
Ground Motion
1.0 General Buildings and Structures
It has been inferred from the field survey thatthe ground motion generated by Latur earthquakecontained horizontal, vertical and possibly torsionalcomponent [7, 14]. It may not be possible to infer theexistence of torsional motion just on the basis of
62

deformation/damages of structure, but poss ib i l i ty ofver t ica l motion could be inferred with reasonablecer ta in t ies from these information. IS:1893,principally, deals with horizontal motion in detail andapparently attaches less importance to the ver t i ca lmotion. The information revealed from Latur earthquakeclearly indicates that both of vertical and horizontalmotion should be treated with equal importance inaseismic design.
The range of ground acceleration (horizontal)calculated is 0.023g to 0.006g considering differentvalues of 5 and I for regions falling in seismic zone-l.The ground acceleration in epicentral area of Laturearthquake has been estimated as 0.2g using theinformation collected after the event. Therefore, if astructure is designed for earthquake excitation as perIS1893 in the epicentral area of Latur earthquake, theni t needs to have ducti l i ty factor 8.69 to 33.33(corresponding to PGA 0.023g to 0.006g) to withstand0.2g ground acceleration.
I t is presumed that when a structure is designedand detailed following the codal cri teria of ductiledesign [21] and good engineering practice, the ductili tyfactor of about 5 could be achieved. Demand ofductility factor 8.69 may be acceptable with a viewthat structure could be allowed to suffer certain levelof damage. But demand of ductibility factor 3 3.33 istoo high. I t indicates that there exists possibility ofunderestimation of the design value of seismic effectsby IS1893 in some cases and there is a need to re-examine this respect.
2.0 Nuclear Power Plants
The PGA values are calculated for the areas aroundKil lar i vi l lage from maximum reported magnitude ofearthquake as per AERB/SG/S-11. The maximum magnitudeearthquake occurred before the September 30, 1994 eventwas felt 4.0. For various combinations of epicentraldistance and hypocentral depth, PGA values arecalculated with this information and are found to beless than 0,2g. The maximum value is 0.104g whenepicentral distance of 5 km and hypocentral depth of 5km are considered. For other combination of epicentraldistance and the hypocentral depth, the values are lessthan O.lg. For the epicentral distance and thehypocentral depth both taken upto 10 km, the calculatedPGA values are even less than 0.05 g in some cases. ThePGA values were also calculated for differentcombinations of epicentral distance (upto 2 0 km) andhypocentral depth (20 km) for magnitude upto 7.5. I t isfound in number of cases the PGA value works out to beless than 0. 2g and in a few cases i t is even less than
63

0. lg when magnitude is taken less than or equal to 6.5.In this context, it may be noted, out of eight majorearthquakes occurred in the region of peninsular India,magnitude of seven earthquakes were less than 6.5. Themagnitude of the largest one was 7.79 which occurred in1819 at Kutch region.
The above results indicate that it may not alwaysbe conservative to determine the PGA only on the basisof past earthquake data only, specially, for the sitefalling in a stable continental region.
Design and Detailing of Structure
The principal failure modes of concrete structureswhich are generally addressed in the design of areinforced concrete structure are flexure, shear andbond, while for steel structure they are flexure, shear,buckling. The joints are also very important aspect forsteel structures or pre-fabricated structures forefficient aseismic design. Except flexure, all otherfailure modes are non-ductile for concrete structures.Structural design should eliminate the possibility ofnon-ductile failure modes. For this purpose, ductilityshould be implemented in all design implicitly and whenthis is warranted, explicit implementation should bemade [22].
The behaviour of different engineered brickmasonry buildings and RCC structure with aseismic designfeature during Latur earthquake again confirms thatpresent state of aseismic design of structure canattribute them the capability to withstand the effect ofearthquakes in intended way even if the seismicexcitation is more than the one accounted in the design.
SUMMARY
1. The Latur earthquake occurred in the stablecontinental region of peninsular India comprisingof the Deccan Volcanic Province (DVP) and acraton. According to seismologist, thisearthquake of magnitude above 6.0 in a stablecontinental region associated with craton is arare event.
2. The earthquake had shallow focus and while thedamage area was comparatively small but the feltarea was very large. This is attributed toefficient propagation of seismic wave in theshield region. High number of death toll was dueto the fact that the earthquake occurred in theearly morning hours when people were fast asleep.Moreover, large damage of buildings is alsoresponsible for this. The buildings/structures
64

responded in expected manner. Most of thebuildings in the affected areas were ofconventional type construction and were poor inresisting lateral forces and thus suffered severedamage or collapsed. Appropriately engineeredstructures with earthquake resistant capabilitywithstood the earthquake in intended way.
3. The ground motion produced by the earthquake wasof complex nature comprising of horizontal andvertical component. Presence of torsionalcomponent in the ground motion was also reported.The ground acceleration in the epicentral regionhas been estimated as 0.2g.
4. Following conclusions are drawn from theexamination of some of the aspects of presentmethodology of aseismic design followed in India.
i) The revision of seismic zoning map needs tobe based on the geological, geophysical andseismological information along with thestrong motion as well as micro earthquakedata.
ii) The present" methodology of IS1893 todetermine the design parameters ofearthquake ground motion for aseismic designof structure may underestimate the value ofdesign ground motion parameter which may notbe the intent of IS1893. The method needs tobe re-examined.
iii) Ductility should be implemented in all designimplicitly. When required explicitimplementation of ductility is to be madethrough design methodology.
iv) A minimum level of ductile detailing shouldbe specified for the all buildings/structuresirrespective of their location ofconstruction with respect to seismic zone.
v) Appropriate detailing needs to be adopted, asa first step, to cater for possible torsionalmotion generated by earthquake.
vi) Both the vertical and horizontal excitationneeds to be taken care in the designassigning equal importance to each.
vii) Evaluation of maximum earthquake potential offaults only on the basis of past earthquakedata may not give conservative design basisground motion of a NPP site in a stable
65

continental crust region. The maximumpotential shall also be evaluated consideringthe capability of the fault from geological,geophysical and seismological information/data.
ACKNOWLEDGMENT
Author wishes to express his sincere thanks to Dr.S.K. Guha, Joint Director (Retd.) of CWPRS, Pune, Dr.S.K. Arora, Head, Seismology Section, BARC, Dr. R.D.Sharma, Head, Seismotectonic, NPC and Dr. S.K. Jain ofIIT Kanpur, for providing data and information. Authorhad discussion with a number of persons on Laturearthquake and i t is not possible to quote a l l of theirnames. Their help and co-operation are also thankfullyacknowledged. He is also grateful to Chairman, AERB forallowing him to publish this paper.
REFERENCE
1 . J a i n S . K . , M u r t h y C . V . R . , C h a n d a k N . , J a i n N . K . ," T h e S e p t e m b e r 2 9 , 1 9 9 3 , M 6 . 4 K i l l a r i , M a h a r a s h t r aEarthquake in Central I nd i a " , EERI Specia lEarthquake Report, pp. 1-8 January, 1994.
2. Seeber Leonardo, "Kil lari , The Quake that Shookthe World", New Scientist , 2nd Apri l , 1994, pp.25-29.
3. Arora S.K., "The Killer Earthquake of K i l l a r i " ,Deep Continental Studies in India, Vol.4, No. 2,September, 1994, Sponsored by Department ofScience & Technology, Government of India, pp.2-4.
4. Indra Mohan, Rao M.N., "A Field Study of Latur(India) Earthquake of 30th September, 1993,"Memoir Geological Society of India, No. 35, pp.7-32, Bangalore, India 1994.
5. Iyengar R.N., Manohar C.S. and Jaiswal, "FieldInvestigation of the 30 September Earthquake inMaharashtra", Current Science, Vol. Nos. 10thSeptember, 1994, pp 368 - 379.
6. Gupta H.K., "The Deadly Latur Earthquake", Memoir,Geological Society of India, No. 35, pp. 1-5,Bangalore, India, 1994.
7. Baumbach M. , Grosser H. , SCHMIDT H.G., PAULATA,Rietbrock A., Raraakrishna Rao, C.V., Solomon RajuP . , Sarkar D. , Indra Mohan, "Study of theForeshocks and Aftershocks of the In te rp la te LaturEarthquake of September 30, 1993, India", Memori,Geological Society of India, No. 35, pp. 33-63,Bangalore, India, 1995.
8- Bolt Bruce A, "Earthquakes," WH Freeman andCompany, New York, 1988.
9. Gaur V.K. , "Evaluation of seismic hazard in Indiatowards minimizing earthquake r i s k " , Current
66

Science, Vol.67, No.5, 10th September, 1994, pp.324-329.
10. Gupta H.K., "Latur Earthquake : Some Results ofGeophysical Invest igat ions" , Deep ContinentalStudies in India - Newsletter, Vol .4, No.2,September 1994, sponsored by Department of Science& Technology, Government of India, pp. 4-8.
11. Midha R.K., "Latur Earthquake Some Majorini t ia t ive by DST", Deep Continental Studies inIndia - Newsletter, Vol.4, No. 2, September 1994,sponsored by Department of Science & Technology,Government of India, pp. 8-10.
12. Rastogi BK, "Latur Earthquake: Not Tiggerred",Memoire of Geological Society of India, No. 3J, pp1-5, Bangalore, India.
13. Chetty TRK, Rao MN, "Latur Earthquake of September2 993; Surface Deformation and Lineament Pattern",Geological Society of India, Mcmor 35, Bangalore,India.
14. Sinbhal A, Bose PR, Dubey RN, "Damage Report ofthe Latur-osmanabad Earthquake of September 30,1993.
15. Singh V.S, Subrammanyam, Hodlur GK, Angareyulu,"Report on Hydrological Reconnaissance in someEArthquake affected v i l l a g e s in Latur andosmanabad Districts of Maharashtra", Memoir No.35 of Geological Society of India, pp 131-138,Bangalore, India, 1995.
16. Rastogi BK, Rao MN, "After Effects of LaturEArthquake Smoke/Gas Emanations and sub terraneamSounds/Microearthquakes", Memoir No. 35,Geological Society of India , pp 139-149,Bangalore, India, 1994.
17. BIS, "Indian Standard, C r i t e r i a for EarthquakeResistant Design of S t ruc tures" , IS:1893-1984(Fourth revision) , Bureau of Indian Standard.
18. Sinha R, Goyal A, "Damage to buildings in LaturEarthquake", Current Science, Vol. 67, No.5,10th September, 1994.
19. AERB, "Seismic Studies and Design Basis GroundMotion for Nuclear Power Plant S i t e s , " SafetyGuide No. AERB/SG/S-11, Atomic Energy RegulatoryBoard, India.
20. Guha S.K., Basu P,C, "Catalog of Earthquakes (=>m 3.0) in peninsular India" , AERB TechnicalDocument No. AERB/TD/CES-1, 1995, Atomic EnergyRegulatory Board, India.
21. BIS, "Indian Standard Code of P rac t i ce forEarthquake Resistant Design and Construction ofBuildings", IS 4326, 1976, Bureau of IndianStandard.
22. Basu P.C., "Ductil i ty C r i t e r i a , A Part ofIntegrated Design Approach in Proposed REvision ofIS456: A Deliberation", paper presented in theseminar on Revision of IS 456, September 4-6,1992.
67
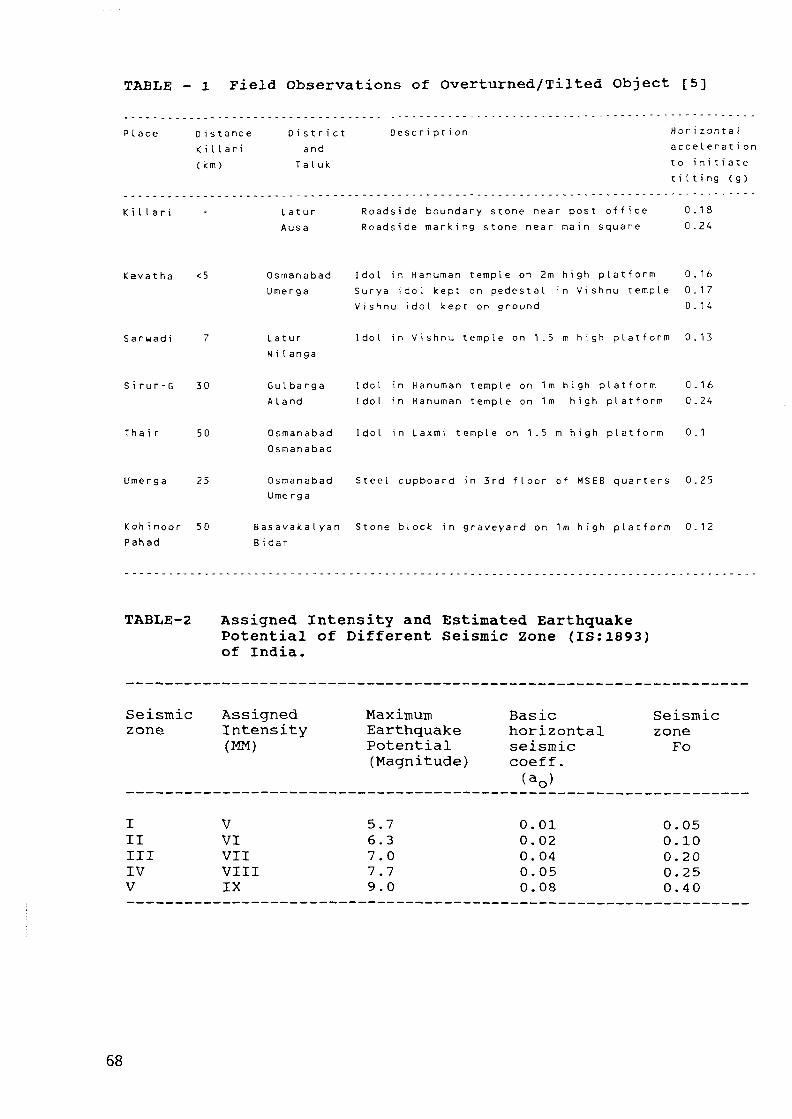
TABLE - 1 Field Observations of Overturned/Tilted Object [5]
P l a c e D i s t a n c e
K i l l a r i
( k m )
D i s t r i c ta n d
T a l u k
D e s c r i p t i on H o r i z o n t a la c c e l e r a t ionto i n i t i a t et i l t i n g ( g )
K i l l a r i L a t u rA u s a
R o a d s i d e b o u n d a r y s t o n e n e a r p o s t o f f i c e 0.18R o a d s i d e m a r k i n g s t o n e n e a r m a i n s q u a r e 0.24
K a v a t h a <5 O s m a n a b a d Idol in H a n u m a n t e m p l e on 2m high p l a t f o r m 0.16
U m e r g a S u r y a idol kept on p e d e s t a l in V i s h n u t e m p l e 0.17V i s h n u idol k e p t on g r o u n d 0.14
S a r w a d i 7 L a t u r
N i t a n g a
I d o l i n V i s h n u t e m p l e o n 1 . 5 m h i g h p l a t f o r m 0 . 1 3
S i r u r - G 3 0 G u l b a r g a I d o l i n H a n u m a n t e m p l e o n 1 m h i g h p l a t f o r m 0 . 1 6A l a n d I d o l i n H a n u m a n t e m p l e o n 1 m h i g h p l a t f o r m 0 . 2 4
T h a i r 5 0 O s m a n a b a d I d o l i n L a x m i t e m p l e o n 1 . 5 m h i g h p l a t f o r m 0 . 1
O s m a n a b a d
U m e r g a 25 O s m a n a b a d S t e e l c u p b o a r d in 3 r d flo o r of M S E B q u a r t e r s 0.25Ume rg a
K o h i n o o r 50 B a s a v a k a l y a n S t o n e b l o c k in g r a v e y a r d on 1m hi g h p l a t f o r m 0.12P a h a d B i da r
TABLE-2 Assigned Intensity and Estimated EarthquakePotential of Different Seismic Zone (IS:1893)of India.
Seismiczone
IIIIIIIVV
AssignedIntensity(MM)
VVIVIIVIIIIX
MaximumEarthquakePotential(Magnitude)
5.76.37.07.79.0
Basichorizontalseismiccoeff.
0.010.020.040.050.08
SeismiczoneFo
0.050.100.200.250.40
68

68'
36*N
32'
28'
24'
20*
16'
12'
8'
-
1
<s
72' 76' 80*
1 / - " ~v i
( s> ^
J // 8 •*"' DELHI''* 0 , (
/ • - . ~ / A 3 — , " y' '5 N.
**-*-^ I « « k u 7T——• • • * • /
\ x ; : : ilVwo* AABAD
84* BB'
1 1
0 100'1 . 1 . .
7J^4 ) T ^ ) C A l
/ " / • 76*1
92' 96° E
1
300 500 Kmi 1 . i . 1
r
\
30. - - - - N
TALNI ^KILLARI
1 MC-ZZ? SASTUR^/*^^-'"
\ x {MADRAS:.. t " ^ -BANGALORE* JL
W T 1 / 7
\HG y1 1 \ iT I
72* 76* 80*
Q
- RAJECSAON
. HLTLLI\ TOnAMBA
Km
MUNSAL
-
-
i.
\
\1
i///
36'N
32'
28*
24'
20*
[::::::g MssoioicCainoroic volcanism
Rill Zonos
A-1
A-2
A-3
Plulonic
1
II
III
IV
V
Dharwar tills
Rilled jone ol alkaliplulonilos and carboniles
Aravalli Delhi rill(Ptecambrian)
grabens
Godavan
Mahanadi
Damodar
Narmada
Cambay
Precambrian shear rones
T1
T2
T3
Archean cralonmpbile bellInlerlaca; HG; High Giade Tetrain
Easletn Margin ol Ciddapah Basin
Sukinda Thutsl
Singhbhum shear zones
ID
FIR. 1 Generalized tectonic map oj the Stable continental region ojIndia.The big Mar is the epicenter <>J the Latur earthquake oj September 30, 1993. Open star enclosed in solid circles are previousei^ht largest earthquakes /after Johnston {1993)}: I: 1819, M = 7.79; 2: 1803, M = 6.65; 3: 1956, M = 6.-S3; 4: 1927M = 6.411; 5: 1967, M = 6.3; 6: I93S, M = 6.26; 7: 1918, M = 6.24; 8: 1956, M = 6.05. {
Inset is the mcfiiiseisinal area of Lainr earthquake.
(Ref-10)

TALIII
¥ LAMJAH
r^ i— KILLARIHATTAHGA
TERNA RIVEHAKHIOAM
TAU5ISARII
5ALESA0H
RAJE8AOM
YEXUNOI
- JAWAL6APETH SflUGYI
HULLI
_ UHAROA
fig 2 Loa t ion of j c m r of the worst »((ect<:d v i ) ] a j e 5devastilcd bf the iitur - Osmimbtd < j r t h q t u k c atSeptember JO. 1993. (Hodi(ied l i t r e S u r v - y o ^ J n r f nToposhect 56 B). Inlet jhovj epicenter o f t h eearthquake on map of Indi2.
l'Hj-3 nraiiiii(;e Pjl lcm Around Killari Village and Inferred Subsiirlacc
Harna^c Jntcustty f/»;»|» in UN Scale
70

BENCH UAEIK
tMANY
fSj (10-20CWI
50m LEFT OFFSET 11 . 13cmSCAflP -ISon HIGH
Figure 5 • Portion of the surface rupture associated with the 1993 Killariearthquake. This rupture was mapped discontmously in an east-west zone over adistance of about 7 km. Barbs indicate the uplifted side of the scarps: theapproximate height of the scarps is also indicated. Plus signs indicate upliftedarea, circled when localized. Note that a 'transform" fault connects a south-facing scarp in the center of the map with a north-facing, scarp on the right. This'transform' offsets a field boundary by 53 cm left laterally, which is a minimummeasure of the Shortening. The strike of this and other "transforms' in this mapis north-northeast, the inferred direction of shortening.
(Ref-1)
Fig-6 Views Showing Fault Scrap
(Courtesy Dr. 5.K. Jain, JIT, Kanpur, India)
71

7TTV77VV7vv77-rr7
3 0 - 5 0 Cm TMICX.TUFF ON ROOF(Grey Soil)
POINTINGWITH SOIL (Grey)Lime/Cement
OUTER WALL
WALLO-5-2m Thick
UNDRESSEDSTONES(Bosalfs)
Fig-7 Typical Detail of Conventional Buildings with Stone Wall
Fig- g Damage of Conventional Stone Wall Building(Courtesy : Dr. S-K. Jain, IIT, Kanpur, India)
72
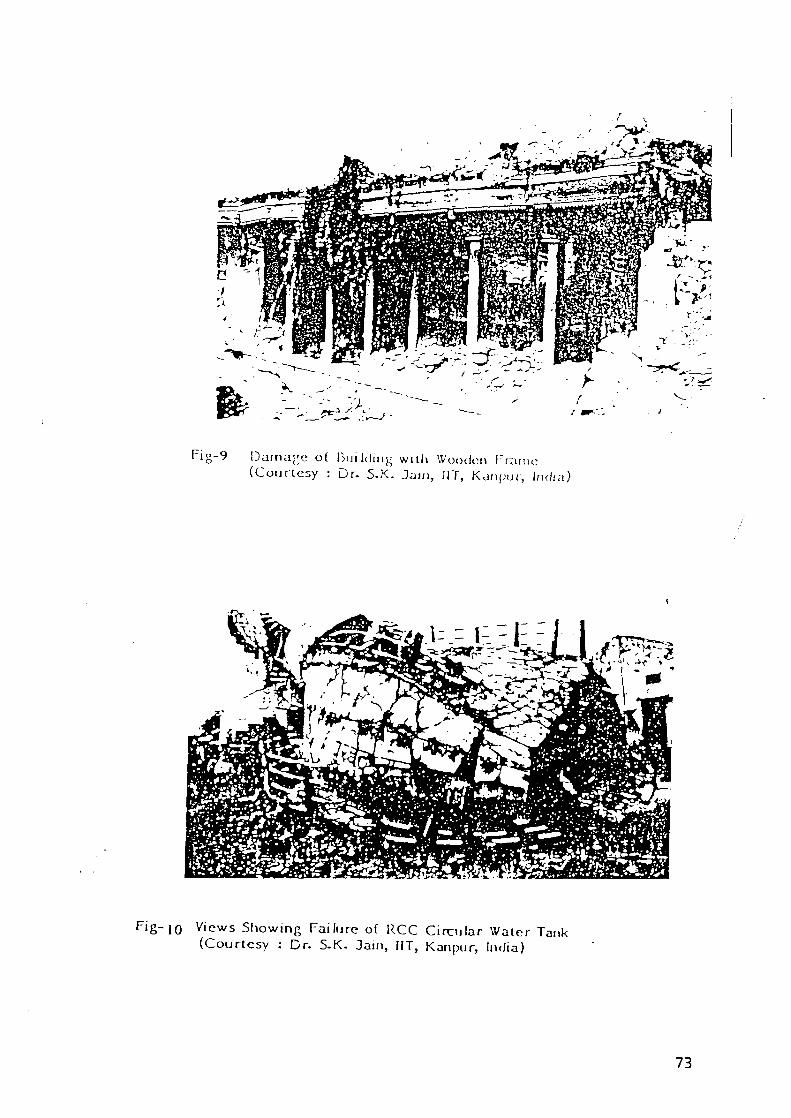
Fig-9 Damage of Building with Wooden Frame(Courtesy : Dr. 5-K. Jiiin, NT, KU/I[«JI, India)
Fig-10 Views Showing Failure of RCC Circular Water Tank(Courtesy : Dr. S-K. Jain, IIT, Kan pur, India)
73

,1
i^- II Ilartliquake Zoning Map of India(ReJ. IS 1893)
- 07
uiao
zo OS
<U)
c| 0 1 - 1 -
F1 /
• -
i
—>
• —
-
-
-
-
—
-
\
-
—
1;
-
-
\
z
\ 1 i /i
i V
-
-
f
--
77
>
2
x
-
/-
<
/"
- - - -
. . .
T
—i
G V. DAMPING
-? v.• S y .
- -i
- -
i
" • — ,
-r
I
i
--
11
—
-
-
11
1
Ji ;
[ rlr i
-
-
i i
'
--
-
i 1 i
-
-
-
-
rri'fr
-
-
-
-
-
-
-
-
-
-
—
--
--
-
-
-
-
Ill;
——
,LJ_
L.
—( H 0 8 12 I S 10 1 L 2 8
HAtURAL PERIOD OF v i U R A t i O N (t( 5 E C 0 K 0 S
74 l T i j ; -12 Average Rcsfwnsc Spec t ra (IS 1893)

SESSION II
"COUNTRY EXPERIENCE IN SEISMICRE-EVALUATION PROGRAMME"
NEXT PAGEIS)left SLANK
75
XA99526481
PROCEEDINGS OF SMiRT 13 - POST CONFERENCE SEMINAR 16 SEISMIC EVALUATIONOF EXISTING NUCLEAR FACILITIES
U.S. EXPERIENCE IN SEISMIC RE-EVALUATION AND VERIFICATION PROGRAMS
John D. StevensonJ. D. Stevenson, Consulting Engineer9217 Midwest Ave. Cleveland OH 44125
ABSTRACT: The purpose of this paper is to present a summary of the development of a seismicre-evaluation program for older nuclear power plants in the U.S. The principal focus of this re-evaluation is the use of actual strong motion earthquake response data for structures and mechanicaland electrical systems and components. These data are supplemented by generic shake table testresults. Use of this type of seismic re-evaluation has led to major cost reductions as comparedto more conventional analytical and component specific testing procedures.
1. INTRODUCTION
The U.S. nuclear industry has been extremely successful in the development and the limiteduse various kinds of experience data to include analysis, test and earthquake for the seismic re-evaluation, verification and as necessary upgrading of Nuclear Power Stations. Nuclear powerplants prior to 1975, particularly East of the 105° longitude in the U.S. (72 units in all) weredesigned to seismic criteria which was less well developed and in some cases less stringent thanwould be the case for nuclear power plants built at the same sites using seismic criteria developedsince 1977. As a result, the U.S. Nuclear Regulatory Commission defined an Unresolved SafetyIssue A-46 in 1980 which required these older plants (pre 1975) to re-evaluate their seismic designadequacy. This phenomena of increased seismic loading on nuclear power plants is a world widetrend, hence the experience gained in the U.S. could be applicable to many other countries. Theprogram defined in this paper is limited to the USNRC Unresolved Safety Issue A-46 which isconcerned with reevaluation of existing nuclear power plants for their original design basis safeshutdown earthquake. However, there is no reason why it could not be applied to other types ofnuclear facilities or other type of hazardous facilities in the U.S. or elsewhere.
The USNRC has also prescribed a seismic margin or probablistic risk assessment review.This review is applicable to all nuclear power plants in the U.S. which for so called focused andfull scoped plant as part of an Individual Plant External Event Evaluation use significantly higherseismic input (i.e. 1.5 to 3.0 times that prescribed in the original design) and could also be appliedin other countries where it is desired to quantify the margins or risk associated with the existingearthquake design.
Current rigorous seismic design and construction techniques account for about 10 to 14percent0-2' of the total cost of a nuclear power plant in the U.S. These methods rely primarily onstructural analysis for building structures, distributions systems (piping, cable trays, conduitductwork, etc.) and mechanical components, and on shaker table testing for seismic qualificationof electrical components. To apply these conventional seismic qualification techniques to olderoperating plants and consequential modifications would be extremely expensive between$15,000,000 to $20,000,000 dollars per unit. In Table 1 is a summary of the large number of
77

of mechanical and electrical, distribution systems and components which typically would have beeninvolved for the subset of seismic or safety Category I, Systems and Components, which make upthe items required for safe shutdown of a U.S. Pressurized Water Reactor plant of 1000 Mwe size.It should be noted that this is a subset of all the safety related seismic category mechanical andelectrical systems and components in the plant. To this list could be added approximately 4 to 6building structures which also would require some level of seismic re-evaluation. All seismicCategory I structures, systems and components to include all those required for postulated accidentand external hazard prevention or mitigation systems and components would increase the quantitiesshown in Table 1 by a factor of 1.5 to 2.0.
It was established as part of an earlier SEP program(3) and in NUREG/CR-4334(4) and as partof a NUREG/CR -6239(5) survey of the response of piping in power stations in California that haveseen at least 0.2g peak ground acceleration that piping systems designed to U.S. power plant pipingstandards could withstand without failure zero period ground acceleration ZPGA up to 0.5g. Forthis reason piping (but not in-line power operated values) was excluded from the A-46 program.For somewhat more obscure reasons, HVAC ducts and their supports (but not fire damperscontained therein) were also excluded.
In addition, earlier pilot studies and evaluations (0J> indicated that building structures plusthe reactor coolant systems and component designed by the Nuclear Steam System Suppliers in theU.S. would be able to meet the new seismic criteria up to about 0.5g ZPGA without much difficultyhence also have not been included in the A-4-6 seismic re-evaluation effort in the U.S.Recent experience in Eastern Europe suggests that this conclusion may not be valid for reactorfacilities that were constructed without meeting the recommendations of the S-l Guides and the S-2guides of the IAEA(S-9).
Recognizing this major NRC concern with regard to older nuclear power plants, starting in1982, several U.S. utilities banded together to form the Seismic Qualification Utility Group, SQUG,to fund an effort to develop simpler, cost effect and safety neutral ways to seismically verifyexisting NPP structures, systems and components. They initiated a pilot effort to develop a database which described and evaluated the seismic behavior in strong motion earthquakes of 8 classesof typical equipment found in nuclear power plants to include high and low and AC and DCswitchgear, motor control centers, horizontal and vertical pumps and power operated valves. Thiseffort was completed in 1984, and it clearly demonstrated that such equipment behaved extremelywell in strong motion earthquakes for Zero Period Ground Acceleration, ZPGA, up to at least 0.3g,with little or no damage. This was contingent on certain caveats being met, components beingpositively anchored and spatial interaction with adjacent components and structure evaluated andsignificant damage precluded.
In 1983, a Senior Seismic Review Advisory Panel SSRAP consisting of 5 acknowledgedexperts in seismic design and evaluations of NPP was formed to review the data being developedby SQUG and their consultants.00' In 1985, the pilot study of 8 classes equipment was enlargedto 20 as shown in Table 2, and the Electric Power Research Institute, EPRI, also began to take anactive part in the effort. By 3987, the enlarged study was completed*6' and the NRC issued a formalrequirement in the form of a Generic Letter 87-02°I} to resolve the USI-A^46 issue. The SQUGgroup began the preparation of a Generic Implementation Procedure, GIP, to provide detailedguidance to individual utilities and their consultants based on the class of 20 reports andinteractions with the NRC and SSRAP to perform walkdowns, document and evaluate the SSCin the individual plants. The GIP was finalized in 1992, and individual plant walkdowns have beenconducted over the past 3 years. It is expected that the walkdowns and reports documenting theresults will be completed by most U.S. utilities by the end of 1996.
The total cost in terms of manhours per nuclear power plant unit using the GIP methodologyand including the evaluation potential malfunction of relays has generally been between 4,000 and8,000 man hours. Physical upgrades as a result of the GIP process which relies heavily on the use
78

of experience data from both actual earthquakes and generic testing has typically been required inless than 1 to 2 percent of the components surveyed. Total cost per unit to perform the entire A-46effort including hardware fixes typically has been less than $1,500,000. This compares withengineering manpower estimates alone of 250,000 to 300,000 man hours and an estimated total costof 15,000,000 to 20,000,000 per unit using conventional seismic analytical and component specifictest methods and procedure.
2. SUMMARY OF THE USI-146 GIP PROCEDURE
The GIP requires re-evaluation considering four areas:
(a) Seismic Capacity versus Demand(b) Caveats(c) Anchorage(d) Interaction
as defined in Seismic Evaluation Work Sheet, SEWS.
2.1 Capacity Versus Demand
The demand is based on the existing design basis or safe shutdown earthquake in the formof either ground or in-structure response spectra. The seismic capacity of components are definedin the GIP as the Bounding Spectrum as shown in Figure 1 for which the earthquake experiencedata base is applicable, or the Generic Equipment Ruggedness Spectra from which seismic test dataon overall classes of equipment have been gathered.
2.2 Caveats
Caveats are developed based on the observations or lack of information contained in theearthquake experiences and the test data base that existed at the time the GIP was prepared (1988-1992). These are discussed in general in Part II Section 4.3 of the GIP. Individual caveatsapplicable to specific items of equipment are contained in Appendix B of the GIP.
2.3 Anchorage
Anchorage requirements and capacities are defined in the Part II Section 4.4 and in detailin Appendix C of the GIP.
2.4 Interaction
Potential interactions of the component with adjacent structures and other. systems andcomponents are discussed in Appendix D of the GIP.
Typical SEWS forms for individual classes of equipment from the GIP can be found inFigures 2 and 3.
3. FUTURE OF SEISMIC QUALIFICATION OF STRUCTURES, SYSTEMS ANDCOMPONENTS IN THE U.S.
3.1 Current Design Codes and Standards
The seismic evaluation or base lining of SSC in existing nuclear power plants designed priorto 1975 using SQUG-GIP methodology will be essentially completed by the end of 1996.
79

However, there is the continuing requirement to seismically evaluate and qualify new, replacementand modified SSC in both old (prior to 1975) and newer nuclear power plants. In the U.S. nuclearpower plants are typically designed for an operating life of 40 years with life extensions possibleup to a 60 year total. During this time period 50 to 70 percent of the original safety relatedcomponents and distribution systems are expected to be added to, replaced or modified. Suchcomponents and systems, particularly in harsh environments which include caustic, acid or wetsteam fluids or other corrosive and erosive environments need to be replaced every 10-15 years orso.
Seismic qualification procedures for Safety related SSC relied upon, between 1975 and 1987were typically based on component specific analysis of structures and mechanical components andgeneric fragility or proof testing of electrical components by their manufacturers. This was a timeconsuming and expensive procedure typically adding some 12 to 14 percent to the total cost of thenuclear power plant. In 1987, the IEEE-344 Standard was reissued to permit the use of actualearthquake experience data contained as in Section 9 of the standard for reference SSC to be usedto qualify candidate SSC based on previous analysis, tests or actual earthquake experience data.This procedure could be used if similarity could be demonstrated between the reference componentand the candidate component.
For mechanical components a new standard, Qualification of Active Mechanical EquipmentUsed in Nuclear Power Plants, ASME QME-1-1994 also permitted the use of actual earthquakeexperience data for operability evaluation as discussed in Attachments A and C to Appendix A ofthe ASME Standard. Unfortunately to date, neither of these two Standards has received unqualifiedacceptance by the USNRC.
In using experience data for seismic verifications and evaluations it is necessary to establisha similarity relationship between the parent or reference components or system and the candidatecomponent or system. This can be done on generic basis as was the case for SQUG where actualearthquakes have supplied an extremely large data base but with relatively little component specificinformation or on a component specific basis as is the procedure used by IEEE and ASMEStandards.
The ASME seismic qualification procedure for operability in ASME QME Section QR,Appendix A, Attachment A is summarized as follows:
1. Functional Characteristics
Candidate equipment considered for qualification by similarity shall have similarfunction/malfunction characteristic to that for the parent equipment for which adatabase is available.
2. Excitation Characteristic
The excitation for the candidate equipment shall be shown to be similar to that forthe parent equipment. The parent data may include a composite spectrum that wasgenerated from qualification of several parent equipment items. Specific excitationcharacteristics to be considered include (but are not necessarily limited to):
a. frequency distribution - indicated by amplified region of response spectrumor by power spectral density
b. peak amplitude of time history, i.e., excitation ZPA
c. maximum amplification factor - ratio of maximum response spectrum value
80

to ZPA.
d. time duration - strong-motion portion must be at least 10 sec.
e. axes of orientation - must be common for candidate and parent equipment,i.e., careful examination of supports at excitation location is required
f. excitation location.
3. Physical Characteristics
Physical similarity is determined by those equipment properties which influence itsdynamic response. Physical similarity between candidate and parent or referenceequipment can be shown by one of several methods, some of which are as follows:
a. Essentially identical equipment - Equipment compared by make, model, andserial number, and found to be identical (within deviations associated withmanufacturing tolerances) or whose differences are so slight that the dynamicresponse can be argued to be essentially unaffected.
b. Similar modal properties - Equipment whose mass, stiffness and dampingproperties can be shown to be similar.
c. Acceptance criteria - For acceptance criteria, provide comparison of items forboth the parent and candidate equipment. If there are significant differences(more than +. 15%) in any one of the items (or sub-items), the effect of thedifference shall be evaluated in terms of the following:
a) stiffnessb) mass distributionc) boundary conditionsd) natural frequenciese) damping
The different effect on the stresses, deformations, and load capacities (suchas stem or shaft buckling capacity, bearing load capacity, etc.) at criticallocations shall also be evaluated and shown to be within the allowable criterialimits.
d. Similar Critical Transfer Function - The critical transfer function establishesa direct dynamic relationship between the excitation and the critical locationwhere failure or malfunction is being evaluated. It can be established fromtypical exploratory resonance search data, if available, for a response pointnear a critical location. When the critical transfer function plot can beestablished for both candidate and parent equipment, and where this can beshown to be within 20% in amplitude within a designated frequencybandwidth, no further modal characteristics need to be determined. As aresult, the equipment is physically similar within the designated frequencybandwidth.
4.0 Concurrence of Excitation and Physical Similarity
A valid qualification by similarity requires that the frequency bandwidth withinwhich physical similarity exists for both candidate and parent items shall beconcurrent within the frequency band for which the candidate's required excitation
81

spectrum is enveloped by the parent equipment excitation spectrum. Envelopingoutside this frequency band is not essential, but cannot be unlimited.
The ASME for mechanical components and systems with regard to operability followed theIEEE lead in 1994. To date the use of experience data for the most part has been limited toquestions of operability of mechanical and electrical equipment with structural and leak tightintegrity as applicable still being addressed by construction codes and standards. It is the author'sopinion that for mechanical components and distribution systems in the future, experience data willbe used to develop, simplified "design by rule" procedures which will be adopted in the designportion of construction codes (ASME Boiler and Pressure vessel Code Sections ED., VEU and ASMEB31.1) for seismic analyses. However, it is highly unlikely that experience data without the expresscomputation of stresses in the component and their supports at least on a generic spacing tables andcharts basis will be permitted by these standards. For the design of elevated temperature pipingsystems with design temperatures greater than about 150° F (80°C), it is highly unlikely that thespacing table and chan methods can be used because of the complication of the computation ofrestraint of free end expansion stresses. It is also highly unlikely that the structural design codesfor concrete or steel structures which are analysis based will be changed significantly as the resultof use of current experience data.
A program for seismic qualification (functional), STERI since 1992 has been developed forqualification of new, replacement and modification to safety related systems and components innuclear power plants. This program uses both the SQUG-GIP earthquake experience and pastgeneric testing of components (Generic Equipment Ruggedness Spectra) and a new qualificationprogram called SQRTS. The SQUG-GIP approach has the drawback that to be useful forexperience based seismic qualification, the component must be in the data base (i.e. they must haveexperienced a strong motion earthquake, have been analyzed, or been included in the generic testing.There is much new or replacement equipment particularly those with solid state and digital deviceswhere such data are not available.
The nuclear industry in the U.S. and particularly that associated with new or replacementequipment is no longer large enough to support generic testing by individual manufacturers. As aresult, individual utilities in the U.S. have banded together to support a particular testing facility toperform seismic qualification testing on individual components as requested by individual utilitieswith results to be shared by all. This program is called SQRTS and is associated with the seismicqualification of otherwise commercial grade equipment in the U.S..
4. THE REGULATORY PERSPECTIVE IN THE U.S.
For plant designed between 1975 and 1987 in the U.S., the Nuclear Regulatory Commissionas part of the individual licensing process was able to secure commitments from the utilitiesinvolved to perform individual component specific seismic qualification by test or analysis. Ingeneral, no mention was made of the use of experience data. As a result, the NRC has tended toview the use of generic or actual earthquake experience data to seismically qualify SSC as a dilutionof this legal commitment. However, they have permitted it to be used for verification of seismicadequacy and in seismic margin evaluations for all nuclear power stations. On the older pre-1975plants, the USNRC has permitted its use to qualify new equipment since in most cases there wereno specific regulatory commitments as to how the seismic qualification would be performed onthese earlier plants. It should also be noted that the NRC has not accepted the IEEE-347-87 orASME QME.QR Appendix A portions dealing with the use of experience data since it wouldamount to generic acceptance. It is hoped that further research and codification of the use ofearthquake experience will permit the USNRC to accept the use of earthquake experience as a validprocedure for seismic evaluations and qualifications in the future. Currently for new or advancedreactor designs in the U.S. there is a major push by the nuclear power industry in that direction.
82
5. FUTURE AND CONCLUSION
There are strong economic pressures to increase the use of experience data as the basis ofsafety neutral seismic qualification of safety related systems and components in U.S. nuclear powerplants. Since 1976, the high cost of seismic qualification or design (+12 to +14 percent of totalplant cost) which does not take advantage of the use of earthquake experience data and the high costof document based Quality Assurance (+30 to 35 percent) procedures have resulted in nuclear powerbeing considerably more expensive than other forms of energy for electric power generation in theU.S. There also has been a general surplus of power generation capability and the ability to importelectricity from Canada. As a result, this plus the uncertainties of nuclear plant licensing, there havebeen no new nuclear plant orders since 1976 in the U.S. Significantly, nuclear power stations usingessentially U.S. reactor designs are currently being constructed outside the U.S. by using morerational seismic and quality assurance procedures which are still economically viable whencompared to the cost of fossil fueled power stations.
The U.S. Nuclear Regulatory Commission has moved to simplify the licensing process ofnew advanced reactor designs but the underlying economic issues of seismic design and documentbased quality assurance have yet to be addressed in a meaningful way. In the author's opinion, itshould be possible by rational use of experience data and "design by rule" produces based on theactual observed damage to mechanical and electrical systems and components in strong motionearthquakes to reduce seismic design and qualification costs to less than 5 percent of plant costs.It should also be possible to reduce the cost of performance based quality assurance to 10 to 15percent of base plant cost which could once again make nuclear power a viable economical optionin the U.S.
It must be understood that nuclear power is the only form of renewable (breeder or fusion)source of high density energy in the world. Sooner or later, nuclear power will become thedominate form of power generation in the U.S. as it has in many other countries. If the sooneroption is taken, we will be able to preserve our fossil materials as chemical feed stocks for thematerial needs of future generations rather than squander it as fuel in the near term. We would alsobe able to address concerns associated with acid rain and the green house global warming effectsin a much more ecologically positive manner.
6. REFERENCES
(1) Stevenson and Associates, "Evaluations of the Cost Effects on Nuclear Power PlantConstruction Resulting from the Increase in Seismic Design Level," NUREG/CR 1508Prepared for U.S. Nuclear Regulatory Commission, April 1981.
(2) Stevenson and Associates, "Differential Design and Construction Cost of Nuclear PowerPlant Safety Related Systems," In preparation as a Welding Research Council Bulletin. 1995
(3) Senior Seismic Review Team, "Seismic Review of Dresden Nuclear Power Station-Unit 2for the Systematic evaluation Program," NUREG/CR 0891, U.S. Nuclear RegulatoryCommission, April 1980.
(4) Budnitz, R.J., "An Approach to the Quantification of Seismic Margins in Nuclear PowerPlants", NUREG/CR-4334, August 1985.
(5) Stevenson, J.D., "Survey of Strong Motion Earthquake Effects on Thermal Power Plants inCalifornia with Emphasis on Piping Systems", NUREG/CR-6239 Vols. 1 and 2 November1995.
83

8
(6) EQE Incorporated, "Summary of the Seismic Adequacy of Twenty Classes of EquipmentRequired for the Safe Shutdown of Nuclear Plants", Prepared for seismic QualificationUtility Group, February 1987.
(7) EQE Inc., "Summary of the Seismic Adequacy of Twenty Classes of Equipment Requiredfor Safe Shutdown of Nuclear Plants", EPRI NP7149 March 1991.
(8) Safety Guide 50-SG-S1, "Earthquakes and Associated Topics in Relation to nuclear PowerPlant Siting", International Atomic Energy Agency, 1979.
(9) Safety Guide 50-SG-S2, "Seismic Analysis and Testing of Nuclear Power Plants,"International Atomic Energy Agency, 1979.
(10) Senior Seismic Review and Advisory Panel, SSRAP, "Use of Experience and test Data toShow Ruggedness of Equipment in Nuclear Power Plants", DE-01921, Sandia NationalLaboratories, June 1992.
(11) USNRC, "Verification of Seismic Adequacy of Mechanical and Electrical Equipment inOperating Reactors, Unresolved Safety Issue A-46", Generic Letter 87-02.
84

99904b Table 1
TABLE 1' List of Quantities of Safety Related Structures Systems and Components Requiredfor Nuclear Power Plant Safe Shutdown
MECHANICAL COMPONENTS
Components
A. Seismic Category IPiping2,3
1. Containment-ReactorBldg.
a. Instrumentationtubing
b. ASME Class 1c. ASME Class 2
and 3
2. Auxiliary buildinga. Instrumentation
Tubingb. ASME Class 2
and 3 piping
3. Fuel buildinga. Instrumentation
tubingb. ASME Class 2
and 3
4. Diesel generatora. Instrumentation
tubingb. ASME Class 2
and 3
5. Intake structure, pipe
B. Valves<2) (Units)
1. Motor Operated
2. Hand Operated
C. Vertical & Horizontaltanks, heat exchangersand vessels (Units)
1. Column supported
2. Skirt supported
3. Saddle Supported
Quantity (Metric)
< 1 2.5 cm
2000
2500
160
330
None inSSEL
> 1 2.5 cm
9004300
10600
330
500
160
> 8 cm
11005500
9300
660
130
340
Total
2000
20009800
2500
19900
160990
330
630
500
150
800
105
45
10
85

10
Components
D. Pumps1. Vertical
2. Horizontal
E. Seismic Category IHVAC ductworkBuilding
1. Containment
2. Auxiliary building
3. Fuel building
4. Diesel generator
TOTAL
Quantity (Metric)
< 12 in.dia.
30 cm
1800
5600
300
200
7900
> 12 in.30 cm
800
1600
200
100
2700
60
100
Total
2,600
7,200
500
300
10,600
II ELECTRICAL COMPONENTS
A. SeismicCategory IElectricalConduit
1. Galvanizedrigid
2. Flexible
B. SeismicCategory Icable trays
C. SeismicCategory IElectricalcomponents
1. Controlpanels
2. Switchgear
3. Transform-ers
4. MotorControlCenters
Quantity (Metric)
< 1 in.2.5 cm
1200
5300
8000
1 in2.5 cm
9000
6600
4 cm
6000
7000
5 cm
12600
2500
8 cm
5000
10 cm
8000
Total
41000
20400
8000
90
80
20
60
86

11
5. Pressure &TemperatureSensors andTransmitters
Quantity (Metric)
200
1. Qualities listed for the Safe Shutdown List are only one third to one half of thosetypically defined as safety related for a U.S. Nuclear Power Plants.
2. For all piping, assume 40% of the quantities shown are hot (design temperature, >80°Cand, therefore, require thermal flexibility analysis and may require the use of constantor variable spring hangers for deadweight and dampers or snubbers to carry seismicloads.
3. Piping and hand operated valve quantities given are for information only. In the U.S.piping and hand operated valves are not included in the Safe Shutdown List becauseprevious evaluations have indicated piping in Nuclear Power Plants including handoperated valves have HCLPF values which exceed 0.5g peak ground acceleration.
87

1 2 99904bTable2.1
TABLE 2
1.
2.
*>
4.
5.
6.
7.
8.
9.
10.
11.
12.
13.
14.
15.
16.
17.
18.
19.
20.
Classes of Safe Shutdown Equipmei
Fans
Air compressors
Battery racks
Battery chargers and inverters
Air handlers
Chillers
Transformers
Vertical pumps
Horizontal pumps
Motor-generators
Motor control centers
Low voltage switchgear
Medium voltage switchgear
Distribution panels
Fluid-operated valves
Motor-operated valves
Engine-generators
Instrument racks
Sensors
Control and instrumentation cabinets
88
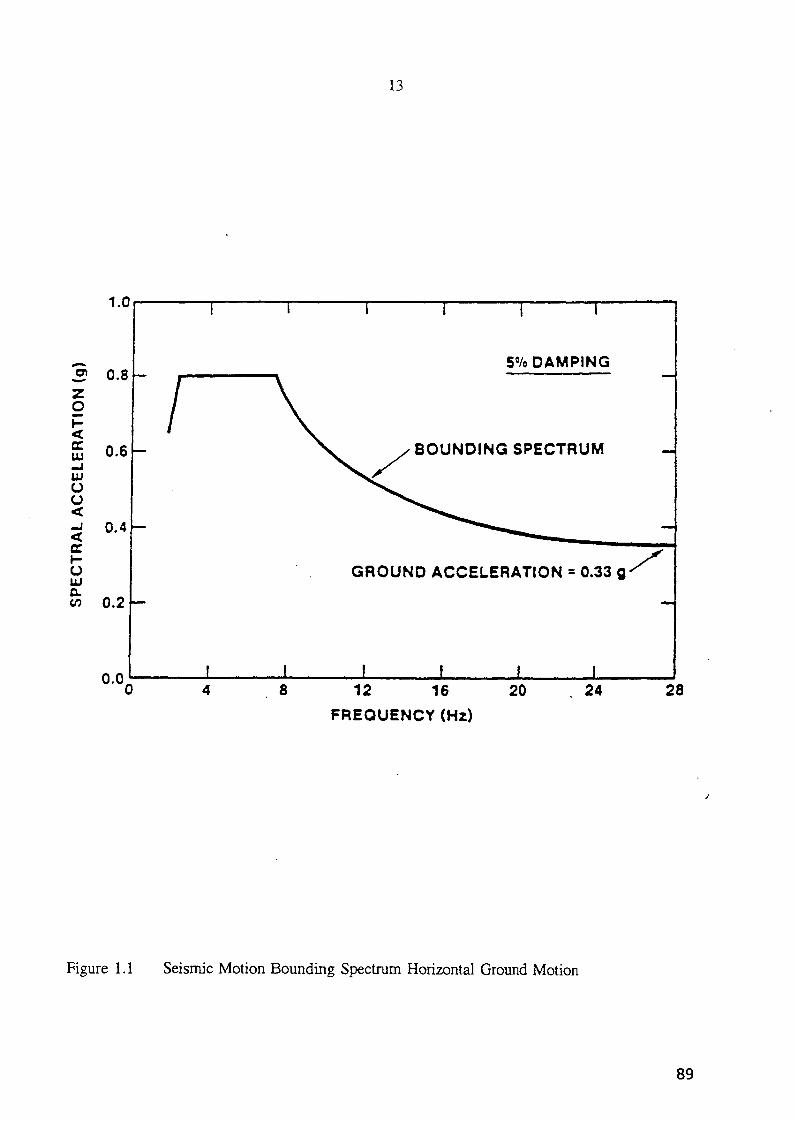
13
1.0
3 0.8zo
£ 0.6UJoo
<a.oUJ
0.4
0.2 -
0.0
5% DAMPING
BOUNDING SPECTRUM
GROUND ACCELERATION = 0.33 g
8 12 16 20
FREQUENCY (Hz)
24 28
Figure 1.1 Seismic Motion Bounding Spectrum Horizontal Ground Motion
89

14
Status Y N U
SCREENING EVALUATION WORK SHEET (SEWS) Sheet 1 of 2
Equip. ID No. Equip. Class 5 - Horizontal Pumps
Equipment Description
Location: Bldg. Floor El. Room, Row/Col
Manufacturer, Model, Etc.
Horsepower/Motor Rating RPM Head Flow Rate
SEISMIC CAPACITY VS DEMAND1. Elevation where equipment receives seismic input2. Elevation of seismic input below about 40' from grade Y N U3. Equipment has fundamental frequency above about 8 Hz Y N U N/A4. Capacity based on: Existing Documentation DOC
Bounding Spectrum BS5. Demand based on: Ground Spectra 6RS
Amplified (Floor) Spectra AFSDoes capacity exceed demand? Y N U
CAVEATS - BOUNDING SPECTRUM1. Equipment is included in earthquake experience
data base Y N U N/A2. Driver and pump connected by rigid base or skid Y N U N/A3. No indication that shaft does not have thrust
restraint in both axial directions Y N U N/A4. No risk of excessive nozzle loads such as gross
pipe motion or differential displacement Y N U N/A5. Base vibration isolators adequate for seismic loads Y N U N/A6. Attached lines (cooling, air, electrical) have
adequate flexibility Y N U N/A7. Anchorage adequate Y N U N/A8. Relays mounted on equipment evaluated Y N U N/A9. No other concerns Y N U N/A
Are the caveats met for Bounding Spectrum? Y N U N/A
ANCHORAGE1. Appropriate equipment characteristics determined
(mass, CG, natural freq., damping, center of rotation) Y N U N/A2. Type of anchorage covered by GIP Y N U N/A3. Sizes and locations of anchors determined Y N U N/A4. Adequacy of anchorage installation evaluated
(weld quality, nuts and washers, expansion anchortightness) Y N U N/A
Figure 2 Typical Seismic Evaluation Work Sheet for Mechanical Equipment
90
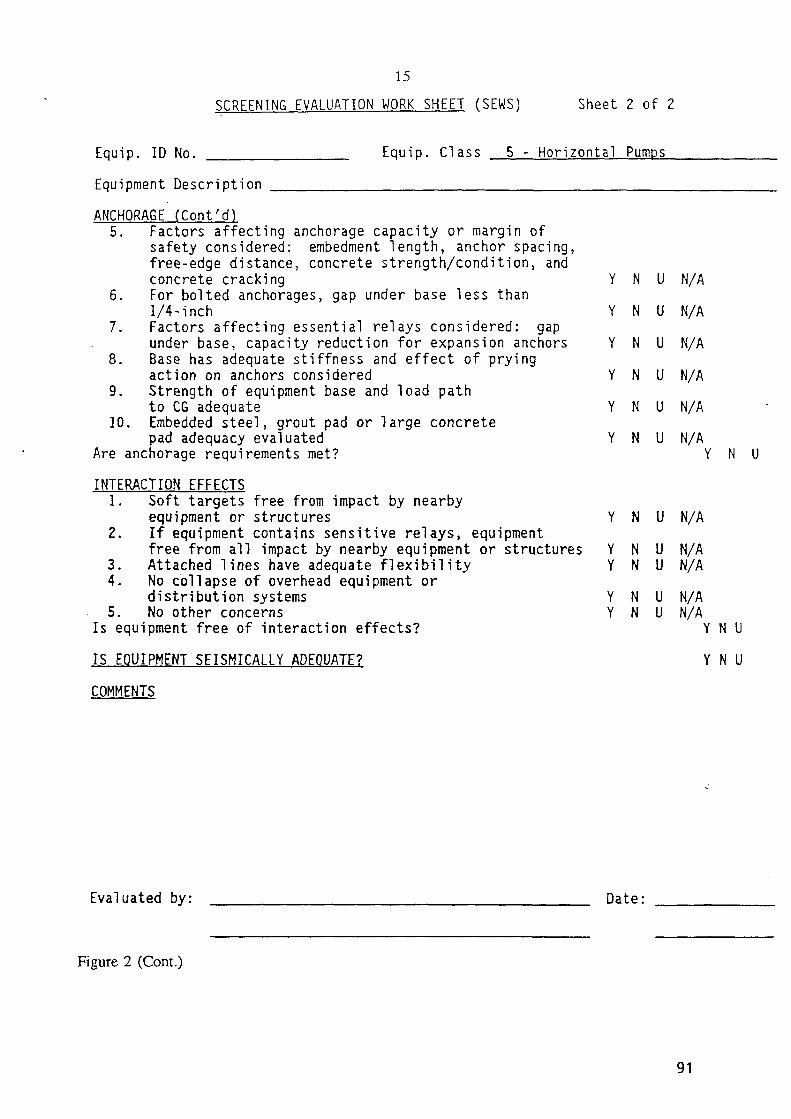
15
SCREENING EVALUATION WORK SHEET (SEWS) Sheet 2 of 2
Equip. ID No. Equip. Class 5 - Horizontal Pumps
Equipment Descript ion
ANCHORAGE (Cont'd)5. Factors affecting anchorage capacity or margin of
safety considered: embedment length, anchor spacing,free-edge distance, concrete strength/condition, andconcrete cracking Y N U N/A
6. For bolted anchorages, gap under base less than1/4-inch Y N U N/A
7. Factors affecting essential relays considered: gapunder base, capacity reduction for expansion anchors Y N U N/A
8. Base has adequate stiffness and effect of pryingaction on anchors considered Y N U N/A
9. Strength of equipment base and load pathto CG adequate Y N U N/A
10. Embedded steel, grout pad or large concretepad adequacy evaluated Y N U N/A
Are anchorage requirements met? Y N U
INTERACTION EFFECTS1. Soft targets free from impact by nearby
equipment or structures Y N U N/A2. If equipment contains sensitive relays, equipment
free from all impact by nearby equipment or structures3. Attached lines have adequate flexibility4. No collapse of overhead equipment or
distribution systems5. No other concerns
Is equipment free of interaction effects?
IS EQUIPMENT SEISMICALLY ADEQUATE? Y N U
COMMENTS
YY
YY
NN
NN
UU
UU
N/AN/A
N/AN/A
Y N U
Evaluated by: Date:
Figure 2 (Cont.)
91

16
SCREENING EVALUATION WORK SHEET (SEWS) Sheet 1 of 2
Equip. ID No. Equip. Class 20 - Instr. & Control Panels & Cabinet
Equipment Description
Location: Bldg. Floor El. Room, Row/Col
Manufacturer, Model, Etc.
SEISMIC CAPACITY VS DEMAND1. Elevation where equipment receives seismic input2. Elevation of seismic input below about 40' from grade3. Equipment has fundamental frequency above about 8 Hz4. Capacity based on: Existing Documentation
Bounding Spectrum5. Demand based on: Ground Spectra
Amplified (Floor) SpectraDoes capacity exceed demand?
CAVEATS - BOUNDING SPECTRUM1. Equipment is included in earthquake experience
data base2. No computers or programmable controllers3. No strip chart recorders4. Steel frame and sheet metal structurally adequate5. Adjacent cabinets or panels which are close enough
to impact, or sections of multi-bay cabinets orpanels, are bolted together if they containessential relays
6. Drawers and equipment on slides restrainedfrom fall ing out
7. All doors secured by latch or fastener8. Attached lines have adequate flexibility9. Anchorage adequate10. Relays mounted on equipment evaluated11. No other concerns
Are the caveats met for Bounding Spectrum? Y N U
ANCHORAGE1. Appropriate equipment characteristics determined
(mass, CG, natural f req . , damping, center of rotation) Y N U N/A2. Type of anchorage covered by GIP Y N U N/A3. Sizes and locations of anchors determined Y N U N/A4. Adequacy of anchorage instal lat ion evaluated
(weld qual i ty , nuts and washers, expansion anchortightness) Y N U N/A
Figure 3 Typical Seismic Evaluation Work Sheet for Electrical Equipment
YYDOCBSGRSAFS
YYYY
Y
YYYYYY
NN
NNNN
N
NNNNNN
UU
uuuu
uuuuuuu
N/A
Y N U
N/AN/AN/AN/A
N/A
N/AN/AN/AN/AN/AN/A
92

17
SCREENING EVALUATION WORK SHEET (SEWS) Sheet 2 o f 2
Equip. ID No. Equip. Class 20 - I n s t r . & Cont ro l Panels & Cabinets
Equipment Desc r ip t i on
ANCHORAGE (Cont'd)5. Factors affecting anchorage capacity or margin of
safety considered: embedment length, anchor spacing,free-edge distance, concrete strength/condition, andconcrete cracking
6. For bolted anchorages, qap under base less than1/4-inch
7. Factors affecting essential relays consiaered: gapunder base, capacity reduction for expansion anchors
8. Base has adequate stiffness and effect of pryingaction on anchors considered
9. Strength of equipment base and load pathto CG adequate
10. Embedded steel, grout pad or large concretepad adequacy evaluated
Are anchorage requirements met?
INTERACTION EFFECTS •1. Soft targets free from impact by nearby
equipment or structures2. If equipment contains sensitive relays, equipment
free from all impact by nearby equipment or structures3. Attached lines have adequate flexibility4. No collapse of overhead equipment or
distribution systems5. No other concerns
Is equipment free of interaction effects?
IS EQUIPMENT SEISMICALLY ADEQUATE?
COMMENTS
Y
Y
Y
Y
Y
Y
N
N
N
N
N
N
U
U
U
U
U
U
N/A
N/A
N/A
N/A
N/A
N/A
YY
YY
NN
NN
UU
UU
Y N U
Y N U N/A
N/AN/A
N/AN/A
Y N U
Y N U
Evaluated by: Date:
Figure 3 (cont.)
NEXT PAGE(S)l«ft BLANK
93
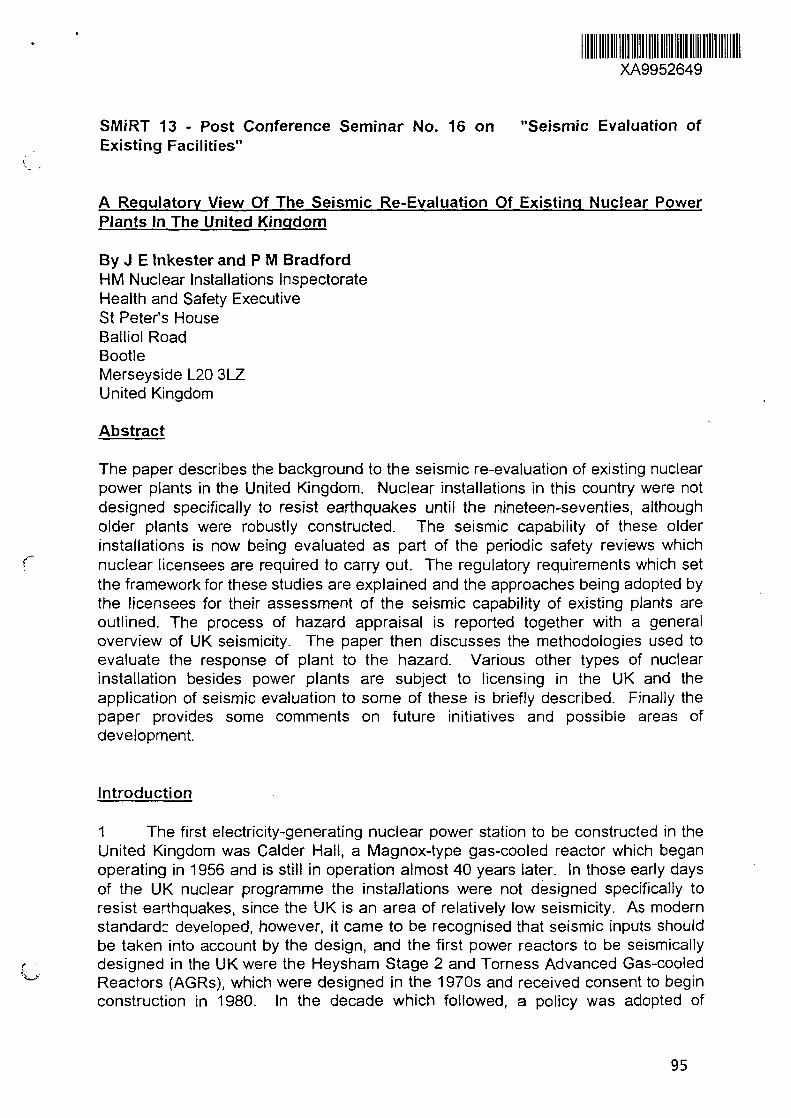
XA9952649
SMiRT 13 - Post Conference Seminar No. 16 on "Seismic Evaluation ofExisting Facilities"
A Regulatory View Of The Seismic Re-Evaluation Of Existing Nuclear PowerPlants In The United Kingdom
By J E Inkester and P M BradfordHM Nuclear Installations InspectorateHealth and Safety ExecutiveSt Peter's HouseBalliol RoadBootleMerseyside L20 3LZUnited Kingdom
Abstract
The paper describes the background to the seismic re-evaluation of existing nuclearpower plants in the United Kingdom. Nuclear installations in this country were notdesigned specifically to resist earthquakes until the nineteen-seventies, althougholder plants were robustly constructed. The seismic capability of these olderinstallations is now being evaluated as part of the periodic safety reviews which
C nuclear licensees are required to carry out. The regulatory requirements which setthe framework for these studies are explained and the approaches being adopted bythe licensees for their assessment of the seismic capability of existing plants areoutlined. The process of hazard appraisal is reported together with a generaloverview of UK seismicity. The paper then discusses the methodologies used toevaluate the response of plant to the hazard. Various other types of nuclearinstallation besides power plants are subject to licensing in the UK and theapplication of seismic evaluation to some of these is briefly described. Finally thepaper provides some comments on future initiatives and possible areas ofdevelopment.
Introduction
1 The first electricity-generating nuclear power station to be constructed in theUnited Kingdom was Calder Hall, a Magnox-type gas-cooled reactor which beganoperating in 1956 and is still in operation almost 40 years later. In those early daysof the UK nuclear programme the installations were not designed specifically toresist earthquakes, since the UK is an area of relatively low seismicity. As modernstandard:: developed, however, it came to be recognised that seismic inputs shouldbe taken into account by the design, and the first power reactors to be seismicallydesigned in the UK were the Heysham Stage 2 and Torness Advanced Gas-cooledReactors (AGRs), which were designed in the 1970s and received consent to beginconstruction in 1980. In the decade which followed, a policy was adopted of
95

reviewing the safety of all UK power reactors for their longer-term operation, and itwas decided to include seismic evaluation, or re-evaluation, in those reviews.
2 This paper describes the history of the approaches and the present positionfor seismic review of existing nuclear power plants. This is reported within thecontext of the overall arrangements for the regulation of nuclear safety in the UK.The evaluation of the seismic capability of such installations is now part of a widerprogramme of periodic safety reviews (PSR) of nuclear power plant. The paperprovides some background to these and explains the criteria used to assess theadequacy of the performance of the plant.
3 There is a wide selection of UK nuclear installations other than powerreactors - for example, nuclear chemical plant - where a similar lack of knowledgeexists regarding the seismic capability of older plant. Brief details are given of oneof the assessment processes used to evaluate such plant.
4 HM Nuclear Installations Inspectorate has now had several years' experienceof assessing seismic safety cases. At the same time, we are aware of similarinitiatives in other countries and have, in fact, had a number of contacts on thissubject, either bilaterally or through conferences, seminars and other meetings,such as those arranged by the IAEA. The present seminar provides a timelyopportunity for the wider sharing of experience of seismic evaluations of existingnuclear installations.
Regulation
5 In the UK the main legislation governing the safety of nuclear installations isthe Health and Safety at Work etc. Act 1974 and the associated relevant statutoryprovisions of the Nuclear Installations Act 1965. Under the Nuclear Installations Actno site may be used for the purpose of installing or operating any commercialnuclear installation unless a nuclear site licence has been granted by the Healthand Safety Executive (HSE) and is for the time being in force. HM NuclearInstallations Inspectorate (Nil) is that part of HSE responsible for administering thislicensing function.
6 The Health and Safety at Work etc. Act requires the provision andmaintenance of plant and systems of work that are, so far as is reasonablypracticable, safe and without risks to health. Another way of expressing this is thatthe risks must be reduced to as low as is reasonably practicable, or ALARP. Thelegislation places the primary responsibility for safety on the operator (i.e. thelicensee) of each installation. It is the duty of Nil to see that appropriate standardsare developed, achieved and maintained by licensees, to ensure that any necessarysafety precautions are taken, and to monitor and regulate the safety of plant bymeans of its powers under the licence and relevant regulations. It should be notedthat this is a non-prescriptive licensing regime and, in the context of seismicevaluation, Nil does not, for example, prescribe the level of input ground motion northe spectral shape to be used.
96

7 The Nuclear Installations Act gives the Nil, on behalf of HSE, the power toattach conditions to each site licence in the interests of safety. There are 35standard licence conditions which are applied to most sites. One of theseconditions requires the licensee to produce "safety cases", which consist ofdocumentation to justify safety during the design, construction, manufacture,commissioning, operation and decommissioning phases of the installation. Anotherlicence condition requires the licensee to carry out a periodic and systematic reviewand reassessment of safety cases. The earliest manifestation of these periodicsafety reviews was the series of Long Term Safety Reviews (LTSR) which werecarried out for the Magnox gas-cooled reactors after they had been operating for 20years. We have, however, moved now to the position where periodic safety reviews(PSR) will be required every ten years, and these have already been carried out forsome Magnox stations operating beyond 30 years and are currently under way forthe AGRs. Seismic evaluation of the installation is one of the topics covered by theLTSRs and PSRs.
Safety Assessment Principles
8 Nil assesses the licensees' safety cases for their adequacy, and HSE haspublished the safety assessment principles (SAPs, Ref. 1) which form the frameworkused by Nil's inspectors in carrying out this work. For natural hazards, it isrecognised that the uncertainty of data may prevent reasonable prediction of designevents for frequencies less than once in 10,000 years and, where this is the case,which is generally considered to apply to earthquakes in the UK, the SAPs call forthe establishment of a design basis event which is conservatively determined at thatfrequency. The plant should then be designed to contain or limit the release ofradioactivity following such a design basis event, such that there should be norelease of radioactivity except in the most severe cases and, even then, no personoutside the site will receive an effective dose of 100 mSv or more.
9 The SAPs are, however, "aimed primarily at the safety assessment ofproposed (new) nuclear plants, but they will also be used in assessing existingplants." The document goes on to say: "For the assessment of plants which existtoday ('old plants') there is a further point to be considered in that the safetystandards used in their design and construction may differ from those used in plantscurrently being designed and built. The existence of such differences has to berecognised by our assessors when applying the SAPs in the assessment of oldplants. The ALARP principle is of particular importance to such assessments, andthe age of the plant and its projected life are important factors to be taken intoaccount when making judgements on the reasonable practicability of makingimprovements to those plants."
10 This implies that standards which are lower than the 'modern' standardsrepresented by the SAPs can be accepted for older plants. But there has to be alimit, and HSE has also published a document entitled "The Tolerability of Risk fromNuclear Power Stations" (Ref. 2), in which it is stated that, "We propose to maintainour existing position that a risk [of death] of 1 in 10" per annum to any member ofthe public is the maximum that should be tolerated from any large industrial plant in
97
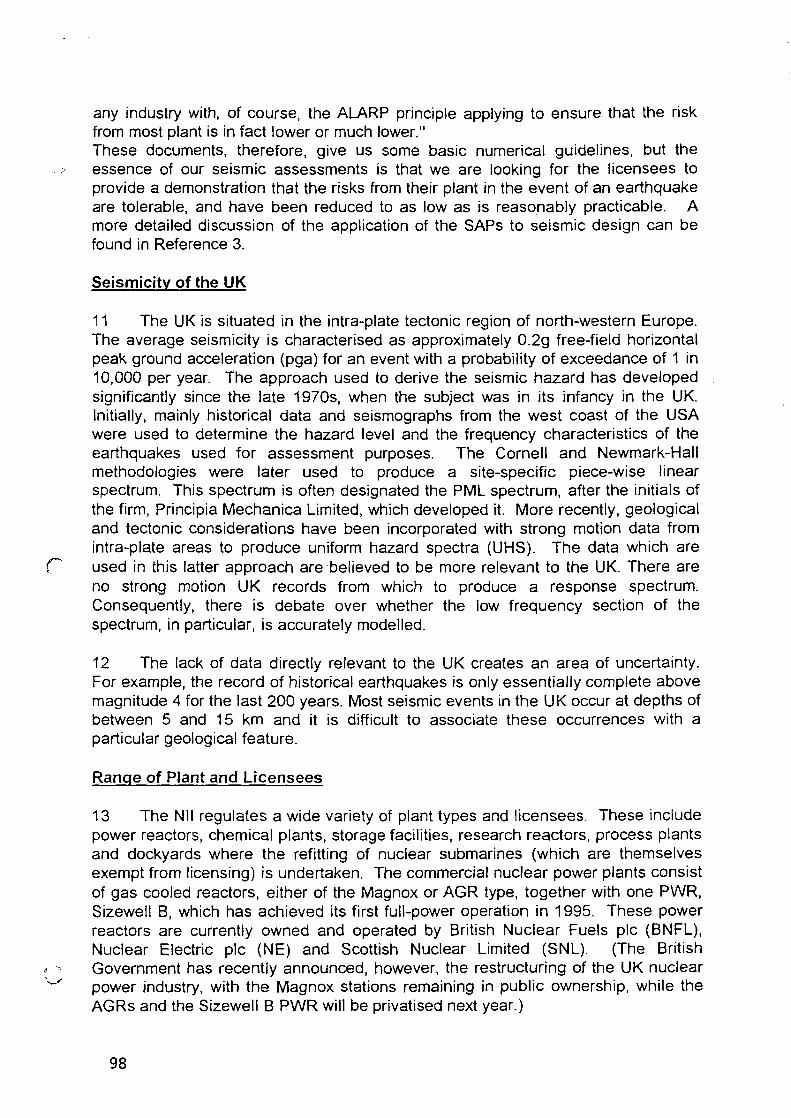
any industry with, of course, the ALARP principle applying to ensure that the riskfrom most plant is in fact lower or much lower."These documents, therefore, give us some basic numerical guidelines, but theessence of our seismic assessments is that we are looking for the licensees toprovide a demonstration that the risks from their plant in the event of an earthquakeare tolerable, and have been reduced to as low as is reasonably practicable. Amore detailed discussion of the application of the SAPs to seismic design can befound in Reference 3.
Seismicity of the UK
11 The UK is situated in the intra-plate tectonic region of north-western Europe.The average seismicity is characterised as approximately 0.2g free-field horizontalpeak ground acceleration (pga) for an event with a probability of exceedance of 1 in10,000 per year. The approach used to derive the seismic hazard has developedsignificantly since the late 1970s, when the subject was in its infancy in the UK.Initially, mainly historical data and seismographs from the west coast of the USAwere used to determine the hazard level and the frequency characteristics of theearthquakes used for assessment purposes. The Cornell and Newmark-Hallmethodologies were later used to produce a site-specific piece-wise linearspectrum. This spectrum is often designated the PML spectrum, after the initials ofthe firm, Principia Mechanica Limited, which developed it. More recently, geologicaland tectonic considerations have been incorporated with strong motion data fromintra-plate areas to produce uniform hazard spectra (UHS). The data which areused in this latter approach are believed to be more relevant to the UK. There areno strong motion UK records from which to produce a response spectrum.Consequently, there is debate over whether the low frequency section of thespectrum, in particular, is accurately modelled.
12 The lack of data directly relevant to the UK creates an area of uncertainty.For example, the record of historical earthquakes is only essentially complete abovemagnitude 4 for the last 200 years. Most seismic events in the UK occur at depths ofbetween 5 and 15 km and it is difficult to associate these occurrences with aparticular geological feature.
Range of Plant and Licensees
13 The Nil regulates a wide variety of plant types and licensees. These includepower reactors, chemical plants, storage facilities, research reactors, process plantsand dockyards where the refitting of nuclear submarines (which are themselvesexempt from licensing) is undertaken. The commercial nuclear power plants consistof gas cooled reactors, either of the Magnox or AGR type, together with one PWR,Sizewell B, which has achieved its first full-power operation in 1995. These powerreactors are currently owned and operated by British Nuclear Fuels pic (BNFL),Nuclear Electric pic (NE) and Scottish Nuclear Limited (SNL). (The BritishGovernment has recently announced, however, the restructuring of the UK nuclearpower industry, with the Magnox stations remaining in public ownership, while theAGRs and the Sizewell B PWR will be privatised next year.)
98

14 As a result of the non-prescriptive nature of the British regulatory system, theapproach to achieving an acceptable level of safety at existing nuclear installationsvaries between the licensees and the different types of plant involved. The last twoAGR stations, Torness and Heysham 2, were seismically designed (although notnecessarily to the same standards that would be applied if they were beingdesigned today). Sizewell B was also seismically designed and closelyapproximates the modern standard. None of these stations has yet reached thedate for its first periodic safety review, so no seismic re-evaluation has yet takenplace. For the older plant, various techniques have been used to attempt to quantifytheir seismic capability. Details of these assessments are given in the followingsections.
Seismic Re-Evaluation Of Existing Plant
Overview of the Programme of Reviews
15 BNFL , SNL and NE have all carried out reviews of older plants. The seismiccapability of each of the Magnox reactors was assessed in its Long Term SafetyReview (LTSR). The purpose of the LTSR programme was to demonstrate that theplants would be adequately safe for at least 30 years operation. (They did nothave a 'design life' as such, but their designers are believed to have envisaged aworking life of 20 to 25 years.) For the Chapelcross and Calder Hall reactors, BNFLused techniques which were developed during the Seismic Damage Assessment(SDA) of reprocessing plant at Sellafield (see below). From the experience gainedin both the LTSRs and SDAs, ways are being developed by the licensees toenhance the methodology of seismic re-evaluation. NE is now carrying out studiesto show that its Magnox reactors are fit for continued operation beyond 30 years andBNFL is doing the same for operation beyond 40 years for Calder Hall andChapelcross. (SNL's Magnox station, Hunterston A, has been closed since its LTSRwas carried out.) NE and SNL have also begun Periodic Safety Reviews (PSRs) oftheir AGR reactors. All these reviews include seismic re-evaluation.
NE and SNL's Maqnox Long Term Safety Reviews
16 When the LTSR programme began it was agreed between Nil and thelicensees that an assessment against a 0.1g earthquake should be performed. Aconsideration in choosing this level was undoubtedly that the IAEA guidance for thesiting of new nuclear power plants (Ref. 4) recommends that, regardless of anylower apparent exposure to seismic hazard, all plants should adopt a minimumvalue of 0.1 g peak ground acceleration. Thus, although the LTSR programme wasfor existing power plants, a certain consistency would be achieved.
17 The LTSR assessments therefore used a ground motion defined by a 0.1ghorizontal pga and the PML response spectrum. The intention was to establish thatthe major structures and the plant used to shut down the reactor, remove decay heatand maintain negative reactivity could survive this motion, and to use thisinformation as a basis for deciding whether the stations were acceptably safe. Theassessment should also identify any improvements which were reasonably
99

practicable, which might include improvements giving a capability well beyond 0.1g.Plant improvements have indeed resulted from these reviews, including such thingsas better restraint of electrical equipment and the installation of tertiary boiler feedsystems for decay heat removal.
BNFL's Seismic Damage Assessment
18 BNFL has a wide variety of plants ranging from reactors to reprocessingfacilities, most of which did not cater specifically for resistance to earthquakes intheir design. A seismic damage assessment (SDA) was carried out for the chemicalplant at Sellafield, firstly to identify the potential for improvements to the robustnessof the installations, and secondly to allow preparation of emergency plans for copingwith the consequences of an earthquake. The SDA predicted the likely plantperformance at 0.125g, 0.25g, and 0.35g pga (PML spectrum). The 'walkdown'methodology developed in the USA was also used. Many of the techniques in theEPRI methodology for the conservative deterministic failure margin (CDFM) (Ref. 5)were employed. The SDA aimed, however, to provide only a slightly conservative,best estimate of the plant performance and therefore did not actually comply with allthe CDFM criteria. For their reactors, BNFL adopted a two-stage methodology. Allsafety-related plant was shown to be capable of surviving a 0.125g pga event (PMLspectrum) and a subset of 'plant essential to safety' one of 0.2g pga.
AGR Periodic Safety Reviews
Safety strategy
19 NE and SNL have recently embarked on a periodic safety review (PSR)programme for their AGRs. They have proposed the following policy for the integrityof protection:-
(a) For any frequent initiating event (more frequent than 10~3 per annum) thereshould normally be at least two lines of protection to perform any essential function,with diversity between each line;
(b) For any infrequent initiating event (less than or equal to 10"3 per annum) thereshould be at least one line of protection to perform any essential function, and thatline should be provided with redundancy.
Input motion specification
20 NE and SNL have stated that, for the seismic safety case, the magnitude ofthe infrequent initiating event should correspond to a severity consistent with areturn frequency of 10"4 per annum at the site. The appraisal will examine allessential structures and a single line of protection (including redundancy) to trip,shutdown and cool the reactor. The systems involved have been designated 'thebottom line plant'.
21 The plant which will provide a diverse means of achieving trip, shutdown andpost trip cooling against frequent events is called the 'second line plant'. The ground
100

motion specification for the frequent initiating event is 0.1g pga and the PMLresponse spectrum appropriate to the site conditions.
22 Plant whose failure could threaten the defined lines of protection is known as'related plant'. It will be assessed to the same level as the plant which it couldthreaten.
23 For the first AGRs to be reviewed, Hinkley Point B and Hunterston B, the'bottom line plant' assessment ground motion has been pragmatically agreed as thePML hard ground spectrum anchored at 0.14g pga. Since this spectrum envelopescompletely the claimed expected 10"4 UHS for Hunterston, and matches that forHinkley Point closely at the frequencies of most practical importance (1 to 8 Hz), NEand SNL consider this to be a surrogate for a level of ground motion with anexpected probability of exceedance of 10"4 per year. Nil will give consideration tothis claim when the relevant reports are received for assessment. In subsequentreviews of AGRs, NE intends to provide a uniform hazard spectrum (UHS) for eachsite at the expected confidence level, with a probability of exceedance of 1 in10,000 per year. Discussions are ongoing between the Nil and NE as to whetherthe UHS that they propose are an adequate representation of a 10"4 per year event.
Seismic re-evaluation methodology
24 Building response to the input ground motions will be determined usingestablished modelling techniques and soil structure interaction. This will enable
f~" secondary response spectra to be generated for use in plant analyses. Twoapproaches will be used for plant assessment : analysis and 'walkdown1. The'walkdown1 will make use of the SQUG Generic Implementation Procedure (Ref. 6)and its associated caveats when using earthquake experience data. Analysis willbe used whenever the walkdown approach is not applicable or fails to demonstratethat the item can withstand the earthquake. The capacity of the structure and plantitems will be determined using design code allowable stresses, strains anddeflections in the first instance. Should the determined capacity be inadequate forthe proposed functional requirement more detailed calculations may be carried outallowing limited but tolerable damage or inelasticity.
25 NE and SNL believe that the above process is robust. The system caters foruncertainty by specifying an expected level of site specific input motion(approximately 60% confidence level), a median or slightly conservative evaluationof the structure's response and the determination of the plant's capacity using codeallowables where possible. The licensees have offered to carry out limitedsensitivity studies and to document margins above assessment levels in order toprovide Nil with confidence in the methodology.
Maqnox Periodic Safety Reviews
/-> 26 To establish that the Magnox plants can continue operating safely beyond 30years (and beyond 40 years in the case of Calder Hall and Chapelcross), MagnoxPSRs are being carried out as a development of the LTSR programme. Althoughtwo of NE's Magnox stations, Bradwell and Hinkley Point A, have already been
101

cleared for operation beyond 30 years, the methodology continues to be developed.Nil has requested that the licensees' PSRs should show that the 'bottom line plant1
has a safety margin beyond the capacity which was demonstrated in the LTSRagainst an earthquake ground motion defined by the PML response spectrumanchored to 0.1 g pga.
27 At the present time the method of achieving this requirement is still underdiscussion with NE. However, NE has proposed to demonstrate that a single line ofprotection exists against the 10"4 per annum seismic event in an essentially similarbut perhaps simplified manner to that for the AGR PSR. NE have suggested thatthe ground motion input should be a UHS.
Regulatory View of PSR Approach Adopted by Licensees
28 The continuing development by the licensees of the methodology for theevaluation of nuclear plant which originally had no designed seismic capability iswelcomed. The identification of the 'bottom line plant' and its assessment at theseismic input levels proposed, backed up by the 'second line plant1 at a lower level,should at least enable a judgement to be made that the risks from the plant in theevent of an earthquake are tolerable. Sensitivity analyses will provide additionalconfidence. An appraisal of the margins that exist in the seismic capability of theplant assessed against these events should permit an argument to be developedthat the risks have been reduced to as low as is reasonably practicable. This mayentail actual plant improvements. Any weak links in items of plant or structure whichmight cause failure to provide their functional requirements during an earthquakeshould be identified by this process. If numerical margins are determined, theseplant items may then be ranked so as to identify areas where strengthening woulddecrease risk most effectively. Care must be taken that comparisons betweenmargins are meaningful, e.g. the calculations should be made on the same basis.Additional confidence could be obtained that the risk from the seismic hazard is atan appropriate level if seismic probabilistic risk assessments are carried out. Bycomparing the seismic risk to the risk from other classes of hazard more effectivestrengthening of the safety case can be carried out as necessary. At present there islimited expertise in this field within the UK, and this is an area for furtherdevelopment.
Future Developments
29 BNFL, NE, SNL and the UK Atomic Energy Authority have established aNuclear Industry Group on Seismic Methodology, which is reviewing current issuesin seismic assessment. This group provides a useful focus for developing thesubject within the UK nuclear industry, and Nil is in regular contact with itsmembers. The group considers all hazard or design matters which are commonacross the industry, and part c* its current programme involves the assessment ofexisting plant. It has decided to consider the introduction of a generic methodologydocument with respect to design and assessment criteria for both reactors andchemical plants. It is also arranging for two pilot studies to be carried out on seismicprobabilistic safety assessment, one on a reactor plant and one on a nuclearchemical plant. Nil looks forward to discussing the results with the group.
102

30 The Nil will continue to maintain a 'watching brief on developments inseismic assessment in other countries. As part of this, we recently invited twoAmerican consultants to the UK to bring us up to date on progress in the USA. Theyvisited briefly a number of nuclear installations and provided information on'walkdowns1, seismic re-evaluation approaches and simplified seismic PRA. Thisknowledge was shared with the majority of the licensees in the UK, thus providingthem with the opportunity to follow up on some of the techniques for use in theirprogrammes of seismic assessment.
31 The UK has a fairly large nuclear safety research programme. Some of theresearch is co-ordinated under the auspices of the Health and Safety Commissionand is managed by the nuclear industry in consultation with Nil through a series oftechnical working groups (TWGs). The programme provides for safety issues to beraised by Nil for research to be contracted out to consultants and researchestablishments by the licensees. The TWG on external hazards currently managestwo research projects which have direct relevance to the seismic assessment ofexisting structures. The first project deals with the seismic performance of masonrypanels, which often carry essential systems, or have the potential to damageessential plant if they collapse. The second project is reviewing the work carried outin the USA on seismic PRA and determining its applicability to UK plant. Aninvestigation is also being carried out by one of the licensees into the applicability ofAmerican experience data for UK equipment, the results of which will be madeavailable through this programme.
32 Additionally, Nil has an extramural support budget, which is used mainly tobuy in specialist advice on a consultancy basis, but which can also provide themeans to take part in international collaborations. One such project in which we arecurrently involved is the Seismic Shear Wall ISP (international standard problem)being co-ordinated by the OECD's Nuclear Energy Agency.
Conclusion
33 The non-prescriptive nature of the UK nuclear regulatory system has allowedthe licensees to adopt a variety of approaches to the seismic re-evaluation of theirplant, much of which was constructed before seismic inputs were specificallyconsidered at the design stage in this country. This flexibility has catered for thewide range of types of nuclear installation and the variety of nuclear licensees.Many of the techniques and methodologies used have been developed from, orhave some parallels with, approaches used in the USA. The evaluation processesare still being developed for their application to British plant and there appears to bea move towards consensus among the licensees on the approaches to be adopted.
34 The reviews carried out to date are judged to have allowed the licensees toshow that the risks from their plant in the event of an earthquake are tolerable, andhave gone some way to showing they are also as low as is reasonably practicable.There is, however, room for further development particularly on the latter point asthe techniques become more sophisticated. The reviews currently in progressshould improve our understanding of seismic margins.
103

c
Acknowledgement
35 The authors wish to thank the Chief Inspector of Nuclear Installations of theHealth and Safety Executive for permission to publish this paper. The viewsexpressed are those of the authors, and do not necessarily represent those of theInspectorate.
References
1. Health and Safety Executive, Safety Assessment Principles for NuclearPlants, HMSO, London 1992, ISBN 0-11-882043-5.
2. Health and Safety Executive, The Tolerability of Risk from Nuclear PowerStations, HMSO, London 1992, ISBN 0-11-886368-1.
3. Bye R., Inkester J. and Patchett C , A regulatory view of uncertainty andconservatism in the seismic design of nuclear power and chemical plant, Nucl.Energy, 1993, 32, No. 4, Aug., 235-240.
4. International Atomic Energy Agency, Earthquakes and Associated Topics inRelation to Nuclear Power Plant Siting, A Safety Guide, Safety Series No.50-SG-S1 (Rev. 1), IAEA Vienna, 1991.
5. EPRI (Electric Power Research Institute) NP-6041 'A Methodology forAssessment of Nuclear Power Plant Seismic Margin1 Project 2722-1, October 1988.
6. 'Generic Implementation Procedure (GIP) for Seismic Verification of NuclearPlant Equipment', SQUG, Revision 2A, March 1993.
104

d/5) XA9952650
PROCEEDINGS OF SMIRT13 - POST CONFERENCE SI-MINAR 16SEISMIC EVALUA TION OF EXISTING NUCLEAR FACILITIES
SEISMIC RE-EVA LUA TION OF FRENCH NUCLEAR POWER PLANTS
R. ANDRIEUElectricite de France, Direction de I'Equipement, CLI, France
ABSTRACT : After a presentation of the seismic inputs which have been taken into account inthe design of the French Nuclear Power Plants, the re-assessed values of these inputs areshown. Some considerations about the specificity of the French PWR program with regard tothe standardisation of plants are given together with the present objectives of seismic re-evaluations. Finally the main results of the seismic re-analysis being performed for the PhenixFast Reactor are considered.
SEISMIC INPUT ASSESSMENT
Since the start, in the seventies, of the extensive French PWR program the anti-seismicrules for French NPP's have been established progressively following a pragmatic approachrelying on experience gained through analysis of proposals made in the course of the licensingprocedures of the earliest plants. For example the notion of site related design spectra was notconsidered before 1978. Before this date studies were performed using correlation betweenintensity and maximum ground acceleration ( 0.1 g for VII MSK and 0.2 g for VIII MSK). Theregulatory document RFS l-2c (Fundamental Safety Rule : " Calculation of seismic motionsto be considered in safety analysis ") was only issued in October 1981. As far as re-analysis ofexisting plants is concerned, the approach is similar and the process of gaining experience fromactual cases is still underway.
The attached table 1 indicates the SSE levels which have initially been considered for thevarious plants still operating, taking into account standardisation. For CPY type of NPP'sstandard spectra was EDF 7.73 scaled at 0.2 g ZPA for all standardised buildings ; For P4, P'4and N4 type of NPP's standard spectra was NRC (RG 1.60) scaled at 0.15 g. It should benoticed that the seismic input taken into consideration in the original design has sometimesbeen modified during the construction due to complementary studies, and thus assumptionsmay differ on one site depending on the building considered. This is in particular the case forPaluel NPP where standardised pumping station rafts were designed for an EDF spectra scaledat 0.2 g before the decision to standardise the applicable spectra which became NRC 0.15 gand was used for the remaining standardised buildings. The values given in this table are thefinal values at the design stage (for horizontal movements).
105

(2/5)
For the first built reactors an overall review has already been done including a re-analysisof earthquake hazard at the site which considers the most recent data available on seismicityand tectonics. The corresponding up-dated ground response spectra are shown, when differentfrom the original ones.
Following this re-evaluation of the seismic input the site spectra was not in some casesenveloped for all frequencies by the design spectra. For these plants verification of the seismicbehaviour has been performed, when considered necessary and on a case by case basis, takinginto account the margin in the corresponding frequency domain (if any) due in particular to theratio between MHPE and SSE. Safety margins have been included in each step of design, buthave not yet been clearly evaluated. This is particularly the case of most of the components forwhich according to codes, the design is controlled by the French equivalent to OBE (halfSSE). These design-oriented rules are inadequate for re-analysis purposes. Furthermore onehas to keep in mind the French standardisation of plants, (implying for example soil-structureinteraction to be made for a large variety of soil conditions), which leads to increased margins.
For examples St Alban NPP, for which safety related site buildings, which were initiallydesigned for EDF 0.1 g peak ground acceleration, have been verified for NRC 0.13 g ;Tricastin NPP was initially designed for an EDF spectra scaled at 0.2 g which was revised to asite spectra DSN 0.3 g for which analyses of the behaviour of buildings and components havenot shown any necessity to modify the design. Concerning Cruas NPP, EDF made very quicklythe decision to install anti-seismic bearings on the raft of the reactor building, as discussions ledto the proposal of a site spectra DSN scaled at 0.3 g, instead of the initial EDF 0.2 g. ThisDSN 0.3 g was used for the design of safety related site buildings and for the verification ofstandardised buildings.
For Creys-Malville Fast Breeder Reactor the initial studies concluded that the plantshould be designed with a design spectrum EDF 0.1 g (corresponding to SSE intensity VIIMSK, but for reasons of homogeneity with the CPY types of PWR plants, it was decided toadd margin and to design the plant with a design spectrum EDF 0.2 g. This appeared to be theright decision as according to the later decrees the MHPE was re-evaluated to VI-VII MSK,thus confirming the use of this design value.
SEISMIC RE-ANALYSIS PROGRAM
Following these revised ground spectra, although no specific regulations on seismicsafety evaluation of existing plants have been issued so far, and the discussions with the FrenchSafety Authorities on this topic have not yet been finalised, some actions have already beenundertaken :
- For each specific plant or standardised type of plant a collection of floor responsespectra per building and per level has been drawn. It includes those initially used in design(when existing) and a complete set of calculated response spectra with the revised seismicinput (if necessary). Attention has been drawn to the consistency of the spectra between thevarious components and building design studies and discrepancies clarified. This new set offloor response spectra should be considered when designing new equipment or structuresthrough a procedure under discussion as it may differ considerably from the initial data.
106

(3/5)
- An updated version of the regulatory document RFS l-2c is being discussed with theFrench Safety Authorities. It may lead to some modifications related to the consideration ofsite effects, and to calculation methods for soil movements.
- Recent legislation and technical rules for anti-seismic design outside nuclear field havebeen published. Their applicability is being studied with regards to their possible consequenceson NPP design.
- Walk-downs have been performed on Bugey 2-3 and Fessenheim 1-2 NPP's in orderto identify the components which are not seismic resistant and may affect safety components.During these walk-downs report forms have been established which specify the type of actionto follow (on site fittings or complementary studies). As far as necessary improvement ofdesign is being studied in particular for increasing rigidity of metallic platforms and for re-qualification of component anchorages. Implementation of the corresponding upgradingmeasures is planned to be performed during the second ten-year outages (starting 1999). It isalso presently considered to complete these walk-downs with instrumentation lines walk-downs (which were not initially checked) and to extend the procedure to the CPY types ofNPP's.
- Data bases are being established for each plant with consideration of all seismicrelated data (characteristics of soil, characteristics of structures, modelling and calculationmethods used, floor response spectra, qualification spectra, tests...).
- It is intended to perform for one plant of 900 MW series a Seismic MarginAssessment based on EPRI recommendations in order to estimate applicability of existing databases to French NPP with the following objectives :
- identification of elements for which design rules and qualification methods bringsubstantial margins,- identification of elements for which available data are not sufficient to determineexistence of margins,- to make specific studies for this second category of elements
SEISMIC RE-ASSESSMENT OF PHENIX NPP
As far as Fast Breeder Reactors are concerned, a seismic re-evaluation of Marcoule(Phenix) NPP has been undertaken. This plant, mainly composed of steelworks structures,except Reactor Building wich is made of prestressed concrete, was built according to theexisting regulations of that period (sixties) without specific requirements due to NPP's exceptthat the plant should operate after an earthquake of intensity VII MSK, and radioactive releaseshould be prevented up to VIII MSK. According to the re-evaluation the MHPE is VII-VIIIMSK, which leads to considering distant earthquakes at an EDF spectra scaled to 0.15 g peakground acceleration and according to RFS l-2c spectrum for close earthquake scaled at 0.2 g.
Seismic calculations have been performed this year using recent calculation methodsincluding modelisation of soil-structure interaction, modal analysis and spectral analysis.Stresses have been calculated using 2D anJ 3Dmodel (Hercule).
The results of these studies are as follows:
- For the Handling Building which is made of concrete for the lower levels and steelworks from 8 to 34 m high with precast concrete wall facing, the calculated values showed
107

(4/5)
acceleration 3 to 4.5 times higher than those of the initial design. Though the behaviour of theconcrete levels is satisfactory this leads to the necessity of complementary bracing frames andreinforcement of facing panels by sprayed concrete, which has to be strongly connected to theexisting structure.
- For the Steam Generator Building which consists of a 34 m high steelworks structureon a concrete basement calculations performed for both input (EDF 0.15 g and RFS 0.2 g)showed that the EDF spectra was more severe (due to a different shape) and that somemembers were overloaded by 4 times the admissible values. Some reinforcement will benecessary even when considering behaviour coefficients.
The re-assessment of Phenix NPP is still underway and the final upgrading measures areat present being designed.
CONCLUSION
A seismic re-assessment program is still under evaluation in France. Many actions havebeen undertaken in order to assess the existing state of the oldest plants with regards to theirseismic resistance, but the way these studies have to be completed or used remains to bediscussed with the French Safety Authorities, as specific regulations about seismic safety re-analysis of existing plants have not yet been issued in France.
REFERENCES
J. Betbeder-Matibet and B. Mohammadioun (1986) : Current Practice and Future Trends forSeismic Design and Analysis of French Nuclear Power Plants, Paper presented in theSpecialist Meeting Earthquake Ground Motion and Anti-Seismic Evaluation of NuclearPower Plants, Moscow, March 24-28, 1986.
J. Betbeder-Matibet and P. Labbe (1990) : Simplified Seismic Analysis Methods in France,Nuclear Engineering and Design 123, pp 305-312.
J. Betbeder-Matibet and B. Mohammadioun (1991): Seismic Re-assessment of French NuclearPower Plants, Paper presented in the AIEA Meeting Seismic Evaluation of Existing NuclearPower Plants, Tokyo, August 26-29, 1991.
GLOSSARY
CPY : Pressurised Water Reactor type 900 MW,DSN : Division Surete Nucteaire (Safety Authorities),FBR : Fast Breeder Reactor,MHPE : Maximum Historically Probable Earthquake,N4 : Pressurised Water Reactor type 1400 MW,NRC : US Nuclear Regulatory Commission,OBE : Operating Basis Earthquake,P4 : Pressurised Water Reactor type 1300 MW first generation,P'4 : Pressurised Water Reactor type 1300 MW second generation,RFS : Fundamental Safety Rule, (French Republic, ministry of industry),
108
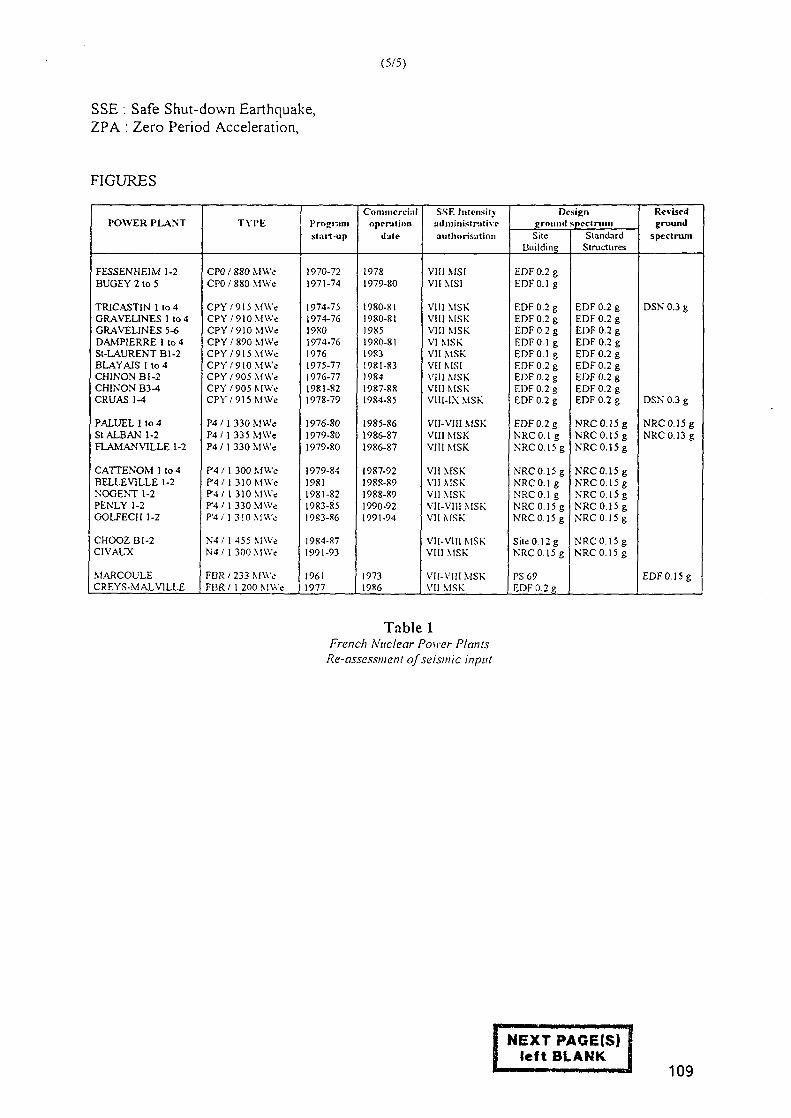
(5/5)
SSE : Safe Shut-down Earthquake,ZPA : Zero Period Acceleration,
FIGURES
POWER PLANT
FESSENHEIM 1-2BUGEY 2 to 5
TRICASTIN 1 to 4GRAVELINES 1 to 4GRAVEUNES 5-6DAMP1ERRE 1 to 4St-LAURENT Bl-2BLAYAIS 1 to 4CHINONBI-2CHINON B3-4CRUAS 1-4
PALUEL 1 to 4St ALB AN 1-2FLAMANVILLE 1-2
CATTENOM 1 to 4BELLEVILLE 1-2NOGENT 1-2PENLY 1-2GOLFECH 1-2
CHOOZB1-2C1VAUX
MARCOL'LECREYS-MALV1LLE
TYPE
CPO / 880 MWeCPO / 880 MWe
CPY/915 MWeCPY/910 MWeCPY/910 MWeCPY / 890 MWeCPY/915 MWeCPY/910 MWeCPY / 905 MWeCPY/905 MWeCPY/915 MWe
P4 / 1 330 MWeP4/1 335 MWeP4 /1 330 MWe
P4 / 1 300 MWeP4/ 1 310 MWeF4/ 1 310 MWeP4/ 1 330 MWeP-4/I 310 MWe
N4 / 1 -455 MWeN4 / 1 300 MWe
FBR / 233 MWeFBR / 1 200 MWe
Programstart-up
1970-721971-74
1974-751974-7619801974-7619761975-771976-771981-821978-79
1976-801979-801979-80
1979-8419811981-821983-851983-86
1984-871991-93
19611977
Commercialoperation
dute
19781979-80
1980-811980-8!19851980-8119831981-8319841987-881984-85
1985-861986-871986-87
1987-92198S-891988-891990-921991-94
19731986
SSF. Intensityadministrcitiveauthorisation
VIII MSIVII MSI
VIII MSKVIII MSKVIII MSKVI MSKVII MSKVII MSIVIII MSKVIII MSKVIII-IXMSK
VII-VIII MSKVIII MSKVIII MSK
VII MSKVI) MSKVII MSKVII-VI1I MSKVII MSK
VII-VIIIMSKVIII MSK
VII-VIII MSKVII MSK
Ocsignground spectrumSite
Building
EDF0.2gEDFO.lg
F.DF 0.2 gEDF0.2gEDF0.2gF.DF 0.1 gEDF0.1 gF.DF 0.2 gEDF0.2gEOF 0.2 gEDF0.2g
EDF0.2gNRCO.lgNRC0.l5g
NRC0.I5gNRC0.1 gNRC0.1 gNRC0.15gNRC 0.15 g
Site 0.12 gNRC0.15g
PS 69EDF 0.2 g
StandardStructures
EDF 0.2 gEDF 0.2 gEDF 0.2 gEDF 0.2 gEDF 0.2 gEDF 0.2 gEDF 0.2 gEDF 0.2 gEDF 0.2 g
NRC0.15gNRC0.15gNRC 0.15 g
NRC 0.15 gKRC0.15gNRCO.lSgNRC 0.15 gNRC 0.15 g
NRC0.15gNRCO.lSg
Revisedground
spectrum
DSN 0.3 g
DSN 0.3 g
NRC 0.15 gNRC 0.13 g
EDFO.lSg
Table 1French Nuclear Power Plants
Re-assessment of seismic input
NEXT PAGE(S)left BLANK
109

XA9952651
NUCLEAR POWER PLANTSSEISMIC REVIEW PROGRAMME IN SPAIN.
Consejo de Seguridad Nuclear
Area de Emplazamientos
J. G. Sanchez Cabanero
A. Jimenez Juan
111

ACRONYMS
CSNConsejo de Seguridad Nuclear
CDFCore Damage Frecuency
EPRIElectrical Power Research Institute
EQEEarthquake Engineering
HCLPFHigh Confidence of Low Probability of Failure
IPEEEIndividual Plant Examination of External Events
LLNLLawrence Livermore National Laboratory
USNRCUnited States Nuclear Regulatory Commission
PEDPermiso de Explotacion Definitivo (Final Operational Permit)
PSAProbabilistic Safety Analysis
PRAProbabilistic Risk Assessment
RLEReview Level Earthquake
SMMSeismic Margin Methodology
SSESafe Shutdown Earthquake
USIUnresolved Safety Issue
112
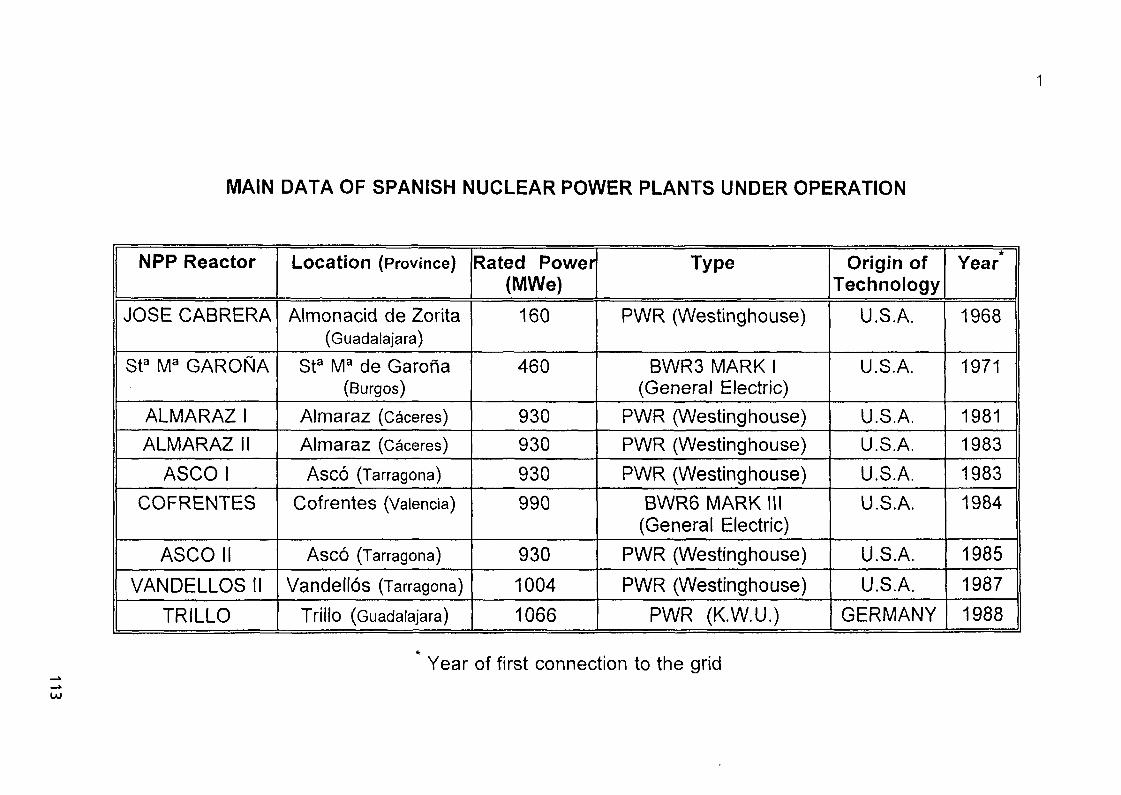
MAIN DATA OF SPANISH NUCLEAR POWER PLANTS UNDER OPERATION
NPP Reactor
JOSE CABRERA
Sta Ma GARONA
ALMARAZ1
ALMARAZ II
ASCOICOFRENTES
ASCO II
VANDELLOS II
TRILLO
Location (Province)
Almonacid de Zorita(Guadalajara)
Sta Ma de Garona(Burgos)
Almaraz (Caceres)
Almaraz (Caceres)
Asco (Tarragona)
Cofrentes (Valencia)
Asco (Tarragona)
Vandellos (Tarragona)
Trillo (Guadalajara)
Rated Power(MWe)
160
460
930
930
930
990
930
1004
1066
Type
PWR (Westinghouse)
BWR3 MARK I(General Electric)
PWR (Westinghouse)
PWR (Westinghouse)
PWR (Westinghouse)
BWR6 MARK III(General Electric)
PWR (Westinghouse)
PWR (Westinghouse)
PWR (K.W.U.)
Origin ofTechnology
U.S.A.
U.S.A.
U.S.A.
U.S.A.
U.S.A.
U.S.A.
U.S.A.
U.S.A.
GERMANY
Year*
1968
1971
1981
1983
1983
1984
1985
1987
1988
Year of first connection to the grid
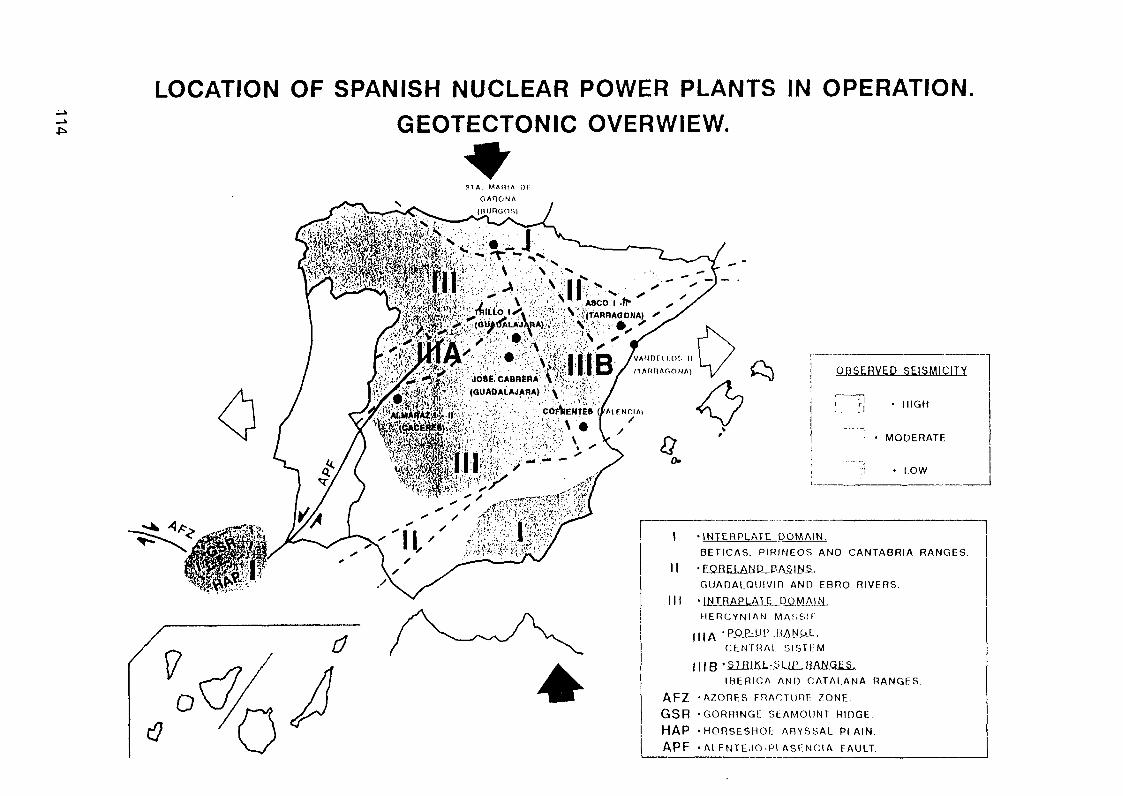
LOCATION OF SPANISH NUCLEAR POWER PLANTS IN OPERATION.GEOTECTONIC OVERWIEW.
otf
SI A MAMIA
GAHOUA
}:MU•%m&b iSA,mmm
&?.
;l$
WA
0
K .
sW!
!•'**( fy\
^K:
•>*»
Svl;
' (AUAIJALAJXRA)
i • • • . . . . » -
. • i j - • ' . • . • • • »
JO86 CABRERA
(aUAOALAJAflA) '
f %
•V.i'l. • • N I
'•* ;';'• V" ' '
^ —
,A«CO 1 -fr x ^
j |JT% /vANDril.Oi. II| . | E } / OAHnAGONA)
' • ! ; ' • . ' • • /
. $ • ' • - • " • /
A" - • /• s ' . . . ' . .• •• . . ;• , • ' •. - " • ' * v i • ' X
:'.,u'>"-1. ''•• ;• "'. C O A E N T E * (f Aif.NoiAi
•-, \ \ : ' • ' ' • ' • • '•• '('' : - - » ' ' ' '
^OBSERVED 5EISMICITV
^ an?y&
-'/':F
• HIGH
MODERATE
• LOW
II •1NTERPLATE DOMAIN,
BETICAS. PIRINEOS AND CANTABRIA RANGES.
• FORELAND BASINS.
GUADALQUIVIR AND EBRO RIVERS.
• INTRAPLATE DOMAIN,HERCYNIAN MASSH"
CENTRAL SISTLM.
I I IB' lIBERICA AND CATALANA RANGES.
A F Z -AZORES FRACTURE ZONE
G S R 'GORRINGE SLAMOUNT RIDGE.
H A P -HORSESHOr: ABYSSAL PLAIN.
A P F • ALENTEJO-Pl.ASENCIA FAULT.
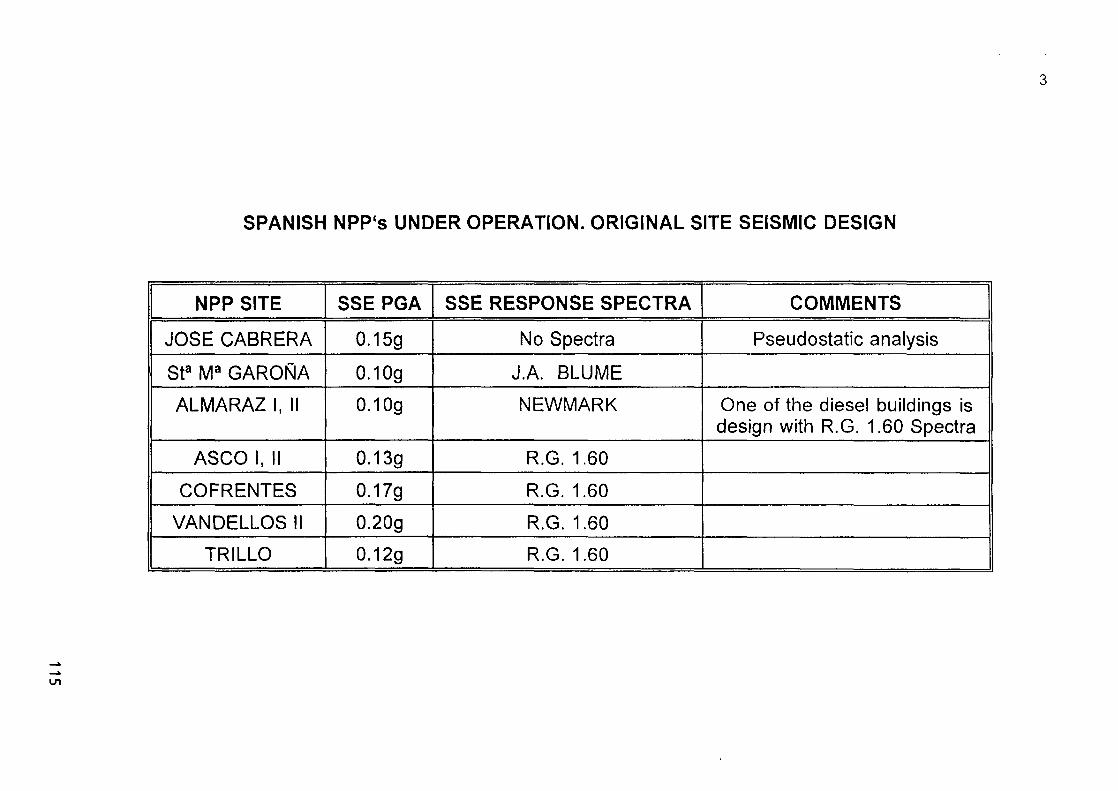
SPANISH NPP's UNDER OPERATION. ORIGINAL SITE SEISMIC DESIGN
NPP SITE
JOSE CABRERA
Sta Ma GARONA
ALMARAZ 1, II
ASCO 1, II
COFRENTES
VANDELLOS II
TRILLO
SSE PGA
0.15g
0.1 Og
0.10g
0.13g
0.17g
0.20g
0.12g
SSE RESPONSE SPECTRA
No Spectra
J.A. BLUME
NEWMARK
R.G. 1.60
R.G. 1.60
R.G. 1.60
R.G. 1.60
COMMENTS
Pseudostatic analysis
One of the diesel buildings isdesign with R.G. 1.60 Spectra

RE-EVALUATION OF NPP WITH "EARLY" SEISMIC DESIGN("Early" means licensed before 12.13.73, the efective publication of 10CFR100)
SEP PROGRAM.
o The seismic re-evaluation for Sta Ma de Garona and Jose Cabrera plants wasdeveloped according to USNRC SEP and USI-A46 methodologies (deterministicapproach).
Related to PED
o There is ongoing a seismic re-evaluation for Almaraz plant according to USA10CFR100 contents.
NPP SITE
JOSE CABRERA
Sta Ma GAROfiAALMARAZ
f ORIGINAL SEISMIC DESIGN ~|
PGA
0.15g
0.10g
0.10g
RESPONSE SPECTRA
No Spectra (Pseudostatic)
J.A. BLUME
NEWMARK
PGA
0.07g
0.10g
0.10g
RE-EVALUATION
RESPONSE SPECTRA
USNRC NUREG/CR-0098, Rock
USNRC R.G. 1.60
Ongoing
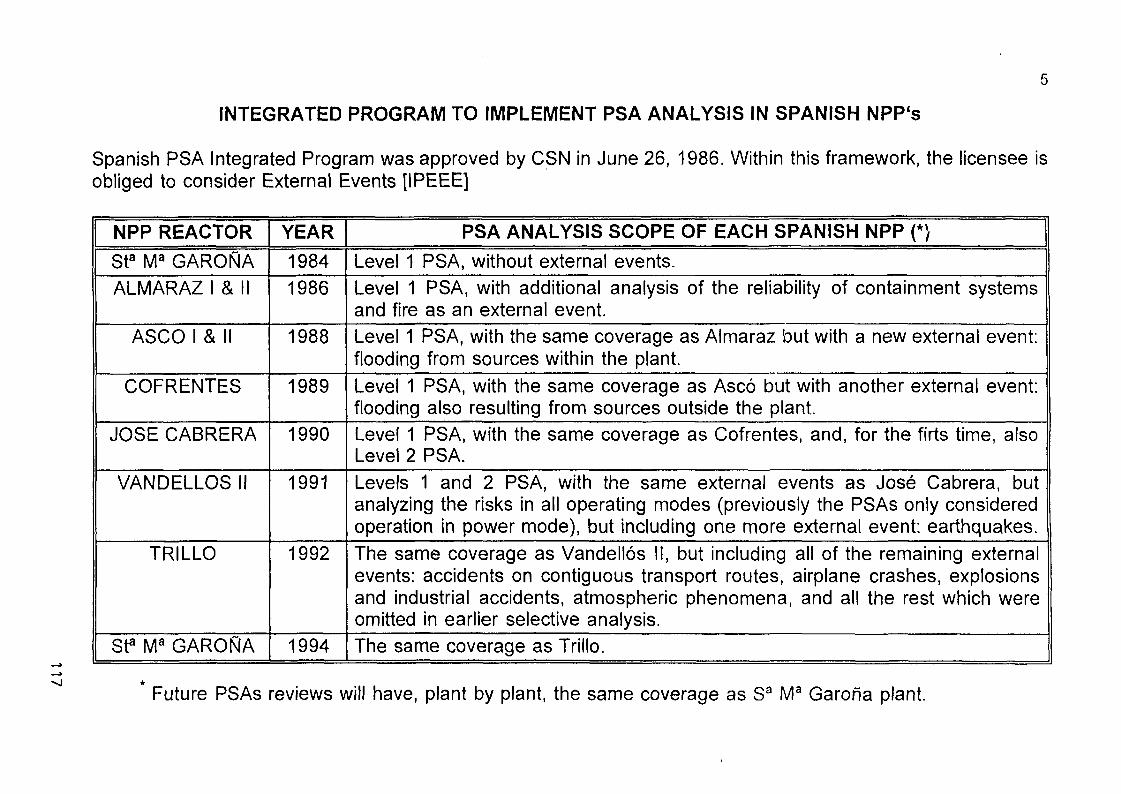
INTEGRATED PROGRAM TO IMPLEMENT PSA ANALYSIS IN SPANISH NPP's
Spanish PSA Integrated Program was approved by CSN in June 26, 1986. Within this framework, the licensee isobliged to consider External Events [IPEEE]
NPP REACTORSta Ma GARONAALMARAZ I & II
ASCO I & II
COFRENTES
JOSE CABRERA
VANDELLOS II
TRILLO
Sta Ma GAROftA
YEAR19841986
1988
1989
1990
1991
1992
1994
PSA ANALYSIS SCOPE OF EACH SPANISH NPP (*)
Level 1 PSA, without external events.Level 1 PSA, with additional analysis of the reliability of containment systemsand fire as an external event.Level 1 PSA, with the same coverage as Almaraz but with a new external event:flooding from sources within the plant.Level 1 PSA, with the same coverage as Asco but with another external event:flooding also resulting from sources outside the plant.Level 1 PSA, with the same coverage as Cofrentes, and, for the firts time, alsoLevel 2 PSA.Levels 1 and 2 PSA, with the same external events as Jose Cabrera, butanalyzing the risks in all operating modes (previously the PSAs only consideredoperation in power mode), but including one more external event: earthquakes.The same coverage as Vandellos II, but including all of the remaining externalevents: accidents on contiguous transport routes, airplane crashes, explosionsand industrial accidents, atmospheric phenomena, and all the rest which wereomitted in earlier selective analysis.The same coverage as Trillo.
Future PSAs reviews will have, plant by plant, the same coverage as Sa Ma Garofia plant.

00
IPEEE SEISMIC RE-EVALUATION
The earthquake consideration was specificaly reqired by CSN to VANDELLOS II [October18, 1990], TRILLO [July 18, 1991] and Sta Ma de Garona [December 15, 1994] plants
NPP SITE
VANDELLOS
TRILLO
S. M. GAROISIA
ALMARAZ
ASCO
COFRENTES
JOSE CABRERA
SEISMIC DESIGN
SSE PGA
0.20g
0.12g
0.10g
0.10g
0.13g
0.17g
0.07g
SSE RESPONSE SPECTRA
R.G. 1.60
R.G. 1.60
R.G. 1.60
NEWMARK
R.G. 1.60
R.G. 1.60
NUREG/CR-0098, Rock
RE-EVALUATION
RLE
Ongoing
Ongoing
Ongoing

7
IPEEE SEISMIC SCOPE (I)
The seismic review was specificaly reqired by CSN:
To:
o "Identify potential vulnerabilities and estimate thelikelihood of dominant plant secuences that could leadto seismically induced core damage and fission productreleases"
According to the following minimum requirements:
o Determine Seismic Hazard Frequency DistributionCurves based on Uncertainty Analysis and realiceSensitivity Analysis of the Results (ref. USNRCNureg/CR-2815 -August, 1985- and Nureg/CR-2300 -January, 1983-)
o Consider the local tectonic environment and local soilspecific response of each plant site
o Both, PRA methodology or SMM and binningmethodology are considered acceptable (ref. USNRCNureg-1407 [IPEEE], June 1991)
o Perform an independent peer-review of the whole study
119
IPEEE SEISMIC SCOPE (II)
Vandellos II plant proposed to CSN that Seismic IPEEEwas performed using Seismic Margins Methodology(SMM)
As a suggestion of the CSN staff, PWR and BWRSpanish owners groups have jointly developed a singleProbabilistic Seismic Hazard Analysis for the all sevenSpanish NPP sites
Afterwards, they have proposed to CSN a SeismicCategorization (binning and RLE selection) of theSpanish plant sites applying SMM
120

"IPEEE SEISMIC HAZARD STUDY FOR SPANISHNUCLEAR POWER PLANTS"
Spanish NPP's owners have presented to CSN to beevaluated the study: "IPEEE Seismic Hazard Study forSpanish Nuclear Power Plants", February 1994
o It consists of several documents:
one "Generic Study",
and
seven "Plant Specific Inputs and Results", one byeach site
o The study contains two different parts:
1.- A Probabilistic Seismic Hazard Analysis[methodology, input data, modelling techniques, method of eliciting,manipulating, etc.],
and
2 - Spanish NPP's sites Seismic Categorization [binningand RLE selection]
o It has been prepared by
Westinghouse Energy Systems Europe
EQE International
Geomatrix Consultants Inc.
With two Spanish experts colaboration
121

10
1.- PROBABILISTIC SEISMIC HAZARD ANALYSIS
The used methodology considers only one single expertteam. Consensus among team experts has beenrequired
Only a few attenuation models, selected by the expertsteam, are considered
Vibratory ground motion is characterizated usingespectral accelerations. No local soil conditionscorrection is taken into account
Incertainties are propagated through the logic treemethodology
The software used was developed by USA contractors.The validation of this software has not beendemonstrated
The used methodology is not strictly that of EPRI neitherLLNL studies
An independent peer-review has not been performed
122

11
2.- SPANISH NPP's SITES SEISMIC CATEGORIZATION
o As there are only seven NPP sites in Spain [nine reactors],and only a single expert team has developed theProbabilistic Seismic Hazard Analysis, the NPP's ownerspropose adapting the NUREG-1407 methodology, todefine the Spanish case ranking criteria.
D Ranking criteria of Spanish NPP's sites proposed:
HCLPF = 0,3g, with Focused Scope
Mean annual probability of exceeding the 0.3gNureg/CR-0098 espectrum is less than 10*4,
OR
Mean annual CDF* is less than 10~5
Vandellos II, Asco[iand nunits], Cofrentes, Garofiaand Zorita plants
HCLPF « Reduced scope
Mean annual probability of exceeding the SSEespectrum is less than 10"4,
AND
Mean annual CDF* is less than 10'5
[I and ll units] a n d Tri l lO [the last one, conditional ondemonstrating a sufficient margin on seismic CDF]
Following fragility averaged curves obtained from existinq seismic PRA in U.S.A. andseismic hazard curves [HCLPF Capacity = Am • e1'1'65 (B* + BU) l ; BR=0.22, B^.024]
123

o
12
CSN PRELIMINARY EVALUATION
PWR and BWR owners groups have jointly sponsoreda single Probabilistic Seismic Hazard Analysis for the allSpanish NPP's sites, and they propose a SeismicCategorization of the plant sites to apply SeismicMargins Methodology
Seismic Hazard. Draft Conclusions:
the methodology developed by the USA contractorsto perform the Probabilistic Seismic HazardAnalysis, is not EPRI neither LLNL
the Analysis has been performed by only one singleexpert team. So, it is not consistent to consider theincertainties have been fully captured
The validation of the software used by the USAcontractors has not been demonstrated
An independent peer-review has not beenperformed
Seismic Categorization. Draft Conclusions:
the adopted methodology does not follow theNureg-1407. The Spanish NPP's binning isperformed using the USA contractors self criteria[not EPRI neither NRC], and these criteria areunder discussion
in some cases, Seismic Categorization results differfrom the seismic design decisions adopted duringlicensing period
124

13
CSN RECOMENDATIONS
The Spanish NPP's owners Probabilistic Seismic HazardStudy:
requires an independent and deep-review onmethodology, used software, modelling techniques,data management and method of eliciting, in orderto decide about its acceptability
-* reflects the opinion of only one single experts teamand it would be necessary to include more expertopinions to consider the incertainties fully captured
The Spanish plant sites Seismic Categorization propose:
-* requires an independent and peer-review, becauseof its methodology does not agree with that ofNureg-1407
To evaluate the Probabilistic Seismic Hazard Study andthe Seismic Categorization, the CSN is organizing an"ad hoc" working group which will have the technicalassistance of LLNL, that was USNRC adviser aboutthese topics
NEXT PAGE(S) ii«ft BLANK I
ZZZ I 125

SESSION III
"GENERIC WWER STUDIES
NEXT PAGE(S) Ileft BLANK I
••oaanHMMaHM 1 2. I

XA9952652
PROCEEDINGS OF SMiRT 13 - POST CONFERENCE SEMINAR 16 on SEISMICEVALUATION OF EXISTING FACILITIES
SEISMIC SAFETY OF NUCLEAR POWER PLANTS IN EASTERN EUROPE
Aybars GiirpinarInternational Atomic Energy AgencyDivision of Nuclear Installation SafetyP.O. Box 100, A-1400 Vienna, AustriaTel: 43 1 2060 22671Fax: 43 1 20607
Antonio GodoyInternational Atomic Energy AgencyDivision of Nuclear Installation SafetyP.O. Box 100, A-1400 Vienna, AustriaTel: 43 1 2060 26083Fax: 43 1 20607
ABSTRACT: This paper summarizes the work performed by the International Atomic Energy
Agency in the areas of safety reviews and applied research in support of programmes for the
assessment and enhancement of seismic safety in WWER type nuclear power plants during the
past five years. Three major topics are discussed; engineering safety review services in relation
to external events, technical guidelines for the assessment and upgrading of WWER type nuclear
power plants, and the Coordinated Research Programme on "Benchmark study for the seismic
analysis and testing of WWER type nuclear power plants". These topics are summarized in a
way to provide an overview of the past and present safety situation in selected WWER type plants
which are all located in Eastern European countries. Main conclusion of the paper is that
although there is now a thorough understanding of the seismic safety issues in these operating
nuclear power plants, the implementation of seismic upgrades to structures, systems and
components are lagging behind, particularly for those cases in which the re-evaluation indicated
the necessity to strengthen the safety related structures or install new safety systems.
1.0 INTRODUCTION
The concern on the safety level of existing nuclear power plants in Eastern Europe came
into focus a few years ago. One of the major reasons for this concern was the recognition that
some site-related external events were not properly considered in the original plant design as well
129

as the need to compare the criteria, standards and methods used to establish seismic safety in
eastern European nuclear power plants with those generally accepted in international practice.
Seismic safety issues generally involve two major components; those related to the
derivation of the design basis parameters (i.e. seismic input) and those involving the seismic
capacity of structures, equipment and distribution systems. Regarding the first component,
although most Eastern European nuclear power plant sites can be characterized as low to medium
seismicity, the deficiency in the geological and seismological databases as well as the methods
used in the 1970s for determining the seismic hazard at a specific site, have led to the necessity
to implement comprehensive hazard re-evaluation programmes of those facilities. The results of
the new studies consistently indicate that the original design basis ground motion parameters had
been underestimated, sometimes by a considerable margin.
The issues related to the seismic capacity of structures, equipment and distribution
systems are even more complex. For WWER and RBMK type nuclear power plants, structures
which do not function as a pressure boundary are designed like conventional industrial frame
buildings, often using precast concrete elements. Moreover, in WWER 440 and RBMK type
nuclear power plants, the 'confinement' concept restricts the pressure boundaries to the lower part
of the reactor building. WWER 1000 type plants, however, have a proper structural containment
and therefore are inherently more robust for external events.
The involvement of the IAEA in the seismic safety issues of Eastern Europe has been
substantial through national and regional projects. Seismic safety review missions visited nuclear
power plants in Armenia, Bulgaria, Czech Republic, Hungary, Poland, Romania, Russian
Federation, Slovakia, Slovenia and Ukraine within the past five years.
These countries operate different types of nuclear power plants, i.e. WWER 440/230
(Armenia, Bulgaria, Russian Federation, Slovakia), WWER-440/213 (Czech Republic, Hungary,
Slovakia, Russian Federation, Ukraine), WWER-1000 (Bulgaria, Czech Republic, Russian
Federation, Ukraine), RBMK (Russian Federation, Ukraine), Candu (Romania) and PWR
(Slovenia).
130
The level of IAEA involvement has also varied greatly ranging from minimal in Poland
(where the nuclear power programme was abandoned), Russian Federation and Ukraine, to
limited in the Czech Republic, Romania and Slovenia, to extensive in Armenia, Bulgaria,
Hungary and Slovakia. The extent of the involvement has depended mainly on the urgency of
the need as expressed by the host country.
The activities related to the assessment and enhancement of seismic safety may be
considered within two time frames. The engineering services, i.e. site/plant specific reviews, are
short term actions to provide recommendations to the regulatory authority and the nuclear power
plant management regarding criteria and methods of assessment and upgrading. There is also the
coordinated research programme dealing with the seismic safety of WWER type plants in the
medium and long term. This programme is titled, "Benchmark study for the seismic analysis and
testing of WWER type nuclear power plants" and involves 25 institutions from 15 countries.
Another coordinated research programme on the "Assessment of RBMK type nuclear power
plants in relation to external events" will begin in 1997.
It should also be mentioned that substantial amount of help in terms of supply of
equipment, mainly computer hardware and software for seismic hazard and structural analysis,
as well as seismic instrumentation, was provided to Eastern European countries under the scope
of national technical assistance and co-operation programmes.
These short and long term activities will be described in the subsequent sections of this
article with emphasis on the results achieved so far and what remains to be done in order to
significantly improve the seismic safety of these nuclear power plants built to earlier standards.
2.0 REVIEW SERVICES
A seismic re-evaluation programme for a nuclear power plant has three major
components, as follows:
131

(I) the re-assessment of the seismic hazard as an external event;
(ii) the evaluation of the plant specific seismic capacity to withstand the loads generated by
such event, and
(iii) the implementation of upgrades to buildings and components, if needed.
Figure 1 shows the general flow diagram for the seismic re-evaluation process, constituted
by five major phases, starting with the assessment of the original seismic input and design bases
and finishing with the implementation of the upgrades for the structures, systems and components
upgrades if required.
The IAEA has conducted a substantial number of seismic safety review services to
nuclear power plants in 10 East European countries covering 11 sites, the scope of which
depended on the stage of assessment and/or upgrading of the specific plant or unit. In most of the
cases the process of review started with the assessment of the original seismic input.
The interim result of the re-evaluation of the seismic hazard Eastern European nuclear
power plants is given in Table 1.
The geological stability and the ground motion parameters are assessed according to
specific site conditions and in compliance with criteria and methods valid for new facilities, which
means in accordance with criteria established by the IAEA Safety Guide 50-SG-S1 (Rev. 1).
Therefore, the review level earthquake RLE should correspond to the SL-2 level directly related
to ultimate safety requirements, i.e. a level of extreme ground motion that shall have a very low
probability of being exceeded during the plant lifetime and represents the maximum level to be
used for design and re-evaluation purposes. As established in the above mentioned IAEA NUSS
Safety Guide, the recommended minimum level is a peak ground acceleration of 0. lOg for the zero
period of the design response spectrum. For the probability of exceedance a typical value of 10'4/yr is usually used coupled with elastic ground response spectra.
Table 2 provides an overview of the IAEA services in relation to seismic safety which
were conducted to these plants within the past five years. Each service is designated with a code
132

5
indicating the type of review provided in terms of the stage of the assessment (see Figure 1).
Considering that the site related investigations for reassessing the seismic input need a
long time for completion (i.e. several years), a conservative preliminary value for the RLE is
generally assumed for starting the activities related to the re-evaluation of the seismic capacity and
upgrading of plant systems, structures and components. This may be called the interim RLE
(iRLE).
Another important consideration for re-evaluation purposes only is that if median plus one
standard deviation was used for the definition of the peak ground acceleration, a median shaped
elastic response spectra as given in US-NUREG/CR-0098, Ref [2], is permitted.
3.0 CRITERIA FOR RE-EVALUATION OF SEISMIC CAPACITY
In relation to the second component of the programme mentioned in Section 2, the
objective is to enhance the seismic safety in compliance with valid standards and recognized
practice, using (a) "as-is" data, i.e. data reflecting the present state of the plant items; (b) more
realistic criteria and methods than the ones used in the design process for at least those functions,
systems, components and structures required to ensure safe shutdown and to maintain it in safe
shutdown conditions, trying to avoid unnecessary conservatism. This is often a subset of the
structures, systems, and components important to safety. This practice effectively ensures that
a set of "dedicated, earthquake-hardened safe shutdown systems" exist at the plant.
Figure 2 provides the flow diagram of the detailed work plan indicating sequence,
relationship and interdependence between different tasks. The main steps and criteria used are
as follows:
3.1. Identification and classification of seismic safety functions, systems and components
The first step is the identification of the functions, systems, components and structures
133
required during and after an earthquake occurrence. For this purpose, the main criteria and
assumptions as indicated by international practice are:
(a) the plant must be capable to be brought to and maintained in a safe shutdown condition
during the first 72 hours following the occurrence of the RLE;
(b) safe shutdown means hot or cold shutdown;
(c) simultaneous offsite and plant turbine generated power loss occurs for up to 72 hours;
(d) loss of make-up water capacity from offsite sources occurs for up to 72 hours;
(e) the required safe shutdown systems should fulfill single active failure criterion;
(f) the required safe shutdown systems should include one main path and one redundant path;
(g) other external events such as fires, flooding, tornadoes, sabotage, etc. are not postulated
to occur simultaneously;
(h) Loss of Coolant Accident (LOCA) and High Energy Line Breaks (HELB) are not
postulated to occur simultaneously.
The safe shutdown equipment list (SSEL) is the list of the minimum set of selected
equipment required to achieve and maintain those safe shutdown conditions and is the most
important result of this step.
3.2 Plant walkdown
Emphasis should be given to the collection and compilation of original design basis data
and documentation in order to minimize the effort required for the re-evaluation programme. In
this regard the seismic plant walkdown has become one of the most important components of the
seismic re-evaluation programme for an existing facility, with the main objectives of collection
of information on as-is conditions and of assessment of the seismic capacity of equipment.
The main focus of the walkdown is on anchorage of the equipment; load path from the
anchorage up through the equipment; the equipment structure; and spatial systems interactions.
In general, there will be three alternative disposition categories for each structure, system
134
7
and component being evaluated during the walkdown:
(1) Disposition 1: a fix is required;
(2) Disposition 2: the seismic capacity is uncertain and an evaluation is needed to determine
if a fix is required, and
(3) Disposition 3: the seismic capacity is adequate for the specified RLE and the items appear
to be seismically rugged.
The three alternate dispositions are primarily based on judgement and the walkdown teams
must be sufficiently experienced in order to make these judgements.
Screening guidelines are used to determine if the components are represented by the
experience database applicable to the component in question. Unfortunately, most of the
components and distribution systems in the WWER type rectors were manufactured by
organizations for which seismic and testing experience has not yet been gathered and reviewed
on an international scale. Similarity analysis should, therefore, be made.
3.3 Evaluation of seismic margin capacity
The concept of High Confidence of Low Probability Failure (HCLPF) capacity is used to
assess and quantify the seismic margins of NPPs. In simple terms it corresponds to the seismic
input level at which, with high confidence (s 95%) it is unlikely (i.e. < 5%) that failure of a
system, structure or component required for safe shutdown of the plant will occur.
(a) The first step in the estimation of HCLPF seismic capacity is to develop a clear definition
of what constitutes failure for each of the systems, structures and components being
evaluated. Several modes of seismic failure may have to be considered. It may be
possible to identify the failure mode which is most likely or the most dominant to be
caused by the seismic event by reviewing the structure, system, component (SSC) design
and to consider only that mode.
135

8
(b) The response analysis for RLE is conducted with the values of appropriate damping ratios,
which may be used if the stresses in the majority of resisting building elements for the
applicable loading combination are greater than 50% of ultimate strength for concrete or
yield capacity for steel (i.e. Stress Level 2). The use of higher damping values, if properly
justified and determined, is also permitted.
(c) Nearly all structures and components exhibit at least some ductility (i.e., ability to strain
beyond the elastic limit) before failure or even significant damage.
The inelastic energy absorption ratio, Fu, is related to the amount of inelastic deformation
that is permissible for each type of structural element. The additional seismic margin due
to this inelastic energy absorption ratio (or ductility) should be considered in any margin
review. In most cases, it is feasible to use linear elastic analysis techniques. When linear
elastic analysis is applied, the easiest way to account for the inelastic energy absorption
capability is to reduce seismic response by the Fu factor. Fu is defined as the amount that
the elastic-computed seismic demand may exceed the capacity of the component without
impairing its performance. It means that for non-brittle (ductile) failure mode inelastic
distortion associated with a demand-capacity ratio greater than unity is permissible.
Standard Fu values for different structural systems as being accepted for WWER type
plants are determined considering two conditions: (I) the verification of seismic capacity
of existing structures and components at WWER type reactors; and (ii) the verification of
seismic capacity of structures designed using joint ductile requirements as established in
applicable codes.
(d) Seismic response of building structures will be evaluated on the basis of dynamic analysis
of models of the soil-structure system. In order to develop appropriate structural models
special attention is given to (I) structural configuration and construction details (joints,
gaps, restraints and supports); (ii) non structural elements, such as masonry or precast
reinforced concrete panels that may modify the structure response. Stiffness and strength
of such panels, and those of their attachments to the structure, should be accounted for in
136

the formulation of the models; (iii) as-built material properties and dimensions of
structural members; (iv) geotechnical data of foundation materials and their potential
implications on the necessity to perform soil-structure interaction analysis, for which
direct methods are usually being applied. For soil-structure interaction analysis radiation
damping will not be limited but resultant composite modal damping should not exceed
20%.
(e) Combinations of seismic and non-seismic loads shall be made according to the specific
equations (for reinforced concrete structural elements, for masonry walls and precast
reinforced concrete panels, component pressure boundaries, supports for piping and
pressure components and cable raceways). The reassessed seismic input is defined for
each of the horizontal components and the vertical component is assumed as a prescribed
ratio of the horizontal input.
(f) An earthquake experience and test based judgmental procedure to verify the seismic
adequacy of the specified safety-related equipment in operating NPPs using seismic
experience methods, was developed in the USA to address regulatory requirements for
requalification of older plants. The procedure is primarily based upon the performance
of installed mechanical and electrical equipment in conventional plants or other industrial
facilities which have been subjected to actual strong motion earthquakes as well as upon
the behaviour of equipment components during simulated seismic tests. With a number
of caveats and exclusions for excitations below spectra normalized to 0.3 Og and in some
cases 0.50g, for the zero period ground acceleration (i.e. ZPGA), it is unnecessary to
perform explicit seismic analysis or test qualification of existing equipment to
demonstrate functionality after the strong shaking has ended. The existing data base
reasonably demonstrates the seismic ruggedness of existing equipment up to these
seismic motion bounds. This conclusion should not be extrapolated beyond the classes
of equipment existing in the database.
(g) The issue of adequate anchorage is perhaps the most important single item which affects
the seismic performance of distribution systems and components, which can slide,
137

10
overturn, or move excessively when not properly anchored. Adequate strength of system
and component anchorage can be determined by any one of many commonly accepted
methods. The load or demand on the anchorage system can be obtained from the floor
response spectral acceleration for the prescribed damping value and at the estimated
fundamental or dominant frequency of the system or component. A conservative estimate
of the spectral acceleration may be taken as the peak of the applicable spectra. This
acceleration is then applied to the mass of component or system at its center of gravity.
Generally, the four main steps for evaluating the seismic adequacy of equipment
anchorage include: anchorage installation inspection; anchorage capacity determination;
seismic demand determination; and comparison of capacity to demand.
(h) In addition to the inertia effects there may also be significant secondary stresses induced
in systems and components by differential or relative anchor motion if the system or
component is supported or restrained at two or more points. For supports it is common
practice to evaluate such seismic induced anchor motion, where the relative or differential
motion of the building structure at the different points of attachment should be input to
a model of the multiple supported component or system. Resultant forces, moments and
stresses in the support system determined from the seismic anchor motion effects acting
alone shall meet the same limits for normal operation plus RLE inertia stresses.
4.0 COORDINATED RESEARCH PROGRAMMES
4.1 Background
A coordinated research programme on the benchmark study for the seismic analysis and
testing of WWER type nuclear power plants was initiated subsequent to the request from
representatives of member states during the IAEA Technical Committee Meeting on the seismic
safety of existing nuclear power plants held in Tokyo in August 1991. The conclusions of this
meeting called for the harmonization of methods and criteria used in member states in issues
138

11
related to seismic safety. In particular, seismic safety concerns related to WWER type nuclear
power plants were expressed.
With this objective in mind, it was decided that a benchmark study is the most effective
way of achieving the principal objective. Two types of ex-USSR designed WWER reactors
(WWER-1000 and WWER-440/213) were selected for the benchmark exercise.
Twenty five internationally recognized institutions (public or private companies) from
fifteen countries take part in the seismic analysis and/or testing of the two prototypes which have
been identified as Kozloduy NPP Unit 5/6 and Paks NPP, representing the WWER-1000 and
WWER-440/213 respectively.
Four research coordination meetings were held so far, in Paks, Kozloduy, St. Petersburg
and Bergamo. Reconnaissance plant walkdowns were performed during the first two meetings
for the two selected prototypes.
Thirteen volumes of research material has been prepared by the participating institutions.
One of the major activities of the program has been the full scale dynamic testing of the Paks and
Kozloduy NPPs using blast excitation.
4.2 Prototype Plants
Paks NPP
Paks NPP comprises four WWER-440/213 units. It is located about 100 kms south of
Budapest on the Danube river. In the original design of the plant seismic loads had not been taken
into consideration. The seismic input for the plant has been recently re-assessed to be 0.25g
having site specific response spectra. A major program of seismic evaluation and upgrading is
underway at Paks NPP. The so called "easy fixes" have already been implemented. These mainly
include equipment supports and anchorages, as well as strengthening of unreinforced masonry
walls with the potential of collapsing on safety related items.
139

12
Structurally, the WWER-440/213 type NPPs lack a containment, i.e. protection from
external loads. The reactor building structure is steel frame with infill walls and without proper
bracing to resist lateral loads. The monolithic concrete part of the building is in the lower part of
the structure and serves as an ultimate pressure boundary for extreme internal loads (Figure 3).
Kozloduy NPP Unit 5/6
Kozloduy NPP site has four WWER-440/230 units and two WWER-1000 units. Units 5
and 6 refer to the 1000 MWe units. The site is located north from Sofia and on the right bank of
the Danube. The soils can be classified as medium with pockets of looser sands especially under
parts of the water intake canals. Originally Units 5 and 6 were designed to 0. lOg. The reassessed
seismic design level is 0.20g associated with a wide band response spectrum rich in lower
frequencies (mainly due to the Vrancea earthquake source). Although considerable work has been
done in terms of re-evaluation and upgrading of the 'easy fixes' type for the smaller units at
Kozloduy (these units were not designed for seismic loads originally), so far only a partially
completed seismic PSA was performed for Unit 5.
Structurally, WWER-1000 units are radically different from the WWER-440 units. The
containment structure of the reactor building provides general protection from extreme external
hazards (Figure 4). However the adequacy of this protection with respect to site seismicity still
needs consideration.
4.3 Participation and tasks
In the fourth year of its implementation, the number of participating institutions to the
coordinated research program has increased to twenty five, coming from fifteen member states.
Each participating institution (generally a public or private company) has a well defined work
plan and task. The distribution of tasks is generally made during the research coordination
meetings.
The areas of interest are grouped in a matrix form and may be related to analysis, testing
140
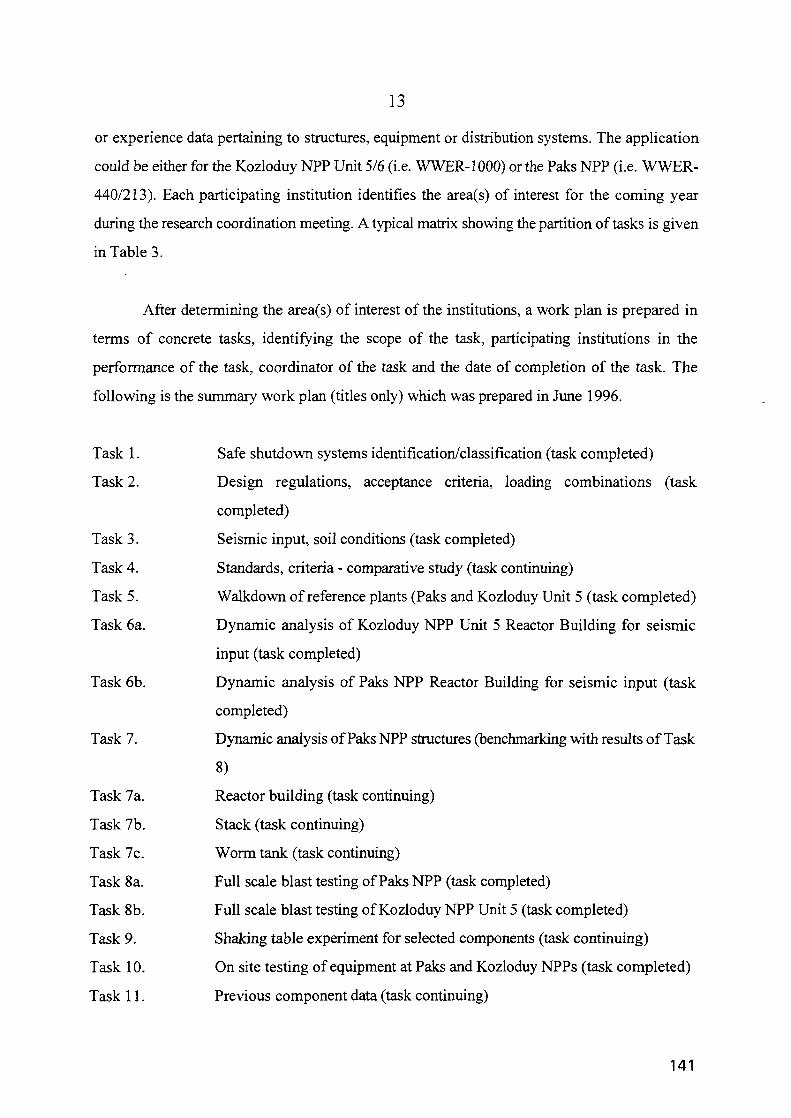
13
or experience data pertaining to structures, equipment or distribution systems. The application
could be either for the Kozloduy NPP Unit 5/6 (i.e. WWER-1000) or the Paks NPP (i.e. WWER-
440/213). Each participating institution identifies the area(s) of interest for the coming year
during the research coordination meeting. A typical matrix showing the partition of tasks is given
in Table 3.
After determining the area(s) of interest of the institutions, a work plan is prepared in
terms of concrete tasks, identifying the scope of the task, participating institutions in the
performance of the task, coordinator of the task and the date of completion of the task. The
following is the summary work plan (titles only) which was prepared in June 1996.
Task 1. Safe shutdown systems identification/classification (task completed)
Task 2. Design regulations, acceptance criteria, loading combinations (task
completed)
Task 3. Seismic input, soil conditions (task completed)
Task 4. Standards, criteria - comparative study (task continuing)
Task 5. Walkdown of reference plants (Paks and Kozloduy Unit 5 (task completed)
Task 6a. Dynamic analysis of Kozloduy NPP Unit 5 Reactor Building for seismic
input (task completed)
Task 6b. Dynamic analysis of Paks NPP Reactor Building for seismic input (task
completed)
Task 7. Dynamic analysis of Paks NPP structures (benchmarking with results of Task
8)
Task 7a. Reactor building (task continuing)
Task 7b. Stack (task continuing)
Task 7c. Worm tank (task continuing)
Task 8 a. Full scale blast testing of Paks NPP (task completed)
Task 8b. Full scale blast testing of Kozloduy NPP Unit 5 (task completed)
Task 9. Shaking table experiment for selected components (task continuing)
Task 10. On site testing of equipment at Paks and Kozloduy NPPs (task completed)
Task 11. Previous component data (task continuing)
141

14
Task 12. Experience data from Vrancea and Armenia earthquakes (task continuing)
Task 13. Experience data from US earthquakes (task completed)
Task 14. Special topic 1 - Assessment of containment dome prestressing of Kozloduy
NPP (task continuing)
Task 15. Special topic 2 - Assessment of containment dome/cylindrical part for
different loading combinations (task continuing)
Task 16. Special topic 3 - Stress analysis of safety related piping of Kozloduy NPP
(task continuing)
Task 17. Special topic 4 - Dynamic analysis of selected structures of Kozloduy NPP
(task continuing)
Task 18. Paks NPP feedwater line analysis to be compared with testing which was
already performed (task continuing)
Task 19. Analysis of buried pipelines for KNPP [between DG and spray pools] (task
continuing)
Task 20. Analysis of buried pipelines for PNPP (task continuing)
Task 21. Comparison of beam vs 3D models for KNPP and PNPP structures (task
continuing)
Task 22. Experience data base (WWER SQUG) initiation (task continuing)
Task 23. Consolidation of results and reports (task continuing)
Task 24. Dynamic analysis of Kozloduy NPP Unit 5 structures [benchmarking with
results of Task 8] (task continuing)
Task 25. Comparison of blast and vibrator tests for KNPP (task continuing)
Thirteen volumes of research material has been compiled reflecting the results of the
completed tasks. These volumes are titled as follows:
Volume 1. Data related to sites and plants (Paks and Kozloduy NPPs)
Volume 2. Generic material: codes, standards, criteria
Volumes 3A, 3B, 3C, 3D, 3E. Kozloduy NPP, Units 5/6: Analysis/testing
Volumes 4A, 4B, 4C, 4D. Paks NPP: Analysis/testing
Volumes 4A, 5B. Experience data
142

15
4.4 Full scale dynamic test of Paks and Kozloduy NPPs
One of the most significant tasks already completed is the full scale dynamic testing of
the Paks NPP. The test was conducted by Ismes, an Italian consulting company and Paks NPP
with assistance from local contractors especially for the realization of the blasts. The test was
performed in December 1994 following a two week preparation period for placing the
instruments and recording of smaller test blasts.
The blast location was about 2.5 kilometers from the reactor building. Two main blasts
were performed with a total each of 300 kilograms of TNT charge. Three free field locations were
selected for instrumentation. Two of these had two borehole (@40 meters and 15 meters depth)
and one surface recording. About 40 meters corresponds to the depth of the firmer geological
formation. An additional (fourth) instrument was located about 12 kilometers away in order to
provide some information on attenuation characteristics. A large number of seismometers and
accelerometers were mounted in the reactor building (some also in other buildings) to record the
structural response. Instruments were also placed on certain heavy components and tanks.
Both blasts used a time delay to enhance the duration of the motion so that an adequate
time series analysis was possible. In most locations a motion of about 20 seconds was recorded.
The records are of very high quality. It should also be noted that all of the instruments functioned
as intended.
One set of free field recordings have been made available to the benchmark programme
participants. Locations and directions of the in-structure instruments have been indicated and the
participants have been asked to make a blind prediction of the response recorded at these
locations. All the relevant dynamic soil properties and structural properties have been provided
to the participants.
A similar test was carried out for the Kozloduy NPP Unit 5 in June 1996. The test was
again performed by Ismes and Kozloduy NPP as well as local contractors assisted in the test. All
instruments, both free field and in-structure, functioned as intended. The results of the test have
143
16
been recently processed.
5.0 CONCLUDING REMARKS
A review and comparison of Figure 1 and Table 1, presented earlier reveal some
indication of present picture of the seismic safety situation of nuclear power plants with which
the IAEA had significant involvement.
The first observation from Table 1 is that the reassessment of the seismic design basis has
been completed for three of the sites (i.e. Kozloduy, Paks and Medzamor) while for Bohunice and
Mochovce this activity is continuing. For all the sites in question, the reassessment has yielded
significantly greater RLE values. This, in turn, indicates that for most of the plants, the capacity
check yields the result that the plant requires upgrading (i.e. inadequate seismic capacity).
The last two columns of Table 1 generally indicates good progress in easy fixes, i.e.
mainly supports and anchorages of mechanical and electrical components. For some cases, this
included more substantial upgrades involving replacement of batteries and strengthening of
unreinforced masonry walls to prevent spatial interaction. Similar progress is unfortunately not
the case for structural upgrades or when the installation of additional safety systems were
required. Due to bigger funding and longer outage requirements, structural upgrades will
probably take much longer to complete. Unfortunately, the overall seismic safety of these NPPs
will not have been improved to the target levels, until structural upgrades are implemented.
REFERENCES
[1] IAEA, Safety Guide 50-SG-S1 (Rev. 1), "Earthquakes and associated topics in relation
to nuclear power plant siting", IAEA, Vienna, 1991.
[2] NUREG/CR-0098, "Development of Criteria for Seismic Review of Selected Nuclear
Power Plants", N.M. Newmark and W.J. Hall, NRC, May 1978.
144

17
[3] Gurpinar, A. and Godoy, A.R., "Seismic safety of nuclear power plants in Eastern
Europe", Proc. Tenth European Conference on Earthquake, A.A. Balkema/Rotterdam,
1995.
ACKNOWLEDGMENT
The authors acknowledge that parts of this article have been taken from technical material
contributed by various consultants in the course of the past five years either in relation to IAEA
Engineering Safety Review Services for external events or the Coordinated Research Programme
on "Benchmark study for the seismic analysis and testing of WWER type NPPs".
In particular, the criteria for the re-evaluation and upgrading of existing NPPs were
developed by several authors led by Mr. J. D. Stevenson.
File: s/godoy/ smirtl3/sl6paper.wpw
145

Table 2:
18
List of Tables and Figures
Table 1: Seismic Safety Status of Selected WWER NPPs in Eastern
Euorpe
5 Year Summary of IAEA Site/Seismic Safety Review Services
to Eastern European NPPs
Table 3: Partition of Tasks for Participating Institutions
Figure 1: Flow Diagram for Seismic Re-evaluation and Upgrading of
Existing Nuclear Power Plants
Figure 2: Detailed Flow Diagram for the Assessment and Improvement
of Seismic Safety
Figure 3: Cross Section of Paks NPP
Figure 4: Cross Section of Kozloduy NPP, Unit 5
146

19
Table 1.
Legend:SDB:NED:Neg.:
No:
Seismic Safety Status of selected WWER NPPs inEastern Europe
Plant
Kozloduy 440
Kozloduy 1000
Bohunice VI
Bohunice V2
Mochovce
Paks
Armenia
OriginalSDB
NED
O.lgNED
NED
0.06gNED
0.1e/0.2e
ReassessedSDB (RLE)
0.2g
0.2g
0.25g?
0.25g?
O.lg?0.25g
0.35s
CapacityCheck
Neg.
PSA (*)Neg.Neg.
NoNeg.
No
Upgradesto RLE
Easy FixesYes
No
Some
Some
NoYes
No
StructuralNo
No
SomeNo
No
No
No
Seismic Design BasisNo Explicit DesignInadequate seismic capacity for the reassessed SDB (RLE)A question mark indicates an ongoing activity with a preliminary indication of the reassessed SDB (RLE)The activity has not started yetIncomplete

20
Table 2.
5 Year Summary of IAEASite/Seismic Safety Review Services
to Eastern European NPPs
Country
Armenia
Bulgaria
Bulgaria
Bulgaria
Croatia
Czech Republic
Czech Republic
Hungary
Romania
Russian Federation
Russian Federation
Slovakia
Slovakia
Slovakia
Slovenia
Ukraine
TOTAL
Plant
Armenia
Kozloduy 1-4
Kozloduy 5-6
Belene
(Site Survey)
Temelin
(Spent Fuel Storage)
Paks
Cernavoda
(Generic WWER)
Smolensk
Bohunice VI
Bohunice V2
Mochovce
Krsko
Crimea
W
-1-
--
2-
-
11-
-
1
1
1-
8
Number of services(1990-95)
s
-2-
2
1
4
1--
-
-
-
-
-
-
-
10
SI
5
5
1
2-
-
1
6-
-
1-
2
2
3
1
29
sc
3
52
-
-
-
-
5
2-
1
3-
3
1
-
25
Legend:
W:S:SI:SC:
WorkshopSite Safety ReviewReview of Seismic Input and Tectonic StabilityReview of Seismic Capactiy
148

21
Table 3.
Partition of Tasks for Participating Institutions
Analysis
Testing
ExperienceData
Structures
Kozloduy NPP
IZSIIS (M)Siemens (G)
MD (CR)CL (BG)
K-NPPIsmes (I)
Siemens (G)SAS (SR)
Paks NPP
SAGE (B)IZIIS (M)AEP (RF)-P-NPP (H)-Siemens (G)
MD (CR)EQE (BG)
EQE (USA)CL (BG)
Ismes (I)P-NPP (H)
Siemens (G)SAS (SR)
Components
Kozloduy NPP
Siemens (G)VNIIAM (RF)
WESE (B)BRI (BG)-SP (CH)
IZIIS (M)AEP (RF)
VNIIAM (RF)K-NPP
AEP (RF)-Siemens (G)EQE (USA)
VNIIAM (RF)WESE (B)SA (US)
Paks NPP
Siemens (G)-P-NPP (H)
CKTI (RF)-SA (CR)VNIIAM (RF)Argonne (US)
P-NPP (H)VNIIAM (RF)
IZIIS (M)
SA(R)EQE (USA)Siemens (G)
SA (CR)VNIIAM (RF)
WESE (B)SA (US)
Distribution
Kozloduy NPP
K-NPPSiemens (G)-
WESE (B)SP (CH)-BRI (BG)
CL (BG)EQE (US)Wolfel (G)
CKTI (RF)VNIIAM (RF)
SA(R)EQE (USA)AEP (RF)
VNIIAM (RF)WESE (B)SA (CR)SA (US)
Systems
Paks NPP
P-NPP (H)-Siemens (G)
CKTI (RF)-SA(CR)
WESE (B)EQE (US)
CKTI (RF)P-NPP (H)
VNIIAM (RF)
EQE (USA)AEP (RF)SA (CR)
VNIIAM (RF)WESE (B)SA (US)

22
Figure 1
Flow Diagram for Seismic Re-evaluation and Upgradingof Existing Nuclear Power Plants
ASSESSMENT OF ORIGINALSEISMIC INPUT ANDDESIGN BASIS
adequate
RE-EVALUATION OF SEISMICINPUTSpecific to the site - RLE
adequate
FURTHERACTION
IMPLEMENTATION OFUPGRADING
ASSESSMENT OF SEISMICCAPACITY OF THE PLANT TOTHE NEW DEFINED RLE
DESIGN OF UPGRADES
150

23
Figure 2
Detailed Flow Diagram for the Assessment and Improvementof Seismic Safety
GEOTECHNICALDATA
AS-BWLTIDESIGKDATA COLLECTION
Tasfc 2
FUNCTIONS/SYSTEMS/COMPONENTSCLASSIFICATIONT&sk 4
STRUCTUREMODEL
SSEL
SOIL-STRUCTURERESPONSETask 5
STRUCTUREINTERNALFORCES
IN-STRUCTURERESPONSESPECTRA (FRS)
SOILCAPACITYEVALUATIONTask 6
TSTRUCTURECAPACITYEVALUATIONTask 7
DISTRIBUTION SYSTEMS(A) functional;(B) structural integrityTask 8
EQUIPMENT:(A) funcfionai(0) structural integrityTask 9
1PRJORiTLZATION
HIGHPRIORITY
Task 10
LOWPRIOKITY
Task 10
FURTHERANALYSIS
Task 10
£UPGRADES DESIGN
ANDIMPLEMENTATION
i '
OK
OK
151

FIGURE 3.
CROSS SECTION OF PAKS NPP(WITH INDICATION OF INSTRUMENT LOCATIONS
FOR THE FULL SCALE DYNAMIC TEST)
GalleryBuilding
ReactorBuilding Condensation Tower

(*m2.x
'a* m
FIGURE 4
CROSS SECTION OF KOZLODUY NPP, UNIT 5(WITH INDICATION OF INSTRUMENT LOCATIONS
FOR THE FULL SCALE DYNAMIC TEST)
M u
•a m liliiurmou
TV
J»o[ I $90
(r)
SCO
:
! SCOc:
.'.I-;
50 too?:.: I
. " >?*.(>•<
l 0 it cfi
iic
i XA9952653
PROCEEDINGS OF SMIRT 13 - POST CONFERENCE SEMINAR 16 SEISMIC EVALUATION
OF EXISTING NUCLEAR FACILITIES
COMPARISON OF EX-USSR NORMS AND CURRENT INTERNATIONAL
PRACTICE IN DESIGN OF SEISMIC RESISTANT NUCLEAR POWER PLANTS
B .HauptenbuchnerTechnical University of Dresden, Dresden, Germany
M. DavidDavid, Consulting, Engineering and Design Office, Prague, Czech Republic
ABSTRACT:Seismic hazard has been estimated according to ex-USSR norms in the original designs of WWER -type Nuclear Power Plants (NPP) in former Soviet Union as well as in all former east Europeancountries. For some steps of the design the national standards has been also taken into account. Theoriginal ex-USSR norms and instructions has been several times changed and improved during thetime.
This contribution is dealing with the development of ex-USSR norms and regulations withthe aim to recognise some most important differentiations in comparison with correspondingwestern or international ones from point of view of civil structures. The understanding of relationsof these documents is very important for seismic qualification and upgrading of WWER-type NPPs.The main Soviet/Russian Standards and Regulations related to the seismic design and qualificationof NPP structures as SNiP II-A. 12-69, VSN 15-78, SNiP II-7-81, PiNAE G-7-002-86, NTD SEVetc. have been taken into consideration and compared with western or international standards asIAEA 50-SG-S1, IAEA 50-SG-D15, KTA 2201.1-6, ASCE 4-86 etc.
The numerical examples of structural seismic qualification has been elaborated according todifferent standards for better understanding and in order to determine the degree of safety referringto corresponding standards. The authors has tried also to take into account the way of application ofex-USSR norms. The comparison of different norms and regulations has been analysed andcorresponding conclusions and recommendations have been derived. These conclusions andrecommendations can be helpful by the seismic qualification and upgrading of WWER-type NPPs.
1. INTRODUCTION
Many countries, particularly countries with regions with earthquake hazard have, developedstandards for seismic design of structures. However, these standards were not sufficient for theconstruction of Nuclear Power Plants from many reasons. First of all, the required safety oftechnological systems and structures related to nuclear safety is much higher than the safetyrequired for living houses or ordinary industrial equipment and buildings. Furthermore, theseexisting standards have not defined methods and acceptance criteria for technological systems andstructures of NPPs at all.
In connection with the development of NPPs, the corresponding standards have to be alsodeveloped. The elaborated standards for design of NPPs in seismic regions have been usuallyimproved step by step in accordance with permanent increase of safety requirements on one site andincrease of corresponding experience and knowledge on the other site.
155

The comparison of initial Soviet and current Russian Standards with west standards must bestudied in connection with their historical development.
2. REVIEW OF USSR STANDARDS USED DESIGNS OF NAP
The historical development of initial Soviet and current Russian Standards can be dividedinto several periods according to their main characteristics. The most important standards arepresented in Table 1.
Table 1. Historical Development of Initial Soviet and Current Russian StandardsRelated to general Safety Issues of NPPs.
Period
1st Period
2nd Period
3rd Period
year
up to the end of 70thyears
up to the end of 80thyears
from the late 80thyears
Standards,Regulations
SNiP II-A.12-69*
SNiP II-A.12-69*SNiP II-7-81VSN 15-78OAG 130.03RTM 108.020.37-81RD 16 20.1-86PiNAE G-5-006-87NTD SEVPiNAE G-l-011-89PiNAE G-7-002-86NTD SEV 4214-86RD 16 20.1-86RD 25818-87OTT-87GOST 17516.1.90GOST 16962.2-90
Comment
General seismicbuilding standardwithout respect toNPPsVSN 15-78 is anextension of generalseismic buildingstandards SNiP forNPPs
Note: Thick printed Standards and Regulations refer to earthquake and associated topics in relationto NPP sitting and seismic analysis of NPP civil structures.
3. COMPARATIVE STUDY WITH WEST STANDARDS
Following international, westeuropeans and USA Standards and Regulations have been mainly usedfor comparison with soviet/russian standards: (ref. Table 2.)
156

Table 2. West Standards and Regulations Used for Comparison with Soviet/Russian Standards
Standards, Regulations
IAEA50-SG-S1IAEA50-SG-D15
KTA 2201.1KTA 2201.2KTA 2201.3KTA 2201.4KTA 2201.5KTA 2201.6ASCE 4-86
Comments
IAEA Safety GuideIAEA Safety Guide: Seismic Design and Qualification forNuclear Power PlantsGerman Regulations
ASCE Standard: Seismic Analysis of Safety RelatedNuclear Structures and Commentary.
3.1. General Comparison of Standards and Regulations
The main steps of the design of seismic resistant NPPs structures according to different standardswill be studied now in order to compare the east and west standards.
Earthquake levels:
Almost all standards use two levels of earthquake: Despite that the terminology as well as thedefinition of maximal estimated earthquake is very different, according to the practice east - west.The earthquake with annual probability 10 is assumed as the maximal estimated earthquake in allcountries. Some countries ( Germany) use the maximal earthquake only. (Ref. Table 3.).
Table 3. Comparison of Earthquake Levels
Standard, Regulation
IAEA 50-SG-S1Initial Soviet VSN 15-78Current RussianPiNAE G-5-006-87USA (SRP, RG)Germany KTA 2201.1
Lower Design EarthquakeLevelSL-1DE
the sameOBE
-
Higher DesignEarthquake Level
SL-2MDE
the sameSSEMCE
Notes:1. The SL-1 level corresponds to an earthquake often denoted as Operational Basis Earthquake
(OBE).2. The SL-2 level earthquake corresponds to an earthquake level denoted as Safe Shutdown
Earthquake (SSE).3. Design earthquake (DE) is an earthquake which may occur one times per 102 years. The plant
should remain functional during and after DE.
157

4. Maximal Design Earthquake (MDE) is an earthquake which may occur one times per 10 years.5. The Operating Basis Earthquake (OBE) is an Earthquake which, considering the local geology
and seismology and specific characteristic of local subsurface material, could reasonably beexpected to affect the plant site during the operating life of the plant. It is the current practice inthe US that the OBE is taken one-half of the SCE ground motion.
6. The Safe Shutdown Earthquake (SCE) is that earthquake which is based upon an evaluation ofthe maximum earthquake potential considering the regional and local geology and seismologyand specific characteristic of local subsurface material. It is that earthquake which produce themaximum ground motion for which the safety-related structures, systems and components aredesigned to remain functional.
7. KTA 2201.1 requires only the higher design earthquake level - Maximum Credible Earthquake(MCE).
There is no minimum Peak Ground Acceleration value (PGA) for the higher earthquake inSoviet/Russian standards and regulations for seismic design of NPPs as recommended f.e. by theIAEA document (0,10 g).
3.2. Seismic Categorisation of Structures
Seismic categorisation of structures systems and components according to their relationship to safeshutdown of the reactor is assumed in all standards. The Russian standards use more detailedseismic categories, I, la, Ib, III, but there are no substantial differences in the definition ofbuildings, structures and technology involved in seismic category
3.3. Determination of Seismic Forces
3.3.1. Structural Seismic Analysis according VSN 15-78
Seismic analysis of the structures according to the VSN 15-78 is based on the utilisation ofequivalent static seismic forces. These forces are determined by the method of modal analysis ofthe structure using additional coefficients expressing the features of the structure, of the soil,damping etc.
The seismic forces have to be determined according to the relations of the common USSRseismic standard SNiPII-A. 12-69 with some modifications which are described in the VSN-15-78.Seismic forces are calculated according to the formula given in the SNiPII-A. 12-69 and modifiedby VSN-15-78:s ik - m Qk Ks Pi T| & (1)
where it is:m - coefficient according to the VSN 15-78
m = 2,5 for buildings of 1st seismic categorym = 1,0 for buildings of 2nd and 3rd seismic
categoryQk - weight concentrated in the node "k"
Ks - seismic coefficient according to the table 6.
(3} - dynamic coefficient, Pj = 1/Tj < 3,0
>0,8for structures with low damping (towers etc.)
158

for structures without effective shearwalls and with the ratio of the height of co-lumns their width equal to 25 or higher coefficient p should be multiplied by thefactor 1,5 ,with the ratio equal to 15 or less coefficient p should be not increased.
- modal analysis factor - ref. Eq.(2)
Modal analysis factor is determined in accordance with the equation:
"Hik =Xi(xk) I Qj.Xi(xj)
(2)
Seismic load will be increased for buildings with the number of floors n > 5 by the factorl+(n-5) but not higher than 1,5 and for the buildings of precast big elements or concrete cast in situwalls by the factor l+0,06(n-5) but not higher than 1,3. Only one factor, higher from the factor forincreasing the value B or the factor taking into account the number of floors should be used in thecalculation of seismic loads.According to VSN-15-78 furthermore it is necessary to take into account local site conditions.Local site geological and hydrogeological are introduced into consideration by correspondingregulation of site intensity (ref. Table 4.).
Table 4. Influence of Local Geological and Hydrological Conditions
Category of the Soil
I. Category of the soil:rock or soil with big pieces andunderground waterlevel h = > 15 m
II. Category of the soil:disintegrated rock with big pieces and undergroundwater level 6 < = h < = 1 Omor sand and clay soil, h >= 8m
III. Category of soil disintegrated rock with bigpieces, underground water level h < = 3 m, orsand and clay soil h < 4 m
Site Intensity (ball)
4 5. 6 7 &
3 4 5 6 7
4 5 6 7 8
5 6 7 8 9
Seismic intensity is furthermore adapted according to the Table 5.
159

Table 5. Seismic Intensity According Seismic Category of Buildings
Characteristics of the building
NPP buildings and structures seismic category I. and II.
NPP buildings and structures seismic category III.
Seismic Intensity for theCalculation (ball)
4 5 6 7 8
5 6 7 8 9
4 5 6 7 8
Seismic coefficient should be determined with the respect to the resulting calculationseismic intensity using the Table 6. It should be noted that the seismic intensity used in thecalculation can be different for different buildings on the same site
Table 6. Seismic Coefficient Ks ( SNiP II-A. 12-69 )
DeterminedSeismic Intensity
(ball)
Coefficient Ks
4
0,003
5
0,006
7
0,025
6
0,013
8
0,050
9
0,100
3.2. Structural Seismic Analysis According PiNAE G-5-006-87
The standard PiNAE G-5-006-87 constitutes an extension of the general Russian seismic standardSNiP II-7-81
The seismic analysis of building and structures of seismic categories I and II according tothe standard PiNAE G-5-006-87 can elaborated by the help of static equivalent forces determinedby the formula:
Sik = Kc-K2Kli;.QK-A-p.-Tiik (3)
where it is:
K. £ is the coefficient taking into account the specific conditions of the operation of NPPand it is assumed:
for structures of the first seismic category
160
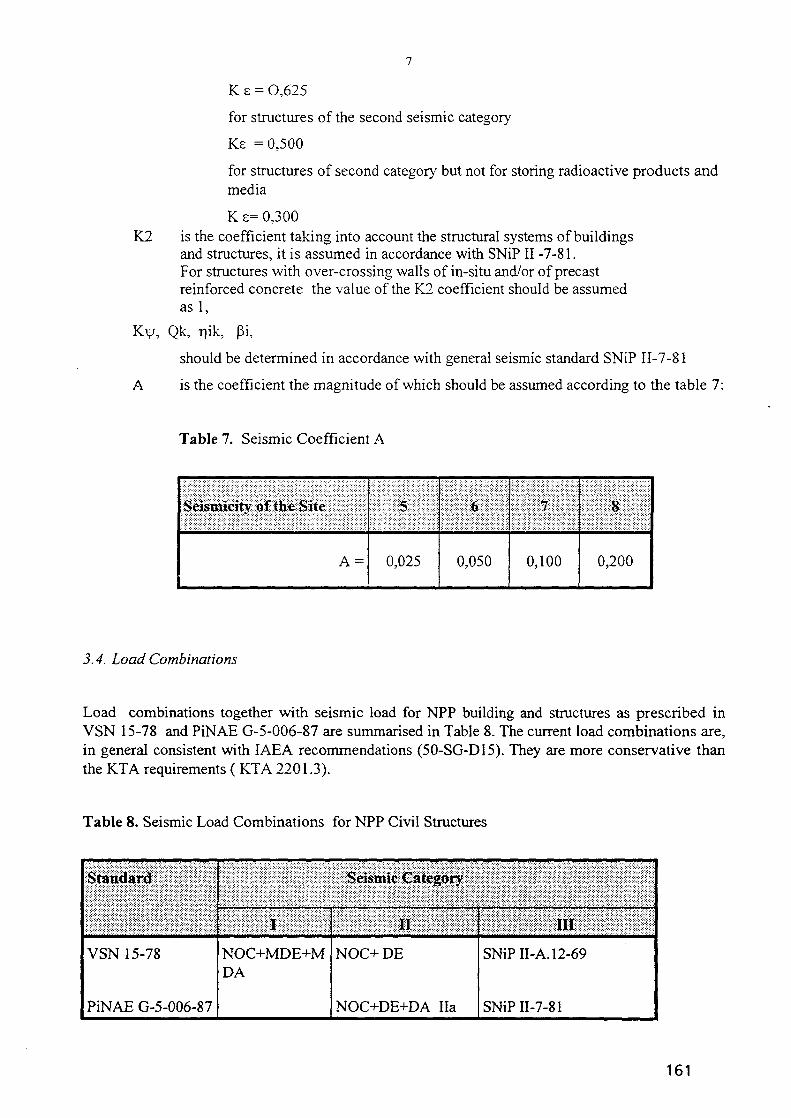
K s = 0,625
for structures of the second seismic category
Ke = 0,500
for structures of second category but not for storing radioactive products andmedia
K e= 0,300K2 is the coefficient taking into account the structural systems of buildings
and structures, it is assumed in accordance with SNiP II -7-81.For structures with over-crossing walls of in-situ and/or of precastreinforced concrete the value of the K2 coefficient should be assumedas 1,
Kv|/, Qk, T]ik, pi,
should be determined in accordance with general seismic standard SNiP II-7-81
A is the coefficient the magnitude of which should be assumed according to the table 7:
Table 7. Seismic Coefficient A
A =
Illliill
0,025
illlill
0,050
Illllll
0,100
Illllllll
0,200
3.4. Load Combinations
Load combinations together with seismic load for NPP building and structures as prescribed inVSN 15-78 and PiNAE G-5-006-87 are summarised in Table 8. The current load combinations are,in general consistent with IAEA recommendations (50-SG-D15). They are more conservative thanthe KTA requirements ( KTA 2201.3).
Table 8. Seismic Load Combinations for NPP Civil Structures
Standard
VSN 15-78
PiNAE G-5-006-87
Seismic Category
I
NOC+MDE+MDA
nNOC+ DE
NOC+DE+DA Ha
mSNiP II-A. 12-69
SNiPII-7-81
161

NOC+MDE
ANOC+MDE
NOC+DE+DA
NOC+DE lib
ANOC+DE lib
NOC - Normal Operational ConditionMDE - Maximal Design EarthquakeMDA - Loads due to Postulated Maximal Design AccidentANOC - Abnormal Operational Conditions
3.5. Ductility of Structures
Unfortunately there are no detailed instructions in all standards about the utilisation of ductility ofstructures, despite the fact that the positive influence of structural ductility to bearing capacity ofstructures in the case of earthquake is well known from the literature as well as from realearthquakes. Most probably the coefficient K in soviet standard PiNAE G-5-006-87 (Ks = 0,625for Category I structures) refers to the ductility of structures, but on the other hand this coefficientcan be used without limits for all structures (ductile and non ductile) according this standard.
3.6. Soil Structure Interaction (SSI)
Soil structure interaction is very important for the structures based on the soft soil, but there are noinstructions or recommendations in both Soviet/Russian Standards and in Interatomenergo standardreferring to this problem. The influence of soil to the seismic response of structures is inSoviet/Russian Standards introduced by the soil quality dependent ground response spectrum andby changing of the seismic intensity of the site (ref. Table 4).
3.7. Damping of Seismic Structural Vibrations
Damping of seismic structural vibrations recommended in different standards, east and west, is verysimilar. Values of damping recommended for most important structures are presented in Table 9.
162
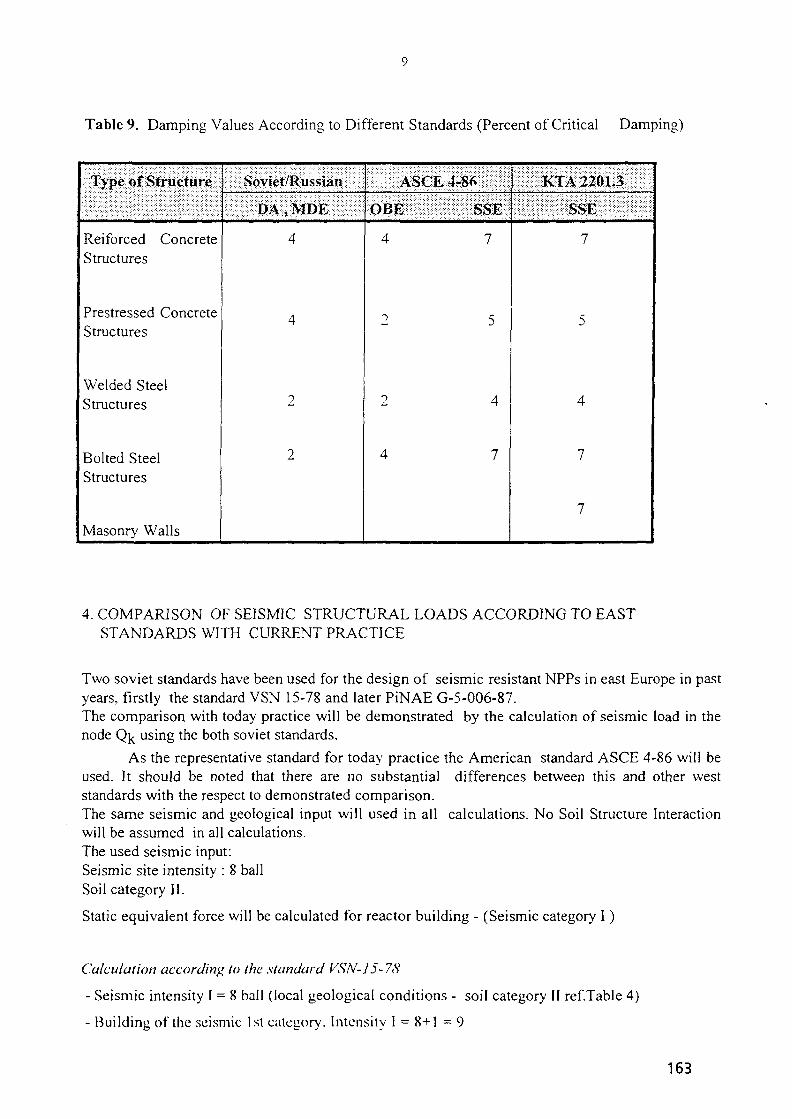
Table 9. Damping Values According to Different Standards (Percent of Critical Damping)
liillilllllll
Reiforced ConcreteStructures
Prestressed ConcreteStructures
Welded SteelStructures
Bolted SteelStructures
Masonry Walls
:lllilB.BiIl
4
4
t-o
t-o
pilllllllllli!4 7
~> 5
2 4
4 7
||f|pPt;llP#I:§;;liliiiii||p#i:|lilil
• • : • • • • : • • - : - : • • • : • : • . : • - • • : - . - . : • : • • • • . • • : : • • • • - " • : • : • . • : • • • ; • : • : • : • '
7
4
7
7
4. COMPARISON OF SEISMIC STRUCTURAL LOADS ACCORDING TO EASTSTANDARDS WITH CURRENT PRACTICE
Two soviet standards have been used for the design of seismic resistant NPPs in east Europe in pastyears, firstly the standard VSN 15-78 and later PiNAE G-5-006-87.The comparison with today practice will be demonstrated by the calculation of seismic load in thenode Qk using the both soviet standards.
As the representative standard for today practice the American standard ASCE 4-86 will beused. It should be noted that there are no substantial differences between this and other weststandards with the respect to demonstrated comparison.The same seismic and geological input will used in all calculations. No Soil Structure Interactionwill be assumed in all calculations.The used seismic input:Seismic site intensity : 8 ballSoil category II.
Static equivalent force will be calculated for reactor building - (Seismic category I )
Calculation according to the standard VSN-15-78
- Seismic intensity 1 = 8 ball (local geological conditions - soil category II ref.Table 4)
- Building of the seismic 1st category. Intensity I = 8+1 = 9
163

10
- factor with the respect to number of floors = 1,0
- factor for increasing coefficient p was adopted 1,0
- coefficient for buildings of 1st category m = 2,5
- seismic coefficient Ks for increased Intensity 9 is Ks=0,100 ref. Table 6.
- maximal value of pi is for fi > 2,85 Hz, pj = 3,0
Maximal modal force in the node k and for the frequency i is:
S i k = 0,75-Qk
where it is: Qk weight in the node "k"
r]jk modal factor
Calculation according the standard PiNAE G-5-006-87
The coefficients of the equation for equivalent static forces according to assumed input are:
- Ke= 0,625 conditions of the NPP operation
- K-2 = 1,00, structural solution
- K \\> = 1,00 type of structure
- A = 0,20 for the intensity 8 ball
- Pi = 2,7 value for fj > 2,43 Hz
Maximal modal force in the node k for the frequency fj is:
S i k = 0,3375.QkTl ik
Calculation according to the standard ASCE 4-86
Seismic and geological input is the same as before but following data must be added.
- ground acceleration corresponding to the site intensity 8 ball is assumed to be cca 0,25 g as themaximum.
- structural damping is 5 %
- the amplification factor for the site-independent response spectra (acceleration) is 2,71, (ref.ASCE 4-86)
maximal acceleration spectral value is 2,71 .0,25 = 0,677g for fj in the interval 1,5-10 Hz.
Maximal modal force in the node k and for the frequency fj is
Sik = Sa.Qk.-pile = 0,677 .Qk . r | i k
Comparison of the results
The comparison of the modal forces determined using different standards is presented in Table 10.The modal force obtained according to ASCE 4-86 is denoted as 100 %
164
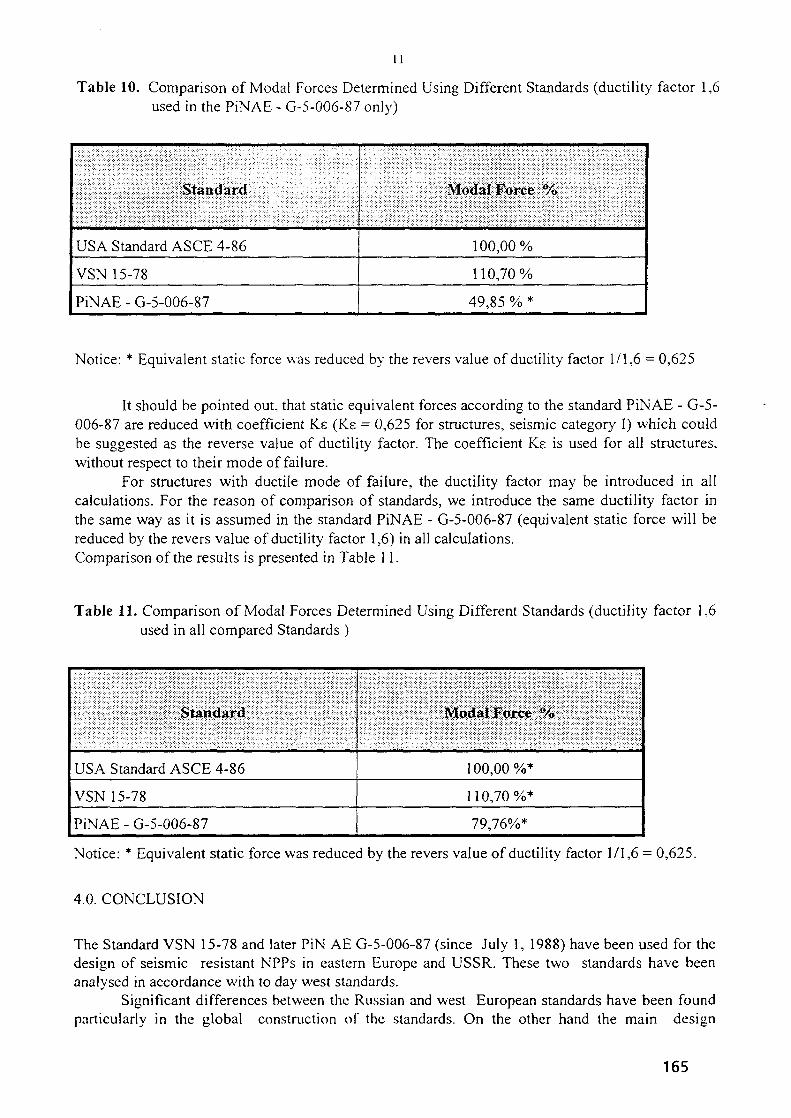
11
Table 10. Comparison of Modal Forces Determined Using Different Standards (ductility factor 1,6used in the PiNAE - G-5-006-87 only)
Standard
USA Standard ASCE 4-86
VSN 15-78
PiNAE - G-5-006-87
Modal Force %
100,00%
110,70%
49,85 % *
Notice: * Equivalent static force was reduced by the revers value of ductility factor 1/1,6 = 0,625
It should be pointed out, that static equivalent forces according to the standard PiNAE - G-5-006-87 are reduced with coefficient Ke (Ke = 0,625 for structures, seismic category I) which couldbe suggested as the reverse value of ductility factor. The coefficient Kg is used for all structures,without respect to their mode of failure.
For structures with ductile mode of failure, the ductility factor may be introduced in allcalculations. For the reason of comparison of standards, we introduce the same ductility factor inthe same way as it is assumed in the standard PiNAE - G-5-006-87 (equivalent static force will bereduced by the revers value of ductility factor 1,6) in all calculations.Comparison of the results is presented in Table 11.
Table 11. Comparison of Modal Forces Determined Using Different Standards (ductility factor 1,6used in all compared Standards )
Standard
USA Standard ASCE 4-86
VSN 15-78
PiNAE - G-5-006-87
Modal Force %
100,00%*
110,70%*
79,76%*
Notice: * Equivalent static force was reduced by the revers value of ductility factor 1/1,6 = 0,625.
4.0. CONCLUSION
The Standard VSN 15-78 and later PiN AE G-5-006-87 (since July 1, 1988) have been used for thedesign of seismic resistant NPPs in eastern Europe and USSR. These two standards have beenanalysed in accordance with to day west standards.
Significant differences between the Russian and west European standards have been foundparticularly in the global construction of the standards. On the other hand the main design
165

12
philosophy of all standards is very similar. It is very difficult to compare the main parameters asdamping value, load combinations etc. of west and Soviet standards, because different methods forthe evaluation of structural seismic forces are assumed. In order to overcome this problem thecomparison of resulting seismic forces according to two cited Soviet Standards and the USAASCE-64 Standard has been elaborated in this contribution. The results of this comparison arepresented in the section 4. of this contribution.
On the basis of this comparison it can be theoretically concluded that despite somedifferences the structural seismic forces calculated according to Soviet-Russian Standards are ingood relation to that one determined by west standards. It seems that the standard VSN 15-78 wasvery conservative and the new Soviet-Russian Standard PiNAE G-5-006-87 is less conservative,because it uses the effect of ductility of structures or other effects increasing their bearing capacitywithout respect to their characteristics.
It should be pointed out, that the comparison of calculations according to different standardswas elaborated without respect to Soil Structure Interaction, because there are no recommendationsor comments to this problem in both Soviet standards. The results of comparison could be verydifferent when SSI will be included, particularly in the case of foundations on soft soil. Accordingto the authors experience, usually the substantial problems have not been caused by the utilisationof Soviet Standards, but mainly by their not correct interpretation in the practice. The improvedSoviet seismic Standard PiNAE - G-5-006-87 came too late (valid since July 1988) and not exactlydefined methodology have been used for designs of NPPs for a long period.
From all above mentioned reasons the comparison elaborated here cannot be generalised anddetailed seismic verification will be always necessary in concrete cases of seismic upgrading ofNPPs WWER-type. However, despite that the authors of this paper do believe that here presentedcomparison of east and west standards can contribute to better understanding of initial seismicdesigns of VVER -type NPPs.
REFERENCES
[11 David, M., Benchmark Study for Seismic Analysis and Testing of WWER-Type NPPs,Standards, Criteria, Comparativ Study, Prague, 1994
[21 Masopust, R., Benchmark Study for Seismic Analysis and Testing of WWER-Type NPPs,OriginalSeismic Design Data and Application ofSMA and GIP Methodolodogies -Volume 1, Pilsen, 1994
131 Newmark, N.,M., Fundamentals of Earthquake Engineering, Prentice-Hall, Inc. EnglewoodCliffs, N. Y., 1980
[41 Birbraer A., N, Sulman, S.,G., Procnost i Nadeznost Konstrukcij AESpri Osobychdynamiceskich Vozdejstvijach, Energoatomizdat, Moskva 1989
151 WolfJ., P., Dynamic Soil-Structure Interaction, Prentice-Hall, Inc.,Englewood Cliffs, N.J.07632
STRUCTURAL SEISMIC ANALYSIS
VSN 15-78
166

1 • 2 0 XA9952654
PROCEEDING OF SMiRT 13 - POST CONFERENCE SEMINAR NO. 16
SEISMIC EVALUATION OF EXISTING NUCLEAR FACILITIES
SEISMIC PRA, APPROACH AND RESULTS
Robert D. Campbell
EQE International
ABSTRACT: During the past 15 years there have been over 30 Seismic Probabilistic Risk
Assessments (SPRAs) and Seismic Probabilistic Safety Assessments (SPSAs) conducted of
Western Nuclear Power Plants, principally of US design. In this paper PRA and PSA are used
interchangeably as the overall process is essentially the same. Some similar assessments have been
done for reactors in Taiwan, Korea, Japan, Switzerland and Slovenia. These plants were also
principally US supplied or built under US license. Since the restructuring of the governments in
former Soviet Bloc countries, there has been grave concern regarding the safety of the reactors in
these countries. To date there has been considerable activity in conducting partial seismic upgrades
but the overall quantification of risk has not been pursued to the depth that it has in Western
countries. This paper summarizes the methodology for Seismic PRA/PSA and compares results of
two partially completed and two completed PRAs of soviet designed reactors to results from earlier
PRAs on US Reactors. A WWER 440 and a WWER 1000 located in low seismic activity regions
have completed PRAs and results show the seismic risk to be very low for both designs. For more
active regions, partially completed PRAs of a WWER 440 and WWER 1000 located at the same
site show the WWER 440 to have much greater seismic risk than the WWER 1000 plant. The
seismic risk from the 1 OOOmw plant compares with the high end of seismic risk for earlier seismic
PRAs in the US. Just as for most US plants, the seismic risk appears to be less than the risk from
internal events if risk is measured is terms of mean core damage frequency. However, due to the
lack of containment for the earlier WWER 440s, the risk to the public may be significantly greater
due to the more probable scenario of an early release. The studies reported have not taken the
accident sequences beyond the stage of core damage hence the public heath risk ratios are
speculative.
1. INTRODUCTION
Internal event PRAs have been conducted in the US for a period of about 20 years. The
addition of seismic and other external events to these studies followed shortly. In the early 1980's
the USNRC sponsored a Seismic Safety Margins Research Program (SSMRP) to study
methodology and results for PRAs. Reference 1 is a summary of the overall program and results.
Concurrently, several utility sponsored PRAs, including seismic and other external events were
conducted. These earlier studies were driven primarily by the regulators to address seismic risk at
perceived high risk sites due either to the population density or due to technical issues related to the
P:\950000\100\TECHPAPR.DOC/irv
167
2-20
design bases. A PRA Procedures Guide, (Ref. 2) was developed in 1983 to provide guidance on the
conduct of PRAs. The guide was focused primarily on internal event analysis with some general
guidance on seismic and other external events.
In 1988 a Severe Accident Policy (Ref 3) initiated by the US regulators required all operating
Nuclear Power Plants (NPPs) to conduct PRAs for internal events. Supplement 4 to the Severe
Accident Policy (Ref. 4) required that external events, with emphasis on seismic and internal fire,
be included. For seismic events, the regulators allowed the utility to choose between a
deterministic seismic margins approach and PRA. For the highest seismic activity sites, PRA was
mandatory.
Throughout the evolution of PRAs in the US, several Western Countries also commissioned
PRAs including seismic events. The methodology for seismic PRAs has stayed basically the same,
however, several technical enhancements have evolved.
Since the restructuring of the governments in the former Easter Bloc countries, there has been
significant concern expressed by people in these countries and in neighboring counties regarding
the safety of the Russian designed reactors. To date there have been a few PRAs completed or
partially completed to address these safety concerns.
This paper will present a summary of the overall methodology for seismic PRA, then
summarize seismic PRA activities for Water Cooled Water Moderated Energy Reactors (WWERs)
at three sites and compare the results to earlier published PRAs of US Plants.
2. OVERVIEW OF METHODOLOGY
The key elements of a seismic PRA are:
1. Seismic hazard analysis - estimation of the frequency of various levels of
seismic ground motion (acceleration) occurring at the site
2. Seismic fragility evaluation - estimation of the conditional probabilities of
structural or equipment failure for given levels of ground acceleration
3. Systems/accident sequence analysis - modeling of the various combinations
of structural and equipment failures that could initiate and propagate a
seismic core damage accident sequence
4. Evaluation of core damage frequency and public risk - assembly of the
results of the seismic hazard, fragility and systems analyses to estimate the
frequencies of core damage and plant damage states; assessment of the
impact of seismic events on the containment integrity; and integration of
PA<lS0<)<X>\l(X)\TECHPAPR.i:>OC/irv
168

3 - 2 0
these results with the core damage analysis to obtain estimates of seismic risk
in terms of effects on public health
The process is shown schematically in Figure 2-1.
Following is a brief description of the four steps utilized in the PRA process.
nt sequences
Peak Q:ou"C icce>.
Plant sj/eiy systemsB
BPV fupiuies
Fault treeSystem B
failure cue to non-seismic \ iseismic inpul failure
Figure 2-1: Schmatic Overview of a Seismic PSA
Seismic Hazard Analysis
Seismic hazard is usually expressed in terms of the frequency distribution of the peak value of
a ground motion parameter (e.g., peak ground acceleration) during a specified time interval. The
different steps of this analysis are as follows:
1.
2.
3.
Identification of the sources of earthquakes, such as faults and seismotectonic
provinces.
Evaluation of the earthquake history of the region to assess the frequencies of
occurrence of earthquakes of different magnitudes or epicentral intensities.
Development of attenuation relationships to estimate the intensity of
earthquake-induced ground motion (e.g., peak ground acceleration) at the
site.
4. Integration of the above information to estimate the frequency of exceedance
for selected ground motion parameters.
The hazard estimate depends on uncertain estimates of attenuation, upperbound magnitudes,
and the geometry of the postulated sources. Such uncertainties are included in the hazard analysis
by assigning probabilities to alternative hypotheses about these parameters. A probability
P:\950O00\100\TECHPAPR.DOC/irv
169

4 - 2 0
distribution for the frequency of occurrence is thereby developed. The annual frequencies for
exceeding specified values of the ground motion parameter are displayed as a family of curves with
different probabilities (Figure 2-2).
10
0.01
Peak Ground Acceleration (g)
Figure 2-2: Typical Seismic Hazard Curves for a Nuclear Power Plant Site
Seismic Fragility Evaluation
The methodology for evaluating seismic fragilities of structures and equipment is summarized in
References 2 and 5. Seismic fragility of a structure or equipment item is defined as the conditional
probability of its failure at a given value of the seismic input or response parameter (e.g., peak
ground acceleration, stress, moment, or spectral acceleration). Seismic fragilties are most
commonly referenced to peak ground acceleration and this definition will be used in this paper. The
best estimate of seismic capacity is developed and is defined as the peak ground motion
acceleration value at which the seismic response of a given component located at a specified point
in the structure exceeds the component's resistance capacity, resulting in its failure. The ground
acceleration capacity of the component is estimated using information on plant design bases,
responses calculated at the design analysis stage, as-built dimensions and material properties.
There are many variables in the estimation of this ground acceleration capacity, thus, the
distribution on the capacity is also quantified. Component fragility is described by a family of
fragility curves; a probability value is assigned to each curve to reflect the uncertainty in the
fragility estimation (Figure 2-3).
P:\950000\l 00\TnCHPAPR.DOC/irv
170

5 - 2 0
0)
(6LJL
"IQ L
"TOco
coO
SSE
Peak Ground Acceleration, g
Figure 2-3: Typical Family of Fragility Curves for a Component
Analysis of Plant Systems and Accident Sequences
Frequencies of severe core damage and radioactive release to the environment are calculated by
combining plant logic with component fragilities and seismic hazard estimates. Event and fault
trees are constructed to identify the accident sequences that may lead to severe core damage and
radioactive release.
The plant systems and sequence analyses used in seismic PRAs are based on the PRA
Procedures Guide (Reference 2) and can generally be summarized as follows:
1. The analyst constructs fault trees reflecting (a) failures of key system
components or structures that could initiate an accident sequence and (b)
failures of key system components or structures that would be called on to
stop the accident sequence.
2. The fragility of each such component (initiators and mitigators) is estimated.
P:\950000\100\TECHPAPR.DOC/irv
171

6-20
3. Fault trees are used to develop Boolean expressions for severe core damage
that lead to each distinct plant damage state sequences.
4. Considering possible severe core damage sequences and containment
mitigation systems, Boolean expressions are developed for each release
category.
As an example, the Boolean expression for severe core damage in a prior Probabilistic Safety
Study is:
MS = 4 + 8 + 10 + 14 + 17 + 21 + (12 + 22 + 26) * 9 (2-1)
The numbers represent components for which seismic fragilities have been developed. The
symbols "+" and "*" indicate "OR" and "AND" operations, respectively. Plant level fragility
curves are obtained by aggregating the fragilities of individual components according to Equation
2-1, using either Monte Carlo simulation or numerical integration. The plant level fragility is
defined as the conditional probability of severe core damage as a function of the peak ground
acceleration at the site. The uncertainty in plant level fragility is displayed by developing a family
of fragility curves; the weight (probability) assigned to each curve is derived from the fragility
curves of components appearing in the specific plant damage state accident sequence.
Evaluation of Core Damage Frequency and Public Risk
Plant level fragilities are convolved with the seismic hazard curves to obtain a set of doublets
for the plant damage state frequency,
fij> } (2-2)
where fjj is the seismically-induced plant damage state frequency and py is the discrete
probability of this frequency.
Pij = qipj (2-3)
fij = If, (a)—-1 da (2-4)da
Here, Hj represents the j t n hazard curve, fj the i tn plant damage fragility curve; q\ is the
probability associated with the i*h fragility curve and p; is the probability associated with the j m
hazard curve.
The above equations state that the convolution between the seismic hazard and plant levelfragility is carried out by selecting hazard curve j and fragility curve i; the probability assigned tothe plant damage frequency resulting from the convolution is the product of the probabilities p; and
P:\950000\100\TECHPAPR.DOCirv
172

7-20
qj assigned to these two curves. The convolution operation given by Equation 2-4 consists of
multiplying the occurrence frequency of an earthquake peak ground acceleration between a and a +da (obtained as the derivative of Hj with respect to a) with the conditional probability of the plant
damage state, and integrating such products over the entire range of peak ground accelerations 0 to
oo. In this manner, a probabilistic distribution on the frequency of a plant damage state can be
obtained.
Severe core damage occurs if any one of the plant damage states occurs. By probabilistically
combining the plant damage states, the plant level fragility curves for severe core damage are
obtained. Integration of the family of fragility curves over the family of seismic hazard curves
yields the probability distribution function of the occurrence frequency of severe core damage
(Figure 2-4). By extending this procedure, probability distribution functions of the occurrence of
different release categories are obtained.
1.0
OC-o
oo
2oolCDOc
CDOX
LUco
0.8
0.6
0.4
0.2
0
L /r /
/
/
/ -
/ Range For
/ Severe Core
_/ — Damage Frequency
/] /i
!
1 1
10" 10" 10
Annual Severe Core Damage Frequency
Figure 2-4: Probability Distribution of Seismically-Induced Severe Core Damage Frequency
Public risks in terms of early fatalities, long term adverse health effects, and property damage
are evaluated by developing a site-consequence model and inputting the release frequencies
calculated above. This analysis would produce seismic risk curves showing frequencies of
exceedance at different levels of consequences.
Fragility Cutoff Methodology
It is not practical to calculate fragilities for all components which are included in the risk
modeling. Most components and distributive systems are inherently rugged and can be screened
out on the basis that their seismic induced failure rate is low in comparison to the items which will
ultimately dominate seismic risk. It is desirable to establish a fragility target above which
components exceeding this target may be screened out.
l':\950000\IOO\TnCHPAPR.DOC/irv
173

8-20
In developing the target, three variables must be considered; seismic hazard, uncertainty in the
median fragility and frequency of failure (potential core damage) relative to that for other events. A
fourth variable, consequence of failure is important, but for purposes of establishing a fragility cut
off it is assumed that all failures have equal consequence. Parametric studies are usually conducted
using the hazard and candidate fragility curves as input variables and examining the resulting
failure frequency.
Seismic Hazard: NUREG-1407, Ref 6 provides guidance for the US IPEEE program. It states
that the seismic hazard must be carried out to 1.5g unless sensitivity studies can show that a lower
cutoff is justified. Previous fragility cutoff studies with cut offs at 1.0 and 1.5g have shown that for
low capacity components, the extension of the hazard does not make a significant difference but at
the fragility level that was ultimately determined to be an acceptable cutoff, there was enough
difference between the 1.0 and 1.5g cutoff results that the cutoff decision was based on a 1.5g
cutoff.
Uncertainty in the Median Fragility: The uncertainty range for fragilities varies with the
failure mode. For ductile modes of failure, such as for structures or piping, the margin to failure
relative to code allowables is larger than for brittle or functional failure modes but the uncertainty is
also larger so that dual criteria must be implemented to establish a minimum value of the median
capacity and of the HCLPF.
HCLPF is an acronym for high-confidence-of-low-probability-of-failure. It is defined
mathematically as 95% confidence of less than 5% probability of failure. The fragility curve isusually described by the median, Am, the randomness, BR, and uncertainty, BTJ, where the Bs are
logarithmic standard deviations. For an assumed lognormal distribution the HCLPF may be
computed from:
HCLPF = Am exp (1.65) (BR + By)
For ductile failure modes of flexible systems, such as for structures, the ratio of median to
HCLPF is typically about three or greater. For brittle failure modes of rigid equipment or
functional failure modes such as relay chatter, the ratio of median to HCLPF can be as low as two.
Thus, for the same seismic failure rate, the flexible, ductile items must have a higher median but
may have a lower HCLPF than for a non-ductile failure mode.
Numerous case studies conducted to determine the fragility level for screening reveal that the
seismic failure rate is more sensitive to HCLPF than median. Often it is more convenient to
estimate or compute a deterministic HCLPF for making decisions on screening. The final cutoff
value for fragility may then be targeted to a HCLPF value, wherein the median value is implied,
depending upon the failure mode. Establishment of a HCLPF above the cutoff target is the
approach usually used for screening of structures and equipment.
P-^OCKXA 100\TECHPAPR.DOC/irv

9-20
Failure Rate Relative to Other Event Failure Rates: Core damage from internal events usually
governs the plant risk. Internal event core damage frequencies typically are on the order of 1E-5 or
greater. Seismic failures that could contribute more than 10% of this should not be screened out so
an approximate target for screening is a seismic failure rate of 1E-6 or less. Surrogate fragilities
representing the screening level are then used for the top event in any fault tree where all basic
events have been screened out.
The screening level is dependent upon the severity of the seismic hazard and the core damage
frequency of internal events. All significant parameters must be assessed to arrive at a rational and
defendable screening level.
3. CASE STUDIES, WESTERN VS. EASTERN EUROPEAN REACTORS
Over the past 15 years, there have been over 30 seismic PRA's conducted of Western nuclear
power plants, principally of U.S. design. Reference 7 summarized the author's insights from
participation in most of these studies. Since the political restructuring of the former Easter Block
countries, there has been much involvement of Western contractors in safety assessments and safety
upgrades of Russian designed NPPs. Seismic assessments of these plants has become of particular
importance in several countries. In conjunction with seismic upgrades being implemented on
several plants, some partial and some complete seismic probabilistic risk assessments have been
conducted. In this paper, the seismic risk from four WWER reactors has been summarized and is
compared to that for a sampling of U.S. reactors.
There are three generations of WWER-the 440-230, 440-213, and the 1000. The 440-230's
are the oldest design and the 1000's are the latest. The plants studied and summarized are a 440-
230 and a 1000 design at the same site in Bulgaria for which the seismic hazard is moderately
severe, a highly modified version of a 440-230 in Finland, and a new 1000 mw plant under
construction in the Czech Republic. The seismic hazard for the latter two sites is very low. The
WWER 440s studied had no special seismic design provision, but a number of seismic backfits
have been made. The WWER 1000's were designed for seismic loading. For the plant in Bulgaria,
the design level was less than current seismic hazard studies would suggest, but as will be shown,
there is a large seismic margin in most of the 1000 mw structures and equipment.
The first generation of WWER's produced 440 megawatts (WWER-440). The earlier model
230's are of greatest concern due to their lack of containment. Later model 213's incorporated a
bubble tower to condense steam released from a loss of coolant accident. This second generation
WWER-440 has improved safety features and can mitigate a large LOCA. The WWER-1000 has a
post-tensioned concrete containment and is very similar in system design to current generation
Western PWRs.
P:\9S0000\l00\TECHPAPR.DOOirv
175

10-20
The primary focus is on six reactors located at Kozloduy in Bulgaria, four WWER 440-230's
and two WWER-1000's, henceforth are subject to identical seismic hazards. The Loviisa 440 plant
in Finland and the Temlin 1000 mw plant in the Czech Republic are in low seismicity regions and
only the results are provided for comparison.
Probabilistic risk assessment methodology (PRA) was used to assess the risk due to internal
events and due to earthquakes. Because of the urgency in assessing the relative risk from various
aspects of the design and the external hazards, the initial study of the Kozloduy WWER 440's was
abbreviated to a "Top Level Risk Assessment" (TLRA), Reference 8, as opposed to a full PRA.
The Top Level Risk Assessment utilizes event tree methodology, but does not include the
development of detailed fault trees. The PRA for the WWER 1000's was a full PRA conducted in
much greater depth.
The Top Level Risk Assessment focused on internal event initiated accident sequences. A very
brief supplemental study was conducted to include seismic initiating events. At the time of the Top
Level Risk Assessment, the seismic hazards for the Kozloduy site had not been finalized; therefore,
an existing seismic hazards study of the Belene site (Reference 9) was used. Both sites are on the
Danube River and the hazard is dominated by seismic sources near Vrancea in Romania. The
recently completed PRA of the WWER 1000's utilized a site-specific hazard. The two seismic
hazards curves are compared in Figure 3-1. Although the hazard used for the earlier Top Level
Risk Assessment was greater, the results of the two studies show more than an order of magnitude
greater core damage frequency (CDF) for the older WWER 440's, whereas, there is only about a
factor of two difference in the hazards, i.e., the probability of exceedance of a given peak ground
acceleration is about a factor of two greater. Thus, comparison between the results for the two
designs are meaningful.
Hazard Curves for NPP KOZLODUY and BELENE
o
v\SELENE
i
- -
KOZLODUY
PEAK ACCELERATION (G)
Figure 3-1: Hazard Curves, Free Field Maximum Acceleration
l':W5OU()(>\IOOVn:CIII>Al'R.IXX7irv
176

11-20
Description of Reactors
The WWER 440's are designed as dual reactor complexes connected to a gallery complex
which is connected to the turbine building. Each structure is, however, on a separate foundation.
The reactor primary system and six steam generators are contained within a reinforced concrete
confinement which is designed for a one bar internal pressure. Upon exceedance of one bar
pressure, relief valves open and vent to the atmosphere. The confinement is sized to contain the
release from a 100 mm diameter pipe break, but with an orifice to choke flow. Neither the system
design nor the containment can mitigate or confine a larger break. The two later WWER 440's
have low pressure safety injection systems (LPSI), but the design basis loss of coolant accident
remains a 100 mm line break choked by an orifice.
The WWER 1000 has a post-tensioned concrete containment which, unlike western
containments, sits on top of the auxiliary building structure. Its safety systems are similar to
Western PWRs and can mitigate and confine a large loss of coolant accident.
The safety systems differ considerably between the two generations of reactors. In general, the
Russian reactors have three train safety systems, as compared to a two-train system in Western
PWRs. However, in the two earliest WWER 440's at Kozloduy, the service water system and DC
power system consist of three trains shared by two units. The service water system is also shared by
non-essential heat loads, thus increasing the vulnerability of the service water system.
The WWER 440's do not have a closed loop decay heat removal system. Long-term decay
heat removal is by means of heat exchangers on the secondary side that cool water circulated
through the steam generators. None of the WWER's have procedures for "feed and bleed" for
controlled depressurization of the primary system in the event of a loss of main and emergency
feedwater to the steam generators. Most Western PWRs have this capability.
The WWER 440's at Kozloduy do not have fast closing main steam isolation valves, thus there
is a risk of overcooling the embrittled reactor vessel in the event of a main steam line break.
The WWER 440's at Kozloduy do not have power-operated isolation valves for the primary
coolant letdown and filtration system, thus increasing the system boundary which could initiate a
loss of coolant accident. Table 3-1 compares the above features for the three Russian designs at
Kozloduy and modern Western designs.
Seismic Design Basis
The two earlier WWER 440's at Kozloduy did not have a seismic design basis. Soon after
operation, the two reactors experienced an earthquake in 1977 which was centered in Vrancea,
Romania. There was no seismic instrumentation at the site, but post-earthquake investigations
estimated about O.lg peak ground acceleration. One unit was manually scrammed and the other
P:\95OOOO\100\TECHPAPR.IX)C/irv
177

12-20
continued to operate. Post-earthquake damage investigation and analysis revealed that the steam
generators had moved about 11 cm and that the primary coolant piping was close to yielding. Some
minor structural damage was noted and repaired. The structural design of the WWER 440's outside
of the reinforced concrete confinement consists of primarily precast concrete columns, beams and
shear panels. The connection details are very weak and brittle, thus most of the essential structures
are vulnerable to large earthquakes. There is extensive use of unreinforced masonry walls for
interior walls. Some of these walls cracked during the 1977 earthquake.
Table 3-1
COMPARISON OF DESIGN FEATURES OF KOZLODUY AND WESTERN REACTORS
Function
Containment
Large LOCAMitigation
Closed LoopPrimary SystemDHR
Safety SystemRedundancy
Feed and Bleed
Fast Closing MSIVs
Letdown Isolation
Steam DrivenEmergency FeedPumps
Kozloduy1 & 2 WWER-440
1 bar confinement
No
No
3 train AC Power,3 train DC and
service water, sharedby two units
No
No
No
No
Kozloduy3 & 4 WWER-
440
1 barconfinement
No
No
3 train
No
No
No
No
Kozloduy5 & 6 WWER-
1000
Yes
Yes
Yes
3 train
No
Yes
Yes
No
Western PWRs
Yes
Yes
Yes
2 train
Yes (most)
Yes
Yes
Yes
Subsequent to the 1977 earthquake, selected upgrades were made to the primary system,
including the letdown filtration system to prevent a loss of coolant accident. These upgrades were
designed for a O.lg PGA and were incorporated into units 3 and 4 which were under construction at
the time. Some upgrades were made to the secondary system steam generators and DHR heat
exchanges, but as was discovered in a walkdown of the 4 units (Reference 10), many of the
[CKKA100\TKCI lI'APR.DOC/irv

13-20
upgrades were either not completed or were improperly constructed. Upgrades were not carried to
other essential equipment or to structures. At the time of the Top Level Risk Assessment there
were many unanchored essential equipments.
The two WWER 1000's were designed for O.lg PGA but, in many instances, the design is
standards for up to 0.3g PGA, thus there is a large margin in the main structure and in many
components.
The essential structures are cast-in-place reinforced concrete. A previous assessment of the
Belene reactor which was under construction in Bulgaria revealed that they could, for the most part,
meet design requirements for greater than 0.2g PGA (Reference 9). Most essential equipment is
properly anchored and supported, although a few exceptions were noted during a walkdown in
review of Reference 11. Much of the electrical and control cabinets are top braced so that they are
not as vulnerable to seismic input motions, as were many earlier U.S. plant installations.
Unreinforced masonry walls are not used in areas near essential equipment.
Although the current hazard study for the Kozloduy site suggest that the design basis should
have been for 0.2g PGA rather than O.lg, in general there is good detail and margin in this 1000
mw design.
Risk Models
WWER 440
The Top Level Risk Assessment for the WWER 440s focused primarily on internal events risk
to identify design vulnerabilities and develop concepts for cost-effective back fitting, including
construction of a "bunker system" for safe shutdown. The initial seismic activity was focused on
determining the magnitude of seismic backfit required to structures and equipment with and
without the bunker system. However, a previous study conducted for the International Atomic
Energy Agency (Reference 10) resulted in the development of some seismic fragility curves for
selected weak link components in the plant. These fragilities, along with some estimated structural
fragilities, were utilized in a simple Boolean expression to approximately quantify the seismic risk
in order to have a comparison with the risk from internal events. The simple Boolean utilized was
representative of units 3 and 4, but approximately represents all four of the WWER 440 units.
The weak links of essential systems were assumed to be the top event in the fault trees
representing AC power supply, AC power distribution, emergency feed water and safety injection.
The Boolean took credit for a "feed and bleed" capability in the event of loss of emergency feed
water, but no procedure for this was in place at the time of the study nor was it certain that the
power operated relief valves had the capability of performing this operation. Since failure of major
structures lead directly to core damage, the weakest structures were also represented.
I>:\950000\IOOVIIX'III'AI'K IXXVirv
179

14-20
The DC power system, control systems, and systems interactions, primarily block walls, were
not modeled. DC power appeared to be reasonably rugged except for numerous unreinforced
masonry walls. The control system was most vulnerable from lack of anchorage of relay cabinets.
Since the service water pump structures and diesel building were not any better than unreinforced
masonry walls, the walls were not included in the simple model. Also, it was recognized that a
major program for anchorage of equipment would be necessary, hence control cabinet anchorage
was not included in this first approximate quantification.
The convolvement of the hazard and fragility curves in the Boolean expression resulted in a
predicted core damage frequency (CDF) of 1.6 x 10" per year, more than an order of magnitude
greater than what would be acceptable in the Western world. This was, however, comparable to the
calculated CDF for internal events and the CDF estimated for fire. Using the later site-specific
hazard shown in Figure 3-1, the CDF was about 7.5 x 10 , still very high relative to Western
reactors. If a complete systems model were used, increasing the number of basic events, the CDF
would increase and likely be in the neighborhood of 1 x 10" .
Some subsequent studies utilizing detailed fault trees representing the AC power system,
service water system, emergency feed water system, low pressure injection system and high
pressure injection system were conducted to determine the sensitivity of the reactor to the various
sources of failures and to aid in setting priorities for upgrades. The major structures were also
included as in the initial quantifications. The service water and diesel building failures were
incorporated into the service water and AC power systems fault trees and the turbine building was
incorporated into the emergency feed water system fault tree. The fault trees contained the logic for
quantifying the top event taking into consideration multiple failure sources for the system such as
unreinforced masonry walls and electrical cable systems, as well as essential component failures.
Again, the DC system and instrumentation and control systems were not modeled for the reasons
previously given. Six accident sequences were modeled which included:
• Loss of core cooling
Small LOCA
• Very small LOCA (normal system leakage)
• Large LOCA
• Loss of reactor protection systems
• Failure of auxiliary building
Cases were run assuming no "feed and bleed" capability and "feed and bleed" capability. The
Belene seismic hazard, Figure 3-1, was used as was the case for the earlier TLRA model.
PiiaSOPOOUOOVTECHPAPR.DOC/irv
15-20
The overall results were not much different than the results using the simple Boolean
representing top events. The predicted core damage frequency for the case of no feed and bleed
was 1.46 x 10"3 per year, whereas the frequency considering feed and bleed was 1.39 x 10"6 per
year. The main difference between the earlier results without detailed fault tree modeling and the
more detailed fault tree model was that the earlier model assumed loss of offsite power as a given,
whereas in the fault tree model analysis, loss of offsite power was quantified.
Fussel-Vessely importance functions indicate the major contributors shown in Table 3-2.
Using the order of importance in Table 3-2, one can quickly assess cost-benefit of backfits.
Numerous cases were run assuming upgrades to the various systems. Cases were also run to
represent system design changes that would resolve the seismic issue without seismic upgrading.
In many cases, system changes were more effective than seismic backfits. It was, however, evident
that because of the numerous vulnerabilities, major backfits were required to result in a significant
reduction in seismic risk. Significant equipment anchorage and block wall reinforcement backfits
have been performed in the four units. Much of this backfitting, though, has only brought the plant
to a level to validate the assumptions in the simplified SPRA. Without backfitting the major
structures or building a dedicated safe shutdown system to replace systems in vulnerable buildings,
the risk reduction to date relative to the assumed base case in the simplified SPRA is less than a
factor of two.
WWER 1000
A seismic PRA for the 1000 mw plant is being conducted by Risk Engineering Ltd. in
Bulgaria, Reference 11, with assistance in the development of seismic fragilities by the Bulgarian
Academy of Science. A site-specific hazard curve is being used for this study (Figure 3-1). The
seismic and internal event PRAs are being conducted simultaneously. Guidance in performing the
seismic PRA is obtained from the PRA Procedures Guide, Reference 2, and IAEA Technical Guide,
Reference 5. The initiating events considered are:
• Reactor Vessel Rupture
• Large LOCA
• Medium LOCA
• Small LOCA
• Class 1 Transient, secondary cooling available
• Class 2 Transient, secondary cooling not available
P:\950000\100\TECHPAI'R.DOC/irv
181

16-20
Table 3-2
PERCENT CONTRIBUTION TO CORE DAMAGE AS DEFINED BY FUSSEL-VESSELY
IMPORTANCE FUNCTIONS
Failure
Loss of offsite power
400V vital bus
6.0 kv/400v transformer
Manual Operation of MOV
Service water gravity feed tank
Turbine building
Service water building
Deaerator
Chemical treatment plant
Brick wall, 6.0 kv bus
Brick wall, cables in SWPB
Pressurizer (large LOCA)
Cable path
6 kv vital bus
Auxiiiary building
Danube water pump building
Regenerative HX
Ion Filters
Diesel generator building
Pipeline, Confinement EWST
Contribution WithoutFeed and Bleed %
14.2
13.2
8.77
6.12
6.08
5.83
4.47
3.96
3.37
3.12
2.98
2.39
2.39
2.39
2.39
1.49
1.44
1.44
1.18
1.02
Contributions withFeed and Bleed %
13.2
14.6
9.76
6.47
7.40
3.87
5.47
3.42
<1
3.31
3.61
2.56
2.56
2.56
2.56
1.84
1.53
1.53
1.25
2.21
For each initiating event, the plant is assumed to be at full power and offsite power is assumed
to be unavailable. The internal event fault trees were modified to reflect the seismic induced failure
modes.
Fragilities of the main structure, primary coolant system, and major equipment in the ECCS
system were developed from 3D finite element analysis . The main structure response analysis
included the effects of soil-structure interaction. Probabilistic response analysis to develop
probabilistic floor spectra and structural loads was conducted using the Latin-Hypercube
OOOMOOYHXIII'AI'R IXKVirv

17-20
experimental design methodology developed in the Seismic Safety Margins Research Program
(SSMRP), Reference 12.
Fragilities for other equipment were developed for 38 generic categories of equipment.
Generic fragilities were obtained from Reference 13, provided that the walkdowns did not identify
any obvious seismic vulnerabilities. For cases where components appeared vulnerable, either
specific fragilities were developed or fixes were recommended to correct the potential problem.
Preliminary computation of core damage frequency results in a mean value of 1 x 10"5 per year
as compared to an internal event value of 3.7 x 10"4. The seismic risk is, however, underestimated
due to several factors. First, because of software limitations, the entire earthquake hazard range
was not utilized in the computation. The computed value represents the core damage frequency for
a single 10"5 nonexceedance probability earthquake which is about 0.26g pga. Second, the risk
model, derived from the internal events risk model, considers component failures in redundant
trains as being uncorrelated where, in fact, for seismic failures, the redundant trains are mostly
correlated. Third, in a few instances, either some backfitting is necessary in order for the generic
fragilities to be applicable or in a few instances, the generic fragilities derived for standard
equipment in the U.S. plants are not applicable to some unique construction features of the 1000
mw WWER equipment.
The author's opinion is that the final results will show a severalfold increase in core damage
frequency, but will still be an order of magnitude less than the current status of the adjacent WWER
440s. It is also anticipated that the seismic core damage frequency will be considerably less than
the currently computed internal event frequency of 3.7 x 10"4.
Reference 14 reports the results of the seismic PRA for Loviisa in Finland. Although the plant
has virtually no seismic design and has many seismic vulnerabilities relative to minimum seismic
design standards set by the IAEA, the hazard is very low and the computed mean CDF due to
seismic events is on the order of 10'7/year. Thus, there is not an incentive to do seismic upgrades
just because there are perceived weaknesses in equipment anchorage, etc.
A PSA for Temlin in the Czech Republic was just completed. The plant was originally
designed for 0.05g, but is being reassessed and upgraded to 0. lg prior to licensing. There are
existing components that do not currently meet the O.lg new design basis, however, the seismic
hazard is very low and the computed seismic induced CDF for the existing conditions is negligible,
as was the case for Loviisa.
4. CONCLUSIONS
The seismic risk of two generations of Russian designed reactors located at a moderately
seismically active site and at two low hazard sites has been compared and it is shown that for the
more seismically active region the seismic induced CDF from the earlier 440 mw units is about an
P:\95O(XK)\!<K)\TECHI'APR.IXX:/irv
183

18-20
order of magnitude greater without conducting significant backfits to the 440 mw units. There have
been many backfits conducted to date to increase the seismic capacity of the primary system and
supporting equipment, but none to date to essential structures which would now govern the risk.
Table 4-1 from Reference 15 compares internal and external event risk ol several U.S. reactors.
The highest contribution from seismic events to mean core damage frequency in the U.S. plants in
Table 4-1 is about 25% of the total CDF. In this case the mean annual seismic induced CDF is
about 6.25 x 10" /year, which is comparable to the estimated CDF for the 1000 mw plant. The
internal event CDF for the Kozloduy 1000 mw plant was computed to be about 3.7 x 10"4, thus
seismic induced CDF is estimated to be on the order of 20% of internal event CDF.
For the Kozloduy 440 mw plant, the initial internal event CDF from the TLRA was on the
order of 3 x 10" , or about twice the initial seismic risk. With current upgrades in the 440's, both
the internal event and seismic CDF are reduced. No quantification of the current status is available,
but the estimated risk from both internal and external events is anticipated to be up to an order of
magnitude greater than for the adjacent 1000 mw plants.
It can be concluded that simplified studies such as the seismic and internal event TLRA can be
a useful cost-benefit tool to set priorities for upgrades. It was in fact extremely useful to reach the
conclusion that beyond the initial activities to overcome some system design deficiencies and to
strengthen equipment and surrounding masonry walls, it is evident that major reconstruction is
necessary to bring the safety of the 440 mw units close to that of current Western designs. The
more detailed PRA of the 1000 mw units indicates that, with minor upgrades, the seismic safety of
Western plants can be approached.
I'AWOOOOMOOVI'IICHI'Al'R IXK.7irv
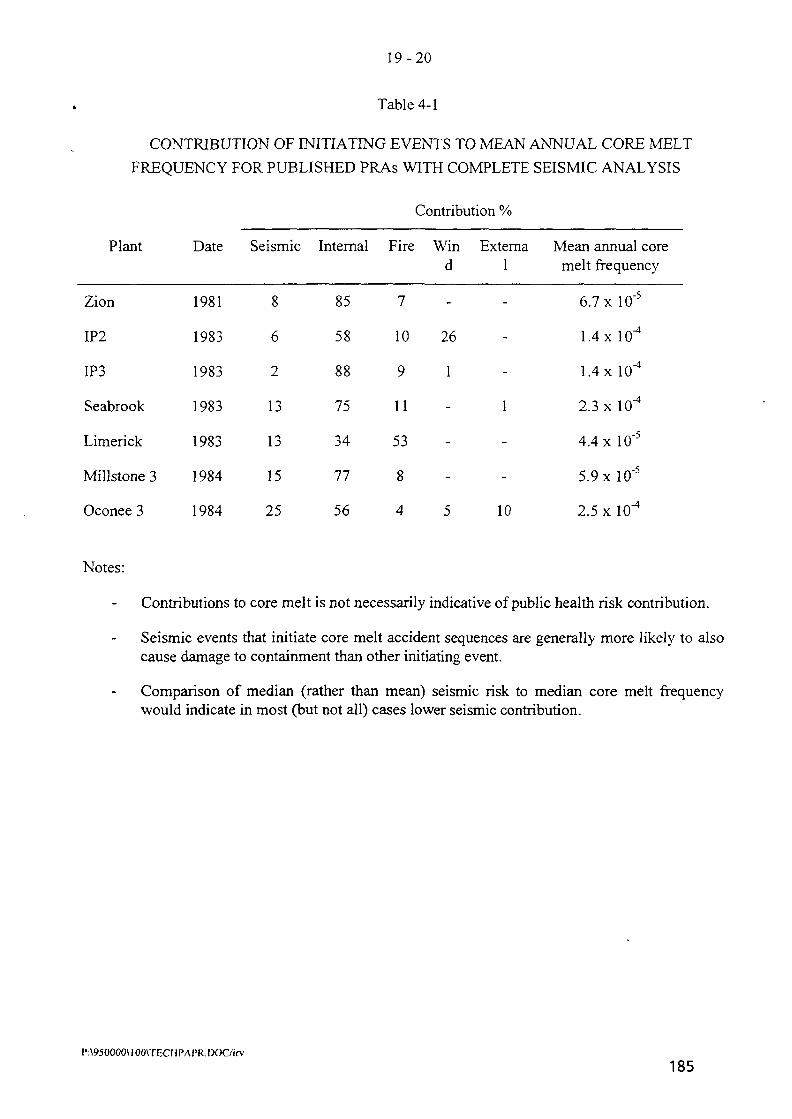
19-20
Table 4-1
CONTRIBUTION OF INITIATING EVENTS TO MEAN ANNUAL CORE MELT
FREQUENCY FOR PUBLISHED PRAs WITH COMPLETE SEISMIC ANALYSIS
Contribution %
Plant Date Seismic Internal Fire Win Externad 1
Mean annual coremelt frequency
Zion
IP2
IP3
Seabrook
Limerick
Millstone 3
Oconee 3
1981
1983
1983
1983
1983
1984
1984
8
6
2
13
13
15
25
85
58
88
75
34
77
56
7
10
9
11
53
8
4
-
26
1
-
-
-
5
6.7x10
1.4 x 10"
1.4 x 10"
2.3 x 10"
4.4x10
"5
"5
10
5.9 x 10
2.5 xlO"
'5
Notes:
Contributions to core melt is not necessarily indicative of public health risk contribution.
Seismic events that initiate core melt accident sequences are generally more likely to alsocause damage to containment than other initiating event.
Comparison of median (rather than mean) seismic risk to median core melt frequencywould indicate in most (but not all) cases lower seismic contribution.
P:\950000\l 00\TECHPAPR.IX)C/irv
185

20-20
5. REFERENCES
1. NUREG/CR-4431, Summary Report on the Seismic Safety Margins Research Program,January 1986.
2. "PRA Procedures Guide," NUREG/CR-2300, January 1983.
3. USNRC Generic Letter 88-20, "Individual Plant Examination for Severe AccidentVulnerabilities," 10 CFR 50.54(f), November 23, 1988.
4. USNRC Generic Letter 88-20, Supplement 4, "Individual Plant Examination of ExternalEvents (IPEEE) for Severe Accident Vulnerabilities," June 1991.
5. IAEA, "Probabilistic Safety Assessment for Seismic Events," Technical DocumentTECHDOC 724, October 1993.
6. NUREG 1407, "Procedural and Submittal Guidance for the Individual Plant Examination ofExternal Events (IPEEE) for Severe Accident Vulnerabilities," June 1991.
7. Campbell, R.D., "Insights from Probabilistic Risk Assessments and Seismic MarginsAssessments Regarding the Variance of Design Margin for Seismic Event," AmericanSociety of Mechanical Engineers, Technology for the 90's, 1993.
8. EQE, Ltd., "Top-Level Risk Study of Kozloduy NPP Units 1 through 4," Report 58-01-R001, April 1992.
9. EQE International, Westinghouse Energy Systems and Geomatrix Consultants, "SeismicReview of the Belene Construction Project (Units 1 and 2)," prepared for Techno-Import-Export, March 1990.
10. Westinghouse Energy Systems International, EQE International, "Seismic RuggednessEvaluations of Kozloduy VVER Units 1 to 4," prepared for IAEA, November 1991.
11. Risk Engineering, Ltd, "Seismic Probabilistic Safety Analysis for NPP Kozloduy Units 5and 6," Report RE/0-10-3, February 1994.
12. NUREG/CR-2015, "Seismic Methodology Analysis Chain With Statistics," Vol. 9, 1981.
13. "Handbook of Nuclear Power Plant Seismic Fragilities," NUREG/CR-3558, June 1985.
14. Varpasuo, P., J. Puttonen and M. K. Ravindra, "Seismic Probabilistic Safety Analysis ofLoviisa NPP, Unit 1," Proceedings of SMIRT 12, Paper MK05/3, August 1993.
15. Sues, R., P. Amico, and R. Campbell, "Significance of Earthquake Risk in Nuclear PowerPlant Probabilistic Risk Assessment," Nuclear Engineering and Design 123, 1990.
P:\95iQOOO\l OOVTECHPAPR.DOC/irvP:\95iOOi
186

SESSION IV
"ANALYTICAL METHODS FORSEISMIC CAPACITY RE-
EVALUATION"
NEXT PAGE(S) Ileft BLANK I
• 187
1PROCEEDINGS OF SMiRT 13 - POST CONFERENCE SEMINAR 16 SEISMICEVALUATION OF EXISTING NUCLEAR FACILITIES
SEISMIC DESIGN OF NUCLEAR POWER PLANTS - WHERE ARE WE NOW?
J. M. RoessetThe University of Texas at Austin, Austin, Texas
ABSTRACT: The lack of any significant activity in the design and construction of new nuclearpower plants over the last ten years has resulted in a corresponding lull in the basic academicresearch carried out in this field. While some work is still going on related to the evaluation ofexisting plants or to litigation over some of them (including some that never became operational)most of it is of a very applied nature and little basic research is being conducted at present. Yetresearch on earthquake engineering in general, as applied to buildings, bridges, lifelines, dams andother constructed facilities has continued. This paper attempts to look at some of the areas wherethere were major uncertainties in the seismic design of nuclear power plants (selection of the designearthquake and its characteristics, evaluation of soil effects and soil structure interactions, dynamicanalysis and design of the structures), the progress that has been made in these areas, and theremaining issues in need of further research.
1. INTRODUCTION
The importance of nuclear power plants and the consequences of a nuclear accident required thatthey be designed to safely withstand the most severe environmental conditions that could reasonablybe expected to affect mem during their lifetime. This led during the 1960s and 70s to anextraordinary amount of basic and applied research on their seismic analysis and design, researchwhich benefited not only the nuclear industry but also the area of earthquake engineering in general.Many significant advances in this field are a direct result of these research efforts and the nuclearindustry can be proud of their contribution. Yet the desire to apply new knowledge as fast as it wasbeing generated and the pressure to use the latest state of the art procedures without an adequateamount of time for reflection and validation had some undesirable consequences: further analysesand reanalyses were required in some cases without any real justification based on conclusions orresults from papers which addressed very particular cases of limited scope; methodologies that wereincomplete and at times incorrect (incorrect for some practical situations) were accepted or evenendorsed at one time and then disavowed entirely; and criticism of established and commonly usedprocedures pointing out their limitations was occasionally considered treacherous and detrimental tothe good of the industry. All this resulted in a significant amount of controversy. This controversyand the adversary relationships which existed at one time between the owner / designer /manufacturer team, the regulatory agencies and their consultants and the public at large, whojustifiably demanded answers to a number of important questions and access to information, hurt thenuclear industry and resulted eventually in a near complete halt in new designs and construction aswell as research. Unfortunately, the conflict has not stopped. It has continued with the adversariesbecoming the reactor manufacturers, the architect engineering teams, and the owners who try torecover the extra costs associated with the lack of complete knowledge at the time the design of theirplants was initiated and was being carried out, the need for research and development of newmethodologies which existed at the time, and the required reanalyses and design modifications.
The reduction in activity within an area with the corresponding decrease in the pressure to findinstant solutions to new problems for which there is very limited experience provides, or shouldprovide, the opportunity to compare and validate methodologies, to better define their ranges ofapplicability, to identify areas where additional research is necessary, and to reach a consensus,
189

perhaps, on acceptable solutions and procedures. It is also the time for industry to regroup andprepare itself to be ready when the need for new designs arises again, trying to avoid futurecontroversies. Unfortunately, in the seismic design of nuclear power plants this kind of activity hasbeen rather limited, although significant work has been done in Japan by a number of companies(Kajima, Mitsubishi, Ohbayashi, Toshiba) and in the United States by the Electric Power ResearchInstitute (EPRI) and government organizations such as the Nuclear Regulatory Commission or theDepartment of Energy, among others. Most of this work is, however, of an applied rather than abasic nature and some controversial issues remain unresolved. Research on earthquake engineeringhas continued, on the other hand, with applications to building structures, bridges, hospitals, dams,lifelines, and other facilities, using in many cases the methodologies developed for nuclear powerplants and extending them.
The purpose of this paper is to review some of the major sources of uncertainties which existedin the seismic design of nuclear power plants, discuss briefly some of the work that has been done inthese areas, and point out remaining topics in need of further research. The three main areas to beaddressed are the definition of the design earthquake (or earthquakes), the effects of the soil (soilamplification and soil structure interaction), and the dynamic structural analysis.
2. DEFINITION OF DESIGN EARTHQUAKE
The determination of the design earthquake (or earthquakes) for a nuclear power plant wasnormally based on a series of extensive seismological and geological studies. Historical records ofpast earthquakes were carefully reviewed and a seismic history of the region was compiled.Tectonic zones were defined and their seismicity evaluated. Potential active faults were identified.Rates of occurrence of earthquakes of different magnitudes were assigned to all known faults orareas where epicenters of past earthquakes had been located. Finally, attenuation laws weredeveloped which could provide peak values of the ground motions parameters (acceleration, velocityor displacement) for a given earthquake as a function of magnitude and distance. Yet the results ofall these studies were expressed in terms of a single parameter, the effective peak groundacceleration. The design earthquake was then specified in terms of this acceleration as a scalingfactor and a standard set of response spectra for various values of damping. The same shapes of thespectra were applicable to the different levels of motion (operating basis or safe shutdownearthquakes) and in many cases to the horizontal and vertical components of motion, changing onlythe scale factors (in some cases a small modification was introduced in the shape of the horizontaland vertical spectra using different scale factors over two ranges of frequencies). This implied thatthe frequency content of the earthquake was considered independent of its magnitude and sourcemechanism, the distance from the site to the causative fault, the general topographical and geologicconditions of the region, and in some cases even the local soil properties. These spectra were all thatwas needed when a modal spectral analysis was to be used to calculate the seismic response. It wascommon, however, to generate one or more sets of artificial earthquakes (synthetic time histories) fordirect solutions of the equations of motion in the time or frequency domains. The response spectraof these artificial earthquakes was supposed to match within certain specified tolerances the smoothtarget design spectra. An iterative procedure was used typically to achieve this match but a perfectmatch was very difficult to obtain, particularly for several values of damping. As a result thesynthetic motions tended to be conservative, and sometimes substantially so, over some frequencyranges. They also had a higher amount of energy for a given value of the peak acceleration than realearthquakes which do not have smooth spectra.
This process could be improved considerably by generating design motions on the basis ofphysical considerations, accounting for the effects of magnitude, focal mechanism, distance,topography, and soil conditions, not only on the value of the peak or effective ground accelerationbut also on the frequency content and duration of the earthquake, simulating a fracture propagatingalong a rupture zone and following the paths of the waves which are generated from the fault to thesite under consideration. A significant amount of research has been conducted over the last 15 or 20years on this subject and is still continuing today. When combined with probabilistic formulations toaccount in a rational way for all the existing uncertainties and with statistical data from actualearthquake records it has the potential to be one of the major improvements in seismic design.Ideally one would like to obtain a description of the design earthquake in terms of the types of wavesthat would be arriving at the site, their amplitudes and their angles of incidence at bedrock as afunction of frequency and the duration of shaking. A detailed modeling of a fault with the complete
190

length of rupture and the geological features of the terrain over dimensions of many kilometers maybe, however, far too expensive even for present day supercomputers, particularly for practicalapplications. Studies with less detailed models but accounting for information from actual recordscan provide, however, valuable insight on the general characteristics of the expected motions at thesite (duration and frequency content) for different magnitudes and distances.
It is interesting to notice that the use of simple physical models based on wave propagation tosimulate earthquake motions had already been proposed by Housner in the 50's, but this approachwas discarded and researchers preferred to concentrate on the generation of artificial earthquakes asstochastic processes without any physical basis. In 1969, Rascon and Cornell attempted to revivethis line of research by combining it with a probabilistic formulation, but their effort was again anisolated one. It was only in the late 70's that a concentrated attack was launched along these linesand today this is the area where most progress has been achieved. Many are the researchers whohave contributed to this progress and no attempt will be made here to trace their individual efforts.One should mention, however, the studies conducted by EPRI (1986) and by the LawrenceLivermore Laboratory (Bernreuter et al, 1985, 1987, 1989) for the Eastern United States and morerecently the work conducted at the National Center for Earthquake Engineering Research of the StateUniversity of New York in Buffalo (in combination with the Lamont-Doherty ObservaioryX Jacob1994). Clearly more work remains to be done and there are still uncertainties that cannot be fullyaccounted for. The discrepancies between the results that would be obtained using the earlierprocedures suggested by the Lawrence Livermore National Laboratory study and the EPRImethodology illustrate the fact that the interpretation of the same data by different researchers maylead to different conclusions and that further studies may be needed to reconcile the differences. Itappears that the later revised methodology of LLNL is in much better agreement with the EPRI's. Inspite of the remaining issues, it is possible today to prescribe design motions consistent with adesired return period (or probability of occurrence) in terms no longer of a single parameter butaccounting for duration and frequency content as well as peak ground acceleration. This is a majorstep forward.
A second improvement would be the consideration of more than one design motion for the samereturn period, corresponding perhaps to different distances and magnitudes (one could have forinstance a small, or relatively smaller, but very close earthquake and a stronger but more distantone). When the motions are specified in terms of design response spectra or, even better, in terms ofa power spectral density that could be used directly for probabilistic dynamic analyses, this is all thatis needed. When using actual earthquake records with characteristics similar to those of the designmotions or synthetic accelerograms matching the design spectra it would be necessary to considerseveral samples for each design earthquake. This has been opposed by industry arguing that it wouldbe far too expensive. This is not necessarily so with present day supercomputers or evenworkstations, particularly for linear analyses, which are the ones most commonly performed. It ispossible then to break the analysis into a series of logical steps, storing the results of each one inpermanent files.
The next major point of concern in the definition of the seismic input is the location where thedesign or control motion is specified. This was a subject of considerable debate for many years andalthough some promising trends are observed it is not yet clear whether the matter has been fullyresolved. As has been often stated (Roesset and Kim, 1987, for instance), there are five possiblechoices:
• the free surface of the soil deposit at the site.• a hypothetical outcropping of rock.• bedrock when there is rock at some finite depth at the site.• the elevation of the foundation in the free field (soil deposit without any structure or
excavation.• directly at the foundation.
If the characteristics of the design motions correspond to some average firm ground conditionsand the soil at the site can be classified as such, specification of the earthquake at the free surface ofthe soil deposit would be the logical choice. This would also be the case if the seismic hazardanalyses had already incorporated the effect of the local soil conditions (i.e., if the soil amplificationstudies for the site had been conducted explicitly by the seismologists, instead of waiting for thegeotechnical engineers to do it, or if they had been incorporated implicitly). A more general solution
191

would be to specify the motion at a hypothetical outcropping or rock, accounting for earthquakemechanism and distance but not for local soil conditions. These would be considered in soilamplification studies which could be one-, two- or three-dimensional depending on the topographyand stratigraphy at the site and which could be different for various locations at the site. If the sitehas a well-defined transition between soil and much stiffer rock at a finite depth the specification ofthe motion at bedrock would be very similar to the specification at rock outcropping. Otherwise thisalternative is not very meaningful since the characteristics of the motion at one level within the soildeposit will be a function of the properties of the soil above and below that level. Finding thus aconsistent motion at some depth would require amplification studies similar to those performed todetermine motions at the free surface from a specified input at a hypothetical rock outcrop.Specification of the design motion at the foundation level in the free field, as required at one time, isthe least advisable option and leads to a number of serious inconsistencies if there are variousstructures with their foundations at different levels. Specifying the control motion directly at thefoundation is equivalent to ignoring kinematic interaction effects. It is commonly assumed that thisis a conservative assumption, particularly for deeply embedded foundations, but it ignores rotationalcomponents of motion and, more importantly, the physical reality. And introducing uncontrolledconservatism, which is hard to quantify, is an undesirable approach particularly when attempting toperform more rigorous probabilistic risk analyses.
One of the main problems in deciding the location of the control motion was an apparentconfusion for embedded foundations between its specification at the level of the foundation in thefree field and the direct specification at the foundation. This confusion was aggravated by a numberof papers and studies that attempted to justify the reduction in the levels of acceleration withfoundation depth by looking at the motions recorded at different depths in boreholes. A source ofconcern was the fact that the motion that would be obtained at a given depth in the free field wouldexhibit a very sharp valley in its spectrum at the natural frequency of the overlying soil mass. Thisconcern would be eliminated by the use of more than one earthquake record as suggested above andprimarily by the use of more than one set of soil properties (as has always been done). Moreimportantly, the compatible motions at the foundation level accounting for the excavation willexhibit a clear reduction in the high frequency components of motion but much less sensitivity tospecific frequencies than the one-dimensional deconvolution solution.
A sixth alternative which has not been included in the above list is the specification of the motionnot at the foundation but directly at the base of the structure ignoring therefore not only kinematicbut also inertial interaction. This is of course what was traditionally done for regular buildings.
3. EFFECT OF LOCAL SOIL CONDITIONS
The effect of the local soil conditions on the characteristics of the earthquake motions at the site(soil amplification studies or determination of site specific spectra) is normally carried out assuminga horizontally stratified soil deposit and vertically propagating seismic waves. This implies that soilproperties can vary arbitrarily with depth but remain constant in the horizontal direction and that allpoints on a horizontal plane experience the same motion at any instant of time. The solution of thisproblem, whether using a continuous formulation based on one-dimensional wave propagationtheory (Roesset and Whitman 1969), or a discrete model (finite differences, finite elements or aphysical discretization of lumped masses and springs) as suggested by Seed and Idriss (1969), isvery simple and well-known. It can be efficiently performed in a personal computer. When themotion is specified at a hypothetical outcropping of rock (the ideal location) or at bedrock thepurpose of the analysis is to compute the consistent motions at the free surface of the soil deposit orat any other elevation in the free field, as well as compatible motions and stresses at other pointswithin the soil profile (the points of contact between the foundation and the soil or points along alateral soil boundary if the soil structure interaction analyses are to be conducted with a finiteelement model). If the motion is specified directly at the free surface of the soil deposit but the soilstructure interaction studies are going to be conducted using a finite element discretizationamplification studies must again be conducted to obtain now compatible motions at the bottomboundary of the domain as well as at the other points mentioned above. In the first case the analysisprocess is referred to as a convolution, while in the second it is known as a deconvolution.Deconvolution analyses are also performed to determine equivalent soil properties with depth (basedon the levels of strain) for soil structure interaction analyses using continuous solutions or evensimplified expressions for the foundation stiffnesses.
192

These analyses are normally performed in the frequency domain assuming therefore linear elasticmaterial behavior. It has long been recognized, however, that soil is a highly nonlinear material andthat the design seismic motions are likely to induce large strains. Nonlinear soil behavior isnormally accounted for in convolution or deconvolution analyses using an iterative linear procedurewhere the values of the shear moduli and the soil material damping are adjusted at the end of eachcycle of analysis based on the strains computed in the previous cycle and curves of modulus anddamping versus shear strain characteristic of the material (Schnabel et al 1972). In this wayamplification studies are carried out not only to determine compatible motions and stresses at variouspoints within the soil but also to obtain equivalent soil properties to be used in the soil structureinteraction studies. This procedure is well-established and unfortunately generally accepted. Yet theaccuracy of the results is open to question, particularly when dealing with soft and deep soil deposits.When the motions are followed from the bottom (or rock outcropping) to the free surface theprocedure filters out excessively the high frequency components. In fact if this procedure werecorrect, it would imply that earthquake motions recorded on top of very deep or soft soil depositsshould have no energy about 8 or 10 Hz. This simply is not the case. In deconvolution analyseshigh frequency components increase with depth and the solution eventually becomes unstable. As aresult motions specified at the free surface are often artificially modified eliminating all componentsabove 8 to 10 Hz before proceeding with the analysis (the cutoff frequency decreases as the depth ofthe stratum increases). The main reason for these errors is the assumption of a linear hystereticdamping which is independent of frequency although the amplitudes of the different frequencycomponents are quite different (Roesset, Huerta and Stokoe 1995). A large number of studies havebeen conducted through the years to assess the validity of the iterative linearization. For most casesthe linearized solution overestimates the peak accelerations at the free surface by 10 or 20%, whileunderestimating displacements and strains, sometimes by as much as 50% (Constantopoulos 1973).Unfortunately, the results of the comparative studies are often contradictory (D'Appolonia 1979,Dames and Moore 1978). Nonlinear analyses in the time domain, which would avoid theseproblems, can be performed very economically and also in a personal computer, for the one-dimensional convolution problem. For the deconvolution problem the process is at times ill-conditioned because as the solution proceeds down the profile from mass to mass one has tocompute first the relative displacements between masses associated with the inertia forces, thenobtain the second derivative of these displacements to compute a new acceleration and theincrements in the inertia forces. The need to conduct repeatedly the differentiation of thedisplacements to obtain accelerations is the main source of difficulties. A procedure to perform truenonlinear deconvolution analyses using the theory of characteristics has been recently suggested byYamada et al (1995). If this method is robust even for deep deposits it would represent a significantimprovement and it should be adopted to replace the iterative linearization scheme. The mainlimitation of true nonlinear analyses is that they cannot provide equivalent soil properties, since thesoil properties are changing continuously in time, although one could obtain weighted averages.This implies that all ensuing analyses would have to be conducted with nonlinear models in the timedomain.
There are a number of areas in which additional research is necessary to resolve outstandingquestions in the computation of soil specific motions. The main source of uncertainties is related,however, to the soil properties. To perform soil amplification studies, as well as the soil structureinteraction analyses discussed later, it is necessary to know the soil properties in situ, under theexisting state of stresses, as well as their variation with levels of strain (variations of modulus anddamping with strain for one-dimensional studies and more complete nonlinear constitutive modelsfor more general two- or three-dimensional states of stresses). Traditionally, soil properties weredetermined through laboratory tests on so-called "undisturbed" samples. Yet, when measurementswere carried out in the field the values of the elastic moduli obtained for very low levels of strain insitu and in the laboratory could differ by factors of 2 to 4. It is interesting to notice in this respectthat when independent studies were carried out by a number of researchers to reproduce the testsconducted by the EPRI at Lotung, those who used only the data provided from laboratory testsobtained relatively poor agreement with the actual data; those who used the in situ data for the lowstrain values of the elastic moduli, combined with the variation of modulus and damping with levelof strain obtained from laboratory tests, or simply with published standard curves for the type ofsoils encountered at the site, got invariably a very good match. This indicates that an accurateknowledge of the soil properties in situ, even if they correspond only to very low levels of strain, isor can be more important than a detailed definition of the nonlinear variation of these properties withlevel of strains. This is again one of the areas where significant progress has been achieved in the
193
last 15 years. In addition to the downhole and crosshole method, which have been in use for sometime and can be very reliable (particularly the crosshole test), but are expensive due to the need tohave boreholes, the Spectral Analysis of Surface Waves (SASW) Method, which has evolved fromthe Rayleigh wave technique, provides an accurate, fast and relatively economical wcy ofdetermining the soil properties in situ and their variation with depth over an extended area (Nazarian1984, Sheu 1987).
To account for the uncertainties in soil properties, it was common in the seismic design ofnuclear power plants to perform analyses with the best estimate of the soil properties and widi thesevalues multiplied and divided by a factor of 2. These factors were applied simultaneously to all thelayers. When the properties of the different strata are relatively homogeneous in the horizontaldirections and in situ measurements are available over an extended area, more realistic, and probablysmaller, variations can be justified from the data. For soils where the variations in properties in bothhorizontal and vertical directions are large (such as alluvial deposits), the application of a factor toall the layers simultaneously may not provide an adequate range of variation in the final results, aspointed out by Lysmer (1994). It would be more appropriate in these cases to conduct a number ofMonte Carlo-type simulations assuming that the properties of the different layers are independentrandom variables and statistically interpreting the results.
A second source of uncertainty is the angle of incidence of the incoming seismic waves in theunderlying rock, as a function of frequency, and the relative amplitudes of the different types ofwaves (SH, SV, P) propagating through the soil deposit. The formulation to study the amplificationof any type of waves by a horizontally layered soil deposit has been available for a long time and thesolution of this problem is not more complicated than that of vertically propagating waves (Jones1970). The main difficulty in considering other types of waves lies in the selection of theappropriate type and this is an area where seismologists can again provide valuable information.
In many cases soil profiles are not horizontally stratified: soil layers can be dipping at differentangles or have arbitrary geometries with soil properties changing in both the horizontal and verticaldirections. In other cases some of the structures may be built at different levels on embankments orsmall hills with two- or three-dimensional geometries. Amplification studies considering simpletwo-dimensional geometries (a sloping bottom layer, elliptical sedimentary valleys, etc.) have beencarried out for some time. A weighted residual formulation with a collocation minimization criterionwas used first in what has been known as the Aki-Larner method (Aki and Lamer 1970). Morerecently solutions are based on the use of the direct or indirect boundary integral equation (orboundary element) method but a number of other alternatives have been explored (Aki 1988, Bardand Bouchon 1980, 1985, Dravinski 1982, 1983, Papageorgiou and Kim 1992, Sanchez Sesma1983). The studies conducted on simple geometries have provided considerable insight into thenature and importance of 2D amplification effects for shallow rectangular (or trapezoidal) valleys aswell as deep triangular canyons, but most of these studies have assumed homogeneous and linearsoil properties for the valley or canyon. 2D or 3D amplification analyses are clearly more expensiveand time-consuming than the simple one-dimensional solutions and their use in actual practice(rather than for research purposes) is going to be limited. Even so, when the geometry at the site isclearly two- or three-dimensional, some studies of this kind should be conducted to assess thepotential importance of geometric effects.
The approximate iterative linear analyses described earlier become even more questionable whendealing with two- or three-dimensional states of stresses. To assess their applicability and to answersome of the lingering questions, it would be necessary to conduct true nonlinear analyses withappropriate nonlinear constitutive models for the soil. A considerable amount of work has been doneon the development of plasticity-type models for soils but this is one of the areas where relativelylittle improvement has been achieved in practical studies and much more remains to be done. Somemodels, like the multiple yield surfaces model of Prevost (1977), the cap model of Di Maggio andSandier (1971) (based on the original cam-clay model developed by Roscoe in Cambridge), or themore recent forms of the endochronic models (Systems, Science and Software 1980), would seem tohave an excellent potential, particularly when combined with a two-phase formulation to account forthe buildup and dissipation of pore water pressures. Even so, it appears that the possibility of havinga single model which can correctly reproduce all the features of soil behavior under arbitrary statesof stress with a manageable number of parameters is remote. Normally the laboratory tests neededto determine the model parameters are selected so as to reproduce the types of loadings which bestsimulate the field conditions for each specific problem. Nonlinear two-dimensional and three-dimensional analyses are again expensive and require the use of powerful workstations or even
194

supercomputers (particularly for the 3D case). Their use in practical design applications is furtherlimited by the uncenainties in the soil properties and the cost and labor associated with extracting asufficient number of undisturbed core samples over an area with large horizontal and verticaldimensions. This is an area in which supercomputers can contribute significantly to basic research inorder to validate simpler approximate procedures which can be used in practice.
Another problem closely related to the effects of local soil conditions on the seismic motions isthe assessment of the liquefaction potential for a site and the estimation of the effects of suchliquefaction on settlements and the behavior of the foundations. Although a substantial amount ofwork has been conducted, and is still going on in this area, most of it has been concerned withestablishing correlations between the occurrence of liquefaction (observed in past earthquakes) and anumber of different soil parameters (Seed 1979, Seed, Idriss and Arango 1983, Seed and Harder1990, Leed et al 1984). The results of these studies are supposed to provide a mechanism todetermine for a given site and a specific level of earthquake whether liquefaction is likely to occur ornot. In most cases, these procedures allow one to conclude that liquefaction will indeed occur, that itwill not, or that the site falls in a gray area where some liquefaction is possible. The more importantquestion of what are the extent and consequences of the potential liquefaction is much harder toanswer and would again require true nonlinear analyses with an appropriate two-phase constitutivemodel. This is another area in which some significant progress has been achieved during the lastyears (Dobry 1995), even if this work has not been associated with the design of nuclear powerplants. Worth mentioning is the work that has been conducted in this area at the National Center forEarthquake Engineering Research (NCEER) (O'Rourke 1994). The application of these moresophisticated nonlinear dynamic analyses in practice, considering three-dimensional geometries andstates of stress, may be again impractical, not just because of the cost of the analyses but primarilybecause of the lack of detailed information on the soil parameters over an extended volume. Yet thistype of studies for research purposes are necessary in order to validate simpler approximateprocedures which can be used for design purposes. Probabilistic formulations are also needed (andare beginning to be developed) in order to account in a rational way for the many uncertainties.
4. SOIL STRUCTURE INTERACTION ANALYSES
The degree of sophistication of soil structure interaction analyses for nuclear power plantsincreased continuously with the development of new formulations and computer programs and theimprovements in memory capacity and speed of computation. Yet it appears that in the last ten orfifteen years, in spite of the continued improvements in computational capabilities the trend inresearch has been towards ignoring the more rigorous methodologies already available in order todevelop new, alternative, simplified procedures with different degrees of reliability.
Soil structure interaction analyses were initially conducted replacing the foundation by a series ofsprings and dashpots (and sometimes lumped masses) with their values computed with availableformulae for circular foundations on the surface of an elastic, homogeneous and isotropic half space.The viscous dashpots were intended to reproduce the loss of energy by radiation of waves away fromthe foundation, while the lumped masses, when used, were meant to reproduce the variation of thestiffnesses with frequency. This type of model was known (rather improperly) as the foundationimpedance approach. It was intended to reproduce the inertial interaction effects. Kinematicinteraction was ignored. When applying this model it was common to impose arbitrary bounds onthe effective damping of the combined soil structure system particularly in modal analyses, becausethe nature and magnitude of radiation damping were not well understood. In some cases, however,the limitations were not imposed if the solution was performed in the frequency domain (indicatingagain a lack of understanding). The practical advantage of this approach was that most of thecomputer programs developed for general dynamic analysis of structures allowed one to incorporatethese constant masses, springs and dashpots or at least the masses and springs. When a modalanalysis was conducted the combined structure-foundation system would not have normal modes inthe classical sense (real modes) when the dashpots were included and it was then necessary for amodal spectral analysis to compute equivalent values of modal damping using approximateformulae. All these problems disappeared when performing the analyses in the frequency domain.Unfortunately the normal structural analysis programs did not allow this type of solution.
With increasing research (Veletsos and Wei 1971, Veletsos and Verbic 1974, Luco 1974, Kausel1974), it became clear that the dynamic stiffnesses of a mat foundation are functions of frequency
195
and that the parabolic variation implied by the use of constant springs and masses is only valid overa very small range of frequencies. For the case of an elastic half space or a very deep soil depositwith homogeneous properties, which is not a frequent case in practice, the dynamic stiffness isnearly independent of frequency in the horizontal direction; the variation with frequency is,however, important for the vertical and rotational (rocking and torsional) stiffnesses and it dependson the value of Poisson's ratio (the variation is more pronounced as Poisson's ratio approaches avalue of 0.5 corresponding to a nearly incompressible material or in practical terms a saturated soildeposit). The frequency dependence of the foundation stiffnesses is further affected by the variationof soil properties with depth. The existence of a much stiffer, rocklike material at some depth (andparticularly at shallow depths) gives rise to marked oscillations around the half space solutioncorresponding to the natural frequencies of the soil deposit. More importantly, below thefundamental frequency of the soil there is no radiation of waves in the lateral direction andcorrespondingly no radiation damping (when there is some internal material damping there is also avery small amount of energy leakage and therefore radiation damping even below the thresholdfrequency but the amount is essentially negligible and it can be ignored for practical purposes). Toaccount more realistically for all these effects as well as for the effect of foundation embedment(both on the stiffnesses and on the kinematic interaction) a number of computer programs speciallyconceived for dynamic analysis in the frequency domain were developed. Most of these programsperformed the analyses assuming linear elastic behavior although some of them applied the iterativelinearization to simulate nonlinear material behavior with two-dimensional states of strain. Only asmall number of programs carried out the solution in the time domain with nonlinear constitutiveequations for the soil.
Two main approaches evolved from this research work: the analysis in a single step of thecomplete soil structure system, often referred to as the direct approach, and a three step orsubstructure approach (Kausel and Roesset 1994). The three steps are:
a) Determination of compatible seismic motions for the foundation (kinematic interactionanalysis). If the foundation can be assumed to be rigid, which is normally the case for reactorbuildings, these motions will consist of at most six components (three translations and threerotations). For a flexible foundation, as a large mat supporting several buildings, it would benecessary to compute three translational components of motion at a sufficient number of contactpoints between the foundation and the surrounding soil or between the structure and the foundation.
b) Determination of the foundation stiffnesses. For a rigid foundation this implies obtaining theterms of a symmetric 6 x 6 matrix applying unit harmonic displacements and rotations to thefoundation and computing the resulting forces and moments, which will be complex functions offrequency. For a flexible foundation the dynamic stiffness matrix should be in general 3n x 3n if n isthe number of contact points between the foundation and the soil or between the structure and thefoundation. The terms of these matrices would be the reactions at each one of these points (assumedfixed) when a unit harmonic displacement in each of the three coordinate directions is applied ateach point.
c) Dynamic analysis of the structure supported on a continuum represented by the dynamicstiffness matrix of the foundation, and subjected to the motions computed in the first step.
When each one of these steps is carried out in the frequency domain, the results are in terms oftransfer functions. In the last step, which is the most time-consuming if one uses a detailed model ofthe structure, one can further separate the effect of the structure from that of the foundation through amodal synthesis or a simple condensation procedure. One can obtain in this way a dynamic stiffnessmatrix relating forces and displacements at the base of the structure which can be coupled directly tothe dynamic stiffness matrix of the foundation. In this way, for each different set of soil propertiesdue to imposed variations to account for uncertainties or to the variations caused by the levels ofstrain induced by different earthquakes, one must only solve a system of 6 equations with 6unknowns for a rigid foundation or 3n equations with 3n unknowns for a flexible foundation, but thestructural analysis needs to be performed only once.
In the direct approach the structure is normally modeled through a combination of finite elementsand linear members. The soil is discretized using finite elements or finite differences. Since adiscrete model is used to reproduce a semi-infinite domain, special attention must be paid to themesh size and to the boundary conditions imposed at the edges of the domain. The main advantage
196
of this approach is that is would permit a true nonlinear analysis with the complete interactioneffects. A rigorous solution would require, however, a fully three-dimensional model and anappropriate set of nonlinear constitutive equations for the soil. In practice these requirements arerarely met. The first programs developed for direct soil structure interaction analyses used a two-dimensional plane strain model with elementary, viscous-type boundary conditions at the verticaledges to simulate radiation effects (for instance the program LUSH) (Lysmer et al 1974). ProgramFLUSH (Lysmer et al 1975) incorporated consistent lateral boundaries which could be placeddirectly at the edges of the foundation for a linear solution, and allowed to place dashpots on thesides of a finite width soil slice to simulate three-dimensional behavior. This was still basically atwo-dimensional model as far as the structure was concerned and the lateral dashpots did notcorrectly reproduce the 3D soil behavior. For structures with axisymmetric geometry andhorizontally layered soil deposits, a true 3D solution assuming linear behavior could be obtainedformulating the problem in cylindrical coordinates and solving separately for vertical and torsionalexcitations on one hand and horizontal and rocking motions on the other. True nonlinear solutions inthe time domain using the cap model were implemented in programs such as TRANAL (Baylor et al1974) and FLEX (Vaughan 1983). In these cases the lateral boundaries of the finite element regionmust be placed at a sufficient distance from the foundation to guarantee that the reflected waves havea very small amplitude when reaching back the core region.
In the substructure approach the foundation motions and the dynamic stiffnesses can be obtainedusing a discrete model with finite elements and a consistent boundary or using the boundary integralequation (or boundary element) method. Programs such as TRIAX, developed by Stone & WebsterCorporation, used the first approach for structures with axisymmetric geometry whereas CLASSI,developed by J.E. Luco, used the second (indirect boundary element method). In the boundaryelement solutions the Green functions can be obtained from a continuum formulation, evaluatingnumerically the integrals in the wave number domain, or from a discrete formulation (Kausel 1981,Kausel and Peek 1982).
All the above mentioned programs were developed in the middle and late 1970s and the early1980s. They could be run in the mainframes available in those times with some limitations on themaximum number of layers or finite elements. With the advent of supercomputers or even with thepresent workstations the capabilities of these programs can be tremendously expanded. New andmore powerful programs such as SASSI (Lysmer 1988) have been developed. The basis of theseprograms is again the use of a core region modeled with finite elements (or hyperelements) and asemi-analytical representation of the far field. These programs allow one to consider truly three-dimensional effects with a linear elastic solution. Programs such as SASSI would allow theinclusion of a number of effects which are normally ignored, such as layer interfaces which are nothorizontal, flexibility of the mat foundation, variable degree of embedment along the perimeter ofthe foundation, structure-soil-structure interaction (effect of adjoining structures), etc.. A limitedamount of work has been done on each of these topics at the research level and it is generally feltthat they are secondary effects but this may not be so in all cases. So for instance the effect of theflexibility of the mat has been found to be small when dealing with a reactor building by itself,particularly in relation to global response parameters (Kausel 1974). It could be more significant,however, for other buildings or when dealing with several structures supported on a single, verylarge mat. The lack of uniform embedment is sometimes accounted for in practice by multiplyingthe contribution of the sidewalls to the foundation stiffnesses (using for instance Novak's procedure)by the ratio of the perimeter in contact with the soil to the total perimeter. This seems to be arelatively good approximation for the imaginary part of the stiffnesses (representing the radiationdamping) but not for the real part (Chen 1984). Interaction between adjacent structures through thesoil tends to be important when dealing with a light structure next to a much heavier one, but areconsidered small for the typical buildings encountered in nuclear power plants (Gonzalez 1977).Additional research to assess more fully the importance of these effects and to better delineate theconditions under which they may be safely neglected is still necessary. The main difficulty inincluding all or some of these effects in a true three-dimensional solution is the cost of computation,even for a supercomputer. A large number of parametric studies might not be possible in practicebut a few studies (or even just one) to assess the magnitude of these effects and the variations in theresults with those of simpler solutions may be warranted. True nonlinear effects such as thenonlinear soil behavior under three-dimensional states of strain and with an appropriate constitutivemodel, or separation effects (sliding and uplifting of the foundation) are still not included in thesepowerful programs and require a solution in the time domain. Nonlinear soil behavior is normallyaccounted for considering only the nonlinearities associated with the soil amplification problem
197

10
(using the equivalent properties resulting from the last cycle of the iterative procedure) orimplementing the iterative scheme with a 2 or 3D model (which makes its validity much morequestionable). Separation effects tend to be beneficial, reducing the base shear and overturningmoment, but they may increase vertical accelerations near the axis of the structure and produceadditional stresses in the mat (Wolf 1976, 1977, Roesset and Scaletti 1979). These effects are alsostrongly dependent on the properties and initial state of stresses in the soil. The proper considerationof nonlinear effects is the area where the major contributions to the soil structure interaction problemremain to be done. Even if true 3D nonlinear analyres were not possible in practice (at least in largenumbers) and were not justified considering the lack of complete data on the soil parameters neededto fit the constitutive models research to assess more fully the validity of the linear or linearizedanalyses and the potential errors involved in present day procedures is badly needed. Part of thedifficulty in launching this research may be in the selection of an adequate constitutive model out ofthe various available ones.
Most of the research work on seismic soil structure interaction has been concerned with rigid,and in most cases circular, mats resting on or embedded in a horizontally layered soil deposit. Thisis due to the fact that this is the type of foundation most commonly encountered in nuclear powerplants. A number of studies have been conducted to determine the dynamic stiffness and motions ofrectangular foundations using boundary elements (mostly surface foundations but in some cases alsoembedded ones) (Dominguez 1978, a,b). These studies have led to a number of simplifiedprocedures to obtain their stiffnesses from those of an equivalent circular mat or to approximateformulae to compute them directly (Dobry and Gazetas 1985). It should be noticed, however, thatthese approximate procedures are intended to match primarily the static values of the stiffnesses andthat their frequency variation may not be as well reproduced. This is particularly so when dealingwith a layered soil deposit where the properties vary with depth rather than an elastic half space(normally considered in these studies). A substantial amount of work has also been done on pilefoundations including group effects. A number of rigorous formulations assuming a linear elasticsoil and perfect bonding between the pile and the surrounding soil have been developed (Blaney et al1976). Group effects can be accounted for with some approximations such as enforcing thecompatibility of displacements along the axis of the pile rather than along its perimeter for the studyof two piles, and enforcing interaction at the pile heads only for large groups (Kaynia and Kausel1982, Sanchez Salinero 1983). These assumptions are no longer valid when considering closelyspaced piles or very large numbers of piles, but are reasonable for many other cases, particularly ifthe layering of the soil is taken into account properly. Simplified procedures based on an elastic halfspace again raise questions when extrapolated to realistic soil profiles. The main limitation in theanalysis of pile foundations is again the linear assumption. The behavior of the soil around a pileand particularly near the pile head is highly nonlinear. Approximations based on the assumption of aconcentric annular cylinder with reduced soil properties are of value to provide a qualitative pictureof the phenomenon but cannot provide accurate quantitative results. In reality the properties andwidth of this annular region should be changing with depth and instead of a single annulus with asharp contrast in material properties with the surrounding soil a smooth transition in propertiesshould occur (Cheng 1986, Kim 1987). The alternative is the use of P-y and T-z curves, asemployed in the offshore industry, which better reproduce the nonlinear soil behavior under staticloads (particularly monotonic loads) but which do not account for dynamic effects (Matlock andReese 1960, Matlock 1970). Clearly much more work remains to be done on this type of foundation.Very little work has been done also on spread or strip footings with or without tie beams betweenthem (Vardanega 1978). This is a frequency type of foundation for regular buildings but not so fornuclear power plants.
Nuclear power plants are structures for which soil structure interaction effects may be importantand normally beneficial when designing for smooth broad band response spectra. As a result aconsiderable amount of research was performed in this area in the 1960s and 70s under thesponsorship of the nuclear industry, and a considerable amount of knowledge was acquired throughthis research. By the time the research on seismic design of nuclear power plants started to wane thearea had acquired great popularity and the research has continued during the last years withapplication to other types of structures (regular buildings, bridges, offshore structures, etc.) or inabstract terms. Unfortunately, most of this research has not been oriented towards the solution of themain outstanding issues and sources of uncertainty. Much of the recent work on dynamic or seismicsoil structure interaction has dealt with the derivation of alternative procedures to solve problems forwhich results are already available with emphasis on obtaining more elegant formulations which canbe more economical for the same degree of accuracy than the existing ones (boundary element
198

11solutions in the time or frequency domains for instance) or simplified models which are moreeconomical but still provide a reasonable approximation, at least for the particular cases studied. Inthe best cases these alternative formulations have provided a better insight into the problem or therelative importance of various effects. In a number of cases the studies have shown on the otherhand a lack of understanding of the phenomenon with models which accounted (sometimesincorrectly) for the real part of the foundation stiffnesses but neglected the radiation damping, orwith values of the soil and structural parameters which were totally unrealistic. Thus, in spite of allthe research that has been conducted over the last 25 years and which has been not only disseminatedin a large number of technical papers but even published in books (Wolf 1985, 1988, 1991). S.D.Werner in a state of the art paper published in 1991 wrote, "The overall engineering community hasnot had adequate exposure to SSI concepts, procedures, and evaluation of results that would enhancethe incorporation of SSI provisions in current seismic design practice. Therefore provisions forworkshops, conferences, and publications that present SSI to practicing engineers are encouraged."Even the recent DOE Standard, Natural Phenomena Hazards, Design and Evaluation Criteria forDepartment of Energy Facilities published in 1994 is rather weak and vague on the question of soilstructure interaction. This document states for instance that "The shear modulus and materialdamping ratio used to evaluate foundation impedance shall be values compatible with the shearstrain induced in the foundation medium during earthquake excitation," but it fails to indicate atwhat point or depth within the foundation medium this shear strain should be calculated, how itshould be calculated or whether this is the strain due only to the seismic waves in the free field (inwhich case it would be the horizontal shear strain supposedly) or accounting also for the presenceand vibrations of the structure. It also indicates that "Dynamic Modeling of the foundation mediumis generally accomplished using a half space model," and later, "When significant layering exists inthe foundation medium, it should be modeled explicitly or its effects considered." There is again noindication as to what constitutes significant layering or how its effects can be considered.
A serious controversy existed for a long time between the two general approaches to SoilStructure Interaction analysis. The substructure approach referred to as the impedance approach wasnot allowed at one time because it was erroneously associated with the use of frequency independentsprings and dashpots based on the static solution for an elastic half space. The direct approach whichhad been the recommended one later became unpopular because of the 2D nature of the solution. Itappears that at the present time both might be acceptable but there seems to be a trend towards thesimplest possible solutions as suggested by the above quotes. Given today's computer capabilitiesand the existence of computer programs that can provide at very little cost accurate solutions for alayered half space this trend is somewhat strange. Simplified solutions are of great value to gaininsight into the behavior of the physical process, to identify key parameters and understand theireffects and relative importance, to obtain preliminary estimates of the response, to assess whethereffects can be important and more sophisticated analyses are necessary, and to provide checks to theresults of more complicated models. There is, however, a risk of oversimplification. When effectsare found to be important and when dealing with structures such as nuclear power plants one shouldalways try to use the most accurate models available at least for a limited number of studies ratherthan relying exclusively on simple models.
5. STRUCTURAL MODELS
The buildings encountered in a nuclear power plant are typically very stiff, massive andextremely complex structures, including many different structural types (thick shells for thecontainment, frames, trusses, heavy shear walls, thick slabs, etc.). A detailed modeling of any one ofthese structures requires a large number of degrees of freedom, and these models have been oftenused. In many cases, however, the seismic analyses were carried out using highly simplified modelsconsisting of close-coupled systems of masses and springs (or equivalent stiffness matrices). Thesewere referred to as "stick" models. Each element connecting two adjoining masses, or its stiffnessmatrix, was intended to reproduce the combined effects of all the members and walls between thetwo floor levels where the masses were lumped. The stiffness matrices were often computed withthe implicit assumption that the floor slabs were infinitely rigid not only as diaphragms in their ownplane but also in bending. The use of simplified models with a reduced number of degrees offreedom is of course common to many structures and not just nuclear power plants but the degree ofsimplification that was used at times in nuclear structures was unusually large. Thus while thesemodels could be reasonably accurate to estimate the general, or global, features of the dynamicresponse, such as accelerations at various floor levels, some questions could be raised as to their
199
12
ability to reproduce local response parameters such as stresses or deformations in individualmembers. The main objective of the seismic analyses of nuclear power plants conducted with thesemodels was in fact in many cases the derivation of floor response spectra for the design of equipmentrather than a detailed stress analysis of the structure.
The structural models could be even cruder for soil structure interaction analyses where,ironically, a considerable amount of effort might be devoted to the appropriate modeling of the soilwhile the structure was idealized as a stick with only a few masses or a solid block discretized withfinite elements. This situation was more likely to be encountered when the complete analysis wasperformed in a single step (direct approach) than when using the three step or substructure approach(particularly if the modal synthesis procedure described earlier to reduce the structure to forces anddisplacements at its base was implemented). It was suggested in fact at one time that soil structureinteraction analyses should be performed with a highly simplified model of the structure todetermine the motions at the base of the structure and that these motions could then be used as inputto conventional dynamic analysis programs which assume the structure on a rigid base. Not onlydoes this approach ignore in most cases the rotational component of motion at the base, sinceconventional programs cannot take it into account, but the procedure is inadvisable and can lead toserious errors: inconsistencies in the structural models will result in shifts in the peaks and valleys ofthe transfer functions for the motions at the base of the structure. These transfer functions shouldexhibit some pronounced valleys at the natural frequencies of the structure whereas the transferfunction for the structural response will exhibit peaks at the same frequencies. If these frequenciesare not the same in the two structural models (the one used to compute the transfer function for thebase motion and the one used later to compute the structural response from this base motion), theamplifications at the resonant structural frequencies will be greatly exaggerated.
Even when the derivation of floor response spectra is the main objective of the analysis the stickmodels can introduce some significant errors. This is so, for instance when considering the verticalaccelerations at various points on the floor without accounting properly for the flexibility anddynamic response of the slab. The error would become more significant as the flexibility of thefloors increased. It is also common to ignore the equipment entirely in the derivation of thestructural model. Uncoupling the equipment from the structure is justified in most cases because themass of the former is very small compared to that of the latter. The exception is when the naturalfrequency of the equipment is very close to that of the structure and its mass is not negligible. Yet itis interesting to notice that accounting properly for the coupling between equipment and the structurein a rigorous way is relatively easy and not as laborious or expensive as often believed, particularlyfor analyses in the frequency domain using the substructure approach. It is only necessary tocompute the transfer functions for the displacements at the location of the equipment due to unitforces applied at the same location and the transfer functions for the motions at these points due tounit excitations at the base of the structure. The main requirement for this approach is theavailability of sufficient computer memory to store all the required transfer functions. This was asignificant requirement at one time but is no longer so with the present cost of memory. Similarsources of errors are introduced when entire components (walls, slabs) are omitted from thestructural model and then analyzed independently assuming uncoupled behavior. Even when thesesimplifications are reasonable in general terms, it is very hard to quantify the magnitude of the errorsthey can introduce which can become important when attempting to conduct more rigorous analysesto accurately define levels of performance under varying earthquake intensities.
A considerable amount of time and effort was normally spent on the analysis and design ofpiping and pipe supports. A source of difficulty in these analyses was the fact that the structuralmodel was not detailed enough in most cases to properly define the motions of the different supports.An even more serious problem in this case tended to be, however, the lack of consistency and up-to-date files with information on the as-built conditions or the latest modifications and the fact thatanalyses and redesigns were often performed by different persons with little communication.
The various structures present in a nuclear power plant are often connected by a variety of ductsand pipes. The fact that each structure was analyzed independently made it very difficult to performthe seismic analysis of these connecting elements unless the input motions to the various structureswere consistent and the transfer functions for the motions at the connection points in the differentbuildings were stored and available in the same data base.
200

13
All these comments point out the desirability of having a large data base where completeinformation on the nuclear power plant at any time, the models of the different structures and thesoil, the seismic motions used for input, and intermediate results such as transfer functions ofdifferent effects, can be stored and retrieved as needed. This would not only affect the consistencyand reliability of the seismic analyses but facilitate considerably the evaluation of potential changesand their effects, future redesigns or just checks requested at a later date. These points can becomeparticularly important when the plant has reached its design life but it is desired to maintain itoperational and therefore extend its service life. It is interesting to notice that data bases of thisnature have been developed and used in other fields (offshore structures for instance). In the nuclearfield, as stated in the Introduction, efforts along these lines have been conducted by a number ofcompanies in Japan (Machiba and Sasaki 1990, Kaneuji et al 1990, Satoh et al 1990).
A variety of methods have been used in the past to perform the dynamic analysis of the structuralor soil structure models. They ranged from traditional modal spectral analyses directly using thesmooth design spectra and performing the combination of the modal maxima through a number ofdifferent expressions (accounting or not approximately for correlation between the modal responses),to standard modal analyses in the time domain combining the time histories of the responses in eachmode, direct integration of the equations of motion in the time domain or solutions in the frequencydomain. For the second and third options it is necessary to have available earthquake time histories,whether corresponding to actual earthquake records or generated synthetically to match the targetspectra; for the last option one can start with these time histories and obtain their Fourier transformor directly with the Fourier spectrum (or in some cases the power spectrum) of the desired motion. Itwas not uncommon to have different parts of the plant or different portions of the analyses carriedout with different approaches using thus several of these methods simultaneously with very littleconsistency. Thus for instance the soil structure interaction analyses were carried out in many casesin the frequency domain which had no limitations on the effective damping (by opposition to themodal analyses), while the detailed structural analyses were performed with a modal spectralapproach. The fact that different groups within the design team were in charge of different sectionsof the analysis explains in part the diversity in approaches and lack of consistency.
By opposition to regular buildings which are designed on the assumption that they will undergolarge inelastic deformations under a severe earthquake the structures in a nuclear power plant werealways designed to remain linearly elastic even under the safe shutdown earthquake. A very smallamount of inelastic behavior was implicitly assumed in allowing larger values of material dampingfor the safe shutdown than for the operating basis earthquake but it was supposed to be very small.The use of reduction factors based on a vaguely defined and often meaningless system ductilitycustomary in the seismic design of regular buildings had been, however, wisely avoided.
Three new and significant trends have been evolving during the last 15 or 20 years in the seismicdesign of structures: the design for performance criteria rather than simply for a desired factor ofsafety (or equivalent load and resistance factors); the incorporation of probabilistic concepts toperform a complete seismic risk analysis accounting for the uncertainties in all the different phases;and the use of reduction factors based on system ductility following procedures similar to those usedfor conventional buildings (although the allowable reduction factors are smaller). The first twotrends represent a desire to obtain more accurate and realistic estimates of the effects of potentialearthquakes on the behavior of the structures. The third trend is somewhat contradictory to theothers and is in the opinion of the writer an undesirable step backwards.
A proper use of performance-based criteria would imply predicting the behavior of the structurenot only in the linear elastic range but also as yielding and inelastic action begin to occur and as theyprogress until a limiting serviceability condition or failure take place, as the loads are continuouslyincreased. This is a clear improvement over a conventional elastic analysis that can only furnishinformation on the level of earthquake for which yielding would start or a limit analysis that mightindicate the level of motion associated with failure. It also represents, however, the need for morerigorous and sophisticated models and analysis procedures. Present models for nonlinear dynamicanalysis of structures can predict reasonably well elastic behavior or failure but they are not verygood at estimating the extent of cracking, damage or inelastic deformations.
The use of probabilistic formulations is the only rational way to assess the effect of the manyexisting uncertainties on the reliability of the final results. Combined with sensitivity analyses theseformulations can help to identify the key parameters or effects controlling the response. These are
201

14
the parameters whose variations have a stronger influence on the final results. Once these variableshave been identified, one can concentrate resources on decreasing their uncertainty or modeling theeffects more accurately rather than spending time in attempting to reproduce accurately lesssignificant effects. On the other hand, it must be realized that the use of probabilistic techniques willnot and cannot by itself eliminate or decrease uncertainties; it can only provide an idea of theirimportance. The reduction in uncertainties can only be accomplished through improvedunderstanding of the physical processes, more accurate determination of material properties andmore accurate analysis procedures. The statement often made that refinement of the models or themethods of analyses used is unnecessary and even unwarranted when using a probabilistic approachsince any errors due to inaccuracies will be encompassed within the variations due to theuncertainties is highly misleading. Probabilistic analyses cannot account for systematic errorsintroduced by inadequate models, and compounding errors and uncertainties may lead to a furtherdecrease in the reliability of the results depending on the circumstances.
Probabilistic risk analyses are based on the use of fragility curves which provide the probabilityof failure of a given component or structural arrangement as a function of the level of earthquake(defined by a single parameter such as the effective or peak ground acceleration). The definition offailure is arbitrary and one could in principle derive fragility curves for different levels ofperformance. These fragility curves would be applicable to a given type of earthquake (a givenfrequency content) unless the characteristics of the motion are changed as a function of the level ofexcitation. The basic question is the degree of accuracy with which these fragility curves can becomputed or the accuracy of fragility curves based on highly simplified models. A number ofdifferent procedures have been suggested to obtain fragility curves. Some are based on relativelysimple semi-empirical procedures, others on more rigorous random vibration analyses. It is not clearat the present time how different would be the curves obtained for a given type of structure usingthese alternative procedures or even how different the results would be if the same technique were tobe used by several independent researchers or structural engineers. Thus, while the methodology toperform seismic risk analyses is reasonably well-established the ability to perform these analyses inactual practice with an appropriate degree of accuracy is questionable. The trend towards theimplementation of these methodologies is still a positive one, but the validity and accuracy of theresults of these analyses should not be accepted without question.
Even more questionable is the use of the rather crude techniques commonly employed for regularbuildings in the seismic design of important structures such as nuclear power plants. The use ofreduction factors on the design spectra to account for the ability of a structure to withstand inelasticdeformations is based primarily on the concept of ductility defined as the ratio of the maximumdistortion to the elastic (or yield) distortion for a single degree of freedom elastoplastic (elastic -perfectly plastic) system. The actual reduction factors are generally larger than the allowableductilities to account for a number of other factors often associated with the assumption that theactual strengths are underestimated or that analyses are conservative. This implies of course thatmore accurate analyses and estimation of the material strength coupled with these reduction factorswould lead to unconservative results. The extrapolation of the behavior of an idealized single degreeof freedom system to predict the response of an actual multidegree of freedom structure requires theuse of a system ductility, which is defined only in loose terms, but is hard to quantify. The relationbetween this system ductility and the local ductilities of the different elements is a function of thestructural type and many other factors. The use of the system ductility as a measure of damagetherefore has very little basis and is inconsistent with the concepts of performance-based design orprobabilistic risk analyses. To complicate matters further, the allowable ductilities are typicallybased on tests on single components subjected to idealized states of stress rather than the actualthree-dimensional conditions encountered in a real structure. As a result, the ability to predictrequired ductilities with any reasonable accuracy using present models and methods of analyses, andeven more with code-type procedures or spectral analyses and the possibility of quantifying theamount and type of damage that the structure may undergo for the predicted ductilities are highlyquestionable.
6. SUMMARY AND FINAL CONSIDERATIONS
The major uncertainties in the seismic design of nuclear power plants have always beenassociated with the selection and characterization of the design earthquake (s), the soil properties tobe used in the soil amplification and soil structure interaction analyses consistent with the in situ
202
15state of stresses, the accuracy of the structural and soil structure models and methods of analysis, andthe general treatment of nonlinear effects (nonlinear soil behavior, liquefaction potential, separationeffects between the foundation and the soil, and to a limited extent only nonlinear structuralresponse). In spite of the considerable reduction in the research effort related to nuclear powerplants over the last 15 years substantial progress has been done in some of these areas.
Thanks to the research conducted over the last years it is possible now to define the earthquakeor earthquakes associated with a desired level of hazard, or probability of occurrence, in a muchmore realistic way than before, accounting for the effects of magnitude, source mechanism anddistance not only on a single parameter such as the peak ground acceleration, or an effectiveacceleration, but also on the duration and frequency content. This represents a major breakthroughand an important departure from the traditional obsession with the use of only one variable.
Much progress has also been achieved in the determination of soil properties in situ over anextended volume but only for low levels of strain. The reasons for the large differences that wereobserved between the field and laboratory measurements are now well understood and correctionfactors which can improve greatly the agreement between the two types of results have beendeveloped. For one-dimensional situations the nonlinear soil behavior can be then inferred from thecurves relating modulus and damping to level of strain. For two- or three-dimensional situations itwould be necessary on the other hand to derive appropriate nonlinear constitutive models. The insitu determination of the parameters needed to define these models is in need of much more work.
The techniques to perform linear one-dimensional soil amplification studies have been well-known for a long time. Nonlinear convolution and deconvolution analyses are still being carried out,however, using an iterative linearization technique which can lead to serious errors for deep and softsoil deposits Major advances have been made in the consideration of 2D and 3D geometries, as oftenencountered in practice.
The assessment of the liquefaction potential at a site and the evaluation of the consequences ofliquefaction is another area where the state of the art has improved considerably in the last years,with a much better understanding (after years of controversy) of the physical phenomenon, muchmore statistical data to validate numerical predictions, experimental data from centrifuge tests, andcomputational models capable of accounting for pore pressure buildup, nonlinear soil behavior andlarge deformations and displacements.
There are now a number of rigorous formulations available to perform linear soil structureinteraction analyses including all major effects. There is also an ever increasing inventory ofsimplified models and procedures which can be used for preliminary design purposes, to estimate thepotential importance of various effects or to check the order of magnitude of the results from moresophisticated models. With present day computational capabilities, however, there can be nojustification for the use of these simplified models in the final analyses instead of the more rigoroustechniques which are available. The arguments often presented that these rigorous solutions can beextremely expensive are erroneous in most cases.
The final area in which very significant progress has been achieved is the development ofmethodologies for complete seismic risk analyses. This is the only rational way to account for theuncertainties that will always be present and to reach decisions related to safety and performance. Itshould be noticed, on the other hand, that these methodologies by themselves will not be of realvalue unless accurate models and data are available to predict the structural performance. This is notyet the case in practice.
It is clear that more work remains to be done in each one of these areas. The success achievedover the last years should encourage the industry and other funding sources to continue these lines ofresearch if it is desired to avoid unnecessary controversies when the design of new nuclear powerplants becomes a need. The area in which less progress has been done and a considerable amount ofresearch is needed in the evaluation of nonlinear effects. If the unfortunate trend to accept ductilityfactors in the design of nuclear power plants, by opposition to the linear behavior that was essentiallyrequired, is accepted and implemented in design regulations the proper modeling of nonlinearstructural behavior will become another major source of concern (and another source of controversyuntil this research is carried out).
203

16
As important as the improvement in the accuracy of the models and the analysis procedures is themaintenance of up to date files with information on the status of the plant, the analyses, intermediateresults, modifications introduced, etc.. This will avoid the inconsistencies, omissions and mistakeswhich are likely to occur when many different and separate groups are involved in the various phasesof the design process. The computer capabilities now available make it particularly easy to developmodern data bases where this information can be stored.
7. REFERENCES
Aki, K. 1988. Local site effects on ground motion. State of the art report. "Recent advances inground motion evaluation." Geotechnical Special Publication, ASCE, ne 20.
Aki, K. & K.L. Lamer 1970. "Surface motion of a layered medium having an irregular interface dueto incident plane SH waves." Journal of Geophysical Research, ne 75.
Bard, P.Y. & M.A. Bouchon 1980. "The seismic response of sediment filled valleys." Parts I & II.Bulletin Seismological Society of America, vrlQ.
Bard, P.Y. & M.A. Bouchon 1985. "The two-dimensional resonance of sediment filled valleys."Bulletin Seismological Society of America, n- 75.
Baylor J., M. Bienieck & J. Wright 1974. TRANAL: A 3D finite element code for transient nonlinearanalysis. DNA 3501F: Weidlinger Associates.
Bernreuter, D.L., J.B. Savy, R.W. Mensing, J.C. Chen & B.C. Davis 1985. Seismic hazard andcharacterization of the eastern United States. Vol. 1 & 2. LLNL-UCID-20421.
Bernreuter, D.L., J.B. Savy & R.W. Mensing 1987. "Seismic hazard of the eastern U.S.Comparative evaluation of the LLNL and EPRI studies." USNRC report NUREG/CR-4885.
Bernreuter, D.L., J.B. Savy, R.W. Mensing & J.C. Chen 1989. "Seismic hazard characterization of69 plant sites east of the Rocky Mountains." LLNL, USNRC report NUREG/CR-5250, UCED-21517. Vol. 1-8.
Blaney, G.W., E. Kausel & J.M. Roesset 1976. "Dynamic stiffness of piles." Proceedings 2ndInternational Conference on Numerical Methods in Geomechanics, ASCE.
Chen, Huei Tsyr 1984. "Dynamic stiffness of nonuniformly embedded foundations." Report GR84-10. Civil Engineering Department, The University of Texas at Austin.
Cheng, Fu-Ping 1986. "Dynamic response of circular foundations in an elasto plastic soil medium."Report GR86-3. Civil Engineering Department, The University Texas at Austin.
Constantopoulos, I.V. 1973. "Amplification studies for a nonlinear hysteretic soil model." ReportR73-46. Civil Engineering Department, M.I.T.
Dames & Moore 1978. "Study of nonlinear effects on one-dimensional earthquake response." EPRIReport NP-865.
D'Appolonia Consulting Engineers, Inc. 1979. "Seismic input and soil structure interaction." Reportprepared for the US. nuclear regulatory commission. NUREG/CR-0693.
DiMaggio, F.L. & I. Sandier 1971. "Material model for granular soils." Journal of the EngineeringMechanics Division, ASCE. Vol. 97, n2 EM3.
Dobry, R. & G. Gazetas 1985. "Stiffness and damping of arbitrary shaped machine foundations."Journal of Geotechnical Engineering, ASCE.
Dobry, R. 1995. "Liquefaction and deformation of soils and foundations under seismic conditions."State of the art paper. 3rd International Conference on Recent Advances in GeotechnicalEarthquake Engineering and Soil Dynamics. Vol. JH. St. Louis, Missouri.
DOE Standard 1994. "Natural phenomena hazards. Design and evaluation criteria for department ofenergy facilities." DOE-STD-1020-94.
Dominguez, J. 1978a. "Dynamic stiffness of rectangular foundation." Report R78-20. CivilEngineering Department, M.I.T.
Dominguez, J. 1978b. "Response of embedded foundations to travelling waves." Report R78-24.Civil Engineering Department, M.I.T.
Dravinski, M. 1982. "Scattering of elastic waves by an alluvial valley." Journal of the EngineeringMechanics Division, ASCE, nfi 108.
Dravinski, M. 1983. "Amplification of P, SV and Rayleigh waves by two alluvial valleys." SoilDynamics and Earthquake Engineering, n^ .
EPRI 1986. "Seismic hazard and methodology for the central and eastern United States." TechnicalReport NP-4726A. 11 Volumes.
EPRI 1993. "Guidlines for determining design basis ground motions." Technical Report TR-102293.
204
17
Gonzalez, J.J. 1977. "Dynamic interaction between adjacent structures." Report R77-30. CivilEngineering Department, M.I.T.
Jacob, K. 1994. "Quantifying seismic hazard and providing realistic ground motions for engineeringapplications primarily in the eastern United States." Research 1986-1994 accomplishments.NCEER.
Jones, T.J. & J.M. Roesset 1970. "Soil amplification of SV and P waves." Report R70-3. CivilEngineering Department, M.I.T.
Kaneuji, A., N. Akitomo & Y. Katoh 1990. "Technologies of computer integrated engineering andmanufacturing systems for nuclear power plant." Proceedings 1st International Conference onSuper computing in Nuclear Applications. Mito, Japan.
Kato, M. et al 1990. "Simulation analysis of dynamic characteristics on actual reactor buildings."Proceedings 1st International Conference on Super computing in Nuclear Applications. Mito,Japan.
Kausel, E. 1974. "Forced vibrations of circular foundations on layered media." Report R74-11.Civil Engineering Department, M.I.T.
Kausel, E. and J.M. Roesset 1974. "Soil structure interaction for nuclear containment structures."Proceedings ASCE Power Division Specialty Conference. Boulder, Colorado.
Kausel, E. 1981. "An explicit solution tor the Green functions for dynamic loads in layered media."Report R81-13. Civil Engineering Department, M.I.T.
Kausel, E. & R. Peek 1982. "Boundary integral method for stratified soils." Report R82-50. CivilEngineering Department, M.I.T.
Kaynia, A.M. & E. Kausel 1982. "Dynamic stiffness and seismic response of pile groups." ReportR82-03. Civil Engineering Department, M.I.T.
Kim, Y.S. 1987. "Dynamic response of structures on pile foundations." Ph.D. Dissertation. TheUniversity of Texas at Austin.
Luco, J.E. 1974. Impedance functions for a rigid foundation on a layered medium. Nuclearengineering and design..
Lysmer, J., T. Udaka, H.B. Seed & R.N. Hwang 1974. LUSH. "A computer program for completeresponse analysis of soil structure systems." Report EERC 74-4. University of California,Berkeley.
Lysmer, J., T. Udaka, C.F. Tsai & H.B. Seed 1975. "FLUSH. A computer program for approximate3D analysis of soil structure interaction problems." Report EERC 75-30. University ofCalifornia, Berkeley.
Lysmer, J. et al 1988. SASSI. "A computer program for dynamic soil structure interactionanalysis." Report UCB/GT81-02. University of California, Berkeley.
Lysmer, J. 1994. Personal communication.Machiba, H. & Sasaki, N. 1990. "Ioshiba CAE system for nuclear power plant." Proceedings 1st
International Conference on Super computing in Nuclear Applications. Mito, Japan.Matlock H. & L.C. Reese 1960. "Generalized solutions for laterally loaded piles." Journal of the
Soil Mechanics and Foundations Division, ASCE. Vol. 86 SM-J.Matlock, H. 1970. "Correlations for design of laterally loaded piles in soft clays." Proceedings 2nd
Offshore Technology Conference. Paper OTC 1205.Miyamoto, A. et al 1990. "Response analysis of the PWR type reactor building for vertical
earthquake motion using supercomputers." Proceedings 1st International Conference onSupercomputing in Nuclear Applications, Mito, Japan.
Nazarian, S. 1984. "In situ determination of elastic moduli of soil deposits and pavement systems byspectral analysis of surface waves method." Ph.D. Dissertation. The University of Texas atAustin.
O'Rourke, T. 1994. "Soil liquefaction, large ground deformation and earthquake resistant design oflifelines." Research 1986-1994 accomplishments. NCEER.
Papageorgiou, A. & J. Kim 1992. "Propagation and amplification of seismic waves in 2D valleysexcited by obliquely incident SV and P waves." Earthquake Engineering and StructuralDynamics, n222.
Prevost J.H. 1977. "Mathematical modeling of monotonic and cyclic undrained clay behavior."International Journal of Numerical and Analytical Methods in Geomechanics. Vol. 1. n2 2.
Roesset, J.M. & R.V. Whitman 1969. "Theoretical background for amplification studies." ReportR69-15. Civil Engineering Department, M.I.T.
Roesset, J.M. & H. Scaletti 1979. "Nonlinear effects in dynamic soil structure interaction." 3rdInternational Conference on Numerical Methods in Geomechanics. Aachen, Germany.
Roesset, J.M. & Y.S. Kim 1987. "Specification of control motions for embedded foundations."Proceedings 5th Canadian Conference on Earthquake Engineering.
205
18
Roesset, J.M., D.W. Chang & K.H. Stokoe, II 1991. "Comparison of 2D and 3D models for analysisof surface wave tests." Soil Dynamics and Earthquake Engineering V: Elsevier AppliedScience.
Roesset, J.M. C. Huerta & K.H. Stokoe 1995. "Effect of magnitude and type of damping on soilamplification." 3rd International Conference on Recent Advances in Geotechnical EarthquakeEngineering and Soil Dynamics. St. Louis, Missouri.
Sanchez Salinero, I. 1983. "Dynamic stiffness of pile groups: approximate solutions." ReportGR83-5. Civil Engineering Department, The University of Texas at Austin.
Sanchez Sesma, FJ . 1983. "Diffraction of elastic waves by three-dimensional surface irregularities."Bulletin Seismological Society of America, vrl3.
Satoh, S. et al 1990. "The use and limitations in using supercomputers in structural design fornuclear power plants." Proceedings 1st International Conference on Supercomputing in NuclearApplications. Mito, Japan.
Schnabel, P.B., J. Lysmer & H.B. Seed 1972. "SHAKE. A computer program for earthquakeresponse analysis of horizontally layered sites." Report EERC 72-12. University of California,Berkeley.
Seed, H.B. & I.M. Idriss 1969. "Influence of soil conditions on ground motions duringearthquakes." Journal of the Soil Mechanics and Foundations Division, ASCE.
Seed, H.B. 1979. "Soil liquefaction and cyclic mobility evaluation for level ground duringearthquakes." Journal of the Geotechnical Engineering Division, ASCE, Vol. 105, n- 2.
Seed, H.B., I.M. Idriss & I. Arango 1983. "Evaluation of liquefaction potential using fieldperformance data." Journal of the Geotechnical Engineering Division, ASCE, Vol. 97, n2 3.
Seed, H.B., K. Tokimatsu, L.F. Harder & R.M. Chung 1984. "The influence of SPT procedures onsoil liquefaction resistance evaluations." Report UCB/EERC 84/15. University of California,Berkeley.
Seed, H.B., & L.F. Harder, Jr. 1990. "SPT based analysis of cyclic pressure generation andundrained residual strength." Proceedings H. Bolton Seed Memorial Symposium: Vol. 2.
Sheu, J.C. 1987. "Application and limitations of the spectral analysis of surface waves method."PhD. Dissertation. The University of Texas at Austin.
Systems, Science and Software 1980. "New endochronic plasticity model for soils." EERI ReportNP-1388.
Vardanega, C. 1978. "Soil structure interaction effects on the dynamic response of shear wallbuildings." M.S. Thesis. Civil Engineering Department, M.I.T.
Vaughan, D. 1983. "FLEX User's guide." Document UG8298:Weidlinger AssociatesVeletsos, A.S. &Y.T. Wei 1971. "Lateral and rocking vibrations of footings." Journal of the Soil
Mechanics and Foundations Division, ASCE, Vol. 97.Veletsos, A.S. & B. Verbic 1974. "Basic response functions for elastic foundations." Journal of the
Engineering Mechanics Division, ASCE, Vol. 100.Werner, S.D. 1991. "Soil structure interaction: the state of practice and recommended research
needs." NSF Workshop on Experimental Needs for Geotechnical Earthquake Engineering.Albuquerque, New Mexico.
Wolf, J.P. 1976. "Soil structure interaction with separation of base mat from soil (lifting off)."Nuclear Engineering and Design. Vol. 38.
Wolf, J.P. 1977. "Seismic response due to travelling shear waves including soil structure interactionwith base mat uplift." Earthquake Engineering and Structural Dynamics. Vol. 5.
Wolf, J.P. 1985. Dynamic soil structure interaction: Prentice Hall.Wolf, J.P. 1988. Dynamic soil structure interaction in time domain: Prentice Hall.Wolf, J.P. 1994. Foundation vibration analysis using simple physical models: Prentice Hall.Yamada, A., K. Miura & T. Kobori 1995. "Nonlinear analysis method for prediction of base
motion." 3rd International Conference on Recent Advances in Geotechnical EarthquakeEngineering and Soil Dynamics. St. Louis, Missouri.
206
. 2 - XA9952656
DYNAMIC ANALYSIS OF W E R TYPE NUCLEAR POWER PLANTS USING DIFFERENTPROCEDURES FOR CONSIDERATION OF SOIL-STRUCTURE INTERACTION EFFECTS
L. Halbritter, N.J. KrutzikSiemens AG, Power Generation Group (KWU), Offenbach, FRG
ABSTRACT: The dynamic response of structures due to seismic loadings is conventionallyanalyzed in the time domain using modal substructure procedures. This procedure uses frequency-independent parameters to represent the soil underneath the structure. These parameters aretuned to the main frequencies of the soil-structure system. This is a common procedure widelyused in the preliminary design of power plant structures and provides conservative results.
However, parallel to the rapid progress being made in upgrading the capability of data processingsystems, methods and software tools have become available which work only in the frequencydomain using complex mathematical models or models in which the soil is represented byfrequency-dependent impedances. This complex method also allows realistic treatment ofkinematic interaction effects and especially consideration of the embedment parameters of thebuilding structure.
The main goal of the study presented here was to demonstrate the effects of differentprocedures for consideration of soil-structure interaction on the dynamic response of the structuresmentioned above. The analyses were based on appropriate mathematical models of the coupledvibrating structures (reactor building, turbine hall, intermediate building structures) of a WER440/213 as well as a WER 1000 and the layered soil.
On the basis of this study, it can be concluded that substructure models using frequency-independent impedances and cut-off of modal damping usually provide conservative results.Complex models which allow the soil-structure interaction effects to be realistically represented(by coupled models of the soil and the structure or by frequency-dependent impedances) providemore accurate results. The advantage of the frequency-domain analysis will be demonstrated anddiscussed, based on results obtained for the WER 440/213 PAKS and WER 1000 Kozloduy.
1 INTRODUCTION
The treatment of soil-structure interaction effects in the analysis of structures founded on thesurface or embedded in the soil is still one of the most discussed issues in the field of aseismicdesign and requalification of operating nuclear power plants.
In the course of verifying and upgrading seismic input data for a number of sites with operatingnuclear power plants, attention was focused on the conservatism of the design procedures andmethods used in the past for the design of these units.
Although the building structures generally possess enough capacity reserves to sustain higherloads, the conservative design procedures have to be replaced by more realistic methods due tothe vast requalification effort required for components and systems which have to be upgraded or,in extreme cases, strengthened to accommodate higher seismic loading.
In the framework of requalifying of a number of operating German-type or WER-type (formerUSSR) nuclear power plants at sites where the seismic input definitions were increased,investigations were performed using different calculation methods and procedures forrepresentation of the soil. It was observed that the conservatism of various substructure methods
207

- 3 -
{Figure 1) that generally assume frequency-independent soil parameters (indirect method) andsolve the equations of motion in the time domain could be reduced significantly by means of adirect method (Figure 2) in which the frequency dependency of the soil parameter is realisticallyconsidered (by a complex mathematical model of the soil and the structure or by frequency-dependent soil parameters) and in which the analysis is performed in the frequency domain. Unlikethe indirect method (Figure 1), which is an analysis in the time domain, the direct method alsoallows realistic treatment of kinematic interaction effects and, especially, consideration of the realembedment parameters of the structure.
In order to demonstrate the conservatism of the indirect methods, the results obtained for themain buildings of a WER 440/213 and WER 1000 by means of the two methods mentionedabove will be compared and evaluated.
2 DESCRIPTION AND IDEALIZATION OF THE STRUCTURES
2.1 WER 440/213
Paks Nuclear Power Station consists of so-called twin units. The main buildings are connectedtwo-by-two on a common monolith basemat of 2-m thickness and have a symmetrical layout(Figure 3). The bottom of the basemat is set at an elevation of -8.5 m. On this foundation (145 mlong, 52 m wide) there are two condensing towers with a base surface of 42 x 24 m. The towersrise to an elevation of 50 m and are designed to withstand a 2.5-bar pressure generated by aLOCA. Above the 18.9 m elevation there is a hall used for reactor maintenance and refueling. Thefloor and wall thicknesses vary from 0.6 to 1.5 m and comply with structural and radiation shieldingrequirements.
On the eastern side of the building, a north-south oriented gallery building of 12 m in width andthe turbine hall with a span of 39 m are attached to the reactor building. Both are constructed ofsteel. On the south as well as the north sides there is also a gallery building which as attached tothe reactor building and is supported partly by reinforced concrete pillars and by the reactorbuilding wall.
This plant is characterized by structural elements with different stiffness properties, resulting in acomplex mixed structure. For this reason an accurate and detailed model was necessary. In orderto ensure adequate treatment of interaction effects, all the structures described in the previoussection were modeled in only one 3D finite element model (main building, turbine hall andgalleries).
The finite element model of one unit of the Paks nuclear power plant has 9930 dynamic degreesof freedom. It comprises 1675 nodal points and 2132 trapezoidal elements, 470 triangularelements and 1005 beam elements.
A general view of the finite element model is shown in Figure 5. The weight of the structure iscomposed of the weight of the structure itself, the weight of mechanical and electricalcomponents as well as various live loads. The total weight of the model is approximately 2 200000 kN.
2.2 WER 1000
The reactor building (Figure 4) is designed as a square, reinforced-concrete structure, each sidemeasuring approximately 67.8 m in length. It is supported on a 2.8-m-thick foundation slab.
The bottom of the building foundation is located approximately 7 m below plant grade. In view ofthe thickness of the foundation slab this results in a total height of approximately 73 m, of which66 m are above plant grade. The load-bearing and stiffening members mostly comprise walls andfloors. Up to approximately the 13.2-m elevation, the walls and floors, which for reasons ofradiation shielding as well as structural requirements are of massive design, form a compositesystem of rigid cells.
Above the 13.2-m elevation, the reactor building is subdivided into three structures separated byconstruction joints: the surrounding building, the prestressed concrete containment and the reactorsection.
208

- 4 -
All three structures are supported on a 2.4-m-thick floor. The surrounding building encompassesthe containment. Apart from the outer and inner walls, only the horizontal floors make anysignificant contribution to its structural rigidity.
The containment has a diameter of 45 m and a wall thickness of 1.2 m. It is a prestressedconcrete structure of cylindrical shape with a spherical dome at the top which is designed with acylindrical transition.
The mathematical model and the degree of discretisation were chosen such that the naturalbehavior of the structure in the relevant frequency range could be computed with good reliability.Furthermore the number of nodes at which information is needed influenced the modeling.
Considering the geometric shape, stiffening and mass distribution of the reactor building underconcern, as well as the frequency content of the dynamic excitation, an equivalent beam modelwas used in the first calculations (Figure 6).
The beam model includes the outer structure, the containment, the inner structure and thebasement structure as an entirely connected total system. Derivation of the equivalent stiffnessesand masses was performed using a computer on the basis of input data and assumptions definedfor each floor and region.
3 METHOD OF ANALYSIS
3.1 Substructure model approach
The analyses were based appropriate models for the building structures as well as frequency-independent soil impedances (equivalent springs and dampings). As mentioned above, appropriatemathematical models with an adequate degree of discretization were used. The equivalent springsand damping elements, were derived from the corresponding impedance functions (Figures 7-10)and distributed appropriately at nodes of the discretized foundation of the buildings (Figures 5 and6).
Seismic excitation was represented in both cases by three artificial time histories compatible withthe given free-field spectra. At the base of the building, excitations were subsequently appliedwhich represented the deconvoluted motion at the embedment level (Figures 11 and 13) in thetranslational (horizontal 1 and 2) and vertical directions. For the WER 440/213 (PAKS) themaximum horizontal acceleration was 3.50 m/s2 and the duration of the time history was 15seconds. In the vertical direction, values scaled down by a factor of 2/3 were used.
In the case of the WER 1000 the maximum horizontal acceleration was 2.0 m/s2, the duration ofthe excitation 60 seconds and in the vertical direction values scaled by 0.5 were used.
The dynamic analyses were conducted using the STRUDYN finite element program 171. Inaccordance with German standards (KTA 2201.4), the analysis was performed assuming a cut-offdamping of 15 % and 30 % for the horizontal and vertical directions, respectively.
3.2 Complex model approach
The structural models of the building described above were coupled with the mathematical modelof the soil to form one complex finite element model (Figures 13 and 14). The numericalcomputations were performed using the SASSI /6/ computer code which solves the equations ofmotion in the frequency domain. In SASSI the flexible volume method is adopted for coupling thetwo structures and allows a horizontally layered halfspace representing the soil region under thefoundation to be taken into account. Based on the parameters of the layered soil and the geometricform of the foundations in the first step of the calculation the frequency-independent impedancematrices are computed.
The impedance matrix for the soil was determined by inverting the flexibility matrix calculated forall interaction nodes which are common to the structure and soil region. The impedance matrixwas added to the stiffness matrix of the structure and this resulted in a final complex matrix for alldegrees of freedom needed to describe the behavior of the system.
The flexibility matrix was calculated for all interaction nodes using an axisymmetric model of thesoil deposit with one core element connected to lateral transmitting boundaries allowing for
209

- 5 -
dissipation of energy as radiation damping. The underlying halfspace was simulated throughadditional layers with viscous dampers at the lower boundary.
To represent the real soil-structure interfaces, the beam model was coupled to a rigid foundationplate having the real length and width of the building. The structural models of the building werethen coupled with the mathematical soil models as before. The control motion, i.e. inputacceleration time history, was defined for the surface of the free-field.
The Fast Fourier Transform technique was applied to obtain the response at any node in themodels. The equations of motion were only solved at selected frequencies and the results for all"in-between" frequencies were interpolated.
4 CHARACTERISTIC RESULTS
To demonstrate the influence of different assumptions regarding the representation of the soil-structure interaction effects on the dynamic response of the VVER 440/213 and VVER 1000building structures during earthquake excitation, response spectra obtained for characteristicregions Figures 15 and 16) were computed by both procedures and compared (Figures A1 to A21and B1 to B18).
A comparison of the respective spectra for 2 % shows that there is a significant differencebetween the dynamic response results obtained by means of the two procedures (substructureand complex models). When a analyzing the response spectra it can be generally observed thatthere is a slight shift in the fundamental frequency of the building and a reduction in the spectralaccelerations when using complex models.
As regards the higher damping capacity of a more soft soil, the reduction effects obtained for theWER 440/213 (PAKS site) are higher than for the WER 1000 Kozloduy site).
Because of the greater effect of soil damping (material and radiation damping) on the dynamicbehavior of the lower part of the building, the reductions are more pronounced at the foundationlevel than on the upper floors of the building.
However, on the upper floors the reduction in the peak frequency range is by about a factor of 3in the horizontal direction and up to 25 - 50 % in the vertical direction. The reduction in the rigidbody part of the spectra is nearly the same.
It is evident that the lower structural response obtained (in the frequency domain) using coupledsoil-structure models is due to the realistic representation of the soil capabilities as well asconsideration of the real damping capacity of the coupled soil-structure system.
5 SUMMARY AND CONCLUSIONS
Soil-structure interaction analyses using different analytical approaches and solution procedureswere performed for seismic loading and the soil conditions of the main buildings of the nuclearpower plants VVER 440/213 and WER 1000.
In general, complex model analysis (considering the frequency dependency of the soilparameters) yielded significantly lower accelerations, especially in the frequency range above thefundamental frequency, compared to the accelerations obtained through conventional substructureapproaches.
This is due to the following influences:- Consideration of the real damping capacity- Consideration of kinematic interaction effects by the complex mathematical model- Consideration of the real stiffness of the foundation plate- Filtering effects of the soil.
On the basis of this study, it can be concluded that the substructure model approach usingfrequency-independent (discrete) stiffnesses, dampings and cut-off of modal damping usuallyprovides very conservative results. On the other hand, the complex model approach, which allowssoil-structure interaction effects to be represented more realistically, provides more reliable results.
210

- 6 -
This approach yields a realistic and efficient design which is not only safe but also economical, itmay be recommended for use especially in situations requiring verification of existing buildingstructures due to upgraded seismic input data.
6 REFERENCES
/ 1 / Katona, T., Turi, L, Halbritter, A., Krutzik, N.: Experimental and Analytical Investigation ofPAKS Nuclear Power Plant Building Structures, 10 WCEE - Madrid, July 1992
121 Ewers, J., Hitzschke, U., Krutzik, N.J., Papandreou, D., Schiitz, W., Time Versus FrequencyDomain Analysis of Nuclear Power Plant Building Structures, 12th SMiRT Conference,Stuttgart, August 1993
13/ Ambriashvili, Y.K., Boyadjiev, Z., Krutzik, N.J., Papandreou, D., Schutz, W.: StructuralResponse Behavior of a Standardized VVER 1000 Nuclear Power Plant Using Substructure andCoupled Models, 10th European Conference on Earthquake Engineering, August 1994, Vienna
141 Main Building Complex PAKS, Structural Dynamic Analysis for Seismic Loading (Time DomainCalculation), Working Report Siemens KWU NDA2/94/E173
/5/ Structural Dynamic Analysis for Seismic Loading of the Main Building Complex PAKS(Frequency Domain Analysis), Working Report Siemens KWU NDA2/94/E0288
/6/ SASSI/Siemens (1981), A Computer System for Analysis of Soil-Structure Interaction, UserManual, Siemens VAX Version
111 STRUDYN, General Computer Program for Linear, Elastic, Static and Dynamic Analysis, UserInformation Manual, VAX Version 3/1991
Coupled SystemSoil-Structure
Coupled Model
Spatial' Model
Soil/Model
Excitation
V7/////////////77/////////S
•< •
Excitation
Fig. 1 Complex Method of Analysis of the Soil Structure Interaction Effect (Coupled Models)
211
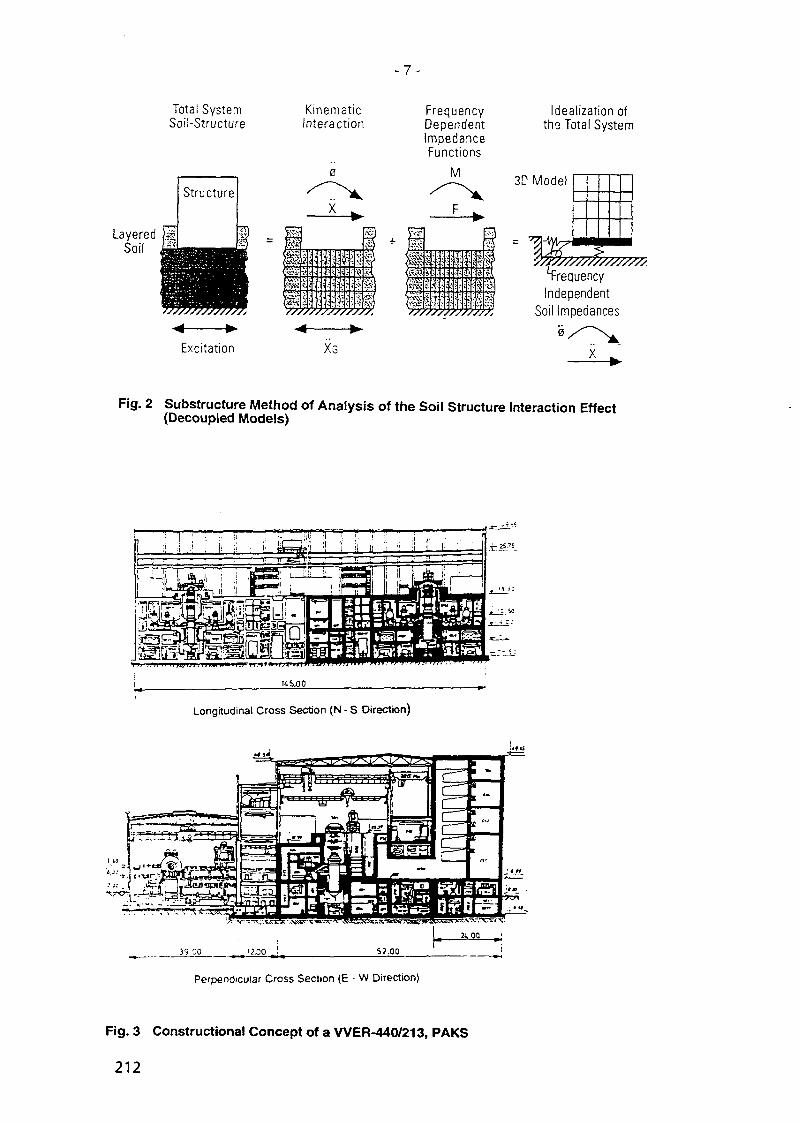
- 7 -
Total SystemSoil-Structure
KinematicInteraction
LayeredSoil
FrequencyDependentImpedanceFunctions
M
Idealization ofths Total System
M51
? < : ; : j
^ • .• - • i
; • ; » • a
1 5 ; ••'- S
ii///////////////
3C Model
• • •
FrequencyIndependent
Soil Impedances
Excitation XG
Fig. 2 Substructure Method of Analysis of the Soil Structure Interaction Effect(Decoupled Models)
Longitudinal Cross Section (N - S Direction)
Perpendicular Cross Section (E • W Direction)
Fig. 3 Constructional Concept of a WER-440/213, PAKS
212

- 8 -
Fig. 4 VVER-1000 Reactor Building KOZLODUY,Characteristic Output Regions
Containment
" " 36.90
- " 3J.60
- "28.80
" " 24.60
- - 19.40
4- 16.80
u..
4-5 60
41.40
36.60
33.60
20.40
16JM
13.20
0.00
-<20-s.eo
Fig. 6 VVER-1000 USSRBeam Model of the Reactor Building
213

- 9 -
Turbine Hall
SpatialModel
SoilImpedances
:i2 /
>M
Fig.5 Substructure Model (Spatial) of an 1300 MW BWR Reactor BuildingFrequency-Independent Soil Idealization
214
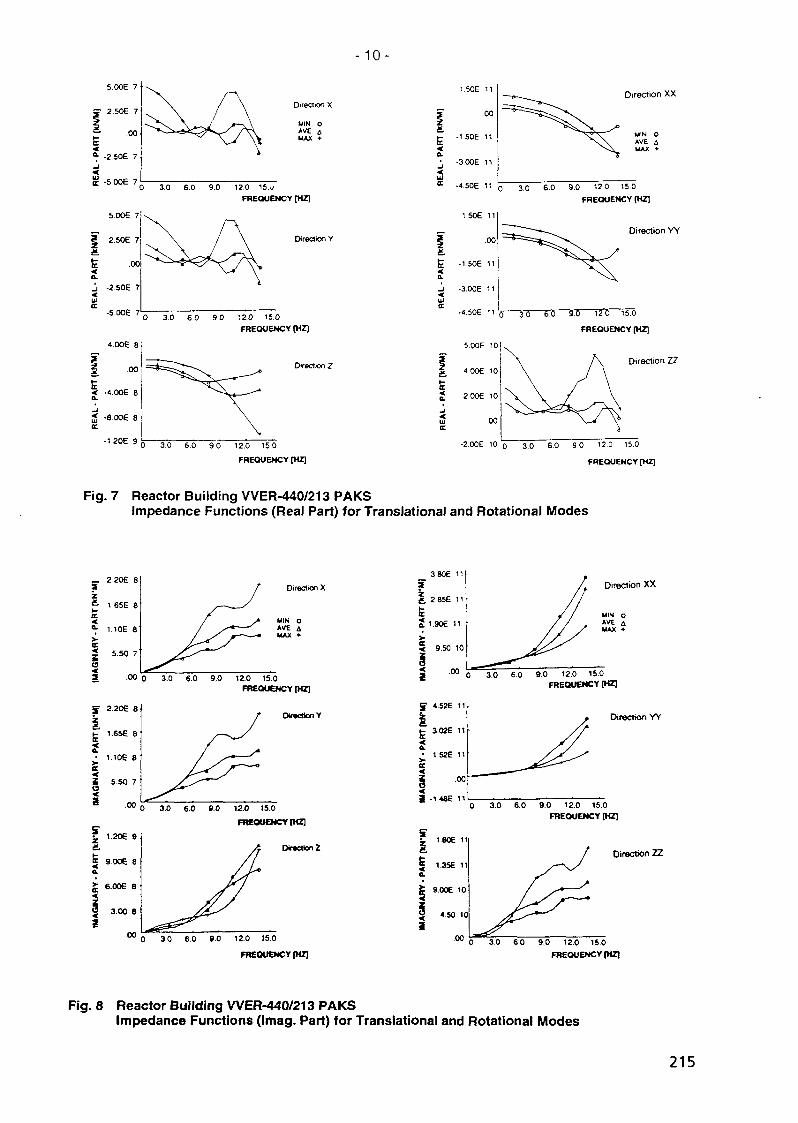
- 10-
5.0OE 7
2.SOE 7
.00
-2.50E 7
-SOOE 7
5.006 7
2.S0E 7
.00
-2.50E 7
•5.00E 7
4.00E 8
,oo|
•4.00E 8
-8.006 8
•1.20E 9
WIN OAVE 4MAX •
0 3.0 6.0 9.0 12.0 IS.uFREQUENCY [HZ]
Direction Y
0 3.0 6.0 9.0 12.0 15.0FREQUENCY [HZ]
Direction Z
0 3.0 6.0 9 0 12.0 15.0
FREQUENCY [HZ]
l.SOE n
.00
-1.50E 11
-3.00E 11
I
Direction XX
MIN oAVE AMAX •
Direction YY
-4.50E 11 0 3 0 6.0 9.0 12.0 15 0
FREQUENCY [HZ]
l.SOE 11
.00
•l.SOE 11
•3.00E 11
•4.50E 11 '
5 00E 10
400E 10
2.0OE 10
.00
ST3 ST5 12T5 i T o
FREQUENCY [HZ]
Direction 2Z
•2.00E 10 0 3.0 6.0 9 0 12 0 15 0
FREQUENCY [HZ]
Fig. 7 Reactor Building VVER-440/213 PAKSImpedance Functions (Real Part) for Translational and Rotational Modes
2.20E 8
1.6SE 8
1.10E 8
5.50 7
3.80E 11
Direction X
MIN oAVE 4
•00 o 3.0 6.0 9.0 12.0 15.0FREQUENCY (HZ)
2 206 8
1.65E 8
1.10E 8
5.50 7
.00
OiTKttonY
0 3.0 6.0 8 0 12 0 15.0
FREQUENCY [HZ]
DnctfcmZ
' 0 30 6 0 S.O 12.0 15.0
FREQUENCY [HZ]
5 4.52E 11
t 3-02E 11
• 1.S2E 11
II -1.48E 11
Direction XX
0 3.0 6.0 9.0 12.0 15.0FREQUENCY [HZ]
Z 1.60E 11
5 1356 11
| 9.00E 10
g 450 10
200
Direction YY
0 3.0 6.0 9.0 12.0 15.0FREQUENCY [HZ]
Direction ZZ
0 3 0 6 0 9.0 12.0 15.0
FREQUENCY [HZ]
Fig. 8 Reactor Building VVER-440/213 PAKSImpedance Functions (Imag. Part) for Translational and Rotational Modes
215

-11 -
00 20
DIRECT©* X
a.o I O O 00 20
Fig. 9 Reactor Building WER-1000 KO2LODUYImpedance Functions (Real Part)
DIRECTION XX
DIRECTION X DIRECTION 2
0 0 ?0 o eo 8 0
DIRECTION XX
Fig. 10 Reactor Building WER-1000 KOZLODUYImpedance Functions (Imaginary Part)
216

- 12-
f nquency fHZ]
2.0 ;
1.E-1 2.E-1 S.E-1 1.E0 2.60 S.EO 1.E1 2.E1 S.E1 1.E2Frequency [HZ]
Fig. 11 Seismic Input Information for the Site PAKSFig. 12 Reactor Building KOZLODUY, Unit 5
Response Spectra of Foundation Level (Benchmark 3)
Turotn* Building Reactor Building
xwwwwv
Lay«r«dSoil
• W W Y 5 ™ 60 MN'
40 m 160MNT1?
5Srr 250 MNfnJ
Fig. 13 Mathematical Model for the Coupled SystemTraverse Direction (Direct Method)
UyaredSoil
G= WOMN/m2
D= 7%
p= 1.80 t/nf
G= 330 MN/m2
0= 7%v= 0.36p= ZMt/nf
0= 7%v= 0.45p= 2.00 t/m3
Fig. 14 Model of Reactor Building and Foundation(Complex Model)
217
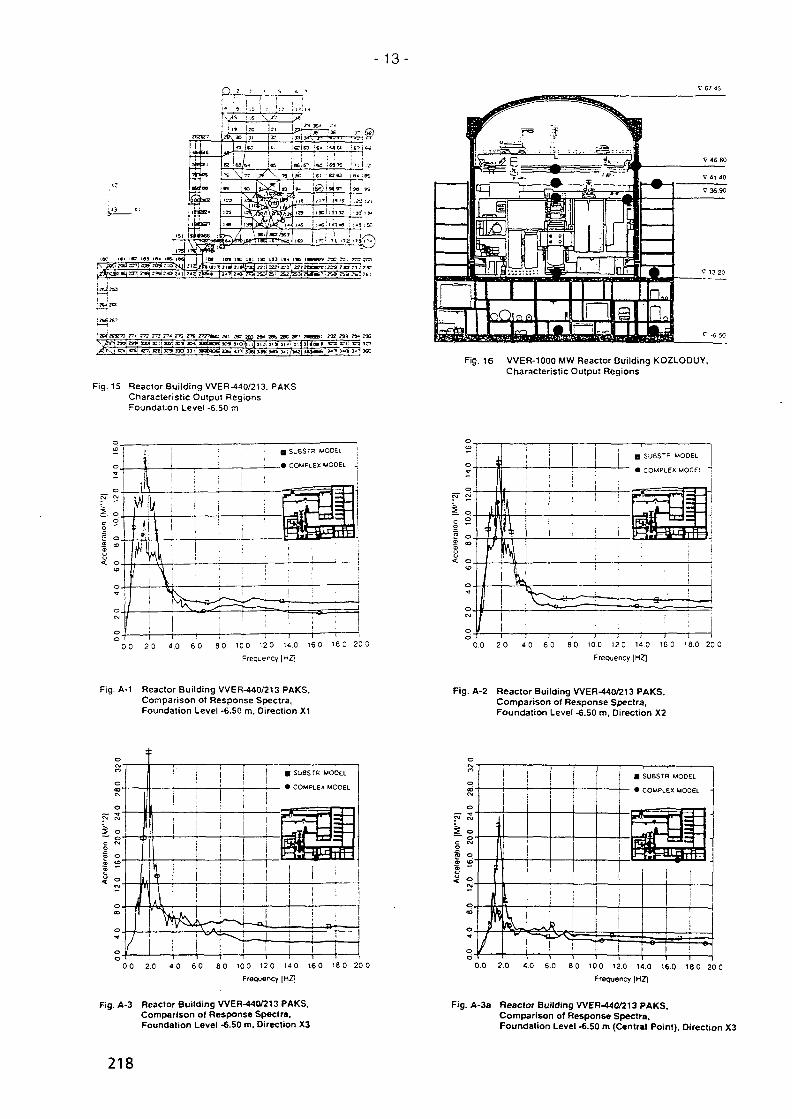
- 13-
£§>
i i«z 183 18* iesi las 1 |:na IOT IK: HI I B U S IS« US I M » W r g rsi ??r ^
^ Pi; g j S>^"3*a 3^13
Fig. 15 Reactor Building VVER JJ40/213. PAKSCharacteristic Output RegionsFoundation Level -6.50 m
Fig. 16 VVER-1000 MW Reactor Building KOZLODUY,Characteristic Output Regions
-I 1 100 20 4.0 60 80 100 120 K.O 16 0 180 20 0
Frequency [HZ]
0.0 2.0 4.0 6.0 8.0 100 120 U.O 160 18.0 20 0
Frequency (HZ)
Fig. A-1 Reactor Building VVER-440/213 PAKS.Comparison of Response Spectra,Foundation Level -6.50 m. Direction X1
Fig. A-2 Reactor Building WER-440/213 PAKS,Comparison of Response Spectra,Foundation Level -6.50 m, Direction X2
I suasm MODELI COMPLEX MODEL
IS^H
1 1 i i 1 1 1 1 100 2.0 40 60 80 100 120 14 0 16 0 180 20 0
Frequency |H2]
• SUBSTR MODEL
• COMPLEX MO061
1
0.0 2 0 4.0 6.0 8 0 10.0 12.0 14.0 16.0 18.0 20 0
Frequency |H2)
Fig. A-3 Reactor Building WER-440V213 PAKS.Comparison of Response Spectra.Foundation Level -6.50 m. Direction X3
Fig. A-3a Reactor Building WER-440/213 PAKS.Comparison of Response Spectra,Foundation Level -6.50 m (Central Point), Direction X3
218

- 14-
OC 2 C 4 0 6 C 8 0 -.CO ' 2 0 ' 4 0 16 .0 - 8 C 2
• SJ8STR MODEL :j
• COMPLEX MODEL
_ - . • .' —
H==_J
0 0 2 0 <C 6 0 8 0 ' 0 0 1 2 0 1 4 0 1 6 0
Fig. A-4 Reactor Building VVER-440/213 PAKS.Comparison of Response Spectra,Elevation 0.00 m. Direction X1
Fig. A-5 Reactor Building VVER-440/213 PAKS,Comparison of Response Spectra,Elevation 0.00 m. Direction X2
SjBSTfl MOOEL
COMPLEX MOOtL
0.0 2.0 4.0 6.0 8 0 10 0 12.0 14 0 16 0 18 0 20 C
Frequency [HZ]
0.0 2 0 4.0 6.0 8 0 10.0 12 0 14 0 16 0 18 0 20 0
Frequency |HZ]
Fig. A-6 Reactor Building WER-440/213 PAKS,Comparison of Response Spectra,Elevation 0.00 m. Direction X3
Fig. A-7 Reactor Building WER-440/213 PAKS,Comparison of Response Spectra,Elevation 6.00 m. Direction X1
• SU8STR MOOEL
. • COMPLEX MODEL
0 0 2.0 4 0 6 0 8 0 1 0 0 1 2 0 1 4 0 1 6 0 1 8 0 20 0
Frequency |HZ]
< °
I SU8STR MOOEL
> COMPLEJ! MODEL
0 0 2 0 4 0 6 0 8 0 1 0 0 12.0 1 4 0 16 0 1 8 0 20 0
Frequency |HZ]
Fig. A-8 Reactor Building WER-440/213 PAKS.Comparison of Response Spectra,Elevation 6.00 m, Direction X2
Fig. A-9 Reactor Building WER-440/213 PAKS.Comparison of Response Spectra,Elevation 6.00 m. Direction X3
219
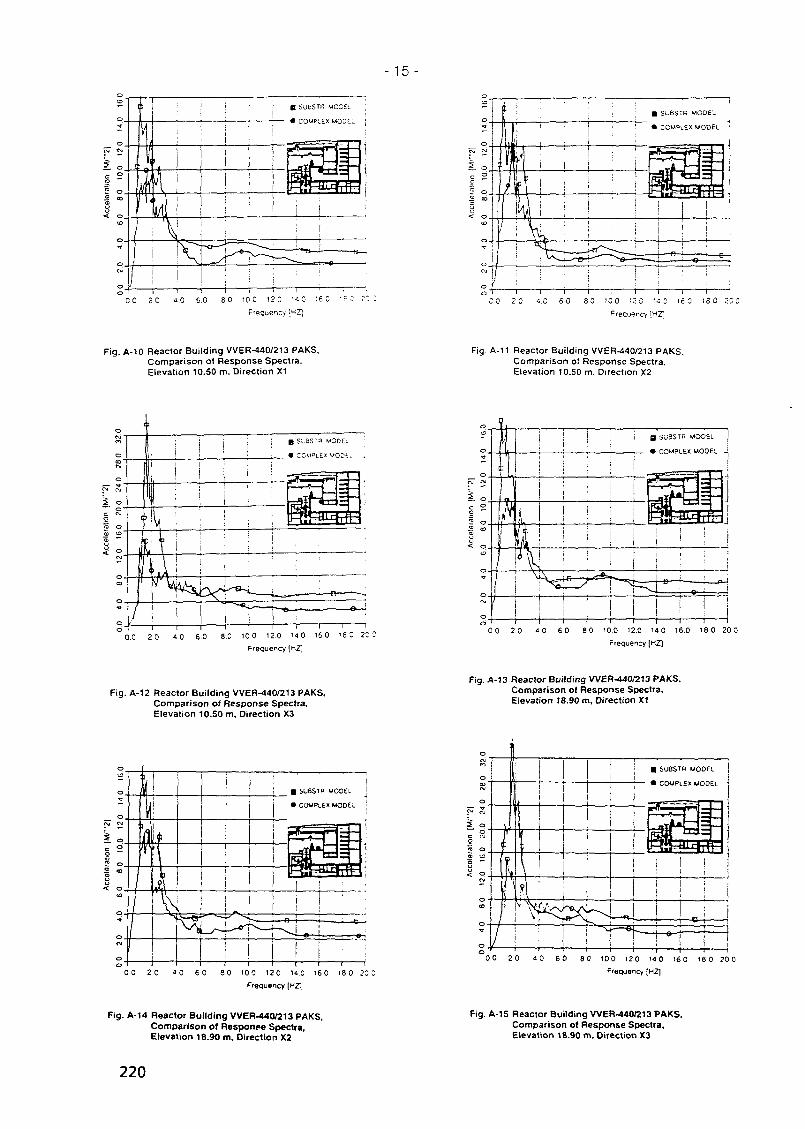
- 15-
00 2.0 40 6.0 80 100 12 C U S 16!
Frequency ;^Z]
2 0 t.C 6 0 SO 10 0 12 0 « ! 16 0 18 0 20 C
Frequency [HZ]
Fig. A-10 Reactor Building VVER-440/213 PAKS,Comparison o< Response Spectra,Elevation 10.50 m. Direction X1
Fig. A-11 Reactor Building VVER-440/213 PAKS.Comparison of Response Spectra,Elevation 10.50 m. Direction X2
0 0-r20
-r4 0 80 100 12.0 HO 160
Frequency |HZ]
00 20 40 6 0 80 100 12 0 140 160 180 20 0
Frequency [HZ]
Fig. A-12 Reactor Building WER-440/213 PAKS,Comparison of Response Spectra,Elevation 10.50 m. Direction X3
Fig. A-13 Reactor Building WER-440/213 PAKS.Comparison of Response Spectra,Elevation 18.90 m, Direction X1
• SUBSTR MODEL
• COMPLEX MOOEL
I I
0 0 2 0 40 6 0 80 10.0 12 0 14 0 16 0 18 0 20 C
Frequency [HZ]
i• SUBSTB MODFL
• COMPLEX MODEL
0 0 20 40 6 0 80 10 0 12.0 14.0 16 0 18 0 20 0
Frequency (HZ]
Fig. A-14 Reactor Building WER-440/213 PAKS,Comparison of Response Spectra,Elevation 18.90 m. Direction X2
Fig. A-15 Reactor Building VVER-440/213 PAKS,Comparison of Response Spectra,Elevation 18.90 m, Direction X3
220
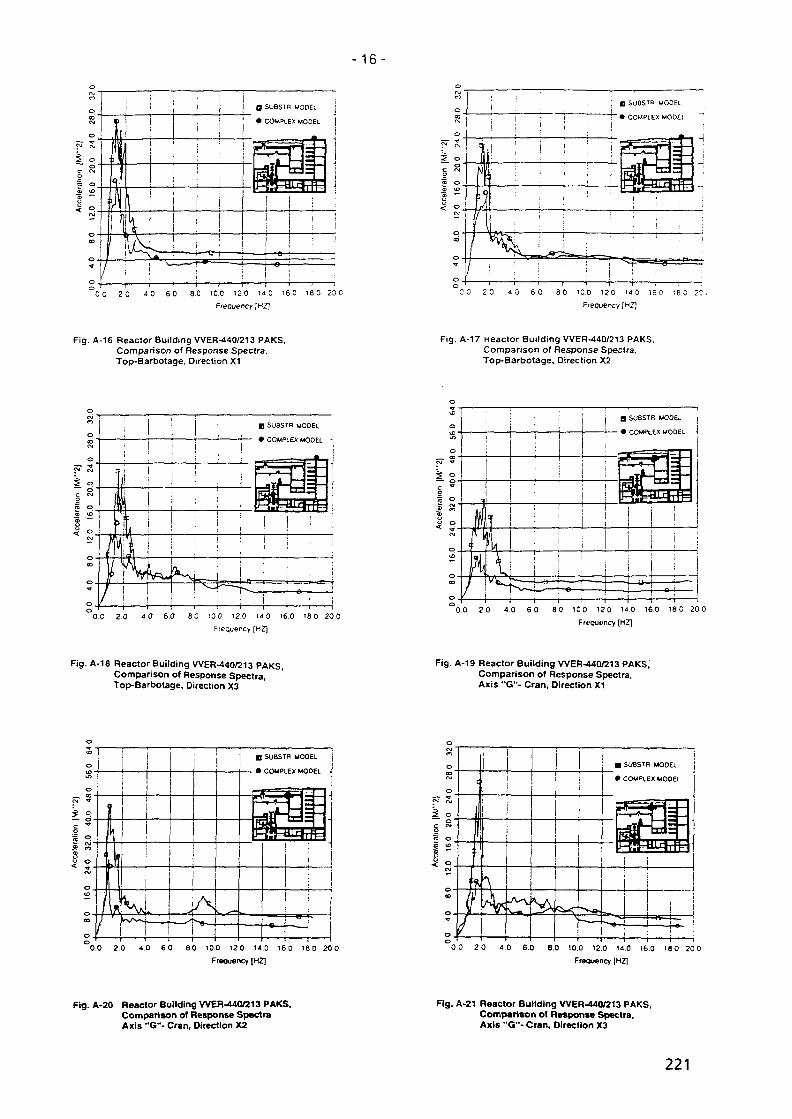
-16-
- i 1 r"OO 2 0 4 0 6 0 8 0 10.0 12,0 110 16.0 18 0 20 C
Frequency [HZ\
r>
O<oCM
o
o
o
M
x>
D -V
1/ /1
j-
I :i i
i 11
1
i
i
i*—^-im
• B SU6STR MOOEL1! • COMPLEX MODEL1
; 1: \\ 1
; t
1
34
; : • !'
I ]
J i 1 1 \ 1 1 1 1 1 100 2 0 40 6 0 80 100 120 14 0 160 180
Frequency (HZ]
Fig. A-16 Reactor Building VVER-440/213 PAKS.Comparison of Response Spectra.Top-Barbotage, Direction X1
Fig. A-17 Reactor Building VVER-440/213 PAKS.Comparison of Response Spectra.Top-Barbotage. Direction X2
J.O
56 0
6
i Pc *
rc °
o ofVJ
0 16
CO
o .
I
7
w\ii
I|
a suesr
• COMPl
R MOOEL
| — j — |
- |i-i
i
j j
0.0 2.0 4 0 6.0 SO 10 0 12.0 14 0 16.0 18 0 20 0
Frequency (HZ]
0.0 2.0 4.0 6 0 8 0 1 0 0 12.0 14.0 16.0 1 8 0 20 0
Frequency (HZ]
Fig. A-18 Reactor Building VVER-440/213 PAKS,Comparison of Response Spectra,Top-Barbotage, Direction X3
Fig. A-19 Reactor Building VVER-440/213 PAKS;Comparison of Response Spectra,Axis "G"- Cran, Direction X1
n
1• — —
A
B SUESTH MOOEL
• COMPLEX MOOEL -
i
— •
=
i
• * i
r
i
0.0 2.0 4.0 6 0 60 10.0 12 0 14.0 16.0 18.0 20 0
Frequency [HZ]
0 0 2 0 4 0 6.0 8.0 10.0 12.0 14.0 16.0 18 0 20 0
Frequency |HZ]
Fig. A-20 Reactor Building WER-440/213 PAKS.Comparison of Response SpectraAxis "G"- Cran, Direction X2
Fig. A-21 Reactor Building WER-440/213 PAKS,Comparison of Response Spectra,Axis "G"- Cran, Direction X3
221
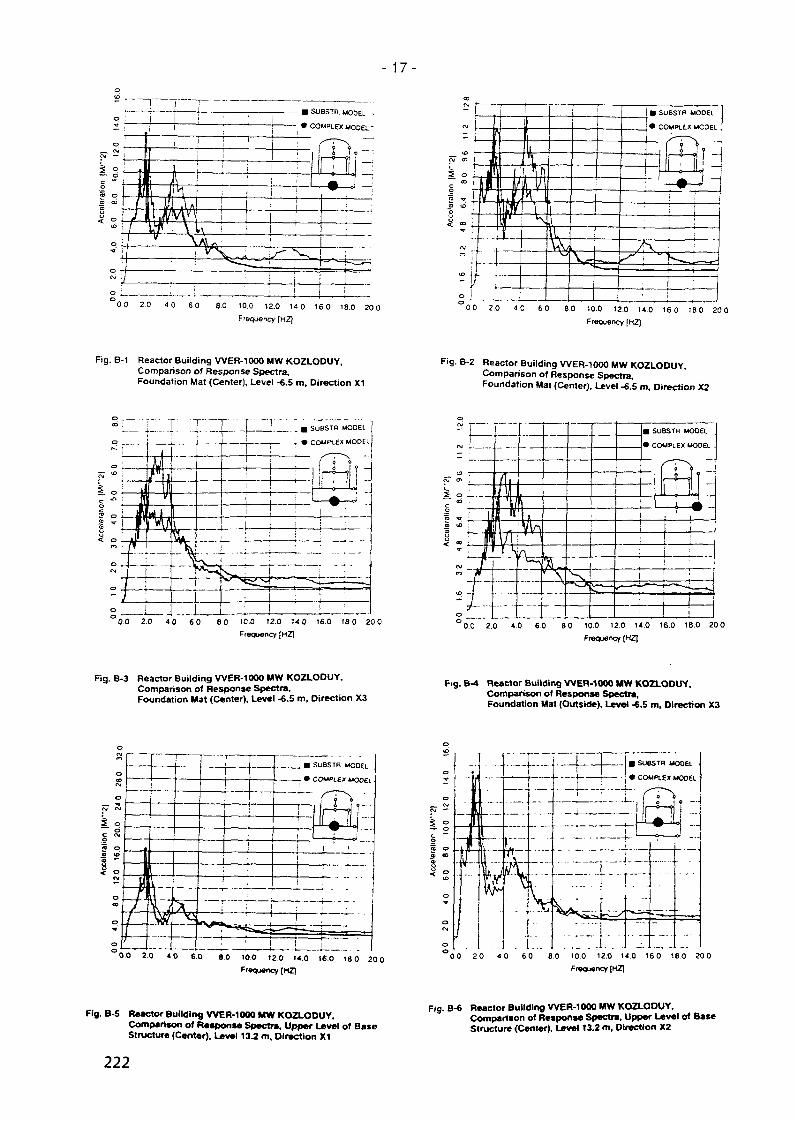
- 17-
0 0 2.0 4.0 6.0 8.0 10.0 12.0 14.0 16.0 18.0 20.0
Frequency (HZ)0 0 2.0 4.0 6 0 8 0 10.0 12.0 14.0 16 0 18 0 20 0
Frequency [HZ]
Fig. B-1 Reactor Building WER-1000 MW KOZLODUY,Comparison of Response Spectra,Foundation Mat (Center), Level -6.5 m. Direction X1
Fig. B-2 Reactor Building WER-1000 MW KOZLODUY.Comparison of Response Spectra,Foundation Mat (Center), Uvel -6.5 m. Direction X2
a SUBSTB MOOEL
MODEL
0 0 2.0 4 0 6.0 8 0 10.0 12.0 14.0 16.0 18.0 20 0
Frequency [HZ)
CM 1
11
• i l V1
• EV\[A^-..—
X' j
- —
• SUBSTR MOOEL
• C 01
(
1
JPLEX1^ODEL -
llj ' 1
i Ii J
10.0 2.0 4 0 6 0 8 0 10.0 12.0 14.0 16.0 18.0 20 0
Frequency (HZ]
Fig. B-3 Reactor Building WER-1000 MW KOZLODUY,Comparison of Response Spectra,Foundation Mat (Center), Level -6.5 m. Direction X3
Fig. B-4 Reactor Building WER-1000 MW KOZLODUY.Comparison of Response Spectra,Foundation Mat (Outside), Level -6.5 m, Direction X3
• SUBSTR MOOEL
• COUPLEX MOOEt
0 0 2.0 4.0 6.0 8.0 100 12.0 14.0 16.0 18 0 20 0
Frequency [HZ|
00 20 4 0 6 0 8 0 10 0 12.0 14.0 16 0 18 0 20 0
Frequency |HZ|
Fig. B-S Reactor Building WER-1000 MW KOZLODUY.Comparison of Response Spectra, Upper Level of BaseStructure (Center). Level 132 m. Direction X1
Fig. B-6 Reactor Building WER-1000 MW KOZLODUY,Comparison of Response Spectra. Upper Level of BaseStructure (Center), Level 13.2 m. Direction X2
222

- 18-
0 0 2 0 4 0 6 0 8.0 10.0 12.0 14.0 16.0 18.0 20.0
Frequency (HZ1
O SUBSTR. MODEL .
• COMPLEX MODEL
0.0 2.0 4.0 6.0 8.0 10.0 12.0 14.0 16.0 18.0 20.0
Frequency [HZ]
Fig. B-7 Reaclor Building WER-1000 MW KOZLODUY,Comparison of Response Spectra, Upper Level of BaseStructure (Center), Level 13.2 m, Direction X3
Fig. B-8 Reactor Building WER-1000 MW KOZLODUY,Comparison ot Response Spectra, Upper Level of BaseStructure (Outside), Level 13.2 m, Direction X3
• SUBSTR MODEL
• COMPLEX MODEL
0.0 2.0 4.0 6.0 8.0 10.0 12.0 14.0 16.0 18.0 20.0
Frequency {HZ]
0.0 2.0 4.0 6.0 60 10.0 12.0 14.0 160 18.0 20.0
Frequency [HZ]
Fig. B-9 Reactor Building WER-1000 MW KOZLODUY, Fig. B-10 Reactor Building WER-1000 MW KOZLODUY,Comparison of Response Spectra, Reactor Section (Center) Comparison of Response Spectra, Reactor Section (Center)Level 36.90 m, Oirection X1 Level 36.90 m, Direction X2
o —
a SUBSTR MOOEL
— " • COMPLEX MODEL '
0 0 2 0 40 6.0 80 10.0 12.0 14.0 16.0 18 0 20 0
Frequency |HZ]
0 SUBSTR MODEL
• COMPLEX MODEL •
0.0 2.0 4.0 6.0 8.0 10.0 12.0 H.O 16.0 180 20.0
Frequency |HZ]
Fig. B-11 Reactor Building WER-1000 MW KOZLODUY, Fig. B-12 Reactor Building WER-1000 MW KOZLODUY,Comparison of Response Spectra, Reactor Section (Center) Comparison of Response Spectra, Reactor Section (Outside)Level 36.90 m. Direction X3 Level 36.90 m, Direction X3
223

- 19-
0.0 2.0 4.0 6 0 8.0 10.0 12.0 14 0 16 0 18 0 20 0
Frequency (HZ]
0.0 2.0 4.0 6.0 8.0 10.0 12.0 14.0 16.0 18.0 20.0
Frequency (HZ]
Fig. B-13 Reactor Building VVER-1000 MW KOZLODUY,Comparison of Response Spectra, Containment (Outside),Level 46.80 m, Direction X1
Fig. B-14 Reactor Building VVER-1000 MW KOZLODUY,Comparison of Response Spectra, Containment (Outside),Level 46.80 m. Direction X2
._ O SUBSTR MOOEl
— • COMPLEX MODEL
30.0 2.0 4.0 6.0 8.0 10.0 12.0 14.0 160 18.0 20 0
Frequency [HZ]0.0 2.0 4.0 6.0 8.0 10.0 12.0 14.0 16.0 18.0 20 0
Frequency [HZ]
Fig. B-15 Reactor Building VVER-1000 MW KOZLODUY,Comparison of Response Spectra, Containment (Outside),Level 46.80 m. Direction X3
Fig. B-16 Reactor Building WER-1000 MW KOZLODUY,Comparison of Response Spectra, Outer Building,Level 41.40 m, Direction X1
Q SUBSTR MODEL
• COMPLEX MODEL
0 0 2.0 4 0 6 0 8 0 100 12.0 14 0 16 0 18 0 20 0
Q SUBSTR. MOOEL .
• COMPLEX MOOEl
u> ;
° : iii !
W
(T)9v -
1 1
Ffsqueney [HZ]
0.0 2.0 4.0 6.0 8.0 10.0 12.0 14.0 16.0 18.0 20 0
Frequency )HZ]
Fig. B-17 Reactor Building WER-1000 MW KOZLODUY,Comparison of Response Spectra, Outer Building.Levei 41.40 m. Direction X2
Fig. B-18 Reactor Building WER-1000 MW KOZLODUY,Comparison of Response Spectra, Outer Building,Level 41.40 m. Direction X3
224

( ] ) XA9952657
PROCEEDINGS OF SMiRT 13 - POST CONFERENCE SEMINAR 16 SEISMIC EVALUATIONOF EXISTING NUCLEAR FACILITIES
DYNAMIC ANALYSIS OF WWER-1000 NUCLEAR POWER PLANTS
Alejandro P. Asfura, Ph.D.EQE InternationalSan Francisco, California, USA
Marin J. JordanovEQE InternationalSofia, Bulgaria
J. INTRODUCTION
As part of the effort to assess the seismic vulnerability of nuclear power plants in Eastern Europe, a seriesof dynamic analyses have been carried out for several plants [1. 2, 3]. These analyses were performed usingmodern analysis techniques, current local seismic parameters, and local soil profiles.
This paper presents a compilation of some of the seismic analyses performed for the WWER-1000 reactorbuildings at the nuclear power plants of Belene and Kozloduy in Bulgaria, and Temelin in the Czech Republic.The reactor buildings at these three plants are practically identical and correspond to the standard buildingdesign for this type of reactors.
The series of analyses performed for these buildings encompasses various soil profiles, seismic groundmotions, and different soil-structure interaction (SSI) analysis techniques and modeling. The analysis of acommon structure under different conditions gives the opportunity to assess the relative importance that eachof the analysis elements has in the structural responses. The use of different SSI computer programs andfoundation modeling was studied for Kozloduy, and the effects of different soil conditions and site-specificseismicity were studied by comparing the responses for the three plants.
In-structure acceleration response spectra were selected as the structural responses for comparisonpurposes.
2. DESCRIPTION OF REACTOR BUILDING
The reactor building for a typical 1000 MW WWER nuclear power plant consists of four distinctivestructures, as shown in Figure 1. The base substructure starts from the foundation basemat and rises up to asecond concrete basemat, which supports the reactor containment, Hie reactor internal structure, and aperipheral auxiliary building called the "outer building."
The substructure is a three-story building, which houses the main control room and the auxiliary systems,and equipment including several large tanks. The building has a square shape of about 70 m by 70 m withorthogonally distributed walls. Most of the interior walls and slabs in the substructure are made of precastconcrete panels serving as formwork for cast-in-place concrete.
The containment is a post-stressed concrete shell with an 8-mm-thick steel liner. The posttensioncd cablesarc anchored in a stiff ring girder at the junction of the cylinder and the spherical dome. The containmentthickness is 1.2 m for the cylinder and 1.1m for the dome.
The internal structure is a massive concrete structure supporting the reactor vessel, four horizontal steamgenerators, (he reactor coolant pumps, a prcssurizcr, accumulator tanks, and other auxiliary equipment. Thecore of the structure consists of a thick cylindrical shield wall around the vessel and two groups of pools andcavities containing the spent fuel.y.'iOO-200/A)>A\iiiin.l)ot/Nov-95
225
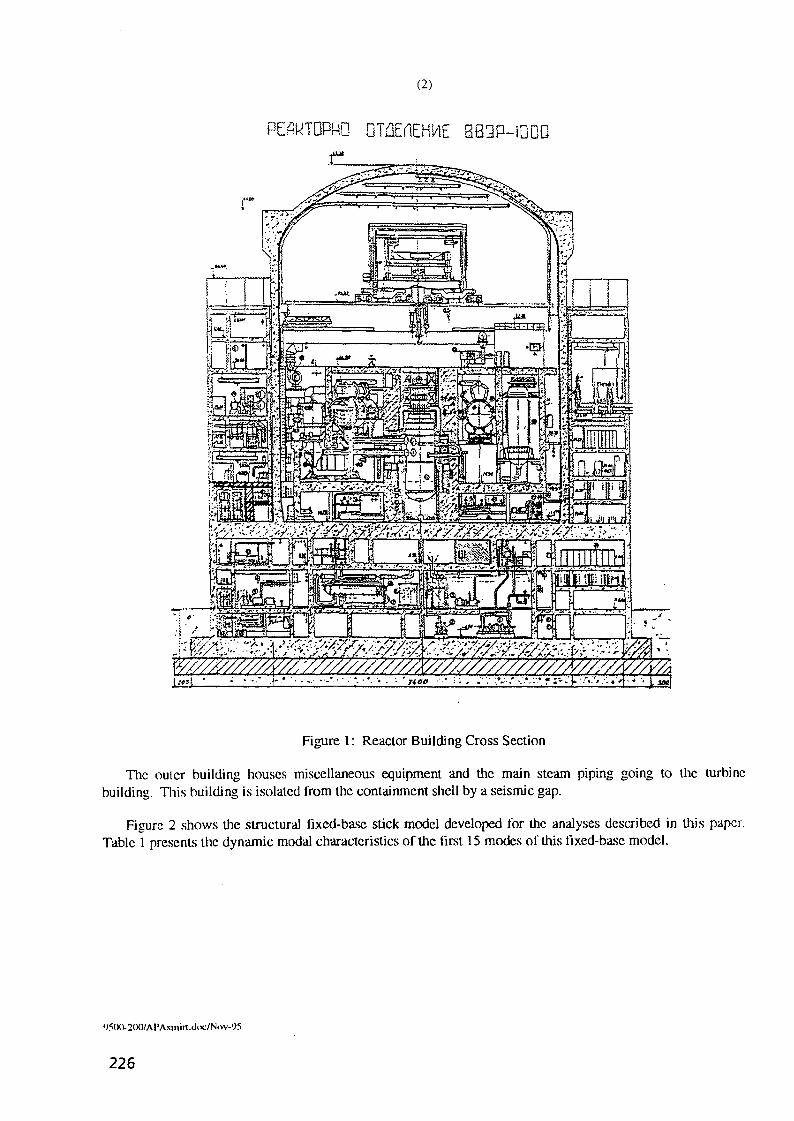
(2)
PMTOPMQ OTiOErlEHUE 3B3P-iDDD
"I * ' i-'SSrS
W///7///77///77/7//Ay////77/M
Figure 1: Reactor Building Cross Section
Tlic outer building houses miscellaneous equipment and the main steam piping going to the turbinebuilding. This building is isolated from the containment shell by a seismic gap.
Figure 2 shows the structural fixed-base stick model developed for the analyses described in this paper.Table 1 presents the dynamic modal characteristics of the first 15 modes of this fixed-base model.
«;5(H)-2C)0/Al1AM«in.dix./Nov-95
226

(3)
L CONTAINMENT MODEL
61.06 m
L INTERNAL STRUCTUj MODEL
r
i36.90 m
29.00 m
• I 25.70 m
19.34 m
16.40 m
13.20 m
47.09 mt OUTER BUILDING
MODEL
J>
ki
45.6 m
41.4 m
33.6 m
28.8 m
24.6 m
20.4 m
A' „ ' " 16.8 m• I „''
13.2,m J»*'. PA [P
12.0 m
* Mass Point
I Beam Element
I Rigid Unkz ;
r'T
6.3 m
-0.3 m
- * - X -7.0 m
t! SUBSTRUCTURE MODEL
Figure 2: Reactor Building Element Model
W(W-2(«VA!1A.vniirt.d<>t7Nov-y.'i
227
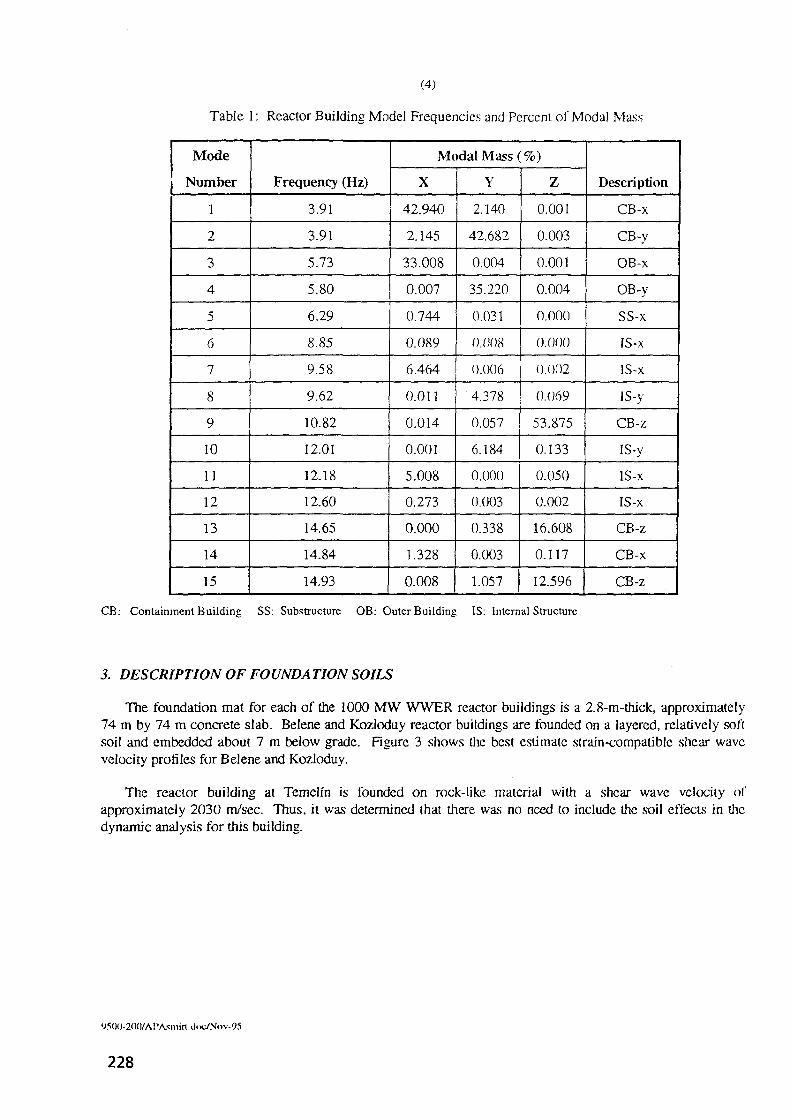
(4)
Table 1: Reactor Building Model Frequencies and Percent ol" Modal Mass
Mode
Number
1
2
3
4
5
6
7
8
9
10
11
12
13
14
15
Frequency (Hz)
3.91
3.91
5.73
5.80
6.29
8.85
9.58
9.62
10.82
12.01
12.18
12.60
14.65
14.84
14.93
Modal Mass (%)
X
42.940
2.145
33.008
0.007
0.744
0.089
6.464
0.011
0.014
0.001
5.008
0.273
0.000
1.328
0.008
Y
2.140
42.682
0.004
35.220
0.031
0.008
0.006
4.378
0.057
6.184
0.000
0.003
0.338
0.003
1.057
Z
0.001
0.003
0.001
0.004
0.000
0.000
0.002
0.069
53.875
0.133
0.050
0.002
16.608
0.117
12.596
Description
CB-x
CB-y
OB-x
OB-y
SS-x
IS-x
IS-x
IS-y
CB-z
IS-y
IS-x
IS-x
CB-z
CB-x
CB-z
CB: Containment Building SS: Substructure OB: Outer Building IS: Internal Structure
3. DESCRIPTION OF FOUNDATION SOILS
The foundation mat for each of the 1000 MW WWER reactor buildings is a 2.8-m-thick, approximately74 m by 74 m concrete slab. Belene and Kozloduy reactor buildings are founded on a layered, relatively softsoil and embedded about 7 m below grade. Figure 3 shows the best estimate strain-compatible shear wavevelocity profiles for Belene and Kozloduy.
The reactor building at Temelih is founded on rock-like material with a shear wave velocity ofapproximately 2030 m/sec. Thus, it was determined that there was no need to include the soil effects in thedynamic analysis for this building.
'.)MK).200/AlV\smirul<>e/N<>v-95
228

(5)
-Belene Profile
: — Koztoduy Profile
-so -
I
200 300 400
Shear Wave Velocity (Vs) (m/sec)
Figure 3: Best Estimate Strain-compatible Shear Wave Velocity Profile
4. DESCRIPTION OF INPUT MOTION
For the three plants, the seismic motions used were consistent with the seismic hazard for the site. Figures4 and 5 show the horizontal and vertical acceleration response spectra at 5% damping for the three plants. ForBelene and Kozioduy, the hazard was dominated by the Vrancea source [1,2], and the motioas were anchoredto an equivalent peak ground acceleration of 0.2g. Both seismic motioas correspond approximately to areturn period of 10^ years. For Belene and Kozioduy, the specified vertical spectra were defined as half of thehorizontal spectra.
The seismicity at the Temeh'n site was dominated by the local conditions [4]. The intensity and epiccntraldistances selected for the site resulted in a design peak ground acceleration of less than O.lg. However, for theTemelfn study presented in this paper, the spectra of an actual earthquake considered to be representative forthe site [4] anchored to a horizontal maximum peak ground acceleration of O.lg were used to develop a singleartificial earthquake for the analysis. The selected earthquake has its main frequency content coinciding withthe main frequencies of the fixed-base reactor building.
VS(X)-200/AI'A.'smirt.ilix.7Nt>v-<)S
229

(6)
— 0.4C.2
Io C.3
-Belene Spectrum
Kododuy Spectrum
Temefin Spectrum
Frequency(Hi)
Figure 4: Comparison of Horizontal Input Response Spectra, 5% Damping
ass-
IsI
Selene Spectrum
Koztoduy Spectrum
Temelm Spectrum
Figure 5: Comparison oi" Vertical Input Response Spectra, 5% Damping
M500-200/Al'A.smirt.ilix;/Nov-9.'i
230

(7)
5. ANALYSIS
SSI analyses were performed for Belene and Kozloduy to capture the effects of the foundation soil in thestructural responses. For Kozloduy, a series of sensitivity studies were performed to assess (he impact thaiSSI modeling parameters and calculation techniques have in the structural response of these plants.
Since this plant is founded on rock, a fixed-base time-history analysis was performed for Temelfn.
5.7 Impedance and Scattering Functions Calculation
To assess the effect that different SSI methods have in the calculation of the impedance and scatteringfunctions, three different codes were used for Kozloduy. The three codes were SASSI (developed by ProfessorLysmer at U.C. Berkeley), CLASSI (developed by Professors Wong and Luco at the University o\~ SouthernCalifornia), and SUPELM (developed by Professor Kausel at MIT). The versions of SASSI and SUPELMused allow for the consideration of the embedment effects. The version ol" CLASSI used considers onlysurface-founded conditions.
For the calculation of scattering functions, vertically propagating seismic waves were assumed.
Figures 6 to 8 show the horizontal, vertical, and rocking impedance functions, respectively. Figure 9shows the horizontal term of the scattering function. For the SASSI and SUPELM cases, it was consideredthat the foundation was embedded and perfectly bonded to the soil. For the CLASSI case, the foundation wasassumed at a free surface at the bottom of the foundation level.
SASSISUPELMCLASS]
Figure 6: CLASSI/SASSI/SUPELM Comparison Horizontal Impedance
9500.20CyAPAsmirt.iloc/Nov-95
231

(8)
.0 S.fl 10.0 1S.0 20.0
x io7 Imaginary.4
-.2
- . 4.0 5.0 10.0 15.0 20.0
SASSISUPELMCLASSI
Figure 7: CLASSUSASSySUPELM Comparison Vertical Impedance
.0 5.0 10-0 1S.0 20.0
x io" Imaginary
- . 1
- . 2
- . 3.0 S.O 10.0 15.0 20.0
Fr*qu«ncy
LtssniSA.SS1SUPHLMCI-ASSI
Figure K: CLASS I/S ASS 1/SUPELM Comparison Rocking Impedance
V5(K)-2OO/A]>Asii)in.d<)c/Niw-<J.'i
232
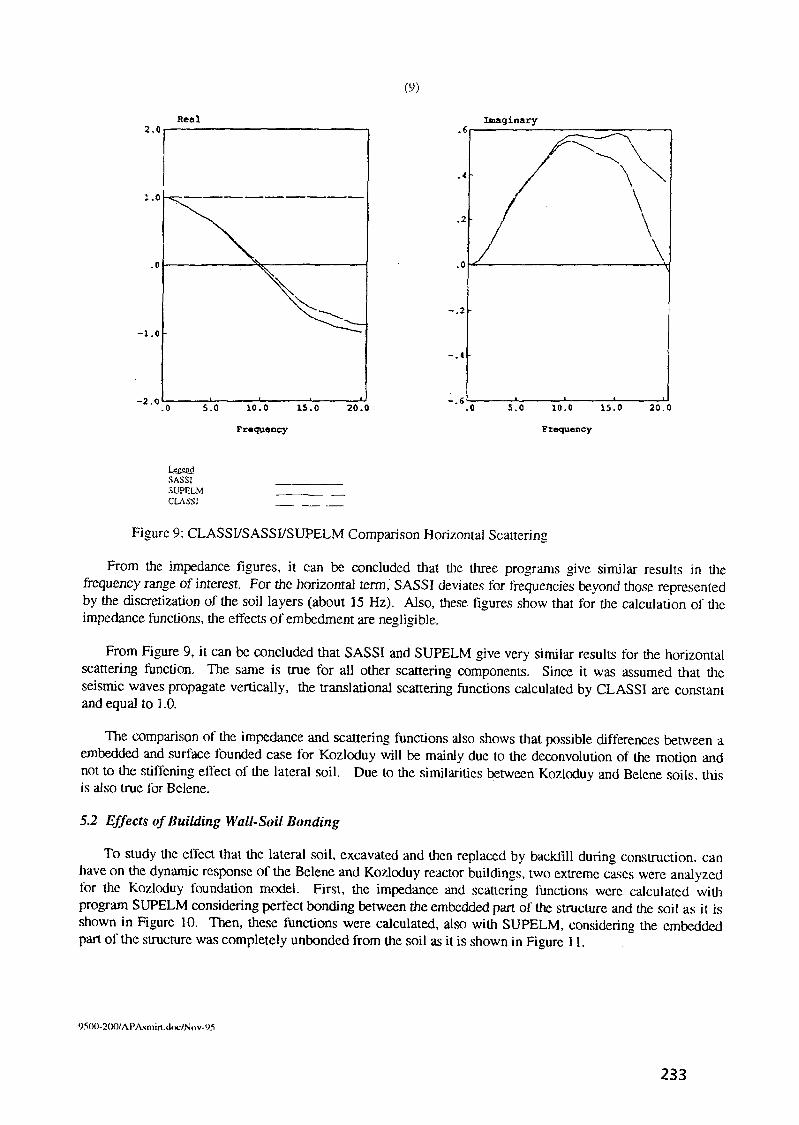
(9)
2.0
1 .0
Real Imaginary
- 1 . 0 •
-2.C .0 5.0 10.0 15.0 20.0
Fr«qu«ncy
- . 65.0 10.0 15.0 20.0.0
SASSISUPELMCLASS;
Figure 9: CLASSI/SASSI/SUPELM Comparison Horizontal Scattering
From the impedance figures, it can be concluded that the three programs give similar results in thefrequency range of interest. For the horizontal term, SASSI deviates for frequencies beyond those representedby the discretization of the soil layers (about 15 Hz). Also, these figures show that for the calculation of theimpedance functions, the effects of embedment are negligible.
From Figure 9, it can be concluded that SASSI and SUPELM give very similar results for the horizontalscattering function. The same is true for all other scattering components. Since it was assumed that theseismic waves propagate vertically, the translational scattering functions calculated by CLASSI are constantand equal to 1.0.
The comparison of the impedance and scattering functions also shows that possible differences between aembedded and surface founded case for Kozloduy will be mainly due to the deconvolution of the motion andnot to the stiffening effect of the lateral soil. Due to the similarities between Kozloduy and Belene soils, thisis also true for Belene.
5.2 Effects of Building Wall-Soil Banding
To study the effect that the lateral soil, excavated and then replaced by backfill during coastruction. canhave on the dynamic response of the Belene and Kozloduy reactor buildings, two extreme cases were analyzedfor the Kozloduy foundation model. First, the impedance and scattering functions were calculated withprogram SUPELM considering perfect bonding between the embedded part of the structure and the soil as it isshown in Figure 10. Then, these functions were calculated, also with SUPELM, considering the embeddedpart of the structure was completely unbonded from the soil as it is shown in Figure 11.
<}MH>-2<X)/APAsmirul<K./Nov-y5
233

(10)
2R-2.1M.87 tt
'//{///////////{///////^^^; '.,-.•:BACKFILL'.
SANDY
Figure 10: SUPELM Analysis Foundation Model (Bonded Wall)
2R-a»136.»7 ft
./ .. /.
• v - ' - - ? : / . : - ^ : - ; . r - J • : ^ - ' / - ; • • • ; ' ~ > ^ ' • • * . '
Figurc 11: SUPELM Analysis Foundation Model (Unbonded Wall)
Figures 12 to 14 show the horizontal, vertical, and rocking impedance functions, respectively, lor llicbonded and unbonded cases. Figure 15 shows the horizontal term ol" the scattering function for these twocases. Some differences exist, but mainly beyond the frequency range of the soil-structure responses. Thesedifferences will have only a minor impact in the final dynamic response of (he reactor building. Thus, for anypractical effect, the SSI analyses for Ko/.loduy and Bclcnc can be done considering perfect bonding.
2<HVA!'Asiiiin.ilik7Niiv-<J5
234
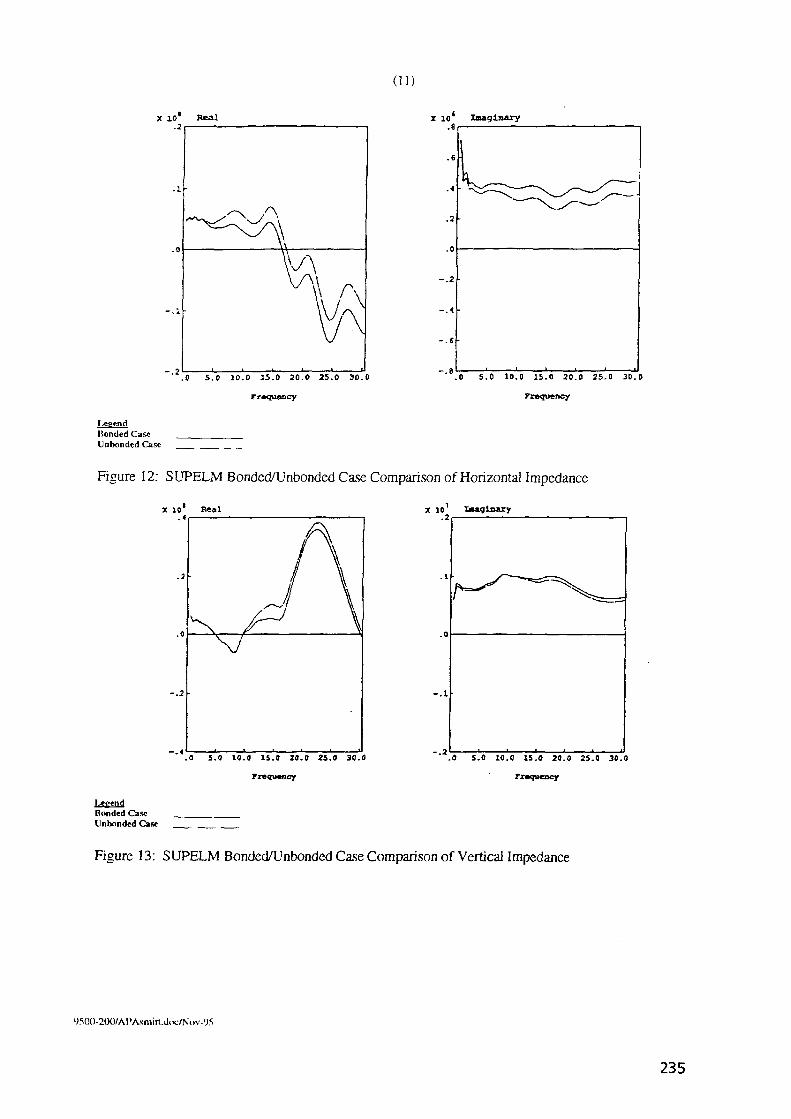
(11)
X 10' Imaginary
.0 5.0 10.0 15.0 20.0 2S.0 30.0
frequency
' .0 S.O 10.0 15.0 20.0 25.0 30.0
Frequency
Bonded CaseUnbonded Case
Figure 12: SUPELM Bonded/Unbonded Case Comparison of Horizontal Impedance
x 10' Real
.0
V
i
JA/ \
\
.0 S.O 10.0 15.0 29.0 2S.0 30.0
- . 1
- . 2.0 5.0 10.fl 15.0 20.0 25.0 30.0
Ronded CawUnbonded Case
Figure 13: SUPELM Bonded/Unbonded Case Comparison of Vertical Impedance
'JSOO-SOO/Al'Axmirt.doc/Nov-VS
235
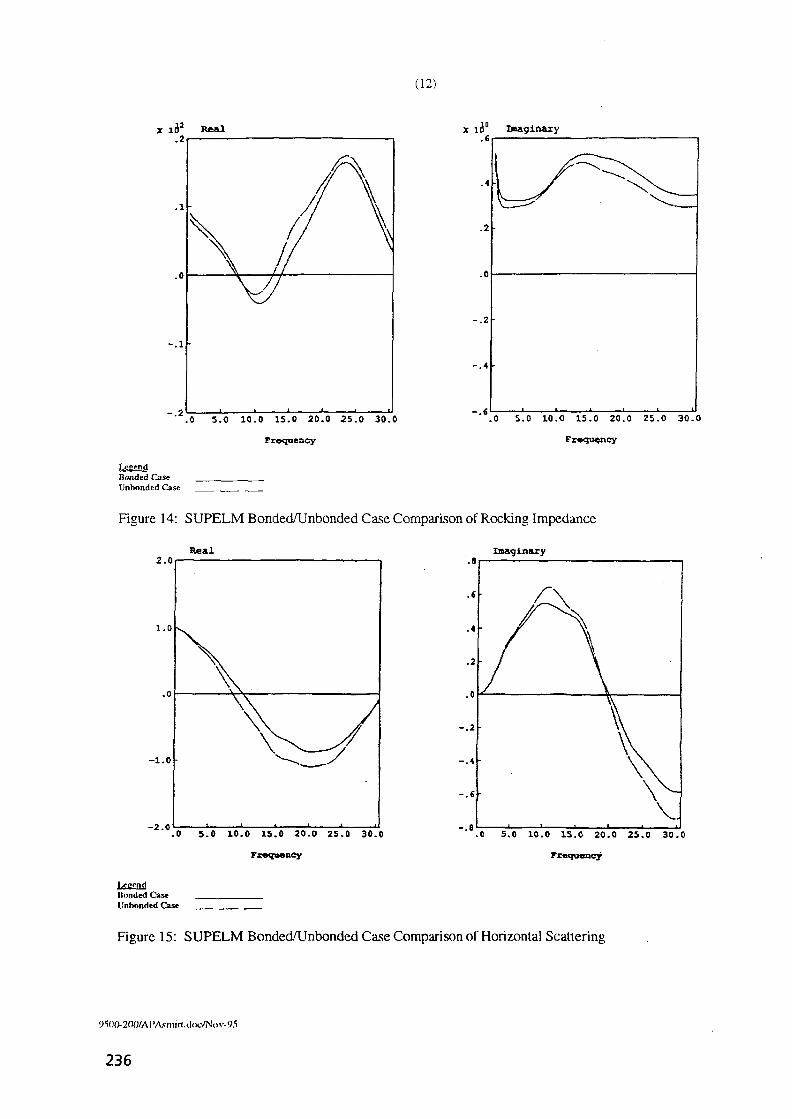
(12)
x IC" Imaginary.£
- . 2
- . 4
' .0 5.0 10.0 15.0 20.0 25.0 30.0
Frequency
.0 5.0 10.0 15.0 20.0 25.0 30.0
Frequency
LegendBonded CaseUnbonded Case
Figure 14: SUPELM Bonded/Unbonded Case Comparison of Rocking Impedance
2.0
1.0
Real Imaginary
-1 .0
-2.0.0 6.0 10.0 15.0 20.0 25.0 30.0
- . 2 •
- . 4
- . 6
.0 5.0 10.0 15.0 20.0 25.0 30.0
Froquoncy
l,egendBonded CastUnbonded Case
Figure 15: SUPELM Bonded/Unbonded Case Comparison of Horizontal Scattering
236

( 1 3 )
5.3 Effects of Embedment
The acceleration in-slruclure response spectra for Kozloduy were calculated for the embedded, perfectly-bonded case (SUPELM) and for the surface-founded case (CLASSI) to quantify the differences in the dynamicresponses in the reactor buiiding. Figures 16 to 19 show acceleration in-structure response spectra at 5c/<-damping for selected locations at the containment, internal, outer, and substructure portions of the reactorbuilding, respectively. These figures show that the differences between the embedded and the surface-foundedcases are in general of the order of 10% to 15% at some particular frequency ranges. The results for thesurface-founded case are, as expected, higher than the results for the embedded case.
North-South Direction (X)
1 . 2
£ 1-0 ifr
I\:
~—i
1 .2
1 .0
10" 10'
Fr«quancy <Hz)
10
$
4
3
2
1
n
Vortical
J
/'
J
Direction
t-,
1Z)
A
ly
n
10* 10
Frsqoaacy (Rxl
East-West Direction Ci)
.2
,
1)
J
If\iI
10" 10
(8t)
EmbeddedSurface Founded
Notes:RLE LevelEmbedded Bonded Wall5% Spectral DampingAcceleration in g's
Figure 16: Comparison of Surface Founded to Embedded Structural Model, Top of the ContainmentRcspoasc
237
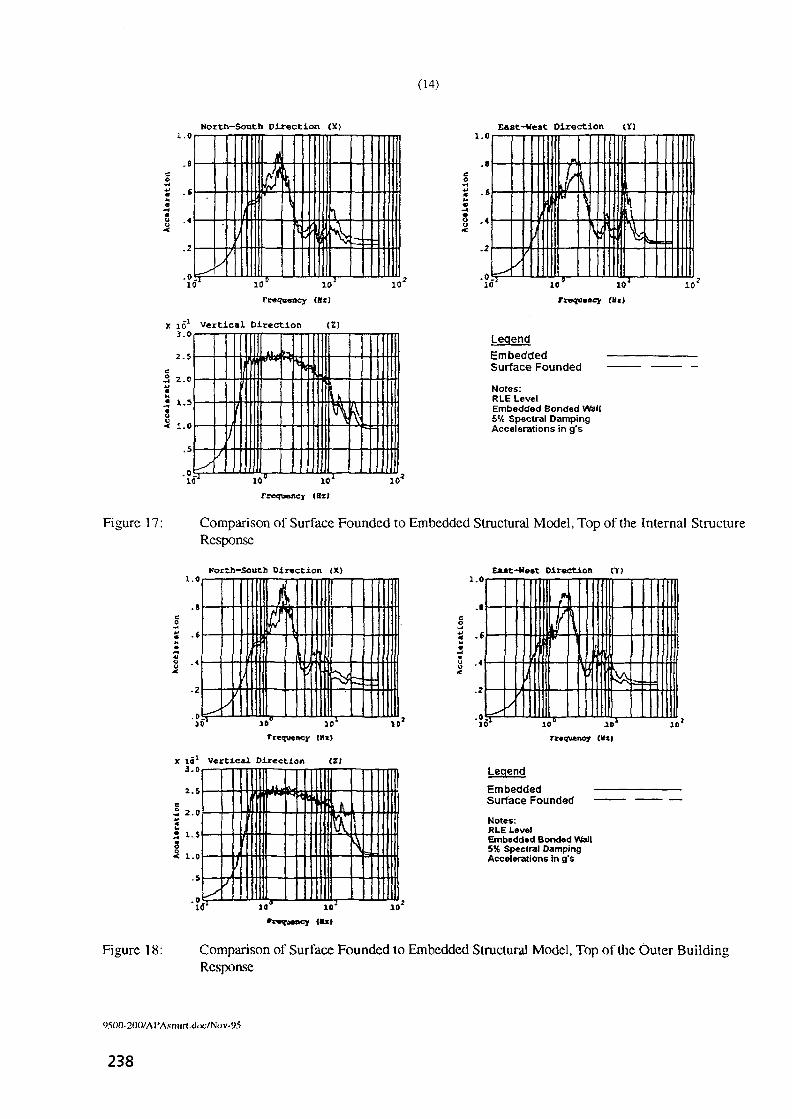
(14)
i .ONorth-South Direction <X) East-West Direction (I)
•?s
II
\\ 1
1.0
.8
10" •}?
X
101 Vertical Direction3.0
rrequency {Hz)
(Z)
10" 10*
Frequency (Hz)
10 '
Legend
EmbeddedSurface Founded
Notes:RLE LevelEmbedded Bonded Wall5% Spectral DampingAccelerations in g's
10'
Frequency (Bx)
10
Figure 17: Comparison of Surface Founded to Embedded Structural Model, Top of the Internal StructureResponse
forth-South Oir«ction <X) E»*t-H«»t Direction (Y)
.2
1
f
kj
1
L16 1C
rre<jvi«ncy (Hi)
10*
10* Vertical Direction <Z>Legend
EmbeddedSurface Founded
Notes:RLE LevelEmbedded Bonded WallSK Spectral DampingAccelerations In g's
10*
Figure 18: Comparison of Surface Founded to Embedded Structural Model, Top of the Outer BuildingRcspoase
<;5(X)-2(KVAI>A.vinirt.<l<>c/N<)V-y5
238

(15)
North-South Direction (X) East-West Direct ion
.6
. 2
1..•ft\mm
f l
10 10
(Hi)
10
X 10 Vertical Direction3.0
2.5
I 2.0
< 1.0
<Z>
•
1I
1/
•4
10" 10'rr«qu«ncy (S31
10
.«
.2
j
)
I
\
10" 10'Frequency (Hz)
EmbeddedSurface Founded
Notes:RLE LevelEmbedded Bonded Wall5% Spectral DampingAccelerations in g's
Figure 19: Comparison of Surface Founded to Embedded Structural Model, Top of the SubstructureResponse
5.4 Effects of Site-specific Conditions
To quantify the effects thai site-specific conditions, soil, and scismicily have in the dynamic response ofthese three "standard" reactor buildings, the results of the dynamic analyses for them were compared. ForBelcnc and Kozloduy, the SSI analyses had been performed assuming embedment and perfect wall-soilbonding. For Temelfn. a lixed-base analysis was performed.
Acceleration in-structure response spectra at 2% damping are compared in Figures 20 to 23 for thecontainment, internal, outer, and substructure portions of the reactor building, respectively.
The in-structurc response spectra compared in Figures 20 to 23 correspond to the envelopes of the twohorizontal directions at the selected locations. The spectra for Temelin were broadened by \5% to coverstructural and analysis uncertainties. Belene's spectra were broadened 25% to also cover soil uncertainties.Kozloduy spectra were broadened by 15% to cover only structural and analysis uncertainties, but three soilcases were considered to cover the soil uncertainties. This difference in the treatment of uncertainties docs notprevent a meaningful general comparison between the three sets of results.
The comparison in Figures 20 to 23 shows that the acceleration in-structurc response spectra lor Bclcncand Kozloduy arc similar. This similarity results from their seismic input in the frequency range of interestbeing comparable, as well as (on average) from the foundation conditions.
The in-structurc response spectra for Tcmeh'n arc very different from those for Bclcnc and Kozloduy. Asexpected, the Uirec plants' spectral peaks occur at different frequencies, and even though the seismic hazard alTcmclfn is lower than the seismic hazard al Bclcnc or Kozloduy, the in-struclurc response spectra at that plantarc much higher than those at Bclcne or Kozloduy. This difference is mainly due to the dissipation of energy
239

(16)
through the soil (radiation damping) for (lie Belene and Kozloduy reactor buildings, which reduces theirstructural responses, making them much lower than the Temelin responses.
This large difference in the in-structure response spectra results in a large difference between the seismicdemands for the equipment at the Temelin and the Bulgarian 1000-WWER reactor buildings.
6
51
gC£ 3-oa
2
1
0.1
/
^
"s\
V \\10
Kaztoduy Spectrum
Temehn Spectrvm
Fn»q«ncy(Hx)
Figure 20: Comparison of Horizontal Floor Spectra; Containment, Elevation 46.8 m
- Belene Spectrum
Koztoduy Spectrum
•Temelrt Spectrum
Figure 21: Comparison of Horizontal Floor Spectra; Internal, Elevation 25.7
95OO-2OO/APAsmtn.dix;/N<iv-9.'i
240
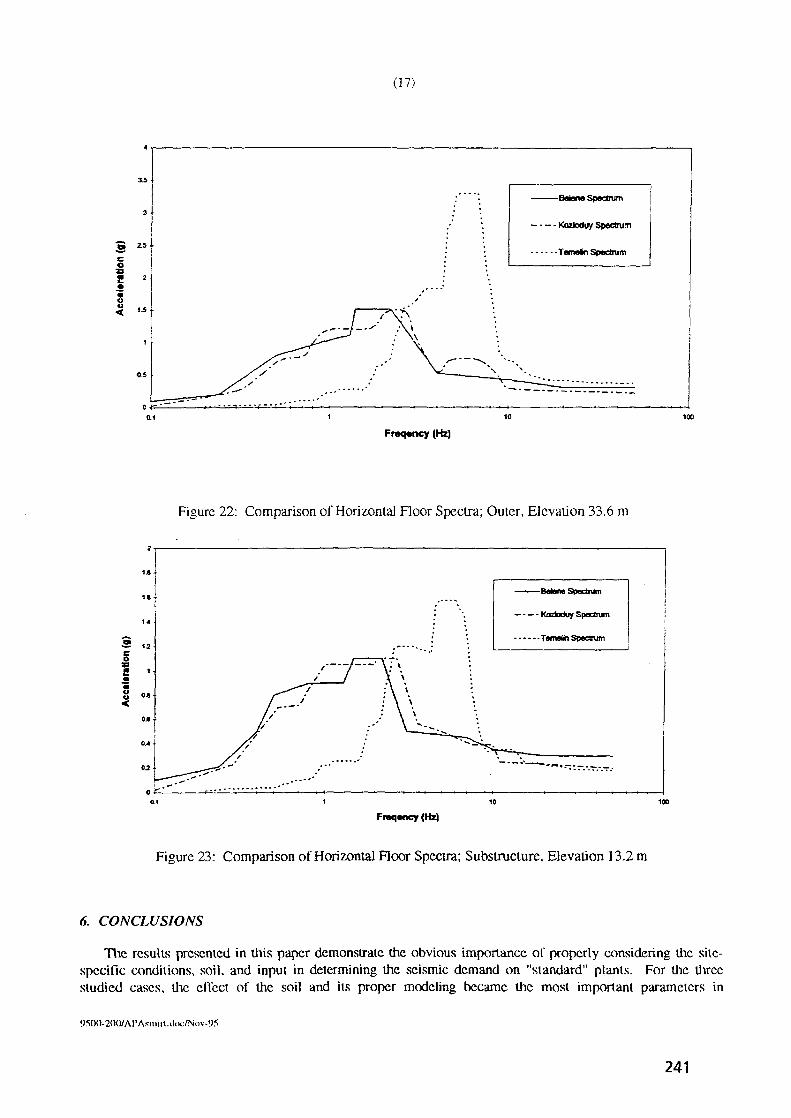
(17)
co
S 2
Betane Spectrum
Kozloduy Spectrum
Tom»in Spectrum
Fmq«ncy (Hz)
Figure 22: Comparison of Horizontal Floor Spectra; Outer, Elevation 33.6 m
Fraqancy (Hz)
Figure 23: Comparison of Horizontal Floor Spectra; Substructure, Elevation 13.2 m
6. CONCLUSIONS
The resulls presented in this paper demonstrate the obvious importance of properly considering the sitc-spccific conditions, soil, and input in determining the seismic demand on "standard" plants. For the threestudied cases, the clTect of the soil and its proper modeling became the most important parameters in
ySOO-200/AI>Asmiit.d<K;/Nov-<;5
241

(18)
determining the structural seismic demands, overcoming the higher seismic hazard at the Belene and Kozloduyplants.
7. REFERENCES
1. EQE Engineering/Westinghouse/Geomatrix. March 1990. "Seismic Review of the BeleneConstruction Project (Units 1 & 2)."
2. EQE International. October 1994. "Structural Response of Kozloduy 1000 MW WWER."
3. Asfura, A. P., J. J. Johnson, and M. J. Jordanov. August 1995. "Dynamic Analysis of Three 1000MW WWER Reactors in Eastern Europe." 13th SMIRT Conference. Porto Alegre, Brazil.
4. David Consulting. Engineering and Design. "Seismic Hazard Analysis. Ground Response Spectra.NPPTemelfn, Probabilistic Safety Assessment for Seismic Events."
242

XA9952658PROCEEDINGS OF SMiRT 13 - POST CONFERENCE SEMINAR 16SEISMIC EVALUATION OF EXISTING NUCLEAR FACILITIES
IN-STRUCTURE SPECTRA GENERATION FOR KOZLODUY NPP, BULGARIA
Marin KostovCentral Laboratory for Seismic Mechanics and Earthquake Engineering,Bulgarian Academy of Sciences, Sofia
ABSTRACT. This paper is presenting most of the results achieve in the last 4 years during thein-structure response spectra generation of NPP Kozloduy, Bulgaria. A variety of models andtechniques have been used for investigation of the soil-structure interaction problems. Theexperience collected and the problems met are discussed hereafter.
1. Introduction
In 1993 a new review level earthquake (RLE) for the site of Kozloduy NPP wasdetermined. The maximum acceleration at the site has been changed to 0.2g , respectively anew free field response spectrum has been developed. For the qualification of equipment andsystems the in-structure response spectra have been generated for all six units and for thespent fuel storage building. The methods and the techniques used have been a matter ofdevelopment and improvements trough the last three years. In the present paper some of theexperience collected in this work is presented.
2. Free Field Seismic Characteristics and Local Geology
The horizontal free field spectrum is presented in fig.l. The respective vertical excitation isassumed to be 1/2 of the horizontal one. In the site conformation report it has beenrecommended also the separate consideration of local seismic excitation (magnitude 4.5 atdistance 7km)
The generalized local geology characteristics are presented in table 1. The site of KozloduyNPP is characterised by medium to weak soils, mainly loess, sand and gravel.
3. In-structure Spectra for the WER 440-230 structures.
The units 1 to 4 of Kozloduy NPP are of type VVER 440-230. Those units are constructedas two couples of tween units with a common turbine hall going trough all four units. Eachunit consists of the following parts: the reactor building, the intermediate building and theauxiliary building. The lower part of the reactor building (the compartment) is a rigidstructure characterized by massive concrete walls up to an elevation of 10.4m. From that levelup to the roof there is a frame structure. The turbine hall is formed by flexible frames both inlongitudinal and transversal direction. The connection between the two buildings is anintermediate building. The main part of the critical equipment for which the floor spectrashould be computed is located in the reactor building and the intermediate building.
The in-structure spectra for the first two units are computed by plane models both intransversal and longitudinal directions (fig.2).
243

Table 1, Soil Characteristics, Kozloduy NPP site
LAYERTHICK-NESS
m
3.04.06.5
5.0
3.0
9.5
11.042.6
19.4
29.018.024.029.020.021.020.0
FROM-..TO. . .
m
0.0- 3.03.0- 7.07.0- 13.5
13.5- 18.5
18.5- 21.5
21.5- 31.0
31.0- 42.042.0- 84.6
84.6-104.0
104.0-133.0133.0-151.0151.0-175.0175.0-204.0204.0-224.0224.0-245.0245.0-265.0265.0-
DENSITY
t/m3
1.601.601.80
2.00
2.00
2.12
2.101.92
1.98
2.011.982.001.961.982.001.962.00
POISSON'SRATIO
0.420.440.41
0.45
0.45
0.45
0.470.45
0.44
0.460.440.440.430.370.400.400.40
S-WAVEVELOCITY
Vs
m/s
170175450
500
500
500
430520
550
450540580530630680705>705
P-WAVEVELOCITY
Vp
m/s
4705401180
1600
1600
1600
17001700
1700
1600160017501470147017001760
>1760
TYPEOF
SOIL
LoessSandy loessClayeyloessGravellysandCompactclaySand-fineclayeySandy claySand-fineclayeySand-fineclayeySandy clayMarly clayMarly clayMarly clayMarly clayClayey marlClayey marlClayey marl
Computer code FLUSH and PLUSH are used for that purpose. Correction is made foraccounting the torsional response [1].
The in-structure spectra for unit 3 and 4 are developed on the base of complete 3D FEmodel (fig.3). Soil-structure interaction is modelled by spring and dashpots. The dynamicanalysis is performed by computer code STARDYNE. A comparison between results fromunit 1/2 and 3/4 is presented in table 2 [2].
Discussion:
The FLUSH /PLUSH/ code is using transmitting boundaries in horizontal direction toaccount for the radiation damping. FLUSH /PLUSH/ incorporates also the deconvolution ofthe free field motion. For the dynamic analysis with STARDYNE the deconvolution shouldbe done separately, so the input seismic motion is applied to the foundation. The radiationdamping is accounted by an equivalent modal damping. The modal damping is computedusing the method of composite damping, i.e. the damping is compiled by weighting thematerial damping of each structure member by the corresponding modal strain energy. Afterthe composite modal damping is determined, it is kept within the limits, prescribed by KTA2201. As a matter of fact there is almost no need of cutting the damping because thecomposite damping is usually under those limits. The exception is the case of extremely weaksoils ( 0.5 of the best estimate soil properties). That fact is showing that the soil structureinteraction is not of primary importance for that type of building. It is important to stress thatthe overall dynamic behaviour of those structures is heavily influenced by interaction betweenstructures with very different stiffness. Most of the attached to the reactor building structureshave a rotational response around the centre of stiffness of the combined structure. Those
244
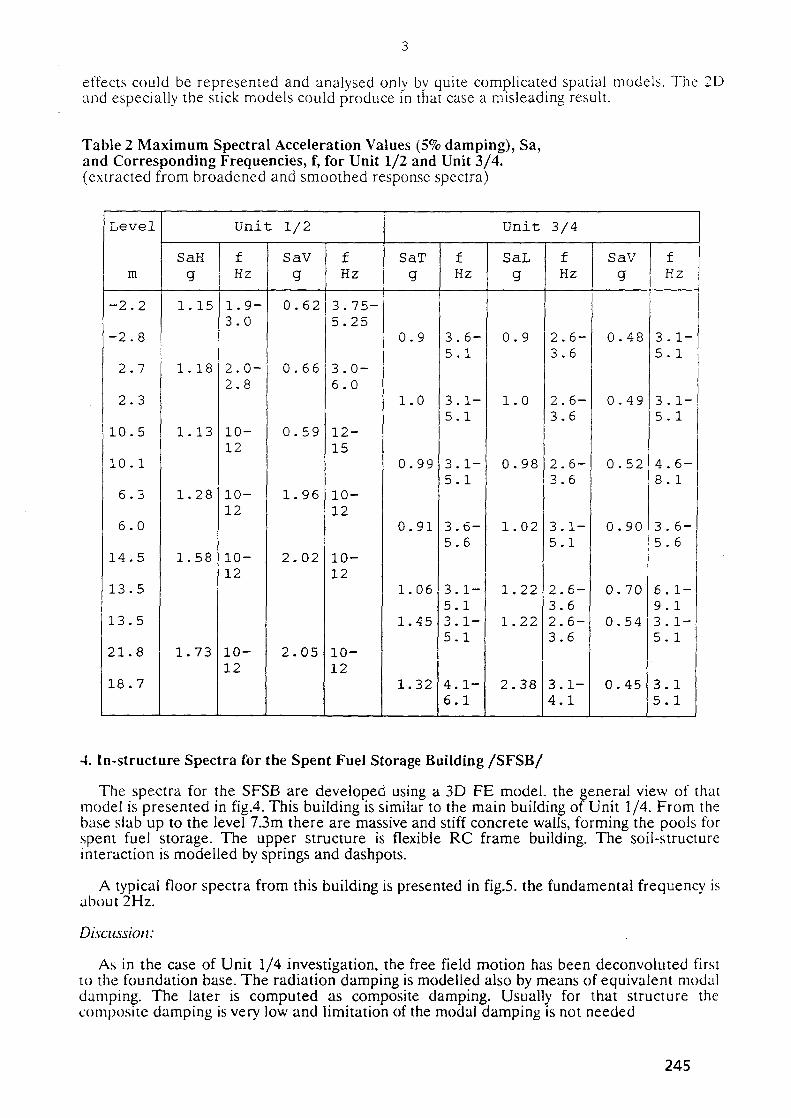
effects could be represented and analysed only by quite complicated spatial models. The 2Dand especially the stick models could produce in that case a misleading result.
Table 2 Maximum Spectral Acceleration Values (5% damping), Sa,and Corresponding Frequencies, f, for Unit 1/2 and Unit 3/4.(extracted from broadened and smoothed response spectra)
Level
m
-2.2
-2.8
2.7
2.3
10.5
10. 1
6.3
6.0
14.5
13.5
13.5
21.8
18.7
SaH
1
1
1
1
1
1
g
.15
. 18
.13
.28
.58
.73
Unit
fHz
1.9-3.0
2.0-2.8
10-12
10-12
10-12
10-12
1/2
SaVg
0.62
0.66
0.59
1.96
2.02
2.05
fHz
3.75-5.25
3.0-6.0
12-15
10-12
10-12
10-12
SaTg
0.9
1.0
0.99
0.91
1.06
1.45
1.32
35
35
35
35
35oJ
5
46
fHz
.6-
.1
.1-
.1
.1-
.1
.6-
.6
• 1 ~".1. 1 -.1
. 1 -
.1
Unit
SaLg
0.9
1.0
0.98
1.02
1.22
1.22
2.38
3/4
23
23
23
35
2323
34
fHz
.6-
.6
.6-
.6
.6-
.6
.1-
.1
. 6-
.6
.6-
.6
. 1-
.1
SaVg
0.48
0.49
0.52
0.90
0.70
0.54
0.45
35
35
48
35
6935
35
fHz
. 1-
. 1
. 1-
. 1
. 6-
. 1
. 6-
. 6
. 1-
. 1
. 1-
. 1
. 1
. 1
4. In-structure Spectra for the Spent Fuel Storage Building /SFSB/
The spectra for the SFSB are developed using a 3D FE model, the general view of thatmodel is presented in fig.4. This building is similar to the main building of Unit 1/4. From thebase slab up to the level 7.3m there are massive and stiff concrete walls, forming the pools forspent fuel storage. The upper structure is flexible RC frame building. The soil-structureinteraction is modelled by springs and dashpots.
A typical floor spectra from this building is presented in fig.5. the fundamental frequency isabout 2Hz.
Discussion:
As in the case of Unit 1/4 investigation, the free field motion has been deconvoluted firstto the foundation base. The radiation damping is modelled also by means of equivalent modaldamping. The later is computed as composite damping. Usually for that structure thecomposite damping is very low and limitation of the modal damping is not needed
245
5. In-structure Spectra for Unit 5/6, WER-1000
The VVER 1000 reactor building is modelled by detailed 3D FE model. Within theBenchmark Program for Seismic Analyses of VVER-Type NPP's of IAEA investigation ofthat building are performed also using simple stick models. The comparison between resultsfrom 3D FE and the stick model computations are showing very good fit.
The reactor building of VVER-1000 is a stiff structure consisting of four main parts:foundation block, containment shell, internal structure, auxiliary building. The joiningelement of all of them is the massive RC plate at level 13.2m. Practically all parts areintegrated in one rigid block. The internal structure is supporting the reactor and the primarycircuit. Because of the symmetry only 1/4 of primary circuit is modelled as flexible elements.The other parts are considered only as masses. The complete FE model is shown in fig.6 [3].
The soil is represented by springs and dashpots. the equivalent stiffness and damping aredetermined by an impedance analyses. The equivalent radiation damping is estimated to be70% for vertical vibration, in horizontal direction it is respectively 60% of the vertical, forrocking 50% and for torsion - 30% of the damping for vertical motion.
The fundamental frequency of that building fixed at base is about 5Hz. The soil stiffness i>changing that frequency to 2Hz. Because of the relatively weak soils the fundamental mode>of that rigid building are governed by the soil-structure interaction.
Typical in-structure spectra for that structure are shown in fig.7. As it could be seen onl> afew modes are contributing to the spectral shape.
For the aims of a PSA analyses a set of probabilistic in-structure spectra have beengenerated also [4]. The seismic input has been prepared in terms of uniform hazard free fieldspectra. The later have been represented by means of a set of time-histories, bearing the sameresponse statistics. A comprehensive multiple time-history analyses based on Latin HypercubeExperimental Design procedure have been applied. Statistics of the in-structure spectra arcderived for several levels of hazard. Typical probabilistic in-structure spectra for Unit 5/6 art-shown in fig.8.
Discussion:
It is interesting to compare the deterministic and the probabilistic response spectra (10--»annual probability of exceedance). Generally there is good fit in spite of the different inputexcitation. Comparing the mean plus one standard deviation spectra with the deterministicspectra it could be seen that there are cases were the probabilistic values are overshooting thedeterministic one. Because of the conservatism involved in the deterministic spectracomputation one should expect actually the revers situation, i.e. the deterministic values beinggrater than the probabilistic one.
7. Conclusions
The results achieved for in-structure generation of VVER-type reactors at the site ofKozloduy are leading to the following conclusions:
l.The Kozloduy NPP site is characterised by deep alluvial deposits with relatively lowstrength. Having in mind that the reactor structures are relatively stiff structures an intensivesoil-structure interaction effects are expected.
2.For the structures of the 1000 MW reactors the soil structure interaction is determiningthe fundamental dynamic behaviour. Most of the in-stricture spectra are influenced by therocking motion of the rigid structure due to soil compliance. The structure response isrelatively insensible to the free field spectrum .shape. There is relatively high radiationdamping in all direction of vibration.
246

3.The in-structure spectra of the 440 MW units are quite different in character. Obviouslythe soil-structure interaction effects are not so important for the framed structures. Theresponse is compiled by participation of many mode shapes. This makes these structuressensible to the shape of the free field spectrum but also to the shape of the time history. It isalso important to stress that these structures are very sensitive to vertical vibration what is notthe case for the 1000 MW reactor structures.
4.There is an important difference in the response of the 440 MW reactors structures andthe 1000 MW units. The response of the small units is governed mainly by the difference inthe stiffness between the reactor building and the attached auxiliary buildings and turbinehall. All attached buildings are practically rotating around the stiff reactor structure, becauseof this there are heavy problems of structural interaction which are highly unfavourable. Theresponse of the 1000 MW unit is quit homogeneous, governed by small number of modes,mainly due to soil-structure interaction. The interaction effects in that case are in favour ofthe structural safety - they are contributing to mild the dynamic response of the building.
8. Literature:
1. Kostov. M. et al., 1993, Floor Response Spectra Generation for Unit 1/2, Kozloduv NPP.Report EGP, Sofia.2. Rostov, M. et al., 1994, Floor Response Spectra Generation for Unit 3/4, Kozloduy NPP.Report EGP, Sofia.3. Kostov, M. et al., 1994, Floor Response Spectra Generation for Unit 5/6, Kozloduv NPP.Riskengineering LTD.4. Kostov, M. et al, 1994, Probabilistic Safety Analysis of Unit 5/6, Kozloduy NPP, Level 1.Report RE/LTD-10.3., Voll-4, Riskengineering LTD, Sofia.
DESIGN RESPONSE SPECTRUM UNIFORM HAZARD SPZCTRA. S'J. DAKPtNCANWUAl PROBABILITY OF EXCEEBANCE 1 0 "
0.50
0.00
Fig.1. Acceleration response spectra at free field - RLE and probabilistic Sa
§j§§ S= 9 r= = := =
:'
iai vmBmm" • " • •
Fig.2. Plane, 2D FE Models, Unit 1/2 - transversal and longitudinal model
247

Fig.3. 3D FE Model, Unit 3/4
Fig.4. 3D FE Model, Spent Fuel Storage Building
fREOUCNCr / H , / FREOUCNCr / M i / 'RtOOCMOr / M i /
F i g . 5 . Floor Response Spec t r a , SFSB, Level 3 .55 , n.p.904
248

F i g . 6 . 3D FE M o d e l , U n i t 5 / 6 , 1 0 0 0 MW
ACCELERATION RESPONSE SPECTRAENVELOPESOAKPINC: 0.02: O OS; 0.07; D.lOK0D.U. POINT 2OZBCOMPONENT L
ACCELERATION RESPONSI SPECTRAENVELOPESDAMPING: 0.03: O.Ot; 6.07; 0.10NODAL PCTNT WZ8COMPONENT T
ACCELERATION RESPONSE SPECTRAENVELOPESDAUPINC: O.OZ; Q.01; 0.07; 0.10NODAL POINT ZOZ&COKPONENT V
ntSt)tJEHCr / H i / niEQUENCy / H i /
Fig.7. Deterministic Floor Response Spectra, Unit 5/6, centre of dome,n.p.2028
Fig.8. Probabilistic Floor Response Spectra, Unit 5/6, centre of dome, n.p.2028
KEXT(eft BLANK
249
XA9952659
Applications of Seismic Damage Hazard Analysisfor the Qualification of
Existing Nuclear and Offshore Facilities
by P. Bazzurro(1), G. M. Manfredini^2) and I. Diaz Molina*3)
ABSTRACT
The Seismic Damage Hazard Analysis (SDHA) is a methodology which couples conventionalSeismic Hazard Analysis (SHA) and non-linear response analysis to seismic loadings. This is apowerful tool in the retrofit process: SDHA permits the direct computation of the probability ofoccurrence of damage and, eventually, collapse of existing and upgraded structural systems.
The SDHA methodology is a significative step towards a better understanding and quantification ofstructural seismic risk. SDHA incorporates and explicitly accounts for seismic load variability,seismic damage potential variability and structural resistance uncertainty. In addition, SDHA makesavailable a sound strategy to perform non-linear dynamic analyses. A limited number of non-lineardynamic analyses is sufficient to obtain estimates of damage and its probability of occurrence.
The basic concepts of the SDHA methodology are briefly reviewed. Illustrative examples arepresented, regarding a power house structure, a tubular structure and seabed slope stability problem.
1.0 INTRODUCTION
The goal of this contribution is to illustrate a methodology to predict the level of seismic response ofrealistic structures that is hazard-consistent. This means that the response meets specifiedprobabilistic safety goals expressed both in terms of serviceability and ultimate-capacity levels.
The behavior of such systems to seismic excitation is usually very complex (multi degree-of-freedom,MDOF) and often involves nonlinearities. The seismic evaluation of such structures cannot involvesimply the application of a site-specific Uniform Hazard Spectrum (UHS), i.e., the single-degree-of-freedom (SDOF) linear spectral ordinates for a range of frequencies.
However, this UHS, coupled with structure-specific fragility curves, is the current prevailing practicefor seismic design and re-assessment of structures. The implicit assumption in such conventionalapproach is that the response of the MDOF structure has the same hazard of the elastic, SDOFuniform hazard spectrum. This approach may prove to be accurate provided that the linear elasticstructural response is dominated by the first mode contribution. For realistic cases when the seismicresponse goes well beyond the maximum elastic capacity, the accuracy of the conventional approachis questionable, unknown, and surely variable on a case-by-case basis.
0 ) Senior Project Consultatnt, D'Appolonia S.p.A., Genoa, Italy.(2) Senior Partner, D'Appolonia S.p.A., Genoa, Italy.(3) Director, D'Appolonia, Cordoba, Argentina.
251

The earthquake engineering community in many areas (hazardous facilities, offshore structures,bridges, buildings, etc.) has recently recognized the need of going towards more advanced andmodern regulatory assessment criteria based explicitly on probabilistic risk goals and on non-linear,closer-to-failure structural dynamic behavior. Both are necessary to achieve the most effectiveregulation of safety. Examples include the IPEEE (US NRC, 1991) and the draft DG1032procedures for NRC; the "1020" natural hazard assessment document (US DOE, 1993) for DOEfacilities; the API RP2A guidelines for offshore structures (API, 1993) which include a new chapterfor seismic reassessment; the new AASHTO LRFD bridge design criteria; the Japanese designguidelines for RC buildings (PRESSS, 1992).
The proposed procedure, called Seismic Damage Hazard Analysis (SDHA) is fundamentallyprobabilistic, includes the seismology relevant aspects, and is based on structure-specific non-lineardynamic analyses. This type of analyses, given the exponential growth in computational efficiencyand the availability of adequate software, can be considered today an available office tool.
Published references on SDHA include Bazzurro and Cornell (1992; 1994a and b), Bazzurro et al(1994a and b), Bazzurro et al. (1995).
This work is organized as follows. In Section 2.0 the procedure is summarized with more emphasison clarity of exposure and illustration of ultimate goals rather than mathematical details. Chapter 3.0presents a made-up example included to show how all the steps of the procedure can be put togetherto obtain the desired damage/failure probabilities. Real case applications where the methodology hasbeen successfully used are included in Chapter 4.0. Chapter 5.0 serves as conclusion.
2.0 SEISMIC DAMAGE HAZARD ANALYSIS
The innovative methodology for the evaluation of the probability of exceeding specified levels ofpost-elastic seismic damage in realistic, multi-degree-of-freedom (MDOF) structures is brieflysummarized in the following (excerpted from Bazzurro et al., 1994a).
The proposed SDHA is implemented by combining conventional seismic hazard analysis (SHA) forthe site and non-linear structural response to ground motions from different events (e.g., magnitude,M, and source-to-site distance, R, pairs). The driving idea is to make use of the well establishedprobabilistic approach (Cornell, 1968), not for computing the probability of exceedance of ground-motion intensity levels at the site but for assessing the probability of exceedance of a damage state inthe structure induced by such seismic loads. The damage measures monitored during the non-lineardynamic analyses are the most appropriate to gauge the performance of the particular structure beinginvestigated (for example, the peak damage suffered in a specified group of columns measured interms of, say, the maximum of their ductility ratios). The most appropriate damage measures (e.g.,ductility ratio, normalized hysteretic energy, etc.) and the location of the damage within the structurevary on a case-by-case basis.
Computationally, the calculation of the annual probability of exceedance of a desired level, x, of apost-elastic damage, DM, at a location / (e.g., the specified group of columns) in the structureinvolves the repetitive calculation of the following conditional probability (Bazzurro and Cornell,1994a):
252
P[DM,l>x\m,r]=p[Sa{f.€)>Saoujmx{f,S)\'».r] (D
where:
(1) m and r are realizations of the random variables i\4 and R of the ground motion;
(2) Sa _ ( / ,£ ) is the pseudo-spectral acceleration (PSA) of the ground motion which induces
the specified damage level, DM = x, at location / in the structure. This PSA is associated witha representative frequency, / , and percentage of critical damping, £,. Note that for realisticMDOF systems multiple choices of/ are possible. Directions on "best" choices of a repre-sentative single frequency of vibration can be found in Iwan (1980) and Kennedy et al. (1984).In any case, experience suggest that this choice is not critical: the objective is to measure the"strength" of the ground motion in the frequency range swept by the dominant modes ofvibration of the structure during the ground shaking. If the first mode is dominant in theresponse, then an obvious choice could be the fundamental frequency. If more than one modeis important, an appropriate intermediate frequency may be selected and adopted as thereference frequency/.
0) Sa(f<Q *s t n e PSA at the site; it is predicted by conventional ground-motion attenuation laws.
For conciseness of notation, in the following So(f,E) will be referred to as simply Sa andSODM l=x(f, i) as SDM. Both are random variables.
It is important to recognize that, for a given structure of deterministic resistance, SDM is not aconstant but is a characteristic of the ground-motion accelerogram. Inversely, differentaccelerograms inducing the same damage DM = x at the same location / in the structure havedifferent values of PSA at the same reference frequency/ Previous empirical studies (Sewell, 1988;
variable, SDM shows (1) a very moderate record-to-record variability (coefficients of variation of, say,0.3 or less) relative to the intrinsic variability of Sa (coefficients of variation, COV's, of 0.6 - 0.8depending on the attenuation law and on the frequency) and (2) insensitivity in the mean to M and R.
In light of the preceding considerations, the seismic damage risk can be computed very simply(Bazzurro and Cornell, 1994a):
(1) by replacing SDKi in Equation 1 by its unconditional mean, SDM(=E[SDM\m,r] = E\SDM\),
and
(2) by inflating the original variability intrinsic in Sa (Seismic Load Variability) in order to accountfor the comparatively small additional variability in SDM (Seismic Damage PotentialVariability).
For example, if the maximum ductility ratio, //, experienced in a given group of columns during theground shaking is chosen as the damage measure DM, and if p is monitored for severalaccelerograms, then a relationship between fj and SDM (here Sp) can be easily obtained. To do so
one may select a suite of real ground-motion accelerograms typical of those recorded in the region ofthe site and perform a series of non-linear dynamic analyses of the structure being investigated.
253

More precisely, each ground-motion record (or all the three components of each event for 3Dstructures) has to be appropriately scaled to obtain a new record capable of inducing at location / inthe structure exactly the specified damage levei DM =x. The spectral ordinate (at the pre-selectedreference frequency, / , and damping ratio, E,) of each scaled record represents a realization of therandom variable SDM (i.e., SaDMI_x(f<£))- The value of 5^./ can be obtained by simply averaging allthe SDM values of the scaled records.
It is important to note that, given the relative small variability observed in SDM, the approximationintroduced in the calculation of SD^ by the use of only a few ground-motion accelerograms can beusually reduced to negligible values (again relative to the uncertainty of Sa) with only a sample sizeof 5-7 records (Bazzurro and Cornell, 1994a).
An example of how a typical relationship between SDftl and DM (here //) may look like for astructure behaving dynamically (1) as an elasto-plastic (EP) system, and (2) as a stiffness- andstrength-degrading system is displayed in Figure 1. The form of this relationship for such systemshas been consistently observed in previous empirical studies (Sewell, 1988; Inoue, 1990; Bazzurroand Cornell, 1994a).
Once that the relationship between the structural damage and the ground-motion spectralacceleration has been established, a seismic hazard curve such as the curve shown in Figure 2 may beproduced by performing a seismic hazard analysis for the site. This analysis requires the use of aninflated variability. Referring to previously reported COV values of So and SDM, it is clear that thetotal variability increases by only a small amount (e.g., being a total variability equal to
62 + 0.32 =0.67, the increase is in the order of only 10%). Notice that the seismic hazard curve
in Figure 2 was obtained for a reference frequency, / , of 2.0 Hertz and a damping, E,, of 5% ofcritical.
Seismic damage hazard curves yielding the annual probability of exceeding various levels of u.ranging from the beginning of post-elastic response (p=\) to very severe damage (//, say, larger than4) may be obtained simply by rearranging results in Figures 1 and 2. For the two systems consideredin Figure 1 and the seismic hazard shown in Figure 2, the resulting seismic damage curves aredepicted in Figure 3.
It is important to note that, once the mean and the uncertainty of SDM are obtained through a seriesof non-linear dynamic analyses of the structure, the computation of seismic damage curve (therecould be more than one of such curves for the same structure, since more than one damage measureDM or location / could be selected to gauge the structural damage) is neither any different nor moredifficult than the routine computation of conventional seismic hazard curves.
The seismic damage curves computed following the methodology just presented do not considerpossible uncertainty in structural resistance. In the previous example, the uncertainty in thestructural resistance can be reflected in different plausible u. values in the columns that could bringthe entire structure to collapse. This type of uncertainty (Resistance Uncertainty) is usually far lessimportant than the variability present in the seismic loads. This uncertainty, however, can be easilyincluded by using the following simplified approach.
254

Let HDi/x) = ?[DMJ > x] = ?[Sa > S^^J be the result of the modified hazard analysis plottedversus damage levels x (see Figure 3). Then assume that on log-log paper the seismic damage curve,HD}Jx), can be locally represented as a straight line, that is:
) = Kox-K> (2)
Kj being the local slope estimated from the curve in the region of x equal to the median capacity.Furthermore, assume the capacity, C, of the structure to resist damage (measured in damage terms,such as ductility at location /, not in spectral acceleration terms) is lognormally distributed withmedian c and standard deviation of the natural logarithm equal to a. Incidentally, note that, stillreferring to the previous example, the variability on C is a column-to-column variability and hasnothing to do with record-to-record variability (such as in Sau).
With these assumptions, it can be shown that the probability of exceeding a desired level of structuraldamage is obtained as:
r-2 2hi a
pf=P[DM,l>C)=jHDM{x)fc{x)dx^HDSI(C)e -' (3)
is the (lognormal) probability density function of C.
Notice that Equation 3 is exact if Equation 2 is exact for all damage values. The exponential termmultiplying HDM(C) in Equation 3 is a "correction factor" which scales up the seismic damagecurve to account for the resistance uncertainty not included before.
This "correction factor" is close to one, provided that K;a is small. To quantify this term note thatKj=l/logl0 x10> where xI0 is the factor by which one must increase DM (here /S) in order to reducethe hazard by an order of magnitude. The value of xl0 is about 2 for the EP system in Figure 3,implying K} = 3.3. Recall that if the whole structure during the ground shaking behaves basically asan EP system, then the relationship between SDM and fj is nearly linearly proportional (see Figure 1).In this case seismic hazard curves and seismic damage hazard curves have the same slope. Thereforethe experience gained with conventional seismic hazard calculations can be used to assess x10. In ourexperience this number ranges from 1.75 to 2.5, leading to K, values of 4.1 to 2.51. The slope K,depends on the site and on the probability of exceedance levels. Thus, assuming resistance variabilityexpressed by COV(C) up to 0.6, the "correction factor" (see Table 1) may increase the exceedanceprobability by as much as one order of magnitude. To derive the numbers in the table recall that,assuming lognormality for C, the standard deviation of the natural logarithm of C, a, and theCOV(Q are related by the following relationship:
o2=COV2(C)+1 (4)
If the structure behaves as a system with degrading strength and stiffness, then previous results showthat SDMvaries with // with relationships similar to the curve with triangular markers in Figure 1.This behavior can be described with relationship of the form SDKi=afib (with b<\) orSDM =a-(bju+c/1. The parameters a, b and c are constants to be determined case by case. Notethat, given the same seismic hazard curve, the slope of the seismic damage hazard curve for a
255
degrading system is less steep (see Figure 3) compared to the seismic damage hazard curve of an EPsystem, implying a lesser correction factor.
This simple but effective methodology, which accounts for the uncertainties both in the loads and inthe structural resistance, permits the direct computation of damage and, eventually, failureprobabilities of structures. This approach does not include any hidden safety factors. Hence, it isconducive in the effort of reducing possible overconservatism in current practice. This is speciallyvaluable in the reassessment process.
3.0 EXAMPLE
This section includes an illustrative, made-up example regarding the computation of the failureprobability, Ps, of a hypothetical nuclear power plant safety-related structure with regards to seismicloads. The calculation exploits the proposed methodology.
It is assumed that preliminary analyses have shown the following:
(1) the structure behaves dynamically as a 5%-damped 2.0 Hertz EP system;
(2) the damage suffered in the columns during the ground shaking is responsible for themechanism which leads the entire structure to collapse. This damage is monitored in terms ofductility ratios and the maximum of them, p, is deemed adequate to describe the severity of theinduced damage;
(3) the relationship between SDA/ at 2.0 Hertz and the maximum ductility ratio u. follows thestraight line in Figure 1;
(4) the seismic hazard curve in Figure 2 is available as a result of a seismic hazard analysisperformed for the site. Both the seismic load uncertainty and the seismic damage potentialuncertainty were already included in the derivation of such a curve.
After these premises, the seismic damage curve for this structure is the curve for EP systemdisplayed in Figure 3. Moreover, the median of the resistance capacity, C, of such columns isbelieved to be JJ = 4 with a COV of 0.4.
From the seismic damage curve in Figure 3 it follows that x10 is about 2.0 and, thus, Kl isapproximately equal to 3.3. Hence, the correction factor in Equation 3 is equal to 2.2 (Table 1).
Finally, substituting these values in Equation 3, it follows that the probability of failure of such astructure due to seismic loads is simply P,= 5 x 10"6 x 2.2 = 1.1 x 10⁻⁵ (where 5 x 10"6 is HfJ(4)
from Figure 3).
256
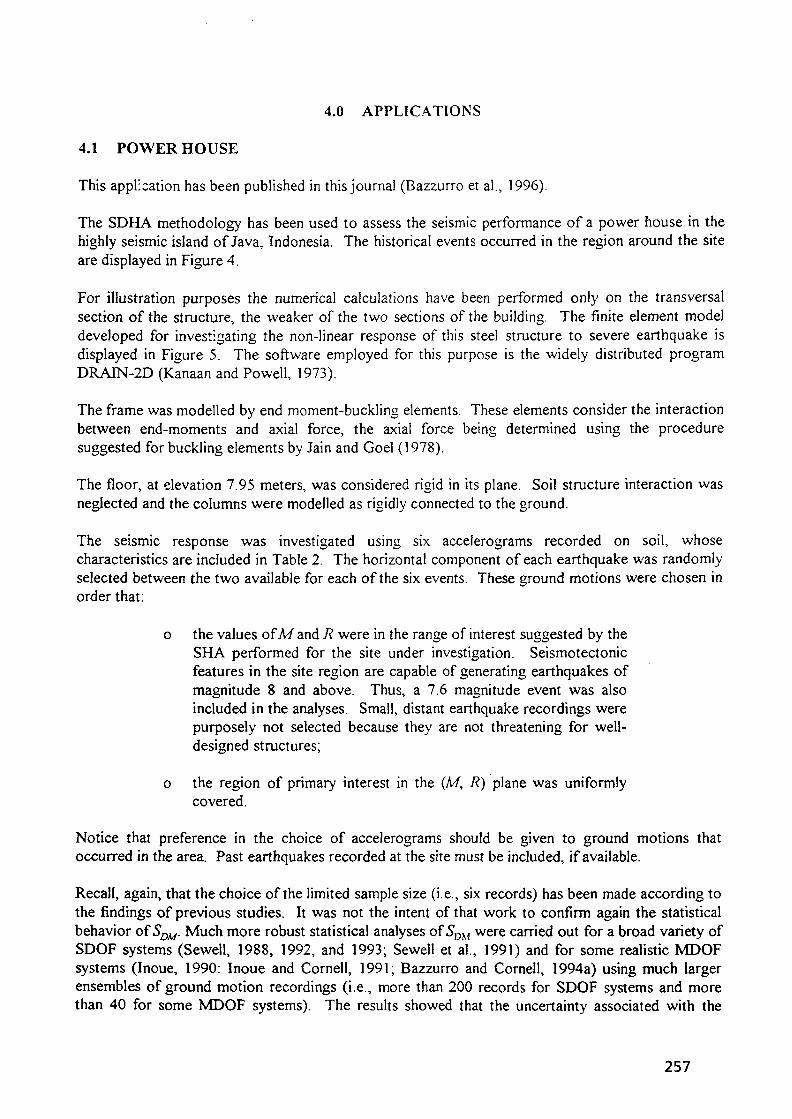
4.0 APPLICATIONS
4.1 POWER HOUSE
This application has been published in this journal (Bazzurro et al., 1996).
The SDHA methodology has been used to assess the seismic performance of a power house in thehighly seismic island of Java, Indonesia. The historical events occurred in the region around the siteare displayed in Figure 4.
For illustration purposes the numerical calculations have been performed only on the transversalsection of the structure, the weaker of the two sections of the building. The finite element modeldeveloped for investigating the non-linear response of this steel structure to severe earthquake isdisplayed in Figure 5. The software employed for this purpose is the widely distributed programDRAIN-2D (Kanaan and Powell, 1973).
The frame was modelled by end moment-buckling elements. These elements consider the interactionbetween end-moments and axial force, the axial force being determined using the proceduresuggested for buckling elements by Jain and Goel (1978).
The floor, at elevation 7.95 meters, was considered rigid in its plane. Soil structure interaction wasneglected and the columns were modelled as rigidly connected to the ground.
The seismic response was investigated using six accelerograms recorded on soil, whosecharacteristics are included in Table 2. The horizontal component of each earthquake was randomlyselected between the two available for each of the six events. These ground motions were chosen inorder that:
o the values of M and R were in the range of interest suggested by theSHA performed for the site under investigation. Seismotectonicfeatures in the site region are capable of generating earthquakes ofmagnitude 8 and above. Thus, a 7.6 magnitude event was alsoincluded in the analyses. Small, distant earthquake recordings werepurposely not selected because they are not threatening for well-designed structures;
o the region of primary interest in the (M, R) plane was uniformlycovered.
Notice that preference in the choice of accelerograms should be given to ground motions thatoccurred in the area. Past earthquakes recorded at the site must be included, if available.
Recall, again, that the choice of the limited sample size (i.e., six records) has been made according tothe findings of previous studies. It was not the intent of that work to confirm again the statisticalbehavior of SDM. Much more robust statistical analyses ofSOM were carried out for a broad variety ofSDOF systems (Sewell, 1988, 1992, and 1993; Sewell et al., 1991) and for some realistic MDOFsystems (Inoue, 1990: Inoue and Cornell, 1991; Bazzurro and Cornell, 1994a) using much largerensembles of ground motion recordings (i.e., more than 200 records for SDOF systems and morethan 40 for some MDOF systems). The results showed that the uncertainty associated with the
257

estimate of the "true" mean ofSDM can be reduced to negligible values (compared to the uncertaintyof Sa) by using a sample size of 5 to 7 ground motions. In fact the COV of the estimator is the COVofSDM (found usually to be not greater than 0.3) divided by the square root of the sample size.
Besides seismic loads, dead loads of both structure and internal equipment, and fifty percent of thedesign live loads were considered in the analyses.
The non-linear dynamic analyses were performed in the time domain using an integration time step of0.01 to 0.02 seconds and a material-structural damping of 5% before yielding. The damping afteryielding is directly accounted for by the hysteretic behavior of the elements included in the model.
When the structure is subjected to a sufficiently strong seismic excitation the response of the framebecomes non-linear. When lateral displacements of about 3 centimeters are observed at nodes 5 (or8), hinges start forming at the base of the main columns (nodes 1 and 4). For extremely severeexcitations, hinges develop also at the top and at the bottom of the internal columns (elements 16and 17), at nodes 5 and 8 in elements 1, 2, 4 and 5, and at nodes 11 and 12 in elements 7 and 8 at theconnections with the main columns.
In order to quantitatively describe the seismic performance of the structure, .the plastic rotation ofhinges in the main columns at nodes 1, 4, 5 and 8 was taken as reference damage measure DM. Infact, the most severe damage is concentrated at such locations. For a plastic rotation of 0.015radians in hinges formed in elements 1 and 2 at nodes 1 and 5 (or, alternatively, in elements 4 and 5at nodes 4 and 8) lateral displacements of 15 centimeters at node 5, and relative lateral displacementsof 35 centimeters between node 5 and 13 can be observed. When at least one of the hinges reachessuch a threshold value, <pfaib several other plastic hinges are simultaneously fully developed in theframe and the structure can be considered as failed (or, at least, not fit-for-purpose). This value ofplastic rotation occurring in at least one hinge formed anywhere in the main columns was consideredas a reference rotation indicating collapse of the structure.
To compute the mean values of SDM for the entire range of plastic rotation from zero to q>fail, sixanalyses were performed for each record in Table 2 scaled to successively higher values. The valuesof SDM for any desired damage level (i.e., percentage of plastic rotation at collapse) were computedby linear interpolation.
Notice that spectral acceleration SDM was associated with a reference frequency equal 2.0 Hertz.This frequency is a linear combination of the first two modes of vibration which are almost equallyimportant and dominate the lateral response of the frame. About the importance of the selection of avalue for such reference frequency recall the discussion in Section 2.0.
Once that the mean values and the COV's ofSDM were estimated, the annual probability of structuraldamage and, eventually, failure were computed in accordance with the methodology presented inSection 2.0, with the exception that the uncertainty in the structural capacity is not included here.
The seismic hazard calculations were performed using the program EQRISK (McGuire, 1976). Theseismic parameters for the area under investigation were estimated using ISC (1989 and 1994) andNOAA (1989 and 1994) earthquake catalogs. The historical events occurred in the region aroundthe site are displayed in Figure 5.
258

In this case study the equation used to estimate the spectral acceleration at the site is the attenuationlaw developed by Campbell (1990). If possible, however, the selected attenuation law shouldinclude accelerograms of past earthquakes recorded in the area.
Two sets of calculation were performed using two different values of the variability of SDM: one ascomputed from the analysis (i.e., COV equal 0.15 across the entire damage range) and the otheraugmented up to values (i.e., 0.3) which, in our experience, can be considered conservative.
The results are the seismic hazard curves (Figure 6) expressed in direct damage terms. The twocurves reflect the different degree of conservativeness and/or confidence in assessing the globaluncertainty in the seismic hazard computations. Incidentally, with reference to the methodologypreviously illustrated and recalling that no capacity uncertainty was considered in this application, thecurves in Figure 6 represent HDM(C) in Equation 3.
Thus, the annual probability of observing an earthquake at the site causing the yielding of the mainpower house structure is about 1 x 10"3 to 2 x 10°, whereas the collapse of the building has anannual probability of occurrence of approximately 4 x 10^ to 2 x 10"5 in the two cases. Again, theseranges of probabilities reflect the confidence in assessing the response-based factors involved in thecomputations.
The annual probability of yielding, structural damage, and collapse shall then be compared withtarget probabilities. For the seismic requalification of this type of buildings, usually classified as non-nuclear safety structures, an acceptable level would perhaps be a probability of collapse less than 10-4
per year.
4.2 JACKET-TYPE OFFSHORE PLATFORM
This application appeared in Bazzurro and Cornell (1994b).
The structure is the steel, jacket-type, Unocal's offshore platform called Rajah Wellhead (Figure 7)located immediately offshore of eastern Kalimantan, Indonesia (Figure 8).
This large 3D-structure and its foundation is a challenging example because it displays an array oftypes of nonlinearities: steel and soil material nonlinearity as well as softening geometric nonlinearity,both locally (buckling braces) and globally {P-A effect).
Rajah Wellhead is a typical jacket-type platform operating in 45 m of water. It has a rectangularbase and four legs. The piles are driven to a depth of 107 m below the mud line and grouted insidethe legs. The distance between the lower side of the deck and the mean water level is about 14 m.Both the superstructure and the piles are made up of steel tubular members. The uppermost soillayer is a soft clay, whose resistance characteristics are very poor.
Non-linear dynamic analyses were performed on a 3D finite-element model developed by means ofthe computer program Karma (ISEC, 1989). The model includes 451 nodes, at which the structuralmasses are lumped, 644 elements; and 2010 degrees of freedom. Legs and piles were modeled bylarge-displacement inelastic beam-column elements with distributed plasticity; diagonal braces weremodeled by large-displacement postbuckling elements with degradation of both strength and stiffnessof the section. Linear beams were used for the deck and non-linear near-field elements were used forthe soil. In particular, the foundation soil was modeled by defining a set of three orthogonal springs
259

(two lateral and one axial) at fixed elevations along the shaft of the pile. The pile-soil deformationwas related to the soil resistance in both the lateral and the axial directions by specifying,respectively, lateral p-y and vertical t-z force-deformation curves. These curves, for both virgin anddegraded soil, were available as a result of a geotechnical investigation at the site. The analysispermits transition from one state to the other.
The non-linear dynamic analyses were performed in the time domain, by direct integration of theequations of motion. The non-linear postelastic behavior of the elements explicitly accounts for thestructural damping after material yielding. Earthquake (inertia) loads, dead load of the structure inaddition to equipment located on the deck, live loads present on the deck during oil production, andbuoyancy loads on the submerged members were included in the non-linear dynamic analyses. Theactions of other environmental loads, resulting from wind, wave, and current, were not included.Drag forces acting on the submerged members of the jacket, due to the motion induced by theearthquake, were also neglected.
In this case, to evaluate the mean of SDM the five earthquakes in Table 3 were adopted. Thesemagnitude and distance pairs were selected to describe the seismicity of the area around the RajahPlatform site. Beyond using records only from "soil" sites, no modifications were made for thespecific local site conditions. On the basis of both modal and preliminary non-linear dynamicanalyses, the spectral acceleration SDM was associated to a representative frequency of 0.55 Hertzand a damping of 5% of critical.
Again the seismic damage risk for the jacket is evaluated by using the methodology presented beforewith the only exception concerning the structural uncertainty that was not included in thecalculations.
Three non-linear types of damage DM are considered in the case of the Rajah Wellhead Platform:two for describing the global performance and one for monitoring the local damage in the piles. Theoverall postelastic damage of the platform is measured by the global ductility ration fu , based ondeck displacement. The two different types of global ductility ratios considered are the following:
o Mdispjc which is the ratio of the maximum lateral oscillationamplitude of the deck to the reference deck displacement (7.6 cm).Such reference value was selected because due to the poor strengthand stiffness of the uppermost clayey layer, the platform subjectedto the action of only the asymmetric state vertical deck and self-weight loads deviates from the upright position and leans towardsthe negative ^-direction of 7.6 cm, before the lateral loads areapplied. Initially, under the action of the lateral loads, all theinelastic events occur only in the soil, and the platform tilts virtuallyas a rigid body while remaining elastic response analyses. The firstinelastic event in the structural frame occurs the foundation soil hasalready yielded in several places. The inelastic events in thestructure are concentrated in the piles below the mud line;
o noffJC which is the ratio of the deck displacement permanent offset inthe ^-direction at the end of the ground shaking to the referenceoffset displacement (i.e., 12 cm, see Bazzurro and Cornell 1994b,for details on the criteria employed for the computation of such
260

value). This is an important damage measure, as revealed bypreliminary non-linear dynamic analyses. In fact, because the X-direction is more flexible and weaker than the ^-direction andbecause the structure is initially leaning in the negative X-direction,the platform responds to seismic excitations by progressivelyincreasing its deviation from the vertical position towards thenegative X-direction.
The situation is more complicated in the case of the local damage that occurs only in the piles at aconsiderable depth below the mud line (about 40 m). Piles behave as non-linear beam-columnelements whose response is governed by a set of multilinear relationships that include axial force-displacement, in-plane and out-of-plane moment rotation, and torque-twist behavior. In theseelements, a four-dimensional interaction surface controls the inelastic response, and this fact makes itdifficult to postulate a compound damage measure. In this particular case, though, since the damageoccurs mainly in a pile at a large depth below the mud line, the axial force is dominant over bendingand torque moments. Therefore, the usual ductility ratio JJ1OC, based on the axial deformation of theelement, is a reasonably accurate measure of the peak damage sustained by the piles.
The seismic hazard computations were conducted using the computer program EQRISK (McGuire,1976).
The study of the tectonic features of the region and the spatial occurrence of historical earthquakeshas not yet provided sufficient information for identifying with confidence active faults nearby (saywithin 100 km). The historical data, however, suggests the partition of the region into the threelarge seismic zones shown in Figure 8. Within each zone, the seismicity was considered relativelyuniform, and figure occurrence of earthquakes was described by a single probability distribution.Seismic events wee modeled to occur as single points of energy release at a random location. Theearthquake magnitude distribution adopted for the seismic zones in the present study is the doublytruncated exponential distribution.
The equation used to estimate the spectral acceleration (for a frequency of 0.55 Hz and dampingratio of 5%) at the site is the attenuation law developed by Campbell (1990). This equation appliesspecifically to soil sites. No other provisions were made, however, for possible amplification of theinput motions due to the extremely soft soil condition at the Rajah Wellhead Platform site.
According to the methodology presented before, the variability in the spectral acceleration Sa wasincreased in order to account for the variability in both SDM. The seismic hazard curvescorresponding to the ductility values associated with the maximum deck displacement in the X-direction (measured by fJdlsp^), the residual permanent deck displacement in the ^-direction(measured by Mofp<)> ar |d the structural damage in the piles (measured in terms of {tloc) are displayedin Figure 9. From this figure it follows that, for example, the annual probability that the structuremay experience a final permanent displacement of 23 cm or more in the ^-direction (correspondingto iioffx « 2) is approximately 5.0 x 10^. Moreover, the collapse of the Rajah Wellhead Platform,which is an event that requires the values of ductility ratios (both global and local) equal to or higherthan those displayed in Figure 9, has an annual probability of occurrence that is less than 1.0 x 10⁻³.Again, it is important to appreciate that since no uncertainty in the structural capacity was includedin the analysis, the three curves in the figure represent the term HDM(C) for three different damagemeasures DM.
261

4.3 STABILITY OF A SLOPING SEABED
This application has been presented at the Third Symposium on Strait Crossings held in Alesund,Norway, June, 1994 (Bazzurro et al., 1994b). This section, excerpted from the reference citedabove, discusses the numerical evaluation of the annual probability of exceeding specifieddisplacement values in subsea slopes of the Messina Strait, Italy.
As pointed out by Newmark (1965) the magnitude of slope displacements that develop during anearthquake should be the criterion for assessing the degree of stability or instability of a slope, ratherthan consideration of the possibility of the factor of safety dropping to unity during the earthquake.The amount of acceptable deformation depends on the specific problem. For the landfalls of asubmerged-floating tunnel, as an example, the anticipated slope displacement must be small enoughnot to induce structural collapse. Depending on the seismic event considered, the operability of thesystem may also be a concern. In this case relatively large deformations may not be acceptable evenif the structural safety is preserved.
The slope displacements can be computed by a procedure analogous to that used for analyzing themovement of a sliding block on an inclined plane (Figure 10). The displacements in the soil mass arecomputed integrating twice the acceleration time history portion exceeding the yield acceleration av,as schematically depicted in Figure 11. The yield acceleration is defined as the acceleration value atthe ground surface for which failure occurs (i.e., shear strength exceeded) along a potential slidingplane (see Pelli et al., 1994). The yield acceleration depends on soil strength, slope angle, total andeffective stresses at the failure surface level, and depth of the failure surface. In this context, ay is theonly parameter representing the "capacity" of the slope.
Although crude, this model has been used extensively in the past thirty years as it catches some ofthe basic physics controlling the stability of slopes and embankments under seismic loading (e.g.,Goodman and Seed, 1966; Sarma, 1975; Seed et al., 1985; Lin and Whitman, 1986; Yegian et al.,1991;Baziaretal., 1992).
Bearing in mind the premises above, in this context, the damage was assumed to be simply the finalpermanent deformation of the slope. According to the Newmark's method referred to above, theslope lateral displacements induced by the ground shaking can be found by double integration of theearthquake acceleration time history. Only the spikes above the yield acceleration value, a givecontribution to the final permanent deformation. Again, the parameter ay is the only quantitydescribing the resistance of the slope to the ground shaking.
In this application SaDMHx (o r simply SDAf) is the peak ground acceleration (always greater than ay)
necessary to induce in the slope a permanent displacement x at the end of the ground shaking. SDM,for any value of x, is a random variable whose mean in this application was evaluated using a largedatabase of 52 strong-motion records (Table 4).
The seismic hazard calculations were performed using the in-house modified version of the computerprogram EQRISK (McGuire, 1976). The equation used to estimate the PGA at the site is theattenuation law developed by Joyner and Boore (1988). The variability of PGA suggested by Joynerand Boore was conservatively increased by 20% to account for the additional variability on SDM
(see Bazzurro et al., 1994b, for details).
262

The procedure yielded the seismic damage hazard curves in Figure 12 expressed in terms ofpermanent displacements for different slopes at the site (i.e., for different ay values). For example adisplacement of 0.05 meters is exceeded at the site in a slope having a critical acceleration of 0.3 gon average once every 10,000 years.
5.0 CONCLUSIONS
This contribution has demonstrated that a methodology is available to assess the probability ofexceedance of damage states induced in real structures by seismic loadings. In the qualificationprocess of existing facilities this is a vital need, that is fulfilled without including any hidden safetyfactor. The SDHA methodology allows for a realistic evaluation of safety margins. Furthermore,upgraded structural configurations can be quickly analyzed, thus validating the reassessmentstrategy.
6.0 REFERENCES
American Petroleum Institute (API), 1993, "Recommended Practice for Planning, Designing andConstructing Fixed Offshore Platforms", API RP2A-WSD, 20th Edition, Washington, DC.
Baziar, M. H. R. Dobry & M. Alemi 1992. Evaluation of lateral ground deformation using slidingblock model. Proc. 10th World Conf. on Earthquake Engrg., Madrid, 3: 1401-1406.
Bazzurro, P. and C. A. Cornell, 1992, "Seismic Risk: Non-Linear MDOF Structures". Proceedingsof ]Qth World Conference of Earthquake Engineering. Vol. 1, pp. 563-568, Madrid.
Bazzurro, P. and C. A. Cornell, 1994a, "Seismic Hazard Analysis of Non-linear Structures. I:Methodology", Journal of Structural Engineering, ASCE, Vol. 120, pp. 3320-3344, November.
Bazzurro, P. and C. A. Cornell, 1994b, "Seismic Hazard Analysis of Non-linear Structures. II:Applications", Journal of Structural Engineering, ASCE, Vol. 120, pp. 3345-3365, November.
Bazzurro, P., C. A. Cornell, D. Diamantidis and N. R. Vaidya, 1994a, "Probabilistic SeismicRequalification of Nuclear Power Plant Structures", Proceedings of ASME PVP-1994 Conference.Minneapolis, MN, June 19-23.
Bazzurro, P., Cornell, C. A., Pelli F. and G.M. Manfredini, 1994b, "Stability of Sloping Seabed:Seismic Damage Analysis, Methodology and Application", Proceedings of Strait Crossings 1994.Balkema, Rotterdam, The Netherlands, pp. 821-829.
Bazzurro, P., Cornell C. A., Diamantidis D. and G. M. Manfredini, 1996, "Seismic Damage HazardAnalysis for Requalification of Nuclear Power Plant Structures: Methodology and Application",Journal of Nuclear Engineering and Design, 160, pp- 321-332.
Campbell, K. W., 1990, Report, "Empirical Prediction of Near-Source Soil and Soft Rock GroundMotions for the Diablo Canyon Power Plant Site", San Luis Obispo, CA, prepared for LawrenceLivermore National Laboratories, Dames & Moore Job No. 10805-476-166.
263

Cornell, C.A., 1968, "Engineering Seismic Risk Analysis", Bulletin of the Seismological Society ofAmerica, Vol. 58, No.5.
Goodman, R. E. & H. B. Seed 1966. Earthquake induced displacements in sand embankments. J.SoilMech. Found Div., ASCE 92 (SM7): 125-146.
Inoue, X, 1990, "Seismic Hazard Analysis of Multi-Degree-of-Freedom Structures", Report No.RMS-8, Department of Civil Engineering, Stanford University, Stanford, CA.
Inoue, T. and C. A. Cornell, 1991, "Seismic Hazard Analysis of MDOF Structures", Proceedings ofICASP. Instituto de Ingenieria, UNAM, Mexico City, Mexico.
International Seismological Centre (ISC), 1989, "Historical Hypocentre File", Computer File, ISC,Newbury, U.K.
International Seismological Centre (ISC), 1994, Updating of the "Historical Hypocentre File",Computer File, ISC, Newbury, U.K.
ISEC Inc., "KARMA Computer Program", Documentation, Vol. 1-V, San Francisco, California.
Iwan, W. D., 1980, "Estimating Inelastic Response Spectra from Elastic Spectra", EarthquakeEngineering and Structural Dynamics, Vol. 8, pp. 375-399.
Jain, A. K. and S. C. Goel, 1978, Hysteresis Models for Steel Members Subjected to Cyclic Bucklingor Cyclic End-Moments and Buckling, Report No. UMEE 78R6, Dept. of Civil Engineering,University of Michigan, MI.
Joyner, W. B. & D. M. Boore 1988. Measurement, characterization and prediction of strong groundmotion, Proc. of Earthquake Engrg and Soil Dynamics II, Geotechnical Division, ASCE, Park City,UT., June 27-30.
Kanaan, A. E. and G. H. Powell, 1973, Purpose Comuter Program for Inelastic Dynamic Responseof Plane Structures, Report No. EERC 73-6, Earthquake Engineering Research Center, University ofCalifornia, Berkeley, CA.
Kennedy, R. P., S. A. Short, K. L. Mertz, F. J. Tokarz, I. M. Idriss, M. S. Power and K. Sadigh,1984, "Engineering Characterization of Ground Motion - Task 1: Effects of Characteristics of Free-Field Motion on Structural Response", NUREG/CR-3805, Vol. 1, U. S. Nuclear RegulatoryCommission.
Lin, J. S. & R. V. Whitman 1986. Earthquake-induced displacements of sliding blocks. J. Geotech.Engrg., ASCE 112(1): 44-59.
McGuire, R.K., 1976. EQRISK, Fortran computer program for seismic risk analysis, Open FileReport 76-67, USGS, Denver, CO.
National Oceanic and Atmospheric Administration (NOAA), 1989, "The Entire Earthquake DataBase", Computer File, Boulder, Colorado.
264

National Oceanic and Atmospheric Administration (NO A A), 1994, Updating for PDE Catalog fromJanuary 1989 to July 1993, Computer Files, Boulder, Colorado.
Newmark, N. M. 1955. Effects of earthquakes on dams and embankments. Geotechnique 15(2):139-160.
Pelli, F., G. V. Vassallo & F. Casola 1994. Earthquake-induced permanent deformations in thelandfalls of submerged-floating tunnels in sand. Proc. of the Third Symposium on Strait Crossings,Alesund, Norway.
Press (Japan) Guidelines Drafting Working Group, 1992, "Design Guidelines (Draft) for ReinforcedConcrete Buildings", The Third Meeting of The U.S.-Japan Joint Technical Committe4e on PrecastSeismic Structural Systems, San Diego, California, November.
Sarma, S. K. 1975. Seismic stability of earth dams and embankments. Geotechnique 25(4): 743-761.
Seed H. B., R. B. Seed, S. S. Lai & B. Khemeneh-pour 1985. Seismic design of concrete facedrockfill dams. Symp. on Concrete Face RockfiU Dams, ASCE: 459-478.
Sewell, R. T., 1988, "Damage Effectiveness of Earthquake Ground Motion: Characterizations Basedon the Performance of Structures and Equipment", Ph.D. Dissertation, Dept. of Civil Engineering,Stanford University, Stanford, CA.
Sewell, R. T.5 G. R. Toro and R. K. McGuire, 1991, "Impact of Ground Motion Characterization onConservatism and Variability in Seismic Risk Estimates", Prepared for U.S. NRC, Risk Engrg., Inc.,Final Report, Golden, CO, May.
Sewell, R. T. 1992. Effects of duration on structural response factors and on ground-motiondamageability. Proceedings of SMIP92, edited by M. J. Huang, Div. of Mines ad Geology, Calif.Dept. of conservation, Sacramento, CA.
Sewell, R. T., 1993, "Impacts of Earthquake Strong-Motion Duration on Inelastic StructuralResponse Factors and on Ground-Motion Damage Potential", CSMIP Data Utilization Report. RiskEngrg, Inc., Final Report, Golden, CO, May.
Trifunac, M. D. and A. G. Brady, 1975, "A Study on the Duration of Strong Earthquake GroundMotion", Bulletin of the Seismological Society of America, Vol. 65, No. 3, pp. 581-626.
U.S. Department of Energy (DOE), 1993, "Natural Phenomena Hazards, Design and EvaluationCriteria for Department of Energy Facilities", DOES-STD-1020-92, Washington, D.C., February.
U.S. Nuclear Regulatory Commission, "Individual Plant Examination of External Events (IPEEE)",Generic Letter No. 88-20, Supplement 4, NUREG/CR-1407.
Yegian, M. K., E. A. Marciano & V. G. Ghahraman 1991. Earthquake-induced permanent deforma-tions: probabilistic approach. J. Geotech. Engrg., ASCE 117(1): 35-50.
265

TABLE 1CORRECTION FACTOR
FOR TYPICAL Kj AND RESISTANCE UNCERTAINTIES VALUES
cov(C)0.2
0.4
0.6
4
1
i:
.i
.4
.5
3.3
1.2
2.2
5.3
2.
1
1
2
51
.1
.6
.6
Notes:
(1) See Equation 3 for correction factor definition.
(2) The value of K; equals 3.3 corresponds to xl0 equals 2.0.
(3) COV stands for coefficient of variation.
266

TABLE 2LIST OF GROUND MOTION RECORDS
USED IN THE ANALYSESOF THE POWER HOUSE
EARTHQUAKE
No.
1
2
3
4
5
6
NAME
Kem County, CA
Hollister, CA
Imperial ValJey, CA
Parkfield, CA
Lima, Peru
Loma Prieta, CA
STATION NAME
Callech Athenaeum
Gilroy, Gavilan
El Centre, Array 5
Taft Lincoln School
Inst. Geofisico
Palo Alto Hospital
DATE
07-21-52
11-28-74
10-15-79
06-27-66
10-03-74
10-18-89
COMP.
SOOE
S23E
230°
S69E
N08E
212°
DISTANCE
(Km)
109
10
4
105
38
47
MAGNITUDE
7.4
5.2
6.5
6.1
7.6
7.0
PGA
(cm/sec2)
-46.5
-94.1
367.2
11.2
179.0
378.2
DURATION
(sec)
30.0
2.8
9.5
33.4
48.4
13.1
Note:
The duration values reported in the table refer to the ground-motion duration which bracketsthe 90% of the energy released (Trifunac and Brady, 1975).
267

TABLESCHARACTERISTICS OF
GROUND MOTIONS INCLUDED IN DATABASEUSED IN THE OFFSHORE PLATFORM APPLICATION
EARTHQUAKE
No.
1
2
3
4
5
NAME
San Fernando, Calif.
Long Beach, Calif.
Borrego Mountain,Calif.
Kem County, Calif.
Loma Prieta, Calif.
STATION NAME
Wheeler Ridge
Vemon CMD Building
Cal Edison, Colton
Caltech Athenaeum
Olema, Ranger Station
DATE
02-09-71
03-11-33
04-09-68
07-21-52
10-18-89
DISTANCE
(Km)
82
22
130
109
136
MAGNITUDE
6.6
6.2
6.6
7.4
7.0
SOIL TYPE
(sec)
Soil
Soil
Soil
Soil
Soil
268
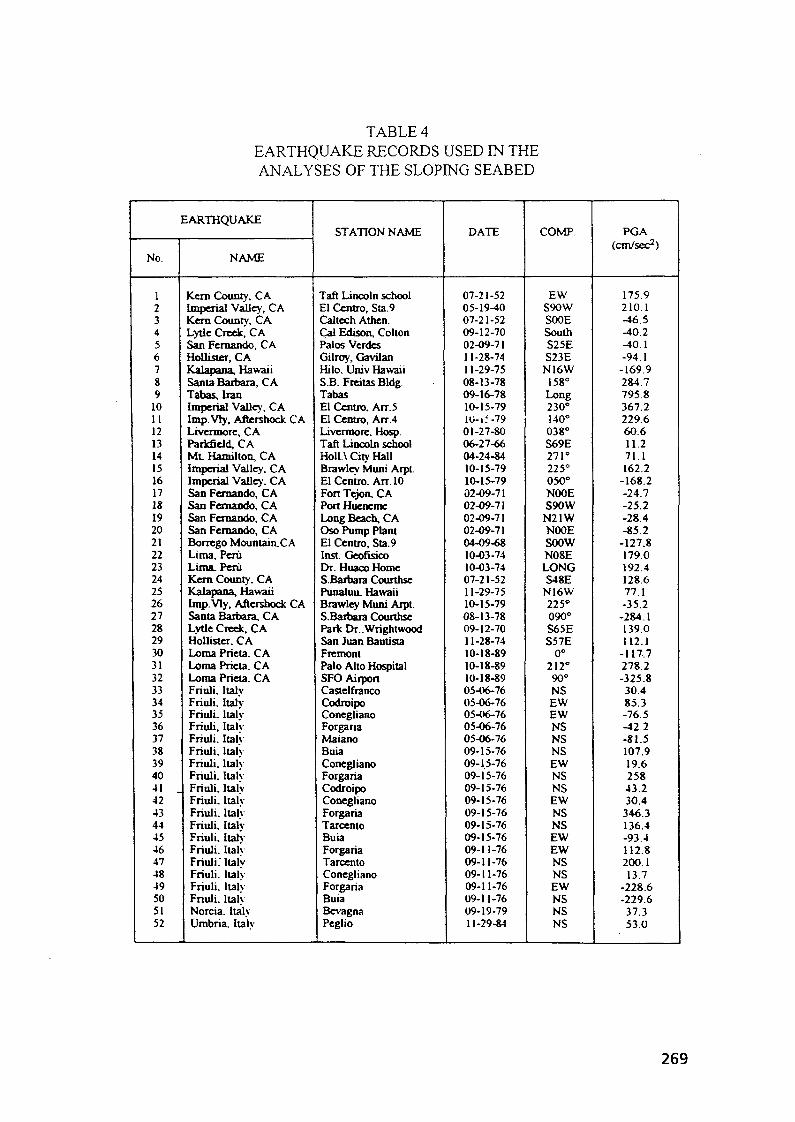
TABLE 4EARTHQUAKE RECORDS USED IN THEANALYSES OF THE SLOPING SEABED
No.
123456789
1011121314151617181920212223242526272829303132333435363738394041 _4243444546474849505152
EARTHQUAKE
NAME
Kem County, CAImperial Valley, CAKern County, CALytle Creek, CASan Fernando, CAHollister, CAKalapana, HawaiiSanta Barbara, CATabas, Iranimperial Valley, CAImp.Vry, Aftershock CALrvermore, CAParkfield, CAM L Hamilton, CAImperial Valley. CAImperial Valley. CASan Fernando, CASan Fernando, CASan Fernando, CASan Fernando, CABorrego MountairuCALima, PeruLima. PeruKern County. CAKalapana, HawaiiImp.Vly, Aftershock CASanta Barbara. CALytle Creek, CAHollister. CALoma Prieta. CALoma Pricta. CALoma Prieta. CAFriuli. ItalvFriuli. ItalyFriuli. ItalyFriuli, ItalyFriuli. ItalvFriuli. ItalyFriuli. ItalyFriuli. ItalyFriuli. ItalvFriuli. ItalyFriuli. ItalyFriuli. ItalyFriuli, ItalyFriuli. ItalvFriuli; ItalvFriuli. ItalyFriuli. ItalyFriuli. ItalyNorcia. ItalyUmbria. Italy
STATION NAME
Taft Lincoln schoolEl Centre, Sta.9Caltech Athen.Cal Edison, ColtonPalos VerdesGilroy, GavilanHilo. Univ HawaiiS B . FreitasBldgTabasEl Centre. Arr.5El Centre, Arr.4Livermore. Hosp.Taft Lincoln schoolHollA City HallBrawlcv Muni Arpt.El Centre. An. 10Fort Tejon, CAPort HuenemeLong Beach, CAOso Pump PlantEl Centre, Sta.9Inst. GeofisicoDr. Huaco HomeS.Barbara CourthsePunaluu. HawaiiBrawlcy Muni Arpt.S.Barbara CourthsePark Dr..WrightwoodSan Juan BautistaFremontPalo Alto HospitalSFO AirportCastelfrancoCodroipoConeglianoForgariaMaianoBuiaConeglianoForgariaCodroipoConeglianoForgariaTarcentoBuiaForgariaTarcentoConeglianoForgariaBuiaBcvagnaPeglio
DATE
07-21-5205-19-4007-21-5209-12-7002-09-7111-28-7411-29-7508-13-7809-16-7810-15-79lO-i.'-7901-27-8006-27-6604-24-8410-15-7910-15-7902-09-7102-09-7102-09-7102-09-7104-09-6810-03-7410-03-7407-21-5211-29-7510-15-7908-13-7809-12-7011-28-7410-18-8910-18-8910-18-8905-06-7605-06-7605-<>6-7605-06-7605-06-7609-15-7609-15-7609-15-7609-15-7609-15-7609-15-7609-15-7609-15-7609-11-7609-11-7609-11-7609-11-7609-11-7609-19-7911-29-84
COMP
EWS90WSOOESouthS25ES23E
N16W158°
Long230°140°038°S69E271°225°050°N00ES90WN21WN00ESOOWN08ELONGS48E
N16W225°090°S65ES57E
0°212°90°NSEWEWNSNSNSEWNSNSEWNSNSEWEWNSNSEWNSNSNS
PGA(cm/sec2)
175.9210.1-46.5-40.2-40.1-94.1
-169.9284.7795.8367.2229.660.611.271 1162.2
-168.2-24.7-25.2-28.4-85.2
-127.8179.0192.4128.677.1-35.2
-284.1139.0112.1
-117,7278.2-325.830.485.3-76.5-42.2-81.5107.919.625843.230.4
346.3136.4-93.4112.8200.113.7
-228.6-229.637.353.0
269
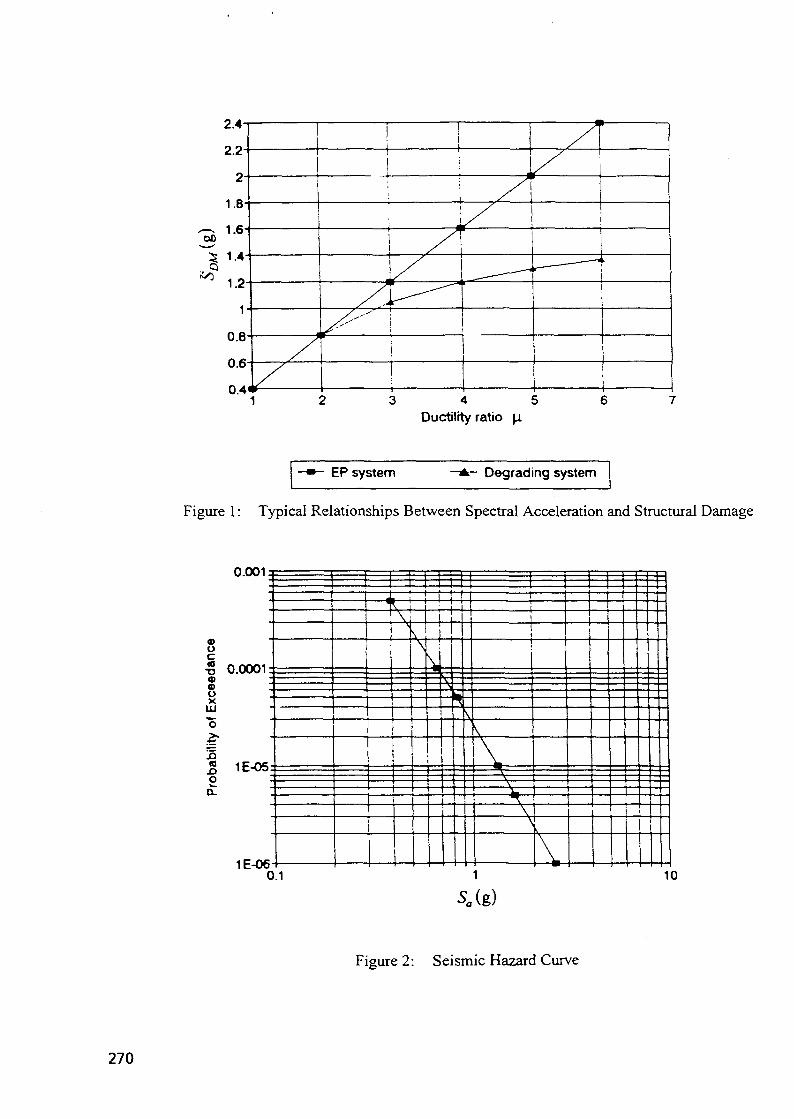
2.4-
2.2-
2-
1.8-
1.6-
1.4
1
0.8
0.6
0.4
/
1
i
i '
! / *
/
/
/
i
2 3 4 5 6 7Ductility ratio [i
—•- EP system —A- Degrading system
Figure 1: Typical Relationships Between Spectral Acceleration and Structural Damage
u.uui:
o
•S 0.0001-o
I E
xce
o
g 1E-05-
1E-060.1
- 4i
>
t
\
I
I
1
^
\
V
\
:_. \ _\
\
1
i
\
1
Figure 2: Seismic Hazard Curve
270

o(0
oX
LLJ
"o
«JQO
1
1E-05:
1E-06
\
\ J1 i-,
x ~.
1
IN i
10Ductility ratio (i
EP system Degrading system
Figure 3: Seismic Damage Hazard Curves
271

4'S
9TS
SUMATRA^ © T
f\_2L^LS
A
• JAVA SEA
1CK'E 105* 106" 107 108*
SCALE
0 35 70 14OKm
272
LEGEND
A
O
e•A0
3.00 -
3.50 -
U.00 -
H.5C -
5.00 -
5.50 -
3,49
3.99
U . 49
H.99
5.49
5.99
•
••
SITE
6 . 0 0 -
6 ,50 -
7 .00 -
7 .50 -
8.0C -
8 .50 -
SYMBOL
t
6
7
7
8
8
. 49
. 9 9
. 4 9
.99
. 4 9
.99
Figure 4: Past Seismic Activity in the Region

25.00m
LEGEND
1 NODE NUMBER
ELEMENT NUMBER0
20m
Figure 5: Power House Steel Structure, Numerical Model of the Transversal Section
273

(DOCCO
Q)O
CD
_ QCO
O
coDCCCO
0.01
0.001
~ 0.0001 E
1E-05=
1E-060 10 20 30 40 50 60 70 80
% of plastic hinge rotation at collapse90 100
LEGEND
COMPUTED USING CONSERVATIVEVALUES OF COVS
COMPUTED USING ESTIMATEDVALUES OF COVS
Figure 6: Seismic Hazard Curves in Terms of Structural Damage
274

Waterline level
45 m
Mudline level
57 m
12 m
50 m
LEGEND:I I Soft Clay[HI! Dense Sand• 1 Stiff Clay
Figure 7: Rajah Wellhead Platform with Foundation Soil Profile (Not to Scale)
275
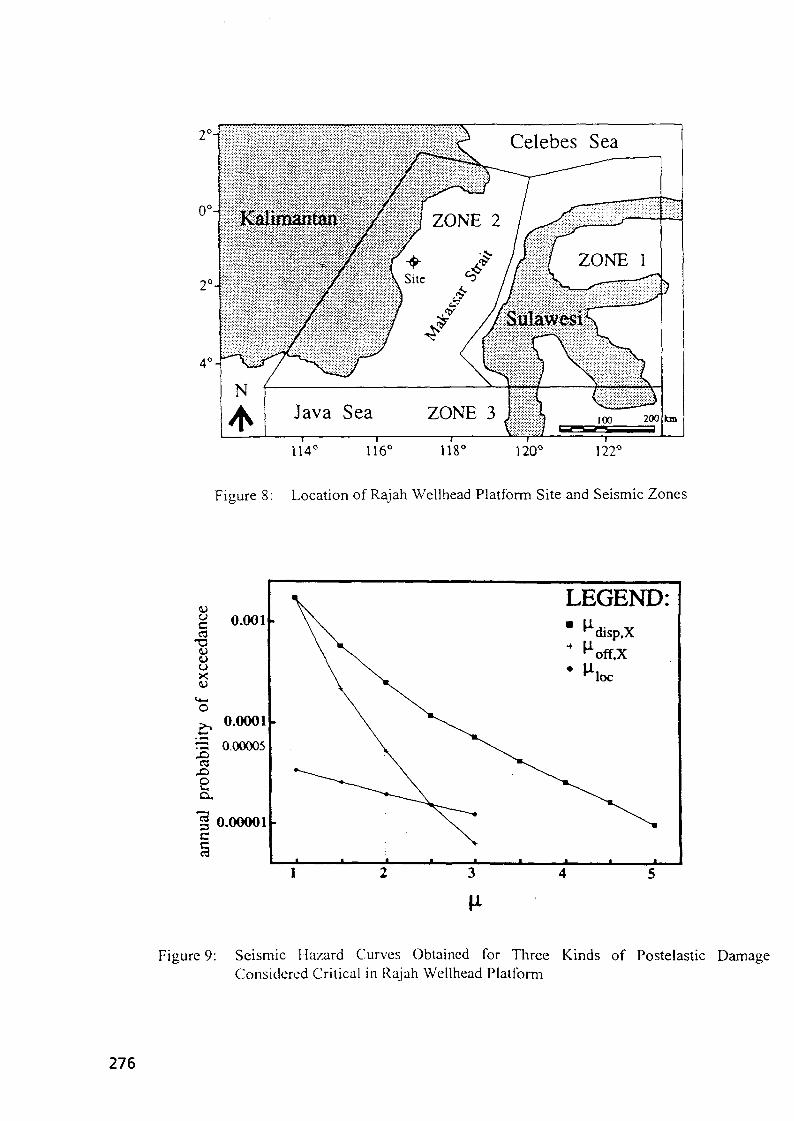
Celebes Sea
114 120° 122°
Figure 8: Location of Rajah Wellhead Platform Site and Seismic Zones
Figure 9: Seismic Hazard Curves Obtained for Three Kinds of Postelastic DamageConsidered Critical in Rajah Wellhead Platform
276

LEGEND
M W-OCK « S S
W ILOCH ME 1DM1
R RESISTING FO«CE
aiDOCCELEKSTIOH HUE MlSIWtt
a SLOTE OXOLE
RIGID BLOCK
SHQKIHG UEDGE
Figure 10: Sliding Block Model
LEGEND
TltLO OCCElEtOUON
) «CCEl.E««:iON 1I«E KISTOSY INDUCEDBT 1ME FMTHOUAKE
TIHE
Figure 11: Method to Compute Residual Displacement (Modified After Goodman and Seed,1966)
277

5•o1
0.1
"o 0 . 0 1
*->
| 0.001
£c.
~tt
\ 0.0001
IE-OS
15^\
^ •
\
• ' " '—
k. I
• -
—
•
i —
—<
--^a
- i » - a=().l
-**- a=0.4
—
L-
'',» 1—1
=^—=s
_
—
1
• - * - •
1— — ~
• • I..,,, , ~
1 • — .
1=0 L'g - = - a=0 :l£
=o.5e
~
1 • - * —
^ ^
-= ;
= — = ?
——-_
i . —
—=^—
—
,
0 0.0S 0.1 0.1:••> 0.2 0.25 0.:! O.:Jf> 0Permanent Displacement (m)
4 0.45 0.5
Figure 12: Seismic Damage Hazard Curves in Terms of Permanent Displacement. The a inthe legend stands for yield acceleration
278

SESSION V
"EXPERIMENTAL METHODS FORSEISMIC CAPACITY RE-
EVALUATION"
NEXT PAGE(S) Ileft BLANK I
, 1 279

Full-scale dynamic structural testing of Paks Nuclear Power Plant
E.M. DA RIN, F.P. MUZZIISMES S.p.A., Bergamo, Italy
ABSTRACT: Within the framework of the IAEA coordinated "Benchmark Study forthe seismic analysis and testing of WWER-type NPP's", in-situ dynamic structuraltesting activities have been performed at the Paks Nuclear Power Plant in Hungary.The specific objective of the investigation was to obtain experimental data on theactual dynamic structural behaviour of the plant's major constructions and equipmentunder normal operating conditions, for enabling a valid seismic safety review to bemade.
This paper gives a synthetic description of the conducted experiments and presentssome results, regarding in particular the free-field excitations produced during theearthquake-simulation experiments and an experiment of the dynamic soil-structureinteraction global effects at the base of the reactor containment structure. Moreover, amethod which can be used for infering dynamic structural characteristics from therecorded time-histories is briefly described and a simple illustrative example given.
1. INTRODUCTION
An IAEA Coordinated Research Programme was initiated in the early nineties toassist the countries of Central and Eastern Europe in evaluating the actual safetyconditions of their first generation nuclear power plants. This Programmefundamentally aims at providing technical bases to the safety related decisions to betaken by the countries operating the plants, with the consulting assistance of othercountries providing technical and financial support.
Within the above-outlined context, a full-scale experimental investigation into thedynamic structural characteristics of a typical WWER-type Nuclear Power Plant hasrecently been performed at Paks in Hungary. Experimental data on the actual dynamicbehaviour of the plant's major structures is obviously essential for validating computermodels and allowing valid seismic safety analysis to be made. The Paks NPP site hasthus been subjected to earthquake-like ground shaking through appropriately devisedburied explosions - at a safe distance from the plant - and the dynamic response of theplant's major structures digitally recorded, together with the concurrent free-fieldexcitation. The large amount of experimental data acquired during three successiveearthquake simulation experiments is being analyzed for to extracting useful referenceinformation.
281

Figure 1. General view of the Paks Nuclear Power Plant.
2. PLANT AND SITE SHORT DESCRIPTION
There are presently four WWER-440 type V-213 reactor units in operation at thePaks NPP. The latter was originally designed in the former Soviet Union, but someadaptations were made by Hungarian design offices. The two first reactor units startedcommercial operation in 1983 and 1984.
In the design stage the seismic hazard of the Paks site was considered to be very lowand thus, no special regard was given to possible earthquake actions. Lately however,the seismic hazard of south-eastern Hungary is being revised and it was henceconsidered important that the seismic safety of the Paks NPP be rationally reviewed.The four reactors of the Paks NPP are arranged as two twins (Figure 1). The mainbuilding of each twin houses two reactor units in a symmetrical layout and is made upof a stiff reinforced concrete containment building, that is supported - together with anadjacent condensation tower - on a 2m thick continuous direct foundation slab. Thefoundation soil is a rather soft one, being composed of alluvial silts, sands and gravelsbecoming dense at around 16m depth.
3. SIMULATED EARTHQUAKE EXCITATION TESTS
The Paks NPP site was thus subjected to the effects of appropriately designed buriedexplosions, with the object of inducing an earthquake-type excitation of the plant'sstructures. By transmitting the vibratory energy to the structures through their ownfoundation soil - as actually occurs during real earthquakes - the full-scale dynamicsoil-structure interaction effects are activated and can hence be realisticallyinvestigated.
282

Three different successive earthquake simulation experiments were performed at thePaks site, with the whole nuclear power plant under normal operating conditions. Theexperiments were performed by igniting TNT charges, installed in 50m deep boreholesat an overall horizontal distance of about 2,5km from the 1st unit reactor base centre.• The first of the three experiments was a single blast one, which allowed to evaluate
the blast-induced vibrations intensity and to conveniently calibrate the dynamicrange of the measurement instrumentation.
• Subsequently, two time-delayed multiple blasts were produced, with the object ofsomewhat lengthening the ground excitation duration.
In fact, the duration of real earthquakes is obviously longer than that produced by asingle underground explosion; but, even more important in the present context, ahigher frequency resolution can be used in extracting structural behaviour informationfrom the experimental records, if the latters are of longer duration. Each one of theearthquake excitation tests comprised a different layout of the measurementinstrumentation, for the scope of acquiring a comprehensive experimental data set onthe structural response of all the power plant's major constructions.A large number of dynamic transducers were installed at appropriate locations in thenuclear power plant's structures. A series of sensitive velocity transducers(seismometers) were fixed against the reactor building foundation mat; in particular,three vertical and two horizontal sensors were set up around the base of the reactorshaft massive containment structure, as shown in Figure 2, and a number of identicalsensors were installed at the upper reactor hall floor level.
Figure 2. Measurement stations around the reactor shaft base.
For measuring the actual free-field excitation produced by the earthquake simulationexperiments, three further seismometers were buried 1m deep into the natural soil at a120m lateral distance aside the reactor base centre. Moreover, a series of piezoelectricaccelerometers were used for measuring the vibrations at the upper levels of the reactorhall steel superstructures and close to the top of the nearby reinforced concrete twinchimneys. For the synchronous recording of all the structural response data, togetherwith the concurrent free-field excitation, use was mad of an advanced multichanneldata acuisition and analysis system, developed by ISMES and the hardware of whichwas set up in a mobile laboratory, parked beside the reactor containment building. Thissystem is capable of simultaneously recording up to 52 signals at a 200Hz samplingfrequency, with real-time analog to digital conversion; it is a submodule of "AIACE"(the Advanced ISMES Acquisition, Analysis and Control Environment), which wasspecifically developed for performing static or dynamic experiments, while providingalso ample data analysis capabilities. In the case of time-history data to be collected,
283

the acquisition process can be automatically triggered according to a specifiedcriterion; data from all the connected transducers are fed to signal conditioners which,after on-line A/D conversion drive directly into the computer memory. At the end ofthe data acuisition process, the collected data are ready for graphical examinations bymeans of various plotting functions, as well as for applying time or frequency domainsignal analysis procedures.
4. EXPERIMENTS PERFORMED AND RESULTS OBTAINED
As already outlined above, three different blast-induced ground excitation tests wereperformed at the Paks NPP site, with the plant in normal operating conditions. Duringeach single experiment 52 digitized response signals were simultaneously recorded at a200Hz sampling rate. Analogic low-pass filters were used for eliminating the highfrequency noise prior to digitizing.
A preliminar test was carried out by simultaneously detonating two 50kg charges in50m deep boreholes at a 2442m distance in the SSE direction from the NS orientedfirst reactor building. Subsequently, two time delayed multiple blasts experimentswere performed with the scope of lengthening the overall excitation duration. The firstmultiple blasts experiment was carried out by detonating three 100kg charges, withtwo 1,64sec delays, at practically the same mean horizontal distance from the reactorbuilding than before. A second multiple blasts test was later performed with two 150kgblows and a l,58sec delay. Figure 3 shows the three-orthogonal velocity time-historiesthat were recorded in the free-field during the triple delayed blasts experiment.
» 1i • Ki i tilHSnai Slcngitudiral
Figure 3. Free-field response records. Figure 4. Reactor base response records.
284

The Paks NPP site appears to have been significantly excited by the buriedexplosions; about 20 sec long useful response signals were obtained. The free-fieldrecords show two consecutive rather distinct high and low frequency excitation phases,separated by an intermediate interference period. The following maximum peakvelocities were recorded in the free-field during the respectively higher and lowerfrequency excitation phases:• 0,081 and 0,071 cm/s in the horizontal directions,• 0,287 and 0,058cm/s in the vertical one.These values are well below the 0,5 and 0,3cm/s conservative foundation velocitylimiting values that are recommended in the DIN4150/3(1983) Standard for preventingany damage to occur in the case of blast induced vibrations in a "particularly sensitivebuilding environment". The corresponding maximum peak horizontal accelerations areclose to that of a M.M. grade III intensity earthquake, characterized by maximumhorizontal accelerations up to 0,002g.
5. REACTOR SHAFT RESPONSE
Figure 4 shows the time-histories that were recorded during the triple blastsexperiment at the reactor shaft base (see Figure 2) in the longitudinal, transverse andvertical directions. The reactor shaft base responses (recorded at the reactor buildingfoundation slab level) appear to be significantly lower than the corresponding free-field excitations; with the exception of the lower frequencies vertical vibrations, whichshow to maintain almost the same amplitudes - however with a slower decay - at thereactor base than in the free-field. Just a slight amplification of the vertical responsewas measured around the metallical top of the reactor shaft, suggesting that aprevailingly "rigid" vertical response of the latter occured.
More detailed observations can be made by comparing the response spectra of thereactor shaft base induced motions to those of the free-field excitation. For thatpurpose, the 2% damping pseudovelocity response spectra were computed in the 1-lOOHz frequency range for the excitations that were simultaneously recorded in thefree-field and at the reactor base. These pseudovelocity spectra can be considered toreflect the amount of energy content that is present in the recorded motions at thevarious frequencies. The free-field and the reactor base response spectra of the tripleblasts ground excitation records are shown in Figures 5 and 6.
- _
ilJ I-inQ
vertical
f
/
1I
}
I
J A
ii
•i
ii
iV
\
VFREQUENCY
CHi3Figure 5. "EOUENCY Figure 6.Free-field (above) and reacto* base (below) pseudovelocity response spectra.
285

While in the first diagram the spectra of the corresponding horizontal motions caneasily be compared, the second diagram shows the difference in the vertical free-fieldand reactor base motions response spectra. It clearly appears that:- The spectra computed from the horizontal motions at the reactor shaft basement areboth well below that of the corresponding free-field excitations.- The same observation holds for the vertical excitation in the higher frequency range.Around 2Hz however the reactor base vertical motion spectrum exceeds the free-fieldone; two small peaks are noticed at 1,75 and 2,34Hz.
These important observations indicate the activation of favourable dynamic soil-structure interaction effects: the thick reinforced concrete continuous foundation slabof the reactor containment building succeeds in remarkably attenuating the earthquake-like excitation levels: The horizontal excitation energies at the reactor shaft base showto be drastically attenuated over the whole frequency range in comparison to the free-field excitation and a considerable vertical vibration energy cut off is achieved above3,12 Hz; below the latter frequency, however, the excitation energy of the reactor baseis somewhat amplified with respect to the free-field one.
6. CONCLUSIVE CONSIDERATIONS
The IAEA promoted dynamic testing investigation of the Paks NPP site by means ofburied explosions-induced ground motions has provided a large amount of interestingdata on the structural response of the plant's major constructions. The technique usedby the Hungarian mining specialists for carrying out the underground explosionsactually succeeded in producing an earthquake-like excitation of rather low but quitewell measurable intensity. High quality digital data acquisitions were made by meansof the ISMES dynamic measurement instrumentation and data acquisition system.
A first series of analyses of the experimental data has recently been performed forexamining the free-field excitations that were actually produced during the blast-induced ground shaking experiments and interesting information on the actualdynamic soil-structure interaction effects could be infered for low level seismic-likeexcitation. A further detailed analyses task has still to be conducted for extractinginformation on the structural characteristics and behaviour of the Paks NPP majorconstructions.
For determining the actual modal characteristics (fn, <j)n and ^n), energy spectraldensity analyses [/I/] can be made of the collected data. As a simple illustrativeexample, the energy auto- and the cross-spectral density diagrams of the twinchimneys' top responses to the ground excitation are reproduced in Figures 7 and 8.
The auto-spectral density function, describes the vibration intensity (the variance ofthe measured quantity) distribution in the frequency domain and thus allows to identifythe structural resonance frequencies at its peak values; moreover, the associatedstructural damping ratios can be estimated from the peak widths. On the other hand,the cross-spectral density function describes the frequency domain distribution of thecovariance of the measured quantities in two different stations. The real (coincident)part of this function clearly shows the in- or out of phase relationships of the motions.
286

TWIN CHIMNEYS' TIPMEASUREMENT STATIONS
. laterall
Figure 7. Energy auto-spectral densitiesof the twin chimneys' tip transverse andlongitudinal responses
Figure 8. Energy cross-spectral densities ofthe twin chimney's tip transverse responses
From the above-reported diagrams, it can be concluded that:- The first two longitudinal bending resonance frequencies of the twin chimneys are at1,97Hz and 3,2Hz, with a further minor resonance frequency located around 4,6Hz;- The first two synchronous lateral resonance frequencies of the chimney stacks are at2,07Hz and 4,73Hz, while the first alternate lateral motion resonance occurs at 3,37Hz.
7. REFERENCES
[/I/] Bendat J.S., Piersol A.G."Random Data: Analysis and Measurement Procedures", J. Wiley & S. 1971.
8. ACKNOWLEDGEMENTS
The positive attitude of the Paks NPP people (in particular: Dr. T. Katona, ChiefEngineer and Dr. L. Turi, Head of the Experimental Section) during the preparationand execution of the above-described tests is gratefully acknowledged. Special thanksalso to Dr. I. Sziics for the collaboration in the design of the multiple blastsexperiments.
NEXT PAGE(S)left BLANK
287

XA9952661
C.A. PratO, Address: San Eduardo 151. B°.Jardin Espinosa, 5014 Cnrdoha. ArgentinaPhone/fax: >54 51 6901II or 644320
FULL SCALE DYNAMIC TESTS OF ATUCHA II NPP
T. Konno, Kajima Corporation, Japan S. Uchiyama, Kajima Technical Research Institute. Japan
L.M. Alvarez, ENACE S.A., Argentina A.R. Godoy, International Atomic Energy Agency
M. A. Ceballos and C.A. PratO, National University of Cordoba. Argentina
ABSTRACT:This paper summarizes the main results of a series of dynamic tests of the reactor building ofAtucha II NPP performed to determine the dynamic properties of its massive structure deeplyembedded in Quaternary soil deposits. Tests were performed under two different types of loadingconditions: Steady state harmonic loads imposed by mechanical exciters and impulsive loads inducedby dropping a weight on the ground surface in the vicinity. Natural frequencies and mode shapeswere identified and the associated modal damping ratios were experimentally determined.
Numerical analyses of the reactor building-foundation system by two different F.E. models wereperformed. One of them, based on an axisymmetric representation of the soil-structure system, wasused to simulate the steady state vibration tests and to calculate the dynamic stiffness of thefoundation slab and soil layers for comparison with those experimentally obtained. The other, a 3-DF.E. model of the superstructure, was used to assess the natural frequencies and mode shapesobtained from the tests, representing dynamic stiffness of the foundation with stiffness coefficientsderived both from the tests and from the axisymmetric F.E. model.
Good agreement of the natural frequencies given by two types of tests was generally found, withthe largest difference between them in the fundamental frequency of the building. Estimates of modaldamping derived from the tests showed significant differences depending on the technique used tocalculate them. For the fundamental mode damping was found to be 23 - 42 %, gradually decreasingwith frequency to 2 - 4 % for around 10 Hz.
1. INTRODUCTION
Presently under construction, the Atucha II NPP is located on the Parana River approximately
120 km north of the city of Buenos Aires. It is provided with a 745 MW pressurized water reactor
fueled with natural uranium. The civil construction of buildings was completed at the time the
dynamic tests were performed (November 1993). The plant site includes another smaller unit
(Atucha I) in operation since 1974.
Although the plant site is located in an area of very low seismicity, its reactor building was
selected to perform the tests as part of a cooperative international agreement involving the Owner
(Comision Nacional de Euergia Atomica - CNEA), the Engineer (Empresa Nuclear Argentina de
Centrales Electricas - ENACE S.A.), the Kajima Corporation of Japan and the National University of
Cordoba, Argentina.
The main motivations for the test programme were: i) Collection of experimental data on dynamic
characteristics of full-scale structure systems controlled by foundation soil properties; ii) Assessment
289
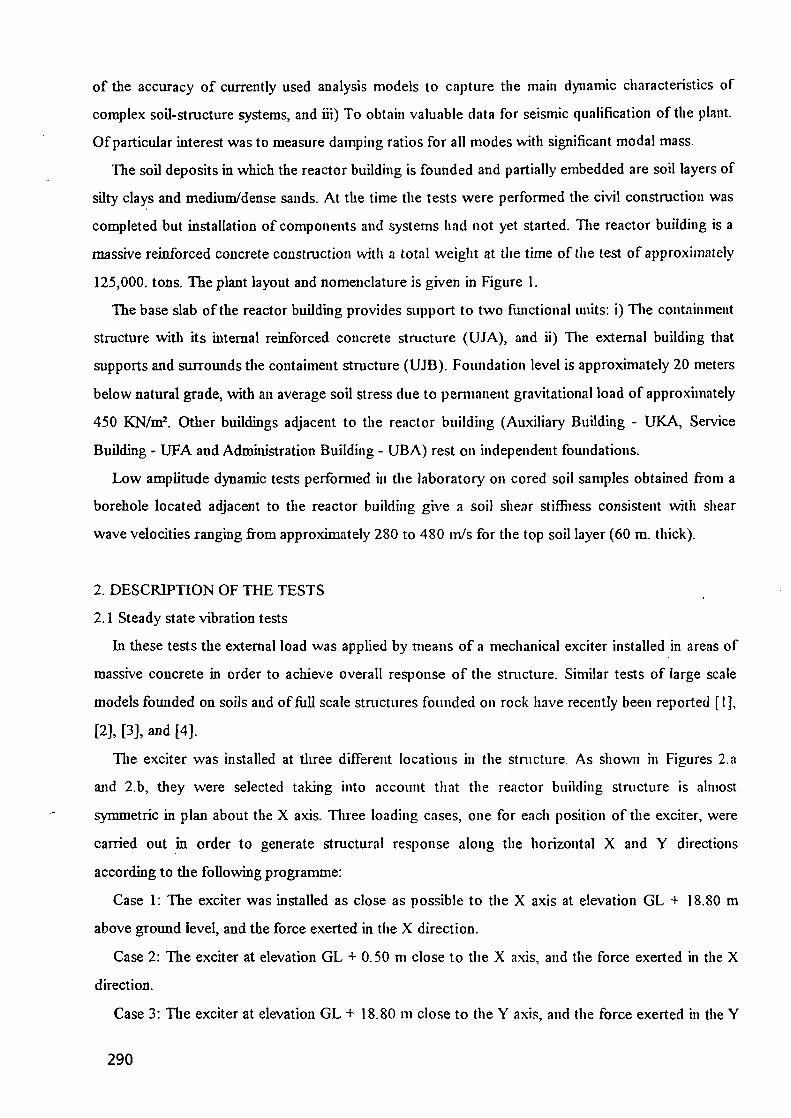
of the accuracy of currently used analysis models to capture the main dynamic characteristics of
complex soil-structure systems, and iii) To obtain valuable data for seismic qualification of the plant.
Of particular interest was to measure damping ratios for all modes with significant modal mass.
The soil deposits in which the reactor building is founded and partially embedded are soil layers of
silty clays and medium/dense sands. At the time the tests were performed the civil construction was
completed but installation of components and systems had not yet started. The reactor building is a
massive reinforced concrete construction with a total weight at the time of the test of approximately
125,000. tons. The plant layout and nomenclature is given in Figure I.
The base slab of the reactor building provides support to two functional units: i) The containment
structure with its internal reinforced concrete structure (UJA), and ii) The external building that
supports and surrounds the contaiment structure (UJB). Foundation level is approximately 20 meters
below natural grade, with an average soil stress due to permanent gravitational load of approximately
450 KN/m2. Other buildings adjacent to the reactor building (Auxiliary Building - UKA, Service
Building - UFA and Administration Building - UBA) rest on independent foundations.
Low amplitude dynamic tests performed in the laboratory on cored soil samples obtained from a
borehole located adjacent to the reactor building give a soil shear stiffness consistent with shear
wave velocities ranging from approximately 280 to 480 m/s for the top soil layer (60 m. thick).
2. DESCRIPTION OF THE TESTS
2.1 Steady state vibration tests
In these tests the external load was applied by means of a mechanical exciter installed in areas of
massive concrete in order to achieve overall response of the structure. Similar tests of large scale
models founded on soils and of full scale structures founded on rock have recently been reported [I],
[2], [3], and [4].
The exciter was installed at three different locations in the structure. As shown in Figures 2.a
and 2.b, they were selected taking into account that the reactor building structure is almost
symmetric in plan about the X axis. Three loading cases, one for each position of the exciter, were
carried out in order to generate structural response along the horizontal X and Y directions
according to the following programme:
Case 1: The exciter was installed as close as possible to the X axis at elevation GL + 18.80 m
above ground level, and the force exerted in the X direction.
Case 2: The exciter at elevation GL + 0.50 m close to the X axis, and the force exerted in the X
direction.
Case 3: The exciter at elevation GL + 18.80 m close to the Y axis, and the force exerted in the Y
290

direction.
Cases 1 and 2 were intended to provide some redundancy in the test data and to determine the
sensitivity of the results to the location of the exciting force, since modal frequencies and shapes are
intrinsic properties of the structure independent of the point of application of the load. The exciters
were capable of generating a stationary harmonic horizontal force with a controlled frequency
ranging from 1 to 20 Hz in increments of 0.10 Hz. The load amplitude vs. frequency is given in
Figure 4.
The M1K (Muto, Ishii, Kajima) measuring system was utilized to record and to process the data
obtained from the tests. Steady state response was measured by means of displacement sensors
installed at representative locations indicated in Figures 2.a and 2.b. Other sensors not shown in the
figure were located at the neighboring turbine building foundations and at the natural soil surface up
to a distance of 200 m from the reactor building.
The exciter and a typical displacement sensor are shown in photographs of Figure 3. The sensors
can be set to a natural period of either 1 or 7 seconds. They exhibit linear response characteristics
above a certain frequency that depends on the natural period selected for the sensor; typically for an
instrument set to a natural period of 1 second response is linear above 1 Hz. Since the frequency of
the tests was equal or larger than 1 Hz, the natural period of all the sensors was set at 1 second for
which their sensitivity is higher than for 7 seconds.
At each sensor location the response of the structure to the harmonic load generated by the
exciter was defined through the amplitude and phase angle of the calculated Correlation Function
between the sensor output and the signal from the exciter force. This procedure, outlined in Figure 5,
is repeated for each frequency to define the resonance curves for all sensors. Corrections for the
measured phase angle between the exciter force and sensor response were introduced by the M1K
system in accordance to the specifications of each sensor.
2.2 Impulsive load tests
To complement the test programme using mechanical exciters with stationary harmonic loads
described above, a set of impulsive load tests was performed to take advantage of all measuring
equipment installed. The excitation was introduced by dropping a concrete weight with a crane on
natural soil grade (1.6 tons from about 6 meters) at a distance of approximately 80 m from the
reactor building at the position indicated iu Figure 1. The photograph of Figure 3 shows the crane
and concrete block used for this purpose.
Structural response was recorded at selected locations of the inner concrete structure shown in
Figure 2.c, and at the free field on the ground surface near the point of impact as shown in Figure 1.
291

The nomenclature used to designate the sensors used for these tests is given in Figure 2.c. The
displacement records were then processed to identify dominant frequencies and damping values.
3. TEST RESULTS
3.1 Steady state vibration tests
Typical frequency response curves for the steady state vibration tests are given in Figures 6, 7
and 8. The natural frequencies of the system, as derived from the peaks of these curves are given in
Table 1 for the three loading cases indicated before. As expected, it can be observed that the
frequencies at which the peaks of response occur are independent of the position of the exciter (load
cases 1 and 2). The fundamental mode involves deformations predominantly associated with rocking
of the superstructure on the foundation and surrounding soil.
A very important feature of the forced vibration tests is the possibility to determine the dynamic
stiffiiess (or flexibility) of the foundation on the assumption that the base slab and lateral walls of the
buried part of the building remain rigid in the range of frequencies of interest. For each frequency,
the exciter load is known and the inertia forces can be calculated from the displacements values
recorded at measuring points; amplitude and phase angle (relative to the exciter force) of the
displacements at representative locations throughout the structure allow calculation of the real and
imaginary parts of the inertia forces in the structure. Figure 9 contains the dynamic stiffness
coefficients for rocking and horizontal sway motions, Krr and Khh respectively, derived froni test
results for each of the three locations of the exciters.
Mode shapes and frequencies of the building were identified from both the peaks of amplitude and
phase angles. The frequencies of the first modes are given in Table 1.
Damping ratios were calculated for the combined soil-structure system from displacement records
by the half power method. At the fundamental frequency the damping ratio was found to be
approximately 42 % of critical, whereas for higher modes was in the range of 2 to 2.5 % .
Damping of the foundation alone was also derived from the foundation stiffness coefficients. At
2.9 Hz the damping ratio for the sway mode was found to be 54 % and for the rocking mode 30 % .
3.2 Impulsive load tests
Typical displacement records from the impulsive load tests are given in Figure 10. Records of the
free field vertical displacements of the ground near the point of impact (Figure 11) exhibit peaks of
amplitude below 2 Hz, but relatively small variation of amplitude in the range of interest (2 to
12 Hz).
Since the dynamic input at the foundation level is not known in these tests, the readings of all
292

sensors were normalized before processing without loss of information.
Interpretation of the impulsive load tests was carried out as follows. The significant part of the
transient displacement records was sampled with a sequence of windows of 1.3 s duration shifted in
time at regular increments of 0.05 s.
The domiuant frequencies of the Fourier Transform Amplitude of records can be considered an
approximation to the natural frequencies of the system. Alternatively, the natural frequencies can be
identified with the minima of the phase angle dispersion coefficients [7J calculated for all sensors
using evenly spaced sampling windows. Typical curves representing the variation of phase dispersion
as function of frequency are given in Figure 12. Mean values of the natural frequencies derived by
this technique are given in Table 1.
Modal damping values derived from the impulsive load tests were calculated through the
amplitude decay with time for all frequencies identified as natural frequencies. The rate of amplitude
decay was obtained by best fitting exponential curves to the time evolution of FT amplitude as
shown in Figure 13. Sketches of the mode shapes for the low frequency modes are given in
Figure 14. There it is shown that for the natural frequency identified at 5.47 Hz the base slab
undergoes negligible rotation and deformations. This frequency is in close agreement with the fixed-
base fundamental mode of the complete reactor building structure obtained with a 3-D F.E. model.
4. ANALYTICAL MODELS
Several numerical models of the reactor building soil-structure system were developed to provide
an assessment of their capacity to predict field data derived from the dynamic tests.
One approach was to develop an axisymmetric F.E. model for the structure and foundation soil,
analyzed with the ASHSD2 computer program [5] to simulate the steady state vibration tests. A
sketch of the model is given in Figure 15. The shear wave velocities of soil strata used for this model
ranged from 281 m/s to 482 m/s. Viscous boundary at the base, and transmitting boundary at the
sides [6] were assumed in the F.E. mode) shown in Figure 15. A comparison of experimental and
calculated response of the structure to exciter harmonic load is given in Figure 16 for various
locations in the reactor building.
Another approach to represent the the superstructure was to develop a 3-D F.E. model of the
reactor building above the fondation slab with approximately 12000 d.o.f. This model of the
superstructure above the base slab was analyzed with different support conditions at the base. One of
them was to assume all nodes of the base slab to be fixed. Under this assumption the fundamental
frequency of the structure is found to be 5.6 Hz, which is in close agreement with experimental
results of the impulsive tests, where for 5.47 Hz the base slab appears to have almost no
293

displacements due to rocking and horizontal sway (Figure 14).
The 3-D model was also analyzed replacing the fixed-base boundary conditions by spring supports
applied at the base slab (assumed to be rigid), while global vertical response of the building was
prevented by suitable restrictions. Two sets of spring constants were used: i) Those resulting from
the steady-state vibration tests (Figure 9), for which the fundamental frequency of the soil-structure
becomes 3.35 Hz, and ii) Those derived from foundation stiffness calculations by F.E. axisymmetric
soil model, for which the fundamental frequency of the system is 2.46 Hz. Doth estimates are in the
range of measured values (2.7 to 3.5 Hz). The difference between the calculated values of the
fundamental frequency can be attributed to uncertainties in the dynamic properties of the soil layers
used in the analysis to derive the spring constants, since the fundamental frequency of the structure
resulting from tests and analysis for the fixed base condition are in very close agreement (5.47
and 5.6 Hz).
CONCLUSIONS
Valuable data related to the dynamic characteristics of the Atuclia H Reactor Building were
obtained both from the tests and analytical models, and the following conclusions may be derived
from them:
1. Natural frequencies of the reactor building were identified by two different types of tests
(steady state and impulsive), and good correspondence between them was found within the range of
interest. The largest difference between them was in the value of the fundamental frequency of the
soil-structure system due to the lack of a single peak of response that could be assigned to this mode.
2. Damping ratios were measured for the relevant modes of the structure. They were found to be
largest for the fundamental mode, gradually decreasing for higher frequency modes. Damping ratio
of the fundamental mode was found to be higher than damping cut-off limits widely used for design
of nuclear power plants in conjunction with modal response calculations.
3. The dynamic stiffness of an equivalent rigid fundation was derived directly from the tests
measurements and assessed with results from analytical models. Significant differences between
experimental and analytical results attest to the shortcomings of assigning dynamic soil properties for
numerical analysis by means of laboratory tests of cored samples. Further analysis using more
accurate soil properties at the site remains to be done to finalize the comparison of test results with
those of analytical models.
4. Results obtained from the tests can be used for seismic qualification of Atucha II NPP, and may
provide relevant information for seismic design of nuclear facilities founded on similar Quaternary
soil deposits.
294

5. Further processing of the test results may still lead lo obtain more refined results regarding the
dynamic properties of the Atucha II reactor building.
ACKNOWLEDGEMENTS
This paper is a summary of the main results of the Atucha II dynamic tests presented at 13
SMIRT entitled "Full Scale Vibration Tests of Atucha II NPP," Parts 1 through VIII. The authors
would like to acknowledge the contributions of their colleagues: Tsugawa,T., Mnsucln, K. and
Maeda, T. of Kajima Corporation, Naito, Y. and Ohno, S. of Kajima Technical Research Institute,
Sala, G. of CNEA, and Friebe, T.M. and Capelli, P. of ENACE S.A., Halbritter, A., Krutzik N., and
Schiitz, W. of Siemens A.G. and to the organizations participating in this research project.
REFERENCES
[1] Morishita, H. et al., "Forced Vibration Test of Hualien Large Scale SSI Model," 12 SMIRT, Div.
K, pp. 37-42, Stuttgart, August 1993.
[2] Kurimoto, O. et al., "Field Tests on Partial Embedment Effects (Embedment Effect Tests on
Soil-Structure Interaction)," 12 SMIRT, Div. K, pp. 43-48, Stuttgart, August 1993.
[3] Morishita, H. et al., "Study on Vertical Seismic Response Characteristics of Deeply Embedded
Reactor Building," 12 SMIRT, Div. K, pp. 61-66, Stuttgart, August 1993.
[4] Katona, T. et al., "Dynamic Response of VVER-440/213 PAKS NPP to Seismic Loading
Conditions and Verification of Results by Natural Scale Experiments," Proceedings of Seminar 16,
12 SMIRT Post Conference Seminar, pp.535-568, Vienna, August 1993.
[5] Ghosh, S. and Wilson, E., " ASHSD2 - Dynamic Stress Analysis of Axisymmetric Structures
under Arbitrary loading," EERC Report 69-10, revised September 1975.
[6] Berger, E., Lysmer, J. and Seed H.B., " ALUSH - A Computer Program for Seismic Response
Analysis of Axisymmetric Soil-Structure Systems," EERC Report 75-31, 1975.
[7] Ceballos, M.A., Prato, C.A. and Alvarez, L.M., "Experimental and Numerical Determination of
Dynamic Properties of the Reactor Building of Atucha 11 NPP," Proceedings of Seminar 16, 13
SMIRT Post Conference Seminar, Iguazii, August 1995.
295

0
Impact
Point
>a.
a> I .? to'<o
UKA
Auxiliary Building
UJA/UJBReoctor Building
UBA
Control Building
UMA
Turbine Building
Figure 1. Atucha II Plant Layout

Y 18.8m Excitation
X 18.8m Excitation
Exciter
270°(a)18.8m-lcvcl
90°
(b) ().5m-levcl
Figure 2a. Location of sensors and of exciter
180c
nr-X 0.5m Excitation
180c
297

00
-O-
p.u. (Vertical)p.u. (Horizontal)Exciter (+18.8m, +0.5m)
X Direction Y Direction
Figure 2b. Location of sensors and of exciter

H2
Elevotion: + 10.10 m Elevotion: + 18.80 m V1
H6
Elevation: - 18.60 m Elevation: + 0.50 m
+27.00 m
+ 18.80 m
+10.10 m
+ 0.50 m
— 6.60 m
-18.60 m
977777777777777777777777777777777777,
References: Vertical Sensors Horizontal Sensors
Figure 2c. Location of sensors for Impulsive load tests
299
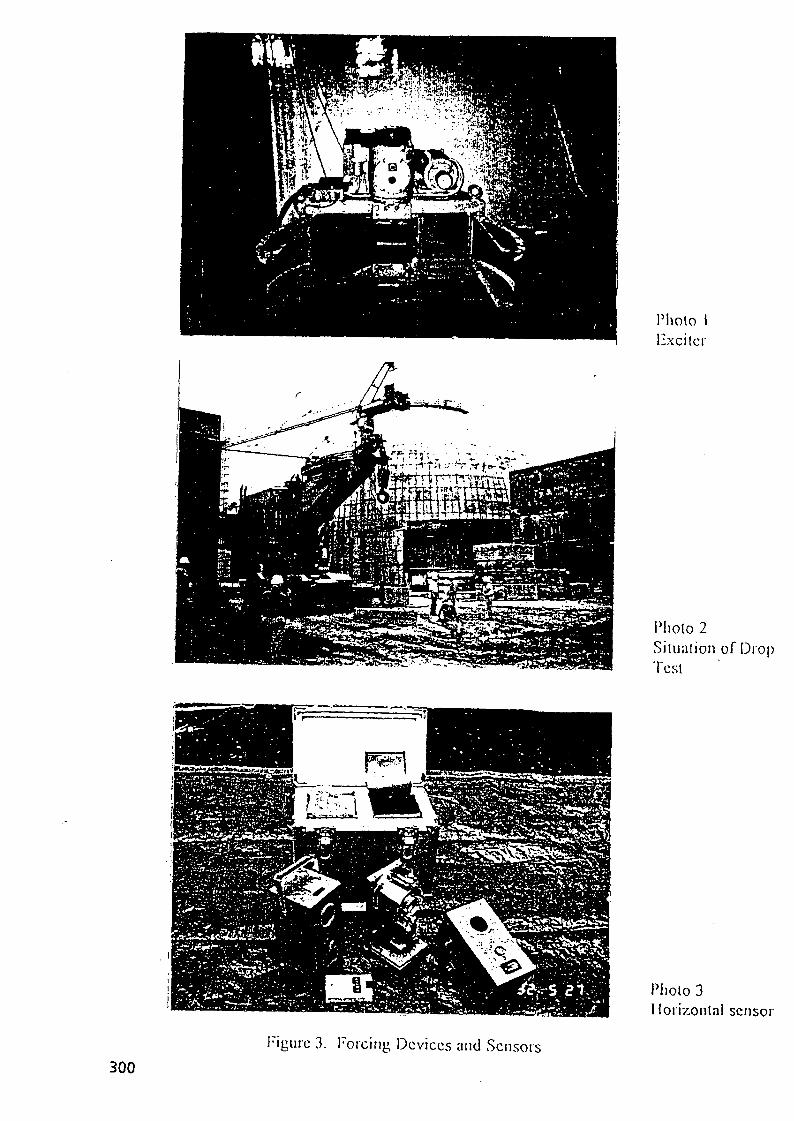
300
Figure 3. Forcing Devices and Sensors
Photo IExciter
Photo 2Silualion of DropTest
Photo 3Horizontal sensor

Exciting force
l t o n
1.0LLLL _L 1. 0.0.1
5.0 10.0 20.0Frequency [Hz]
Figura 4. Exciter force-frequency relation
EXCITER
CROSS CORRELATION FUNCTION Cl>g(r)
AMPLITUDE: A. PHASE: 0
Figura 5. MIK System flow chart for Steady-state vibration test
301

Level: -18.60m - Direction X (Horizontal)0. 2
Q.
0)IM
ID
0. 1
0) B 0
9 0
-1—i—i—i—I—i—i—r i r
i i i i I i i i i i i I i i i i
ro - 9 0
- 1 8 0 >—'—' •'
Frequency [Hz]
Level:-18.60m - Direction Z (Vertical)0. 3
0. 2
rsi— 0. I
O2=
01 8 0
TO_ l
0}toTO
^ :Q .
9 0
- 9 0
- 1 8 0
i I i i v i r i
\ 0
Frequency [Hz]i 5 2 o
Figure 6. Response of Base Slab
302
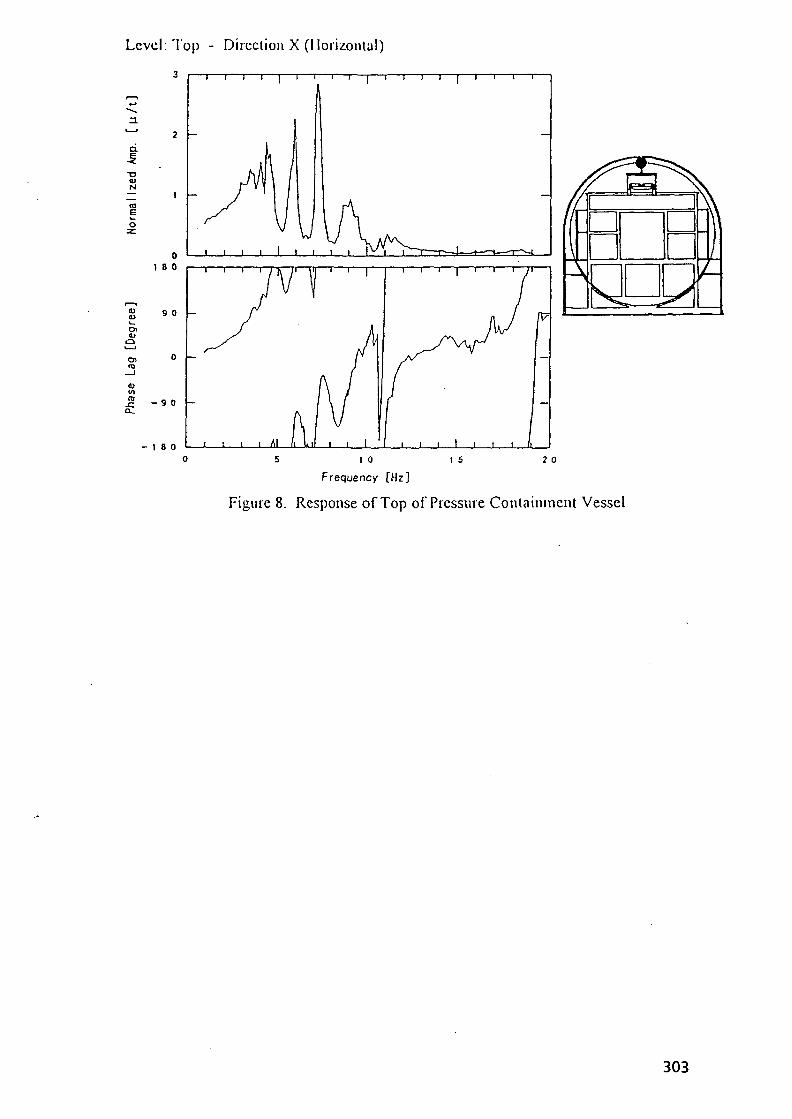
Level: Top - Direction X (Horizontal)
1N
EO
1)
01 8 0
9 0
ra - 9 0
- 1 8 0
' ' I
1 1 1 1
I I l 7VT
i i i i y\l li u » i i I
t 0
Frequency [Hz]
I 5 2 o
Figure 8. Response of Top of Pressure Containment Vessel
303

10.0xlO7K (t/m)
8.0 -
6.0
10.0
8.0
6.0
4.0
2.0
0.0
xlO7 K (t/m)
5 Hz 6
-10.0
xlO'°K (t m/rad)2.5 R '
2.0 -
1.5
1.0
0.51-
0.00 1
x+18.8
jI
1
t
I""" V 1
I1 1
<
Im.
J
"6' ~~
P
4 5 H z 6
2.5x!01 0Kp(t m/rad)
2.0-
1.5-
1.0-
0.51-
0.0(
>
Im rf
\
* 1;i
Re.0
o
o
cP
.p
6
P.
t.fl.* \
x+0.5
2.5
2.0
1.5
0 1 4 5 Hz 6
xl0 l uKB( t m/rad)
Im. j
Re.
O
O
a
6...
P
cV
A
T
1.0- -
0 .5-
0.0Hz
9. Dynamic stiffness of fiindation derived from Steady-state vibration tests

3
ni2
fco
disp
lrm
0
0.5-
0-
-0.5V
0
0.5
0
-0.5-
0
\
0.5
0.5
Testi IJ\ 1A In!1
Testi
i
«,
1
1 - Sensor H3
\. di
sN
orrr
1.5 2 2.5 3 3.5 4Time [sec]
1 - Sensor V6
A (\r-J*v\- - j-~u -«. -
V1.5 2 2.5 3 3.5 *
Time [sec]di
spl.,
Nor
m
[
0.5-
0
-0.5-^\
V
0 0.5
0.5-
0-
-0.5-
0 0.5
Test
, jL J _\ Mii l
1
Test
I
Af1
2
I
1
2
1.
- Sensor 113
5 2 2.5 3 3.5 4Time [secj
- Sensor V6
5 2 2.5 3 3.5 4Time [sec]
Figure 10. Typical displacement record from Impulsive load tests
Test 2 - Sensor VI Tesl 2 - Sensor V I
0 0.5 1 1.5 2 2.5 3 3.5 4
\y V~^^
0 1 2 3 4 5 6 7 8 9 10 11 12 13 14 15Frequency (Hz)
Figure 11. Free field vertical displacement in Impulsive load tests
305
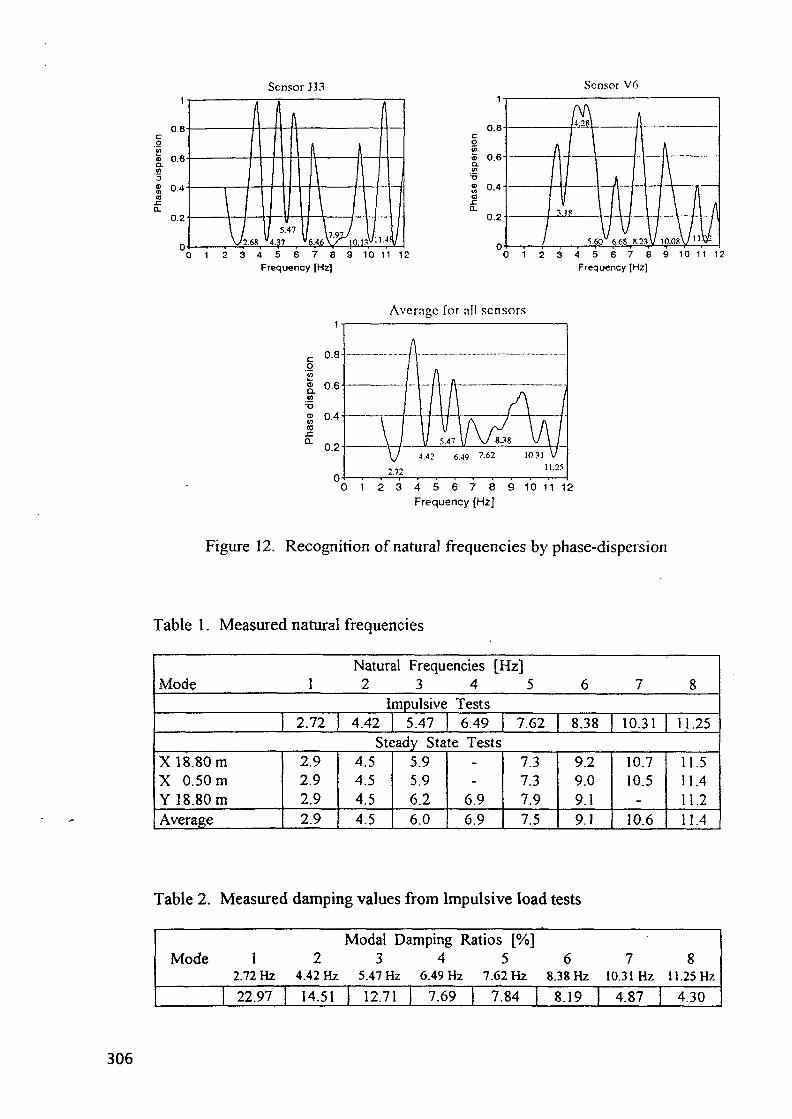
Sensor H3 Sensor V6
0 1 3 4 5 6 7 8 9 10 11 12Frequency [Hz]
0.8
£ 0.6c
'-oS 0-4ax:a
0.2
[$\ ftJ
l\i 1 A I Il | s l i l M
/ 5.60 6.68 8.23V 10.08x7 " ^0 1 2 3 4 5 6 7 8 9 10 11 12
Frequency [Hz]
0.8
a °.6iCO
T3ffi 0 .4-(0
f 0.2
0
Average for all sensors
2.72
A
ft
lv6.49
V/8JJ8
7.62
\ Iw10.31 V11.25
0 1 2 3 4 5 6 7 8 9 10 11 12
Frequency [Hz]
Figure 12. Recognition of natural frequencies by phase-dispersion
Table 1. Measured natural frequencies
Mode 1
2.72
Natural Frequencies [Hz]2 3 4 5
Impulsive4.42 5.47
Tests6.49 7.62
6
8.38
7
10.31
8
11.25Steady State Tests
X 18.80 mX 0.50 mY 18.80 mAverage
2.92.92.92.9
4.54.54.54.5
5.95.96.26.0
6.96.9
7.37.37.97.5
9.29.09.19.1
10.710.5
10.6
11.511.411.211.4
Table 2. Measured damping values from Impulsive load tests
Modal Damping Ratios [%]Mode 1 2 3 4 5 6 7 8
2.72 Hz 4.42 Hz 5.47 Hz 6.49 Hz 7.62 Hz 8.38 Hz 10.31 Hz 11.25 Hz
22.97 I 14.51 | 12.71 7.69 7.84 8.19 4.87 4.30
306

Sensor 113 - Mode 1 : 2.72 Hz Sensor IB - Mode 2 : 4.42 IIz
disp
FT o
f nor
m3-
2.5-2
1.5-
1-
0.5-
c
\
\
) 0.2 0.4Time
0.6[sec]
0.8 1
—
FT o
f no
rm,
dlsp
3-
2-
1.5-
1-
0.5
//
) 0.2
\ \
0.4Time
\
\
0.6[sec]
0.8 1
Sensor 113 - Mode 3 : 5.47 Hz
0.2 0.4 0.6Time [sec]
0.8
Sensor 113 - Mode 4 : 6.49 Hz
0.2 0.4 0.6Time [sec]
0.8
Sensor 113 - Mode 5 : 7.62 Hz Sensor H3 - Mode 6 : 8.38 Hz3
2. 25
I 2
c 15
0.2 0.4 0.6 0.8Time (see]
3
2-5
E 1 5
I 1"ot 05
00.2 0.4 0.6 OB
Time [sec]
Sensor 113 - Mode 7 : 10.31 Hz Sensor 113 - Mode 8:11.25 I Iz
—
I-1
of
no
rm
3-
2.5
1.5-
1
/
0
\ ^
0.2 0.4 0.6Time [sec]
" ~ ~ ~ - \
0.8 1
2-5-
2
i 1-5| 1
0.2 0.4 0.6 0.8 1Time (sec]
Figure 13. Modal damping from Impulsive load tests
307

MODE 1 G-» MODE 2 («.« HI)
MODE 3 (s.«7 HI) MODE 4 («•«
MODE 5 C7.62 m) MODE 6 (fi-M HI)
MODE 7 <'OJ1 HI) MODE 8 (11-25 Hi)
Figure 14. Sketch of modal shapes of the Internal structure from Impulsive load tests
308

GLOm
Elastic properties of soil profile
UJ
Dcpih(GL-m)
0 - 6
6-13
13-20
20-26
26-33
33-41
41-50
50-60
Thickness(m)
6.0
7.0
7.0
6.0
7.0
8.0
9.0
10.0
Vs(m/scc)
272.
229.
261.
281.
308.
344.
417.
482.
Poisson'sRatio
0.35
0.35
0.35
0.35
0.35
0.35
0.35
0.35
Unii Mass(ton sVm')
0.19
0.19.
0.19
0.19
0.19
0.19
0.19
0.19
Elastic properties of the structure materials
Part
R/B
PCV
Base Mat
Young's Modulus(lAn2)
3.5x 10'
2.1x 10'
3.5x 10s
Poisson'sRatio
0.2
0.3
0.2
Unit Mass(ton sVm4)
0.2447
0.7970
0.2447
Thickness(m)
0.6
0.3
2.8
Figure 15. Axisytnmedic F. E. Model
(c) Top of 1/CX10 "rad/ion
(d) Operating Floor (c) Base Mat (0 Rocking of Base Mat
Figure 16. Response and phase lag curves by simulation analysis F NEXT PAGEIS)!8 left BLANK 3 309
EXPERIMENTAL AND NUMERICAL DETERMINATION OF THE DYNAMIC PROPERTIESOF THE REACTOR BUILDING OF ATUCHA II NPP
M. A. Ceballos, E. J. Car, T. A. Prato and XA9952662C. A. PratO, National University of Cordoba, ArgentinaL. M. Alvarez, EN ACE S.A., Argentina, and A.R.Godoy, IAEA
ABSTRACTDetermination of the dynamic properties of the reactor building of Atucha II NPP is carried out inorder to: i) Obtain valuable information for seismic qualification of the plant, and ii) Assess someprocedures for testing and analysis that are used in the process of seismic evaluation of existingnuclear facilities founded on Quaternary soil deposits.Both steady state and impulsive dynamic tests were performed but attention is centered here in thetechniques used to determine natural frequencies and modal damping ratios with impulsive tests.Numerical analyses were performed by means of a 3-D model model of the superstructure togetherwith foundation stiffness coefficients derived in a separate paper from steady state vibration tests,and also from analysis with a 2-D F.E. model of the soil layers capable of approximating the 3-Dfeatures of the problem. The computed foundation stiffness coefficients are compared both withthose obtained from the tests and from an axisymmetric F.E. model; results indicate that foundationstiffness coefficients calculated with F.E. models with soil parameters given by laboratory testsperformed on cored samples are significantly lower than those given by the steady state vibrationtests.
I. INTRODUCTION
Seismic evaluation of existing nuclear facilities, currently under way following national and
international guidelines, normally requires as a starting point a reliable estimate of the dynamic
characteristics of the structure-foundation system, and of the electromechanical systems and
components. In contrast to the seismic design of new facilities, their as-built properties can be
determined both by tests and analysis, and the results of the two approaches can be used to validate
the assumptions adopted for analysis.
As part of a seismic evaluation programme, small amplitude vibration tests of full scale structures
are one of the alternatives to estimate the dynamic characteristics of structure-foundation systems
The size and complexity of nuclear power plants is often such that considerable resources are
required to perform these tests. In order to obtain as much data as possible from the tests of Atucha
II NPP, several concurrent objectives and redundant paths to achieve them were formulated while
planning the test programme.
One of the main participants of the Atucha II vibration test programme has performed,
cooperated and participated in other similar tests of full scale nuclear power plants and large scale
models. For that purpose it has developed measuring techniques, software and equipment to record,
process and interpret steady state vibratory tests by means of mechanical exciters, providing the basic
311
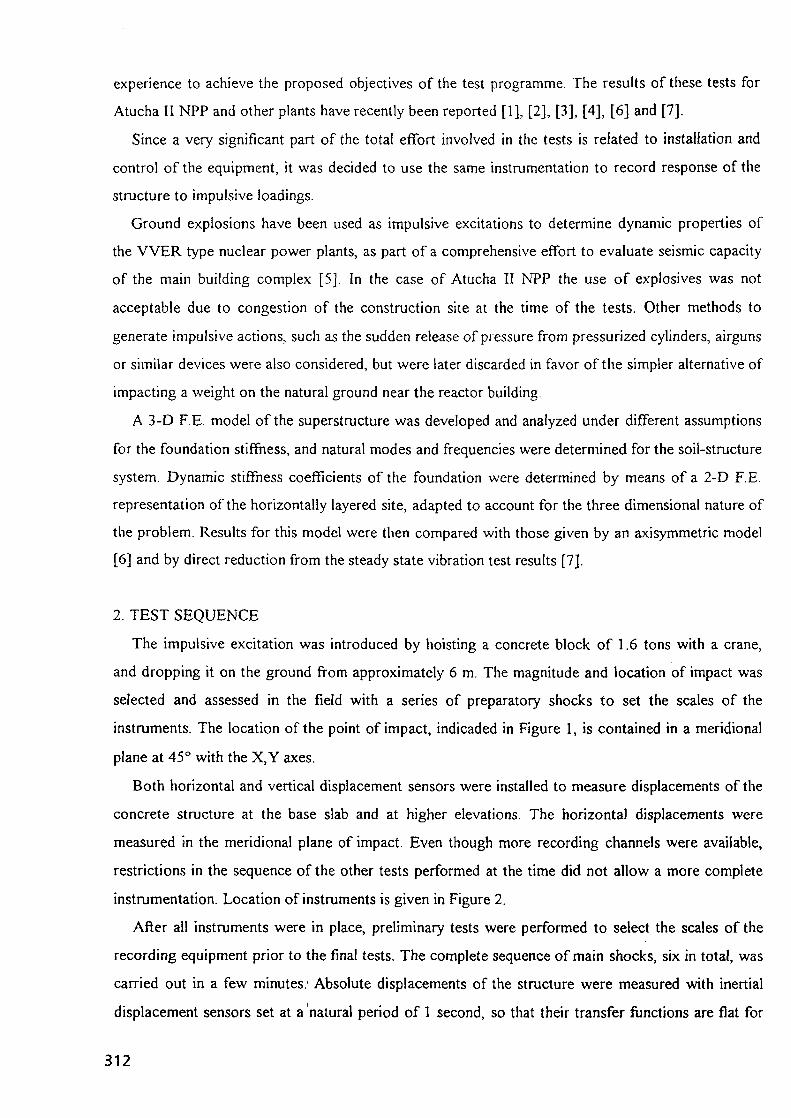
experience to achieve the proposed objectives of the test programme. The results of these tests for
Atucha II NPP and other plants have recently been reported [1], [2], [3], [4], [6] and [7].
Since a very significant part of the total effort involved in the tests is related to installation and
control of the equipment, it was decided to use the same instrumentation to record response of the
structure to impulsive loadings.
Ground explosions have been used as impulsive excitations to determine dynamic properties of
the VVER type nuclear power plants, as part of a comprehensive effort to evaluate seismic capacity
of the main building complex [5]. In the case of Atucha II NPP the use of explosives was not
acceptable due to congestion of the construction site at the time of the tests. Other methods to
generate impulsive actions, such as the sudden release of pressure from pressurized cylinders, airguns
or similar devices were also considered, but were later discarded in favor of the simpler alternative of
impacting a weight on the natural ground near the reactor building.
A 3-D F.E. model of the superstructure was developed and analyzed under different assumptions
for the foundation stiffness, and natural modes and frequencies were determined for the soil-structure
system. Dynamic stiffness coefficients of the foundation were determined by means of a 2-D F.E.
representation of the horizontally layered site, adapted to account for the three dimensional nature of
the problem. Results for this model were then compared with those given by an axisymmetric model
[6] and by direct reduction from the steady state vibration test results [7].
2. TEST SEQUENCE
The impulsive excitation was introduced by hoisting a concrete block of 1.6 tons with a crane,
and dropping it on the ground from approximately 6 m. The magnitude and location of impact was
selected and assessed in the field with a series of preparatory shocks to set the scales of the
instruments. The location of the point of impact, indicaded in Figure 1, is contained in a meridional
plane at 45° with the X,Y axes.
Both horizontal and vertical displacement sensors were installed to measure displacements of the
concrete structure at the base slab and at higher elevations. The horizontal displacements were
measured in the meridional plane of impact. Even though more recording channels were available,
restrictions in the sequence of the other tests performed at the time did not allow a more complete
instrumentation. Location of instruments is given in Figure 2.
After all instruments were in place, preliminary tests were performed to select the scales of the
recording equipment prior to the final tests. The complete sequence of main shocks, six in total, was
carried out in a few minutes; Absolute displacements of the structure were measured with inertial
displacement sensors set at a natural period of 1 second, so that their transfer functions are flat for
312

frequencies higher than 1.4 Hz., with a sensitivity of 1 urn; the lower sensitivity for frequencies
below 1.4 Hz did not impair identification of the natural frequencies of the structure, all above 2 Hz.
It is of interest to note that, in spite of the large total mass of the structure, the limited energy of
the excitation was sufficient to generat" clear and distinctive signals in the displacement sensors,
with sufficient amplitude to render acceptable signal to ambient noise ratio. In fact, as shown in
Figure 3 for sensors H3 and V6, the recordings of response at any given location for two successive
shocks were very similar in amplitude and frequency content. Moreover, as previously pointed out,
the frequency content of the incident wave generated in the soil by the impact, as shown in Figure 3
for sensor VI, was uniformly distributed in the range of 2 to 12 Hz. Thus, even though the structure
response is strongly affected by deformations of the soil, particularly at the fundamental frequency of
the soil-structure system, the peaks in the frequency distribution of response is a direct consequence
of the selective amplification of the excitation waves by the natural modes of the combined system.
3. INTERPRETATION OF TEST RESULTS
Duration of the significant part of the structural response to the impact loads was typically two to
three seconds as depicted in Figure 3. Some background noise was present in the records but its
amplitude was not significant relative to the signals due to impact. Absolute displacement records
shown in Figures 3 and 4 were normalized with respect to the maximum value at one particular
sensor and impact test; this normalization did not imply loss of information since the exact nature,
distribution and intensity of the excitation transmitted by the soil to the structure is not known, and is
not required for interpretation of the results.
The width of the sampling window used to analyze the records was selected according to the
following criteria: i) It should be sufficient to capture the lowest dominant frequency of response,
estimated at 2.5 Hz, with a minimum of 3 cycles within the sampled segment; ii) The window should
allow analysis of the evolution of amplitude and frequency content of response along the 2 to 3
seconds total duration of the records; and iii) A silent zone should be added to all records in order to
increase frequency resolution.
With these conditions a Hanning window of 1.3 second width was adopted and a final silent zone
up to 20 seconds was added to all records.
A basic condition to identify the natural frequencies of the soil-structure system from the
frequency content of the transient records is that the distribution of amplitude of the excitation with
frequency be as uniform as possible within the frequency range of interest. This assumption is
reasonably satisfied as indicated by the free field displacements given in Figure 3. A Fourier analysis
of the total length of these records indicates that the dominant frequency components were all above
313

2 Hz. The amplitude of the FT of the free-field ground motions measured at a location between the
point of impact and the reactor building shows a smooth and almost uniform frequency distribution
in the range of interest (2 to 12 Hz) so that the peaks of the frequency distribution of structural
response can be attributed to the natural frequencies of the system.
The Fourier amplitude spectra of Figure 4 were obtained by sliding the sampling window along
the time axis for sensor H3. The lowest frequency peaks of each curve exhibit some frequency drift
from 2.5 to 3.2 Hz; this drift is less pronounced for the other peaks.
An alternative way to determine the dominant frequencies of response is proposed here through
the phase angle of the Fourier Transform of the signals sampled with a series of windows equally
spaced in time. A norm of the phase dispersion (PD) of the FT is proposed through the following
expression:
]
>m~2
n
n - ]v—i
2_,j = i
n^ — i
k=j + l
/(sirtp^ - sin
\ 2
*>ik) +
/ \ 2|COS(p. . - C O S c p , )
\ 1J ' /
(0where:
/' is the frequency at which PD is evaluated
(po is the phase angle at frequency / of the/th sample of the signal
(pit is the phase angle at frequency / of the Ath sample of the signal
n is the total number of windows considered
Notice that PDi varies from 0 (no dispersion at that frequency) to 1 (maximum dispersion at that
frequency). The dominant frequencies are associated with the relative minima of PD as shown in
Figure 5 for individual sensors (top) or for the summation of the PD of all sensors (bottom). The
latter values are given in Table 1 together with the frequencies obtained from the steady state
vibration tests [7]. In this procedure dominant frequencies are implicitly assumed to remain constant
during the transient process. The authors are not aware of a previous similar application of the phase
angle variation with time to define the dominant frequency components.
To calculate the damping ratio for each of these frequencies the following technique was
implemented. The amplitude of response was obtained for each of the sampling windows, and
plotted as function of time. Since the duration of the excitation is very short as shown in the record
of the free field on the ground surface, it may be assumed that the amplitude after the first peak of
response corresponds to free vibration of the system. The damping ratio is directly related to the rate
of decay of the amplitude after the first peak.
This technique was assessed by aplying it to calibration signals of known characteristics. These
tests showed that this method is reliable when the dominant frequencies follow the pattern given in
314

Table 1, but is Jess accurate when closely spaced frequencies and high damping ratios are involved.
Damping ratios found are given in Table 2. Their values vary with location and frequency, from 23
% for the fundamental mode to 4 % for the eighth mode. Figures 6 and 7 contain typical results of
this analysis.
Figure 8 shows sketches of the mode shapes associated with the frequencies given in Table 1.
Horizontal displacements correspond to the meridional plane that contains the point of impact. These
results indicate that the first two modes involve dominant rocking motions, while the third mode
(5.47 Hz) shows dominant horizontal sway displacements of the superstructure and negligibly small
displacements of the base slab.
4. NUMERICAL ANALYSIS
The 3-D F.E. model developed for the superstructure, with approximately 12.000 d.o.f, is shown
in Figure 9. Most of the structural parts were represented by cuadrilateral elements with membrane
and bending stiffness; the base slab and central sections that support the spherical steel containment
were modelled with eight-node brick elements.
The purpose of this model was to determine the natural frequencies and mode shapes having a
modal mass of at least 1% of the total mass of the structure, using different support conditions at the
base. One condition was to assume the base slab fixed, while the others represent the foundation by
horizontal and rotational springs.
Two sets of spring constants were considered; one of them was the foundation stiffness
coefficients as derived from the steady state vibration tests [7], while the other was obtained with a
2-D F.E. model of the foundation. In both cases the static stiffness coefficients were used in the
analysis since only real-valued eigenvalues of the complete model were to be determined.
Even though it has long been recognized that 2-D models have inherent limitations to represent
3-D dynamic behaviour of rigid foundations as discussed in [8] and [9 ], the dynamic stiffness
coefficients of the foundation of the Atucha II reactor building embedded in a horizontally layered
site were calculated with an alternative plane 2-D F.E. model capable of approximating the three
dimensional nature of the problem. Axisymmetric models to represent 3-D behaviour by means of a
2-D description of the soil if the geometry of the foundation and of the lateral boundaries of the soil
are axisymmetric, are also widely used for dynamic soil-structure analysis. These two approaches
were applied for the case of Atucha II in order to compare the amount of radiation damping of the
foundation given by both analysis models with that obtained from the steady-state vibration tests.
Figure 10 depicts a F.E. discretization of a vertical plane of the soil at the site. The distribution of
soil properties with depth given in the figure was derived by means of small amplitude laboratory
315

tests performed on cored samples. The thickness of the slice of this plane model is taken equal to the
diameter of the foundation. To help represent the 3-D behaviour of the slice, two sets of distributed
springs and dashpots are added to the lateral planes (parallel to the plane of the model) in order to
account for: i) The static stiffness of the 3-D system; and ii) The radiation of energy in the direction
normal to the plane of the model.
Horizontal and vertical springs are taken so as to reproduce the static horizontal and rotational
stiffness of the same rigid foundation placed on the surface of the uniform elastic half space. For the
layered site these constants are taken directly proportional to the dynamic shear modulus of the
layers. The two sets of springs generate an additional stiffness matrix that turns out proportional to
the consistent mass matrix of the plane model, which is superimposed with the standard F.E. stiffness
matrix.
Horizontal and vertical dashpots are defined as the shear terms of a Lysmer-Kuhlemeyer boundary
[10]. These elements generate a damping matrix also proportional to the consistent mass matrix of
the plane F.E. model, that accounts for the variation of soil properties with depth.
Figure 11 contains the horizontal and rotational stiffness coefficients for the Atucha II model
shown in Figure 10; results are given as obtained with both the plane 2-D F.E. solution and with an
axisymmetric model of the same system [6]. There it is shown that the real parts are in good
agreement, while the imaginary parts exhibit somewhat larger differences.
Figure 12 presents a comparison of the stiffness coefficients as derived from the forced vibration
tests [7] with those of the plane 2-D F.E. model. There it can be seen that the results of both analysis
models underestimate the imaginary part. In addition, a sign inversion of the experimental results
suggests the existence of a natural frequency of the soil layers between 5 and 6 Hz which is not
picked up by the analyses. These results confirm that the dynamic properties of soil layers as derived
from laboratory tests from cored samples may differ from the actual properties in the field.
The results of the natural frequencies of the 3-D model of the superstructure with the foundation
stiffness as derived from tests analyses is given in Table 3. For the spring stiffness given by tests the
fundamental frequency is 3.35 Hz and for the stiffness from analysis is 2.46 Hz. For the structure
fixed at the base the fundamental frequency is 5.6 Hz, in close agreement with the tests (5.47 Hz).
5. CONCLUSIONS
The series of tests and analyses presented in this paper provide valuable information regarding the
dynamic characteristics of the complex soil-structure system of the reactor building of Atucha II
NPP.
Natural frequencies obtained from impulsive tests are in general good agreement with those
316

derived from steady state tests by means of mechanical exciters. For the fundamental frequency of
the structure, results of the impulsive tests show some drift of frequency from 2.5 to 3.2 Hz with a
mean value of 2.72 Hz, while the steady state vibration tests give a mean value of 2.9 Hz.
Damping ratios extracted from the transient tests by measurements at the base slab and in the
reinforced concrete internal structure show a tendency to decrease with increasing frequency. This is
attributed to the larger participation of soil deformations relative to structural deformations for lower
frequency modes. Estimates of modal damping values show considerable scatter from test to test,
situation that is not unusual in attempts to measure damping values of structural systems of
comparable complexity.
Time and manpower required to perform and interpret the impulsive load tests as performed here,
as well as the valuable data obtained from them, indicate that this test method is an expeditive and
potentially useful technique to determine dynamic properties of complex structural systems.
Analyses of the foundation stiffness performed with a plane 2-D F.E. model have produced a set
of dynamic stiffness coefficients in general agreement with those derived by axisymmetric F.E.
models, provided that appropriate boundary conditions are applied to account for the three-
dimensional nature of the problem. However, when the dynamic properties of soils used for analysis
are obtained from laboratory tests performed on cored samples, both types of analysis give results
significantly different from those obtained through full scale tests.
6. ACKNOWLEDGEMENTS
The authors would like to express their gratitude to the organizations supporting this project:
Kajima Corporation of Japan, Comision Nacional de Energia Atomica (CNEA), Empresa Nuclear
Argentina de Centrales Electricas (ENACE), Universidad Nacional de Cordoba, and the Science and
Technology Research Council of the Province of Cordoba, Argentina (CONICOR).
7. REFERENCES
[1] Morishita, H. et al., "Forced Vibration Test of the Hualien Large Scale SSI Model," 12 SMIRT,
Div.K, pp. 37-42, August 1993.
[2] Kurimoto, O. et al., "Field Tests On Partial Embedment Effects (Embedment Effect Tests on
Soil-Structure Interaction)," 12 SMIRT, Div.K, pp. 43-48, August 1993.
[3] Morishita, H. et al., "Study on Vertical Seismic Response Characteristics of Deeply Embedded
Reactor Building," 12 SMIRT, Div.K, pp. 61-66, August 1993.
[4] Tsutagawa, M. et al., "Seismic Verification Program of Nuclear Power Plants Quaternary
Deposits in Japan," 12 SMIRT, Div.K, pp. 67-72, August 1993.
317

[5] Katona, T. et al., "Dynamic Response of VVER-440/213 PAKS Nuclar Power Plant to Seismic
Loading Conditions and Verification of Results by Natural Scale Experiments," Proceedings of
Seminar 16, 12 SMIRT Post Conference Seminar, pp. 535-568, August 1993, IAEA, Vienna.
[6] Masuda, K., Maeda, T. and Uci.iyama, S., "Full Scale Vibration Tests of Atucha II NPP: Part IV
Numerical Simulation of Steady-State Vibration Response by Axisymmetric FEM," 13 SMIRT,
Div.J, Porto Alegre, 1995.
[7] Uchiyama, S., Naito, Y. and Ohno, S., " Full Scale Vibration Tests of Atucha II NPP: Part II
Interpretation of Tests Results for Steady-State Harmonic Forces," 13 SMIRT, Div.J, Porto
Alegre, 1995.
[8] Luco, J.E. and Hadjian, AH., "Two-Dimensional Approximations to the Three-Dimensional
Soil-Structure Interaction Problem," Nuclear Engineering and Design, 3 1 (1974); pp. 195-203.
[9] Wolf, J.P., "Foundation Vibration Analysis Using Simple Physical Models," PTR Prentice Hall,
1994.
[10] Lysmer, J. and Kuhlemeyer, R.L.. "Finite Dynamic Model for Infinite Media," Engineering
Mechanics Division Journal, ASCE, Vol.95, EM4, 1969, pp. 859-877.
318

UJA/UJBReactor Building0
uFigure 1. Atucha II Plant Layout. Location of Impact.
319
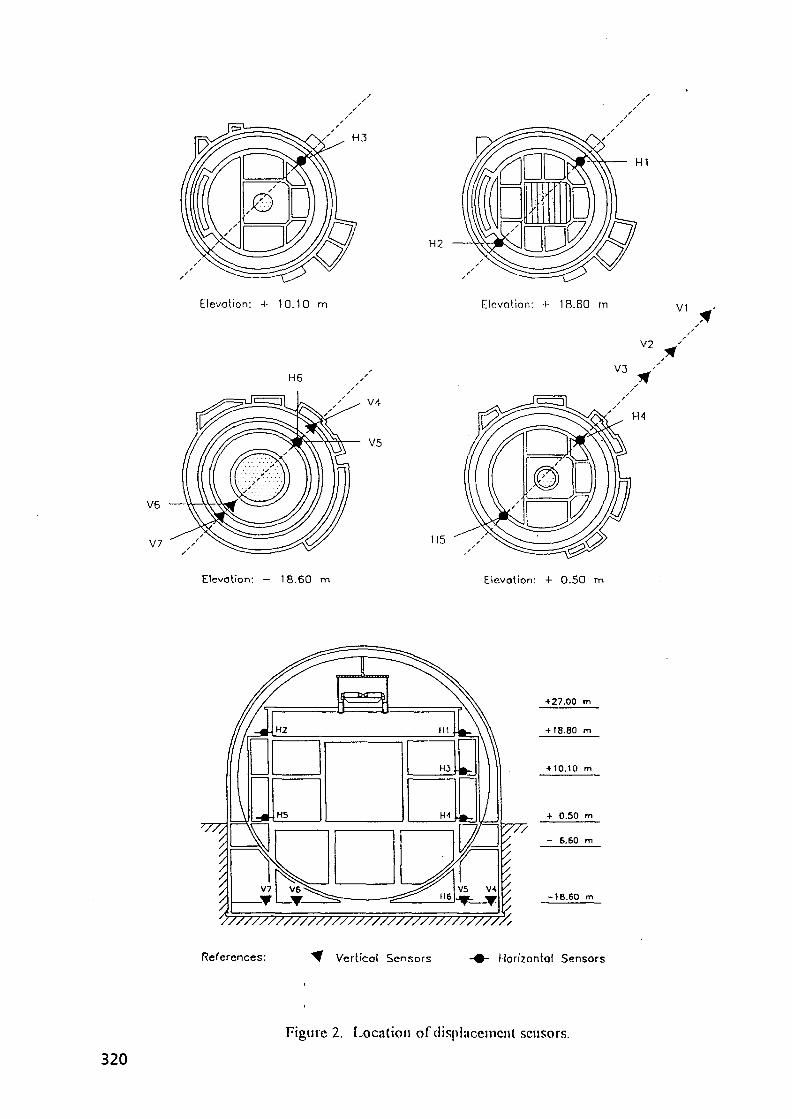
H2
Elevation: + 10.10 m Elevation: -i- 18.80 m V1
V2
H6V3
II5
Elevation: — 18.60 m
77?
////.',
+ 27.00
+ t8.80
+ 10.10
+ 0.50
- 6.60
-1B.60
m
m
m
m
m
m
References: Vertical Sensors llorizontol Sensors
Figure 2. Location of displacement sensors.
320

Test 1 - Sensor 113 Test 2 - .Sensor 113
Test 1 - Sensor V6 Test 2 - Sensor V6
0 0.5 1 1.5 2 2.5 3 3.5 4 0 0 5 1 1.5 2 2.5 3 3.5 4
0.75Test 2 - Sensor VI Test 2- Sensor VI
-0.750 1 2 3 4 5 6 7 8 9 1 0 1 1 1 2 1 3 1 4 1 5
Frequency [Hr|
Figure 3. Displacement records of structure response (H3, V6) and free field (VI).
Test 1 - Sensor 113 Tcsl 1 - Sensor 113
0 0.5 1 1.5 2 2.5 3 3.5 4 0 1 2 3 4 5 6 7 8 9 10 11 12 13 14 15Frequency [Hz]
Figure 4. Sampling and evolution of Fourier Amplitude Spectra.
321

Sensor 113 Sensor V6
0 1 2 3 4 5 6 7 8 9 1 0 1 1 1 2Frequency (Hz]
0 1 2 3 4 5 6 7 8 9 10 11 12Frequency (Hz)
Avcr:»gc of nil Sensors
0 1 2 3 4 5 6 7 8 9 10 11 12Frequency [Hz]
Figure 5. Recognition of natural frequencies by phase-dispersion.
322
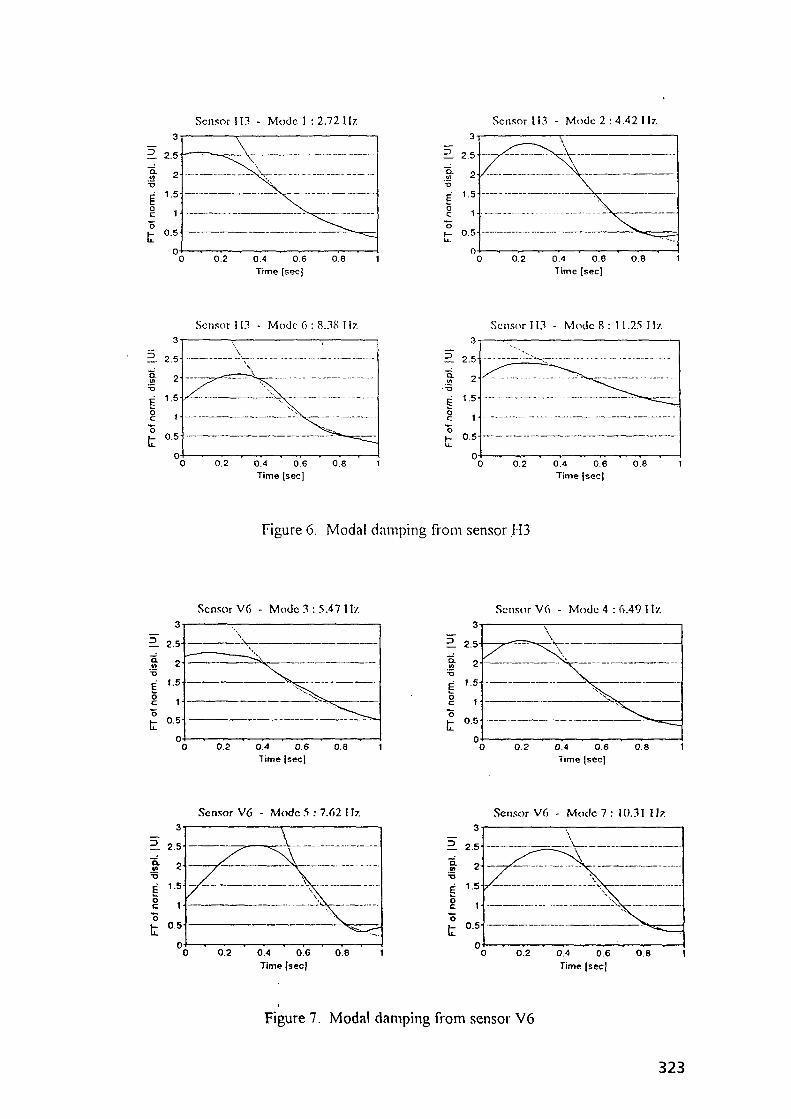
Sensor 113 - Mode 1 : 2.72 II7. Sensor 113 - Mode 2 : 4.42 1 Jr.
zL 2.5
0.4 0.6Time [sec]
0.8 0.4 0.6Time Isec)
zL 2.5"
Scnsor 113 - Mode 6 : 8.38 Hz
0.2 0.4 0.6Time |sec]
0.8
zL 2.5-
1-5-
0 5
Sensor 113 - Mode 8 : 11.25 11/.
0.2 0.4 0.6Time (sec]
0.8
Figure 6. Modal damping from sensor H3
Sensor Vf> - Mode 3 : 3.47 11/.
o.a 0.A 0.6Time (sec]
0.8
Sensor V6 - Mode 4 : 6.49 1 Iz
0.2 0.4 0.6Time (sec]
0.8
Sensor V6 - Mode 5 : 7.62 I \z Sensor V6 - Mode 7 : 10.31 IIT-.
0.4 0.6 0.8Time |secj
0.2 0.4 0.6Time |secj
0 6
Figure 7. Modal damping from sensor V6
323

MODE 1 MODE 2 («••« " 0
'/////A
MODE 3 <s.<? HI) MODF. -I ( M O no
MODE 5 C-62 in) MODE 6
MODE 7 (>°Ji »") MODE 8 ( " • " H I )
Figure 8.' Sketch of modal shapes of the internal structure
324

Figure 9. 3-D Finite Element Model of Siiperstnictiire
325
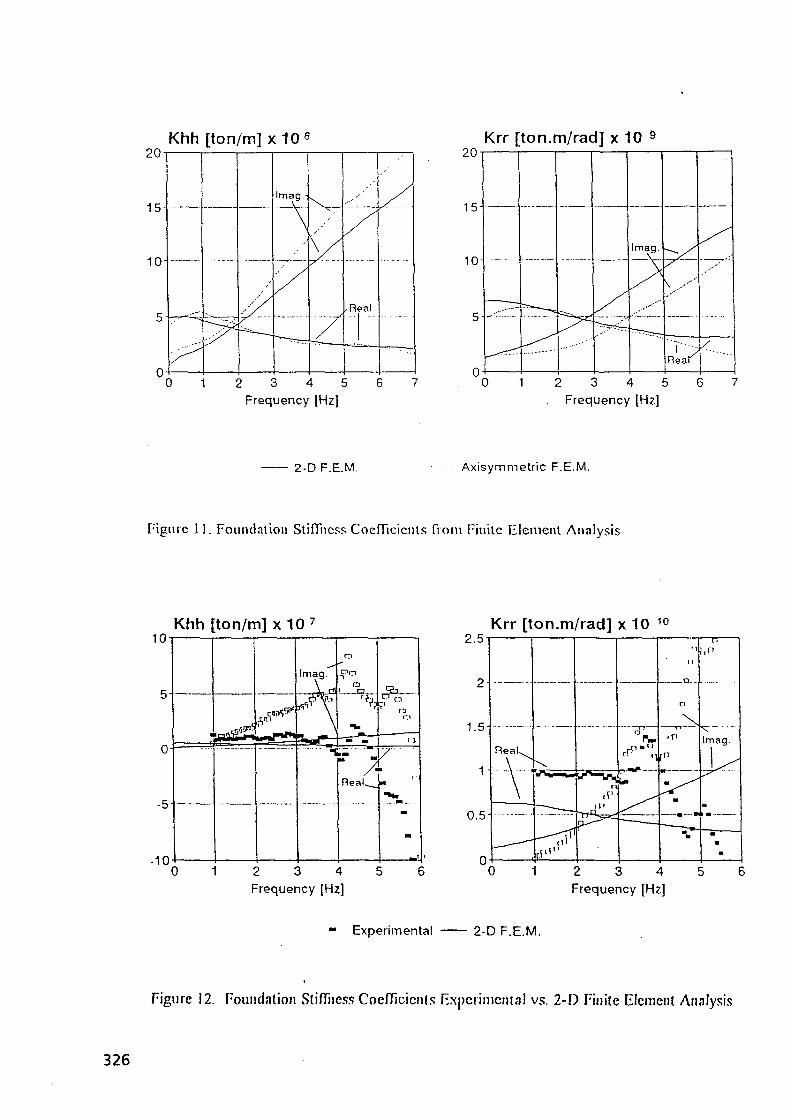
Khh [ ton/m] x 1 0 6
0 1 2 3 4 5 6 7Frequency [Hz]
20
15
Krr [ton.m/rad] x10
i Imag.
\ . • • "
Reat^
0 1 2 3 4 5 6 7Frequency [Hz]
2-D F.E.M. Axisymmetric F.E.M.
Figure 11. Foundation StifTness CoefTicicnts from Finite Clement Analysis
Khh [ton/m] x 10
o 1 2 3 4 5 6Frequency [Hz]
Krr [ton.m/rad] x 10 10
0 1 2 3 4 5 6Frequency [Hz]
- Experimental 2-D F.E.M.
Figure 12. Foundation Stiffness Coefficients Experimental vs. 2-D Finite Element Analysis
326

Mode
X 18.80 mX 0.50 mY 18.80 mAverage
1
2.72
2.92.92.92.9
Natural Frequencies2 3 4
4.42Impulsive Tests
5.47 6.49
[Hz]5
7.62Steady State Tests
4.54.54.54.5
5.95.96.26.0
6.96.9
7.37.37.97.5
6
8.38
9.29.09.19.1
7
10.31
10.710.5
10.6
8
11.25
11.511.411.211.4
Table 1. Measured natural frequencies.
Mode
H 1H 2113H 4H5116V 4V 5V 6V 7
Average
12.72 Hz
22.4522.7423.3822.1221.5324.0322.1422.2825.9023.1122.97
Modal Damping Ratios [%"2 3
4.42 Hz 5.47 Hz
16.5012.5413.9210.5910.9214.1313.3014.6918.2420.2414.51
15.639.9914.5411.479.179.2319.2518.827.4311.5612.71
46.49 Hz
9.916.4010.466.576.855.057.8110.126.377.387.69
57.62 Hz
7.527.937.485.346.495.979.547.3411.329.477.84
68.38 Hz
7.119.467.605.296.4411.5410.189.577.217.488.19
710.31 Hz
6.423.302.303.063.754.906.537.036.654.794.87
811.25 Hz
2.252.691.453.743.536.535.975.725.755.344,30
Table 2. Measured modal damping ratios.
Mode
123456789
Foundation Spring from% Modal Mass Frcq. [Hz]
72.173.51.432.724.432.3417.419.31.47
3.353.364.875.896.667.107.157.30
. 8.37
TestsDirection
YXYYX
Y , XXY
X
Foundation Spring from F.% Modal Mass
70.070.11.711.38.1--
-
Frcq. IHzj
2.462.464.805.165.20
----
E.ModelDirection
YXYXY-
•
-
-
Table 3. Natural Frequencies by 3-D F.E.Model.
NEXT PAGbiS;left BLANK 327

PROCEEDINGS OF SMiRT 13 - POST CONFERENCE SEMINAR 16SEISMIC EVALUATION OF EXISTING NUCLEAR FACILITIES
XA9952663SHAKING TABLE TESTING OF MECHANICAL COMPONENTS
D. Jurukovski, Lj. Taskov, D. Mamucevski, D. PetrovskiInstitute of Earthquake Engineering and Engineering Seismology, Skopje, Republic of Macedonia
ABSTRACT: Presented is the experience of the Institute of Earthquake Engineering and EngineeringSeismology, Skopje, Republic of Macedonia in seismic qualification of mechanical components byshaking table testing. Technical data and characteristics for the three shaking tables available at theInstitute are given. Also, for characteristic mechanical components tested at the Institutelaboratories, basic data such as producer, testing investor, description of the component, testingregulation, testing equipment and final user of the results.
1 INTRODUCTION
The mechanical and the electrical components in a nuclear power plant should be capable ofwithstanding a pre-established seismic environment. This process is known as seismic qualificationRegulatory agencies usually specify the general procedures to follow in seismic qualification
According to the existing practice, a regulatory agency might stipulate seismic-excitationcapability requirements for the equipment used in the plant, or the regulatory agency might specifythe qualification requirements for various categories of equipment. The customer is directlyresponsible to the regulatory agency for adherence to the stipulations. Therefore, the customer ormanufacturer hires the services of a test laboratory which is the contractor for seismic qualificationof the equipment in the plant. A basic step in any qualification program is the preparation of aqualification procedure.
According to IAEA (International Atomic Energy Agency) specifications (guides), thefollowing types of testing can be applied:
1 Type-approval test (fragility test),2 Acceptance test (proof test);3 Low impedance test (dynamic characteristics test),4 Code verification test.
The seismic qualification test is required when failure modes cannot be identified or defined byanalysis or earthquake experience. Direct qualification by testing employ type-approval andacceptance tests. Low impedance (dynamic characteristics) tests are normally used to identifysimilarity or verify or help to develop analytical models. Method of testing depend on required input,
329

weight, size, configuration and operating characteristics of the item, plus characteristics of theavailable test facility.
2. TESTFNG FACILITIES OF THE INSTITUTE
The experimental investigations of the seismic and vibratory withstand of different types of me-chanical equipment were performed in the last fifteen years in the Institute of EarthquakeEngineering and Engineering Seismology, University "St. Cyril and Methodius", Skopje. Theinvestigations were performed for known end-user and the selection of the standards, criteria andrequirements was made by the Investor, Producer and End-user.
Most of the investigation programs were based on the former Soviet Union (GOST and OTT82/87) standards, but a lot of the tested prototypes were tested based on the state of the anmethodologies in the experimental mechanics A lot of designer's dilemmas or mathematicaladjustments were solved after experimental investigations.
This type of testing required usage of a sophisticated testing equipment, and application ofadvanced methods.
At the Institute of Earthquake Engineering and Engineering Seismology, three shaking tablesare installed:
biaxial shaking table;uniaxial shaking table;electromechanical shaking table.
The short review of the IZIIS testing facilities is presented herewith.
2.1 BIAXIAL SHAKING TABLE (Figure 1)
• Size:• Mass of the table:• Mass of the tested specimen.• Height of the tested specimen:• Type of existing equipment:
• Type of vibrations:• Dynamic load capacity:• Frequency band:• Directions (axis):• Dynamic performances:
Horizontal directionStroke:Velocity:Acceleration:
5 m x 5 m40000 kg40000 kg9 metersServo controlled electro-hydraulicequipmentRandom, sinusoidal, artificial wave forms800 kN0.1 -70 Hz2, horizontal and vertical
± ! 25 mm±75 cm/s± 2 g maximum(depending on the mass of the specimen)
330
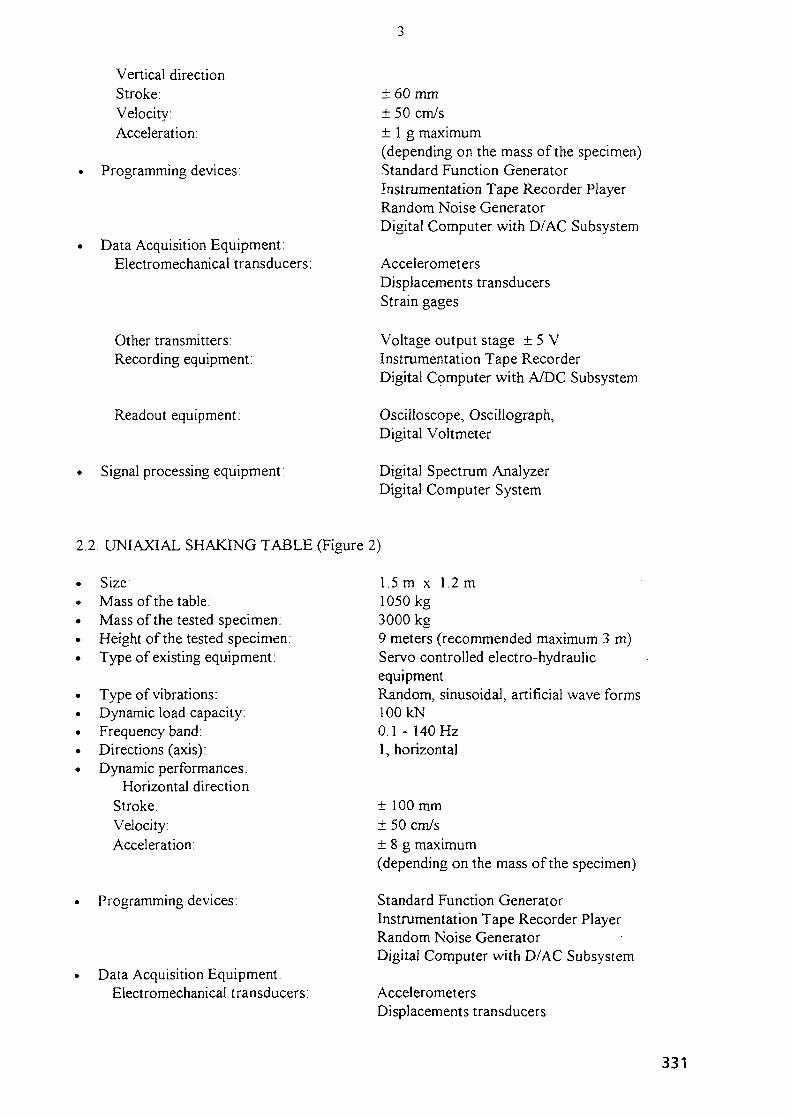
Vertical directionStroke:Velocity:Acceleration:
Programming devices:
Data Acquisition Equipment:Electromechanical transducers:
Other transmitters:Recording equipment:
Readout equipment:
Signal processing equipment:
±60 mm± 50 cm/s± 1 g maximum(depending on the mass of the specimen)Standard Function GeneratorInstrumentation Tape Recorder PlayerRandom Noise GeneratorDigital Computer with D/AC Subsystem
AccelerometersDisplacements transducersStrain gages
Voltage output stage ± 5 VInstrumentation Tape RecorderDigital Computer with A/DC Subsystem
Oscilloscope, Oscillograph,Digital Voltmeter
Digital Spectrum AnalyzerDigital Computer System
2.2. UNIAXIAL SHAKING TABLE (Figure 2)
Size:Mass of the table:Mass of the tested specimen:Height of the tested specimen.Type of existing equipment:
Type of vibrations:Dynamic load capacity:Frequency band:Directions (axis):Dynamic performances:
Horizontal directionStroke:Velocity:Acceleration:
Programming devices:
Data Acquisition EquipmentElectromechanical transducers:
1.5 m x 1.2 m1050 kg3000 kg9 meters (recommended maximum 3 m)Servo controlled electro-hydraulicequipmentRandom, sinusoidal, artificial wave forms100 kN0.1 - 140 Hz1, horizontal
± 100 mm± 50 cm/s± 8 g maximum(depending on the mass of the specimen)
Standard Function GeneratorInstrumentation Tape Recorder PlayerRandom Noise GeneratorDigital Computer with D/AC Subsystem
AccelerometersDisplacements transducers
331

Strain gages
Other transmitters:Recording equipment:
Readout equipment:
Signal processing equipment:
Voltage output stage ± 5 VInstrumentation Tape RecorderDigital Computer with A/DC Subsystem
Oscilloscope, Oscillograph,Digital Voltmeter
Digital Spectrum AnalyzerDigital Computer System
2.3. SMALL ELECTROMECHANICAL SHAKING TABLE
Size:Mass of the table:Mass of the tested specimen:Height of the tested specimen.Type of existing equipment:Type of vibrations:Dynamic load capacity.Directions (axis).Dynamic performances:
Horizontal directionStroke.Acceleration:
Vertical directionStroke:Acceleration:
Data Acquisition Equipment:Electromechanical transducers.
Other transmitters:
Recording equipment:
Readout equipment:
Signal processing equipment:
50 cm x 50 cm1000 kg (total mass without foundation)50 kg3 meters (recommended height 1 m)Three Phase Asynchronous MotorSinusoidal or Sinusoidal SweepinglOOkN2, horizontal and vertical
± 15 mm (max. for low frequency band)± 8 g maximum(depending on the mass of the specimen)
± 15 mm (max. for low frequency band)± 8 g maximum(depending on the mass of the specimen)
Accel erometersDisplacements transducersStrain gages
Voltage output stage ± 5 V
Instrumentation Tape RecorderDigital Computer with A/DC Subsystem
Oscilloscope, Oscillograph,Digital Voltmeter
Digital Spectrum AnalyzerDigital Computer System
332

The Institute staff have developed the software package for processing control, dataacquisition, signal processing and functioning performance monitoring. The different flexiblesolutions provide a lot of facilities to satisfy all the testing criteria and requirements prescribed in theIAEA regulatory guides, IEEE Standards and recommendations, IEC testing procedures, and a lot ofdomestic documents related to seismic and vibratory testing of the equipment.
3. SELECTED TESTED COMPONENTS
Different types of mechanical components have been tested on the shaking tables installed atthe Institute of Earthquake Engineering and Engineering Seismology, Skopje.
In this review, a summary on the testing of four types of mechanical components are presented.The selected types of equipment are:
• valves;• electromechanical driving gears,• large scale mechanical shutters;
• base isolating components.
3.1. LARGE SCALE VALVES
Producer. "ENERGOrNVEST" - Sarajevo, Bosnia and Herzegovina
Testing Investor: "ENERGOINVEST" - Sarajevo, Bosnia and Herzegovina
Description: The tested large scale valves are primarily intended for usage in nuclear powerstations produced by the Soviet Union companies. These "open - close" devices are designed forpiping installations conducting low pressure fluids (usually water and air). Up to 6 different modelswere tested. However, some models were tested in two or three versions.
The tested basic models were as follows: v JZZ~.T
Sluice valve DU-600Sluice valve DU-400Valve DU-150Valve DU-100Regulatory valve DN100 PN200Regulatory valve PN25 ND300
Scheme of DU-100 Sluice Valve
333

All the tested models were fully assembled with electromechanical driving gears and associatedpower transferring mechanisms. The tests were performed for opened and closed valve. Themounting of the valves on the shaking table was made ideally stiff, using two short segments ofconvenient pipes.
Selected regulations: The investigation procedure was conceptualized by the former SovietUnion regulations referred to as OTT-82 and OTT-87 (General Technical Requirements published1982 and 1987).
Testing equipment: All the tests are carried out on the uniaxial shaking table. A digitalcomputer system with D/AC and A/DC subsystem is used for seismic input data pre-processing,process control, data acquisition and preliminary data processing. Up to 32 high speed dataacquisition channels are used to collect data on accelerations, displacement and strain on the carrierstructure, the supports and the active parts and mechanisms forming the tested assembled specimen.The acquired data processed in the time and frequency domain (Fourier spectra)
Test results: All the tests were performed in two orthogonal directions: longitudinal andtransversal. In the first phase, the dominant or the first natural frequencies for both directions, at allpossible different states of the tested assemblage, were defined. In the second phase, sinusoidalvibrations with duration of 20sec and an acceleration amplitude of 3g were applied in bothdirections, at all possible states of the tested assemblage. In each case, the tests were performed:
• under resonant conditions, if subjected natural frequency was in the range from 20Hz to 50Hz• under frequency of 50Hz , if the subjected natural frequency was higher than 50Hz.
If the natural frequency of the tested specimen was lower than 20Hz, the tested specimen doesnot satisfy the basic criteria and such a specimen was tested again after improvements made in thefactory. If the tested specimen lost its function during the testing, such a model had to be modified inthe factory and tested again. Accelerations, displacements and strain-stress distribution weremeasured. The final data processing was performed to help the designers improve the designingprocedure.
Final user of the results: All the tested products from this series were primarily intended forusage in nuclear power stations and produced by the Soviet Union producers and Eastern Europeco-producers.
3.2. ELECTROMECHANICAL DRIVING ASSEMBLAGES
Producer: "ENERGO1NVEST" - Sarajevo, Bosnia and Herzegovina
Testing Investor: "ENERGOINVEST" - Sarajevo, Bosnia and Herzegovina
Description: The electro mechanical driving assemblages with different power capacity anddifferent models were tested applying similar testing procedures. The following basic models weretested:
EMSTN 25-16-C1-PEMSTN 40-16-C1-PEMPN 100-10-C-00/KK-0-6-1-9-00EMPN 250-10-C-00/KK-0-6-1-9-00
334

EMPNEMPNEMPNEMPNEMPN
320-16-C-P400-16-C-P800-16-C-P1000-16-C-P2000-16-C-P
Simplified Scheme of Electromechanical Driving Gear
Some models were tested in two or three versions when the first version did not satisfy thetesting criteria. The nominal power of the tested models varied from 25Nm to 2000Nm. All thetested models are primarily designed for usage in nuclear power installations as driving part inswitching or regulations valves. Fully assembled driving gears were tested. The tests were performedby simulation of real loads, constant or variable, ranging between 0 to 125% from the nominal(declared) power capacity.
Selected regulations: The investigation procedure was conceptualized by the former SovietUnion regulations referred to as OTT-82 and OTT-87 (General Technical Requirements published1982 and 1987).
Testing equipment: All the tests are carried out on the uniaxial shaking table. A digitalcomputer system with D/AC and A/DC subsystem is used for seismic input data pre-processing,process control, data acquisition and preliminary data processing. Up to 32 high speed dataacquisition channels are used to collect data on accelerations, displacement and strain on the carrierstructure, the supports and the active parts and mechanisms forming the tested assembled specimen.The acquired data processed in the time and frequency domain (Fourier spectra).
Test results: All the tests were performed in three orthogonal directions of the tested specimenIn the first phase, the dominant or the first natural frequency was defined for each directions and forall the possible states of the driving gear:
• out of operation• under operation without load• under operation with a load
In the second phase, sinusoidal vibrations with duration of 20sec and acceleration amplitude of8g applied in all the directions and under all possible states. In each case, the test was performed asfollows:
• under resonant conditions, if the subjected natural frequency was in the band from 20Hz to 50Hz• under frequency of 50Hz, if the subjected natural frequency was higher
335

If the natural frequency of the tested specimen was lower than 20Hz, the tested specimen doesnot satisfy the main criteria and such specimen was tested again after improvements done in factory.In case the specimen lost its functioning capabilities during the test, such a model had to be modifiedin the factory and tested again.
Final user of the results: All the tested products from this series were primarily intended forusage in nuclear power stations and produced by tne Soviet Union producers and Eastern Europeco-producers.
3.3 "OPEN - CLOSE" DEVICE FOR LOW PRESSURIZED LARGE SCALE PIPINGINSTALLATION MODEL "KZOK - 1200"
Producer: "MIN" - Nis, FR Yugoslavia
Testing Investor: "MIN" - Nis, FR Yugoslavia
Description: The device "KZOK - 1200" (prototype model was tested) is intended for "open -close" functions in low pressurized large scale (diameter 1200 mm) piping installations in nuclearpower stations. The main parts of the tested device are shown on the scheme.
1. base2. "open - close" device body3 closer4. gearing device5. drive
Scheme of KZOK - 1200 Prototype Model
The "open - close" functions could be performed manually or automatically supported by anelectrically driven gear.
Selected regulations: The investigation procedure was conceptualized by the former SovietUnion regulations referred to as OTT-82 and OTT-87 (General Technical Requirements published1982 and 1987).
Testing equipment: All the tests are carried out on the biaxial shaking table. A digital computersystem with D/AC and A/DC subsystem is used for seismic input data pre-processing, processcontrol, data acquisition and preliminary data processing. Up to 32 high speed data acquisitionchannels are used to collect data on accelerations, displacement and strain on the carrier structure,the supports and the active parts and mechanisms forming the tested assembled specimen. Theacquired data processed in the time and frequency domain (Fourier spectra).
336

Test results: The prototype model was tested in two positions:
• opened, free closer• closed, fixed closer
The testing procedure was realized in two phases. In the first phase, the natural frequencieswere realized for all the six different states (two positions, three directions). In the second phase, thetesting was performed by sinusoidal vibration with a duration of 20sec and an amplitude of 3g in thehorizontal direction and 2g in the vertical direction. The amplitudes were in the geometrical center ofthe models' bodies (or more precisely, in the center of the pipe segment). According to the technicalrequirements, the tests were performed under resonant conditions and consequently, a differentfrequency was applied in each case. Also, in each case, the most critical frequency was applied sincethe tested model consisted of three dynamic subsystems. The dynamic behavior of the model wasmonitored by recording of acceleration and strain time histories. The acceleration time histories areinteresting from the driving-gear functioning view point and from the aspect of identification of thedynamic subsystems in the assembled tested model. The strain-stress time histories are important formonitoring the stress distribution at characteristic points and checking of some design considerationsand approximations. During the tests, strengthening was performed, especially at the driving gearinterconnections
Final user of the results: The testing investor requested an answer to the following twoproblems:
• verification of the applied design methodology and checking of the considered solutions andapproximations during designing as well as manufacturing of the prototype
• checking of the realized model capabilities making a comparison with OTT-82 and OTT-87criteria
3 4 NEEDLE SHAPED VALVE TYPE Pp 160 Tp 100
Producer: "PRVA ISKRA" - Baric, Belgrade, FR Yugoslavia
Testing Investor: "PRVA ISKRA" - Baric, Belgrade, FR Yugoslavia
Description: The needle shaped valves type Pp 160 Tp 100 are small size devices with manualcontrol only. In nuclear power installations, these devices are used in small-scale piping installationsof secondary systems. The automatic control of functioning is not considered. On the scheme, themain dimensions of the tested specimens are presented. Tested were three identical specimens Thetested specimens were mounted on ideally stiff supports (plates mounted on the shaking table).
337

10
4)70
<S>>
I
26
Scheme of Pp 160 Tp 100 Needle Shaped Valve
Selected regulations: The investigation procedure was conceptualized by the former SovietUnion regulations referred to as OTT-82 and OTT-87 (General Technical Requirements published1982 and 1987).
Testing equipment: The tests were performed on the small electromechanical shaking table.This shaking table can generate sinus or sinus sweeped vibration in a frequency band from lHz to7Hz and from 7Hz to 77Hz. The vibrations can be generated in horizontal and vertical directionsTwo vibrations can be generated in horizontal and vertical direction. Two accelerometers are usedfor measurement of input (excitation) vibrations and output (response) vibrations A two channelspectrum analyzer was used for measurement and analysis of vibratory accelerations.
Test results: Each specimen was tested in two positions.
• opened• closed
At each position, the tests were performed in three orthogonal directions. In all the six cases,the same testing procedure was applied. Anticipated in the first phase was definition of the naturalfrequency. Using the shaking table in the frequency domain from lHz to 70 Hz, no natural frequencywas detected. The first natural frequency was detected in all six cases, using pulse excitation and
338

11
spectral analysis of the free damped oscillations of the tested specimen. All the detected naturalfrequencies were greater than lOOHz. In the second phase, all the tests were performed at afrequency of 20Hz and 30Hz with an acceleration amplitude of 3g in the horizontal and 2g in thevertical direction according to the regulatory criteria and because all the natural frequencies werehigher than 3 OHz.
Final user of the results: The production of this type of valves was ordered by the SovietUnion manufacturers specialized in equipment for nuclear power stations.
3.5. STOCK BRIDGE DAMPERS FOR HIGH VOLTAGE CONDUCTORS ANDDISTRIBUTION LINES
Producer: "EMO" - Ohrid, Republic of Macedonia
Testing Investor: "EMO" - Ohrid, Republic of Macedonia
Description: The stock bridge damper for high voltage conductors and distribution lines wastested in several versions and several sizes. The role of this device is to attenuate the ambientvibrations of high voltage conductors. Areal and spatial dampers were tested. Each version,representing a separate physical model was tested independently, without any conductor. The testswere performed on the small electromechanical shaking table. Some selected models were testedmounted on a conductor. The programmable vibrations of the conductor were generated by thebiaxial shaking table.
i—i ' , , /•• -
Simplified Scheme of STOCK BRIDGE Damper
Selected regulations: The applied methodology was developed following some industrialpractice and standards for testing of such type of an equipment.
339

12
Testing equipment: All the tests with a conductor are carried out on the biaxial shaking table.A digital computer system with D/AC and A/DC subsystem is used for seismic input data pre-processing, process control, data acquisition and preliminary data processing. Up to 32 high speeddata acquisition channels are used to collect data on accelerations, displacement and strain on thecarrier structure, the supports and the active parts and mechanisms forming the tested assembledspecimen. The acquired data processed in the time and frequency domain (Fourier spectra). All thetests without a conductor are carried out on the small electromechanical shaking table. The digitalshaking table can generate sinus and sinus sweeped vibration in a frequency band from lHz to 7Hzand from 7Hz to 77Hz. The vibrations can be generated in horizontal and vertical direction. Twoaccelerometers are used for measurement of input (excitation) vibrations and output (response)vibrations. A two channel spectrum analyzer was used for measurement and analysis of vibratoryaccelerations.
Test results: For each tested model, the natural frequency, damping ratio and vibration shapemode were determined using sinusoidal vibrations. The mechanical impedance was calculated usingsome empirical formulae. The dynamic behavior of a segment of a conductor without a damper andwith a damper was investigated using different type of programmable vibrations. Comparativeanalyses were performed to identify the influence of the mounted damper.
Final user of the results: The testing investor defined two tasks:
• creation of a base for mathematical modeling of different types of dampers• preparation of a data base for marketing purposes, especially for export jobs in Iran and other
Asian and Arabic countries
3.6. BASE ISOLATION ELEMENT FOR DIESEL GENERATORS AND ENGINES TYPE3.08 140 000
Producer: "JUGOTURBINA" - Karlovac, Croatia
Testing Investor: "JUGOTURBINA" - Karlovac, Croatia
Description: The base isolation element is primarily intended for base isolation of dieselgenerators and engines in the ships. However, it could also be used for other base isolation purposesThe element represents a rubber based base isolation product. The minimal number of base isolationelements is four. For testing purposes, a minimal configuration consisting of four identical elementswas used Elements of different hardness were tested (45 SH, 55 SH, 65 SH). An ideally stiff frameloaded by a continuous load was used as a tested specimen isolated by four base isolating elementsSome tests were performed for each element taken separately and some were executed for the set offour elements.
Selected regulations: The producer defined the testing requirements based on Lloyd's RegisterRegulations
Testing equipment: All the tests are carried out on the biaxial shaking table. A digital computersystem with D/AC and A/DC subsystem is used for seismic input data pre-processing, processcontrol, data acquisition and preliminary data processing Up to 32 high speed data acquisitionchannels are used to collect data on accelerations, displacement and strain on the carrier structure,the supports and the active parts and mechanisms forming the tested assembled specimen. Theacquired data processed in the time and frequency domain (Fourier spectra) To determine the
340

13
dynamic characteristics, a dynamic electrohydraulic actuator with programmable movement wasused. To define the static characteristics, a quasi-static actuator with programmable stroke was used
Test results: A static characteristic represents a ratio between load and deflection. In thehorizontal direction, a set of four elements connected by a stiff frame was used. The characteristicswere defined for three different axial pre-loads: 30kN, 40kN and 50kN per element. The maximaldeflection was ±40mm. In the vertical direction, a static characteristic is determined in each elementindividually, for maximal axial load of 70kN.
3.7. HYDRAULIC. SNUBBER TYPE HA - 500kN
Producer: "GOSA" - Belgrade, FR Yugoslavia
Testing Investor: "GOSA" - Belgrade, FR Yugoslavia
Description: The hydraulic snubbers from the HA series are designed as energy absorbingelements primarily designed for usage in railway transports and some industrial installations. Aprototype was tested. The tested specimen is a bi-stable device. In the first state (low velocitymovement), the piston of the snubber is free and only friction forces provide some resistance againstthe external axial load. If the movement becomes with a velocity greater than the critical one, thepiston becomes locked and further movement is not possible.
Selected regulations: Not specified. Some design considerations, theoretical and empiricalrequirements and criteria were the basis for the investigation program.
Testing equipment: Electrohydraulic dynamic and quasi-static actuators with programmablemovement were used for testing of the hydraulic snubbers.
Test results: The investigations were performed in two main phases. In the first phase, themethodology for selecting of a set of a valve and spring was experimentally developed. The task wasto establish criteria regarding the compatibility between the valve and the spring to obtain a doubleended (symmetrical) hydraulic cylinder. In the second phase, the parameters of the snubber wereexperimentally defined: the friction load, the critical velocity and the nominal load.
Final user of the results: The testing investor (GOSA Institute for Research and Development)was the user of all the experimental results.
4 CONCLUSIONS
In the Dynamic Testing Laboratory at the Institute of Earthquake Engineering and EngineeringSeismology, University "St. Cyril and Methodius", Skopje, Macedonia in the past fifteen years manymechanical and electrical components for NPP as well as for other special facilities have been testedunder seismic and various dynamic loads. From the gathered experience and existing world practice,seismic qualification of mechanical and electrical components primarily depends on the threefollowing testing conditions.
Definition of the seismic input at the location where the component is installed. The seismicinput should be determined to represent actual seismic action from the point of view of frequencyrange of interest, amplitudes and time duration. The frequency range should bound the most
341

14
influenced frequencies of the components. In our experience, the seismic or dynamic input wasdetermined by the manufacturers or end-users of components.
It is obvious that accurate experimental simulation of the determined seismic or dynamic inputhas to be provided. It means that the simulated input on the shaking table has to be done withoutfrequency or amplitude modifications.
The outcome of seismic qualification obtained by testing, is mostly influenced by the criteria ofacceptance. The criteria of acceptance should be coordinated decisions from the point of view ofdefinition of functional and structural acceptance. In the existing practice functional acceptance isusually estimated after the testing which means off- line. This should be a joint effort of experts fromproducers, users, regulatory bodies and testing laboratories.
5. REFERENCES
1. IEEE 279-1971 Criteria for Protection of Systems for Nuclear Power Generating Stations(ANSI/IEEE) (REAFF 1978) (Revision of IEEE Std 279-1968)
2. IEEE 323-1983 Qualifying Class IE Equipment for Nuclear Power Generating Stations(Revision of IEEE Std 323-1974)
3. IEEE 336-1985 Installation, Inspection and Testing Requirements for Power Instrumentationand Control Equipment at Nuclear Facilities (Revision of IEEE Std 336-1980)
4. IEEE 344-1975 Recommended Practices for Seismic Qualification of Class IE Equipment forNuclear Power Generating Stations (ANSI/IEEE) (Revision of IEEE Std 344-1971)
5. IEEE 3 82-1980 Standard for Qualification of Safety-Related Valve Actuators (Revision ofIEEE Std 382-1972)
6 IEEE 420-198 2 Standard for the Design and Qualification of Class IE Control Boards,Panels and Racks Used in Nuclear Power Generating Stations
7. IEEE 467-1980 Standard Quality Assurance Program Requirements for the Design andManufacture of Class IE Instrumentations and Electric Equipment for Nuclear PowerGenerating Stations
8. IEEE 497-1981 Standard Criteria for Accident Monitoring Instrumentation for NuclearPower Generating Stations (ANSI/IEEE)
9. IEEE 600 Draft - Trial Use Standard Requirements for Organizations that ConductQualification Testing of Safety Systems Equipment for Use in Nuclear Power GeneratingStations (ANSI/IEEE)
10. IEEE 603-1980 Standard Criteria for Safety Systems for Nuclear Power Generating Stations(Revision of IEEE Std 382-1972)
11. IEEE 627-1980 Standard for Design Qualification of Safety Systems Equipment Used inNuclear Power Generating Stations (ANSI/IEEE)
12. IEEE Std 693-1984 IEEE Recommended Practices for Seismic Design of Substations, TheInstitute of Electrical and Electronic Engineers, Inc.
13. Nuclear Regulatory Commission, Regulatory Guide 1.100, Revision 1, 1977. SeismicQualification of Electronic Equipment for Nuclear Power Plants
14. IAEA Safety Guides, Safety Series No. 50-SG-S2 Seismic Analysis and Testing of NuclearPower Plants, A Safety Guide, IAEA, Vienna 1979
15. IEC Publication 68-2-6 Basic Environmental Testing Procedures; Test and Guidance;Vibration (Sinusoidal), International Electronical Commission, 1982
16. IEC TC 50 SC 50A Environmental Testing; Shock and Vibration Tests, InternationalElectronical Commission, 1982
17. IEEE Std 501-1978, IEEE Standard Seismic Testing of Relays, The Institute of Electric andElectronic Engineers
18 INTERATOMENERGO - Moscow, General Technical Requirements OTT-H2 and OTT-H7
342

15
19. IAEA Safety Series No. 50-SG-D 15 Seismic Design and Qualification for Nuclear PowerPlants, A Safety Guide, IAEA, Vienna 1992
20. Atomic Energy Commission, Regulatory Guide 1.60, Design Response Spectra for SeismicDesign of Nuclear Power Plants, 1973
21. Atomic Energy Commission, Regulatory Guide 1.29, Revision 1, Seismic DesigtiClassification
22. Lloyd's Register festing Manuals
Figures
343
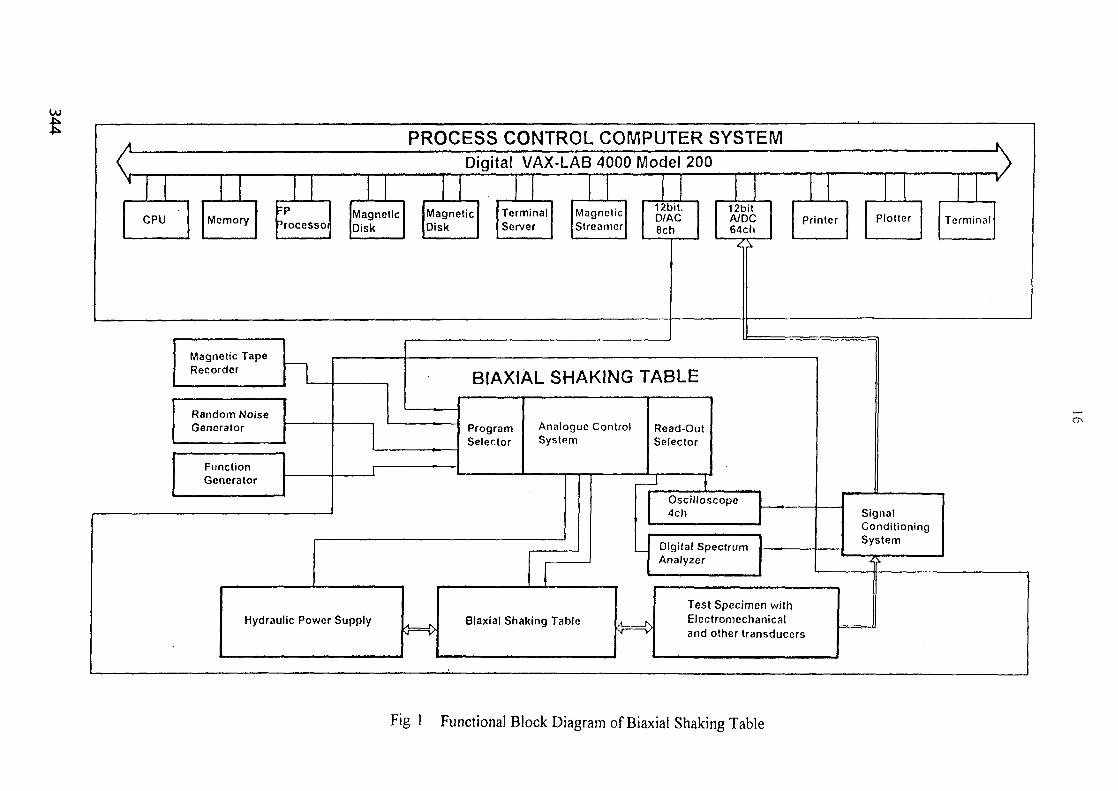
PROCESS CONTROL COMPUTER SYSTEM
CPU MemoryZP3rocessoi
MagneticDisk
Digital
MagneticDisk
VAX-LAB
TerminalServer
4000 Model
MagneticStreamer
200
12bit.D/AC8ch
12bitA/DC64ch
Printer Plotter Terminal
Magnetic TapeRecorder
Random NoiseGenerator
BIAXIAL SHAKING TABLE
FunctionGenerator
Analogue ControlSystem
Read-OutSelector
Oscilloscope4ch
Digital SpectrumAnalyzer
SignalConditioningSystem
Hydraulic Power SupplyTest Specimen withElectromechanicaland other transducers
Fig I Functional Block Diagram of Biaxial Shaking Table
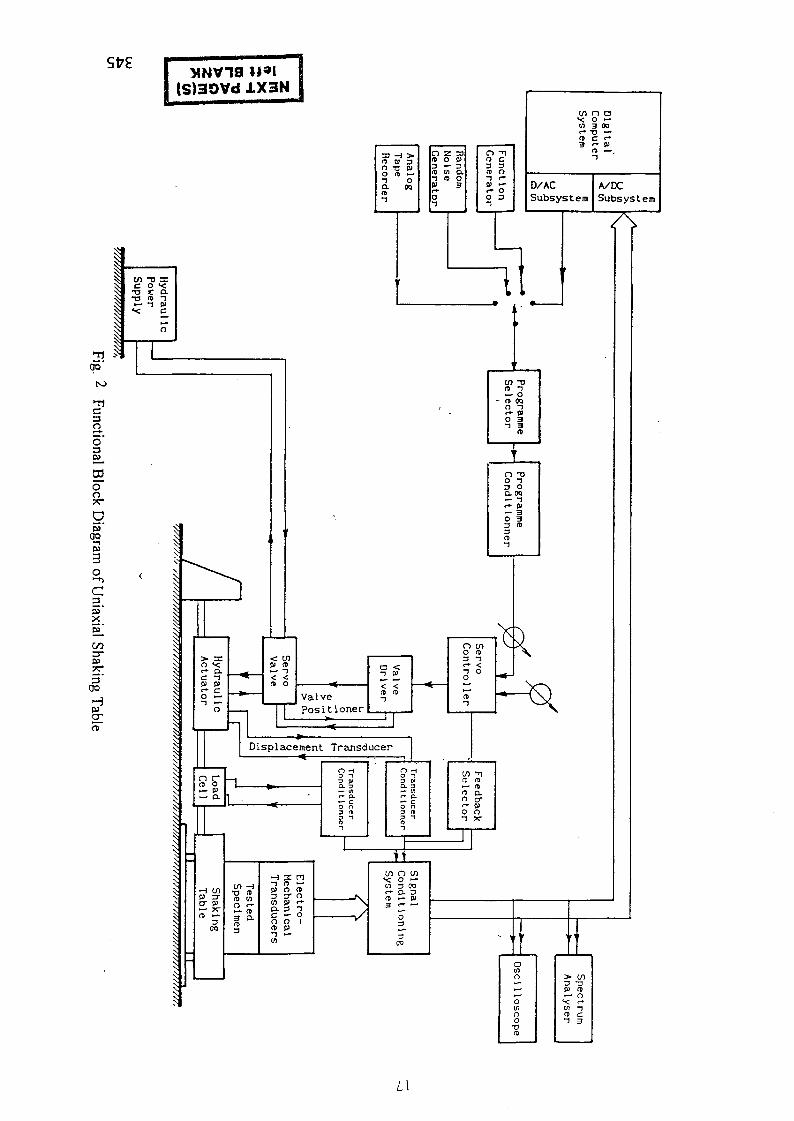
XNV19 H»l(S)30Vd 1X3N
(Tl fij 3
o o -a->
00
n z 33 - Dre in CLT O O
o-1
o(»Dre
IV
o
a
-ncnet
3
I
> n •v; o —11 3»<~ -o —O C r»3 •- B>
D/ACSubsystem
A/DCSubsystem
7>
3O
5'CO
oo
03
CO
O
G3_
5'C/3
CD
oa
toa;a
Displacement Transducer*
L\

1 XA9952664
PROCEEDINGS OF SMIRT 13 - POST CONFERENCE SEMINAR 16SEISMIC EVALUATION OF EXISTING NUCLEAR FACILITIES
EXPERIMENTAL AND COMPUTER ANALYSES OF CONTROL ROD DRIVE SYSTEMSSEISMIC CAPACITY.
Victor V. Kostarev,Victor N. Abramov,Alexis M. Berkovski,Peter. S. Vasiliev,Alexander J. Schukin,
CKTI-Vibroseism (CVS), St. Petersburg, Russia.
ABSTRACT: The experimental and computer analyses of the 1/4 scale Control Rod Drive System(CRDS) model of WER-440 reactor has been carried out. The experimental study has been under-taken on CVS 20 ton's capacity shaking table with modeling operability of CRDS during earth-quake and operational vibration. A special PC computer program has been developed for evaluationof CRDS seismic and vibration margins. The program enables estimation of different nonlinear ef-fects in bearings and gaps of CRDS including shocks and friction that highly influence on dynamiccapacity of CRDS. The results of these investigations are presented in this paper.
1. INTRODUCTION
' The WER-440 Control Rod Drive System consists of the control rods and related mechanicalcomponents which provide the means for mechanical movement. The main special feature of W E RCRDS is the length of over 10 meter's height construction with a number of bearings and gaps withrelatively small clearances. Such construction suggests some sensitivity of the CRDS to dynamicand seismic impacts during operational of its safety functions.
According to NUREG - 0800 Standard Review Plan, Section 3.9.4 General Design Criteria 26and 27 require that the CRDS provide one of the independent reactivity control systems. The rodsand the drive mechanism shall be capable of reliably controlling reactivity changes either underconditions of anticipated normal plant operational occurrences, or under postulated accident condi-tions. The same idea is included in demands of Russian Code PNAE G-5-006-87, 1987.
A positive means for inserting the rods shall always be maintained to ensure appropriate marginfor malfunction, such as stuck rods. Since the CRDS is a system important to safety and portions ofthe CRDS are a part of the reactor coolant pressure boundary (RCPV), General Design Criteria 1, 2,14, and 29 and 10 CFR Part 50, p. 50.55a, require that the system shall be designed, fabricated andtested to qualify standards commensurate with the safety functions to be performed. This is to assurean extremely high probability of accomplishing the safety functions either in the event of anticipatedoperational occurrences to withstand the effects of postulated accidents and natural phenomena suchas earthquakes.
The W E R CRD Systems using the above mentioned criteria mean confirmation of extremelyhigh probability of CRDS functioning in modes of AR (normal operational regulation of reactorreactivity) and AZ (safety function in postulated accidents including earthquakes). The main inter-est belongs, of course, to AZ mode when W E R CRDS is working in conditions of rod free gravityfall inserting and malfunction and stuck rod can occur due to dynamic impact.
347

A number of W E R natural scale CRDS shaking table tests shows the real possibility of stuckrod occurrences during seismic wave excitation [ 1 ].
At the same time it was rather hard to get the general objectives and regularities due to highlycomplicated structure of W E R CRDS and multiple nonlinear effects in CRDS bearings and gapsduring dynamic excitation.
That is why the new investigation of W E R CRDS seismic capacity has been undertaken in thestream of IAEA efforts for Seismic Upgrading of W E R type NPPs.
The current investigation consists of two main parts:a) Study of W E R - 440 CRDS 1/4 scale model seismic and vibration capacity on the CVS 20
ton's shaking table;b) Computer analyses of CRDS dynamic behavior under seismic and vibration loads by means of
special developed program for PC and comparative study of experimental and analysis results.
2. EXPERIMENTAL STUDY.
2.1. Description of the Test Rig and Measurement System.
The experimental investigations of W E R - 440 CRDS 1/4 scale model seismic and vibrationcapacities have been carried out on the CKTI-Vibroseism 1-D horizontal Shaking Table, specifi-cally designed for all kinds of dynamic testing, including seismic loading of the full scale CRDS forWER-440 and WER-1000 MWt reactors, Figure 1.
The CVS shaking table has the following technical characteristics:- maximal dynamic pushing force 120 kN (12tons);- mass of foundation more than 250 tons;- mass of vibration platform 2.0 tons;- dimensions of vibration platform for equipment
installation 3.0 x 1.5m;- height of undertable space for samples installa-
tion more than 5m;- maximal acceleration of unloaded shaking table
(without samples) 15g;- maximal mass of testing equipment with lg ac-
celeration level 10 tons;- maximal overturning moment 600 kNm;- frequency range 0 (static), 0.05 - 100 Hz;- maximal amplitude of displacements ±90 mm;-resonant frequency of the shaking table more than 40 Hz;- errors in frequency setting less than 1%;- coefficient of nonlinear distortion in displace-
ment setting (0,05-20 Hz) less than 10%.
The shaking table Control System consists of PC with Analogue-Digital-Analogue Converters(ADC/DAC) and permits to set the following modes of operation and testing:
- sinusoidal sweep excitation;- static displacements of the table;- multiharmonic excitation;- random dynamic and seismic excitation.
348

The vibration measurements during the CRDS testing on shaking table have been carried out byComputer Multichannel Complex "MERA" and "Bruel & Kjer" instrumentation, Figure 2.
2.2. The CRDS Model.
The main goal of current investigation was to determine the nonlinear dynamic behavior ofCRDS and make an attempt to create reliable analytical model and to verify the computer programand results of analyses on this base. From this point of view the CRDS model has to reflect all im-portant peculiarities and dynamic properties of CRDS that can influence on seismic and vibrationcapacity of CRDS. To achieve this task is not necessary to make a full copy of CRDS but only toreproduce the main inertia, material, stiffness, gap and other properties of CRDS so as interaction ofinternal elements.
Usually for model seismic testing of structures on shaking tables is used the Simple GeometricPrinciple. The specific side of the CRDS modeling is the necessity of taking the acceleration modelcoefficient equal to "1" for modeling the operability of CRDS during accident situations with AZmode free insertion of the rod (rack in W E R case).
The tested structure presents the 0.25 scale geometric model of VVER - 440 Paks NPP CRDSARK like prototype.
The main characteristics and model scales are the following:- time 0.5;- material 1 -0;
.-linear scale 0.25;- displacement 0.25;- frequency 2.0;- velocity 0.5;-mass 0.015625.
2.3. Methodology.
Obviously, the main role in CRDS stuck rod and insertion time in AZ mode under dynamic im-pacts belong to horizontal excitation. The influence of vertical excitation is practically negligible incomparison with horizontal one. That is why the testing of CRDS model has been carried out onlyunder horizontal random dynamic excitation, scaled to demand intensity and duration in accordancewith model coefficients of acceleration and time. The Paks NPP Design Spectra (elevation 18 m)has been used for developing of model synthetic TH process for testing and analyses of CRDS. Theduration of model excitation was equal to 10 seconds and ZPA level has been varied from 0 up to0.72g.
The Figure 3 shows the four different seismic wave displacements of the model seismic excita-tion on the shaking table.
The main criteria of CRDS operability and at the same time the CRDS seismic capacity is thetime of CRDS rack inserting (free fall) in AZ mode which is limited for natural scale CRDS from8.5 up to 12.8 seconds, that corresponds the average velocity of the rack insertion about 300 - 200mm/s. For CRDS model it means that the time of CRDS rack insertion has to be in limits reducedaccording to model scaling.
349

So the general goal of CRDS seismic testing is determination of the CRDS insertion time in AZmode during design earthquake or other accident postulated events, for example high intensity op-erational vibration.
The Control and Measurements System of the test rig allows to set the needed input kinematiccharacteristics of shaking table and to gather, process and analyze all output data such as accelera-tion, velocity and displacement of structure and parameters of CRDS rack insertion under dynamicexcitation.
2.4. Results of CRDS testing.
The initial stage of experiment was to determine the first natural frequency and damping charac-teristics of the CRDS model. This test has been performed with upper and lower positions of CRDSrack and shows that the first mode and damping parameters are the same for these two cases. Theplots of CRDS free oscillations are shown on the Figures 12, 13. The first natural frequency of thissystem is equal to:
/ = 4.6 Hzand damping ratio is equal to:
k = 0.013 (1.3%).
The investigations of influence of seismic and vibration impacts on CRDS rack free insertion inAZ mode have been performed with ten levels of seismic wave accelerations from 0 up to 0.72 g.Five experiments with statistical processing of results have been fulfilled for each level of seismicacceleration .
The analyses of results show rather good reproducing and repeatedness of shaking table parame-ters during different experiments, Figure 3. The recording of the upper part CRDS displacementmakes clear that the CRDS rack is working like non-linear gap dynamic damper in CRDS bearings,that's why output displacement waves are quite different in the levels and phases in case of the sameinput parameters of shaking table, figure 4. The sensitivity of CRD system to "rack — housing" in-teractions can be also illustrated by the plots of free rack insertions under the same conditions of theexperiment, including the shaking table excitation, Figure 6.
The main results of seismic excitation influence on CRDS rack free insertion in W E R AZ modeare shown on Figure 6. The plots are illustrated the dependencies of average free fall insertion ofthe CRDS rack from intensity of earthquake excitation. It is clear that the Mean +/- standard de-viation zone of results becomes more narrow with increasing of seismic impact intensity. It is alsopossible to conclude that the time of rack insertion mainly is limited by duration of excitation andcan achieve several times greater levels in comparison with normal designed time in AZ mode un-der real earthquakes.
The investigations of influence of operational vibration on CRDS free insertion in AZ mode havebeen also performed during the tests on the shaking table. In these tests the frequency of harmonicexcitation was tuned according to resonant frequency of CRDS rack to achieve the vibration shockmode in CRDS bearing gaps. The frequency was equal to 37 Hz for model of CRDS that means18.5 Hz for natural scale CRDS. The results are shown on Figure 7. The resonant of CRDS rackgreatly influences on the CRDS free insertion time and depends primarily from the deepness ofresonant process of the system "Rack - Bearings".
The main experimental results of CRDS dynamic testing under seismic and vibration excitationsshow that the time of CRDS AZ rack accident insertion like the general criteria of safety functions
350

of CRDS can increase up to 2 - 6 times against design requirements, Figure 8. So, achieving of theCRDS demand seismic and vibration capacities is the real way to upgrade the safety properties ofWER-type reactors.
3. ANALYTICAL STUDY OF THE SEISMIC RESISTANCE OF THE CRDS.
3.1 Computer Code SEISM-2000 for the dynamic analysis of the non-linear systems with paratiiet-rically varying characteristics.
SEISM-2000 is the computer software program developed for analytical investigation of the non-linear systems whose parameters and characteristics are changed during the dynamic process.
The background for developing of SEISM-2000 is the component-element method (CEM) [2]combined with the finite-element method (FEM). To solve the difference equations of motion thedirect integration method in terms of central finite differences is used.
The program provides the dynamic time-history analysis with finite-element approximation ofbeam-type elements and systems with concentrated parameters (lumped mass, stiffness, damping,etc.). The library of non-linear elements includes a number of components. Among them are:
- elastic spring element;- viscous damper element;- constant friction element;- variable friction element (the reaction force in this element depends from reaction in other de-
scribed early element and treated by program as friction force);. - limit stop;
- moving limit stop (this element takes into account interaction between moving inserting rodand external construction);
- hydraulic damper and snubber,- bearing damper, etc.
To create the analytical model of system the program uses finite-element approximation of beamsubstructures and concentrated parameters, such as lumped masses, stiffness and damping. Then allparts of analytical model incorporate among themselves by component elements.
To provide dynamic analysis the recording of time-history acceleration is used as input excita-tion.
The input data for the SEISM-2000 are: the geometry and properties of beam substructures, val-ues of concentrated inertia and stiffness parameters, the characteristics of component elements,digital records of input excitation.
The dynamic response of system is the result of computer analysis. Among the output resultsthere are following dependencies: "time-displacement," "time-velocity", "time-acceleration" for dy-namic degrees of freedom and "time - deformation - reaction force" for component elements.
3.2 Analytical model of the CRDS.
To create the analytical model of CRDS the geometry and properties of experimental 1/4 scalemodel of WER-440 CRDS have been used. From experimental data the damping ratio for wholeconstruction was determined too. The time of the control rod's insertion is defined by the complexof kinematic parameters of CRDS including dry friction in the bearings of drive mechanism and hy-
351
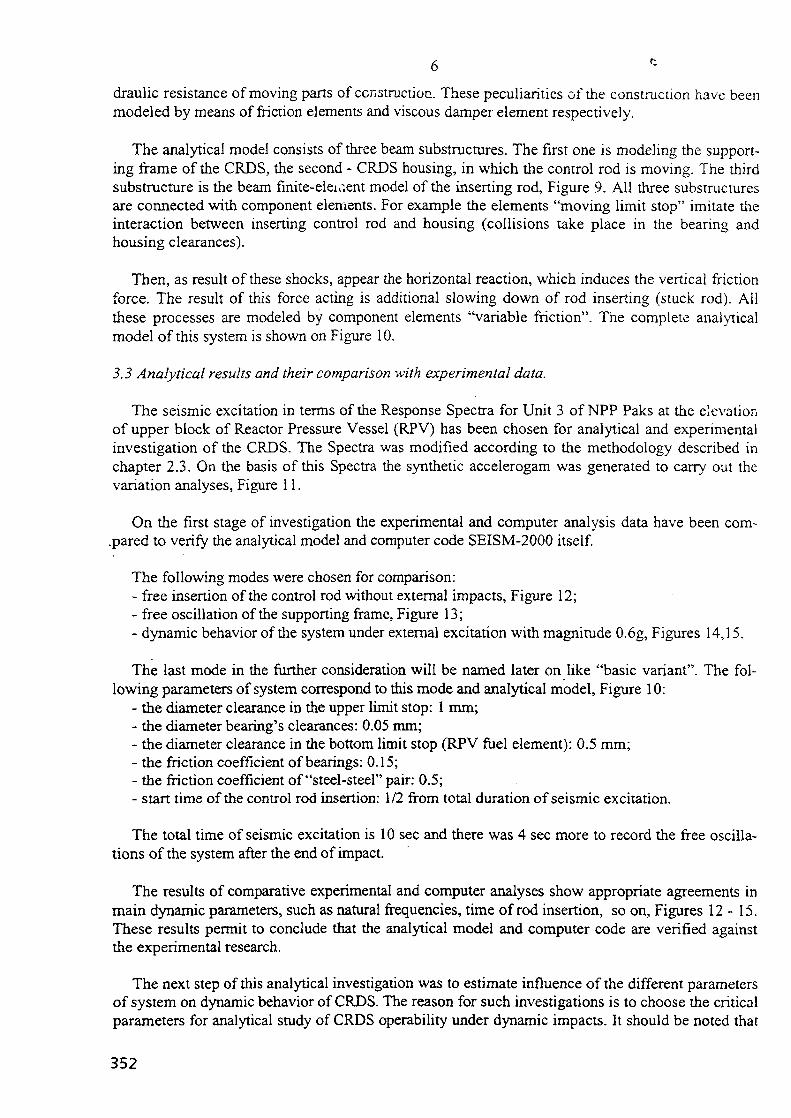
draulic resistance of moving parts of construction. These peculiarities of the construction have beenmodeled by means of friction elements and viscous damper element respectively.
The analytical model consists of three beam substructures. The first one is modeling the support-ing frame of the CRDS, the second - CRDS housing, in which the control rod is moving. The thirdsubstructure is the beam finite-element model of the inserting rod, Figure 9. All three substructuresare connected with component elements. For example the elements "moving limit stop" imitate theinteraction between inserting control rod and housing (collisions take place in the bearing andhousing clearances).
Then, as result of these shocks, appear the horizontal reaction, which induces the vertical frictionforce. The result of this force acting is additional slowing down of rod inserting (stuck rod). Allthese processes are modeled by component elements "variable friction". The complete analyticalmodel of this system is shown on Figure 10.
3.3 Analytical results and their comparison with experimental data.
The seismic excitation in terms of the Response Spectra for Unit 3 of NPP Paks at the elevationof upper block of Reactor Pressure Vessel (RPV) has been chosen for analytical and experimentalinvestigation of the CRDS. The Spectra was modified according to the methodology described inchapter 2.3. On the basis of this Spectra the synthetic accelerogam was generated to carry out thevariation analyses, Figure 11.
On the first stage of investigation the experimental and computer analysis data have been com-.pared to verify the analytical model and computer code SEISM-2000 itself.
The following modes were chosen for comparison:- free insertion of the control rod without external impacts, Figure 12;- free oscillation of the supporting frame, Figure 13;- dynamic behavior of the system under external excitation with magnitude 0.6g, Figures 14,15.
The last mode in the further consideration will be named later on like "basic variant". The fol-lowing parameters of system correspond to this mode and analytical model, Figure 10:
- the diameter clearance in the upper limit stop: 1 mm;- the diameter bearing's clearances: 0.05 mm;- the diameter clearance in the bottom limit stop (RPV fuel element): 0.5 mm;- the friction coefficient of bearings: 0.15;- the friction coefficient of "steel-steel" pair: 0.5;- start time of the control rod insertion: 1/2 from total duration of seismic excitation.
The total time of seismic excitation is 10 sec and there was 4 sec more to record the free oscilla-tions of the system after the end of impact.
The results of comparative experimental and computer analyses show appropriate agreements inmain dynamic parameters, such as natural frequencies, time of rod insertion, so on, Figures 12 - 15.These results permit to conclude that the analytical model and computer code are verified againstthe experimental research.
The next step of this analytical investigation was to estimate influence of the different parametersof system on dynamic behavior of CRDS. The reason for such investigations is to choose the criticalparameters for analytical study of CRDS operability under dynamic impacts. It should be noted that
352

7
for real construction of CRDS it is too complicate to define the exact values of such parameters asclearances, friction, etc.. All analyses have been fulfilled under "basic variant" of CRDS model de-scribed above.
Figure 16 shows that the clearance in CRDS bearings is not influence practically on dynamic be-havior of system. On the other hand, varying of clearance in bottom limit stop, that imitate theW E R Fuel element, gives the great effect in CRDS rod time insertion, Figure 17.
Changing of friction coefficient in CRDS gaps demonstrates practically the linear dependenciesbetween CRDS rod insertion time and friction conditions, Figure 18, 19.
The next important result of analytical study is that the CRDS rod insertion time is heavily de-pends on start point of rod insertion during earthquake excitation, Figure 20.
The dependencies of CRDS rod insertion path and time from seismic intensity (ZPA) are shownon Figure 21. It is clear from these plots that seismic impact can heavily increase (2-4 times) themain safety characteristic of CRDS.
That means the necessity of additional evaluation of these phenomena in seismic design and up-grading of WER.
4. CONCLUSIONS.
1. The complex of experimental and analytical study of the WER-440 Control Rod Drive System.seismic and vibration capacities have been carried out.2. To analyze dynamic behavior of CRDS the computer code SEISM-2000 has been developed andsuccessfully verified against experimental results.3. The investigations of CRDS seismic and operational vibration capacities show that dynamic exci-tation can significantly increase the time of CRDS accident insertion and may influence safety ofVVER plants.
5. REFERENCES.
1. V. Kostarev. Evaluation of Potential Hazard for Operation of WER Reactor Control Rods underSeismic Excitation, IAEA Report, No. 7448/EN, 1994.2. S. Levy, J.P. Wilkinson. The Component Element Method in Dynamics. McGraw Hill IBC, 1976.
353

354
Figurei 1. The general view of CVS Shaking Table with natural scale CRDS.

1 - potentiometer1 2, 3, 4 - acceleration transducer B&K
CRDS
Hydraulic Actuator
amplifier/integratorB&K 2635
Shaking Table
77777777 77777777
PC
DAC
TableControlSystem
UJFigure 2. Principal chart of measurement
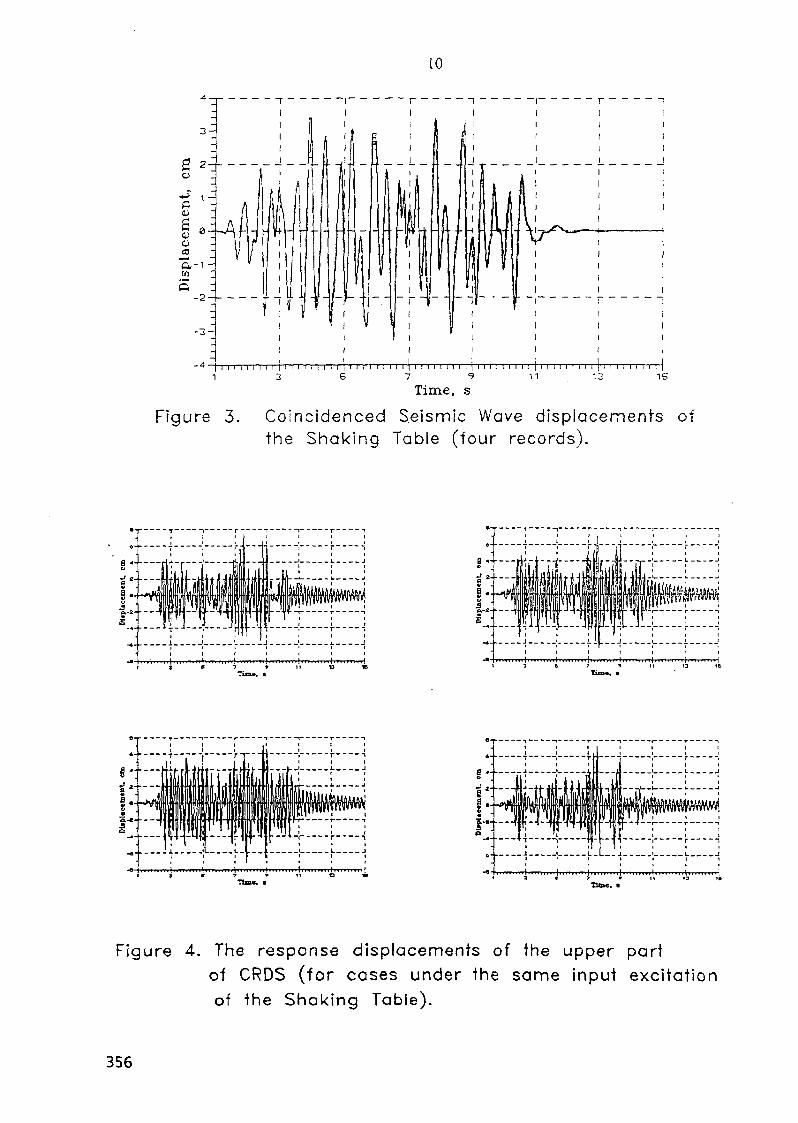
10
Time, s.
Figure 3. Coincidenced Seismic Wave displacements ofthe Shaking Table (four records).
a •>•
•i*-
! • -
•L-i •
r
til
Tl 1
1 1 ~ - ' '
liIT i
, ' ii
\ | T,
! !
1
_ L _ _ J
i i . i
6-
! • •
5 '
-a-
! ! ! I 1
2-L J ill 11 .
1 1 i ' 1 1 1
l \ I ' l ' i[•ITU I-TTV.-I
Figure 4. The response displacements of the upper partof CRDS (for cases under the same input excitationof the Shaking Table).
356

1!
without excitationunder excitation
Figure 5. Free insertion of the CRDS Rack inAZ mode (four cases under the sameinput excitation of the Shaking Table).
Mean value00000 Mean - Std.Deviation
Mean + Std.DeviationEnd of the Table Excitation
n—i—i—i—i—i—i—i—;—i i—i—i—i—i—i—i—i—i—i—i—i—i—i—i—i—i—i—i—;—i—i—i—i—\—i—i
Acceleration. G
Figure 6. Influence of the CRDS free insertiontime in AZ mode from accelerationlevel of seismic excitation.
357

12
Amp I .= 0 . 03 cmAmp I .= 0 . 0 2 cmWi thou t Ex c I t & t I o n
10 12
Time, s
Figure 7. Influence of the CRDS free insertion limein AZ mode from amplitude of operationc!vibration.
60-E
O 50-E
a; 40-E
I03
Q 20-
(S iln
7'y
I.I
I
without excitationseismic shock
— — vibration 37 Hz
12 14 18
time, s
Figure 8. Influence of the CRDS free insertion timein AZ mode from different types ofdynamic excitation.
358

Z pipes 32x2 5
Substructure 1
C\
\ pipes 4&j<2 5
pipe 40x2
. -OX
'"" pipe 76x2.5
-14
4G0
460
460
460
400
r\ Solid Cirrlc Be*m (0 IZmm]
Load
Substructure 3
Substructure 2
uo Figure 9. Substructures of the Analysis Model.

14
gap: + / - 0.5 mm.structural frictioncoefficient 0.15
1 ;
• 0
/////Y//// ////V///// ///////
10
gap: + / - 0.25 mm,
structural friclioncoefficient: 0.5
gap: + / - 0.025 mm.
structural frictioncoefficient: 0.15
gap: +/-0.C25 mm.structural frictioncoefficient: 0.15
Figure 10. Analysis Model of the CRDS.
360
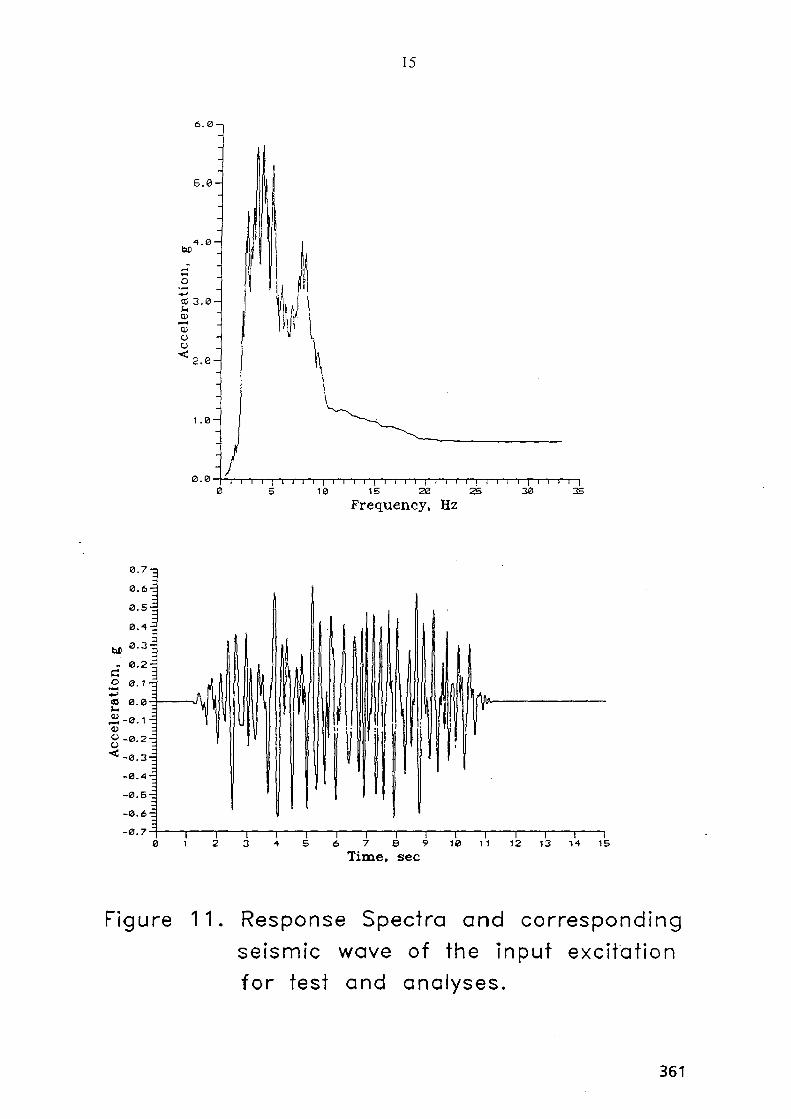
15
6.0-
1 . 0 -
o
a 3.0-
0)
o
1 .0 -
0.0- I t I r10 15 20 25
Frequency, Hz
Time, sec
Figure 11. Response Spectra and corresponding
seismic wave of the input excitation
for test and analyses.
361

80.0-,
60.0-
eu
aI0)
oI—H0,10
40.0-
20.0-
6.0-
16
AnalysisExperiment
e.ee i.ee 3.ee 4.00Time, sec
Figure 12. Free Insertion of the Control Rodwithout dynamic excitation
Experiment
0 . 0 e.s i .e I.S 2.0 2.S 3.6Time, sec
3.6
Analysis
e.e e.e s.e 3.cTime, see
362
Figure 13. Free oscillations of theCRDS Housing (point 2).
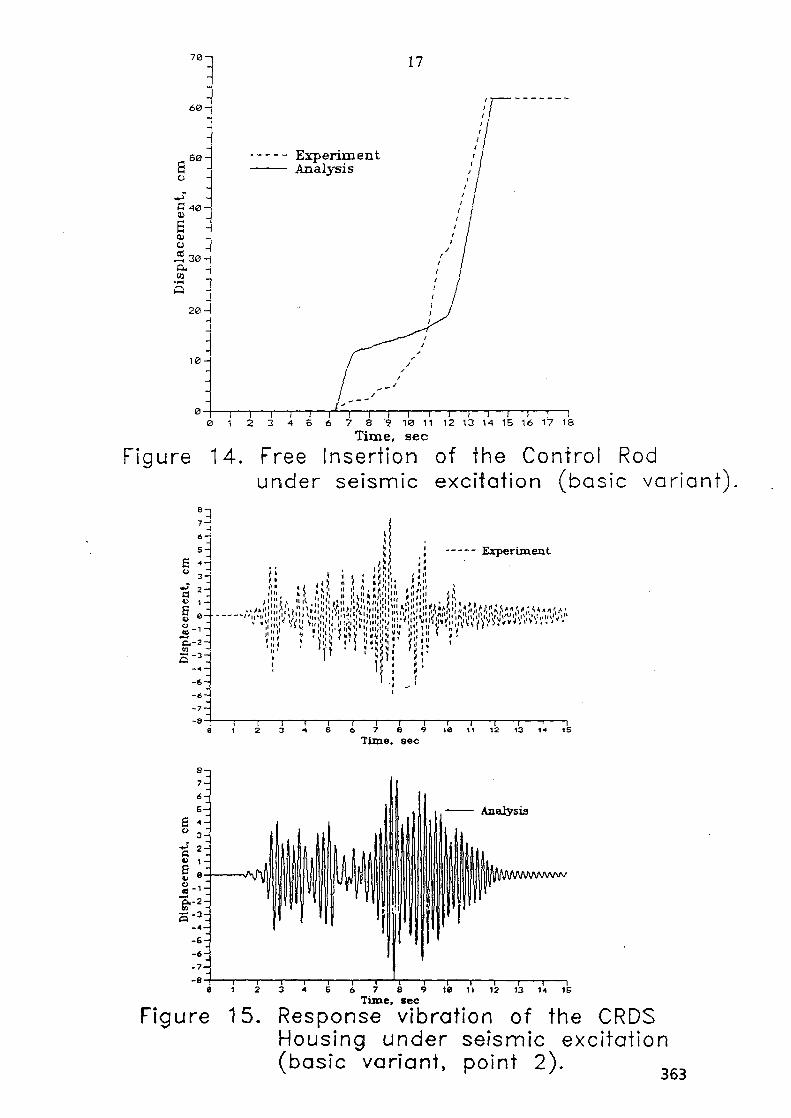
70-i
6 0 -
17
ExperimentAnalysis
8 ? 10 11 12 13 14 15 16 17 18Time, sec
Figure 14. Free Insertion of the Control Rodunder seismic excitation (basic variant)
Time, sec
Analysis
12 13 H 15Time, sec
Figure 15. Response vibration of the CRDSHousing under seismic excitation(basic variant, point 2).
363
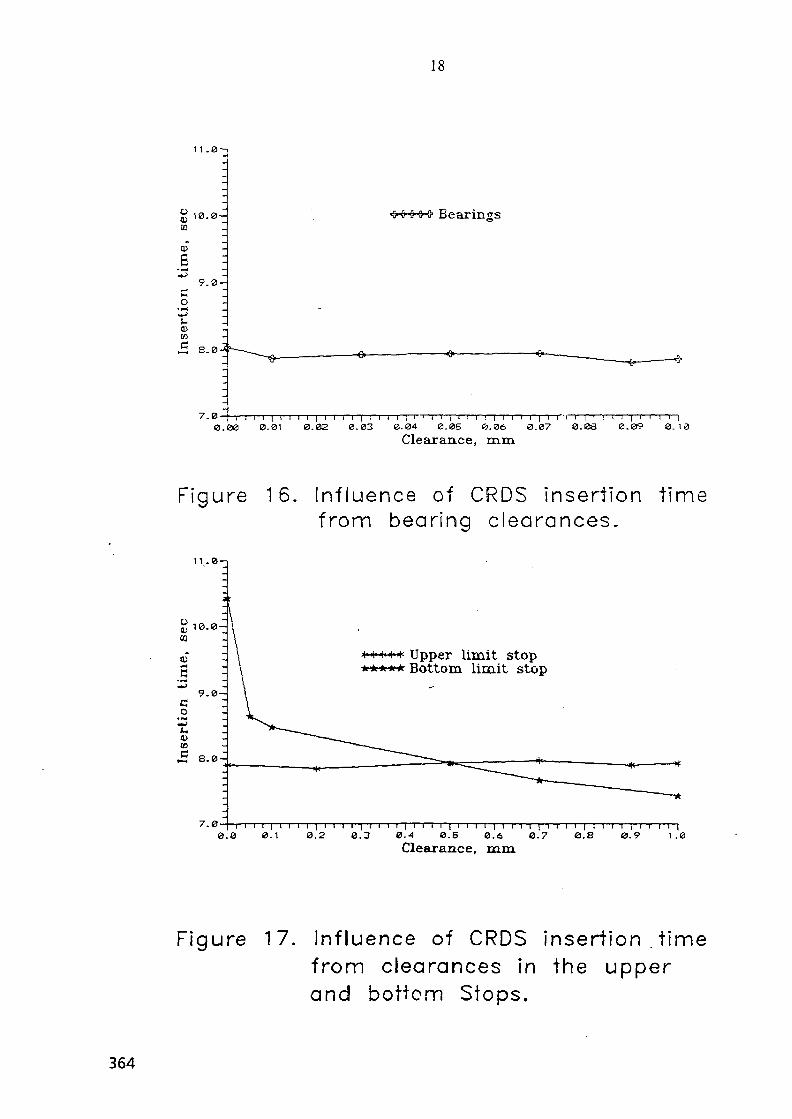
18
11 .0-1
10.0-
0)
g
O
9.0-
•H 8 . 0 -
Bearings
7 .0 I i i i i | i i i i ] i i i i | i i i i | i ' i i | i i i ! |—n—i i | i I"-I—i—pi—i—i—i—i—i—i—i—;—i0.00 0.01 0.02 0.03 0.04 0.05 0.06 0.07 0.B3 0.09 0.1l3
Clearance, mm
Figure 16. Influence of CRDS insertionfrom bearing clearances.
11.0-1
10.0-
9.0-
0)
B
co
CO
£ 8.0-
7.0-
Upper limit stopBottom limit stop
me
0.0 0.1 0.2 0.3 a.A 0.6 0.6 0.7 e.8 0.9 1.0
Clearance, mm
Figure 17. Influence of CRDS insertion timefrom clearances in the upperand bottom Stops.
364

19
8.0-1
45
s6.0-ao
03W
J5S.0-
•4.0-
"steel - plastic" pair
e.ee' i i | i r
0.05 b.10 0.15
Friction coefficient0.20
Figure 18. Influence of CRDS time insertion fromfriction in bearings.
8.2-1
m '•en
0 . 0
*-*•***-* "steel — steeP pair
Friction coefficient
Figure 19. Influence of CRDS time insertion from
friction in the bottom part of CRDS.365
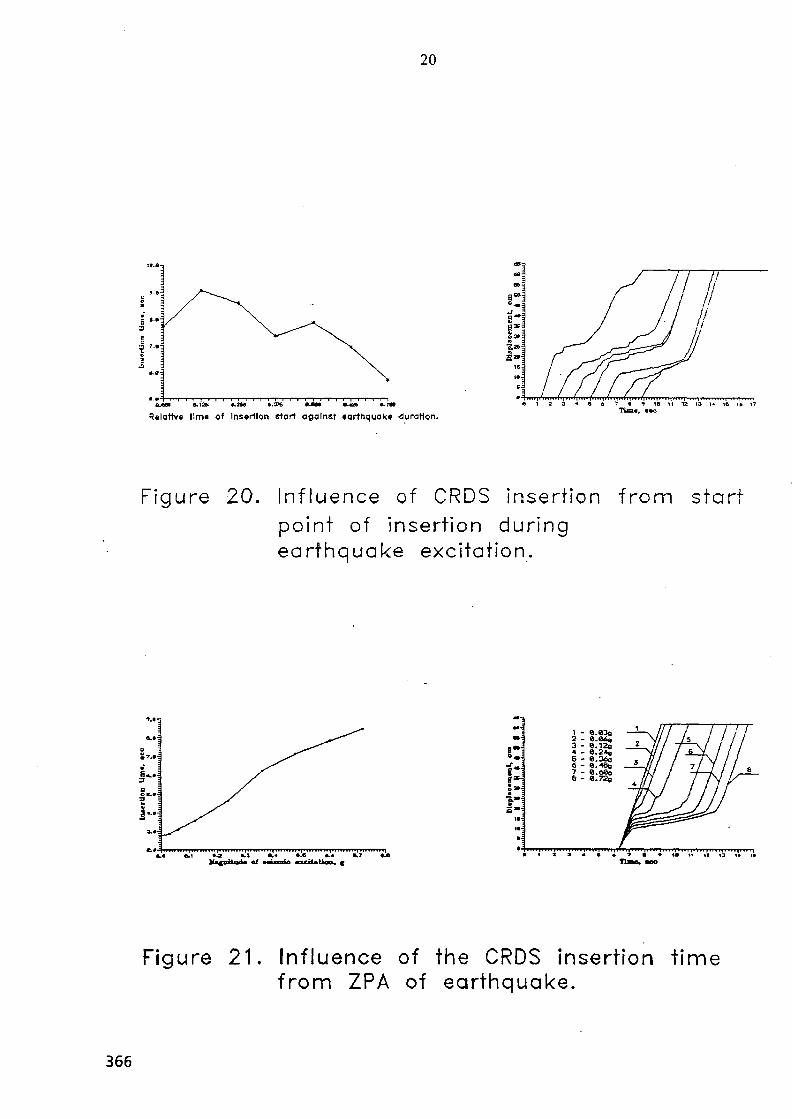
20
R«lottv« tlm« of Insertion start against «arthquak« duration.Tuna, B*C
Figure 20. Influence of CRDS insertion from startpoint of Insertion duringearthquake excitation.
n":
j m
V'
5 -
i - a eoo3 - e.i2o6 * dl36o
6 - el72s
1 I!
z Jl I' if I
IPr
i j
i 7 /
JlijTine, to
Figure 21 Influence of the CRDS insertion timefrom ZPA of earthquake.
366

XA9952665
PROCEEDINGS OF SMIRT 13 - POST CONFERENCE SEMINAR 16SEISMIC EVALUATION OF EXISTING NUCLEAR FACILITIES
SHAKING TABLE TESTING OF ELECTRICAL EQUIPMENT INARGENTINA
CARMONA, Juan S.; ZABALA, Francisco; SANTALUCIA, Jorge; SISTERNA, Cristian;MAGRINI, Marcelo; OLDECOP, Luciano.
Institute de Investigaciones AntisismicasUniversidad National de San Juan - San Juan - ARGENTINA
ABSTRACT: This paper describes the testing facility, the methodology applied and theresults obtained in the seismic qualification tests of diferent types of electric equipment. These testswere carried out on a shaking table that was developed and built at the Earthquake ResearchInstitute of the National University of San Juan, Argentine.
The equipment tested consist of 500 KV and 132 KV current transformers, a 500 KVvoltage transformer, a 145 KV disconnecter and a relay cabinet. The acceleration response of thetested equipment was measured at several locations distributed along its height, and strains weremeasured at critical points by strain gauges cemented on the base of the porcelain insulator. All theinformation was recorded with a data acquisition system at a sampling rate of 200 times per secondin each channel.
The facility developed at this Institute is the largest one in operation in Argentina at presentand the equipment tested is the highest, heaviest and more slender one which has been seismicallyqualified on a shaking table in this country.
These tests have been a valuable experience in the field of structural dynamic testing appliedto equipment of hydroelectric and nuclear power plants.
1. INTRODUCTION
Earthquakes have often affected the electric power systems causing the interruption of powersupply to industries and homes, which sometimes has extended during several days. S o m ecomponents of high voltage substations have shown to be very sensitive to the shaking of strongearthquakes. Measurement transformers,disconnec-ting switches, circuit breakers and other similarsubstation equipment of 220 KV or larger voltage have been severely damaged on the 1978Miyagi-Oki, Japan earthquake (Katayama 1980), on the 1987 Bay of Plenty, New Zealandearthquake (Rutledge 1988) and on the 1989 Loma Prieta and 1995 Northridge, USA earthquakes(EERI 1990, 1995).
The restoration of the operation of this equipment demands time which produces importanteconomic losses that are larger than the reposition cost itself. Also, some equipment could beessential for assuring the security of power plants.
With the purpose of carrying out dynamic tests on full scale substation electric equipmentsubjected to seismic motion, the Earthquake Research Institute of the National University of SanJuan, Argentina, has designed, built and put into operation a shaking table. With this testing facilitythe seismic qualification tests of two 500 KV measurement transformers and other equipment havebeen recently performed (Figures 5 to 9).
367

2, THE SHAKING TABLE
The shaking table mentioned above has one horizontal degree of freedom and was designedand built keeeping in mind that the electric equipment to be tested are slender and have normallythe centre of gravity in such a position that generates a very important seismic overturning momentat its base. The testing facility is located in San Juan City which, with its mild and very dryclimate, allowed the facility to be built outdoors. This fact also simplifies the erection of theequipment to be tested which has, in the case of 500 KV current transformers, a total height a littlelarger than 10 meters.
The shaking table motion is produced by a PC computer controlled electro-hydraulicactuator.
The operation limits of this facility are shown in Figure 1. The installation has also a dataacquisition system to measure and record the cinematic variables which correspond to the motionsof the shaking table and the equipment under testing.
The whole installation has been designed by the authors of this report, including the frameand supports of the table, the actuator, the transducers and electronic circuits of the data acquisitionsystem and its software.
3, SEISMIC QUALIFICATION TEST MOTIONS
The electric and mechanical equipment seismic qualification tests are the experimentalapproach to demonstrate the ability of the equipment to perform its required functions during andafter the occurrence of earthquakes.
About the seismic activity in Argentina, the most destructive earthquakes have occurred atthe centre of the western part of its territory, (Volponi 1962). For example, in November 23, 1977the city of San Juan was shaken with Mercalli Intensity VIII by one Ms = 7,4 earthquake froman epicentral area at a distance of 60 km. Figure 4 shows the acceleration record obtained in SanJuan city on that occasion with a maximum acceleration 0,17g whereas one Wilmot seismoscopewith a period 0,7 sec and 10% of damping located on the same site recorded 0,26g as spectralacceleration. (Carmona 1978).
The 500 KV measurement transformers tested will be installed in substations ofhydroelectric power plants located at Limay River in Comahue Region, one thousand km. to thesouth of San Juan City, where the seismic activity is lesser than in this place.
To seismically qualify these equipment Hidronor, the owner at the time of these tests,specified the spectral response accelera-tion curve shown in Figure 2 with a maximum value of0,26 g. The shaking table motion that was specified to fulfill this require-ment was a sine-beat typeacceleration. It was specified a sequence of 5 sine-beats separated by quietness intervals, eachsine-beat having five complete sine waves with amplitude modulated by a half sine wave and periodequal to the fundamental natural period which has the equipment under testing in the direction ofthe shaking table applied motion (Figure 3).
An example of another motion applied with this shakinq table is shown in Figure 12. Thisaccelerogram was derived from the record obtained in San Juan City in 1977 and aplied to a 5 tonsstructural model.
4, PERFORMED TESTS ON 500 KV MEASUREMENT TRANSFORMERS.
To perform the seismic qualification test, the transformers were mounted on the shakingtable with its bolted steel tower support rising to a total height of 10,5 m. It is very important toproperly reproduce the service condition since the tower support changes the dynamic response ofthe device (Figures 5-6).
368
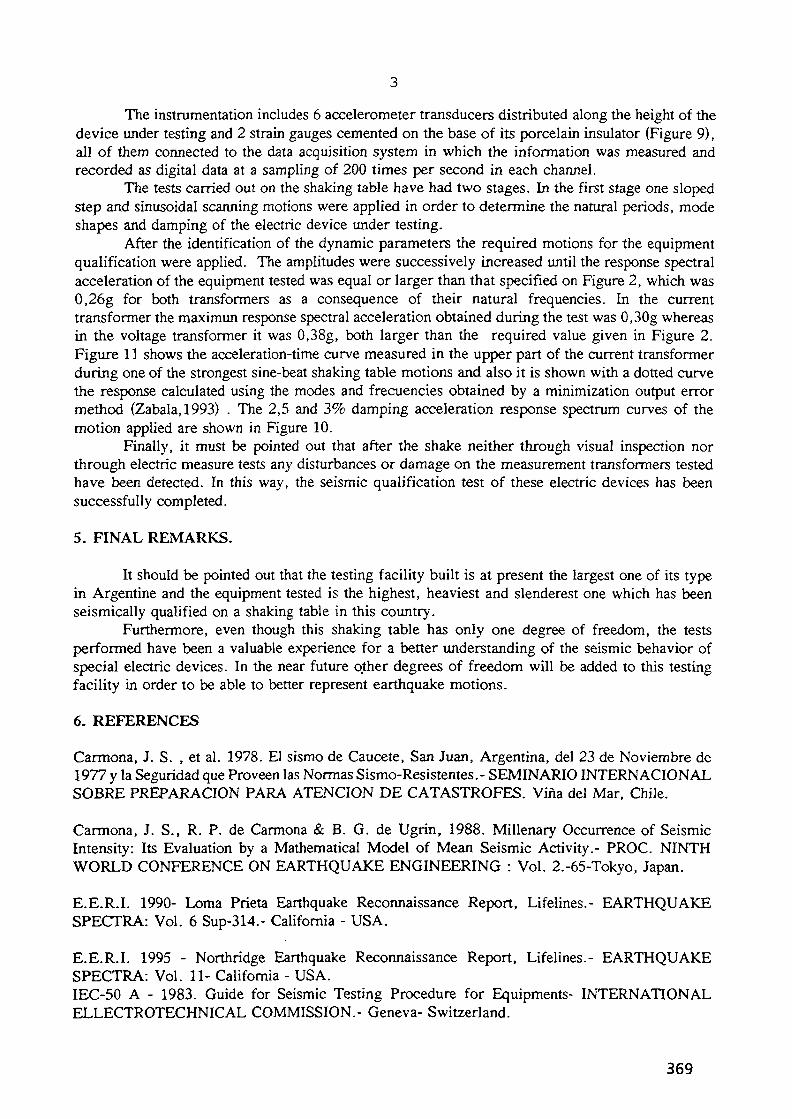
The instrumentation includes 6 accelerometer transducers distributed along the height of thedevice under testing and 2 strain gauges cemented on the base of its porcelain insulator (Figure 9),all of them connected to the data acquisition system in which the information was measured andrecorded as digital data at a sampling of 200 times per second in each channel.
The tests carried out on the shaking table have had two stages. In the first stage one slopedstep and sinusoidal scanning motions were applied in order to determine the natural periods, modeshapes and damping of the electric device under testing.
After the identification of the dynamic parameters the required motions for the equipmentqualification were applied. The amplitudes were successively increased until the response spectralacceleration of the equipment tested was equal or larger than that specified on Figure 2, which was0,26g for both transformers as a consequence of their natural frequencies. In the currenttransformer the maximun response spectral acceleration obtained during the test was 0,30g whereasin the voltage transformer it was 0,38g, both larger than the required value given in Figure 2.Figure 11 shows the acceleration-time curve measured in the upper part of the current transformerduring one of the strongest sine-beat shaking table motions and also it is shown with a dotted curvethe response calculated using the modes and frecuencies obtained by a minimization output errormethod (Zabala,1993) . The 2,5 and 3% damping acceleration response spectrum curves of themotion applied are shown in Figure 10.
Finally, it must be pointed out that after the shake neither through visual inspection northrough electric measure tests any disturbances or damage on the measurement transformers testedhave been detected. In this way, the seismic qualification test of these electric devices has beensuccessfully completed.
5. FINAL REMARKS.
It should be pointed out that the testing facility built is at present the largest one of its typein Argentine and the equipment tested is the highest, heaviest and slenderest one which has beenseismically qualified on a shaking table in this country.
Furthermore, even though this shaking table has only one degree of freedom, the testsperformed have been a valuable experience for a better understanding of the seismic behavior ofspecial electric devices. In the near future other degrees of freedom will be added to this testingfacility in order to be able to better represent earthquake motions.
6. REFERENCES
Carmona, J. S. , et al. 1978. El sismo de Caucete, San Juan, Argentina, del 23 de Noviembre de1977 y la Seguridad que Proveen las Normas Sismo-Resistentes.- SEMINARIOINTERNACIONALSOBRE PREPARACION PARA ATENCION DE CATASTROFES. Vina del Mar, Chile.
Carmona, J. S., R. P. de Carmona & B. G. de Ugrin, 1988. Millenary Occurrence of SeismicIntensity: Its Evaluation by a Mathematical Model of Mean Seismic Activity.- PROC. NINTHWORLD CONFERENCE ON EARTHQUAKE ENGINEERING : Vol. 2.-65-Tokyo, Japan.
E.E.R.I. 1990- Loma Prieta Earthquake Reconnaissance Report, Lifelines.- EARTHQUAKESPECTRA: Vol. 6 Sup-314.- California - USA.
E.E.R.I. 1995 - Northridge Earthquake Reconnaissance Report, Lifelines.- EARTHQUAKESPECTRA: Vol. 11- California - USA.IEC-50 A - 1983. Guide for Seismic Testing Procedure for Equipments- INTERNATIONALELLECTROTECHNICAL COMMISSION.- Geneva- Switzerland.
369

IEEE Std 344-1975 -Recommended Practices for Seismic Qualification of Class IE Equipment ForNuclear Power Generating Stations.- THE INSTITUTE OF ELECTRICAL AND ELECTRONICSENGINEERS- New York- USA.
Katayama, T., Y. Masui & R. Isoyama 1980. Restoracion of Lifelines in Sendai after the damagecaused by the 1978 Miyagi-Ken-Oki Earthquake.- PROC. SEVENTH WORLD CONFERENCEON EARTHQUAKE ENGINEERING: Vol. 8-233.- Istanbul. Turkey.
Rutledge, A. L. 1988. Earthquake Damage at Edgecumbe and Kawarau Electricorp Substations inthe Bay of Plenty Earthquake on 2 March 1987.- BULLETIN OF THE NEW ZELANDNATIONAL SOCIETY FOR EARTHQUAKE ENGINEERING: Vol. 21-N2 4-247. Wellington -New Zealand.
Volponi, F. 1962. Aspectos Sismologicos del Territorio Argentino.- ACT AS DE LAS PRIMERASJORNADAS ARGENTINAS DE INGENIERIA ANTISISMICAS: Tomo 1-51.- San Juan,Mendoza, Argentina.
Zabala, F. 1993. Identificacion de modelos matematicos de comportamiento electrico a partir deensayos en mesa vibratoria. V Encuentro Regional Latinoamericano de la CIGRE. Ciudad del Este.Paraguay.
370

FRECUENCY (C/SEC)100 50 20 10 5 2 1 0,5 0,2 0,1 0,05
! o 0 -4 1 ;^-H 1 H~r—i i l-TsrH 1 1" 1 0°
0,01 0,02 0r05 0,1 0,2 0,5 1 2
PERIOD (SEC!
FIGURE 1. Shaking table operation limits.
10 20
| SAC/03)
M 1,2 T(sec)
FIGURE 2. Acceleration response spec-trum required by Hidronor.
ACCELERATION/A max
1,00 - •-, " m a x
0,50
0,00
- 0 , 5 0
-1,BO
(a) ACCELERATION
OISPLACEMENT/Anax T 2
• JM:
O,8Z|
0,0'-
/ \ A
\ \ 1 \
-0,024P'!I
- 0 , 8 J x
(b) EMPLACEMENT
FIGURE 3. Sine-beat type shaking table motion required byHidronor.
10.
cm/sec-
20-
0-
20--cm
10..
i I I I • 1 I I t *. |
w^^ ACCELERATION
Amax = 17.0
Vroax » 30,4 cm/sec-
A A VELOCITY
DISPLACEMENT
1.4 cm
5 10 20 30 40 50 60 T(sec.)
FIGURE4. Acceleration record of San Juan (Argentina), Nov.23,1977 earthquake.
371

FIGURE 5. 500Kv current transformer with itssupporting tower.
FIGURE 6. 500Kv voltage transformer readyfor the test.
~'-:*A".
FIGURE 7. 145Kv disconnectors with accele-ration transducers.
FIGURE 8. Relay cabinet mounted on the sha-king table.
372
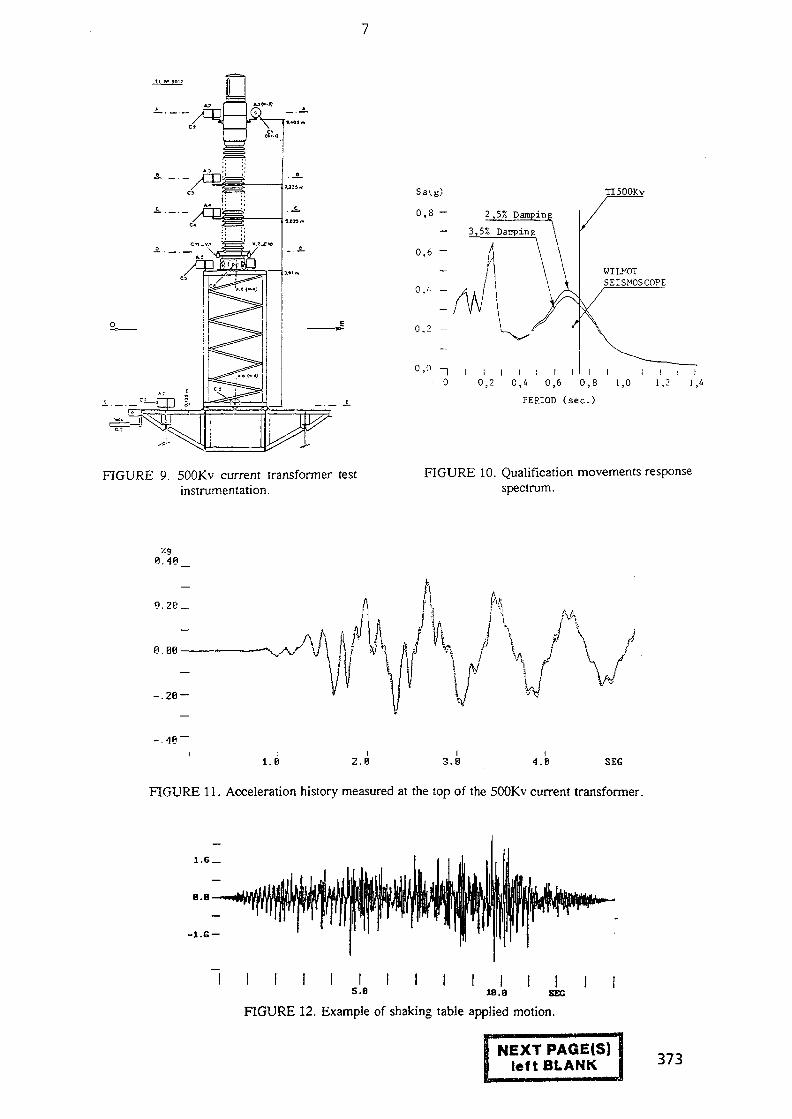
FIGURE 9. 500Kv current transformer testinstrumentation.
0.4 -
0.2 -
0,0 - ,0
TI500KV
WILMOTSEISMOSCOPE
I i i : i i i i ! i i i i0 , 2 0 , 4 0 , 6 0 , 8 1 ,0 1,2 1,4
PEP10D ( s e c . )
FIGURE 10. Qualification movements responsespectrum.
0.48
- . 2 0 -
- . -10 "I
2.8l .B 2.8 3.8 4.8 SEG
FIGURE 11. Acceleration history measured at the top of the 500Kv current transformer.
e.B
- i . e —
5-6 18. a SEC
FIGURE 12. Example of shaking table applied motion.
NEXT PAGE(S)left BLANK 373

SESSION VI
"CASE STUDIES"
NEXT PAGE(S)left BLANK ___
~"* 375
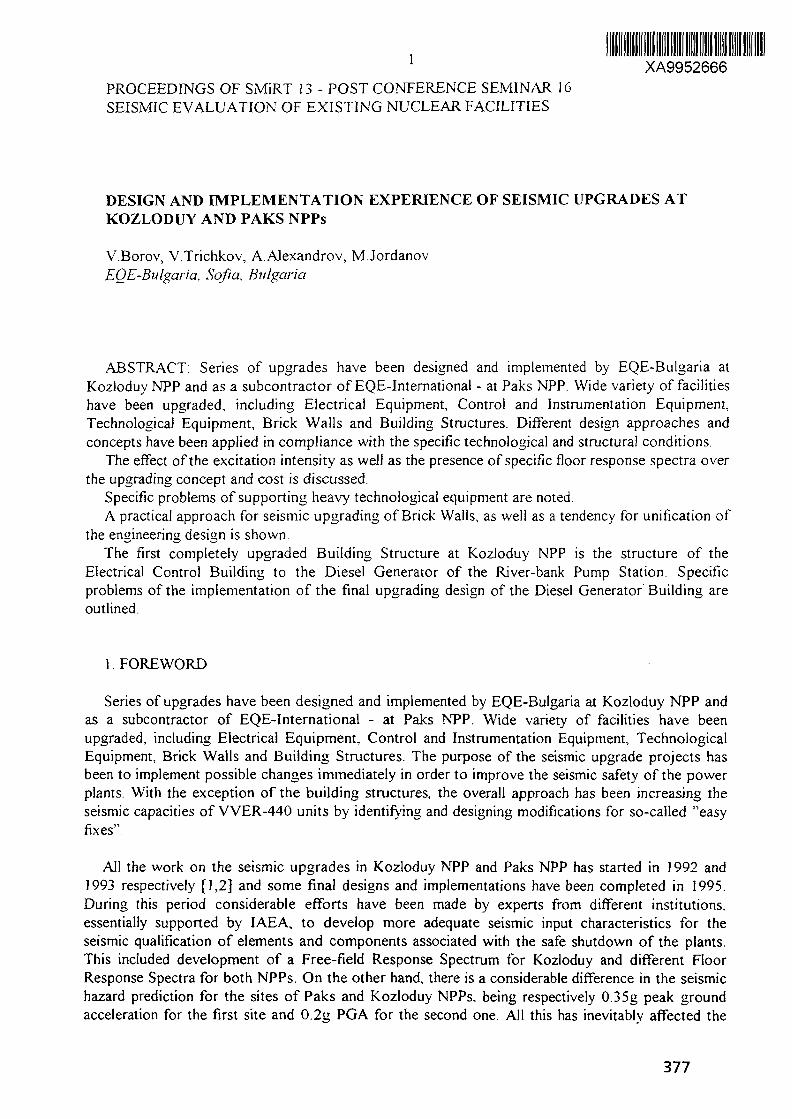
1 XA9952666PROCEEDINGS OF SMiRT 13 - POST CONFERENCE SEMINAR 16SEISMIC EVALUATION OF EXISTING NUCLEAR FACILITIES
DESIGN AND IMPLEMENTATION EXPERIENCE OF SEISMIC UPGRADES ATKOZLODUY AND PAKS NPPs
V.Borov, V.Trichkov, A.Alexandrov, M.JordanovEOE-Bulgaria, Sofia, Bulgaria
ABSTRACT: Series of upgrades have been designed and implemented by EQE-Bulgaria atKozloduy NPP and as a subcontractor of EQE-International - at Paks NPP. Wide variety of facilitieshave been upgraded, including Electrical Equipment, Control and Instrumentation Equipment,Technological Equipment, Brick Walls and Building Structures. Different design approaches andconcepts have been applied in compliance with the specific technological and structural conditions.
The effect of the excitation intensity as well as the presence of specific floor response spectra overthe upgrading concept and cost is discussed.
Specific problems of supporting heavy technological equipment are noted.A practical approach for seismic upgrading of Brick Walls, as well as a tendency for unification of
the engineering design is shown.The first completely upgraded Building Structure at Kozloduy NPP is the structure of the
Electrical Control Building to the Diesel Generator of the River-bank Pump Station. Specificproblems of the implementation of the final upgrading design of the Diesel Generator Building areoutlined.
1. FOREWORD
Series of upgrades have been designed and implemented by EQE-Bulgaria at Kozloduy NPP andas a subcontractor of EQE-International - at Paks NPP. Wide variety of facilities have beenupgraded, including Electrical Equipment, Control and Instrumentation Equipment, TechnologicalEquipment, Brick Walls and Building Structures. The purpose of the seismic upgrade projects hasbeen to implement possible changes immediately in order to improve the seismic safety of the powerplants With the exception of the building structures, the overall approach has been increasing theseismic capacities of VVER-440 units by identifying and designing modifications for so-called "easyfixes-
All the work on the seismic upgrades in Kozloduy NPP and Paks NPP has started in 1992 and1993 respectively [1,2] and some final designs and implementations have been completed in 1995.During this period considerable efforts have been made by experts from different institutions,essentially supported by IAEA, to develop more adequate seismic input characteristics for theseismic qualification of elements and components associated with the safe shutdown of the plants.This included development of a Free-field Response Spectrum for Kozloduy and different FloorResponse Spectra for both NPPs. On the other hand, there is a considerable difference in the seismichazard prediction for the sites of Paks and Kozloduy NPPs. being respectively 0.35g peak groundacceleration for the first site and 0.2g PGA for the second one. All this has inevitably affected the
377

qualifications and the design of upgrades, ending sometimes not only with heavier or lighter fixingelements, but even in changing the upgrading concept.
Another significant factor affecting the design of seismic upgrades of existing facilities isobviously the free space and the existence of strong structural elements near by, such as reinforcedconcrete floors, ceilings, walls, etc. It has to be noted, that very often initial concepts, that haveseemed possible and reasonable in the beginning, have to be principally changed in the end. Theimplementation of the projects for seismic upgrading often is impossible because of lack of space,especially concerning the upgrading of building structures.
2. SEISMIC INPUT
2 1. SEISMIC INPUT FOR KOZLODUY NPP
In the beginning of 1992 EQE-Bulgaria, under contract with Kozloduy NPP, started the design ofhigh priority short term seismic upgrades for the four VVER-440MW operating units at KozloduyNPP [3]. At that time the seismicity of the Kozloduy site was still under investigation, so theestimation of the seismic capacity of the equipment was done on the basis of an anticipatedearthquake of 0.25g peak ground acceleration and assuming a broad banded response spectrumsimilar to a US Nuclear Regulatory Commission standard spectral shape [4], Besides, in the designof seismic anchorage upgrades of specific electrical power and C&I cabinets the seismic input loadswere to be based on the following equation, defining a static horizontal acceleration componentcoefficient for 5% damping, Ft, [5]:
Fh = (0.8 + 2.0H s /Hn)g
where : Hs = height from the building base to elevation XHn = total height of the building.
The value of was to be reduced by a factor of 0.5, if the fundamental frequency of the upgradedequipment could be shown to be equal to or greater than 8 Hz. The vertical component accelerationcoefficient was to be taken as 0.67Fh.
The Bulgarian Building Research Institute developed specific site response spectra, approved byIAEA in the end of May 1992 [6]. The seismic evaluation was to be conducted for a safe shutdownearthquake defined as 0.2g horizontal peak ground acceleration with 50% of this value for thevertical component. On this basis a team of Energoproject S.A. lead by Mr. M. Kostov developedfloor response spectra for units 1-4 using detailed computer models of the structures [7]. The lastseismic qualifications and upgrades of equipment for units 1-4 were conducted using the floorresponse spectra.
2.2. SEISMIC INPUT FOR PAKS NPP
Paks NPP had retained EQE-International and Westinghouse Energy Systems Europe (WESE) toparticipate in strengthening plant equipment which had insufficient seismic capacity. EQE-Bulgariatook part in the program as a subcontractor of EQE-International. The goal of the program was todetermine which components and structural elements associated with the safe shutdown of the plantfollowing an earthquake had seismic capacity less than 0.3g peak ground acceleration and to increasetheir seismic capacity to withstand a O.35g earthquake (as a minimum).
378

The screening of existing equipment and commodities has been carried out for a 0.3g peak groundacceleration using 50% spectral shape defined in NUREG/CR-0098 [8]. For design of seismicupgrades the more conservative design spectrum has been used. The ground motion was specified asa US NRC Regulatory Guide 1.60 spectral shape anchored to 0.3g [4]. The seismic analysis has beenconducted by Siemens [9], They have developed floor response spectra for all locations of equipmentin the reactor building and the turbine hall. The analytical technique has followed the guidelines ofthe US NRC Standard Review Plan [10] for conducting soil-structure interaction. The spectraprovided were the result of enveloping all locations on a particular floor with broadened andsmoothed peaks. The spectra were to be linearly scaled to 0.35g by multiplying by the ratio of0.35/0.30 and were to be used in the design of upgrades.
2.3. COMPARISON OF THE SEISMIC INPUT FOR THE DIFFERENT CASES
In order to assess the effect of the different seismic input for the separate cases a brief comparisonof the inputs is made. For the purpose the different free field spectra for 5% damping are plotted onFigure 1.
INITIAL K^ZLODUY jlNPUT(TO THB FORMULA)
r rL
0.5 1.0 5.0 10.0 50.0
Frequency (Hz)
Fig. 1 Comparison of 0.3g NUREG/CR-0098 spectrum, 0.3g Regulatory Guide 1.60 spectrum,Kozloduy site 0.2g spectrum and Initial input for Kozloduy, 5% damping
It is obvious, that the seismic input for Paks is about twice the finally developed input forKozloduy. On the other hand the initial input for Kozloduy according to the formula is respectivelyclose to the 0.3g RG 1.60 Spectrum. The maximum spectral value of the acceleration on theKozloduy site has dropped 1.74 times and the maximum horizontal floor accelerations should havedropped about two times and more.
In general it might be concluded, that the initial input for Kozloduy NPP site and the one for thePaks NPP site do not differ substantially. The development of site specific response spectrum forKozloduy, the development of detailed structural models and from there - of floor response spectra,has diminished the input seismic excitation for the structural elements and equipment considerably.
379

3. UPGRADING DESIGN APPROACHES AND CONCEPTS
The general approach is to use seismic and testing experience and expert judgement,supplemented by analysis, to demonstrate the seismic adequacy of equipment. The demonstration ofseismic adequacy includes the strength of the components and their anchorage as well as theoperability. "Generic Implementation Procedure for Seismic Verification of Nuclear PlantEquipment" has been developed by the Seismic Qualification Utility Group (SQUG) in 1991 [11]. Itcovers twenty generic classes of active equipment as well as cable trays, tanks and heat exchangers.The strength is demonstrated for the most part by providing that the equipment is adequatelyanchored. Operability is demonstrated by assuring that the equipment is similar to equipment in theexperience database and that it meets all the inclusion rules contained in the Generic ImplementationProcedure
3.1. CONCEPTS FOR UPGRADING OF ELECTRICAL, INSTRUMENTATION ANDCONTROL EQUIPMENT
For better understanding of the approach for supporting and upgrading the cabinets it is essentialto remind, that initially for Kozloduy the value of horizontal excitation was to be reduced by a factorof 0.5 if the fundamental frequency of the upgraded equipment could be shown to be equal to orgreater than 8 Hz. This is completely reasonable and complies well with the character of the standardresponse spectra , such as RG 1.60 (see the graph on Fig. 1). From experimental data the naturalfrequencies of such type of cabinets are found to be in the range of 3 to 10 Hz [12]. As the usualstructural scheme for the cabinets is a cantilever beam, it is natural to choose an approach to supportthe cantilever at the top (Fig. 2), thus changing the natural frequency and drifting it in the range of 12to 30 Hz.
. CSd CABINET fn=3-10Hz fn=12-30Hz
3 /
support
anchorincI
I 1
M support M
Fig. 2 Structural schemes for dynamic calculation of cabinets
In this way it is considered, that not only the seismic stability of the whole cabinet is provided, butthe seismic effect over the electrical and control and instrumentation devices is reduced.
In cases with rows of cabinets the supporting at the top is preceded by uniting the separatecabinets . Uniting at the top is usually done with bolts and uniting members, the latter being pieces orcontinuous element along the whole row. The supporting at the top has different opportunities inaccordance with the cabinet location - to be anchored to the ceiling, to a neighbouring concrete wall,to the floor, to a perpendicular neighbouring row of cabinets, by uniting cabinets arranged in "horseshoe" and by vertical supporting frame. Typical details are shown on Figures 3,4,5,6.
380
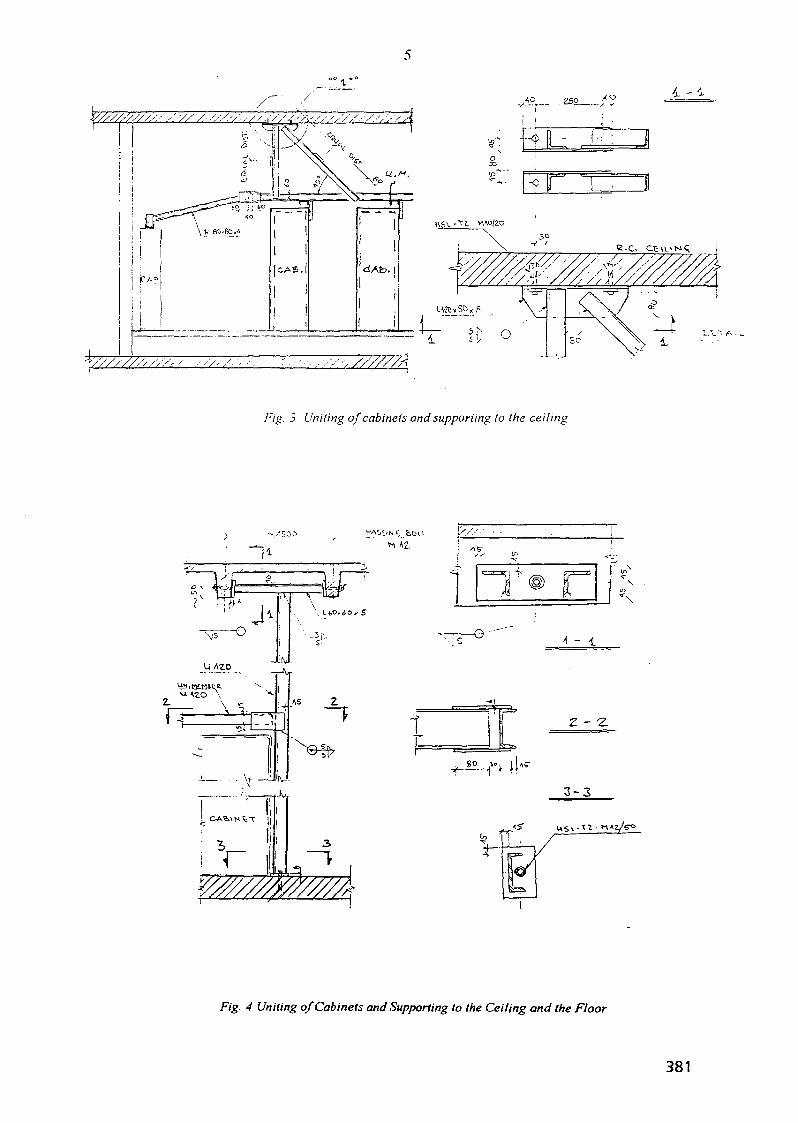
5
Fig. 3 Uniting of cabinets and supporting to the ceiling
1- <•
Z-'Z
3 - 3
Uniting of Cabinets and Supporting to the Ceiling and the Floor
381

n n/•/</. . / '/tiling of cahmets ami supporting in the columns
UNITING MEMEBER «?
LB0.8 ' "V -r-
C10
I i , ANCHORING
/•;,£». 6 Vertical Supporting Frame
It was found in Paks, that the seismic vulnerabilities of equipment were almost identical to thosedetermined for Kozloduy and that the same "easy fix" backfits would be generally applicable forPaks Practically the same concepts were applied as the initial input for Kozloduy was comparativelyclose to that assumed for Paks (Fig. 7).
382

Fig. 7 {'-niting of Cabinets and Supporting to the (''eiling in 1'aks M'l'
The development of the floor response spectra for Kozloduy units 1-4 gave the opportunity toavoid the necessity to change the system's natural frequency for cabinets located at lower levelsEven more - in the "easy fix" calculations for these cabinets the highest spectral values of theacceleration for a certain level was applied, regardless of the natural frequency. The reactions in theanchoring points were calculated to be small enough to allow very simple detailing and constructing.Simple anchoring elements with one or two anchoring bolts were applied (Fig. 8).
A-A
CABINETCOLUMN V -
At the same locations very simplebolting one cabinet to the other.
Fig. H Anchoring Detail
unification at the top was applied, often comprising of direct
3.2 TANKS AND OTHER TECHNOLOGICAL EQUIPMENT
Thin-walled tanks and similar equipment had been supported in Kozloduy and Paks in a similarmanner. They are usually supported at the top and anchored at the bottom. Supporting of verticaltanks at the top if possible is preferred because of the much greater mass compared to the cabinetsFor the lightest tanks and in cases, where the seismic excitation is shown to be weak enough, onlystrengthening of the legs and improvement of the anchoring was applied (Fig. 9).
383

/'"/#. 9 Improvement the supporting of tanks in I'aks NPP
As the upgrades are usually designed as steel supports, elements and anchorings, the technologicaland structural restrictions for minimal size do not allow taking advantage of lower excitations andrealising any considerable material economy. For control of the expenses for upgrades the backfitconcept is of the greatest importance.
Sometimes there are special problems with supporting heavy technological equipment, especiallyof such, included in the primary circuit. Equipment of this type is predominantly made of stainless orother special alloyed steel and welding to its corpse is not only difficult, but very often forbidden. Allthis requires a special approach for the support concept and design. Interesting examples are sometanks in Paks and Kozloduy NPPs (Fig. 10,11) and the pressurisers in Kozloduy NPP units 1-4(Fig. 12).
ID Seismic supporting of n Steam iiciieralor Illnutluwn Separator lank in Ko:hxliiy
384

/'/«. / / Seismic: supporting of a Steam (ieneralor Blowilown Separator lank in Kuzlodtty - detail
The pressurisers are supported to the neighbouring reinforced concrete walls, by means of specialelements (Fig. 12). It would be interesting to mention, that all the connections are dismountable.
12 Seismic supporting of I'ressunser to the wall in Kozloduy NI'P
385

10
3.3 SEISMIC UPGRADING OF BRICK WALLS.
Masonry brick walls are classified as major sources for seismic interactions. The seismicinteractions may result from the falling of one item which is not essential (brick wall) into an essentialitem. That is why if the neighbouring equipment is in the safe shutdown path, the brick walls are tobe reinforced and supported.
A practical approach for seismic upgrading of brick walls is adopted. The main concept is tosupport the walls by means of vertical standard channel steel, anchored to the ceiling, the floor andthe wall itself. The calculation procedure is reduced to determining the distance between the verticalsupporting profiles, the last depending on the mortar tensile strength, the wall height and the seismicinput. Typical details were developed for anchoring the steel channel to the floor (Fig. 13) and to thetop according to the type of ceiling (Fig. 14,15).
ANCHORING TO FLOOR
X BOLT HILTI
Fig. 13 Anchoring the steel channel lo the floor
It should be noted, that a significant economy had been realised by applying testing procedure ofHILTI HIT C20 anchor bolts [13]. The application of this procedure allows the reduction of thesafety factor v from 3 to 1.25 thus reducing the number of anchorings more than two times. This isimportant especially for anchorings of the channel to the brick wall, where their quantity is very
Fig. 14 Anchoring of the supporting steel channel to the ceiling - variants
386

11
ROOF
DETAIL T1
REINFORCE SEAM
DETAIL T4
UNITING MEMBER IH210.100 BOLT
ROOF DETAIL T9
//< /
/' //' //'A/^
'v/
U12 ^ ^
j
REINFOftCEB BEAM
HILTI BOLT
/
|
i
uoa8 U12
U12
/
II *" ~25O020
n
II
1•/I
I
I
1
I
.!_,.1
.11
—4=
LJLJ
/'7g. /5 Anchoring of the supporting steel channel to the ceiling - variants
387

12
3.4 SEISMIC UPGRADING OF BUILDINGS
EQE-Bulgaria under contracts with Kozloduy NPP has elaborated projects for seismic upgradesof a series of building structures including: Diesel Generator Building 2, Central Pump Station 2,Autonomous Pump Station, Electrical Control Building to the Diesel Generator Building of theRiver-bank Pump Station, Diesel Generator Building of the River-bank Pump Station and as asubcontractor of EQE International - Spent Fuel Storage Building. The design process itself isdifficult enough and there are a lot of problems related to it, that will not be considered in this paper.As the process of implementation of these projects has already started it is better to point out somespecific problems that have appeared.
The general idea in the seismic upgrading of buildings is to construct new bearing elements totake the seismic forces from the top of the building to the foundations such as: strengthening of roofsand floors, vertical steel X braces and outer steel braces, new shearwalls, in cases - new additionalfoundations.
The first completely upgraded building structure at Kozloduy NPP is the structure of theElectrical Control Building to the Diesel Generator Building of the River-bank Pump Station [14].The upgrading of the building of the diesel generator itself is almost completed. These buildings aretypical for the Kozloduy site, erected of precast reinforced concrete elements. The general upgradingapproach for such buildings is by placing vertical steel X braces between the reinforced concretecolumns, spanning from the roof to the basement floor (Fig. 16).
Fig. 16 New vertical steel X braces in the Diesel Generator Building
388
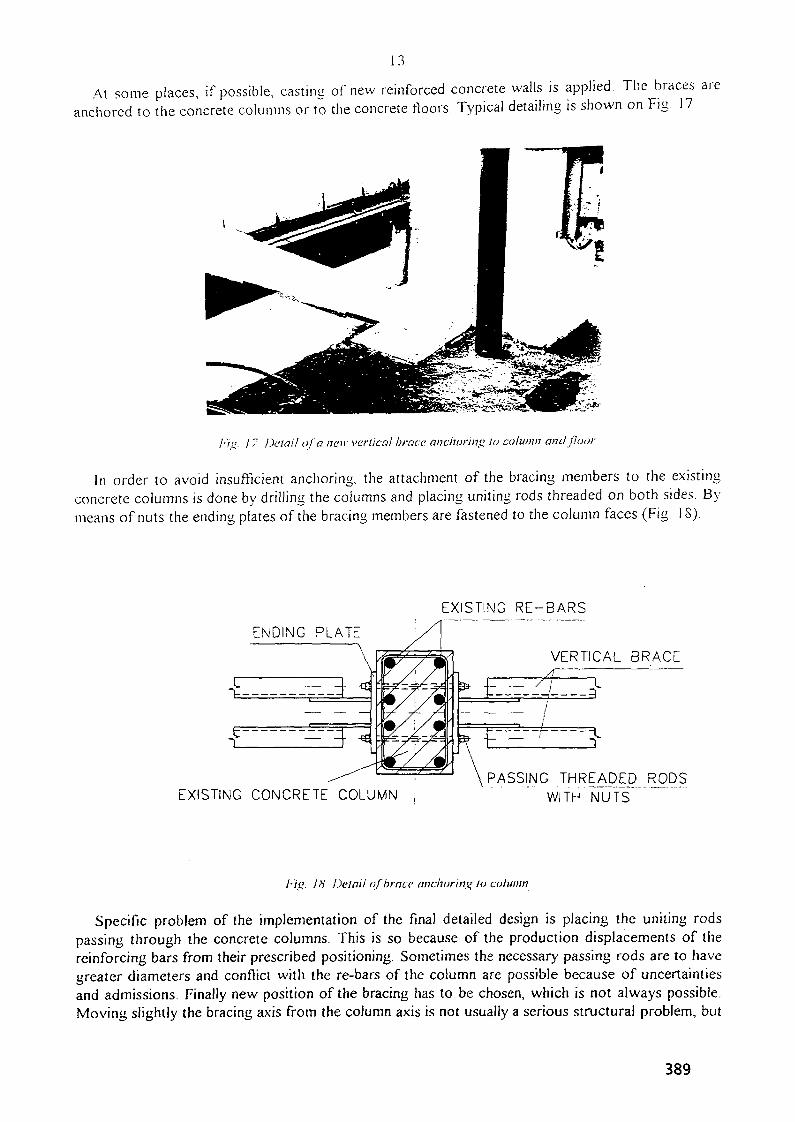
13
At some places, if possible, casting of new reinforced concrete walls is applied. The braces areanchored to the concrete columns or to the concrete floors. Typical detailing is shown on Fig. 17
/-/». / 7 Detail of a new vertical brace anchoring to column and floor
In order to avoid insufficient anchoring, the attachment of the bracing members to the existingconcrete columns is done by drilling the columns and placing uniting rods threaded on both sides. Bymeans of nuts the ending plates of the bracing members are fastened to the column faces (Fig. 18).
ENDING PLATE
EXISTING RE-BARS
VERTICAL BRACE
EXISTING CONCRETE COLUMNPASSING THREADED RODS
WITH'NUTS"""" ""
/•is,'. Jfi Detail of brace anchoring lo column
Specific problem of the implementation of the final detailed design is placing the uniting rodspassing through the concrete columns. This is so because of the production displacements of thereinforcing bars from their prescribed positioning. Sometimes the necessary passing rods are to havegreater diameters and conflict with the re-bars of the column are possible because of uncertaintiesand admissions. Finally new position of the bracing has to be chosen, which is not always possible.Moving slightly the bracing axis from the column axis is not usually a serious structural problem, but
389

14
is a serious implementation problem if the bracing member comes into conflict with neighbouringcable trays, cabinets, tubes or ducts of different type. The moving of the neighbouring device is notalways possible not to mention the additional expenses. The best decision in such case is to move thebrace to another span between the columns if it is structurally possible. Unfortunately it happens thatthe whole upgrading concept has to be changed, followed by new calculations and designrespectively requiring additional time and efforts.
Generally the application problems are connected with absence of free space to place theupgrading members. Moving of existing ducts and equipment usually comes out to be moreexpensive and time consuming than the very upgrades. All this brings up again the importance ofprecising the seismic excitation and limiting the conservatism to a reasonable point in order thatsmaller upgrading elements could be applied without safety loss.
4. CONCLUSION
The implementation of the programmes for improving the seismic safety of VVER-440 type unitsin Eastern Europe aims to increase the reliability of safety systems and reduce the influence of theexternal events in the total risk of nuclear accidents.
The re-evaluation of the design basis and design implementation from the point of view of themodern criteria for designing and construction of NPPs [15], show the leading influence ofearthquakes in the global nuclear risk. Substantial investments were directed to seismic upgrades.The approach for their realisation includes three stages.
I and II stage - short-term programmes realised during regular annual outages including theseismic upgrade of technological, electrical and C&I equipment, cable trays, pipelines and brick wallswhich are source of risk for such equipment;
III stage - long-term programmes including seismic upgrade of building structures.
Stages I and II are almost completed in Kozioduy NPP with the exceptions of some complexpipelines and cable trays.
It is possible to perform a risk reduction assessment of Kozioduy NPP based on probabilisticsafety analysis (PSA) of a Top Level Risk Study (TLRS), realised by EQE-Bulgaria [16]. Accordingto general data the realisation of stages I and II has reduced the nuclear risk of an earthquake with afactor of 7 to 10 and the influence of the earthquake as an initial external event from 50% (ordominant) to 20-25%. The realisation of the stage III will reduce the influence of the seismic eventbelow 10% which means that it will not predominate in a quite lower level of risk.
In spite of all the specific problems and difficulties of the implementation of seismic upgrades ofnuclear facilities in Eastern Europe the work is proceeding and there is a considerable effect already.
REFERENCES
[1] "Interim Report on Seismic Evaluation of Kozioduy NPP, Units 1-4", EQE-International, June.1992
[2] "Report on Seismic Assessment Walkdown of Paks NPP", Robert Campbell, EQE-International.Prepared for IAEA, Project Number INT/9/122-04, 1993
[3] "Short Term Seismic Upgrading of Kozioduy NPP, Units 1 - 4", EQE-Bulgaria ReportsNo 0202-D-02xx, 0202-D-03xx, 1992-1993
390
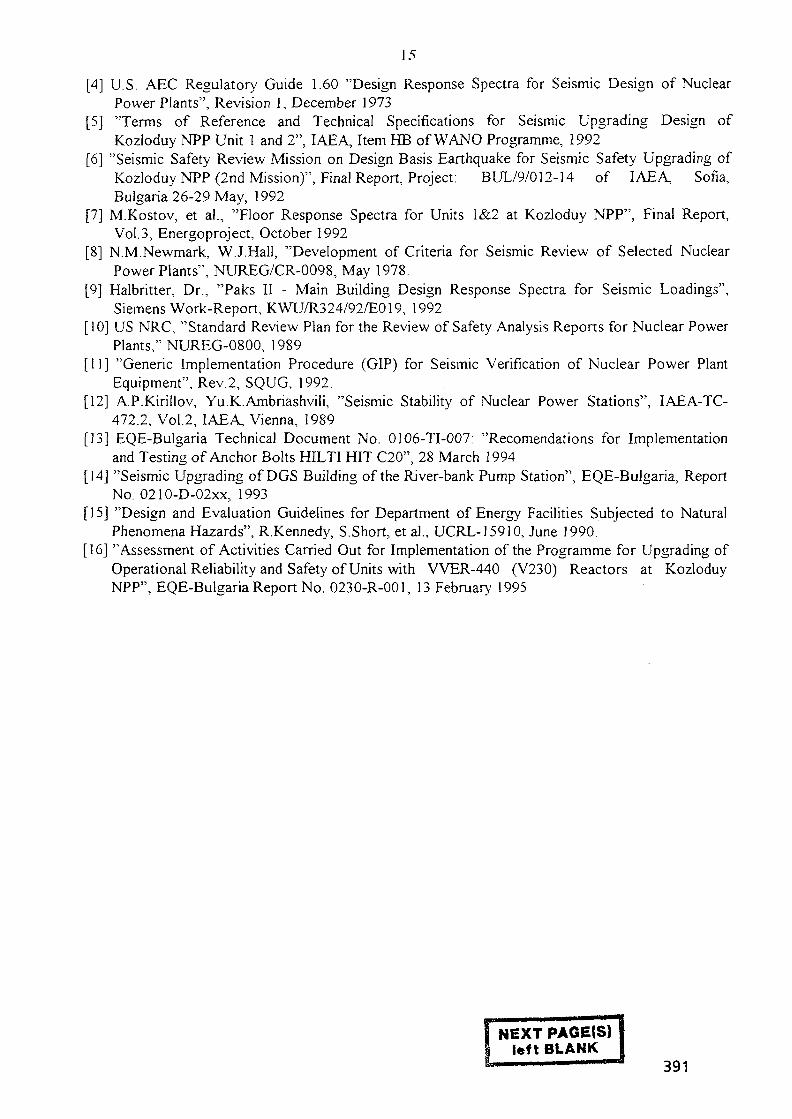
15
[4] U.S. AEC Regulatory Guide 1.60 "Design Response Spectra for Seismic Design of NuclearPower Plants", Revision I, December 1973
[5] "Terms of Reference and Technical Specifications for Seismic Upgrading Design ofKozloduy NPP Unit 1 and 2", IAEA, Item HB of WANO Programme, 1992
[6] "Seismic Safety Review Mission on Design Basis Earthquake for Seismic Safety Upgrading ofKozloduy NPP (2nd Mission)", Final Report, Project. BUL/9/012-14 of IAEA, Sofia,Bulgaria 26-29 May, 1992
[7] M.Kostov, et a!., "Floor Response Spectra for Units 1&2 at Kozloduy NPP", Final Report,Vol.3, Energoproject, October 1992
[8] N.M.Newmark, W.J.Hall, "Development of Criteria for Seismic Review of Selected NuclearPower Plants", NUREG/CR-0098, May 1978.
[9] Halbritter, Dr., "Paks II - Main Building Design Response Spectra for Seismic Loadings",Siemens Work-Report, KWU/R324/92/E019, 1992
[10] US NRC, "Standard Review Plan for the Review of Safety Analysis Reports for Nuclear PowerPlants," NUREG-0800, 1989
[11] "Generic Implementation Procedure (GIP) for Seismic Verification of Nuclear Power PlantEquipment", Rev.2, SQUG, 1992.
[12] A.P.Kirillov, Yu.K.Ambriashvili, "Seismic Stability of Nuclear Power Stations", IAEA-TC-472.2, Vol.2, IAEA, Vienna, 1989
[13] EQE-Bulgaria Technical Document No. 0106-TI-007: "Recomendations for Implementationand Testing of Anchor Bolts HILTI HIT C20", 28 March 1994
[14] "Seismic Upgrading of DGS Building of the River-bank Pump Station", EQE-Bulgaria, ReportNo. 0210-D-02xx, 1993
[15] "Design and Evaluation Guidelines for Department of Energy Facilities Subjected to NaturalPhenomena Hazards", R.Kennedy, S.Short, et al., UCRL-15910, June 1990.
[16] "Assessment of Activities Carried Out for Implementation of the Programme for Upgrading ofOperational Reliability and Safety of Units with VVER-440 (V230) Reactors at KozloduyNPP", EQE-Bulgaria Report No. 0230-R-001, 13 February 1995
NEXT PAGE(S)left BLANK I
— " " 391
XA9952667PROCEEDINGS OF SMiRT 13 - POST CONFERENCE SEMINAR 16SEISMIC EVALUATION OF EXISTING NUCLEAR FACILITIES
SEISMIC UPGRADING OF WER 440-230 STRUCTURES,UNITS 1/2, KOZLODUY NPP
D.Stefanov, M.Kostov, H.Boncheva, G.VarbanovCentral Laboratory for Seismic Mechanics and EarthquakeEngineering, Bulgarian Academy of Sciences, Sofia
ABSTRACT:
The purpose of this paper is to present final results from a big amount of computationalwork in connection with the investigations of the possibilities for upgrading of VVER 440-230structures, units 1/2, Kozloduy NPP.
1. Introduction
The first NPP's with VVER-type reactor structures have been designed and built withoutconsideration of seismic influences and on the base of simplified calculation. It's the case withNPP Kozloduy. In connection with change of site seismic characteristics and safety demandthe necessity rise of checking up and ensuring of technology systems seismic resistance of theexisting 440-MW VVER-type units in Bulgaria.
2. Description of the existing structure
The Kozloduy NPP consists of four Units of type VVER-440/230 and two units of typeVVER-1000. Units 1 and 2 are of the first type and they are constructed as twin units, i.e. Unit2 is a mirror image of Unit 1 with a temperature expansion joint in between. The layout ofUnits 1 and 2 is schematically shown in Figure 1. The expansion joint is in axis 22. The mainbuilding is composed essentially of two parts - the reactor building (between rows C and D -Figure 2) and the turbine hall (between rows A and B). Between them is located thelongitudinal intermediate part. Next to the reactor building are the smaller buildings of theventilation centre and the control rooms connected to the reactor building.
The reactor building consists of many massive reinforced concrete walls, shells and slabsirregularly distributed. The roof structure is constructed by steel trusses mounted onreinforced concrete columns. The turbine hall is a regular frame structure - longitudinal RCframes and steel trusses in transverse direction with hinge joints between them and the RCcolumns. The later are founded on separate foundations. The roof is made of prefabricatedRC panels. The turbine hall structure is divided in two equal parts by an expansion joint of 5cm in axis 12. The longitudinal intermediate building is constructed mainly by precast RCgirders and floor panels. This part connects the reactor building and the first part of theturbine hall. The second part is independent.
3. The three dimensional model of the structure
Previous investigations (1,2,3,4) proved the necessity of creating a complex 3D model ofthe main structure. The entirely different dynamic behaviour of the reactor building and theturbine hall lead to some spatial effects in the seismic response of the structure. The two partsof the turbine hall structure (separated by an expansion joint) have also different behaviour.
393

Unfavourable torsional effects appear and dominate the seismic response. As a result somestructural elements (beams and columns in the turbine hall structure) as well as thelongitudinal intermediate building will be overloaded during on earthquakes. That is why adetailed three-dimensional finite element model of the soil-structure system has been used.
The seismic input motion at the foundation level is computed by deconvolution of thedesign "free field" motion represented by three components of a generated acceleration timehistory. The local geological conditions are taken into consideration. The design "free field"spectrum and the response spectrum of the N-S component at foundation level are shown inFigure 3.
In the model the soil is represented by springs and dashpots corresponding to its stiffnessand damping characteristics.
The spatial structural model consists of 3-D beam elements with 6 degrees of freedom ateach node and 3-D rectangular hybrid finite elements with 5 degrees of freedom per node. Allcolumns, longitudinal beams and girders and roof trusses are modelled as beam elements.The roof and floor panels, slabs and shells are modelled with rectangular elements.
4. Investigation of the original structure
Dynamic and static analyses of the original structure are performed using programSTARDYNE. The verification of the mathematical model is made using the results from afull-scale test. The first mode of vibration is shown in Figure 4 and the fourth mode - in Figure5. The main characteristics of the response are:- the response of the independent part of the turbine hall building (between axes 1 and 12) isprimarily in transverse direction. The rotation of that part can be clearly seen.- the response of the other part (between axes 12 and 24) is predominantly in longitudinaldirection.- the intermediate building is loaded in an unfavourable way because of the different stiffnessof the reactor building and the turbine hall.- the displacements of some control nuda! points (at the ends of the turbine hall "tail") arelarger than the permissible ones.
Several variants of combination of the internal forces due to the static and dynamic loadingare performed in order to get the most unfavourable loading condition. The position of thecrane is changed in different places of the turbine hall. The bearing capacity of all structuralelements is checked. The girders at the upper levels in the longitudinal frames of the turbinehall are assessed that they could not resist the respective forces. The bearing capacity ofalmost all columns in raw "A" and some of columns in row "B" is found as insufficient. Thefinal conclusion is that the structure should be upgraded.
5. Investigation of the upgraded structure
The basic idea of the structure upgrading consists in an increasing of the stiffness by addingof additional elements - mainly diagonal bracing for the RC frames, steel stretch bars, girders,etc. The distribution of those elements in the existing structure is of great importance becausethe stiffness concentration should be avoided. The places of the additional elements should bein accordance with the technological requirements too. The stiffness of the existing structurecould be increased also by strengthening of the structural elements cross section. The existingrigid structural elements (e.g. the stair-cases) should be used to support the more flexibleparts of the structure.
Different variants of strengthening are analyzed (5). For each separate case a capacitychecking of the bearing structural elements is performed. The displacements of some nodalpoints are controlled also.
394

Several alternatives of upgrading are investigated in order to find the optimum solution.The final variant (Figure 6) incorporates the following additional elements and connections:
1. Steel bracing diagonals 2L 125/125/10 in the spans of the RC frames shown in Figure6.
2. Steel stretch bars 130 along axis 10 (from row"B" up to the end span of diagonals) at fourlevels in control room.
3. The girders at level 18.70 m in whole row "A" and in the "tail" only of row "B" arestrengthened connecting the two girders in a "box-like" cross section.
4. All columns in row "A" and the columns in the "tail" of row "B" are strengthened in theupper part (over the crane path) by steel plates with dimensions 20/2 cm placed in thecorners of each column.
5. There are stiff beam connections between two adjacent columns (forming the expansionjoint) at all levels of girders in longitudinal frames.
6. In the intermediate building (between rows "B" and "W") in the spaces between levels20.80 m and 28.40 m "K-bracing" 2L 125/125/10 are put.
7. There is a steel connection (2L 125/125/10) between turbine hall, row "B" at level 28.40m and the reactor building, row "W" at level 33.60 m.
8. There are two inclined connections (2U20) between control rooms and the frame in row"B".
9. Additional steel girders are put between the control room and the longitudinal frame ofthe turbine hall.
The dynamic analysis of the "upgraded model" shows that the added stiffness is sufficient -the displacements of some characteristic nodal points are smaller than the allowable ones.The reduction of the displacements is shown in Table 1. The first mode of vibration is shownin Figure 7. The fundamental period is reduced considerably.
A capacity check of all structural elements is performed according to Bulgarian Code fordesign of concrete and reinforced concrete structures (Sofia, 1988). The checking is done foreccentric compression or eccentric tension about the two principle axes of the cross section.As a criterion for safety of the elements is assumed the ratio of the bending moment ofmaximum internal forces to the moment of the external forces. A ductility factor is usedelement by element to account the nonlinear capacity of the RC members. The factor usedfor columns is 1.25 and for girders 1.5 respectively.
Several positions of the crane are investigated. First the crane is put in axes 20,21,22. Theresult is overloading of the columns at these axes. This is the reason to put "K-bracing" in theintermediate building. The second position of the crane is in axes 10,11 and 12. This place is atypical one because there is an expansion joint between the two parts of the building. Thethird position of the crane is in axes 5,6 and 7 (middle of the "tail" structure).
Looking at the shear force values in all elements there are not considerable problems.Nevertheless additional connection are needed between the top of columns (level 28.40) andsteel trusses.
6. Optional upgrading of the structure
The idea is to use the possibility of fixing the parking position of the crane and performupgrading for that particular load case. In that way a considerable amount of upgradingstructures could be saved. The new option is described as it follows:
395
1. Crane in the turbine hall is located in axes 12 13 and 14. This is one usual parkingposition of that crane.
2. Static and dynamic calculation of the complete building is performed only for thatparticular crane position.
As a result of this analyses the following reduction of the already proposed upgrades can bedone:
- remove the upgrades of the RC columns above level 18. m in row "A" and "B" everywhereexcept row"A", axes 13 and 14.
- remove the "K-bracing" in axes 22,21,20 and 19.
A precondition for acceptance of that optional proposal is the elaboration and the strictcontrol for implementation of an operational procedure to use the crane in turbine hall. Theprocedure should minimize the crane stay in other positions and should assure the parkingposition as described.
7. Conclusion
The main building of Unit 1/2 is a complicated structure - there is a great variety in heightand stiffness of the different structural parts. The analyses of the seismic behaviour haveshown weak elements that should be improved. This is achieved by strengthening of thebuilding. There are two main requirements - decreasing the large displacements andincreasing the bearing capacity of some structural elements. In the case of Unit 1/2 thestructure is upgraded by adding additional stiffness but also by connecting stiff structuralelements with more flexible parts in order to redistribute seismic forces. As a whole thestructural stiffness is increased and the displacements due to seismic response are decreased.The bearing capacity of the upgraded structure is checked, the dynamic behaviour of theupgraded building satisfies the requirements for seismic safety of critical facilities.
The seismic upgrading of existing NPP is usually very complicated and expensive. Theengineering solution is to find the optimum variant between the economy and safety of theupgrading and to satisfy these conflicting requirements.
8. Acknowledgements
This work is performed in cooperation with Energoproject PLC, Sofia. The authors areexpressing deep acknowledgement to Dr. Arturo Ordonez, Empresarios Agrupados, Spain,for the highly professional support during the investigation process.
9. References
1. Kostov M. et al.Floor response spectra, Unit 1/2, Kozloduy NPP, Final report C31 - 128, Energoproject,Sofia, 1992.
2. Kostov M. et al.Seismic capacity of turbine building, Final report, Task 2-3. Six month WANO Program, ItemHB. Energoproject/WESI/EA. 1992.
3. Kostov M., D.Stefanov, H.BonchevaResponse and capacity evaluation of Unit 1-2, Kozloduy NPP, SMiRT-12 Post ConferenceSeminar No.16, Vienna. 1993.
396

4. Rostov M., H.Boncheva, D.Stefanov,Main features of the Units 1-4 building complex, Kozloduy NPP in respect to seismic safety.,SMiRT-12 Post Conference Seminar No. 16, Vienna. 1993.
5. Kostov M. et al.Design seismic upgrades for the turbine building. Task 3-6. Six month WANO Program, ItemHB. Phase 3, Energoproject/WESI/EA. 1994.
TABLE 1
NODAL POINT DISPLACEMENT (m)ORIGINAL AND UPGRADED MODELS
Nodal
point
Row "A"
797792
Row "B"
803796
Row "A"
594
Along X-direction
Originalmodel
, Level 28.40
.3642
.3387
, Level 28.40
.3643
.3387
, Level 18.70
.2719
Upgradedmodel
.0374
.0362
.0374
.0336
.0287
Along Y-direction
Originalmodel
.1293
.1294
.0661
.0662
.0863
Upgradedmodel
.0294
.0294
.0271
.0271
.0304
397

s .« \i I u—c—u u "\i'ii u-u—u u u u u u
Figure 1. Main building, Layout
Figure 2. Main building, cross section
0.50
0.00PERIOD /•/
Figure 3. Acceleration response spectrum at foundationlevel and design spectrum, N-S component
398

ORIGINAL STRUCTURE'S MODEL
Figure 4. First mode of vibration, Tl=1.3915 s
ORIGINAL STRUCTURE•S MODEL
Figure 5. Fourth mode of vibration, T4=0.5377 s
399

UPGRADED STRUCTURE ' S MODEL
Figure 6. General view
UPGRADED STRUCTURE • S MODEL
Figure 7. First mode of vibration, Tl=0.5815 s
400
1XA9952668
PROCEEDINGS OF SMiRT 13 - POST CONFERENCE SEMINAR 16SEISMIC EVALUATION OF EXISTING NUCLEAR FACILITIES
SEISMIC UPGRADING OF PIPING SUPPORTS IN VVER 1000MW
Martin F. SchmidtStuessi & Partner, Engineering Consultants, Zuerich, Switzerland
ABSTRACT: Russian VVER type nuclear power plants were initially designed for a horizontalearthquake peak acceleration of O.lg. Since a level up to 0.2g is now considered more realistic, areassessment of the seismic capacity of safety relevant piping systems and supports is of greatimportance. An improved behaviour can be obtained by adding more or better support devices. Inthe current paper, two types of inexpensive and easily implementable motion limiting devices arecompared.
1. INTRODUCTION
The improvement of the support configuration for an existing piping system requires an optimalchoice of the number, position and type of additional support devices. In the current work, twoeasily implementable motion limiting devices are examined and compared: viscous dampers andgaps. An important issue is the tradeoff between stresses in pipings and support loads.
2 MOTION REDUCTION BY GAPS
The introduction of gaps is an inexpensive and effective method to reduce seismically inducedlarge amplitude motion while allowing free thermal expansion and free low-amplitude vibrations.The energy accumulation of a resonant mode is limited mainly by perturbing the phase lagbetween excitation and response such that a resonant behaviour is not possible (Messmer, 1993).
A sample piping system has been used to numerically investigate the behaviour of a pipingsubsystem with motion reducing gaps. The system shown in figure 1 consists of a straight pipe of10m length, simply supported at both ends. The cross sectional properties and overall dimensionscorrespond approximately to segments of the emergency feedwater system of VVER 1000MWreactors.
In a first step, the system was excited by a sine ground acceleration input with 0.5g amplitudeand a frequency near the resonant frequency of the pipe without gap support. The response has beenanalyzed during 15 seconds starting from a motionless initial state.
Without gap, a maximum amplitude of 559mm is reached. In the following, this amplitude waslimited by introducing a symmetrical 20mm gap with a finite stiffness. The non-linear supportstiffness is shown in figure 2. Several choices of the gap stiffness have been tested. In figure 3, themaximum stress in the piping system and the maximum gap reaction and displacement are plottedagainst the relative gap stiffness for a 20mm symmetrical gap.
401

Figure 1 - Sample piping subsystem with gap support
Force Relative gap stiffness
48 E lI3
Displacement
Figure 2 - Non-linear stiffness of the gap element
10
8 - -B-
Maximum displacement (cm)Maximum bending stress (daN/mm2)Maximum gap reaction (kN)
10 20 30 40Relative Support Stiffness K
50 60
Figure 3 - Maximum gap reaction and maximum stress in pipe as a function of therelative stiffness K
402
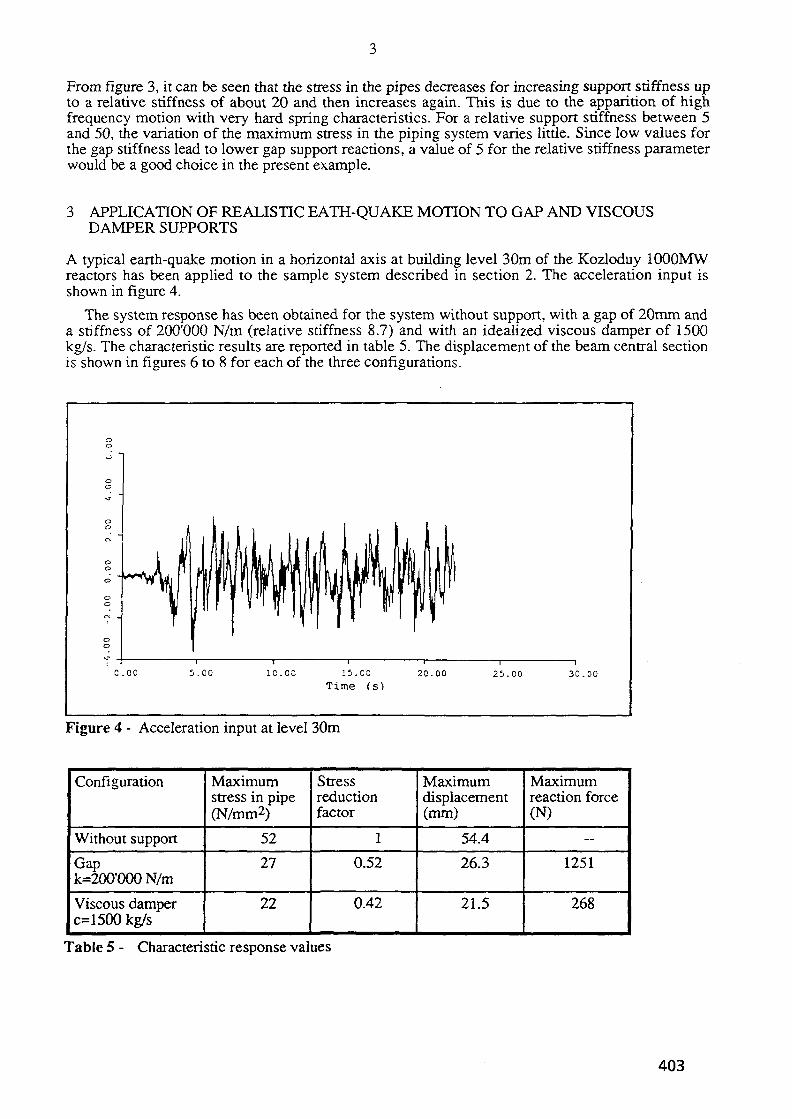
From figure 3, it can be seen that the stress in the pipes decreases for increasing support stiffness upto a relative stiffness of about 20 and then increases again. This is due to the apparition of highfrequency motion with very hard spring characteristics. For a relative support stiffness between 5and 50, the variation of the maximum stress in the piping system varies little. Since low values forthe gap stiffness lead to lower gap support reactions, a value of 5 for the relative stiffness parameterwould be a good choice in the present example.
3 APPLICATION OF REALISTIC EATH-QUAKE MOTION TO GAP AND VISCOUSDAMPER SUPPORTS
A typical earth-quake motion in a horizontal axis at building level 30m of the Kozloduy lOOOMWreactors has been applied to the sample system described in section 2. The acceleration input isshown in figure 4.
The system response has been obtained for the system without support, with a gap of 20mm anda stiffness of 200'000 N/m (relative stiffness 8.7) and with an idealized viscous damper of 1500kg/s. The characteristic results are reported in table 5. The displacement of the beam central sectionis shown in figures 6 to 8 for each of the three configurations.
C . 0 0 1.00 10.00 • 5 . C O
Time (s)
—i
20.00—I
2 5 . 0 0 30.00
Figure 4 - Acceleration input at level 30m
Configuration
Without support
Gapk=200'000 N/m
Viscous damperc=1500 kg/s
Maximumstress in pipe(N/mm2)
52
27
22
Stressreductionfactor
1
0.52
0.42
Maximumdisplacement(mm)
54.4
26.3
21.5
Maximumreaction force(N)
—
1251
268
Table 5 - Characteristic response values
403
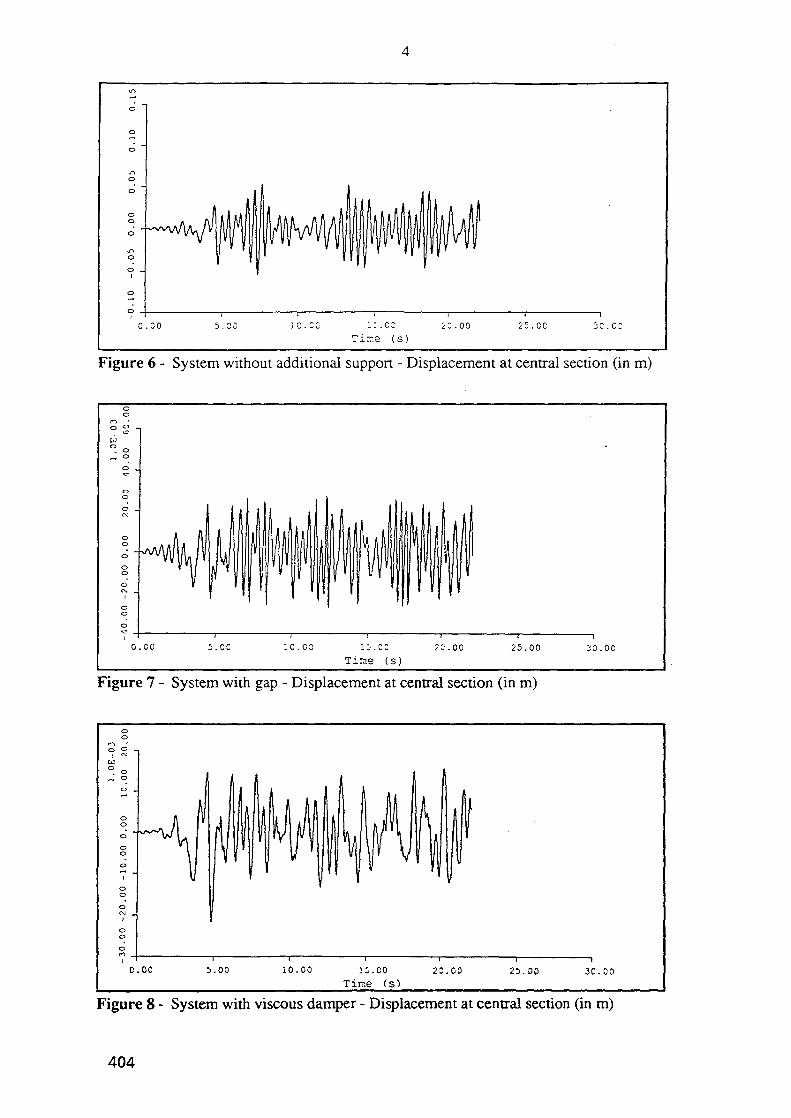
Figure 6 - System without additional support - Displacement at central section (in m)
0.00—I
5 . C G 1 0 . C O i i . C 0
T i n e (s )
—i
20.00—I
2 5 . 0 0120.00
Figure 7 - System with gap - Displacement at central section (in m)
coo—I
5 . 0 0 1 0 . 0 0 IS.CO
Tirr.e ( s )
—i
20 .00—I
2 5 . 0 0—I
30 .00
Figure 8 - System with viscous damper - Displacement at central section (in m)
404
From the results presented above, the following conclusions can be drawn:• Both gaps and viscous dampers allow an efficient reduction of the stress in pipes
• Viscous dampers lead to lower support reactions for a comparable reduction of the pipe stresses.Energy accumulation is reduced by an increased modal damping factor. From figures 7 and 8, itis evident that the average vibration amplitude is much lower for the system with viscousdamper although the peaks are of comparable magnitude.
The main advantage of the gap solution is the very low cost. In fact, a stiffness such as the one usedabove can be realized easily by a typical steel construction of the support (cantilever beam, beamframe, etc.). As general guideline, gap motion reduction is appropriate for light structures (lowreaction forces, high bending stresses) whereas viscous dampers are useful in systems where highreaction forces are the dominant problem.
4 PRACTICAL CONSIDERATIONS FOR VVER 1000MW REACTORS
Actual calculations on the 1000MW VVER plants are currently just starting such that only fewresults are available. Preliminary results indicate that most of the safety relevant piping subsystems(systems required for the safe shutdown of the reactor after an earthquake) receive rather lowseismic stresses. This is due to the fact, that the piping subsystems are rather short and have largecross-sections.
For the VVER primary sytem under study, upgrades, if any, will most probably be orientedtoward reduction of the reaction forces at supports or strengthening of the support structures.Considering rhe results of section 3, an application of viscous dampers could be of interest if largeamplitude resonant motion occurs.
5 CONCLUSIONS
Motion reduction by gaps and viscous dampers in seismically excited piping systems has beenstudied by numerical examples. Both devices allow an efficient reduction of pipe stresses and bothare inexpensive and easy to implement. Gaps are probably the most efficient means for the motionreduction of smaller diameter piping subsystems.
Though the implementation of gaps or viscous damper elements is straightforward, their analysisneeds some additional consideration. In fact gaps are highly non-linear elements, and localizedviscous dampers result in complex mode shapes. In the current study, calculations were performedby direct time integration. If modal superposition or response spectrum analysis are to be used,linearization procedures can be applied (see for example zum Felde & Haas or Tang, Jaquay &Larson).
REFERENCES
zum Felde, P.& Haas, E. 1987. Consideration of local damping mechanism in modal FEM analysisof piping systems. In SMiRT 9 - Transactions of the 9th International Conference on StructuralMechanics in Reactor Technology, Lausanne. RotterdanrBalkema
Messmer, S. 1993. Repeated impacts in a piping system under seismic excitation. In SMiRT 12 -Transactions of the 12th International Conference on Structural Mechanics in ReactorTechnology, Stuttgart. Elsevier
Tang, H.T. & Jaquay, K.R: & Larson, J.E. 1987. Simplified nonlinear dynamic piping analysismethodology development. In SMiRT 9 - Transactions of the 9th International Conference onStructural Mechanics in Reactor Technology, Lausanne. Rotterdam:Balkema
NEXT PAGE(S) Ileft BLANK |
— 405
XA9952669
METHODOLOGY AND RESULTS OF THE
SEISMIC PROBABILISTIC SAFETY ASSESSMENT OF
KRSKO NUCLEAR POWER PLANT
M.K. Vcrmaut, Ph. Monette
IVestinghoitse Energy Systems Europe. Brussels. Belgium
20. Bvd. Paepsem. 1070 Brussels. Belgium
lei. 32-2-5568625; fax. 32-2-5568758
R.D. Campbell
EQE International. Irvine. CA. USA
ABSTRACT
A seismic IPEEE (Individual Plant Examination for External Events) was performed for the
Krsko plant. The methodology adopted is the seismic PSA (Probabilistic Safety Assessment).
The Krsko NPP is located on a medium to high seismicity site. The PSA study described here
includes all the steps in the PSA sequence, i.e. reassessment of the site hazard, calculation of
plant structures response including soil-structure interaction, seismic plant walkdowns.
probabilistic seismic fragility analysis of plant structures and components, and quantification
of seismic core damage frequency (CDF). Also, relay chatter analysis and soil stability studies
were performed. The seismic PSA described here is limited to the analysis of CDF (level 1
PSA). The subsequent determination and quantification of plant damage states, containment
behaviour and radioactive releases to the outside (level 2 PSA) have been performed for the
Krsko NPP but are not further described in this paper. The results of the seismic PSA study
407
indicate that, with some upgrads suggested by the PSA team, the seismic induced CDF is
comparable to that of most US and Western Europe NPPs.
1. INTRODUCTION
This paper describes the seismic Probabilistic Safety Assessment (PSA) performed for the
Krsko plant. Krsko is a Westinghouse 2 loop PWR. The safe shutdown earthquake level
specified for design is 0.3g PGA, with Reg.guide 1.60 design response spectra.
The seismic PSA is one of the options for performing a seismic Individual Plant Examination
for External Events (IPEEE), i.e. examining NPPs for beyond design basis loadings. A seismic
margins assessment is another alternative. However, for Peak Ground Accelerations (PGAs)
above 0.5g, a PSA is the only acceptable method. The PSA study was conducted in strict
accordance with the criteria specified by the USNRC for the evaluation of NPPs for beyond
design basis events and was reviewed by the IAEA.
The seismic PSA described here is limited to the analysis of core damage frequency
(CDF)(level 1 PSA). The subsequent determination and quantification of plant damage states,
containment behaviour and radioactive releases to the outside (level 2 PSA) have been
performed for the Krsko NPP but are not further described in this paper ([4]).
The different sections of this paper describe the successive building blocks of the seismic PSA
study. Obviously, no detailed methodology descriptions can be provided for each of the
sections. This paper intends to illustrate the application of the seismic PSA methodology to the
Krsko plant, using the Krsko specific assumptions, inputs and results.
408

2. SEISMIC HAZARD
A site-specific seismic hazard analysis was prepared for the Krsko NPP site by the University
of Ljubljana Institute of Structural and Earthquake Engineering. The process of the Krsko NPP
site seismic hazard analysis is not further described in this paper; only results from the process,
to be used in the Krsko seismic PSA, are included here.
The hazard analysis has resulted in the determination of probabilistic hazard curves and
uniform hazard response spectra. The probabilistic hazard curves expressing frequency of
exceedance as a function of PGA are shown in Figure 2.1. PGA is the motion input parameter
in terms of which seismic fragilities (see sections 3 and 4) are most commonly expressed.
Figure 2.2 shows the probabilistic response spectral accelerations corresponding to a uniform
hazard of 10000 years. These spectral shapes, referred to as Uniform Hazard Spectra (UHS)
were used in the calculation of soil structure interaction and building response analysis (section
3).
Local earthquakes.
Accelerographs installed in the buildings of the Krsko NPP and surroundings have recorded
several small magnitude local earthquakes in the past. All records demonstrate very short
duration of strong ground motion (less than 1 second). The input energy of such ground motion
is very small. High frequencies are clearly predominant in the response spectra for the local
earthquakes (sharp peaks occurring in the frequency range 11-12Hz). Accelerograms, obtained
at the foundations of buildings simultaneously with the free field motion, are systematically
much smaller than at those on tne surface. Studies following a 1989 local earthquake at Krsko
NPP have aimed at numerically simulating this reduction in acceleration. According to
409

experience, such ground motions do not damage buildings and equipment located in the
buildings. Rather, the concern is restricted to functional failures of devices such as relays
which are sensitive to high frequency albeit small displacement motion.
Theoretically, these frequently occurring small local earthquakes could affect the shape of the
UHS and the seismic hazard curves, leading to a higher seismic risk. However, acceleration
spectra, traditionally used for design of structures and used for the fragility analyses of this
Krkso seismic PSA study, do not provide any information on the duration of ground motion
and do not take into account this parameter, which is of great importance as a measure of input
energy. It was therefore believed not correct to combine the influence of strong earthquakes
with 'standard" characteristics (larger magnitude earthquakes from distant sources), and of
weak local earthquakes with short duration and predominant high frequencies. The
characteristics of the first type are defined by spectra obtained by the probabilistic seismic
hazard analysis as described above (results shown in Figures 2.1, 2.2). The second type
corresponds to small local'earthquakes. An idealized spectrum (see Figure 2.3) is used to
represent the latter. It was concluded from the seismic hazard analysis that peak ground
accelerations greater than 0.5g were not expected from local earthquakes. However, data were
insufficient to develop a probabilistic description of the hazard due to local earthquakes. The
approach taken in the Krsko PSA study is to assume that a local earthquake PGA of 0.6g will
not be exceeded in less than 10000 years, making the local earthquake PGA hazard comparable
to the PGA hazard for distant earthquakes.
Structural response studies performed on an equivalent basis for the local and the distant
earthquakes show that response spectra for the distant earthquakes generally exceed the
corresponding spectra for local earthquakes. Exceptions where the local earthquake spectra
exceed the distant earthquake spectra are limited to some higher building elevations, and to a
410

narrow frequency band around I l-12Hz. Given the non-damaging character of local
earthquakes, only the impact of the local earthquake spectra on the relay seismic capacity
evaluations is considered to be of any significance.
3. SOIL STRUCTURE INTERACTION AND BUILDING RESPONSE ANALYSIS
For seismic PSA purposes, it is of fundamental importance to obtain realistic estimates of
structural responses to the postulated seismic events. In general, floor response spectra and
structure member forces developed for the Final Safety Analysis Report (FSAR) are considered
to be conservatively biased. Hence it was decided to generate new seismic structural responses
using current state-of-the-art techniques, and to avoid any intentional bias in the analysis with
respect to soil-structure modeling. In order to generate seismic results in a form convenient for
the development of structural and equipment fragilities (section 4), a probabilistic approach
was adopted.
The structures included in the study were the Main Complex (MC), the Diesel Generator
Building (DGB) and the Essential Service Water Intake Structure (ESWIS). The MC is formed
by the reactor building, intermediate building, control building, fuel handling building.auxiliary
building and component cooling building. Since all the buildings at the MC are on a common
foundation, the analyses were performed considering all of them.
The objectives of this part of the study were twofold:
• To estimate median structure forces and the variability about the median for all major
structures of interest, for input to the seismic fragility analysis of these plant structures
(section 4).
411

• To develop probabilistic floor response spectra in all major structures for use in the seismic
fragility analysis of equipment located within the plant structures.
The approach to probabilistic response analysis was to perform multiple deterministic SSI
analyses using the methodology described herebelow. Input motion and SSI parameters
(structural frequency and damping, and soil shear modulus and damping) were sampled
following the Latin Hypercube Sampling method. As a result of multiple deterministic analyses
using the sampled input values, distributions were obtained of the analysis results - i.e. loads in
structural elements and in-structure response spectra. These distributions are then described by
the median (50th percentile) values and the variability (represented e.g. in the 84th percentile
curve).
As both the seismic hazard and the structure/component fragility curves (consistently) use the
PGA as the reference seismic input parameter, SSI and probabilistic structural response
analysis were performed for a reference PGA value. However, direct scaling of results from
one earthquake level to another is not strictly correct due to nonlinearity in soil behaviour.
Also, due to the complexity of the structural model and the probabilistic (multiple time history)
analysis method used, a single level of earthquake was desired rather than multiple
earthquakes. Past studies have shown that the greatest risk comes from earthquakes 2 to 3
times the SSE. For the Krsko PSA, 2 times the SSE level was chosen as the level that would
challenge the weaker elements of the plant which would govern risk. For those components
with much higher capacity, scaling the response for an input of 2 times the SSE would tend to
be conservative since higher input levels that would challenge these components would result in
more attenuation in soil-structural amplification.
412
In probabilistic response analysis, the characteristics of the free-field ground motion is defined
by the shape of the median uniform hazard spectrum (UHS) corresponding to a return period of
interest. For the Krsko PSA, the UHS shape corresponding to the 10000 year return period was
used (see Figure 2.2).
The elements of the SSI and probabilistic response analysis are outlined below. The approach
is based on work performed under the SSMRP (Seismic Safety Margins Research Program,
[2|). Analysis results are also provided below.
• Specifying the free-field ground motion.
Since the SSE level for Krsko is 0.3g PGA, the median UHS shape for the probabilistic
analyses was anchored to a PGA of 0.6g. To perform the probabilistic analysis, an
ensemble of 30 earthquakes was developed to capture the randomness of the seismic input.
The median (50% non exceedance probability - NEP) matches the median UHS, and the
84th percentile (84% NEP) of the spectra matches the 84th percentile of the UHS, as is
shown on Figure 3.1 (UHS spectra anchored to 0.6g PGA). To account for the effects of
deconvolution in the SSI analysis of the Main Complex, the motion at the embedment depth
of this structure was determined by deconvolving the surface ensemble of the time
histories, using soil properties compatible with the other analysis steps. For comparison
with Figure 3.1. Figure 3.2 shows the comparison between the 50% and 84% NEP of the
deconvolved spectra with the 50% and 84% NEP UHS.
• Development of the soil models, i.e. defining the soil profile and performing the site
response analysis.
For the low strain soil properties and the dynamic soil properties, best estimate values were
obtained from previous studies. A site response analysis was performed for the 0.6g PGA
level to establish median strain compatible soil properties. For the probabilistic SSI and
413
response analysis, the distribution of soil parameters was required. A lognormal
distribution was taken for each parameter (soil shear modulus and soil damping), with a
coefficient of variation based on previous work and expert judgement.
• Calculating the foundation impedance functions and wave scattering effects.
The high strain soil properties obtained above were used to develop impedance functions
for the three structures (MC, DGB, ESWIS).
• Determining the fixed-base dynamic characteristics of the structure.
Structural models developed for the original Krsko design analyses (and reported in the
FSAR) are representative of current procedures, and may be considered as best estimate
models for the purpose of this study. SSI effects were incorporated using foundation
impedance functions to replace the soil springs representing the supporting soils flexibility
in the original design analysis. As for the soil properties, the structural frequencies and
structural damping are probabilistic parameters which were assigned lognormal
distributions and typical coefficients of variation representing all modelling and random
uncertainty in the estimation of the median values. The largest variabilities for the Krsko
analyses are in the soil parameters.
• Performing the SSI analysis, i.e. combining the previous steps to calculate the response of
the coupled soil-structure system.
The SSI and structural response analysis results of interest include peak accelerations,
maximum member forces, and floor acceleration time histories. These quantities are needed for
downstream fragility development.
Floor acceleration time histories computed for each of the 30 simulations performed were post-
processed into 5% damped floor response spectra. For each location, the spectral accelerations
were fitted to a lognormal distribution and the median and 84th percentile values were
414
extracted. An example comparison between the calculated median in-structure response spectra
and the Krsko FSAR design spectra is given in Figure 3.3 (the example applies to the Main
Complex). The most notable difference between the FSAR and the median centered spectra is
the frequency at which the spectral peak occurs. This shift can be explained through a shift in
the dominant frequency of the SSI and structural response, which is caused by the lower
median soil stiffness properties corresponding to the 0.6g PGA earthquake level which is higher
than the 0.3g PGA SSE level used in the FSAR.
Local earthquakes.
As indicated in section 2, a distinction was made between low energy local earthquakes and
large magnitude distant earthquakes.
Deterministic SSI and structure response analyses were performed for a representative local
earthquake which was determined to be an approximate 84th percentile amplification from
recorded close-in earthquakes. Response was compared, on an equivalent basis (a median
response analysis of a 84% NEP close-in free field input response spectrum), to results from
the response analyses (84% NEP response to 50% NEP free field input) for distant
earthquakes.
Analysis showed that the local earthquake frecfield motion is attentuated considerably. Indeed,
the system (soils + structure) frequency is not in the amplified portion of the input spectra of
the local earthquake. In contrast, the distant sources with low frequency cause significantly-
higher response. Therefore, it is generally seen that the floor response spectra from the distant
earthquakes envelop the corresponding floor response spectra calculated for the local
earthquake. However, for a limited number of locations at higher elevations in the buildings.
415
the local earthquake did induce higher response than the distant sources, in the limited 11-12Hz
frequency range. However, based on the fact that local earthquakes, with the very short
duration and small energy input are deemed not to cause damage to structures and not to
structurally fail equipment, the exceedances of the local over the global response spectra are
only taken into account in the seismic capacity assessment of relays (section 6).
4. FRAGILITY ANALYSIS
Background on the probabilistic seismic fragility curve representation and development is
provided in [1].
4.1 Seismic Walkdowns
Past experience in conducting seismic PSA and seismic margin assessments has shown that the
walkdown is generally a very beneficial task in a seismic IPEEE. A walkdown conducted by
experienced engineers is valuable in order to identify any potential seismic vulnerabilities and,
using knowledge regarding the performance of structures and equipment in strong motion
seismic events, screen out the inherently very rugged components and assemble data on the
components for which plant specific fragility curves will be developed (to a required level of
detail as described in section 4.2).
The Krsko PSA seismic walkdown scope of survey included:
• structures (MC, DGB, ESWIS)
• safe shutdown equipment including support systems: pumps, tanks, heat exchangers, diesel
generator system, batteries, HVAC, electrical cabinet
416
• piping and piping components (per P&IDs): support configurations. 11/1 issues, valve
operator proximity, ...
• cable trays: sample
• instrumentation and tubing (per P&IDs)
The general observation from the walkdown was that the design was conservative and that the
plant was quite rugged. Potential vulnerabilities of a few items of equipment were observed.
These included:
• poor anchorage welding on few electrical cabinets
• low bending capacity of support legs of one tank (the corresponding low seismic capacity
was confirmed from the fragility calculations of the tank)
• control room ceiling support required reinforcement
Fixes were recommended for the above issues, as they were easy fixes which would increase
the seismic capacity of the components to a generaiiy adopted screening level (as per section
4.2).
Seismic-fire and seismic-flooding interaction waikdowns were also performed, in order to
identify potential seismic sources of fire and flooding respectively.
4.2 Screening Level for Seismic Fragility Analysis
From the safe shutdown equipment lists and following the seismic waikdowns of the plant, 37
equipment items (i.e. individual components or groups of components) were retained for
fragility analysis, in addition to the essential structures (MC, DGB, ESWIS).
417

However, from a verification of the impact on CDF. it was determined that structures and
components could be 'screened out' if their High Confidence of Low Probability of Failure
(HCLPF) was about 0.74g PGA or greater or their median capacity was about 2.0g PGA or
greater. If it could be determined through a conservative analysis that the screening level was
exceeded for a structure or component, no further detailed fragility analysis would be
performed, and the conservatively low screening capacity level wouid be assigned to that
structure or component. The impact of this conservatism on the resulting CDF is marginal.
4.3 Seismic Fragilities of Plant Structures and Equipment
Seismic fragility curves were calculated for plant structures and components. The seismic
fragility of a component is defined by a curve that gives the conditional probability of failure as
a function of the reference seismic input motion parameter (PGA in the case of the Krsko
study). Randomness and uncertainty are tracked throughout the fragility analysis and
incorporated into a family" of probabilistic curves ([ 1]).
Sources of plant documentation to support the fragility analyses included original design
analysis, seismic qualification reports, plant drawings as well as data and notes on expected
limiting failure modes collected during the walkdowns.
The determination of the seismic capacity of plant structures normally requires the evaluation
of a number of parameters such as strength, inelastic energy dissipation, response
characteristics, ... including the determination of median factors and associated variabilities.
For all the Krsko structures, the single strength parameter could be demonstrated to be
sufficiently high for the screening seismic capacity level to be met, without further detailed
418

evaluation of inelastic energy dissipation nor evaluation of the variabilities associated with the
various parameters contributing to the seismic capacity.
Similarly, the seismic capacity of the majority of plant safe shutdown components was found
to exceed the screening level. Provided the fixes of seismic vulnerabilities identified during the
walkdown are implemented, the following is the small list of components for which capacities
were calculated to be below the screening level.
Component
Condensate storage tank
DG control cabinets
Refueling water storage tank
Battery chargers
DG fuel oil tank
Median capacity (g)
0.78
1.25
1.11
1.59
1.64
HCLPF (g)
0.31
0.46
0.48
0.58
0.67
It should be noted that the calculated seismic capacities of the DG control cabinets and the
Battery chargers are based on the design qualification level. It is expected that higher seismic
capacities could be demonstrated if qualification test reports to such levels were available.
4.4 Screening of Soils Stability Issues
The evaluation of the potential for soil liquefaction is a requirement of the IPEEE. The soil
stability evaluations were therefore performed and concluded that the HCLPF was in excess of
0.7g, which is consistent with the screening level adopted for the structures and components.
419

The following list summarizes the credible soil related issues for which an evaluation or
verification was performed:
• liquefaction potential for yard area soils supporting ESW piping and electrical duct bank
• settlement of soils underlying the safety related plant structures
• lateral earth pressure on partially buried safety related buildings as well as stability of the
essential service water (ESW) pumphouse and intake structure against sliding
• stability of the river bank slope at the ESW building and the potential impact of its failure
on the intake structure
5. RISK QUANTIFICATION
The frequencies of core damage are calculated by combining the component and structures
fragilities described in earlier sections, with the plant logic. Event and fault trees are
constructed to identify the accident sequences which may lead to core damage.
The risk quantification process described here is limited to the calculation of core melt
frequency (level 1 PSA). The subsequent determination and quantification of plant damage
states, containment behaviour and radioactive releases to the outside (level 2 PSA) were
performed for the Krsko NPP but are not further described in this paper ([4]).
The Krsko NPP SPSA was performed in such a way as to employ much of the work done in
the internal events analysis of the Krsko Individual Plant Evaluation (IPE). That is, the event
trees and fault trees developed for the internal events analysis would at most need to be
modified to address the specific aspects of the plant or systems response to a particular seismic
event.
420

Scismicallv Induced Initiating Event Determination and Frequency Calculation
Seismically induced initiating events considered in the CDF quantification are outlined below.
The list of initiating events is constructed based on the following process:
1. A choice is made of buildings, structures and equipment used to determine the plant status
following the seismic event.
2. Given the failure of each of the items listed in step 1, the plant disposition is defined.
Failures with similar results are grouped together into failure groups.
3. A hierarchy among initiating events is developed. The order of the hierarchy is such that, if
one initiating event occurs, the occurrence of other initiating events further down the
hierarchy are of no significance in terms of plant response.
4. The conditional probability of failure for each failure group is determined from the fragility
curves of the components in the failure group.
The failure groups defined for the Krsko seismic initiating events are described below.
• Break beyond ECCS capacity.
This failure is assumed to lead to direct core damage, and is a function of building or
SG/RJPV support failure.
• Large primary pipe break.
This failure is a function of the RCS equipment supports.
• Medium primary pipe break.
This category includes all pipes of sufficient size to produce a medium LOCA event. The
probabilities are estimates based on calculations for appropriately sized piping calculated
in the SSMRP Zion analysis [3].
421
• Small primary pipe break.
This category includes all pipes of sufficient size to produce a small LOCA event. The
probabilities are estimates based on calculations for appropriately sized piping calculated
in the SSMRP Zion analysis [3J. In addition, the failure mode of the reactor coolant pumps
which leads to damage of the seals causes a leakage equivalent to the small LOCA.
• Emergency service water pumphouse failure.
This failure leads to loss of the ESW systems, leading eventually to the loss of component
cooling water system heat removal ability.
• Secondary side pipe break.
• ATWS due to control rod insertion failure.
• Loss of off-site power.
Note that since the switchyard ceramic conductors have a high probability of failure during
a seismic event, loss of off-site power was also considered to be combined with all other
initiating events.
A generic seismic fragility based on US electrical grids was used for the Slovenian
electrical grid.
Seismic Event Trees and Fault Trees
For each initiating event, an event tree models the plant system performance, and hence the
accident sequences leading to different plant states. The event trees developed for the Krsko
NPP internal events IPE were used as the basis for the seismic event trees. In general,
modifications to internal events analysis event trees are simplifications as branches where
failure is assumed to occur with certainty following the occurrence of an earthquake, can be
eliminated. The assumed failure is caused by seismic failure of a system which is not
422

seismically qualified (such as the instrument air system causing valves to go to a fail-safe
position).
The seismic fault trees are defined by the seismic event tree nodes and those components and
support systems which are required for successful] system operation represented by the event
tree node. The seismic fault trees are put in parallel with the internal events analysis fault trees,
i.e. random and seismic fault trees are combined in the CDF quantification process. Several
assumptions affecting the construction of seismic fault trees are:
• Similar redundant components, generally located in close proximity, simultaneously fail
with a probability equal to that of one component. This (conservatively) removes train
redundancy while simplifying the seismic fault trees.
• Off-site power is assumed not to be recoverable within 24 hours. Events which take credit
for system recoveries are generally not possible within the first 24 hours after an
earthquake. '
• Operator actions required within 10 minutes after the occurrence of the earthquake are
assumed to fail.
• Systems which are not classified as seismic category I are conservatively assumed to fail
at any seismic activity level (e.g. instrument air)
Seismic Hazard Intervals
For the CDF quantification, the range of PGA of interest was split into a number of intervals:
seismic interval: 1: 0.15-0.25g
2: 0.25-0.35g
423

3: 0.35 - 0.50g
4: 0.50-0.70g
5: 0.70-0.90g
6: 0.90-1.10g
For each interval, the median PGA was selected to represent the interval. The corresponding
frequency of occurrence was set equal to the frequency of occurrence of PGA values within the
interval, as obtained from the seismic hazard curves (see Figure 2.1).
Core Damage Frequency Quantification Results
Compilation and quantification of the fault trees and event trees leads to insight in the most
important core damage sequences, and the most important core damage cutsets i.e. the
components whose failures contribute the most to core damage. Figure 5-1 illustrates the
distribution of core melt frequency contributions from the different seismic intervals.
A review of CDF quantification results leads to the following observations.
• The significant contributors to core melt from the first two seismic intervals (PGA <
0.35g) are DG random failures combined with the loss of off-site power.
• For higher PGA levels, seismic failures of components begin to appear in parallel with the
random failures and loss of off-site power. The significant seismic failures of components
involve the diesel generator control panel, the battery chargers, the condensate storage
tank, and the refueling water storage tank. As indicated in section 4, the failure
probabilities of battery chargers and DG control panels assumed in the analysis are
424

considered to be conservatively low as they were based on limited seismic qualification
documentation.
• The station blackout initiating event represents more than half of the total seismic core
damage frequency. Therefore, if plant modifications are made as a result of the seismic
PSA, they should focus on improvements that lower the contribution to core damage by
station blackout. Also, from the level 2 analysis, the plant damage states which represent
the station black-out sequences contribute by far the largest frequency to containment
failure and containment bypass ([4]).
6. RELAY EVALUATION
A relay chatter evaluation was also performed as part of the Krsko IPEEE. The purpose of the
evaluation was to verify the capacity of relays against chattering, and/or the acceptability of
relay chatter in a seismic event. A progressive screening of relays based on at least one of the
following criteria was performed:
1. The best estimate seismic capacity of the relay is higher than the screening level of 2.0g
PGA. which is consistent with the screening level adopted for plant equipment.
2. Relay chatter which occurs does not affect the ability to achieve and maintain safe
shutdown.
Progressive screening was applied to extensive lists of relays, switches, contactors and breakers
available from plant equipment databases. Screening was performed in any sequence which
would permit rapid elimination of groups of relays from the lists. Summarized, the screening
was based on the following:
425

• solid state relays and some contacting devices, such as mechanically actuated contacts, are
considered seismically rugged.
• seismic capacity against chattering is determined for relay types for which test data,
generic industry data, ... are available. Relay demand was calculated from floor spectra
and cabinet amplification. As explained in section 2, the local earthquake floor response
spectra were taken into consideration as well as the distant earthquake response spectra. Of
the probabilistic relay capacity description, only the median (best estimate) capacity value
was calculated for the relay types and compared to the 2.0g PGA median capacity
criterion. A significant number of relays could be screened out as the criterion was met.
• relays whose change of state can be tolerated as having no adverse impact on "safe
shutdown (no spurious seal-in or latch occurs which would prevent the system from
performing its safe shutdown function, or prevents control resets and operational control
such as pump restart from the control room or other normal point of control), and/or which
can be reset by operator action (within a reasonable time, assumed for the purpose of this
evaluation as 30 minutes to 1 hour, and according to existing procedures and based on
accessibility of required indications) are screened out.
7. CONCLUSIONS
The study was performed in accordance with the criteria specified by the USNRC and was
reviewed by the IAEA.
During the seismic PSA, a thorough walkdown was conducted. The plant appeared to be
rugged and generally designed with ample seismic margin. Some miiior design errors were
426

noted and some walkdown observations indicated potential vulnerabilities of a few items of
equipment, for which easy seismic improvements were proposed.
With the few upgrades suggested above, the seismic induced core damage frequency is
comparable to that of most US and Western Europe NPPs.
Valuable insights are obtained from the process of modelling the plant and quantifying the core
damage frequency. If plant modifications are considered, they should be benchmarked against
the insights.
8. R E F E R E N C E S
[ 1 ] IAEA-TECDOC-724, October 1993, "Probabilistic safety assessment for seismic
events"
[2] NUREG/CR-20'15. Vol.9, Lawrence Livermore Laboratory. September 1981,
'"Seismic Safety Margins Research Program. Phase I Final Report - SMACS - Sismic
Methodology Chain with Statistics (Project VIII)"
[3] NUREG/CR-4550. also SAND86-2084. Vol.3. Rev. 1. Part 3, December 1990.
"Analysis of Core Damage Frequency: Surry Power Station, Unit 1 External Events".
M.P.Bohnatal.
[4] "KRSKO SEISMIC LEVEL 11 PRA". P.N.Shah, R.Prior. F.P.Wolvaardt. R.Bastien.
presented at the 3rd Regional Meeting on Nuclear Energy in Central Europe,
Portoroz, Slovenia, September 1996.
427

Figure 2.1
Krsko NPP Site Fractile Hazard Curves
428
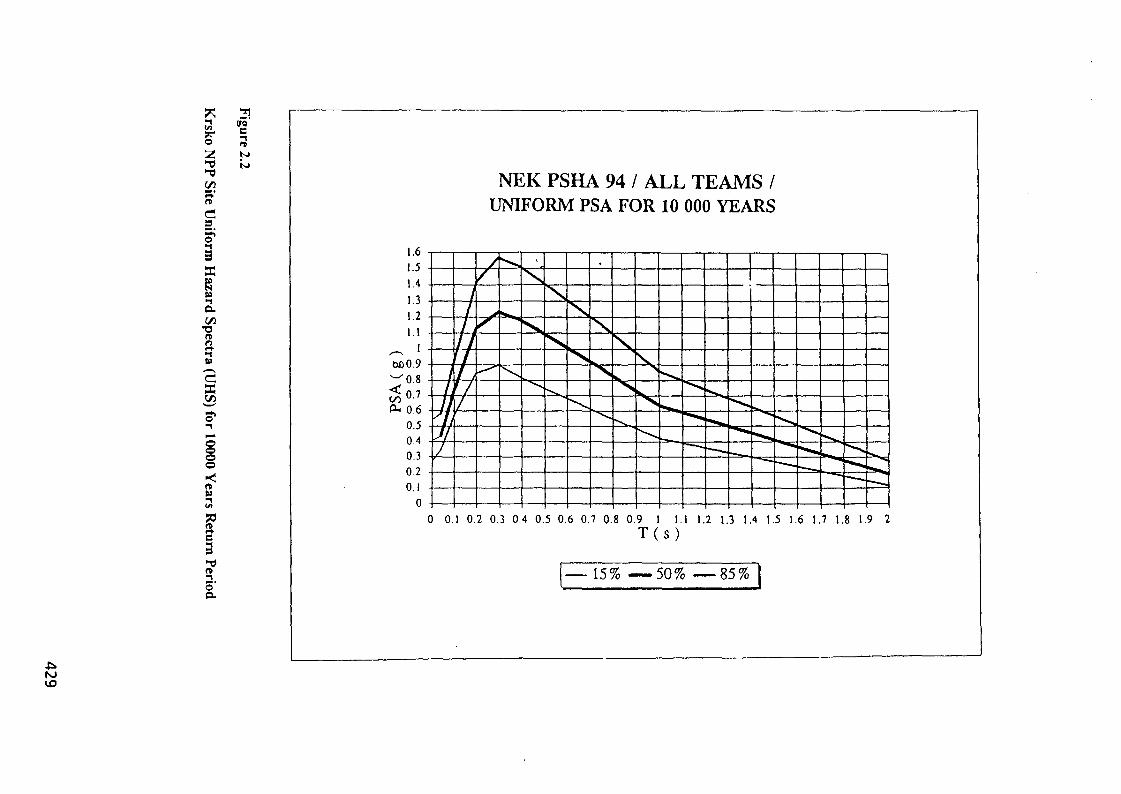
2§*
Ift
as
x
s.•Onr>
C/3
TO
N»
p
7o'a.
1.6 -i1.5 -1 4 -1 3 •1 2 -1.1 -
bfiO.9 -
•—'0.8 -
3 0 .7 -(^ 0.6 •
0.5 -I0.4 •
0.3 -0.2 •0.1 -
0 •0
NEK PSHA 94 / ALL TEAMS /UNIFORM PSA FOR 10 000 YEARS
/
//
/
/ /
l\I J
wJ
0.1 0.
s
***
N
sN \
V\
S, • S i
«-,1 .
• —
—
— —
•—J 1 —
2 0.3 0.4 0.5 0.6 0.7 0.8 0.9 1 1.1 1.2 1.3 1.4 1.5 1.6 1.7 1.8 1.9 2
T ( s )
— 15% —50% —85%

o
V-, rn
oZ Z O.1 < Oui UJ o;x x a.
o
o
DO—
a
rt(si
CrtuOCL.
*-•
2-^
cKo.oo.c »
S«
:oje
8.5.1 S
G. o
5-S
ika:
gOJC LCO
cOO
<S1<u
• o
V5
oo-ool
ecir
a.
sec:
sE
•ooJcCO
3on
S
voa/¥s
Figure 2.3
Statistics of Six Recorded Local Earthquakes and Proposed Local Earthquake Response
Spectrum
430
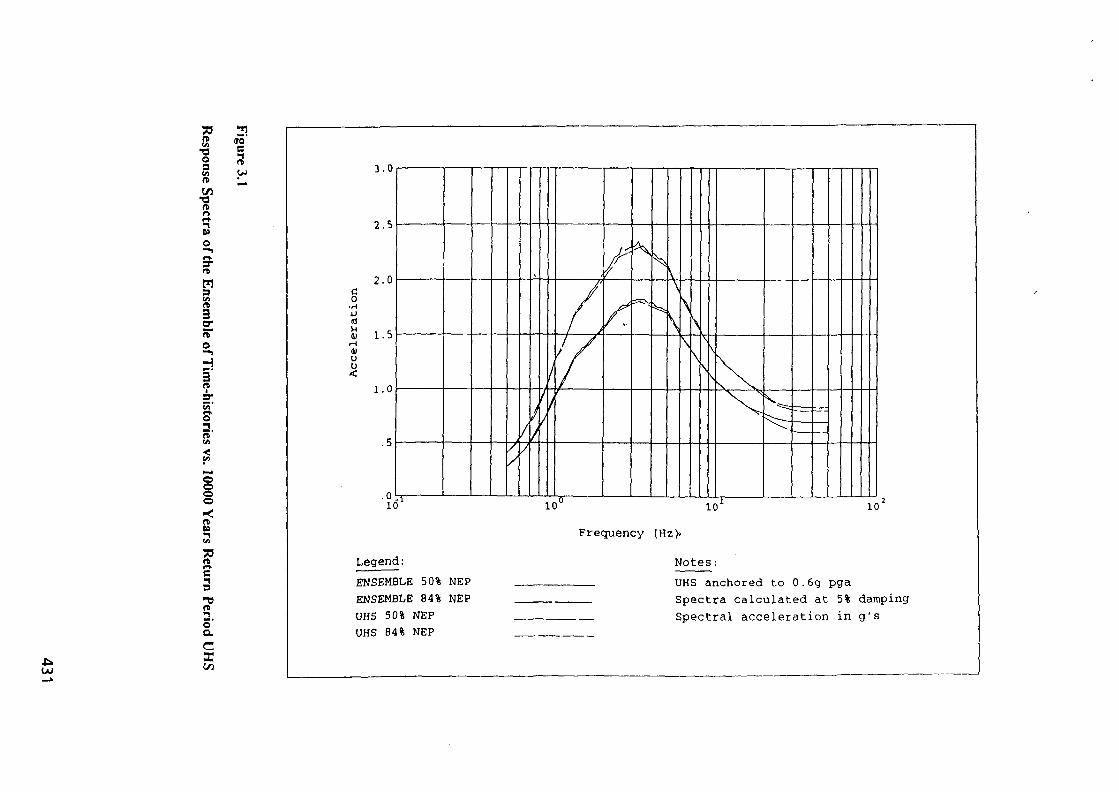
30 **1
a **ft j ^
ftr»
2
ftmMft
crft"o
oS'
2=
JOft
"I
?S'o.C
3.0
Frequency (Hz>»
Legend:
ENSEMBLE 50% NEP
ENSEMBLE 84% NEP
UHS 50% NEP
UHS 84% NEP
Notes:
UHS anchored to 0.6g pga
Spectra calculated at 5% damping
Spectral accelerat ion in g ' s

/(V
1
'Xv
Ay ^
/
i .
1
1
j1
y'J/l
\\)
^-^-—
s \
NX
>1oqu
01
u
o
•O
a
• -ao a)o nj
3•a v
<U r-i
o uo <a
c
oJJ
10ID
JJ
os
« JJ
oCO SJ
P Pi
JJ0ao03
-0cV0)V. i
w
oi n
a
oJ2oowQ
a<u53<*>
CD
a
o
oouQ
S34 P
Oi n
^*CO
w
Figure 3.2
Response Spectra of the Ensemble of Deconvolved Time-histories vs. 10000 Years Return
Period UHS
432

V
^ _ _ • •
^ !
/
j/
^ ^
1
J
-—V\ \\\\\
cHaure
a
c&•ia
u(0 -U
"OQi TJxJ Vto 4J
r-i <63 --(O 3
^H O
^ CD« K
NX
o
&a)
o
W01
^ tnen Him~ §a; -H
en «
Figure 3.3
Comparison of FSAR vs. Median Probabilistic Response Spectrum (Reactor Containment
Base, East-West Translation)
433

Oao69
2\
&3'
i
ero
Selimlc Hazard Frequency
3 * 5Soltmlc Interval
Conditional Core Melt Probability
Core Melt Frequency
1 JE-05
I 0E 05
»0E-Ofl
6 0ECW
< 0E 06
2 O E M
OOE-00
mil..1 2 3 4 5 6 > 6Safimli: Inlarvt!
Int 1Int 2Int 3Int 4Int SInt 6>6
Total
Haz. Freq.
2 54E037 32E-043 11E-048 20E052 00E053 60E-061 40E06
Cond. Core Melt
3 914E031 274E023 406E-021 628E015 803E-019 262E011 OOOE*00
Core Melt Freq
9 942E069 326E061 059E051 335E051 161E053 334E061 400E06
5 96E05
> tStlamlc Inttrvll

SMiRT-13, POST CONFERENCE SEMINAR NO. 16(ATS)"SEISMIC EVALUATION OF EXISTING NUCLEAR FACILITIES'
IGUAZU, ARGENTINA, 21 - 23 AUGUST 1995
TIMETABLE
Monday. 21 August 1995
08:30 - 09:3009:30-10:15
RegistrationOpening Session (Joint session for Seminars PCS No. 2-10-16)
Opening by D. BENINSON, Chairman of ENRENPresentation of Keynote Paper: M. ROSEN (IAEA)
10:15-10:30 Coffee break
10:30-12:30
10:30-11:1011:10-11:5011:50-12:30
SESSION I: "Earthquake Experience"
1.1 - J.J.JOHNSON1.2 - H. SHIBATA1.3 - P. BASU
12:30-14:30 Lunch break
14:30-16:50
14:30-15:1015:10-15:3015:30-15:5015:50-16:1016:10-16:3016:30- 16:50
SESSION II:
II. 1 -II.2 -
-II.3 -
III.l -
"Country Experience in . . . "
J. STEVENSONJ. INKESTERF. HENKEL (Germany)R. ANDRIEUP. MONETTEA. GURPINAR (1st part-seismic safety)
16:50-17:10 Coffee break
17:10 -18:10
17:10-17:3017:30-17:5017:50-18:10
SESSION III: "Generic WWER Studies"
III. 1 - A. GODOY (2nd part-technical guidelines)III.2 - M. DAVIDIII.3 - A. GURPINAR(3rd part-benchmark programme)
435

SMiRT-13, POST CONFERENCE SEMINAR NO. 16 (ATS)"SEISMIC EVALUATION OF EXISTING NUCLEAR FACILITIES"
IGUAZU, ARGENTINA, 21 - 23 AUGUST 1995
TIMETABLE (continuation)
Tuesday. 22 August 1995
08:30-10:50
08:30-09:1009:30-10:1010:10-10:50
SESSION TV: "Analytical methods ... "(cont'd session III)
III.4 - R. CAMPBELLIV. 1 - J.M.ROESSETIV.2 - N. KRUTZIK
10:50-11:10 Coffee break
11:10-12:10
11:10-11:3011:30-11:5011:50-12:10
SESSION IV: (continuation)
IV.3 - A. ASFURAIV.4 - M. KOSTOVIV.5 - I. DIAZ MOLINA
12:10-13:30 Lunch break
13:30-17:00 Visit to Iguazu Falls
17:30 -19:10
17:30-17.5017:50-18:1018:10-18:3018:30-18:5018:50-19:10
SESSION V: "Experimental methods ... "
V.2 - C.PRATOV.3 - C. PRATOV.4 - D. PETROVSKIV.5 - V. KOSTAREVV.6 - J. CARMONA
20:00 - Official Dinner for all participants to the 3 Seminars
436

SMiRT-13, POST CONFERENCE SEMINAR NO. 16 (ATS)"SEISMIC EVALUATION OF EXISTING NUCLEAR FACILITIES"
IGUAZU, ARGENTINA, 21 - 23 AUGUST 1995
TIMETABLE (continuations
Wednesday. 23 August 1995
08:30-10:00
08:30 - 09:0009:00 - 09:2009:20 - 09:4009:40-10:00
SESSION VI: "Case Studies"
VI. 1 - V.BOROVVI.2 - D. STEFANOVVI.3 - M. SCHMIDTVI.4 - P. MONETTE
10:00-10:30 Coffee break
10:30-12:30 SESSION VII: "Panel discussions"
12:30-14:00 Lunch break
14:00 Visit to Itaipu Dam (Brazil) - (optional)
NEXT PAGE(S)left BLANK
437

SMiRT-13, POST CONFERENCE SEMINAR NO. 16 (ATS)"SEISMIC EVALUATION OF EXISTING NUCLEAR FACILITIES"
IGUAZU, ARGENTINA, 21 - 23 AUGUST 1995
LIST OF PARTICIPANTS
1. ALVAREZ, LuisENACEAngel Gallardo 391 (1A)Buenos AiresArgentinaTel: +54(1)856-7387Fax:
2. ANDRIEU, RogerEDF35-37, Rue Luis Guerin - B.P.121269611 Villeurbanne CedexFranceTel:+33(72)824051Fax: +33(72)824010
3. ARAKELIAN, FrederickRepublic of ArmeniaMinistry of Energy & FuelArmenergy Seismicprojects InstituteYer. HPS-2, RazdanCanyon, Yerevan375015 ArmeniaTel: 7(8852)580 649Fax: 7(8852)151 805
4. ASFURA, AlejandroEQE International44 Montgomery St., Suite 3200San Francisco, California 94104U.S.A.Tel: +1(415)989-2000Fax:+1(415)362-0130
5. AVILES, AlejandroN.A.S.A.Central Nuclear EmbalseEmbalse - CordobaArgentinaTel: +54(51)244577Fax:+54(51)244577
6. BASU, P. C.Atomic Energy Regulatory BoardVikram Sarabhai Bhavan, 4th FloorN. Wing Anushaktinag., Bombay-400 09IndiaTel:+91(22)5562310Fax: +91(22)5562343
439

7. BOROV, VinsentEQE Bulgaria S.A.Chr. Smirnenski 1, 11th Floor1421 SofiaBulgariaTel:+359(2)660417Fax: +359(2)650039
8. BRUSCHI, SilvestroTechintWineberg30151636 Olivos - Pcia. de Bs. As.ArgentinaTel:+54(1)790-9685Fax:+54(1)318-4745
9. CAMPBELL, RobertEQE International18101, Von Karman, Suite 400Inving, CA 92715U.S.A.Tel:+1(714)833-3303Fax:+1(714)833-3392
10. CAR,EduardoUniversity Nac. de CordobaC.C. 9165000 CordobaArgetinaTel: 54(51)60-3800Fax:+54(51)60-3800
11. CEBALLOS, MarceloUniv. Nac. de CordobaC.C. 9165000 CordobaArgentinaTel:Fax:
12. CHIVERS, TerryNuclear Electric picBerkeley GlosGLl 3 9PBBerkeley Technology CentreUnited KingdomTel: +44(14)53812257Fax: +44(14)53812659
13. DAVID, MilanDavid Design Eng. & Cons.14700Praha4Ke Krci 7Czech RepublicTel: +42(2)870375Fax: +42(2)878674
440
14. DIAZ MOLINA, IvanD'AppoloniaArturo M. Bas 73 Piso 25000 CordobaArgentinaTel:+54(51) 254225Fax:+54(51)254225
15. ENGSTLER, SusannePreussenelektra, HeadofficeTresckowstr. 330457 HannoverGermanyTel: 0511/4394178Fax: 0511/4394187
16. FA JFAR, PeterUniv. of LjubljanaJamova 2SI-61000 LjubljanaTel: +386(61)268562Fax: +386(61)272696
17. GIULIANO, AlejandroInst. Nac. prev. sism.Roger Balet 47 - Norte5400 San JuanArgentinaTel: +54(64)234463Fax: +54(64)234463
18. GODOY AntonioIAEADivision of Nuclear SafetyP.O. Box 200A-1400 ViennaAustriaTel: +42(1)2060 26083Fax:+43(1)20607e-mail: [email protected]
19. GURPEVAR, AybarsIAEADivision of Nuclear SafetyP.O. Box 200A-1400 ViennaAustriaTel:+43(1)2060 22671Fax:+43(1)20607e-mail: [email protected]
20. HAUPTENBUCHNER, BarbaraTechnische Universitat DresdenMommsenstr. 1301062 DresdenGermanyTel:+49(351)463 4641Fax:+49(351)463 7108
441

21. HENKEL, Fritz-O.Woelfel Beratende Ing.P.O. Box 1264D-97201 Hoechberg near WuerzburgGermanyTel:+49(931)49708-0Fax:+49(931)49708-15
22. INKESTER, John E.N.I.I.St. Peters House, Balliol R., BootleMerseyside L20-3LZUnited KingdomTel:+44(151)951-4000Fax:+44(151)922-5980
23. INOUE, NorioTohuku UniversityAramaki AobakuSendai 980-77JapanTel:+81(22)217-7872Fax: +81(22)217-7873
24. JOHNSON, James J.EQE International44 Montgomery Street, Suite 3200San Francisco, Ca 94104U.S.A.Tel:+1(415)989-2000Fax:+1(415)433-5107
25. KAMIMURA, KazuDoriNuclear Power Engineering CorporationShuwa-Kamiyacho Bldg., 2F3-13 4-Chome ToranomonMinato-Ku, Tokyo 105JapanTel: 81-3-3434-4551Fax:81-3-3434-9487
26. KONNO, TakaakiKajima Corporation6-5-30, Akasaka, Minato-KuTokio 107JapanTel:+81(3)5561-2111Fax:+81(3)5561-2345
27. KOSTAREV, Victor V.CKIT - VibroseismAtamanskaya 3/6St. Petersburg 193167Tel:+7(812)277-2940Fax: +7(812)395-1338e-mail: [email protected]
442

28. ROSTOV, MarinCentral Laboratory' for Seismic Mechanicsand Earthquake EngineeringAcad. G.Bonchev Str. Block 31113 SofiaBulgariaTel:+359(2)713-3303Fax:+359(2)268-8951e-mail: [email protected]
29. KRUTZIK, NorbertSiemens AG, NPP EngineeringBerliner Str. 295-303P.O. Box 10106363010 Offenbach a. MainGermanyTel: +49 69 807-3355Fax: +49 69 807-4822
30. LAPAJNE, JanezGeophysics Survey of SloveniaKersnikova 361000 LjubljanaSloveniaTel:+386 (61) 1320283Fax:+386 (61)1327067
31. LLOPIZ, Carlos R.Invap S.E.Granaderos 897 P.l-Of. 4MendozaArgentinaTel: +54 (61) 253455Fax:+54(61)253455
32. MASUDA, KiyoshiKajima Corporation1 -2-7, Akasaka, Minato-k4Tokio 107JapanTel:+81 (3)3403-3311Fax:+81(3) 3470-1444
33. MONETTE, PhilippeWestinghouse E.S. Eur.Boulevard Paepsem, 20B-1070 BrusselsBelgiumTel: +32(2)556-86-24Fax: +32(2)556-87-58e-mail: Monette.Ph%[email protected]
443

34. NAITO, YukioKajima Technical Res. Inst.2-19-1, Tobitakyu, Chofu-ShiTokio 182JapanTel:+81(424)85-1111Fax:+81(424)89-7116
35. PETROVSKI, DimitarInst. Earthquake Eng.P.O. Box 10191000 SkopjeRep. of MacedoniaTel:+389(91)111-344Fax:+389(91)112-163
36. PRATO, Carlos A.University Nacional de CordobaC.C. 9165000 - CordobaArgentinaTel:+54(51)60-3800Fax:+54(51)[email protected]
37. PRATO, Tomas A.University Nacional de CordobaC.C. 9165000 - CordobaArgentinaTel:+54(51)60-3800Fax:+54(51)60-3800
38. QUEVAL, Jean-C.CEACEN Saclay Drn/Dmt/Semt/Emsi91191 Gifs/yetteCEDEXFranceTel: +33(1)6908-6652Fax:+22(1)6908-8331
39. ROESSET, Jose M.The University of Texas at AustinAustin, Texas 78712U.S.A.Tel: 512-471-4927 or 471-8482Fax: 512-471-8477e-mail: [email protected]
40. ROSEN, MorrisIAEAP.O. Box 200A-1400 ViennaAustriaTel:+43(1)2060-22700Fax: +43(1)2060-2948
444
41. SASAKI, YouichiNuclear Power Eng. Corp.Shuwa-Kamiyacho Bldg. 2F3-13, 4-Chome Tor., Minato-KuTokyo 1JapanTel:+81(3)3434-5695Fax:+81(3)3434-9487
42. SCHMIDT, MartinStussi & PartnerSteinwiesstr. 308032 ZurichSwitzerlandTel:+41(1)262-4224Fax: +41(1)262-4228
43. SHIBATA,HekiYokohama National UniversityDept. of Mech. Eng.Tokiwadai, HodogayaYokohama 240JapanTel: +81(45)335-1451 Fax: +81(45)331-6593
44. STEFANOV, DimitreCentral Lab. Seismic Mech.Acad. G. Bonchev Str. Block 31113 SofiaBulgariaTel:+359(2)703107Fax: +359(2)700226
45. STEVENSON, John D.Stevenson & Associates9217MidestBlvdCleveland Ohio 44125U.S.A.Tel: +1(216)587-3805Fax:+1(216)587-2205
46. TADRA, TakaomiNuclear Power Eng. Corp.Shuwa-Kamiyacho Bldg. 2F3-13, 4-Chome Tar., Minato-ku,Tokyo 1JapanTel:+81(3)3434-5695Fax:+81(3)3434-9487
47. UCHIYAMA, ShojiKauima Technical Res. Inst.2-19-1 Tobitakyu, Chofu-ShiTokyo 182JapanTel:+81(424)85-1 111Fax:+81(424)89-7116
445

48. VARPASUO, PenttiIvo International Ltd.Rajatorpantie 8, VantaaFin-01029 IvoFinlandTel:+358(0)8561-2223Fax:+358(0)8561-2223
49. YANG, KejianTohoku UniversityFaculty of EngineeringAoba, Aramaki, Aoba-ku, SendaiMiyagi, Japan, 980-77Tel/Fax: 81-22-217-7873
50. YUN, Choul-HoKINSP.O. Box 114, YusongTaejeonKoreaTel:+82(42)868-2615Fax: +82(42)861-2535
51. ZABALA, FranciscoNational University of San JuanAv. del Libertador 12905400 San JuanArgentinaTel:+54(64)228123Fax: +54(64)213672
52. ZARATE, Stella M.ENRENAv. Libertador 82501429 Buenos AiresArgentinaTel: +54(1)704-1494Fax:+54(1)704-1181
446