
Smart Water Utilities: Complexity Made Simple - IWA Publishing
308
This title was made available Open Access through a partnership with Knowledge Unlatched. IWA Publishing would like to thank all of the libraries for pledging to support the transition of this title to Open Access through the KU Select 2019 program. ©2020 The Author(s) This is an Open Access book distributed under the terms of the Creative Commons Attribution-NonCommercial-NoDerivatives Licence (CC BY-NC-ND 4.0), which permits copying and redistribution in the original format for non-commercial purposes, provided the original work is properly cited. (http://creativecommons.org/licenses/by-nc-nd/4.0/). This does not affect the rights licensed or assigned from any third party in this book. Downloaded from http://iwaponline.com/ebooks/book-pdf/651186/wio9781780407586.pdf by guest on 14 January 2022
-
Upload
khangminh22 -
Category
Documents
-
view
1 -
download
0
Transcript of Smart Water Utilities: Complexity Made Simple - IWA Publishing

This title was made available Open Access through a partnership with Knowledge Unlatched.
IWA Publishing would like to thank all of the libraries for pledging to support the transition of this title to Open
Access through the KU Select 2019 program.
©2020 The Author(s)
This is an Open Access book distributed under the terms of the Creative Commons Attribution-NonCommercial-NoDerivatives Licence (CC BY-NC-ND 4.0), which
permits copying and redistribution in the original format for non-commercial purposes, provided the original work is properly cited.
(http://creativecommons.org/licenses/by-nc-nd/4.0/). This does not affect the rights licensed or assigned from any third party in this book.
Downloaded from http://iwaponline.com/ebooks/book-pdf/651186/wio9781780407586.pdfby gueston 14 January 2022

iwapublishing.com @IWAPublishing
ISBN: 9781780407579 (Paperback)ISBN: 9781780407586 (eBook)
“In a world of increased complexity and rapid changes water professionals are looking for new solutions to cope with these challenges in order to operate and manage their systems in a more effective and sustainable way. Pernille Ingildsen and Gustaf Olsson share their long time experience as teacher, researcher and manager. By introducing the M-A-D (Measurement-Analysis-Decision) concept they provide the basis for a better understanding and operation of water systems at all levels. This is a must-read book for all water professionals irrespective if you are researcher, a consultant, an operator or a manager of a water utility. You will find an abundance of new ideas for improving the water cycle and to transform your water system into a real smart water system.”
Norbert Jardin, Ruhrverband, Germany
“The world looks ahead to the ”post-2015 development agenda” towards 2030 by launching a new set of Sustainable Development Goals and a new global Climate Agreement. Facing the challenges of a climate uncertain future, including rapid urbanisation, in the midst of an unprecedented information revolution, this book addresses the right issues at the right time: how to contribute to a sustainable future by harnessing our ever growing mass of information and data to achieve ”smart” water and energy management. And it does so in the right way: going from the comprehensive to the specific, from the complex to the simple, by taking all relevant utility stakeholders by the hand and give them a toolbox to face a world of advanced sensors and real time control. I learned a lot from it and warmly recommend it to others.”
Dr Torkil Jønch Clausen, Senior Adviser to the DHI Group and Global Water Partnership Chair of the Scientific Programme Committee for the World Water Week in Stockholm Governor of the World Water Council
“Smart Water Utilities: Complexity Made Simple is unusual in the breadth of its scope, which includes a global overview of sustainability issues, a discussion of management issues at the utility level, and extensive information on the technical specifics of designing, operating, and fully utilizing information from automated data and control systems. The authors have presented all information, from the most abstract to the most detailed, in a user-friendly way, using analogies from the real-life experience of readers to clarify their points. This book is a real addition to the literature of the water industry.”
Cheryl Davis, Chair of IWA Sustainability Group, CKD Consulting
“The book is an outstanding inspiration and eye-opener. It is a must for every water manager and for anyone who wants to become a water expert.”
Professor Dr Harro Bode, CEO, Ruhrverband, Germany
Pernille Ingildsen and Gustaf Olsson
Smart Water UtilitiesCOmPlexIty made sImPle
Smart W
ater Utilities: C
Om
PlexIty ma
de sIm
PlePernille Ingildsen and G
ustaf Olsson
Smart Water UtilitiesCOmPlexIty made sImPle
Downloaded from http://iwaponline.com/ebooks/book-pdf/651186/wio9781780407586.pdfby gueston 14 January 2022

Kalundborg Utility in Denmark is an innovative utility hosting services of potable water based on groundwater as
well as surface water sources, wastewater and district heating. The utility is one of many utilities around the world making an effort to become smarter throughout the water systems and their operations and design. Kalundborg Utility invites
entrepreneurs, visionaries and people with good ideas to come and work at Kalundborg Utility to bring the vision of a truly smart utility into life. Kalundborg Utility has co-sponsored this book to further enhance the evolution of smart water
utilities everywhere.
To my courageous daughter and my brave son - never
stop believing that you can better the world.
Pernille
I wish to dedicate the book to my children, grandchildren
and great-grandchild, our future
Gustaf
Downloaded from http://iwaponline.com/ebooks/book-pdf/651186/wio9781780407586.pdfby gueston 14 January 2022

Published by IWA Publishing Alliance House 12 Caxton Street London SW1H 0QS, UK Telephone: +44 (0)20 7654 5500 Fax: +44 (0)20 7654 5555 Email: [email protected] Web: www.iwapublishing.com
First Published 2016
© 2016 IWA Publishing
Apart from any fair dealing for the purposes of research or private study, or criticism or review, as permitted under the UK Copyright, Designs and Patents Act (1998), no part of this publication may be reproduced, stored or transmitted in any form or by any means, without the prior permission in writing of the publisher, or, in the case of photographic reproduction, in accordance with the terms of licenses issued by the Copyright Licensing Agency in the UK, or in accordance with the terms of licenses issued by the appropriate reproduction rights organization outside the UK. Enquiries concerning reproduction outside the terms stated here should be sent to IWA Publishing at the address printed above.
The publisher makes no representation, express or implied, with regard to the accuracy of the information contained in this book and cannot accept any legal responsibility or liability for errors or omissions that may be made.
PICTUrE CrEDITS
p.15 Pnor Tkk (Shutterstock); p16 islavicek (Shutterstock); p.19 Chinaview (Shutterstock); p.23 rawpixel.com (Shutterstock); p.25 Tanarch (Shutterstock); p.74 Dmitri Ma (Shutterstock); p.79 thailoei92 (Shutterstock); p.297 Jag_cz (Shutterstock).
DISCLAIMEr
The information provided and the opinions given in this publication are not necessarily those of IWA and should not be acted upon without independent consideration and professional advice. IWA and the Author will not accept responsibility for any loss or damage suffered by any person acting or refraining from acting upon any material contained in this publication.
ISBN: 9781780407579 (Paperback)ISBN: 9781780407586 (eBook)
Downloaded from http://iwaponline.com/ebooks/book-pdf/651186/wio9781780407586.pdfby gueston 14 January 2022

Pernille Ingildsen and Gustaf Olsson
Smart Water UtilitiesCOmPlexIty made sImPle
Downloaded from http://iwaponline.com/ebooks/book-pdf/651186/wio9781780407586.pdfby gueston 14 January 2022

introduction of authors
Pernille Ingildsen started her carrier as an industrial Ph.D. at Lund University as a student of Gustaf Olsson. During her Ph.D., Pernille and Gustaf published a book called Get more out of your wastewater treatment plant – complexity made simple together with Danfoss Analytical. Since her Ph. D., she has been working focused with the purpose of improving intelligence in the urban water cycle by taking on leadership positions in water utilities both within operations and engineering and by working in the industry with product development and innovation. A key focus has been to bridge the gap between the results obtained by research and the real practical world – making it happen for real. Today she has a leadership position at the Kalundborg utility in Denmark, where she works on transforming it into a true Smart Water Utility.
Gustaf Olsson is professor emeritus in industrial automation at Lund University, Sweden. He has devoted his research to control and automation in water systems, electrical power systems and industrial processes. In particular he has been working with instrumentation, control and automation in wastewater treatment systems for more than forty years. Since 2006 he has devoted part of his time as a guest professor at the Tsinghua University in Beijing, China and the Technical University of Malaysia. He is also advisor to several international research groups and programs. He is a Distinguished Fellow of IWA, the International Water Association and since 2012 also an Honorary Member of IWA. For the last few years much of his research has been focusing on the water-energy nexus. His most recent book called Water and Energy – Threats and Opportunities (IWA Publications) was first published in 2012. A second edition has been published in 2015 by IWA Publishing.
Downloaded from http://iwaponline.com/ebooks/book-pdf/651186/wio9781780407586.pdfby gueston 14 January 2022

contentsforewords 61. foreword 1:
a new emerging Paradigm
Manel Poch, Laboratory of Chemical and
Environmental Engineering, University of
Girona, Catalonia.
2. foreword 2:
the future is smart
by Paul Reiter, President – Reiter International
Water Solutions Ltd.,
and former Executive Director of International
Water Association
1. introduction 12
2. aPProach 26what is a smart water utility
objectives in a smart water utility
M-a-d: a new mindset for smart water utilities
implementation
3. Measure 60sensors: the basis of ”smart”
sensor selection
electrical control systems
4. analyse 94single signal analysis
Mathematical models
Performance measures
5. decide 130strategic decision making
operational decision making
automatic decision making: control
6. case studies 192eleven case studies from different places on
the water cycle, from different parts of the
world and using different smart technologies
7. trends 250top ten trends shaping the
smart water utility trend
8. new PersPectives 268nine thought leaders offers their perspectives
on where we may be heading moving forward
9. next stePs 298
acknowledGeMents 304
Downloaded from http://iwaponline.com/ebooks/book-pdf/651186/wio9781780407586.pdfby gueston 14 January 2022

6 sMart water utilities: Complexity made simple
I’m sure you’ve heard, more than once, about the smart city concept, one that may be the harbinger of a coming paradigm shift in our lives. It’s likely that you live in a city working to become one of them, or even to attain leadership in this coming transformation.
It’s possible that when you’ve asked about how this paradigm shift will affect the water cycle, you received an answer similar to what my colleagues at work in this field gave me. Generalized slogans about the information society, or the internet of things, etc., but no concrete proposals laying out how I can contribute to this new and exciting world. Also, when I talk to people working in water utilities, the answers I hear, best case, are simply frustrating. They have participated in congresses, courses, seminars, projects, etc., but they hardly get a clear idea of concrete action, receiving little more than vague, formless suggestions like what I hear from my colleagues.
It is in this context that I want to acknowledge that Pernille Ingildsen and Gustaf Olsson have written a ground-breaking book. It was a pleasure to read it. And though it’s an easy read, I needed to stop many times, look up, and contemplate the thrilling new concepts and insights revealed. It’s unusual in a book about water utilities, for example, to encounter a reflection alluding to Jung’s description of the ego!
While reading it, I was reminded of Winston Churchill’s famous remark during the middle of the Second World War, “This is not the end, this is not even the beginning of the end, but this is, perhaps, the end of the beginning.” I couldn’t decide whether this is the last book in the old paradigm (the end of the beginning) or the first in the new one (the beginning of the end). Finally, I concluded that it’s both! This book showcases two complementary approaches.
This is why I think it may excite a number of constituencies in the water world.
Their contribution in describing this change is one of the book’s strongest points. Especially so because it is a contribution that comes from a synergetic method integrating the experience and visionary approach that we have come to expect from Gustaf with Pernille’s day-to-day efforts to transform Kalundborg into a Smart Water Utility.
But, the book not only offers a perspective on the changes to come, also do not stop delivering innovative messages embedded it its very details, helping to have a clear glimpse to the future knocking next door. Just three examples.
The chapter “Customer Service Level,” recognizing the three classes of customers, may not seem, at first sight, particularly relevant to academics or interesting to them, but I can testify that it is definitely a disruptive idea in the water utilities world. The authors introduce a fresh insight: viewing environmental demands as customers, and community demands as emergent systems. This adds a novel dimension to the field that may catalyse the academic approaches to come.
Similarly, their presentation of the MAD concept (Measure, Analyse, Decide) and its application to the field is a nice example of how to make better decisions in water utilities at different levels. The authors’ way of defining the varying and sometimes conflicting objectives at each level of the decision-making process represents a productive way to think about the problems, and to solve them.
Usually, academic researchers (at least, in our sci-tech world) are not conscious of this fact, and we forget that a lot of the applications of our work (work we think is so important!) is constrained by decisions
foreword 1: a new eMerGinG ParadiGM
Downloaded from http://iwaponline.com/ebooks/book-pdf/651186/wio9781780407586.pdfby gueston 14 January 2022

7introduction
made at a more strategic level, and, too often, with little foresight concerning their impact.
The chapter on decisions is a clear example of how to transition between paradigms. It includes a more “classical” section on automatic control (obviously it is a pleasure to read it as a nice synthesis on automatic control), preceded by a section on strategic decisions—not only those at the operational level but also those in the planning stages—which is most insightful.
My overall conclusion is that we need this book!
For a lot of reasons, but two in particular.
First, because it presents a fresh and revealing approach to operating a water utility from a very realistic point of view in a smart way, and second, it opens our eyes to a new perspective that goes beyond the technical aspects by integrating them into strategic levels, offering new and exciting opportunities to academia and utilities to develop and consolidate the coming paradigm (the beginning of the end!).
Manel Poch, laboratory of cheMical and environMental enGineerinG, university of Girona, catalonia.
… I was reminded of Winston Churchill’s famous remark: ‘This is not the end, this is not even the beginning of
the end, but perhaps this is the end of the beginning.’
Downloaded from http://iwaponline.com/ebooks/book-pdf/651186/wio9781780407586.pdfby gueston 14 January 2022

8 Smart Water UtilitieS: Complexity made simple
doinG More with less –sMarteninG-uP our water systeMs for briGhter future
Smart infrastructure, smart systems, smart water. Many of my colleagues complain about the overuse of these poorly defined terms. But not me.
The reason I like these terms, in spite of my colleague’s apparently justified criticisms, is that smart infrastructure or smart water are aspirational terms – aspirations that are desperately needed in the field of environmental infrastructure (water, energy, waste), both today and in the future. I realize that using the term “desperately needed” will invariably alarm some readers, so let me explain.
If you think about it, the collective impact of 7+ billion people living on what is, from a resources perspective, a rapidly shrinking planet already presents formidable challenges. Now augment this reality by the coming reality over the next 40 years - we are adding about 1 million new entrants to Planet Earth every week between now and 2050. As this process unfolds, cities will be home to 90% of the new entrants and by 2050, about 75% of the world’s population, projected in 2050 to be 9 billion, will be living in cities.
So what do these facts have to do with smart systems? In my mind, everything. To pull off the transformation that will be required to bring the world’s population into a position where a reasonable income, a basic education, health and happiness are the norm rather than the exception, we are going to need to get “super-efficient” in our use of natural resources among many other things worldwide, starting with the developed countries.
In this context, transforming existing and future urban infrastructure to a much more efficient state through smarter systems -- especially related to resource dependent environmental infrastructure that both affects and is dependent on water, air and other natural resources – is a key challenge for the present and the future.
Let’s focus on water systems, in line with the scope of this book. So where are we today vis-à-vis the imperative of becoming “super-efficient”? Given the explosion of IT opportunities in the forms of sensors, microprocessors, large scale data analytics on the supply side, a growing awareness/imperative that traditionally managed water systems use a lot energy on account of their networks, and finally, a seemingly inexhaustible demand in developed countries for higher and higher standards for our water systems – one would think that there would an explosion of change in water system design and operations. Changes that could substantially lower energy use, lower operating costs and greatly improve water quality/service reliability all at the same time.
If we are honest with ourselves and again focussing on water systems in the most technologically sophisticated countries in the world – we are sadly far from this goal. Why? I believe that answering this question points us in the right direction in terms of working towards a highly efficient state through smartening-up our
foreword 2: the future is sMart
…smart infrastructure or smart water are aspirational
terms – aspirations that are desperately needed in
the field of environmental infrastructure…
Downloaded from http://iwaponline.com/ebooks/book-pdf/651186/wio9781780407586.pdfby gueston 14 January 2022

9foreword
environmental infrastructure – a big project that will take time.
In beginning to answer this question, and staying with water as our frame of reference for this discussion, let’s look at water in the context of a very similar and yet very different industry – commercial aviation.
In water production/distribution and wastewater collection/treatment -- reliability, public health and safety and economical delivery are the major imperatives. And many regulators are assigned to ensure that these imperatives are met. Commercial aviation has almost identical imperatives and also, plenty of regulators to ensure the right outcomes.
But consider this fact. In the commercial aviation industry, between 1960 and 2010, worldwide fuel consumption per passenger mile dropped in excess of 80%. Put another way, people are flying every mile using one-fifth of the fuel that was required at the advent of jet travel. No revolution occurred in the process – just steady improvement every year. During this time, the safety of airline travel has continued to escalate. One could say that being on an airplane is one of the safest places to be from a mortality standpoint.
Now let’s compare this record for aviation with the record for water utilities over this same period. In attempting to answer this question, the first discovery is that there are no comprehensive records to allow an assessment in virtually any country in the world, let alone a comparison with aviation. Anecdotally, we know that as a broad generalization over a comparable period between 1960 and 2010, energy consumption per PE did not decline and in general increased. In the UK for example, energy consumption between 1990 and 2006 for water and wastewater utilities doubled, with
Downloaded from http://iwaponline.com/ebooks/book-pdf/651186/wio9781780407586.pdfby gueston 14 January 2022

10 Smart Water UtilitieS: Complexity made simple
little growth in PE demand. The argument that rising EU standards over this period compelled the increase in energy use. An alternative view is that rising standards provided the opportunity to do new things better and more much efficiently.
So why the difference between these two industries? I believe the answer fundamentally lies in two very different circumstances between these two industries. One is the profit motive for the airline manufacturers. They make their money through selling new planes and fuel efficiency is the main selling point for airlines to buy new planes. In contrast, incentives within utilities are widely scattered and seldom focussed on resource efficiency.
Second, is the fact that airplanes, unlike water systems, are discrete objects that can be manufactured anew, used and then retired. When a new airplane design is introduced, the entire “system” can be improved or “smartened-up” to use the language of this book. Water systems in contrast are never designed from scratch or retired and replaced. Instead, water systems evolve organically and like a tree that is never pruned, have a lot of dead branches – all underground and out of sight.
This reality about slowly evolving and complex legacy systems however, is no excuse. All water professionals must be committed to the notion that almost everything design they design, modify and operate will be around for at least 4-5 decades -- unlike airplanes – and that the art of a “super-efficient” or “smart” state has to a constant preoccupation.
Clearly, water systems specifically and environmental infrastructure in general, require of lot of further thought and tailored strategies in the quest for a achieving a much higher level of efficiency. “Smartening up” legacy systems through a combination of control, process technologies and resource recovery will tend to lead this process. But this thought process has to be accompanied by repurposing elements of the legacy system as well as removing the “dead branches” in the distribution and collection systems.
Designing new increments to these legacy systems that envision a much more efficient long term state is also a critical part of the process of making the overall systems smarter. For example, the strategic use of satellite systems that keep water “closer to home”, reducing citywide flux and associated energy use.
Finally, technology is only part of the solution set. Super-efficient, “smart systems” will only be achieved by changing the risk-reward set of incentives that utility and government decision makers employ when making long terms capex and opex decisions.
So let’s get busy on all fronts towards our goal. And we can start the process by reading this book!
Paul reiter, President – reiter international water solutions ltd., forMer executive director of international water association
Downloaded from http://iwaponline.com/ebooks/book-pdf/651186/wio9781780407586.pdfby gueston 14 January 2022

11foreword
Guide to the reader
introduction: the what and the why of Smart Water Utilities. What does it mean and why should you be interested?
approach: in this book, an approach of Measurement–Analysis–Decisions (M-A-D) is used. This concept is explained including the philosophy that lies behind it and how this can be implemented in a water utility organisation.
Measurement: real online data is the basis of good decision making. This chapter gives you an overview and insight into all you need-to-know about sensors for water.
analysis: if data is the foundation, analysis is the process of changing data into useful and actionable information. This chapter provides some essential analysis tools for a Smart Water Utility.
decisions: many decisions have to be taken in a water utility handling the urban water cycle. As systems are getting more complex, water utilities need to increase clarity in their decision structure.
case studies: in this chapter, some of the Smart Water Utility pioneers share their experiences. They show that it is possible to honestly describe the difficulties involved.
trends: this chapter provides a list of ten major trends that are affecting the water utility industry and that should be integrated into the thinking of smart water utilities
new Perspectives: thought leaders share their ideas for inspiring a new mind-set for water professionals of the future.
next steps: contains the authors’ final remarks and hopes that the future will bring.
Downloaded from http://iwaponline.com/ebooks/book-pdf/651186/wio9781780407586.pdfby gueston 14 January 2022

The important thing about Smart Water is
To take good care of the water
To treat it respectfully
To handle it intelligently
To keep people healthy and prosperous
To return it clean to nature
And to make sure the fi sh are happy
But the important thing about Smart Water is
To take good care of the water
Downloaded from http://iwaponline.com/ebooks/book-pdf/651186/wio9781780407586.pdfby gueston 14 January 2022

introdUction1
Downloaded from http://iwaponline.com/ebooks/book-pdf/651186/wio9781780407586.pdfby gueston 14 January 2022

14 Smart Water UtilitieS: Complexity made simple
The challenges with which water utilities are faced today call for smarter control and management of our water resources.
The world population is growing; more people need fresh water as well as food, energy, products, etc. All of these goods require increasing amounts of clean water. Urbanisation in many regions is happening faster than the growth of water infrastructure and the establishment of good water reservoirs to supply the cities. The increasing standard of living further raises the expectations for sufficient amounts of clean water and seamless wastewater handling. This increases the pressure for a safe and clean natural environment and nature. As if nature for nature’s own sake were not enough, we also need nature as a source of life as well as for recreational purposes. We need the nature, and nature increasingly needs us to collaborate.
Unsustainable water extraction and wastewater handling can take place for a while, but at some point water needs to be managed in a way that is sustainable long term. When more water is pumped out of the ground than is replenished, the water table drops and at some point it will be
impossible to extract sufficient water or water of a sufficient quality from that resource. As a result of this process, the lakes and rivers may run dry. Where water has not been handled carefully, where rivers have been used to carry away waste streams, the problems of getting access to clean water become challenging – sooner or later. Like overspending on a bank account, sooner or later we will need to deal with unsustainable actions.
Emerging climate change further increases the pressure on the water infrastructure. This happens by changes of the pattern of the rainfall – the primary source for fresh water for all purposes. In that sense,the climate change challenges are mostly appearing as water availability. The changes will cause increasing incidents of water scarcity as well as increasing frequency of flooding events. Both situations lead to serious challenges for all people affected.
These challenges further increase the requirements to manage and control the water quantity and quality intelligently. From top to bottom we need to take better decisions to obtain sustainability and provide good water service to all. We need to handle water utilities “smarter”.
From top to bottom we need to take better decisions to obtain sustainability and provide good water service to all.
today
Downloaded from http://iwaponline.com/ebooks/book-pdf/651186/wio9781780407586.pdfby gueston 14 January 2022

15introdUction
Downloaded from http://iwaponline.com/ebooks/book-pdf/651186/wio9781780407586.pdfby gueston 14 January 2022

16 Smart Water UtilitieS: Complexity made simple
Downloaded from http://iwaponline.com/ebooks/book-pdf/651186/wio9781780407586.pdfby gueston 14 January 2022

17approach
So the challenge is clear. And happily new and effective tools and technologies are at the same time becoming available at an affordable cost.
New water treatment technologies are steadily changing the water infrastructure options. With current water treatment technologies, we are able to treat any quality of dirty water into any quality of clean water. This means that the old paradigm of one water type for all purposes change – purpose-sufficient water quality is enough. It also means that recycling of water may become a viable option economically as well as in regard to water quality and safety.
Sensors are becoming available for an ever increasing number of parameters. The quality and robustness are increasing rapidly and the required service is diminishing. This means that the sensors become more reliable and hence can be relied upon to a much greater extent for automatically handling critical processes. Online and real-time control means safer and more
effective operation.
The combination of better sensors and new water treatment technologies is a strong enabler for decentralised and diversified water treatment. Plants can be run with a minimum of personnel attendance. Whereas earlier we had tens of sensors we will in the future have thousands of sensors in the water utility cycle to handle all the complexity in an effective way.
So what is the difference between having tens and having thousands of sensors?
The main difference is that we need some kind of automation to bring the thousands of data points into useful and actionable information. As an operator or a water consumer, I should not have to worry about all this complexity. As with the telephone network, for the most part, of the couplings should be handled “behind the curtain”. The caller should just know whom he wants to call.
tomorroW
So the challenge is clear.
Downloaded from http://iwaponline.com/ebooks/book-pdf/651186/wio9781780407586.pdfby gueston 14 January 2022

18 Smart Water UtilitieS: Complexity made simple
It is not possible to effectively manage and control systems and processes that are not well understood.
Whether the dynamics are fast (seconds or minutes), medium (hours) or long (days, weeks or months), we need data to make good decisions. Data from sensors, measurements, laboratory analysis, and observations. From short to long timescale processes and from water catchment to wastewater effluent, we need real-time and online data to measure what is going on.
However the enormous amounts of data continuously streaming in from a variety of sensors in a multitude of positions, together with all the other types of data is bound to be confusing unless a structured analytical system is set up to transform data into information.
The information has to be easily comprehensible, ideally green or red light indications – and in
case of red light followed by an array of possible reasons for the malfunction and its correction. The information needs to be tailored to the many decisions that should be taken in the water cycle. From automatic decisions taking place in controllers, operational decisions about choice of critical set point, tactical decisions on how to replace or redesign the system and strategic decisions on the higher goals of the utility and its collaboration and interaction with the world around it.
A framework for Smart Water utilities based on a M-A-D approach (Measurement-Analysis-Decision) is proposed and elaborated upon in this book. This framework organises the ”Smart” in a comprehensible way, which gives a good starting point for implementing ”Smart” in a water utility by providing an overview of supporting technologies and methods. A tool box for all water challenges.
complexity made Simple
A tool box for all water challenges.
Downloaded from http://iwaponline.com/ebooks/book-pdf/651186/wio9781780407586.pdfby gueston 14 January 2022

19approach
Downloaded from http://iwaponline.com/ebooks/book-pdf/651186/wio9781780407586.pdfby gueston 14 January 2022

20 Smart Water UtilitieS: Complexity made simple
The auThors’ MoTivaTion
Water is a resource essential for all life. This perspective should penetrate all our handling of water. The challenges of water in a modern society are in many cases rooted in its apparent abundance. Traditionally, to the extent that water could be claimed and moved to the location of usage, the water problem was solved. However, as the population and cities have grown, industries are adding to the pressure on water resources; climate change is further adding to the stress; the former robust relationship between water in nature and water in society has become, or is at the verge of becoming, out of balance.
The rules have changed. Today the approach of ‘every man for himself ’ cannot work. There needs to be some kind of water stewardship that ensures that the urban and the natural water cycles work together seamlessly and without destroying values in either place.
It will be possible to achieve this through intelligent water stewardship, and the water utilities hand in hand with the authorities at different levels are in charge of solving this task. The authorities set the requirements at the interfaces and the utilities should strive towards excellence in managing the water accordingly.
While water requirements today are quite crude and based mainly on maximum concentrations, future requirements will be based on the ecological quality of the recipients and reservoirs. Hence utilities need to acquire a deeper understanding of the urban water systems as well as the natural water system. Through an improved understanding better control can be achieved – and hence a better result. The solution is both technical and behavioural – but most of all we believe it is intelligent – and achievable by applying “Smart Water Utility” technologies.
While the mounting pressure from the demand pulls this area forward, the technology opens up new possibilities and creates a push effect.
Downloaded from http://iwaponline.com/ebooks/book-pdf/651186/wio9781780407586.pdfby gueston 14 January 2022

21approach
There needs to be some kind of water stewardship that ensures that the urban and the natural water cycles work together
seamlessly and without destroying values in either place.
demand pUll
Regulatory requirements, economics and efficiency are significant driving forces for any utility manager and for any water operation, small or large. The quality has to be satisfied at all times in the various parts of the urban water cycle, for the consumer of drinking water as well as for the lake or river receiving the treated wastewater. The quality requirement will become increasingly stringent and will have to be monitored around the clock. Of course this sets tremendous demands on instrumentation and frequent measurements of many different variables, but also on our ability to interpret an ever increasing torrent of information. It is apparent that this cannot be done manually. Instead, we have to trust that automatic systems can take care of most of the operational challenges, some in a very fast time scale, others appearing very slow, in periods of months and years.
Energy is usually the single largest operating expense in water operations so it makes economic sense to reduce those costs where possible through good control. The vision of zero or even positive energy plants has already been realised in some cases. Furthermore, wastewater is not waste, it is a resource, containing thermal energy, organic substances, phosphorus and many other interesting and valuable components. Therefore any wastewater treatment is nothing more than a water resource recovery process.
technology pUSh
To measure is to know and obtaining reliable measurements is the fundamental condition for any good operation. In any plant operation, small or large, the primary goal is to (hopefully automatically) make sure that the equipment – pumps, motors, valves, etc. – are operating adequately. The next level of information is about water quality. The development of online sensors has been remarkable and it is logical that all water operations should take advantage of this.
There is a risk with having lots of data available, whereby we may become data-rich but information poor. Therefore it becomes increasingly important to exhaust the measurement data and make meaningful information out of it. With the computing power today, any computation effort is almost for free. Our challenge is to make the maximum use of the measurement and computational resources.
Still another crucial development is the revolution in communication. The “internet of things” makes it realistic to monitor any instrument wherever we are. It also means that competent people such as operators and process engineers do not have to be physically present at a process or a plant. The “death of distance” makes them available for operations of any scale and size.
Downloaded from http://iwaponline.com/ebooks/book-pdf/651186/wio9781780407586.pdfby gueston 14 January 2022

22 Smart Water UtilitieS: Complexity made simple
This book is addressed to the entire water industry: managers, engineers and operators of water and wastewater utilities, consultants, designers of water infrastructure, researchers in university and industry, innovators, manufacturers of equipment,– and policy makers.
The concept of “Smart Water Utilities” extends by borrowing the use of ”Smart” from the electrical energy arena (e.g. Smart Grid) to water. The book is about the full water cycle and how to manage and control it in an intelligent way by the use of online real-time data. A very simple model is proposed, called M-A-D: Measure–Analyse–Decide. So, basically:
1. Make sure you get the data you need, preferably in real time;
2. Make sure you analyse the data both correctly and creatively; and
3. Apply the results to take better decisions.
This is about decisions at all levels, from automatic control to management of the full water cycle and the organisation to handle it. Besides from presenting the M-A-D framework there is a number of interesting case stories from people working with Smart Water Utility concepts. The book ends with a number of visions, reflections and views into the future of Smart Water Utilities covering areas of management, technology and innovation, presented by leaders in the profession.
Basically our view is that today you can treat any kind of poor water source and convert it to any kind of high water quality you wish. It is all a matter of the cost and complexity of the treatment. Especially, it is about the energy that you put into the process as well as the required capital investment.
Energy and capital are the two main restraints keeping the world from reaching the grand water vision. But we know that in water laboratories all over the world, scientists and engineers are spending work-hours and night-hours pushing the technological limits to provide water smarter, and at a lower cost, both in terms of treating it and transporting it.
This book is about all these water innovations and how they can be used in the real world to benefit all. Part of the water industry is mature and water and wastewater are handled consistently and with few hiccups and have been for decades. But there is also an emerging area in which new-comers and visionaries tenaciously develop new water technologies and frameworks for how to handle the water more intelligently.
We can all contribute and have a role in creating the new and improved water utility: the water utility 2.0. It will require a lot of effort from all of the industry.
Having picked up this book and read this far, we welcome and encourage you to take part and join us on this travel into new and emerging possibilities.
thiS book iS for yoU!
Downloaded from http://iwaponline.com/ebooks/book-pdf/651186/wio9781780407586.pdfby gueston 14 January 2022

23approach
Water Utility Manager
You have been entrusted with a very important and valuable asset of your community. The decisions that you make while managing will have to be lived with by water utility managers for the next 50–100 years. But they are not the only ones to enjoy your legacy. The economic and social developments of your community are also greatly influenced by your decisions for many years to come. And even if we don’t talk a lot about it, the nature around us is also affected. Remembering back when you chose this path of career was not nature an important personal driver?
Water Utility engineer
There are so many things to understand about the urban water cycle and so many options to make your footprint clear. Be it automation and control, construction, treatment processes, models, asset management, water cycle wide integration or any other field, your utility relies on your ability to make the effort to really go deep into understanding what is going on and how it could be made to work optimally. In the day to day hassle of making things and collaboration relationships work, it might be difficult to find time to think out of the box – but try to make time. You might be closer to a great solution than you think.
Water Utility Director
Dear Director, this is important! You need to understand what Smart Technology makes available to you. You can set the direction and paint the future of your utility. Please paint it to be smart. Not just for the sake of your employees, the politicians that rely on you, your customers and stake holders – but also for yourself. By making the water utility smarter your doubts and fears about catastrophes looming on the horizon can be reduced. You can sleep soundly at night knowing that the smallest problem on the horizon will be picked up and that you can defend all of your actions to a potential sudden angry political reality. Just browsing through this book will give you an idea of what can be done. Then you may give the book to your engineers and see what happens.
consUltant
So you are working in a water company – new or mature. Well, this is as you probably noticed neither the fastest, most glamorous nor the easiest industry. But it makes good moral sense and as an engineer you do get some street-credit for “saving the world”. We hope to give you a better overview – outside of your particular choice of specialty. This can enable you to collaborate better with other businesses and provide new solutions to your customers. Additionally, understanding world trends and the world of your customers will also benefit your company. Please be patient but persistent with the industry.
Designer
We know the dilemma: make it smart or make it the conventional low-risk way. But please if you don’t invest the time in understanding how smart this could all be – now, then the industry will never change for the better. So muster the courage and the dedication to sell a good solution, talk to the client, suggest something better, and educate him as well. Design the plants and the networks for flexibility and make sure that sensors are specified as well. Coordinate with the engineers in automation and control; they will be happy to help you and show you where flexibility counts. Remember, it is profitable to become smart!
researcher
You are still up? This late at night? We know! We are up with you. We imagine you are doing experiments in laboratories and in front of computers trying to wring out the secrets of how to treat water even better, how to transport it even cheaper, how to detect that substance that is still undetectable, how to control the process even better without compromising process stability. In the breaks from your experiments read this and make sure that your research really counts on the big problems. We need your intelligence, persistence and concentration to work on the real-world problems. Above all, make sure that you not only solve the problems right, but also solve the right problems.
Downloaded from http://iwaponline.com/ebooks/book-pdf/651186/wio9781780407586.pdfby gueston 14 January 2022

24 Smart Water UtilitieS: Complexity made simple
Water challenges around the world take different forms, depending on factors such as climate, water availability and wealth of nations.
Some countries, such as Canada and Norway, have tremendous water resources. Norway can supply 100% of its electric power using hydropower. There is a temptation when having so much water to consider it infinite.
Lack of water is a major reason for the Middle East crisis. The Gaza strip will be completely dried out in a few years due to over-abstraction of its aquifer. The aquifer under the West Bank is primarily used by the Israelis, leaving far too little for the Palestinians.
Northern China is dry, while the South is wet. The North includes not only major cities such as Beijing but also huge water requirements for the agriculture, for energy generation, for other industries and for a rapidly increasing population. The Chinese solution is to build a huge south–north waterway from the Yangtze River.
The west and south west of the USA is a dry country, creating a water supply challenge for millions of people. There is also a serious conflict between oil exploration using hydraulic fracturing and agriculture that depends on irrigation using groundwater.
Our huge need for oil is causing terrible suffering for many people. In Nigeria, the livelihood of some 30 million people has been destroyed by leakages from the oil exploration in the Niger Delta. This used to be one of the most valuable wetlands in the world.
Every country, region and city has its own water challenges. Smart Water utilities provide a toolbox that is useful across all challenges and conditions. The tools will not always solve the problems but will provide a framework and relevant data to make the problems solvable.
This book will present you with a toolbox and an introduction to methods and tools, providing a perspective of what can and could in the future be achieved by intelligently managing the water. And that means managing water at all levels, from national politics, local politics, and utility leadership down to the concrete physical layer of controllers operating to treat and transport the water.
a tool box for all Water challengeS
Canada: The great riches found in the Athabasca oil sands put severe pollution pressure on the Athabasca River due to leakages and tailing ponds.
Latin ameriCa: 77 m people lack access to clean water. 100 mio people lack access to sanitation. Aquifers are facing serious quality problems due to heavy mining.
mexiCo: The groundwater level under Mexico City is dropping due to extraction of more water than is supplied by the rain. The problem is causing the whole city to sink.
USa: The water table at Lake Mead has dropped to an alarmingly low level. Eventually Hoover dam will stop producing energy.
Downloaded from http://iwaponline.com/ebooks/book-pdf/651186/wio9781780407586.pdfby gueston 14 January 2022

25approach
the mediterranean: Countries are increasingly suffering from water scarcity and the Mediterranean is struggling under the pressure of pollution in its surrounding 22 countries.
rUSSia: Seen as a whole, Russia has plenty of water resources available but struggles with water quality around many urban and industrial areas. Between Kazakhstan and Uzbekistan, the Aral Sea, which was once among the largest lakes in the world has shrunk and almost disappeared due to intensive irrigation projects through the 60s, 70s, 80s and 90s. The lake is now being slowly restored after decades of overusing.
China: As its population and economy grows, so does the need for water. At the same time, the growth causes water pollution in many parts of the country. China is working hard on establishing much needed urban water cycle systems – but it is a huge challenge.
india: Suffering from very poor water security, not only because of lack of water, but also because of lack of sufficiently clean water. Too much groundwater as well as surface water in streams, rivers and lakes is seriously polluted.
aUStraLia: It is a dry continent. For example, Perth in the south west is suffering from long-term drought and hence has been seriously troubled by water insecurity. Other parts, for example in Queensland, experience extremes of both severe droughts and huge flooding.
egypt: Depends completely on the River Nile for its water needs. The river flow rate is decreasing in general and this trend is further accelerated by hydropower and dam projects upstream. Ethiopia’s construction of a hydroelectric dam is a source of great transnational conflict.
Downloaded from http://iwaponline.com/ebooks/book-pdf/651186/wio9781780407586.pdfby gueston 14 January 2022

The important thing about the approach is
That it works
A method should be systematic
And easy to understand
It should guide your thinking
But not limit it
It should be helpful
And it should be structured
But the important thing about the approach is
That it works
Downloaded from http://iwaponline.com/ebooks/book-pdf/651186/wio9781780407586.pdfby gueston 14 January 2022

approach2
Downloaded from http://iwaponline.com/ebooks/book-pdf/651186/wio9781780407586.pdfby gueston 14 January 2022

28 Smart Water UtilitieS: Complexity made simple
Making water visible
In industrialised countries we are mostly blind to the various aspects of water. We simply take the clean water in the tap for granted and we are hardly aware of the dirty water that goes into our sewer systems.
For a long time it was impossible to see and quantify what exactly was going on in the various processes along the water cycle. Hence it was necessary to build the systems robustly and fail safe. Not surprisingly, this led to very large and inflexible water systems. The ability to look into the processes has increased dramatically over the last 10–20 years. What was earlier impenetrably unclear can now be measured online and continuously, and hence be visualised and understood.
Utilities that have embraced this transformation and welcomed the new sensors in their utilities have been surprised by the result more than once. What was once common understanding of how the systems operated has in some cases been confirmed and in many cases contradicted by real measurements, and new understanding has emerged. Phenomena that we previously had no idea about suddenly could be detected in the data and new and better explanation models could be developed.
Additionally the new information has made it possible to operate the system in a better and more responsive way based on dynamic data rather than assumptions about the average process behaviour.
What is a smart Water utility? A Smart Water utility ensures a systematic
and intelligent decision making process at
all levels, based on online water quality and
quantity sensors, taking into account the
full water cycle from water intake to water
effluent, with the aim of ensuring adequate
water quality and quantity, with a minimum
consumption of energy and materials. This
has to take place in close to real-time with the
required decisions.
Downloaded from http://iwaponline.com/ebooks/book-pdf/651186/wio9781780407586.pdfby gueston 14 January 2022

29approach
applying sMart throughout the water cycles
To measure is to know. This book is about understanding the value of sensors and control throughout the water cycle – or more precisely throughout the water cycles. The main municipal water cycle defined as starting with water intake – through drinking water treatment and distribution, further on to the user, then to wastewater collection and treatment and returning to nature through disposal of treated wastewater – is supplemented by other water cycles, primarily the industrial, agricultural and ecological water cycles.
All of these cycles and their interactions have great potential for improvement through the application of sensors and control. As the water resources are being increasingly exploited to the last drop, it is important that this is done in a truly non-wasteful way. Sensors and control systems can inform our actions, ensuring that we act intelligently and deliberately and hence ensure an effective and good utilisation of the water resource.
sMart water
The heart of the message of this book is that you need to measure in order to understand, and you need to measure in real-time to control. By transforming the invisibility of water quantity and quality into something visible and transparent, we are enabling and empowering true water stewardship.
Translating the high-level global and regional challenges and responsibilities of water stewardship into some manageable, practical actions is the next challenge – and it is not an easy one.
There needs to be a systematic approach and way of thinking on how to apply Smart Water solutions to transform our current ineffective water system into a next-century water system – a version 2.0 of water systems.
The definition of a “Smart Water utility” on the previous page is the closest we come to a strong definition. However what is more important is to define what kind of problems you are trying to solve and how to measure the progress toward that goal. Without Smart water systems it might be difficult to even define what you are trying to do. The invisibility of the water cycle needs to be changed in order to understand.
The definition keeps an open eye towards using new technologies to solve old problems in a better way, primarily by the application of new water treatment technologies. A good example of this is the increasing application of water re-use. Water re-use holds great promise for saving water. At the same time, the water cycles will become more and more interconnected and hence in need of stringent online measurements and real-time control and automation to ensure consistent water quality and sufficient water quantity.
In industrialised countries we are mostly blind to the various
aspects of water. We simply take the clean water in the tap for granted and we are hardly aware of the dirty water that
goes into our sewer systems.
Downloaded from http://iwaponline.com/ebooks/book-pdf/651186/wio9781780407586.pdfby gueston 14 January 2022

30 sMart water utilities: Complexity made simple
Concerns about Smart Water:
66 It can seem like a jungle finding out what I need and I may not understand the lingo, the architecture, or what I am supposed to do with it all?
66 How am I going to integrate it into my current IT systems, not to speak of how I am going to integrate it into my organisation – to make people take the new data in?
66 What if it does not work and controls things in the wrong way. Then I am worse off than my current conservative approach;
66 What about all the maintenance of the system I need to do? Sensors and control are much more fragile products than pipes, pumps and valves;
66 I already have a few data, and I know what to do with these data. But I cannot manage many more parameters. How am I going to make sense of it all?
66 Things are working all right as they are and the sensors might unravel all kinds of trouble for which I don’t want to take responsibility;
66 I am not sure if it will ever pay off. How can I know if I will get any new information at all ;it might be just as I assumed it to be?
Today even large utilities are managing operation with only rudimentary sensors and most utilities are far from exploiting the full potential of monitoring and control. But sensors are available for most water process related purposes and from several suppliers. Experience has been acquired in most applications. But there is still much to be learned before the extensive application of sensors becomes standard operating procedure.
So why are smart water solutions not catching on like wildfire? There are many concerns in the water industry.
One reason is that water systems development due to its capital intensiveness develops slowly. Another reason is the technical skills required. This list shows some of the concerns. This book tries to help in tackling these concerns and to show the benefits despite the concerns.
sMart water technology leaving infancy?
How am I going to integrate it into my
current IT systems, not to speak of how I am going
to integrate it into my organisation – to make
people take the new data in?
Downloaded from http://iwaponline.com/ebooks/book-pdf/651186/wio9781780407586.pdfby gueston 14 January 2022

31approach
The most important enablers for Smart Water utilities are:
66 Instrumentation technology: in-situ sensors that are easy to place and to maintain;
66 Actuator technology, variable speed drives are widespread and are a proven technology;
66 Computer power: it was a limiting factor in the 1970s, now it is almost free;
66 Data collection: is not an obstacle any more – even wireless has become standard;
66 Control theory: there is a huge knowledge available for water operations;
66 Dynamic models are now available for all major processes;
66 Education of operators and process engineers is improving rapidly
66 Incentive structure is getting in place based on legislation initiatives;
66 Plant design for control flexibility is still. lacking somewhat and needs further attention.
Leading utilities today are already using hundreds of sensors and online mathematical models to help their operation. They are pioneers and their work is extremely important for the rest of the water industry. These utilities are leading by example and are moving the boundary of our joint Smart capabilities.
A very fortunate characteristic of the water industry is its general willingness and interest in sharing experience.
The application of instrumentation, control and automation (ICA) started in the 1970s. Today the capacity of a biological nutrient removal (BNR) plant is typically improved by 10–30% with the application of ICA. 10–20 years from now, the typical capacity increase by ICA is predicted to be 20–50%.
sMart water technology growing up!
The full exploitation of instrumentation, control
and automation will have enormous consequences for both design and operation
of water systems.
Downloaded from http://iwaponline.com/ebooks/book-pdf/651186/wio9781780407586.pdfby gueston 14 January 2022

32 sMart water utilities: Complexity made simple
the role of instruMentation, control anD autoMation (ica) in a water utility
In his description of the ego, Carl Gustav Jung writes:
“Theoretically, no limits can be set to the field of consciousness, since it is capable of indefinite extension. Empirically however, it always finds its limit when it comes up against the unknown. This consists of everything we do not know, which, therefore, is not related to the ego as the centre of the field of consciousness. The unknown falls into two groups of objects: those which are outside and can be experienced by the senses, and those which are inside and are experienced immediately. The first group comprises the unknown in the outer world; the second the unknown in the inner worlds. We call this latter territory the unconsciousness.”
Stimuli from the outside (somatic) as well as from the inside (psychic) feed the ego with information, he further writes:
“A considerable proportion of these stimuli occur unconsciously, that is subliminally. The fact that they are subliminal does not necessarily mean that their status is merely physiological, any more than this would be true of a psychic content. Sometimes they are capable of crossing the threshold, that is, of becoming perceptions. But there is no doubt that a large proportion of these endosomatic stimuli are simply incapable of consciousness and are so elementary that there is no reason to assign them a psychic nature.”
Using this as a parallel to understanding the sensor and control system, it is clear that, as in the human psyche, there is an ego. In the utilities, this ego is the people managing
and controlling the utility. The stimuli come primarily from a sensor system set up to monitor and control the system (psychic stimuli) as well as a sensor system to monitor the outside world in the form of, for example, rainfall, groundwater level in the water catchment reservoir, the incoming wastewater flow and strength, etc.
A large proportion of the sensor inputs are used locally to control various processes, for example, DO sensor input is used to control the valves that increase or decrease the airflow to the biological processes. This type of process takes place at the unconscious level, because the ego (operators of the plant) does not need to act on this, as it happens automatically. However the information on DO concentration may rise to conscious awareness as it is routinely checked, an alarm is set off or it is deliberated whereas DO set point should and could be increased or decreased.
As described by Jung, the sensor networks could in principle be extended indefinitely, but in reality we only have the sensors we have – the rest is unknown, though it may sometimes be determined from existing data – by various clever methods.
Jung further writes:
“Concepts that are too broad usually prove to be unsuitable instruments because they are too vague and nebulous. I have therefore suggested that the term ‘psychic’ be used only where there is evidence of a will capable of modifying reflex or instinctual processes.”
In other words, to be an effective ego for the utility you should be able to modifying
Downloaded from http://iwaponline.com/ebooks/book-pdf/651186/wio9781780407586.pdfby gueston 14 January 2022

33approach
the reflex or instinctual processes, that is, to change the set point according to the situation. The wise ego is, based on analysis, able to modify control strategies as he transforms new information to new and better experience about the functionality of the interaction between the equipment of the water utility with the surroundings that it is made to control, i.e. to change the flood protection strategy according to experience of a flooding event, to change the DO set point scheme according to analysis of energy consumption and daily pattern, etc.
Sensor and control systems are in many ways not so different from our daily experience of being human beings and having new experiences and developing our ability to cope with the world around us. The major difference is that we are establishing the sensation inputs as we add more sensors to the systems, we increase the intelligence as we program the software handling the inputs and we even define the body and its functions based on this intelligence as we slowly rebuild the system year by year.
Downloaded from http://iwaponline.com/ebooks/book-pdf/651186/wio9781780407586.pdfby gueston 14 January 2022

34 Smart Water UtilitieS: Complexity made simple
Diseases in ica systeMs
Being the nervous system of the utility ICA can suffer from different problems, which are similar to human psychological diseases and disorders.
The following diagnosis tool is not based on a deep level of knowledge about psychological disorders – and is meant as an illustrative rather than a real way to diagnose control systems.
These disorders may be a helpful tool to discuss the challenges in your current ICA system.
amnesia: data are not stored systematically. This means that it is impossible to go back into data to find the frequency of various types of events. In many SCADA systems, data that are a few years wold or less are erased to make digital storage space available for new data. Storage is not so expensive anymore! Make sure you save your data and that you have a system that makes historic data easy to access. The same goes for various reports produced over time.
aDhD: complex issues are not solved or finalised – because the attention shifts before the system is running stably.
autism: being very particular about one specific element in the Smart Water utility set-up and ignoring the overview and other important aspects.
antisocial behaviour: the system goals become so important that personnel and management are unhelpful to each other. Certain types of management systems may create a culture of blame and fear.
catatonia: the system does not react to any disturbance, but just continues as if nothing had happened. In effect, no, or very little, control of the system is applied.
hypochondriac: the alarm system is overly sensitive and too many alarms are issued. This makes operators indifferent to alarms; hence serious alarms may easily be overlooked.
impulse control disorder: It is difficult to understand the system and on occasions it reacts completely irrationally and it is very difficult to troubleshoot or even explain why the system is doing what it is doing,i.e. which rules were activated?
Downloaded from http://iwaponline.com/ebooks/book-pdf/651186/wio9781780407586.pdfby gueston 14 January 2022

35approach
Sensor and control systems are in many ways not so different from our daily experience of being human beings and having new experiences and developing
our ability to cope with the world around us.
Manic-depressive: when controllers are not correctly tuned they may either oscillate extremely around the set point – leading to great wear on all equipment. Or, on the contrary, react extremely slowly to changes and hence in effect fail to control.
perfectionism: aiming for flawlessness in the control system – may drive you mad!
post-traumatic stress disorder: systems may come into situations from which it is difficult to get back to a normal operation unaided. This may for example be the case if the sludge content in the biological wastewater treatment becomes too high or low. Here human interference is necessary to get the system back into balance.
schizophrenia: a control system that controls different aspects of the system based on different beliefs or goals for the operation; this will give the system a different personality depending on the location.
sadomasochism: the control system does things that impair the functioning of the overall system.
separation anxiety disorder: a system that feels it needs operator attendance 24-7.
Water operation is a truly multidisciplinary area. Process engineers have to coordinate their efforts with hydraulic engineers, sensor specialists, computer engineers, control and communication people and many others. Furthermore, the water cycle is a chain of operations of many different kinds, from pumping, water treatment and distribution, wastewater collection, wastewater treatment, sludge treatment, to name the principal operations.
Too often, the areas are fragmented, not only between different professional disciplines but also between different organisations. Still the water has to be delivered at anadequate quantity and quality at any time. We need not only to understand the integrated picture but also to adapt the operation to the complete water cycle. Then the system can become “smart”.
Downloaded from http://iwaponline.com/ebooks/book-pdf/651186/wio9781780407586.pdfby gueston 14 January 2022

36 Smart Water UtilitieS: Complexity made simple
Objectives in a smart Water utilityThe reason for implementing Smart concepts
in water utilities is to consistently achieve the
objectives of the water operations. The multiple
objectives at different levels are discussed
and a framework for identifying and ordering
these objectives to achieve clarity is presented.
custoMer service level
Water utilities are delivering a product or a service to a large group of customers. But it is not a product that lends itself easily to industrial customer models, where the products are optimised towards the likings of one or more segments of consumers.
“The customer” is not a single more or less identical figure. The most obvious customer is of course the consumer of the service, i.e. water consumer and wastewater disposer; domestic or industrial. But the customer is also the community as a whole. Additionally, there is nature or the environment as a customer – or at least a key stakeholder. Taking clean water and delivering less clean water back to a different place can have dire consequences for nature – and in turn these consequences come back to the community and hence to the individual customer again in various indirect ways.
The demands from these three entities are treated in the following pages.
When determining the customer service level, all these different aspects need to be considered and balanced against each other. Regardless of how well we try to design our systems some of the aspects will be in conflict and we need to find good ways to mediate compromise or innovate around these conflicts.
At the same time, if you try to quantify all the perspectives and pool them into one joint parameter you may easily loose transparency, not only to the customer and community but you may also impair your own understanding.
In the best case, the service level definitions are encompassing, specific, simulatable, achievable, adjustable and have a clear effect.
Downloaded from http://iwaponline.com/ebooks/book-pdf/651186/wio9781780407586.pdfby gueston 14 January 2022

37approach
encompassing
The service level definition needs to encompass the whole aspect you are trying to define. This is often difficult to achieve and instead indicators are used. But that is not always a good solution. Take energy consumption as an example. The problem is not energy; the problem is CO2 in the atmosphere, so if the energy is produced by a windmill it is not a problem. But even taking CO2 emission as the parameter may not be the right approach. All greenhouse gases are important. Sewer systems may produce nitrous oxide, which is 300 times more potent than CO2. So if you are to balance these two factors, it may be sensible to remove nitrous oxide by the use of some additional CO2 produced by conventional energy production.
specific
Service levels should be very specific, especially in relationship to risk. A good example when it comes to flooding is that water should not occur at terrain level more than once every twenty years. A poor example is that “operations should be environmentally friendly”. While the former is specific, the latter can mean almost anything and it is difficult to agree on its meaning, hence it is not helpful in the process of setting priorities.
adjustable
Obviously the longer the return period that is chosen for the sewer flooding, the better the delivered service – but at the same time also the more expensive. By having a service level that is adjustable you can open up a rational discussion with the community around the utility. No one wants higher bills. But if you can clarify that the service level is something that can be adjusted, then it is possible to have a constructive debate about the relationship between service level and cost.
simulatable
Simulations are great tools for communication. Consider the example of a twenty year return of flooding. It is possible to determine how strong a rain the system should be able to handle based on statistical data. It is possible to make a hydraulic simulation of the reaction of a sewer system to any given amount of rain. This is useful in estimating the additional cost of the sewer system if the system should have a stronger rain resistance. Simulations also make it possible to try out different methods to achieve the goal – and hence find the least costly design. This can be done in a virtual and low-cost environment. Hence the simulations may work both to define the problem and negotiate the optimal balance between service-level and cost. After the goal-setting discussion the models can be used to help find the design and control road to achieve the set goals.
have a clear effect
What is more discouraging than striving for and working hard to achieve a goal, which you cannot discern? So if the goal is about better aquatic water quality in the natural streams, make sure to influence the right parameter to achieve this. And make sure to monitor the change as well as the effect, so that you can see it is really happening. Many utilities are so caught up in their daily job, that they don’t get out and see the fruits of the job in terms of better aquatic environments and the more diverse aquatic life. Obviously, one needs to prepare for long time constants, but that is no strange thing in the world of utilities.
Downloaded from http://iwaponline.com/ebooks/book-pdf/651186/wio9781780407586.pdfby gueston 14 January 2022

38 Smart Water UtilitieS: Complexity made simple
Many utilities are so caught up in their daily job, that they don’t get out and see the fruits of the job in terms of better
aquatic environments and the more diverse aquatic life.
stakeholDer DeManDs
customer demands
The customers’ wish for water services may vary from place to place. Where there is still no safe reliable source of running water that is a first request. As water supply and wastewater handling systems become more advanced and the customers get used to the service, it seems the main interests raised relate to either price or quality of service – especially reliability. If quality and quantity are satisfactory, as is the case in many countries, the main interest revolves around price. Even so, most people are unable to remember their annual spending on water services.
Regardless of this fact, the focus on price naturally translates into a wish to optimise the cost structure of water. That is, to obtain rationalisations of the staff count at the utility, the amount of energy consumed, as well as the consumption of other consumables such as chemicals. Hence, there will always be a pressure towards optimisation. In some places, the pressure for low cost may be stronger than what constitutes the ability to provide safe and reliable water handling. Such issues need to be dealt with politically or from a financial point of view.
An easy item to save when under price pressure is on the capital investments, i.e. the repairing and refurbishment of various parts of the infrastructure. This may work out for long periods, even decades. However, as many cities around the world experience at some point in time, the bill has to be paid. The water infrastructure is affected by strong and corrosive forces and eventually they will deteriorate. In
many places, the infrastructure has been built during a relatively short time period. Now 50–100 years later, all of it needs to be exchanged at the same time – at an enormous cost. Hence, obviously, it is a better strategy to apply a consistent renewal system that ensures timely repairs and refurbishments – stretching the work over a longer time period.
The main contact between utility and customer is normally carried out by a customer service centre that makes sure bills are sent out and paid. The main reasons for the customer to contact the utility are:
66 Discussions of bills;
66 Water quality problems;
66 Residential wastewater problems;
66 Problems with contractors working for the utility.
Beyond the point of time for billing, water utilities may also want to contact their customers. This may for example be in the case of a drinking water pollution incident or the closing of water supply due to repairs. In many places it is becoming increasingly common that the utility contacts the customers by means of a telephone text messaging system. Such a system can be coupled with the Geographical Information System and hence be very precise in its targeting of customers.
Increasing interaction is also happening as more Smart Water technologies enable a better understanding of local quality issues, as for
Downloaded from http://iwaponline.com/ebooks/book-pdf/651186/wio9781780407586.pdfby gueston 14 January 2022

39approach
example during water mains flushing. With colour sensors it is possible to inform customers when not to use the water and when to do residential flushing. Customers are expected to request more and more data over time. Data made available by apps and through social media such as Facebook, Instagram, Twitter and LinkedIn.
Smart technologies are not limited to the technical domain, but are increasingly entering the social domain – also in water.
When, on rare but unpredictable occasions, something dramatic happens at the water utilities, smart technology can play a major role in both detecting and solving the problems fast. In the case of Campylobacter pollution at Køge drinking water facility in Denmark, it was possible to warn all customers via text messaging. Various sources of contamination could be ruled out based on spot samples and online sensors. Based on the combination of a map of the locations of disease cases and mathematical models of the system, a few possible sources of contamination could be pinpointed. Based on DNA sequencing it could be concluded that the source was from a single strain of animals. These technologies helped the utility react fast and keep customers and authorities fully informed during the process.
community demands
Water utilities have a special obligation to serve the community of which they are a part. However, even if the community is often made up of all the customers, it is not always, so that the customers and the community’s demands are exactly the same. The community usually represented by a political body should also have long-term interests in mind when administering the water utilities. So even if the interest is to have a low price and low operating cost, etc. there is also the obligation of the continuation of the community. Hence, the political body supports and ensures that the necessary capital investments are carried out.
Water utilities seem to have a long-standing tradition of always using the ‘least expensive’ criterion in tendering processes. That in spite of the well-known fact that what is least expensive in the short time horizon may not be so in the long horizon. Water utilities will have to improve by making smarter investments. This can be done by focusing on TOTEX, i.e. the total expenditure. This is a much more effective strategy than the current CAPEX (capital expenditures) philosophy by which OPEX (operational expenditures) are sacrificed as higher operating costs and short lifespan of the structures.
The community may have more interests. In cities with large industrial plants there is a strong demand that these plants – ensuring important jobs and tax income in the community – should be readily supplied with necessary water services. It is the obligation of the water utility to find good and environmentally sound solutions for these demands – and today there are lots of solutions available. Especially, if water utilities start thinking outside of the boundaries of the utility and identify different water streams that can be re-used after water treatment in relevant facilities.
Agricultural needs may also compete with water utilities for access to water. The need for irrigation and the need for other water consuming processes need to be resolved in a just and fair way. Today this ‘negotiation’ is often left to ‘the one with the stronger pump/deeper well’ rather than solved politically. This needs to change.
The global society outside the boundaries of the municipalities is also increasingly having an impact on water utilities through the emergence of the greenhouse effect, which leads to a different distribution of water resources. Where some areas experience more frequent and heavier rainfall, other areas experience longer drought periods.
Both situations constitute a problem that the water utility needs to deal with. In many places, the climate effects are not yet visible, but the
Downloaded from http://iwaponline.com/ebooks/book-pdf/651186/wio9781780407586.pdfby gueston 14 January 2022

40 Smart Water UtilitieS: Complexity made simple
transformation of the infrastructure is so slow that the predicted changes need to be taken into account in anticipation today. Additionally, there is mounting pressure on reducing CO2 and other greenhouse gas emissions. For water utilities this means reducing energy consumption, but also – as is becoming increasingly clear –reducing the emission of nitrous oxide.
environmental demands
Sustainability is a key word that has to be considered in all water operations. There are many ways to define it, but they all reflect a simple truth. We need to find new efficiencies by doing more and using much less. This includes the development of new technologies and technical solutions and using less water, not wasting energy and other resources for the treatment and transport of the water.
Water is a very special commodity since it is finite. When we talk about water use we have to be careful with the nomenclature. Water used for a shower or a washing machine is incapable of further use. Other “uses” may leave the water unusable for anybody else.
… the urban water cycle becomes both a source of
pollution of natural water resources and a victim
of such pollution.
The urban water cycle and the natural water cycle are strongly interconnected. This means that the urban water cycle becomes both a source of pollution of natural water resources and a victim of such pollutions.
The urban water cycle is a source of pollution through its emissions of effluent from
wastewater treatment plants – even when water is treated, polluting material is still emitted. In some cases, the pollution load from the urban water cycle increases above normal through combined sewer overflows, where uncleansed (but often diluted) wastewater during heavy rain fall overflows due to insufficient sewer system to transport all of the surplus water.
Wastewater may be polluted with a wide range of different substances. The main focus of the industry has originally been on suspended and visible matter – or filth, which is removed through screens and coagulation and sedimentation in wastewater plants. Secondly, the focus is on organic matter that if not removed before effluent will be degraded in the recipients by the use of dissolved oxygen, leading to oxygen deficit conditions in the recipients. Similarly, the nutrients nitrogen and phosphorus lead to a change of the balance of nutrients in recipients, resulting in various eutrophication problems and hence to deteriorating of the natural quality of the recipients, i.e. lakes, streams, rivers and oceans.
During the last decade, as laboratory equipment has become more and more advanced, there is an increasing focus on micropollutants such as pesticides, medicine and their by-products and recently also microplastics and nanoparticles, which travel through most current wastewater treatment systems and accumulate in the aquatic environment.
The urban water utility is often also a victim of such pollution in the water intake end of the cycle. Generally, the cleanest water possible will be used as the basis of the production of drinking water. However as the pollution matrix of the water grows and becomes increasingly complex, more complex water treatment methods are required, such as advanced oxidation and membrane based cleaning. Not only does the more advanced treatment lead to higher cost, the processes also have various environmental unwanted side-effects.
Downloaded from http://iwaponline.com/ebooks/book-pdf/651186/wio9781780407586.pdfby gueston 14 January 2022

41approach
Different objectives at Different levels
Water utilities have a multitude of objectives at different levels. Organising these hierarchically, as shown in Figure 2.1, provides an overview of all the objectives. Each hierarchical level illustrated by a box represents a level that has its own requirements for effective, efficient and reliable operation. Understanding and clarifying these objectives are crucial for successful and consistent operation of a water utility. urban water cycle objectives
The objectives for the complete urban water cycle are defined outside the “jurisdiction” of the water utility. The objectives include at least these aspects:
customer requirements and expectations. For example, the customers want clean water available at demand and at an adequate quality and pressure. They do not want their basement to be flooded by wastewater during rain events. Clarification of customer requirements and expectations may need facilitation by the water utility.
legal compliance is defined by national law, combined and refined by local requirements put forth by local authorities.
natural limitations and sustainability considerations: for example, it is not wise to pump more groundwater than can be replenished by natural processes or to supersede the capacity of the aquatic recipients for receiving and handling oxygen demanding pollutants.
other technical and economic conditions are applied to the system including cost and input of required resources, such as chemicals and energy as well as in the composition of wastewater.
incoming disturbances such as changes in wastewater flows and composition, temperature, rain events.
On top of these there may be additional objectives related to political or strategic ambitions.
plants and networks
The plants and networks level includes all the main utilities: water intake, water treatment, water distribution, water usage, wastewater collection, wastewater treatment and outlet. The plant and networks included may belong to different legal entities and be handled by different organisations or divisions in the owner organisation.
For the full urban water cycle to work harmoniously, each individual plant and network needs to work according to specified objectives. Recent advances have found that these objectives may in some cases be dynamic, depending on the situation. For example, in the case of heavy rain, where the sewer network may be used for storing wastewater to its maximum capability to protect the downstream sewer system as well as the wastewater plant from flooding. Coordinating and ensuring clear and consistent objectives with regard to effectiveness, efficiency and reliability at plants and networks is paramount for overall good performance of the urban water system.
process and districts
Plants are divided into process parts, i.e. a wastewater treatment plant is typically divided into parts of primary, secondary and tertiary treatment, and sludge treatment. Networks are (or can be) divided into districts serving a geographical area, for example, sewer systems generally have a branched structure, in which branches of a given approximate size can be regarded as a district. Drinking water distribution networks are generally (though not
Downloaded from http://iwaponline.com/ebooks/book-pdf/651186/wio9781780407586.pdfby gueston 14 January 2022

42 Smart Water UtilitieS: Complexity made simple
water intake
water treatment
water distribution
water usage
wastewater collection
wastewatertreatment
outlet recipient
Urban water cycle
Plants and networks level
Process and districts level
Functional units level
Component level
Figure 2.1: The different layers of a water utility.
primary treatment
secondary treatment
tertiary treatment
anoxic processes
aerobic processes
sedimen- tation
aeration tanks
compressor diffusors
everywhere) more looped, ensuring the provision of water from more sides. The trend seems to be for drinking water networks to be divided into separate districts, enabling the shut-off of districts in the case of major leaks or pollution of water. The objectives of each process or district are defined to ensure that the full network or plant delivers on their objectives.
functional units
The above process and districts may be further subdivided into functional units. These units
perform the dynamic and more complex functions of the processes and districts. Such functional units include pumping stations, booster stations, aeration systems, dosing systems, UV systems, etc. For each functional unit, there is a central piece of equipment (typically the actuator) but mostly these units also contain several ancillary components to ensure the efficient operation during various situations. In the aeration system example, the compressor may be seen as the central piece of equipment, but there are also aeration discs, pipework, dissolved oxygen sensors, controllers, communication, valves, etc.
Downloaded from http://iwaponline.com/ebooks/book-pdf/651186/wio9781780407586.pdfby gueston 14 January 2022

43approach
While only a few years ago, the functional units were mostly tailored for each location, today it is becoming more and more common that the functional units are delivered as a package by an industrial supplier. This allows for better optimisation of the units as more engineering hours can be spent on developing a strong standardised design of the physical parts as well as the control of these. However, still in many cases the functional units need to be adapted to the full process or district. This is an area that is often neglected, the result being poor and unpredictable performance of the full system.
components
Each piece of equipment has its own requirements in terms of maintenance and surveillance of performance. The malfunction of a piece of equipment can potentially affect all the above levels and lead to a serious malfunction. The objectives relating to effectiveness, efficiency and reliability for the various components at the different levels define the requirements and the potential benefits of the usage of the Smart Water concepts. During the last few decades, more and more software has been included in many of the components enabling a more precise control of the equipment. Smart Water utilities must make sure to take advantage of these new opportunities.
the three Main aspects of water utility objectives
1. effectiveness in design
By effectiveness is meant the adequacy of the system to achieve the determined objectives. Effectiveness is primarily related to the design of the water utility and the equipment selection, i.e. correct choice of process, good sizing, and good quality equipment with sufficient flexibility. Problems with effectiveness are often difficult or impossible to remedy by means of operation.
Obviously if a wrong process has been selected the effectiveness of the system suffers, but often the error is more subtle. A classic example that can be observed in many places is the usage of an overflow weir before the wastewater reaches the anoxic zone. As it is crucial that the anoxic zone is without oxygen it is very unfortunate that the water is aerated due to the fall over the weir before entering the process – and no smart operational actions can solve this problem.
Obviously if a wrong process has been selected
the effectiveness of the system suffers, but often the error is more subtle.
Under- or more often over-dimensioning of equipment is another frequent problem. Over-dimensioning may happen as designers add multiple safety factors to their design. The effects of this practice can be difficult to overcome. For example a pump that is too large sends detrimental water-hammering chocks through a drinking water distribution system, leading to increased wear of the pipes and their joints. Moreover, it does not work at its most efficient operating range.
Downloaded from http://iwaponline.com/ebooks/book-pdf/651186/wio9781780407586.pdfby gueston 14 January 2022

44 Smart Water UtilitieS: Complexity made simple
Lack of equipment flexibility, especially for actuators, is an important limiting factor to what can be achieved by Smart automatic control of processes. Lack of flexibility, gravely inhibits the opportunities for running the system efficiently and reliably. Lack of flexibility costs in terms of capital investment, as the reliability is often built into the system by using larger tank volumes.
2. efficiency in operation
While it is quite difficult to determine if a plant is running at its optimum, it is possible to see if the performance improves as an effect of changing the operational set points. Efficiency is more or less synonymous with decreasing the cost of operation to a minimum, while still meeting determined objectives including legal and technical requirements pertaining to adequate water quality and transportation of water. The most important costs are energy, chemicals and manpower. For most processes it is possible to define an operational cost formula by adding these three factors multiplied by each unit-cost factor.
From a steady-state point of view, the cost formula can be improved by changing the settings of the different inputs to the processes, i.e. pumping rate, valve positions and aeration. The optimum set of these settings is almost impossible to find by trial and error, though it is possible to come close. By means of a calibrated model of the system, however, it is possible to test a series of settings for best cost function output. Also, the sensitivity to different settings can be evaluated.
Normal plant or network operation is rarely in steady-state; the system is always disturbed or off-set in some way. Disturbances occur in different time scales and involve different parameters, e.g. influent flow/water demand over the day or from season to season. Adapting the plant dynamically to these changes by adding more power during high load and less during low can improve the cost function significantly.
Both averaging and dynamic optimisation relies heavily on online measurement and control – a key discipline in Smart Water utilities.
3.total reliability
Local society is so entangled with the consistent operation of its water utility that even minor upsets have wide implications. Hence, water systems have to run robustly 24-7 and have to be able to absorb internal as well as external disturbances without endangering product quality or quantity.
The solution is to work with clear levels of robustness throughout the utility system. The required level of reliability can be determined in terms of resilience, i.e. the ability to handle defined disturbances instead of, e.g. added volumes and horse-power. In this case more options become available:
Design optionse.g. additional or larger process lines and
equipment, volumes, pipe dimensions.
Operation and control options.e.g. variable speed drives on pumps, motor
controlled valves, sensors for quality checking.
Plans for response in case of upsets.e.g. response plans for heavy storms handling
and alternative supply plans in case of water pollution.
Quality of system components;e.g. Selecting high quality products and carrying
out good systematic maintenance.
In many utilities, capital and operational expenditures (CAPEX and OPEX) are administered by two different departments, both trying to optimise their cost. However there is a special obligation for the CAPEX organisation to ensure that overall cost is addressed rather than pure CAPEX optimisation.
Downloaded from http://iwaponline.com/ebooks/book-pdf/651186/wio9781780407586.pdfby gueston 14 January 2022

45approach
Mapping the objective hierarchy
Wherever possible, always establish a clear “line of sight” from every activity to the overall objectives of the urban water cycle. For example, the reduction of water losses from water mains is done for several reasons,: to save energy for pumping and treatment, to ensure the integrity of the pipes to avoid dirty water getting in, to save the original water resource, etc. Always make sure it is well understood why things are done.
For many – if not all – of the defined objectives it is possible to:
1. Monitor the performance according to the objective, which is the prerequisite for detecting either trouble or opportunities for improvements;
2. React intelligently to any sign of non-compliance or inefficiency.
Figure 2.2: Hierarchy of objectives.
Sewer District A
drain area aminimise cso
Sewer District B
drain area bminimise cso
Pumping Station A1moVe water
forward or to storage basin
Storage Basin A1
Hold back rain water witHout oVerflowing
Settlerretain sludge
in tHe bioreactor system
Aerobic Zone
oxidise matter and nutrients
by aeration
Compressorkeep pressure at most effectiVe and efficient
pressure setpoint
URBAN WATER CYCLE OBJECTIVES
policy and serVice leVel
PLANT AND NETWORKS OBJECTIVESreQuirements
PROCESS AND DISTRICTS OBJECTIVES
tecHnical purpose
PROCESS OBJECTIVES
operational goals
COMPONENT OBJECTIVES
product operation and maintenance
SystemeffectiVe, efficient and
robust operation
SeweraVoid flooding
of Houses
WWTPremoVe organic matter,
suspended soils, nutrients, micropollutants
BioreactorremoVe organic
matter and nutrients
Downloaded from http://iwaponline.com/ebooks/book-pdf/651186/wio9781780407586.pdfby gueston 14 January 2022

46 Smart Water UtilitieS: Complexity made simple
tracking progress towarDs becoMing a sMart water utility
There is probably no end-station as to how intelligent or smart a water utility may become – at least in principle this is also the case with human beings. Neither are there some minimum requirements that need to be met in order to call a utility a Smart Water utility. Therefore we propose a method to monitor progress in this regime in the following pages.
We have tried to come up with an indicator system that can be used for monitoring this progress. The system is based on our joint common sense rather than testing and we hope that over time better indicators will be developed for monitoring “smart-water-utility”-progress. Basically, we believe it is necessary to monitor the three components of the MAD system individually.
There is probably no end-station as to how
intelligent or smart a water utility may become
The developmental stage of measuring (M) should answer not only the question of how many sensors you have installed, but rather: do you have the important ones and do you have them in the right places? The M-indicator will be the first indicator to increase, as it is a pre-requisite for the following parameters (A and D). As the M-indicator crosses a critical point, the sensors can actually be used to extract real reliable information from the system. We don’t imagine that this indicator will ever reach its max as this would probably not be economically feasible; alternatively as the indicator approaches its limit, more processes requiring monitoring will be identified.
M-A-D: a neW mind-set fOr smart Water utilitiesThis book is based on a structure denoted
by MAD (measure, analyse, decide).
This corresponds to the natural decision
process. Everybody uses it every day. You
see something, you think about it and you
decide what to do about it. By systematically
implementing the same way of thinking in
water utilities, they become smart.
Downloaded from http://iwaponline.com/ebooks/book-pdf/651186/wio9781780407586.pdfby gueston 14 January 2022

47approach
MeasureThe measurement part is a lot about having sensors applied throughout the whole water utility. When online sensors are not viable, laboratory data or human observations should be applied. When determining how to develop the sensor network: think about how these data can be used to support decisions at all levels, as well as in emergency situations. The obvious case for sensors is the short-term decisions of process automation. But also long-term decisions need to be planned, e.g. decisions about new plants or pipes are often taken based on predictions of future requirements, which are based on past performance. Make sure that for such decisions you do have sufficient historical data to understand the trend. For the automatic decisions, make sure that the signal you are using for control is truly representative for the process you are aiming to control. Be critical and make sure you understand the sensor options you have before you decide. this is detailed in chapter 3.
AnalyseData from measurements need to be processed actively to create value. As long as the data are just stored in databases they are not necessarily creating value. Analysis is a prerequisite for reaping the benefits of sensors. This is – perhaps surprisingly – the weak link at many water utilities. Installing the sensor equipment is fairly standard, but taking the data and transforming them into a basis for decisions in each specific case is a lot more challenging. The challenge is about getting easy access to the data, about crunching the numbers and even defining how the numbers should be crunched in order to provide valid and useful answers. Even defining the questions that need to be answered to make good decisions is far from trivial. This book contains a chapter dedicated to showing various analysis methods and how they can be applied in water utility systems. These methods should be used creatively to arrive at solutions that achieve the goals. Traditionally, in water utilities, the goals have been achieved by building large structures. Smart Water Utilities reach solutions at less cost but with more intelligence. Be David rather than Goliath. this is detailed in chapter 4.
DecideThe last letter in the acronym is about decisions. This should always be kept in mind, the reason for the sensors and analysis is to reach good and robust decisions that keep generating value for a long time. Surely, many interesting things can be discovered in the data by various analyses. But to make these findings yield value, a decision needs to be made about the result. Often the problem is that too little time and energy is spent on a decision before it is made. It is as if there is a reluctance to spend too much time on taking the right decision, while lots of time and energy can be spent on building, digging, installing and commissioning – and not least on trouble shooting and inventing fixes for wrong decisions. Obviously, we cannot spend forever deliberating various options. However, considering the cost in the initial deliberation phase against the building and operations phase – it will often be the case that a tripling of the deliberation process can provide a 1–5% saving in the building and operation phase – it is a very good business case to spend the extra time in deliberation. this is detailed in chapter 5.
Downloaded from http://iwaponline.com/ebooks/book-pdf/651186/wio9781780407586.pdfby gueston 14 January 2022

48 Smart Water UtilitieS: Complexity made simple
The developmental stage of analysis (A) does not take off automatically – unfortunately. It really takes dedication to transform the sensor data into something useful. Surprisingly, many utilities install sensors but hardly ever consult the sensors again after installation. A routine for consulting sensor signals needs to be in place for things to happen. The lack of regular consulting the sensors also means that the sensors are unreliable, because they have not been verified. Consequently, the operators will not appreciate any value of the sensors. To really derive value from sensor data requires special competences at the utilities. These competences need to be either developed from internal staff or hired into the utility for a new type of position. The job is to interpret data using all kinds of analytical methods and process understanding.
Increasingly, system software is becoming available that can help personnel with medium level educational backgrounds carry out this job.
The developmental stage of decisions (D) based on the Smart technologies is also something that does not happen automatically, though the step is not as high as for the A-indicator. For the D-indicator to take off, the A-indicator needs to reach a critical threshold, and from there on it is more a question of planning and organising around the information streams. As in other industries, the information streams are increasingly becoming the central managing tool at all levels in the utility.
As shown in Figure 2.3, the development of the three parameters is predicted to increase as parallel s-curves over years or even decades. Our expectation is that as all three indicators increase, more information will be requested at an increasing speed, until at some point the main issues have been dealt with, after which the intelligence will increase at a slower pace.
Figure 2.3: The progress of Smart technologies are expected to start with measurement (M), continue with analysis (A) and finally reach the decision layer (D).
years
poin
ts
M A D
10
5
Downloaded from http://iwaponline.com/ebooks/book-pdf/651186/wio9781780407586.pdfby gueston 14 January 2022

49approach
the M-inDicator
evaluating the state of the sensor landscape
A major challenge in managing water utilities is the opaqueness of the system – there are so many processes that are neither well understood nor monitored in regard to quality or quantity. The purpose of the increased number of sensors is to increase the transparency of the system
The sensor landscape is a vital part of the full data basis available at a water utility when it comes to evaluating the current level of transparency. Though not the only source of data, the set of installed and functional sensors working in a water utility makes up a platform of online and time-variant data input that cannot be collected in any other way and that sets the limits to how intelligently it is possible to react to and manage the full system.
A major challenge in managing water utilities
is the opaqueness of the system – there are so many
processes that are neither well understood nor monitored in regard to quality or quantity.
The sensor landscape is most meaningfully evaluated in the context of the objectives hierarchy of the water utility (Figure 2.2).
Start by establishing a list of sensors (and frequently measured laboratory analyses), as well as the full objectives hierarchy. See example in Table 2.1. Compare the two lists taking one objective at a time, asking:
Sensor PositionAmmonia Line 1, tank 6
Nitrate Line 1, tank 2
Dissolved oxygen Line 1, tank 3
Dissolved oxygen Line 1, tank 4
Dissolved oxygen Line 1, tank 6
Flow Inlet, line 1
Flow Return sludge, line 1
Flow Inlet, line 2
Flow Return sludge, line 2
Flow Inlet, line 3
Flow Return sludge, line 3
… …
Table 2.1: List of sensors and position (sample).
Example of a sensor list the list can in many cases be retrieved from the scada system. remember to state at least parameter and location. sometimes it is important to be very specific about the location, depending on the original purpose of the sensor. for example, locating the nitrate sensor at the beginning or the end of a tank may yield quite different results. the same goes for measuring at the top, middle or bottom of the tank.
Downloaded from http://iwaponline.com/ebooks/book-pdf/651186/wio9781780407586.pdfby gueston 14 January 2022

50 sMart water utilities: Complexity made simple
66 Which sensors (and other data) show to what extent this objective is met?
66 In which (geographic) areas do we not have measurements informing us about the state of this objective?
66 In which processes are we blind to the state of this objective (think also of parallel and identical processes, they are often not as identical as you may think)?
66 Which parameters related to this objective are not monitored?
66 Based on the above analysis, how well is the state of this objective understood and monitored – on a scale from 0–10 points?
A measure of transparency can be achieved by assigning “importance weights” to each underlying objective on a scale of 0–100%.The importance weights assigned should give a sum of 100%. Based on these data it is possible to get an overall transparency index as shown in the example. For illustration of the principle see Figure 2.4.
Figure 2.4: Assigning points to calculate the M-indicator.
M – Indicator=
50% * 10 + 20% * 10 + 10% * 5 + 10% * 5 + 10% * 5
=8.5 points of 10 possible
Constant flowimportance: 50%
monitored: 10 points
Sufficient oxygenimportance: 20%
monitored: 10 points
Nitrate in full zone
importance: 10%
monitored: 5 points
Criterion 4importance: 10%
monitored: 5 points
Criterion 5importance: 10%
monitored: 5 points
Example of calculating the transparency indexthis can be applied at any level and it is possible to get an overall urban water cycle transparency index.
Downloaded from http://iwaponline.com/ebooks/book-pdf/651186/wio9781780407586.pdfby gueston 14 January 2022

51approach
the A-inDicator
evaluating the state of the analysis capabilities of the organisation
A large number of sensors will lead to a high transparency index. However the data needs to be transformed into actionable information in order to create value. The intelligence index is a self-evaluation scheme (Figure 2.5) that describes the abilities and practice of analysing data:
0: No attentionThe sensor data is hardly ever looked at by either operational staff or management staff. The utility might not even be able to identify a person who understands the meaning of all the data.
1. Rudimentary attentionThe sensors are looked at, unsystematically, but there is only limited understanding.
2. Narrow attentionThe importance of a handful of sensor signals is understood and these signals are followed carefully. This might for example be focus on production rate (flow) in drinking water utilities or dissolved oxygen in wastewater treatment plants.
3. Daily attentionThe SCADA system is checked daily with a shifting focus on more process parts – usually the process parts that are creating trouble at the time, e.g. too high sludge content in the tanks, increased turbidity in the clean drinking water.
4. Time variance orientationTime series are checked as part of the daily operation. Various time series are called forth on the SCADA system and there is a proficient understanding that various phenomena are to be observed in different timescales, i.e. hours, days, weeks, months.
5. Multi parameter orientationWhile looking at various time series it is understood that more parameters play together at once and hence must be viewed together in time-series charts – leading to a correct identification of causality in the plant.
6. Simple analytical toolsAnalytical tools are applied on the data. Most SCADA systems do not make analytical tools available; this means that data in many cases need to be transferred to Excel, for example, for making x-y plots of the data.
Figure 2.5: Scoring of the A-indicator.
10. Plant wide online models
9. Online modles
8. Process models
7. Advanced analytical tools
6. Simple analytical tools
5. Multi parameter orientation
4. Time variance orientation
3. Daily Attention
2. Narrow attention
1. Rudimentary attention
0. No attention
Downloaded from http://iwaponline.com/ebooks/book-pdf/651186/wio9781780407586.pdfby gueston 14 January 2022

52 Smart Water UtilitieS: Complexity made simple
7. Advanced analytical tools More advanced mathematical techniques are applied such as filtering data, statistical analysis, and time-series analysis.
8. Process modelsProcess models such as activated sludge models, settler models, filter models, real-time statistical process control charts are applied to understand and simulate process performance.
9. Online modelsThe models are running online and are automatically calibrated to describe the variance of the system in such a way that the model captures the main phenomena occurring in the plant. The best operational strategy and abnormal process behaviour are identified.
10. Plant wide online modelsOnline models are running throughout the whole urban water cycle ensuring a plant wide perspective and optimisation capability.
The intelligence index is a self-evaluation scheme that
describes the abilities and practice of analysing data.
the D-inDicator:
evaluating the state of the decision capabilities
Measuring the decision capabilities of a full system is a daunting task and different organisations find different solutions to manage the system. This obviously also relates to personnel management style and in the end the performance of the full systems speaks for itself in terms of good or poor performance.
However many of the decisions made in water utilities reach quite far out into the future – especially design decisions. Therefore poor utility performance may be due to old poor decisions, and current good performance may cover up future poor performance due to current poor decisions. Therefore it makes sense to set a “golden” standard.
This self-evaluation scheme, Table 2, can be used to give an indication of current decision performance. In the example shown below the marks show the performance of a given water utility. The total score of this utility comes from adding the points in each of the five categories, i.e. 1+1+0+1+2 = 5 points. The maximum number of points is 10.
Downloaded from http://iwaponline.com/ebooks/book-pdf/651186/wio9781780407586.pdfby gueston 14 January 2022

53approach
Table 2.2: Scoring of the D-indicator.
DECISION LEVEL
STRATEGIC
STRATEGY
OPERATIONAL
AUTOMATIC
UNPLANNED
0 POINTS BASIC
No top level goals and priorities are defi ned in writing. Goals and priorities change from day to day. This type of management often leads to a demoralised and confused staff.
Improvements are done haphazardly; often improvement projects are ill-defi ned and not successfully run to the end.
Processes are not monitored carefully and often run off course. This leads to a constant state of ”fi refi ghting” trying to get things back on track.
No processes are handled by controllers based on sensor input.
No strategies for unplanned events and no means to detect unplanned events before they become a problem.
1 POINT INTERMEDIATE
The objectives, values and priorities are well communicated by management and well understood by the staff.
A number of improvement projects are defi ned to improve the performance of the full water utility cycle.
Skilled operational managers and operators ensure a more or less safe operation of the system with occasional hiccups that are usually rapidly ”solved”.
Lots of real-time controllers are implemented, but they may not be maintained correctly because control-competent staff are not in place. This means that many controllers are not correctly tuned.
Plans are in place to handle critical unplanned events such as for example a drinking water pollution incident.
2 POINTS ADVANCED
The objectives are clearly stated in writing and visible to all. Everybody knows where to fi nd the decisions and there is (probably) a good quality management system in place as well.
A number of improvement projects are defi ned to improve the performance of the full water utility cycle. These are clearly communicated, well run and with clear management backing
There is a clear system of following up on all operational objectives. Any deviation is handled fast and diligently. The processes rarely run into critical states. There is a clear understanding of process robustness
As many automatic controllers as possible are applied and these are carefully crafted with advanced control methodologies. There are staff available with computational skills that are capable of maintaining and troubleshooting ”broken” controllers.
Plans for the most critical unplanned events are in place as well as a measuring system to ensure a warning about an upcoming critical event as early as possible.
Downloaded from http://iwaponline.com/ebooks/book-pdf/651186/wio9781780407586.pdfby gueston 14 January 2022

54 Smart Water UtilitieS: Complexity made simple
the iDea of control
In our daily life we have plenty of experience of measuring, analysing and deciding. Consider the morning shower. You wish to keep not only the water flow but also the water temperature at a comfortable level. Assume that there is no thermostat installed. If the water is too cold we often react in panic and increase the warm water too much. Then we may react too much to turn down the warm water. How much to change the water flow for a given mismatch of temperature is defined as the gain of the control. The gain is a key concept in all control systems.
As a car driver we practice control all the time. The eyes, ears and many muscles of the body sense where we are. All this information is analysed in our mind (very quickly!) to make a decision, to increase the speed, to brake, to turn or any combination of these actions. The decision in the brain is then translated into actions via our muscles, turning the steering wheel and other actions which will make a correction so that we satisfy the goal: keeping the car on the road, etc. The whole cycle is repeated with frequent intervals. Notice that a good driver will make smooth changes. This means that the gain is just right. A beginner may change the steering wheel too much or too quickly or brake too suddenly. This is a sign of too much gain from the information to the action.
By using smart measurements, data analysis, decision and
control actions, it is possible to save electrical energy, to
extract inherent energy or to recover critical ressources.
implementatiOnRegardless of how the utility is structured
on the centralised–decentralised axis, it
can benefit from Smart Water technologies.
However these technologies may work better
as the physical structure is designed to
accommodate them. Even more profound is
that the emergence of these new technologies
may also lead to shifts towards more efficient
organisation and management of the work. .
Downloaded from http://iwaponline.com/ebooks/book-pdf/651186/wio9781780407586.pdfby gueston 14 January 2022

55approach
A water and wastewater system can be considered as a combination of numerous small systems. Some simple examples:
66 The pressure in the distribution system is nowadays maintained via variable speed pumps. If the pressure is too low, then the pump speed has to increase and vice versa. In more detail: how much can the pressure deviate from the desired one before we take any action?
66 How quickly and how much do we have to change the pump speed in order to compensate for the pressure deviation?
66 Pumping water into a wastewater treatment plant is often based on measuring the level of a wet well. If the water level is too high, then the pump speed must increase. The opposite action will take place if the level is too low;
66 The dissolved oxygen (DO) concentration in an activated sludge plant can be measured on-line. If the DO level is higher than required, then the air flow rate should be decreased. The measurements are usually noisy due to turbulence in the tank and due to sensor noise. Therefore we have to decide which is the correct measurement value. If the DO level is too high or too low we have to determine how much to change the air flow for a given concentration error.
A water distribution system or a wastewater treatment plant consists of a number of components or unit processes, each one of which has to act according to a given goal or purpose. Having a control action on each one of the small systems is not sufficient to make the combined plant work most efficiently. The plant is a system of systems. All the parts of the plant need to be coordinated.
Think about our body, how all the movements have to be coordinated. Imagine a robot arm that should mimic a human arm movement. Each
one of the joints has a little servo motor that determines how much to change the angle of the wrist, elbow, axis, etc. Lifting the arm means that all the joints have to be coordinated in such a way that the hand is moved along a given path.
In a similar way, a water supply system has to be adjusted according to the customer demand. This means that all the parts – raw water pumping, water treatment, water distribution – have to be coordinated in such a way that water is available. Similarly, the influent flow to a wastewater treatment plant is often highly variable and these variations have to be accepted by the wastewater treatment. The sewer pumping, the influent water pumping, the biological reactions and the settler operations are coupled sequentially and depend on each other. What makes the system even more complex is all the recirculation streams between the various processes: return sludge is recirculated from a secondary settler to the biological reactor, nitrified water is recirculated from the aeration tank to the anoxic reactor, nitrogen rich supernatant water from the sludge treatment is recirculated to the influent of the biological reactors, to mention a few.
To coordinate all the unit processes is called plant wide control. If we consider the couplings between the sewer, the wastewater treatment plant and the receiving water, we can also talk about system wide control.
So, why do we need to make the operation more complex by considering plant wide or system wide? Complexity is not a goal in itself. The goal is to make the water delivery and treatment more efficient, recover valuable resources, save operating costs and protect the environment. By using smart measurements, data analysis, decision and control actions, it is possible to save electrical energy, to extract inherent energy in the water or wastewater (heat energy or organic energy), or to recover critical resources such as phosphorus. Furthermore, the system can be made more resilient to disturbances. This has to work around the clock, with or without human intervention.
Downloaded from http://iwaponline.com/ebooks/book-pdf/651186/wio9781780407586.pdfby gueston 14 January 2022

56 sMart water utilities: Complexity made simple
The idea of smart water systems is applicable at any scale, in large or small systems. Decentralised systems are being developed at an increasing rate. It is also becoming more and more important that small systems can work without human intervention during normal operations. The computer does not take coffee-breaks and is expected to work consistently around the clock. However, if serious disturbances happen, then a skilled operator should be warned automatically. Communication systems of today make geographical distances disappear.
Timescales are widely distributed in water systems. Some actions, like pumping and pressure changes take place in seconds. The dissolved oxygen concentration can drop in minutes and it takes some 10–20 minutes to compensate the DO concentration with the compressor. Concentrations in the system usually change on an hourly timescale, while microorganism growth takes days and weeks. Then there are seasonal variations in the system. Consequently, measurements and control actions have to take place in all these vastly different timescales.
Some control actions are particularly important for the operating costs, such as chemical dosage control, air flow control, and distribution pressure control.
types anD scope of Decisions in water utilities
The “Smart Water utilities” method enables utilities to take better decisions – or to put it another way, enables better decision making or even creation. Decisions are made based on relevant analysis of available data fused with creative thinking about the decision to be taken. The image of the decisive leader who takes fast and bold decisions is not what we are looking for. Instead we are trying to establish a framework for decision making whereby the decisions that are taken throughout the organisation are in line with the organisation’s overall goals.
The decisions that need to be taken can reasonably be divided into four levels plus an ancillary mode of decisions related to unforeseen issues:
strategic decisions
Strategic decisions determine the purpose, the vision and the overall goals of the utility, which values should govern the decision making, how to further develop the organisation and how to organise the utility to achieve the goals. It would be a strategic decision to decide to become a Smart Water utility as suggested in this book. The Smart Water utility framework includes several strategic decisions that set the general direction of the water utility.
Downloaded from http://iwaponline.com/ebooks/book-pdf/651186/wio9781780407586.pdfby gueston 14 January 2022

57approach
tactical decisions
Tactical decisions translate the strategic intent into actual project definitions. The projects should be designed to move the utility towards the goals described and envisioned in the strategy. It is also at this level that changes at the plants and the distribution/collection networks are decided, such as, e.g. the implementation of separate sewer systems. The execution of projects and their effects are often long term and may span several years or decades.
operational decisions
Operational decisions are primarily related to changing the process states to fullfil the day-to-day and month-to-month operational goals of, e.g. discharge limit compliance. Even if this sounds stationary in nature, operations are continually disturbed by factors such as temperature changes, rain events, algae blooming, equipment failures, operationalization of new systems, etc. Making the full water utility run 24 hours a day and seven days a week is a demanding job requiring decisions made every hour and day.
automatic decisions
A large fraction of the decisions in water utilities are carried out automatically, resembling the functioning of various internal organs in the human body. They are running automatically and unconsciously. If an automatic procedure is causing problems, an alarm should go off. This may be likened to pain in the body. Control and automation theory provides a large base of theories and knowledge applicable in this field.
unplanned decisions
Generally, it is possible and advisable to define a clear structure for the decision processes mentioned above. The situation is different when it comes to unplanned events. Such events require clever and often fast decisions and the employees that would normally take decisions pertaining to the problem are not guaranteed to be present. This includes events such as pollution of drinking water or heavy storm water events. Emergency plans for recurring and high risk events can and should be established beforehand.
Downloaded from http://iwaponline.com/ebooks/book-pdf/651186/wio9781780407586.pdfby gueston 14 January 2022

58 sMart water utilities: Complexity made simple
builDing strong Decision capability in organisations
Even if sensors are not new to water utilities, it is important to recognise that transforming a water utility to a “Smart Water Utility” is a fundamental cultural change of the organisation. There needs to be a fundamental change of mind-set, in which sensor data or information derived from sensor data are freely available and accessible to everybody in a number of different forms, depending upon purpose. Plus it has to be a natural part of the working day of everybody to make use of data – relevant for this individual or part of the system - to transform them into information for decision making.
Interestingly this also requires a very clear perception of the goals of the organisation – what are we precisely trying to achieve. The lack of precision will impair efficiency, effectiveness, robustness and cost tremendously.
Even if sensors are not new to water utilities, it is important to recognise that transforming a water utility to a “Smart Water Utility” is a fundamental cultural change of the organisation.
values
Guessing and assuming is such an ingrained value in most water utilities that it might be difficult to even recognise. But think of oxygen control. Earlier it was done without oxygen measurements and people were happy. Thinking on where we are today on the understanding of this issue, it is clear that guessing and assuming was earlier “the standard way”. But in how many aspects is this still the case today? We need to cultivate a much more fact-based decision-making process.
Downloaded from http://iwaponline.com/ebooks/book-pdf/651186/wio9781780407586.pdfby gueston 14 January 2022

59approach
Managerʼs role
The manager’s role in creating a more fact-based decision culture is clear. Managers need to communicate these expectations clearly and to set examples again and again. The manager needs to be clear about expectations by asking questions that illuminate the lack of reliable information. The manager needs to provide a clear strategy (and funding) for improving the sensor base as well as developing the required intelligence. But most importantly: he/she needs to communicate, communicate, communicate…
Decision capabilities
Decisions are not only taken at the manager’s desk. Every employee is taking and carrying out decisions throughout the workday. Acknowledging that making good decisions is actually a competence in itself may help facilitate decisions relating to process problems. Understanding the potential collateral effects of poor decision making and the risk of not deciding in a timely manner. Everybody needs to understand their role and scope as decision-maker and how their decisions influence everything in the full utility.
Decision process design
There is no “best decision process”, but some processes are obviously better than others. Making the goals of the utility crystal clear is the foundation of good decision making capabilities throughout the organisation. Making the decision tools available is key to unlocking the effectiveness, efficiency and risk reduction potential of the utility. Finding a good balance between listening to the relevant people’s expert opinion and getting things done effectively and with determination is the key.
line of sight
Line of sight and transparency in decision making goes hand in hand. Understanding the reasoning behind decisions is crucial – especially for everybody involved in carrying out the activities followed by that decision. Any unclarity and lack of “line of sight” to the overall directional goals of the utility substantially increases the risk of poor implementation and hence poor decision performance. Clear line of sight fosters commitment, trust and not least the opportunity of seeing better and more innovative solutions.
Downloaded from http://iwaponline.com/ebooks/book-pdf/651186/wio9781780407586.pdfby gueston 14 January 2022

The important thing about measuring is
To give you feedback
Hence you should measure all that is important
And hence you should measure pervasively
You should measure fl ows and quality
Then you will always know that all is well
And if not you can help out fast
But the important thing about measuring is
To give you feedback
Downloaded from http://iwaponline.com/ebooks/book-pdf/651186/wio9781780407586.pdfby gueston 14 January 2022

Measure3
Downloaded from http://iwaponline.com/ebooks/book-pdf/651186/wio9781780407586.pdfby gueston 14 January 2022

62 Smart Water UtilitieS: Complexity made simple
No process operation can perform better than the quality of the measurement data. To measure is to know. Today there are more sensors available than ever before, so the real challenge from a utility point of view is to recognise where different sensors and instruments are needed and how this information could be used for the best possible operation.
For every single sensor, it is crucial to define why it is used. Any operator or maintenance person has to be motivated, not only to use the sensor information, but also to make sure that the sensor or instrument is properly maintained and calibrated. Many instrumentation systems have failed simply because nobody explained the value of the measurements. Some instrumentation is used for monitoring or early warning; some is used as part of an automatic control loop. Whatever the purpose, the reason for the measurement has to be communicated, both to the maintenance personnel and to the operators, so that the measurements can be trusted.
Instrumentation – including sensors, analysers and other measuring instruments – is no longer the bottleneck for the control of wastewater systems. However, it has to be kept in mind that the measurements have to be quality checked all the time. There is still no general standard for how to check on-line sensors, and it is important to realise that a control loop depends on every single value from the sensors.
On-line measurements can never be used for control without an adequate data quality check. Therefore, all sensors have to be combined with adequate data screening, measurement processing and more or less sophisticated feature extraction from the measurements.
Irrespective of the availability of the sensors, the the effluent water quality has to be sufficiently good.
A fundamental issue is the frequency of the measurements. One way to express the need for the frequency interval is that it should be possible to reconstruct the true signal variations from the (time discrete) measurements acquired by the computer. As a result, we will have measurements in highly different time scales in a utility.
Many instrumentation systems have failed simply
because nobody explained the value of the measurements.
For example, flow rates of influent water should be measured so often that it is possible to see the variations that will influence the process. The dissolved oxygen concentration will change on a minute-to-minute time scale. Consequently, it should be measured at least a couple of times every minute. The suspended solids concentration in an activated sludge reactor does not change more often than hourly, so it may be sufficient to measure it every 10–20 minutes. Sometimes the value may seem to vary very slowly, for example, the temperature of influent wastewater. However, it varies not only with the seasons. A cold rain may drop the influent water temperature very quickly, and this will immediately influence the activity of the microorganisms in the biological reactor.
Some sensors or automatic analysers may not produce the measurement result immediately. Therefore it is crucial to consider the time delay from the sensor in relation to the variations of the true signal. If the sensor is fast in relation to the true signal variations we have no problem, but the opposite situation has to be considered very carefully.
Many ways of sensing water
Downloaded from http://iwaponline.com/ebooks/book-pdf/651186/wio9781780407586.pdfby gueston 14 January 2022

63measure
We consider different kinds of measurement information:
66 Online sensors (smart sensors). Today we have opportunities like never before;
66 Laboratory analysis;
66 Human observations.
The measurement information forms the basis for monitoring (to keep track of the state of the process) and for any decision, automatic or human. Feedback can be based on any type of sensor or observation. Naturally automatic control has to be based on automatic measurements, directly coupled to analysis and decisions in a real-time computing environment.
The Supervisory Control And Data Acquisition (SCADA) system is, in a sense, the back-bone of Smart technologies – or the neural system that enables Smart to happen. To understand what a SCADA system is and how it works, it is necessary to venture into the field of electrical engineering. SCADA means
Supervisory Control and Data Acquisition. The most productive way of understanding this is to see the whole electronic intelligence part of a process as the SCADA. Today SCADA systems are quite complex systems with lots of functionalitiesand it may be difficult to understand each and every little detail about how they work. Luckily, it is not necessary to understand every detail, but it is very helpful to have an understanding of the main components making up the system and understanding how they work on a general level.
Looking at a sensor a colleague once said: “Well as it is, it is just a dumb stick!” In order to advance the sensor from a dumb stick to something that can provide insight, it needs to be connected to a computer, so that the computer can collect data from the sensor, which can afterwards be accessed and processed. The most obvious thing to do with the data is to draw a graph on how the data has developed over time, i.e. see a time series. Such a system would probably be one of the simplest SCADA systems imaginable. However, modern SCADA systems can do a lot more than this.
Downloaded from http://iwaponline.com/ebooks/book-pdf/651186/wio9781780407586.pdfby gueston 14 January 2022

64 Smart Water UtilitieS: Complexity made simple
Hydraulic sensors
Describing the hydraulics of a system actually comes down to understanding just two parameters: the flow and the pressure.
Historically, measuring the flow in a stream was quite complex because the velocity of the water was not constant across the cross-section.So measuring the velocity at the surface and multiplying this by the area of the cross-section is not representative for the flow. Discovering the venturi effect was a great step ahead. The venturi effect means constricting the area of the flow, and the resulting pressure can be used to measure the flow across the section.
Today the measurement of flow and pressure are the most commonly encountered sensor measurements. But even these simple measurements can provide lots of information about the system. These variables are the primary parameters of interest in wastewater collection systems and water distribution systems. But they also play an important role in process control in the water treatment parts of the utilities. Not least is the importance of flow when calculating the individual cost of water by water meters, which are in fact small flow meters.
SenSorS: the BaSiS of “Smart” There is a multitude of sensors applicable for
water utilities. It is necessary to have a good
overview of the sensors, their application
and measurement principles. Here the most
important sensors are presented and described
in short.
Downloaded from http://iwaponline.com/ebooks/book-pdf/651186/wio9781780407586.pdfby gueston 14 January 2022

65Measure
1. Flow
Flow is a central parameter to any application in the water utility cycle. Together with water level measurements it keeps track of the hydraulics, i.e. where is the water/liquid and how is it moving?
Flow measurements come in a wide range of sizes from large inlet flow measurements of thousands of metres squared per hour to small chemical dosage measurements of millilitres per minute. Even water meters are flow meters.
Flow can be measured in open channels as well as in pipes (full-running or not) with different measurement principles, such as mechanical methods, pressure based, such as venturi meters, electromagnetic flow sensing, optical flow sensing, vortex measurements, ultrasonic and laser-doppler measurements.
In water utilities the most frequently applied flow sensor method is magnetic flow sensing in closed full-running pipes. Two coils on each side of the flow meter generate an electromagnetic field. This field makes positively and negatively charged particles separate and hence generate a current perpendicular to the magnetic field. The generated current is proportional to the flow. Hence measurement of the current is used to get a measurement of the flow.
Flows in pipes that are not filled are generally measured by principles other than electromagnetic.
2. Water level and pressure
Water level and pressure are in many cases interchangeable. Hence pressure may also be measured in units such as metres of water column. This means the pressure that a water column of a given height puts on the area it “stands on”. The SI unit for pressure is the pascal (Pa), defined as newton per metres squared. However, this is rarely used. The two most commonly used units in daily life at the water utility are bar or psi, depending on the country.
The psi is easily understood as the force generated by one pound standing on one square inch, whilea bar is equivalent to 100.000 Pa or 100 kPa.
In some cases differential pressure is relevant. For example in the operation of filters and membranes. As they increasingly clog, the differential pressure across the filters increases. This means more and more pressure is required to push the water through the filter or membrane. At some critical level the filters or membranes have to be cleansed.
A piezoresistive strain gauge is the most frequent device for online pressure sensing. Here pressure is applied to a metallic film. As pressure increases, the atoms in the film are moved further from each other, resulting in a change in electrical conductivity of the metal film.
Downloaded from http://iwaponline.com/ebooks/book-pdf/651186/wio9781780407586.pdfby gueston 14 January 2022

66 sMart water utilities: Complexity made simple
1. Turbidity
Small particles in water are slow to settle; some may take years in still water. Instead of waiting for all the solids to settle, turbidity can be measured. Turbidity measures the cloudiness of the sample including particles that cannot be seen by the naked eye.
Turbidity can be measured by several methods; the most widely used is measuring the light scattering in the sample. To do this, a light beam penetrates the sample and a light detector on the side of the light beam measures the light that scatters due to the particles. The unit of turbidity is called the Nephelometric Turbidity Unit, i.e. NTU.
Acceptable NTU levels of clean drinking water are around 0.3, though some may have higher or lower limits. At these levels the haziness can generally not be seen by the naked eye. The haziness becomes visible around 5–50 NTU, though it depends on the size distribution of the particles.
Though turbidity cannot be used directly as a measure of suspended solids it is often used as an indicator and there is a strong positive correlation between the two.
Turbidity is used to monitor incoming water quality, efficiency of filtration and coagulation processes, outgoing water quality (to consumers) and as a monitoring parameter in the drinking water network.
Turbidity is important when it comes to disinfection as particles often have a wealth of bacteria on their surface. Therefore highly turbid water is generally more difficult to disinfect and higher disinfection dosages are required. In UV applications the turbidity absorbs part of the UV light and hence longer exposure time is required or higher intensity.
Key drinKing water Quality sensors
The main sensors for drinking water are presented here. For various reasons water quality
sensors for drinking water are used far less than in wastewater. This is predicted to change in the near future. The key drivers for this trend is health considerations, water shortage and an increase in recycled water.
Downloaded from http://iwaponline.com/ebooks/book-pdf/651186/wio9781780407586.pdfby gueston 14 January 2022

67Measure
2. Free chlorine
Chlorine disinfection is still the number one method of disinfection worldwide. The chlorination can take place usingsodium hypochlorite, chlorine dioxide or chloramine. The chlorination has a direct effect in the process of disinfecting the water, and does also have a residual effect on the water after it has left the water treatment plant.
The process as well as the residual effect can be monitored by online sensors for free chlorine.
Online chlorine sensing can be carried out by sensors or by small automated lab equipment, typically wall-mounted. Until today, most such online equipment has been applied for process control in the water treatment plant. However with the emerging focus on the processes taking place in the water distribution network of water mains, such sensors will increasingly be installed in the network. Here they will enable monitoring that the residual chlorine is present to the end-point of the network and help avoid over-dosing or under-dosing.
Chlorine is measured by means of amperometric or colorimetric methods and now also solid state sensors are becoming available, which is expected to increase stability and reduce the requirements for recalibration and chemicals.
3. pH
pH describes the acid–base equilibrium and is a measure of the logarithm of the concentration (negated) of free hydrogen atoms. The pH of 7 denotes neutral water, while lower numbers indicate acidic water and higher numbers denote caustic water.
In most water the pH is controlled by the carbonate system. Hence increased carbon dioxide concentration leads to lower pH and vice versa.
Attention to pH in drinking water relates primarily to the corrosive power and the chlorination process. At low pH the water becomes strongly corrosive. Chlorination performs optimally in the pH range 5.5–7.5.
The pH generally does not have a strong effect on health; though high (>10) and low (<4) pH may cause skin and eye irritation effects. Generally, a pH close to neutral is recommended, i.e. 6.5–8.5.
The pH can be measured by a glass electrode. An ion selective electrode selective to hydrogen atoms is located at a reference solution (pH=7) and a solution that is in pH contact with the surrounding liquid through a glass membrane. The electrical potential difference formed between the two electrodes can be converted into a pH measurement. A newer method based on ISFET (ion-sensitive field effect transistor) is also available as an online sensor.
Though turbidity cannot be used directly as a measure of suspended solids it is often used as an indicator and there
is a strong positive correlation between the two.
Downloaded from http://iwaponline.com/ebooks/book-pdf/651186/wio9781780407586.pdfby gueston 14 January 2022

68 sMart water utilities: Complexity made simple
4. UV254/TOC
The content of organic matter in drinking water is relevant to both chlorinated and non-chlorinated drinking water.
The organic matter may serve as substrate for bacteria and in the chlorinated system it gives rise to the formation of carcinogenic disinfection by-products. Additionally it has effects on the coagulation efficiency and may add taste or odour to the resulting drinking water.
UV 254 measurements are also relevant in UV disinfection as they reveal if the UV light can efficiently penetrate the water being disinfected.
Determining total organic carbon (TOC) and dissolved organic carbon (DOC) requires laboratory work. However UV254 has been found to be a good approximation for the TOC content of the water. UV 254 measurements are implemented in sensors and hence offer a way of getting online real-time information about the carbon content of the water.
UV254 is simply a measure of the amount of light emitted at a wavelength of 254 nm that is absorbed by the water sample. Two different units are applied depending on whether the measurement is on the absorbance (A/m) or the transmittance (%/m).
5. ORP
ORP, or the oxidation/reduction potential, describes the liquids potential for oxidising or reducing.
Originally, oxidation meant the reaction in which oxygen is transferred. Fire is an example of fast oxidation, while rust is an example of slow oxidation. It has more recently come to mean the exchange of electrons in a reaction. A substance is oxidised if it loses electrons and reduced if it gains electrons.
ORP measures the potential for reduction or oxidation reactions. Chlorination works so well because it is a strong oxidiser and hence oxidises enzymes in microbes whereby the microbe either dies or is disabled from reproducing. Hence ORP can be used to control the chlorination process.
ORP is expressed in millivolts (mV) and is measured in largely the same way as pH, with a standard electrode and an electrode in contact with the medium being measured.
The latter is made from an inert material (e.g. gold or platinum) and hence will give up or take up electrons depending on the redox potential of the measured liquid. This gives rise to a potential difference that can be measured.
Knowing and understanding the key quality sensors in drinking water is central.
Downloaded from http://iwaponline.com/ebooks/book-pdf/651186/wio9781780407586.pdfby gueston 14 January 2022

69Measure
6. Conductivity
Conductivity is a measure of the ability of the water to transport an electronic charge. Hence it depends on the concentration of inorganic charged ions (both positive and negative) such as chloride, nitrate, sodium and calcium. Organic compounds have a very low ability to conduct current and hence only affect the conductivity of water to a minor extent. Temperature also has an effect; hence the standard is defined at 25 oC.
Conductivity is closely related to TDS (total dissolved solids) which is a highly relevant parameter in reverse osmosis as a high TDS implies that a higher pressure is required for reverse osmosis to take place.
Conductivity may also be used for detecting the intrusion of saline water or raw wastewater from outside water mains in water distribution systems.
Conductivity is measured quite simply as the resistivity of the water between two electrodes at a fixed distance. While the conductivity may be around 1–10 S/m (S= siemens) in seawater, the conductivity of drinking water is usually in the range of 10−4–10−2 S/m.
7. Temperature
“Cool water is generally more palatable than warm water, and temperature will impact on the acceptability of a number of other inorganic constituents and chemical contaminants that may affect taste. High water temperature enhances the growth of microorganisms and may increase taste, odour, colour and corrosion problems.” That is all WHO has to say about temperature in drinking water in its Guidelines for Drinking-water Quality (2006)
Though somewhat indirect, a temperature measurement can be useful when understanding retention time of the water and many customer complaints about water quality are related to water temperature.
Temperature sensors have been around for many years and are regarded as the simplest types of measurements available for water quality monitoring.
The most used sensor types for temperature are NTC and PTC thermistors. The electrical resistance of thermistors changes with temperature in a predictable way either with a positive correlation (PTC) or a negative correlation (NTC). A thermistor has a low cost. Many sensors for other purposes also include a temperature sensor and hence can feedback the temperature for almost free together with other signals.
Downloaded from http://iwaponline.com/ebooks/book-pdf/651186/wio9781780407586.pdfby gueston 14 January 2022

70 sMart water utilities: Complexity made simple
8. Colour
Biofilm on the walls of drinking water pipes are common in many systems and generally not dangerous. However especially in the case of change of flow patterns, e.g. reversal of flows, bursts or flushing of pipes the biofilm may be torn loose and lead to discolouring of the water.
Customer complaints about periodic discoloration may be difficult to troubleshoot without a colour sensor. However, combined with data on flow patterns it is much easier to find the cause of the discoloration.
Colour in water may also stem from substances present in the water source, as for example the harmless tannins.
Some types of industrial processes can depend heavily on the usage of water without colour, especially where the water is concentrated by the industrial process. In these cases, even small amounts of colour in the water can be significant.
Colour can be measured by sensors applying NIR/VIS absorption, which measures the absorbed light in the visible and near infrared areas of the colour scale.
9. Ozone
Ozone is a gas consisting of molecules of three oxygen atoms. Ozone is highly unstable and will transform into di-oxygen very fast. In this process, a free oxygen atom is split off. This atom is a highly reactive agent. Under normal conditions it will only live for a few milliseconds.
Due to its high reactivity, ozone is an extremely effective disinfection agent. It can also degrade molecules that are quite difficult to degrade due to its aggressiveness.
Hence ozonation of water has become popular in the last decades for its ability to reduce iron, manganese and sulfur and reduce or eliminate taste and odour problems.
Two different types of ozone sensors may be in use in water utilities:
Dissolved ozone sensors are used for sensing the ozone concentration in the water being treated. Ozone concentration can be measured online by means of electrochemical methods.
Secondly, ozone is measured in the air as a precaution to protect operators from inhaling ozone. Due to its high reactiveness, ozone may degrade tissues in the lungs, which may be lethal.
Downloaded from http://iwaponline.com/ebooks/book-pdf/651186/wio9781780407586.pdfby gueston 14 January 2022

71Measure
Key wastewater Quality sensors
The last 1-2 decades have provided the wastewater sector with unprecendented high quality and trustwrthy sensors. Though some
of the sensors still require close performance monitoring, the sector has experienced a great leap forward due to development efforts in the sensor companies. The next leap forward is the responsibility of future Smart Water Utilies, applying the sensors intelligently.
1. Dissolved oxygen
It is hard to imagine that it was once a difficult job to convince wastewater treatment plant operators to apply online dissolved oxygen sensors in their plants. Dissolved oxygen measures the amount of oxygen in the water, which is a pre-requisite for aerobic biological activity for the degradation of organic matter as well as nitrification.
The saturated (maximum dissolved) concentration of dissolved oxygen in water depends primarily on temperature and is in the range of 8–10 mg/l. Maintaining a DO setpoint around 1.5–3 mg/l in the aerobic tanks ensures aeration adjustment according to load. Today many plants have several DO sensors in the aerobic line as well as sensors in parallel lines to ensure proper aeration at all times.
DO is traditionally measured by the Clark principle, whereby a reaction chamber is isolated from the water by a membrane that allows oxygen molecules to penetrate. The generated current between a silver anode and a gold cathode in an electrolyte solution of potassium chloride gives a signal proportional to the oxygen concentration dissolved in the water.
New sensor developments allow for membrane free DO sensors. These sensors are based on luminescent principles and require no calibration for years of operation or any maintenance (besides cleaning).
2. Total suspended solids
Total suspended solids (also named TSS or SS) are measured in milligrams per litre and refer to the content of solids that are not fast settling out of the water. In a laboratory, this parameter is measured by filtering a water sample on a pre-weighed filter. After filtering, the filter is dried and weighed again with the suspended solids on top of it. The difference in the weight divided by the amount of water filtered is the measurement of the suspended solids.
This laboratory procedure is obviously not well suited for implementation in an online sensor. Instead, the same method as for turbidity is used, i.e. reflected light from the sample is measured. For suspended solids measurements, various reflection angles are measured and infrared light is used, i.e. light with longer wavelengths than visible light.
When selecting the actual sensor it is important to have a clear idea about the measurement range required for the sensor to be able to give data during all conditions. Air bubbles and temperature are known to interfere with the measurement; some sensors have different ways of compensating for this interference.
Downloaded from http://iwaponline.com/ebooks/book-pdf/651186/wio9781780407586.pdfby gueston 14 January 2022

72 sMart water utilities: Complexity made simple
3. Ammonia
Ammonia content is central to the understanding of the process of nitrification which is part of the overall nitrogen removal process. In nitrification, ammonia is transformed to nitrate while reacting with (and hence consuming) dissolved oxygen. Some people speak of ammonia (NH3) and others of ammonium (NH4+). pH determines the actual distribution between the two; the expressed value is the sum of the two. This makes good sense because in this context the interesting part is the nitrogen atom that the nitrification and denitrification process is removing by locking it in an N2 molecular structure, which will leave the water phase as gas. Often ammonia is expressed as mg/l NH4-N. This means that only the nitrogen content is calculated in the milligrams per litre unit. This is a convenient way of expressing the content because it means that 1 mg/l NH4-N is converted into 1 mg/l NO3-N by nitrification. This would not the case if the concentrations were expressed as NH4 and NO3 respectively because of the difference in molecular weight. In laboratories, ammonia is usually measured by means of colorimetric methods (FIA). However the sensor arena today is dominated by the ion sensitive electrode (ISE), converting the concentration into an electrical potential by means of specialised electrodes. The clear advantage of this method is that it does not require any small scale pumping, which has previously been prone to failure. The disadvantage is that no electrodes are completely selective, so the signal may be interfered with by other substances. In the case of ammonia, potassium may have an effect on the accuracy.
4. Nitrate
Nitrate is the other critical substance in the nitrogen removal process. Nitrate is formed during nitrification and removed during denitrification. Denitrification leadsto the gaseous N2 that leaves the water and hence essentially removes the nitrogen from the water. This removal makes the water less potent as a eutrophication agent (eutrophication is the addition of too much nutrients to the aquifers with detrimental effects on the aquatic quality).
Nitrate sensors are either based on ion selective electrodes (see ammonia) or UV (Ultraviolet) absorbance. Visual light/colours are electromagnetic waves with wavelengths in the range 390–700 nanometres (nm). UV is defined as the spectrum in the range of wavelengths from 185 to 380 nm. Nitrate molecules absorb UV light intensively at a wavelength of around 220 nm; hence, measuring the absorbance at this wavelength gives a good indication of the nitrate concentration in the water. Unfortunately, some commonly present organic matter molecules absorb light at the same wavelength, which may confuse the measurement somewhat. To counteract this interference, a reference measurement of 275 nm is used to give an idea of this interference. Using both results in the calculation provides a “fairly” precise and very easy way to perform online measurement of nitrate.
Downloaded from http://iwaponline.com/ebooks/book-pdf/651186/wio9781780407586.pdfby gueston 14 January 2022

73Measure
5. Phosphate
Phosphate is the third of the three nutrient ions usually measured online in wastewater. Phosphorus is the second of the two most important nutrients leading to eutrophication (the other being nitrogen). Phosphate is either removed chemically by precipitation or biologically by the micro-organisms taking up the phosphorus in their cells. In both cases the phosphorus is removed together with the sludge. While phosphorus is not in the solid phase it is dissolved in the water primarily as phosphate. While historically nitrate and ammonia measurement methods were based on colorimetric methods, these have been replaced by methods better suited for implementation in sensors (ion selective). So far however, it has not been possible to find a robust and easier method for the detection of phosphate. Hence, most sensors for phosphate are still based on colorimetric methods. This means the addition of a chemical, which by reaction with the ion, in this case phosphate, colours the water. The intensity of the colour is then detected by a photometer which translates this into the concentration of mg/l PO4-P.
6. Organics
One of the main purposes of traditional wastewater treatment is the removal of organic matter, which otherwise would consume oxygen from the recipient during degradation. The difficulty in measuring organic matter lies in the great multitude of compounds that make up the pool of organic matter.
To evaluate the effect that the organic matter puts on the recipient, two parameters have been developed to quantify the organic matter: the chemical oxygen demand (COD) and the biochemical oxygen demand (BOD). These parameters describe how much oxygen is required to degrade the water sample’s content of organic matter – either through full chemical oxidation by a strong oxidant or through bacteriological degradation. The COD is always higher than the BOD, as the difficult degradable organic matter is not degraded biologically.
Instead some sensor companies are developing parameters that approximate COD and BOD. One method is based on UV measurements as many organic compounds absorb UV radiation. A formula is developed by selecting wavelengths at which different organic compounds absorb light. Then statistical methods are applied to calibrate the sensor towards the COD and BOD content measured in water samples at the site.
Downloaded from http://iwaponline.com/ebooks/book-pdf/651186/wio9781780407586.pdfby gueston 14 January 2022

74 sMart water utilities: Complexity made simple
7. Sludge level
Sludge level means the level in a sedimentation tank above which there is clear water and below which there is sludge at a high concentration. If the sludge level moves upwards there is a risk that the sludge will escape out of the sedimentation tank together with the effluent water – which is exactly the opposite of what is the purpose of the sedimentation tank. Additionally, it should not go too low as that would impair the filtering effect of the sludge – depending on sedimentation tank design.
In reality it is not always so easy to define the sludge level, because the sludge concentration has a vertical gradient all through the sedimentation tank. Under steady-state conditions the concentration of sludge is largest in the bottom of the settler and decreases all the way up to very low levels in the clarified water at the top. Defining at which shifting point exactly in the sludge concentration the sludge level is located is not trivial. This is further complicated by different compaction characteristics of different types of sludge and the occasionally non-steady state behaviour of the settler.
Ultrasonic measurement is a common online method for sensing sludge level. Ultrasound is sound with higher frequencies than the human ear can hear. The ultrasonic method for sludge level sensing sends an ultrasound impulse into the water; the time it takes for the sound to be reflected by the sludge levels is used as an indicator of the sludge level’s position. By applying different sonar frequencies different levels can be detected in the same situation. These differences correspond to using different concentration shift points in defining the sludge level.
A new sludge level sensor generation uses a near infrared optical measurement head. As the head is lowered in the clarifier or thickener it will continuously measure the suspended solids versus liquid depth and how the amount of suspended solids varies in the clarification zone.
Downloaded from http://iwaponline.com/ebooks/book-pdf/651186/wio9781780407586.pdfby gueston 14 January 2022

75Measure
8. Respirometry
Respirometry received a lot of attention from the research world for some decades without really gaining momentum in the utilities. The idea of respirometry is to make a respirometric experiment with sludge (microorganisms) in a batch reactor with well controlled conditions.
By monitoring the respiration, i.e. the rate of change of dissolved oxygen, various parameters can be estimated. Depending on the conditions, parameters such as easily degradable organic matter, bacteriological growth rate and inhibition due to for example toxicity can be estimated.
In some cases, the full-scale aerobic reactor has been used as a respirometer to obtain the required information. This can be done by monitoring the airflow rate to the system and monitoring the rate of change in the reactor, while controlling the dissolved oxygen concentration. By means of mathematical models it is then possible to calculate fairly precise estimates of the respiration rate.
9. Airflow
Online measurement of airflow in a diffusor type aeration system may be used as part of the controller system to ensure more stable control of the aeration process. The measurements can also be used to compare the load in various compartments of the biological system, for example, to see if the load is the same in two parallel identical lines – as it should be. If aeration is controlled to the same DO setpoint and the suspended solids concentration is similar, the required air flow should be the same.
There are at least three different ways of measuring air flow in diffusor systems:
By means of differential pressure across a pipe restriction, it is possible to estimate the air flow.
This is probably the oldest measurement method available.
Vortex shedding based air flow meters are based on the physical principle that when an obstacle is introduced in an airflow, whirlpools or vortices are created. As speed increases, the number of formed vortices increases. By measuring these the flow can be calculated.
The most widely applied technology for air flow sensing is based on thermal dispersion. By applying a heated and a non-heated temperature sensor the amount of energy used to keep the temperature difference between the two constants is proportional to the air flow.
Downloaded from http://iwaponline.com/ebooks/book-pdf/651186/wio9781780407586.pdfby gueston 14 January 2022

76 Smart Water UtilitieS: Complexity made simple
eMerging sensor trends
Many interesting sensor developments are happening in laboratories of universities and companies all over the world. Here are five of them presented. The Gartner hype curve can help understand what is happening with new technologies. The curve illustrates that most technologies go through five phases:
1. A technology trigger
2. A peak of inflated expectations
3. Trough of disillusionment
4. Slope of enlightenments
5. Plateau of productivity
Basically the idea is simply put that new technologies become “buzz-words” before they can actually deliver. This leads to disappointment, followed by a period, in which
the interesting question of what can actually be done with this technology is asked and from there the technology develops into products that provide value. Where on the Gartner hype curve the presented technologies are located is up to you to guess.
Microbiology
Frustratingly, there is not yet an accepted method of online measurement of microbiology for drinking water. In laboratories around the world, scientists and developers are working with different principles to come up with such a method.
Being able to measure E. coli, coliform bacteria or another trustworthy indicator organism for faecal contamination would mean a giant leap forward in both water disinfection and water safety. The use of alternative methods for chlorination and hence lack of residual effect, increases the need for such a sensor or analyser.
Technology Trigger
markeT hype
The peak of inflaTed
expecTaTions
The Trough of disillusionmenT
The plaTeau of producTiviTy
Adapted from Gartner’s theory of cycle for emerging technologies
Figure 3.1: The Gardner hype curve.
Downloaded from http://iwaponline.com/ebooks/book-pdf/651186/wio9781780407586.pdfby gueston 14 January 2022

77measure
Methods being tested include image analysis, enzymatic and RNA-based or similar. We, the authors, wish to promise a bottle of fine Scandinavian Schnaps to the company who succeeds in doing this in a way that can make a trustworthy alarm due to microbial pollution with a short (<10 minutes) response time and at detection levels similar to current 1 per 100 ml of coliform and E. coli bacteria.
The detection of the larger parasites Cryptosporidium and Giardia lambia are probably closer to being online detected, but a robust solution is still not yet available.
intelligent sensors
At the beginning of electrical sensor technology development, most sensor outputs were quite simple. Generally, a 4–20 mA signal that was converted to the actual measuring point by means of a simple calculation,distributing the measuring range along the span of the current (or in some cases the voltage).
However, as processor power can be embedded in the electronics of the sensors and more complex data messages can be sent via electrical networks, this allows for much more intelligent sensor output
One way of applying this increased availability of intelligence in the sensor is to handle the internal states of the sensors more intelligently. This is especially the case for analytical sensors, where internal flows of chemicals have to be controlled, calibration fluids have to be forwarded at specific points of time and the sensing part of the sensor needs to know when
the signal is real and when it is an internal calibration. In spectral sensors, the computer power can be used to extract specific features of various measured spectra.
Another way of applying the increased intelligence is by giving the user of the sensor more complex information. It is possible to make a sort of pre-validation of the signal and hence tell the user when to trust the sensor and when to check it.
Micro pollutants
Today, there are a number of micro-pollutants for which it is very difficult to get a clear picture. The reason is that it is a quite diverse group and the compounds are present in very low concentrations. A further complicating issue concerning micro-pollutants is that the health effects are generally long term, i.e. they have accumulative effects over decades or may affect the reproductive scale of generation to generation. This makes it extremely difficult to differentiate the effect of one substance compared to another, as all people are affected by a cocktail of different micro-pollutants. It might be that the combination of more substances leads to adverse effects. In recognition of this complexity, the EU has moved to adopt the REACH regulations. Every chemical substance that is used in society risks ending up in the waterways at some point – a risk bordering on certainty. The main concern groups relevant to water quality include pesticides, hormones, endocrine disrupters, heavy metals, solvents, cosmetics, micro-plastics, nanoparticles, vira, etc. For many of these, even laboratory analysis is challenging. However, analysis methods are
One way of applying this increased availability of intelligence in the sensor is to handle the internal
states of the sensors more intelligently.
Downloaded from http://iwaponline.com/ebooks/book-pdf/651186/wio9781780407586.pdfby gueston 14 January 2022

78 Smart Water UtilitieS: Complexity made simple
emerging. One crude example is to test toxicity in water by using living fish. The fish movements are observed and analysed via a vision system in front of the fish tank. The fish movements have been shown to be very sensitive to any change of the water quality and hence it is possible to detect a significant change in the fish movement whenever some toxic material enters the fish tank.
spectroscopy
Instead of measuring absorbance or reflectance at only one or a few wavelengths, the ability to measure whole spectra online provides new exciting opportunities in describing and understanding the current quality as well as the change in quality of water – both in regard to clear water and wastewater types of water. Today this type of online information can mostly shed more light on the currently somewhat opaque understanding of the composition of organic matter. Mathematical methods for rapidly estimating parameters of BOD or COD have been proposed. If these become widely accepted they would be an important step forward in online monitoring of these parameters. But parameters such as TOC (Total Organic Carbon), DOC (Dissolved Organic Matter), BTX (Benzene, Toluene and Xylenes) and AOC (Assimilable Organic Carbon) can also possibly be monitored. AOC for example can possibly work as a measure/estimate of the microbial growth potential in water, which is extremely interesting from a microbiological point of view. These spectrometric measurements will become increasingly interesting as experience
increases and the community has tested and applied various mathematical techniques on their resulting spectra.
wireless communication
While wireless can hardly be said to be a new thing, it has now entered a phase in which it is becoming easily affordable and technically easy to manage. The development and implementation of GPRS and 3G in mobile phones has also entered the sensor world. “The internet of things” and “Big data” are buzz words that try to describe what is happening around this trend of connecting more and more products via the Internet.
For the water utility community it means that remote sensor location is not a challenge any more. Locations where it was previously too expensive, or difficult to place sensors due to cabling, are now easily available. The water utility community is in a state of adjusting and having eye-opening experiences as to what this means. Drinking water networks, sewer systems, water sources and wastewater recipients are the new frontiers in monitoring and are within our grasp. When dissolved oxygen sensors and later nutrient sensors became available it clarified the functioning of the individual process systems to an extent that made it possible to gain significant operational optimisations. Similarly, this remote monitoring trend will lead to a clarification and hence more intelligent handling of the processes in the areas of the urban water cycle that are geographically distributed.
Downloaded from http://iwaponline.com/ebooks/book-pdf/651186/wio9781780407586.pdfby gueston 14 January 2022

79measure
a data and inforMation “librarian”
Creating an overview of relevant information needed to support decision making in water utilities is far from trivial. A large part of the knowledge about the system is tacit and hence difficult to absorb. But even when strictly speaking of the existing tangible data, it may be difficult to get an overview and often also to access this data easily.
Such data is in the form of:
66 Historic data in the SCADA system;
66 Geographical data in the GIS system;
66 Analytical reports carried out by internal and external personnel;
66 Laboratory data;
66 Strategies and plans;
66 Laws and local regulation;
66 Management systems describing procedures;
66 Academic books, journals and articles;
66 An external network of consultants, lawyers, universities…;
66 Databases.
Appointing an information librarian may be very helpful. The responsibility of such a “utility librarian” is to keep track of all the material and make sure it is presented to the utility staff in a way that ensures that the information is used actively. If things are not easy to find and see in daily life, there is a good chance that they will not be used at the right point.
Taking a librarian point of view and creating the overview will additionally enable the utility to understand where the gaps are in the information body. This should result in a strategy for closing the serious gaps.
Downloaded from http://iwaponline.com/ebooks/book-pdf/651186/wio9781780407586.pdfby gueston 14 January 2022

80 Smart Water UtilitieS: Complexity made simple
iMportant aspects of sensor selection
When selecting sensors it makes sense to carefully consider the following aspects of the sensor.
cost of ownership
With sensors – as with so many other components – the price of the product is not the key issue to consider when talking cost. Generally, cost can be divided into:
The capital cost
66 Price of the sensor;
66 Cost of physical installation, including sometimes a need to change tanks, pipe work and housing to accommodate the sensor;
66 Cost of additional equipment to ensure the installation, i.e. the rig, pre-treatment, sample transportation pipework, etc;
66 Cost of electrical installation, including wiring, signal transmitting, data storage and data presentation in your preferred IT environment (i.e. SCADA system);
66 Testing of the system, i.e. does the displayed data correspond with an independent (e.g. laboratory) measurement at the given point? The error between point of measurement and point of display can relate to, e.g. the sensor not measuring correctly, the electrical and software wiring from sensor to display being wrong, the calibration being wrong or even the laboratory measurement being wrong or taken at a point that is non-representative for the sensor measurement;
66 Programming of intelligence connected with the sensor including controllers (and their tuning) and analysis algorithms.
SenSor Selection Sensor selection should not be done hastily.
Rather the following aspects need to be
considered carefully: signal dynamics,
signal precision, robustness, ownership cost,
measuring principle and a number of other
aspects. It may also prove to be an advantage
to understand the sensor market.
Downloaded from http://iwaponline.com/ebooks/book-pdf/651186/wio9781780407586.pdfby gueston 14 January 2022

81measure
The operational cost
66 Consumables such as electricity and chemicals, plus the disposal of chemicals;
66 Calibration efforts – how often and how much time it takes. Is a laboratory technician required for the work?
66 Maintenance and spare parts. This may be handled in a service contract;
66 Checking of the sensor should be done at some intervals to make sure that the sensor is performing as it should;
66 Troubleshooting of the sensor when it does not perform correctly.
Other costs
66 Expected life-time of the equipment and the associated guarantees;
66 Leasing contract is also an option at some companies, this enables a change to better technology when such become available.
Total cost of ownership
The cost of ownership is the joint cost of the above mentioned costs. For advanced water quality sensors the added cost on top of the sensor price is of great importance while for flow and pressure sensors on the other hand there are very little additional cost on top of the price. However for all sensors it is important to compare the total cost with the quality of the sensor and be very clear about the requirements for each individual installation.
Hassle of ownership
Thinking of the hassle of ownership as just an added cost factor is a regrettable perspective. It can be like buying an old non-expensive car that is at the workshop all the time. While in the workshop you can’t drive it and will have to walk or take the bus instead – a lot of hassle. Troublesome sensors do not only have the cost of the work that needs to be done on them. They also have the problem that when something unexpected actually happens and the sensor signals tell you so, you will first of all doubt the sensor.
Doubting the sensor, means that you will direct your attention toward the sensor and try to fix that, rather than trying to fix the problem that the sensor is showing you. When you finally realise that the sensor is actually showing the right dynamics, only then will you, very much delayed, start analysing the real problem. At that point in time, the problem may have become even worse and valuable time may have been lost.
Good, stable, robust, well-tested sensors in the setting of good reliable knowledge suppliers and advisors are really worth a serious mark-up compared to unreliable difficult-to-operate sensors.
sensor technology
As described in the chapter about the most popular sensors in water and wastewater applications, some sensors have more core technology options. For example, the measurement principles of flow meters include pressure based, such as venturi meters, electromagnetic flow sensing, optical flow sensing, vortex measurements, ultrasonic and laser-doppler measurements. While in the area of water quality parameters the dominating technologies include electrochemical, optical, spectrographic, electromagnetic, gas or ion sensitive electrodes, ultrasound, luminescence,
Downloaded from http://iwaponline.com/ebooks/book-pdf/651186/wio9781780407586.pdfby gueston 14 January 2022

82 Smart Water UtilitieS: Complexity made simple
colorimetric and more. Obviously, the technology on which the sensor is based has important influence on the performance of the sensor with regard to different parameters. It is not possible to make a clear recommendation of which technology is better.
Generally, if sensors exist that are built on different technologies, it means that there are some trade-offs between the sensors, where for some application one technology is better and for another application another is better. The most important divide is not necessarily related to price – though it may be. More often it is a trade-off between good performance parameters such as robustness, ruggedness, low level of maintenance, precision, width and position of range, low drift, fast response time and low limit of detection.
To choose between these characteristics is not trivial and obviously sensors should preferably have good performance on all parameters. However, if that were the case and time allowed, the sensors based on the superior technology would prevail, while the poorer performing sensors would disappear from the market space.
technical specifications
Range
The measurement range is clearly a key selection parameter that needs to be considered. The process you are measuring needs to be kept within the measuring range of the sensor or the signal will saturate either at maximum or minimum, which in effect means that you don’t know anything about the value except that it is higher or lower than the measuring maximum or minimum. For some types of sensors the applied technology depends on the measuring range, so that one technology is applicable for low ranges and another for larger ranges. For some technologies, this is because they have a linear response to the increasing value of the measured
parameter until a certain point, at which the sensitivity is reduced.
Precision needs to accompany the range and is typically a percentage of the total range. This means that with the same precision percentage, small range sensors are more precise than large range sensors – which may be fine, but one should be aware of it.
Sensitivity to other parameters
Interference is an important aspect to be aware of as some technologies are interfered with by the presence of other substances. The sensor supplier should generally be able to inform about the main interferences, which might be temperature, pH, turbidity or the presence of air bubbles. It is to be expected that the sensors have been tested against these normally appearing substances. However, sensors may still react differently in different water compositions – water is not “just water”. Hence it may be a good idea to test the sensor in the relevant water before investing in it. Some suppliers offer this as part of their sales service.
Other technical parameters
The ISO standard 15839:2003 protocol is a standard for online sensors/analysing equipment for water dealing with specification and performance tests. The standard:
66 Defines an on-line sensor/analysing equipment for water quality measurements;
66 Defines terminology describing the performance characteristics of on-line sensors/analysing equipment;
66 Specifies the test procedures (for laboratory and field) to be used to evaluate the performance characteristics of on-line sensors/analysing equipment.
Downloaded from http://iwaponline.com/ebooks/book-pdf/651186/wio9781780407586.pdfby gueston 14 January 2022

83measure
The standard describes important aspects such as:
66 Coefficient of variation (%)
66 Limit of detection (measurement unit)
66 Limit of quantification (measurement unit)
66 Repeatability at 20% (measurement unit)
66 Repeatability at 80% (measurement unit)
66 Lowest detectable change at 20% (measurement unit)
66 Bias at 20% (measurement unit)
66 Bias at 80% (measurement unit)
66 Short term drift (%/day)
66 Day-to-day repeatability at 35% (measurement unit)
66 D ay-to-day repeatability at 65% (measurement unit)
The following pages explain in more detail some aspects of signal dynamics, precision and accuracy.
in summary
Many aspects go into the selection of sensors and it might sound a bit confusing and overwhelming. The point is to understand the intricacies of sensing and which of these matters with the specific location, parameter and process to be monitored. Make use also of the experience from other utilities and be sure to ask independent questions of your sensor supplier.
Downloaded from http://iwaponline.com/ebooks/book-pdf/651186/wio9781780407586.pdfby gueston 14 January 2022

84 Smart Water UtilitieS: Complexity made simple
signal dynaMics
In ISO 15839 characterization of on-line sensors for water, the parameter’s response time, delay time, rise time and fall time are defined as depicted in the Figure 3.2, which shows a step response experiment in which a sensor is subjected to a 20% concentration followed by an 80% concentration and then back to a 20% concentration, in which the percentages are taken as percentage of the full measurement range.
Unfortunately, far from all sensor suppliers supply these data, but the most important issue here is to understand that both delays and dynamics are influencing the response time in all sensors. If the response time is considerably faster than the process changes, this is of little importance. However if the sensor response time and the time constants of the process dynamics are close, it will cause problems as the sensor will show wrong values most of the time. This may also lead to strong oscillations when trying to control the process according to the signal. Therefore it is important when selecting sensors
that they have a fast response and that the response time is at least a factor 5–10 faster than the process change time constants.
accuracy and precision
Besides delay time and a certain rise time in the sensor signal, the signal can be imprecise in a number of different ways. ISO 15839 attempts to quantify how accurate a sensor is by various formulas. The statistical definitions are a bit complicated. As an illustration of the challenges of the typical issues, see Figure 3.3. The ideal sensor shows a signal that corresponds perfectly to the parameter in the water, however achieving such ideal behaviour – even in the laboratory – is very difficult. So performing online and in real-time measurements usually comes with a bit of compromise, still if these compromises are understood, the sensors can still be of great value. In the below graph, the red line illustrates reality, while the black dots illustrate what the sensor communicates.
Figure 3.2: Illustration of the key dynamic parameters as defined by the ISO 15839 characterisation of on-line sensors.
reality signal
0.0 0.2 0.4 0.6 0.8 1.0 1.2 1.4 1.6 1.8 2.0
Meas
uring
Rang
e
1
0.9
0.8
0.7
0.6
0.5
0.4
0.3
0.2
0.1
0
response Time
delayTime
riseTime
10%
10%
fallTime
Downloaded from http://iwaponline.com/ebooks/book-pdf/651186/wio9781780407586.pdfby gueston 14 January 2022

85measure
sensor supplier selection
The market for sensors can roughly be divided into the following types of players:
66 A few large corporations with a broad and more or less complete sensor product portfolio;
66 Many innovative sensor companies with one or only a few specialised sensors;
66 Sensor companies owned by larger corporations for incorporation of sensors in their intelligent solutions, which does also include actuator components such as pumps, drives and valves;
66 Sensor distributors with a clear sensor focus distributing a set of selected sensors;
66 Consulting engineers and contractors delivering sensors as part of their service.
Which road to take when selecting sensors for
your water utility is obviously a matter of your preference. In order to help you navigate this market we have prepared a number of good questions to ask and aspects to consider in your buying process.
supplier competence level
While so many other parameters may seem more obvious to start with than this, it may be one of the most important aspects to consider in the choice of supplier. Generally, the contact to a given company will go through the local or national sales person. As these companies are often quite small, the sales person may also be involved in both installation and operation of the sensors and it is not uncommon for the sales person to have extensive experience in where to place the sensors as well as all the do’s and don’ts of sensor operation. He or she may know how to best compare the result of the sensor with alternative measuring methods and he or she may even for specific types of sensors recommend some of the competitors’ sensors.
0.0
0.2
0.4
0.6
0.8
1.0
1.2SensorReality
0.0
0.2
0.4
0.6
0.8
1.0
1.2SensorReality
0.0
0.2
0.4
0.6
0.8
1.0
1.2SensorReality
0.0
0.2
0.4
0.6
0.8
1.0
1.2SensorReality
0.0
0.2
0.4
0.6
0.8
1.0
1.2SensorReality
0.0
0.2
0.4
0.6
0.8
1.0
1.2SensorReality
Figure 3.3: Illustration of sensors’ accuracy and precision issues.
Downloaded from http://iwaponline.com/ebooks/book-pdf/651186/wio9781780407586.pdfby gueston 14 January 2022

86 Smart Water UtilitieS: Complexity made simple
A good way to evaluate the competence level is to see how good the different important questions presented here are answered. It is not a prerequisite that any sales person can answer all and every question, but being able to get you the answer fast tells you that the competence is present in the organisation and that the organisation is responsive. Be aware that to some extent the understanding of sensors and the understanding of the application of sensors in real-life is not the same thing and it is rare to find people who span both areas of competence well. Hence the existence of both sensor technology savvy persons and application specialists is preferable. But ensuring that there are also real sensor development enthusiasts in the development department is important if you want state-of-the-art sensors. Because the sensor industry is still in its infancy and hence still making significant developmental steps in each new generation, it is important that you buy the newest products.
supplier service level and responsiveness
As mentioned above, getting knowhow from the company tells you something about the responsiveness of the organisation, however getting service from the company if there are problems with the sensor may be something different. As opposed to the rest of the components of water utilities, sensors have generally not reached the same high level of ruggedness and long life-time. Some sensors are relatively simple and require very little care and maintenance, however a majority tend to be a bit fragile and all kinds of things can go wrong during installation, operation and calibration. Sensors are automated lab equipment that has moved from safe handling by educated lab personnel in controlled laboratories to the “violence” of the real world. This can be made to work, but it requires some competent help once in a while. Good sensor suppliers have extensive experience in all the things that may go wrong
and know how to diagnose the problems in an effective way – or even better – know how to instruct users to avoid problems in the first place.
Choosing a good supplier may mean the difference between success and failure of a Smart Water utility initiative. Building a Smart Water utility on sensors that are down or unreliable most of the time is like building a house on a shaky foundation. The service level is obviously something to be discussed with the company, but may also be a thing to check and discuss with other utility customers.
width of portfolio
Some prefer suppliers with a broad portfolio. They are generally well-run, deliver a standard service. There is only one point of contact and the business model is clear and obvious. Others prefer specialised suppliers, because they may be more passionate and dedicated to the individual type of sensor they are supplying, however the down-side may be a smaller organisation, that is less robust. Many small and successful suppliers of specialised sensor equipment are eventually acquired by larger sensor suppliers and incorporated in the broader portfolios.
Buying from the small suppliers may also be an act of supporting the continued development and pushing of the boundaries of sensor development; an obligation that responsible and Smart Water utilities ought to take seriously. It is clear that the safe way is … well the safest, but it also leads to a stagnant water business with little development.
Downloaded from http://iwaponline.com/ebooks/book-pdf/651186/wio9781780407586.pdfby gueston 14 January 2022

87measure
arcHitecture of control systeMs
A control system is a network of connected devices, instruments and actuators typically used to control an industrial process. The network ensures that information and commands travel between the different devices and equipment so that they can function in a coordinated way to produce the desired result. In the beginning of control history the equipment functions were coordinated by mechanical means, but the invention of electronic control has changed that significantly and made quite amazing feats of automatic coordination possible. Most spectacularly, electronic control systems have enabled the Mars Exploration Rovers to explore the surface of Mars hundreds of millions of kilometres away.
The control systems we know today are the result of a long line of development from Monolithic systems – first generation SCADA systems, in which each device was connected directly to old-time main frame computers. The invention of serial communication over bus-networks marked a change to second generation distributed control systems, in which devices could all be connected to one main thread – the bus. All communication was sent as packages of information over the bus. The information packages were put together in a way in which the devices requiring the information would recognise their own message among lots of messages that were meant for other devices. The system of putting together these messages is called the protocol. Current protocols allow for both synchronous (at a steady frequency) and asynchronous messages (event messages).
In the beginning, there were lots of different protocols, where one protocol was not able to interact with other protocols. The third and currently most widespread generation is the networked control system. The main difference between second and third generation is that
electrical control SyStemS Electrical control systems collect, store and
display input measurements from sensors
and output setpoints and other automatic
control actions. At the core of the system is
the SCADA – Supervisory Control And Data
Acquisition – systems
Downloaded from http://iwaponline.com/ebooks/book-pdf/651186/wio9781780407586.pdfby gueston 14 January 2022
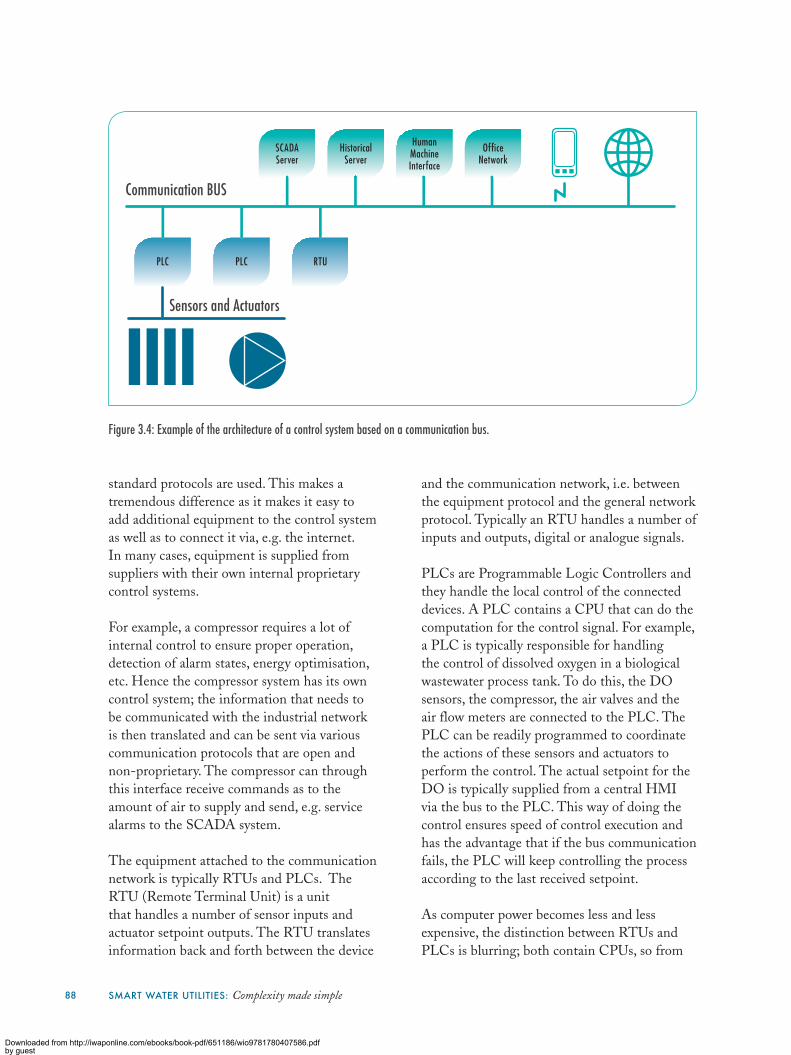
88 sMart water utilities: Complexity made simple
standard protocols are used. This makes a tremendous difference as it makes it easy to add additional equipment to the control system as well as to connect it via, e.g. the internet. In many cases, equipment is supplied from suppliers with their own internal proprietary control systems.
For example, a compressor requires a lot of internal control to ensure proper operation, detection of alarm states, energy optimisation, etc. Hence the compressor system has its own control system; the information that needs to be communicated with the industrial network is then translated and can be sent via various communication protocols that are open and non-proprietary. The compressor can through this interface receive commands as to the amount of air to supply and send, e.g. service alarms to the SCADA system.
The equipment attached to the communication network is typically RTUs and PLCs. The RTU (Remote Terminal Unit) is a unit that handles a number of sensor inputs and actuator setpoint outputs. The RTU translates information back and forth between the device
and the communication network, i.e. between the equipment protocol and the general network protocol. Typically an RTU handles a number of inputs and outputs, digital or analogue signals.
PLCs are Programmable Logic Controllers and they handle the local control of the connected devices. A PLC contains a CPU that can do the computation for the control signal. For example, a PLC is typically responsible for handling the control of dissolved oxygen in a biological wastewater process tank. To do this, the DO sensors, the compressor, the air valves and the air flow meters are connected to the PLC. The PLC can be readily programmed to coordinate the actions of these sensors and actuators to perform the control. The actual setpoint for the DO is typically supplied from a central HMI via the bus to the PLC. This way of doing the control ensures speed of control execution and has the advantage that if the bus communication fails, the PLC will keep controlling the process according to the last received setpoint.
As computer power becomes less and less expensive, the distinction between RTUs and PLCs is blurring; both contain CPUs, so from
Figure 3.4: Example of the architecture of a control system based on a communication bus.
plc rTuplc
Communication BUS
Sensors and Actuators
scada server
historical server
human machine interface
offi cenetwork
Downloaded from http://iwaponline.com/ebooks/book-pdf/651186/wio9781780407586.pdfby gueston 14 January 2022

89measure
a development point of view it is a minor additional cost to enable control capabilities in RTUs.
To take care of the overall control, a SCADA server is applied. The SCADA system ensures polling data from all the sensors in the system. The polled sensors, and the frequency by which they are polled, and the length of time for which the data are stored, is decided by the designers and hence the owners of the system. The SCADA system normally has a backup server, called the historical server. The historical server contains all the sampled information and will take over control of the system if the SCADA system fails for any reason.
The most visible part of the control system is the HMI (Human Machine Interface), which ensures the interface between the control system and the operators. This is typically a graphical computer interface with diagrams depicting the processes and read-fields with online readings of key equipment, such as sensor readings and states of actuators, such as valve position and pumping rates. The interface will also contain fields in which it is possible to change the set points of various processes or even change the general control strategy, turning on and off pumps, etc. The HMI can also display historical values in a graphical presentation interface and, very importantly, it ensures that alarms that require human interaction are displayed to operators.
tHe HuMan–MacHine interfaces
The Human–Machine Interface (HMI) enables operators and managers to interact with the technical system, i.e. with the various water pumping and cleaning processes in water utilities. This is a key tool! Or it should be. Compared to the fantastic advances in programming, communication and process control, the general design effectiveness of user interfaces is lagging somewhat behind.
Until now, in most control systems the main paradigm for the HMI interface has been a geographic sorting of the data combined with a P&I (piping and instrumentation) diagram thinking. This means that the screenshots look like P&I diagrams with singular data points scattered on the screen in proximity to the physical location of the measurement. Though this has worked well for decades, there are good reasons to revise this way of organising the interface. As Smart technology is developing further and the number of data points and the flexibility of the system are increasing, new solutions need to be invented.
When things have been organised the same way for a long time, it may be difficult to perceive the inherent problems. Here is a list of some of some of the problems encountered in current HMIs.
Compared to the fantastic advances in programming, communication and process control, the general design
effectiveness of user interfaces is lagging somewhat behind.
Downloaded from http://iwaponline.com/ebooks/book-pdf/651186/wio9781780407586.pdfby gueston 14 January 2022

90 Smart Water UtilitieS: Complexity made simple
lack of overview
The expanding amount of data stemming from an increasing amount of sensor parameters and sensor locations also intensifies the overall complexity. Keeping on cramming all data points belonging to a process into the same screenshot makes it more and more difficult for operators to get an overview of the data and hence to quickly grasp the state of the system.
lack of understanding of the data points
When there are only a few data points, it may be possible to memorise the normal values of all of them. However, as the number of data points increases and the combined values of more sensors gives information about the state of the system, there is a need to do some calculations on these numbers and present more high-level information; popularly speaking, to transform data into information. This higher level information should be placed in a context in which it is easy to see and understand if the system is in a normal state and also if the system is within acceptable boundaries.
difficult to forecast what will happen in the future
It is much more difficult to predict what is going to happen in the future with the processes than is often recognised. All operators do over time develop their own internal mental representations of how the processes and the plants operate. Based on this they decide what needs to be done to remedy a situation where a process is on its way out of normal state. The problem with these mental models is that they are not always correct; often reality is much more complex. It is not just that the processes do not work as we think: many processes interact and cheat or confuse our feeling of process understanding. We need to apply more specific
and science based models for our predictions. Models that can actually deal with the complex reality.
inability to change the system
Many if not most HMIs and in fact the full control system are designed in a once-and-for-all way. As long as processes are working they will not be changed. Most plants do not have easy access to people who can do even rudimentary programming. While installations may look nice and clean, the invisible code often looks like a bowl of spaghetti. This makes it difficult to correct anything – even for programming professionals.
The HMI should support operators in their most recurring “jobs-to-be-done”, so start the design phase by identifying these. Then consider each phase carefully and figure out the best way to support new as well as seasoned operators in doing each job easily and effectively. On one hand, the HMI should enable fast and correct assessment of the situation. On the other hand the HMI should leave room for some deeper thinking: enabling troubleshooting and identification of optimisation opportunities.
One example of a “job-to-be-done” that appears again and again in many contexts is to make a situational assessment:
1. Understanding if the state of the process is normal and within acceptable limits
2. If it is not or there is a risk of the process drifting out of these boundaries, the interface needs to help in trouble shooting how the process arrived at the current state, i.e. what is wrong
3. The interface should then support the operator in finding ways to make the process return to a normal and acceptable operation mode.
Downloaded from http://iwaponline.com/ebooks/book-pdf/651186/wio9781780407586.pdfby gueston 14 January 2022

91measure
alarm read-ouTs
conTrol sTraTegy,
where key seTpoinTs
are seT
do sensor read-ouT
seTTing of sTaTe of moTor conTrolled valves
access To relevanT curves
The system should encourage the operator to identify more solutions and help him predict the effect of the suggested solutions.
it security
As SCADA systems become increasingly
66 Based on open protocols;
66 Connected to the internet and traditional office networks;
66 Accessible by wireless communication.
They are increasingly at risk of being breeched by hackers. This problem is often overlooked as systems were earlier much better protected by their design, i.e. they were isolated systems, the communication protocols were quite obscure and only understood by a few insiders to the protocols.
The most famous hacker event in water utilities is the Maroochy Shire case. Maroochy Shire is located 100 km north of Brisbane, Australia. In 2000, the 142 pumping station sewer system had 47 events of sewage spills due to cyber-attacks. The failures caused the release of wastewater into waterways and parks. It took quite some time to troubleshoot the reasons for these spills.
The SCADA system was analysed again and again to find the reason for the error, as pumps were not operating when they should and alarms were not raised. The culprit was eventually identified as a former disgruntled employee of the company who had supplied the SCADA system. After being rejected for a job at the utility, he decided he wanted revenge at both the SCADA company and the utility. By means of equipment stolen at the SCADA company before leaving, he was able by means of radio links to change the configurations of the pumping stations. Eventually, after having been
Figure 3.5: Example of a conventional HMI in a SCADA system. This HMI is used for the control of the biological reactors in Kalundborg WWTP.
Downloaded from http://iwaponline.com/ebooks/book-pdf/651186/wio9781780407586.pdfby gueston 14 January 2022

92 sMart water utilities: Complexity made simple
suspected and surveyed for a while, he was found to have the stolen equipment his car and he was convicted of using a computer to cause harm and cause serious environmental harm and was jailed.
As in most water utilities, Maroochy Shire had no cyber security policies or procedures and there were no cyber security defences, the radio signals were not the least encrypted and staff were not trained to identify such a problem. Hence, at first, installation errors were blamed. Only after finding that re-installing everything did not solve the problem, and rather that the system changed in a way that it could not do on its own, it was clear that an external person was responsible.
Most SCADA systems do have some kind of encryption and logic protection mechanism, but buyers of SCADA systems need to pay more attention to this problem and ensure that these safety precautions are installed properly and ensure that communication is properly encrypted, passwords are strong enough, etc. This needs to be done by specifying the level of security required in the system specifications. In many cases where the SCADA systems are old, it may be difficult or impossible to secure the system, as processor power is too low. In these cases it may be necessary to exchange the system prematurely or at least protect the system physically and have cyber security procedures in place. 6
Cyber security
Make an inventory of what needs to be secured, including:
66 Hardware (computers, servers, PLCs, RTUs, actuators, sensors);
66 System and application software;
66 Customised software including control programs in PLCs, settings of various devices, etc;
66 Communication networks (bus communication, wireless communication, connections to internet and office network, networks running from PLCs and RTUs).
Discuss with security experts how to secure these assets.
The threats to the system may come from three main sources:
66 Employees or former employees who may damage the system either intentionally or by incompetence;
66 Amateur hackers and vandals. The most common hackers on the internet are amateurs who are looking for well-known weak spots in security. Their approach is generally opportunistic, so if there are no easy holes they will often continue to easier targets
66 Professional hackers and cyber terrorists. This is the most unlikely kind of attack on a water utility system, as these systems generally do not hold information of high value. However, in the wake of 9-11, there has been great concern about the risk of poisoning the drinking water supply of cities, but securing against such an event goes beyond cyber security.
Downloaded from http://iwaponline.com/ebooks/book-pdf/651186/wio9781780407586.pdfby gueston 14 January 2022

93measure
sensorsIn the book Olsson, G., Nielsen, M., Yuan, Z., Lynggaard-Jensen, A. and Steyer, J.P. (2005) Instrumentation, Control and Automation in Wastewater Systems. IWA Publishing, chapter 9 is devoted to sensors and instrumentation. The information is still adequate.
In the paper, Rieger, L., Alex, J., Winkler, S., Boehler, M., Thomann, M., and Siegrist, H. (2003) Progress in sensor technology – progress in process control? Part I: Sensor property investigation and classification. Water Science & Technology, 47(2), 103–112, the authors suggest a test environment that will allow control engineers to define the requirements of the measuring equipment as a function of the selected control strategy.
You can read about sensors for leakage detection in Sarrate, R., Blesa, J., Nejjari, F. and Quevedo, J. (2014) Sensor placement for leak detection and location in water distribution networks. Water Science & Technology: Water Supply, 14(5), 795–803, where it is described how leak detection and localisation can be performed by using pressure measurements in the network.
In the paper, Shen, Y.J., Lefebvre, O., Tan, Z. and Ng, H.Y. (2012) Microbial fuel-cell-based toxicity sensor for fast monitoring of acidic toxicity. Water Science & Technology 65(7), 1223–1228 a microbial fuel cell (MFC) based toxicity sensor is described. In MFCs bacteria convert the chemical energy into electricity. If a toxic event occurs, microbial activity is inhibited and thus the power output of the MFC decreases. As a result, the MFC could serve as an early toxicity warning device.
The paper, Rieger, L., Vanrolleghem, P.A., Langergraber, G., Kaelin, D. and Siegrist, H. (2008) Long-term evaluation of a spectral sensor for nitrite and nitrate. Water Science & Technology, 57(10), 1563–1569 describes in-situ spectral analysis based on UV to measure nitrite and nitrate concentrations.
The standard ISO 15839:2003 describes the performance testing of on-line sensors/analysing equipment for water.
A large number of vendors can easily be reached on the internet by using “water and wastewater sensors” and similar keywords.
it systeMsThere is a vast literature on SCADA systems. The basic ideas in SCADA are actually explained in several booklets, freely available on the internet. They can explain basic concepts such as the components of a SCADA system, basic computer communication, computer interfaces and human–machine interfaces (HMI).
Actuators are a crucial part of any control system. This is further discussed in later chapters. Electric drive systems are vital in water operations, in which any pumping is dependent on an electric motor system. All the major vendors, such as ABB, Siemens, and many others, provide a large quantity of information on the internet. Furthermore, there are several short lectures available on YouTube. Search for “electric drive systems” on www.youtube.com.
The structure of control systems, from basic PLC (programmable logic controllers) to larger real-time computers, is described in a vast literature. Much information can be found on the Internet from many vendors. Search engines and www.youtube.com may be used to look for “SCADA”, “PLC” and “real-time computer” process control systems.
Issues concerning cyber security are described at many different internet sites. Cyber security is a moving target and hence it is advisable to look at the most recent information. A fast introduction can for example be found in Cyber Security Principles by Garrett Gee. A detailed report on the Maroochy case can be found at http://csrc.nist.gov/ (the computer security division of the National Institute of Standards and Technology, U.S.).
More to read on sensors, measurements and control systems
Downloaded from http://iwaponline.com/ebooks/book-pdf/651186/wio9781780407586.pdfby gueston 14 January 2022

The important thing about analysis is
To make sure you understand deeply
Without it you are roaming in the dark
Without it you make poor decisions
To many it seems diffi cult
When you succeed in solving the puzzle
It is a great feeling
But the important thing about analysis is
To make sure you understand deeply
Downloaded from http://iwaponline.com/ebooks/book-pdf/651186/wio9781780407586.pdfby gueston 14 January 2022

AnAlyse4
Downloaded from http://iwaponline.com/ebooks/book-pdf/651186/wio9781780407586.pdfby gueston 14 January 2022

96 smArt wAter utilities: Complexity made simple
Analytical tools
single signal analysis66 Filtering66 Outlier detection66 Repairing datasets66 Statistical process control
mathematical models66 Linear regression66 Multivariate regression66 Diagnosis66 Simple dynamic models66 Hydraulic models66 Biological reaction models
performance indicators66 KPI66 Benchmarking
tHe AnAlysis toolBoX
SeconDS
MinuteS
HourS
DaYS
MontHS
YearS
The analysis component of the MAD-concept of Smart Water utilities is the link between the sensors, the measurements and all the raw data on the one side and decisions on the other. The analysis component is the component that makes the system “smart”. It is tempting to buy a large number of sensors and call the utility smart, based on the numbers of inputs and outputs. But if nothing smart is going on between input and output, it is just a system with lots of inputs and outputs.
Good analysis creates clarity and resolve, which is the foundation of good decision-making. Luckily, there are many powerful tools for analysis. These tools can be cumbersome to understand and apply. In this chapter we will try to present the tools and show what they are good at as well as organising the tools logically, so that they are easy to find in the toolbox.
There are many ways of analysing data. The best way depends on what you are trying to understand. The systems of water utilities have a lot of different opportunities for analysis as the systems are quite complex. The complexity means that the answers are not obvious. Many water utilities get by, by guessing the answers and acting accordingly with varying results. Surely, after working with water utilities for years or even decades, some people are able to gain an almost body-integrated understanding of the dynamics of the system and make quite good predictions on what will happen when a lever is pulled or pushed.
However, if a utility is aiming at reaching true excellence, it is not a consistent process of progress towards that goal. Instead clever managers are needed who are able to ask adequate questions who are able engineers and technicians and able to answer these questions based on sound scientific/technical thinking about the system.
Downloaded from http://iwaponline.com/ebooks/book-pdf/651186/wio9781780407586.pdfby gueston 14 January 2022

97analyse
Good analysis creates clarity and resolve, which is the foundation of good decision-making.
For this purpose, a number of mathematical tools are available. Obviously, the engineers responsible for the analysis need to both understand and the ability to apply these mathematical tools. For the rest of the organisation, it is of great value to make the effort to comprehend the thinking behind these tools because it provides a sound basis for asking intelligent questions.
Some reasons that the effort is worthwhile are that the understanding:
66 Enables the questioner a feel for what kind of question can actually be answered;
66 Gives the questioner an understanding of the depth of the analysis that is behind the answering of a question: is it guesswork, is it an overall approximation, or is it a clearly understood and documented analysis. What is enough depends on what is enough, and this needs to be defined by he who asks;
66 Enables a dialogue between the questioner and the analyser about the applied assumptions;
66 Enables an appreciation of the result of a good analysis as well as patience with the time and resources required to make such a good analysis;
66 Ensures that the decisions taken based on the analysis are not “polluted” with misunderstanding and hence suboptimal compared to the ideal.
The analytical tools presented here are key tools that every utility should know about and apply on a regular basis. The individual tools can be used for different purposes. However, to provide an overview, the tools have been organised into three groups: tools applied for primarily (1) short-term analysis, (2) medium-term analysis and (3) long-term analysis.
Thinking of problems as pertaining to different time domains (short, medium and long term) is a central abstraction to make when discussing various process issues in the utility system. This lies at the heart of understanding and managing/controlling dynamic systems.
Downloaded from http://iwaponline.com/ebooks/book-pdf/651186/wio9781780407586.pdfby gueston 14 January 2022

98 smArt wAter utilities: Complexity made simple
Presented methods
filteringFiltering is used to remove noise from signals – either online or offline. A filter to remove the low frequencies is also presented.
outlier detection and data repairMethods to detect faulty data automatically and in some cases to repair the dataset.
DiagnosisMethods for detecting faulty signals.
statistical process controlA method to detect when the output from a process is significantly different from normal process behaviour.
SINGLE SIGNAL ANALYSIS It starts with a single signal. Some processes
are described by just that signal, while other
processes need more signals to be understood
together. In both cases it is important to refine
the single signal and to detect any anomalies
in the signal – abnormalities may be due to
either sensor trouble or to real anomalies in
the process producing the signal..
signAl filtering
Filtering data is a powerful single signal analysis, which is used to convert a noisy signal into a more useful signal. This can be done by analogue means using transistors. However applying digital filtering (i.e. by computer-aided calculation) is generally much more flexible and easier to adjust to the requirements.
real-time exponential low pass filter
The most frequently used filtering method is a real-time low pass filter that reduces the noise of the signal directly from measuring point to measuring point. Doing this online and in real-time naturally means that future values cannot be taken into account. Instead the filtered signal is achieved by a combination of the newest measuring point and the last filtered value. Adding a fraction of the new data point and a fraction of the old calculated data point gives the powerful exponential filter.
Downloaded from http://iwaponline.com/ebooks/book-pdf/651186/wio9781780407586.pdfby gueston 14 January 2022

99AnAlyse
Figure 4.1: Low pass filter – how it works.
0.5
0.4
0.3
0.2
0.1
0
–0.1
–0.2
–0.3
–0.4
–0.5
0.02 0.04 0.06 0.08 0.1
∝FD (t – 1) + (1 – ∝) RD(t) = FD(t)
0
Raw data (RD)Filtered data (FD)
The sum of the fractions adds up to one; the parameter controlling this is called � (alpha). The smoothness of the filtered curve is controlled by this � as shown in the formula. A higher value of (closer to one) yields a smoother signal and vice versa, where an alpha of zero means no filtering at all.
Unfortunately, the increased filtering also results in an increase in the delayed response time of the signal compared to the raw data. Therefore, the choice of � means a compromise between responsiveness and smoothness. The filter also has to make a compromise between the fast and the slow modes of the signal. Not only the noise but also the true signal contains some fast variations.
Figure 4.2: Low pass filter examples with different alpha values.
3.0
2.5
2
1.5
1
0.5
0
–0.5
–1.0
0 1 2 3 4 5 6 7
SignalLo-pass � = 0.5
3.0
2.5
2
1.5
1
0.5
0
–0.5
–1.0
0 1 2 3 4 5 6 7
SignalLo-pass � = 0.9
3.0
2.5
2
1.5
1
0.5
0
–0.5
–1.0
0 1 2 3 4 5 6 7
SignalLo-pass � = 0.98
0 1 2 3 4 5 6 7
0 1 2 3 4 5 6 7
Downloaded from http://iwaponline.com/ebooks/book-pdf/651186/wio9781780407586.pdfby gueston 14 January 2022

100 smArt wAter utilities: Complexity made simple
Figure 4.3: Moving average filter – how it works.
Figure 4.4: Moving average filter example.
1.2
1
0.8
0.6
0.4
0.2
01 1.05 1.1 1.15 1.2 1.25 1.3 1.35 1.4 1.45 1.5
SignalMA filter
FD (t) = 5 * (RD(t – 2) + RD(t – 1) + RD (t) + + RD (t + 1) + RD (t + 2) 1
moving average filter
A moving average (MA) filter is a simple low pass filter that allows the low frequencies of the signal to pass, while filtering the high frequency noise out of the filter.
The more data points that are included in the averaging calculation, the more the signal is
smoothed. If the moving average is based on the current and previous signal values, then the MA filter is a real time low pass filter. The MA filter can also be used to filter data offline. Then we can include “future” values. As a result, there is no delay phenomenon. Below is an illustration of an MA filter using five data points to form one filtered data point.
SignalMA-filter
3.0
2.5
2
1.5
1
0.5
0
–0.5
–1.0
0 1 2 3 4 5 6 7
3.0
2.5
2
1.5
1
0.5
0
–0.5 0 1 2 3 4 5 6 7
Downloaded from http://iwaponline.com/ebooks/book-pdf/651186/wio9781780407586.pdfby gueston 14 January 2022

101AnAlyse
A high-pass filter
Sometimes it is interesting to analyse the fast frequencies without having to take the low frequencies into account at the same time. This
Figure 4.5: High pass filter – how it works.
SignalHi–Pass
3.0
2.5
2
1.5
1
0.5
0
–0.5
–1.0
0 1 2 3 4 5 6 7
3.0
2.5
2
1.5
1
0.5
0
–0.5
–1.0
0 1 2 3 4 5 6 7
1.0
0.8
0.6
0.4
0.2
0
–0.2
–0.4
–0.6
–0.80 0.1 0.2 0.3 0.4 0.5
Raw data (RD)Filtered data (FD)
FD (t) = RD(t) – RD(t – 1)
can be done by means of a high-pass filter. This is a simply way to detect sudden changes in signals. Below, we show the simplest possible high pass filter. It consists of the rate of change of the signal.
Figure 4.6: High pass filter example.
Downloaded from http://iwaponline.com/ebooks/book-pdf/651186/wio9781780407586.pdfby gueston 14 January 2022

102 smArt wAter utilities: Complexity made simple
Detecting outliers AnD repAiring DAtAsets
Almost all measurement series are affected by some problems such as missing values, noise or outliers. Hence, each signal has to be analysed with respect to its amplitude, mean value, deviation from normal variations, rate of change, trend and variability, etc.
Outliers are data that deviate a lot from the average. Often it is apparent that such a signal cannot be a true signal, but sometimes this data point, far from the average, may contain real information. There are a few rules and a statistical test that should be used before apparent outliers are discarded. If they are outliers, they should definitely be discarded as they can lead to large errors in parameters fitted to the data and subsequent control actions. However, some apparently deviating data points may be adequate data and should not be discarded. Therefore, it is not a trivial task to automatically eliminate outliers.
All sensors can give faulty measurements. There may be many potential reasons for faulty
measurements, such as the measuring principle, location, performance, drifting and, in some cases, something as simple as calibration.
It is in many cases surprisingly easy to see with the naked eye if a signal is behaving abnormally. This might be incidents of flat-lining or sudden erratic behaviour, or data going to zero or max in an abnormal way. The outliers in the signal in Figure 4.7 are apparent for the observer. However seeing it is one thing, but detecting and handling this automatically is a great challenge.
Automatic detection of outliers is beneficial in an online real-time setting, so that it is not necessary to follow every data point coming in to ensure that control loops can work based on a signal. In an offline setting it is more about sifting through large amounts of data and making sure that analysis carried out at a later stage is not disturbed by faulty data.
In some cases, the data can be rectified, while in other cases some physical action is required to pinpoint the reason for the outlier and take corrective actions.
Figure 4.7: Examples of different problems with real-life sensor signals.
Recorded signalClean signal
12
10
8
6
4
2
00 1 2 3 4 5 6
Clean signal12
10
8
6
4
2
Signal saturates; may be due to calibration
increased level of noise in signal and a small offset
Missing data
Signal is drifting upwards
Downloaded from http://iwaponline.com/ebooks/book-pdf/651186/wio9781780407586.pdfby gueston 14 January 2022

103analyse
The following rules to handle outliers are generally recommended:
66 Do not reject them if there are several neighbouring outliers. Chances are they are adequate data points. Something is happening that you did not anticipate;
66 Do not reject outliers at the edges of a dataset. Gather more data to move the edge outwards since the data may be the start of some change in direction;
66 Check if other sensors nearby show similar erratic behaviour, which would support something being out of the ordinary;
66 Check if anything looks strange around the sensor and find a way to validate the signal.
Averaging
Erroneous measurement values can be reduced from the very beginning by using simple averaging. For example a sensor can measure a signal 5–10 times faster than needed. This is often put into practice in dissolved oxygen measurements. It is needed to measure only a few times per minute, but the sensor gives a signal every 6 s. The accepted measurement is obtained by averaging over, e.g. five 6 s measurements. In addition, one or two extreme measurement values, the highest and the lowest one, could be discarded. This method is useful in those cases where the input signal (in this case the air flow rate) remains constant during the time interval in which the averaging operation takes place and the variations in the measurement signal are caused by noise in the process or in the sensor.
Detection AnD DiAgnosis for eArly wArning systems
Data analysis and interpretation is an important part of all plant operation. Data analysis is a term used to describe how data are manipulated and processed to produce the features of interest. Data interpretation describes mechanisms to put labels on the data observed.
Detection can be defined as the combination of process observations and measurements, data analysis and interpretation to detect abnormal features or “effects” and the isolation of faults. There are many ways to describe the operations, for example single variable description (low, high, normal), trends (e.g. increasing), process changes, shape descriptions and fault descriptions. Detection does not involve any explanations or causes for the behaviour.
Diagnosis involves the analysis of “effects” to identify and rank possible causes for the problem or the abnormal behaviour. Most often, the diagnosis involves various hypotheses being tested whereby many different hypotheses of known cause-and-effect relationships are tested.
The ultimate reason for detection and diagnosis is to find early warning for changes in the process. This is particularly important in processes or machinery, where some of the changes are not very obvious and may grow gradually until they become a serious operational problem. This is often the case in biological and some chemical systems, but may also appear in machinery (pumps, motors, valves, etc.) due to the wear and tear of the equipment. If an early warning is possible, then the chances for successful corrections become much greater.
In practice, the diagnosis and response tasks are most often characterized by manual, ill-documented or ad hoc operator procedures. There is a tremendous scope for improvement by adopting computer-based fault detection,
Downloaded from http://iwaponline.com/ebooks/book-pdf/651186/wio9781780407586.pdfby gueston 14 January 2022

104 Smart Water UtilitieS: Complexity made simple
diagnosis and advisory systems.
Some of the benefits of this are:
66 Reduced costs by vigilant monitoring of key parameters;
66 Consistent monitoring of the “product” quality (such as the effluent water composition and concentration);
66 Increased consistency by rapid detection and correction of disturbances; and
66 Reductions in human error due to mis-assessment of the process condition or failure to follow standard procedures.
In any detection operation we have to consider how often to measure. When using online physical sensors (such as flow rates, levels, pressures, and temperatures) there is no extra cost to measuring frequently. For other measurements, there is a cost related to each measurement, for example, when the measurement involves the dosage of certain chemicals for the detection. Then, in some cases, the measurements are visual observations by the operator, such as odour, noise, colour, etc. In any case, the goal is to detect what is acceptable behaviour.
Data analysis is a term used to describe how data are
manipulated and processed to produce the features of interest.
There are three basic issues related to inspection:
66 How much and how often to inspect;
66 When to inspect;
66 Where to inspect.
Let us consider the possibility of a toxic polluter entering the plant. Often the measurement or inspection costs are directly proportional to the number of measurements. On the other hand, there is a cost for not detecting serious disturbances sufficiently early. If the disturbance is detected too late, then the consequences may be huge. For example, in one case, a serious spill of heavy metals (Chromium acid) into a wastewater treatment plant wiped out the microorganisms of the activated sludge plant. To recover takes many weeks. In the meantime, the wastewater is not treated properly. In another case the pH of an anaerobic digester was not monitored. The digester got overloaded because the pH dropped too much and the organisms died. It took two months to get the digester into full operation again and to produce some biogas.
Deciding when and where to measure or inspect depends on the type of unit process and its importance for the total operation. Again, inspection can take place if the cost of inspection is less than the likely loss from not inspecting.
Current alarm systems should be migrating into the domain of early warning systems, that is, have automatic detection methods and automatically aided diagnosis systems, in which at the end, the decision is taken by an operator. But his or her thinking is aided by a number of hypotheses about the problem and more importantly the discarding of the hypotheses that the remaining sensor network does not support. In this way, the alarm system would become a smart alarm system.
Downloaded from http://iwaponline.com/ebooks/book-pdf/651186/wio9781780407586.pdfby gueston 14 January 2022

105AnAlyse
stAtisticAl process control
The term statistical process control implies some kind of control. This is not at all the case. Instead statistical process control (SPC) is a simple set of methods to analyse signals.
Using statistical process control the outcome of a process is followed to check if the process is stable and delivers a satisfactory quality. It is a simple method to determine if a measurement that is either high or low is requiring attention or if it is within the boundaries of normal performance. An example is the monitoring of water quality in networks.
The main tool in SPC is a control chart as shown in Figure 4.8 to the left. This indicates the resulting average measuring value as well as an upper and lower control limit. Any measurement beyond these limits requires attention as they indicate that the process is out of specification.
The variance of the data is used to define the upper and lower limits in the control chart. This
means that an initial “preparation” period is required for the SPC, in which the variance of the data is calculated based on the first heap of data – typically 20–50 data points are required to obtain a fair estimate of the variance. Then the standard deviation s is calculated as the square root of the variance.
The upper and lower control limits are normally defined as ±2 or 3 times the standard deviation. The higher number allows for broader variance of the data. Values outside 3 σ mean that only 0.3% of the data would end up outside the boundaries even if they are actually within stable performance. That means a data point outside the boundaries is highly likely to be due to something going wrong. This could be called an outlier.
About 4.5% are typically outside 2 σ.
When an abnormal measurement value has been detected, control procedures should be applied to bring the process back in line with normal operation.
Figure 4.9: The effect of using higher variance boundaries is the inclusion of more data as normal.
Figure 4.8: In statistical process control the data outside the upper and lower control limit may indicate that something is wrong in the process.
upper control limit
lower control limit
Sample
normalprocess
variation
0.9
0.8
0.7
0.6
0.5
0.4
0.3
0.2
0.1
00 1 2 3 4 5
1σ 2σ 3σ
Downloaded from http://iwaponline.com/ebooks/book-pdf/651186/wio9781780407586.pdfby gueston 14 January 2022

106 smArt wAter utilities: Complexity made simple
Presented methods
regression analysisMethod to analyse the relationship between two parameters.
multivariate analysisMethod to analyse the relationship between more parameters.
simple dynamic modelsMethod to understand the dynamics of processes that change over time and where one or more of the processes are interleaved.
the activated sludge modelsThe scientific community of wastewater has developed a number of standard models to describe the processes taking place in activated sludge. These models can be seen as the cornerstone of mathematical modelling around water utilities.
Hydraulic modelsHydraulic models to describe the dynamics of flow and pressure of water. These are very useful in understanding drinking water distribution systems and sewer systems, but also have a place in all kinds of water treatment systems
MATHEMATICALMODELS Some mathematical models can be very
simple representations of the real world, while
others are notoriously complex to understand,
operate and make work. But when they do
they create understanding at a level that
nothing else can. This is an introduction to
the mindset behind models and to some of
the existing standard models that the water
community agrees upon.
Downloaded from http://iwaponline.com/ebooks/book-pdf/651186/wio9781780407586.pdfby gueston 14 January 2022

107analyse
introDuction to moDelling
In the domain of water and wastewater, there has been a tradition or culture of controlling the systems in a “seat of the pants”/blindfolded kind of way. Tales goes around about operators who can see, smell and feel if the process is going well and make small adjustments to get to the operational “sweet-spot”.
Though the existence of such magic abilities cannot be entirely ruled out, it is time for a more thorough and science-based understanding of what is going on in the processes. Here models come in! Please let them all the way into the utilities. Don’t leave them outside the door with researchers and consultants; bring them all the way into the operating room and engineering offices. Learn to operate them or hire someone who can. A model is simply expressing a very useful package of knowledge that can be transferred between the users. Differently expressed: the model is a useful packaging of our knowledge.
Here are four reasons why:
1. If you want to elevate your understanding of the system beyond the elementary, you need tools for your thinking. Models help you understand the outcome of your experiments, they help you explain what worked well and why something did not work well – and they make you able to devise even smarter experiments and hence climb the ladder towards more efficient operation.
2. Models work as simulators, which means that when you have a “well-behaving” model you can actually replace months of experiments in real-life with hours of computer time simulations. And while in real-life you cannot ensure the same conditions from test to test – that is the least problem in a model. This means that you get correct comparison of competing control strategies.
3. A better understanding of sensitivity gives you the tools to really optimise what matters most. A reasonable interpretation of the Pareto principle is that 20% of the available control handles and other actions that can alter a process lead to 80% of the improvement. If you keep adjusting some of the less important parameters you will not achieve a good effect-to-effort ratio. A model can help you pinpoint the most effective control handles to work on.
4. Models are good playgrounds in which you can test all kinds of ideas without jeopardising the daily operation. Models make it possible to pinpoint potential problems in advance, so that these can be taken care of during implementation rather than along the road as the problems tumble down upon the operation in a difficult-to-explain kind of way. Another good “play-ground” option is to test the limits of the plant’s performance. How much rainwater can the plant take? How fast will the settlers begin to dysfunction? What actions can be postponed this point in time? What strategies will cause less pollution to the water ways – or minimise fines?
In the domain of water and wastewater, there has been a tradition or culture of controlling the systems
in a “seat of the pants”/blindfolded kind of way.
Downloaded from http://iwaponline.com/ebooks/book-pdf/651186/wio9781780407586.pdfby gueston 14 January 2022

108 Smart Water UtilitieS: Complexity made simple
Models come in many forms. We can form mental, almost emotional, models of systems spanning from the very simple to the somewhat complex. The act of learning to drive a car is an act of model forming; the same goes for learning to ride a bike or even to learn to coordinate our muscle contraction and relaxation to enable us to walk, shake hands, write, etc. They are all examples of learning to mentally model a system and apply the required actions to make the systems work for us. The mental model can be translated to a computer. For example, for car driving it means that our mental intuitive model is put into numbers and actions that form an autopilot.
The systems that are most easy to learn give us fast and clear feedback of the effects of our actions. We can learn to operate these systems by trial and error and maybe a bit of guidance and get a long way along the road from rookies to proficient drivers, bikers and walkers.
Other systems are much more difficult to learn because they do not provide us with fast and clear feedback and the system response times are either very long or very short compared to our normal domain of operation. An everyday example is the control of our general health. If we were to individually test out all kinds of food combinations to eventually stumble upon a good nutritional diet without any guidance, such a strategy would be almost impossible. Instead we need to rely on science and people with expertise in that domain.
Mathematical models are extremely valuable in water utilities. The models can take various forms mathematically based on the underlying assumptions and simplifications and they can be applied for a wide range of processes describing hydraulic, biological, chemical as well as mechanical processes. Some models are quite standardised and comprehensive, for example, the full activated sludge processes or models of the entire drinking water network. Other models are small and can be applied for fast investigations of relationships, e.g. a linear regression analysis to see how two parameters correlate to each other.
Advanced water and wastewater engineering systems are inherently multidisciplinary. The processes are composed of interacting subsystems of parts from different engineering disciplines, requiring an integration of chemical, biological, mechanical, electrical, control, and process engineering. This also means that design of proper control laws for large systems almost always requires a well-developed process model. Many models are developed to summarize and encapsulate our current understanding of the processes. Well-known examples of this are the Activated Sludge Models (ASM) no 1, 2 and 3 (Henze et al. 2000) and the Anaerobic Digestion Model (ADM) (Batstone et al. 2002), published by task groups in IWA. These models describe the kinetics and reactions taking place in the biological reactors in wastewater and sludge treatment systems.
Models come in many forms. We can form mental, almost emotional, models of systems spanning from
the very simple to the somewhat complex.
Downloaded from http://iwaponline.com/ebooks/book-pdf/651186/wio9781780407586.pdfby gueston 14 January 2022

109analyse
Many models, including the ones mentioned, are used for design. Increasingly, such models describe the dynamic response to load changes. Furthermore, they are aimed to model the internal behaviour of the process. This means that phenomena that are not directly measurable are also part of the model, such as organism concentrations. It is obvious that these models cannot be truly verified until after the plant has been built and put into operation.
A spectrum of models
A reliable system operation also requires that faults and failures are detected automatically at an early stage. This requires other types of models, to support the detection process. Such models are part of the operator guidance and support system and should give a basis for manual decisions, where operating changes are performed by a human operator, or automatic decisions where an automatic controller is used. The models are closely related to the available measurements and do not necessarily describe all the internal details of the processes. Similarly, models for control are mostly less complex than the models for design. Their purpose is to model as accurately as possible the dynamic relationship between online measurements and control signals. A good control model will also be able to predict the system response for a certain time. This time horizon is related to the response time of the control action.
You may compare modelling with completely different model thinking around cars and car driving. In order to drive the car (or setting up a cruise controller) we need to know the performance of the engine, how fast the car can accelerate and how it can brake. We will then set up a relationship that shows how the speed of the car is influenced by the accelerator. Note that the speed varies with time. Similarly the speed response to a brake has to be known.
On the other hand we need a significantly more complex model of the engine for the design of a new engine. Then we have to know what happens inside the cylinders, the detailed description of the internal combustion. The models are closely related to the available measurements and do not necessarily change the air/fuel ratio, how to obtain a certain compression, and so on.
In other words, we need a whole spectrum of models, depending on the purpose of them.
This is also true for a water or wastewater operation. For example, to control the dissolved oxygen concentration it is important to know how fast the DO concentration will change as a result of air supply changes. However, to design the aeration system, a lot more detailed knowledge is necessary.
A system like a water or wastewater plant can be modelled in many different ways so there is no such thing as one model. The researcher would need a model to absorb the knowledge about the mechanisms and wish to explain the detailed behaviour in various time scales. The designer also needs a model that describes the internal mechanisms of a plant and its various interactions. The control engineer needs a model that can accurately predict the system behaviour over a certain time horizon. Such a model does not necessarily need to explicitly describe the internal behaviour, but does need to relate the measurements and the control signals in a reliable way. The operator would need a model that will relate the measurements to certain key performance parameters. This can be used for monitoring the plant behaviour.
microscopic and macroscopic
Wastewater treatment presents interesting combinations of microscopic and macroscopic challenges. We can only control the system with macroscopic methods, such as flow rates,
Downloaded from http://iwaponline.com/ebooks/book-pdf/651186/wio9781780407586.pdfby gueston 14 January 2022

110 Smart Water UtilitieS: Complexity made simple
air flow rates, recycles, dosing carbon sources and chemicals, etc. Still the consequences can often be seen at the microscopic level, where the organism behaviour is determined by our plant control actions. As an example, we can favour simultaneous nitrification–denitrification depending on the availability of dissolved oxygen and organic carbon. Another example is given from anaerobic digestion. The flocs can be broken up by using ultrasonic devices and the resulting reaction rate will increase. However, we are not sure what is causing the increasing reaction rate. Is it a better contact between organisms and food? Is it because of enzymes being released? One confusing problem is that organisms are also destroyed by the ultrasonic treatment.
system wide models
A major challenge in system wide control is to predict the flow rate and concentrations at important points in the sewer system some time ahead. Dynamic flow predictions should at the same time be used to minimise flooding problems of streets, basements, etc. This will also include the prediction of the influent load (including both flow rate and concentrations) to the wastewater treatment plant. The purpose is to maintain most of the pollution from the system in the basins or the stored water for later discharge via the treatment plant when the plant capacity has become available.
In a water distribution system, the pressure in the water pipes is seldom constant. Instead, it is changing every time the consumption changes, or when a pump starts or stops or a valve opens or closes. This can also be modelled.
model limitations and uncertainty
Some phenomena have still not been captured consistently by models, though progress is made. One example is the phenomena of solids/liquid separation. The solids concentration profile
in one dimension, both above and below the feeding point, can be predicted by dividing the settler into a number of layers. Around each layer a solids balance is developed. In reality the liquid forms more complex flow patterns depending on the influent flow rate and on the boundary conditions of the tank. Computational fluid dynamics can provide a more accurate description. Another challenge has to do with the modelling of the relative settling velocity of the solids in the liquid. This is related to the floc forming process in the biological reactor. The knowledge of the relationship between floc forming and biological activity is quite incomplete. For example, we know that floc surface properties play an important role.
Sludge bulking is a well-known phenomenon that causes large operational problems. Massive growth of filamentous bacteria is often a serious problem in nitrifying plants. In Europe, Microthrix parvicella has been identified as the dominating filament responsible for most bulking and scumming events. Still we have quite an incomplete knowledge about the mechanisms. Still we lack reliable models of the floc formations in combination with the behaviour of the solids/liquid separation with both filamentous and floc forming organisms present.
Hardly any model is perfect. They reflect our understanding of phenomena and can never be more accurate than the measurements allow. Not even Newton’s second law is perfect: it has to be corrected for relativity or quantum effects but is of course satisfactory in the “human” scale of time and space.
There are many factors that will contribute to model uncertainty:
66 Measurement inaccuracy
66 Process noise
66 Parameter values
Downloaded from http://iwaponline.com/ebooks/book-pdf/651186/wio9781780407586.pdfby gueston 14 January 2022

111analyse
66 Structural uncertainty
66 Mode changes
66 Unknown phenomena
Measurements are never perfect. Measurement inaccuracy enters as calibration errors as well as noise added to the measurement. Measurement inaccuracy also depends on the sampling method, sampling location and the analytical techniques being used. The uncertainty is of course even larger if no direct measurements are possible. Another type of uncertainty is “process” noise. As one example, consider the mixing in a tank. We may often assume perfect mixing, while the true concentration has spatial variations in the tank or in the pond. Similarly, aeration may be assumed to be the same along a certain reactor distance, while in reality it is varying along the reactor.
Parameter values are often difficult to estimate, such as growth rates or transfer rates. Often they cannot be determined in separate experiments, since they often depend on the experimental conditions. Furthermore, many parameters are time varying. A parameter like a growth rate will not only depend on temperature, but will be affected by pH changes as well as inhibitors and toxic compounds. The primary reasons can often be hidden.
model changes
Many systems may change behaviour due to new phenomena that may appear more or less suddenly. One example is the growth of filamentous organisms. Before any significant concentration of these organisms is present there is one type of behaviour in the clarifier, and suddenly – as filamentous organisms appear - the settling and clarification will have a different behaviour.
In many water systems with biological activity there are certainly phenomena that we do not
understand or know. For example, we have only a superficial knowledge of the relationship between biological activity and settleability. This adds an uncertainty to the integrated models.
We can note that some of this uncertainty can be eliminated with further knowledge and research. Other kinds of uncertainty will always be there, for example, the varying composition and concentration of influent water.
Dealing with uncertainties
How do we take the consequences of uncertainty? The designer mostly compensates for the uncertainty in the design by adding a safety factor. The control engineer needs to compensate in another way. Uncertainty means that the prediction of various variables is not perfect. As a consequence, the control actions usually become more cautious. A cautious controller will have a smaller gain. As a consequence, the desired process variable will need a longer time to reach the final goal. Control under uncertainty or stochastic control is a special field of control theory whereby the uncertainty is modelled by statistical theory.
In a sophisticated treatment plant, there is a huge data flow from the process. More instrumentation and new instrumentation development will further provide more data. Unlike humans, computers are infinitely attentive and can detect abnormal patterns in plant data. Information technology can be used more to encapsulate process knowledge, i.e. knowledge about how the process works and how to best operate it.
Most of the changes in wastewater treatment processes are slow when the process is recovering from an “abnormal” state to a ‘normal’ state. The early detection and isolation of faults in the biological process are very effective because they allow corrective action to be taken well before the situation becomes unwieldy. Some changes
Downloaded from http://iwaponline.com/ebooks/book-pdf/651186/wio9781780407586.pdfby gueston 14 January 2022

112 Smart Water UtilitieS: Complexity made simple
are not very obvious and may gradually grow until they become a serious operational problem.
Verifying models
Verifying a model to the physical reality is far from trivial. The activated sludge models are represented by various organism and substrate concentrations; each one of them is a state in the model. The organism concentrations cannot be measured on-line and still it is highly desirable to know them. In principle, this can be accomplished by state estimation, where on-line measurements are combined with a process model to find out the current values of the unknown states. A lot of attempts have been made and many estimation methods are available. Most of them are variants of the famous Kalman filter.
Another challenge is to identify model parameters, given on-line (and noisy) measurements. Typically the activated sludge models have many parameters and not all of them can be estimated from plant measurements. Interesting parameters are growth rates of organisms and half rate constants in the growth rate expressions. Given a model having “perfect” measurements it is possible to find out the identifiability of some of these parameters. Given perfect measurements the parameters
can be individually determined, even if they are closely coupled.
A model is seldom valid under all possible operating conditions. For example, if the composition of the influent water changes, then the microbial composition in the wastewater treatment biological reactor will probably change too. This means, that we have to define some way to determine the region of validity for the current model. This is far from trivial. Very seldom a model can be tested under all possible operating conditions.
There is an enormous number of mathematical methods and tools available – from the simple to the complex. Getting experience in using them on various practical problems and applying them on real data will eventually provide a sense of which tools should be applied when and proficiency in getting fast to the interesting parts will eventually be learned. It is like learning carpentry, with practice you will learn how to cut the wood so that the ends fit nicely together, you will learn to hammer a nail without hitting your fingers and eventually you will be allowed to handle the power-tools.
The tools presented here are targeted for water utilities, grouped logically and organised – at least to some extent – on a scale going from the easy to the advanced.
Downloaded from http://iwaponline.com/ebooks/book-pdf/651186/wio9781780407586.pdfby gueston 14 January 2022

113AnAlyse
Figure 4.10: Linear regression.
regression AnAlysis
Regression analysis is a method to determine a formula for the relationship between two variables. Determining this relationship is interesting in many situations. Examples of the applicability in a smart water utility setting could for example be:
66 Determine the relationship between average daily dissolved oxygen concentration and the effluent ammonium concentration with the purpose to find the optimal dissolved oxygen setpoint;
66 Determine the relationship between valve opening and flow through said valve. For example, determining a good control scheme for the valve;
66 Determine the relationship between time elapsed from back flushing a filter until turbidity reaches an acceptable level with the purpose to determine the optimal time to return to normal filter operation.
Linear regression is a simple analysis which aims at determining the best-fit of a straight line between a variable x to predict another variable y. The best-fit could in principle be defined in a variety of ways, however generally it has been agreed upon to define it as the line that minimises the squared errors of prediction.
When prediction errors are defined in this way it is quite straightforward to determine the parameters of the linear regression, as can be seen from the formula. This can easily be calculated manually when having as few data as in this example. However in most cases, and especially as datasets get larger, various software packages can be applied such as for example Excel.
Mostly regressions are calculated in various types of software; however it is instrumental to try it out by hand yourself, to assure you that it is quite simply just adding, subtracting, multiplying and dividing.
To find the best fitting line, calculate the standard deviation of each data set x and the
6
5
4
3
2
1
0
0.5 1.0 1.5 2.0 2.5 3.0 3.5 4.0 4.5 5.0 5.5
f(x) = 0.665x + 1.286
Downloaded from http://iwaponline.com/ebooks/book-pdf/651186/wio9781780407586.pdfby gueston 14 January 2022

114 smArt wAter utilities: Complexity made simple
0 1 2 3 4 5 6
0 1 2 3 4 5 6 0 1 2 3 4 5 6
y = 0.095x5 – 1.14x4 + 4.81x3 – 8.39x2 + 6.29x + 0.32r2 = 0.95
0 1 2 3 4 5 6
Figure 4.11: Various types of regression.
stdev (y)
where stdev(x) =� n –1 Σ (x–E(x))21�
correlation coefficient between the two. It is then possible to find the parameters a and b in the linear equation.
y = ax + b a = r stdev (x) b = mean(y) – a*mean(x) and r = ��
Σ x * y
Σ x2 * �y2
7
6
5
4
3
2
1
0
y = 1.36e0.28x
r2 = 0.90
6
5
4
3
2
1
0
y = 0.019x2 + 0.55x + 1.41r2 = 0.98
6
5
4
3
2
1
0
5.0
4.5
4.0
3.5
3.0
2.5
2.0
1.5
1.0
0.5
0
y = 1.60ln(x) + 1.77r2 = 0.93
Downloaded from http://iwaponline.com/ebooks/book-pdf/651186/wio9781780407586.pdfby gueston 14 January 2022

115AnAlyse
Figure 4.12: Pr incipal components analysis – finding the principal components among three variables.
Figure 4.13: Pri ncipal components – forming clusters around a normal condition.
multiVAriAte AnAlysis
Multivariate analysis is a tool to detect patterns of the operation. Large datasets of a number of variables can be considered as a data “cloud”. This is illustrated in the Figure 4.12, in which the values of three variables are recorded. All the three measurements at one instant make up one point in the cloud. Usually there are many more variables and the space is then multidimensional. Many of the variables are usually correlated, since most of them reflect some underlying mechanisms that drive the process in different ways. For example, consider a flow rate in a pipe. There may be two different measurements indicating the same thing: data from a flow rate sensor and data from a pump speed. The information from these two variables is strongly correlated and one of them may be sufficient to indicate the flow rate. Similarly there are many other measurements that are more or less depending on each other.
Therefore the true dimension of the cloud is usually much less than the number of
measurement signals. By projecting the data cloud on a lower dimension it is often possible to find key variables that can explain the changing behaviour. In the simplest case with two variables, a regression line or curve can represent both of them. In Figure 4.12 most of the variations of the cloud take place along a plane defined by the two orthogonal axes PC1 and PC2. Of course, some data points are located above or below the plane. The distance from the cloud point to the plane (measured along the axis PC3) indicates an error. If the errors are sufficiently small then most of the variations can be explained by only two variables instead of three. Similarly, there may be ten variables that relate to an alarm situation. However, the changing conditions may be explained by only two variables, which are a combination of the ten measurements.
Multivariate analysis had been used for many years in the chemical process industry before it was introduced into the wastewater industry in the late 1990s.
–4 –3 –2 –1 0 1 2 3 4
4
3
2
1
0
–1
–2
–3
–4
DeViation
VariaBle 1
Vari
aBle
2
X1
X2 X3
Downloaded from http://iwaponline.com/ebooks/book-pdf/651186/wio9781780407586.pdfby gueston 14 January 2022

116 Smart Water UtilitieS: Complexity made simple
Under normal operating conditions, the cloud is limited within a certain volume, illustrated by the ellipse in Figure 4.13. In other words: the normal range of all the measurements can be defined. In the figure, a low and a high alarm limit have been indicated. There are different methods available to determine how this volume or surface is defined. Often it is possible to use data under normal operations and define the normal variation as a cluster with a certain centre point. Then, if some variables are deviating from normal, the cloud will move outside the normal volume and an operator can readily detect that something has happened. In principle he will get an automatic detection not only that a single variable has exceeded the permitted amplitude, but that the combination of many signals has crossed an alarm limit. Now the analysis allows backtracking of the data, so that the real physical signals that caused the deviation can be identified. Each one of the variables may have changed within permitted limits, but the combination of their deviations has caused an alarm.
The most well-known multivariate method is Principal Component Analysis (PCA). However, PCA methods are insufficient to deal with data that are highly variable in time, such as influent flow rates and compositions in wastewater systems. The standard PCA assumes that there is a linear relationship between the variables. If there are nonlinear relationships then the PCA has to adapt to this case, in analogy with the simple regression methods above. Furthermore, the wide range of time constants in a wastewater treatment system makes it difficult to look at correlations of data in just one time scale. Consequently, more sophisticated methods have been developed to deal with these challenges. One is called Adaptive PCA. Multi-scale PCA decomposes the measurement data into different time-scales. The various multivariate methods are powerful tools to give the operator an early warning about operation deviations from normal.
HyDrAulic moDelling AnD tHe process of operAting moDels
Hydraulic modelling in water utilities is primarily used in three areas:
66 In drinking water networks
66 In sewer networks
66 In process reactors
Whereas the purpose of modelling of drinking water and sewer networks are primarily related to the flow and pressure of the water at different positions, the modelling of hydraulics in process reactors are mostly applied in order to keep track of the transformation of one compound to another through chemical or biological processes.
For the network modelling, an array of formulas describe the relationship between pressure and flow running in pipes that are either full or partially full, such as Chezy’s, Darcy-Weisbach and the most widely used Manning formulae. Parameters describing quality of pipe surface (smooth or roughness), slope, length of pipe, pipe diameter and the level to which the pipe is full are used in the different formulas. These formulas can be used for calculation by hand.
However when the network becomes large and complex this is not practical. To solve this problem, a number of computer models are available to solve all the formulas. The steps in getting hydraulic models up and running are more or less the same for all types of models:
Downloaded from http://iwaponline.com/ebooks/book-pdf/651186/wio9781780407586.pdfby gueston 14 January 2022

117AnAlyse
1. Build a model of the network
This is done by inserting and connecting the key components, which in drinking water network modelling includes:
66 Water source with flow pattern (one or a few water treatment plants);
66 Water reservoir (e.g. water tower) and tanks with height, position, size, etc.;
66 Water consumers (often hundreds or thousands), i.e. the customers;
66 Pipelines with length, slope, height, roughness;
66 Pumps with pump characteristics;
66 Valves and fittings with water throttling characteristics.
In wastewater network modelling the key components are similarly:
66 Wastewater producers (often hundreds or thousands), i.e. the customers;
66 Rainfall inlets;
66 Pipelines with length, slope, height, roughness;
66 Pumping stations with pump characteristics and tank characteristics;
66 Reservoirs with height, position, size, etc.
2. Apply consumptions or production patterns
For drinking water it means determining water consumption rates at the consumers. For wastewater it means determining wastewater production rates at the customers. For many of the customers in both domains a general pattern can be used to model the general average domestic water behaviour. For industrial usages the consumption pattern may be quite different. In many cases the patterns need to be assumed to have a certain diurnal, weekly and sometimes even annual characteristic – depending on the relevant timescale.
3. running the model
In this step, the model has been setup and is ready to run – at least in principle. However, often various types of run-time errors can be experienced. These need to be corrected before the model can be executed. Generally, in the first run, apply a model that is as simple as makes sense. Often it makes sense to test the model’s ability to execute on a regular basis and not wait
Figure 4.14: The stages of model implementation.
Build a model of the network
Apply consumption and production rates
Run the model
Calibrate the model
Testing scenarios
Downloaded from http://iwaponline.com/ebooks/book-pdf/651186/wio9781780407586.pdfby gueston 14 January 2022

118 Smart Water UtilitieS: Complexity made simple
until every detail is applied. Have patience and don’t panic, all runtime errors will eventually be solved (call a friend if not).
4. calibrating the model
When the first simulation data get out of the model (and you figured out how to plot them) it gets interesting. But you should ask yourself: is this really what I expected the results to look like… approximately? Whether you are surprised by the data or not, it is a very important step to calibrate the simulation output against real data. Often in network systems there is not much data to check against. So often you need to be a bit creative to find things that you can compare your simulated data with. That might by flow or pressure sensor signals in the networks or in tanks and basins. Pump activity logging can also provide you with a clue about whether the simulation is similar to the reality. You may in some cases be limited to steady-state data that is average data over a time span.
The better the real measured data fit the simulated data, the better you can trust the model. The fit between the model and real data does not need to be perfect, actually it rarely is. What is important is:
66 The general levels, such as max, min, average are similar and within an acceptable error margin and;
66 The dynamics are similar, that is, that the same frequencies of the signal should show up both datasets.
If (or in real life: as long as) the simulated and the measured datasets do not fit well enough with each other it is necessary to try to change various parts of the model, however always within the boundaries of the reasonable. It may be that some roughness parameters can be increased or decreased, that you can adjust some consumption patterns, etc. And on many occasions you will find that you have built up the model in a wrong way. These types of information can be important feedback to the utility organisation, as they indicate that the system does not behave as generally believed.
At times you may realise that the real system does not operate as you imagined, and you need to change either the operation or the model, so that the two match each other. This may be a somewhat cumbersome process; however it greatly enhances your understanding of the system.
5. testing out scenarios
When the calibration is satisfactory, it is time to start testing all the interesting scenarios and see how the system can be improved. The improvement can generally be in the form of changed control and operational procedures, i.e. pump and valve control, or it can be in the form of changing the design, i.e. exchanging pipelines to different dimensions, slopes, roughness, increase storage volumes, change pump characteristics, etc.
Care should be taken in modelling to keep the model well calibrated and to document the model thoroughly – and continue to document results as you test different scenarios.
Care should be taken in modelling to keep the model well calibrated and to document the model thoroughly – and
continue to document results as you test different scenarios.
Downloaded from http://iwaponline.com/ebooks/book-pdf/651186/wio9781780407586.pdfby gueston 14 January 2022

119analyse
Documentation
Special attention should be given to documentation – and it is not easy. But it is necessary that you thoroughly document your results. It is tempting to move on and things may get very exciting. But sooner or later you are going to lose your overview if great care is not taken.
Hence, as the model becomes ready for scenario testing, decide on a documentation policy for the scenarios. Such a policy might be:
66 Before running a simulation, describe the exact purpose of the simulation;
66 In this description it is required to define the output that documents the findings and to formulate the questions to be answered;
66 The model used as basis is chosen and documented. It is important to note the critical assumptions in the model;
66 All files from the simulations are organised in a retrievable file structure;
66 Failed simulations are saved and the reason for the failure is noted together with the change of assumptions needed to get it right;
66 As analysis progresses it may be relevant to change the problem formulation. If so, this should be clearly marked together with the reason for this change. The original purpose formulation needs to be updated including required outputs and assumptions;
66 When the answers are available, these should be presented to people with practical experience to double check that the conclusions are not totally off. This may lead to additional simulations;
66 Finally all results should be documented.
sewer system moDelling
Modelling the risk of flooding has become increasingly relevant with the change in rain patterns observed and expected in the future due to climate change. A good way to reach a very practical understanding of the effects of changed rain patterns is to simulate the effect of increased rain intensity.
In many countries forecasts have been prepared based on climate change scenarios that predict the future rain intensities and duration of extreme rains with e.g. 5, 10, 50 and 100 years of return period. These extreme events can be applied in the model and the effect on the city can be seen as illustrated above.
Figure 4.15 shows the effect of a 100 year rain in a small town near Kalundborg in Denmark. Brown colour indicates the water will be 0–10 cm above terrain, red means 10–50 cm and yellow means 50–200 cm. As can be seen from the map, a lot of the water will be limited to the roads, however, in some places the water will flow beyond the road systems and into houses, gardens, etc.
The maps resulting from the simulations can be used to prioritise the preparatory steps to safeguard vital assets. This is a huge undertaking and needs to be prepared years before the extreme events may take place.
combined sewer overflow
Combined Sewer Overflow (CSO) happens when rain intensity is too high for the sewer system to cope with. For this reason overflow weirs have been designed to lead the surplus water, which is a combination of rain and sewer to a place more convenient than directly into the streets, where it would lead to flooding events.
The CSO can be led into storage tanks, but occasionally the volumes become so large that
Downloaded from http://iwaponline.com/ebooks/book-pdf/651186/wio9781780407586.pdfby gueston 14 January 2022

120 Smart Water UtilitieS: Complexity made simple
the water is led into a nearby recipient. When this happens, it is called CSO.
These CSO events can be quite detrimental to the state of the environment in the recipients into which they are led. Obviously, the wastewater will be diluted by the rain, however it often also happens that the first flush increases the amount of suspended solids transported
due to the effect of tearing loose materials that have settled in the sewer system. Therefore, the amount of pollution can be quite serious.
By means of modelling it is possible to investigate the current situation in terms of numbers and amounts of CSO’s into the recipient. It is also possible to test out different strategies to handle these events.
Figure 4.16: Combined sewer overflow (CSO) takes place when the sewer system is full.
Figure 4.15: Example of a simulation of flooding event in Kalundborg, Denmark. The colors illustrates where there is water on terrain in cm (Brown: 0-10 cm, red: 10-50 cm, yellow: 50-200 cm).
Downloaded from http://iwaponline.com/ebooks/book-pdf/651186/wio9781780407586.pdfby gueston 14 January 2022

121analyse
Figure 4.17: Modelling of a pollutant in a water distribution network (will be exchanged with a better picture).
wAter DistriBution networK moDelling
modelling the propagation of a pollution in drinking water
Simulations of pollution incidents in water networks can be helpful both when it has happened and as a preparation for the future possibility of such an incident. Basically, such a simulation calculates the effect of a tracer being injected into the water at some point with a constant concentration or as a one-time shot.
The simulation can show where and how fast the pollution will extend. This obviously depends on flow rate in the system, design of the system and size of the pipelines. By means of such simulation, it may be possible to contain the pollution within a specific section of the network and hence avoid affecting the whole network.
When a pollution incident has happened it can also be used to backtrack the source of the pollution by indicating the positions at which
the polluting substance has been found and then run the simulation backwards in time. Importantly, this may show large areas of the network from which the pollution cannot have originated – which in turn means that the search area for the source is reduced.
As a preparation such simulations can be used to prepare action plans in case of different pollution scenarios.
water leakage and energy consumption
In many water distribution systems, the water pressure is controlled from one or only a few places. In order to ensure sufficient pressure in the periphery of the network, this pressure is set higher than is required in most places of the network.
Maintaining a too high pressure implies using too much energy for pumping and maintaining such high pressure. Additionally, the high
Source of pollutiontracer
–
0.9
0.8
0.7
0.6
0.5
0.4
0.3
0.2
0.1
0.0
Downloaded from http://iwaponline.com/ebooks/book-pdf/651186/wio9781780407586.pdfby gueston 14 January 2022

122 Smart Water UtilitieS: Complexity made simple
pressure causes greater tear on the pipelines, more water is lost through cracks in the pipelines and hence more water is lost overall in the water network.
Modelling shows where overly high pressure is applied and hence provides an opportunity to decrease pressure in parts of the system by means of valves, turbines or booster stations.
Some models can in fact run online on the system and hence adjust the pressure setpoints in different parts of the network dynamically. With the pumping technology using variable speed technology, the pressure generation can be distributed in the pipe network. This approach is becoming increasingly attractive and is implemented in more and more distribution networks. Even if this does not solve the problems of water leakages, it reduces both the probability of and the effect of the leakages.
reActor HyDrAulic moDelling
To understand reactor hydraulics, imagine a reactor that is perfectly (or ideally) mixed. If at some point a drop of a conservative substance, e.g. salt is added to the reactor, then the reactor will at that time have a salt concentration corresponding to the salt being evenly distributed throughout the liquid in the reactor. If non-salty water is flowing through the reactor, the salt will slowly but steadily be washed out of the reactor. The salt concentration will not drop linearly, because the amount of salt transported out of the reactor per unit time decreases as the concentration in the reactor decreases. Therefore the concentration will diminish exponentially. This can also be seen from the dynamic equation describing the concentration as function of time.
Figure 4.18: Following the timely (x-axis) development in water leakage (left y-axis) and energy consumption (right y-axis) is a crucial management tool.
14%
12%
10%
8%
6%
4%
2%
0%
113
112
111
110
109
108
107
1061 2 3 4 5
Water lossEnergy
Downloaded from http://iwaponline.com/ebooks/book-pdf/651186/wio9781780407586.pdfby gueston 14 January 2022

123analyse
Figure 4.19: Fully mixed reactor. The curve shows how the concentration of a tracer substance in the tank develops as function of time when a pulse disturbance has been injected at time 0. It shows that the at time 0 the concentration in the tank is 1 (eg mg/l). As time goes by the clean water streaming into the reactor reduces the concentration in the tank continuously. This is seen as an exponential decline in the effluent concentration of the tracer.
Figure 4.20: Not mixed reactor, i.e. similar to a piece of pipeline . The curve shows how the concentration in the tank at position “1” develops as function of time when a pulse disturbance has been injected at time 0 in the inlet of the pipeline. This type of flow pattern shows the same kind of concentration out of the reactor as the pattern flowing in.
0 1 2 3 4
1.21.00.80.60.40.2
00 0.5 1 1.5 2 2.5 3
1.21.00.80.60.40.2
0
If on the other hand, the salt is dropped into a pipeline system with the same volume but with absolutely no mixing, the peak concentration that entered the water will appear as the same peak some time later at the outlet of the pipeline. The time it will take the water to travel from inlet to outlet is called the retention time and is calculated as the volume divided by the flow rate through the pipeline.
Apparently completely mixed and no mixing are the two extremes of reactor hydraulics. Generally they only appear in theory. In real life, regardless of whether the reactor is mixed or not, the real effluent curve will be somewhere in between the two extremes. An easy way of modelling the reactor hydraulics “in between” the two extremes is by describing the tank as a series of ideally mixed reactors. This means that the exponential outlet of the first reactor is calculated as the inlet
to the next reactor, causing the concentration out of the second reactor to increase at first and then decrease. This outlet characteristic is in terms applied as the following reactor’s inlet concentration profile and so on. Depending on the number of ideally mixed reactors in series, the outlet of the series looks like somewhere between ideally mixed and no mixing at all. Actually, assuming an endless amount of ideally mixed reactors in series leads to the same effluent characteristics as no mixing.
Depending on the lay-out it is possible to calculate more complex assumptions on how the reactors are connected by applying parts of the stream as no mixing (by pass) and others parts of the stream to various levels of mixing.
The modelling can be used for any type of inlet concentration of water and is often combined
Downloaded from http://iwaponline.com/ebooks/book-pdf/651186/wio9781780407586.pdfby gueston 14 January 2022

124 Smart Water UtilitieS: Complexity made simple
with reaction elements, as described in the activated sludge model.
However, if the exact distribution of the substance is important, it is possible to apply computation fluid dynamics (CFD). Current CFD modelling tools can provide a very vivid understanding of how the water is propelled around in the reactor. It is possible to see this as 3D video simulations. Calibrating CFD models are however cumbersome and one should be careful not to be charmed by the nice visuals, they may appear to be true even when they are not.
Figure 4.21: Results showing more and more reactors in series. A very short pulse of concentrated liquid has been injected at time 0. One reactor in series corresponds to an ideally mixed reactor. The more reactors in series the more the response resembles that of no mixing, i.e. a plug flow system.
Figure 4.22: Example of the results from a CFD simulation where sludge height in a water stabilisation pond is modelled (horizontal look) – the inlet is in the upper left corner. See more detailed explanation under cases. CFD is used for many different purposes from hydraulics to aerodynamics, plastic moulding windmill simulations and many more.
0 0.5 1 1.5 2 2.5 3
1.8
1.6
1.4
1.2
1.0
0.8
0.6
0.4
0.2
0
16
8
4
2
1
Time
Conc
entra
tion
Downloaded from http://iwaponline.com/ebooks/book-pdf/651186/wio9781780407586.pdfby gueston 14 January 2022

125AnAlyse
tHe ActiVAteD sluDge moDel
It took a group of engineering researchers five years to develop the first standard activated sludge model, named the ASM1. The first international standard model was published in 1987, later it has been known by the short name ASM1 (Activated Sludge Model no 1). Previously modelling efforts had taken place in various university settings. However this model became a true break-through of modelling of water processes. The ASM1 model describes organic removal as well as biological nitrogen removal via the nitrification and denitrification processes.
Later the ASM1 model has been complemented with:
66 The ASM2 that added biological phosphorous removal to the process matrix;
66 The ASM2d corrects the dynamics of biological phosphorous removal based on new insights regarding the phosphorous accumulation organisms (PAOs);
66 The ASM3 model is a correction to the ASM1 model, hence it is not concerned with biological phosphorous removal, but makes the application of the model easier to calibrate based on data that are more easily available.
These models are the agreed-upon standard models worldwide for modelling wastewater and they are applied intensively at universities (cited in countless articles), to some extent at consulting engineering offices and only a little (but increasingly) at traditional full-scale wastewater treatment plants. They are used for dynamically simulating wastewater treatment plant behaviour.
On the adjacent page you can see the full ASM1 model. The way that this diagram is to be read is as follows:
0 0.5 1
1.0
0.9
0.8
0.7
0.6
0.5
0.4
0.3
0.2
0.1
0
Eight processes (left column) are modelled, starting with Aerobic Growth of Heterotrophs (Heterotrophs are a type of bacteria abundantly present in activated sludge, here they survive by getting energy from a combination of organic matter and oxygen) to Hydrolysis of Entrapped Organic Nitrogen (a process where nitrogen in microbial cells are freed as the dead cells decompose).
These eight processes effects 13 compounds (top row) in the water, from Soluble Inert Organic Matter (i.e. organic matter that is so high in complexity that it will not be degraded by the microorganisms in the activated sludge) to Alkalinity (a parameter related to the acidity of the water, this may be increased/decreased by some of the processes and potentially creating pH problems in the process).
Each process is represented by a process rate (defined in the right column), that are all measured in e.g. mg/l/hour. The production process rates generally consists of a bacteria growth rate times the present concentration of
Figure 4.23: The Monod kinetics describes how a process rate is affected by the presence of a given substance. Process 1 (P1) has a higher process rate as the substabce increases but it flattens gradually. Process 2 (P2) does the opposite, it works well until the concentration of substance gets too high.
p1 p2
Time
Conc
entra
tion
Downloaded from http://iwaponline.com/ebooks/book-pdf/651186/wio9781780407586.pdfby gueston 14 January 2022

126 smArt wAter utilities: Complexity made simple
Table 4.2: The full activated sludge model No. 1 From “Activated Sludge Models ASM1, ASM2, ASM2d and ASM3 by Henze, M. et al, 2000, IWA Publishing. The point of looking at this overview is not so much to understand each detail as to appreciate the complexity of the system and yet also the relative simplicity of the model.
component i
j process
1 aerobic growth of heterotrophs
2 anoxic growth of heterotrophs
3 aerobic growth of autotrophs
4 ‘Decay’ of heterotrophs
5 ‘Decay’ of autotrophs
6 ammonifi cation of soluble organic nitrogen
7 ‘Hydrolysis’ of entrapped organics
8 ‘Hydrolysis’ of entrapped organic nitrogen
observed conversion rates [Ml–3t–1]
Stoichiometric parameters:
Heterotrophic yield: YH
autotrophic yield: YA
fraction of biomass yielding
particulate products: f �
Mass n/Mass coD in biomass: iXB
Mass n/Mass coD in products from biomass: iXP
Solu
ble i
nert
orga
nic m
atte
r [M
(coD
)l–3
]
read
ily b
iode
grad
able
subs
trate
[M(c
oD)l
–3]
parti
cula
te in
ert o
rgan
ic m
atte
r [M
(coD
)l–3
]
Slowl
y bi
odeg
rada
ble s
ubstr
ate [
M(c
oD)l
–3]
activ
e het
erot
roph
ic bi
omas
s [M
(coD
)l–3
]
activ
e aut
otro
phic
biom
ass [
M(c
oD)l
–3]
parti
cula
te p
rodu
cts a
risin
g fro
m b
iom
ass d
ecay
[M(c
oD)l
–3]
oxyg
en (n
egat
ive c
oD) [
M(c
oD)l
–3]
ri = Σ j�i j� i
1
SI
2
SS
1
3
XI
4
XS
1–fP
1–fP
–1
5
XB,H
1
1
–1
6
XB,A
1
–1
7
XP
fP
fP
8
SO
– YH
1
– YH
1
– YH
1– YH–
– YA
4.57– YA–
Downloaded from http://iwaponline.com/ebooks/book-pdf/651186/wio9781780407586.pdfby gueston 14 January 2022

127AnAlyse
proceSS rate, �i [Ml–3t–1]ni
trate
and
nitr
ite n
itrog
en [M
(n)l
–3]
nH4+ +
nH 3 n
itrog
en [M
(n)l
–3]
Solu
ble b
iode
grad
able
orga
nic n
itrog
en [M
(n)l
–3]
parti
cula
te b
iode
grad
able
orga
nic n
itrog
en [M
(n)l
–3]
alka
linity
– M
olar
uni
ts
Kinetic paraMeterS:Heterotrophic growth and decay:µH , KS , KO,H , KNO , bH
autotrophic growth and decay:µA , KNH , KO,A , bA
correction factor for anoxic growth of heterotrophsηg
ammonifi cationkS
Hydrolysiskh , KX
correction factor for anoxic hydrolysis:ηh
– 2.86YH
1– YH
9
SNO
10
SNH
–iXB
–iXB
–iXB
1
11
SND
–1
1
12
XND
iXB – fP iXP
iXB – fPiXP
–1
13
SALK
– YA
1
YA
1
14*2.86YH
–iXB/14
1– YH
14
iXB–
–14
iXB–7YA
1
141
�H � �gXB,H( )( ) ( )SS
KS + SS( )( )KO,H
KO,H + SO( )( ) SNO
KNO + SNO( )
( )( )�A XB,A
SNH
KNH + SNH( )( ) X( )( )SO
KO,A + SO( )( ) X( )( )
( )( )�H XB,H
SS
KS + SS( )( ) X( )( )SO
KO,H + SO( )( ) X( )( )
bA XB,H
bH XB,A
kASND XB,H
��(XND / XS )
kh [( ) ( )( )]SO
KO,H+ SO[( ) ( )( )]KO,H
KO,H+ SO[( ) ( )( )]SNO
KNO+ SNO[( ) ( )( )]XS /XB,H
KX +(XS /XB,H)+�h XB,H
Downloaded from http://iwaponline.com/ebooks/book-pdf/651186/wio9781780407586.pdfby gueston 14 January 2022

128 smArt wAter utilities: Complexity made simple
Fig ure 4.24: The IWA COST benchmark wastewater treatment plant layout.
anoXic(1000 M3)
anoXic(1000 M3)
aeroBic(1333 M3)
aeroBic(1333 M3)
aeroBic(1333 M3)
bacteria and then reduced a bit according to the presence or absence of such as oxygen, easily degradable organics etc. These are expressed by means of the Monod Kinetics term, where a “half-velocity constant” defines when the process rate is reduced to the half. Besides the Monod is a smooth curve that ensures computational performance and is not too far away from what is measured in experiments.
For each of the compounds a parameter signifies how much this parameter is changed when the process develops with time. For example the aerobic growth of Heterotrophs is obviously affected by a factor 1. For the readily biodegradable substrate the factor is -1/YH. This means that while the bacteria multiply the substrate is reduced (negative parameter). The YH factor is a yield coefficient, meaning how much bacteria mass is produced per substrate consumed.
tHe BencHmArK moDel
Inspired by the successful application of the Kodak Tennessee Eastman plant model which has been applied in chemical engineering for comparison of different operational strategies here, a group of researchers working together in a EU-COST program devised a model based wastewater treatment plant. This
COST benchmark treatment plant does not exist in reality, it only exists as a definition of a “standard” plant in various benchmarking software.
The purpose of the benchmark model is to have a platform that can be used across engineers and researchers to compare different control strategies.
The COST plant is defined as a recirculation plant (also known as a pre-denitrification plant) with five ideally mixed tanks in series: the first two being anoxic (denitrification) and the three following being aerobic (nitrification) followed by a sedimentation tank modelled as a ten layered model and connected with flows, as shown in Figure 4.23.
A two week influent water flow file and pollution concentration file has been defined as well as selection of the various kinetic parameters.
Based on this model set-up and the IWA ASM models it is possible to simulate various control strategies to see the effect in terms of, for example, effluent pollution concentration, energy consumption and much more. See example of a one-week period of simulation with nitrification controller in the schematic at the bottom.
Downloaded from http://iwaponline.com/ebooks/book-pdf/651186/wio9781780407586.pdfby gueston 14 January 2022

129analyse
Figure 4.26: Example of results from a controller simulation using the IWA COST benchmark.
Figure 4.25: The IWA COST benchmark influent flow and nitrogen concentration.
0 2 4 6 8 10 12 14
3.5
3
2.5
1
1.5
1
Influe
nt Flo
w
(m3/
day)
x 104
0 2 4 6 8 10 12 14
60
50
40
30
20
10Influe
nt am
moniu
m co
ncen
trate
(m
g/l N
H4-N)
DaYS
0 1 2 3 4 5 6 7DaYS
20
18
16
14
12
10
8
6
4
2
0
Ammo
nium
and D
O co
nc. (
ml/l
)
ammonium outlet aerobic reactor (mg/l nH4-n)Do concentration (mg/l)ammonium effluent secondary settler (mg/l nH4-n)Setpoint (mg/l nH4-n)
The purpose of the benchmark model is to have a platform that can be used across engineers and
researchers to compare different control strategies.
Downloaded from http://iwaponline.com/ebooks/book-pdf/651186/wio9781780407586.pdfby gueston 14 January 2022

130 Smart Water UtilitieS: Complexity made simple
PERFORMANCE MEASURES Performance measures can be used as an
important way of communicating how well
a given water utility is doing according to
relevant parameters, which the utility can define
for itself; or which are agreed upon with other
utilities. Performance measures tell everybody
within the organisation or outside how well
things are going. It is possible to set goals for
a certain performance and then find means to
reach the goal.
Key performAnce inDicAtors
Gauging the success of a water utility is not so obvious. It is not a traditional company progressing by generating increased revenue and profits. The monopolistic nature of the utility makes the question of when to celebrate success unclear. One way of clarifying this is the setting and reaching of goals. In water utilities, the goals can be divided in two groups: (1) the repeated achievement of continuous operational goals and (2) the achievement of strategic goals that are renewed as old goals are reached. To track especially the operational goals, the use of performance indicators is beneficial, both in the sense that it clarifies what constitutes success and it gives a way of tracking the success. Such performance indicators are also useful for the setting and reaching of strategic goals, as strategic goals are often set in order to achieve threshold shifts in the “operational goals”.
Performance indicators are well established in financial processes, such as revenue, operational expenses, capital expenses, asset value, etc. Some performance measures also exist in the technical domain such as for example regulatory compliance to effluent water quality criteria. However, besides the regulatory constraints, the application of performance indices in the technical area is generally not part of standard management in most utilities – but it ought to be.
A performance indicator indicates or preferably summarises the performance of a process in the utility. For each process in the water utility, one or more performance indicators can be defined. Performance indicators can be thought of in different categories:
leading and lagging indicators
Lagging indicators inform you about the historic performance of a process; it is well suited for celebrating successful operation and making sure that goals have been achieved. Lagging
Downloaded from http://iwaponline.com/ebooks/book-pdf/651186/wio9781780407586.pdfby gueston 14 January 2022

131analyse
indicators are defined to assess by looking in the “rear mirror” at what has happened. Important as that is, nobody will claim that looking out of the front window is not at least as important. Leading indicators try to predict future performance. An example of a lagging indicator in a wastewater treatment plant is the effluent water quality compliance measure. An example of leading indicators could for example be that equipment is sufficiently maintained or that bacterial activity in the basins is maintained at a sustainable level.
Quantitative and qualitative indicators
When most people think of a performance indicator they see for their inner eye a number that is graphed and followed over time – and most indicators are defined as such. However not all indicators are quantitative and force-fitting them into that is not always a good thing. One example is process robustness, i.e. the control system’s ability to keep the process within normal and preferable operation. Another important aspect is agility, i.e. the system’s ability to react to sudden disturbances, such as toxic events or extreme rain events. However, in order to be able to track them, some indicator needs to be invented or identified. The application of subjective evaluation can even be of great value if more people need to agree on the scores. The disagreements in these discussions may be the needed spotlight on problems that would otherwise not be identified.
input, output and process indicators
Input indicators measure the consumed resources of a process, while output measures the result of a process. Process indicators attempt to
combine the two and measure the efficiency of that process. Generally it is not enough just monitoring efficiency. Keeping track of inputs and outputs separately is necessary as well. Many times we believe that people by experience and over time reach an approximate feeling for these things. However, again and again, employees in one department are very surprised when they understand just how many chemicals or how much energy is actually consumed. Converting the read-outs from hundreds of electricity consuming pumps into something comparable, such as, e.g. the amount of household electricity consumption, is not done automatically. But it really needs to be done and the numbers need to be communicated clearly in order to give any meaning. Thinking in abstract terms like: “I know the pumps use a lot of energy” is not truly helpful.
Different indicators are relevant to different people
When working systematically with performance indicators, it is important to be aware that all indicators are obviously not equally relevant to all. So when key performance indicators are selected of the hundreds of possible performance indicators, one should ask: “key to whom?” Obviously, there are indicators that are relevant to the overall performance of the utility, so these will be the key to top management. But on many of these parameters employees will have only little or very indirect influence; if so, they will not be particularly interested in these parameters. Hence it may make good sense to also use device performance indicators for each department or even groups within the department; in some cases, even personal performance indicators may be relevant, though that is more in the league of people management than “utility management”.
Performance measures tell everybody within the organisation or outside how well things are going.
Downloaded from http://iwaponline.com/ebooks/book-pdf/651186/wio9781780407586.pdfby gueston 14 January 2022

132 smArt wAter utilities: Complexity made simple
Table 4.3: One example of a consistent way of organising the KPIs across the full urban water cycle.
Water source
Water treatment
Water distribution
Wastewater collection
Wastewater treatment
Wastewater recipient
UTILITY
Suffi ciency of source
Quality of source, e.g. salt intrusion in groundwater
Energy cost
Chemicals consumptionMaintenance cost
Energy cost
Water loss due to leakage
Maintenance cost
Energy cost
Maintenance cost
Combined sewer overfl ow events
Performance of each major unit in the treatment process measured by means of effl uent water quality
Resource consumption at each unit process
Production of resources such as energy from biogas or thermal energy from effl uent water
CUSTOMER
Reliability, no water production stops Water quality, i.e. no E. coli bacteria, acceptable water hardness, …
Satisfactory fl ow and pressure
Satisfactory water quality
Risk of fl ooding during extreme rain events
Problems with collapsing pipework and other malfunctions
CSO to beaches and hence problem with bathing water quality
Problem with recipient water quality leading to problems for people, i.e. bathing water, fi shing water, sailing water
ENVIRONMENT
Ecological quality of source, e.g. suffi cient river fl ow
CO2 emission due to energy consumption
Water pollution, i.e. due to membrane concentrate to be disposed
Solid wastes, i.e. chemical sludge from fl occulation
CO2 emission due to pumping
Unwanted substances from pipeline material
Ecological problems due to combined sewer overfl ow (CSO) into lakes, rivers and oceans
CO2 emission due to pumping
CO2 emission
Final product quality which determines the load on the recipient
Recipient water quality
Biodiversity reduction due to poor effl uent wastewater quality
Downloaded from http://iwaponline.com/ebooks/book-pdf/651186/wio9781780407586.pdfby gueston 14 January 2022

133analyse
Hence it may be helpful to think of performance indicators as a hierarchy, in which indicators at the lower level somehow support upper level performance indicators.
Aspects
Keeping to technical performance indicators, Table 4.3 illustrates a way of working with indicators across the full water utility cycle but within different aspects. A low number of aspects are actually helpful in order to help communication and get an overview of the performance indicator structure. Having the structure of indicators relating to three aspects is often a good model: to the utility operational cost, to the customers experience and to the environmental impact.
Note that if there are too many aspects, each aspect will only account for a very small part of the performance of the utility, and at some point it becomes of insignificantly small importance. This does not mean that it is not important, but maybe it can be handled without the administrative trouble of tracking performance indices? One should be be realistic.
BencHmArKing
The purpose of benchmarking is to get an idea about the performance of one company (in this case a utility) compared to others. This could in principle be seen as an attempt to apply the same KPIs to more utilities and see how they score in comparison. There are in principle many utilities with more or less the same purpose, so it should be relatively easy – one would imagine. However it has been shown to be much more difficult than imagined. At least, it is difficult to say who is better. After all, the utilities are different in several ways that makes them difficult to compare. Some of the ways in which they are different are:
66 Proportion of industries in their network leads to different treatment processes;
66 Topography means significantly different pumping costs;
66 Comparisons that are based on the volume of water may have quite different starting water quality, which leads to different costs of treatment;
66 Looking at financial comparisons of, e.g. cost per m3 may be very difficult depending on the emphasis that is laid on maintenance or on investments in equipment of pipelines. Obviously, for a while, the expenses will go down if maintenance and investments are neglected;
66 The natural recipients, their quality and quantity very much influence both investment and capital costs of the utility.
That said, there are performance parameters, regardless of these differences, that are interesting to observe and follow. Denmark has over several years followed a number of parameters between 60+ utilities. Each individual parameter does not say so much about overall performance, but the statistics around it are interesting to understand as it clarifies issues around own identity compared to the other utilities.
renewal of sewer systems
Consider how much is spent annually on renewal of the sewer system. It is both interesting and surprising to see that the expenses vary from 0.1% to 2.5% – which is actually a world apart. Assuming an average lifespan of sewer systems of 50 years that would require an annual renewal rate of 2%. Hence it is interesting to get into a dialogue with other utilities about the difference here – and obviously there could be a lot of different reasons for the differences.
Downloaded from http://iwaponline.com/ebooks/book-pdf/651186/wio9781780407586.pdfby gueston 14 January 2022

134 Smart Water UtilitieS: Complexity made simple
non-revenue water
Another interesting statistic is to see the difference in non-revenue water in drinking water supplies. Again, the difference from top to bottom performance is striking, i.e. 1% to 20+%.
Amount of bacteriological samples
A favourite parameter seen from a Smart Water utility perspective is the amount of bacteriological samples taken compared to
the legislational minimum. Looking at these statistics, it is clear that many utilities are purely leaning against the minimum demand, this obviously only gives a certain minimum water quality safety level. But then approximately two-thirds of the utilities choose to measure more – all the way up to 15 times what is required.
These benchmarking exercises give the utilities something to compete around, but also gives the customers a point of reference for the service they are rendered. 6
The purpose of benchmarking is to get an idea about the performance of one utility compared to others.
Downloaded from http://iwaponline.com/ebooks/book-pdf/651186/wio9781780407586.pdfby gueston 14 January 2022

135analyse
0 1 2 3 4 5renewal rate %
6.34%
10.96%
langelandffV
rebildarwos
nyborgSvendborg
VardeVandcentre S
Holbækegedal
ringstedaalborgroskilde
StruerSlagelse-Kor
furesøringk.-Skj.
StevnsHerning
provasViborg
MiddlefartBallerupVestfors.
Greve SolrødSilkeborg
aarhustårnby
Helsingørassens
fr. BergSc avedøre
randersHørsholm
Jammerbugtodsherred
Kalundborgfredensborg
HalsnæsGribvand
lyngby-taarbfr. HavnSyddjurs
thistedesbjerg
GolstrupSorø
rudersdalHedensted
SkiveSønderborg
HjørringKøge
Hofor Kbh.fredericia
Skanderborgikast-Brande
MariagerfiHorsens
favrskovallerød
GladsaxeBornholmnæstvedGentoftefr. Sunde
KertemindelollandMorsø
tønderSimpelt gns.Vægtet gns.
ikastfr. Berg
Mariagerfj.Verdo
nyborgHjørring
Viborgegedal
SilkeborgSkanderborg
GlostrupesbjergtønderaarhusStruer
Vandcenter S.Gladsaxe
Sorøfr. Sund
KalundborgVestfors.BallerupHorsens
ringk.-Skj.fredensborgSønderborg
Hørsholmassens
lyngby-taarbroskilde
Svendborgtårnby
HelsingørHerning
Hofor Kbh.Skive
aalborgfr. Havn
Vardeprovas
ffVodsherred
lollandringstedGrinstedtrefor
arwosthistedHolbæk
GentofteBornholm
MorsøKøge
Slagelse-Korlangelandrudersdal
HalsnæsKerteminde
Simpelt gns.Vægtet gns
0 5 10 15 20% Waterloss
m3/km/day2 4 6 8
Figure 4.27: Annual renewal rate in green (%) and average age (years) in yellow of a selection of Danish utilities’ sewer systems (source: Danva)
Figure 4.28: Water loss in water distribution network in blue (%) and specific water loss in (m3/km/day) in light blue
Downloaded from http://iwaponline.com/ebooks/book-pdf/651186/wio9781780407586.pdfby gueston 14 January 2022

136 Smart Water UtilitieS: Complexity made simple
Figure 4.29: Consumption of electricity at drinking water utilities in kWh/m3 sold water. Dark blue denotes the production; light blue denotes the distribution.
HørsholmGladsaxe
tårnbylyngby-taarb
MorsøHofor Kbh.Vandcentre S
BallerupSilkeborgGlostrupfr. Berg
Verdoaalborg
Grindstedesbjerg
fredensborgKerteminde
roskildeSorø
thistedSønderborg
HerningVarde
Vestfors.nyborgassens
ringstedringk.-Skj.
egedalSvendborg
fr. Sundarwos
lollandHelsingørGentofte
BornholmMariagerfj.
StruerikastKøge
KalundborgffV
Holbækaarhus
SkiveSkanderborg
treforHjørring
langelandViborg
rudersdalSlagelse-Kor
provastønder
fr. HavnHorsens
odsherredHalsnæs
Vægtet gns.Simpelt gns.
0.0 0.1 0.2 0.3 0.4 0.5 0.6 0.7 0.8 0.9 1.0kWh/m3 sold water
production Distribution
Downloaded from http://iwaponline.com/ebooks/book-pdf/651186/wio9781780407586.pdfby gueston 14 January 2022

137analyse
Figure 4.30: Left figure – Consumption of electricity at wastewater utilities in kWh/m3 “sold” water for distribution purposes (lower axis scales). Right figure – Consumption of electricity at wastewater utilities in kWh/m3 “sold” water for treatment purposes. The yellow dots denote the percentage of produced electricity compared to bought electricity (upper axis scales).
KertemindeHørsholm
tønderGreve Solrød
Måløvlynetten
Helsingøraarhustårnby
rudersdalaalborg
Kalundborgfredensborg
randersSyddjurs
VardeHorsens
ikast-Brandelolland
ffVViborg
Sc avedøreringsted
SkanderborgSønderborg
BornholmHerning
egedalStevns
Vandcenter SMiddlefart
roskildeesbjergStruer
Vestfors.Køge
Mølleåværketlangeland
favrskovHjørring
odsherredSorø
Silkeborgallerød
ringk.-Skj.arwos
Mariagerfj.Svendborg
assensHedensted
Skivefr. Havn
provasHolbæk
Gribvandfr. Sund
fredericiaMorsø
Slagelse-KornæstvedHalsnæsnyborgthistedfuresø
Jammerbugtrebild
Simpelt gns.Vægtet gns.
0.0 0.5 1.0 1.5 2.0 2.5kWh/m3 sold water in the network of the plant
% own production of electricity15 30 45 60 75
GolstrupBallerup
lyngby-taarbSc avedøre
GladsaxeGreve Solrød
fr. Bergallerødesbjerg
Vandcenter S.fredericia
Vestforsaarhus
HerningHofor Kbh.
HørsholmGentofteHorsens
KøgeSlagelse-Kor
rudersdalaalborgegedal
fredensborgfr. Sund
ViborgHolbæk
fr. HavnStruer
favrskovtønder
Silkeborgfuresø
roskildeodsherred
Kalundborgringk.-Skj.
Skanderborgassensprovas
nyborgGribvand
Varderanders
rebildMiddlefart
næstvedHalsnæs
Sønderborgtårnbylolland
SyddjursBornholm
StevnsSvendborg
SorøJammerbugt
Hjørringringsted
thistedikast-Brande
MariagerfjHelsingør
arwosHedensted
SkiveKertemindelangeland
MorsøffV
Simpelt gns.Vægtet gns.
0.0 0.5 1.0 1.5 2.0 kWh/m3 sold water in the network
transport (kWh/m3)
cleaning (kWh/m3)part of own production
of electricity (%)
Downloaded from http://iwaponline.com/ebooks/book-pdf/651186/wio9781780407586.pdfby gueston 14 January 2022

138 Smart Water UtilitieS: Complexity made simple
Figure 4.28: Microbiological samples taken compared to required amount (%)
arwosGrinstedlollandMorsø
ringk.-Skj.Skanderborg
SorøVestfors.
thistedVerdoStrier
fr. BergHjørring
VardeSkive
Halsnæsrudersdallangeland
tårnbyBornholm
Kertemindetønder
Glostrupodsherred
egedalesbjergassens
ffVfr. Havnnyborg
SønderborgMariagerfj
fredensborgaalborg
HelsingørHolbæk
lyngby-taarbViborg
fr. SundKalundborg
Køgetrefor
Silkeborgroskilde
ikastringstedGentofte
Slagelse-KorVandcenter S
HorsensGladsaxe
provasHørsholm
aarhusBallerupHerning
SvendborgHofor Kbh.Vægtet gns.Simpelt gns.
0 200 400 600 800 1000% in relation to the requirements
1.018%3.095%
Downloaded from http://iwaponline.com/ebooks/book-pdf/651186/wio9781780407586.pdfby gueston 14 January 2022

139analyse
There are numerous books and papers on analysis, so here we just mention a few that can serve as “entry points” into more literature. The first papers in water and wastewater applications appeared in the 1970s and discussed data handling, error corrections and basic signal filtering. The ultimate aim of all the papers is to ensure data quality.
An excellent summary of the ideas of data screening, filtering and multivariate methods is found in Rosen, C. (1998). Monitoring Wastewater treatment systems. Licentiate Thesis, Dept. of Industrial Electrical Engineering and Automation (IEA), Lund University. Available at http://www.iea.lth.se/publications/Theses/LTH-IEA-1019.pdf
A most readable text on multivariate methods is found in MacGregor (1997) Using on-line process data to improve quality: challenges for statisticians. International Statistical Review 65(3), 309–323.
A most readable introduction into multivariate monitoring is found in Rosen, C. (2001) A chemometric approach to process monitoring and control. PhD Thesis, Dept. of Industrial Electrical Engineering and Automation (IEA), Lund University, chapter 3. Available at http://www.iea.lth.se/publications/Theses/LTH-IEA-1022b.pdf.
Rosen also provides a description and insight into why some of these methods have failed and also gives guidance on how to adapt the use of the methods for wastewater treatment operations.
Statistical process control, applied for wastewater treatment systems was applied by Chapman, D.T. (1998) Statistics for treatment plant operation, in: J.F. Andrews (Ed.), Dynamics and Control of the Activated Sludge, Water Quality Library, Vol. 6., Technomic Publishing Company, Inc., Lancaster, Pennsylvania, USA.
In Olsson, G., Nielsen, M., Yuan, Z., Lynggaard-Jensen, A., Steyer, J.P. (2005) Instrumentation, Control and Automation in Wastewater System, IWA Publishing, London, chapter 10 is devoted to signal analysis and fault detection.
The textbook, Olsson, G. and B. Newell (1999) Wastewater Treatment Systems. Modelling, Diagnosis and Control . IWA Publishing, London, contains several chapters on monitoring, detection and diagnosis.
There is a vast literature on data analysis and there are literally hundreds of books covering various parts of it. Furthermore, several books on elementary data analysis are freely downloadable from the internet.
It is important to emphasise that there is a lot of freely available, but also commercial, software for data analysis. All the methods described here can be executed on some available software. Software like Excel can be used for a lot of elementary data analysis, while more sophisticated software such as Matlab (http://se.mathworks.com/) or SAS (http://www.sas.com) contain a multitude of data analysis methods.
More on the Danva benchmarking system can be found at www.danva.dk – an English version is also available.
Henze, M., Gujer, W., Mino, T., and van Loosdrecht, M. 2000. Activated Sludge Models ASM1, ASM2, ASM2d and ASM3. Scientific and Technical Report, No. 9, IWA Publishing, London.
Batstone D.J., Keller, J., Angelidaki, I., Kalyuzhnyi, S.V., Pavlostathis, S.G., Rozzi, A., Sanders, W.T.M., Siegrist, H. and Vavilin, V.A. 2002. Anaerobic Digestion Model No. 1. Scientific and Technical Report No. 13, IWA Publishing, London.
More to read on analysis
Downloaded from http://iwaponline.com/ebooks/book-pdf/651186/wio9781780407586.pdfby gueston 14 January 2022

The important thing about decisions is
That you make them before you must
To lead is to make right-minded decisions
To react is to wait
Until only one option is available
Your largest obligation is to make good decisions
Decisions that will serve the common good
But the important thing about decisions is
That you make them before you must
Downloaded from http://iwaponline.com/ebooks/book-pdf/651186/wio9781780407586.pdfby gueston 14 January 2022

decide5
Downloaded from http://iwaponline.com/ebooks/book-pdf/651186/wio9781780407586.pdfby gueston 14 January 2022

142 smarT WaTer uTiliTies: Complexity made simple
While the analysis tool box is concerned with transforming all available data into actionable information, the decision tool box is concerned with transforming the aspirations of the utility into decisions, which in turn will result in actions and hence affect the urban water system.
These changes can be for the benefit of various stake-holders in the water system, causing either improvements or the opposite to the stakeholders’ interests. Some changes may lead to improvements both of the system and of the economy – at least after the course of some years. Other changes may not lead to any visible economic advantage; however, these changes may be necessary to avoid risks that would lead to economic losses later on.
Yet other projects may bear only economic costs while leading to improvements in the environment, in customer service or in other more intangible domains that do not seem to have a clear cost–benefit balance. Hence these decisions may be difficult to take and to defend afterwards. These decisions may in fact have very good payback in terms of benefits, but since the benefit is not easy to translate into money, they have a tendency to not be prioritised appropriately.
The purpose of a strategy is to facilitate this prioritisation and decision process. A strategy can be thought of as a scaffolding structure that makes the intangible aspirations tangible and actionable. Strategy work starts with clarifying visions of the future system of utilities. As for all other businesses and organisations, utilities need to re-invent themselves from time to time. To really ask the hard questions of identity: why are we here and what do we need and wish to achieve.
Some of the answers to these questions may be straightforward, such as “clean water for all”, but when coming across questions that are more difficult to answer, it often indicates
The decision Tool BoX
Decision making tools
control loop level
Autiomatic control
unit control level
Autiomatic control or
manual control
plant-wide control level
Operatinal decision making
strategic level
Strategic decision making
seconds
minUTes
hoUrs
days
monThs
years
As for all other businesses and organisations, utilities need to reinvent themselves from
time to time. To really ask the hard questions of identity: why
are we here and what do we need and wish to achieve.
Downloaded from http://iwaponline.com/ebooks/book-pdf/651186/wio9781780407586.pdfby gueston 14 January 2022

143decide
that some stakeholder interests have not been considered deeply. So, after asking the big “why” and understanding what role the utility plays in the lives of each stakeholder and what guiding principles should apply, these are to be translated into more and more detailed and concrete decisions.
So the strategy scaffold has at its top the strategic purpose, hopes, aspirations and visions. These have to be translated all the way down to decisions of which projects to embark upon of the many hundreds or thousands projects possible, how to carry out the projects, i.e. the design of things and all the way down to how to operate the system and all the subsystems. It finally ends with making decisions on the level of opening or closing of valves and starting and stopping of pumps.
This process is generally thought of as a top-down process. However, in reality it is a process that runs up and down the scaffolding ladders. It is often in the practical real world that decisions need to be taken, which will lead to questioning the above strategic directions. These questions require a concretisation and interpretation of the strategic intent. Most often, more or less detailed analysis needs to support the decisions, an analysis based on data.
So to make the really good decisions, that actually lead the utility into the desired direction, the strategic framework and more or less all decisions will benefit from a “Smart utility” approach, so that decisions do actually have a real chance of having the intended effect. “Smart Water utilities” have through their strong ability to sense the world through sensors and other measurements and through the refined
analysis, a clearer view of the current situation. By matching this with a clear vision, a real high quality impact can be made.
At the top level, a strategy deals with decision making that typically spans a few years (1–5 y) but will impact the utility for much longer time, even decades. Here decisions on extending and renewing important to the infrastructure are taken.
The second level includes more operational decisions so as to make the infrastructure work in an effective and efficient way. This may include minor changes to the system, adding of sensors or controls and stating the general operational strategy.
Below this level is the plant-wide control level, which is a semi-automatic system that optimises the different unit processes towards each other and leads the plant operation as close as possible to plant-wide optimum operation.
At the bottom level is the automatic control that consists of hundreds of local controllers keeping simple processes in control at all times. Often, very little attention is paid at this level after installation – though it pays off to check them once in a while. Actually, in more complex systems there is a supervisory computer that keeps track of the performance of each one of the performances of individual control loops. The lowest control level corresponds to the body’s lowest levels of controllers handling breathing, walking, running, holding things, etc. To which we do not pay much attention – at least as adults. However, our sophisticated bodies will immediately raise the alarm if some of the basic functions should fail.
So the strategy scaffold has at its top the strategic purpose, hopes, aspirations and visions. These
have to be translated all the way down...
Downloaded from http://iwaponline.com/ebooks/book-pdf/651186/wio9781780407586.pdfby gueston 14 January 2022

144 Smart Water UtilitieS: Complexity made simple
forget to spend enough time on understanding and explaining the motivation for the strategy. Simon Sinek proposes in his now famous TED talk (www.ted.com) that organisations need to start with the “big why”. Why do we get up early in the morning and head to the utility and why should anybody care?
Understanding and articulating the “why” of the utility may seem obvious, but asking around in the organisation reveals that there are so many reasons. So the question when setting the strategic direction for the utility is to decide which of the many whys are the guiding star of this particular utility. This means articulating the belief system that is the basis of the utility. There are so many valid, powerful and engaging opportunities for such a message – the job is to spend time together to identify the driving why or whys and to find an engaging way of articulating them in the local community.
Such a communication and potential dialogue may also help change the prevalent discussion with the local community from an all-to-frequent focus on complaints, bills and shut off of service into something more fruitful and visionary. A good indicator of whether a statement really explains the “why” is to start it with “We believe…”. This page contains examples of “We believe… “-statements.
When reading through these it is clear that the choice of why may alter priorities significantly.
strategic decision making In strategic decision making the long-term
decisions are taken. Strategy is about
organisation identity, and establishing
leadership in specific areas and in a specific
way. It is about what goals we set for ourselves
and the development we hope to achieve. It is
all too easy not to take this decision and not lay
out a plan. Like Alice asking the Cheshire cat:
“Would you tell me, please, which way I ought
to go from here?”
“That depends a good deal on where you
want to get to.”
“I don’t much care where –”
“Then it doesn’t matter which way you go.”
Lewis Carroll, Alice in Wonderland
Downloaded from http://iwaponline.com/ebooks/book-pdf/651186/wio9781780407586.pdfby gueston 14 January 2022

145decide
Figure 5.1: Example of visions
…the job is to spend time together to identify the driving “why”
Downloaded from http://iwaponline.com/ebooks/book-pdf/651186/wio9781780407586.pdfby gueston 14 January 2022

146 Smart Water UtilitieS: Complexity made simple
Many different tools for working up a strategy have been developed for businesses and organisations. The tools represent different ways of looking at a strategy, the decision scaffold.
The tools offer different perspectives and highlight different aspects. Hence, choosing to apply one strategy tool over another may lead to quite different ways of defining and formulating the strategy.
Much information and many refinements of the different tools are available in books and on the internet; hence the purpose of this chapter is to give an idea of the variety of tools and a short introduction to the route of strategic thinking in a few useful tools.
Tools for developing sTraTegies
To ensure that a good strategy results from a strategy process it is important to carefully consider the methods for developing the strategy. In the old days the strategy was formulated by one or a few persons, but to enable a process whereby valuable inputs and ideas are collected from a larger part of the organisation, methodology and tools are central to keep the overview and for the process not to result in a poor strategy.
A strong top-down approach to strategy may be too simplistic as too few perspectives are considered. Considering all perspectives in a consensus based way may also prove limiting as there are few things that everybody agrees upon. So a good middle way is sought, in which the strategy can be both bold and based on a wide array of perspectives
In the old days the strategy was formulated by one or a few persons, but to enable a process whereby valuable inputs and
ideas are collected from a larger part of the organisation, methodology and tools are central to keep the overview
and for the process not to result in a poor strategy.
Downloaded from http://iwaponline.com/ebooks/book-pdf/651186/wio9781780407586.pdfby gueston 14 January 2022

147decide
Effective strategy characteristics
66 Clear on direction;
66 Clear definition of what it means to succeed as well as specific steps to succeed;
66 Enable collaboration, e.g. by explaining how the steps are coordinated;
66 Know how to develop the required future core competences;
66 Address real needs, problems and opportunities (not imagined ones);
66 Achieve advances that will be sustainable and not temporary;
66 Will be flexible enough to adjust to changes that happen around and inside the utility;
66 Cover appropriate time horizon(s) – utilities are a lot about the long-term;
66 Articulate what you won’t do or will do less if you want to do something new or some other thing more;
66 Allow progress to be observed;
66 Articulate the required mind-set and culture to be developed;
66 Embody clear communication with clear arguments and solid analysis and diagnosis.
Ineffective strategy characteristics
66 Fail to define and face the real challenge(s);
66 Rely on motivation alone to achieve the vision and the goals (clear steps need to be defined);
66 Have poor goals that are ill-defined or unrealistic;
66 Are not forward looking enough or broad minded enough;
66 Are not ambitious enough or too ambitious;
66 Do not consider the resources available;
66 Result from tunnel vision and keeping inside the comfort zone;
66 Are full of fluff that does not really inform anybody;
66 Do not address the mind-set and culture of the organisation;
66 Try to follow through on too many or conflicting objectives, i.e. no choice or focus;
66 Are not followed up and not corrected when the required results are not evident;
66 Are not properly backed by analysis and diagnosis of the situation and future possibilities.
Downloaded from http://iwaponline.com/ebooks/book-pdf/651186/wio9781780407586.pdfby gueston 14 January 2022

148 Smart Water UtilitieS: Complexity made simple
1. sWoT
SWOT analysis has been around since the 1960s and is still very popular, not only due to its simplicity but also because it works well in establishing a joint look at the strategic situation.
SWOT analysis consists in jointly identifying and formulating an organisation’s strengths (S), weaknesses (W), opportunities (O) and threats (T).
The first two factors, strengths and weaknesses, primarily relate to internal factors and hence describe what distinguishes the organisation from others. Something that is close to “industrial standard performance” does not qualify as either a strength or a weakness (regardless of how difficult it might be, so it needs to be distinguishable beyond standard).
The model can be used to identify opportunities and threats that need to be addressed based on strengths and weaknesses.
The model can also be used the other way around (TOWS) to understand which abilities need to be focused upon to achieve opportunities and avoid threats in the environment (i.e. an outside-in analysis).
SWOT analysis has been around since the 1960s and
is still very popular, not only due to its simplicity but
also because it works well in establishing a joint look
at the strategic situation.
2. Porter’s five forces
This tool may at first not seem too relevant for utilities as it is used to assess the competitive situation of an organisation (generally a business).
Though most utilities enjoy a more or less monopolistic situation, this may change in the future. Considering these changes may in fact help identify new and better ways to supply the service.
In the analysis, the spotlight is on the following five factors of power:
1. Supplier power (the supplier has power if he is in control of his market and not so much if there are several equally good competitors);
2. Buyer power (the buyer has power if he can get your product from other several other suppliers that he perceives as equally good);
3. Competitive rivalry (the power of the competitors);
4. Threat of substitution (the buyers opportunity to get his problem solved in another way);
5. Threat of new entry (could other organisations enter and solve the task easily?)
3. PESTEL analysis
This analysis gives a helicopter view on threats and opportunities by looking and investigating the following factors:
1. Political factors (considering local, national and global level as well as short- and long-term);
2. Economic factors (current status of economy and projected development and trends that may affect your utility);
Downloaded from http://iwaponline.com/ebooks/book-pdf/651186/wio9781780407586.pdfby gueston 14 January 2022

149decide
3. Socio-cultural factors (development of population, urbanisation, cultural trends, taboos and attitudes);
4. Technological factors (new technologies, radical new ideas, infrastructure development);
5. Environmental factors (climate change, water environment, ...);
6. Legal factors (changes in regulatory systems, new laws, standards).
4. Benchmarking
Benchmarking is about comparing own performance with the performance of “the best utility”. Defining which “is the best” is for obvious reasons a tricky thing – and different utilities may be best at different things.
As described earlier a mathematical benchmark model has been devised in which the basic conditions can be controlled perfectly to be equal. In all other comparisons there are differences in the environment or basic conditions. Another approach is to compare using parameters of performance that most utilities agree to be beneficial, such as water loss in drinking water systems, which is probably one of the most successful and easy parameters.
To illustrate the difficulty, consider energy consumption as a similarly interesting parameter, however, energy consumption depends also on the distance and heights water should be pumped across as well as, in terms of treatment, how polluted the incoming water is, as well as how clean the effluent water needs to be. Hence there are probably no two utilities with the same base conditions.
There are many initiatives and attempts to find good ways to compare, and in the end it is more about ensuring learning from each other
than about “finding a winner”. Additionally, the benchmarking parameters can be improved from year to year at each utility individually.
…in the end it is more about ensuring learning
from each other than about “finding a winner”.
5. Critical success factors
The number of activities an organisation can engage in seems to be endless. There are so many opportunities to grasp and so many threats to prepare for.
The idea of identifying “critical success factors” is to determine (or decide) which are the critical areas. These can be identified based on the goals and objectives of the organisation. That is, if a certain objective is to be reached, then a number of critical success factors are crucial.
If the number of critical success factors is overwhelming, then it should be examined whether the number or the ambitions in the objectives are too high.
6. USP analysis
A Unique (U) Selling (S) Point (P) analysis is again an example of a strategy development tool that is primarily targeted at more commercial companies.
However this tool may give valuable insights into how the water services should be further developed. Real unique selling points are difficult to find – even in commercial business; and if one is found then soon competitors will seek to follow.
Downloaded from http://iwaponline.com/ebooks/book-pdf/651186/wio9781780407586.pdfby gueston 14 January 2022

150 Smart Water UtilitieS: Complexity made simple
The interesting aspect about this analysis is to consider things from a customer point-of-view – or even a stake-holder point-of-view.
1. What do customers value of your product – and what do they value with the product of other utilities?
2. How well is your utility performing on delivering that value and, not least, where do you plan to rank?
3. Are there things around water that users/consumers want that they are not getting today?
7. Balanced score card
The balanced score card method makes it easier to communicate strategy and follow up on implementation.
Strategy always runs the risk of becoming bla-bla-bla in many people’s ears. It seems that regardless of how well-crafted the strategy, this is a major risk.
Developing a Balanced Scorecard involves a number of steps including stating vision and mission and defining the measures of success within key focus areas such as financial, customers, organisation and business processes. These targets are then coupled with various medium-term initiatives.
This makes it easy to follow up on these projects and for everybody to understand how actual activities and projects are coupled to the strategic objectives.
8. The triple bottom-line
Many commercial companies struggle with a short-term focus on the economic bottom-line. While this is not a completely bad thing it often
leads to decisions that are a bit narrow-sighted or short-term, which may endanger the long-term survival of the company.
This might not be the case with utilities; however the methodology applied may be beneficial in a utility setting. The point is to have three instead of one bottom line. The headlines of the bottom lines are
1. People
2. Planet
3. Profit
So obviously, profit is still important, but so is the environmental impact as well as social impacts. Both “people” and “profit” can be interpreted in the broadest sense (all stakeholders and global environment) or in a more narrow sense (local environment and people in the organisation).
So basically, this is about caring, which means making the impact of the operation of the company or utility positive.
…profit is still important, but so is the
environmental impact as well as social impacts.
9. Turnaround management
It suffices to say that some utilities have been well run for years – others have not. If you find yourself in the latter, something needs to be done – often something dramatic.
Various theories exist for how a successful turnaround is carried out. In many cases it is just “played by ear” with a varying quality of results.
Downloaded from http://iwaponline.com/ebooks/book-pdf/651186/wio9781780407586.pdfby gueston 14 January 2022

151decide
Before engaging in any radical changes it is worthwhile to have a phase of analysis to make sure that the changes will have the right effect.
One important thing to remember is that there are not infinite resources to carry out the turnaround and management and employees may be very tired. On the other hand, more resources are probably available than meets the eye. So whatever is done, make sure it works.
First pay attention to the acute needs. Then it is time for restructuring, stabilising and then revitalising the utility. In a complex and “heavy” organisation, such as a utility, such a turnaround process may take several months or even years.
10. Scenario analysis
We do it all the time, unconsciously, prepare scenarios in our mind. What happens if I make this decision or that? This is about imagining things in the future – and possibly doing it together rather than individually.
Scenario analysis can be done in many different ways, exploring different kinds of futures. One approach is when having to make a large decision to identify the top 3–5 of major uncertainties and prioritising them by decreasing importance (i.e. more or less prioritise according to probability times impact).
Then “tell the story” of how one factor at a time would affect the outcome; try applying a set of reasonably favourable and a set of somewhat unfavourable conditions and calculate the consequences (if possible); or tell a story of the future as an imaginative simulator.
Regardless, you will most probably be wrong, but you are now armed with an understanding of the most probable list of outcomes and their probabilities.
11. Value chain analysis
To transform one or more inputs into an output that is valued by somebody, some kind of value needs to be added. This is done by a chain of activities – each activity adding value.
A value chain analysis starts by identifying the activities that add value. When this chain of values has been identified, it can be discussed either how to produce that value with less activity or add more value by maximising the effects of actions.
Sometimes such analysis may result in identifying activities that do not add value. These activities should, for obvious reasons, be stopped.
12. Mission and vision statements
No strategy tools can avoid mentioning the ubiquitous mission and vision statements. Though many times failing, there is quite a big potential in defining these statements. They are strongly linked to the definition of the big “why”. The two statements are often confused, but it is actually quite important to be clear about the difference.
The vision statement states how a perfect future would look, i.e. what the organisation wants to achieve or support happening over time.
Mission statements explain the role the organisation has in achieving a vision such as: “by delivering water services for everybody in this area with the minimum possible detrimental impact on the environment”.
When mission and vision statements are at their best they uplift the spirit of people involved with the organisation, create a joint focal point for activities and can help attract people with shared values.
Downloaded from http://iwaponline.com/ebooks/book-pdf/651186/wio9781780407586.pdfby gueston 14 January 2022

152 smarT WaTer uTiliTies: Complexity made simple
“Foresight is seen as a wholly rational process, the product of a constantly running internal computer that deals with intersecting series and random inputs and is vastly more complicated than anything technology has yet produced. Foresight means regarding the events of the instant moment and constantly comparing them with a series of projections made in the past and at the same time projecting future events – with diminishing certainty as projected time runs out into the indefinite future”,
writes Robert Greenleaf in his book “Servant leadership”.
He continues:
“The failure (or refusal) of a leader to foresee may be viewed as an ethical failure, because a serious ethical compromise today (when the usual judgment on ethical inadequacy is made) is sometimes the result of a failure to make the effort at an earlier date to foresee today’s events and take the right actions when there was freedom for initiative to act. The action that society labels “unethical” in the present moment is often really one of no choice”.
This is indeed the pressure that one should be aware of when carrying out strategic planning.
Table 5.1: Examples of from–to pairs in a strategy.
THEME FROM TO
clarity of strategy Unclear strategy clarity, business case based decisions, coordinated between sub-utility areas, easy to communicate internally and externally
smart utility Few online measurements online monitoring of water quality and quantity and no models running across the urban water cycle and calibrated
models for all networks and plants
environmental impact Unclear environmental impact identifi cation of major environmental impact and 20% reduction on top three impacts compared to today
asset management maintenance based on alarms maintenance based on foresight
culture low level of cooperation across Passionate culture in an organisation with clear goals the organisation and ambitions
sTraTegic planning
Downloaded from http://iwaponline.com/ebooks/book-pdf/651186/wio9781780407586.pdfby gueston 14 January 2022

153decide
It is not a task that should be taken lightly. Careful planning is not so much about making sure that all the details fit neatly in the spreadsheet; it is taking care that the right activities are initiated in a timely fashion to avoid “situations of no choice”. Take the example of incidents of water contamination of the drinking water systems. Such incidents are much more prone to happen in systems that have not been properly maintained and cared for. This is a commitment that spans decades of hard work.
If you are thinking “well that might be, but we only have so and so amount of resources available”, then you should question, “Are we using the resources optimally?” and if the lack of resources is the main threat, then “How should
I spend my time to expand that pool”, the latter might actually be the most important task at hand, i.e. building the argument around the case, networking with key political decision makers, etc.
Strategic planning generally –for practical reasons – is planned to take place at a given frequency of time, e.g. annually or every two, three, four or five years. Not having prepared and maintained an infrastructure to feed this process during the periods of action (as opposed to the periods of planning) will render the planning process more difficult and more prone to error. The process needs to be fed continually with data, information, analysis, inspiration, ideas, scenarios and imagination.
Figure 5.2: Project portfolios and feedback points to monitor progress.
Them
e 1Th
eme 2
Them
e 3
Time, years/monThs
Feedback PoinTs
acTiviTy a
acTiviTy b
acTiviTy c
acTiviTy d
acTiviTy e
acTiviTy F
acTiviTy a
acTiviTy b
acTiviTy c
acTiviTy d
acTiviTy e
acTiviTy F
acTiviTy a
acTiviTy b
acTiviTy c
acTiviTy d
Downloaded from http://iwaponline.com/ebooks/book-pdf/651186/wio9781780407586.pdfby gueston 14 January 2022

154 Smart Water UtilitieS: Complexity made simple
Deciding the end result of a strategic planning process may contribute to making the process much easier and less fuzzy. At any given time there are probably hundreds of issues that should be dealt with in the strategic planning process. However in order to make the process clear and comprehensible it is a good idea to bundle the issues into key-themes.
For each key-theme describe in a few words the current situation and in a few words what it should be changed into. Based on these wishes for change, brainstorm on what activities need to be put into the plan. More suggestions mean more variety to choose from and hence a better chance of initiating the real effective activities. Sometimes activities may be comprised of a combination of several proposals.
When a list of the most effective activities have been identified for each theme, the activities need to be transformed into clear projects with a clear project definition including description of the overall aim of the project, the level of ambition, the budget, the owner/steering group, name of the project manager and his or her team, resources available, etc. This definition frames the whole project and makes it possible to guide the project during its execution. As the
project manager and the team gets deeper into the project, the project definition may need to be adjusted. This should be done in collaboration with the steering group.
All the projects are then distributed over the plan period as shown. It is beneficial to have some clear points in time of feedback of the overall plan. The purpose is to steer the plan right as the organisation gets wiser on the effects of projects that have or are in the process of being executed.
At such feedback points the following questions should be answered:
66 How far are we from reaching our goal?
66 Is the goal still valid or does it need to be updated?
66 Are the projects moving the utility in the direction toward the goal?
66 Can the plan be adjusted to help the goals be accomplished faster, better or with the use of fewer resources?
Based on the answer to these questions the plan can be adjusted.
Downloaded from http://iwaponline.com/ebooks/book-pdf/651186/wio9781780407586.pdfby gueston 14 January 2022

155decide
In the end, it is all about choices and decisions. What a Smart Water utility is basically doing is setting itself up for being prepared to answer central questions leading to informed, right-minded choices. If no information system is set up on the huge, complex and dynamic infrastructural systems of human water usage the decisions must be based on guess work and the success of the choices and decisions are accidental and non-consistent. This in turns leads to loss of resources on small as well as large scales.
Choosing instead the informed road forward it may be that the first decisions and control concepts are not perfectly optimal, however through the deliberate effort to analyse forth an understanding of the reasons behind the non-optimalities it will be possible to move closer and closer to optimality and even at times make large leaps ahead, where new relationships between processes are found or invented, leading to stronger bonds of collaboration, innovation and symbiosis. The ultimate aim of the whole process of improvement is to become a seamless and non-destructive collaboration with the surrounding environment.
relaTionship To overall sTraTegy
Strategy obviously involves a lot of different aspects of running a utility, regarding safety of supply, quality and quantity, efficiency, customers, competence development, etc. In principle, for each of these aspects a plan can be devised. Smart technology is a pervasive technology that potentially relates to and enables improvements across the whole variety of strategic aspects. But since Smart Water utility technology cannot be implemented all over and to the smallest detail at once, it is important
to consider a plan that improves water cycle operation across as many strategic themes as possible at the same time.
resources
An iron law in utilities seems to be that there are always operational issues more pressing in this very instant than developing the utility to perform better in the future. This has the unfortunate effect that improvements such as the application of sensors, models and control will generally be postponed unless something deliberately is done to avoid this.
There are probably more solutions to this problem, however it cannot be stressed enough that if there is a leadership decision to make the utility smarter, it is of paramount importance to either hire or assign a champion for making this happen. This champion needs to be well skilled within natural sciences as well as have good social and communication skills. He or she will have to work across all of the departments in the organisation. There is also a need for the person to be well-trained in change management as well as possessing a good portion of grit to be able to keep moving in spite of both the technical and organisational difficulties he/she will face. Additionally, money needs to be assigned to the project over several years; it is not a quick fix.
infrasTrucTure
To take the MAD-system as a skeleton for an information infrastructure might be a meaningful approach. First of all it is definitely meaningful to install and acquire data from a multitude of sensors and other measurement devices throughout both the urban infrastructure
smarT WaTer uTiliTy sTraTegy and planning
Downloaded from http://iwaponline.com/ebooks/book-pdf/651186/wio9781780407586.pdfby gueston 14 January 2022

156 smarT WaTer uTiliTies: Complexity made simple
and the natural infrastructure with which it collaborates in the sense of water sources and recipients (Measurement). Secondly it is of paramount importance to make sure that the organisation is capable of converting raw data into meaningful analyses (Analysis) and finally it is meaningful to couple this with all the decisions at all levels at which the utility is making decisions (Decision). However the question that this structure does not answer is how to begin building this structure and how to develop it over time. For this question there are two types of answers:
1. The answer of possibility, i.e. though more and more sensors are becoming available and models are getting increasingly refined, the options are actually still quite limited. Secondly, the cost of sensors, communication systems, data acquisition, data handling and data analyses are still quite prohibitive
for wide-spread application. Hence, what it is possible to do with the constraints of technological availability and economic opportunity is limiting for what kind of information infrastructure is applied, and the challenge is often to get as much information out of as few sensors and devices as possible and then estimate the rest.
2. The answer of ambition. What is the ambition of the utility? This comes back to answering the big why question – what is actually being achieved. Regardless of the ambition and the height of the level of ambition, the MAD infrastructure can be of value. The type of information that is being acquired is closely related to what is important. This means identifying the questions that are important to answer in order to be able to “live” the ambition of the utility.
Figure 5.3: A “MAD” process.
MeasurementsSensor site selection
Sensor selection
Sensor installation
Sensor communication
Sensor integration
Establishment of procedures for:
66 Maintenance of sensors
66 Interpretation of signals
66 Conveyance of information
AnalysisDetermine focus of model
Building the model
Calibrating the model
Correcting understanding of system
Integration with rest of IT system
Establishment of procedures for:
66 Various usages of the model
66 Scheduled re-calibration
66 Documentation of insights
DecisionsPredefined points of actions based on inputs from sensors and analyses
Periodic reporting supporting normal succesful operation
On demand analysis devised to shed light on relevant questions
Decision support during unforeseen incidents
Downloaded from http://iwaponline.com/ebooks/book-pdf/651186/wio9781780407586.pdfby gueston 14 January 2022

157decide
Definition of our ambition:
The quality of the water utility is defined by its ability to deliver adequate service to its main stakeholders: the citizens, the industries and the surrounding natural environment.
It is a deeply held belief that the level of service offered to the stakeholders can be dramatically increased within normal cost of service by closely monitoring and analysing the performance of the delivered service and working to continually improve service and make decisions based on life-cycle cost analysis, including the value of not harming the natural environment.
Our annual smart process
As with the annual budgeting exercise, there will be an annual Smart Water utility process. This process identifies improvement projects in each main process of the water cycle (water source, water intake, water treatment, water distribution, water consumption, wastewater transportation, wastewater treatment and water recipient).
Annually, a total of 5% of the utility’s total capital cost will be assigned to making the utility smarter. Based on the resources available in the “smart fund”, the best opportunities will be defined as projects and executed the following year.
Additionally, an annual report will be prepared that identifies the improvements achieved by the combined “smart system”; the improvements can in some cases be monetised. In many cases the benefits are more subtle; however they will still be described to make the effects of the smart investments visible.
Our plan of implementation
year 166 Invest in 20 new data points/sensors66 Establish models on drinking water and sewer
networks
year 266 Shift actuators to ensure flexibility in the ten
most important places66 Establish models for the largest wastewater
plant
year 3:66 Invest in 20 new data points /sensors66 Establish models for all of the wastewater
plants
year 466 Invest in 20 new data points /sensors66 Strengthen the efforts of profiting from
the models by means of large analysis of opportunities to improve efficiency and effectiveness
year 566 Focus on symbiosis opportunities by dialogue
with stakeholders
An example of a Smart Utility strategy
Downloaded from http://iwaponline.com/ebooks/book-pdf/651186/wio9781780407586.pdfby gueston 14 January 2022

158 Smart Water UtilitieS: Complexity made simple
Asset Management is a new discipline that has been gaining weight during the last decade or so. Water utilities administer huge infrastructural assets with a high total value. In many places these systems have been built over a period spanning around a century. Changing this structure or even maintaining it is a costly and slow process. But it is a process, and in that sense it can be said to share some similarities with faster processes in water utilities; processes for which we are applying sensors, analysing and finding optimal operation points. So why should the case be different for maintaining the infrastructures of interconnected pipeline networks, treatment plants and the interface to nature (i.e. the clean water resource and the final recipient of the system)?
Many water utilities have come to a point in time at which this infrastructure needs to be replaced, upgraded, refurbished, maintained and disposed of on a large scale. The field of asset management attempts to ask questions so that our management of assets become systematic, logic and responsible. It supports the striving for developing a framework that ensures decision making based on objective, clarified, transparent and consistent criteria across asset decisions.
It supports the striving for
developing a framework that ensures decision making based on objective, clarified, transparent and consistent
criteria across asset decisions.
The tasks of asset management rely heavily on the engineering/project/strategic department of a water utility and are more closely linked to the capital spending than to the operational spending of a water utility (though not entirely). Asset management has been and is applied in other industries than water utilities, especially industries that are heavy in capital spending and have invested high in assets to produce and distribute their products. The high investment industry of oil and gas was the first industry to work systematically with asset management – at least they were the first to use this “asset management” (AM) term for it. In a sense, companies have always worked with asset management, without calling it so. What is new is the development of a systematic way of thinking of it and handling the processes involved in doing it rationally and effectively. Indeed, a consistent methodology will bring a lot of value to the tactical thinking.
There are good theories for AM; however as the field is young, there is still a lot of development to do. Especially the field of applying AM to water utilities is very young. ISO 55000 describes a certifiable process for AM. To become certified you can look to this standard. The description presented here will only deal with some of the main concepts related to smart decision making in terms of tactical decisions, i.e. decisions concerning the maintenance of the material system of the urban water cycle, e.g. plants, pipelines, pumps, basins, etc.
For the general understanding of AM, the pyramid of AM as presented in Figure 5.4 provides a good model for how to work. The pyramid brings some order in the otherwise often confusing discussions about how to manage assets well. The pyramid provides a joint understanding of the levels of AM. Much confusion in this AM discussion relates to people talking about different levels of this pyramid and hence talking about different things.
asseT managemenT sTraTegy and planning
Downloaded from http://iwaponline.com/ebooks/book-pdf/651186/wio9781780407586.pdfby gueston 14 January 2022

159decide
The top triangle of the pyramid is actually (at least in theory) outside the scope of AM. This is the strategic level of the utility. Here it is defined what aspects define value in the company context and how it should be valued. Here the directions are laid down for how the prioritisation of resources should be done. In real life this is often expressed as vague and often ambiguous directions of providing excellent customer service, ensuring the environment and doing so at a reasonable cost. It is often left to the asset management group to translate these directions into crisp criteria upon which it is possible to optimise the management of the assets.
On the level below (the third level counting from the bottom) is the portfolios level. A utility may have one or more portfolios depending on how broad a part of the urban water cycle it covers. Examples of portfolios are: water intakes including the supplying groundwater fields and surface water intakes, water treatment plants including various treatment processes and pumping stations, water distribution including districts of water pipes, wastewater networks including catchment areas, etc. It may also cover other utility types such as district heating, solid waste, electricity, etc. The purpose at this level of the pyramid is to prioritise the sections
Figure 5.4: An asset management pyramid.
Strategy ValuationCriteria Goals
Prioritising Planning
Best solution Business case Evaluation
Innovation
Maintenance Scheduling
Recording
UTiliTy
waTer wasTewaTer
a: new PiPelinesb: changed mainTenancec: innovaTove solUTiond: …
ProjecT solUTions
comPonenTs
Downloaded from http://iwaponline.com/ebooks/book-pdf/651186/wio9781780407586.pdfby gueston 14 January 2022

160 Smart Water UtilitieS: Complexity made simple
inside each portfolio against the more strategic priorities at the top level.
Imagine that the asset management team has succeeded in prioritising the potential sections/areas/projects in each portfolio and selected which of these top-prioritised projects are to be conducted in the next budget period?
On level two, the purpose is to look at the chosen section/area/project and identify the best solution. After coming up with a number of possible solutions, the best solution can be judged based on the same criteria as defined above. This is the level at which innovative technological thinking should take place, at which several solutions should be weighed against each other and a business case should be presented based on the best solution. If the business case proofs to be good the project is carried out.
On the base floor of the pyramid is the maintenance of all the components. This work is often carried out by the operational department or outsourced to a service company. A risk of having this being done by the same staff as the day-to-day operational team is that production often gets priority over maintenance; which for unfortunate reasons often cause maintenance to be neglected – causing more acute issues in operations… and hence creates a poor cycle of increasing operational emergency issues. At this level it should be clarified how any given asset should be maintained and how often this should be done. This means that this level includes all the procedures around maintenance.
A natural starting point for such maintenance processes is to schedule the maintenance according to the calendar. But also here it is – at least to some extent – possible to make the scheduling smarter by the use of sensors. Sensors that can tell the maintenance team when an asset needs maintenance. There are several possibilities, like measuring equipment operational time, acoustical sensors to detect
noise, propagation of pressure waves in distributions pipes, to name a few.
The four levels of asset management are – as described – quite different in nature. Hence it is very important to involve the right people at the right time for the right purposes in asset management. However, done correctly this should result in much better clarity about why things are being done as well as when things should be done.
defining valuaTion criTeria
Being clear about the value a utility is creating in society is no easy task and is hence often left open to interpretation. In some instances this is good and fruitful and leaves space open for creativity. However in asset management it is of crucial importance to be clear about the understanding of value. The chosen valuation of different aspects is closely linked to clearly understanding the priorities of the utility. In too many utilities the planning and prioritisation of investment projects has more to do with power and interest dynamics between people than with crisp technical and economic criteria. This opens a door for plain wrong decisions based on lack of overview and technical misunderstanding, as well as – in the worst case – for injustice and corruption.
The chosen valuation of different aspects is closely
linked to clearly understanding the priorities of the utility.
Defining clear valuation criteria will often make differing meanings surface and may be an area prone to conflict. However the conflicts are not provoked by asset management per se, rather they become visible and can be handled in a rational and just way because of the asset management framework. Asset management struggles to
Downloaded from http://iwaponline.com/ebooks/book-pdf/651186/wio9781780407586.pdfby gueston 14 January 2022

161decide
answer the question of which investment to make in respectively refurbishing, replacing old sewer pipelines and laying new pipelines.
What is at stake can be seen with examples from a sewer system:
66 Old sewer mains run the risk of collapsing and hence become expensive and difficult to repair, leading to serious temporary wastewater transportation problems. This problem is worsened by the situation that in most utilities this is not surveyed in a systematic way and hence the planners do not know which pipelines are in better or worse condition;
66 Some pipelines have been designed with too small hydraulic capacity which leads to flooding of roads and basements when it rains above a certain threshold of rain intensity and duration. In case of a really heavy rain, the economic damage will be substantial;
66 The combined sewer overflows (CSOs) run to delicate ecological recipients in some areas;
66 Some areas have yet to get a sewer system and hence the wastewater collection is often operated in a less than optimal way from an economical, a sanitation as well as an environmental point of view;
66 The operational costs need to be cut, i.e. energy saved by replacing pumps and maintenance budgets reduced by replacing equipment with frequent malfunction;
66 And then every city has its own red spots where for one reason or another the sewer system is subject to frequent trouble.
All of these are important issues, but all of them cannot be solved at once. That is at the core of the problem of defining valuation criteria, which of these problems to solve first.
Another aspect of asset management is that maybe not all of these issues should be solved. If for example it is less expensive to pay for the cost of repairs after flooding than to ensure flooding does not happen – or if it is less expensive to have emergency equipment ready than to avoid the situation, then that might be a better solution. Such economic comparisons and deliberations need to be analysed and taken seriously.
The following are criteria for good valuation criteria:
daTa Based
The criteria should be data-based, i.e. it should be measurable and not rely (too much at least) on human interpretation. This means that real life data needs to be available that measures the effects of current operation, i.e. it has to be possible to really know the amount of CSO if that is part of the valuation criteria. Total CSO can be measured or modelled, regardless of whether it is a major task to really understand and know what is overflowing in even a medium sized sewer network.
risk Based
Looking at the state of all the assets is obviously a good guide to understand the need for maintenance, refurbishment or renewal. However that is not enough. The state needs to be coupled with the risk at the point at which the asset is located. This means looking at its criticality. Maybe remote sewer pipelines can be left until collapse and managed at that point. On the other hand, that would be a bad decision for centrally positioned sewer pipelines.
TransparenT and logical
The criteria should ensure a clear line-of-sight from the action taken (e.g. project) to the overall
Downloaded from http://iwaponline.com/ebooks/book-pdf/651186/wio9781780407586.pdfby gueston 14 January 2022

162 Smart Water UtilitieS: Complexity made simple
vision and strategy. This means that for every action that is taken, i.e. any investment made, it should be possible to track back to these valuation criteria.
aligned
It is a clear recommendation to always convert the criteria into value, i.e. money. This may make it all seem a bit heartless. However it is a great eye opener to decide and understand how different things are actually valued. For the factors that are difficult to value, such as a clean and healthy aquatic environment, the value can be set by means of political negotiation. This ensures that this gets the proper amount of attention. There may, for example, be a conflict between minimising CSOs to create a clean environment and the desire to cut operational and investment costs. When the valuation criteria have been negotiated and defined, the problem can be left to technical staff. Before criteria were defined, the conflict was just hidden and dealt with in an unclear way by technical staff and not by management or owners. Defining criteria is hence a clear work of leadership.
include all relevanT facTors
All relevant factors are all the factors that rightfully should influence the decision on how to invest in the assets of the utility. Table 5.2 shows examples of key components in valuation criteria for asset management relevant to most utilities. They include cost, risk and inconvenience in respect to the utility’s resource, the customers and the environment.
The inclusion of additional factors in the valuation criterion, how to calculate the factors and weight them against each other is up to each individual utility.
porTfolio prioriTisaTion
It is easier to state the objective of this task than to explain how it is done. The objective is to provide a prioritised list of construction projects that the utility should undertake in the future. The priority should rank the most important and critical at the top and then downwards with decreasing importance. Additionally, it should be stated, the amount of activity to undertake annually for at least 5–10 years ahead. Based on these two pieces of information, it is a relatively simple task to make a list of the projects for the coming fiscal year, which satisfy the two criteria:
1. The total cost is estimated approximately around the planned annual spending for the given year;
2. The selected projects are to the best of everybody’s knowledge the most important projects to undertake.
Stringently, this should be done by dividing the infrastructural system into a number of zones and based on the valuation criterion calculating the annual cost of each zone compared to the cost of a newly renovated system. One challenge is that the zones could be divided in many different ways. One reasonable way of doing it could be to divide it based on equal cost of replacement. Another way could be to divide it based on natural delimitations, such as separate city areas or based on the technical structure of the system.
However the most important thing about portfolio prioritisation is the establishment of a measuring system for obtaining real world data on the system. Until now an often used criterion for replacement has been the age of the infrastructure, which is a reasonable idea as infrastructure generally becomes more and more prone to failure the older it grows. However the speed of decay varies greatly in pipe network systems.
Downloaded from http://iwaponline.com/ebooks/book-pdf/651186/wio9781780407586.pdfby gueston 14 January 2022

163decide
The reasons are:
66 Different technologies were used in different decades, which may mean that relatively new infrastructure may be closer to a collapse than older ones;
66 Different quality standards of different contractors largely influence the durability of the system, an aspect that is often overlooked in the eternal hunt for lowest construction prices;
66 Different conditions of the soil (e.g. water content) that the pipelines are placed in may influence life time significantly;
66 Different operational conditions applied also have strong influence on the state of
the assets. An obvious example of this is the problematic formation of hydrogen sulfide in sewer systems;
66 Wrong dimensioning of parts of the system may seriously impair the functioning of the joint system, though the part in question is in a perfect health.
For the parts of the infrastructure that are above ground it is relatively straightforward to establish an overview of the state of health. However both sewer systems and water distribution networks are located underground, which makes it very difficult and expensive to establish an understanding of the state of health of these assets. However methods do exist:
Table 5.2: Overview of some key valuation criteria (examples).
UTILITY CUSTOMER ENVIRONMENT
water intake Energy cost (pumping) Climate CO2 effect
Maintenance cost Effect on water source
water treatment Energy cost (treatment) Hygienic risk, i.e. probability of CO2 failure times cost of consequence Maintenance cost
water distribution energy cost (pumping) Hygienic risk, i.e. probability of Water loss (NRW) failure times cost of consequence CO2 Maintenance cost
sewer system Energy cost (pumping) Flooding risk CSO Maintenance cost Risk of polluting water
network CO2
ww treatment Energy cost (treatment) Smell and noise CO2 Maintenance cost Bypass of wastewater Effl uent wastewater
Downloaded from http://iwaponline.com/ebooks/book-pdf/651186/wio9781780407586.pdfby gueston 14 January 2022

164 Smart Water UtilitieS: Complexity made simple
Sewer system
Sewer systems can be inspected by the use of mobile cameras travelling through the system. This has a heavy cost and should be systematised. The priority of doing the inspections could be based on criteria including state at last inspection and age.
Drinking water pipelines
Besides the cumbersome and expensive digging out of samples for analysis, other indirect measures can be applied to determine the health of the system parts. These methods are not fully developed yet but could include:
1. The registration of bursts;
2. The calculation of water losses in different sections by the use of online flow meters in the system and online metering at the point of consumption and;
3. Looking at the change in water quality in different parts of the system.
For both sewer systems and drinking water pipeline systems it should be possible to exchange experience in a systematic way that enables the development of a model that can predict the state of the pipelines as well as ancillary equipment such as pumps, valves, sensors, etc.
finding The BesT soluTion
After the portfolio prioritisation of projects has been carried out the projects need to be handed over to project managers and designers for them to find the best solution. Finding a solution may be difficult enough, however finding the best solution is a completely different ball game.
Often too little time is spent in the preparatory stages, meaning that the project team may jump into solution and implementation mode too soon. This gives rise to many aggravations that at a later point in time may seem like unavoidable unfortunate events, which the project managers need to deal with as best they can at that point in time. However many projects would have benefitted greatly from spending more resources in the initial stages of the projects.
The stages of a project in an asset management setting could be something along these lines:
1. Create a clear understanding of the full problem
Often it is assumed that the overview of the situation exists immediately, but generally it is not so. Hence it is important to get the opinions and perspectives of more people, especially different stakeholders and experts. Always trying to solve more than one problem at a time should be the frame of mind when getting to understand other person’s perspectives. It may be a challenge to
Often too little time is spent in the preparatory stages, meaning that the project team may jump into
solution and implementation mode too soon.
Downloaded from http://iwaponline.com/ebooks/book-pdf/651186/wio9781780407586.pdfby gueston 14 January 2022

165decide
manage the expectations of stakeholders and experts, but it is a doable job, especially if feedback is given to all involved as the solution develops.
An important part of the job in this phase is to craft good questions, such as:
66 What do you see as the top three problems in this area?
66 What would you like to see happen as a result of this project?
66 What would you be most sorry about if it did not succeed when doing this project?
66 How would you like to be involved or even to contribute to the solution?
66 What are your greatest concerns looking one, ten and fifty years ahead?
66 Can you see any synergies with other initiatives in this area?
2. Creating alternatives
The first solution that you or your group come up with is not always the best. In technical groups, as well as so many other groups, people who can come up with solutions fast are very valued and in many circumstances they should be. However when embarking on a project, where the chosen solution has an effect on the system for the next century, the project surely deserves spending a few hours on brainstorming for more solutions.
There are many ideas for making good brainstorm sessions. Because of the complexity of the solutions in infrastructure projects the brainstorming is generally not a single free-thinking session in which all voices are equally heard. Much of the brainstorming work is about discussing ideas with your network. Hence, in order to ensure a high quality of the output of
the brainstorming it is important to maintain a strong network of experts, solutions providers, contractors, thought leaders, peers in other utilities and to attend conferences, network meetings, join development projects, read professional articles, etc. This could be said to be the equivalent of having physical sensors – this however is rather about the detection of new ideas.
3. Evaluation
After the brainstorming, spend energy analysing at least three different solutions. Again it is important to make clear criteria for the evaluation. If one solution addresses an aspect that is not measured by the first established criteria, make sure to include that in the criteria and also evaluate the other projects accordingly. Finally, it should be clear to the group which is the best option. Alternatively, two options may be more-or- less equally good, in which case it does not matter much which solution is taken.
4. implementation
When the best solution has been selected, it is time for implementation.
mainTenance
Maintenance is the last aspect to consider in asset management. From an asset management point of view, it is important that a systematic and economically effective approach is applied to maintenance. In principle, following the same optimisation criteria as described above.
This can be done more or less intelligently as is described later.
An important aspect is obviously to implement the necessary procedure for optimising the life-time and the life-time costs of the asset.
Downloaded from http://iwaponline.com/ebooks/book-pdf/651186/wio9781780407586.pdfby gueston 14 January 2022

166 Smart Water UtilitieS: Complexity made simple
smarT mainTenance
The traditional way of thinking in maintenance is some kind of time based maintenance. In our cars we may change the oil every 15,000 km and do other kinds of engine maintenance every 20,000 km, etc. This kind of maintenance is based on experience and not on the real condition of the car engine. Similarly, in a treatment operation we may look at the valve operation and consider valve maintenance at some regular intervals. The problem is often that we do not know which interval is the best.The maintenance of an air valve can be used to demonstrate the idea of smart maintenance, based on the operational record. The air flow from the air valve should be a function of the valve opening. By measuring both the valve opening and the air flow we can continuously monitor the performance and define what a “normal” operation looks like. If the air flow for a certain valve opening is deviating too much from normal, then we get an indicator of a valve problem. This could be some clogging, or that friction in the valve has caused the valve to stick.
In another case, if the flow rate measurement is compared with an electrical current measurement of the relevant pump motor, a relationship has been established that can diagnose the problem. The valve opening, the pump speed and the flow rate are related to the pressure drop over the valve. All this information can be used to detect abnormal situations that can initiate a maintenance operation.
Having this kind of measurement to indicate when there is time for maintenance gives much more favourable operation. Sometimes we need to maintain more often than the time-based maintenance; sometimes we can save a lot of resources by not maintaining unnecessarily often.
There are many tasks of an integrated supervision platform: plant-wide monitoring, database and knowledge base maintenance, fault detection, fault diagnosis and control.
operational decision making Operational decision making is what takes
place every day – dealing with issues that
arise and implementing the changes that need
to be executed to achieve the strategic goals.
The higher the ability for handling complex
issues at the right level of complex thinking
and transforming this into simple but effective
decisions, the better the success the utility will
experience.
Downloaded from http://iwaponline.com/ebooks/book-pdf/651186/wio9781780407586.pdfby gueston 14 January 2022

167decide
Failures or malfunctions of process components or instrumentation increase the operating costs of the plant. Gross failures, such as accidents, massive hydraulic overload or toxic influent in a wastewater treatment plant or large bursts and leakages or toxic spills in a water distribution system, are definitely more serious.
Modern process engineering requires prompt detection and classification of process anomalies, which would minimise the overall repair time by assisting operators and engineers in the diagnosis of system degradation. Moreover, it is essential to detect incipient faults and to locate the deteriorating or the deteriorated components as early as possible. In other words, some form of prediction of each device’s condition and likelihood of its failure is necessary to undertake timely and appropriate maintenance work.
The condition of the system must be monitored at each and every instant and the purpose of the diagnostic system is to detect quickly any fault that could seriously degrade the performance of the system. A specialized field called condition monitoring and diagnosis is devoted to determining the life span of operating devices. However, some devices tend to fail abruptly without showing any symptoms or warnings. Moreover, complex control laws often compensate for and conceal the faults. That is why real time process supervision assumes a central role in timely fault detection and isolation of complex systems. Real-time detection and diagnosis of faults while the plant is still operating in a controllable region can help avoid abnormal event progression and reduce the losses.
To track the current process operational state via the instrumentation is called monitoring. However, even reliable instrumentation can fail during operation, which can have serious consequences if the instrumentation is used in closed loop control. Therefore, real time data validation is needed before using measurements
for control purposes. Data validation can be performed by quite simple methods on measurements from a single instrument or as cross validation on measurements from more instruments if any correlation is expected. If confidence in a measurement decreases, it might be possible (on a short-term basis) to use an estimated value, but eventually control must be set to a default scheme until confidence in the measurement has been restored.
Sometimes during the detection process there may be new questions coming up and new analysis or measurements will be required. This is similar to what happens at a medical check-up. If some of the information is contradictory or insufficient, the doctor may wish to make another test.
In a sophisticated treatment plant, there is not only a huge data flow from the process, but also from monitoring key components. Unlike humans, computers are infinitely attentive and can detect abnormal patterns in plant data 24–7. The early detection and isolation of faults in components may show to be very effective because they allow corrective action to be taken well before the situation becomes unfavourable. Some changes are not very obvious and may gradually grow until they become a serious operational problem.
planT Wide conTrol
In a water supply system or a wastewater operation we often consider one unit process at a time and in that way a complex problem is decomposed into parts that can be handled more easily. This is done both in design and in plant operation. However, this approach is not satisfactory if we are to achieve the best efficiency, economy and the most robust operation. To obtain this we need to take a helicopter view of the whole plant, or even a larger system. Such an approach is called plant-wide, system-wide or integrated control.
Downloaded from http://iwaponline.com/ebooks/book-pdf/651186/wio9781780407586.pdfby gueston 14 January 2022

168 Smart Water UtilitieS: Complexity made simple
Figure 5.5 illustrates what every operator knows, that all the processes are linked along the whole urban water cycle. Apparently, water distribution control could be improved if we knew more about the water consumption. Similarly, if the sewer can be controlled together with the wastewater treatment plant, then the total system can perform better. Today, sewer operations and wastewater treatment operations are carried out by different organisations. They have different goals. The sewer operator wishes to minimise the combined sewer overflow, avoid basement flooding, etc. As a consequence the sewer operator wishes to direct as much as possible of the sewer flow to the treatment plant. The treatment plant operator, on the other hand, desires to limit the flow rate so as to be able to treat the wastewater properly. This indicates that the sewer and wastewater treatment operations have to be coordinated so as to minimise the environmental impact on the receiving water.
Whatever the size of the system, we have to define its boundaries. Every phenomenon within these boundaries is an internal event and all variables that cross the boundaries are called external. For example, in the system that consists of both the sewer system and the wastewater treatment plant, the flow rate from the sewer into the treatment plant is an internal variable. The plant wide control then has a chance to control the flow rate between the sewer and the wastewater treatment plant. Then it is possible to manipulate the flow rate in the sewer so that we match a good sewer operation (for example to avoid any sewer overflow) and a good wastewater treatment operation (not to accept a large change
in the flow rate or a too high flow rate during a short time).
The aim of wastewater treatment is to satisfy the effluent requirements while minimising the operational costs. During storm conditions, these goals may be difficult to reach. If the sewer and the wastewater treatment plant are operated as separate systems, then the flow rate from the sewer into the treatment plant is an external disturbance for the wastewater treatment operation. Consequently, the wastewater plant operator cannot manipulate the influent flow but simply has to make the best possible decision to handle the flow. A common responsibility means that we have to look at the operation that is best for the combination of all the sub-systems. One of the systems cannot override the others. The overall goal of minimising the load to the receiving water has to overrule the individual goals.
It was recognised already in the 1970s that a plant-wide perspective has to be applied in order to achieve the highest possible efficiency in the operation. The operation of the primary settler will influence the treatment both in the activated sludge unit and the anaerobic treatment of the sludge. Chemical precipitation can be performed by dosing before or after the reactors or in the reactor itself. The many recycle-streams in a wastewater treatment plant make the complex couplings obvious, such as the return sludge, nitrate recycle or the recycling of the supernatant from the anaerobic digester to the influent of the wastewater treatment. The motivation to look at them together was obvious.
reciPienT
Figure 5.5: Plant-wide control means controlling across processes in each plant and between the major units of the urban water cycle.
wasTewaTer TreaTmenT
sewer sysTem
waTer consUmPTion
waTer disTribUTion
waTer TreaTmenT
waTer inTake
Downloaded from http://iwaponline.com/ebooks/book-pdf/651186/wio9781780407586.pdfby gueston 14 January 2022
169decide
Wastewater treatment as a resource recovery
The energy issue should force us to think in terms of system-wide or plant-wide operation. When comparing various systems for wastewater handling, the accumulated energy consumption of the total system has to be considered. This includes transportation of the wastewater, energy demand for treatment, the use of heat content in the water, and gas production. Therefore we should regard the plant not as a waste treatment plant but as a resource recovery plant. Via the influent water the plant will receive energy in terms of thermal energy. The organic content of the water can later on be converted into biogas. We have to add electrical energy for aeration, mixing, pumps, etc. With a plant-wide perspective we wish to control the plant so that the organic content is used as wisely as possible. It can be eliminated by oxidation, but then we use too much electrical energy and get no “payment”. It can also be eliminated by anaerobic (without any oxygen) digestion and produce biogas that can be used for heating, for vehicle fuel or for making electrical energy. This kind of consideration requires systems thinking.
Water supply operation
Energy management is important also in water supply. Let us just mention one possibility to make the system smarter: to control the pressure in the distribution system. The traditional means of pressure control is to keep the pressure sufficiently high at the “delivery point”. During the day, water is consumed along the pipes, and as a result the pressure along the pipe will decrease. Then it is important to keep the pressure sufficiently high so that the customer at the far end of the pipe will have sufficiently high pressure. This is the “critical point”. During the night, the conditions are different. Then the consumption is low, and consequently the pressure drop along the pipe is much smaller. As a result, the pressure at the critical point is much
higher. This means that the pressure will have quite wide swings during the day. This will cause great mechanical stress of the pipe material and the risks for leakage will increase.
Now, look at the pressure control differently. The obvious goal is to keep the pressure at the critical point sufficiently high, but not higher. If the pressure in this point is measured and the signal is sent via wireless communication to the pump system that produces the pressure, then the pressure can be kept at a minimum all the time. There are two obvious advantages. A significant amount of energy will be saved. Furthermore, the risks for leakages will decrease significantly with a decreasing pressure. Such systems are now implemented.
The equipment requirement is of course pressure measurements. Furthermore, a variable speed pumping at the head end of the system is desirable. Today, variable pressure in water distribution systems is a proven technology, but still most systems are based on the old thinking. We are reminded that “nothing is new under the sun”. The idea of controlling the supply pressure in water distribution systems was presented in 1985, in Takamatsu City, Japan. The progress in network calculations had recently been possible by the development of computers. Two other applications of variable pressure control were implemented in the UK in 1985. The telemetry systems made it possible to remotely control the valve settings in water distribution zones. Today the telemetry systems are replaced by mobile telephone networks for the communication between the pressure sensors and the remotely controlled valves. Variable speed pumping is a proven technology today and can provide further energy reduction.
Based on studies of more than one hundred systems in ten countries, it has been found that a 10% average decrease of the maximum pressure resulted in a 14% reduction in burst frequency in mains and service pipes. On top of that there are significant energy savings. Results from the
Downloaded from http://iwaponline.com/ebooks/book-pdf/651186/wio9781780407586.pdfby gueston 14 January 2022

170 Smart Water UtilitieS: Complexity made simple
Gold Coast, Queensland, and Australia are encouraging: after pressure management had been implemented, service breaks were reduced by 73% and main breaks by 56%.
System structure
The control of any complex system needs a structure. This means that the overall goal of the control and operation has to be defined and this will imply goals for each individual unit process. In control science much research effort has been expended to develop methods for plant-wide control. The results of advanced control in wastewater treatment have been remarkable. Based on experiences from a couple of decades with at least fifty wastewater systems, it has been found that operational savings are remarkable. Reductions in power consumption for aeration are 5–25%, and for internal flows such as return sludge and internal nitrate recirculation 25–50%. Savings in dosage of chemicals have been 20–100%. Better control can also result in design improvements: the aeration volume may be decreased by 10–25% and the secondary settling volume by 25–50%.
conTinual improvemenT
The difference between the word continuous and continual is that continuous means something that is happening or in process at all time. Continual on the other hand means something that is carried out again and again but in discrete jumps. For describing the process that has been made famous by Maassaki Imai as Kaizen, the later form continual is most meaningful.
There is a comprehensive set of theories and methods around the idea of continual improvement that is worth further study; however the short version of the concept is that when something goes wrong or not according to the plan it constitutes an opportunity for improvement. The main focus is all the time on incremental improvements rather than large leaps ahead.
The concept is an important part of most quality management systems and can prove very effective in improving water cycle operation. However the focus and handling of the negative feedback from small and large failures in operation as well as other parts of the organisation around a water utility can also wreak havoc in the organisation if not implemented correctly. A spirit of error-finding and blaming may pester the organisation.
Therefore it is of the utmost importance that the process of learning from deviations is not in the spirit of blaming for errors but instead takes place in a psychologically safe environment for everybody.
For the debriefing sessions following an error or incident to ensure and promote learning a process based on the process of mediation can be very effective.
To go through a debriefing it is a great help if a facilitator is appointed. The facilitator can be either external or internal depending on the situation. It is important that the facilitator does not have a share in the problem and that he/she is trusted by the participants and has the human skills to create a safe and learning environment.
…when something goes wrong or not according to the plan it constitutes an opportunity for improvement.
Downloaded from http://iwaponline.com/ebooks/book-pdf/651186/wio9781780407586.pdfby gueston 14 January 2022

171decide
Phase 0: Setting the scene
The purpose of phase 0 is to establish a safe psychological environment supporting the learning process. Anybody having experiences both inside and outside of utilities may recognise that a large part of utilities worldwide are not by default characterised as being psychologically safe. For some reason, the communication in utilities is in many cases quite harsh and focused on blaming and a “command and control” paradigm. In that sense, utilities are actually quite old-fashioned and need of recognising this issue in order to transform themselves into safer and more caring organisations. This challenge is further increased by the general increase in stress factors permeating our whole society these years, leading to an increase in problems of stress. It is in this context that a safe environment needs to be created and recreated at each debriefing session.
One way of creating such an environment is to set the debriefing meeting at a different location than normal. However, most importantly, to ask the participants what they need in order to feel safe.
Phase 1: Free story telling
This is the phase at which the actual debriefing starts. The point here is to let everybody tell their part of the story. It is often the case that everybody only holds a few pieces of the puzzle. In order to really deeply understand the causes for an incident it is important that all the pieces are put together so that everybody can see the big picture as well as the small details that contributed to creating the situation. In most cases where incidents happen in utility organisations – or any other organisation for that matter – the incidents are the results of
faciliTaTing conTinual improvemenT Through The mediaTion process”
many small actions that viewed separately are not disastrous, but together can create grave incidents. To take the effort and really understand all the underlying dynamics and ways of thinking that led to the incident is key to learning how to act better as individuals and moving forward as an organisation. As long as the full story is not understood it may be easy to blame. As the story unfolds it will be apparent that all actions are interrelated and everybody contributed or failed to act where they could have.
Examples of needs are:
66 Not to blame each other;
66 That everybody understands the purpose of the process and says so if it becomes unclear;
66 To listen and not interrupt;
66 To be fully honest about what has happened;
66 That you can leave the process if you do not want to continue;
66 That everybody will be heard;
66 That what is said at the meeting is confidential and only the result will leave the meeting.
Downloaded from http://iwaponline.com/ebooks/book-pdf/651186/wio9781780407586.pdfby gueston 14 January 2022

172 smarT WaTer uTiliTies: Complexity made simple
Phase 2: Identifying needs
Behind everything that contributed to making the situation go wrong there will be one or more needs that should be attended to in the future to be able to move forward in a better way. Identifying these needs is not easy and will require the joint effort of all the participants. Again, different perspectives on the situation will reveal different issues. Examples of needs are:
66 Communication about specifications between operations and design departments are crisp clear
66 That the voice of somebody who has seen a potential risk is actually heard
66 Contractors are managed appropriately
Phase 3: Brainstorming on solutions
For each need, several actions and ideas may help to avoid such situations happening again. Before identifying the best solution, it is better to have several solutions to choose from. Here a basic brainstorm should be able to generate different initiatives and solutions. As in all brainstorming, it is key that the idea generation process is separated from the judging process. If the two are done at the same time it is generally known to hinder imagination and creativity. Hence stay with the idea generation for a while and at least till there are more than 2–3 proposals for each need identified in phase 2.
Phase 4: Select which actions to carry out
Selecting the best ideas can be done in many different ways. Looking at the relationship between effect and effort is a good way of sorting things out, which often makes it clear that some low-effort initiatives may create a lot of value and vice versa, see Figure 5.7.
Phase 5: Make a plan
At the end of the debriefing, agree upon a plan stating who is doing what and by when. The rest from there is implementation.
Downloaded from http://iwaponline.com/ebooks/book-pdf/651186/wio9781780407586.pdfby gueston 14 January 2022

173decide
Plan – do – check – act
The plan–do–check–act model is central in the mind-set of continual improvement, see Figure 5.6.
First you plan an improvement (e.g. by the end of the debriefing process).
Then you do, i.e. you do the work that is necessary to execute the planned activities. In the context of continual improvement this may in many cases involve introducing new procedures of working.
After a while, it is checked whether the actions are working, which means studying the results of the new process.
If the results are satisfactory, then that is the new way of acting. Otherwise a new plan needs to be prepared. That is, if the chosen solution, e.g. solution C is not solving the problem satisfactorily, solution B may be initiated and then a second round of the plan–do–check–act round is taken until the problem is finally solved or the process is improved
F igure 5.6: The plan–do–check–act cycle is a central continual improvement process.
Fi gure 5.7: Prioritising various improvement efforts.
Act Plan
Check Do
Suggestion A
Suggestion B
Suggestion C
eFFecT low high
eFFo
rTlo
w
hi
gh
Downloaded from http://iwaponline.com/ebooks/book-pdf/651186/wio9781780407586.pdfby gueston 14 January 2022
174 Smart Water UtilitieS: Complexity made simple
unplanned decision making
“Life is what happens to you when you are busy making other plans” Allen Saunders wrote in 1957 and it is still the case. Regardless of how well everything has been planned something will go wrong on occasions. This is not a theoretical axiom in daily operation of water utility infrastructures, some would argue that that is the daily life in water operations and no single day passes by without some new never-experienced- before emergency happens.
Examples of incidents are:
66 Mechanical problems in water treatment equipment caused by, e.g. clogging or wear;
66 Electrical failure of pumping stations leading to local flooding or sewer overflow incidents;
66 Contamination of drinking water pipe-line system due to, e.g. a power outage and intrusion of water from the outside of the system;
66 Dramatic changes in influent water quality suddenly clogging filters and membranes;
66 External persons doing unforeseen things with the water infrastructure;
66 Sewer overflow killing aquatic life in a stream.
Regardless of how well everything has been
planned something will go wrong on occasion
While some operational upsets are small and others are large, an information infrastructure in the system can be helpful from two points of view:
1. To forewarn of impending problems; and
2. To understand the reasons for incidents that have occurred.
Early warning systems
We have seen some examples of early warning systems. Such a system first assumes that there is some kind of automatic detection of changes in the operation. Naturally, this will assume that there are sensors that provide the first level of information.
The simplest early warnings are of course when a sensor signal deviates significantly from “normal”. In a more elaborate case we may detect a problem when two signals are combined. For example a certain air valve opening should produce a certain amount of air, given the pressure difference. If there is a mismatch between the air flow rate and the valve opening a problem is detected. The information so far is not sufficient to make the final conclusion about the cause of the problem. In a more complex setting a mathematical model can be used. For example, assume that the flow rate and the suspended solids concentration are measured at the inlet of a clarification unit. Under normal conditions the effluent suspended solids can be predicted by the model with reasonable accuracy. If the predicted value and the true effluent suspended solids measurement are too far apart there is an indication of an operational problem. The true reason has to be further examined, but we have a first indication that something is wrong and needs to be observed more closely. Similarly multivariate analysis is another early warning of a problem, when the measurement is located outside a defined cluster area or volume.
Downloaded from http://iwaponline.com/ebooks/book-pdf/651186/wio9781780407586.pdfby gueston 14 January 2022

175decide
Another example is automatic detection of leakage in a distribution pipe. If a burst appears, it is crucial to take action as early as possible to minimize the consequences and the damage caused by the leakage. Therefore it is desirable to detect that a burst has happened somewhere but also to automatically localize the burst as well as possible. Today there are powerful methods developed to perform this. They would give a sufficiently good prediction of the location that will make it possible to readily find the exact location using manual methods.
It should be emphasised that the early warning system does not give the full explanation for the problem appearing. However, it triggers an action to diagnose the abnormal situation so that adequate action can be taken.
Handling emergency situations
While the reader of this book may be an exception, most people are not especially good at dealing with emergency situations. Knowing this, people who are taught first aid are instructed to follow the following sequence of actions:
1. Establish an overview of the situation;
2. Ensure safety by stopping the accident and bringing yourself into safety;
3. Evaluate the situation and carry out life-saving first-aid if necessary;
4. Call for help;
5. Carry out other types of first-aid while waiting for the professionals helpers.
Transforming this plan of actions to the situation of an operational situation, it is clear that you should firstly stop the problem if (1) it is so grave in its development that the additional time it takes to get help will seriously worsen the situation and (2) you can easily, speedily
and without danger to yourself stop the incident from developing. If either of these two conditions is not present the first impulse is to get help.
Since most operational upsets are not emergency situations they may easily develop in that way and then it is important to have some clear line of command and a situation handling plan.
Setting up a smart system for emergency situations
Sensors giving information can help you
66 Get an overview of the consequences;
66 Pinpoint the starting point of the situation;
66 Make early warning of a situation developing;
66 Document the effects of a situation, e.g. for authority reporting;
66 Help you gain control of the situation fast;
66 Give you information about ways of handling the situation;
66 Give you important information for customers on who is affected.
It can be helpful to decide a system of classifying emergencies into different levels of severity and have different kinds of responses.
An example of such a classification for a water utility is shown in Table 5.3.
For each level of emergency it should be decided who needs to be informed, who is in charge of the situation and who is to be brought to the board of decision taking. For the more severe cases, top management, PR staff and highly skilled technical people will have to be included.
Downloaded from http://iwaponline.com/ebooks/book-pdf/651186/wio9781780407586.pdfby gueston 14 January 2022

176 smarT WaTer uTiliTies: Complexity made simple
Table 5.3: Example of classification of operational emergencies.
DESCRIPTION
Threats to human life or health
Threats to property or large potential economic losses
Threats to the environment
Threats to process performance in the short time-horizon (hours)
Threats to process performance in the longer time-horizon (days or weeks)
EXAMPLES
Drinking water contamination or work hazards
Flooding or break down of water supply to water relying industries or to the municipality
Heavy fl ooding of combined sewer overfl ow to vulnerable environments
Non-functional aeration system in wastewater systems
Surplus sludge outtake is impaired leading to a steady increase of suspended solids in the system
IN CHARGE
CEO or chief of operation
Chief of operation
Manager of operation
Manager of operation
Manager of operation
IN THE DECISION LOOP
PRHighly skilled technical peopleManager of operationsAuthorities
Highly skilled technical peopleManager of operationsStakeholders whose properties are at riskPossibly authorities
Highly skilled technical peoplePossibly authorities
Key operational personnel
Key operational personnel
CLASS
level 1
level 2
level 3
level 4
level 5
In these situations there should be a clear structure of command, so that in the best case everybody knows their job and all actions are perfectly coordinated.
Downloaded from http://iwaponline.com/ebooks/book-pdf/651186/wio9781780407586.pdfby gueston 14 January 2022

177decide
Why auTomaTic process conTrol?
From an automatic control point of view, wastewater treatment is best documented and will be used here to illustrate the benefits and the application of process control based on sensors and automation. It has been demonstrated that process control may increase the capacity of biological nutrient removal plants by 10–30% today. The advanced knowledge of the mechanisms involved in biological nutrient removal that is being gained today is producing an increased understanding of the processes and the possibilities for control. There is a sophisticated relationship between the operational parameters in a treatment system and its microbial population and biochemical reactions, and hence its performance. With further understanding and exploitation of these relationships the improvements due to ICA (Instrumentation, Control and Automation) may reach 20–50% of the total system investments within the next 10–20 years. Various case studies of advanced control in water and wastewater treatment systems have shown significant savings in operating costs and remarkably short payback times.
A major incentive for control is the presence of
disturbances, and their impact has to be compensated for.
A major incentive for control is the presence of disturbances, and their impact has to be compensated for. Compared to most other process industries the disturbances to a wastewater treatment plant are significant. The wastewater influent typically varies substantially both in its concentration, composition and flow rate, with time scales ranging from fractions of hours to months. Discrete events such as
automatic decision making: controlControl is at the heart of Smart Water utilities.
This is the transformation of the sensing system
into good automatic decision making. The
control arena has developed rapidly since and
along with the industrial revolution and is today
a quite sophisticated field of expertise. Still
the simple methods of on/off and PID control
will take you a long way in improving plant
operation.
Downloaded from http://iwaponline.com/ebooks/book-pdf/651186/wio9781780407586.pdfby gueston 14 January 2022

178 Smart Water UtilitieS: Complexity made simple
rainstorms, toxic spills and peak loads may also occur from time to time. As a result, the plant is hardly ever in steady state, but is subject to transient behaviour all the time.
Consistent performance must be maintained despite the disturbances. The traditional way of dampening the disturbances has been to design plants with large volumes to attenuate large load disturbances. This solution incurs large capital costs. On-line control systems, which have been demonstrated to cope well with most of these variations, are a much more cost-effective and thus attractive alternative. Disturbance rejection is indeed one of the major incentives for introducing on-line process control.
Too often, unnecessary disturbances are created within the plant itself. Often this depends on a lack of understanding of how the various parts of the plant interact. One example may illustrate the problem: if the influent flow rate cannot be varied continuously but the pumps are operated in an on/off mode, the consequence is that the plant will be subject to sudden flow rate changes. In particular, the clarifier operation will suffer from such sudden flow rate changes.
Most utility operations have the following priorities:
1. Keep the plant running;
2. Satisfy the effluent requirements by controlling key concentrations;
3. Minimise the cost by advanced control.
Minimising the cost includes more advanced control of single variables. By coordinating the control of various plant parts – such as the sludge treatment and the wastewater treatment – the plant operation can be further improved. Finally a system-wide operation is obtained if the sewer operation is integrated with the influent flow pumping control to the wastewater treatment plant.
Time scales
Every operator knows that the plant is never in steady state. Instead most flow rates and concentrations are varying with time. The fact that the plant is a dynamic system also means that the result of a corrective action will take some time; it will never appear immediately. Therefore the time scales of the process changes are so important. The dynamics of a wastewater treatment system involve a wide range of time scales, from seconds to months. Typical time scales in a wastewater treatment plant are:
1. Fast: minutes – hours
2. Medium fast: hours – several hours
3. Slow: days – months
The time scale influences the design of the control strategies. One way to express the control task is – for example – to supply the right amount of air, or add the correct amount of chemicals, or move the sludge to the right place to match the substrate load, at the right time. We can see that there is a wide difference between the fast and the slow timescales. Often it is possible to separate the various control actions into different time domains. This means that in the fast timescale the variables that change very slowly will be considered constant. For example, the dissolved oxygen(DO) controller can act as if the biomass concentration is constant. In the slow timescale, for example, for the control of the total sludge inventory, the DO concentration can be considered to change instantaneously.
Sometimes the sensor time lag has to be taken into consideration. To get a DO reading takes a number of seconds. This delay is small compared to the typical time for a DO change, a fraction of an hour. A respirometer reading will take a longer time, typically half an hour. It is obvious that such a measurement can be used only for slower corrective actions, in the order of hours.
Downloaded from http://iwaponline.com/ebooks/book-pdf/651186/wio9781780407586.pdfby gueston 14 January 2022

179decide
It is always important to consider the dynamics when closing the loop. Sometimes the controllers are tuned to be too “ambitious”. For example, a DO sensor may show a new DO concentration value every 10 s. This does not mean that the air flow rate should be changed so often, since the typical response time in a full-scale aerator is 15–30 minutes. A change of the air flow more often than every minute will only produce meaningless control actions and wear out the actuators. Instead, a control action every 5–12 minutes is more adequate. Then the DO measurement fed to the controller should be an averaged value (and possibly further filtered) over the same time interval of 5–12 minutes.
Modelling for control
Modelling for control is not the same as modelling for understanding basic kinetic mechanisms. Consequently, models like the Activated Sludge Model are not meant to be the basis for controller design. Instead, they represent detailed descriptions of the way we understand the mechanisms of the biological processes. Instead, the models can be used for the testing of control structures and algorithms. Thereby it is possible to test the effect on
efficiency as well as the control structure’s ability to attenuate disturbances.
Open loop and closed loop
To get a proper understanding of control we have to distinguish between open loop and closed loop (feedback) control. Many processes are manipulated without any measurements made.
For example:
66 Sludge scrapers in a clarifier may be operated based only on timers;
66 Screens are cleaned at regular intervals;
66 Air blowers are turned on and off based on timers.
These control actions are examples of open loop control. There is no measurement made. Instead the actuator is working at regular intervals. In other words: after having made the control action there is no confirmation about the result of the action. For better operation it is necessary to make measurements.
The fundamental principle of control is feedback. The process (for example, an aerator, a chemical dosage system, or an anaerobic reactor) is the entire time subject to disturbances. This is why the control action can never be the same. In our daily life we experience feedback all the time. Driving a car is built on feedback: the eyes and the ears are the sensors that measure and monitor the environment, which is changing all the time. Based on this information we make a decision in the brain (our computer). The brain signal has to be transferred to the muscles, the hands and arms (the actuators) and further on to the steering wheel and the speed control of the car.
The open loop examples mentioned above can be converted to feedback (closed loop) control:Figure 5.8: The control process based on feedback.
Process
decision
measUremenTacTUaTor
Downloaded from http://iwaponline.com/ebooks/book-pdf/651186/wio9781780407586.pdfby gueston 14 January 2022

180 smarT WaTer uTiliTies: Complexity made simple
66 Sludge scrapers in a primary clarifier: if the sludge depth in the clarifier is monitored, then the scrapers will start only when the sludge depth reaches a pre-set value;
66 Screen cleaning: the differential pressure over the screen is measured and cleaning initiated when the pressure reaches a pre-set value;
66 Aeration blowers: the DO in the reactor is monitored; based on this measurement a correction of the air flow is made.
Disturbances – the reason for control
The reason for control is the appearance of disturbances. If there were no disturbances we would not need any control! If the effect of the disturbance is measured within the plant, such as a change in the DO concentration, a rising sludge blanket, or a varying suspended solids concentration, the measured information is fed back to a controller that will activate a pump, a valve, or a compressor, so that the influence on the plant behaviour is minimised. Having made the decision it has to be implemented via an actuator, which is typically a motor, a pump, a valve or a compressor. In other words: control is about how to operate the plant or process towards a defined goal, despite disturbances.
If there were no disturbances we would
not need any control!
inTroducTion To The pid conTroller
So, any control system has to include:
66 Measurements – a sensor system;
66 Signal treatment – take away all non-essential data (noise);
66 Decision – calculation of a control action;
66 Actuators – transferring the computer system to “muscles”, to motors, valves, pumps, etc;
66 A goal for the control – this may be, for example, “to keep the flow rate constant”, “to maintain a constant pressure”, “to keep the DO constant”, or “to ramp up the pump speed from zero to full speed”. This goal is often expressed as the setpoint (or reference value).
In control engineering, feedback control is represented by a block diagram (see Figure 5.9) that describes the signals of the control system. This kind of a simple control loop appears in all the local control of levels, pressures, temperatures and flow rates. The controller has two inputs, the measurement (actual) value y and the reference (setpoint) value uc and one output, the control signal u. In this simple case the controller uses only the difference between the two inputs. The controller tries to make the error e as small as possible in the best possible way.
In most process control loops the reference value (setpoint) is kept constant. The process variable is subject to disturbances and the regulator is used to make the process variable approach the setpoint in the best possible way. The all-dominant type of controller is the PID (proportional-integral-derivate) controller.
Downloaded from http://iwaponline.com/ebooks/book-pdf/651186/wio9781780407586.pdfby gueston 14 January 2022

181decide
Referring to the figure the control error is first calculated as:
e = uc - y
where uc is the setpoint value and y the measurement (the sensor signal).
The controller consists of four terms:
u = K • (e + Ti ∫ e • dτ + Td dt )1 de
+ u0
where K is the controller gain, Ti the integral time and Td the derivative time.
66 The first term, the proportional part, reacts at the present control error;
66 The second term, the integral part, sums up all the previous control errors;
66 The third term, the derivative part, predicts future control errors by using the derivative of
the control error, or the rate of change of the error;
66 The last term u0 is used to define the controller output for zero control error.
The controller can be used with all its parts or with only P, PI or PID control. In a large majority of cases the controller is a PI (proportional-integral) controller (Td = 0). Figure 5.10 shows the principal behaviour of P, PI and PID controllers for a step change in the setpoint value. In particular, note that P control cannot eliminate the steady-state offset.
The purpose of the integral part of the PID controller is only to eliminate the stationary error (the steady state off-set), in other words to make e = 0 after some time. The integral action can be understood intuitively in the following way. In steady-state, all variables are constant. For the argument, assume that e would be constant and nonzero. Then the integral part would increase and the u term would increase, meaning that it is not in steady-state. So, the
Figu re 5.9: The PID controller is based on a calculation of the error (e) which is made up of the difference between the setpoint (uc) and the measurement (y). The control law results in a setting of the actuator (u) that affects the process.
conTrol law
–1
Techinical ProcessΣ
uc e u y
conTroller
eXTernaldisTUrbances
Downloaded from http://iwaponline.com/ebooks/book-pdf/651186/wio9781780407586.pdfby gueston 14 January 2022

182 Smart Water UtilitieS: Complexity made simple
only way to keep u constant after a long time is to make e = 0.
One of the most well-known possible sources of degradation of performance is the so-called integrator windup phenomenon. This occurs when the controller output saturates (for example, a valve becomes fully open, or a motor runs at full speed). This problem is of particular concern at the process start-up. In this case the system operates as in the open-loop case, since the actuator is at its maximum (or minimum) limit, independently of the process output. The control error e decreases more slowly as in the ideal case (when there are no saturation limits) and therefore the integral term becomes large (it winds up). Thus, even when the value of the process variable attains that of the reference signal, the controller still saturates due to the integral term and this generally leads to large overshoots and controller settling times.
Most commercial computer based PID controllers today are supplied with anti-windup features. They solve the problem either by putting an upper limit on the integral term or by turning off the integral action when the controller output saturates. A problem with the latter approach is that the actuator or the manipulated variable itself may saturate before the controller output.
Derivative action (the D-part) adds a kind of predictive capability by reacting to the rate of change of the error. In the absence of noise, this adds a stabilising effect, which can counteract the destabilising effect of integral action. However the signal y is often corrupted by noise. To take a derivative of a noisy signal cannot be recommended, since the dy/dt value will become even noisier. This will result in a control signal u that is not smooth at all, and will wear out the equipment and provide a poor control instead of an improved one. So, the use
Figure 5.10: The differences in response of P, PI and PID controllers.
0 2 4 6 8 10 12 14 16 18 20
Time
1.4
1.2
1
0.8
0.6
0.4
0.2
0
Sens
or si
gnal
Downloaded from http://iwaponline.com/ebooks/book-pdf/651186/wio9781780407586.pdfby gueston 14 January 2022

183decide
of the D term should be used with great care and the measurement has to be properly filtered to eliminate undesired noise. Actually the D-term quite unusual in most real-life water system applications.
Feedforward control
Sometimes the disturbances can be measured upstream, before they hit the plant, for example the influent flow rate, or influent COD or ammonia-nitrogen concentrations. Then the information can be forwarded from such a sensor to compensate ahead for the disturbance. Such control action is called feedforward. For example, the aeration can be increased before a load increase hits the plant. Another example is when the return sludge pumping can be increased to lower the sludge blanket as a preparation of the settler for an expected increase in the hydraulic load. The “low level control” includes all control actions that are made to keep the plant running, such as the control of local flow rates, liquid levels, air pressures or various concentrations that are not immediately connected to the effluent quality. However most control actions are based on traditional process feedback control loops.
advanced conTrol meThods
Cascaded control
Figure 5.11 shows how PI controllers can be used as building blocks to build more advanced control structures. The example shows how the effluent ammonium concentration can be controlled by changing the DO setpoint. The DO concentration is controlled by the air flow and the air flow is controlled by changing the valve opening. This is a somewhat extreme example that shows how cascaded controllers can be used.
The advantage of cascaded control is the decoupling of processes with varying time scales.
Generally, the outer control loop, in this case the ammonium controller is the slower controller. This will change the DO setpoint in a slow (hourly or diurnal) timescale. To adjust the DO concentration accordingly the air flow rate will be changed in a timescale of fractions of hours, etc.
On top of decoupling the different time scales this type of control also deals to some extent with difficult non-linearities. In this case the valve has mostly nonlinear characteristics.
However, by measuring the resulting air flow the DO controller does not need to calculate how much the valve has to be opened or closed in order to produce a certain air flow. The DO controller only provides the desired air flow to obtain the DO concentration close to the DO setpoint.
In a group of cascaded control loops, the controller tuning needs to be carried out starting from the fastest loop and moving backwards in the row. That means starting with controlling the valve position and moving backwards to the ammonium controller. The Ti of the integral part will reflect the timescale of the various controllers and generally the Ti of the ammonium control loop will be higher, i.e. the reaction time slower than the following control loops.
There are many other types of ways to improve the control of a process by more advanced control. PI or PID control can be understood as a “one-fits-all” controller – and it does more or less. PI controllers can control most processes. However in the field of control there are many more advanced methods and theories on how to achieve even better performance.
nonlinear control
Non-linear control is one example of more advanced control. Non-linear control is used when the process is non-linear. A typical air flow valve has been mentioned as an example. With most
Downloaded from http://iwaponline.com/ebooks/book-pdf/651186/wio9781780407586.pdfby gueston 14 January 2022

184 smarT WaTer uTiliTies: Complexity made simple
valves the flow increases most while the valve is just slightly open. This means that the difference between 1% and 5% open causes a larger change in flow than opening the valve from 90 to 94%. In the cascade control we avoided the added problem of nonlinearity by the inner loop from airflow rate to the valve opening.
In DO control there is nonlinearity. For low air flow rates the oxygen transfer rate from gaseous oxygen to dissolved oxygen is more sensitive than for high air flow rates. This means that a 10% increase of the air flow at low flow rates will have a larger impact on the DO concentration than a 10% air flow increase at high airflow rate (and consequently high load to the plant). As a consequence, a controller for low loads needs a smaller gain than a controller for high loads.
The non-linearity can be handled by gain scheduling. This means that the gain of the PI controller (K) is different depending on the output of the controller. Another example of handling a non-linearity in the controller is to transform the output signal, so that it acts as if linear. This is known as linearisation, i.e. the
output signal may be squared before sending to the actuator.
Model-based control
Generally speaking, we need models as a basis for controller design. However, for many processes in the water and wastewater industry, a control engineer has used the knowledge of the process and its underlying physics to design very simple controllers, such as PID controllers. Analysis methods can be combined with an empirical approach to the problem to design controllers with an acceptable level of performance. During the last decades more powerful control techniques have been developed and used in various industrial sectors in order to increase their productivity.
A typical example is that of model-based predictive control (MPC) in the chemical industry, where improving the purity of some products by a few per cent can yield very important profits. An interesting aspect of MPC is that it was born more than 30 years ago
Figure 5.11: Example of a cascaded controller for the control of dissolved oxygen in a biological wastewater treatment system.
Pi conTroller Pi conTroller Pi conTroller Pi conTroller
nh4 seTPoinT
do seTPoinT
airFlow seTPoinT
valveseTPoinT
nh4 sensor
do sensor
airFlow sensor
valvesensor
The Processes
moTorvalvemovemenT
Downloaded from http://iwaponline.com/ebooks/book-pdf/651186/wio9781780407586.pdfby gueston 14 January 2022

185decide
and developed in the industrial world, based on a very pragmatic approach to what optimal industrial control could be. It only began to arouse the interest of the scientific community much later. The basic idea is to predict the behaviour of the process at a certain time horizon T. Given the desired performance, we will know where the process should be after the time T.
The controller now can calculate how much to manipulate so that the predicted value reaches the desired value. An MPC controller can perform much better than a PID controller in cases where there are hard constraints on the state variables, nonlinearities or significant time delays. As an example, how much can we improve the operation of a wastewater treatment plant if we can predict the influent load 1, 2, or 12 hours ahead?
Nearly all modern optimal control design
techniques rely on the use of a model of the system to be controlled. As the performance specifications became more stringent with the advent of new technologies, the need for precise models from which complex controllers could be designed became a major issue, resulting in the theory of system identification.
The theorists of system identification quickly oriented their research towards the computation of the “best” estimate of a system, from which an optimal controller could be designed, using the so called certainty equivalence principle: the controller was designed as if the model was an exact representation of the system. However, a model is never perfect, with the result that the controller designed to achieve some performance with this model may fail to meet the minimum requirements when applied to the true system. Robust control became an answer to this problem. It uses bounds on the modelling error to design controllers with
Figure 5.12: A model predictive controller has the ability to predict the behaviour of the process in the near future. A very simple prediction is the D (derivative) part of a PID controller. This simply predicts that the process variable will continue in the same direction for the next sampling interval. A more elaborate model of the process can of course make a more accurate description of the near future behaviour of the variable. In the figure the variable has been measured up until time t. The model predicts that the variable will continue along the blue curve. The target of the variable is along the red curve. The controller now has to calculate a control signal that will bring the process along the red curve,. At the next sampling time t+Dt the procedure is repeated another time step.
t time t+∆ t
Downloaded from http://iwaponline.com/ebooks/book-pdf/651186/wio9781780407586.pdfby gueston 14 January 2022

186 Smart Water UtilitieS: Complexity made simple
guaranteed stability and/or performance. As the identification theorists do not spend much effort trying to produce such bounds in complement to their models, a huge gap appeared, at the end of the 1980s, between robust control and system identification.
During the last twenty years much effort has been expended in order to bridge the gap between robust control and system identification and a new sub-discipline appeared, called identification for control. This became a very active research area during the 1990s. It resulted in iterative schemes in which steps of closed loop identification – using the latest version of the controller – alternated with steps of controller updating, using the most recently developed model.
acTuaTors
Actuators transform decisions to actions, from “brain” to “muscles”. Too often, the actuators can limit the performance of a control system, if they do not have the right flexibility. Try to keep the speed of a car if the throttle can only be maximum or minimum. Or try to steer the car if the steering wheel is not continuously variable, but can only be rotated into a few discrete positions.
In water systems there are a multitude of pumps, compressors and valves. Their functionalities have to be adapted to the specific needs. This means that the capacity of a pump has to fit the actual flow rates or the valve to have a size that fits all possible flows. A valve cannot be more than 100% open and a pump has a given maximum capacity. A poor performance of an actuator can destroy the intention of the best control method.
It was recognised early that actuators may limit the ability of control, for example by having a too low maximum or too high minimum capacity. This is probably the most fundamental
barrier for more widespread acceptance of new control strategies, and many existing water or wastewater treatment plants are not designed for real time control. The ability to adjust the control handles in a continuous way is also of paramount importance to get a smooth and varied operation.
A couple of examples may illustrate the problems. In one small industrial wastewater treatment plant it was desired to perform dissolved oxygen (DO) control. The current DO levels were far too high. It soon appeared that there was no point in trying any control method. The system was extremely over-designed. Three on/off compressors supplied the air and one compressor even had a capacity that far exceeded the need.
In another municipal plant four on/off compressors supplied the air for an activated sludge process. Actually, the average air requirement would be adequately supplied by around 0.6 compressors.
The primary pump for a municipal plant was so over-designed that it needed to be turned on only 5 min/ h to pump the influent. As a result, a huge hydraulic shock upset the plant once an hour, causing difficult settling problems.
Often valves are poorly designed for control. In one plant the valve controlling the influent water had a maximum range of 1 m. However, to control the most common flow rates the valve needed to be operated in the range 0.2 ± 0.02 m. Naturally, this valve change could never be made accurate. So the apparent lesson from these examples is that the right design of actuators is of paramount importance.
On-off control
Both pumps and compressors are often controlled to be either on or off. Such a control is of course simple and low cost, but
Downloaded from http://iwaponline.com/ebooks/book-pdf/651186/wio9781780407586.pdfby gueston 14 January 2022

187decide
often quite inaccurate. Simple systems can be favourably controlled in an on/off mode, like the temperature control of the stove in the kitchen or temperature control of a room from a radiator. When the temperature is below a given value, turn on the heater; otherwise turn it off.
Many pumping systems are operating in on/off mode. When the level of a wet well has risen above a certain value the pump is turned on and when the level has lowered below a certain height, then the pump is turned off.
Such a system is simple and cheap but has several disadvantages. Every time the pump is turned on a certain hydraulic shock is created. When it reaches the sedimentation units the settling or clarifying operations often are deteriorated. The other problem is wear and tear. Too many sudden starts and stops will naturally create mechanical stress on the system, not only on the pump itself but often on the pipe material as well.
Compressors are also often controlled in on/off mode. As for pumps, the mechanical wear and tear may be significant and the resulting control is often not sufficiently good.
Variable speed motors and pumps
For a pump or a compressor there are two principal ways to change the flow rate:
66 Using a throttle valve, or;
66 Changing the speed of the pump.
Reducing the pipe area using a throttle valve will increase the pressure in the pipe, creating a higher load to the pump. As a result, the pump will produce a smaller flow rate. Naturally, this leads to higher energy losses. Still this is a common way to control the flow rate in both liquids and gases because of its simplicity. However, the cost for the energy loss is going to be less and less tolerable. The desired flow rate
could have been produced either with a smaller pump or with the same pump having a lower speed. Control by “throttling” is like trying to control your car’s speed by braking with one foot while continuing to accelerate with the other. Of course there is a waste of energy. Furthermore, it causes excessive wear and tear on the equipment.
A pump with a variable speed motor drive will change the speed (n) to change the flow rate.
The energy loss by throttling is avoided. Consequently variable speed control by means of a frequency converter is a more efficient way of adjusting pump performance exposed to variable flow requirements. This simple approach can significantly reduce the amount of electricity that a motor-pump system uses, and also lengthen the life of equipment that is no longer subject to the jolting on/off braking that results from throttling. Variable speed control is also desirable from a process operation point of view. The sudden hydraulic shocks caused by on/off control are no longer there.
Variable speed control is a proven technology over a wide range of power, from milliwatts to megawatts. It is important to note that a lot of energy is saved using variable speed control. According to the so-called affinity laws the pump flow rate is proportional to the pump speed n. In other words, to double the flow rate requires double the speed. The power P to pump is very sensitive to the speed and increases with the cube of the speed, in other words:
P = g • n3
where g is nearly constant. This means that if the flow rate is reduced to half, then the speed will also be halved. At the same time, this requires only around 1/8 of the power. In reality, the pump efficiency is different at different speeds and flow rates, so the practical relationship between P and n is not as dramatic. Still, this explains why variable speed control is superior to throttle valve control from an energy
Downloaded from http://iwaponline.com/ebooks/book-pdf/651186/wio9781780407586.pdfby gueston 14 January 2022

188 Smart Water UtilitieS: Complexity made simple
point of view. In practice, a reduction of the speed will result in a slight decrease in efficiency. Therefore, to calculate more precisely how much power can be saved by reducing the pump speed, one has to take the efficiency of the frequency converter and the motor into consideration. Still, throttle control required full power even at half the flow rate.
Design for control and efficiency
Usually the flow rate is seldom constant in water operations. Considering this variability it is clear that the pumps and compressors should be designed to have the best possible efficiency at the most common flow rates – air or water.
We should also learn from the bad examples of performance shown earlier that the valves or the motors should not operate in a too narrow range. Then we will lose the accuracy of the control. Furthermore, in most cases it is of great importance to achieve a smooth control action. Therefore, variable speed control is of fundamental importance in most operations.
Note that wastewater pumping usually causes more wear than clean water pumping. Debris accumulates in sewers and inlet pumps. Fats, oils and greases bind surface debris. Rags, paper and other solids bind round pump shafts and impeller vanes. Valves and other hydraulic fittings are potential blockage points. All of this will result in extra energy requirement and it requires extra care in maintenance of these pumping systems.
Often there is more than one way to influence the efficiency. Most often, more than one pump is installed so as to achieve both better reliability and efficiency. If there are low flows, quite often it may be recommendable to install a small pump having the best efficiency at the low flow rates. Another pump can be designed to have the best efficiency at the most common flow rates. Then, for each flow rate it is possible
to configure the best combination of pumps. For the cost–benefit analysis it is obvious that investment costs as well as operating costs have to be taken into account.
conTroller Tuning
Controllers need tuning, i.e. the setting of the controller parameters to sensible values that makes the controller response effective. Take the example of finding the optimum values of PID controller, i.e. K, Ti and Td. Good control performance can be achieved with a proper choice of the controller parameters, but poor performance and even instability can result from a poor choice of values. Controller tuning methods based on the dynamic performance have been used for many decades.
Generally speaking, we have the following qualitative considerations to make concerning the settings of the controller parameters:
66 If the gain K is too small, then the control action will become too slow and the controller is not acting as quickly as we wish;
66 If K is too large, then the controller is too sensitive to disturbances and may overreact. In some cases the controller will cause the system to be unstable, that is, the process variable will oscillate with increasing amplitudes. This is illustrated in Figure 5.13 (left);
66 If the integral time Ti is made short, then the regulator may overreact. It is too “ambitious” to make the error equal to zero, and the control system may be unstable. On the other hand, if Ti is too large, then the error may approach zero too slowly. See Figure 5.13 (right);
66 Ti should be longer than the typical time constant of the individual process unit, so that the error e gradually approaches zero.
Downloaded from http://iwaponline.com/ebooks/book-pdf/651186/wio9781780407586.pdfby gueston 14 January 2022

189decide
Figure 5.13 Left: a P-controller with various K values. Large K values lead to instability (oscillations).
0 2 4 6 8 10 12 14 16 18 20
Time
1.5
1.0
0.5
0
Sens
or si
gnal
1.4
1.2
1.0
0.8
0.6
0.4
0.2
00 2 4 6 8 10 12 14 16 18 20
Time
Manual tuning of PID control is surprisingly common. The tuning procedure relies on the specific properties of the three terms described above. We restrict our discussion to P and PI control because D control is a little specialised. The systematic tuning goes as follows:
1. Determine whether the priority for the closed-loop system is reference tracking (i.e. a setpoint that is changing) or load disturbance (when the setpoint is constant);
2. Determine whether steady-state accuracy is essential to the control system performance;
3. P control tuning: introduce proportional action by increasing the value of the proportional gain K until the speed of the response is acceptable. See Figure 5.13;
4. I control tuning: If steady-state accuracy is considered important, then introduce integral action into the controller by slowly decreasing the integral time from Ti = ∞ (when no integral control takes place) to smaller values. The Ti should be decreased so that an acceptable settle time is achieved;
5. Balancing the controller terms: increasing K may increase the overshoot. To compensate for this, K has to be decreased. A little fine tuning between K and Ti will be necessary to achieve acceptable time responses.
The manual procedure is a trial and error process. It is hoped that steps (4) and (5) will eventually converge to an acceptable solution. Basically, while K changes the speed of response, changing Ti alters the settling time, with a tendency to introduce overshoot.
Excessive overshoot usually needs to be avoided, but the settle time must be reasonably short so that the desired output level is reached. Naturally, the manual tuning method is somewhat laborious, time-consuming and an ineffective use of resources. We can do better by using some system knowledge.
There are smarter methods for tuning controllers, most notably the two Ziegler–Nichols open and closed loop methods. Additionally, there are a number of autotuning methods available that will tune the controller based on analysis of the reaction response curve automatically and while the control loop is in
Downloaded from http://iwaponline.com/ebooks/book-pdf/651186/wio9781780407586.pdfby gueston 14 January 2022

190 Smart Water UtilitieS: Complexity made simple
operation. Most commercial control systems today are supplied with autotuning features.
auToTuning
Today most commercial computer control systems are delivered with PID controllers including automatic tuning, or autotuning. The identification of the process model and the tuning of the controller are made automatically. An identification experiment is automatically performed after a specific request by the operator and the values of the PID parameters are updated at the end of it. For this reason the overall procedure is also called one-shot automatic tuning or tuning-on-demand.
The design of an automatic tuning procedure involves many critical issues. The choice of the identification procedure is usually based on an open-loop step response or on a relay feedback experiment. In the latter case the controller is simply (automatically) replaced by an on-off controller that will cause the process output to oscillate slightly. The process model parameters are found from this identification experiment. Finally a tuning rule is executed. At the end the tuned PID controller will automatically take over the control.
The autotuning methods have been developed over the last two decades and show very good results in the process industry. 6
Downloaded from http://iwaponline.com/ebooks/book-pdf/651186/wio9781780407586.pdfby gueston 14 January 2022

191decide
There are literally hundreds of textbooks on control, so we select a couple of them from this large collection. Automatic control is sometimes called the hidden technology. It appears everywhere around us and we do not even think about it. It is used in the cruise controller in the car, in the temperature control of a room, as well as in the hundreds of thousands of controllers in water and wastewater operations that make sure that flow rates, pressures, levels and temperatures are right. Our own body contains a multitude of control systems, for example, to keep our body temperature at 37°C, despite variations in the surrounding environment. Even if control is applied in completely different areas, there is a common theory that is independent of the applications.
A superior textbook has been published recently: Åström, K. J. and Murray, R. M. (2014) Feedback Systems: An Introduction for Scientists and Engineers. The authors are world leaders in the development of control theory and engineering. The complete book is available for free on the web, called FBSwiki (http://www.cds.caltech.edu/~murray/amwiki/index.php/Main_Page). On this site you will find the complete text of the book as well as additional examples, exercises, and frequently asked questions. Copyright in this book is held by Princeton University Press, who has kindly agreed to keep the book available on the web. Having studied this excellent book you are a long way to understanding control and its applications.
There is a vast literature on control of water and wastewater treatment systems. Olsson, G. (2012) ICA and me – a subjective review. Water Research, 46 (6), 1585–1624, available online at doi:10.1016/j.watres.2011.12.054. is a subjective review of the development of ICA in wastewater treatment during four decades.
The state-of-the-art-report, Olsson, G., Nielsen, M., Yuan, Z., Lynggaard-Jensen, A. and Steyer, J.P. (2005) Instrumentation, Control and Automation in Wastewater Systems. IWA Publishing, London. Presents quite a comprehensive view of ICA in wastewater treatment systems, leading up to 2005, and can still be said to contain all essential information for smart water systems.
The textbook Olsson, G. and Newell, B. (1999) Wastewater Treatment Systems. Modelling, Diagnosis and Control. IWA Publishing, London, contains a more comprehensive account of model building, measurements, monitoring, detection, diagnosis and control of wastewater treatment systems.
SCADA systems are available from several vendors and the best way to get updated information about them is to consult various web pages, for example ABB, Siemens, Schneider Electric, Rockwell Automation.
There are also interesting lectures on SCADA systems and water and wastewater automation on Youtube. Search for “SCADA” or “water automation” on youtube.com
To learn more about strategic thinking, consult articles in Harvard Business Review or some of the leading strategic thinkers, i.e. Henry Mintzberg, Michael Porter, Robert Kaplan or Bruce Henderson. See for example Strategy Safari: The Complete Guide through the Wilds of Strategic Management by Mintzberg, H., Ahlstrand, B. and Lampel, J., Free Press, 2006, Competitive Strategy by Porter, M., Free Press, 1998 and Balanced Scorecard: Translating Strategy into Action by Kaplan, R. and Norton, D. P.Harvard Business Review Press, 1996
Simon Sinek has written a book on the big why called Start with Why: How great leaders inspire everyone to take action, Penguin, 2011.
More to read on control and management
Downloaded from http://iwaponline.com/ebooks/book-pdf/651186/wio9781780407586.pdfby gueston 14 January 2022

The important thing about cases is
That you make examples that are better
Examples are made by people
Examples show that it can be done
They tell you about practice
They tell you about failure
They set the bar
But the important thing about cases is
That you make examples that are better
Downloaded from http://iwaponline.com/ebooks/book-pdf/651186/wio9781780407586.pdfby gueston 14 January 2022

CaSe StUdieS6
Downloaded from http://iwaponline.com/ebooks/book-pdf/651186/wio9781780407586.pdfby gueston 14 January 2022

194 Smart Water UtilitieS: Complexity made simple
real-time monitoring of gangeS river BaSin dUring KUmBh mela Ceremonyby J. raiCh-montiU, f. edthofer, r. WUrm and a. Weingartner, S::Can meSSteChniK gmBh, vienna, aUStria
The Ganges is a trans-boundary river which flows through India and Bangladesh. The 2,525 km river rises in the western Himalayas in the Indian state of Uttarakhand, and flows South and East through the Gangetic Plain of North India into Bangladesh, where it empties into the Bay of Bengal. By discharge, it is the third largest river in the world after the Amazon and Congo Rivers.
An Action Plan was initiated by the Indian Government in 1984 with the financial support of the World Bank and the Government of Netherlands, aiming at the control of the rising levels of pollution. The plan was to identify and mitigate major sources of wastewater and other point-source discharges into the river through the construction of interceptor sewers, sewage diversion mechanisms and sewage treatment plants. Despite substantial investments, since then, no agreement on the effect of the Ganges Action Plan could be found between the stakeholders. One major problem was the lack of data as a basis to evaluate and optimise the effect of the investments.
One major problem was the lack of data as a basis to
evaluate and optimise the effect of the investments.
More recently, the Kumbh Mela ceremony, in which more than 100 million Hindu pilgrims bathe in the Ganges River to wash their sins away, became the focus of interest. To monitor and control pollution during this event, a pilot project was initiated. The installation of a Smart Water quality monitoring network was part of the “Clean Ganges” initiative. Supported by the World Bank, the Central Pollution Control Board (CPCB) assigned s::can Messtechnik GmbH and their local partners with the design and implementation of a 10-station pilot network. The main targets of the pilot were
66 To monitor diurnal variation of different physical–chemical parameters, as well as to detect events from episodic discharges of pollution sources (industrial as well as municipal) along the Ganges River, as a basis to undertake corrective measures before and during the event;
66 To assess reliability and sustainability of smart modern real-time monitoring sensors and technology as a basis for the monitoring and control of pollution along the river basin, in contrast to old-fashioned, reagent based on-line analysers. This network should provide the basis to steer future investments in water infrastructure along least-cost/best-effect tracks, and enable us to evaluate and optimise the effect and sustainability of such investments.
Downloaded from http://iwaponline.com/ebooks/book-pdf/651186/wio9781780407586.pdfby gueston 14 January 2022

195CaSe StUdieS
Figure 6.2: Riverside monitoring station.
Figure 6.1: Floating monitoring station.
Figure 6.3: Overview of monitoring station locations.
deSCription of inStalled BaSe
Monitoring stations were installed by s::can together with local alliances such as companies Aaxis Nano, Tritec, and Techspan, at ten different locations along the Ganges River (see Figure 6.1 and 6.2), to monitor ten parameters each: Total Suspended Solids (TSS), Chemical Oxygen Demand (COD), Biochemical Oxygen Demand (BOD), Electrical Conductivity (EC), pH, temperature, ammonium (NH4-N), nitrates (NO3-N), dissolved oxygen (DO), and chloride.
Interest is focused on organic pollution (expressed by COD and BOD), and on nitrogen nutrients (NH4, NO3). Especially for those normally expensive and difficult to measure parameters, a so far unknown level of reliability and stability has been reached. All parameters are measured by innovative sensors, preferably optical, which are reagent-free and can operate almost without maintenance. There are no moving parts for either the measuring or the cleaning process.
The monitoring stations consist of:
66 4 sensors each to measure 10 parameters (more possible);
66 A station terminal with Postgres database, interfaces for – almost any number of – digital and analogue sensors, SDI-12, Modbus, USB, TCP/IP-Ethernet, 4-20 mA, and other interfaces, integrated GSM/GPRS/3G modem, advanced graphical touch screen interface;
66 moni::tool station and data management, data validation and event detection software;
66 A battery charging system (battery, solar panel);
66 A compressor for automatic air cleaning;
66 Cameras and alarm sirens, security cages and other protection against vandalism.
Downloaded from http://iwaponline.com/ebooks/book-pdf/651186/wio9781780407586.pdfby gueston 14 January 2022

196 Smart Water UtilitieS: Complexity made simple
Figure 6.4: Scheme of the station, sensor, and data management solution provided by moni::tool software.
Although stations are secured against vandalism, local people take care of the stations because they are in favour of such
project to protect their holy Ganges River against pollution.
s::can’s smart monitoring concept and software consists of several modules according to Figure 6.4.
The stations had to be tolerant to extreme environmental conditions (high and low temperatures, and high humidity). Although stations are secured against vandalism, local people take care of the stations because they are in favour of such project to protect their holy Ganges River against pollution.
All real-time data are automatically transferred via a GPRS network to a centrally receiving FTP server located at CPCB central office in New Delhi. The central system has the capability to receive, analyse, display and store the data received from the ten remote monitoring stations, and links the inforwmation to a GIS-system for geographical display and analysis. All the monitoring stations are operational in a real-time mode, and each station can be accessed from the central server.
Smart SoftWare SpotlightS
The purpose of real-time data validation is to detect problems in the measurement data quality. Real-time data correction cleans up undesired data quality problems; however, the primary goal of the data validation step is to provide feedback to the operator, which allows detection of installation and sensor issues, and the taking of measures to improve.
The purpose of the event detection step is to detect alarming changes in the water quality and composition. The event detection system self-learns the typical relation of water quality parameters under normal conditions within typical fluctuation, and compares this baseline to current measurements, to detect any deviations.
In order to verify the behaviour of real-time data validation, and to determine the source of effects detected by real-time data validation, the collected data additionally went through a
Downloaded from http://iwaponline.com/ebooks/book-pdf/651186/wio9781780407586.pdfby gueston 14 January 2022

197CaSe StUdieS
Figure 6.6: The noise detection algorithm measures uses typical deviations of the parameter values from a smoothed time series to estimate the noise level. Deviations from typical noise levels are often an indicator of installation problems such as in this Figure , where the elevated noise level after 04/18 was the result of the monitoring station partly falling dry.
Figure 6.5: The outlier detection algorithm calculates an upper and a lower tolerance limit around a prediction for the next parameter value. Values outside the tolerance are outliers (marked with dashed circles around). The tolerance limits are automatically adapted to the typical prediction errors:
where pi are the actual measurements, si are predicted measurement values and minTol a minimum tolerance.
Tk = Sk ± max(Σi = 1, where no outlier (f ), min Tol)N | pi – si |N
manual offline data analysis validation process.
Three examples of the value of smart data management and real-time analysis are presented here:
1. real-time data validation by vali::tool
vali::tool analyses the data to detect inconsistent noise levels, outliers, data gaps, drops to zero and other features in the data. Figure 6.5 and 6.6 show examples of raw data time series together with validation results.
2. event detection software
The event detection software uses water quality parameters such as TSS, COD, BOD, etc. and their relations, as well as the UV-Vis absorption spectra and ratio of all 250 single wavelengths, to detect deviations in water quality. The software automatically collects data during times of normal water quality, and uses these data as a reference in a (self )-training process. Several learning modes are available, depending on the characteristics of the water. The software learns the normal ranges of the parameters, and the relation between each parameter and the others. The learning is done by a nearest-neighbour type of algorithm in the case of event detection based
Downloaded from http://iwaponline.com/ebooks/book-pdf/651186/wio9781780407586.pdfby gueston 14 January 2022

198 Smart Water UtilitieS: Complexity made simple
Figure 6.7: Results from Varanasi2 station showing battery voltage and the interrupted time series of conductivity and CODeq.
on single water quality parameters. The deviation from the normal values and relations is expressed by an alarm value and is given by:
A = min (Σi )N(rji – pi)2
N
where rji is the parameter i of reference sample j and pi is the parameter i of the current measurement. The alarm value is determined by the reference sample, which minimises the sum in the expression.
This value is low or close to zero for normal water quality conditions; a stable, close to zero baseline indicates a well-trained event detection software. The higher and the more distinct the alarm value, the more abnormal the event. An alarm is set off whenever the alarm value exceeds a pre-defined threshold. The value of the threshold is a configuration parameter that determines the sensitivity of the event detection system.
3. offline data analysis and evaluation
Several stations delivered data with gaps at regular intervals, as seen in Figure 6.7. Typically these gaps followed a daily pattern, with interruption at a certain point in time during the night hours, and auto-restarts in the morning hours.
An analysis of the available data showed that the interrupts occurred whenever the battery voltage dropped below a critical level
Downloaded from http://iwaponline.com/ebooks/book-pdf/651186/wio9781780407586.pdfby gueston 14 January 2022

199CaSe StUdieS
leSSonS learned
Long-term and stable on-line water quality monitoring was achieved at an unprecedented level by using smart on-line monitoring hardware and software.
The identified bottlenecks were:
66 Power supply: for some stations, power consumption had to be optimised to fit to the given size of solar panels and batteries.
66 Hydraulic stability/good installation: some stations had to be removed because water was flooding the cabinets during hard rain events. Waterproof cabinets are considered. During the dry season, some stations fell dry and had to be moved to other locations.
Preventive maintenance concept: although the equipment requires relatively low maintenance, a well-planned preventive maintenance scheme should replace the applied maintenance-on-
demand procedures.
Self-diagnosis feedback: feed the real-time self-diagnosis information about sensor and station health given by moni::tool software back to the maintenance team in order to trigger reactive maintenance, but also to introduce into regular maintenance schedules, and with this, minimise station down time.
The results of the pilot project prove that smart on-line monitoring technologies, our “eyes into water”, are extremely useful to gather an information base which is crucial before deciding about financial investments into expensive infrastructure. Using such dynamic information, the origin, nature and peaks of pollution can be detected and documented. It is possible to assess where to invest next at least cost and best effect, and to optimally select, design and build infrastructure. And finally, control the proper and sustainable operation of the constructed infrastructure, and also to monitor, evaluate and compare the effect of the investments. 6
…smart on-line monitoring technologies, our “eyes into water”, are extremely useful to gather an information
base which is crucial before deciding about financial investments into expensive infrastructure.
Downloaded from http://iwaponline.com/ebooks/book-pdf/651186/wio9781780407586.pdfby gueston 14 January 2022

200 Smart Water UtilitieS: Complexity made simple
Smart water projects are in their early stages. Ideally these projects integrate real time data from numerous water quality sensors and leakage, flow and pressure monitoring as well as other equipment deployed in the distribution network. The data is not viewed in isolation but considered with information systems, network intelligence and reported events prompting decisions to make operational network improvements and enable proactive management of the network.
An instrument installed directly in the pipe by means of a valve, such as the Intellisonde illustrated in Figure 6.8, offers an ideal solution for the real time monitoring, logging and transmission of data from up to eleven water quality sensors all from a single instrument. Parameters include free chlorine, mono-chloramine, conductivity, pH, ORP, dissolved oxygen, turbidity, temperature, flow, pressure and an ion selective electrode (ISE – ammonium or fluoride or nitrate).
The majority of the sensors are on the tip of the instrument as seen in Figure 6.8, others are on the side. The sensors are selected depending on the application and water characteristics. Once the data has been received “Smart Water” models can be produced using data not only from the Intellisonde but also other instruments installed in the network. Correlation of the data provides a valuable insight into network dynamics.
Understanding of data has to start with knowledge of the norm or base. The norm is illustrated by data that is consistent and the point at which it always returns after any unusual events.
To confuse, the norm is not one model, it can differ depending on a number of factors including the geographic location of monitoring
equipment in the pipe network, the country and the type of water in the pipeline. To demonstrate, examples seen in Figure 6.9 and 6.10 represent water quality data from instruments installed in different geographic locations in a town. Both represent normal data over a 7 day period for pH, conductivity, free chlorine and turbidity, yet they differ. Note that the pH and conductivity, which are almost linear in Figure 6.9, display variations in Figure 6.10.
Knowledge of the network helps explain the difference. The sensing equipment in Figure 6.10 is placed close to a location in which the effects of mixing of the two sources of water are observed.
The norm can change along the geographic location of a pipe. It has been observed that as mixed source water travels along the pipe the pH and conductivity can change to that seen in Figure 6.9 The impact of mixing is no longer observed as the distance travelled has meant the water has fully blended.
Having established the norm, Figure 6.11 illustrates the impact of the interruption in
a glimpSe into Smart Water databy Jo Cooper, intelliteCt Water, romSey, UK
Figure 6.8: The sensor.
Downloaded from http://iwaponline.com/ebooks/book-pdf/651186/wio9781780407586.pdfby gueston 14 January 2022

6
5
4
3
2
1
21.81.61.41.21.00.80.60.40.2
19/02 20/02 21/02 22/02DATe
201CaSe StUdieS
flow and turbidity spikes arising upon flow restoration. A number of questions arise, for example, do we know what happened? Did it cause a problem? Were there any customer complaints? Can we predict these events? Smart networks compile intelligence to answer these questions and ultimately enable proactive and efficient management.
An example of proactive management can be seen in Figure 6.12 in the flushing and cleaning of pipe networks. A defined level of turbidity prompts cleaning. Initially real time data indicates when cleaning is required, and then it is used to determine the length of time of flushing to bring the turbidity down to an acceptable level. “Smart” work is scheduled around a need with cost savings rather than on a routine basis.
The data from smart networks presents an opportunity for reduced operational costs,
improving water quality and delivering customer satisfaction through the effective management and rehabilitation of the water distribution network. 6
Figure 6.12: Flushing and cleaning of pipes.
Figure 6.9: Norm – water quality monitoring. Figure 6.10: Norm – mixing of water sources.
Figure 6.11: Impact of flow interruption.
Key points
66 Smart Water projects utilise real time data allowing timely decisions to me made on the management of water networks.
66 Smart Water projects are in their early stages, there is a lot to be learned as the data may not always be as expected, as changes occur in the condition of the network.
66 Before any interpretation of data, there needs to be an understanding of the norm/baseline
12
10
8
6
4
2
500
400
300
200
100
31/7 01/08 02/08 03/08 04/08 05/08 06/08 07/08
12
10
8
6
4
2
500
400
300
200
100
01/11 02/11 03/11 04/11 05/11 06/11 07/11 08/11
DATe DATe
10987654321
1.0
0.8
0.6
0.4
0.2
14/08 15/08 16/08 17/08 18/08 19/08 20/08 21/08DATe
Downloaded from http://iwaponline.com/ebooks/book-pdf/651186/wio9781780407586.pdfby gueston 14 January 2022

202 Smart Water UtilitieS: Complexity made simple
UnderStanding ComBined SeWer overfloWS (CSoS)by nUrUdeen adeyinKa SalaU, KalUndBorg forSyning, denmarK
The connection between human activities and the natural water cycle led to the development of drainage systems in most urban areas in developed nations. Wastewater and storm water are the two major types of water requiring drainage and these two types of water drain with either a separate or a combined sewer system. The separate sewer system transports wastewater and storm water in two separate pipes to a discharge point, outfall or a wastewater treatment plant, while the combined sewer system transports both storm- and wastewater in the same pipe.
During heavy storms, the conveyance of storm water and wastewater in a combined system has remained difficult; as combined sewer systems can only handle a limited amount of flow. The resolution in such circumstances is to provide structures in the sewer system, diverting untreated combined flows above a certain level out of the sewer system into water bodies. These structures are identified as combined sewer overflows or CSOs in urban drainage management, see Figure 6.13.
The application of a short-term measurement campaign
method is indispensable in a CSO modelling project.
The major role of CSOs is to gather inflow during extreme rain events and discharge these flows into two separate outflows by means of a control device commonly known as a weir. When the inflow rises above the weir crest level, the overflow is either stored in a basin or discharged
to water bodies, while the remaining flow in the system is discharged through the combined sewer to the wastewater treatment plant.
CSo management
Modelling and field observations through measurement campaigns are well suited to understanding the extent of CSO problems in a community. Mathematical models can compute important parameters such as the numbers, duration and volume of combined sewer overflows during various storm intensity situations. The models are useful to investigate whether CSOs are in compliance with Government regulative requirements and for upgrading and reducing overflow discharge from weirs.
Measurement campaigns are required to achieve real life short-term CSO data. Such campaigns are accomplished by making temporary (or
Figure 6.13: Combined sewer overflow happens during rain when the sewer cannot handle all the sewage.
CSO
Wastewaterteatment plant
Downloaded from http://iwaponline.com/ebooks/book-pdf/651186/wio9781780407586.pdfby gueston 14 January 2022

203CaSe StUdieS
permanent) installations of rain-gauges and flow and level sensors. These are installed at representative and central measurement positions and at a number of CSO overflow weirs in the area.
For the prediction and management of CSOs, Kalundborg Forsyning uses the Mike Urban model. (www.mikebydhi.com). The model predicts the long-term flow and CSOs generated by each type of sewers. In Mike Urban, the collection system hydraulic module (data of the network of the pipe) is used to model pipes and junctions by solving the complete St Venant’s (dynamic wave) equations throughout the drainage network both looped and branched. This allows for modelling backwater effects, flow reversal, surcharging in manholes, alternating free surface and pressurized flow, tidal outfalls, storage basins, pumps, weirs, orifices, etc.
The application of a short-term measurement campaign method is indispensable in a CSO modelling project. It is unavoidable at the point in the modelling process at which the calibration plot is prepared. The calibration plot is the comparison between (Normal) simulation and short-term field measurement data. A short-term measurement campaign is used to determine the ‘goodness of fit’ of the model and to minimise the difference between normal simulation results and real-life measured field data. After the calibration exercise has been carried out and the goodness of fit of the model is established, Long Term Statistics (LTS) simulation is then applied with standard rain series to calculate flow rates, water levels, the annual average overflow volume, the overflow frequency and the return period for single event overflow volumes.
Site preSentation
Kalundborg utility supplies sewer systems in the municipality of Kalundborg in Denmark. The municipality consists of a medium sized town
with 16.000 inhabitants and four larger villages. The aim is to have working models of the complete sewer system of the municipality. The first step in doing this is to set up a model of one of the villages, Gørlev. The village has 2,500 inhabitants, 39.34 km of sewer pipe system, whereof 36% is a wastewater system, 33% rainwater and 30 % is a combined system. There are four CSO constructed weirs in Gørley. In three pipes the overflows run within the system and in one the overflow runs into a creek called Helsinge stream. The water in the Helsinge stream finally enters the Ornum Bjerge beach. The purpose of the initial work with models is to get an overview of how much the sewer system pollutes the creek by means of CSO.
SeWer SyStem modelling
Modelling of a sewer system has the following main steps:
66 Setting up the model;
66 Calibrating the model;
66 Running the model;
66 Comparing the results of any number of improvement projects;
66 Selecting the best suited solution;
66 Setting up the model.
When setting up a model of a sewer network, the first job is to bring together the available data about the design of the sewer system. In Kalundborg, the geographical information system (GIS) used is called Micro station. The GIS system contains all available information about the sewer system such as invert and ground levels, pipe diameters, weirs, orifices, pumps, valves, surface coordinates, ID numbers, shape, material, etc. These data have been stored continually over many years while the sewer system has
Downloaded from http://iwaponline.com/ebooks/book-pdf/651186/wio9781780407586.pdfby gueston 14 January 2022

204 Smart Water UtilitieS: Complexity made simple
been designed and built as well as based on data stemming from TV-inspections of the older parts of the sewer system (before rigorous registration in geographic information systems). The data format of the GIS system needs to be converted to a data format that the model can read; this is carried out through an XML file that is exported from the GIS system and imported into the modelling software. An overview of the area in the GIS system I shown in Figure 6.14.
For various reasons, the GIS system often lacks some network design data. These need to be estimated or measured in order for the model to be able to run. When ambiguity exists, somebody needs to determine the best approximation to the real practical conditions in the network. Hereby, some error may be introduced; hence it is important to keep track of the effect of these estimates in the final simulation.
The second thing to set up is the correspondence between rainfall and drainage. A storm event consists of rain at a given possibly varying intensity over a certain period of time. It is
possible to apply a “rectangular rain”, i.e. a rain event at a constant intensity over a given period of time. However a better option is to apply data from real rain events recorded over a period of time spanning as many years as possible. A well-known precipitation pattern is the Chicago design storm (CDS) which serves as an input to the drainage system. The pattern is characterised by historical data of rainfall, and it is designed to statistically estimate the average recurrence interval (return period) of different rainfall intensity over an extended period of time. When inputted into the model as time series, it is used to determine the return period of flooding, flow rates, CSOs, etc. For example, CDS statistical estimation can be that a 1 h rainfall with a given intensity in Chicago occurs once in every 5 years. If a sewer network is designed with a 5 year return period CDS time series, it means that flooding or CSOs should happen on average once every 5 years. A 1 hour rainfall occurring more than once in 5 years and/or exceeding this intensity is likely to exceed the full running capacity of the sewer and thereby lead to flooding and CSOs occurring more than once within the 5-year return period. In order to apply the CDS 5 at another location than Chicago it is adjusted to local conditions by changing the geographic coordinate numbers, annual yearly rainfall, mean extreme climatic rainfall days and climate change and uncertainty factor for the particular location.
Finally, the connection between the rain falling on the ground and the amount of water running to the sewer needs to be established. This obviously depends on the type of area being modelled. From a forest or a field not much water will reach the drainage system. From a tightly populated area in the city where all of the area is covered with buildings and roads most of the water will be drained. Finally there are different types of areas in between which will have drainage coefficients between zero and a 100 per cent. To model this, the surface and impervious area can be analysed based on aerial photos or based on local knowledge of the area.
Figure 6.14: The sewer system that is modelled.
Downloaded from http://iwaponline.com/ebooks/book-pdf/651186/wio9781780407586.pdfby gueston 14 January 2022

205CaSe StUdieS
When the set-up has been finalised, the model is ready for its first simulation, or its first “run”. However, even if the model can actually compile results, the model needs to be calibrated before the resulting simulations can be trusted.
model CaliBration
An important part of successful modelling is model calibration and verification. Calibration ensures that the simulated results fit reasonably well with the flow and level observations in the short-term measurement campaign.
However, before there are any data with which to compare, a measuring campaign needs to be carried out. The measurement campaign of Gørlev included the installation of five flow meters, two water level meters and a local rain gauge in the centre of the village. Before calibration could take place, a number of rain events had to be recorded.
The basic methodology of calibration is to adjust the parameters applied in the model in such a way that the results generated by the model resemble the measured data as well as possible. It will in practice be impossible to
have the simulation and the measured data fit perfectly due to the fact that neither the model nor the measured data are perfect. A reasonable fit is found when the dynamics look similar and the timing of events is more or less the same.
The most notable difficulties experienced in the Gørlev CSO modelling project included the complexity of the processes involved in setting up a good model and measuring and estimating insufficient design data from the GIS. Another technical hitch linked that proved time- and resource consuming was preparing the measuring campaign. This included addressing issues such as selection of measuring points, buying and installing sensors, waiting for long enough time-series, and judging if the sensors showed the correct image of the situation. In particular, the questions of where and how many sensors to install are not easy to answer, as it is neither possible nor sensible to measure the complete system. After a massive amount of both practical and modelling work it was possible to get the first calibrated model of Gørlev. One example of the result is shown in the plot, Figure 6.15. This shows the water level at a manhole 702A0230F. For the calibration exercise, upstream catchment contributing runoff to the manhole was defined in the model,
Figure 6.15: Comparison of modelled and measured pressure at a specific node shows good correspondence and hence a good fit of the calibrated model.
1.50
1.40
1.30
1.20
00:00 00:00 00:00 00:00 00:0016/10 18/10 20/10 22/10 24/10
2014
Measured Simulated
Downloaded from http://iwaponline.com/ebooks/book-pdf/651186/wio9781780407586.pdfby gueston 14 January 2022

206 Smart Water UtilitieS: Complexity made simple
rain event data from a local weather service corresponding to the measurement campaign period was used as input time series, and the model reduction factor and initial loss was adjusted several times in order to achieve some goodness of fit. The simulated hydrograph and the observed field data are obviously not perfectly the same, but it is clear that it is the same dynamics that are observed. The simulated timing is very close to that measured, as the events appear at the same points in time and with the same duration, and the water levels reach approximately the same levels. One interesting aspect was that the start and end-time was either a bit too early or a bit too late. This may be caused by the distance from the rain gauge to the contributing area.
Based on a good fit between model water level and actual water level, it is possible to have reasonable trust in the CSO discharge volumes and numbers to be computed in the model long-term statistics (LTS) simulations.
SimUlation reSUltS
The time to harvest the fruits of sewer system modelling is when the model is set up and calibrated. At that point, the LTS simulations can provide the general statistics results showing the average volume, numbers and durations of weir and outlet discharge per year. Additionally, the maximum flow rate from all links (pipes) and nodes (Manholes) can be generated for various periods, for example 1, 2, 5 and 10 years.
Table 6.1: Results of the long-term simulation at different CSO points, shows the flow rate that returns annually, bi-annually and with a return period of 5 years. It shows how much water the system can take (Qfull) and hence the return period (Tfull) of combined sewer overflows taking place at the point
Upstream manhole
658A0090R
703A0040R
703A1050R
703A1030R
703A0020R
703A0010R
703A1040R
703A0060R
703A1020R
703A1010R
Downstream manhole
658A0080R
703A0030R
703A1040R
703A1020R
703A0010R
703U0000R
703A1030R
703A0050R
703A1010R
703A0060R
Pos. [m]
8.972
25.733
26.372
17.652
12.834
5.000
21.160
25.634
17.496
17.975
Flow rate 1 year[m3/s]
0.069
0.386
0.100
0.105
0.377
0.377
0.108
0.390
0.108
0.119
Flow rate 2 years [m3/s]
0.072
0.47
0.129
0.134
0.45
0.45
0.143
0.47
0.137
0.149
Flow rate 5 years [m3/s]
0.078
0.50
0.156
0.151
0.48
0.48
0.175
0.50
0.154
0.164
Qfull [m3/s]
0.061
0.41
0.142
0.141
0.94
2.35
0.15
0.42
0.145
0.147
Tfull [years]
0.53
1.19
3.24
3.47
> 9.23
> 9.23
2.11
1.20
3.63
1.91
General statistics of flow rate from Result File LTS Simulation_for 1, 2 and 5 years return period
Downloaded from http://iwaponline.com/ebooks/book-pdf/651186/wio9781780407586.pdfby gueston 14 January 2022

207CaSe StUdieS
Key points
66 CSO estimation can only be solved by simulation of models or very long-term sensor observations
66 Model calibration has to be carried out carefully by adjusting model parameters to find a good match between the dynamics of the short-term (months) measured data and model simulations of the same period
66 Calibrated models are crucial for effective solutions for CSO control and minimisation.
66 Accurate model calibration can be time- and resource consuming because of the many practical difficulties that may arise during the process of calibration.
Results from the model include statistical data that can be compared to legislation limitations, such as:
66 Flooding on terrain (must not happen more than once every n year).
66 Flooding of basements (must not happen more than once every n year).
66 Discharge from CSO weirs to receiving waters (must not happen more than n times per year).
66 Total volume from CSOs (must not exceed a certain threshold amount per year).
The LTS simulation conducted for Gørlev provided valuable statistics, see Table 6.1, that can be used to evaluate the legislative limitations mentioned above. The maximum flow rate in sewer pipes with a return period of 1,2 and 5 years respectively was predicted, as well as the full running capacity of the pipes (Qfull) and (Tfull) years, and the return period for a full running pipe.
The manhole upstream and downstream denotes the beginning and end of a given pipe. The position in metres denotes the geometric height above or below the earth’s surface, the three flow rates are the flow rates in the pipeline at a return period of 1, 2 and 5 years, Qfull indicates the maximum capacity limit of the pipe, meaning that any flow above the value leads to overflow and Tfull is the same as the return period of an overflow event.
By using this statistics functions, it is possible to identify where pipe capacity is exceeded, resulting in flooding and overflows, and also to compare the effects of various mitigation measures in the planned rehabilitation, the performance of various control strategies, the cost–benefit efficiency of the planned investments, as well as to determine whether the functionality of the sewer system is compliant with legislative requirements. 6
Downloaded from http://iwaponline.com/ebooks/book-pdf/651186/wio9781780407586.pdfby gueston 14 January 2022

208 Smart Water UtilitieS: Complexity made simple
advanCed proCeSS Control in deCentraliSed mBr WaSteWater treatment plantby BhUpendra poUdel and Søren nøhr BaK, grUndfoS, denmarK
One solution to the water availability challenges faced at many locations is the use of decentralised wastewater treatment plants (WWTP). These plants maintain water in the urban water cycle by discharging extra-clean wastewater effluent to rivers or lakes where the water can be re-drawn for potable purposes such as irrigation, industrial processes or even drinking water.
For a decentral paradigm to be attractive the decentralised plant needs to be cost-effective
in investment and operating costs as well as deliver a superior water quality.
For a decentral paradigm to be attractive the decentralised plant needs to be cost-effective in investment and operating costs as well as deliver a superior water quality. Furthermore, in order to ensure low operating costs and reliability, it is essential that the WWTP is operating with a high degree of robustness in order to withstand the changes in the incoming wastewater.
Membrane biological reactors (MBR) have during the recent decade gained more and more popularity due to the advantages of compactness, disinfection, improved effluent quality and robustness. However, in order to ensure robustness in operation for an unmanned WWTP, it is necessary to integrate advanced process control into the logic of the plant.
The combination of reliable online instruments, process knowledge and proactive actions together with robust membranes and equipment are the key factors for advanced process control in decentralised WWTPs with low requirement for manual intervention.
the CaSe
Arla Foods in Vimmerby, Sweden produces powdered milk. As a result of the cleaning of the production plant, wastewater is generated from four large CIP (cleaning in process) plants. The wastewater is characterised as high organic carbon and nitrogen content with varying phosphorus concentrations. High fluctuations in pH and temperature are observed in the wastewater due to the cleaning cycles of the CIP plants.
The wastewater treatment plant is based on a MBR activated sludge process with side stream dynamic ultrafiltration membranes provided by Grundfos BioBooster A/S, see Figure 6.16. The WWTP removes the organic carbon, nitrogen and partially the phosphorus via a biological nitrification/denitrification process supplemented with a chemical precipitation of phosphorus when required.
In order to cope with the large variation in influent and ensure effluent stability, advanced process control is implemented in the treatment plant. Online sensors have been extensively used for overall operational control based on feedback; ranging from aeration control to automatic shutting down of the plant.
Downloaded from http://iwaponline.com/ebooks/book-pdf/651186/wio9781780407586.pdfby gueston 14 January 2022

209CaSe StUdieS
The concept for advanced nutrient control (nitrogen and phosphorus) removal in the plant is discussed in this case.
plant deSCription
A wastewater plant (WWTP) basically consists of four treatment modules based on their functionalities; pre-treatment modules, biological tank modules, filter modules and supply modules.
Wastewater from the dairy industry is pumped to pre-treatment facilities where larger particles (> 0.6–1 mm) are separated by drum screening. Screened wastewater is pumped to biological process tanks where the major biological treatment occurs via the activated sludge process. Influent wastewater is mixed with return activated sludge from membrane filtration in process tanks. Ammonium, nitrate and COD in wastewater are removed by denitrification and nitrification processes in three process tanks (DN-N/DN and N). Phosphorus level in the process tank is controlled either by adding alum or adding phosphoric acid. Mixed liquor suspended solids (MLSS) is pumped to filter modules where solids
from treated water are separated by UF filters. Apart from filtering solids, UF filters are also used to thicken the sludge by dead-end filtration to remove excess sludge from the plant. Permeate (effluent) produced through filtration undergoes a quality check by various online sensors before it is discharged to the recipient. Supply modules consist of equipment required for the WWTP for example: blowers, chemicals, a CIP/CEB system for membranes.
The graphs and table (Figure 6.18) show the total COD, total nitrogen (TN) and total phosphorus (TP) removal efficiency of the treatment plant in dairy wastewater.
Effluent water qualities are maintained below discharge requirements even under larger loading variation as a result of smart process control in the WWTP.
nitrogen Control
Outlet ammonium and nitrate online sensors are the basis of nitrogen control in the plant. They provide feedback signals to the control system. Outlet ammonium level measured by online
Figure 6.16: Arla -Vimmerby MBR WWTP in Sweden based on the Grundfos BioBooster modular concept. The concept of a Biobooster system and similar concepts, which have emerged in recent years, is a modular decentralised wastewater plant that is pre-assembled and can be delivered on trucks on site. The modularity allows for easy extending of the plant in case of increased load and vice versa.
Downloaded from http://iwaponline.com/ebooks/book-pdf/651186/wio9781780407586.pdfby gueston 14 January 2022

210 Smart Water UtilitieS: Complexity made simple
Figure 6.18: Inlet and outlet wastewater parameters in the MBR WWTP.
6000
5000
4000
3000
2000
1000
02013 2014 2014 2014 2014 201418/12 02/01 17/01 01/02 16/02 03/03
Total COD removal (discharge limit-60 mg/L)
Inlet
COD
[mg/
Lit]
Outle
t COD
[mg/
Lit]
200
160
120
80
40
0
Discharge Limit, COD Inlet COD Outlet COD
40
30
20
10
02013 2014 2014 2014 2014 201418/12 02/01 17/01 01/02 16/02 03/03
Total Phosphorus removal (discharge limit-0.5 mg/L)
Inlet
TP [m
g/Lit
]
Outle
t TP
[mg/
Lit]
2.0
1.5
1.0
0.5
0.0
Discharge Limit, TP Inlet TP Outlet TP
400
320
240
160
80
02013 2014 2014 2014 2014 201418/12 02/01 17/01 01/02 16/02 03/03
Total Nitrogen removal (discharge limit-20 mg/L)
Inlet
TN [m
g/Lit
]
Outle
t TN
[mg/
Lit]
60
50
40
30
20
10
0
Discharge Limit, TN Inlet TN Outlet TN
Parameter (mg/L) Inlet OutletCOD total 3360 <30
Total N 258 0.51
Total P 23.6 0.18
Figure 6.17: Process flow diagram of the Arla-Vimmerby MBR WWTP.
Downloaded from http://iwaponline.com/ebooks/book-pdf/651186/wio9781780407586.pdfby gueston 14 January 2022

211CaSe StUdieS
sensors is used for changing the DO setpoint in the nitrification (N) tank and changing the aeration duration in the nitrification/denitrification (N/DN) tank.
Under increasing effluent ammonium level, the first DO set point in the N tank is changed to a higher value providing more oxygen to the nitrifiers. If the high DO level in the N tank is not enough, then the aeration duration in the N/DN tank is increased gradually until the effluent ammonium concentration is below the discharge limit. Aeration duration in the N/DN is increased or decreased by half an hour every 2 h (user setting) based on feedback from the effluent online ammonium sensor.
During high (> 3 mgNH4-N/L) effluent conditions (between > 1 to 3:30 AM), the DO set point was automatically shifted to 2 mgO2/L and during normal (<3 mg NH4-N/L) effluent conditions, the DO set point was shifted back to 1.5 mgO2/L.
Higher DO level in the N tank enhanced the nitrification capacity and was able to reduce the NH4-N level back to normal after 3 h, preventing risk of continuous increase in effluent NH4-N, which might be the case in absence of such process control.
During further increased loading situations the proportion of aerobic (‘A’) and anoxic (‘O’) duration in the N/DN tank was controlled based on online effluent NH4-N measurement. After the first process cycle of ‘A’ (½ h) and ‘O’ (1½ h), effluent NH4-N did not drop below the high limit; therefore ‘A’ and ‘O’ duration were increased and decreased by ½ h respectively in the next cycle. The effluent NH4-N stabilised and started to decline after 4 h.
Automatic adjustment of the DO setpoint in the N tank and change in A/O duration in the N/DN tank enables the plant to maintain stable effluent ammonium level together with optimising aeration cost at the same time. This
Figure 6.19: Automatic adjustment of oxygen setpoints in the N tank based on the outlet ammonium level.
Figure 6.20: Changes in operation pattern of the N and N/DN tank under normal and high effluent ammonium levels.
Figure 6.21: Increasing aeration durations in the N/DN tank due to a high effluent ammonium level.
Downloaded from http://iwaponline.com/ebooks/book-pdf/651186/wio9781780407586.pdfby gueston 14 January 2022

212 Smart Water UtilitieS: Complexity made simple
approach of advanced nitrogen control is crucial under high nitrogen loading or poor nitrification processing in the plant.
phoSphorUS Control
Due to change in production and the CIP cleaning cycle in the upstream factory, the C:P ratio in the influent wastewater frequently changes. Under low influent C:P ratio, automated alum dosing is activated in the plant to reduce the effluent phosphorus level. Whereas under high C:P influent ratio automated P source dosing is activated in order to maintain enough phosphorus level in the plant for biological sludge growth.
The WWTP has two levels of alum dosing control:
66 When the effluent phosphorus is above the discharge limit then PID control alum dosing is activated in the N tank. PID controlled dosing flow is based on a feedback signal from an online phosphorus analyser located at the effluent side.
66 If this first level of phosphorus control is not sufficient, then a step controlled alum dosing activates in the inlet wastewater entering the DN tank.
Flow proportional step controlled alum dosing is also based on the online phosphorus analyser and increases or decreases depending upon the effluent phosphorus level. Such a second level of alum dosing is effective, whenever there is a very high phosphorus concentration in the influent wastewater.
Figure 6.22 shows activation of the PID controlled alum dosing in the N tank when the effluent phosphorus is higher than the discharge limit of 0.5 mg/L. It also illustrates the activation of step dose alum dose once the PID controlled alum dosing cannot reduce the effluent phosphorus concentration under a very high phosphorus loading condition in the plant.
A long duration of a high C: P ratio in the plant is detected by an online phosphorus analyser measuring low level of phosphorus in the effluent.
Figure 6.22: Alum dosing control in the plant under high and very high effluent phosphorus levels.
Downloaded from http://iwaponline.com/ebooks/book-pdf/651186/wio9781780407586.pdfby gueston 14 January 2022

213CaSe StUdieS
Key points
66 Small decentralised plants make it possible to preserve the water resource locally
66 The business case for control on these small plants makes sense as it makes the plants extremely autonomous and hence requires only minor human attention.
In order to maintain an optimal level of phosphorus in the MLSS an automatic controlled P source dosing is activated in the plant. Such P dosing is automatically stopped when the phosphorus concentration in the effluent is above the desired level. This strategy also relies on the online analyser.
Controlled P-source dosing is activated in the DN tank when the effluent phosphorus is below 0.1 mg/L for a long duration, which results in a high C:P ratio. P source dosing is stopped once the PO4-P reaches 0.3 mg/L, which is the desired P level in order to maintain an optimal C:P ratio in the process tanks.
reSUltS
In spite of considerable variations in the COD, P and N content the plant maintains the effluent concentration not only below the required limit but also with very small variation. This shows that the control scheme efficiently handles the incoming disturbances by adjusting the operational mode accordingly.
Auto-adjustment of the plant operating conditions has made it possible to operate the plant with minimum manual interventions under those variations. The operator man-hours are typically spent to ensure supply of chemicals, sampling and calibration of sensors.
From a water reuse perspective, one of the key elements is to establish stable effluent qualities from WWTPs. Integrated smart process and instrumentation control has made it possible to achieve such a goal in this milk powder WWTP. 6
Downloaded from http://iwaponline.com/ebooks/book-pdf/651186/wio9781780407586.pdfby gueston 14 January 2022

214 Smart Water UtilitieS: Complexity made simple
paradigm Shift in SenSor USage: from meaSUring tool to proCeSS UnderStanding and intelligent Control by anitha K. Sharma, development engineer at avedøre WaSteWater treatment plant, BiofoS, denmarK, dUring 2006-2009, & thomaS gUildal, proCeSS engineer, BiofoS
Figure 6.23: The four pillars of ICA.
The four pillars of ideal instrumentation, control and automation are:
66 A fully committed qualified team taking ownership and continuous improvement efforts;
66 A monitoring system to gather, quality control and display data;
66 A control system to operate ;
66 Adequate instrumentation to gather important information.
At the first ICA conference held in 1973, instrumentation was identified as a key issue. The same need for adequate instrumentation was identified two decades later at the specialised
ICA History at Avedøre WWTP
66 1996–1997: WWTP upgrading, new SCADA, testing of Danfoss NH4-N sensors
66 1997–1998: Installation of Danfoss NH and Dr. Lange NOx sensors
66 2001: Installation of Dr. Lange PO4 sensors
66 2003: Advanced control, whereby one of the four lanes was equipped with sensor configuration
66 2006–2008: Upgrading another lane with full instrumentation and new improved controls
66 2008: Introducing less expensive ion selective sensors for ammonia and nitrate, so at least one nutrient sensor is present in all the lines
The dedicated development department takes ownership and makes continuous improvement efforts including two large development projects in collaboration with industries and universitie.
ICA
Owne
rship
and c
ommi
tmen
t
Monit
oring
syste
m
Contr
ol sy
stem
Instru
menta
tion
Downloaded from http://iwaponline.com/ebooks/book-pdf/651186/wio9781780407586.pdfby gueston 14 January 2022

215CaSe StUdieS
conference in 1995 at Copenhagen, which is where the present case is from and illustrates the importance of the four pillars of an ideal ICA based on two decades of experience from the Avedøre Wastewater Treatment Plant. The focus is mainly on the sensors/analysers, and illustrates the importance of the regular maintenance, control and validation routines in collecting reliable data. Furthermore, examples are given on how a committed and qualified team can utilise the data and gain improved process understanding as well as develop new control algorithms, whereby the treatment efficiency is improved and the operational expenses are reduced.
Figure 6.24: Aerial view of Avedøre WWTP.
Figure 6.25: Instrumentation at Avedøre WWTP.
avedøre WaSteWater treatment plant
The Avedøre wastewater treatment plant (AWWTP) is one of the three WWTPs run by the BIOFOS utility and is located south of Copenhagen Denmark; it is the third largest WWTP in Denmark serving a population of about 260,000 inhabitants plus industry. The plant’s designed capacity is 345,000 PE (1 PE = 60 g BOD/d) and has tertiary treatment with biological nutrient removal as well as chemical phosphate (P) removal using iron.
The biological part of the plant consists of four parallel lanes and each lane consists of two interconnected biological tanks and two clarifiers. The nutrients removal is based on the BioDenitro principle during dry weather operation, in which both nitrification and denitrification is achieved through a repeating cycle of alternating anoxic and aerobic phases in the two interconnected tanks – without employing separate anoxic reactors or internal recycle streams. Chemical P removal is achieved using an iron based chemical. Figures 6.24 and 6.25 give an overview of the treatment steps at the plant and the position of various sensors.
NH4 NO3
DO PO4 DO
DO MLSS DO
Aeration Tanks Secondary settlers
NH4 NO3
DO PO4 DO
DO MLSS DO
Qbio
reTUrN ACTIVATeD SLUDge (rAS)
IrON ADDITION
QFe QrAS, SS
MLSS
SBL
SBL
SS
SS
QrAS, SS
Qeff, PO4, TP, SS
eFFLUeNT
Downloaded from http://iwaponline.com/ebooks/book-pdf/651186/wio9781780407586.pdfby gueston 14 January 2022

216 Smart Water UtilitieS: Complexity made simple
importanCe of relevant neCeSSary Control roUtineS
Various filtering techniques are available to remove abnormalities such as peaks, constant values, missing data. However, the data quality available from the instruments depends mainly on how well the instruments are maintained, controlled and validated. These routines are even more important in a sewer and a WWTP since the instruments here are exposed to harsher conditions. Unfortunately, the importance of this is rarely acknowledged among the management and maintenance team and since maintenance and quality control is highly time consuming, this activity often has a low priority and is sometimes neglected.
Maintenance, control and validation procedures depend on the type of instrument in question. In 2003 the ISO standard 15389:2003 was released, which describes the performance testing of on-line sensors/analysing equipment for water in a laboratory under controlled conditions and in the field under real-life conditions. In connection with the implementation of advanced online control in 2004 at Avedøre WWTP, new maintenance, control and validation routines were established. Maintenance was performed according to the instrumentation manufacturers manual, whereas control and validation of the instruments were carried out every 2 weeks, whereby a sample was taken and analysed in the laboratory and compared with the sensor/analyser data. In case the value exceeded a predefined value, proper action was taken depending on the sensor.
Two years after the introduction of control and validation routines the collected data was evaluated in order to see how the sensors were performing and whether the control routines could be improved. Furthermore the management was also interested in reducing the frequency of control and validation since these routines were time consuming.
The main conclusions from the data analysis of the control routines for nitrate (Dr. Lange Nitratax sensor), ammonia (Danfoss Evita analyser), and phosphate (Danfoss Evita analyser) are presented here.
nitrate sensor
66 Data from three different sensors were analysed and 56–73% of the sensor data deviated by +/- 0.5 mg/l compared to the laboratory data;
66 Investigations showed that the main reason for this is how the wiper is set, especially at low concentrations and the measuring frequency when the sample was taken. See Figure 6.26;
66 Change in procedure: the wiper mode was changed from single frequency to double frequency; measurement interval during control was changed from 5 min to 1 min.
ammonia and phosphate sensors
66 Generally the differences between the lab and analyser data were within the control limits,
Figure 6.26: Wiper frequency vs. measurement of the Nitratax sensor.
6
5
4
3
2
1
00 15 30 45 60 75 90 105 120
TIMe (MIN)
Nox
(mg-
N/L)
Single wiper fequency Double wiper fequency
Downloaded from http://iwaponline.com/ebooks/book-pdf/651186/wio9781780407586.pdfby gueston 14 January 2022

217CaSe StUdieS
however, the collected data were in the lower concentration range of 0–2 mg/l and the data was accepted if the difference between lab and analyser value was within +/− 0.5 mg/l, which is very high;
66 The performance of the analyser depended on when the sample was taken; the performance was usually poor just before the automatic cleaning, before the calibration and a couple of weeks before chemical change;
66 Performance also depends on which analyser kit was used to compare the values. See Figure 6.27;
66 The measured value was not the value entering into the monitoring and control system, due to conversion error from the instrument to the monitoring system.
Suggestions for improvement
66 Take an average of the different values during sampling;
66 Note the time of sampling;
66 At each control ensure that there is no error between the measured values and the value entering into the monitoring system.
Figure 6.27: Performance of Danfoss Evita Ammonia analyser.
1.5
1.0
0.5
0
–0.5
–1.0
–1.5
Anal
yser
-Lab
(NH 4-N
mg/
L)
Amonia in Lab (NH4-N mg/L)
0.015-2 mg/L
1-12 mg/L range kit
SenSor data leading to proCeSS UnderStanding and diSCovery of neW Control algorithmS
The biological nutrient removal at Avedøre WWTP is based on the BioDenitro principle. Since the WWTP is not designed to have biological phosphorus removal, biological phosphorus removal can be achieved by allowing sufficient anaerobic time in the aeration tanks when the load is low. Even if the discharge limits are reached, the WWTP tries to reduce the nutrient concentration in the effluent even further to achieve economic benefits. This is because in Denmark, a WWTP pays green taxes based on the amount of nutrients discharged. Therefore, chemicals are added to further reduce phosphorus levels and calculations considering green taxes and the price of chemicals show that economically optimal effluent total phosphorus (TP) concentration at Avedøre WWTP is around 0.5 mg/l, because at concentrations below this level the cost of chemical additions for phosphorus removal is higher than the green taxes.
Chemical dosage is controlled using a combination of two phosphorus sensors: one situated at the middle of the aeration tank and the other just before the effluent from the WWTP, and is achieved using the following equation:
Chemical dosage = constant + variable
The constant was derived based on the average outlet phosphorus concentration from the aeration tank and is constant for a day, whereas the variable is based on the actual concentration measured in the outlet of the WWTP.
However, the data analysis showed that applied control had a negative effect on the biological phosphorus removal and on chemical dosage. One of the reasons is that the variable was based on the phosphorus in the outlet. However, the high
Downloaded from http://iwaponline.com/ebooks/book-pdf/651186/wio9781780407586.pdfby gueston 14 January 2022

218 Smart Water UtilitieS: Complexity made simple
concentration in the outlet was not coming from all the tanks but mostly from tanks where the sludge blanket level is very high, see Figure 6.28 for the effect of sludge level on TP in the effluent.
Therefore the control was changed. The constant term was removed and the variable was derived based on the concentration measured in the outlet from the aeration tank. Furthermore, the sludge blanket height was controlled so that it didn’t exceed 1.5 m.
Figure 6.29: Chemical dosage using old control (a) and improved control based on information from the sensors and process understanding (b).
OLD
CONT
rOL
New
CON
TrOL
1.6
1.2
0.8
0.4
0
TP in
the e
fflue
nt (m
g/L)
0 1 2 3Sludge blanket height (m)
reference experiment
Figure 6.28: Effect of sludge blanket height on TP in the effluent.
The other observation made was that when the variable was derived based on the actual concentration measured in the outlet from the aeration tank, the dosage was only correct for half the time. This is because the phosphate analyser was only installed in one of the two aeration tanks due to the high capital and maintenance costs.
The collected data show that a reliable software sensor can easily be developed in the tank without analyser based on the phase length and phosphate concentration measured, and this was developed and implemented.
Calculations show that these improvements resulted in approximately 30000 Euro/year in reduced chemical consumption.
A
B
Downloaded from http://iwaponline.com/ebooks/book-pdf/651186/wio9781780407586.pdfby gueston 14 January 2022

219CaSe StUdieS
Figure 6.30: Oxygen concentration profiles with all 8 mixers (a) and 4 mixers (b) during an aeration cycle. For more information read text.
Figure 6.31: Vertical and horizontal position of oxygen concentration profiles.
Figure 6.32: Field setup for measuring oxygen concentration profiles.
proCeSS UnderStanding leading to improved aeration and redUCed nUmBer of SenSorS
Here is a case illustrating how information collected from sensor data can be used to improve the process understanding and thereby:
66 Change the design guidelines
66 Reduce the energy consumption
66 Improve the treatment efficiency
During wet weather conditions, the treatment process switches to the aeration tank settling process, in which settling is allowed in the aeration tanks to increase the settler capacity and thereby increase the hydraulic capacity of the WWTP. The aeration tanks are equipped with mechanical surface aerators for aeration and eight mixers, each one with 4 kW power capacity, to achieve the required guideline value
of 3 W/m3 to keep the solids suspended. The annual electricity consumption for the mixers is 1.5 GWh/year. The operation during ATS showed that the treatment capacity was not affected. Therefore experiments were conducted to investigate the possibility of shutting down two and/or four mixers in order to reduce the energy consumption.
The effect of reduced mixing was evaluated for: flow velocity, sedimentation of SS, concentration gradients with depth for oxygen and SS, electricity consumption, chemical consumption and treatment efficiency with respect to COD, TN and TP.
Figure 6.25 shows the position of mixers, surface aerators and dissolved oxygen sensors in the
0.4 m fra mv
2.85 m fra mv
3.85 m fra mv
5.25 m fra mv
7.3 m fra mv
1.81.61.41.21.00.80.60.40.2
0
1 2 3 4 5
0.4 m fra mv
2.85 m fra mv
3.85 m fra mv
5.25 m fra mv
7.3 m fra mv
1.81.61.41.21.00.80.60.40.2
0
1 2 3 4 5
A
B
Downloaded from http://iwaponline.com/ebooks/book-pdf/651186/wio9781780407586.pdfby gueston 14 January 2022

220 Smart Water UtilitieS: Complexity made simple
aeration tanks. Figure 6.30 shows the vertical and horizontal oxygen concentration profile when all the mixers are running (a) and when only 4 mixers (50%) are running (b). Figure 6.31 shows where the oxygen concentrations profiles were measured and Figure 6.32 shows the field setup for measurements.
Based on the results from extensive full-scale investigations and long-term operation of the WWTP with reduced mixing in aeration tanks it was concluded that the mixing capacity can be reduced by 50%. The only negative effect observed with reduced mixing was decreased flow velocity; however the flow velocity did not decrease below the critical limit of 0.2 m/s. The results did not show any negative effect on oxygen concentration gradients with depth, SS concentration gradients with depth, or effluent quality. As a result of these investigations the entire plant has been operating with 50% of its designed mixing capacity since September 2007 and the estimated electricity savings are 0.75 GWh/year. 6
Key points
66 A committed, qualified team taking ownership and continuous improvement efforts is very important to achieve a successful implementation of ICA, which can lead to economic benefits in terms of reduced energy, chemical consumption, reduced number of sensors and environmental benefits in terms improved water quality.
66 Maintenance, control and validation of sensor routines are important, and necessary information should be gathered during these routines.
66 Water quality and processes are dynamic, therefore continuous effort is required to understand them and take the necessary actions for optimal real-time control.
referenCeSFor more detailed information on the case please read: Sharma, A.K., Guildal, T., Thomsen H. R., and B. N. Jacobsen (2011) Energy savings by reduced mixing in aeration tanks: results from a full scale investigation and long term implementation at Avedoere wastewater treatment plant. Water Science & Technology , 64(5), pp. 1089−1095.
Downloaded from http://iwaponline.com/ebooks/book-pdf/651186/wio9781780407586.pdfby gueston 14 January 2022

221case studies
Advanced process control has the ability to allow the full performance potential of your wastewater treatment plant to be realised by taking advantage of existing but unused capacities. In plants that are nearing their capacity limits this can lead to improved effluent quality and process stability. In plants that are under capacity, advanced control can allow you to operate your plant closer to effluent limits in order to achieve cost savings. While the benefits of a well-designed control solution are often clear, there are obstacles to implementation of these solutions in the field that can make it difficult to realise all the potential benefits.
Often the most significant obstacles is a seemingly trivial issue such as poor data quality caused by sensor calibration and maintenance issues or lack of communication between plant designers, process engineers, control engineers, and plant operators. This case study will highlight the major obstacles in implementing advanced control solutions and present practical solutions tested in practice.
Ideally, plants should also be responsive so that the dynamics between the manipulated and
controlled variables are fast.
proBlem Statement
As with all complex systems, there are technical and non-technical obstacles when designing, implementing and operating control solutions for water resource recovery facilities (WRRF).
oBStaCleS to advanCed proCeSS Control
A number of different disciplines are involved in designing and operating a WRRF, and their goals and perspectives can vary. From a control engineering perspective, the plant should be designed with control in mind (Marlin, 2000).
This means that appropriate measurements and manipulated variables must exist to facilitate control. The manipulated variables should have enough flexibility to allow a controller to provide good performance.
The plant should be easy to control. Plants with enough buffer capacity or inventory to dampen disturbances are typically easier to control. Of course, this is often at odds with the desire to produce plant designs with a low capital cost. Ideally, plants should also be responsive so that the dynamics between the manipulated and controlled variables are fast. This can be difficult to achieve with some loops in a WRRF due to the slow growth dynamics of the activated sludge and digestion processes.
Proper control calculations are used. This means that basic signal processing is in place, proper
model-SUpported deSign, teSting, and implementation of proCeSS Control StrategieSby leiv rieger (inCtrl SolUtionS, oaKville, ontario, Canada), JenS alex (ifaK e.v., magdeBUrg, germany) and oliver SChraa (inCtrl SolUtionS)
Downloaded from http://iwaponline.com/ebooks/book-pdf/651186/wio9781780407586.pdfby gueston 14 January 2022

222 Smart Water UtilitieS: Complexity made simple
control algorithms are used, the controllers are properly tuned, protection is put in place for integral windup and derivative kick, and limitations are placed on controller outputs and the rate of changes in controller outputs.
The control equipment is properly selected. Consideration must be given to avoiding wasteful excess equipment such as blowers, pumps, and valves.
Obviously, not all these criteria can be satisfied perfectly in the context of a WRRF and compromises must be made. The difficulty is that in the typical design and operation of a WRRF, decisions that affect these criteria are often not all made in consultation with the control engineers and the plant operations staff.
For example, the design of a WRRF is typically handled by a design team that sizes the process units and selects all the equipment. The control engineers may only have input into the control narratives for the plant and only make suggestions as to equipment selection and implementation of the control algorithms. Implementation of the control systems is typically handled by a third-party and relies on their experience in interpreting the control narratives.
Once commissioned, the maintenance of the control system becomes the responsibility of the operations staff. As a result, issues such as sensor data quality assurance and quality control, poor controller tuning, and actuator limitations become issues that must be dealt with by operations staff.
The most challenging technical obstacles are often related to data – data availability, data quality, and data analysis and usage. To be successful, a control system must have reliable input and output data. In our experience, the most important technical issues that should be addressed before any process control solution can be operated sustainably are as follows:
data quality of on-line sensors: without proper QA/QC (quality assurance/quality control) procedures for the controller inputs, sustainable operation of control systems with a manageable risk of failure is not possible. With inaccurate inputs, even a well-designed control system will have compromised control performance which will inevitably lead to the controller being placed in manual mode by operations staff.
maintenance of sensors and equipment: maintaining on-line sensors and equipment is labour-intensive and needs to be optimised to achieve the savings possible with advanced control. Data quality is directly related to the maintenance of sensors and plant equipment.
Sensor response time: consideration should be given to the response times of the selected sensors. Sensors with a slow response time could lead to poor performance or instability in a control system. This also applies to analogue or digital filters within the control loop.
providing information and criteria for decision making: in open-loop decision support systems, one of the biggest obstacles is to provide the most relevant information and clear decision criteria to the plant operators. Excessive and unnecessary data can become a burden to operators.
Controller iSSUeS
Controller tuning is obviously very important as an incorrectly tuned controller can be unstable or inefficient. One of the major issues is that the control loops in a WRRF are often non-linear so that the tuning of the controllers must be revised over time. This is difficult for operators to perform in an operating WRRF as it requires either trial-and-error or plant tests both of which are often impractical or require expert knowledge. Controllers are ideally designed,
Downloaded from http://iwaponline.com/ebooks/book-pdf/651186/wio9781780407586.pdfby gueston 14 January 2022
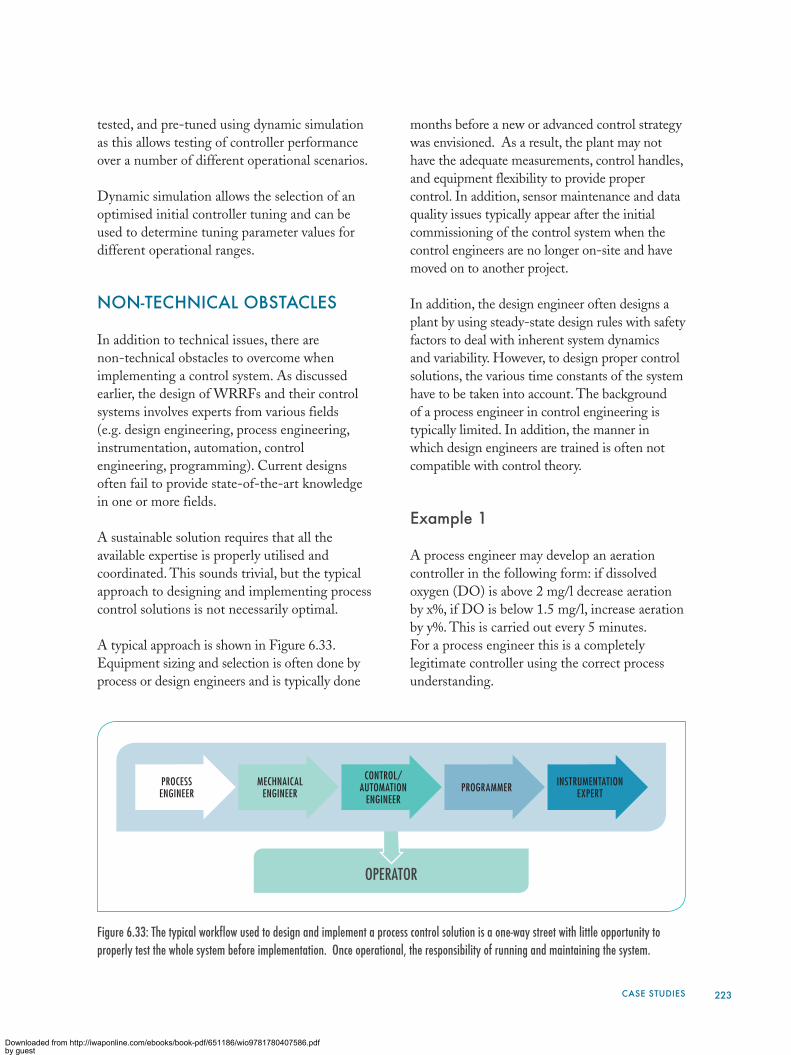
223case studies
tested, and pre-tuned using dynamic simulation as this allows testing of controller performance over a number of different operational scenarios.
Dynamic simulation allows the selection of an optimised initial controller tuning and can be used to determine tuning parameter values for different operational ranges.
non-teChniCal oBStaCleS
In addition to technical issues, there are non-technical obstacles to overcome when implementing a control system. As discussed earlier, the design of WRRFs and their control systems involves experts from various fields (e.g. design engineering, process engineering, instrumentation, automation, control engineering, programming). Current designs often fail to provide state-of-the-art knowledge in one or more fields.
A sustainable solution requires that all the available expertise is properly utilised and coordinated. This sounds trivial, but the typical approach to designing and implementing process control solutions is not necessarily optimal.
A typical approach is shown in Figure 6.33. Equipment sizing and selection is often done by process or design engineers and is typically done
months before a new or advanced control strategy was envisioned. As a result, the plant may not have the adequate measurements, control handles, and equipment flexibility to provide proper control. In addition, sensor maintenance and data quality issues typically appear after the initial commissioning of the control system when the control engineers are no longer on-site and have moved on to another project.
In addition, the design engineer often designs a plant by using steady-state design rules with safety factors to deal with inherent system dynamics and variability. However, to design proper control solutions, the various time constants of the system have to be taken into account. The background of a process engineer in control engineering is typically limited. In addition, the manner in which design engineers are trained is often not compatible with control theory.
example 1
A process engineer may develop an aeration controller in the following form: if dissolved oxygen (DO) is above 2 mg/l decrease aeration by x%, if DO is below 1.5 mg/l, increase aeration by y%. This is carried out every 5 minutes. For a process engineer this is a completely legitimate controller using the correct process understanding.
Figure 6.33: The typical workflow used to design and implement a process control solution is a one-way street with little opportunity to properly test the whole system before implementation. Once operational, the responsibility of running and maintaining the system.
OPERATOR
PrOCeSS eNgINeer
MeCHNAICAL eNgINeer
CONTrOL/ AUTOMATION
eNgINeerPrOgrAMMer INSTrUMeNTATION
exPerT
Downloaded from http://iwaponline.com/ebooks/book-pdf/651186/wio9781780407586.pdfby gueston 14 January 2022

224 Smart Water UtilitieS: Complexity made simple
However, this will not work well in reality because the resulting controller will be too slow to react to the rapidly varying DO concentration because the system’s time constants have not been taken into account. A control engineer could easily translate the control concept into a PI controller. However, this requires proper communication between the involved experts. In current practice this communication is often in the form of printed reports.
The same procedure applies to equipment and sensor selection. Design results are passed on to the next expert leaving significant room for misunderstanding. This in itself poses a problem, but the risk of incorrect planning is increased by the fact that this workflow does not allow any feedback between experts.
The overall design procedure is split into completely independent tasks and the only way to determine if the whole system works is to implement and test it in the field. Adaptations to improve the system efficiency are then difficult and often expensive. In the end, the operators will suffer from a poor design as maintenance needs are often increased and the system performance may be sub-optimal.
example 2
Another example is the selection of blowers. Blowers are the single most expensive piece of equipment at a WRRF and the total number of blowers has a major impact on construction costs. However, correct blower selection (type and number) also determines the energy consumption during operation as aeration energy accounts for 40−60% of the total energy consumption of a plant.
The limiting factor for efficient operation under various loading, temperature, etc. conditions is the ability to vary the airflow according to the process needs. Efficient operation is often limited by the turn-down capabilities of the blowers (and mixing requirements). The
resulting question is to decide whether to save on construction costs or operational costs. A proper cost–benefit analysis is difficult to achieve with the current workflow as the decision is often based on rules of thumb because not all expertise is readily available to the design engineer.
SolUtionS
From consideration of the previously mentioned obstacles, it was concluded that a methodology is needed to capture knowledge and experience from the various fields involved in WRRF design and control. Knowledge should be seamlessly integrated into a platform that follows the work flow from beginning to end while providing access to all the available information to everyone involved. The solution envisioned is a common software platform with models focused on capturing the required level of detail. Interestingly, all experts already have their own task-specific models but these models are often not connected.
One solution is to develop interfaces between the available tools. However, using a single platform improves interconnectivity and user-friendliness, as shown in the Figure 6.34.
This platform, known as Simba#, provides the following benefits:
66 It helps standardising typical tasks and solutions;
66 It encapsulates available knowledge and experience in the form of numerical models;
66 It seamlessly integrates all fields of expertise;
66 It enables communication and feedback between experts;
66 It allows the engineer responsible for the project execution to properly supervise all sub-tasks as all information is readily available.
Downloaded from http://iwaponline.com/ebooks/book-pdf/651186/wio9781780407586.pdfby gueston 14 January 2022

225CaSe StUdieS
integration of WorK floWS
The next step in the development of our platform was to more efficiently integrate existing workflows. Some selected examples:
Control loop design and implementation: much control theory can be encapsulated in standardised and pre-configured solutions graphically represented by an icon on a drawing board. This facilitates the design process and also guarantees a certain level of quality. However, the translation from the design solution to the final implementation still requires several translation steps prone to introducing deviations from the original design or even faulty implementations.
A step further is to integrate and automate the implementation process. Several solutions are available:
66 Automatic generation of PLC code from the pre-configured blocks. This PLC code can be executed and tested in the simulation environment and then exported to the PLC.
66 Developing a control solution with the pre-configured blocks and then switching from the development to a runtime environment.
The controller code is executed on the platform and results are sent back to the SCADA system or PLC.
66 Also combinations are possible in which standard low-level PLC controllers are running in the plant and high-level process controls that send set points or commands to the low-level PLCs are running on the platform.
detailed equipment models: the integration of all fields involved in the design and implementation of control solutions requires the provision of detailed models, not only of the biological, chemical, and physical processes but also of equipment such as pumps, blowers, diffusers, valves, pipes, etc. As an example, a detailed blower model connected to a process model would enable the planning engineer to compare different blower configurations under various loading and temperature conditions. As a result, the planning engineer will be able to provide information on costs and benefits of different scenarios to the client, allowing an informed decision.
piping models: To mathematically model pipes it is necessary to integrate a pipe network
Figure 6.34: Our solution is a simulation, monitoring and control platform combining design and operation in one software solution. The heart is the simulator SIMBA#, which is used to integrate the expertise of all involved experts.
OPERATOR
PrOCeSS eNgINeer
MeCHNAICALeNgINeer
CONTrOL/AUTOMATION
eNgINeerPrOgrAMMer INSTrUMeNTATION
exPerT
Downloaded from http://iwaponline.com/ebooks/book-pdf/651186/wio9781780407586.pdfby gueston 14 January 2022

226 Smart Water UtilitieS: Complexity made simple
Key points
66 Standardisation: current WRRF process control designs often fail to provide state-of-the-art knowledge in one or more of the involved fields. A solution is to encapsulate knowledge in form of pre-configured model blocks.
66 Communication: A sustainable solution needs to integrate all expertise in the same platform providing a common language for all experts involved.
66 Workfl ow optimisation: implementation and operation have to be an integral part of the design. Realistic testing using simulation is a key to designing tailored and sustainable process control solutions.
solver into the simulation environment. This allows us to model air distribution systems including pressure, which in return enables the modelling of the impact of pressure drops and back-pressure within the system on, e.g. the blower performance.
ConClUding remarKS
The design of control systems involves experts from various fields (e.g. process engineering, instrumentation, automation, control engineering, and programming). Current designs often fail to provide state-of-the-art knowledge in one or more fields. Our solution is a combination of (i) encapsulation of expert knowledge in the form of numerical models, (ii) standardisation in the form of pre-configured graphical model blocks, and (iii) integration of all models in one single platform.
A typical current design and implementation procedure for control solutions is a one-way path in which results from one design/implementation step are often passed on to the next expert in form of reports without an option to test before final implementation. Our solution integrates all expert knowledge in the form of numerical models which enables all involved experts to test their solution in combination with the contributions from other experts.
A typical workflow separates design from implementation. Our solution makes the implementation an integral part of the design. 6
referenCeSMarlin, T.E. (2000). Process Control: Designing Processes and Control Systems for Dynamic Performance, McGraw-Hill, New York.
Our solution integrates all expert knowledge in the form of numerical models which enables all involved experts to test their
solution in combination with the contributions from other experts.
Downloaded from http://iwaponline.com/ebooks/book-pdf/651186/wio9781780407586.pdfby gueston 14 January 2022

227case studies
oil exploration in the niger delta
The Niger Delta holds massive oil deposits, which have been extracted for decades. The suffering of the population in the Niger Delta as a result of the oil exploration has been observed by the United Nations and other international organisations.
It is clearly documented that the oil industry has conducted
its petroleum operations in Nigeria far below commonly
accepted international practice used elsewhere in the
world – a double standard.
Recent estimates suggest that over the 50-year history of oil operations in the Niger Delta, 1.4 – 2.1 million m3 of oil have been spilled. Volume estimates of oil spills are usually low since 50% of Nigerian oil is assumed to evaporate within 48 hours and spills are not usually detected in that period. As a comparison, in the Deepwater Horizon oil disaster in the Gulf of Mexico in 2010 some 0.78 million m3 of oil was spilled.
Most spills in the Delta are left unattended. It is clearly documented that the oil industry has conducted its petroleum operations in Nigeria far below commonly accepted international practice used elsewhere in the world – a double standard. As documented in a Nigerian Government report in 2006:
“Oil companies operating in the Delta … can easily improve their environmental performance in the region. Old leaking pipelines and installations must be replaced immediately and dumping of waste must stop.”
the Bodo CaSe
The ecological, human and economic consequences of the Niger Delta oil spills are exemplified by the Bodo Creek case, Ogoniland, eastern Niger Delta. The presence of active Trans-Niger Pipelines (TNPs), transporting crude oil from the hinterlands through Ogoni to Bonny crude oil terminal remains potential threats of oil spillages. The Bodo Community is situated on the northeast edge of creeks and mangrove wetlands known as the Bodo Creek.
Many of the TNPs traverse Bodo Creek. Bodo is a rural coastal town consisting of 35 villages and with a population of over 49,000 people. The majority of its inhabitants are subsistence fishermen and farmers.
A fault in the TNP on August 28, 2008 resulted in a significant oil spill into the Bodo Creek. The oil company claims that they were not informed of the leak until early October 2008. Even then it took the oil company over a month to repair the weld defect in the pipeline.
The second spill occurred on December 7, 2008 and was also the result of equipment failure. It was not capped until February 19, 2009 during which time even greater damage was inflicted upon the creek as crude oil pumped into the creeks and mangrove swamps over a period of two months.
the riSK of not meaSUringby neniBarini ZaBBey, department of fiSherieS, faCUlty of agriCUltUre, UniverSity of port harCoUrt, riverS State, nigeria
Downloaded from http://iwaponline.com/ebooks/book-pdf/651186/wio9781780407586.pdfby gueston 14 January 2022

228 Smart Water UtilitieS: Complexity made simple
Independent experts have calculated the two spills to be 80,000 – 95,000 m3. It has been estimated that 1,000 hectares of mangroves were destroyed by the spills and a further 5,000 hectares were impacted, the largest loss and damage to mangroves by oil the world has ever seen.
Since the oil spills 13,000 fishermen from the Bodo community have been unable to continue working. The TNP has suffered an incidence of operational oil spills between 2006 and 2010 at a rate of more than 130 times greater than the European average.
aUtomatiC leaKage deteCtion
It is apparent that oil leakages are causing huge damages, to the environment, to people and to the economy. Comparing the cost for all the damage, the cost for not detecting a problem is countless times higher than the cost for monitoring and automatic detection. When a leak occurs in a pipeline, an alarm should come automatically, as quickly as possible and give as accurately as possible the location and size of the leak.
If a pipeline is not properly maintained, it can begin to corrode slowly, particularly at construction joints, low points where moisture collects, or locations with imperfections in the pipe. However, these defects can be identified by inspection tools and corrected before they progress to a leak. Other reasons for leaks include accidents, terrorism, earth movement, or sabotage.
A leak detection system will provide an alarm and display other related data to the pipeline controllers in order to aid in decision-making. Pipeline leak detection systems are also beneficial because they can enhance productivity and system reliability thanks to reduced downtime and reduced inspection time. Apparently, automatic leak detection is an important aspect of pipeline technology.
In an internally based leak detection system, there are field sensors used for primarily flow rate, pressure or fluid temperature. The sensors are used to monitor internal pipeline parameters. During steady-state conditions, the flow rate, pressure and temperature in the pipeline are (more or less) constant over time. A leak changes the hydraulics of the pipeline, and therefore changes the pressure or flow readings after some time. Local monitoring of pressure or flow at only one point can therefore provide simple leak detection.
During transient conditions, the hydraulic variables may change rapidly. The changes propagate like waves through the pipeline with the speed of sound of the fluid.
The devastated Niger Delta. Photo: the author.
Photo credit: Leigh Day, London.
Downloaded from http://iwaponline.com/ebooks/book-pdf/651186/wio9781780407586.pdfby gueston 14 January 2022

229case studies
Transient conditions occur in a pipeline, for example, at start-up, if the pressure at inlet or outlet changes (even if the change is small), or when multiple products are in the pipeline. Gas pipelines are almost always in transient conditions, because gases are compressible. Even in liquid pipelines, transient effects cannot be disregarded most of the time.
The acoustic pressure wave method analyses the pressure waves produced when a leak occurs. When a pipeline wall breakdown takes place, fluid or gas escapes in the form of a high velocity jet. This produces negative pressure waves which propagate in both directions within the pipeline and can be detected and analysed. The operating principles of the method are based on the significant characteristic of pressure waves travelling over long distances at the speed of sound guided by the pipeline walls. The amplitude of a pressure wave increases with the leak size. A mathematical algorithm analyses data from pressure sensors and is able in a matter of seconds to point to the location of the leakage with an accuracy of less than 50 m.
Experimental data has shown the method’s ability to detect leaks less than 3 mm in diameter and operate with the lowest false alarm rate in the industry – less than 1 false alarm per year. Acoustic systems can also be applied to a wide range of fluids and scenarios – above-ground, buried, subsea, liquids, gas, and also some multiphase fluids. Multiple monitored sections can be defined and integrated according to each application. In some cases, the sensors (monitoring points) can be spaced up to 30 or 40 km and still keep good sensitivity.
The acoustic pressure wave method is unable to detect an ongoing leak after the initial event: after the pipeline wall breakdown or rupture, the initial pressure waves subside and no subsequent pressure waves are generated. In principle, the system can fail to detect the leak, for instance, if the pressure waves are masked by transient pressure waves caused by an operational event
such as a change in pumping pressure or valve switching. In such a case, the system will not detect the ongoing leak.
Another method of leakage detection is to use the principle of conservation of mass. In steady state the mass flow entering a leak-free pipeline will balance the mass flow leaving it.
Any drop in mass leaving the pipeline indicates a leak. If, during a certain period, there is an imbalance between the influent and effluent flow rate it is an indication of a leak. The method can be further refined by using mathematical models of the flow and pressure, using not only conservation of mass but also conservation of momentum and of energy.
Such mathematical models make it possible to calculate mass flow, pressure, density and temperature at every point along the pipeline in real-time with the help of mathematical algorithms. Such a leak detection system can easily model steady-state and transient flow in a pipeline and consequently detect leaks during both steady-state and transient conditions.
Externally based leak detection systems also utilise field instrumentation – for example infrared radiometers or thermal cameras, vapour sensors, acoustic microphones or fibre-optic cables to monitor external pipeline parameters. Such systems are highly sensitive and accurate, but system cost and complexity of installation are usually very high. Applications are therefore limited to special high-risk areas, e.g. near rivers or nature-protection areas. Actually, the wetlands of Niger Delta have been considered one of the most important wetlands and marine ecosystems on Earth.
the CoSt of not deteCting
In early January 2015, Shell agreed to pay the the Bodo community £55 million for the oil spills in 2008. The agreement is the end of a
Downloaded from http://iwaponline.com/ebooks/book-pdf/651186/wio9781780407586.pdfby gueston 14 January 2022

230 Smart Water UtilitieS: Complexity made simple
four-year legal battle. Shell has also agreed to a long-overdue clean-up, but a UN report has said it could take 30 years to properly restore the ruined land, creeks and mangrove swamps in Ogoniland. Moreover, clean-up, remediation and restoration of the heavily impacted Bodo Creek according to international best practice will be expensive.
The important lesson from a technical point of view is that the cost of measuring is dramatically lower than the cost of not measuring and detecting. Every minute and hour of a leakage causes great damage. In the extreme cases of negligence in the Niger Delta, the costs become astronomical, for the population, for the environment, for the ruined waterways and groundwater, not to mention the cost of lost product. 6
Key points
66 Such massive pollution incidents bear extraordinary cost for the whole community
66 The event could have been greatly reduced by the application of leakage detection equipment and rapid response to the problem
66 In some places, the lack of applying smart technology has had enormous cost and consequences for the environment, the surrounding community as well as the image and reputation of the company not applying surveillance technology
66 Measuring online and in real-time constitutes taking care of vital assets.
referenCeSThe oil spills in the Niger Delta are described in more detail in:
Olsson, G. (2015) Water and Energy – Threats and Opportunities (2nd edition), Chapter 11. IWA Publishing, London.
Olsson, G. and Zabbey N. (2014) The Water Footprint of Oil Exploration – An Urgent Challenge for Water Professionals. IWA World Congress, Lisbon, Portugal.
Pegg, S. and Zabbey, N. (2013) Oil and water: the Bodo spills and the destruction of traditional livelihood structures in the Niger Delta. Community Development Journal, 48(3), 1–15, Oxford Univ. Press, doi: 10.1093/cdj/bst021
An introduction into leakage detection in pipelines and pipe networks (for liquids) is found in:
Wang, X., Lambert, M., Simpson, A., and Vitkovsky, J. (2001) Leak detection in pipeline systems and networks: a review. The Institution of Engineers, Australia. Available at: http://www.researchgate.net/publication/256103533_Leak_detection_in_pipeline_systems_and_networks_a_review (latest access 4 March 2016).
A detailed overview of pipe failure detection and automatic failure monitoring is found in the PhD thesis:
Misiunas, D. (2005) Failure monitoring and asset condition assessment in water supply systems. PhD thesis, Lund University, Lund, Sweden. Available at: http://www.iea.lth.se/publications/Theses/LTH-IEA-1048.pdf
Downloaded from http://iwaponline.com/ebooks/book-pdf/651186/wio9781780407586.pdfby gueston 14 January 2022

231case studies
Utilities and water boards across Europe are facing the challenge of taking appropriate actions for complying with the EU Water Framework Directive (WFD). Similarly, integrated approaches to (urban) water quality management are gaining ground in other areas of the world. For this purpose, the Dommel Water Board launched in 2010 the KALLISTO innovation project, which adopts an impact- based approach including ecological status criteria, exploiting the power of integrated modelling to come up with cost-effective measures for water quality improvement in the Dommel River.
Utilities and water boards across Europe are facing the
challenge of taking appropriate actions for complying with the EU Water Framework
Directive (WFD). This is leading to a predicted saving of 80% of the capital cost to meet the WFD objectives.
The KALLISTO project, a partnership of the Water Board (utility), municipalities, consultants and research institutes with complementary knowledge, accounted for both acute (oxygen depletion, ammonia toxicity) and long-term (eutrophication, morphology) impacts of the urban wastewater system on the chemical and ecological quality of the Dommel River.
The Dommel River is located in the Eindhoven region in the south-east of the Netherlands and receives discharges from the 750,000 PE wastewater treatment plant (WWTP) of Eindhoven and from over 200 combined sewer overflows (CSOs) discharging excess stormwater from 4000 ha of impervious area from 10 municipalities, see Figure 6.35. During dry weather, the WWTP effluent constitutes up to 50% of the river base flow downstream of the WWTP, which increases up to 90% during wet weather.
Building on 5 years of pioneering in-sewer monitoring in the Eindhoven region, the project started with an extensive monitoring campaign in the urban wastewater system (WWTP and
modelling integrated WaSteWater SyStemS for deSign and operation in eindhoven (netherlandS)by lorenZo Benedetti, WaterWayS d.o.o., italy
Figure 6.35: Urban wastewater system of Eindhoven and its receiving waters.
Downloaded from http://iwaponline.com/ebooks/book-pdf/651186/wio9781780407586.pdfby gueston 14 January 2022

232 Smart Water UtilitieS: Complexity made simple
sewers) and in the receiving surface water system. In parallel, pilot-scale research was conducted on physical-chemical treatment techniques for CSO discharges and pre-treatment of WWTP influent.
This was needed to improve knowledge on the system behaviour and its dynamics, as well as the applicability of treatment techniques, and formed the basis for the development of an integrated model.
In a first step, detailed models of the sewer, WWTP and river were developed in dedicated software platforms and were calibrated with data from the monitoring campaigns in the subsystems. These were subsequently reduced in complexity and integrated into a single model in WEST (www.mikebydhi.com), thereby avoiding the need to couple different software platforms. The model reduction was thoroughly validated and the obtained model was able to describe the system performance adequately well with limited computational effort, which was a prerequisite
for the subsequent steps in the project involving many long-term simulations.
In the second step of the project, the integrated model was used to better understand the complex interactions between different components of the system. This is required to identify and estimate the impact a certain change in one system component (e.g. operational change in the sewer) can have on another component of the system (e.g. the ecological quality of a river stretch).
The latter is a typical example of immission-based evaluation of measures in the urban water system. For this purpose, a dedicated evaluation framework based on NH4 and dissolved oxygen (DO) in the river was developed. It defines critical values of NH4 and DO based on frequency-duration curves for the most sensitive organisms in the Dommel River. A global sensitivity analysis (GSA) based on Monte Carlo simulations was conducted on the operational parameters of the system, and repeated using
Figure 6.36: Overview of the different steps of the project.
1. MODeL DeVeLOPMeNTY
2. MODeL ANALYSIS
3. MODeL APPLICATION
Sewer MODeL
(INFOwOrKS)
wwTP MODeL
(weST)
rIVer MODeL
(DUFLOw)
INTegrATeD MODeL
(weST)COST MODeL
gLOBAL SeNSITIVITY
ANALYSIS
A. CUrreNT
INFrASTrUCTUre (rTC)B. ADDITIONAL MeASUreS
(INCLUDINg rTC)C. rOBUSTNeSS CHeCK
Downloaded from http://iwaponline.com/ebooks/book-pdf/651186/wio9781780407586.pdfby gueston 14 January 2022

233case studies
Figure 6.37: Performance of integrated model (DO in a river section downstream the WWTP) for one month of simulation with typical storm events leading to DO depletion.
Figure 6.38: Comparison of the effect of different measures on NH4 concentration in a river section downstream of the city and WWTP effluent after a large storm event.
Downloaded from http://iwaponline.com/ebooks/book-pdf/651186/wio9781780407586.pdfby gueston 14 January 2022

234 Smart Water UtilitieS: Complexity made simple
different storms with distinct severity and return period. The GSA revealed that the current infrastructure, when properly operated and controlled with RTC, is able to deal with small and intermediate intensity storms, but not with big storms. In addition, the control handles of importance in the urban water system (sewer and WWTP) that have RTC potential were identified.
In a third step the integrated model was used in a scenario analysis to investigate measures both with the current infrastructure (operation changes and RTC) as well as evaluating the impact of installing additional infrastructure (38). A reduced (with the help of GSA to reduce the search space) number of scenarios was run for a long period of time. Ten-year input time series were obtained using the available data from the monitoring campaigns. From the RTC scenario analysis within the current infrastructure, it appeared that different strategies are required depending on the type of storm and on the selected objective, i.e. avoiding NH4 peaks or DO dips. The former were mainly attributed to deteriorated WWTP effluent, whereas the latter are caused by the BOD degradation in the river from CSO emissions and by mixing with WWTP effluent having low DO concentration during wet weather flow.
It also became obvious that the current RTC (real time control) potential of the system was not sufficient to achieve the expected compliance at all times. Therefore, additional measures including extension of infrastructure were needed. This is obviously a very significant task as many options are available. A pre-selection of promising technologies for wet-weather treatment was made and simple models of these were developed in order to be included in the integrated model. Furthermore, different potential measures at the WWTP and in the river were evaluated. The large number of potential scenarios was systematically reduced to a set of the 20–30 most promising scenarios
that were implemented in the integrated model, then simulated and evaluated using the 10 year time series. Each 10-year simulation required approximately 3 h on a standard desktop computer.
To extract and summarise information (which could be used for decision making) from the long-term dynamic simulations, an ecological evaluation framework based on the local relationship between DO and NH4 and the presence of macro-invertebrates was used. The quality criteria are defined in terms of thresholds for low DO (for both basic and critical species) and high NH4 in several combinations of frequency and duration of exceedance, to be used in the evaluation of scenarios simulated for long periods. This framework was applied to evaluate the water quality at all sections along the Dommel River, together with the calculation of capital and operational costs of measures.
To find the most cost-effective measures, a model calculating investment and operational cost was developed and used in the evaluation. The best scenario is one that complies with maximum NH4 and minimum DO criteria in the 10-year evaluation at the lowest total cost. A list of evaluated measures is given as a Table. The optimal scenario was finally checked for robustness using a worst-case analysis which considered the uncertainty in the main assumptions.
The eventual most cost-effective scenario obtained consisted of a combination of in-stream river aeration to tackle DO depletion and of WWTP CEPT pre-treatment to reduce NH4 peaks. A comparison with the cost calculated before the start of the project, based on the adoption of conventional methods such as addition of sewer retention volumes, revealed that a saving of about 80% of the CAPEX (from an initially estimated budget of over 150 million EUR) and of about 70% of the TOTEX is possible while reaching even better environmental objectives.
Downloaded from http://iwaponline.com/ebooks/book-pdf/651186/wio9781780407586.pdfby gueston 14 January 2022

235case studies
Measure
Increase interceptor/pumping capacities
RTC in the sewer system
Increase the hydraulic capacity of the biological treatment at the WWTP
NH4-based feed-forward control at the WWTP for additional aeration package in outer ring
Decrease of the NH4 set-point for aeration in the outer ring at the WWTP
Use of PSTs as dry buffers at WWTP inlet with RTC
Chemically enhanced primary treatment (CEPT)
Effluent aeration
Additional aeration capacity in the activated sludge system (middle ring aeration)
River aeration
Increase interceptor/pumping capacities
Field of application/objective
Reduce DO minima in the river
Reduction of DO minima and NH4 peaks in the river improving the use of the available system capacity
Increase of sewer RTC benefits: lower risk of CSOs while storing water in the sewer
Increase responsiveness of aeration to the influent NH4 peak loads
Increase intensity of aeration
Reduction of influent peak load in wet weather flow (WWF) to reduce NH4 peaks in WWTP effluent
Reduction of COD load in WWF
Reduce DO minima in the river due to the WWTP effluent
Increase nitrification capacity to further reduce NH4 peak effluent loads during WWF
Reduce DO minima in river due to WWTP effluent and CSOs
Reduce DO minima in the river
Table 6.2: List of evaluated measures and their associated objectives
Figure 6.39: Results for one scenarios with the ecological evaluation framework; scores from 1 (very good quality) to 5 (very bad quality) at the river section 2 km downstream the WWTP effluent and most CSOs; the class (coloured left side) results from comparing the simulated yearly exceedance frequency (white right side) to the tolerated simulated yearly exceedance frequency (white left side of the Table).
Duration of the event 1-5h 6-24h >24h12 1.5 0.7 0.3 2 5 3 9.0 36.4 13.14 2 1.2 0.5 4 5 4 7.8 24.5 7.31 2.5 1.5 0.7 5 5 5 4.2 19.1 3.90.2 4.5 3 1.5 1 5 4 0.0 0.9 0.4
Duration of the event 1-5h 6-24h >24h12 5.5 6 7 2 5 5 9.2 45.8 30.14 4 5.5 6 4 5 5 5.0 38.5 23.31 3 4.5 5.5 4 5 5 1.4 19.6 17.90.2 1.5 2 3 1 5 5 0.1 0.9 1.7
Duration of the event 1-5h 6-24h >24h12 3 3.5 4 1 1 1 1.4 5.9 4.04 2.5 3 3.5 1 2 2 0.7 2.1 2.31 2 2.5 3 1 2 4 0.1 1.0 1.70.2 1 1.5 2 1 5 5 0.1 0.7 0.9
NH4
Toleratedfrequencyper year
DO critical
Toleratedfrequencyper year
DO Basic
Toleratedfrequencyper year
Downloaded from http://iwaponline.com/ebooks/book-pdf/651186/wio9781780407586.pdfby gueston 14 January 2022

236 Smart Water UtilitieS: Complexity made simple
Key points
66 The sooner one starts monitoring water quantity and quality, the better. Very important locations for which data might not be regularly collected are: (a) upstream river inputs, (b) WWTP influent and (c) CSOs.
66 It is very advisable to involve early in the project not only the people responsible for the planning of design and operation in the utility, but also the operators (who will use the resulting strategies and real time control) and the regulators (who will have to understand and approve the proposed set of measures to achieve the desired water quality).
66 Such integrated models are not “on the shelf” and require substantial code customisation. Therefore, high simulation speed is fundamental not only to be able to quickly run many long-term scenarios, but also to more easily debug the model.
66 The modelling details may require updates and refinements when different questions are asked of the model.
referenCeSBenedetti, L., Langeveld, J.G., Comeau, A., Corominas, L., Daigger, G.T., Martin, C., Mikkelsen, P.-S., Vezzaro, L., Weijers, S. and Vanrolleghem, P.A. (2013) Modelling and monitoring of integrated urban wastewater systems: Review on status and perspectives. Water Science and Technology 68(6), 1203–1215.
Benedetti, L., Langeveld, J.G., de Jonge, J., de Klein, J.J.M., Flameling, T., Nopens, I., van Nieuwenhuijzen, A., van Zanten, O. and Weijers, S. (2013) Cost-effective solutions for water quality improvement in the Dommel River supported by sewer-WWTP-river integrated modelling. Water Science and Technology 68(5), 965–973.
Langeveld, J.G., Benedetti, L., de Klein, J.J.M., Nopens, I., Amerlinck, Y, van Nieuwenhuijzen, A., Flameling, T., van Zanten, O. and Weijers, S. (2013) Impact-based integrated real-time control for improvement of the Dommel River water quality. Urban Water Journal 10(5), 312–329.
The advanced (integrated) modelling tools used in this project proved to be very powerful to quickly investigate interactions, synergies and conflicts in a complex system such as the whole urban wastewater system, allowing for the identification of (cost-)effective solutions to achieve the defined receiving water quality objectives.
Among the cost effective measures some “no regret” measures have been identified that will be implemented shortly, such as river aeration and RTC. These are very cost effective, require relatively little investment and are insensitive
to the remaining uncertainties. The impact of these “no regret” measures on river ecology will be monitored until 2015–2016 and the final set of measures to be implemented will be based on the remaining required improvement of the river ecology and on more detailed knowledge about the development of the ecological quality of the Dommel related to discharges from CSOs and the WWTP as well as the actual performance of the identified cost-effective measures such as CEPT. This final set of measures make up nearly 90% of the total investment volume and will be implemented in stages during the timeframe 2017–2024. 6
Downloaded from http://iwaponline.com/ebooks/book-pdf/651186/wio9781780407586.pdfby gueston 14 January 2022

237case studies
Between 2010 and 2014, Henriksdal, Käppala and Himmerfjärden WWTPs in Stockholm, Sweden, were cooperating with the aim to implement ammonium feedback control in their activated sludge processes. This case story summarises the key take-home messages from the implementation and long-term evaluations of controllers at the plants.
The objective of improving the aeration control at the plants was to reduce energy requirements while maintaining the treatment performance. The three plants treat wastewater from over 1.5 million people. Two of the plants have predenitrification processes and one of the plants has a post-denitrification process.
Ammonium feedback control was implemented directly into the control systems of the treatment plants using standard PID controllers. The ammonium controllers calculated an external set-point to lower-level dissolved oxygen (DO) controllers.
At Henriksdal WWTP and Käppala WWTP, ammonium PI control was compared to constant DO control in all aerated zones. At Himmerfjärden WWTP the ammonium controller was compared to constant DO control of one out of six aerated zones. This control method is less energy efficient than constant DO control in all zones.
leSSonS learnt from implementing ammoniUm ControllerS at three fUll-SCale plantSby linda Åmand, ivl SWediSh environmental reSearCh inStitUte, SWeden
Figure 6.40: Experimental set-up during the evaluation at the three WWTPs. REF = reference line, EXP = experimental line, Qin = inflow rate, TN = total nitrogen, NH4 = ammonium. The lines were fixed at Henriksdal and Himmerfjärden, but operated as reference or experimental lines at Käppala.
Downloaded from http://iwaponline.com/ebooks/book-pdf/651186/wio9781780407586.pdfby gueston 14 January 2022

238 Smart Water UtilitieS: Complexity made simple
Controller tuning of the DO and air flow rate controllers was performed when necessary with the lambda tuning method – a common method for PI controller tuning within the process industry.
Evaluation took place over a period of 8 to 12 months. Despite the control structure being nearly identical at the three plants, the controller behaviour varied depending on the tuning of the ammonium controllers.
Unlike the lower level controllers, the ammonium controllers were tuned manually. The step response test required for lambda tuning is hard to achieve for ammonium control since the ammonium response to a step change in DO concentration is very slow.
Two aspects were the main focus during manual ammonium controller tuning:
66 The influent variation in combination with the plant configuration and
66 The sensor placement.
Both fast and slow ammonium controllers performed well with an estimated reduced energy consumption of between 7 and 19 % with no significant impact on the treatment results. A cost–benefit analysis showed a payback time of between 1 month and 4 years for the implementation of ammonium control.
The ammonium PI controller at Henriksdal WWTP was manually tuned to be slow. The reason was the placement of the on-line ammonium sensor. To decrease sensor maintenance, the sensor is placed after the secondary settler. Frequent daily peaks in ammonium together with a long time delay of
the sensor signals motivated a slow ammonium controller which adjusts the DO concentration on a weekly rather than daily basis. Energy saving was estimated at 7 % and the payback time was less than one month since only a minor investment was required at the plant.
The ammonium sensor at Käppala WWTP was also placed after the secondary clarifier. Despite this, the ammonium PI controller was relatively fast. The reason was that ammonium peaks during normal operation are rare. Often, they only occur during wet weather situations. The ammonium controller contributed to an average reduction in DO concentration of 40 %. Energy saving was estimated at 10 % and the payback time was 2 years.
At Himmerfjärden WWTP, the ammonium sensor was placed in the last aerated zone to allow for fast control. There are daily ammonium peaks at the plant. Limitations in air flow capacity limited the control performance. Energy saving was estimated at 19 % compared to the original control strategy and the payback time was 4 years. The plant had a large energy saving, but also needed to invest in more equipment (sensors, valves) than the other two plants.
The rest of the case story description will list the four take home messages from the long-term evaluation of the controllers.
rememBer the CoSt–Benefit analySiS!
To implement a new control strategy always involves both benefits and costs. A higher need for investments can counteract the effect of a high potential energy saving – as was shown at
To implement a new control strategy always involves both benefits and costs. A higher need for investments can
counteract the effect of a high potential energy saving
Downloaded from http://iwaponline.com/ebooks/book-pdf/651186/wio9781780407586.pdfby gueston 14 January 2022

239case studies
the Himmerfjärden WWTP. A benefit which is difficult to quantify but is nevertheless important is the added value of easier supervision by the plant operators.
The payback time is shorter if the plant is larger. When the treatment lines are larger, the benefit is increased but the cost is unaffected. This is shown below. The costs were assumed to be one ion-selective ammonium sensor (€7500), programming (€1000) and basic construction work (€1875). The benefit was a percentage of the annual electricity cost (€0.1/kWh) for aeration (5,
10 and 15 % saving). The added time for sensor maintenance was assumed to be compensated by a reduced need for process monitoring. The payback time is plotted as a function of annual electricity demand for aeration.
it taKeS time to perform fUll-SCale StUdieS of Control StrategieS
The important point here is that it is never as simple as it looks. In this evaluation study, the main causes of delays were sludge issues, implementation in the control systems and sensor problems.
Delays were created when sludge scrapers broke down or during periods of poor sludge quality caused by rising sludge in the settlers.
The delays connected to the control systems were commonly not of a technical nature. Instead, time was spent waiting for the right person with access to the control system to perform small changes. One example of a necessary adjustment was to allow for a sufficiently long integration time (Ti).
Figure 6.41: Behaviour of the ammonium controllers at the three treatment plants. Black/grey: DO concentration, blue: NH4 concentration.
Figure 6.42: The payback time is shorter in larger treatment trains, and at larger savings due to ammonium control.
Downloaded from http://iwaponline.com/ebooks/book-pdf/651186/wio9781780407586.pdfby gueston 14 January 2022

240 Smart Water UtilitieS: Complexity made simple
Figure 6.43: Mean daily DO concentration in reference lines and experimental lines at Henriksdal WWTP.
Sensor drift and shift made it difficult at times to evaluate two parallel control strategies and delayed the experiments. It is therefore time-saving to have redundancy in the experiments – e.g. several treatment trains in the evaluation.
it ShoUld Be alloWed to taKe time!
For how long should a control experiment be carried out? Here it is useful to think about cycles. There are three main repetitive cycles at a treatment plant: daily, weekly and annual variations. Covering daily and weekly variations in a control experiment could be useful from a control engineering point of view – the experiment can give information about the dynamics of the controller and the response to short-time disturbances. But from an energy point of view the most important cycle to cover is the annual cycle.
Due to the effect of load, flow distribution, temperature and the performance of equipment, the potential to save energy from ammonium feedback control varies over the year. One example is presented in Figure 6.43 showing DO
concentrations at Henriksdal WWTP during the experiments. The main factor influencing the difference in DO concentration between experimental and reference lines is variations in the operation of the reference lines. Another factor is seasonal variations.
data analySiS ShoUld Be performed With Care and CaUtion
How should the effect of a control strategy be quantified in terms of energy? Firstly, do not trust the air flow meters without careful checks. Secondly, when comparing parallel treatment lines it is likely that differences in energy consumption between the treatment lines are larger than between two control strategies.
Also, be careful with normalising energy consumption with treatment performance. The core task is to only capture effects on energy consumption that could be related to changes caused by implementing a different control strategy. By normalising with treatment performance, one could impose a correlation on the data not related to the control strategy itself. 6
Downloaded from http://iwaponline.com/ebooks/book-pdf/651186/wio9781780407586.pdfby gueston 14 January 2022

241case studies
Waste stabilisation ponds (WSP) are typically applied for economical treatment of wastewater in areas where vast stretches of land are available. The efficient and effective use of WSP systems is dependent on the safe and adequate management of their sludge (Nelson et al., 2004). Excessive sludge accumulation affects the hydraulic performance by reducing the effective volume, increasing short circuiting and feedback loads (Abis and Mara, 2005) and therefore reducing the treatment efficiency.
Many studies have measured and studied the sludge patterns and also evaluated the sludge production in some WSPs, reporting a wide range of per capita production from 0.021 to 0.148 m3 person-1 yr-1 (mean total solids = 117 kg m−3). These studies emphasise that high temperatures enhance sludge degradation. However, more experimental data from different climates and pond configurations (inlet/outlet quantity and positioning) is needed to validate the sludge accumulation rates reported.
Today, a relatively large number of studies describe the usefulness of CFD models as
a tool in the design of new plants and the definition of
operation rules improving the effectiveness of existing plants.
Mathematical models have been successfully used in wastewater treatment systems for both system analysis and optimisation. Since the introduction of computational fluid dynamics (CFD) models to predict the flow patterns in ponds in 1995, the interest in CFD modelling for WSPs has expanded rapidly, particularly in practical applications. Today, a relatively large number of studies describe the usefulness of CFD models as a tool in the design of new plants and the definition of operation rules improving the effectiveness of existing plants.
However, CFD studies of large full-scale WSPs systems and the study of sludge deposition patterns by means of CFD are only scarcely reported in literature. Thus, this case study focuses on the assessment of full-scale WSP’s hydrodynamic behaviour by means of CFD. Additionally, an attempt is made at correlating the spatial and temporal (long-term) sludge deposition rate with the flow pattern inside the ponds.
deSCription of the WSp SyStem
The Ucubamba WSP (Figure 6.44) is the largest wastewater system in Ecuador. The system has been in operation since 1999 by the Municipal Company ETAPA (Empresa Pública Municipal de Telecomunicaciones, Agua Potable, Alcantarillado y Saneamiento de Cuenca, Ecuador). The WSP system consists of a pre-treatment step (screen bars and grit chamber) followed by two parallel treatment lines; each
Cfd analySiS of SlUdge and hydraUliC performanCe of a WaSte StaBiliSation pondby andreS alvarado (idrhiCa, UniverSidad de CUenCa, eCUador) and ingmar nopenS (Biomath, gent UniverSity, BelgiUm)
Downloaded from http://iwaponline.com/ebooks/book-pdf/651186/wio9781780407586.pdfby gueston 14 January 2022

242 Smart Water UtilitieS: Complexity made simple
one composed by an aerated pond (mechanical floating aerators), a facultative and a maturation pond. The total WSP has a volume of 1 million m3 with a theoretical retention time of 10.5 days. The system treats the domestic effluent of the Andean city of Cuenca – Ecuador (2400 m a.s.l.; 450,000 inhabitants). The average influent loads during the first 10 years of operation are: COD = 23,900 kg day−1; TSS = 15,550 kg day−1.
Concerning the sludge deposits, the original plan for de-sludging the system was to mechanically remove the sludge by emptying and drying one treatment line at a time at a 5 year interval. However, after 5 years of operation, this plan was reconsidered as it would cause an organic overload to the second treatment line for several months, having a detrimental effect on the receiving water body (Cuenca River). Consequently;, the de-sludging strategy was interchanged by on-line “under water” sludge processing through dredging and dehydrating, which is successfully in operation nowadays.
The present study focused on the Facultative F1 pond. The inlet/outlet of this pond consists of a submerged pipe of 0.9 m diameter lying at the bottom of the 1.8 m deep pond and an overflow structure of 10 m length. The pond is 660 m x 275 m.
traCer experiment
A tracer study was conducted in Facultative pond F1 during the driest season of the year, 2010, to minimise the influence of rainfall on the variability of inflow effluent water. The tracer Rhodamine WT, considered to be non-biodegradable nor absorptive in solids, was mixed with pond water and added as a pulse in the channel upstream of the inlet of the facultative pond in order to minimise the effect of thermal stratification.
The fluorescence concentration in pond samples was measured using an AquafluorTM Fluorometer (http://www.turnerdesigns.com), a lightweight handheld instrument for fluorescence and turbidity measurements in-situ. Water samples were collected using an ISCO Automatic Sampler 6712 (http://www.isco.com). Sampling frequency was 5 minutes until the first peak of the tracer was observed, and then was gradually reduced to 60 minutes until 90% of the tracer was recovered, i.e. after 20 days. The samples were analysed at a fixed temperature of 18C using a thermal bath. The influence of natural fluorescence of algal biomass was controlled by measuring the background fluorescence concentration during several hours before the start of the test.
Figure 6.44: Ground plan of the Ucubamba waste stabilisation pond (WSP) with Facultative Pond F1 enhanced, Cuenca, Ecuado.
Downloaded from http://iwaponline.com/ebooks/book-pdf/651186/wio9781780407586.pdfby gueston 14 January 2022

243case studies
SlUdge meaSUrement
Five full bathymetries of the system were performed by ETAPA during 11 years of operation and analysis of the sludge composition was performed at a few locations. In this study, three bathymetries (those most equally spaced in time, i.e. 2002, 2005 and 2009) are investigated. Figure 6.45 depicts the three sludge distributions derived from the bathymetry data. The latter measured the height of sludge with respect to the water level in 51 grid points within the pond domain. The points were selected to provide an even distribution in the pond, only assigning a denser grid in the region close to the inlet.
The three-dimensional surface profiles of the sludge distribution shown in Figure 6.45 were created directly from bathymetry data. A grid of 6 m was created in each direction by the point Kriging method. The total sludge volume was calculated by integration using Simpson’s interpolation rule to reconstruct the sludge surface. The per capita sludge production was calculated by dividing the sludge volume by the population served and the time of operation at each bathymetry. The sludge accumulation rates were calculated by dividing the sludge volume by the pond area and operation time.
Figure 6.45: Sludge accumulation in Facultative F1 pond in the Ucubamba waste stabilisation pond, corresponding to: top – March 2002, center – July 2005, bottom – February 2009.
Table 6.3: Annual development.
Bathymetry Sludge Sludge volume/ Sludge max Accumulation Sludge production/(operation period) volume total volume thickness rates COD – TSS removed
year (years) m3 % m m3/ mm/ m3/ m3/ hab/ year TnCOD TnTSS year
2002 (2.3) 10196 4.5 0.34 0.028 33 2.29 3.07
2005 (5.7) 29850 13.4 1.06 0.030 40 2.77 3.41
2009 (9.3) 50186 22.3 1.32 0.026 41 2.73 3.31
Downloaded from http://iwaponline.com/ebooks/book-pdf/651186/wio9781780407586.pdfby gueston 14 January 2022

244 Smart Water UtilitieS: Complexity made simple
Figure 6.46: Comparison between velocity profiles (at mid-depth) and sludge accumulation scenarios in Facultative F1 pond in the Ucubamba waste stabilisation pond.
Cfd modelling
Three dimensional single phase CFD simulations were performed for the facultative F1 pond using the commercial software FLUENT v13 (ANSYS). Three different geometries/meshes were created corresponding to each sludge accumulation scenario. The presence of sludge was accounted for by removing the corresponding volume of the pond where sludge accumulation had been measured. Figure 6.46 a, b and c shows the smoothed spatial profile of sludge accumulation at different times.
A finite volume method was used for dividing the computational domain into 102,200 quadratic grid elements, representing the 13 ha facultative pond for scenario 1999 (no sludge accumulation).
For subsequent scenarios the number of quadratic elements decreased respectively to 102,000 (2002); 98,900 (2005); and 88,200 (2009). For the unsteady CFD simulations, the fluid in the pond was assumed to be incompressible and exhibiting Newtonian fluid properties of water.
The computation resources needed for running complex CFD models have been a restriction for scientists, designers and operators in the past. However, the current power of computer technology and possibilities for parallel computation allows us to bring enough potential for routine CFD simulations for a wide range of laboratory, pilot and full-scale systems. Moreover, ample CFD software, both commercial and open source, is nowadays available.
Downloaded from http://iwaponline.com/ebooks/book-pdf/651186/wio9781780407586.pdfby gueston 14 January 2022

245CaSe StUdieS
Key points
66 The sludge accumulation shown in the facultative pond confirms the strong influence of the single inlet in the deposition pattern.
66 The CFD model demonstrates its usefulness in the evaluation of the hydrodynamic performance of a system affected with sludge accumulation and in the analysis of the sludge pattern in relation to the hydrodynamic footprint of the pond.
66 A CFD model can potentially be used in the planning stage of a system for testing future scenarios of sludge accumulation and consequently to prevent therefore the formation of uncontrolled anaerobic zones.
referenCeSNelson, K.L., Cisneros, B.J., Tchobanoglous, G. and Darby, J.L. (2004) Sludge accumulation, characteristics, and pathogen inactivation in four primary WSPs in central Mexico. Water Research 38(1), 111–127.
Abis, K.L. and Mara, D. (2005) Research on waste stabilisation ponds in the United Kingdom: Sludge accumulation in pilot-scale primary facultative ponds. Environmental Technology 26(4), 449–457.
It is important to note the presence of vortex like structures with very low velocities, dead zones, in this region. Most of the settling occurs in these dead zones giving rise to high sludge accumulations peaks. The presence of these sludge peaks near the inlet region can be seen in Figure 6.46, a, b and c. The sludge particles have a tendency to settle near the inlet zone, but as the topology of the pond changes with time due to accumulation, the sludge is expected to start accumulating in the bigger central dead zone as well.
Since the sludge removal in the system is a continuous process (dredging, thickening and dehydrating by belt filter press), the future topology of the sludge deposit will matter in this process. Since the inlet is the only source of momentum provided, it definitely dictates the flow and the sludge deposition profile in the pond. Changing the inlet conditions, viz. providing multiple inlets, changing inlet geometry, configuration or velocity will lead to different hydrodynamic patterns as seen in the comparative
study reported by Nelson et al. (2004). To favour the even distribution of the sludge, multiple inlets could certainly help. However, the use of baffles can be a more economical option. CFD proves to be a valuable tool to aid in the design of such systems to evaluate the effect of various geometries and process conditions. The use of CFD models for testing the distinct effects of multiple inlets or the presence of baffles will be very useful and needs further exploration, e.g. by explicitly modelling the sludge transport which was not pursued in this study.
A fine-tuning of the model (mesh refinement, modelling the sludge as two phase solid–liquid mixture, adjustment of turbulence parameters values, optimising the time steps, employing a rigorous turbulence model and more accurate modelling of the sludge topology could improve the agreement between the CFD model and the experimental data, opening the door for more accurate predictions and subsequent decisions for operation of the system and sludge removing strategies. 6
Downloaded from http://iwaponline.com/ebooks/book-pdf/651186/wio9781780407586.pdfby gueston 14 January 2022

246 Smart Water UtilitieS: Complexity made simple
Water utilities around the developed world started automating their water supply systems around the mid- 1970’s by installing and operating telemetry and supervisory control and data acquisition (SCADA) systems. Prior to this period the treatment plants and pumping facilities were mainly operated manually. In the Netherlands most small-scale water treatment plants (typically groundwater treatment plants serving on average 50,000 people, producing and distributing 6,000 m3 per day) were automated extensively at that time, enabling unmanned operation.
Initially, the small-scale water supply systems were automated with relatively simple control loops: the setpoint for the production flow was derived directly from the level in the reservoir. This level based production flow control is simple and robust.
However, this method of control results in variations in the production flow, which causes variations in the water quality. The desire for more advanced control loops grew to achieve a more constant production flow. The predictive control software named Aquasuite®-OPIR, was developed to enhance the production and transportation flow control.
This control software runs on a Windows platform and connects to the existing SCADA system to read real-time measurements and send setpoints. The software uses an adaptive short-term water demand forecasting model. This model forecasts the water demand in each supply area of the system. The demand forecasts are translated into the total outflow from each reservoir. OPIR’s control method calculates the setpoint for the inflow into the reservoir.
prediCtive Control of a Water SUpply SyStem in the netherlandSby martiJn BaKKer, royal haSKoningdhv, the netherlandS
Figure 6.47: Configuration of the examined water supply system. The system consists of two water treatment plants, four pump stations that transport/distribute the water, four clean water reservoirs , and three supply areas.
grOUND wATer/
rIVer BANK ABSTrACTION
grOUND wATer ABSTrACTION
AerATION/SAND
FILTrATION/ACTIV. CArBON
AerATION
UV-DISINFeCTION
rAPID SAND FILTrATION (2x)
CLeAr wATer reSerVOIr
CLeAr wATer reSerVOIr
SUPPLY AreA
1
SUPPLY AreA
2
SUPPLY AreA
3
CLeAr wATer reSerVOIr
CLeAr wATer reSerVOIr
WTP # 1
WTP # 2
Downloaded from http://iwaponline.com/ebooks/book-pdf/651186/wio9781780407586.pdfby gueston 14 January 2022

The (optimisation) goal is to keep this inflow as constant as possible, for achieving the optimal drinking water quality. The constraints for the control method are the minimum and maximum allowed reservoir levels that can be set by the operators.
The operational results of a full-scale water supply system were examined to envision the advantages of predictive control compared to conventional level based control. Under normal operating circumstances, the system was controlled with the predictive control software. In the experiment, the predictive flow control
was switched off for one week, during which the system was controlled with conventional level based flow control loops. The research comprised of examining the behavior of the systems, during:
66 One week with predictive flow control.
66 One week with level based flow control.
The differences between level based control and predictive control were quantified by comparing average values of the measured parameters of both researched periods. Examples of the differences are shown in the graphs. The graphs
Figure 6.48: Production, transportation and distribution flows, and reservoir levels of water treatment plants #1 and #2. In the period between 22/2 and 1/3, the system was controlled conventionally, in the other periods, the system was controlled by Aquasuite®- OPI.
Downloaded from http://iwaponline.com/ebooks/book-pdf/651186/wio9781780407586.pdfby gueston 14 January 2022

248 Smart Water UtilitieS: Complexity made simple
show that predictive flow control leads to a lower variation in the production flow and a higher production flow rate at night (during low energy tariff ) compared to level based control.
The average specific energy consumption [kWh per m3] was 5.3% lower for predictive control compared to level based control. This is the result of the fact that with level based control the difference between minimum and maximum production flows is larger. The specific energy consumption at high flows is relatively higher, because of the dynamic head loss components in the abstraction and treatment process, and in the transportation and distribution process. As a result, the average specific energy consumption is higher at varying flow rates.
A second aspect is a shift of energy consumption from high tariff to low tariff hours at predictive control compared to level based control (shift 7.7%). This is caused by the fact that with level based control the reservoirs are filled with too high flow rates in the evening and night. As a result, the reservoir level becomes high early in the night, and the level based control decreases the production flow. As a consequence, less water is produced or transported and therefore less energy is consumed in the period with low energy tariff
There is a relation between production flow changes and turbidity. Changes in the production flow lead to disturbances of the
filtration processes, and therefore to an increase of the turbidity of the clear water. In this case study, the average turbidity was 19% lower during the predictive control period compared to the level based control period. This reduction was very significant in this case because the turbidity rates of the treatment plant were rather high (0.81 NTU– 0.65 NTU)
The experiment was carried out in a relatively short time and a limited number of parameters were studied. Therefore not all differences between level based control and predictive control were observed. Two aspects which were not examined are wear of pumps and valves, and the occurrence of process alarms and alerts. The literature describes that predictive control resulted in less wear, because of less variation in the operation, and therefore less starts and stops of pumps occurred. Also, failures and alarms occur less frequently when using predictive control, because processes switch on and off less often. At each switch there is a small risk of a failure in the installation, resulting in a process alert or alarm.
Another aspect is the ease of operation. Process operators of WTP #1 WTP #2 stated that the most valuable aspect of predictive control for them was the ease of operation. With level based control, the operation required much more attention, especially during high demand periods. The predictive control was better able to cope with changing demand situations and to adjust the control accordingly. 6
There is a relation between production flow changes and turbidity. Changes in the production flow lead to
disturbances of the filtration processes, and therefore to an increase of the turbidity of the clear water.
Downloaded from http://iwaponline.com/ebooks/book-pdf/651186/wio9781780407586.pdfby gueston 14 January 2022

249CaSe StUdieS
Key points
66 Adaptive water demand forecasting model enables easy implementation and generates accurate forecasts
66 Informative user interface explains past control behavior and shows forecasts of water demand, flows and reservoir levels
66 Predictive control reduces flow variation by 80%, which results in 7.4% lower energy costs and 19% lower turbidity rates
66 Additional benefits (less equipment wear, less process alarms, less operator attention needed) are important side effects of predictive control
Figure 6.49: User interface, showing trends of forecasted and measured demands, production and transportation flows and reservoir levels.
Downloaded from http://iwaponline.com/ebooks/book-pdf/651186/wio9781780407586.pdfby gueston 14 January 2022

The important thing about trends is
To look to the horizon
Prepare yourself for what will come
Be always vigilant
They always start small
Until they grow to a trend
For better or worse
But the important thing about trends is
To look to the horizon
Downloaded from http://iwaponline.com/ebooks/book-pdf/651186/wio9781780407586.pdfby gueston 14 January 2022

trendS7
Downloaded from http://iwaponline.com/ebooks/book-pdf/651186/wio9781780407586.pdfby gueston 14 January 2022

252 Smart Water UtilitieS: Complexity made simple
An interesting example is the word “poop water”, the slang for water recycled from wastewater to clean water that is fit for human consumption. Google has an interesting tool named Google Trends. Analysing the trend of “poop water” reveals that it was hardly searched from 2004 to 2007, but then increased steadily to explode in January 2015. This jump in attention was caused by Bill Gates first drinking “poop water” publically and later tricking the “Tonight show” host Jimmy Fallon to do the same. This event more than doubled the popularity of the search for “poop water” in January 2015 compared to December 2014.
Sometimes, this kind of public event is required to get a trend publically noticed and in this case for water recycling to progress past the yak-factor. A nicer expression for the same thing, “new water” has been produced by Singapore’s PUB (Public Utility Board) since 2003 and today (2015) meets up to 30% of Singapore’s water consumption needs, according to PUB.
Trends are generally a tool for scientists of future studies
who decipher patterns that have taken place in the past and predict that they will be catching on
further in the future.
future trends in water Trends may be good or bad for you or
your utility, but they will affect you. Hence,
spending some energy thinking about how you
may benefit from a given trend or how you
may avoid it harming you is worth the time.
Trends are generally a tool for scientists of
future studies who decipher patterns that have
taken place in the past and predict that they
will be catching on further in the future.
Downloaded from http://iwaponline.com/ebooks/book-pdf/651186/wio9781780407586.pdfby gueston 14 January 2022

253trendS
1. deCentraliSation
There are several options for decentralisation of water systems, i.e. provision of safe drinking water and safe disposal of wastewater. Obviously, these options have different implications. Historically, most water systems have a centralised architecture with one or a few water treatment plants to supply a large area or city. This architecture has provided a lot of advantages not least the centralisation of the competences for handling water which enables a thorough quality control of the water.
A strong incentive for decentralising the water management is the potential savings on pipework. In most traditional centralised water systems the value of the pipes and pumps for water transportation is several times higher than the more complex treatment part.
The possibility to save a large part of the investment and re-investment in water transportation infra-structure makes decentralisation very attractive. In countries where the water transportation system has reached an age ripe for replacement of a major part, it is worth considering a more decentralised approach to water delivery. In countries where new water infrastructure is being built, a decentral structure enables a more gradual development of the system – which may be easier to manage from an investment perspective.
Decentralisation is enabled by the improving miniaturisation of treatment technologies. The proliferation of containerised water treatment systems originally aimed at remote industrial sites such as oil and gas extraction or mining is working as a major enabler for decentralisation.
Technically it is possible to treat any poor water quality to any good and safe water quality that one is willing to pay for. This also means that direct water recirculation is an option and hence no (or very small) external water input is in principle required. A direct recirculation solves the most important challenge with decentral water treatment: the ability to provide a safe and abundant source of drinking water and the ability to provide a dewatering option with no risk of local flooding. However the concept of direct water recirculation for household purposes often meets cultural resistance and the thought of direct re-use is repulsive to many people.
For these reasons as well as practical and safety reasons, a non-recirculated option is more viable and in many cases it is a better and less costly option to use water from nature, i.e. groundwater, rainwater or water in surface reservoirs such as rivers and lakes. By applying some ingenuity it is often possible to identify super-local water sources, i.e. pertaining to the area a household takes up, i.e. taking water from the roof-top, extracting water from the air.
Top 10 trends in water
1. Decentralisation
2. Water reuse
3. Utility integration
4. Symbiosis
5. Community involvement
6. Climate adaptation
7. Water scarcity
8. Water-food-energy nexus
9. Micro pollutants
10. Water pricing
Downloaded from http://iwaponline.com/ebooks/book-pdf/651186/wio9781780407586.pdfby gueston 14 January 2022

254 Smart Water UtilitieS: Complexity made simple
The extreme alternative to a centralised system is a completely decentralised system where all households are self-supplying. However a more reliable and economic solution is often a clustered approach. Clustered water treatment systems might supply a full multiple-household building or a cluster of 10–100 households.
Another way to think about decentralisation is to think in terms of water qualities. The classical centralised system can be used to supply water of a poor water quality to all households; subsequently the water that will be used for direct consumption can be treated to the appropriate level by house-based systems. This means that water for flushing, bathing, washing; lawn irrigation, etc. can have a lower water quality. In fact, the part of the municipal water used for human consumption makes up only a very small percentage of the total water consumed.
The challenges of decentral water systems should not be neglected. The challenge of ensuring safe operation and maintenance can be daunting. A natural development will be that specialised personnel will take on this responsibility. A strong monitoring and automation of the decentral system will be key to handling the many local systems. For this type of decentralisation, the treatment plants should on average be able to operate for at least a year without physical visits to the plants. The plants need to be monitored remotely. Not only taking care of the processes but also monitoring the state of the equipment. That is, the detection of, e.g. pump or valve malfunctioning will be of great value in optimising the maintenance activities.
2. Water re-USe
The fact that zero-liquid-discharge (ZLD) systems are now applied widely underlines the advances that have been achieved in recent years in the direction of water re-use. Worldwide, ZLD systems are now counted in hundreds. ZLD systems are mostly applied in water
stressed areas for industrial plants. A typical ZLD plant includes an ultrafiltration membrane to remove particles, followed by a reverse osmosis (RO) membrane to remove salts. The concentrated brine can be further concentrated by a brine concentrator and finally turned to solid waste by a crystalliser. This technology may make water requiring operation viable even in water stressed areas.
The advantages of ZLD plants are obviously the dramatically decreasing water requirements as well as the reducing of the detrimental effect of wastewater in the environment. A wider application of water reuse technology may potentially eliminate the problem of water stress for non-agricultural purposes. Hence this is truly a game-changing concept in water management.
There are however still barriers to wide application of water re-use systems. For
potable water, the concept meets a lot of psychological
resistance, in spite of the fact that even “normal” water
is also “recycled water”.
There are however still barriers to wide application of water re-use systems. For potable water, the concept meets a lot of psychological resistance, in spite of the fact that even “normal” water is also “recycled water”. The difference is that this water has been re- cycled by nature. Considering the case of the long rivers of, e.g. Rhine, Ganges and Mississippi, the water intake at the end of the river has at least partially been used before. So the challenge is as much a psychological one. As soon as the water has (if only briefly) touched nature, the water becomes more easily acceptable.
Downloaded from http://iwaponline.com/ebooks/book-pdf/651186/wio9781780407586.pdfby gueston 14 January 2022

255trendS
On top of the psychological challenge, there are of course also technical challenges. One is the threat of failure of systems. Systems that can fail will eventually fail. The risk of failure and hence the frequency of failures can be reduced significantly by increasing the number of barriers, i.e. making treatment redundant. Another option is to closely monitor the quality of the water to be used by the application of online and real-time water quality sensors. Currently, companies and universities are working hard in the laboratories to develop a sensor to monitor the microbiological water quality of the water. This is the most immediate threat to public health and the parameter about which the water utility society is most concerned. Sensors for many of the other parameters are already readily available.
Micropollutant appearance is another parameter that is challenging the water re-use concept. Micropollutants – including pesticides, biocides, medical and chemical substances, flame retardants, etc. – also pose a challenge to water re-use. They are found in extremely small amounts (hence the micro prefix) and since there may be hundreds or even thousands of different substances, it is very difficult to detect them all and even more so in an automated fashion.
Yet another challenge is the cost of operation, especially cost of energy and chemicals. These costs are today prohibitive for widespread application of ZLD technology
From a municipal point of view, two of the most prominent examples of water re-use can be found in Orange County, California, USA and in Singapore. In Orange County the reclaimed wastewater is used primarily for agricultural and irrigation purposes. In Singapore, however the water named “new water” is reclaimed directly from wastewater. The wastewater treatment process is followed by ultrafiltration (UF), reverse osmosis (RO) and ultraviolet (UV) treatment. These four treatment steps provide multiple barriers for pollutants to reach the end
of the treatment. The reclaimed water has a quality so high that it is also used by industries requiring ultrapure water.
A widely used technology that might be categorised as water reuse is also the use of river bank filtration. Here the water is filtered through the bank of a river, i.e. extracted through underground wells some meters or tens of meters from the river. The retention time in the river bank is typically a few days and has the effect of removing a lot of the particulate material from the water. After river bank filtration, the water needs to be further treated in water treatment processes, typically including further particle removal as well as disinfection.
The reclaimed water has a quality so high that it
is also used by industries requiring ultrapure water.
3. Utility integration
Utility organisations may grow to include more supply services. The most common organisation merger is probably the merging of water and wastewater services. This leads to many synergetic effects, for example, joint pipe work renewal, where digging and road rehabilitation makes up a major cost and hence the cooperation around this may cut costs substantially. However, also when it comes to establishing and maintaining sensor and data infrastructure, costs can be saved and more detailed information can be obtained.
The cooperation may also lead to easier troubleshooting in the case in which one utility service influences the other – for example when the pollution of a drinking water supply is due to wastewater ingress. Other nearby utility services that may merge include district heating, electricity and gas.
Downloaded from http://iwaponline.com/ebooks/book-pdf/651186/wio9781780407586.pdfby gueston 14 January 2022

256 Smart Water UtilitieS: Complexity made simple
There may even be interesting synergies with the mail (example: sampling the distributed drinking water system and other distributed checking procedures), security services (example: handling operational emergencies outside of normal business hours), park maintenance (example: maintenance of rainwater reservoirs). In principle, the organisations do not need to merge to obtain the benefits of synergies. The opportunities for cooperation may be surprisingly many when a constructive dialogue is initiated. For decades the abundant availability and flexibility of energy supply has spoiled us all with energy always present at the click of a button. However it seems that the large transition from coal, oil and nuclear based energy to renewable energy from wind, sun, wave and biomass may require the consumer to be more flexible on when to use the energy according to the weather and other major usages.
To encourage flexible behaviour on the consumer side, electricity utilities are experimenting with variable price rates depending on energy availability. The point is to shift energy consumption away from daily peak hours (typically morning and evening) as well as from day to day. Private consumers as well as industrial consumers will be asked to provide flexibility.
Many wastewater treatment plants can provide some flexibility in the energy consumption due to the long retention time in the system, which means that peak energy consumption from aeration can be shifted in time by automatic control. Another opportunity is the retention of wastewater in rain reservoirs and pipework during peak electricity prices. This latter opportunity obviously needs to be coordinated with the weather forecast so that water reservoirs are not filled and hence unable to retain rainwater during heavy rains.
Water tower level control is another opportunity in which energy usage may be shifted. However, many water utilities fear that the change of water
level in water tanks may jeopardise the water quality in the system.
These types of concerns can be discussed back and forth for decades (and have been). In order to really understand what level of flexibility is possible and responsible, the application of real-time and online sensors again comes into focus.
Another integration opportunity regards the energy content of wastewater in terms of biogas potential as well as the heat content of the wastewater. This requires cooperation with district heating utilities, gas utilities as well as electrical utilities. Alternatively, the energy content is used at the plant. However as wastewater plants are transcending from net energy consumers over energy neutrality to energy production, the question of integration or cross-utility cooperation becomes increasingly interesting.
As in the rest of business life, cooperation is increasingly becoming the creative edge that enables further efficiency as well as effectivity wins.
4. SymbioSiS
The term wastewater tells it all – or does it?
Maybe naming wastewater as exactly that is the major obstacle for water re-use in general and industrial symbiosis. So maybe we need to think of what we call different types of water. At an industrial facility, which I recently visited, they had a saying that it is not wastewater before it hits the floor, but then it is lost to wastewater treatment and effluent back to nature. This mind-set actually gives a lot of opportunities, in which one industry’s waste is another industry’s input.
Kalundborg in Denmark is probably the largest and first industrial symbiosis in the world, see Figure 7.1. An industrial symbiosis in theory tries to mimic the world of ecology in which the disposal of a leaf is the input to another
Downloaded from http://iwaponline.com/ebooks/book-pdf/651186/wio9781780407586.pdfby gueston 14 January 2022

257trendS
process. Nothing is wasted in nature. Maybe the industrial complexes of co-located industries can do the same. The key to making it work is open communication and a local industrial forum for exploring and coordinating the opportunities of industrial symbiosis.
Looking at the symbiosis at Kalundborg is informative. Here 17 different companies exchange more than 30 streams of “waste” including water, stream, heat, waste and material. The collaboration has grown from the beginning of the sixties when it consisted of eight industrial entities, to the large exchange system we have today.
The symbiosis has evolved in an evolutionary way over decades and today includes large companies such as Novo, Statoil, Novozymes,
Figure 7.1: The Symbiosis in Kalundborg and all the “waste-to-value streams” (see http://www.symbiosis.dk/en) (latest access 4 March 2016).
Nothing is wasted in nature. Maybe the industrial
complexes of co-located industries can do the same.
Downloaded from http://iwaponline.com/ebooks/book-pdf/651186/wio9781780407586.pdfby gueston 14 January 2022

258 Smart Water UtilitieS: Complexity made simple
Gyproc and the power plant and water utility. All entities are contributing and/or benefiting from various by-products.
The benefits of symbiosis are twofold: economic saving and positive environmental effects in the form of less pollution with various waste products.
Generally, for low grade materials, the proximity of industries is key. However, for higher value materials it may even be worthwhile to transport the material across long distances.
Hence the concept of symbiosis can be seen as extending the concept of water re-use from an intra-firm process to an inter-firm process.
5. CommUnity inVolVement
Utilities are in many countries perceived as relatively closed institutions. Even if they are serving the common good, it is quite difficult to clearly influence the institutions, due to regulatory and technical barriers, but probably most importantly due to barriers of communication. The lack of communication means that quite a few people in a given community carry any opinion besides wanting the services delivered dependably and at a low cost – completely unaware of the impact of the decisions taken at the utilities for the future of the community.
To open up discussions with the surrounding community of a water utility, consider the diagram, Figure 7.2. The point is to have a two-dimensional discussion. On the vertical axis there are issues regarding the individual stakeholders and their particular interests. In the other direction there are issues that are important for the full community. In time, the community interest will also become the interests of each individual customer, as these issues relate to keeping the system in good shape, being prepared for future development and taking care of the immediate as well global environment.
The horizontal axis aims to communicate past decisions and sets the limits as to how the system can be extended and rebuilt. A water utility is a key infrastructural system that cannot be changed overnight. On the other end of the axis are decisions that are taken today, that will affect the future of this infrastructural asset – affecting the same main factors.
The stakeholders may vary from community to community and it is important to identify the key stakeholders and find ways to have them represented in the dialogue about the development of the water utility as well as make the dialogue intelligent by presenting information and questions at a level at which each stakeholder can shape an opinion.
private consumers
Discuss how to save water, e.g. by the application of real-time water meters or by applying variable water pricing that gives a clear and transparent price signal and encourages water savings. As to the emerging trend of flooding due to climate
Figure 7.2: Map as a basis for discussions.
Past decisons
Decisions affecting the future
Com
mun
ity
inte
rests
Indi
vidua
l in
tere
sts
Downloaded from http://iwaponline.com/ebooks/book-pdf/651186/wio9781780407586.pdfby gueston 14 January 2022

259trendS
changes, one option is – instead of extending sewer networks prematurely – to prepare the community with sandbags and other storm water event emergency equipment. Smarter local solutions can sometimes be found by discussing water challenges with inhabitants of a given area, village or city. Some people are very keen observers of such things and can give valuable input as to environmental issues; flooding issues and some may have interesting proposals for solutions. An example from Roskilde, Denmark involves using a stormwater basin as a skate park – when there is no rain.
industrial consumers
For high water consuming industries such as production, oil refineries, food production, power production, etc. access to water may be a cardinal point in their operation, development and planning. For the utility it makes good sense to have very close relationships to the major industries in the area to discuss and understand future demands, water recycling opportunities and the need for different water qualities. The utility may also help by supplying more water meters to get a better overview of water consumption across the production facilities.
agriculture
Agriculture is traditionally outside the urban water utility cycle. But it may be an important step towards more integrated water management to establish strong relationships in this direction.
Agriculture may be less susceptible to using clean re-used water than both industrial and private consumers.
local authorities
Keep close contact with the local authorities and give them a solid view into the operation and challenges of the water utility. This may in turn help both parties to take the best steps forward toward more sustainable and sensible development of the utility. Alternatively, both parties often experience a lack of understanding of the rationale behind decisions. This leads to suboptimal solutions seen from both parties.
nature
Finding a representative for nature may be a challenge, however if it is not given a strong voice in the stakeholder management, it may have grave long-term consequences for the community. Possibilities are to let environmental NGO’s, fishing organisations or authorities represent nature’s point of view.
6. Climate adaptation
The understanding of the physical background for the climate change has increased dramatically only during the last few years, between the IPCC reports 2007 and 2013–2014. Still there are uncertainties surrounding the topic of climate change, in particular for local conditions, and the
The lack of communication means that quite a few people in a given community carry any opinion besides
wanting the services delivered dependably and at a low cost – completely unaware of the impact of the decisions
taken at the utilities for the future of the community.
Downloaded from http://iwaponline.com/ebooks/book-pdf/651186/wio9781780407586.pdfby gueston 14 January 2022

260 Smart Water UtilitieS: Complexity made simple
uncertainties that should not be quietened down. It is important that we look critically at the data and make sure that data are interpreted correctly and the climate models are valid. However when speaking of such potential monumental disaster we need to take our precautions in the face of these uncertainties. It may be helpful to divide the discussion into two different questions and be clear on which question is being discussed:
1. Is climate change real or not, human initiated or not, what is the scope/cost/consequence of the disaster, etc.? Here we can cite the IPCC assessment report from 2014: “It is extremely likely that human influence has been the dominant cause of the observed warming since the mid-20th century. The evidence for human influence has grown since 2007.” This is the consensus of more than 800 climate researchers.
2. In the face of the uncertainty how should we act in our community?
The relevant question to consider is the second one and not the first. This question again has two sides: reducing the outlet of greenhouse gases, which is closely related to energy savings and the issue of preparing our infrastructure, homes, etc. for the changing climate.
In the case of areas haunted by both flooding and drought,
it is crucial to understand the local trends in water
reservoirs and rainfall.
Global warming is in fact more about water than it is about getting warm. The increased temperature will greatly change rain patterns. Hence it is a lot about the availability of water – either as drought or as flooding – in some places both. Most investments in physical infrastructure will still be in service in 20, 50 or even 100 years from now. For these long time frames – thinking ahead is vital. Therefore, when building new or renewing old infrastructures, designing the systems for future climate scenarios is the only sane thing to do.
In the case of areas haunted by both flooding and drought, it is crucial to understand the local trends in water reservoirs and rainfall. This can be carried out by locally monitoring water levels of either surface or groundwater. If rainfall data are not available from the national meteorological institution, this can also be monitored locally.
In many cases it is crucial to understand the full water catchment area to understand the future trends. Generally, the longer the time-series the better. Hence it is a matter of being foresighted and establishing a water catchment monitoring programme; something that will only be rewarding after several seasons of monitoring. When changes are fast, even small datasets of a few years can be informative. However, in many cases it is necessary to monitor for at least a decade and full understanding may even come later. This is because a couple of oscillating periods need to be monitored before a true understanding can be established. The main oscillation is usually the annual oscillation, but there may also be other types of oscillations. Calibrating models connecting rainfall with reservoir size may be a short cut to understanding after only a few years of monitoring.
Monitoring and recording flooding events closely is often overlooked because, as the flooding is taking place, everybody can easily see where the flooding appears. Furthermore,
Downloaded from http://iwaponline.com/ebooks/book-pdf/651186/wio9781780407586.pdfby gueston 14 January 2022

261trendS
monitoring is difficult to do. However later when trying to decide measures for avoidance of future flooding events it can turn out to be vital to have solid data on where the flooding took place, how high the water stood and not the least: where the water came from. The utility can act regarding overflow of sewers but water coming from the ocean is clearly out of the control of water utilities.
It is also a general experience that often the wastewater storage basins are not functioning as they were designed to. Hence it is important to have monitoring equipment to track the water level in the storage as well as at least an on/off indicator of whether combined sewer overflow (CSO) is taking place or not. In the future this may need to be measured more precisely including some kind of water quality measure as well.
A major difficulty of monitoring for climate adaptation is that the events are relatively rare, but the effects may be quite dramatic. Handling the data in a consistent way to gain the understanding required for design of future systems as well as the control strategy for the next event is no trivial task.
7. Water SCarCity
It is apparent that supply and demand of water resources has to be in balance. This means that water scarcity appears not only in very dry countries but also in relatively wet countries. For example, we mostly consider England as a wet country. Still South-Eastern England suffers from water scarcity due to insufficient water transmission systems and to the region’s huge ecological footprint. In fact, England has less water available per head than Afghanistan and the south-western part of England has less water per capita than Ethiopia.
Water scarcity is fundamentally dynamic and intensifies with increasing demand and with
decreasing quantity and quality of the supply. It can also decrease when adequate response actions are taken. There are two type of water scarcity:
66 Physical scarcity is related to availability of fresh water of acceptable quality with respect to the demand. Physical water shortage is the obvious example.
66 Economic scarcity means that there may be water resources available, but there is not sufficient capacity to treat and distribute the water to the users. So, there is scarcity in access to water services. There can also be scarcity due to inadequate infrastructure, irrespective of the level of water resources, due to financial constraints.
While water scarcity considers the natural allocation in relation to the number of users, water stress considers the fact that more people live in places characterised by either too much, too little, or the wrong quality of water.
Australia, for example, faces the most acute water scarcity of any developed country. In regard to developing countries, India’s chronic water scarcity problems will become an even bigger challenge over the next few years, as will the Middle East’s and Africa’s. Most countries in the world outside of the Arctic zone, developed and undeveloped, and even a small developed country like New Zealand, face scarcity challenges in different parts of their geographies. A new high-tech city, Dubai, has been built in a desert and already has the world’s highest per capita rate of water consumption.
Due to many different pressures from agriculture, population growth, increasing urbanisation, and industrialisation, water quality has deteriorated, putting a major strain on water supply globally. Not only the level of water abstraction is reaching its natural limits but water quality deterioration has been driving scarcity and holds back economic growth in
Downloaded from http://iwaponline.com/ebooks/book-pdf/651186/wio9781780407586.pdfby gueston 14 January 2022

262 Smart Water UtilitieS: Complexity made simple
many developing countries. This calls for a dramatic shift in water utilisation concepts in which water quality determines supply and how it can be most efficiently allocated.
Climate change will be obvious in water related areas. The IPCC 5th assessment report from 2014 warns that climate change due to unabated greenhouse gas emissions within this century is likely to put 40% more people at risk of absolute water scarcity than would be the case without climate change. It is obvious that new thinking has to guide the design and operation of future water systems.
The traditional solutions to water scarcity have been to supply water from ever increasingly distant sources – the civil engineering solution. In many places, this type of solution is no longer economically or politically acceptable.
The alternate solution to water stress has been to treat and use the locally available water resource – the chemical engineering solution. While incremental improvements continue to be made in treatment technologies, these systems have reached the limits of their technological and economic effectiveness. This is also due to the increased number, complexity and variety of pollutants and the public’s environmental expectations.
Flexible and adaptable solutions to cope with water stress are needed to reduce vulnerability and ensure that the available water is used in the most efficient way. In the last twenty years there has been an increasing emphasis on demand
management, and particularly on educational programmes to encourage public and private user communities to conserve water and to improve the efficiency of water use. Adequate measurements, information and communication at various levels will play an increasing role in making it possible to use water wisely.
8. Water and energy
Water and energy are inextricably linked. Water is needed to extract and generate energy and energy is needed to extract, treat and distribute water and to clean the used and polluted water. This is the water-energy nexus and as a consequence both challenges must be addressed together. Energy, water and environmental sustainability are closely interrelated and are vital not only to the economy but to the health and welfare of all humans.
As a consequence of the close interrelationship between water and energy the design and operation of water and wastewater systems should take the energy aspect into consideration. Similarly, energy production cannot be planned without taking water resources and water quality into consideration. Water availability is often undervalued and taken for granted. Population growth, climate change, urbanisation and rising health and environmental standards increasingly call for an integrated approach. The design of our cities, suburbs, homes and appliances has enormous implication for water and energy consumption. As a result, we cannot continue to utilise the critical resources water and energy in an inefficient and wasteful manner.
While water scarcity considers the natural allocation in relation to the number of users, water stress considers the fact that more people live in places characterised by either
too much, too little, or the wrong quality of water
Downloaded from http://iwaponline.com/ebooks/book-pdf/651186/wio9781780407586.pdfby gueston 14 January 2022

263trendS
The interdependence between water and energy has been recognised during the last few years. Allan Hoffman (Senior Analyst at the Department of Energy, Washington DC) wrote in 2004 on the topic: “The energy security of the United States is closely linked to the state of its water resources. No longer can water resources be taken for granted if the U.S. is to achieve energy security in the years and decades ahead.
At the same time, U.S. water security cannot be guaranteed without careful attention to related energy issues. The two issues are inextricably linked”. In the USA, the Energy–Water Nexus initiative was initiated in 2004 as an informal DOE National Laboratory initiative to develop a better understanding of the link between the nation’s energy and water supplies. The laboratories conducted preliminary assessments that indicated that the interdependence between energy and water supplies were much broader and much deeper than initially thought.
Example 1
Between 1 and 18% of the electrical energy in urban areas is used to treat, transport and use water and wastewater. Furthermore, the energy related to water use – mostly heating the water in households and industries – requires about ten times more energy compared to the energy needed to deliver the clean and cold water and to treat the wastewater.
Example 2
To treat impaired water to drinking standards requires more energy. Most water treatment plants today are gravity draining through sand with some chlorine added. But as contaminants grow, old technology doesn’t work. Either membrane or thermal water treatment is more energy intensive than traditional methods.
Example 3
Thermal power plants require huge amounts of cooling water. For example, around 39% of all freshwater withdrawals in the USA are used for thermoelectric energy production. This is roughly the same amount of water as for irrigation. Most of the cooling water is returned but around 3% is actually consumed, mostly by evaporation. Water availability has become a contentious siting issue for thermoelectric power plants and must compete with demands from municipalities, agriculture and other industries.
Water and energy are inextricably linked. Water
is needed to extract and generate energy and energy is
needed to extract, treat and distribute water and to clean the used and polluted water.
Downloaded from http://iwaponline.com/ebooks/book-pdf/651186/wio9781780407586.pdfby gueston 14 January 2022

264 Smart Water UtilitieS: Complexity made simple
Increasingly, there is a risk that water and energy interests are in conflict. Some examples can illustrate this (see facing page).
It is critical to understand the key roles and responsibilities associated with the management, operation and use of the water and energy resources. This includes government agencies, private industry as well as individual users. The interdependencies between water and energy should force us to conduct planning and operation in such a way that both the water and energy flows are tracked. Such a systems analysis should recognise the inputs and outputs for each aspect of the system as well as the storage reservoirs for the entire system.
9. miCro-pollUtantS
The discovery and increased focus on micro-pollutants is becoming the new frontier of water pollution and water treatment. During the last few years, the understanding of this group of pollutants has increased and the challenge has increased simultaneously.
Micro-pollutants make up a diverse group of substances that appear in very low concentrations, i.e. microgram (10-6), nanogram (10-9) or even picogram (10-12) per litre. The micro-pollutants come from human activity such as pharmaceuticals, personal care products, cleaners, fuel, etc. Many of the substances have, or are feared to have, bio-active effects on humans, fish and other animals. The substances bear such complex names as nonylphenol, aroctor 1221, 2,4-demethylphenol, desethylhydroxyatrazin – and there are hundreds or thousands of them.
The increased appearance of fish and mammals with defects, such as frogs with extra or no limbs, male otters with shrunken genitals and hermaphrodite fish have been found. The reason for these changes is believed to be due to disturbance of the endocrine system. The
endocrine system is a biological system in the body controlling factors such as growth and reproduction. The disturbances are believed to be at least in part due to various micro-pollutants led out through wastewater systems. Researchers are discussing if these substances are also affecting the human endocrine system.
However micro-pollutants are a diverse group and the substances originate from different sources: drugs (such as beta-blockers, antidepressants, analgesics, antibiotics and chemotherapy products), hormones, organic micro pollutants (such as pesticides, herbicides, solvents, detergents and cosmetics), heavy metals and radioactive substances.
Micro-pollutants challenge the water utility cycle in several places. The treatment can to some extent be decentralised, i.e. by applying special treatment of the wastewater from hospitals and relevant industries. However the utilisation of many of the substances may be in households and hence they need to be treated in a centralised manner in municipal wastewater treatment plants. However some of the substances, such as pesticides, are spread over wide areas. These substances are found in groundwater and surface water sources alike and need to be treated as part of the drinking water treatment system.
The discovery and increased focus on micro-pollutants
is becoming the new frontier of water pollution
and water treatment.
Downloaded from http://iwaponline.com/ebooks/book-pdf/651186/wio9781780407586.pdfby gueston 14 January 2022

265trendS
Several processes for the treatment of different micro-pollutants exist, the most prominent are:
biological processes: some micro-pollutants can be removed by specialised bacteria in both water and wastewater treatment systems. It is not understood how to actively improve the selection process of these bacteria, hence the effectiveness and robustness of this method is still in question. However, it may end up being a very economic and energy efficient process for this purpose.
advanced oxidation processes: ozone is the most widely used oxidant for organic substances. Ozone is formed at the plant by some very energy intensive processes, however, its strong oxidation potential makes it a very effective reagent that removes or breaks even very complex organic compounds. Other oxidants include oxygen peroxide, chlorine and chlorine dioxide. In some processes the additional effect of UV light is used to further increase the effect. The effect of the advanced oxidation processes differ from compound to compound and are usually expressed as log-removal rates.
adsorption on activated carbon (granular (gaC) or powdered (paC)) is a process based on adsorption. Due to its high degree of porosity, one gram may contain several hundreds of square metres of surface area. At some time the surface of the activated carbon is saturated and hence needs to be replaced or regenerated. A disadvantage with activated carbon is that the substances are not (or only to a minor extent) transformed and removed. Hence the waste carbon may be toxic.
membrane systems: membranes such as ultrafiltration, nanofiltration, reverse osmosis or forward osmosis can remove a great variety of micro-pollutants based on size, weight and charge (depending on surface charge of the membrane). Membrane processes
are very effective in removing a large range of substances. The concentrate flow of the process still needs to be discharged however and the energy costs are generally high.
From a measurement point of view this is a very challenging task and the market for online monitoring is very limited – even off-line analysis is a challenge due to the many potential substances, their different detection methods and the low concentrations.
10.Water priCing
In this century’s society, water needs to have a price to avoid it being wasted. In many industries there is a great potential for saving water by means of recycling through treatment units distributed on the factory floor or just by keeping track of where water is measured and an eye on optimising water consumption throughout the internal processes. However, attention follows the money and investment of either capital or time is not put into water savings and recycling before water prices become a significant part of the product cost structure.
In today’s industrial landscape – with a few exceptions – managers in factories do not have capacity to focus on non-critical factors. As long as water cost is insignificant their focus will be elsewhere. The same kind of deliberations are taking place in households though probably more unconsciously. Most people hardly know their annual water expenses – or even have an idea of what fraction of their salary it consumes.
Paying for water is not solely an issue of rising attention but just as much a question of covering the costs of water – and not only the obvious part of the cost but also the treatment and transportation of wastewater, and also the renewal and continued re-design of the system as well as the cost of keeping the water environment safe and sound for future consumption. Regardless of the price of water,
Downloaded from http://iwaponline.com/ebooks/book-pdf/651186/wio9781780407586.pdfby gueston 14 January 2022

266 Smart Water UtilitieS: Complexity made simple
it does have a price and it is not a good idea to make it available for free and retrieve the cost via taxes. Separating tax and water pricing is a just and effective way of running a water utility. Obviously, in countries where the two are not separated, it is a political task to make that separation – which may require some courage as well as some technical advances.
The idea that water users ought to be forced to pay the true price of the product is no more unjust than you having to pay for food. In most places there is no relationship between tariffs and the access to drinking water. Every human being needs between 20 and 25 litres per day for their personal needs. That should be a human right. But it’s not a human right to waste water. It’s not a human right to wash your car when you live in the desert. Even so, water is cheaper in Las Vegas, where there is a shortage of water, than in Sweden where it is plentiful. In many countries, there already are progressive water charges. China, Greece, Malaysia, South Africa, Senegal and Kenya are six countries where the last cubic metre costs more than the first.
Three quarters of the freshwater in the world is used for agriculture and in many places it isn’t used wisely. In many places in the American Midwest, the groundwater is so low that you have to pump it more than 100 m and the level is decreasing. In parts of India the groundwater has been sinking by 10 m per year for the last three decades. There is surface water in the
rivers and lakes but it is so badly polluted that it can’t be used even for irrigation. That’s not sustainable.
At the heart of effective pricing is effective metering. Metering has traditionally been done with mechanical meters in which the cumulated water consumption is read annually. Based on this number, the water bill is calculated. The recent breakthrough of automatic online meters in which the battery life-time problem as well as the data transmittance problem has been solved provides opportunities for new business models and ways of influencing customer behaviour. One method is to have different water tariffs depending on consumption rate. In this way the essential water consumption can be fairly inexpensive, while higher consumption rates are provided at higher tariffs. This makes it possible to regulate the water consumption economically without putting excessive cost on low income groups. Different schemes can be used to compensate for households with many inhabitants.
Another important aspect is the seasonal control of water consumption. Excessive water usage during the summer (or other water poor seasons) can be inhibited by high pricing – and clear communication of this. Various experiments in the UK have shown the good potential of this lever to control water consumption and hence to conserve water. The technology is available for fair, effective and variable pricing and it is the logic next step. 6
Downloaded from http://iwaponline.com/ebooks/book-pdf/651186/wio9781780407586.pdfby gueston 14 January 2022

267trendS
There is a lot of literature on future trends.
decentralizationA recent book is a landmark on decentralization: Tove A. Larsen, Kai M. Udert and Judit Lienert, editors (2013). Source Separation and Decentralization for Wastewater Management. IWA Publishing, London. ISBN – 9781843393481
Monitoring and control will play an important role in this development
Water reuseWe wish to mention one book that illustrates very well some practical possibilities and challenges for water reuse: Lazarova, V., Asano, T., Bahri, A. and Anderson, J., Editors (2013). Milestones in Water Reuse. The best success stories. IWA Publishing
The book presents a large number of reuse experiences from different parts of the world, in integrated management of urban water, urban use of recycled water, decentralised water recycling systems, agricultural use of recycled water, industrial use of recycled water, recreational use of recycled water, and increasing drinking water supplies.
Climate adaptationUN World Water Development Report 2015 (see below) and Olsson (2015) summarize the influence of climate change on water resources, is an excellent book for the layman on climate change.
Flannery, T. (2005). The Weather Makers. Our Changing Climate and what it Means for Life on Earth. Penguin Books, London.
Water scarcityVarious aspects of water scarcity are discussed in the book, Olsson, G. (2015). Water and Energy – Threats and Opportunities, 2nd edition. IWA Publications, London.
And in the UN report: WWDP (2015). The United Nations World Water Development Report 2015: Water for a Sustainable World. Published by UNESCO, Paris.
Available at http://unesdoc.unesco.org/images/0023/002318/231823E.pdf (latest access 4 March 2016)Also, several aspects of the water–food–energy nexus are discussed in detail in the book by Olsson (2015).
Water pricing is discussed in more detail in Chapter 8 of the book Olsson (2015).
The value of water is discussed with great passion in the book: Solomon, S. (2010). Water – The Epic Struggle for Wealth, Power, and Civilization. Harper Perennial. New York, London. ISBN 978-0-06-054831-5
More to read on trends
Downloaded from http://iwaponline.com/ebooks/book-pdf/651186/wio9781780407586.pdfby gueston 14 January 2022

The important thing about new perspectives is
To get inspired
Inspiration is all around
It enables you to act differently
To act better
Thought leaders are all around
You could be one?
But the important thing about new perspectives is
To get inspired
Downloaded from http://iwaponline.com/ebooks/book-pdf/651186/wio9781780407586.pdfby gueston 14 January 2022

neW PerSPectiVeS8
Downloaded from http://iwaponline.com/ebooks/book-pdf/651186/wio9781780407586.pdfby gueston 14 January 2022

Access to clean, reliable and affordable energy and water are essential in a modern society. In many parts of the world, these two physical infrastructures are aging at a very fast pace, and billions of people have
no access to clean water and reliable energy services.
Energy and water infrastructures are inextricably linked – we need water for energy and we need energy for water. While the products delivered by each system are different, there are several analogies in their physical principles which mean that we can potentially apply similar technical solutions to improve how they are operated, maintained and made secured. This also means that they also share similar vulnerabilities. For example, both energy and water systems are threatened by severe and atypical weather events, which are on the increase. Heat waves and extreme cold spells can degrade the efficiency of both power grids and water grids.
270 Smart Water UtilitieS: Complexity made simple
Smartening the energy–Water nexUSby laWrence JoneS, Vice PreSident, international ProgramS, ediSon electric inStitUte, WaShington dc, USa
The electric power grid as we know it today was never designed to cope with the kind of large temperature swings due to climate change. Much higher temperatures can degrade the equipment’s thermal and physical properties. Similarly, water systems being exposed to abnormal thermal stress could mean more damage to pipes and other equipment. Both energy and water delivery systems have losses which must be compensated by more water and energy. To address the above concerns, electric grids around the world are being made smarter by installing advanced sensing, computing, and control technologies. By combining the capacity, capability and reach of new information systems, operators of power networks are increasingly better equipped to manage the flow and delivery of electric energy across both long and short distances in a network. The volume of data collected by the wide array of sensors and then converted into actionable information by the advanced analytical computer systems will facilitate predictive maintenance and optimal utilization of equipment.
Smartening the world’s electric power networks will take decades. During this period, new approaches for dealing with a hybrid grid consisting of both old and new assets will be needed. Interoperability is important in smart grids. This will become even more important in hybrid grids as the older and newer assets must operate in cooperation so that the system has the best possible performance.
meaSUring Smart grid Performance
As utilities invest in technology to make grids smarter, they will need metrics to quantify
Energy and water infrastructures are inextricably
linked – we need water for energy and we need energy
for water … This also means that they also share
similar vulnerabilities.
Downloaded from http://iwaponline.com/ebooks/book-pdf/651186/wio9781780407586.pdfby gueston 14 January 2022

271neW PerSPectiVeS
the level of performance that is achieved for the investments made. Big Data – the large and diverse collection of data collected from the sensors will be, perhaps, the most valuable soft assets that utilities will have to assess and improve how grids perform. Electric utilities are beginning to explore how to take advantage of the diverse analytical computational capability offered as a service using cloud computing to quantify the benefits of increasing investments in smart grids. Game-change technologies that define the so-called Internet of Things (IoT) will also present grid operators with an array of possibilities to create value streams for utilities as well as benefits for consumers.
Smart Water
Due to the interdependence of energy and water systems, it is necessary to make not only the electric grid smarter, but the water supply and delivery system must also be smart. The rest of this book provides a first of a kind description of the development of Smart Water systems or “smart water.” Interoperability and other concepts of cyber-physical smart power grids also apply to smart water. Similarly, new metrics
will be needed to assess the performance of Smart Water networks. Cloud computing and IoT will also present opportunities to optimise the operation of water systems.
As the water–energy nexus becomes smarter, the subject of cyber security must be a key design and operational criterion. The nexus must be secured and resilient to cyber attacks that affect both systems separately and when coupled. The interdependencies at the nexus must be studied carefully to ensure that one smart system does not expose the other to cyber threat. This will require a holistic approach when assessing the vulnerability of energy and water systems.
This ground-breaking volume is an important contribution to reference guides to help design smarter water systems. As the development and deployment of smart grids are ahead of smart water, operators of water networks can benefit from the lessons learned by counterparts who operate smart grids. Whether you are a water or energy expert, it is high-time to apply nexus thinking as you seek to maximise the performance of both systems simultaneously by smartening the nexus.
Downloaded from http://iwaponline.com/ebooks/book-pdf/651186/wio9781780407586.pdfby gueston 14 January 2022

The water industry is always under pressure to reduce costs and operate more efficiently. It has been traditionally been put in its “silos” with water treatment, water distribution, wastewater collection and wastewater
treatment. In reality it is a joined up process that needs to work in a joined up way. With the size of some of the water companies around the world this can be a difficult thing.
The water industry also loves “data” but it also suffers from the phenomenon that it is “data rich” and “information poor,” (DRIP), in some parts of the world where the number of operators is limited, this causes a problem. There is often a disconnect between the data that is collected and what is actually needed. This is often blamed on a “legacy” issue relating to the system a company has, but the reality is that as assets get replaced the situation still exists.
272 Smart Water UtilitieS: Complexity made simple
the oPerational need for “Smart oPeration”by oliVer grieVSon, groUP manager – Water indUStry ProceSS aUtomation and control, UK
conVerting need into reality – bacK to baSicS
So, from this, we can see that work needs to be done and taking a top down approach. The approach needs to identify what information is actually needed from the different stakeholders within the water company to do the daily job that they need to do.
What does this actually look like in reality though?
Take the Managing Director of the Company, who is always busy and from a day to day perspective wants to know where the next problem is coming from. The Chief Executive is putting pressure on to run the business, safely, with a profit, and in line with all the legal obligations. Somewhere there is a balance and the Managing Director has to find it for all the different areas of the business.
As there are multiple areas, a high level of information is necessary, the number of accidents, a cost metric for each area and performance of the system in line with operating parameters (is the business satisfying its legal obligation). Another metric that alerts the Managing Director of where the next problem is going to come from is helpful.
Next, take the Treatment Works Manager. He or she has 30–40 wastewater treatment works under their area of responsibility and maybe up to 20 people. The level of detail that is needed is much greater. The same three areas of information are needed in terms of safety, cost, and process compliance but knowledge about where the process is potentially going wrong so
The water industry also loves “data” but it also
suffers from the phenomenon that it is “data rich” and
“information poor”
Downloaded from http://iwaponline.com/ebooks/book-pdf/651186/wio9781780407586.pdfby gueston 14 January 2022

273neW PerSPectiVeS
it can be acted on is also required. Details such as power consumption for each area of the larger treatment works and a list of where there are mechanical, electrical or process failings and the status of all of the outstanding jobs.
Finally, take the Process Operator. He or she is responsible for their own safety and needs to inform where there is a possible risk (lone working for example). The need for information is at its greatest level of detail and the performance of each individual element of the treatment process is needed in order for informed decision making to happen. This needs to be available when the operator either arrives on site or is displayed on his Toughbook before he gets there so that he can make a decision as to what to do on site today or whether he actually needs to go there.
in real termS?
Bringing all of this together though, what does it actually look like? Well, an example is the Managing Director wakes up one morning and the metrics on that morning show that the wastewater side of the business accident frequency ratio (AFR) is falling, the profitability is falling and he has had one incident at one of his treatment works. The basic level system will then ensure that he makes a call to the Wastewater Director to ask why. The question goes down the various levels of the business to the treatment managers to ask what is happening. In this theoretical situation, it is August and a large number of staff are on holiday and so the drop in AFR is normal and within parameters, the manning level is slightly low and the remaining operators are busy, as a consequence of this, operations is stretched and the mixed liquors have gone up in the activated sludge plants. This in turn has caused an increase in the amount of electricity that has been used in aeration and the situation has got so bad in one treatment works that a loss of the sludge blanket has occurred.
The reaction to this situation is to install sludge age controllers in all of the treatment works in which it is economical to do so which (a) assists the operators in doing their daily job, (b) protects compliance and (c) keeps the energy consumption at an optimum level. A good thing on larger works but not economically feasible as the size of the works decreases and other operational parameters (such as works de-sludging frequency) has an affect on the ability to de-sludge the works.
the fUtUre and What it meanS
An example of what information looks like on the treatment works and in reality this is 20–30 pieces of useful information for the operator to actually operate a treatment works rather than simply collect data for “the system”, which seems a trend that is quite common at the current time. With the correct instrumentation and control systems in place the operator can very quickly assess what, if anything, needs to be changed on the treatment works. This does not necessarily mean opening a valve in the future but tweaking a control setpoint for the automated system to adjust, adapt and stabilise the position.
bUt, What doeS thiS mean for the oPerator?
If the treatment works and networks are instrumented and controlled in a logical manner, the operator actually becomes something more akin to somebody who supervises the system and makes adjustments where necessary. Elements of operation of course still exist, as instruments need to be cleaned and looked after, as do all the mechanical and electrical elements. It also means that the industry acts in a proactive manner rather than the reactive operational mode that is common today.
Downloaded from http://iwaponline.com/ebooks/book-pdf/651186/wio9781780407586.pdfby gueston 14 January 2022

274 Smart Water UtilitieS: Complexity made simple
and the bUSineSS?
The treatment manager has all the information that he needs to assess the performance of his operational area and the stability of the treatment works is improved. The information to hand makes sure that the operational and asset management needs are satisfied and that the breakdowns that happen reduce. For the Managing Director the safety of the personnel is maximised and the risks of reactive work are minimised, the compliance and financial situation are improved.
Why not noW?
The situation seems ideal and there is no reason not to put instrumentation across the board right now. However, there is cost and maintenance of instrumentation, on top of that, there is how to
integrate it into the wider systems and that is often where currently things go wrong.
Instrumentation producing data needs to be integrated into the wider control and automation systems and usable data produced as a result. This is the key to a huge amount of efficiency gains that the water industry does not take advantage of, at least fully.
If the right data is collected in the right way to provide the right information to enable an informed decision whether it be for a human operator or a machine run control system, the industry as a whole could shift from the regressive reactive approach that it tends to take now to a future proactive approach .
This is the key for the industry to operate “Smartly”.
If the right data is collected in the right way to provide the right information to enable an informed decision whether it be for a human operator or a machine run control system, the industry
as a whole could shift from the regressive reactive approach that it tends to take now to a future proactive approach .
Downloaded from http://iwaponline.com/ebooks/book-pdf/651186/wio9781780407586.pdfby gueston 14 January 2022

275neW PerSPectiVeS
fUtUre innoVation in the field of Water technologyby Jan W. PoSt, Program manager at WetSUS, the netherlandS
a UniqUe r&d collaboration
The world requires solutions for growing existing and new problems in the availability and quality of water for personal, agricultural,
industrial use and nature. The focus must be on sustainable solutions for these problems, requiring less energy and fewer greenhouse gas emissions, reusing valuable minerals and metals, and thereby, enabling more water availability with a lower environmental footprint. Traditional engineering solutions will not be able to provide solutions for these challenges faced by society now and in the future. New water process technology is necessary to treat wastewater and to produce clean water from alternative sources such as saline water (sea water, brackish water), wastewater or even humid air to minimise the use of precious groundwater.
Despite the enormous importance of water technology for society, it is not a focal point of most academic research groups. The expertise in various research groups is usually applied for other processes and only later – in spin-off
projects – adapted for water treatment. Within Wetsus, the scattered scientific expertise of 20 different European universities is combined in one institute, leading to a bundling of mono-disciplinary scientific fields into a world-leading multidisciplinary research program on water technology. Wetsus focuses on demand-driven research and development of entirely new concepts, and on breakthrough improvements of existing technology.
The actual research program of Wetsus is split up into themes, which essentially are intellectual property clusters. In order to define and guide the research program and to obtain rights for commercialisation on resulting patents, companies can participate in Wetsus per theme. The companies in a theme represent different sectors sharing a common water problem or water technology business challenge, thus creating inter-sectoral exposure to the researchers. This unique collaboration with over 90 companies brings synergy and new creativity to the search for new sustainable water treatment technology.
Below, we provide a preview of some directions or themes for future innovation in the field of water technology upon which Wetsus is working.
New water process technology is necessary to treat wastewater and to produce clean water from alternative sources such as
saline water (sea water, brackish water), wastewater or even humid air to minimise the use of precious groundwater..
Downloaded from http://iwaponline.com/ebooks/book-pdf/651186/wio9781780407586.pdfby gueston 14 January 2022

276 Smart Water UtilitieS: Complexity made simple
treating SeParated WaSte StreamS
Source separation sanitation (SSS) is a concept in which waste streams with specific characteristics (e.g. urine, faeces, grey water, hospital waste streams) are collected, transported and treated separately at the source. Hospital wastewater, for instance, contains about 10-fold the concentrations of pharmaceuticals in municipal wastewater and is considered an important source of antibiotic resistant bacteria. By treating (hospital) wastewater at the source the risks associated with wastewater can be addressed more specifically and effectively, thereby preventing the spread of antibiotic resistant bacteria and other pathogens in the population and discharge of toxic components into the environment. Furthermore, sustainability objectives such as water reuse, recovery of resources and energy savings can also be more effectively reached within SSS. The main advantage is that source separation prevents dilution of wastewater streams. New technology is under development at Wetsus to treat these concentrated wastewater streams. For the treatment of hospital wastewater it is important to remove antibiotics and to develop a disinfection technology in which bacteria are not only killed but their DNA is destroyed.
For the treatment of hospital wastewater it is important
to remove antibiotics and to develop a disinfection
technology in which bacteria are not only killed but
their DNA is destroyed.
recoVering reSoUrceS from WaSteWater
In the Wetsus research theme on resource recovery, new technologies from harvesting of energy and valuable compounds from wastewater are under development. Ionic current technologies will be combined with physical and chemical technology to specifically recover compounds and produce energy. With a microbial fuel cell or a bio-catalysed electrolysis cell, electricity or hydrogen can be produced from wastewater. Hydrogen production from bio-catalysed electrolysis makes a much wider variety of wastewaters suitable for energy harvesting. This is a revolutionary breakthrough technology in the field of biological hydrogen production from wastewater. Ionic current technologies have the possibility to combine energy generation with separation. For instance, ammonia can be separated from urine to be applied as a fertilizer or as a fuel for additional electricity generation. Biological conversion of soluble sulfur compounds can be combined with metal recovery in a single process. Co-precipitation with in situ generated precipitants like iron oxides enables adsorption or inclusion of compounds such as selenate. Selective recovery of components via specifically designed adsorbents can be used to recover only the compounds of interest. The adsorption/desorption cycles need to be reversible and independent of other chemicals. Preferably light or electricity driven regeneration of the adsorption material is used to enable chemical-free regeneration of adsorbents. Technology development is crucial to specifically recover compounds from wastewater in an economical and sustainable way.
enabling the USe of neW Water SoUrceS
To face the current and future demands for fresh water and water reuse, sustainable desalination of seawater and treatment of groundwater and
Downloaded from http://iwaponline.com/ebooks/book-pdf/651186/wio9781780407586.pdfby gueston 14 January 2022

277neW PerSPectiVeS
wastewater are required. New technology is under development at Wetsus, with the capacity to remove the salts and to recover them in a reusable form. Low energy use and prevention of harmful chemical discharge are further demands for sustainable desalination. In this theme, the focus is on the development of desalination technologies for sea water, brackish water and wastewater. Several desalination technologies are applied and combined together, such as systems based on electrochemistry, supercritical water, crystallisation, membrane separation, and adsorption in, for instance, ionic liquids.
Another example of a specific alternative water source that Wetsus is investigating and developing is water production directly from air at the location where it is needed. The approach is to use water vapour selective membranes to separate water directly from air before cooling it. In this way, only the water vapour will be condensed without producing cold air. Potentially up to 60% of energy could be saved, reducing the water price significantly. The quality of the water produced is excellent as no pollutants can permeate the membrane.
intenSifying the USe of UndergroUnd aSSetS
Our drinking water springs from the natural system of ground- and surface water. Extracting water from usable underground freshwater aquifers is very important. Innovative research is needed to improve current operations of wells. An important reason to develop smart concepts for a better use of the underground is the increasing pressure on available space and water resources. The challenge is to increase the
functionality of an aquifer while securing the water quality and availability. An example is to use the underground for treatment (subsurface iron removal, biological degradation of trace organics by bacteria, adsorption on the soil). The underground can also be used for water storage when water supply and demand are not in synch. Another challenge can be to find synergy with some sort of energy production or storage. A better hydrological and hydro-chemical analysis of (underground) water systems will be developed to make reliable estimates of the effects and feasibility of concepts of this kind of multifunctional use.
Another challenge is the ageing of the very extensive network of drinking-water pipelines and distribution grids. The network varies in age and many different materials and laying methods have been used over time. New technologies are vital to allow inspection of the condition of pipelines and appendages at low cost. Developments such as (ultrasonic) sound, magnetic wave and radar technologies are very relevant. The ambition for this Wetsus research theme is to develop methods for the in-line and on-line inspection of pipelines, to enable well-founded decisions about possible replacement of pipelines.
An important reason to develop smart concepts
for a better use of the underground is the increasing
pressure on available space and water resources.
Downloaded from http://iwaponline.com/ebooks/book-pdf/651186/wio9781780407586.pdfby gueston 14 January 2022

278 Smart Water UtilitieS: Complexity made simple
meeting Water cUStomer demandS USing (the right) databy amir cahn, the SWan netWorK, iSrael
Water utilities are often confronted with a unique challenge: they face budget constraints and an ageing infrastructure, yet increasing customer expectations. For most end users, their water utility is largely invisible unless
there is a drought, poor service or rising costs.
By using the right, real-time data, customers can proactively manage their consumption and costs while utilities can better manage their networks. It will then explore the work being done by the Smart Water Networks Forum (SWAN) to bridge the information gap between water customers, utilities and other industry stakeholders about the benefits of adopting real-time, data-driven solutions.
the ValUe of real-time cUStomer data
Water managers have been so successful in engineering solutions to our water needs that the average customer believes that clean and plentiful water should be available on demand without considering the complexity of this service. This lack of awareness, in the face of increasing water scarcity and increasing costs, is a disservice, not only to the customer but to the utility, as well. Today, water customers demand to have access to the same level of service provided by mobile phone service providers, banks, on-line shopping, and other service-oriented businesses. As a result, improving customer service is a growing concern for many water utilities. In the 2014 SWAN Global Utility Survey, customer service was listed
as the most powerful business driver for utilities, cited by 76% of respondents (SWAN, 2014).
As the cost of water inevitably increases, customers will want to understand not only what they are paying for, but how to control those costs. To change consumption behaviour, utilities will need to engage their customers through relevant, time-sensitive data. By reviewing their water consumption data on a daily basis, customers can make conscious, economic decisions about their water use. To be successful in reducing consumption, people must be given the “geo-temporal” context of their consumption: where, when and why they use water (Symmonds and Hill, 2011). With data and information, utilities can communicate to customers that by conserving resources they are extending the useful life of existing infrastructure and dramatically reducing future increases in the cost of water.
the ValUe of real-time Utility data
The amount of data available on the utility, or water supply-side is growing dramatically with the deployment of more sensors and meters, and the integration of GIS and customer data. Transmission frequency is also increasing, adding to this volume of data. This is driving the requirements for larger storage, increased computing capability and improved access. Virtual servers now allow organisations to store more data, use more computing power and communicate with a connected mobile staff, lowering operation and maintenance costs.
However, before purchasing and installing hardware, it is important that utilities understand
Downloaded from http://iwaponline.com/ebooks/book-pdf/651186/wio9781780407586.pdfby gueston 14 January 2022

279neW PerSPectiVeS
what data is right for them and develop a data management strategy which maximises its use.
A Smart Water Network links multiple systems within a network to share data across platforms. This allows utilities to better anticipate and react to different types of water network issues, from detecting leaks and water quality incidents to conserving energy and tracking residential water consumption. By monitoring real-time information, utility operators can stay informed about what is going on in the field at all times and respond quickly and appropriately when a problem arises. This results in the utility becoming more efficient and reducing the overall cost of service for the customer.
traditional VS. Smart Water SolUtionS
There are several advantages to adopting smart, data-driven water solutions compared to traditional water network management methods.
customer metering: traditional water meters are manually read on a monthly, quarterly or half-yearly basis. “Smart meters” (AMR/AMI), in contrast, allow for continuous, remote monitoring of consumption, resulting in more accurate billing, and comprehensive customer usage and price signal data. Technologies also exist to allow customers the ability to track their own, individual water consumption.
Water quality monitoring: traditional water quality monitoring relies on manual, “grab”
sampling techniques with field or laboratory analysis. In contrast, online water quality monitoring uses sensors to communicate real-time data on various parameters to a software platform. This enables utility operators to quickly locate the source and spread of contamination before customers are impacted.
leak detection: traditional leak detection deploys regular sweeps by field teams, which can be time consuming and costly. Advanced leak detection uses fixed network sensors or analytic software to remotely alert system operators about various network problems preventing water loss and large bursts that interrupt service and cause property damage.
Pressure management: traditional pressure management manually controls valves by selective or reactive programmes or field visits. Advanced pressure optimisation monitors real-time pressure, flow and other data channels sent automatically to a central system for analysis and subsequent automatic control of assets. This reduces burst frequency and extends infrastructure lifetime.
energy management: traditional energy management involves pump station audits or installing pump station controllers, which does not account for energy tariffs or water demand. In contrast, hydraulic modelling simulates network dynamics such as a pump’s efficiency over a wide range of conditions. Furthermore, advanced energy optimisation fully automates pump schedules based on energy tariffs, water demand, source
By monitoring real-time information, utility operators can stay informed about what is going on in the field at all times and
respond quickly and appropriately when a problem arises.
Downloaded from http://iwaponline.com/ebooks/book-pdf/651186/wio9781780407586.pdfby gueston 14 January 2022

280 Smart Water UtilitieS: Complexity made simple
production costs and storage requirements. This increases energy efficiency and asset performance while cutting down greenhouse gases and energy costs.
bridging the information gaP
The water industry faces a communication problem, not only between customers and utilities, but also between utilities and technology providers. The Smart Water Networks Forum (SWAN) brings together key players in the water sector to promote the global development of water networks, making them smarter, more efficient and sustainable. SWAN members include water utilities, technology providers, engineering and consulting firms, academics, and investors. By fostering cross-industry collaboration, SWAN has the unique ability to share its members’ diverse experience, develop its own research and shape industry tools and thinking going forward.
To engage water customers, SWAN has developed three short clips (two in English, one in Spanish), which shed light on the key role that technology plays in ensuring customers have consistent, high quality and affordable water. To help water utilities benchmark their network intelligence, SWAN introduced the SWAN SMART SCORE, which consists of a free, 12-question survey. Complementing the SMART SCORE, the SWAN Interactive Architecture Tool is a first-of-its-kind, online platform available to anyone interested in learning more about smart water technologies. Tool users may match network challenges to available technology solutions, navigate through interactive diagrams, and view informative case studies and benefit analyses. By creating and accelerating awareness about the effective use of smart data systems, SWAN members are helping to influence the future of the water industry.
looKing toWard the fUtUre
Smart water technologies are changing the way customers make decisions about their water use and how water utilities make decisions about monitoring and controlling their network. This is not possible without access to real-time information. However, it is important to emphasise that it is not about having the latest technology, but rather finding the right data, at the right moment, addressed to the right people. The right data gives customers the knowledge and hopefully buy-in to reduce their water footprint and utilities the knowledge to effectively manage their unique challenges whether it be customer metering, water quality, leakage, pressure or energy management. By adopting data-driven solutions, utilities can ensure that customers continue to receive the clean, pressurised and consistent water delivery that they have come to expect. Through its industry tools and resources, SWAN seeks to bridge the information gap about the benefits of implementing real-time, data-driven solutions, but further outreach and investment in public education is now needed. It is time to reinvent our water future.
referenceSSWAN (Smart Water Networks Forum). 2014. SWAN
Global Utility Survey Report. January 2014. http://www.
swan-forum.com/research.html (latest access 4 March
2016).
Symmonds, G. and T. Hill (2011) Smarter Water: Ensuring
Water Sustainability via Infrastructure Incentives and
Information. Global Water FATHOM.
Hill, T. and Symmonds, G. (2013). The Smart Grid
for water: how data will save our water and your utility.
ISBN-13: 978-1599323893 ISBN-10: 1599323893,
Published by Advantage. Charleston, South Carolina, USA.
Downloaded from http://iwaponline.com/ebooks/book-pdf/651186/wio9781780407586.pdfby gueston 14 January 2022

281neW PerSPectiVeS
Performance of Water UtilitieS beyond comPliancefrom eUroPean enVironment agency technical rePort no 5 / 2014 co-aUthored by eea, dg enV and eUroPean Water Utility aSSociationS/benchmarKing netWorKS
European policies are increasingly focused on preserving the Earth’s limited resources in a sustainable manner, while minimising impacts on the environment. This is included in the resource efficiency and
green economy agendas. In order to obtain knowledge on the actual pressure on the aquatic environment from water abstractions and emission of pollutants, and for assessing urban water management, we need to extend the knowledge base beyond compliance with current legislation.
EU-level assessments of the resource efficiency or environmental performance of water utilities are not currently as holistic as they could be. There is considerable reporting of environmental data concerning water already in place, from the local to the EU level. However, these reporting obligations are primarily concerned with the water quality parameters applicable to drinking water and treated urban wastewater. The parameters are related to compliance with the EU directives pertaining to the achievement of drinking water standards, urban wastewater collection and treatment requirements, and receiving water quality objectives.
The European Environment Agency (EEA) hosted in December 2012 an expert meeting jointly organised with leading water associations in Europe. This event framed the context and discussed topics related to the exploitation of data already available with water utility associations and benchmarking networks. A Technical Report was published in May 2014 describing potentials on how the organisations involved in urban water management can share their knowledge bases to support environmental and resource efficiency policies, and technical improvements. The availability of this knowledge base could create a more comprehensive approach to assessing Europe’s water resources and threats. It could also enable a comparison of the environmental performance of different water utilities, monitor progress over time, and aid the implementation of novel environmental technologies. The data can also significantly contribute to improving the transparency and accountability of water service providers by giving citizens access to comparable data on the key economic, technical and quality performance indicators of water operators.
Production cannot be sustained if it requires excessive water use and burdens natural resources. It is thus essential that water uses and efficiencies are also considered in water management practices, including: the actual
Production cannot be sustained if it requires excessive water use and burdens natural resources.
Downloaded from http://iwaponline.com/ebooks/book-pdf/651186/wio9781780407586.pdfby gueston 14 January 2022

282 Smart Water UtilitieS: Complexity made simple
pressures in the aquatic environment from water abstractions, the resulting emissions of pollutants, and the energy consumption/recovery from managing the urban water cycle.
There is a vast amount of knowledge on urban water management, but this knowledge does not always allow for a meaningful collection and comparison of results on a European scale. Some of this knowledge is collated and held by water management actors including the utility operators and the different levels of environmental authorities; all of which may have their own distinct reference points and definitions. Advances in urban water management are frequently presented in events and different networks, but are not always shared and maintained in a systematic approach where all interested parties have access to the information.
There is a vast amount of knowledge on urban water
management, but this knowledge does not always
allow for a meaningful collection and comparison of results on a European scale.
Some national water associations publish assessments and indicators of water utilities’ performance, but the underlying working databases are often targeted at water professionals and rely on a priori knowledge on the topics by the user. Benchmarking networks collect data from their members related to a number of technical and economic parameters used for performance comparison and discuss improvement opportunities. The data policies for the benchmarking networks are defined by the members and results are often presented in anonymous or aggregated form in which the
individual plants/utilities cannot be identified directly and the underlying data are considered confidential.
In European institutional frameworks, considerable information is also provided based on the reporting from countries, e.g. to EU directives, Eurostat Water Statistics, EEA “State of the environment” (SoE) via Eionet, and to international river and sea conventions. Most of this information is made freely available through the Water Information System for Europe (WISE) which offers products such as interactive maps and underlying thematic and reference GIS datasets. As an example, basic data on about 28 000 urban wastewater treatment plants across Europe is available, with about 9000 including data on emissions of organic matter and nutrients.
Indicators play a very important role in effective policy development by providing the knowledge base to assess environmental challenges. They can supply information on the nature of the environmental problem, highlight key factors in the cause and effect relationship, monitor the effectiveness of existing responses, and provide a yardstick for geographical comparisons.
The use of indicators to measure the environmental performance of water utilities across Europe would significantly improve our understanding of the resource efficiency challenges involved. It could also help with creating effective policies and targets to foster improvements. However, for these aims to be realised, a systematic process for indicator selection, computation and communication will need to be developed.
Based on a review between performance indicators used by two benchmarking networks, a few examples with similar definitions were selected as test cases. For drinking water management, these were distribution losses and specific residential water consumption, respectively. For wastewater management, these
Downloaded from http://iwaponline.com/ebooks/book-pdf/651186/wio9781780407586.pdfby gueston 14 January 2022

283neW PerSPectiVeS
were the removal of nutrients in treatment plants as well as emission intensities.
Energy efficiency has been addressed with indicators on electricity consumption for drinking water production and distribution as well as for wastewater treatment, respectively. Final choices of indicators for data sharing may deviate from these, however, the examples are considered relevant and realistic and serve as a good step on the way.
The role of water utilities, represented via their associations, could be to ensure that relevant and technically well-defined performance indicators are developed as a pre-requisite for comparisons – and to provide the data to support such indicators.
The role of the EEA would be to facilitate the inclusion and integration of these data/indicators into the Water Information System for Europe (WISE) and maintain, expand and improve the existing tools in WISE. At the same time, better awareness of what information is already freely available as WISE products to the stakeholders of water professionals may foster new interest of their use in the daily work of urban water managers. Combined, this will support the resource efficiency and green economy agendas.
The full report: “Performance on water utilities beyond compliance” is available on the web http://www.eea.europa.eu/publications/performance-of-water-utilities-beyond-compliance (latest access 4 March 2016) and can be downloaded for free.
Downloaded from http://iwaponline.com/ebooks/book-pdf/651186/wio9781780407586.pdfby gueston 14 January 2022

284 Smart Water UtilitieS: Complexity made simple
the PercePtion of Waterby henry J. charrabé, PreSident & ceo rWl Water, USa
There is hardly any debate about the necessity of fresh water for the survival of human life. Yet, the pricing, availability, and dependability of fresh water globally is not as widespread as, for instance, the use of cellular phones.
One of the reasons for the lack of availability of fresh water is the fact that this essential element is still not priced accurately.
We, in the water industry, know that technology is not what keeps water from being widely available or priced appropriately. Today, any body of water can be treated to drinking water standards and it is merely a matter of cost. Making financing available is the true challenge in bringing fresh drinking water to all regions of the world. In addition, long and sometimes corrupt tendering processes, as well as short-term oriented politicians add to the vicious cycle, which cause water treatment not to be a problem – until it is an emergency. The never-ending debates about breakthrough technologies should be replaced by new concepts about speedily delivering water treatment solutions to all regions by using existing and widely available technologies, including innovative financial models and efficient procurement processes.
If any of us were to survey the average consumer at our local supermarket to name three cell phone companies or computer manufacturers, the answers would be swift and most likely accurate. But if we were to ask him or her to name two global water treatment companies, then we would likely receive no answer or “Evian”.
What we need to focus on is the marketing of water. We need to improve the awareness, the cost structure, and the value of every drop of fresh water. The fact that tenants in New York City do not receive a water bill, as it is already “included” in their rent, is wrong. The fact that most people expect water to be cheap or free is wrong, so long as somebody has to pay to truck, pump, clean, and provide it. Nobody is complaining about constantly increasing cable TV prices. Raising the price of water is not only the sensible thing to do, but also an economic necessity, so that this vital good is used and consumed conscientiously – everywhere and all the time.
neW modelS
RWL Water was founded by Ronald S. Lauder, one of the major shareholders of the Estée Lauder Companies. Lipstick, make-up, and perfume are marketed so that each customer clearly believes in
One of the reasons for the lack of availability of fresh
water is the fact that this essential element is still
not priced accurately.
Downloaded from http://iwaponline.com/ebooks/book-pdf/651186/wio9781780407586.pdfby gueston 14 January 2022

285neW PerSPectiVeS
the differences of the product and brands. Why is all water perceived to be the same?
RWL Water built a 23,000 m3/day freshwater desalination plant in Cyprus from financial close to commissioning in less than 8 months. We have offered customers turnkey, BOT/project finance solutions or just EPC & O&M contracts. We perceive our customers as being just like the consumer goods industry clientele – like partners with long-term relationships.
We need to focus our efforts on the improvements of the infrastructure of water. It is far more economical to build smaller, packaged treatment plants closer to the actual site of consumption, rather than building one large treatment facility, and then spend a lot of money on energy, piping and eventual spillage. The efficient, fast to construct, smaller footprint and decrease costs of civil engineering by reducing concrete for decentralised plants, far outweighs the old model of one large plant. Introducing more project finance models, in which the operator and equipment supplier is also a co-investor in the equity of such pay-per-use plant, particularly smaller plants and lower investment volumes, could make the tendering process more efficient and faster. This way, the operator would also build a plant to higher standards, as the company would be involved in the operation and maintenance for the next 20 or some odd years. This will require a different standard of quality than a plant, which receives the warranty of components for up to five years.
Additionally, the use of existing and tested automation and process controls may vastly increase cost savings in industrial, as well as municipal plants, making processes such as membrane cleaning or nutrients recovery in wastewater much more economical.
One cannot expect the world to altruistically change, unless we create incentives, models and processes to entice new behaviour. The water treatment industry is a vital and vastly fragmented industry, which continues to proceed with “business as usual”. Although potentially painful, we must make the necessary progress, so that the perception of water and water usage will change in order to provide affordable, clean and dependable water worldwide.
We need to improve the awareness, the cost structure, and the value of every drop of fresh water.
Downloaded from http://iwaponline.com/ebooks/book-pdf/651186/wio9781780407586.pdfby gueston 14 January 2022

286 Smart Water UtilitieS: Complexity made simple
Pioneering neW technology in the Water indUStry
by dr Jing liU, bioProceSS control ab, lUnd, SWeden
Energy efficiency is becoming increasingly interesting in wastewater treatment. The whole cycle of transport, treatment, consumption, collection and treatment of wastewater depends on energy. Around 2–3% of
the world’s energy is used for water supply and sanitation purposes. There is significant room for the reduction of energy consumption. In industrialised countries, energy is the second highest cost after labour costs in the water and wastewater industry.
The consumption of electrical energy can be compensated by the recovery of energy from the water and wastewater. The organic content of wastewater can be used to produce biogas, which in turn can generate energy in both thermo and electrical forms.
The operation of anaerobic digesters (AD) is far
from trivial and several microbial reactions and
activities take place.The sludge from the biological wastewater treatment can be further treated in an anaerobic digester. In the anaerobic process, microorganisms assist the process of organic material conversion that produces the biogas.
The production of biogas will make it possible to create the “zero energy” wastewater treatment
plant, where the consumption of electrical energy is compensated by the production of biogas and extraction of heat content of the wastewater.
The operation of anaerobic digesters (AD) is far from trivial and several microbial reactions and activities take place. The biological reactions of the different species in a digester can be in direct competition with each other. For example, acidogenic bacteria produce acids such as volatile fatty acids (VFA) and consequently will reduce the pH of the reactor. This is of importance for the methanogenic bacteria, since they have to operate in strictly defined pH and temperature ranges. The residence time of anaerobic slurry in a continuous stirred-tank reactor (CSTR) is of the order 15–40 days. Typically, the biogas can contain 50–75% methane and 25–50% carbon dioxide depending on the type of organic matter in the feedstock or influent.
In any typical AD operation there is a variable composition and quantity of the feedstock or influent. It is crucial to know the substrate composition of the feedstock or influent to determine the methane yield and methane production rate from the digestion. The amount of biogas that can be produced from various organic matters can be highly varying. For a biogas producer it is therefore of high interest to know this “quality” of the feedstock or influent, called the methane potential. Even if the anaerobic process can accept any biodegradable material, the gas yield depends critically on how digestible the material is. Therefore, many digesters operate with co-digestion of two or more types of feedstock. Apparently, knowing the methane potential is key information to operate the AD process.
Downloaded from http://iwaponline.com/ebooks/book-pdf/651186/wio9781780407586.pdfby gueston 14 January 2022

287neW PerSPectiVeS
The traditional way of finding out the methane potential is to make laboratory scale experiments with the sample feedstock or influent and measure how much biogas or biomethane gas will be produced. This is not only a labour intensive measurement but also very time consuming. We have developed an automatic device that can determine the true biochemical methane potential and dynamic degradation profile of any biomass substrate, called AMPTS (Automatic Methane Potential Test System). This is an analytical device developed for on-line measurements of ultra-low biomethane and biogas flows produced from the anaerobic digestion of any biological degradable substrate at laboratory scale. It allows the operator to readily determine the optimal retention time and mix of substrates for co-digesting.
Another aspect of automatically determining the biogas potential is its commercial value for operation of biogas plants. A biogas producer that needs to purchase organic material for biogas production can select and price the substrates according to the true energy content of biomass. This will help the biogas operators and substrate suppliers to better control their substrate economy, having a positive impact on overall profitability.
In traditional AD operation there is no information available from the reactor, and only the biogas output flow is measured. This means that the operator knows very little about the progress of the operation, and the information of the gas flow comes much too late. Consequently the AD processes are often operated far below the max capacity. It is obvious that more instrumentation and advanced control can address several of these problems. Better control can also achieve a good rejection of disturbances.
The AMPTS unit has proven to satisfy the need for many AD operators and researchers, therefore representing the front line of new technologies for the operation of AD processes.
The AMPTS is the flagship product of our company and has quickly become the preferred analytical instrument around the world for conducting biochemical methane potential (BMP) tests. It is used by both academic and industrial actors in the biogas industry. Still, it has to be remembered that it is not sufficient to have a superior technical product. The right driving forces have to be there. Many AD operators run their processes far below the maximum capacity, and it is common that only 50% of the capacity is used. The reason is that the operators traditionally have emphasised process stability and are not aware of the potential of utilising better instrumentation and control for more efficient and stable operation. Therefore profit has been sacrificed. Consequently, education is crucial. Adequate instrumentation and control can make a significant difference and can increase the biogas production significantly without risking the process stability and reliability. To bring this message to the biogas operator takes time and large effort.
Adequate instrumentation and control can make a significant difference and can increase the biogas production significantly
without risking the process stability and reliability.
The AMPTS is not restricted to estimating the methane potential in biogas plants. It has great potential to support the operation of the nitrogen removal process in an innovative process called Anammox, providing anaerobic oxidation of ammonium. The Anammox process has generated increasing interest at a global level due to its advantages compared to the conventional nitrification and denitrification processes for nutrient removal in wastewater. The use of the Anammox process combined with partial nitrification would lead to an important
Downloaded from http://iwaponline.com/ebooks/book-pdf/651186/wio9781780407586.pdfby gueston 14 January 2022

288 Smart Water UtilitieS: Complexity made simple
reduction of operational costs compared to conventional nitrification–denitrification process.
Anammox bacteria are slow-growing microorganisms. Cultivation and enrichment have been a big challenge due to their long doubling times. In addition, their metabolic activities could be influenced by concentration of substrates and product, as well as possible inhibitory compounds in wastewater. In order to monitor the growth of Anammox biomass and assess the applicability at industrial-scale of Anammox process, a batch activity test has been developed to assess biomass activities in treatment systems, the influence of toxic compounds and environmental parameters and to measure kinetic model parameters.
The conventional method for evaluating and assessing the specific Anammox bacteria activity (SAA) is based on the consumption rate of substrates by analysing ammonium, nitrite and nitrate concentration in the liquid phase at the beginning and the end of the experiment and taking into account the volume of the liquid phase. Also, the production of nitrogen gas can be used to evaluate Anammox activity. These test procedures rely on manual spot-check, which may lead to relatively large variations and poor measuring precision, not only due to the heterogeneous nature of bacterial culture, but also due to potential errors from manual analysis, performance variety of the equipment and non-unified test protocols.
Clearly, a better method to estimate the Anammox activity and establish the effects of different inhibition compounds is needed. Bioprocess Control has developed a new method for determining the SAA test and the effects of different toxic compounds. The test is performed using the AMPTS, demonstrating that the device is applicable not only for biogas operations. As a result, we have achieved:
6 High measurement performance in continuous monitoring of end product, i.e. N2 for extracting process kinetic information;
6 Reduction of manual operation steps, minimising the risk of human errors;
6 Standardisation of data processing and presentation to ensure reliable comparison of the results obtained at different laboratories;
6 High accessibility for monitoring and data visualisation over the test period;
6 Minimised time, labor and skill demand for both industrial and academic applications.
We are confident that smart measurements combined with data analysis and control can enhance not only the process stability but also the profitability and efficiency of the biological process operations.
Downloaded from http://iwaponline.com/ebooks/book-pdf/651186/wio9781780407586.pdfby gueston 14 January 2022

289neW PerSPectiVeS
Urban metaboliSm and Smart Water SyStemS
by SteVen KenWay , adVanced Water management centre, UniV. of qUeenSland, briSbane, aUStralia
What do we mean by the concept of urban metabolism? And how will it help us think about water in cities differently? How will it help them be smarter?
Most of us know a little about the metabolism of our own bodies. We consume water and food. We use oxygen to make energy so the cells and organs of our body can function. We perspire and pant to help us cool down. And we produce waste. We can think of the metabolism in our cities in a similar way.
But first, why are our conceptual models so important? For thousands of years, humans believed the Earth was the centre of the Universe. The conceptual model was that the Sun, and all the stars, rotated around us. This explained the sun rising and falling each day. Eventually however, scientists like Copernicus and Galileo, proved that actually, the Earth rotated about the Sun every 365 days, revolving on its axis every 24 h. This new model was far more powerful. It explained the seasons, due to tilting of the Earth’s axis. It accurately predicted eclipses. And it explained why some stars “wandered” through the night’s sky: the planets. You could imagine how challenging it would be to do this, or to send man to the Moon, using the earlier wrong, but useful, conceptual model. Better conceptual models improve our ability to measure, predict and manage the world around us.
A first step in assessing urban metabolism, is to quantify all flows of water, energy, food and matter moving through cities. I would like to
focus on the water to begin with, even though it is just one “metabolite”. A critical principle of metabolism is that it uses mass balance to mathematically account for all flows into, and out, of something. The “thing” could be our body. It could also be a city. To prepare a mass balance, we must first describe the boundary of the “thing”. This is important so that you can account for all inputs to, all outputs from, and changes in stored water, within the thing. These three parts: inputs, outputs, and stored water, are the critical independently measurable components.
For a city, the water inputs could include water from dams, groundwater supplies, desalination and also rainfall on the city. Output flows include wastewater treatment plant discharges, stormwater flows, evaporation, and percolation to groundwater. Stored water includes water in balancing reservoirs, pipes and the soil. If the balance is done well, all the inputs, will equal all the outputs, minus stored water changes. That is the metabolic water mass balance! Inputs, equals outputs, minus stored water changes.
While a mass balance sounds simple, it is actually really difficult for a city. Part of the challenge is the boundary. Where does the “the city” stop and “the environment” begin? For a human body the boundary is obvious. But for cities it is blurry, and keeps changing.
So how is this metabolic way of thinking better than current ways? Well, it differs from the way urban water is currently accounted. The current conceptual model of a water balance, is that water “supply” must equal “demand”. And this is important. My view though, is that this supply–demand balance alone does
Downloaded from http://iwaponline.com/ebooks/book-pdf/651186/wio9781780407586.pdfby gueston 14 January 2022

290 Smart Water UtilitieS: Complexity made simple
not adequately describe and account for all water sources, meaning many of these flows are ignored in planning for water and cities. If they are regularly quantified, there is a much better chance of opportunities for strategies to manage them better. If we think metabolically, we ask how does a change in efficiency, or a new supply, influence water flowing into the city as well as water flowing out. For example, dual flush toilets influence both the inflows and outflows of water in cities.
The current supply–demand approach also does not adequately show how the city is interacting with and influencing, all water flows. A metabolic mass balance does this. It shows how the shape, form, texture and design of our cities, influences all water flows. Metabolic water balances of Australian cities in the grip of a decade of drought showed that all cities had large flows of water that might be used. More wastewater and storm water flowed out of those cities than the amount of freshwater used. More than double the water demand of the cities fell as rainfall on the city. If we had designed our cities to be able to capture, store and use this rainfall there would be far less pressure on the centralised water system. Some urban development creates more storm water runoff each year, from all the new hard roof and road areas, than is used by the development. The storm water is not only ‘wasted’ but often causes environmental problems downstream. In addition, more freshwater must then be pumped to the site, often from far away, to meet the new demand. This is far from smart.
Currently, most urban water data is compiled without a clear conceptual framework which connects it to “urban performance” or which can add up in a consistent manner. The boundary of analysis is not obvious. Rather, current water accounting is focused on how water and wastewater assets or other components perform. Consequently, data relevant to the overall water performance of cities is stored in fragmented, inconsistent and incompatible ways. This leads to major challenges interpreting how the city as
a whole is functioning. This is not just for water, but for energy and other materials too. Mass balance analysis of urban water, to a consistent boundary, could provide a much clearer structure against which the performance of the water asset, and the city, could be benchmarked simultaneously. More connected management of urban water data could lead to paradigm change in the management of cities and their water systems. Smart cities or regions could be a means to unite not only data but the stakeholders responsible for the diverse and inter-connected urban systems, including water.
On a more complex level, urban metabolism can go well beyond mass balances of water, to also consider energy, as well as food and other materials. Urban metabolism can help by clearly describing interconnections and trade-offs, so that we can collectively better understand the problems and opportunities.
More connected management of urban water data could
lead to paradigm change in the management of cities and their water systems.
Our cities change constantly; rapidly in Australia. This means they are great places for solutions. Urban metabolism creates a conceptual model which will help design and manage more water and energy efficient cities. Our challenge is to also create cities which are fabulous places to live. New ways of thinking about the water balance of cities, and storing and managing data accordingly, will play a major role in achieving the efficient, liveable and resilient cities of the future.
The author acknowledges the support of the CRC Water Sensitive Cities, Smart Water Research Fund, Australian Research Council and Water Research Foundation.
Downloaded from http://iwaponline.com/ebooks/book-pdf/651186/wio9781780407586.pdfby gueston 14 January 2022

291neW PerSPectiVeS
bUtterflieS and a neW leaderShiP PhiloSoPhyby tina monberg, mediationcenter.dK and mette thorKilSen, factor3, denmarK
three fUnctionS – one goal
Smart Water utilities could be designed as a natural system with an infrastructure securing the growing demand, water stress and increasing energy prices. When applying a natural system, focus is on securing three functions: the flow of water from source to customer without obstacles, maintaining a high degree of flexibility in
changing demands and conditions, and securing the form of water of a high quality.
These three F´s: Flow, Flex and Form to implement Smart Water Utilities as a natural system, must not only be implemented, but also be sustained and aligned with an organisational model of similar qualities to optimise the project. In other words, the physical infrastructure for the water utility must be mirrored by a similar human infrastructure. A natural system would be searching for an agile organisational model for human beings ensuring that the utility is working as one operation, with a single goal and with no competition between themselves for profit or recognition. See Figure 8.1.
In nature, changes can occur so quickly that we often don’t notice them happening. When studying weather and atmosphere, one uses the term, the butterfly effect, to describe how the beating of a butterfly’s wings can cause small changes in the atmosphere which can finally result in a tornado occurring on the other
Figure 8.1: Culture pyramid illustrating the new mindset.
An organism – a natural design in flow and balance
Life is a kaleidoscope, where everyone is living to their full potential and capacity
Learning, coaching, mediation and dream sharing
Support the common good symbioses and your higher purpose
Chaos and change like in nature – agile
Who are we as an organisation?
Why is what we do important and which convictions drive us?
Which capacities do we work with?
How do we behave?
Which surroundings do we create?
Identity
Values and beliefs
Qualifications
Behaviour
Environment
Downloaded from http://iwaponline.com/ebooks/book-pdf/651186/wio9781780407586.pdfby gueston 14 January 2022

292 Smart Water UtilitieS: Complexity made simple
side of the planet. The meteorologist Edward Lorenz, who was Professor at MIT, invented the Lorenz-attractor to predict the weather. This is a three dimensional, non-linear structure that demonstrates long-term behaviour with respect to a chaotic flow. The Lorenz figure resembles a butterfly. The result is a dynamic system which develops over time as a complex, non-repetitive pattern. As we are searching for the same qualities, we have coined the expression: butterfly effect for our organisational model consisting of flow, flex and form. To come to these qualities one must transform the organisation from a command and control system to an interest-based system, see Figure 8.2.
When floW, flex and form WorK aS one
What happens when we combine the three elements of flow, flex and form? You will begin to gain an understanding for how these three qualities support each other and can lead to a dynamic organisation which is able to both serve itself and its surrounding context. You will be introduced to the role each element plays in the organisation in terms of servant leadership, facilitation and personal leadership. You will be given the recipe for a model which is intelligent, beautiful and fair.
The three key elements: flow, flex and form or qualities are made operational when translated into three functions for a new company model, The three functions are as follows:
Figure 8.2: Roadmap from current modus operandi to the future opus operandi.
ACTIVE
PASSIVE
STAGE 1controL
STAGE 2participation
STAGE 3eMpowerMent
STAGE 3Service
participativeManaGer
teaMpLayer
SeLf-reSponSiBLecontriBUtor
eMpowerinG Leader
aUthoritarian ManaGer
Mid-LeveL ManaGer/controLLer
oBedient SUBordinate
perSonaL Leader
faciLitator Leader
Servant Leader
Form the WHAT
Flex the HOW
Flow the WHY
Power centred in the management
Empowerment and trust centred in the
follower
Downloaded from http://iwaponline.com/ebooks/book-pdf/651186/wio9781780407586.pdfby gueston 14 January 2022

293neW PerSPectiVeS
Servant leadership is responsible for growth and flow and for creating the platform’s context as a resource and as an opportunity to contribute to a common and overriding goal.
the facilitator is responsible for cohesion or flex. Their role is to facilitate others and ensure that all content lies within its context and that the context, in turn, supports its content.
Personal leadership is responsible for sustainability or form, such that the employees can contribute content via input of labour, wisdom and cooperation.
Figure 8.3 shows what the three functions look like when they are configured to work together as a whole. The structure that is created contains both order and chaos and can accommodate this
tension with the help of a facilitator. The image of chaotic flow is shown by using the Lorenz attractor and takes the form of a butterfly.
We will introduce each element in the following order; servant leadership, personal leadership and the role of the facilitator. Each element and its characteristics have the potential to transform silos and rigid systems to a natural system.
creating the context and floW – SerVant leaderShiP
The term “servant leadership” was coined in 1970 by Robert Greenleaf to describe the approach employed by a leader whose primary aim is to serve the collective and its particular needs. Such a leader first defines himself or
Figure 8.3: The key roles in a butterfly organisation.
The three roles in the butterfly effect model
Servant Leader faciLitator perSonaL Leader
fLow – why?Growth
Purpose & FameSuperordinate goal
ContextOutside
Vision Sharing to create pull effect
fLeX – how?Cohesiveness
Process collaborationReciprocityConnectionIn between
Mediation to create alingment
fLow – why?BalancePassion
SustainabilityContentInside
Coaching to create commitment
Downloaded from http://iwaponline.com/ebooks/book-pdf/651186/wio9781780407586.pdfby gueston 14 January 2022

294 Smart Water UtilitieS: Complexity made simple
herself as a leader after having a vision that can serve the collective.
Greenleaf worked as a developer for one of the world’s largest tele-providers AT&T, but chose early retirement in order to set up the Center for Applied Ethics in 1964 as an alternative organisation to the one governed by command and control leadership. He was affiliated to large universities such as MIT and Harvard Business School as a teacher and inspirator.
Servant leadership makes it possible for both leadership and the company as a whole to serve a higher purpose and set its employees free. Servant leadership is about having power with the employees rather than over them. A key characteristic of servant leadership is that the leader is genuinely engaged in functioning as a beacon, showing how it is possible to both serve oneself and one’s environment. There is a direct relationship between the quality of a community or environment and how likely it is for a business in this environment to succeed.
Servant leadership makes it possible for both leadership
and the company as a whole to serve a higher purpose and set its employees free.
Servant leadership is a more developed and mature form for leadership than the kind of traditional leadership we know today. It isn’t about scoring the largest salary or highest bonus. The servant leaders are driven by different factors, namely, a desire to serve a larger collective than themselves. It is here that they gain satisfaction, motivation and reward.
It is vital for the platform that the company’s management adopts the role of a servant leadership. It is of equal importance that the
employees are ready and sufficiently mature to adopt personal leadership. The difference lies in the fact that the servant leader makes it their business to fulfil other people’s needs. The test for this kind of leader is to check whether the employees are developing holistically as people, whether they are becoming healthier, wiser, more free, more autonomous and as a result, more adept at serving others. Serving others is creating flow and should not be misunderstood as putting oneself in an inferior position or creating any form of hierarchy.
creating the content and form – PerSonal leaderShiP
We define personal leadership as an extension of the mindset of those employees who, having been given the right information and support by a servant leadership, are responsible, active, independent and critical thinkers, say what they mean and contribute with the best they can offer. If they don’t believe that the context created by a servant leadership can reach its goal effectively, then they speak out. This will mean that a facilitator can be brought in to mediate the relationship between leader and employees and adjust the context or content of production such that synergy is regained.
However, the essence of the company’s vision must not be changed so much that the company’s overriding aim no longer exists, unless that is, this vision is no longer relevant and it becomes necessary to draw up a new one to secure flow.
Personal leadership in no way opposes servant leadership because the employees know that their leaders want to serve their needs and help them to be the best they can. A company with both these functions will possess a high degree of trust, cooperation and fairness, or, in other words, a high degree of social capital, agility and resilience. Both leaders and employees are in the same boat and are heading on the same course.
Downloaded from http://iwaponline.com/ebooks/book-pdf/651186/wio9781780407586.pdfby gueston 14 January 2022

295neW PerSPectiVeS
Personal leadership shows a loyalty to the one leading, in the same way as the geese support the goose flying upfront. Employees show cooperation and support for their leaders in an open and transparent environment.
Personal leadership in no way opposes servant leadership because the employees know that their leaders want to serve their needs and help them to be the best they can.
A company model displaying qualities of this kind is in high demand from many leaders. These new tendencies – which reveal a belief, need and will to cooperate – suggest an even greater demand for organisations to function as small dinghies at sea, bracing different tides and navigating in different directions. As such, we are moving away from the silos and towards the new platforms. However, we still lack a new structure, or company model, which can support the movement. The two functions of servant leadership and personal leadership are both imperative for such a structure and model, and along with the facilitator, they make up the model’s three core components.
creating the connection and flex-facilitator
To create a platform for sustainable growth requires a balance between what appears to oppose or be at loggerheads with each other: growth and sustainability; internal and external interests; and management and employees. We need to make sure that the friction between these dualities can be tolerated, just as a tight-rope walker uses a staff to aid her balance and keep herself on the rope.
American anthropologist Gregory Bateson has said that “a person who walks is always out of balance” . In the same way, an organisation in motion or transformation will always find itself in a state of imbalance, which its system must compensate for. This is why, the third
element is required in the new company model: namely, the facilitator. The facilitator ensures that the content stays within its context and that this context is conducive for its content. At the same time, facilitators are ambassadors for social capital – trust, cooperation and fairness – ensuring that these elements are present and visible. They are also responsible for facilitating connections and cohesion within the organisation.
In contrast to the servant leader, who defines the direction and represents the flow, vision and momentum of the company, the facilitator has neither opinion nor stake in the context or the content. The facilitator function ensures that a good relationship is kept between the leadership and the employees by presenting observations to both parties without making hasty conclusions and without judging. The Indian philosopher, Jiddu Krishnamurti has said that the highest degree of intelligence is “to observe without judgment”.
The facilitator has the ability to do this and avoids trying to conclude on or decide a particular direction for the company. There, a water-tight lock balances the functions.
from a Single-cell organiSation to a Self-organiSing organiSm
When companies develop from being a single-cell organisation to being self-organising organisms, then this creates a world of serendipity, with “happy coincidences and pleasant surprises.” This puts focus on what we don’t know and as such, cannot consciously seek, in the same way as the larva isn’t conscious that it will become a butterfly.
More and more people believe that it is nature that can provide us with solutions to the many challenges that face us. It is only by learning from nature’s design and by learning to cooperate
Downloaded from http://iwaponline.com/ebooks/book-pdf/651186/wio9781780407586.pdfby gueston 14 January 2022

296 Smart Water UtilitieS: Complexity made simple
with both nature and each other that we can survive long term. The movement has already begun.
Many examples of organisations and companies that have taken this route are described in the book Monberg-Larsen (2014) Serve to Profit – Butterfly Leadership and more are catching on everyday.
The new imaginary cells are being transformed in today’s society. We believe that those companies who are able to create a good, decentralised framework, with the freedom to think differently and facilitate clearly opposing beliefs between leadership and employees, will be the companies we want to dedicate our hearts and minds to.
This article is written in terms of flow, flex and form and is designed in our cells; that is, in our individual and social nature. In this design, development, cooperation and existence are more important than an economic bottom line or any material value. It is not about getting faster, but better. And the butterfly effect model is one, which will support the coming water utilities to become smart in terms of flow, flexibility and form.
imPlementation
Building trust in an organisation is keen to implement the butterfly effect and the three roles. The three roles expect people to act and work with truthfulness, accountability and consciousness in their daily routine.
The challenge is centred around changing the mind-set from a lose–win to a win–win mindset.
Everyone has to be aware of their own new role and at the same time be aware of changing roles. In one situation you will be the servant leader for your employees and in another situation you will
have to be a personal leader and make the form.
In Denmark we have a coaching/delegating organisational structure and we like to get everyone on board to take part in the discussion and decisions. In the butterfly effect, we separate these things as the servant leader creates the vision and the frame, and the personal leader fills out the frame, while the facilitator ensures that this work goes on in the best way. The facilitator helps people talk and mediates them to a common understanding. Creating the frame gives the personal leaders the freedom and space to find the best functioning solution. The frame itself will tell us if the border is being respected and a lot of decision and decision meetings will be redundant as the system has a high degree of being self-decisive and self-organising.
The challenge with the butterfly effect is that everyone has to make the transformation at the same time and simultaneously in the new mind set. Most people know what to do, but to do it in real time, is always hard work, as our behaviour and attitude often is stocked in the former paradigm. To make a successful implementation and to “live” the butterfly effect, we need people to be conscious about what they see, hear and feel and their choices to a much higher degree than they are today. Implementation of the butterfly effect and the three new roles in flow, flex and form creates an agile resilient organisation, as a lot of issues will solve themselves, more smoothly and faster than you realise. The winnings will be the building-up of value in the organisation and people who think inclusion, feel freedom and live creativity and cooperation.
Let it all begin.
referenceTina Monberg with Gitte Larsen (Ed.), 2014. Serve to
Profit – Butterfly Leadership, Straagaarden, Denmark.
Downloaded from http://iwaponline.com/ebooks/book-pdf/651186/wio9781780407586.pdfby gueston 14 January 2022

297neW PerSPectiVeS
Water is life - let's treat it wisely
Downloaded from http://iwaponline.com/ebooks/book-pdf/651186/wio9781780407586.pdfby gueston 14 January 2022

The important thing about you is
That you are you
It is true that you were a baby
And you grew
And you will grow
Into a man
Or a woman
But the important thing about you is
That you are you
Margaret Wise Brown
Downloaded from http://iwaponline.com/ebooks/book-pdf/651186/wio9781780407586.pdfby gueston 14 January 2022

next StepS9
Downloaded from http://iwaponline.com/ebooks/book-pdf/651186/wio9781780407586.pdfby gueston 14 January 2022

300 Smart Water UtilitieS: Complexity made simple
The 2015 World Economic Forum (WEF) judges “water crisis”, described as “a significant decline in the available quality and quantity of fresh water, resulting in harmful effects on human health and/or economic activity” as the top global risk when it comes to impact. This issue has been on the top five since 2012, but 2015 is the first time it has the top position. In terms of likelihood, WEF also judges water crises high – at position 7 out of 28 global risk themes. At the same time the risk changed from being viewed as a primarily environmental risk to becoming a primarily societal risk, see Figure 9.1.
We, as a community of water experts, are faced
with a large challenge. The challenge is complex and hence
has many aspects: technical, societal, political, managerial, financial, organisationaland
behavioural aspects.
The UN describes the water crisis situation like this:
“Water scarcity already affects every continent. Around 1.2 billion people, or almost one-fifth of the world’s population, live in areas of physical scarcity, and 500 million people are approaching this situation. Another 1.6 billion people, or almost one quarter of the world’s population, face economic water shortage (where countries lack the necessary infrastructure to take water from rivers and aquifers).
Water scarcity is among the main problems to be faced by many societies and the World in the 21st century. Water use has been growing at more than twice the rate of population increase in the last century, and, although there is no global water scarcity as such, an increasing number of regions are chronically short of water.
Water scarcity is both a natural and a human-made phenomenon. There is enough freshwater on the planet for seven billion people but it is distributed unevenly and too much of it is wasted, polluted and unsustainably managed.”
(http://www.un.org/waterforlifedecade/scarcity,
latest access 1 June 2015)
We, as a community of water experts, are faced with a large challenge. The challenge is complex and hence has many aspects: technical, societal, political, managerial, financial, organisational and behavioural aspects. This book on Smart Water utilities primarily addresses the technical theme of the solution and touches only lightly upon the other aspects. We believe that technology can play a large role in inventing solutions that work locally and eventually will provide a collaborative network of effective and efficient ways of managing water cycles by Smart Water utility thinking. The application of more advanced, intelligent and critical thinking about water, water symbiosis and water cycles will play well into the other fields by informing them on the true state of water.
An increasingly complex world calls for more complex thinking and an M-A-D, i.e. measurement–analysis–decision based mind-set around which to make sure that there is a clear interconnection between all the decisions we make about the unit processes: natural resources (lakes, rivers, oceans), water utility processes
Final remarkS
Downloaded from http://iwaponline.com/ebooks/book-pdf/651186/wio9781780407586.pdfby gueston 14 January 2022

301the next StepS
(water intake, water treatment, water distribution and collection), agricultural usage, water for energy, water for industry, water for private households, etc. If we are not careful and diligent in coordinating all these processes sensibly, effectively and in a just manner it will be “every man for himself ”. We see this happening already in too many places; leading to conflict, poverty, illness and despair. We need to find smart solutions, we need to mediate between needs and find ways to re-use the water and we need
to find ways of saving water and not losing it foolishly either quantity – or quality wise.
There is a responsibility to be met. A responsibility that requires foresight so that the systems we build and manage will not only not further impair but also actively restore the ecological balance that is under such tough pressure in the wake of the industrial revolution reaching every corner of the world. A responsibility to the next generations, so
Figure 9.1: Top five threats as to impact as judged by World Economic Forum in 2011–2015. http://reports.weforum.org/global-risks-2015 (latest access 22 March 2016).
Fiscal crisis
climate change
geopolitical conFlict
asset price collapse
extreme energy price volatility
major systemic Financial Failure
water supply crisis
Food shortage crisis
chronic Fiscal imbalances
extreme volatility in energy and
agricultural prices
major systemic Financial Failure
water supply crisis
chronic Fiscal imbalances
diFFusion oF weapons oF mass
destruction
Failure oF climate change adaptation
Fiscal crisis
climate change
water crisis
unemployment and under-employment
critical inFormation
inFrastructure breakdown
water crisis
rapid and massive spread oF disease
weapons oF mass destruction
interstate conFlict with
regional consequences
Failure oF climate change adaptation
2011 2012 2013 2014 2015
Downloaded from http://iwaponline.com/ebooks/book-pdf/651186/wio9781780407586.pdfby gueston 14 January 2022

302 Smart Water UtilitieS: Complexity made simple
that they also have room to prosper, thrive and enjoy, not living in the shadows of ecological disasters and water wars. We have an economical responsibility of really making every dollar, euro, yuan, rubble, real, rupee count and make the most of it, by thinking analytically and collaboratively. We have to be responsible both from the supply side and from the consumer side. The low price on water should mean water for all – not water for rich people to spend thoughtlessly and haphazardly.
The external drivers for the water crisis are actually quite well understood and need to be dealt with on a local basis answering the challenge everywhere. No grand coordinated scheme from the UN or any single financial institution can (or will) solve the problems stemming from the drivers of population increase, climate change, urbanisation, energy issues and ecological imbalances. They need to be tackled by diligent, dedicated, responsible and intelligent people on the ground.
The technical drivers for solving the problems are there and are getting better all the time. They are sensor development, development of smart programs to enable the constructive usage of the abundant computer power available and the emerging easy and low-energy and inexpensive communication networks that are becoming
available. They are also flexible and agile solutions for treating and transporting water and new ways of thinking and working by means of collaborative development and co-creation.
This gives rise to a number of emerging paradigms involving Smart Water utilities and the internet of things, more sophisticated water infrastructure, more technical choice to fit the exact situation, demand control and action, i.e. not only supply oriented thinking, but full circle thinking with symbiosis and a new angle of entry for sustainability
But in all these technical discussions let’s not forget the people who make it happen. How do we prepare ourselves and a new generation for this challenge? What is required in terms of education and training? How should we bring up our children to care for water? How can we encourage and enhance the collaboration between people, between utilities, between stake-holders – on a local as well as a global basis? These are high challenges and require leadership at all levels: at utilities, politically and business-wise.
New challenges require new thinking, bold moves and hard work. So this is your call for action: this is not science fiction, it can happen today! It will take years, so we have to start today – keep pushing the boundaries!
New challenges require new thinking, bold moves and hard work.
Downloaded from http://iwaponline.com/ebooks/book-pdf/651186/wio9781780407586.pdfby gueston 14 January 2022

303the next StepS
donation
There is so much that needs to be changed in our world. Charles Eisenstein (The More Beautiful World Our Hearts Know is Possible) speaks and writes about humanity being in a “space between stories”. We are still in an old story that has brought us a lot of benefits based on heroic scientific endeavours. The water utility system for example has rid us of great suffering from diseases and brought us the luxury of running water, warm baths and nice, comfortable toilet conditions.
However, it seems as if the old story is falling apart and the old story is becoming filled with “unfortunate side effects” of suffering. And these side effects are progressively becoming main effects, such as climate change, plastics suffocating the oceans, stress, depression, pollution with all kinds of chemicals everywhere, extinction of animal species, a food industry drawing profits from unimaginable animal suffering, oil spills, deforestation, and the list goes on.
We must create a new story together and change what we believe can be done better and more compassionately. We hope that a more intelligent and sensitive approach to water may be part of that healing. But we would like to also contribute in other domains. Hence we have decided to donate our income from this book to the organisation Free The Slaves as we find the knowledge of modern day slavery unbearable.
about Free the Slaves
Free the Slaves was born in the early days of the new millennium, dedicated to alerting the world about slavery’s global comeback and to catalysing a resurgence of the abolition movement.
Slavery has been outlawed everywhere, but it has not been eradicated. Free the Slaves exists to help finish the work that earlier generations of abolitionists started.
We help those in slavery escape the brutality of bondage. We help prevent others from becoming trapped by traffickers. We help officials bring slave holders to justice. We help survivors restore their dignity, rebuild their lives, and reclaim the future for themselves, their families, and their communities.
Slavery will end when businesses clean up their supply chains and consumers demand slavery-free products, when governments and international institutions toughen enforcement and fund anti-slavery work worldwide, and when activists and advocates educate the vulnerable about their rights and empower those in slavery to take a stand for freedom.
Free the Slaves is building a world without slavery by demonstrating that ending slavery is possible.
http://www.freetheslaves.net/
Downloaded from http://iwaponline.com/ebooks/book-pdf/651186/wio9781780407586.pdfby gueston 14 January 2022

304 Smart Water UtilitieS: Complexity made simple
acknoWledgementS
We would like to thank the contributors of case stories for this book: Linda Åmand, Bhoupendra Poudel, Soren Norh Bak, Nurudeen Adeyinka Salau, Leiv Rieger, Jens Alex, Jo Cooper, Nenibarini Zabbey, Kim van Schagen, Lorenzo Benedetti, Andreas Weingartner, J. Raich-Montiu, F. Edthofer, R. Wurm, Thomas Guildal, Anitha Sharma, Andres Alvarado, Ingmar Nopens, and Martijn Bakker. Without you struggling at the frontier of Smart Water Technologies, the transformation would never succeed – please keep up the good work!
Thank you to all our contributing thought leaders who have provided us with interesting new perspectives both from the inside of the smart water arena and from the outside. We are happy to have you in our book and in our lives: Lawrence Jones, Oliver Grievson, Jan Post, Tina Monberg, Mette Thorkilsen, Amir Cahn, Bo Neergaard Jacobsen, Jing Liu, Paul Reiter, Leiv Rieger, Steven Kenway and Henry Charrabé.
Thanks to the reviewers: Manel Poch (Lequia, University of Girona, Catalonia), Kriz Villez (Eawag, Switzerland) and Doug J. Lumley (Gryaab, Sweden) who helped us to see our mistakes and gaps in the book, to which we had become blind.
Thanks to Kalundborg Utility (Denmark) for co-sponsoring the book and hence enabling the book to be more graphical than most books in the technical water arena. We feel and hope that this will ease the path of understanding and applying the concepts in real life. Thanks also to colleagues and consultants at Kalundborg Utility for inspirational conversations. A special thank to CEO Hans-Martin Friis Møller for supporting this project in every way possible.
Thanks to the ICA community who have provided a lot of knowledge and inspiration over the years. Our Scandinavian close collaborators: Ulf Jeppsson, Christian Rosen, Dalius Misiunas, Jing Liu, Linda Åmand, Bengt Carlsson, Bo N Jacobsen and Anders Lynggaard-Jensen
Our international ICA colleagues and inspirators: Dr. Manel Poch and Dr. Quim Comas (University of Girona, Catalonia), Dr. Ignasi Rodriguez-Roda
(ICRA, Catalan Institute for Water Research, Girona), Dr. Ann Mattsson and Dr. Doug Lumley (Gryaab AB, Sweden), Prof. Peter Vanrolleghem (Université Laval, Quebec, Canada), Dr. Leiv Rieger (inCTRL Solutions, Canada), Prof. Krist Gernaey (Technical Univ. of Denmark, DTU), Prof. Changwon Kim (Pusan National University, Busan, Korea), Dr. Imre Takács (Dynamita, Bordeaux, France), Prof. Zhiguo Yuan (AWMC, Univ. of Queensland, Brisbane, Australia).
Several Asian and African colleagues have provided their perspective and experiences on water resources and urban water systems: Prof. Jining Chen (former President, Tsinghua University, Beijing; Minister of Environment, China) and Assoc. prof. Siyu Zeng and Dr. Xin Dong, Prof. Shuming Liu (School of Environment, Tsinghua University), Prof. Zaini Ujang (former President, Technical University of Malaysia, UTM; Secretary General II, Ministry of Education, Malaysia), Dr. Norhayati Abdullah (UTM, now Chairperson of the IWA Young Water Professionals), Dr. Inga Jacobs, (Water Research Commission, Pretoria, South Africa) and Dr. Tamsyn Sherwill (Editor Water SA, Pretoria, South Africa).
The poems quoted for each chapter divider are inspired by an idea from Margaret Wise Browns “The important book”, which is a beautifully illustrated book for children about what is important. The last chapter poem is of her hand and is about the important thing about you.
Finally we would like to thank our editor Maggie Smith and everybody at IWAP who helped this book to be realised. For graphical design we would like to thank Haline Ly at Whale for the frontpage design and active support during the project and Gemma Wilson for designing the layout of the book. Thanks also to Prof. Helmut Kroiss, Technical University of Vienna, President of IWA, who has given a lot of great support.
Thanks to family and friends for being there and supporting us during the process of book writing. A special thanks to Gustaf ’s wife Kirsti who with some kind of super-hero powers has been able to listen interested and happily to our discussions about this topic for hours and days.
Downloaded from http://iwaponline.com/ebooks/book-pdf/651186/wio9781780407586.pdfby gueston 14 January 2022

Downloaded from http://iwaponline.com/ebooks/book-pdf/651186/wio9781780407586.pdfby gueston 14 January 2022

iwapublishing.com @IWAPublishing
ISBN: 9781780407579 (Paperback)ISBN: 9781780407586 (eBook)
“In a world of increased complexity and rapid changes water professionals are looking for new solutions to cope with these challenges in order to operate and manage their systems in a more effective and sustainable way. Pernille Ingildsen and Gustaf Olsson share their long time experience as teacher, researcher and manager. By introducing the M-A-D (Measurement-Analysis-Decision) concept they provide the basis for a better understanding and operation of water systems at all levels. This is a must-read book for all water professionals irrespective if you are researcher, a consultant, an operator or a manager of a water utility. You will find an abundance of new ideas for improving the water cycle and to transform your water system into a real smart water system.”
Norbert Jardin, Ruhrverband, Germany
“The world looks ahead to the ”post-2015 development agenda” towards 2030 by launching a new set of Sustainable Development Goals and a new global Climate Agreement. Facing the challenges of a climate uncertain future, including rapid urbanisation, in the midst of an unprecedented information revolution, this book addresses the right issues at the right time: how to contribute to a sustainable future by harnessing our ever growing mass of information and data to achieve ”smart” water and energy management. And it does so in the right way: going from the comprehensive to the specific, from the complex to the simple, by taking all relevant utility stakeholders by the hand and give them a toolbox to face a world of advanced sensors and real time control. I learned a lot from it and warmly recommend it to others.”
Dr Torkil Jønch Clausen, Senior Adviser to the DHI Group and Global Water Partnership Chair of the Scientific Programme Committee for the World Water Week in Stockholm Governor of the World Water Council
“Smart Water Utilities: Complexity Made Simple is unusual in the breadth of its scope, which includes a global overview of sustainability issues, a discussion of management issues at the utility level, and extensive information on the technical specifics of designing, operating, and fully utilizing information from automated data and control systems. The authors have presented all information, from the most abstract to the most detailed, in a user-friendly way, using analogies from the real-life experience of readers to clarify their points. This book is a real addition to the literature of the water industry.”
Cheryl Davis, Chair of IWA Sustainability Group, CKD Consulting
“The book is an outstanding inspiration and eye-opener. It is a must for every water manager and for anyone who wants to become a water expert.”
Professor Dr Harro Bode, CEO, Ruhrverband, Germany
Pernille Ingildsen and Gustaf Olsson
Smart Water UtilitiesCOmPlexIty made sImPle
Smart W
ater Utilities: C
Om
PlexIty ma
de sIm
PlePernille Ingildsen and G
ustaf Olsson
Smart Water UtilitiesCOmPlexIty made sImPle
Downloaded from http://iwaponline.com/ebooks/book-pdf/651186/wio9781780407586.pdfby gueston 14 January 2022