Small Network Equipment: Considerations for Energy ... - IEA 4E
32
Small Network Equipment: Considerations for Energy Efficiency Policy JULY 2021
-
Upload
khangminh22 -
Category
Documents
-
view
1 -
download
0
Transcript of Small Network Equipment: Considerations for Energy ... - IEA 4E

Small Network Equipment: Considerations for Energy Efficiency Policy
J U L Y 2 0 2 1

The Technology Collaboration Programme on Energy Efficient End-Use Equipment (4E TCP), has been supporting governments to co-ordinate effective energy efficiency policies since 2008.
Fifteen countries have joined together under the 4E TCP platform to exchange technical and policy information focused on increasing the production and trade in efficient end-use equipment. However, the 4E TCP is more than a forum for sharing information: it pools resources and expertise on a wide a range of projects designed to meet the policy needs of participating governments. Members of 4E find this an efficient use of scarce funds, which results in outcomes that are far more comprehensive and authoritative than can be achieved by individual jurisdictions.
The 4E TCP is established under the auspices of the International Energy Agency (IEA) as a functionally and legally autonomous body.
Current members of 4E TCP are: Australia, Austria, Canada, China, Denmark, the European Commission, France, Japan, Korea, Netherlands, New Zealand, Switzerland, Sweden, UK and USA.
Further information on the 4E TCP is available from: www.iea-4e.org
The EDNA Annex (Electronic Devices and Networks Annex) of the 4E TCP is focussed on a horizontal subset of energy using equipment and systems - those which are able to be connected via a communications network. The objective of EDNA is to provide technical analysis and policy guidance to members and other governments aimed at improving the energy efficiency of connected devices and the systems in which they operate.
EDNA is focussed on the energy consumption of network connected devices, on the increased energy consumption that results from devices becoming network connected, and on system energy efficiency: the optimal operation of systems of devices to save energy (aka intelligent efficiency) including providing other energy benefits such as demand response.
Further information on EDNA is available at: iea-4e.org/edna
This report was commissioned by the EDNA Annex of the 4E TCP. It was authored by Katherine Dayem and Catherine Mercier of Xergy Consulting. The views, conclusions and recommendations are solely those of the authors and do not state or reflect those of EDNA, the 4E TCP or its member countries.
Views, findings and publications of EDNA and the 4E TCP do not necessarily represent the views or policies of the IEA Secretariat or its individual member countries.
The IEA, 4E, EDNA and the authors make no conclusions, endorsements or disendorsements in relation to any organisations or brands mentioned in this report.

PAGE 1 | Small Network Equipment – Policy Considerations
SMALL NETWORK EQUIPMENT: CONSIDERATIONS FOR
ENERGY EFFICIENCY POLICY
Prepared by:
Katherine Dayem and Catherine Mercier XERGY CONSULTING
Prepared for:
4E ELECTRONIC DEVICES AND NETWORKS ANNEX
July 2021

PAGE 2 | Small Network Equipment – Policy Considerations
TABLE OF CONTENTS
1 EXECUTIVE SUMMARY .............................................................. 3
2 INTRODUCTION AND MOTIVATION .......................................... 4
3 OVERVIEW AND CATEGORIZATION OF SNE DEVICES .......... 5
4 ANALYSIS OF SNE POWER DRAW ......................................... 12
5 ENERGY SAVINGS POTENTIAL AND BARRIERS .................. 20
6 CONSIDERATIONS FOR POLICY ............................................ 23
7 CONCLUSIONS ......................................................................... 26
8 REFERENCES ........................................................................... 27
9 APPENDIX ................................................................................. 29

PAGE 3 | Small Network Equipment – Policy Considerations
1 EXECUTIVE SUMMARY
The energy use of small network equipment (SNE) – network equipment typically used the in
residential and small commercial sectors – will continue to grow as consumers connect more
products to the Internet and demand more data and information from them. Energy
efficiency in SNE, however, remains a secondary factor in manufacturer design and
consumer purchasing decisions, which tend to focus primarily on performance. Energy
efficiency policy may provide the necessary incentive for the development of more efficient
SNE products.
This project lays a foundation for future policy making to improve SNE energy efficiency. We
develop a product categorization system for SNE based on product functions, analyze
available data to estimate relationships between product functions or component
characteristics and power draw, review energy savings strategies and the barriers that may
be preventing their implementation, and discuss policy considerations and approaches.
We find that groups of SNE products that perform similar functions can draw a wide range of
power. This indicates that some products may be performing more efficiently than others,
and that energy efficiency policies may encourage the market to shift to more efficient
designs. We estimate that SNE currently consume 120 TWh per year globally. Through
power scaling and efficiency improvements, SNE energy use may be decreased by 20 to
50%.
Current voluntary measures to improve energy efficiency are likely too complex to be used in
crafting and enforcing policy. We review the elements necessary for SNE efficiency policy,
including metrics and policy structure, and approaches that could lead to successful policy
implementation. Policy approaches such as minimum energy performance standards
(MEPS) and energy labeling can be implemented with varying degrees of complexity and
stringency, and therefore varying degrees of development effort for policy makers. Creative
approaches, such as a combination of MEPS and labeling, may yield better results than
MEPS alone.

PAGE 4 | Small Network Equipment – Policy Considerations
2 INTRODUCTION AND MOTIVATION
In the landscape of consumer electronics, network equipment has a unique role of facilitating
data transfer between products and services. As the adoption of network connected end
user products continues to grow, and as those products consume and produce more data,
the demands on network equipment will increase. Consumers demand ever faster data rates
and improved wireless range lead to more functionality in network equipment, which in turn
leads to increased energy use. This increased functionality and energy use warrants an
examination of the energy savings potential of network equipment, and the potential role for
energy efficiency policy to realize energy savings.
This project examines small network equipment (SNE), which is network equipment used in
residential and small commercial applications, and how energy efficiency policy can be
structured to encourage energy savings. SNE is not currently covered by government
efficiency polices, with the exception of the EU Ecodesign regulation. Industry-led voluntary
measures to improve energy efficiency are in place in two major economies. In the EU, the
Code of Conduct for Broadband Equipment (CoC) covers SNE as well as upstream network
equipment (Bertoldi and Lejeune 2020). In the U.S. and Canada, the Voluntary Agreement
for Ongoing Improvement to the Energy Efficiency of SNE (VA) has been in place since
2015 and 2020, respectively (SNE VA Signatories 2020). These voluntary measures
establish SNE product categories based on functions of and components within a SNE
product. They establish maximum idle power targets based on product type, network
functions and components (such as network interfaces), as well as non-network functions.
The VA requires annual data reporting and is one data source examined in this project.
In this report, we investigate key elements of potential policy, including SNE product
categorization and policy approaches. We analyze available data to characterize power
draw of SNE products currently on the market, and identify data gaps that may need to be
filled as policy is developed. In the sections below, we first review and categorize SNE
products based on functions and the components that provide the functions. Next, we
analyze the available data to identify relationships between product categories and power
draw. We discuss energy savings strategies and estimate the energy savings potential of
SNE in major economies. We end with a discussion of data gaps and policy approaches.

PAGE 5 | Small Network Equipment – Policy Considerations
3 OVERVIEW AND CATEGORIZATION OF SNE DEVICES
Network equipment is a broad range of products whose main purpose is to pass data traffic
within a network and, in some cases, provide that network (Harrington and Nordman 2014,
Lanzisera et al. 2010). SNE is the specific group of network equipment used in homes and
small businesses, on what is often called the “edge” of the network.1 The reader may be
familiar with common SNE products such as modems, firewalls, routers, and access points.
An SNE product offers one or more functions – actions or services – to the user. These
functions are provided by components, which are discrete hardware within the product (e.g.,
Harrington and Nordman 2014), and the related software that controls and orchestrates
component operation. The components and software impact product power draw (e.g.,
EDNA 2018). Given that power is impacted by components and software, which are used to
deliver the function of a product, we develop a tiered categorization for SNE: a primary
categorization based on functions, and a secondary one based on characteristics of the
components and software used to provide the given functions.
In this section, we review the main functions of SNE products and outline a primary
categorization based on those functions. We next discuss the components that provide the
SNE functions, and the characteristics of the components and software that impact power
draw. Lastly, we outline component characteristics that can be identified from product
specifications, such as network protocols and the number of ports or radios, that are a useful
basis for secondary classification.
3.1 Product overview and main functions
An SNE product provides one or both of two main functions on the edge of the network: (1)
receiving and sending data from or to an external wide area network (WAN, e.g., the Internet
or the cloud) and (2) moving data within a local area network (LAN) to end user products
such as computers, appliances, or mobile devices (Figure 1).2
Broadband access equipment provides the first function listed above; it allows consumers
to access high-speed data services to a service provider’s wired, wireless or optical network.
The defining function of broadband access equipment is that of a modem: receiving and
demodulating analog signals from, and modulating and sending signals to the broadband
service provider network. SNE that performs only this function are modems. We refer to
SNE that provide additional functions, such as telephone interfaces or LAN-related functions
(discussed in the next paragraph) as integrated access devices (IADs), following the
1 More specific definitions of SNE include that of the U.S. ENERGY STAR program, which defines SNE as network equipment that operates on “small networks or a subset of a large network,” including any with “integral wireless capability” or stationary equipment with 11 wired network ports or less for use outside of data center equipment racks (U.S. EPA 2014).
2 For a more detailed illustration, see Harrington and Nordman (2014).

PAGE 6 | Small Network Equipment – Policy Considerations
terminology of ENERGY STAR (U.S. EPA 2013). A number of other names are used for
IADs or a subset of them, including home gateway, broadband gateway, or modem-router.
Market research suggests that sales of broadband access equipment is flat or growing
slowly in North America (CA IOUs 2020) and we expect that these trends apply to other
economies in which a large fraction of the residential sector has broadband access.
LAN equipment includes SNE devices that do not have a direct interface to a service
provider. Rather, the defining function of these products is to move traffic between products
within a LAN (Figure 1). Common LAN equipment includes routers, access points, and
switches, and newer-to-market equipment such as Wi-Fi mesh systems (multi-component
products that improve Wi-Fi coverage by establishing and maintaining a mesh network), and
smart home or IoT gateways (a type of proprietary LAN equipment that connects consumer
end products like light bulbs or home security systems to the LAN). Market research
estimates growth in LAN equipment, particularly in Wi-Fi mesh systems, as consumers seek
to improve access throughout their homes (CA IOUs 2020).
The term “gateway” can cause confusion in SNE product terminology. Generically, a
gateway is any type of SNE product that links two networks. A “home gateway” is a
broadband access product that links a WAN and a LAN. The terms “IoT gateway” or “smart
home gateway” are used to describe a LAN device that links two LANs. A home security
system, for example, may include an IoT gateway that connects a LAN of the security
system to the broader LAN within the home.
Figure 1: Project scope (within solid black box) in relation to broader networks (WANs) and local networks (LAN).
3.2 Primary categorization by function
At the highest level of the categorization, we segment SNE products into the two functional
categories introduced above: broadband access equipment and LAN equipment. Broadband
access equipment is further segmented into modems and IADs based on the absence or
presence of LAN-related functions (Table 1). LAN equipment is segmented by how it moves

PAGE 7 | Small Network Equipment – Policy Considerations
data on the LAN and the associated sophistication of the device. These categories are
related to the functional layers on which products operate within OSI model network
topology. Processing requirements (and therefore, in theory, power requirements) increase
with layer (Fraunhofer IZM 2019).
Layer 1 LAN equipment includes simple products that provide functions associated with OSI
layer 1, using the physical layer to transmit data traffic as simple bits. These devices do not
perform any data processing and therefore should require the least amount of power of the
LAN equipment products (Pearson 2002). Examples of layer 1 LAN products include hubs
and range extenders.
Layer 2 LAN equipment includes products that provide functions that reside on layer 1 and 2
of the OSI model. They operate on the data link layer to transmit frames of data to MAC
address, and may multiplex data streams, detect data frames, and allow medium access
and error control (Garg 2007). Prevalent examples include access points and switches.
Layer 3 LAN equipment can provide functions associated with OSI layer 3 and below. These
products operate on the network layer to move data packets across the network using the
most appropriate paths. They also address messages and translate logical addresses into
physical addresses. A router is a common type of layer 3 device.
Layer 4+ LAN equipment utilizes higher OSI model layers and levels of processing to
provide more security or additional intelligence to the act of passing network traffic. This
category includes firewalls, which scan for and eliminate unauthorized or malignant data
(Lanzisera et al. 2010).
Table 1: Function-based SNE categorization
Type Category Function Product
Examples
Broadband Access
Equipment
Modem Receiving/sending and demodulating/modulating analog signals from/to the broadband service provider network
Modem
IAD Modem plus additional function(s) Home gateway
Modem-router
LAN Equipment
Layer 1 Transmit bits Hub
Range extender
Layer 2 Transport frames containing physical addressing Some switches
Access point
Bridge
Layer 3 Transport packets containing IP addresses Router

PAGE 8 | Small Network Equipment – Policy Considerations
Type Category Function Product
Examples
Some switches
Layer 4+ Security or other advanced functions Firewall
This approach is similar to other classification schemes for SNE. The VA, for example, splits
LAN equipment into two categories based on a similar criteria; “basic” products with low data
processing needs that operate on OSI model layer 1, and “advanced” products that include
routers, access points, and VoIP-capable devices associated with OSI model layers 2 and
up (SNE VA Signatories 2020).
3.3 Components that provide SNE functions
As the data will show in Section 4, the function-based categories segment SNE products into
groups that show wide ranges of power draw. To develop a meaningful categorization,
characteristics that impact SNE power draw must be included. These characteristics are
related to the components and software that SNE products use to implement network-
related and other functions. For the purposes of this discussion, we group the common
components of SNE products into the three types below.
All broadband access equipment (modems and IADs) contain at least one WAN interface,
which is a physical connection point that provides access to the Internet service provider’s
wired, wireless, or optical broadband network using an appropriate communication protocol.
The type of WAN interface used in a product depends on the data transmission medium.
DSL and DOCSIS interfaces transmit data over phone lines and coaxial cables respectively;
optical network interfaces transmit data over fiber optic cables; cellular interfaces enable
wireless broadband access.
All LAN and broadband access equipment contain one or more LAN interfaces, which are
physical connection points that allow end user devices such as computers, printers or TVs
within a building to connect to one another and share data. LAN equipment and IADs may
have multiple wired (e.g. Ethernet or USB) and wireless LAN interfaces (e.g. Wi-Fi,
Bluetooth, Zigbee ) (Fraunhofer IZM 2019). Modems contain only wired LAN interfaces.
WAN and LAN interfaces – collectively referred to as network interfaces – are designed to
transmit data using a network protocol: a set of rules that determines the format, speed, and
other properties of the data transferred. These factors can impact SNE power requirements;
faster data transfer rates may require more power. Wireless data transfer generally requires
more power than wired transfer. New versions of a network protocol are progressively added
to enable improvements such as faster data rates or improved security. Common protocols
and current versions are listed in Table 2.

PAGE 9 | Small Network Equipment – Policy Considerations
SNE products also require central components such as processors, network controllers,
memory, and power supplies, to provide supporting functions (Fraunhofer IZM 2019). The
capability or capacity of the central components is determined in part by the network
functionality. A more function-rich product will include more processing and memory capacity
than a simple product, for example.
Table 2: Common protocols utilized by SNE interfaces
Component type Common or current versions & protocols
WAN interface DSL ADSL
VDSL
VDSL2
Collectively, xDSL
Cable DOCSIS 3.0
DOCSIS 3.1
Fiber optic GPON
EPON
Cellular LTE 4G
LTE 5G
LAN interface Ethernet IEEE 802.3bx (10/100/1000 Mbps)
IEEE 802.3bz (2.5 & 5 Gbps)
IEEE 802.3ae (10 Gbps)
Wi-Fi IEEE 802.11n
IEEE 802.11ac
IEEE 802.11ax
Low speed wireless*
IEEE 802.15.4 (Zigbee)
Bluetooth
Bluetooth Low Energy (LE)
USB 2.0
3.0
3.1
MoCA 2.0
2.5
Powerline G.hn
HPNA
* Maximum bandwidth of current low speed wireless protocols is 2 Mbps (Bluetooth).
A given SNE product possesses central components and any variety of network interfaces.
The number and types of components and their characteristics depend on the network
functions of a given device. Figure 2 illustrates common components within SNE products.
All SNE products include the central components shown in the center of the figure.
Broadband access equipment include at least one WAN interface such as those listed on the
left side of the figure. LAN equipment and IADs contain at least one LAN interface (right), but

PAGE 10 | Small Network Equipment – Policy Considerations
can include several types and/or several interfaces of a certain type depending on the
functionality of a given device. An access point, for example, which connects end-user
devices on a wireless LAN to a wired network, contains a number of wireless LAN interfaces
(e.g., Wi-Fi), a wired interface (e.g., Ethernet), and central components; it does not contain
any WAN interfaces. A modem, on the other hand, contains a WAN interface and central
components.
Figure 2: Main components in SNE products. All SNE contain central components. Broadband access equipment contains WAN, and in some cases LAN, interfaces. LAN equipment contain LAN interfaces. Adapted from Fraunhofer IZM (2019).
SNE products can provide additional functions that are not directly related to moving data on
a WAN or LAN. For example, a recent addition to the market are products that incorporate
SNE functionality into other product form factors, such as an LED bulb with an integrated
access point.3 These products possess components that provide network functions, as well
as additional components to provide the non-network functions. The LED bulb with access
point example would contain a wireless network interface to provide its network functions
and an LED and LED driver to provide the lighting function. In these types of products,
central components may be dedicated to a certain function, such as a dedicated network
processor, or shared by functions, such as power supply. The principles described in this
report apply to the network-related functions and components of such products, however the
non-network components and increased capacity of shared components are beyond the
scope of this discussion.
3 See, for example: http://xy-connect.com/en/

PAGE 11 | Small Network Equipment – Policy Considerations
3.4 Secondary categorization by component characteristics
Because the functions delivered by a SNE product determines component and software
choices, and those in turn impact product power, the SNE categorization developed here
includes a secondary layer based on component characteristics.4 Based on previous EDNA
research (EDNA 2018), we outline three such characteristics that likely influence the power
draw of SNE devices (Figure 3).
Figure 3: Component characteristics that impact SNE product power draw. A given product’s functions drive design choices that includes the selection and implementation of components and software, which impact whole-product power draw.
Number and type of components. A product’s functions determine the number and type of
components needed. Of particular importance are the network interfaces; as shown in
Section 4, network interface type impacts product power draw. The more interfaces a
product contains, the more power it is expected to draw.
Component characteristics. Key characteristics of components influence functionality and
likely the power draw of products. Focusing on network interfaces, such characteristics
include bandwidth (the maximum data transfer rate of an interface) and network protocol.
For wireless interfaces, transmit power and the number of antennas are also important
characteristics (Ayre et al. 2021, Gray 2021). Products with higher bandwidth, greater
transmit power, and more antennas will, in theory, draw more power. Wired types of
interfaces, which move data along a cable, should draw less power than most wireless
interfaces, which require power to broadcast signals over an acceptable distance like a
house.5 Other characteristics are inherent to the component itself, such as its efficiency in
delivering its function. Product power draw can be reduced by using efficient components.
4 In the remainder of this discussion, we use the term component characteristics to include both the hardware and software.
5 Low speed, low power wireless technologies like Zigbee, Z-wave, and Bluetooth Low Energy may draw lower power than high speed wired interfaces like Ethernet, but are designed for use for much lower data traffic applications.

PAGE 12 | Small Network Equipment – Policy Considerations
Software and component duty cycle. The power of a component with any given set of
characteristics depends on its duty cycle – the time spent in its various operating states –
which is controlled by software. A component that only utilizes its higher power states will
draw more power than a comparable component that utilizes lower power states when its
function is not needed. Software can enable such power scaling, which is an important
energy savings strategy that scales power to the work being done and powers down unused
components (Section 5.1).
Of the many factors potentially impact power of SNE products, which should be used in a
categorization scheme? In reality, software and component duty cycles are difficult if not
impossible to discern from product inspection or specifications, and therefore are not useful
for categorization. Factors that are easily identified and therefore useful for categorizing SNE
include the types of components, particularly network interfaces, the number of components
of a particular type, and bandwidth (EDNA 2018). Network protocols apply to a specific type
of network interface and determines bandwidth. Therefore, network protocol can be used in
the categorization as a proxy for interface type and bandwidth. For products with wireless
network interfaces, the transmit power is a significant power impact (Ayre et al. 2021, Gray
2021).
In summary, the SNE classification described here based on first functions, then component
characteristics. The function segmentation in Table 1 forms the primary level of
categorization. Secondary categorization is based on network protocol (Table 2) and, for
products with wireless network connectivity, potentially radio transmit power.
A categorization scheme based on network protocol faces one complication: many SNE
products utilize more than one network protocol. Although most broadband access
equipment contains only one WAN interface type, IADs and LAN equipment can contain
many types of LAN interfaces. The categorization may therefore group products based on
the combination of protocols used. The VA addresses this issue differently; broadband
access equipment categories are based on WAN protocol, whereas LAN equipment
categories are based on function, and LAN interfaces are addressed with adders rather than
specific categories. The granularity of the categorization, particularly related to LAN
protocols, is thus an important policy decision, discussed in Section 6.
4 ANALYSIS OF SNE POWER DRAW
In this section, we analyze existing SNE power data to better understand relationships
between power draw and functions or component characteristics.

PAGE 13 | Small Network Equipment – Policy Considerations
4.1 Dataset background and methodology
We leverage four datasets in this analysis, each which contains idle power measurements6
for a range of SNE products. Due to the rapid pace of change in SNE products, we focus on
test data from the past five years to include the most up-to-date information possible. The
datasets include:
C’t: c’t Magazin is a German magazine and website geared towards tech-savvy consumers. It offers a range of content on electronic products, including reviews and tests, some of which contain idle power measurements. We collected about 120 reviews that included idle power measurements from 2016 to 2020 and recorded product characteristics such as WAN interface type and number, and LAN interface bandwidth.
Dangl: This dataset was collected by Georg Dangl with support from EDNA (Dangl 2019). It includes idle power measurements of three IADs and six IoT gateways. The year of first release of the products ranges from 2013 to 2018. Each product was tested up to five times, each test with a different combination of connected network interfaces.
NRCan: Similar to the Dangl dataset, this data collected by Natural Resources Canada (NRCan) includes multiple tests per product, with different network interface connections. It contains test results for six modems, four IADs, ten routers, and four smart home gateways.
U.S. VA: Internet service providers and manufacturers that participate in the VA are required to report idle power and the characteristics of the product that determine its power allowance, including product category, WAN interface number and type, and LAN interface number and
type. We gathered the data reported in the U.S. for 2016 through 2019.7 After duplicate data
points were removed the dataset contained about 400 data points. U.S. VA participant shipments are estimated to represent about 80% of broadband access equipment and no more than 50% of LAN equipment in the U.S. (CA IOUs 2020).
In the discussion below, the datasets are referred to by their names in bold above. Note that
all power measurements available are idle power measurements in which little or no data
traffic is moved during the test. We did not have access to any data of SNE products tested
under non-idle conditions.8
Based on the information available in the data sets, we examine the following questions:
1. For each function-based primary category, what range of power do products draw?
2. How do network components (WAN and LAN interfaces) impact power draw?
3. How do certain characteristics of WAN and LAN interfaces, such as number of interfaces, maximum data transfer rate, or number of Wi-Fi radios impact power draw?
4. Do SNE products employ power scaling to power down components when they are not needed?
6 SNE is most commonly tested in a low-traffic “idle” state, in which no user-generated traffic exists on the network.
7 U.S. data for 2020 was not available at the time of our analysis. Note that the Canadian VA was established in 2020 and reporting data is not yet available.
8 One of the tests required by the CoC is a fully-loaded condition, where all interfaces are tested at maximum data rates. The CoC data, however, is not publicly available and we were unable to obtain it.

PAGE 14 | Small Network Equipment – Policy Considerations
To examine question 1, we segment the c’t and U.S. VA datasets into function-based
product categories and plot the range of power draw for each category. To examine question
2, we further segment broadband access equipment by WAN interface type, and LAN
equipment by LAN interface type. We perform simple and multiple linear regression
analyses to address question 3, which estimate the predictive value of SNE characteristics
(e.g., primary category, network interface type, number of interfaces, maximum data transfer
rate, number of Wi-Fi radios) on power draw. To answer the final question, we analyze the
incremental power of network interfaces using the Dangl and NRCan datasets.
We find that large spread in power draw of SNE products exists, even when comparing
products within a function-based category with similar component-level factors. This finding
suggests that some products are more efficient than others of comparable functionality,
indicating that energy efficiency policy can play a role in reducing energy use of less efficient
products.
4.2 Power draw of function-based categories
We first examine idle power for the function-based product categories outlined in Table 1.
Broadband access equipment shows a wide range in idle power, from 3 to 28 W (Figure 4).
The small number of modems in the datasets (n=32) draw 4 to 12 W. Many IADs, which
have modem and any number of additional functions (mainly LAN interfaces and phone
functions) draw power that is comparable to modems, but some IADs draw significantly
more.
LAN equipment similarly shows a wide spread in idle power (Figure 4). We segment Wi-Fi
mesh systems, which consist of a base unit with router (level 3) functions and one or two
satellite units with access point (level 2 or 3) functions, into additional categories depending
on the number of units in the mesh system.9 Although the data shows a general trend of
higher functioning products drawing more power, broad spread within product categories
exist. As previously noted, the VA segments LAN equipment into two categories, equivalent
to level 1 and level 2 and above. The U.S. VA data shows similarly broad spread in power
for level 1 products: 0.4 to 8 W for level 1 LAN products, and 0.7 to 18 W for level 2 and
level 3 equipment. It does not include any mesh systems.
9 Mesh system power is the sum of the power of each unit.

PAGE 15 | Small Network Equipment – Policy Considerations
Figure 4: SNE idle power for function-based product categories. Broadband access equipment categories include data from c’t and U.S. VA datasets. LAN equipment categories include data from c’t dataset.
4.3 Impact of network-related components
We expect that some WAN interfaces require more power than others; power depends on
the medium (e.g., copper, fiber, air) over which data is transmitted. Segmenting by WAN
interface type, however, still shows a wide spread in idle power, particularly for xDSL and
DOCSIS equipment (Figure 5). WAN interface categories show at least a 2x and at most a
5x spread in power between the lowest and highest power products in the group. For IADs,
additional LAN functions can explain some of the spread, which may also be a result of
some products containing more efficient components than others or utilizing power scaling
strategies.
Most of the LAN equipment in the datasets contain both wired Ethernet and wireless Wi-Fi
interfaces, and show wide spread in power draw within function-based product categories
(Figure 6). The data hints that increasing product functionality increases power draw,
however some level 3 products use less power than some level 1 products.

PAGE 16 | Small Network Equipment – Policy Considerations
Figure 5: Idle power for broadband access equipment by WAN interface type. Data is from c’t and VA datasets.
Figure 6: LAN equipment idle power by LAN interface type and subcategory. Data from c’t dataset.
4.4 Impact of component characteristics
We next analyze the available component characteristics for models in the c’t and U.S. VA
datasets to determine which characteristics show a strong relationship to power draw. Figure
7, Figure 8, and Figure 9 show component characteristics that appear to have some

PAGE 17 | Small Network Equipment – Policy Considerations
relationship to power: the number of Ethernet ports, maximum Wi-Fi data rate, and the
number of Wi-Fi radios, respectively. Although linear regression analysis of the data yield
low correlation and therefore low predictive value of a linear relationship between the
function capacity and power, visual inspection of the data suggests a trend toward higher
power with increased capacity of the component factor in question. For example, products
with more Ethernet ports generally to draw more power than products with fewer ports
(Figure 7). Similarly, products that have the capacity to transmit more data tend to draw
more power than products that have lower data capacity (Figure 8), and products that
contain more Wi-Fi radios trend toward higher power than products with fewer radios (Figure
9).
Figure 7: Power versus number of Ethernet ports by product category and simple linear regression results. Data from c’t dataset.

PAGE 18 | Small Network Equipment – Policy Considerations
Figure 8: Power versus theoretical maximum Wi-Fi speed by product category and simple linear regression results. Data from c’t dataset.
Figure 9: Power versus number of Wi-Fi radios by product category and simple linear regression results. Data from U.S. VA dataset.
Given that any SNE product can contain a number of component characteristics that may
impact its power draw, perhaps the lack of correlation between one function and power is
not surprising. Attempting to better identify power and component characteristics, we
perform multiple variable regression analyses on the U.S. VA dataset, segmented by
product type, to determine whether multiple characteristics of a product can predict whole
product power draw (more details in the Appendix). The analysis shows significant
correlation (p-value < 0.01) of some functions, particularly the number and type of Wi-Fi
PAGE 19 | Small Network Equipment – Policy Considerations
interfaces, to power. The analysis yields a moderate predictive ability to estimate power from
multiple characteristics together, with adjusted R2 values ranging from 0.63 to 0.81 for our
various analyses. In other words, a relationship between some component characteristics
and power does exist, and relationship describes some but not all of the variation in the
datasets. This finding leads us to conclude that additional factors, which could include power
scaling, component choice, and other product characteristics, may have considerable impact
on whole-product power. This suggests that policies that encourage efficient components
and design strategies in SNE products may have significant energy savings potential.
4.5 Power scaling
To investigate whether SNE products employ power scaling to power down unused
components, we examine datasets that include multiple tests on a given product, each with
different interfaces connected. Both the NRCan and Dangl studies conducted such tests. As
in the c’t and U.S. VA datasets, the data show wide spread in power for products of similar
functionality. In addition, the data shows little power variation when different interfaces are
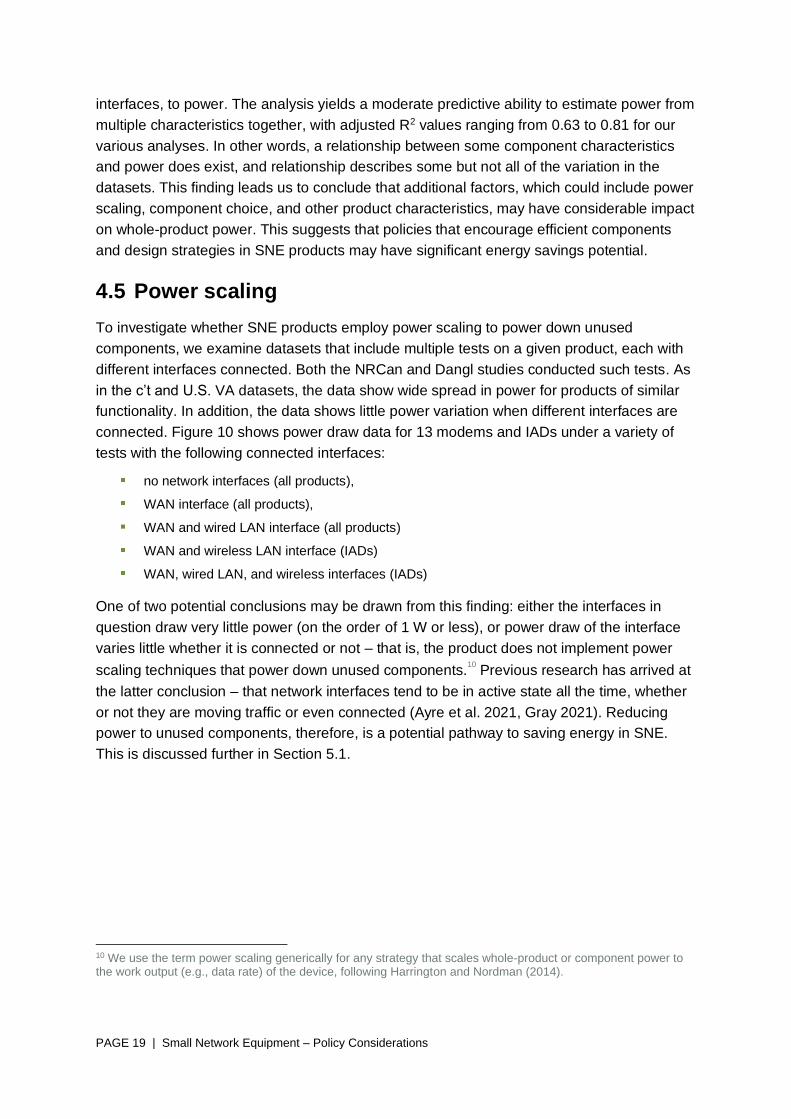
connected. Figure 10 shows power draw data for 13 modems and IADs under a variety of
tests with the following connected interfaces:
no network interfaces (all products),
WAN interface (all products),
WAN and wired LAN interface (all products)
WAN and wireless LAN interface (IADs)
WAN, wired LAN, and wireless interfaces (IADs)
One of two potential conclusions may be drawn from this finding: either the interfaces in
question draw very little power (on the order of 1 W or less), or power draw of the interface
varies little whether it is connected or not – that is, the product does not implement power
scaling techniques that power down unused components.10
Previous research has arrived at
the latter conclusion – that network interfaces tend to be in active state all the time, whether
or not they are moving traffic or even connected (Ayre et al. 2021, Gray 2021). Reducing
power to unused components, therefore, is a potential pathway to saving energy in SNE.
This is discussed further in Section 5.1.
10 We use the term power scaling generically for any strategy that scales whole-product or component power to the work output (e.g., data rate) of the device, following Harrington and Nordman (2014).

PAGE 20 | Small Network Equipment – Policy Considerations
Figure 10: Idle power measurements of modems and IADs tested with various interfaces connected. Data from NRCan and Dangl datasets. Note that LAN indicates wired LAN (Ethernet) and WLAN indicates wireless LAN (Wi-Fi).
5 ENERGY SAVINGS POTENTIAL AND BARRIERS
In this section, we estimate the energy savings potential for SNE in the residential sector
and identify the key barriers to achieving that potential. Numerous studies examine
strategies to save energy in SNE. The magnitude of the savings and the practical steps
needed to achieve the savings are discussed below.
5.1 SNE savings pathways
Pathways to improving the energy efficiency of SNE have been outlined by several
researchers (e.g., Baliga et al. 2011, Dangl 2019, Gray 2018, Harrington and Nordman
2014, Hinton 2011, Lanzisera et al. 2010, Van Heddeghem et al. 2012, Vereecken et al.
2011), and include the following three strategies.
Powering down unused components. This includes powering down unconnected network
interfaces, especially wired interfaces that can be designed to detect whether or not a cable
is attached.
Adjusting processing power to data processing needs. Electronic circuits consume less
power when operating at lower speeds; therefore energy consumption can be reduced by
adjusting the speed at which the device operates to more closely match the data needs
(Harrington and Nordman 2014, Hinton et al. 2011). Connected network interfaces and
central components should use strategies to scale their power to the data processing or
traffic load, such as Energy Efficient Ethernet (EEE) for Ethernet interfaces. This power
scaling strategy is often referred to rate adaptation. Research shows that SNE devices do
Modems IADs

PAGE 21 | Small Network Equipment – Policy Considerations
not implement aggressive power scaling, and can consume up to 85% of their maximum
power draw when in idle state (Fiandrino et al. 2017; Gray 2018, Mahadevan et al. 2009).
Increase efficiency of hardware components: Finally, energy efficiency of SNE can be
improved by using more efficient components. This includes using power supplies that are
efficient at maximum and, if the product implements power scaling, low load points.
5.2 Savings potential
Previous studies estimate that the energy consumption of SNE devices can be reduced by
20 to 50%. The low end of the range assumes power supply efficiency improvements and
implementing EEE (Lanzisera et al. 2010). The high end of the range estimates savings
achieved via aggressive power scaling of network interfaces and other component
(Lanzisera et al. 2010, Dangl 2019). Near-term savings potential may be estimated by
identifying the most efficient products on the market, and assuming that all products adopt
those power levels. An analysis of the U.S. VA data from 2018 suggests that SNE energy
use could be reduced by approximately 15% if they adopt best-on-market efficiency (CA
IOUs 2020). We apply the range of potential energy savings to the total energy use of
residential SNE estimated by the EDNA total energy model version 2 (EDNA 2021) in major
economies (Table 3). This yields a global estimated savings potential of 18 to 60 TWh per
year after stock turnover.
Table 3. Estimated residential SNE energy use and potential savings by region in 2021
Region
(defined in EDNA (2021) Appendix A)
Total Energy
Use (TWh/yr)
Savings Potential Estimates (TWh/yr)
Best-on-market energy
efficiency
Power supply efficiency & power scaling
Low High
Far East and China 51 7.7 10 26
West Europe 17 2.6 3.5 8.7
North America 13 1.9 2.5 6.4
Latin America 9.5 1.4 1.9 4.8
Africa and Middle East 8.8 1.3 1.8 4.4
Central and Eastern Europe 8.7 1.3 1.7 4.4
Asia Pacific 6.2 0.9 1.2 3.1
Indian Subcontinent 4.4 0.7 0.9 2.2
Global 120 18 24 60

PAGE 22 | Small Network Equipment – Policy Considerations
5.3 Barriers
Although strategies to improve energy efficiency of SNE have been known for more than a
decade, it appears that little progress in implementing them has occurred. Studies have
shown that SNE products generally not scale power with traffic (Gray 2018; Lanzisera et al.
2010). The data analysis above suggests that SNE products do not power down unused
interfaces. One might therefore conclude that significant barriers exist to implementing these
savings strategies. To understand these barriers, we reached out to several researchers
(Ayre et al. 2021, Gray 2021) who highlighted the following issues:
1. Cost considerations. Manufacturers face pressure to decrease product pricing over
time and may be resistant to any design modifications that increase, or prevent them
from decreasing, retail prices. If passed on to consumers, incremental cost of energy
efficient designs are perceived to be challenging to recoup through energy cost
savings because the per-product savings potential is low (on the order of 100s of
kWh per year). However, some researchers argue that the assumption that energy
efficient products are more expensive is flawed because more efficient products are
often ones with higher performance which, rather than efficiency, increases cost
(Siderius 2020).
2. Little perceived value of energy efficient choices in the market. Although the
U.S. ENERGY STAR specification for SNE has been in place since 2013, only two
products are listed on the qualified products list today and the U.S. EPA has
proposed to sunset the specification (U.S. EPA 2021). The lack of uptake of the
specification suggests that manufacturers do not use energy efficiency in product
marketing, and consumers likely consider factors other than efficiency, such as
compatibility, speed and range, when purchasing SNE.
3. Resistance to change. Manufacturers may be reluctant to change a product design
that works. As noted by one researcher, a culture of “if it works, don’t change it” may
characterize the industry (Ayre et al. 2021).
4. Product reliability and durability. To be successful, power scaling strategies must
not only power down components appropriately, but also return components to active
states reliably and within acceptable latencies. Rather than risk the chance that
components will not return to their proper state quickly enough, manufacturers
generally choose not to power down components. Durability issues are also a
concern. Products are generally designed to operate at constant temperature.
Temperature fluctuations resulting from power scaling can result in cracked solder or
componentry (Ayre et al. 2021).
5. Lack of incentives. Energy savings must be considered early in the design of any
product (EDNA 2019), and can involve significant time and cost that manufacturers
have little incentive to invest in today (Ayre et al. 2021). Clear policy that sets

PAGE 23 | Small Network Equipment – Policy Considerations
attainable but stringent expectations for energy savings can help provide that
incentive.
6 CONSIDERATIONS FOR POLICY
Because SNE presents energy savings opportunities but a lack of incentives exist for
manufacturers to adopt savings strategies, policy may play a role in improving energy
efficiency. In this section we discuss considerations for crafting efficiency policy, including
metrics, data gaps, and policy approaches.
6.1 Energy efficiency metrics
Any energy efficiency policy requires one or more metrics to evaluate whether or not
products are meeting policy requirements. To identify possible metrics to evaluate SNE
energy use, it is instructive to consider the power draw profile of SNE products and how the
efficiency improvement strategies discussed in Section 5.1 modify that profile. In Figure 11,
we plot the power draw of a generic SNE device against its traffic load (Gray 2018,
Mahadevan et al. 2009). The power draw profile has two elements of interest: the power
draw in idle state with no traffic, and a linear slope element that describes power draw as a
function of traffic rate, or the degree to which the product uses power scaling (Gray 2018,
Hinton and Jalali 2016). Policies should encourage both improved power scaling (a steeper
slope in Figure 11) and increased component efficiency (lower power in Figure 11).
Proposed metrics that assess the energy efficiency of SNE products include the Energy
Proportionality Index (EPI). EPI determines the difference between a product’s measured
power and the power it would draw if power was completely proportional to traffic rate (i.e,
power is zero when traffic rate is zero) (Fiandrino et al. 2017, Mahadevan et al. 2009). An
EPI of 100% represents a perfectly proportional device; an EPI of 0% indicates power draw
does not vary with traffic rate. EPI is solely a measure of the degree to which a product
scales power to traffic rate. It does not evaluate the efficiency of the product at one or more
given traffic rates relative to an efficient product.

PAGE 24 | Small Network Equipment – Policy Considerations
Figure 11: Generic SNE power draw profile (blue line) and improved profile as a result of power scaling and increased component efficiency (green line). Figure modified from Gray (2018).
To evaluate the efficiency of a product at a given traffic rate, policy makers must develop a
metric that accounts for product functions and component characteristics. Examples of this
type of metric include the power targets set by the CoC and VA. These power targets consist
of a base allowance, assigned for function-based product categories, and adders for
component characteristics like network interface type. The VA evaluates measured product
idle state power relative to the sum of the base allowance and adders applicable to the
product. The CoC takes a similar approach, but includes additional targets and
measurements at low and maximum traffic rates. As an alternative to multiple targets at
various traffic rates, Siderius (2021) proposes a single energy metric that accounts for power
draw at various traffic rates with an assumed duty cycle. Policy makers should consider a
similar type of approach; the key to using such an approach is developing the targets or
reference products via a system of base allowances and adders based on product functions
and component characteristics. The CoC and VA are complicated by a large number product
categories and functional power adders. For policy making and compliance to be successful,
a simpler system of base allowances and adders is desirable.
6.2 Data gaps
To develop a policy based with power or energy metrics described above, policy makers
must group products of similar products into categories, and develop metrics to evaluate a
product to others in its product category or to a reference or idealized product. In this project
we outline a simple, function-based categorization (Section 3), but given our inability to
explain the cause(s) of the wide spread of power within product categories, we cannot

PAGE 25 | Small Network Equipment – Policy Considerations
conclude at this time whether or not the categorization has an appropriate degree of
granularity on which to base policy. Categorization and metric setting will require additional
data and research. Whole-product power measurements are useful to understand the power
of the product and to estimate total energy use of products in a region or globally, but as we
find in the analysis above, do not advance our understanding of how the total power is
divided up amongst the components that provide the various functions in the product.
Additional efforts to understand component- or function-level power requirements will be
necessary to determine appropriate power targets based on the capabilities of any given
SNE product.
Previous EDNA research on network standby provides a first estimate of power
requirements for functions (EDNA 2018). The project developed power budget ranges for
common network interfaces based on datasheet information of network components, plus
associated processing and power conversion losses. This approach yields ranges of
network function power requirements across several orders of magnitude, making it
insufficient for use in predicting power draw based on component characteristics or
establishing function-based power targets. Component-level power measurements remain a
significant gap in understanding SNE and developing appropriate targets for energy
efficiency policies.
Given the complexity of the data needs and the product type, policy makers might benefit by
collaborating with manufacturers to obtain data, understand barriers, and determine a path
forward on improving SNE efficiency. In our research, we heard that manufacturers may be
hesitant to employ power scaling due to durability and reliability concerns. Other electronic
products, such as computers and televisions, do employ aggressive power scaling
techniques. The fact that SNE do not implement power scaling may point to latency or other
operational requirements that manufacturer input could illuminate.
6.3 Policy approaches
Most energy efficiency policies rely on minimum energy performance standards (MEPS) to
effectively disallow inefficient products from entering the market. The discussion above
illustrates the data gaps and challenges related to setting maximum allowable power targets
for SNE. Policy makers may consider other tools, in particular consumer-directed energy
labels, that present fewer implementation challenges but present the potential to encourage
the market toward more efficient designs.
As shown in Section 4, SNE products can draw a wide range of power for functions (Figure
4). An SNE energy label would indicate a product’s power draw or energy use relative to
other products with similar functionality. Although energy savings does not appear to be a
motivating purchasing factor for most consumers, labeling can be an effective tool to
encourage manufacturers to improve efficiency and avoid labeling their products as poor
efficiency performers. Labeling can also move the market toward efficient products when
large-quantity purchasers like procurement programs use them in their purchasing

PAGE 26 | Small Network Equipment – Policy Considerations
decisions. Because labeling does not prevent any product from entering the market,
implementing a labeling program presents a lower level of effort for policy makers (Siderius
2020). Compared to MEPS, labeling approaches could use simpler and broader product
categories, and reduce the effort and detail needed in addressing the data gaps above.
The degree to which energy labels alone can move the market of a performance-focused
product like SNE is untested. Policy makers may therefore consider whether a combined
approach of MEPS and labeling can achieve similar or greater energy savings as MEPS
alone. Using MEPS and labels together can eliminate the least efficient products from the
market (MEPS), while providing a push toward efficient designs to the entire market,
especially the least efficient products (labels). Creating market improvement through labels
may allow policy makers to set less stringent MEPS, decreasing the level of effort to develop
the MEPS (Siderius 2020).
7 CONCLUSIONS
Compared to end user products subject to energy efficiency policy, like computers or
televisions, SNE has unique functionality that requires it to always be connected to and/or
maintain a network in order to pass data traffic whenever necessary. Globally, SNE products
consume an estimated 120 TWh annually, which is a figure that will only grow as consumer
demand for network services grows. Strategies exist, however, that have the potential to
reduce SNE energy use by 20 to 50%. One key barrier to improving SNE efficiency is the
lack of incentive for manufacturers to invest time and resources into designing efficient
products. Energy efficiency policy can be that incentive. Due to the complexity and unique
characteristics of SNE, more data collection and research may be necessary for policy
makers to establish power targets or MEPS. However, creative policy approaches, such as
using energy labeling or labeling and MEPS in combination, may yield energy savings while
reducing the technical burden of developing stringent MEPS.

PAGE 27 | Small Network Equipment – Policy Considerations
8 REFERENCES
Ayre, R, J. Cheong and K. Hinton. 2021. Personal communication, March 11, 2021.
Baliga, J., R. Ayre, K. Hinton and R. Tucker. 2011. Energy Consumption in Wired and
Wireless Access Networks. Communications Magazine, IEEE, vol. 49, p. 70-77.
Bertoldi, P. and A. Lejeune. 2020. Code of Conduct on Energy Consumption of Broadband Equipment. Version 7.1. European Commission, Ispra.
CA IOUs (California Investor-Owned Utilities). 2020. Small Network Equipment: Energy
Savings Opportunities and Test Procedure Needs for the LPM Roadmap.
Dangl, G. 2019. Diplomarbeit Erstellung einer Gestaltungsrichtlinie zur Entwicklung
vernetzter Produkte in Haushalten mit reduziertem Stand-by-Energieverbrauch. TU Wien,
Fakultät für Maschinenwesen und Betriebswissenschaften.
EDNA. 2018. Network Standby Power Basics: Factors Impacting Network Standby Power in Edge Devices. Prepared by Xergy Consulting for the International Energy Agency 4E Standby Power Annex.
EDNA. 2019. Bridging the Network Standby Gap Between Mobile and Mains-Powered
Products. Prepared by P. May-Ostendorp of Xergy Consulting and Eric Rubin of Energy
Solutions for the International Energy Agency Electronic Devices and Networks Annex.
EDNA. 2021. Total Energy Model for Connected Devices v. 2. Prepared by P. Ryan of
EnergyConsult Pty Ltd, T. Smith of Mississippi Consulting Pty Ltd, and A. Wu of Hansheng
Ltd for the International Energy Agency Electronic Devices and Networks Annex.
Fiandrino, C., D. Kliazovixh, P. Bouvry and A. Y. Zomaya. 2017. Performance Metrics for
Data Center Communication Systems. IEEE Transactions on Cloud Computing, vol. 5, no. 4,
p. 738-750.
Fraunhofer IZM. 2019. State of Sustainability Research for Network Equipment: Small
Network Equipment. Prepared for the Green Electronics Council and TÜV Rheinland in
support of criteria development for the EPEAT and Green Product Mark ecolabels.
Garg, V.K. 2007. Wireless Communications and Networking. Elsevier Morgan Kaufmann.
Gray, C. 2018. Energy Consumption of Internet of Things Applications and Services..
Submitted in partial fulfilment of the requirements of the degree of Doctor of Philosophy
Department of Electrical and Electronic Engineering. The University of Melbourne.
Gray, C. 2021. Personal communication, March 16 2021.
Harrington, L., B. Nordman. 2014. Beyond Network Standby: A Policy Framework and
Action Plan for Low Energy Networks. Prepared for the IEA 4E Standby Annex.

PAGE 28 | Small Network Equipment – Policy Considerations
Hinton, K. J. Baliga, M. Feng, R. Ayre and R. Tucker. 2011. Power Consumption and Energy
Efficiency in the Internet. IEEE Network, vol. 25, no. 2, p. 6-12.
Hinton, K. and F. Jalali. 2016. A Survey of internet Energy Efficiency Metrics. 2016 5th
International conference on Smart Cities and Green ICT Systems (SMARTGREENS, p. 1-9.
Lanzisera, S., B. Nordman and R. Brown. 2010. Data Network Equipment Energy Use and
Savings Potential in Buildings. ACEEE Summer Study on Energy Efficiency in Buildings.
Mahadevan, P., P. Sharma, S. Banerjee and P. Ranganathan. 2009. A Power
Benchmarking Framework for Network Devices. Networking 2009: International Conference
on Research in Networking, p. 795-808.Pearson. 2002. Pearson IT Certification.
SNE VA Signatories (Signatories of the Voluntary Agreement for Small Network Equipment).
2020. Voluntary Agreement for Ongoing Improvement to the Energy Efficiency of Small
Network Equipment (revised).
Siderius, H-P. 2020. Regulating ICT products through EU ecodesign and energy labelling
measures – a new approach. Proceedings of Electronics Goes Green 2020+.
Siderius, H-P. 2021. Personal Communication, May 4 2021.
U.S. EPA (United States Environmental Protection Agency). 2013. ENERGY STAR Test
Method for Small Network Equipment. Final Test Method Rev.
U.S. EPA. 2021. ENERGY STAR Small Network Equipment – Sunset Proposal Memo.
Van Heddeghem, W., F. Idzikowski, W. Vereecken, D. Colle, M. Pickavet and P. Demeester.
2012. Power consumption modeling in optical multilayer networks. Photonic Network
Communications, vol. 24, p. 86–102.
Vereecken, W., W. Van Heddeghem, M. Deruyck, B. Puype, B. Lannoo, W. Joseph, D.
Colle, L. Martens and P. Demeester. 2011. Power Consumption in Telecommunication
Networks: Overview and Reduction Strategies. Communications Magazine, IEEE, vol. 49, p.
62-69.

PAGE 29 | Small Network Equipment – Policy Considerations
9 APPENDIX
We perform multiple variable linear regression analysis to determine whether power
for various SNE product categories can be predicted with multiple variables. The
U.S. VA dataset contains information on several components and characteristics of
SNE, on which VA power limits are set. We include characteristics that are
applicable to network component characteristics of SNE in the analysis for each
product category, and assume that these characteristics are independent variables
for the multiple variable analysis.
The p-values yielded by the multiple variable regression analysis are listed in Table 4.
P-values less than 0.01 (highlighted in green in the table) indicate a significant
relationship between the independent variable and power draw. The analysis shows
that the number of Wi-Fi radios has significant relationship with power draw in most
cases. Other components, such as phone ports and USB ports, can also show a
significant relationship to power. R2 of the multiple variable regressions range from
0.63 to 0.81 (Table 4).

PAGE 30 | Small Network Equipment – Policy Considerations
Table 4: Independent variables included in multiple variable regression analysis, with p-value, coefficient, adjusted R2, and intercept outputs for product categories analyzed.
Component
IAD All LAN Equipment Level 1 Level 2+
P-value Coefficient P-value Coefficient P-value Coefficient P-value Coefficient
Ethernet ports 0.60 -0.157 0.043 0.128 0.21 0.078 0.042 0.232
802.11n radios, low power 0.38 0.653 1.62E-04 0.898 0.006 0.668 0.11 0.601
802.11ac radios, low power 0.28 1.00 2.98E-07 1.50 4.77E-06 1.91 0.003 1.24
Additional chains, low power 3.07E-07 2.00 9.80E-03 0.507 0.067 0.669 0.034 0.532
802.11n radios, high power 2.32E-03 2.89 1.32E-04 1.07 9.21E-06 1.29 0.22 0.555
802.11ac radios, high power 8.05E-04 3.49 9.95E-16 2.56 0.013 0.762 2.71E-11 3.13
Additional chains, high power 0.67 -0.198 9.94E-03 0.385 0.52 0.262 0.45 0.142
HPNA 0.34 0.876 n/a n/a n/a n/a n/a n/a
G/hn n/a n/a 6.94E-07 2.37 0.019 1.43 7.35E-05 2.45
MoCA 0.092 1.43 1.69E-07 2.56 0.010 1.36 4.02E-06 3.23
Phone ports 2.99E-03 0.850 n/a n/a n/a n/a n/a n/a
USB 2 ports 0.16 0.623 1.26E-04 1.12 0.56 0.307 0.028 0.870
USB 3 ports 0.94 -0.056 7.32E-19 2.74 0.67 0.481 4.22E-11 2.59
Bluetooth n/a n/a 0.72 0.183 0.27 0.679 0.78 0.191
Additional application processor 0.98 -0.020 0.18 0.685 0.014 1.98 0.54 0.417
Adjusted R2 of multiple variable regression
0.63 0.81 0.73 0.74
Intercept 6.98 0.907 1.04 1.27