SMALL AND MEDIUM-SIZED ENTERPRISES IN THE ANTWERP-BRUSSELS AXIS
10
467 SMALL AND MEDIUM-SIZED ENTERPRISES IN Tm ANTVWCRP-BRUSSELS AXS ANN VERHETSEL, ANN JORISSEN & STEFAN VANDAMME Faculty of Applied Economics, Universitaire Faculteiten Sint Ignatius, University of A n t w q , Prinsstraat 13, 2000 Antwerp, Belgium Received May 1994; revised June 1995 ABSTRACT The results of interdisciplinary research in which data and techniques of accounting are combined with theories in the field of economic geography are presented. The investigation tests the validity of some theories of economic geography on the basis of fmancial statement data. Up tiU now these theories have only been tested empiricalh/With the use of macroeconomicdata, such as employment figures. In this project, the performancesof small andmedium- sizedcompaniesare analysedinthe functionalurbanregionsofAntwerp,BrusselsandMechelen.Themostimportant conclusion is that the ‘average’ companies in the centre of the ‘research area’ show weaker financial performances than those in the periphery. If focused solelyon trade companiesthe same pattern emerges. For industrialcompanies however, ‘the reversal of the centre-peripheryrelations’ is not obvious. Key words. Urban geography, Belgium, fmancial statement data, ficial geography, economic geography INTRODUCTION The financial-economicperformance of a number of small and medium-sized enterprises (SMSEs) situated in the functional urban region of Ant- werp, Brussels and Mechelen is analysed. In this analysis the theories about urban economy are empirically tested. In prior studies, these theo- ries were usually tested by means of social- demographic factors such as migration figures or by means of macroeconomic indicators such as employment figures. In this study, these theories will be tested by means of microeconomic data. To this purpose, a number of indicators that give us an idea of the financial performances of the enterprises in these regions were chosen. They are the indicators with respect to liquidity, solvency, profitability, and value added. THE URBAN ECONOMY The main topics in urban economy are sub urbanisation and the erosion of the central cities. With regard to the Belgian situation, these phe- nomenawere alreadyextensively documented and analysed by means of socialdemographic and macro-economic indicators. Following the migra- tion flow of the population, more and more com- panies prefer the suburban area to the city to lo- cate their activities.Note that not only are compa- nies from the city moving to the urban fringe, but also companies from the periphery and new com- panies. Apparently, enterprises moving out of the city are mainlyindustrial companiesthat complain about lack of space and traffic congestion in the city. Although service industries are not hindered to the same extent by those congestion problems, quite a number of tertiary activities, nevertheless, want to aim at the suburban population (trade, financial services, catering) (De Brabander et al., 1992). Such a suburbanisation usually entails a considerable weakening of the economic basis of a city. The main question that arises is whether there are any significant differences between the financial-economic performances of the urban and the suburban enterprises. DEFINING THE AREA STUDIED AND METHOD OF RESEARCH This study focuses on the financial performances of the small and medium-sized enterprises around Antwerp, Brussels and Mechelen. The methodol- ogy used was first applied in a study that examined the financial-economic performance of the me- dian company (makinga distinctionbetween large T&ischni uomEconomische en Sociale Geograje - 1995, Vol. 86, No. 5, pp. 467-476
-
Upload
uantwerpen -
Category
Documents
-
view
3 -
download
0
Transcript of SMALL AND MEDIUM-SIZED ENTERPRISES IN THE ANTWERP-BRUSSELS AXIS

467
SMALL AND MEDIUM-SIZED ENTERPRISES IN T m ANTVWCRP-BRUSSELS A X S ANN VERHETSEL, ANN JORISSEN & STEFAN VANDAMME
Faculty of Applied Economics, Universitaire Faculteiten Sint Ignatius, University of A n t w q , Prinsstraat 13, 2000 Antwerp, Belgium
Received May 1994; revised June 1995
ABSTRACT The results of interdisciplinary research in which data and techniques of accounting are combined with theories in the field of economic geography are presented. The investigation tests the validity of some theories of economic geography on the basis of fmancial statement data. Up tiU now these theories have only been tested empiricalh/With the use of macroeconomic data, such as employment figures. In this project, the performances of small andmedium- sizedcompaniesare analysedinthe functionalurbanregionsofAntwerp,BrusselsandMechelen.Themostimportant conclusion is that the ‘average’ companies in the centre of the ‘research area’ show weaker financial performances than those in the periphery. If focused solely on trade companies the same pattern emerges. For industrial companies however, ‘the reversal of the centre-periphery relations’ is not obvious.
Key words. Urban geography, Belgium, fmancial statement data, f i c i a l geography, economic geography
INTRODUCTION
The financial-economic performance of a number of small and medium-sized enterprises (SMSEs) situated in the functional urban region of Ant- werp, Brussels and Mechelen is analysed. In this analysis the theories about urban economy are empirically tested. In prior studies, these theo- ries were usually tested by means of social- demographic factors such as migration figures or by means of macroeconomic indicators such as employment figures. In this study, these theories will be tested by means of microeconomic data. To this purpose, a number of indicators that give us an idea of the financial performances of the enterprises in these regions were chosen. They are the indicators with respect to liquidity, solvency, profitability, and value added.
THE URBAN ECONOMY
The main topics in urban economy are sub urbanisation and the erosion of the central cities. With regard to the Belgian situation, these phe- nomenawere already extensively documented and analysed by means of socialdemographic and macro-economic indicators. Following the migra- tion flow of the population, more and more com-
panies prefer the suburban area to the city to lo- cate their activities. Note that not only are compa- nies from the city moving to the urban fringe, but also companies from the periphery and new com- panies. Apparently, enterprises moving out of the city are mainly industrial companies that complain about lack of space and traffic congestion in the city. Although service industries are not hindered to the same extent by those congestion problems, quite a number of tertiary activities, nevertheless, want to aim at the suburban population (trade, financial services, catering) (De Brabander et al., 1992). Such a suburbanisation usually entails a considerable weakening of the economic basis of a city. The main question that arises is whether there are any significant differences between the financial-economic performances of the urban and the suburban enterprises.
DEFINING THE AREA STUDIED AND METHOD OF RESEARCH
This study focuses on the financial performances of the small and medium-sized enterprises around Antwerp, Brussels and Mechelen. The methodol- ogy used was first applied in a study that examined the financial-economic performance of the me- dian company (making a distinction between large
T&ischni uomEconomische en Sociale Geograje - 1995, Vol. 86, No. 5, pp. 467-476
468 ANN WRHETSEL, AMVJORISSEN & STEFAN VANDAMME
companies and small and medium-sized ones) in every Belgian district. On the one hand, it re- vealed the economic importance of the Antwerp- Brussels axis. On the other hand, it also showed that the average company on the old axis performs systematically worse than the average company in the suburban and peripheral districts. In this arti- cle, we will take a closer look at the performance of the SMSEs on the AntwerpMechelen-Brussels axis by refining the data to the municipal level.
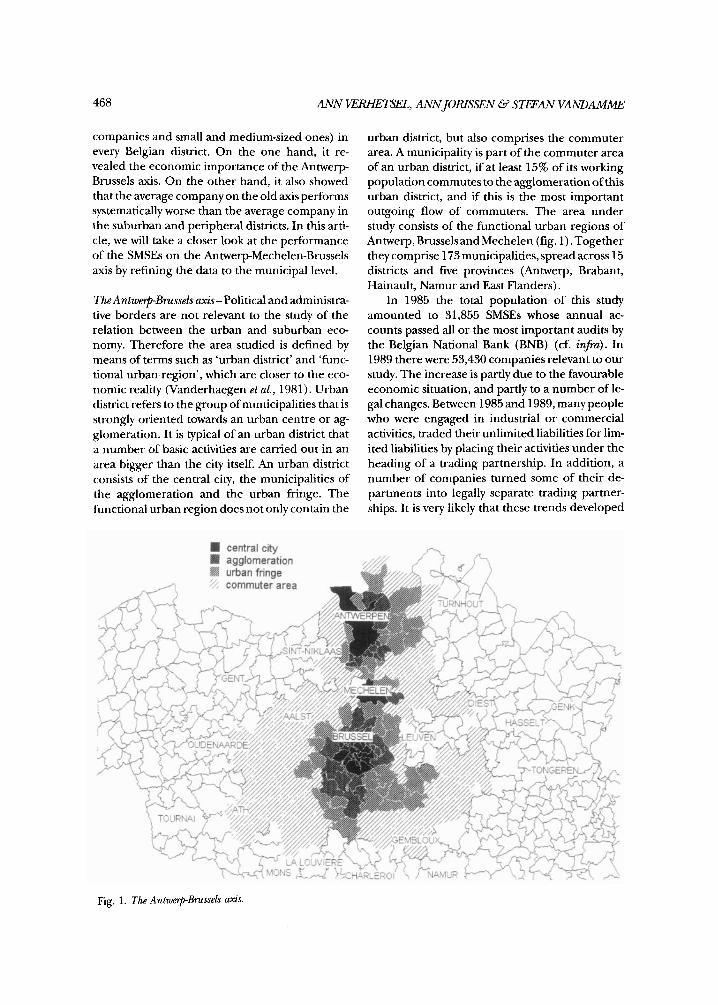
The Antwe-Brussels axis- Political and administra- tive borders are not relevant to the study of the relation between the urban and suburban eco- nomy. Therefore the area studied is defined by means of terms such as ‘urban district’ and ‘func- tional urban region’, which are closer to the eco- nomic reality (Vanderhaegen et al., 1981). Urban district refers to the group of municipalities that is strongly oriented towards an urban centre or ag- glomeration. It is typical of an urban district that a number of basic activities are carried out in an area bigger than the city itself. An urban district consists of the central city, the municipalities of the agglomeration and the urban fringe. The functional urban region does not only contain the
urban district, but also comprises the commuter area. A municipality is part of the commuter area of an urban district, if at least 15% of its working population commutes to the agglomeration of this urban district, and if this is the most important outgoing flow of commuters. The area under study consists of the functional urban regions of Antwerp, Brussels and Mechelen (fig. 1) . Together they comprise 173 municipalities, spread across 15 districts and five provinces (Antwerp, Brabant, Hainault, Namur and East Flanders).
In 1985 the total population of this study amounted to 31,855 SMSEs whose annual ac- counts passed all or the most important audits by the Belgian National Bank (BNB) (cf. in@). In 1989 there were 53,430 companies relevant to our study. The increase is partly due to the favourable economic situation, and partly to a number of le- galchanges. Between 1985 and 1989, many people who were engaged in industrial or commercial activities, traded their unlimited liabilities for lim- ited liabilities by placing their activities under the heading of a trading partnership. In addition, a number of companies turned some of their de- partments into legally separate trading partner- ships. It is very likely that these trends developed
Fig. 1. The AntwerpBrussels axis.

469 SMALL AND MEDIUM-SIZED ENTERPRISES IN THE ANTWEW-BRUSSELS AXIS
in the same way throughout the country. The economic importance of the functional
urban regions of Antwerp and Brussels does not only pertain to the national level. Numerous stud- ies show that they are also very important from a European perspective (Brunet 1989; Cheshire 1990). As such they follow the social, demographic and economic developments that seem to be proper to the metropolitan areas. On the basis of Castells (1993) and Hall (1993), the Antwerp and Brussels area can be characterised as follows: Brussels can be described as a ‘Eurocity’ that is developing into a ‘global city’ i.e., it attracts more and more new tasks which are related to the pro- cessing of information (government, manage- ment, finances). This would ensure the economic growth. The spatial pattern that is linked up to this consists of suburban areas which offer space for industrial production, which consists of the tradi- tional processing industries as well as of new high- tech industries. The latter prefer to settle in the new peripheries of the metropolitan areas, fairly close to the communication centres but at a dis- tance from the other industrial districts. As a re- sult, the central city is very vulnerable. It is the scene for a battle between renovating enterprises and higher middle class families on the one hand, and traditional living and working activities on the other. The more a city comes to play a part in the new information economy, as is the case for Brussels, the more the centre is taken over by the modern service economy. The urban space is be- ing restructured in a far-reaching way, and at the same time the problems of the immigrants and the underprivileged as well as the local protests be- come more visible. Antwerp sticks to the tradi- tional sectors that are related to the processing of material goods, industries, storage, distribution and transport. Here the economic growth is not so self-evident, because these are rather weak func- tions; unless Antwerp enters the winning camp in the international competition between harbours, which is not impossible in view of the positive de- velopments of the last decade (Cheshire 1990). Being an economic centre which concentrates on the traditional sectors, the urban layout of Ant- werp has hardly changed. There is hardly any ur- ban restructuring resulting from the growth of the information economy.
The data - The financial performances of the SMSEs are examined on the basis of the annual
accounts they publish. In the annual accounts, the Board of Directors sketches a picture of the finan- cial state of the company for the use of the share- holders, creditors, employees, the government and other stakeholders. They always consist of three parts, viz. the balance sheet, the profit and loss account and the notes to the accounts. Each of those three parts has its own specific function. The balance sheet contains an overview of the as- sets and the liabilities of an enterprise at a particu- lar moment. It indicates the means a company uses to finance its activities (e.g., capital, loans, retained earnings, accounts payable. It also indi- cates how these financial means were invested (e.g., land, buildings, equipment, inventory, re- ceivables, term deposits). The second part of the annual accounts, i.e., the profit and loss account, presents the composition of the results over the past period. In doing that, it breaks down the reve- nue and costs into operating revenue and costs, financial revenue and costs, and extraordinary revenue and costs. The notes to the accounts, fi- nally, give more information about certain cap tions of the balance sheet and of the profit and loss account. Belgium has a detailed legislation with regard to the contents and layout of the an- nual accounts. As a result, there is detailed and comparable information available about most en- terprises.
The figures in this study pertain to 1985 and 1989.1985 is the first year of Belgium’s economic revival. The period between 1980 and 1984 was characterised by a weak economic situation. 1989, on the other hand, marks the end of this eco- nomic revival. The world economy dipped and this also affected Belgium.
This study is only based on data about SMSEs. These SMSEs are important to the Belgian eco- nomy, and therefore constitute a relevant subject for research. 97% of the Belgian enterprises are SMSEs, and they provide 42% of alljobs (Verbond van Belgische Ondernemingen 1991). In studying 1985 and 1989, we define a company as an SMSE if it does not exceed more than one of the follow- ing criteria: the average number of employees should be no higher than 50; the total on the bal- ance sheet should not amount to more than BEF70 million; and the annual turnover minus VAT should be less than BEF145 million. How- ever, if the average number of employees is more than 100, the enterprise can never be an SMSE. These criteria are laid down by the Royal Decree

470 ANN K!W€ETSEL, ANNJORISSEN L3 STWAN VXNDAMAIE
on annual accounts of September 1983 which im- plements the law on the annual accounts of com- mercial and industrial legal partnerships. A conse- quence of these criteria is that SMSEs defined in such a way only have to publish an abbreviated layout of their annual accounts.
The SMSEs were allocated to the various mu- nicipalities on the basis of their registered offices. If the registered office of an SMSE is located in municipality X, this SMSE was categorised with the population of municipality X. In the case of large enterprises, the locations of the registered offices often differ from the locations of the commercial and industrial activities. This is not as often the case with SMSEs.
An SMSE was entered in the sample studied, if its annual accounts passed all the audits or at least the main audits which the Belgian National Bank performs on all annual accounts filed. The Belgian National Bank traces mathematical mistakes and omissions in the individual annual accounts and corrects them. The BNB does not accept annual accounts which contain too many mistakes and omissions or which are late.
Finally, we have to remark that Belgian annual accounts are to some extent influenced by taxa- tion. Since the results published form the basis for determining corporate taxes, they will be calcu- lated in a rather careful way. This careful attitude is to be found throughout the country, which im- plies that they will not bias the results of a compar- ative study within Belgium.
The ratios used: liquidity, solvency, profitability and value added - In order to judge the financial per- formance of an enterprise, financial analysts usu- ally examine the liquidity, solvency and the profit- ability of that enterprise by means of ratios. There- fore this study determined the most important liquidity, solvency, profitability and value-added ratios for all companies. What do liquidity, sol- vency and profitability actually reflect? It is said that a company is liquid, if it can pay off its short- term liabilities without any problems. In addition, financial analysts also try to find out whether a company will be able to pay off its current long- term liabilities over the next few years. If this ques- tion is answered positively, it is said that a com- pany is solvent. A third element that determines the condition of a company is its profit-earning capacity, which is measured by means of the profit- ability ratios. In calculating these ratios, one works
out how the results are related to the financing means used. Those interested in the precise com- putation of these ratios are referred to Foster (1986), Rees (1990) and Ooghe and Van Wymeersch (1991). As far as liquidity is con- cerned, the following two ratios were calculated: the current ratio (CR) and the acid test ratio (AT). The second series of ratios computed is con- cerned with solvency and deals inter alia with the general debt ratio (GD = outside assets/total amount of assets) and the long-term debt ratio (LD = long-term outside assets/permanent assets). A third important solvency ratio in this study is the self-financing ratio (SR=reserves + profit (or loss) to be carried forward/total amount of assets). This ratio gives some idea of the historical profitability. Moreover, it makes a sharp distinction between failing and non-failing companies in that a self- financing ratio of less than 5% signals high chances ofbankruptcy (Ooghe &Verbaere 1982). Note, though, that the self-financing ratio of young companies is usually rather low. Thirdly, we worked out five profitability ratios, i.e., the gross sales margin (GSM) , the net sales margin (NSM) , the gross profitability of operating assets (GPOA), and the return on equity before (REBT) and after taxes (REAT). And finally, we worked out four value-added ratios which gave us some idea as to the economic performance of a company in gen- eral, and yielded some information about the na- ture of the company (labour-intensive or capital- intensive). They are the share of the labour costs in the gross value added (LVA) , the share of the non-cash costs in the gross value added (NVA) (in SMSEs the noncash costs are mainlywritedowns) . In addition, we also calculated the ratio between the profit or loss added and the gross value added (PVA) and the limit of the gross value added (LGVA) .
In this study every municipalitywas first consid- ered to be a super enterprise for which we calcu- lated globalised ratios. To this purpose, all annual accounts of all small and medium-sized enterprises were summed in a particular municipality. On the basis of those super annual accounts, we com- puted the ratios. These ratios give us some indica- tion as to the financial and economic strength of a municipality.
In addition, we also computed the medians per ratio and per municipality. TO this purpose, we first calculated the various ratios for every SMSE in a municipality so that we could assign the median

471 SMALL AND MELIIUM-SIZED ENTERPRISES IN THE ANTMEW-BRUSSELS AXIS
of each ratio to that municipality. A median is a far better gauge for the performance of an average enterprise in a municipality, because the figures are not influenced by extreme values. Therefore it rather fits in with a microeconomic point of view (Verhetsel &Jorissen 1992; Kempense Kamervoor Handel en Nijverheid 1991). The data put forward in this article all result from the study of medians.
Division per sector: industrial us. commercial enterprises - First, the values for all enterprises in a munici- palitywere computed. Nextwe repeated our calcu- lations for the industrial (NACE code 1 till 5) and the commercial SMSEs separately (NACE code 6 and 7). In 1985 21% of the total population of SMSEs studied was classified as industrial, 50% as commercial. In 1989 these percentages dropped to 19% for the industrial SMSEs and 46% for the commercial ones. The drop in both sectors is mainly due to the strong increase of the number of SMSEs in the services sector (NACE code 8 and 9). This study did not examine the sectors with NACE code 8 and 9 separately. Those interested in a more detailed discussion of the geographical distribution of these sectors are referred to SERV (1992). The spatial distribution of the industrial SMSEs among and within the three functional ur- ban regions shows that 63% of all SMSEs studied are located in the region of Brussels. The shares of Antwerp and Mechelen SMSEs amount to 34% and 3%, respectively. The spatial distribution of the commercial SMSEs in the functional urban regions of Antwerp, Brussels and Mechelen repre- sent 37%, 60% and 3% of the total population of commercial SMSEs, respectively.
RESULTS: STATISTICAL AND CARTOGRAPHICAL ANALYSES
In order to compare the performances of the com- panies in the central city, the agglomeration, the urban fringe and in the commuter area, several analytical techniques were applied, i.e., a statisti- cal test (Mann-Whitney) and a cartographical ana- lysis.
Statistical analysis: the Mann-Whitney test - In order to perform this analysis, the municipalities were divided into two series. The first series (city) com- prises all municipalities which are part of the cen- tral city and the agglomeration; the second series (periphery) comprises all municipalitieswhich are
part of the urban fringe and the commuter area. The Mann-Whitney test allows us to find'out whether there is a significant difference between the mean rank of these two series of municipali- ties. The outcome of this Mann-Whitney test is an indication of the presence or absence of differ- ences in financial performances. As was pointed out before, the results of this statistical analysis only refer to the medians. Moreover, we mainly used the ratios of 1989, because the results of 1985 do not really differ that much from those of 1989 as far as this Mann-Whitney test is concerned. Ta- ble 1 displays the results of the Mann-Whitney test.
The Mann-Whitney test shows that especially profitability is remarkably better in the periphery than in the city. The net sales margin is the only exception, but not all municipalities were taken into account when the net sales margin was com- puted. Possible reasons for this are a number of drawbacks typical of agglomerations, such as traf- fic congestions and higher land prices. For they imply that companies in the city centre have to cope with higher expenses which pull down the actual results. G. Blauwens computed the costs of traffic congestions (jams) from the perspective of business economics (Febiac 1992). The Metropoli- tan Region of Brussels and various real estate groups regularly report on the differences be- tween land prices and prices for company pre- mises. In addition, companies in the periphery would have easy access to a lucid and cheap subur- ban labour market, which is mainly made up by female employees who regard their salaries as a way of supplementing their housekeeping budgets (Castells 1993). More specific details about this are to be found in the socioeconomic atlas of Flan- ders ( 1988), viz. the average wage per working mu- nicipality in 1985 and the way they developed be- tween 1980 and 1985. These data show that wages are on average higher in the City of Antwerp and its southern periphery, and in the northern and northeastern periphery of Brussels. In these areas wages developed in a favourable way as well, with the exception of the City of Antwerp itself where the evolution of the wages was way below the aver- age growth in Flanders.
Also with respect to the solvency ratios and especially to the self-financing ratio, it appears that the periphery performs significantly better than the city. This means that a median company in the urban fringe and in the commuter area has more financial resistance than one in the central

472 ANN W m T S E L , ANNJORISSEN &STEFAN VXhDAMME
Table 1. Results of the Mann-Whitnq test (medians, 1989).
Ratio Mean rank Z-value P*
Liquidity City Periphery
CR 94.37 84.00 -1.2350 0.2168
Solvency GD 76.24 91.37 -1.801 6 0.0716 LD 71.90 93.14 -2.5283 0.0115 SR 74.99 91.88 -2.0 109 0.0443 Profitability GSM 74.24 92.19 -2.1365 0.0326 NSM** 75.51 84.91 -1.1058 0.2688 GPOA 61.23 97.48 4.3149 0.0000 REBT 70.78 93.59 -2.71 58 0.0066 REAT 66.38 95.38 -3.4526 0.0006 Value added LVA 110.66 77.38 -3.9615 0.0001 NVA 56.13 99.55 -5.1688 0.0000 PVA 87.28 86.89 -0.0469 0.9626 LGVA 86.94 87.02 -0.0102 0.9919
AT 110.84 77.31 -3.9939 0.0001
* P is short for tail probability. The NSM cannot be determined for municipalities which host many enterprises (Antwerp, Brussels, Anderlecht, Elsene, Schaarbeek, Sint-Lambrechts-Woluwe, Sint-Pieters-Woluwe, Ukkel and Aalst).
**
city or in the agglomeration. In both cases, how- ever, the mean median rises above the critical bor- der of 5%.
Furthermore, the composition of the value added displays significant differences between the city and the periphery. The city is more labour- intensive and capitalextensive than the periphery. We discovered significant differences with respect to the amount of labour costs as well as with re- spect to the amount of noncash costs. The shares of the profits in the values added do not reveal any significant differences. But these ratios cannot be regarded independently of the other value-added ratios. The meaning of this ratio will become clearer by means of a number of cluster analyses
As far as liquidity is concerned, the acid test yielded significant differences whereas the current ratio test did not. This is because the acid test is a far more rigorous gauge to measure liquidity. Companies can get a high current ratio by having their stock grow more than necessary.
When the Mann-Whitney test was applied at the level of the sectors (trade and industry), the same results for the trading sector were obtained. The trading companies which perform well are
(cf. injru).
situated in the periphery. With regard to the in- dustrial sector, however, the spatial patterns are not that obvious: the performances of industrial SMSEs inside and outside the city display quite a lot of similarities. This observation should be fur- ther examined because people are generally con- vinced that the drawbacks of urbanisation have a much bigger influence on industrial companies than on trading companies. It is very likely that a more refined analysis at the level of the sectors (e.g., by breaking down the NACE codes) and at the spatial level (e.g., by separating the harbour area from the centre of Antwerp) would answer this question decisively.
The conclusion of this first statistical analysis on the basis of medians is that there appears to be a real contrast between the city and the periphery. The median company in the periphery performs significantly better at the financial-economic level than its counterpart in the city. The gap between the medians will grow bigger in the future as com- panies still have a strong tendency towards settling in a suburban area. Note that only sound and prof- itable companies are able to move to the periph- ery, whereas companies with a lesser performance stay behind in the central city.

S M A L L AND MEDIUMSIZED EhTERPRISES IN THE ANTWERP-BRUSSELS AXIS 473
Cartographical analysis: spatial distribution - On the basis of the Mann-Whitney test, a significant differ- ence was observed between the performances of the urban and the peripheral municipalities. The cartographical analysing technique which we a p plied permits us to analyse the differences ob- served before in more detail. We will first apply a simple analysis and next a number of cluster analy- ses.
The urban economy scores low as far as profit- ability is concerned, whereas the economy in the periphery scores better. This thesis, which was al- ready confirmed by the Mann-Whitney test, is fur- ther tested on the basis of the return on equity after taxes (fig. 2). It yielded the same spatial pat- tern as the other profitability ratios.
To the extent that this is indicated by the prof- itability ratio mentioned above, it seems that the situation in the central cities of Antwerp and Mechelen and in the district of BrusselsCapital is far from bright. The peripheral municipalities, on the contrary, host companies that perform well or even very well. In the urban district of Antwerp, most companieswith low scores are situated in the central city (Antwerp), and in the agglomeration (Brasschaat, Hove, Lint). Companies in the urban fringe (Brecht, Stabroek, Wijnegem) and in the commuter area (Nijlen, Puurs, Rijkevorsel, Tem- se) score, but for a few exceptions, a lot better. It also holds for the functional urban region of Brussels that the SMSEs which score low are situ- ated in the central area, in this case the district of Brussels-Capital (the central municipality of Brus- sels and the 18 peripheral municipalities). The agglomeration and the urban fringe form a circle around this central area of companies that per- form well, especially in the north and in the east (Grimbergen, Kampenhout,Vilvoorde, Zaventem,
Fig. 2. Return on equity aft.. taxes, 1989.
Zemst) . As to the performances of the companies in the commuter area, the situation is less straight- forward. Here we find municipalities which host average companies that perform very well and those that perform badly. A detailed survey on the evolution since 1985 shows that especially the me- dian companies in the urban agglomeration of Antwerp displayed negative developments. But profitability also went down in the northern part of the agglomeration of Brussels and in its western periphery. During the economic boom (1985 1989), profitability was to some extent on the de- cline in the urban agglomeration. Suburban SMSEs seemed to have benefited more from the economic revival.
The contrast between the urban and the subur- ban economy is also very obvious as far as indus- trial and commercial companies are concerned. On the basis of the statistical analysis, which was a rather rough one, this contrast did not really stand out. On the basis of the cartographical analysis which is a more refined spatial analysis, the con- trast between industries in the city and in the pe- riphery becomes quite salient.
With respect to industrial companies, there is not only a contrast between the city and the pe- riphery, but there are also many differences be- tween the urban functional regions. Here the axis with the weakest performances is the Mechelen- Brussels one. In the functional region ofhtwerp, there is no contrast between industries in the city and in the periphery at all. Companies in the city as well as in the periphery perform averagely or well. In the functional region of Brussels, munici- palities in the urban fringe situated along the El9 and in the commuter area perform averagely or badly. On comparing industrial and trading com- panies in the periphery of Brussels, there appear to be quite a number of differences. Most trading companies that perform badly cluster south of the linguistic border (Brain-le-Comte, Nijvel, Rixen- sart, Villers-la-Ville) , whereas the industrial SMSEs that perform less well are located both north and south of the linguistic border (Aalst, Braine-le- Comte, Haaltert, Halle).
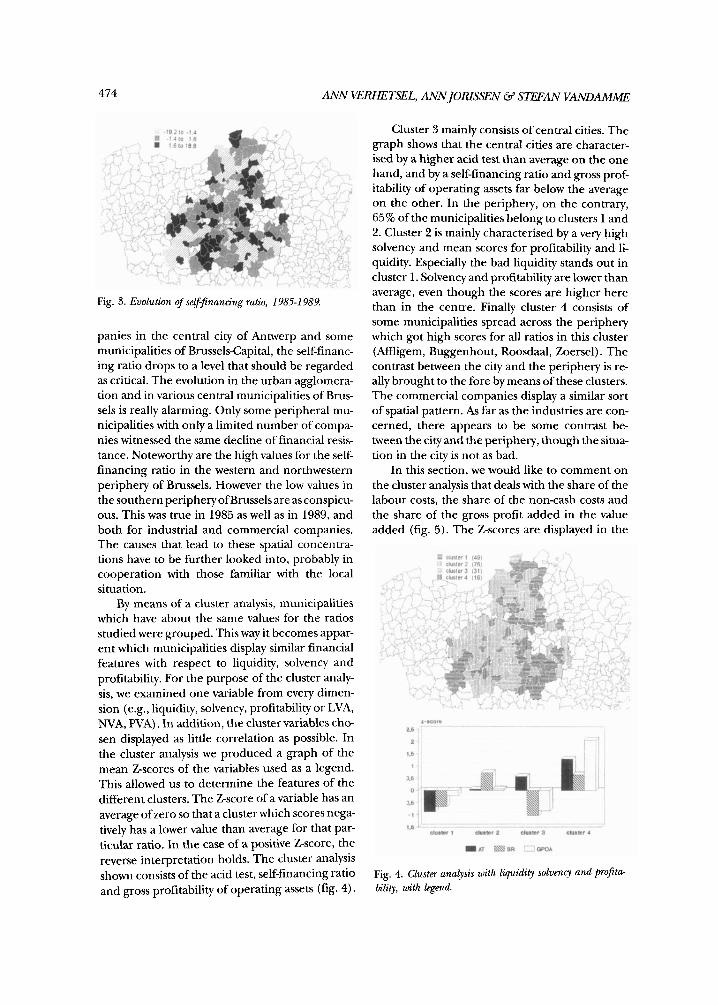
In order to determine the spatial pattern for solvency, the self-financing ratio was mapped (fig. 3). The comparison of the 1985 and the 1989 data points towards a continuing erosion of the city at the expense the periphery. The central cities of Antwerp and Brussels scored less than seven points, which wasverypoor. With the trading corn-
474 ANN WRHETSEL, ANNJOHSSEN &? STmAiV VANDAMME
Fig. 3. Evolution of self-financing ratio, 1985-1 989
panies in the central city of Antwerp and some municipalities of Brussels-Capital, the self-financ- ing ratio drops to a level that should be regarded as critical. The evolution in the urban agglomera- tion and in various central municipalities of Brus- sels is really alarming. Only some peripheral mu- nicipalities with only a limited number of compa- nies witnessed the same decline of financial resis- tance. Noteworthy are the high values for the self- financing ratio in the western and northwestern periphery of Brussels. However the low values in the southern periphery ofBrussels are as conspicu- ous. This was true in 1985 as well as in 1989, and both for industrial and commercial companies. The causes that lead to these spatial concentra- tions have to be further looked into, probably in cooperation with those familiar with the local situation.
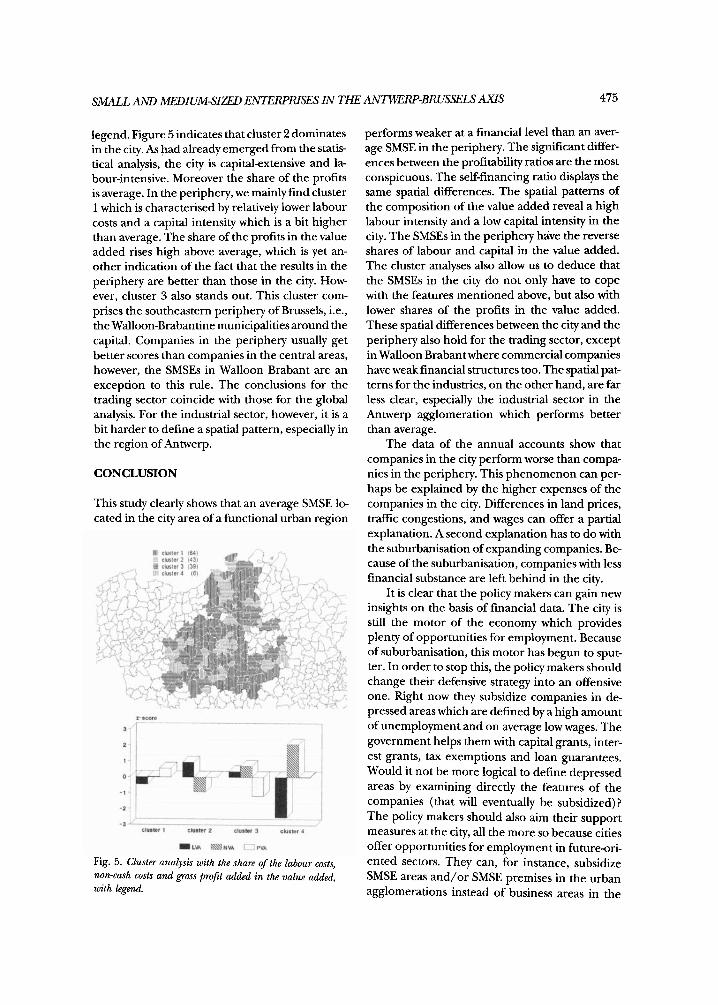
By means of a cluster analysis, municipalities which have about the same values for the ratios studied were grouped. This way it becomes appar- ent which municipalities display similar financial features with respect to liquidity, solvency and profitability. For the purpose of the cluster analy- sis, we examined one variable from every dimen- sion (e.g., liquidity, solvency, profitability or LVA, NVA, PVA) . In addition, the cluster variables cho- sen displayed as little correlation as possible. In the cluster analysis we produced a graph of the mean Zscores of the variables used as a legend. This allowed us to determine the features of the different clusters. The Z-score of a variable has an average of zero so that a cluster which scores nega- tively has a lower value than average for that par- ticular ratio. In the case of a positive Zscore, the reverse interpretation holds. The cluster analysis show consists of the acid test, self-financing ratio and gross profitability of operating assets (fig. 4).
Cluster 3 mainly consists of central cities. The graph shows that the central cities are character- ised by a higher acid test than average on the one hand, and by a self-financing ratio and gross prof- itability of operating assets far below the average on the other. In the periphery, on the contrary, 65% of the municipalities belong to clusters 1 and 2. Cluster 2 is mainly characterised by a very high solvency and mean scores for profitability and li- quidity. Especially the bad liquidity stands out in cluster 1. Solvency and profitability are lower than average, even though the scores are higher here than in the centre. Finally cluster 4 consists of some municipalities spread across the periphery which got high scores for all ratios in this cluster (Affligem, Buggenhout, Roosdaal, Zoersel) . The contrast between the city and the periphery is re- ally brought to the fore by means of these clusters. The commercial companies display a similar sort of spatial pattern. As far as the industries are con- cerned, there appears to be some contrast be- tween the city and the periphery, though the situa- tion in the city is not as bad.
In this section, we would like to comment on the cluster analysis that deals with the share of the labour costs, the share of the non-cash costs and the share of the gross profit added in the value added (fig. 5). The Z-scores are displayed in the
Fig. 4. Cluster analysis with liquidity solvenq and projta- bility, with kgend.
S M A L L ANLI MEDIUM-SIZED EhTERPRISES IN THE AhTWERP-BRUSSELS AXIS 475
legend. Figure 5 indicates that cluster 2 dominates in the city. As had already emerged from the statis- tical analysis, the city is capitalextensive and la- bour-intensive. Moreover the share of the profits is average. In the periphery, we mainly find cluster 1 which is characterised by relatively lower labour costs and a capital intensity which is a bit higher than average. The share of the profits in the value added rises high above average, which is yet an- other indication of the fact that the results in the periphery are better than those in the city. How- ever, cluster 3 also stands out. This cluster com- prises the southeastern periphery of Brussels, i.e., the Walloon-Brabantine municipalities around the capital. Companies in the periphery usually get better scores than companies in the central areas, however, the SMSEs in Walloon Brabant are an exception to this rule. The conclusions for the trading sector coincide with those for the global analysis. For the industrial sector, however, it is a bit harder to define a spatial pattern, especially in the region of Antwerp.
CONCLUSION
This study clearly shows that an average SMSE lo- cated in the city area of a functional urban region
Fig. 5. Cluster analysis with the share of the labour costs, non-cash costs and gross profit added in the value added, with legend.
performs weaker at a financial level than an aver- age SMSE in the periphery. The significant differ- ences between the profitability ratios are the most conspicuous. The self-financing ratio displays the same spatial differences. The spatial patterns of the composition of the value added reveal a high labour intensity and a low capital intensity in the city. The SMSEs in the periphery have the reverse shares of labour and capital in the value added. The cluster analyses also allow us to deduce that the SMSEs in the city do not only have to cope with the features mentioned above, but also with lower shares of the profits in the value added. These spatial differences between the city and the periphery also hold for the trading sector, except in Walloon Brabantwhere commercial companies have weak financial structures too. The spatial pat- terns for the industries, on the other hand, are far less clear, especially the industrial sector in the Antwerp agglomeration which performs better than average.
The data of the annual accounts show that companies in the city perform worse than compa- nies in the periphery. This phenomenon can per- haps be explained by the higher expenses of the companies in the city. Differences in land prices, traffic congestions, and wages can offer a partial explanation. A second explanation has to do with the suburbanisation of expanding companies. Be- cause of the suburbanisation, companies with less financial substance are left behind in the city.
It is clear that the policy makers can gain new insights on the basis of financial data. The city is still the motor of the economy which provides plenty of opportunities for employment. Because of suburbanisation, this motor has begun to sput- ter. In order to stop this, the policy makers should change their defensive strategy into an offensive one. Right now they subsidize companies in de- pressed areas which are defined by a high amount of unemployment and on average low wages. The government helps them with capital grants, inter- est grants, tax exemptions and loan guarantees. Would it not be more logical to define depressed areas by examining directly the features of the companies (that will eventually be subsidized)? The policy makers should also aim their support measures at the city, all the more so because cities offer opportunities for employment in future-ori- ented sectors. They can, for instance, subsidize SMSE areas and/or SMSE premises in the urban agglomerations instead of business areas in the

476 AiW WRHETSEL, ANNJORISSEN €3 STEFAN VANDAMME
periphery. A number of questionnaires (GOM Brabant 1991) showed that SMSEs mainly need working accommodations of 100 to 600 square metres. Areas of these sizes can easily be fitted into the spatial structure of urban agglomerations. In this way the developing potentials present in the
REFERENCES
BRUNET, R. (1989), Les Villes 'Europiennes': Paris: La Doc- umentation Francaise.
CASTELLS, M. (1993), European Cities, the Informational Society, and the Global Economy. Tijdschn? vom Economische en Sociab Geograje84, pp. 247-257.
CHESHIRE, P. (1990), Explaining the Recent Performan- ce of the European Community's Major Urban Re- gions. Urban Studies 27, pp. 31 1-333.
Metropolis. Leuven: Kritak.
Fabry R. GEWESTELIJKE ONTWIKKELINGSMAATSCHAPPIJ VOOR
BRUSSEL (GOM) (1991), Activita'ten '91. Brussels: COMB.
HALL, P. (1993), Forces Shaping Urban Europe. Urban Studies 30, pp. 883-898.
KEMPENSE KAMERVOOR HANDEL EN NIJVERHEID (1991), De Kernpelwe ondernemingen jnancieel doorgelicht. Kas- terlee: Kempense Kamer voor Handel en Nijverheid.
DE BRABANDER, G., L. VERVOORT & F. WITLOX (1992),
FEBlAC (1992), Mobilis. Studie over de mobilita't. Brussels:
urban agglomerations can become reality. This would bring about other positive effects such as a higher return on investments in the city, preserv- ing the scarce open space and limiting the mobil- ity streams.
OOGHE, H. & C. VAN WYMEERSCH (1991), Financiek ana- lyse van ondernemingen: theorie en toepassing op de jaar- rehning. Antwerp: Kluwer.
OOGHE, H. & E. VERBAERE (1982), D e t m i n a n t a van fal- ing: verklanng en predictie. Gent: RUG, Accountancy- Bedrijfsfinanciering-Beleidsinfo.
SERV ( 1992), Rapport 1992 over de regionale onturikhling. Regionale en subregionale betekenis van dejnanciile sectw, de diensten aan bednjven en de verhuur. Brussels: SERV.
VAN DER HAEGEN, H., M. PA- & S. ROUSSEAU (1981), Spreiding en relatiepatroon van de Belgische neder- zettingen in 1980. Statistisch Tijdschrift5-6, pp. 265-283.
VERBOND VAN BELGISCHE ONDERNEMINGEN (1991), In- deling van werkgevers en werknemers naar dimen- sieklasse. VBO-bulletin, No. 1, pp. 52-56.
VERHETSEL, A. & A. JORISSEN (1992), Belgii, een land met meer dan twee snelheden? Het gebruik van jaarrekening- gzgeuens in economisch-geograjsch ondmoek. Antwerp: SESO-UFSIA.