Sliding Wear Behavior of Self-Mated Carbide-free Bainitic Steels
65
Sliding Wear Behavior of Self-Mated Carbide-free Bainitic Steels Amin Mazraeh Mechanical Engineering, master's level 2018 Luleå University of Technology Department of Engineering Sciences and Mathematics
-
Upload
khangminh22 -
Category
Documents
-
view
0 -
download
0
Transcript of Sliding Wear Behavior of Self-Mated Carbide-free Bainitic Steels

Sliding Wear Behavior of Self-Mated
Carbide-free Bainitic Steels
Amin Mazraeh
Mechanical Engineering, master's level
2018
Luleå University of Technology
Department of Engineering Sciences and Mathematics

May science and those who wield it serve the humanity for a brighter future

This thesis summarizes the work I have carried out as part of my Master thesis studies at the
Division of Machine element at Luleå University of Technology. A journey of wonders with plenty
of challenges filled with cycles of failure and success which was completely worth it. Along these
two years I have had the opportunity to meet, work and learn wisdom from extraordinary people
who I would like to thank.
First, I would like to express my gratitude and thanks to my supervisor professor Jens Hardell.
Without his guidance, support, patience and priceless scientific knowledge, this thesis would have
never been possible. I would like to thank my friend Pouria V. Moghaddam as his support,
teachings and patience as a mentor further assisted me on my mysterious scientific journey.
Many thanks to the division of Machine Element for providing a pleasant and friendly working
environment. Many thanks to The Material Science department laboratory, Johnny, Lars and Rosa
for helping me with my experiments and trainings. I also would like to thank my friends and
colleagues; Luca P. Blucci, Ayush Jain, Harry others whom lent me their support and help during
my research.
Especial thanks to my family and my beloved partner Narges as their support and generous
kindness made me stronger and kept me going particularly during my bad days. I will never forget
any of your kindness and hope the best for you in life.
Amin Mazraeh
Luleå 2018

Summary
In this study, the tribological behavior of various carbide free bainitic steels (CFB)
under dry sliding wear conditions and varying load and speed was investigated.
Having determined the adhesive-oxidative wear mechanism in the interested tribo
system, further post analysis such as SEM/EDS, profilometry and XRD were carried
out to study the effect of the retained austenite on the formation of surface and near
surface transformation. During the pin-on-disk tests, contact temperature, friction
coefficient and specific wear rate wear measured and their correlation with load and
speed was thoroughly described.
Results revealed that the retained austenite transformation induced plasticity is a
product of both stress and strain induced deformation. It was discussed how the
material properties and other tribology factors in tribo system would affect the
formation and stability of the layers formed on the surface such as oxide layer and
retained austenite transformation into martensite. It was shown that as the load and
speed increases, a change in dominant wear mechanism from adhesive to oxidative
would occur. Measurements showed that at low loads, by increasing the speed, the
contact temperature would decrease while at higher loads, as expected, by increasing
the speed, the contact temperature would increase as well. On the other hand, friction
coefficient was significantly higher at low loads, and the reasons for such phenomena
were described in detail. Additionally, the relation between the CFB steel
asutempering temperature, microstructure and the test parameters were studied. Also,
further detailed discussion revealed the fact that there is no correlation between
volume fraction of retained austenite and material wear resistance, while retained
austenite grain size would have major effect on the wear resistance behavior of CFB
steels as potential alternatives to current steels in various industrial applications such
as bearings, gears and rail.

List of Figures
FIGURE 1. IRON-CARBON PHASE DIAGRAM [12] 2
FIGURE 2. ILLUSTRATION OF FERRITE PHASE AT DIFFERENT POINTS IN PHASE DIAGRAM [14] 3
FIGURE 3. ILLUSTRATION OF TYPICAL STEEL TTT DIAGRAM [12] 4
FIGURE 4. MICROSTRUCTURE OF UPPER BAINITE: A, 0.8C STEEL TRANSFORMED 20S AT 400 ºC, X670;
B, 0.34C 5
FIGURE 5. MICROSTRUCTURE OF LOWER BAINITE A, 0.8C STEEL TRANSFORMED 30S AT 300 ºC, X260;
B, 0.8C STEEL TRANSFROMED AT 300 ºC. TWO SURFACE COMPOSITE MICROGRAPH, X260; C,
0.8C STEEL TRANSFORMED 5
FIGURE 6. PROBABLE POSITION OF CARBON ATOM WITHIN BCC IRON CRYSTAL. [17] 6
FIGURE 7. THE CORELLATION BETWEEN CARBON CONTENT AND RATIO OF CRYSTAL STRUCTUE
DIMENSIONS. [18] 6
FIGURE 8. IN THE ABOVE IMAGE, THERE ARE TWO FCC ADJACENT UNIT CELLS, WITH A LATTICE
PARAMETER AG. A BCT CELL IS OBTAINED BY CONNECTING THE 8 FCC SITES. THIS CELL HAS
SIDES A AND A / 2. IMAGINE THAT THE BCT CELL IS REMOVED AND DISTORTED SO THAT ITS
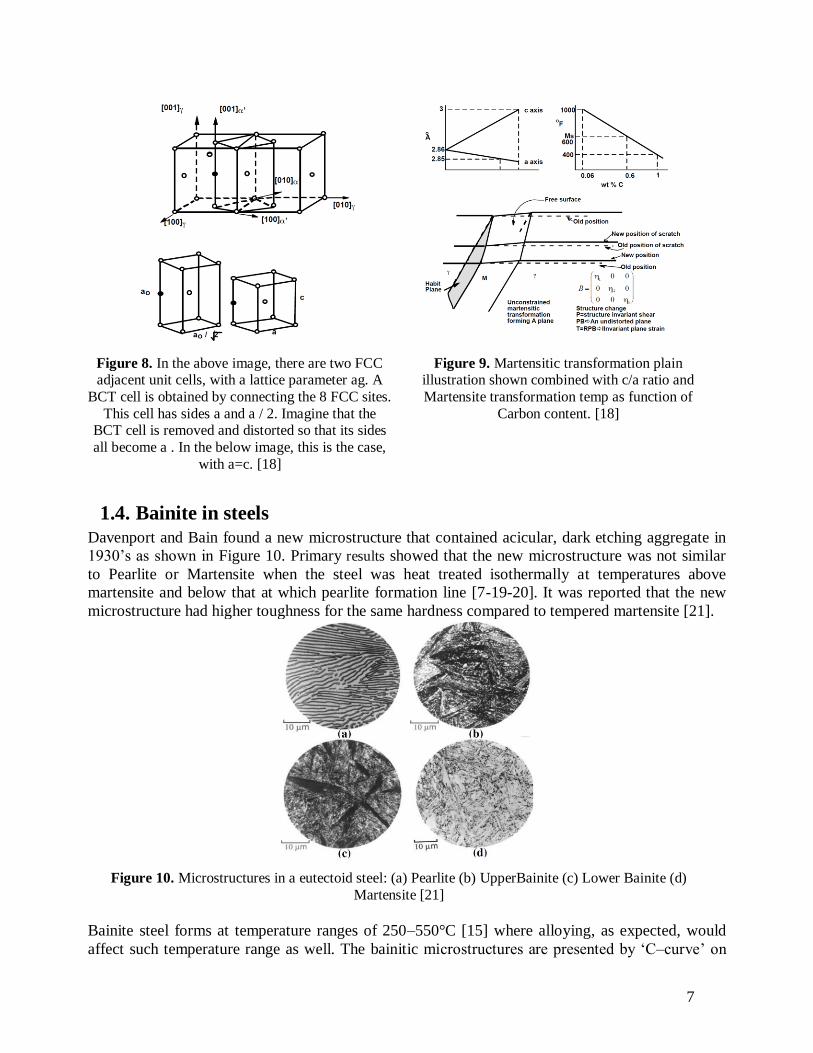
SIDES ALL BECOME A . IN THE BELOW IMAGE, THIS IS THE CASE, WITH A=C. [18] 7
FIGURE 9. MARTENSITIC TRANSFORMATION PLAIN ILLUSTRATION SHOWN COMBINED WITH C/A RATIO
AND MARTENSITE TRANSFORMATION TEMP AS FUNCTION OF CARBON CONTENT. [18] 7
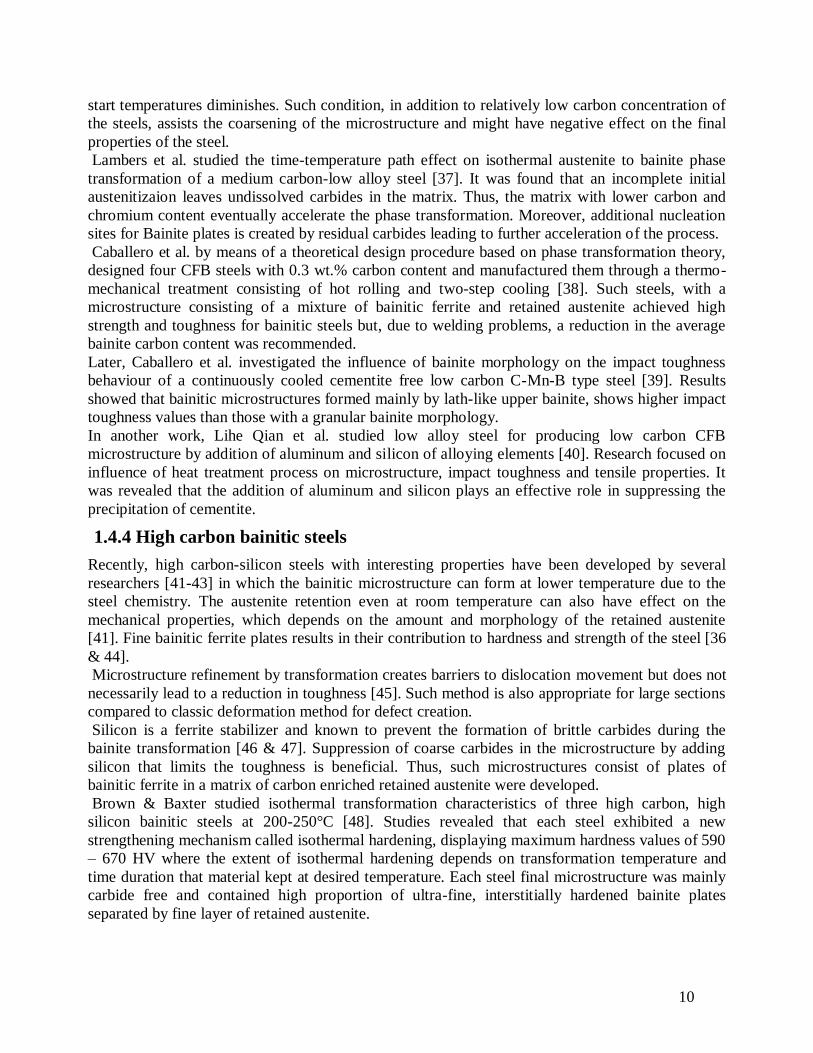
FIGURE 10. MICROSTRUCTURES IN A EUTECTOID STEEL: (A) PEARLITE (B) UPPERBAINITE (C) LOWER
BAINITE (D) MARTENSITE [21] 7
FIGURE 11. TTT EXAMPLE FOR BAINITIC STEEL FORMATION [15] 8
FIGURE 12. CARBON PARTITIONING AND PERCIPITATION IN UPPER AND LOWER BAINITE [22] 8
FIGURE 13. TEM MICROGRAPH OF NEVEL BAINITIC TRANSFORMED AT 200 C FOR 5 DAYS [52,53] 11
FIGURE 14. OPTICAL MICROSTRUCTURE OF NOVEL BAINITIC STEEL TRANSFORMED AT 200 C [54] 12
FIGURE 15. SCHEMATIC VIEW OF HEAT TREATMENT FOR THE CFB SAMPLES INCLUDING
AUSTENIZATION AND AUSTEMPERING 16
FIGURE 16. PIN ON DISK TRIBOMETER INSTRUMENT USED IN THIS STUDY 17
FIGURE 17. A VIEW OF PIN AND DISK SAMPLES GEOMETRY AND DIMENSIONS 17
FIGURE 18. DEMONSTRATION OF THE LOAD-SPEED PARAMETER CHOSEN FOR THIS STUDY AND THEIR
SPECULATED RESULTANT WEAR MECHANISM ON STEEL WEAR MAP [66] 18
FIGURE 19. A VIEW OF XRD INSTRUMENT USED IN THIS STUDY 19
FIGURE 20. A VIEW OF SEM INSTRUMENT USED IN THIS STUDY 19
FIGURE 21. A VIEW OF SEM INSTRUMENT USED IN THIS STUDY 19
FIGURE 22. A VIEW OF WYKO 1100 NT OPTICAL PROFILOMETER 20
FIGURE 23. RESEARCH METHODOLOGY CHART 21
FIGURE 24. HARDNESS MEASUREMENT OF THE CFB SAMPLES WITH VARIOUS HEAT TREATMENTS 22
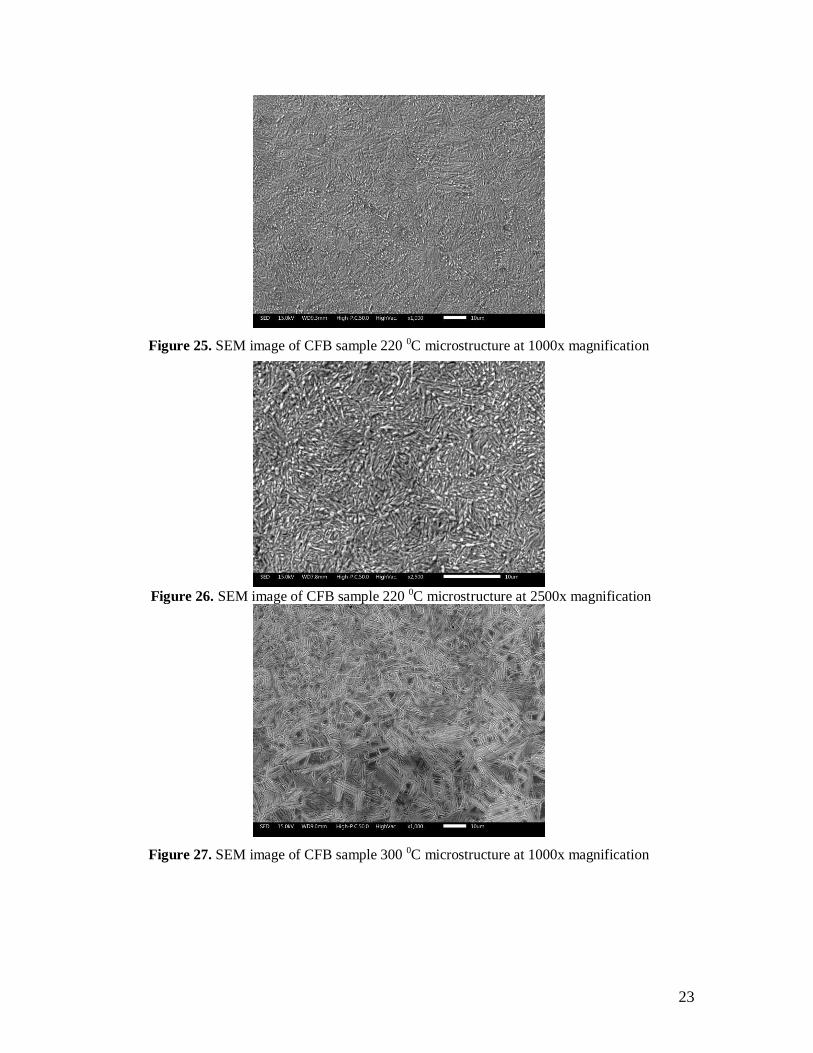
FIGURE 25. SEM IMAGE OF CFB SAMPLE 220 0C MICROSTRUCTURE AT 1000X MAGNIFICATION 23
FIGURE 26. SEM IMAGE OF CFB SAMPLE 220 0C MICROSTRUCTURE AT 2500X MAGNIFICATION 23
FIGURE 27. SEM IMAGE OF CFB SAMPLE 300 0C MICROSTRUCTURE AT 1000X MAGNIFICATION 23
FIGURE 28. SEM IMAGE OF CFB SAMPLE 300 0C MICROSTRUCTURE AT 2500X MAGNIFICATION 24
FIGURE 29. CT VALUES OF CFB SAMPLES FOR DIFFERENT TEST CONDITIONS 24
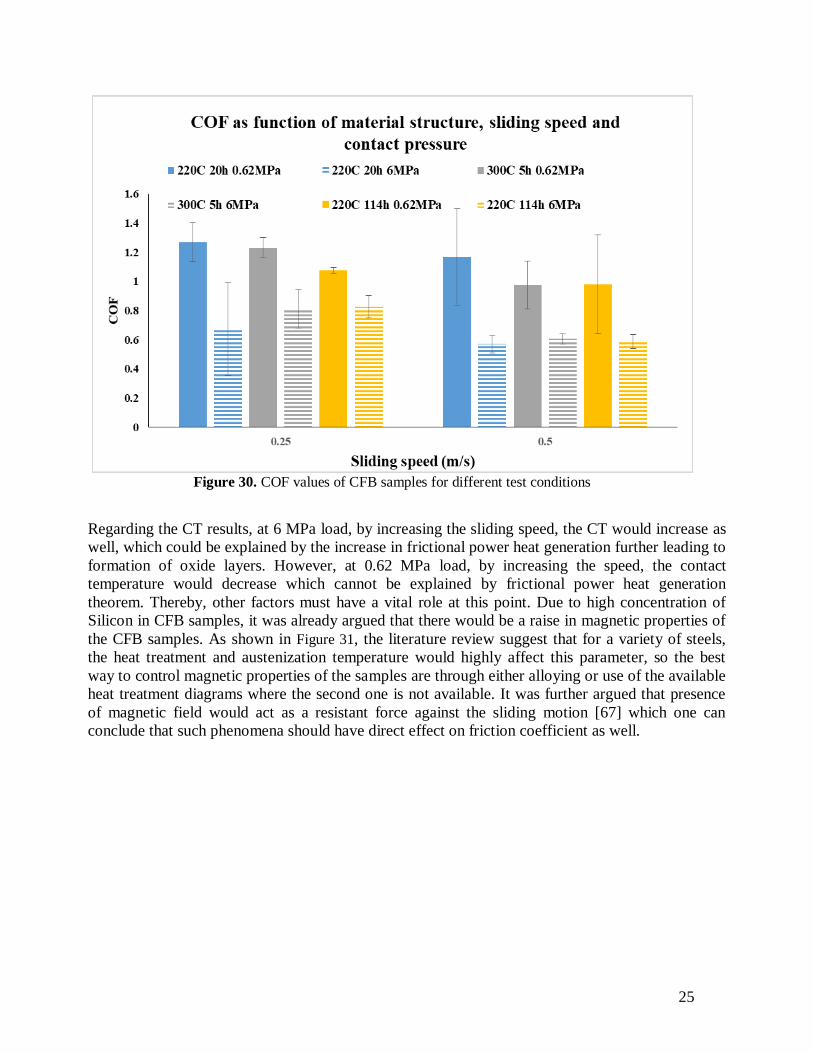
FIGURE 30. COF VALUES OF CFB SAMPLES FOR DIFFERENT TEST CONDITIONS 25
FIGURE 31. EFFECT OF TEMPERING-AUSTENITIZATION TEMPERATURE ON SATURATION
MAGNETIZATION OF STEEL [68] 26
FIGURE 32. EFFECT OF LOAD ON IRON MAGNETIC PROPERTIES UNDER THE EFFECT OF DIRECT
MAGNETIC FLUX [69] 26

FIGURE 33. EFFECT OF SPEED ON IRON MAGNETIC PROPERTIES UNDER THE EFFECT OF DIRECT
MAGNETIC FLUX [69] 27
FIGURE 34. EFFECT OF MAGNETIC PROPERTIES OF THE IRON ON COF AND SURFACE MAGNETIZATION
[69] 27
FIGURE 35. EFFECT OF VARIOUS IRON OXIDE LAYER ON COF AND WEAR BEHAVIOR OF TRIBO
SURFACES [70] 27
FIGURE 36. DEMONSTRATION OF HEMATITE OXIDE LAYER FORMATION AT LOW LOADS MAINLY
FORMED AT LOW TEMPERATURES 28
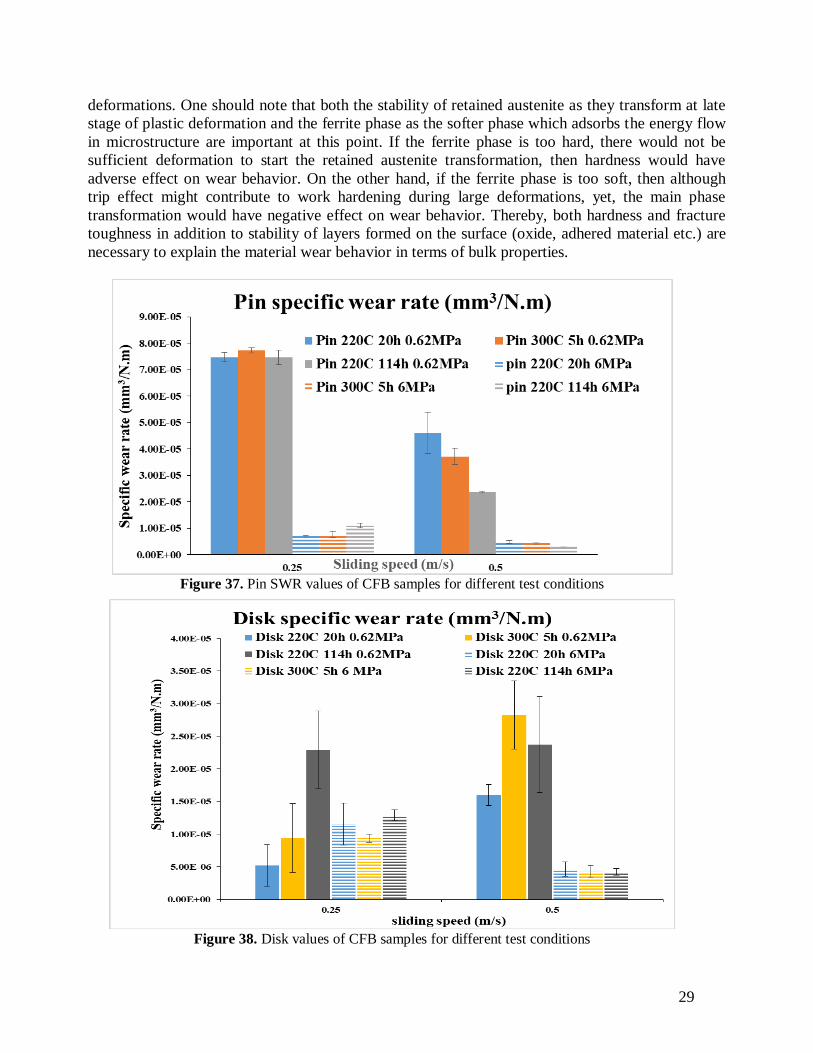
FIGURE 37. PIN SWR VALUES OF CFB SAMPLES FOR DIFFERENT TEST CONDITIONS 29
FIGURE 38. DISK VALUES OF CFB SAMPLES FOR DIFFERENT TEST CONDITIONS 29
FIGURE 39. SEM IMAGE OF DEMONSTRATION OF CFB STEEL DISK AUSTEMPERED AT 220 0C WEAR
MECHANISM FOR THREE TEST CONDITION: 0.25 M.S-1-0.6 MPA (A), 0.25 M.S-1-6MPA (B), 0.5
M.S-1-6MPA(C) 31
FIGURE 40. SEM IMAGE OF DEMONSTRATION OF CFB STEEL DISK AUSTEMPERED AT 300 0C WEAR
MECHANISM FOR THREE TEST CONDITION: 0.25 M.S-1-0.6 MPA (A), 0.25 M.S-1-6MPA(B) 31
FIGURE 41. SEM IMAGE OF WORN SURFACE OF CFB SAMPLE 114H DISK AT 0.25 M.S-1- 0.62 MPA. 31
FIGURE 42. SEM IMAGE OF WORN SURFACE OF CFB SAMPLE 114H DISK AT 0. 5 M.S-1- 0.62 MPA. 31
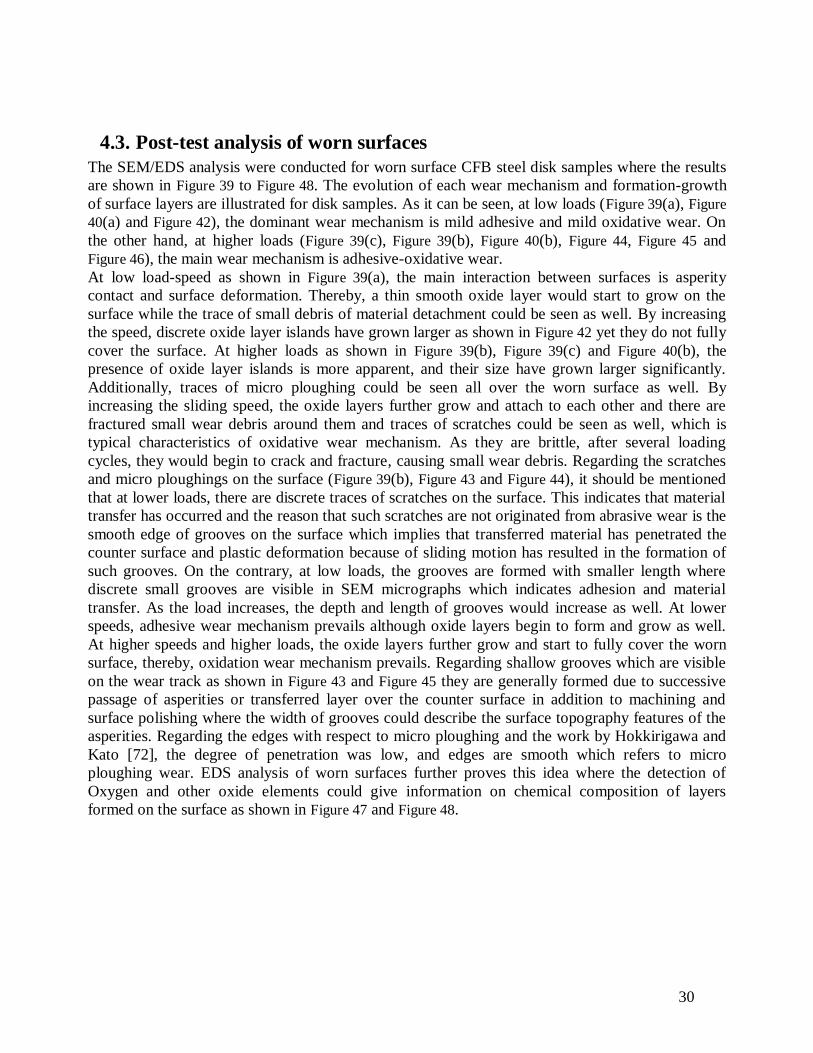
FIGURE 43. SEM IMAGE OF WORN SURFACE OF CFB SAMPLE 20H DISK AT 0. 25 M.S-1- 6 MPA. 32
FIGURE 44. SEM IMAGE OF WORN SURFACE OF CFB SAMPLE 20H AT DISK 0. 5 M.S-1- 6 MPA. 32
FIGURE 45. SEM IMAGE OF WORN SURFACE OF CFB SAMPLE 300H DISK AT 0. 25 M.S-1- 0.6 MPA. 32
FIGURE 46. SEM IMAGE OF WORN SURFACE OF CFB SAMPLE 300H DISK AT 0. 25 M.S-1- 6 MPA. 32
FIGURE 47. EDS ANALYSIS OF WORN SURFACE OF CFB SAMPLE 20H DISK AT 0. 25 M.S-1- 6 MPA. 32
FIGURE 48. EDS ANALYSIS OF WORN SURFACE OF CFB SAMPLE 20H DISK AT 0. 25 M.S-1- 0.6 MPA. 33
FIGURE 49. SEM IMAGE OF DEMONSTRATION OF CFB STEEL PIN AUSTEMPERED AT 220 0C WEAR
MECHANISM FOR THREE TEST CONDITION: 0.25 M.S-1-0.6 MPA (A), 0.25 M.S-1-6MPA (B), 0.5
M.S-1-6MPA(C) 33
FIGURE 50. SEM IMAGE OF DEMONSTRATION OF CFB STEEL PIN AUSTEMPERED AT 300 0C WEAR
MECHANISM FOR THREE TEST CONDITION: 0.25 M.S-1-0.6 MPA (A), 0.25 M.S-1-6MPA (B). 34
FIGURE 51. SEM IMAGE OF WORN SURFACE OF CFB SAMPLE 220H PIN AT 0. 25 M.S-1- 0.6 MPA. 34
FIGURE 52. SEM IMAGE OF WORN SURFACE OF CFB SAMPLE 220H PIN AT 0. 25 M.S-1- 0.6 MPA. 34
FIGURE 53. SEM IMAGE OF WORN SURFACE OF CFB SAMPLE 220H PIN AT 0. 25 M.S-1- 6 MPA. 34
FIGURE 54. SEM IMAGE OF WORN SURFACE OF CFB SAMPLE 220H PIN AT 0. 5 M.S-1- 6 MPA. 34
FIGURE 55. SEM IMAGE OF WORN SURFACE OF CFB SAMPLE 300H PIN AT 0. 25 M.S-1- 0.6 MPA. 35
FIGURE 56. SEM IMAGE OF WORN SURFACE OF CFB SAMPLE 300H PIN AT 0. 25 M.S-1- 6 MPA. 35
FIGURE 57. EDS ANALYSIS OF WORN SURFACE OF CFB SAMPLE 300 0C DISK AT 0.5 M.S-1- 0.6 MPA.
35
FIGURE 58. DS ANALYSIS OF WORN SURFACE OF CFB SAMPLE 220 0C DISK AT 0.5 M.S-1- 0.6 MPA .
35
FIGURE 59. SEM IMAGE OF FRACTURED MULTI-LAYER OXIDE AND WORK-HARDENED SURFACE OVER
DISK SURFACE 36
FIGURE 60. SEM IMAGE OF THE FORMATION OF CRACKS OVER THE DISK OXIDE LAYER
PERPENDICULAR TO SLIDING DIRECTION DUE TO SLIDING MOTION OF PIN OVER THE DISK WITH
PLANE-PLANE CONTACT PRESSURE DISTRIBUTION 37
FIGURE 61. DISKS SURFACE ROUGHNESS MEASUREMENT RESULTS WHERE THE THREE ORANGE, RED
AND GREEN HORIZONTAL LINES REFER TO ORIGINAL SURFACE ROUGHNESS 37

FIGURE 62. PINS SURFACE ROUGHNESS MEASUREMENT RESULTS WHERE THE THREE ORANGE, RED AND
GREEN HORIZONTAL DOTTED-LINES REFER TO ORIGINAL SURFACE ROUGHNESS 38
FIGURE 63. SEM IMAGE OF WORN SURFACE OF CFB DISK SAMPLE 220 0C 114H AT 0. 25 M.S-1- 6 MPA.
39
FIGURE 64. SURFACE ROUGHNESS IMAGE OF WORN SURFACE OF CFB DISK SAMPLE 220 0C 114H AT 0.
25 M.S-1- 0.6 MPA. 40
FIGURE 65. SURFACE ROUGHNESS IMAGE OF WORN SURFACE OF CFB DISK SAMPLE 220 0C 114H AT 0.
25 M.S-1- 0.6 MPA. 40
FIGURE 66. SURFACE ROUGHNESS IMAGE OF WORN SURFACE OF CFB DISK SAMPLE 220 0C 114H AT
0.5 M.S-1- 0.6 MPA. 40
FIGURE 67. SURFACE ROUGHNESS IMAGE OF WORN SURFACE OF CFB DISK SAMPLE 220 0C 114H AT
0.5 M.S-1- 0.6 MPA. 41
FIGURE 68. SURFACE ROUGHNESS IMAGE OF WORN SURFACE OF CFB DISK SAMPLE 220 0C 20H AT 0.
25 M.S-1- 6 MPA. 41
FIGURE 69. SURFACE ROUGHNESS IMAGE OF WORN SURFACE OF CFB DISK SAMPLE 220 0C 20H AT 0.
25 M.S-1- 6 MPA. 41
FIGURE 70. SURFACE ROUGHNESS IMAGE OF WORN SURFACE OF CFB DISK SAMPLE 300 0C 5H AT 0.5
M.S-1- 6 MPA. 42
FIGURE 71. SURFACE ROUGHNESS IMAGE OF WORN SURFACE OF CFB DISK SAMPLE 300 0C 5H AT 0.5
M.S-1- 6 MPA. 42
FIGURE 72. SURFACE ROUGHNESS IMAGE OF WORN SURFACE OF CFB PIN SAMPLE 220 0C 114H AT
0.25 M.S-1- 0.6 MPA. 43
FIGURE 73. SURFACE ROUGHNESS IMAGE OF WORN SURFACE OF CFB PIN SAMPLE 220 0C 114H AT
0.25 M.S-1- 0.6 MPA. 43
FIGURE 74. SURFACE ROUGHNESS IMAGE OF WORN SURFACE OF CFB PIN SAMPLE 220 0C 20H AT 0.5
M.S-1- 0.6 MPA. 43
FIGURE 75. SURFACE ROUGHNESS IMAGE OF WORN SURFACE OF CFB PIN SAMPLE 220 0C 20H AT 0.5
M.S-1- 0.6 MPA. 44
FIGURE 76. SURFACE ROUGHNESS IMAGE OF WORN SURFACE OF CFB PIN SAMPLE 220 0C 114H AT
0.25 M.S-1- 6 MPA. 44
FIGURE 77. SURFACE ROUGHNESS IMAGE OF WORN SURFACE OF CFB PIN SAMPLE 220 0C 5H AT 0.25
M.S-1- 6 MPA. 44
FIGURE 78. SURFACE ROUGHNESS IMAGE OF WORN SURFACE OF CFB PIN SAMPLE 300 0C 114H AT 0.5
M.S-1- 6 MPA. 45
FIGURE 79. SURFACE ROUGHNESS IMAGE OF WORN SURFACE OF CFB PIN SAMPLE 300 0C 5H AT 0.5
M.S-1- 6 MPA. 45
FIGURE 80. XRD ANALYSIS CFB SAMPLE 300 0C 5H ORIGINAL SURFACE FRACTION OF RETAINED
AUSTENITE 46
FIGURE 81. XRD ANALYSIS CFB SAMPLE 220 0C 20H ORIGINAL SURFACE FRACTION OF RETAINED
AUSTENITE 46
FIGURE 82. XRD ANALYSIS CFB SAMPLE 220 0C 114H ORIGINAL SURFACE FRACTION OF RETAINED
AUSTENITE 47

List of tables
TABLE 1. CHEMICAL COMPOSITION OF THE CFB STEEL STUDIED IN THIS RESEARCH.......................................................................... 16 TABLE 2. AUSTEMPERING TEMPERATURE AND TIME DURATION FOR THREE TYPES OF CFB STEEL......................................................... 16 TABLE 3. TEST PARAMETERS FOR PIN ON DISK TEST................................................................................................................. 18 TABLE 4. THE AMOUNT OF RETAINED AUSTENITE ON CFB 114H SAMPLE WORN SURF FOR DIFFERENT LOAD CONDITIONS ......................... 47 TABLE 5. THE AMOUNT OF RETAINED AUSTENITE ON CFB 20H SAMPLE WORN SURF FOR DIFFERENT LOAD CONDITIONS ........................... 47 TABLE 6. THE XRD TEST CONDITIONS AND PARAMETERS CONSIDERED FOR MEASUREMENTS .......................................... 56

Table of Contents Sliding Wear Behavior of Self-mated Carbide-free Bainitic Steels . Error! Bookmark
not defined.
1 Introduction ........................................................................................................ 1
.11 Phase diagram and phase transformation ...................................................... 1
1.1.1 Ferrite formation ...................................................................................... 2
1.2. A eutectoid steel TTT diagram. .................................................................... 4
1.3. Bainite in steels ........................................................................................... 7
1.1.2 Theorems of bainitic transformation ......................................................... 9
1.1.3 Carbide free baintic steels ........................................................................ 9
1.1.4 Low and medium carbon bainitic steels .................................................... 9
1.1.5 High carbon bainitic steels ..................................................................... 10
1.1.6 Low temperature bainite ......................................................................... 11
1.1.7 Acceleration of bainitic transformation................................................... 12
1.4. Tribological behavior of the CFB steel ...................................................... 12
1.5. Research gaps............................................................................................ 14
2 Aim and Objectives ........................................................................................... 15
2.1. Limitations ................................................................................................. 15
3 Experimental materials ..................................................................................... 16
3.1. Heat treatment ........................................................................................... 16
3.2. Sample surface preparation ....................................................................... 17
3.3. Pin-on-disc tribometer instrument ............................................................. 17
3.4. X-Ray Diffraction (XRD) ........................................................................... 18
3.5. Scanning Electron Microscopy (SEM)/ Energy Dispersive Spectroscopy
(EDS) 19
3.6. 3D optical profilometry ............................................................................. 20
4 Summary of results ........................................................................................... 21
4.1. Hardness measurements ............................................................................ 22
4.2. Pin on Disk test results .............................................................................. 24
4.3. Post test analysis of worn surfaces ............................................................ 30
4.3.1 Formation of oxide layers ....................................................................... 36
4.4. Profilometry .............................................................................................. 37
4.5. XRD analysis ............................................................................................. 45
5 Conclusions ....................................................................................................... 49
6 Future work ...................................................................................................... 50
7 References ......................................................................................................... 51
Appendix 1 ............................................................................................................ 56

1
1 Introduction Regarding new demands for advanced materials in various industrial applications and unique
properties of steels, more and more research is conducted to design and develop new
microstructures with a variety of improved properties. Bainitic microstructure has become the main
interest for both scientific and industrial studies in steel research particularly in recent decades [1-
6].
Bainitic transformation is incomplete from the aspect of thermodynamic and energy which leads to
the formation of some retained austenite in the microstructure at various temperatures. Bainitic
transformation includes displacive features like surface relief similar to the martensitic
transformation. On the other hand, unlike the martensitic transformation, diffusional features like
diffusion of carbon has been reported as well.
Earlier works on bainite steel suggest the diffusional transformation mode and other works in
return, support displacive transformation mode [7]. Apart from such controversy, further studies
and theorems have helped to bring about new insight in low temperature decomposition of austenite
and acceleration of the bainitic transformation.
Nanostructured carbide-free bainitic (CFB) steel is an outstanding achievement in steel
manufacturing with the aim of reaching to ultra-high mechanical properties. In recent decades,
numerous research was conducted to improve such microstructure which is applicable for various
industrial applications [8].
Nanostructured CFB steels show excellent properties such as strength, toughness and wear
resistance. Hence, more and more efforts have been focused on detailed studies of CFB steels as
potential alternative to conventional steels in various industrial applications such as rail steels,
bearing, mixing machines and etc. Quench and tempered steels is the most common type of steel
which is used in manufacturing of rolling element bearings and gears.
For many years, pearlitic steels have been employed to produce rail steels. Studies have
demonstrated that bainitic steels can outperform pearlitic railsteels in terms of wear resistance apart
from resistance to plastic flow. Furthermore, rolling contact fatigue (RCF) is considered as one of
the main failure mechanisms in rolling element bearings and rail steels. Results of recent research
showed that nanostructured CFB steels show better resistance to RCF compared to quenched and
tempered martensitic steels [9-11].
With proper combination of alloy design and heat treatment, nanocrystalline structure in CFB steels
can be obtained. Although considerable effort was made to study nanostructured CFB steels in
detail, little attention is given to tribological properties of nanostructured CFB steels.
The tribological properties of nanostructured CFB steels are yet to be studied in more detail which
will bring new fields of applications for such unique CFB microstructures. Thus, the aim of this
work is to have a more detailed study on wear behavior of nanostructured CFB steel under sliding
wear condition as a function of various parameters such as load, speed and temperature. Such
strategy would provide more detailed information on wear behavior of the nanostructured CFB
under different tribo condition and will accelerate demand from industrial units.
1.1. Phase diagram and phase transformation
The equilibrium Fe-C phase diagram illustrates phase fields that involve Carbides and solid
solutions of the iron allotropes. The most important of these carbides is Fe3C, which is called
cementite. The iron-carbon, metastable phase diagram shown in Figure 1.

2
Alpha ferrite is the BCC solid solution of carbon in iron that exists in the low temperature range;
austenite is the FCC solid solution, cementite is the carbide and delta ferrite is the BCC solid
solution that can exist at high temperatures. When the term ferrite is used alone, it refers to low
temperature phase otherwise the ferrite is identified as delta. Many of the microstructures that can
be produced in steels, depend on the fact that when austenite is cooled it can become supersaturated
and therefore, it would undergo phase transformations to reach equilibrium.
Figure 1. Iron-Carbon Phase diagram [12]
1.2. Ferrite formation
An important phase transformation in pure iron and its solid solutions is transformation between the
BCC and FCC phases that occurs when the temperature is about 910 ºC. When the cooling rates are
low (order of a few degrees per second), the temperature of the iron falls below 910 ºC and the iron
becomes super cooled. Then BCC crystals nucleate and grow when cooling is sufficient to provide
the required driving force.
For small cooling rates, the degree of cooling gained at the beginning of transformation is small
and the total transformation is completed at high temperatures by diffusion-controlled nucleation
and growth processes that produce an equiaxed array of grains [13]. The degree of cooling at the
beginning of transformation, increases initially as the rate at which the FCC iron is cooled, is
increased. But, then it remains constant at a constant value. At the same time, the intercrystallite
boundaries of the BCC phase become blocky and the composition remains uniform. These are
characteristics of the massive transformation and the BCC phase is called massive ferrite. Such
behavior has been observed to occur in iron with a few parts per million of dissolved carbon and
also in iron containing 0.01 wt. % carbon [13]. A variety of ferrite phase at different point in phase
diagram is shown in Figure 2.

3
Figure 2. Illustration of ferrite phase at different points in phase diagram [14]
Later, the massive ferrite state begins near 800 ºC at a cooling rate of several thousand degrees
Celsius per second. The actual temperature of the state varies with the grain size of the FCC phase.
At higher cooling rates, another state is observed at a lower temperature that the one described
previously. At this state, the ferrite begins to form as acicular plates which emerge from original
grain boundary positions and also form within grains. Such a morphology is usually called
Widmanstatten [12 &14].
It has been reported that, yet another state occurs in the material at higher rates of cooling. At this
state, the transformation is again FCC to BCC, but the product consists of twinned plates. The
diffusioless processes by which these transformations are produced are called martensitic which is
the general name given to a transformation that produces a change in crystal structure in a
displacive manner and does not require diffusion [12].

4
1.3. A eutectoid steel TTT diagram.
A typical TTT diagram for a eutectoid plain carbon steel is shown in Figure 3. A horizontal line
marks the Ms temperature which is the temperature at which martensite begins to form during
cooling. The diffusion-controlled transformations that occur above this line are described by a pair
of "C" shaped lines that mark the beginning and end of the transformations. The products of the
transformations are ferrite and cementite. Usually these curved lines present above the Ms line are
not projected below it [12]. However, it should be noted that unless the Ms temperature is so low
that diffusion is suppressed, ferrite and cementite can still form below the MS temperature from the
untransformed austenite. Because the martensitic transformation in plain carbon steels is
independent of temperature and heat, the martensite forms during the cooling process and the
amount that forms depends on the temperature to which the sample is cooled [12].
Inspection of this diagram reveals that at small degrees of cooling below the eutectoid isotherm
line, the transformation takes a long time to begin. As the degree of cooling is increased, the
incubation time decreases quickly even though the transformation is occurring at lower
temperatures where diffusion is less quick. Eventually, the incubation time reaches a minimum, tm
and then begins to increase again. The part of the “C” curves at this minimum incubation time is
called the nose of the TTT diagram. The product of the transformation at temperatures above the
nose is pearlite. Bainite is formed below the nose and mixtures of both microstructures are formed
at the nose.
Figure 3. illustration of typical steel TTT diagram [12]
1.3.1 Bainite and Martensite
Regarding TTT diagram for a eutectoid steel as extends from the nose to the eutectoid isotherm
line, the product of isothermal transformations is pearlite. Another type of microstructure is formed
during isothermal transformations below the nose. In this temperature range, the lamellar product is
replaced by mixtures of discrete particles of cementite in ferrite. Details of such microstructures
vary with the temperature and from one steel to another one. Literally, the product formed near the
nose is called upper bainite and that near the martensitic start temperature is called lower bainite. It

5
is reported that upper bainite looks like feathers in optical micrographs while lower bainite is more
acicular [15].
In upper bainite, the ferrite comprises bundles or sheaves of fine and elongated grains which is
similar to laths. Cementite particles lie on the long boundaries between the individual laths. In
contrast, at lower temperatures the ferrite crystals that form the sheaves appear more like needles
and plates. Particles of cementite form both at the boundaries between the grains and within the
crystals of ferrite as shown in Figure 4 and Figure 5 [15].
Figure 4. Microstructure of upper bainite: a, 0.8C steel transformed 20s at 400 ºC, x670; b, 0.34C steel transformed at 400 ºC. Two surface composite micrograph, x330; c, 0.8C steel
transformed at 450 ºC. Dislocations visible. Thin foil EM; d, 0.8C steel transformed 5s at
450 C. Thin foil EM [15]
Figure 5. Microstructure of lower bainite a, 0.8C steel transformed 30s at 300 ºC, x260; b, 0.8C steel

6
transfromed at 300 ºC. Two surface composite micrograph, x260; c, 0.8C steel transformed 6 min at 250 ºC. Thin-foil EM; d, 0.6C steel tranformed at 300 ºC. Thin-foil EM. [15]
As the temperature of the quenching austenite falls below the Ms temperature, a transformation of
structure starts to occur while the temperature is falling. This implies the beginning of martensitic
transformation. A martensitic transformation can be defined as a mechanism for changing
crystallographic structure that does not require atomic diffusion. In most steels, this transformation
occurs very quickly during quenching. The fraction transformed depends on the temperature that
the sample is cooled to and not on time kept at that temperature. Transformation occurs by means
of a displacive transformation which it is possible to displace the atoms from FCC positions to
BCC positions [15].
The displacements associated with the transformation in iron are illustrated in Figure 6 to Figure 9
where the Bain strain is demonstrated. This is a strain proposed to describe the distortion of a
tetragonal cell in the FCC crystal into the BCC of the martensite [16]. Although Martensite
contains numerous defects such as dislocations and boundaries, it is the stable phase in pure iron.
Since the carbon content is unchanged during the martensite formation in a plain carbon steel, the
phase is metastable and is a supersaturated solid solution if its carbon content exceeds the solubility
in ferrite. Moreover, Bain strain sketches show that the carbon atoms that were randomly
distributed in the octahedral sites of the austenite, now occupy a site within the martensite. When
the carbon content exceeds about 0.2 wt.% the carbon atoms produce a significant tetragonal
distortion so that the structure becomes BCT. The c/a ratio of the tetragonal unit cell increases as
the carbon content increases [15].
Figure 6. Probable position of Carbon atom within
BCC iron crystal. [17]
Figure 7. The corellation between Carbon content
and ratio of crystal structue dimensions. [18]
7
Figure 8. In the above image, there are two FCC adjacent unit cells, with a lattice parameter ag. A
BCT cell is obtained by connecting the 8 FCC sites.
This cell has sides a and a / 2. Imagine that the BCT cell is removed and distorted so that its sides
all become a . In the below image, this is the case,
with a=c. [18]
Figure 9. Martensitic transformation plain illustration shown combined with c/a ratio and
Martensite transformation temp as function of
Carbon content. [18]
1.4. Bainite in steels
Davenport and Bain found a new microstructure that contained acicular, dark etching aggregate in
1930’s as shown in Figure 10. Primary results showed that the new microstructure was not similar
to Pearlite or Martensite when the steel was heat treated isothermally at temperatures above
martensite and below that at which pearlite formation line [7-19-20]. It was reported that the new
microstructure had higher toughness for the same hardness compared to tempered martensite [21].
Figure 10. Microstructures in a eutectoid steel: (a) Pearlite (b) UpperBainite (c) Lower Bainite (d)
Martensite [21]
Bainite steel forms at temperature ranges of 250–550°C [15] where alloying, as expected, would
affect such temperature range as well. The bainitic microstructures are presented by ‘C–curve’ on

8
TTT diagrams. Figure 11 shows a typical TTT diagram of carbon steel with various phases as a
function of cooling rate.
Figure 11. TTT example for bainitic steel formation [15]
Austenite transformation to new compositions that form below the temperature of reconstructive
transformations are known as Widmanstatten ferrite, bainite and martensite and regarded as
displacive products [7]. The bainite is formed at temperatures lower than the temperature at which
Widmanstatten ferrite forms. High dislocation concentration ferrite in bainite makes it harder than
usual ferrites. According to the location of carbides in ferrite matrix, bainite is classified as upper
and lower bainite as shown in Figure 12.
Figure 12. Carbon partitioning and percipitation in upper and lower bainite [22]
In upper bainite, carbides precipitate from residual austenite while upper bainitic ferrite is free from
precipitation [23]. Research suggest that lower bainitic cementite nucleates and grows within
supersaturated ferrite in a process which is similar to martensite tempering [6]. In such
microstructures, bainitic ferrite laths are separated by thin films of stable retained austenite [24].
Reducing transformation temperature, fractions of carbon precipitates within the ferrite plates as
cementite which leads to lower-bainite structure. Carbide particles precipitate in a single
crystallographic orientation with plain inclination of 55 - 60o with respect to plate axis [23]. If
carbide precipitation is retained by proper alloying, remained Carbon may diffuse into the retained
austenite so final product of bainite will be stronger and stable [25].

9
The transition from upper to lower bainite depends on correlation between the time it takes for
carbon to partition compared to the time takes for carbides to precipitate within the ferrite [26]. As
it is expected in general, lower bainite is more likely to form in high carbon alloys, and upper
bainite more likely in lower carbon alloys. Higher carbon contents mean more carbon to precipitate
in addition to transformation delay to lower temperatures in continuously cooled samples.
1.4.1 Theorems of bainitic transformation
There are two different theories expressing the bainitic transformation namely diffusive theory and
displacive theory. Regarding the diffusive theory, bainite both nucleate and grow through
constructive mechanism. The growth rate is greater in the edgewise direction. Lengthening of
subunits dominates over thickening which leads to formation and propagation of ledges. Cementite
and ferrite grow simultaneously and cooperatively [27]. The quantitative diffusive theory is capable
of growth limits calculations for both Widmanstatten ferrite and bainitic ferrite and additionally, it
can also predict the growth kinetics of bainite [28-29].
Displacive theory explains that a sub-unit of bainitic ferrite nucleates with carbon partitioning and
grows displacively until growth is restricted by plastic relaxation in adjacent austenite. Carbon is
then rejected from the supersaturated ferrite by diffusion and precipitation into the austenite and
may also precipitate within the subunit. New subunits nucleate and grow on the tips of old subunits.
The displacive theory explains why it is possible in high carbon steels to avoid the formation of
upper bainite and in low carbon steels to avoid forming lower bainite [22]. It is also possible to
predict the shapes of TTT and CCT curves with reasonable accuracy [30]. It has been used to
design many new bainitic alloys [31-34]. It accounts for a lack of partitioning of substitutional
solutes and implies why Widmanstatten ferrite does not always form in steels [35].
1.4.2 Carbide free baintic steels
The performance of the bainitic steels produced through initial attempts was not as good as the
conventional steels particularly for railway applications [36]. Such limitations resulted in
development of carbide-free bainitic steels (CFB) consisting of bainitic ferrite and retained
austenite. The main difficulty with the effort for CFB steels is the formation of blocky austenite due
to the addition of certain alloying elements such as Silicon and Aluminum to suppress the
cementite precipitation.
These blocky austenitic regions would later transform to martensite either naturally or under stress.
By alloying in an appropriate way, it was possible to make the bainite reaction to go further to
completion and result would be blocky retained austenite elimination. CFB steels produced by this
method appeared to be superior to pearlitic rail in terms of of wear resistance and rolling contact
fatigue life.
1.4.3 Low and medium carbon bainitic steels
Bhadeshia showed that in the low carbon bainitic steels (<0.2wt% C), ferrite in the microstructure
limits the strength and low volume fraction of austenite (<20 vol%) limits the toughness [3]. Yang
& Bhadeshia later explored the possibility of producing bainite at low temperatures by suppressing
the transformation using substitutional solutes instead of using large carbon concentrations to
improve the final microstructure properties [4]. Results revealed that although transformation
temperatures can be suppressed in such way, yet, the difference between the bainite and martensite
10
start temperatures diminishes. Such condition, in addition to relatively low carbon concentration of
the steels, assists the coarsening of the microstructure and might have negative effect on the final
properties of the steel.
Lambers et al. studied the time-temperature path effect on isothermal austenite to bainite phase
transformation of a medium carbon-low alloy steel [37]. It was found that an incomplete initial
austenitizaion leaves undissolved carbides in the matrix. Thus, the matrix with lower carbon and
chromium content eventually accelerate the phase transformation. Moreover, additional nucleation
sites for Bainite plates is created by residual carbides leading to further acceleration of the process.
Caballero et al. by means of a theoretical design procedure based on phase transformation theory,
designed four CFB steels with 0.3 wt.% carbon content and manufactured them through a thermo-
mechanical treatment consisting of hot rolling and two-step cooling [38]. Such steels, with a
microstructure consisting of a mixture of bainitic ferrite and retained austenite achieved high
strength and toughness for bainitic steels but, due to welding problems, a reduction in the average
bainite carbon content was recommended.
Later, Caballero et al. investigated the influence of bainite morphology on the impact toughness
behaviour of a continuously cooled cementite free low carbon C-Mn-B type steel [39]. Results
showed that bainitic microstructures formed mainly by lath-like upper bainite, shows higher impact
toughness values than those with a granular bainite morphology.
In another work, Lihe Qian et al. studied low alloy steel for producing low carbon CFB
microstructure by addition of aluminum and silicon of alloying elements [40]. Research focused on
influence of heat treatment process on microstructure, impact toughness and tensile properties. It
was revealed that the addition of aluminum and silicon plays an effective role in suppressing the
precipitation of cementite.
1.4.4 High carbon bainitic steels
Recently, high carbon-silicon steels with interesting properties have been developed by several
researchers [41-43] in which the bainitic microstructure can form at lower temperature due to the
steel chemistry. The austenite retention even at room temperature can also have effect on the
mechanical properties, which depends on the amount and morphology of the retained austenite
[41]. Fine bainitic ferrite plates results in their contribution to hardness and strength of the steel [36
& 44].
Microstructure refinement by transformation creates barriers to dislocation movement but does not
necessarily lead to a reduction in toughness [45]. Such method is also appropriate for large sections
compared to classic deformation method for defect creation.
Silicon is a ferrite stabilizer and known to prevent the formation of brittle carbides during the
bainite transformation [46 & 47]. Suppression of coarse carbides in the microstructure by adding
silicon that limits the toughness is beneficial. Thus, such microstructures consist of plates of
bainitic ferrite in a matrix of carbon enriched retained austenite were developed.
Brown & Baxter studied isothermal transformation characteristics of three high carbon, high
silicon bainitic steels at 200-250°C [48]. Studies revealed that each steel exhibited a new
strengthening mechanism called isothermal hardening, displaying maximum hardness values of 590
– 670 HV where the extent of isothermal hardening depends on transformation temperature and
time duration that material kept at desired temperature. Each steel final microstructure was mainly
carbide free and contained high proportion of ultra-fine, interstitially hardened bainite plates
separated by fine layer of retained austenite.

11
It was concluded that the tensile properties of such alloy, which contained ~95% iron, were
comparable to those of the stronger maraging steels which have much higher alloy content. After
isothermal transformation at 200°C for two weeks, these steels exhibited a compressive yield
strength of 2400 MPa and compressive strength of 3700 – 4000 MPa after a compressive strain of
~50%.
1.4.5 Low temperature bainite
Caballero et al. showed that it was possible to produce bainite by heat treatment at temperatures as
low as 125°C in a high carbon-silicon steel. Such treatment method resulted in super refinement of
the microstructure, which led to a strength in excess of 2500 MPa and an ability to flow plastically
prior to fracture [49].
Later, Garcia–Mateo et al. showed that bainite can be obtained by isothermal transformation at very
low temperature. They obtained bainite by isothermal transformation at 400 K with longer
processing time [50]. The transformation resulted in extremely thin platelets of bainite with a
hardness greater than 600 HV.
Similarly, Garcia-Mateo et al. reported a bainitic structure which formed at low temperature in
high silicon-carbon steels with tensile strength up to 2500 MPa and a fracture toughness up to 28
MPa·m1/2 [51]. Such mechanical properties are a result of a highly refined bainitic microstructure,
due to transformation from austenite at temperatures of around 200 0C as shown in Figure 13.
Ferrite plates are reported to have widths of 20 nm compared to the usual width of 0.2 to 0.5 μm.
The main point to notice is by maximizing the ferrite volume fraction and transformation at
reduced temperatures, large regions of ‘blocky’ retained austenite which would limit the toughness
no longer existed.
Figure 13. TEM micrograph of nevel bainitic transformed at 200 C for 5 days [52,53]
The microstructure is similar to wedge shaped sheaves of bainite and small blocks of residual
austenite, as shown in Figure 14. Transformation at low temperature results in high volume fraction
of ferrite and leading to high strength by introducing defects in the microstructure. High amounts of
carbon super saturation in the ferrite is achieved after transformation which originates from
considerable dislocation density in the bainitic ferrite.

12
Figure 14. Optical microstructure of novel bainitic steel transformed at 200 C [54]
1.4.6 Acceleration of bainitic transformation
Certain techniques have been developed to accelerate the bainitic transformation in steels [4].
Anything which improves the nucleation rate, will accelerate transformation where one common
method is refining the austenite grain size. Another technique is to increase the magnitude of the
free energy change assisting the austenite transformation. Reducing elements such as manganese or
carbon, or addition of cobalt or aluminum have been recommended for such purpose and
experimentally were proved by Garcia-Mateo et al. for high carbon bainitic steels [52].
1.5. Tribological behavior of the CFB steel
Rolling-sliding wear behaviour of CFB steels has attracted considerable interests as a potential
alternative to conventional pearlitic microstructure currently in use as rail steels. The most
important thing to note in history and application of bainite steels for railway applications
according to the author’s background in railway engineering is the operation condition. Apart from
the passenger transportation intentions, a vital problem with current pearlitic rails lies within the
demand for higher speed and increased axle load.
Considering the current circumstances, pearlite microstructure has encountered two major
challenges. Firstly, it is the matter of microstructure resistance against sliding forces both on
straight and curved tracks. On straight paths, the challenges are related to material resistance
against surface plasticity and surface flow at which such condition would determine the initiation of
surface or sub-surface damage. Consequently, such tribological operation condition results in
damage mechanism bifurcation which is either rail failure (fracture is not the concern at this step)
due to high/low cycle fatigue. This is rather controversial that in such circumstances, pearlitic
microstructure should withstand both types of damage. The idea of Bainite rails particularly for
railway (freight and cargo transportation) applications was based on the fact that, rail should not
experience too much surface and sub-surface deformations so plastic flow or wide surface pittings
and other common surface-initiated damages would be avoided (apart from issues with wear at rail
side). Nevertheless, the main problem with bainite microstructure regarding different alloying and
later attempts made to improve such microstructure for rail steel applications till recent years, was
weldability and resistance against high sliding forces. Although, bainitic steel showed surpassing
behavior regarding toughness and resistance against plasticity and material flow [55]. Hence, the
key focus regarding the available literature and experiences was oriented into microstructure

13
improvement with the aim of eliminating high wear rate in pearlitic rails [55,56]. But in practice,
most often, only vehicle speed or axle load is of importance. In another word, rail microstructure-
geometry optimizations are done within multi-steps process. On the other hand, in curved tracks,
where wheel flange and rail side are in contact, the kinematics of the wheel-rail is pure sliding
particularly at sharp curves. So, in this case, the issue lies within microstructure resistance against
pure sliding (if wheel-rail geometry is compatible). Thus, several pearlitic rail steel grades have
been developed and currently in use for different purposes. However, for cargo and freight
transportation applications, such microstructure has shown poor behavior due to high axle loads
and poor steer ability of the bogie vehicles [55].
Secondly, pearlite rail fracture and brittle behavior under different loading condition and the
existence of the Carbides which would accelerate the rail fracture were the key concerns [55]. So
new trends on CFB steels particularly nano-structured bainite for railway applications is to improve
its toughness and resistance against plastic flow (significant improvements already made) in
addition to wear resistance so it would become an ideal alternate to current pearlitic rail steels. For
more information on the history and applications of bainite rail steels in addition to common
pearlitic surface-subsurface damages and competitive behavior of the wear-RCF damages in
pearlitic-Bainitic rails which motivates for further research on CFB steels, the works by Lewis et al.
[55], iwnicki et Al. [56] and Rezvani et al. [57] are recommended.
On the way to improve rail steel tribological and mechanical properties, Clayton et al. conducted
comprehensive study on rolling-sliding wear performance of CFB steels. They found that under
severe rolling-sliding conditions, CFB steels wear performance can compete with Hadfield’s
manganese steel [40]. Additionally, the effect of alloying elements and chemical composition on
wear behaviour of bainitic steels was investigated. Recommendations were made to improve CFB
steel toughness, ductility, fatigue and wear resistance [58]. Clayton et al. also showed the
surpassing sliding wear behavior of CFB steel compared to pearlitic steel [59]. However, there are
some uncertainty on the wear behavior of the bainitic and pearlitic microstructures where some
researches show contradictory results [60, 61].
The abrasive wear of carbide-free bainitic steel under dry rolling/sliding conditions was studied by
Das Bakshi et.al [62]. They investigated nano-structured CFB steels wear resistance for steels
which went under transformation at lower and higher temperatures. Results revealed that those
CFB steels went under transformation at lower temperatures, outperformed those went under
transformations at higher temperatures.
Results implied the fact that under the conditions studied, sliding wear is not dominant damage
mechanism, so that the maximum shear stresses during contact are generated below the contact
surface and the hardness following testing would reach maximum value below the contact surface.
It was also shown that volume fraction, stability and morphology of retained austenite plays a
significant role during wear, by surface work-hardening through phase transformation into
martensite.
In another work, Long et al. conducted research on the relationship between the bainitic
microstructure and wear resistance of Carbide-free and carbide-bearing bainitic steels [63]. The
carbide-free bainite showed higher strength and toughness than carbide-bearing bainite. Wear
studies revealed that at lower loads, carbide-bearing lower bainite exhibits higher wear resistance
while, at higher loads, carbide-free lower bainite exhibits higher wear resistance. It was argued that
such behavior originated from the improved surface hardness due to strain induced martensitic
transformation from the retained austenite.

14
Leiro et al. studied dry rolling-sliding wear behavior of Si alloyed CFB steel austempered at
various temperatures and sliding distances. The aim was to study the wear performance of the
60SiCr7 steel with a carbide-free microstructure containing different amounts of retained austenite
[64]. Results indicated that the material with highest hardness (the one austempered at 250 ºC)
showed the lowest wear rate in every case. It was also observed that the hardness increment and
thickness of the hardened layer increases with increasing the austempering temperature and number
of test cycles. The higher wear resistance performance of the sample austempered at 250 ºC has
been attributed to its superior mechanical properties provided by its finer microstructure. But no
retained austenite could be detected through studies after tests.
Shipway et al. investigated austempering temperature effects on sliding wear resistance of bainite
from single alloy and compared the results with quenched, quenched and tempered (QT) and
normalized steels. Their findings led to the fact that bainitic steel transformation at lower
temperatures would improve wear resistance [65]. They reported that the main factors leading to
excellent wear resistance were fine grain size, high hardness and toughness in addition to resistance
to plastic deformation. Literally, based on the past research, one can conclude that retained
austenite in bainitic steel with low austempering temperature has more resistance to transform into
brittle martensite under shear stress during sliding. Thus, the result would be less wear debris
formation in addition to thinner subsurface deformation layer due to the higher hardness. On the
other hand, for bainitic steel transformed at high austempering temperature, the retained austenite
size is larger and may transform into large blocks of brittle martensite and consequently is
vulnerable to plastic deformations [65].
1.6. research gaps
Following the available literature, numerous works mainly focused on study of CFB transformation
from the aspect of heat treatment and material structure. Research in recent decades have revealed
some aspects of CFB formation at temperatures in which lower bainite microstructure forms and its
superior mechanical properties compared to conventional pearlitic steels and CFB steels which
forms at temperatures in which higher temperature bainite forms.
Additionally, there were numerous works on phase transformation mechanisms in which the
cementite can precipitate and diffuses into the retained austenite which further affects the final
mechanical properties of the CFB. However, very little attention has been given to tribological
studies of such microstructures. More thorough studies are required to study the material behavior
under different tribological conditions such as speed, load and temperature where it would provide
valuable information on further development of such advanced steels for various industrial
applications. Hence, there is a need to study wear behavior of nano-structured CFB steels where
wear mechanisms and phase transformations on the worn surfaces are of high importance. The
influence of retained austenite on wear resistance has not yet been fully comprehended. Literally, it
is often postulated that due to higher toughness of the austenite phase, the wear resistance would
increase as the austenite content increases while the effects of tribological operation condition are
usually not considered.
It is vital to note that, there have been some reports on the transformation of the blocky austenite
into martensite, yet more thorough analysis is required to fully comprehend the stability of the
ferrite-austenite phases and their transformation in to martensite due to mechanical stresses and
plastic-large deformations. Additionally, the contribution of such transformations to the overall
material sliding wear resistance are also to be studied in more detail.
15
2 Aim and Objectives In this research the target was to study the tribo behavior of self-mated CFB steels heat treated at
temperatures in which lower temperature bainite forms. Within this research, apart from the wear
mechanisms and surface characterization such as crystallographic analysis, more attention was
given to study of the retained austenite and their transformation into martensite. Additionally,
micro-Nano structure properties of the CFB steels were studied in more detail. The summary of this
research objectives is expressed below:
❖ Study of the dry sliding wear behavior of CFB microstructure under different tribological
parameters such as load, speed and temperature and measurement of wear rate and friction
coefficient.
❖ Characterization of the worn surfaces of the retained austenite and formation of martensitic
phases and their influence on overall wear behavior.
2.1. Limitations
The wear itself is a random phenomenon in nature where the dominant parameters in material
removal are measured and treated as statistical data. Hence, there are some uncertainties and errors
during measurements (mainly originates from the techniques/devices acquired to study wear
phenomenon) and as a result, during the calculations. The key limitations within this study are
summarized below.
❖ During the pin on disc test, the linear velocity is not constant over the whole contact area of pin
specimens. Literally, the linear velocity reported from experiments refers to speed at the center
of pin specimens and the difference between the pin center and edges are ignored.
❖ Another important thing regarding pin on disk test is that the pin slides over the counter
surfaces at various radiuses with respect to center of the disk. The consequence for such
kinematics is that at larger distances from counter surface center, the number of times that each
point on the counter surfaces meets pin surface would decreases which will affect the final
results.
❖ Additionally, it is not possible to measure the contact temperature at the contact point.
According to current available techniques, the temperatures measured for post analysis, would
approximate the real temperature at the contact point.

16
3 Experimental materials Spring steel was used to produce pin and disc specimens and the chemical composition of this steel
is presented in Table 1. As it can be seen in Table 1, the Si content was 2.5 wt% in the steel.
Addition of silicon retards nucleation and growth of carbide and gives rise to magnetic properties
of the final steel. Moreover, Mn and Cr prevents the formation of other phases existing prior to
bainite formation.
Table 1. Chemical composition of the CFB steel studied in this research
Steel Type Designation C Si Mn Cr Mo
CFB 1C-2.5Si 1 2.5 0.75 1 0.03
3.1. Heat treatment
Heat treatment process of bainitic steels contains the following stages:
➢ Austenitizing
➢ Austempering
A schematic illustration of bainite heat treatment process is shown in Figure 15.
Figure 15. Schematic view of heat treatment for the CFB samples including austenization and
austempering
In the first step, samples were heated into the austenite region. Thus, the samples were held at
temperature of 9500C in a furnace for 30 minutes. Austenitization was followed by austempering
which consists of rapid cooling to the desired bainitic transformation temperature and keeping the
temperature constant for a desired amount of time through salt bath. Samples were subjected to
three different austempering temperatures as shown in Table 2.
Table 2. Austempering temperature and time duration for three types of CFB steel
Austempering temperature (0C) Time duration (h)
220 20
220 114
300 5

17
3.2. Sample surface preparation
Sample preparation for microstructure studies was performed by manually grinding the test samples
step by step from grit #240 to #1200 abrasive paper, followed by polishing in steps with 9, 6, 3, 1
and 0.25 µm diamond paste and master polishing as the final step. This careful sample preparation
procedure was performed to avoid influence from the wear caused by the grinding and polishing, in
form of phase transformation of austenite to martensite in the surface layer of the samples.
3.3. Pin-on-disc tribometer instrument
In this machine, a stationary pin test specimen is loaded against a rotating disk specimen using dead
weight loading system. The friction force is measured by a load cell. Test parameters such as load,
rotational speed, duration and temperature are controlled, monitored and recorded in real time.
Figure 16 and Figure 17 show a view of test equipment and samples used for this study where the
test parameters are presented in Table 3. In total, 12 test scenarios were considered for tribolical
tests in this study. Following the tribo tests, specific wear rate was calculated according to the
following equation 1:
(m) Distance Sliding (N)
)3
(mm Loss
Load
VolumeSWR
(1)
The load and test parameters were chosen in a way to analyze material behavior in area of
plasticity-deformation domain where adhesive-oxidative wear mechanisms would be dominant.
According to Figure 18, by significantly increasing sliding speed-load, there is a possibility that
transition to severe oxidation and seizure wear regions would be dominant. Severe oxidation occurs
either at high sliding speeds or elevated temperatures while seizure occurs at very high contact
pressures with certain applications which are out of the topic in this research.
Figure 16. Pin on Disk tribometer instrument
used in this study
Figure 17. A view of pin and disk samples geometry
and dimensions

18
Figure 18. Demonstration of the load-speed parameter chosen for this study and their speculated resultant
wear mechanism on steel wear map [66]
Table 3. Test parameters for pin on disk test
Test parameter Values
Load (N) 7.5 75.7
Contact pressure (MPa) 0.62 6
Wear track radius (mm) 12.5 25
Sliding distance (m) 4000
Shaft rotational speed (RPM) 191
Sliding speed (m.s-1) 0.25 0.5
Time duration (s) 8000 16000
3.4. X-Ray Diffraction (XRD)
XRD as shown in Figure 19 is a technique used for determination of atomic and molecular structure
of a crystal, in which the crystalline atoms cause a beam of incident X-rays to diffract into many
specific directions. By measuring the angles and intensities of these diffracted beams, a
crystallographer can produce a three-dimensional picture of the density of electrons within the
crystal. From this electron density, the mean positions of the atoms in the crystal can be
determined, as well as their chemical bonds, their disorder, and various other information. Siemens
D5000 XRD equipment has been used for the room temperature XRD measurements where the
exact values for radiation and other test conditions are provided in Appendix 1.

19
Figure 19. A view of XRD instrument used in this study
3.5. Scanning Electron Microscopy (SEM)/ Energy Dispersive
Spectroscopy (EDS)
The SEM micrographs (JOEL JCM 6000 and XHR-SEM SEM machine) obtained at different
resolutions from back scattered electrons signal analysis and secondary electron emitted from the
electron beam as shown in Figure 20 and Figure 21. SEM analysis results will provide detailed
information on morphology of the original and worn samples for material structure (such as wear
mechanisms, cracks and deformations) in various cross-sections and the distribution of the various
material phases. EDS analysis will be done using the same machine to the worn surface to gain
more information on elemental composition of layers formed on the surface after the tribological
pin-on-disc test.
Figure 20. A view of SEM instrument used in this
study
Figure 21. A view of SEM instrument used in this
study

20
3.6. 3D optical profilometry
Initial and final surface roughness values as well as residual scratch depths was determined by
means of WYKO 1100 NT optical surface profilometer as shown in Figure 22. Data would be used
for further detailed analysis of worn surfaces and contribution of various wear mechanisms on final
worn surface characteristics.
Figure 22. A view of Wyko 1100 NT optical profilometer

21
4 Summary of results The research was carried out in a way that in the first step, tribo testing (pin on disk) was conducted
to measure the material wear loss, coefficient of friction (COF) and contact temperature (CT).
Then, specific wear rates (SWR) results are discussed to have a primary assessment of CFB wear
behavior with various austempering temperature and time duration. In next step, surface
profilometry of worn and unworn surface for pin and disk samples with all test conditions are
carried out to study their surface topography and the geometric properties of the worn surfaces.
This together with SEM/EDS analysis could lead to more insight about the wear mechanisms and
formation of oxide layers in addition to how they would affect the surface topography at different
test conditions. Additionally, to study the effect of retained austenite and its transformation into
martensite on wear resistance of the CFB samples, high resolution SEM study of original surfaces
and XRD studies were conducted for original and worn surfaces.
Eventually, the results are discussed and their contribution to main research question are thoroughly
described. Figure 23 shows the research analysis methodology chart and their outcome results are
presented.
Figure 23. Research methodology chart

22
4.1. Hardness measurements
In the first step, hardness measurements were conducted to study the effect of austempering
temperature and duration for which the samples are kept at that temperature on material bulk
hardness. Results are shown in Figure 24. One can observe that, by decreasing the austempering
temperature with respect to bainite start temperature, it is possible to achieve to a significant
increase in surface hardness. Results also reveal that austemperting time duration does not affect
the material hardness for the duration studied here.
Figure 24. Hardness measurement of the CFB samples with various heat treatments
By increasing the austempering temperature from 220 to 300 0C, the ferrite and austenite phases
will achieve larger sizes which would affect their mechanical properties. Yet, although the bainite
structure is unstable in nature, the austempering time does not affect the material hardness for the
duration chosen in this study. Thereby, one can conclude that austempering time would affect the
stability of the retained austenite and kinetics of carbon diffusion from supersaturated ferrite to
retained austenite. As the hardness test measures the resistance to plastic deformation, it could be
argued that the difference between the two microstructures lies within the ferrite-retained austenite
size. The two main factors affecting such difference are the stability of the retained austenite (filmy
or blocky structure) and the Carbon concentration of the ferrite surrounding them. This will become
important as due to the TRIP effect, the retained austenite transforms at late stages of deformation
which introduces work hardening. Yet, the surface plasticity resulting from hardness indentation
test also originates from the ferrite crystal movements (softer phase). So, in such analysis, the effect
of both parameters should be considered. In this case, from SEM microstructure analysis as shown
in Figure 25 to Figure 28, it is evident that 220 0C has smaller grains and narrower (needle shape)
retained austenite which would improve the microstructure resistance against plastic deformation.
CFB sample 300 0C as shown in Figure 27 and Figure 28, contains large (blocky) retained austenite
which is less stable.
23
Figure 25. SEM image of CFB sample 220 0C microstructure at 1000x magnification
Figure 26. SEM image of CFB sample 220 0C microstructure at 2500x magnification
Figure 27. SEM image of CFB sample 300 0C microstructure at 1000x magnification

24
Figure 28. SEM image of CFB sample 300 0C microstructure at 2500x magnification
4.2. Pin on Disk test results
The results from the pin on disk tests as a function of contact temperature and coefficient of friction
are presented in Figure 29 and Figure 30. It should be noted that the contact temperature
measurement is smaller than actual values since the thermocouple wire was attached to the pin with
6 mm distance from the flash temperature point at pin-disk contact area.
Figure 29. CT values of CFB samples for different test conditions
25
Figure 30. COF values of CFB samples for different test conditions
Regarding the CT results, at 6 MPa load, by increasing the sliding speed, the CT would increase as
well, which could be explained by the increase in frictional power heat generation further leading to
formation of oxide layers. However, at 0.62 MPa load, by increasing the speed, the contact
temperature would decrease which cannot be explained by frictional power heat generation
theorem. Thereby, other factors must have a vital role at this point. Due to high concentration of
Silicon in CFB samples, it was already argued that there would be a raise in magnetic properties of
the CFB samples. As shown in Figure 31, the literature review suggest that for a variety of steels,
the heat treatment and austenization temperature would highly affect this parameter, so the best
way to control magnetic properties of the samples are through either alloying or use of the available
heat treatment diagrams where the second one is not available. It was further argued that presence
of magnetic field would act as a resistant force against the sliding motion [67] which one can
conclude that such phenomena should have direct effect on friction coefficient as well.

26
Figure 31. Effect of tempering-austenitization temperature on saturation magnetization of steel [68]
Then the measured COF values for different loading condition was studied where the results are
shown in Figure 35. As it can be seen, at high loads, by increasing the speed, a reduction in COF is
observed which is mainly due to formation of oxide layer which stabilizes the COF. Further
profilometry and SEM/EDS and XRD post analysis support such idea. However, at lower loads, by
increasing the speed, there are no visible significant change in COF and the values are mainly
above one which is quite surprising. Again, more attention was given to the effect of material
ferromagnetic properties on friction coefficient although our samples were not under the effect of
direct magnetic field flux. The literature review revealed that the presence of magnetic field or the
ferromagnetic properties of the samples can have adverse effect on friction coefficient and varies as
function of load and speed as shown in Figure 32 to Figure 34.
Figure 32. Effect of load on Iron magnetic properties under the effect of direct magnetic flux [69]

27
Figure 33. Effect of speed on Iron magnetic properties under the effect of direct magnetic flux [69]
Figure 34. Effect of magnetic properties of the iron on COF and surface magnetization [69]
It could be argued that the increase in COF due to ferromagnetic properties of the CFB samples
acts as a force trying to resist the dynamic motion of the surface which is apart from tribo
properties of the surfaces including asperities and deformations. Thus, it is possible to obtain
significantly high COF values. On the other hand, a preliminary study of oxide layer formed on the
worn surfaces was conducted. It was revealed that at low loads, reddish-orange and reddish-brown
oxide forms which are attributed to formation of hematite and mixture of hematite-magnetite
respectively. According to the available literature, hematite has an adverse effect on tribo properties
of the surfaces which would increase wear and COF values as shown in Figure 35.
Figure 35. Effect of various Iron oxide layer on COF and wear behavior of tribo surfaces [70]
At higher loads, the oxide layer formed on the worn surface were mainly magnetite which has
black color and acts at surface stabilizer in wear process if the substrate on which the oxide layer is

28
formed is stable, then it would highly improve the wear behavior. The typical appearance of oxide
layers on the surface at low loads is shown in Figure 36.
Figure 36. Demonstration of hematite oxide layer formation at low loads mainly formed at low
temperatures
The wear behavior of CFB samples under different test conditions for disks and pins are shown in
Figure 37 and Figure 38. According to results for pin SWR, it is seen at 0.62 MPa-0.25 m.s-1, all
materials manifest same wear behavior while at higher speed, CFB sample 114h outperforms other
microstructures. At 6 MPa-0.25 m.s-1 it is seen that CFB sample 114h has the worst performance
and CFB sample 5h outperforms the other microstructures. Nevertheless, at higher speeds, it is seen
that sample 114h outperforms the other microstructures. Results show that austempering time
duration has a considerable effect on the wear behavior of CFB samples.
For disks samples SWR results, there were large variation in results although many repetitions were
conducted. However, CFB sample 114h nearly outperforms other microstructures at higher loads
and speeds, although it shows worse wear behavior compared to other microstructures at lower
loads and speeds. Additionally, CFB sample 5h and 20h show significantly increased SWR values
with increasing speed at low loads while no significant change could be seen for CFB sample 114h.
The reason for such behavior could be attributed to the stability of the retained austenite, grain size
and Carbon concentration of ferrite-austenite where XRD in addition to the results from SEM
microstructure images of the samples would provide more information. According to the results
from disk and pin SWR, it is possible to conclude that the CFB samples 114h and 20h with higher
hardness, showed improved wear behavior compared to CFB sample 5h at higher loads. However,
one cannot conclude that hardness has a positive effect in wear behavior enhancement as the
hardness itself depends on several parameters such as Young’s modulus of elasticity, yield strength,
ultimate tensile strength, work hardening, ductility, etc. Thereby, it seems hardness alone would not
be sufficient to be considered as a measure of material resistance against wear. More knowledge
regarding other material properties such as fracture toughness, transformation induced plasticity,
oxide layer properties and material phases are required to get a more insight into wear behavior of
materials. This will become crucial for cases such as CFB steels where a transformation from
retained austenite to martensite (TRIP effect) could occur which further adds up to material
hardening during large plastic deformation and enhances material fracture toughness at higher
strain rates.
It is to imply that, if the hardness of the CFB samples increases due to heat treatment, it does not
necessarily mean that there would be an improvement in wear resistance or on the other hand,
higher and lower hardness would result in improvement in wear due to trip effect at large
29
deformations. One should note that both the stability of retained austenite as they transform at late
stage of plastic deformation and the ferrite phase as the softer phase which adsorbs the energy flow
in microstructure are important at this point. If the ferrite phase is too hard, there would not be
sufficient deformation to start the retained austenite transformation, then hardness would have
adverse effect on wear behavior. On the other hand, if the ferrite phase is too soft, then although
trip effect might contribute to work hardening during large deformations, yet, the main phase
transformation would have negative effect on wear behavior. Thereby, both hardness and fracture
toughness in addition to stability of layers formed on the surface (oxide, adhered material etc.) are
necessary to explain the material wear behavior in terms of bulk properties.
Figure 37. Pin SWR values of CFB samples for different test conditions
Figure 38. Disk values of CFB samples for different test conditions
30
4.3. Post-test analysis of worn surfaces
The SEM/EDS analysis were conducted for worn surface CFB steel disk samples where the results
are shown in Figure 39 to Figure 48. The evolution of each wear mechanism and formation-growth
of surface layers are illustrated for disk samples. As it can be seen, at low loads (Figure 39(a), Figure
40(a) and Figure 42), the dominant wear mechanism is mild adhesive and mild oxidative wear. On
the other hand, at higher loads (Figure 39(c), Figure 39(b), Figure 40(b), Figure 44, Figure 45 and
Figure 46), the main wear mechanism is adhesive-oxidative wear.
At low load-speed as shown in Figure 39(a), the main interaction between surfaces is asperity
contact and surface deformation. Thereby, a thin smooth oxide layer would start to grow on the
surface while the trace of small debris of material detachment could be seen as well. By increasing
the speed, discrete oxide layer islands have grown larger as shown in Figure 42 yet they do not fully
cover the surface. At higher loads as shown in Figure 39(b), Figure 39(c) and Figure 40(b), the
presence of oxide layer islands is more apparent, and their size have grown larger significantly.
Additionally, traces of micro ploughing could be seen all over the worn surface as well. By
increasing the sliding speed, the oxide layers further grow and attach to each other and there are
fractured small wear debris around them and traces of scratches could be seen as well, which is
typical characteristics of oxidative wear mechanism. As they are brittle, after several loading
cycles, they would begin to crack and fracture, causing small wear debris. Regarding the scratches
and micro ploughings on the surface (Figure 39(b), Figure 43 and Figure 44), it should be mentioned
that at lower loads, there are discrete traces of scratches on the surface. This indicates that material
transfer has occurred and the reason that such scratches are not originated from abrasive wear is the
smooth edge of grooves on the surface which implies that transferred material has penetrated the
counter surface and plastic deformation because of sliding motion has resulted in the formation of
such grooves. On the contrary, at low loads, the grooves are formed with smaller length where
discrete small grooves are visible in SEM micrographs which indicates adhesion and material
transfer. As the load increases, the depth and length of grooves would increase as well. At lower
speeds, adhesive wear mechanism prevails although oxide layers begin to form and grow as well.
At higher speeds and higher loads, the oxide layers further grow and start to fully cover the worn
surface, thereby, oxidation wear mechanism prevails. Regarding shallow grooves which are visible
on the wear track as shown in Figure 43 and Figure 45 they are generally formed due to successive
passage of asperities or transferred layer over the counter surface in addition to machining and
surface polishing where the width of grooves could describe the surface topography features of the
asperities. Regarding the edges with respect to micro ploughing and the work by Hokkirigawa and
Kato [72], the degree of penetration was low, and edges are smooth which refers to micro
ploughing wear. EDS analysis of worn surfaces further proves this idea where the detection of
Oxygen and other oxide elements could give information on chemical composition of layers
formed on the surface as shown in Figure 47 and Figure 48.

31
Figure 39. SEM image of demonstration of CFB steel Disk austempered at 220 0C wear mechanism for
three test condition: 0.25 m.s-1-0.6 MPa (a), 0.25 m.s-1-6MPa (b), 0.5 m.s-1-6MPa(c)
Figure 40. SEM image of demonstration of CFB steel disk austempered at 300 0C wear mechanism for
three test condition: 0.25 m.s-1-0.6 MPa (a), 0.25 m.s-1-6MPa(b)
Figure 41. SEM image of worn surface of CFB
sample 114h disk at 0.25 m.s-1- 0.62 MPa.
Figure 42. SEM image of worn surface of CFB
sample 114h disk at 0. 5 m.s-1- 0.62 MPa.
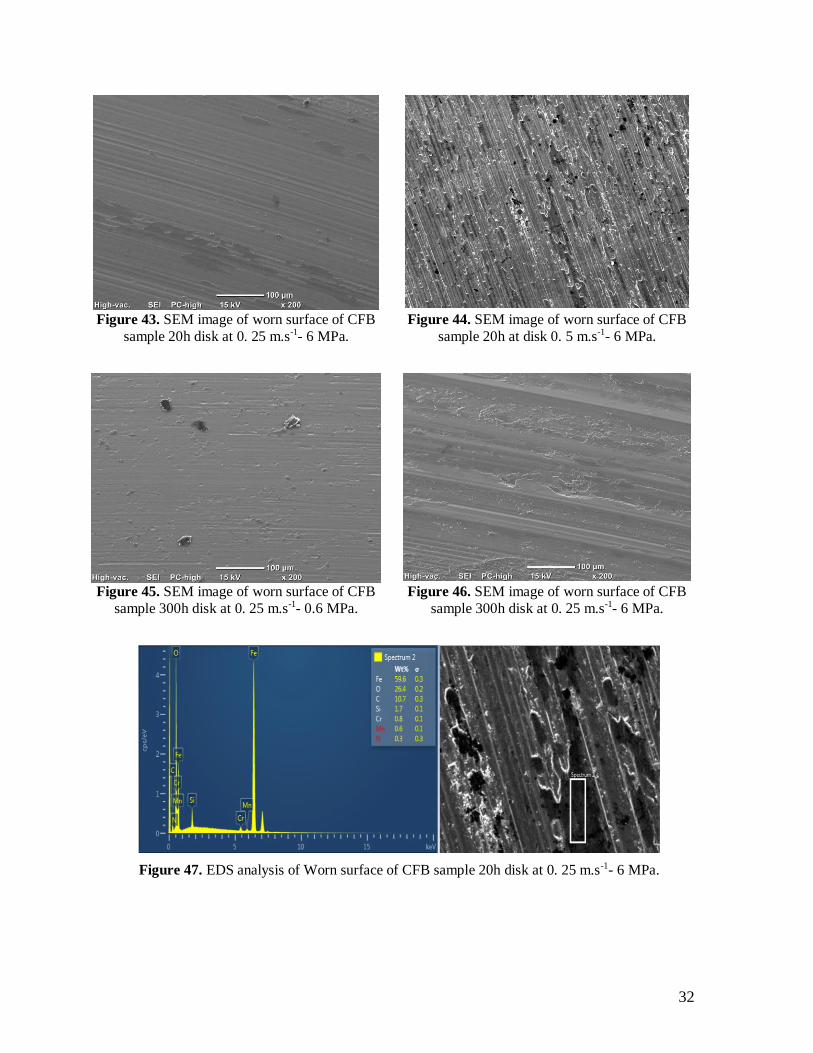
32
Figure 43. SEM image of worn surface of CFB
sample 20h disk at 0. 25 m.s-1- 6 MPa.
Figure 44. SEM image of worn surface of CFB
sample 20h at disk 0. 5 m.s-1- 6 MPa.
Figure 45. SEM image of worn surface of CFB
sample 300h disk at 0. 25 m.s-1- 0.6 MPa.
Figure 46. SEM image of worn surface of CFB
sample 300h disk at 0. 25 m.s-1- 6 MPa.
Figure 47. EDS analysis of Worn surface of CFB sample 20h disk at 0. 25 m.s-1- 6 MPa.

33
Figure 48. EDS analysis of Worn surface of CFB sample 20h disk at 0. 25 m.s-1- 0.6 MPa.
During the pin on disk sliding motion, the pin is continuously in contact while for disk, it could be
described as a cyclic loading in which each point on wear track goes under equal number of sliding
load. Although it is expected to have similar wear mechanism on both pin and disks, yet such
difference in terms of loading condition might make a difference in appearance of surface layers
and surface properties on samples.
SEM/EDS results for all pin surfaces are shown in Figure 49 to Figure 58. According to Figure 49(a),
Figure 50(a), Figure 51, Figure 52 and Figure 55, at low loads, the worn surface is covered with a
smooth thin layer of oxide where at low loads, the trace of adhesive wear mechanism is more
apparent and at higher loads and speeds (Figure 49(b), Figure 49(c), Figure 50(b), Figure 53, Figure 54
and Figure 56), the oxide layers tend to cover the worn surface. The pin surfaces have suffered from
severe plastic deformation where transfer layer traces and voids are visible. At low load-speed,
detachment of material from the pin surface could be seen in addition to shallow micro ploughing
similar to what was observed on the disk worn surface. Additionally, small islands of oxide layer
tend to grow on the surfaces (Figure 49(a)) where at higher loads and speeds, they should prevail on
the surface. However, according to SEM results, at higher loads, the oxide layer does not prevail
(layers are relatively very thin compared to disk samples) the worn surface while traces of transfer
material and fractured oxide layer are more apparent. It could be concluded that due to the
continuous loading on the worn surface of the pin and relative higher temperature compared to disk
surface, oxide layer has high brittle behavior and low ductility. Thereby they continuously grow
and fracture, where the trace of fractured oxide layer are apparent in Figure 49(a) and Figure 51 as
they often are trapped in surface valley between asperities of worn-deformed surfaces. The EDS
analysis also proves the types of layers formed on the surface (Figure 57 and Figure 58).
Figure 49. SEM image of demonstration of CFB steel pin austempered at 220 0C wear mechanism for three
test condition: 0.25 m.s-1-0.6 MPa (a), 0.25 m.s-1-6MPa (b), 0.5 m.s-1-6MPa(c)

34
Figure 50. SEM image of demonstration of CFB steel pin austempered at 300 0C wear mechanism for three
test condition: 0.25 m.s-1-0.6 MPa (a), 0.25 m.s-1-6MPa (b).
Figure 51. SEM image of worn surface of CFB
sample 220h pin at 0. 25 m.s-1- 0.6 MPa.
Figure 52. SEM image of worn surface of CFB
sample 220h pin at 0. 25 m.s-1- 0.6 MPa.
Figure 53. SEM image of worn surface of CFB
sample 220h pin at 0. 25 m.s-1- 6 MPa.
Figure 54. SEM image of worn surface of CFB
sample 220h pin at 0. 5 m.s-1- 6 MPa.
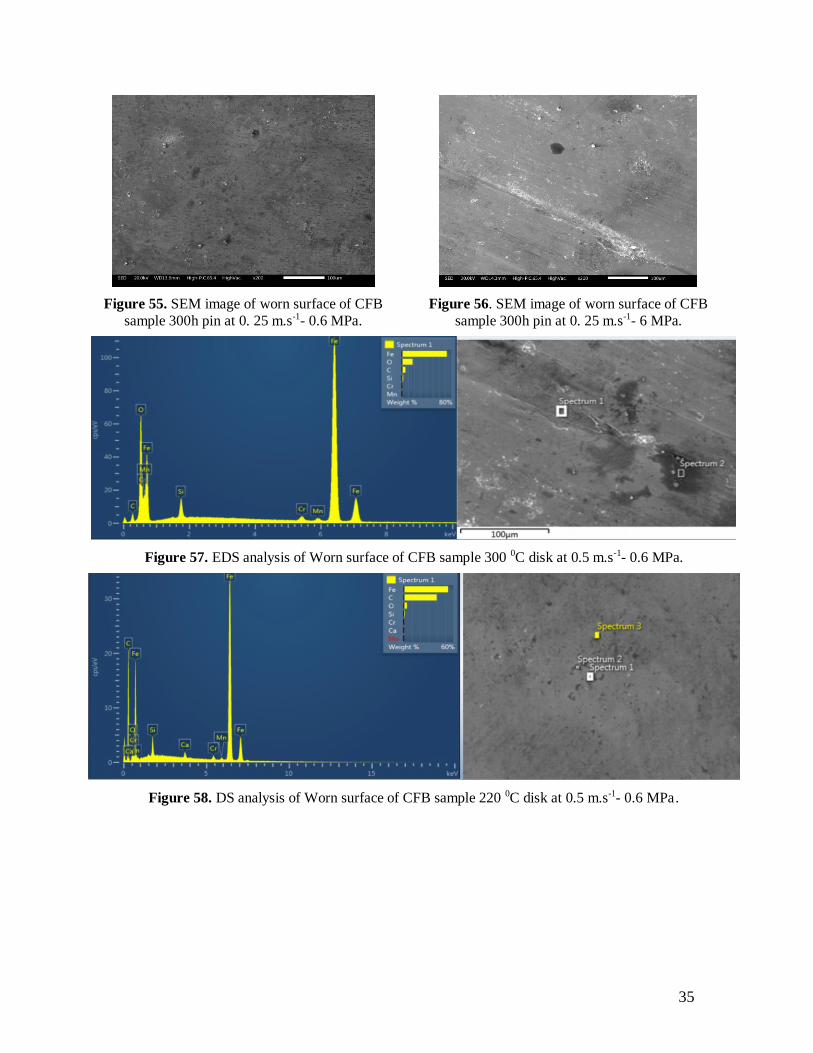
35
Figure 55. SEM image of worn surface of CFB
sample 300h pin at 0. 25 m.s-1- 0.6 MPa.
Figure 56. SEM image of worn surface of CFB
sample 300h pin at 0. 25 m.s-1- 6 MPa.
Figure 57. EDS analysis of Worn surface of CFB sample 300 0C disk at 0.5 m.s-1- 0.6 MPa.
Figure 58. DS analysis of Worn surface of CFB sample 220 0C disk at 0.5 m.s-1- 0.6 MPa .

36
4.3.1 Formation of oxide layers
More focus was given to the formation of oxide layer on the surface as shown in Figure 59. There
are several processes in which oxide layers form in different scales and dimensions. Due to high
energy of Iron compositions on the surface, they will react with oxygen and will form various types
of oxide layers where the most common ones are hematite and magnetite as the environment
temperature increases respectively. Yet, due to their brittle structure, they would fracture and form
oxide debris. Then, due to continuous tribological loading (where load and speed accelerate such
process) and environment temperature, they will attach to each other which resembles sintering
process. Then, as the process continues, more oxide layers would form over each other and go
under cyclic loading which increase their brittle behavior and would lead to oxide layer fracture. It
could be postulated that the stability of the formed oxide layer under cyclic loading and
deformation is a function of their topography such as dimensions and layers number and thickness
in addition to chemical composition and work hardening of the oxide layer. It should be noted that
oxide layers play a vital role in wear process stabilization where both oxide layer and substrate in
which oxide layer is formed are of high importance.
Figure 59. SEM image of fractured multi-layer oxide and work-hardened surface over disk surface
Figure 60 demonstrate fracture of worn surface oxide layer where the cracks are perpendicular to the
direction of sliding motion which are mainly originate from plane-plane contact pressure sliding
over another surface.

37
Figure 60. SEM image of the formation of cracks over the disk oxide layer perpendicular to sliding
direction due to sliding motion of pin over the disk with plane-plane contact pressure distribution
4.4. Profilometry
The worn and original surface of the samples surface topography was analyzed through 3D optical
profilometry and the results are shown in Figure 61 and Figure 62. The reference surface lines refer
to original unworn surface roughness.
Figure 61. Disks surface roughness measurement results where the three orange, red and green horizontal
lines refer to original surface roughness
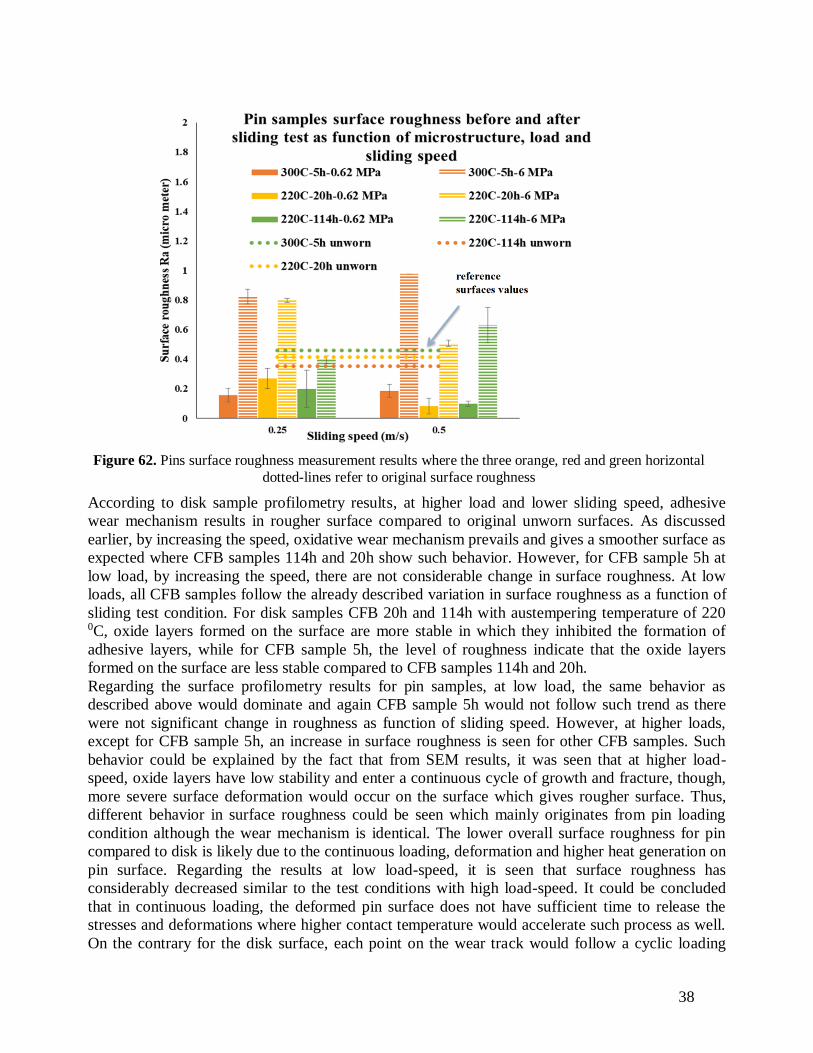
38
Figure 62. Pins surface roughness measurement results where the three orange, red and green horizontal
dotted-lines refer to original surface roughness
According to disk sample profilometry results, at higher load and lower sliding speed, adhesive
wear mechanism results in rougher surface compared to original unworn surfaces. As discussed
earlier, by increasing the speed, oxidative wear mechanism prevails and gives a smoother surface as
expected where CFB samples 114h and 20h show such behavior. However, for CFB sample 5h at
low load, by increasing the speed, there are not considerable change in surface roughness. At low
loads, all CFB samples follow the already described variation in surface roughness as a function of
sliding test condition. For disk samples CFB 20h and 114h with austempering temperature of 220 0C, oxide layers formed on the surface are more stable in which they inhibited the formation of
adhesive layers, while for CFB sample 5h, the level of roughness indicate that the oxide layers
formed on the surface are less stable compared to CFB samples 114h and 20h.
Regarding the surface profilometry results for pin samples, at low load, the same behavior as
described above would dominate and again CFB sample 5h would not follow such trend as there
were not significant change in roughness as function of sliding speed. However, at higher loads,
except for CFB sample 5h, an increase in surface roughness is seen for other CFB samples. Such
behavior could be explained by the fact that from SEM results, it was seen that at higher load-
speed, oxide layers have low stability and enter a continuous cycle of growth and fracture, though,
more severe surface deformation would occur on the surface which gives rougher surface. Thus,
different behavior in surface roughness could be seen which mainly originates from pin loading
condition although the wear mechanism is identical. The lower overall surface roughness for pin
compared to disk is likely due to the continuous loading, deformation and higher heat generation on
pin surface. Regarding the results at low load-speed, it is seen that surface roughness has
considerably decreased similar to the test conditions with high load-speed. It could be concluded
that in continuous loading, the deformed pin surface does not have sufficient time to release the
stresses and deformations where higher contact temperature would accelerate such process as well.
On the contrary for the disk surface, each point on the wear track would follow a cyclic loading
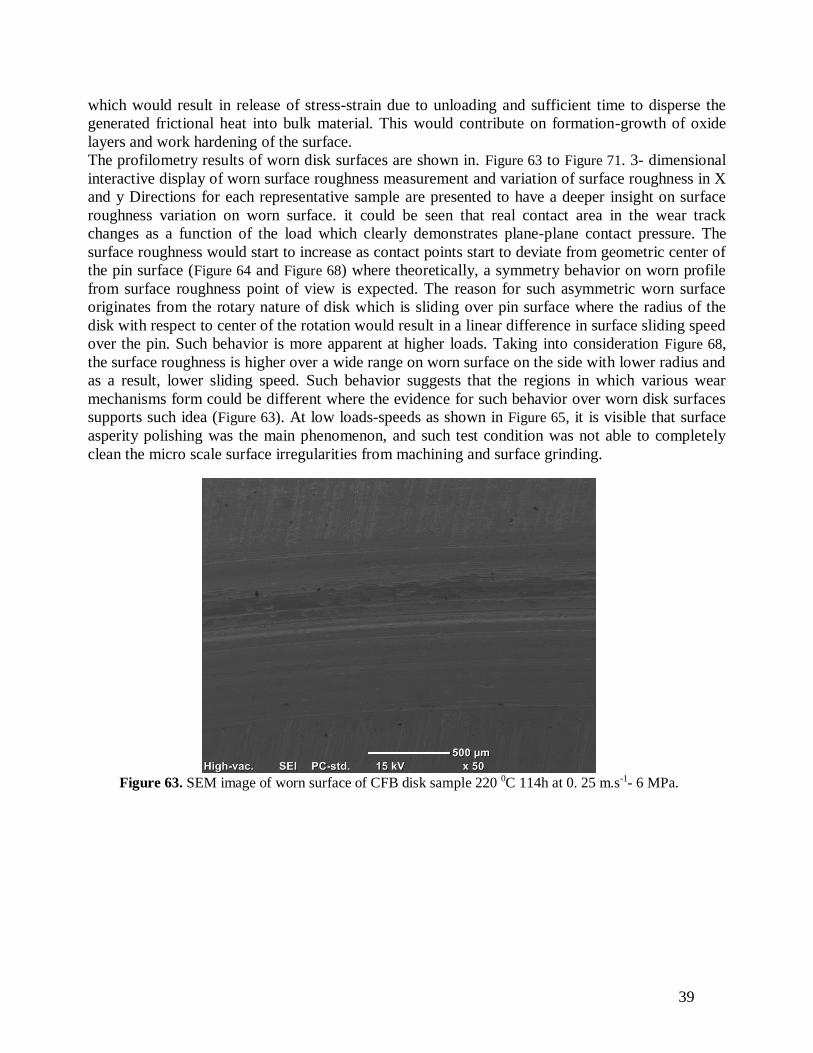
39
which would result in release of stress-strain due to unloading and sufficient time to disperse the
generated frictional heat into bulk material. This would contribute on formation-growth of oxide
layers and work hardening of the surface.
The profilometry results of worn disk surfaces are shown in. Figure 63 to Figure 71. 3- dimensional
interactive display of worn surface roughness measurement and variation of surface roughness in X
and y Directions for each representative sample are presented to have a deeper insight on surface
roughness variation on worn surface. it could be seen that real contact area in the wear track
changes as a function of the load which clearly demonstrates plane-plane contact pressure. The
surface roughness would start to increase as contact points start to deviate from geometric center of
the pin surface (Figure 64 and Figure 68) where theoretically, a symmetry behavior on worn profile
from surface roughness point of view is expected. The reason for such asymmetric worn surface
originates from the rotary nature of disk which is sliding over pin surface where the radius of the
disk with respect to center of the rotation would result in a linear difference in surface sliding speed
over the pin. Such behavior is more apparent at higher loads. Taking into consideration Figure 68,
the surface roughness is higher over a wide range on worn surface on the side with lower radius and
as a result, lower sliding speed. Such behavior suggests that the regions in which various wear
mechanisms form could be different where the evidence for such behavior over worn disk surfaces
supports such idea (Figure 63). At low loads-speeds as shown in Figure 65, it is visible that surface
asperity polishing was the main phenomenon, and such test condition was not able to completely
clean the micro scale surface irregularities from machining and surface grinding.
Figure 63. SEM image of worn surface of CFB disk sample 220 0C 114h at 0. 25 m.s-1- 6 MPa.
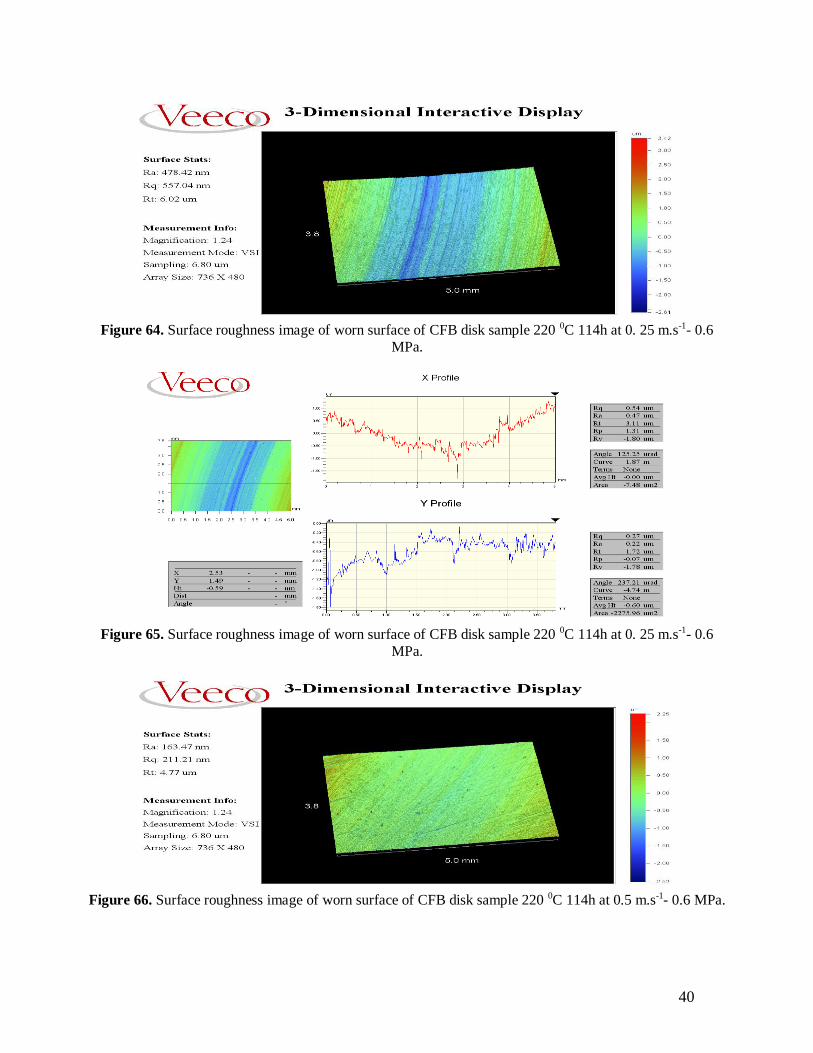
40
Figure 64. Surface roughness image of worn surface of CFB disk sample 220 0C 114h at 0. 25 m.s-1- 0.6
MPa.
Figure 65. Surface roughness image of worn surface of CFB disk sample 220 0C 114h at 0. 25 m.s-1- 0.6
MPa.
Figure 66. Surface roughness image of worn surface of CFB disk sample 220 0C 114h at 0.5 m.s-1- 0.6 MPa.

41
Figure 67. Surface roughness image of worn surface of CFB disk sample 220 0C 114h at 0.5 m.s-1- 0.6 MPa.
Figure 68. Surface roughness image of worn surface of CFB disk sample 220 0C 20h at 0. 25 m.s-1- 6 MPa.
Figure 69. Surface roughness image of worn surface of CFB disk sample 220 0C 20h at 0. 25 m.s-1- 6 MPa.

42
Figure 70. Surface roughness image of worn surface of CFB disk sample 300 0C 5h at 0.5 m.s-1- 6 MPa.
Figure 71. Surface roughness image of worn surface of CFB disk sample 300 0C 5h at 0.5 m.s-1- 6 MPa.
The 2D and 3D surface profiles for pins are shown in Figure 72 to Figure 79. Taking into
consideration the SEM image and the pin worn surface profilometry, at low loads (Figure 72),
surface roughness is lower than the original surface. However, there are still traces of adhesive
wear mechanism or material detachment and short distance micro ploughing on worn surface. At
higher speeds (Figure 74), as expected, more traces of oxidative wear mechanism are apparent on
the surface which again describes the nucleation and growth of oxide layers and adherent material
on the surface. At higher load (Figure 76), the surface roughness is higher than the original surface
and the random shape rough surface describes the adhesive wear mechanism. However, at higher
sliding speeds (Figure 78), the boundaries of adhesive wear mechanism and dominant growing
oxide layer on the surface are more apparent. Although both pin and disk had similar surface
roughness as they were prepared from similar samples with pre-determined surface finishing
method, the pin worn surface roughness is lower than of the disk for majority of test conditions and
CFB sample microstructures. The reason for such difference mainly originates from their difference
in loading condition as described earlier although the wear mechanism for both pin-disk surfaces
are similar for all the test conditions.
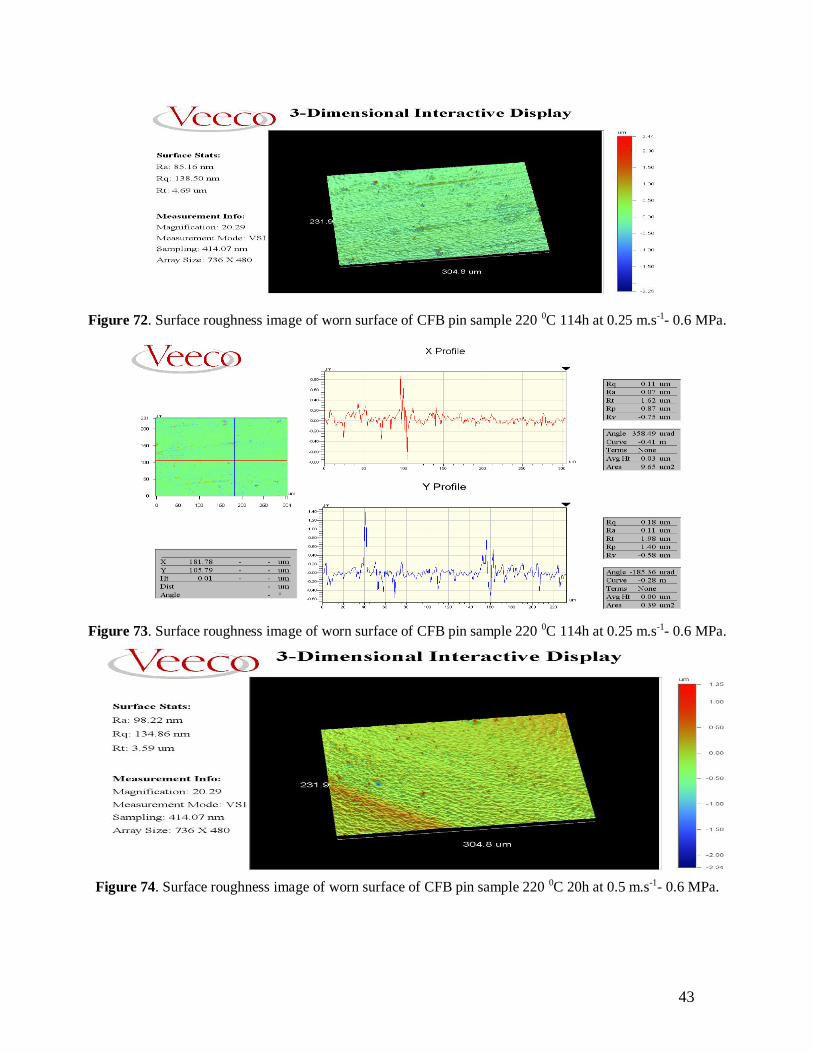
43
Figure 72. Surface roughness image of worn surface of CFB pin sample 220 0C 114h at 0.25 m.s-1- 0.6 MPa.
Figure 73. Surface roughness image of worn surface of CFB pin sample 220 0C 114h at 0.25 m.s-1- 0.6 MPa.
Figure 74. Surface roughness image of worn surface of CFB pin sample 220 0C 20h at 0.5 m.s-1- 0.6 MPa.
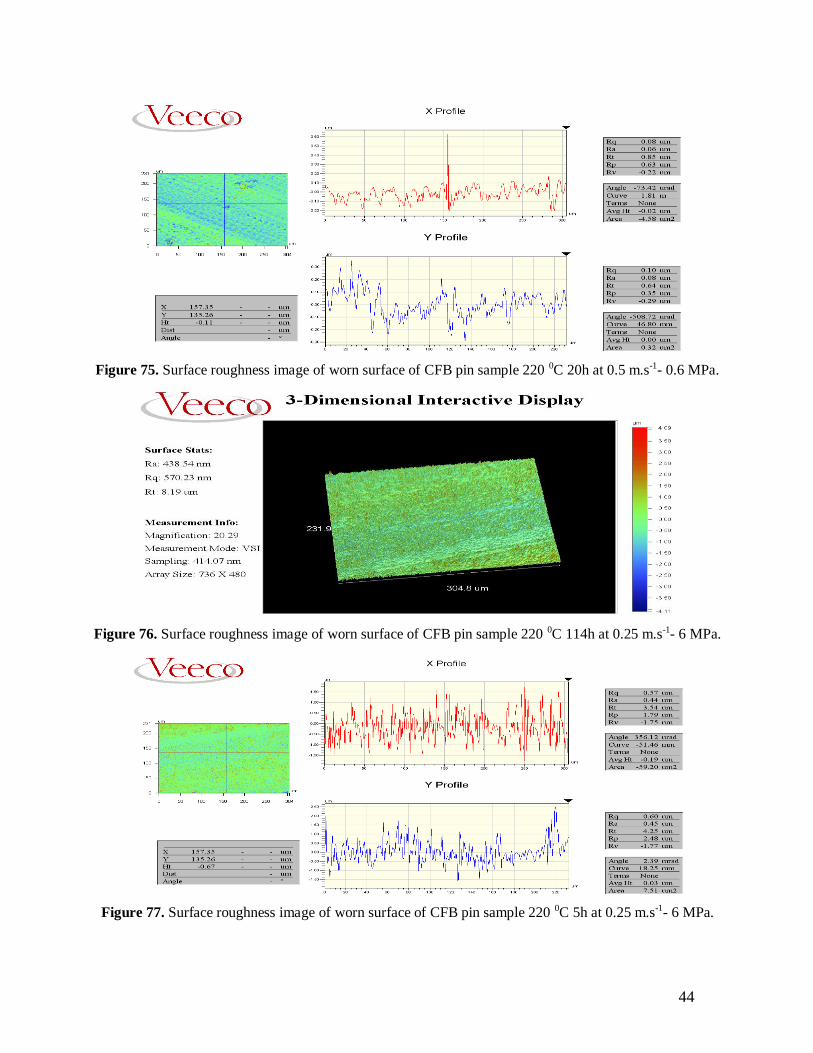
44
Figure 75. Surface roughness image of worn surface of CFB pin sample 220 0C 20h at 0.5 m.s-1- 0.6 MPa.
Figure 76. Surface roughness image of worn surface of CFB pin sample 220 0C 114h at 0.25 m.s-1- 6 MPa.
Figure 77. Surface roughness image of worn surface of CFB pin sample 220 0C 5h at 0.25 m.s-1- 6 MPa.
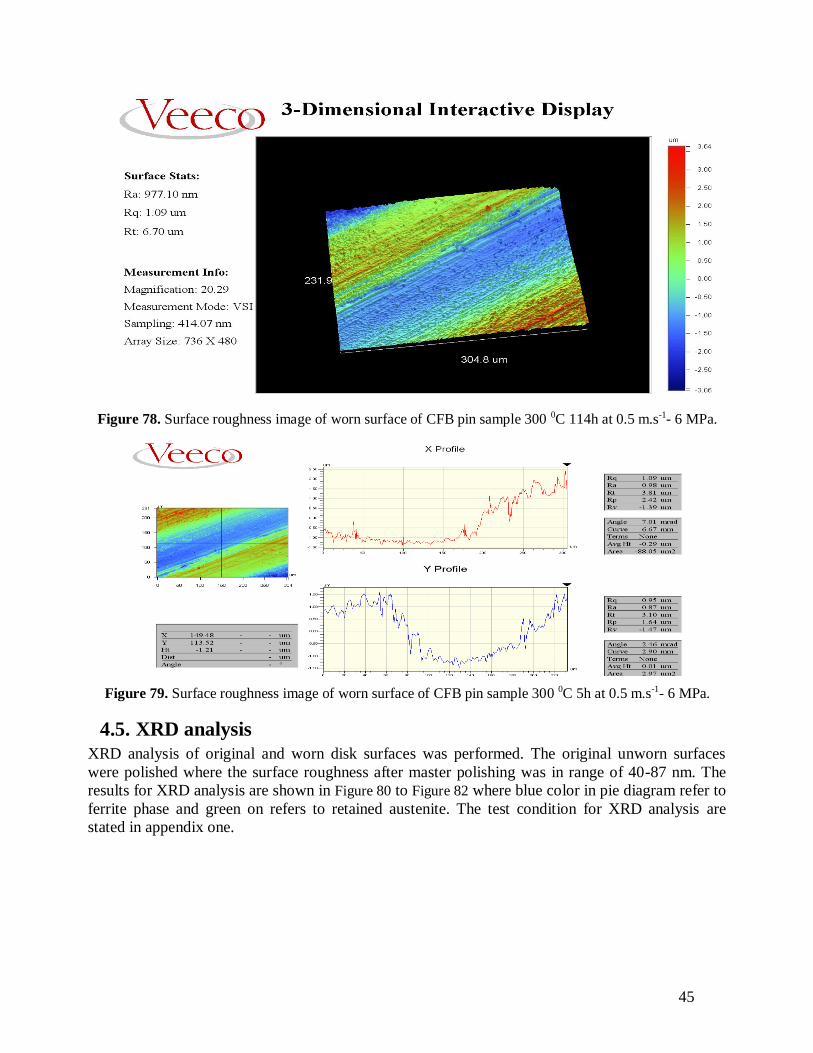
45
Figure 78. Surface roughness image of worn surface of CFB pin sample 300 0C 114h at 0.5 m.s-1- 6 MPa.
Figure 79. Surface roughness image of worn surface of CFB pin sample 300 0C 5h at 0.5 m.s-1- 6 MPa.
4.5. XRD analysis
XRD analysis of original and worn disk surfaces was performed. The original unworn surfaces
were polished where the surface roughness after master polishing was in range of 40-87 nm. The
results for XRD analysis are shown in Figure 80 to Figure 82 where blue color in pie diagram refer to
ferrite phase and green on refers to retained austenite. The test condition for XRD analysis are
stated in appendix one.
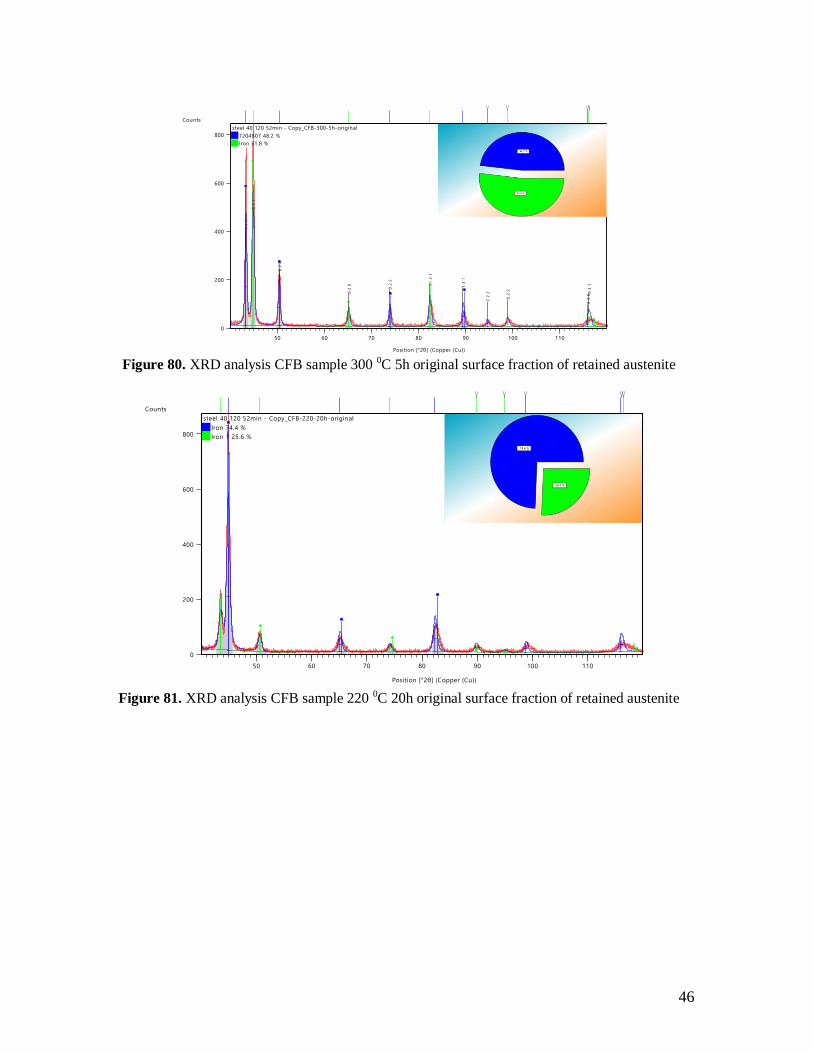
46
Position [°2θ] (Copper (Cu))
50 60 70 80 90 100 110
Counts
0
200
400
600
800
1 1
1
0 1
1
0 2
0
0 2
0
0 2
2 1 2
1
1 3
1
2 2
2
0 2
2
0 4
00
3 1
steel 40 120 52min - Copy_CFB-300-5h-original
7204807 48.2 %
Iron 51.8 %
Figure 80. XRD analysis CFB sample 300 0C 5h original surface fraction of retained austenite
Position [°2θ] (Copper (Cu))
50 60 70 80 90 100 110
Counts
0
200
400
600
800
steel 40 120 52min - Copy_CFB-220-20h-original
Iron 74.4 %
Iron 1 25.6 %
Figure 81. XRD analysis CFB sample 220 0C 20h original surface fraction of retained austenite

47
Position [°2θ] (Copper (Cu))
50 60 70 80 90 100 110
Counts
0
200
400
600
800 steel 40 120 52min - Copy_CFB-220-114h-Original
Iron 77.7 %
7204807 22.3 %
Figure 82. XRD analysis CFB sample 220 0C 114h original surface fraction of retained austenite
According to XRD results, CFB sample austempered at 300 0C 5h contains more retained austenite
(51%) compared to other CFB samples austemperd 220 0C samples where CFB sample 114h
contains lower amount of retained (22.3%) austenite compared to CFB sample 20h (25.6%). It
could be concluded that by decreasing the austempering temperature and time, a lower volume
fraction of retained austenite would be achieved. However, the stability of the retained austenite
plays an important role in the wear resistance of the CFB microstructure where the morphology and
Carbon concentrations could be used to discuss retained austenite stability. Additionally the amount
of retained austenite after tribo test for disk CFB samples austempered at 220 0C were also
measured where the data are presented in Table 4 and Table 5.
Table 4. The amount of retained austenite on CFB 114h sample worn surf for different load conditions
Sample Test condition Retained austenite (%)
114 h 6 MPa - 0.5 m.s-1 12.9
114 h 6 MPa - 0.25 m.s-1 17.5
114 h 0.6 MPa - 0.5 m.s-1 26.6
114 h 0.6 MPa - 0.25 m.s-1 21.2
Table 5. The amount of retained austenite on CFB 20h sample worn surf for different load conditions
sample Test condition Retained austenite (%)
20 h 6 MPa - 0.5 m.s-1 15.4
20 h 6 MPa - 0.25 m.s-1 23
20 h 0.6 MPa - 0.5 m.s-1 24
20 h 0.6 MPa - 0.25 m.s-1 26.9
Regarding the trip effect, it is a transformation which occurs mainly at large deformations and
depends both on retained austenite and surrounding ferrite mechanical and morphological
properties. Regarding the available literature, majority of the works published so far mainly study

48
the effect of stress induced transformation either through applying deformations or loads in which
both cases induce stress in the material bulk. The retained austenite thereby fully transforms into
hard brittle martensite. However, in this study, applying such loads and nature of sliding motion
after running in process (sever contact asperity deformations, fracture and detachment), the focus is
more on surface deformations while stress level is not significant, so the effect of both
deformations and stress could be separated in more details if not completely. Here, normal and
tangential load refer to stressed induced deformation, while sliding speed could be attributed to
deformation of the surfaces.
According to the results for 220 0C CFB samples, at low load, regardless of the change in speed,
there is not a significant change in fraction of retained austenite. However, at higher load, by
increasing the speed, a significant change in amount of retained austenite could be seen.
Additionally, at low speeds, the increase in normal load does not have significant effect on
transformation of retained austenite into martensite while at higher speeds, the variation of the load
is considerable.
The trip effect as a product of plasticity by nature, could be activated through both deformation and
stress based applied energy. However, the main difference lies within the depth of transformation
required for tribological applications where stress induced plasticity affects deeper layers of
material to transform unlike the sliding motion which affects layers close to the surface. Thus,
based on the application of such microstructure, sufficient depth should undergo trip effect
(deformed layer depth) in order to avoid near surface-initiated damage through brittle nature of
martensite or sever delamination of material from surface.
Regarding the SWR results for pins, at low loads and speeds, where the transformation of retained
austenite to martensite occurs with lower percentage, due to shallow transformations depth, the
substrate deforms even more than the transformed surface layer (martensite phase), which cause
them to break and an unstable surface layer would form which is not beneficial to wear
improvement. On the other hand, at higher loads, the sliding speed would contribute to deeper
transformed layers which would result in harder substrate to stabilize the already formed martensite
layers on the surface.
For certain applications such as rail steels, it should be noted while comparing the current pearlitic
steels with potential alternative CFB steels particularly at low loads, it is crucial to study wear
behavior under both large and low surface deformations and how the sliding motion contributes to
such behavior. As it was discussed earlier, at high contact pressure resulting in large deformation
under the contact area, the substrate layer in addition to large deformations due to sliding motion
should be analyzed carefully as they represent tribo systems on straight path (high and low axle
loads) and curved track (high-pure sliding motion or accelerating and decelerating on straight path).
Further detailed studies are required to study CFB steel surface transformation and its correlation
with bulk material substrate and the stability of deformed and oxide layers (particularly martensite
and oxide layer due to their brittle nature).

49
5 Conclusions The effect of retained austenite on the tribological behavior of nanostructured carbide free bainitic
(CFB) steels with various austempering temperature under the dry sliding condition was
investigated in this study. The main conclusions from this study are as follows:
➢ Decreasing austempering temperature significantly increase the hardness but the
austempering time does not have a significant effect on the CFB steel hardness for
durations studied in this work.
➢ Increasing the sliding speed contribute to more friction power and accelerates the formation
of oxide layer which eventually decreases the coefficient of friction.
➢ Addition of Si affects the coefficient of friction (COF) and contact temperature between the
sliding surfaces significantly, particularly at low loads and speed due to improvement in
ferromagnetism properties of the CFB steel samples.
➢ The specific wear rate decreases with increasing speed due to formation of oxide layers. At
higher loads, CFB sample 114h showed the worst behavior at low sliding speeds, while at
higher speeds, CFB sample 114h outperformed the other microstructures. For pin samples,
CFB sample 114h showed promising behavior at higher sliding speeds where the variation
of load would significantly improve CFB sample 114h wear behavior. At low sliding
speeds and low loads, all microstructures showed the same wear behavior while at higher
loads, CFB sample 114h showed the worst behavior. For Disk samples, at low loads, CFB
sample 114h showed the worst wear behavior and as described above, at higher loads, by
increasing the sliding speed, CFB sample 114h outperformed other microstructures.
➢ Formation of Hematite oxide layer at low loads results in higher wear and COF.
➢ Adhesive wear is dominant at low speeds while at higher speeds, oxidative wear prevails.
➢ Through profilometry and wear mechanism analysis, it is possible to correlate the surface
roughness and dominant wear mechanism at various test condition with respect to original
surface roughness.
➢ At high loads, sliding speed has a significant effect on the TRIP effect, while at lower loads,
surface deformation would cause the transformation of retained austenite to brittle and hard
martensite. It was found that although CFB sample 300 0C- 5h contained higher percentage
of retained austenite, the stability of retain austenite as for CFB samples 20h and 114h
plays a major role on wear resistance behavior of CFB steels. Additionally, emphasize was
given to the simultaneous effect of ferrite phase and retained austenite on wear resistance
behavior of CFB samples.

50
6 Future work the proposed future work to further investigate the effect of retained austenite on wear behavior of
CFB samples are as follow:
➢ Detailed studies of deformed layer on longitudinal cross section to validate the speculations
made regarding the behavior of substrate for studied microstructure.
➢ It was concluded that, apart from retained austenite, the ferrite phase mechanical properties
is of importance, so it should be studied in more detail.
➢ More thorough analysis of the effect of the stability of oxide layer on wear behavior is
required.
➢ Hardness properties of the material is not sufficient to compare the wear behavior of CFB
steels, other properties such as fracture toughness in addition to thorough study of the
kinetics of transformations during austempering are necessary.

51
7 References
1. Bhadeshia H.K.D.H, 52nd Hadfield memorial lecture – Large chunks of very strong steel, Journal of Materials Science and Technology, 2005, vol 21, pp 1293-1302.
2. Bhadeshia H.K.D.H, Bainitic bulk-nano crystalline steel, Proceedings of the third international conference on advanced structural steels, Korea, 2006, pp 33-40.
3. Bhadeshia H.K.D.H, The nature, mechanism and properties of strong bainite, Proceedings of the first international symposium on steel science, Japan, 2007, pp 17-26.
4. Bhadeshia H.K.D.H, Very short and very long heat-treatments in the processing of steel,
Proceedings of Simpro-08, India, 2008, pp 3-11.
5. Caballero F.G, Miller M.K, García-Mateo C, Capdevila C & Garcia de Andrés C, Phase
transformation theory: a powerful tool for the design of advanced steels, JOM, 2008, vol 60, no 12, pp 16-21.
6. Caballero F.G, Capdevila C, Chao J, Cornide J, Garcia-Mateo C, Roelofs H, Hasler St and
Mastrogiacomo G, The microstructure of continuously cooled tough bainitic steels, Proceedings of second international conference on super high strength steels, Italy, 2010, pp 1-10.
7. Bhadeshia H.K.D.H, Bainite in Steels - Transformations, Microstructure and Properties, IOM Communications Ltd, London, 2001.
8. Bhadeshia, Super bainite, Research impact, University of Cambridge, 2014.
9. Akbasoglu F. C, Edmonds D. V, Rolling contact fatigue and fatigue crack propagation in 1C-1.5Cr
bearing steel in bainitic condition, Metallurgical Transactions A, 1990, vol 21, pp 889-893.
10. Hollox G. E, Hobbs R. A and Hampshire J. M, Lower bainite bearings for adverse environments,
Wear journal, 1981, vol 68, pp 229-240.
11. Bhadeshia, Steels for Bearings, Progress in Materials Science, 2012, vol 57, pp 268-435.
12. Krauss G, Steels: Heat Treatment and processing principles by, ASM International. 497 pages, Second Edition, 1980.
13. ASM Metal Handbooks, Volume 2 of the 10. Edition, 1992.
14. Wang L.W, Du C.W, Liu Z.Y, Wang X.H and Li X.G, Influence of carbon on stress corrosion
cracking of high strength pipeline steel, Corrosion Science, 2013, vol 76, pp 486-493.
15. Honeycombe R. W. K, Steels: Microstructure and properties, Metallurgy and materials science,
American Society for Metals, 1982.
16. Bain E.C, Crystal Structure of Solid Solutions, Trans. AIME, 1923, vol 68, pp 625–639.
17. Bain E.C and Paxton H.W, Alloying Elements in Steel, Metals Park, OH, ASM, 1966.

52
18. Leslie W.C, The Physical Metallurgy of Steel, McGraw Hill, 1982.
19. Sandvik B.P.J and Nevalainen H.P., Met. Technol., 1981, vol 15, pp 213-220.
20. Putatunda S.K, Singara A.V, Tackett R and Lawes G, Mater. Sci. Eng: A, 2009, vol 513-514, pp
329-339.
21. Bain E.C, Alloying Elements in Steel, ASM, Ohio, USA, 1939.
22. Takahashi M & Bhadeshia H.K.D.H, Model for transition from upper to lower bainite, Journal of Materials Science and Technology, 1990, vol 6, pp 592-603.
23. Bhadeshia H.K.D.H, The lower bainite transformation and the significance of the carbide precipitation, Acta Metallurgica, 1980, vol 28, pp 1103-1114.
24. Sajjadi, S.A, Zebarjad S.M, Isothermal transformation of austenite to bainite in high carbon steels,
Journal of Materials Processing Technology, 2007, vol 189, pp 107-113.
25. Bhadeshia, H.K.D.H, Waugh A.R, Bainite: an atom probe study of the incomplete reaction
phenomenon, Acta Metallurgica, 1982, vol 30, pp 775-784.
26. Matas S.J, Hehemann R.F, The structure of bainite in hypoeutectoid steels, TMS-AIME, 1981, vol
221, pp 179–185.
27. Fielding L, The bainite controversy, Journal of Materials Science and Technology, 2013, vol 29, pp
383-399.
28. Hillert M, Hoglund L and Ågren J, Role of carbon and alloying elements in the formation of bainitic
ferrite, Metallurgical and Materials Transactions A, 2004, vol 35A, pp 3693 – 3700.
29. Quidort D, Brechet Y, The role of carbon on the kinetics of bainite transformation in steels, Scripta
Materialia, 2002, vol 47, pp 151–156.
30. Matsuda H, Bhadeshia H.K.D.H, Kinetics of the bainite transformation, Proceedings of Royal Society London A, 2004, vol 460, pp 1707-1722.
31. Caballero F.G, Bhadeshia H.K.D.H, Mawella K.J.A, Jones D.G. and Brown P, Design of novel high strength bainitic steels: Part 1, Journal of Materials Science and Technology, 2001, vol 17, pp 512-
516.
32. Caballero F.G, Bhadeshia H.K.D.H, Mawella K.J.A, Jones D.G and Brown P, Design of novel high
strength bainitic steels: Part 2, Journal of Materials Science and Technology, 2001, vol 17, pp 517-
522.
33. Gomez G, Perez T and Bhadeshia H.K.D.H, Air cooled bainitic steels for strong, seamless pipes.
Part1-alloy design, kinetics and microstructure, Journal of Materials Science and Technology, 2009,
vol 25, pp 1501–1507.
34. Bhadeshia H.K.D.H, Steels for bearings, Progress in Materials Science, 2012, vol 57, pp 268–435.
53
35. Bhadeshia H.K.D.H, A rationalization of shear transformations in steels, Acta Metallurgica, 1981, vol 29, pp 1117–1130.
36. Caballero F.G, Bhadeshia H.K.D.H, Mawella K.J.A, Jones D.G. and Brown P, Very strong low temperature bainite, Materials Science and Technology, Taylor & Francis, 2002, vol 18, pp 279-284,
doi: 10.1179/026708301225000725.
37. Lambers H.G, Tschumak S, Maier H.J and Canadinc D, Role of austenitization and pre-deformation
on the kinetics of the isothermal bainitic transformation, Metallurgical and Materials Transactions
A, 2009, vol 40A, pp 1355–1366.
38. Caballero F.G, Santofimia M.J, García-Mateo C, Chao J, and Garcia de Andrés C, Theoretical
design and advanced microstructure in super high strength steels, Material and Design, 2009, vol 30,
pp 2077-2083.
39. Caballero F.G, Capdevila C, Chao J, Cornide J, Garcia-Mateo C, Roelofs H, Hasler St and
Mastrogiacomo G, The microstructure of continuously cooled tough bainitic steels, Proceedings of second international conference on super high strength steels, Italy, 2010, pp 1- 10.
40. Qian L, Zhou Q, Zhang F, Meng J, Zhang M and Tian Y, Microstructure and mechanical properties
of a low carbon carbide-free bainitic steel co-alloyed with Al and Si, Materials and Design, 2012, vol 39, pp 264–268.
41. Caballero F.G, Bhadeshia H.K.D.H, Very strong bainite, Current Opinion in Solid State and Material Science, 2004, vol 8, pp 251-257.
42. Caballero F.G, Bhadeshia H.K.D.H, Mawella K.J.A, Jones D.G and Brown P, Design of novel high strength bainitic steels: Part 1, Journal of Materials Science and Technology, 2001, vol 17, pp 512-
516.
43. Caballero F.G, Bhadeshia H.K.D.H, Mawella K.J.A, Jones D.G. and Brown P, Design of novel high strength bainitic steels: Part 2, Journal of Materials Science and Technology, 2001, vol 17, pp 517-
522.
44. Garcia–Mateo C, Caballero F.G, Ultra high strength bainitic steels, ISIJ International, 2005, vol 45,
no 11, pp 1736–1740.
45. Pickering F.B and Gladman T, Metallurgical developments in carbon steels, 1963, Special report no
81, p 10, Iron and steel institute, England.
46. Bhadeshia H.K.D.H, Edmonds D.V, Bainite in silicon steels: A new composition–property approach
- part 1, Metal Science, 1983, vol 17, pp 411–419.
47. Bhadeshia H.K.D.H and Edmonds D.V, Bainite in silicon steels: A new composition–property approach - part 2, Metal Science, 1983, vol 17, pp 420–425.
48. Brown P.M, Baxter D.P, Hyper–strength bainitic steels, Materials Science and Technology, New Orleans, Louisiana, 2004, pp 433–438.
49. Caballero F.G, Bhadeshia H.K.D.H, Mawella K.J.A, Jones D.G and Brown P, Very strong, low-temperature bainite, Materials Science and Technology, 2002, vol 18, pp 279–284.
54
50. Garcia–Mateo C, Caballero F.G and Bhadeshia H.K.D.H, Low temperature bainite, Journal de
Physique IV, 2003, vol 112, pp 285–288.
51. Garcia-Mateo C, Peet M.J, Caballero F.G and Bhadeshia H.K.D.H, Tempering of a hard mixture of bainitic ferrite and austenite, Materials Science and Technology, 2004, vol 20, pp 814–818.
52. Garcia–Mateo C, Caballero F.G and Bhadesia H.K.D.H, Acceleration of low temperature bainite, ISIJ International, 2003, vol 43, no 11, pp 1821–1825.
53. Bhadeshia H.K.D.H, Hard bainite’, Solid-Solid Phase Transformations in Inorganic Materials, ed. J.M.Howe, D.E.Laughlin, J. K. Lee, U. Dahmen & W.A. Soffa, TMS, 2005, vol 1, pp 469-484.
54. Garcia-Mateo C, Caballero F.G, Bhadeshia H.K.D.H, Acceleration of low-temperature bainite, ISIJ
Int, 2003,vol 43, pp 1821–1825.
55. R. Lewis and U. Olofsson. 2009. Wheel-Rail Interface Handbook, CRC Press, Boston.
http://dx.doi.org/10.1533 /9781845696788
56. S. Iwnicki. 2001. Handbook of Railway Vehicle Dynamics, CRC Taylor and Francis.
57. Rezvani, M.A., Mazraeh, A., Shadfar, M., Mehrali, M., "Field study on the efficient tribo/operational parameters affecting the competitive and simultaneous formation of rail wear, rcf
cracks and material deformation", International Congress on Advanced Railway Eng. (IC-ARE'15),
2-4 March 2015, Istanbul, Turkey.
58. Clayton P, Wear behavior of bainitic steels, Wear journal, Elsevier, 1987, vol 120, pp 199 – 220.
59. Clayton P, Jin N, Unlubricated sliding and rolling/sliding wear behavior of continuously cooled low/medium carbon bainitic steels, Wear journal, 1996, vol 200, pp 74-82.
60. Vi´afara C.C, Castro M.I, V´elez J.M, Toro A, Unlubricated sliding wear of pearlitic and bainitic steels, Wear journal, 2005, vol 259, pp 405–411.
61. Chattopadhyay S, Sangal K, Mondal A, Garg, Improved wear resistance of medium carbon
microalloyed bainitic steels, Wear journal, 2012, vol 289, pp 168–179.
62. Das Bakshi S, Leiro A, Prakash B, Bhadeshia H.K.D.H, Dry rolling/sliding wear of nanostructured
bainite, Wear journal, 2014, vol 316, Issues 1–2, pp 70-78, https://doi.org/10.1016/j.wear.2014.04.020.
63. Long X. Y, Zhang F. C, Kang J, Yang Z. N, Wu D.D, Wu K.M and Zhang G.H, Study on carbide-bearing and carbide-free bainitic steels and their wear resistance, Materials Science and Technology,
2017, vol 33-5, pp 615-622, 10.1080/02670836.2016.1242205.
64. Leiro A, Kankanala A, Vuorinen E, Prakash B, Tribological behaviour of carbide-free bainitic steel under dry rolling/sliding conditions, Wear journal, 2011, Vol 273, Issue 1, pp 2-8,
https://doi.org/10.1016/j.wear.2011.03.025.

55
65. Shipway P.H, Wood S.J, Dent A.H, The hardness and sliding wear behaviour of a bainitic steel, wear journal, 1997, vol 203-204, pp 196-205.
66. Ajus C, Tavares S.S.M, Silva M.R and Corte R.R.A, Magnetic properties and retained austenite
quantification in SAE 4340 steel, Matéria (Rio de Janeiro), 2009, vol 14(3), pp 993-999.
https://dx.doi.org/10.1590/S1517-70762009000300011.
67. Ajus C, Tavares S.S.M, Silva M.R and Corte R.R.A, Magnetic properties and retained austenite
quantification in SAE 4340 steel, Matéria (Rio de Janeiro), 2009, vol 14(3), pp 993-999. https://dx.doi.org/10.1590/S1517-70762009000300011.
68. Chang J.P, Chu L.M, Chou H.M, Hwang Y.C, Effects of friction on tribo-magnetization mechanisms for self-mated iron pairs under dry friction condition, Proceedings of the Institution of
Mechanical Engineers, Part J: Journal of Engineering Tribology, 2009, vol 223, PP 859-869
223(6):859AB10.1243/13506501JET501.
69. Zhu Y, The influence of iron oxides on wheel–rail contact: A literature review Journal of Rail and
Rapid transit, Proceedings of the Institution of Mechanical Engineers, Part F: Rapid Transit, 2018,
vol 232(3), doi:10.1177/0954409716689187.
70. Hokkirigawa K, Kato K, Li Z.Z, The effect of hardness on the transition of the abrasive wear
mechanism of steels, wear, 1988, vol 123(2), pp 241-251.
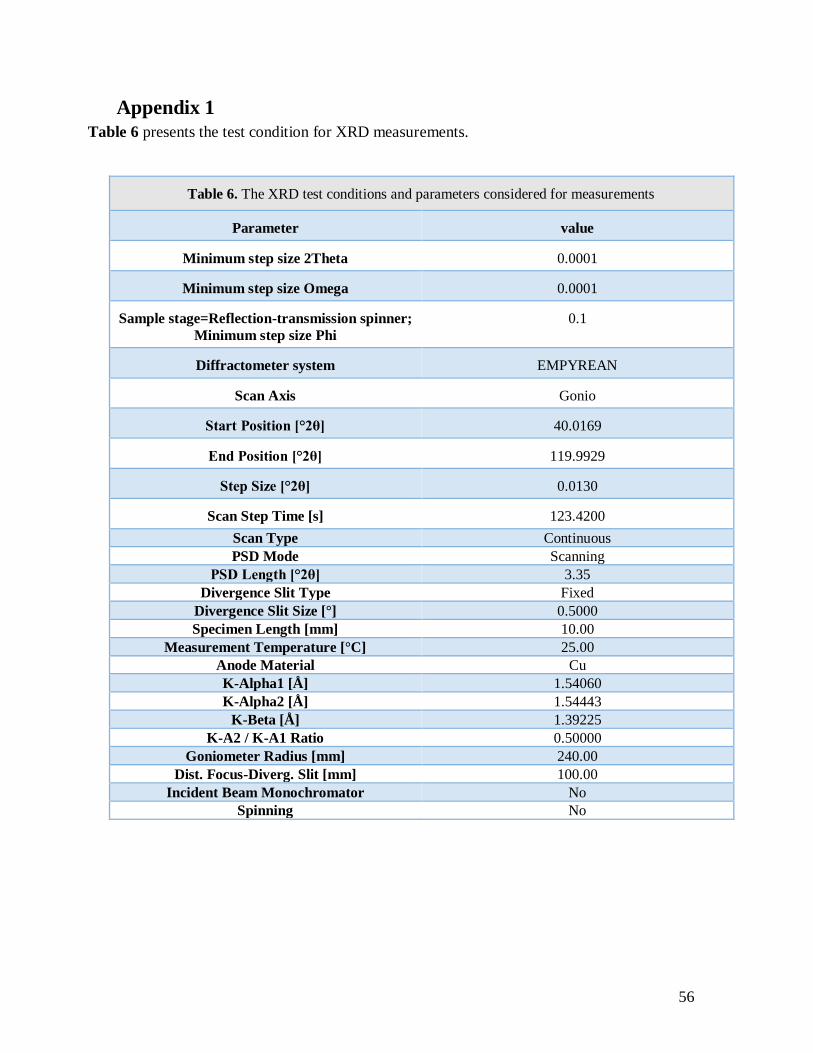
56
Appendix 1
Table 6 presents the test condition for XRD measurements.
Table 6. The XRD test conditions and parameters considered for measurements
Parameter value
Minimum step size 2Theta 0.0001
Minimum step size Omega 0.0001
Sample stage=Reflection-transmission spinner;
Minimum step size Phi
0.1
Diffractometer system EMPYREAN
Scan Axis Gonio
Start Position [°2θ] 40.0169
End Position [°2θ] 119.9929
Step Size [°2θ] 0.0130
Scan Step Time [s] 123.4200
Scan Type Continuous
PSD Mode Scanning
PSD Length [°2θ] 3.35
Divergence Slit Type Fixed
Divergence Slit Size [°] 0.5000
Specimen Length [mm] 10.00
Measurement Temperature [°C] 25.00
Anode Material Cu
K-Alpha1 [Å] 1.54060
K-Alpha2 [Å] 1.54443
K-Beta [Å] 1.39225
K-A2 / K-A1 Ratio 0.50000
Goniometer Radius [mm] 240.00
Dist. Focus-Diverg. Slit [mm] 100.00
Incident Beam Monochromator No
Spinning No