Sleep quality, sleep patterns and consumption of energy drinks and other caffeinated beverages among...
10
Vol.5, No.8A2, 26-35 (2013) Health http://dx.doi.org/10.4236/health.2013.58A2005 Sleep quality, sleep patterns and consumption of energy drinks and other caffeinated beverages among Peruvian college students * Sixto E. Sanchez 1,2 , Claudia Martinez 3# , Raphaelle A. Oriol 3# , David Yanez 4 , Benjamín Castañeda 1 , Elena Sanchez 2 , Bizu Gelaye 3† , Michelle A. Williams 3 1 Universidad de San Martin de Porres, Lima, Peru 2 Asociacion Civil Proyectos en Salud (PROESA), Peru 3 Department of Epidemiology, Harvard School of Public Health, Multidisciplinary International Research Training Program, Boston, USA; † Corresponding Author: [email protected] 4 Department of Biostatistics, University of Washington, Seattle, USA Received 6 May 2013; revised 6 June 2013; accepted 17 July 2013 Copyright © 2013 Sixto E. Sanchez et al. This is an open access article distributed under the Creative Commons Attribution License, which permits unrestricted use, distribution, and reproduction in any medium, provided the original work is properly cited. ABSTRACT Objectives: To evaluate sleep quality in relation to lifestyle characteristics including consump- tion of energy drinks and other caffeinated bev- erages among Peruvian college students. Me- thods: A total of 2458 college students were in- vited to complete a self-administered question- naire that collected information about a variety of behaviors including consumption of energy drinks, caffeinated and alcoholic beverages. The Pittsburgh Sleep Quality Index (PSQI) was used to assess sleep quality. Logistic regression pro- cedures were used to estimate odds ratios (OR) and 95% confidence intervals (95% CI) for poor sleep quality in relation to lifestyle characteris- tics. Results: A total of 965 males and 1493 fe- male students were enrolled in the study. 52.0% of males and 58.4% of females experienced poor sleep quality (p = 0.002). Females (OR = 1.28; 95% CI 1.08 - 1.51) and those who reported consuming ≥3 stimulant beverages per week (OR = 1.88; 95% CI 1.42 - 2.50) had higher odds of poor sleep quality. Students who consumed 1 - 19 alcoholic beverages monthly (OR = 1.90; 95% CI 1.46 - 2.49) had a higher odds of long sleep latency. Consumption of ≥3 stimulant beverages per week was associated with day- time dysfunction due to sleep loss (OR = 1.45; 95% CI 1.10 - 1.90), short sleep duration (OR = 1.49; 95% CI 1.14 - 1.94), and use of sleep medication (OR = 2.10; 95% CI 1.35 - 3.28). Con- clusions: Consumption of energy drinks, other caffeinated beverages and alcoholic beverages are risk factors of poor sleep quality. Increased awareness of these associations should pro- mote interventions to improve students’ lifestyle habits, including consumption of alcoholic and caffeinated beverages, and overall health. Keywords: Sleep; Energy Drinks; College Students; Peru 1. INTRODUCTION As a pivotal modulator of hormone release, cardio- vascular activity and glucose regulation, sleep has been observed to have significant effects on a person’s daily life [1]. Insufficient sleep and irregular sleep-wake pat- terns have been observed at high rates on college cam- puses, and sleep problems have been associated with lower academic performance, impaired social relation- ships, more risk-taking behavior and poorer overall health [2,3]. College students tend to keep shorter sleep schedules and have irregular sleep patterns as they at- tempt to compensate for extended periods of sleep dep- rivation or sleep debt which are associated with poorer academic achievement and increased symptoms of de- pression [2-4]. Sleep loss and sleep debt are known to lead to irregular sleep patterns, daytime sleepiness, ex- haustion, inattentiveness and increased risks for obesity, diabetes, cardiovascular disease, hypertension, mood disorders, substance abuse and other health issues [5]. * Conflict of Interest: The authors have no competing interests to de- clare. # These authors contributed equally to this work. Copyright © 2013 SciRes. OPEN ACCESS
-
Upload
independent -
Category
Documents
-
view
5 -
download
0
Transcript of Sleep quality, sleep patterns and consumption of energy drinks and other caffeinated beverages among...
Vol.5, No.8A2, 26-35 (2013) Health http://dx.doi.org/10.4236/health.2013.58A2005
Sleep quality, sleep patterns and consumption of energy drinks and other caffeinated beverages among Peruvian college students*
Sixto E. Sanchez1,2, Claudia Martinez3#, Raphaelle A. Oriol3#, David Yanez4, Benjamín Castañeda1, Elena Sanchez2, Bizu Gelaye3†, Michelle A. Williams3
1Universidad de San Martin de Porres, Lima, Peru 2Asociacion Civil Proyectos en Salud (PROESA), Peru 3Department of Epidemiology, Harvard School of Public Health, Multidisciplinary International Research Training Program, Boston, USA; †Corresponding Author: [email protected] 4Department of Biostatistics, University of Washington, Seattle, USA Received 6 May 2013; revised 6 June 2013; accepted 17 July 2013 Copyright © 2013 Sixto E. Sanchez et al. This is an open access article distributed under the Creative Commons Attribution License, which permits unrestricted use, distribution, and reproduction in any medium, provided the original work is properly cited.
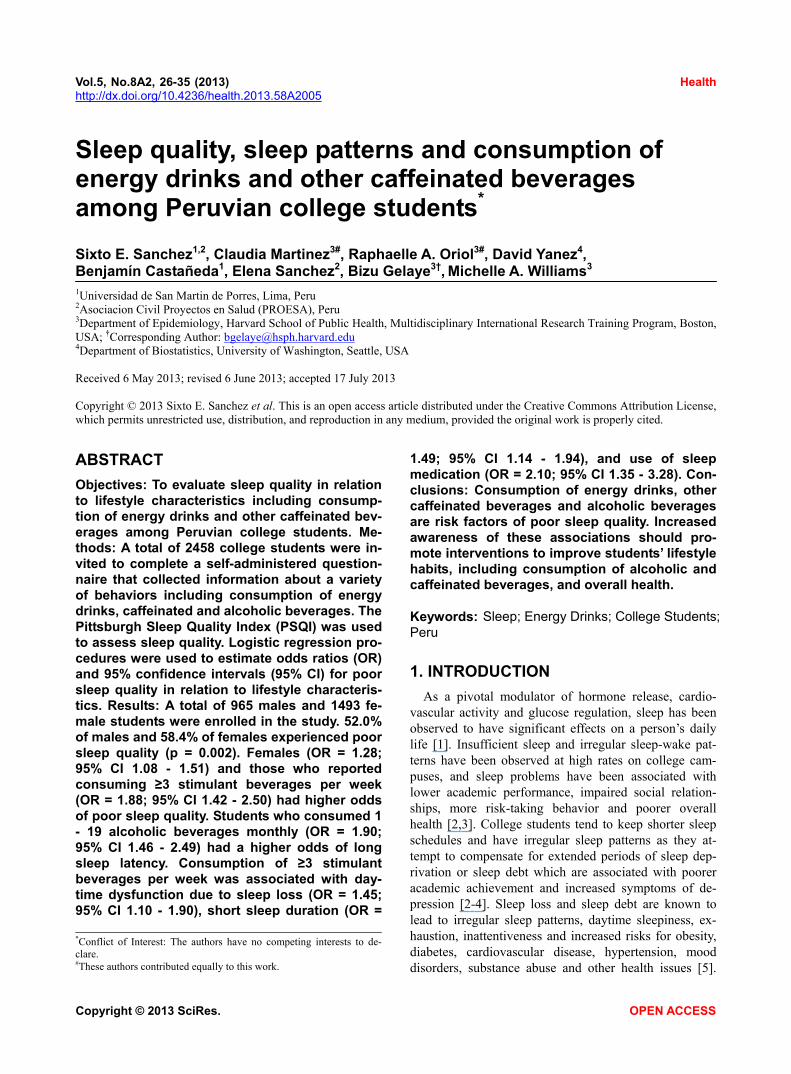
ABSTRACT Objectives: To evaluate sleep quality in relation to lifestyle characteristics including consump-tion of energy drinks and other caffeinated bev-erages among Peruvian college students. Me- thods: A total of 2458 college students were in-vited to complete a self-administered question-naire that collected information about a variety of behaviors including consumption of energy drinks, caffeinated and alcoholic beverages. The Pittsburgh Sleep Quality Index (PSQI) was used to assess sleep quality. Logistic regression pro- cedures were used to estimate odds ratios (OR) and 95% confidence intervals (95% CI) for poor sleep quality in relation to lifestyle characteris-tics. Results: A total of 965 males and 1493 fe-male students were enrolled in the study. 52.0% of males and 58.4% of females experienced poor sleep quality (p = 0.002). Females (OR = 1.28; 95% CI 1.08 - 1.51) and those who reported consuming ≥3 stimulant beverages per week (OR = 1.88; 95% CI 1.42 - 2.50) had higher odds of poor sleep quality. Students who consumed 1 - 19 alcoholic beverages monthly (OR = 1.90; 95% CI 1.46 - 2.49) had a higher odds of long sleep latency. Consumption of ≥3 stimulant beverages per week was associated with day-time dysfunction due to sleep loss (OR = 1.45; 95% CI 1.10 - 1.90), short sleep duration (OR =
1.49; 95% CI 1.14 - 1.94), and use of sleep medication (OR = 2.10; 95% CI 1.35 - 3.28). Con-clusions: Consumption of energy drinks, other caffeinated beverages and alcoholic beverages are risk factors of poor sleep quality. Increased awareness of these associations should pro-mote interventions to improve students’ lifestyle habits, including consumption of alcoholic and caffeinated beverages, and overall health. Keywords: Sleep; Energy Drinks; College Students; Peru
1. INTRODUCTION
As a pivotal modulator of hormone release, cardio- vascular activity and glucose regulation, sleep has been observed to have significant effects on a person’s daily life [1]. Insufficient sleep and irregular sleep-wake pat- terns have been observed at high rates on college cam- puses, and sleep problems have been associated with lower academic performance, impaired social relation- ships, more risk-taking behavior and poorer overall health [2,3]. College students tend to keep shorter sleep schedules and have irregular sleep patterns as they at- tempt to compensate for extended periods of sleep dep- rivation or sleep debt which are associated with poorer academic achievement and increased symptoms of de- pression [2-4]. Sleep loss and sleep debt are known to lead to irregular sleep patterns, daytime sleepiness, ex- haustion, inattentiveness and increased risks for obesity, diabetes, cardiovascular disease, hypertension, mood disorders, substance abuse and other health issues [5].
*Conflict of Interest: The authors have no competing interests to de-clare. #These authors contributed equally to this work.
Copyright © 2013 SciRes. OPEN ACCESS
S. E. Sanchez et al. / Health 5 (2013) 26-35 27
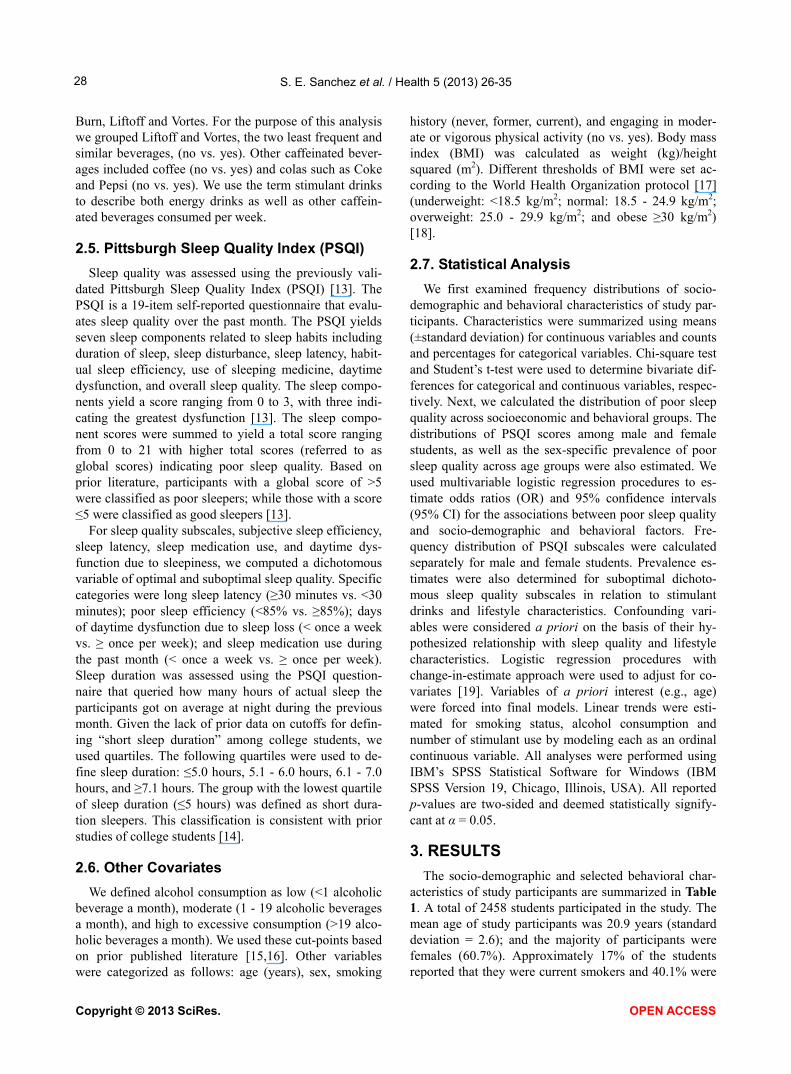
Sleep loss (≤7 hours per night) can have lasting negative effects on the cardiovascular, endocrine, immune and nervous systems [5].
To compensate for a lack of sleep, college students today appear to be developing a higher level of depend- ence on energy drinks and other caffeinated beverages that continue into adulthood [6,7]. Energy drinks con- tain caffeine as a primary ingredient and other sub- stances such as guarana (containing Guaranine, similar to caffeine), taurine (an amino acid) and sugar derivatives [8]. Caffeine has been shown to have both positive and negative behavioral, cognitive and health effects de- pending on the amount consumed. When consumed in excess, caffeine can disrupt sleep [9]. Caffeine consump- tion significantly reduces sleep time, lengthens the per- ceived onset of sleep, and disturbs sleep quality [10]. Excessive caffeine ingestion has been associated with increases in nocturnal body movements, impairments in the development of deeper stages of non-rapid eye movement (NREM) sleep and changes in the temporal organization of slow wave and rapid eye movement dur- ing sleep [6,10]. Disturbed NREM sleep coupled with the accumulation of adenosine and its sleep-inducing effect causes the phenomenon of sleep inertia [11]. Fur- thermore, investigators have noted that caffeine depend-ence may develop among individuals who consume caf-feine because of a subliminal need to counteract sleep inertia [6].
The amount of caffeine students consume is increas- ingly considered to be excessive compared with amounts once thought to be compatible with improving cognitive performance and alertness [12]. In light of the increasing prevalence of sleep disorders among college students and the deleterious effects of excessive consumption of caf- feinated beverages, we seek to estimate the prevalence of poor sleep quality among Peruvian college students and to examine the extent to which poor sleep quality and altered sleep patterns are associated with consump- tion of caffeinated beverages including energy drinks and other caffeinated beverages.
2. MATERIALS AND METHODS
2.1. Study Setting and Sample
This cross-sectional study was conducted in the Uni-versidad Nacional Mayor de San Marcos and Universi-dad San Martin de Porres in Lima, Peru from November 2010 through May, 2011. The Universidad Nacional Mayor de San Marcos is one of the oldest universities in the country founded in 1551. It is a university with na-tional leadership and recognized by the Latin American community and world for its academic excellence and scientific research. The Universidad San Martin de Por-res is one Peru’s largest universities and ranks among the
top three private universities in the country. The univer- sity has more than 30,000 students and 2500 faculty and administrative staff. The two universities were selected based on their large number of students and their will- ingness to participate in the study.
Flyers were posted in each department to invite par- ticipants. Students who expressed an interest in partici- pating in the study were invited to meet in a large class- room or an auditorium where they were informed about the purpose of the study and asked to participate in the survey. Students consenting to participate were asked to complete a self-administered individual surveys. There was no set time limit for completing the survey. A total of 2634 undergraduate students participated in the study. For the study described here, we excluded subjects with incomplete questionnaires and missing sleep quality scores (n = 176). The final analyzed sample included 2458 students (965 males and 1493 females).
2.2. Ethics Statement
All completed questionnaires were anonymous, and no personal identifiers were used. Given the minimum risk of the study and use of anonymous questionnaire, waiver of documentation of written consent form was approved by the ethics committees. The procedures used in this study were approved by the institutional review boards of Dos de Mayo Hospital and Universidad Nacional Mayor de San Marcos in Lima, Peru and the University of Washington, USA. The Harvard School of Public Health Office of Human Research Administration, USA granted approval to use the de-identified data set for analysis.
2.3. Data Collection and Variables
A self-administered questionnaire was used to collect information for this study. The questionnaire ascertained demographic information including age, sex, and educa-tion level. Questions were also included regarding be-havioral risk factors such as cigarette smoking, energy drinks, caffeinated beverages, and alcohol consumption. Measurements of the students’ height, weight, waist, and hip circumference were also collected by trained research staff after each questionnaire was completed.
2.4. Use of Energy Drinks and Other Caffeinated Beverages
Participants were first asked if they consumed more than one energy drinks or caffeinated beverages per week each month during the current academic semester/quarter. Participants answering “yes” were further asked to iden- tify the specific type of energy or caffeinated drinks. En- ergy drinks included international and local brands such as: Red Bull, Evolution Drink, Turbo, Maretazo, Shark,
Copyright © 2013 SciRes. OPEN ACCESS
S. E. Sanchez et al. / Health 5 (2013) 26-35 28
Burn, Liftoff and Vortes. For the purpose of this analysis we grouped Liftoff and Vortes, the two least frequent and similar beverages, (no vs. yes). Other caffeinated bever- ages included coffee (no vs. yes) and colas such as Coke and Pepsi (no vs. yes). We use the term stimulant drinks to describe both energy drinks as well as other caffein- ated beverages consumed per week.
2.5. Pittsburgh Sleep Quality Index (PSQI)
Sleep quality was assessed using the previously vali-dated Pittsburgh Sleep Quality Index (PSQI) [13]. The PSQI is a 19-item self-reported questionnaire that evalu-ates sleep quality over the past month. The PSQI yields seven sleep components related to sleep habits including duration of sleep, sleep disturbance, sleep latency, habit-ual sleep efficiency, use of sleeping medicine, daytime dysfunction, and overall sleep quality. The sleep compo-nents yield a score ranging from 0 to 3, with three indi-cating the greatest dysfunction [13]. The sleep compo-nent scores were summed to yield a total score ranging from 0 to 21 with higher total scores (referred to as global scores) indicating poor sleep quality. Based on prior literature, participants with a global score of >5 were classified as poor sleepers; while those with a score ≤5 were classified as good sleepers [13].
For sleep quality subscales, subjective sleep efficiency, sleep latency, sleep medication use, and daytime dys-function due to sleepiness, we computed a dichotomous variable of optimal and suboptimal sleep quality. Specific categories were long sleep latency (≥30 minutes vs. <30 minutes); poor sleep efficiency (<85% vs. ≥85%); days of daytime dysfunction due to sleep loss (< once a week vs. ≥ once per week); and sleep medication use during the past month (< once a week vs. ≥ once per week). Sleep duration was assessed using the PSQI question-naire that queried how many hours of actual sleep the participants got on average at night during the previous month. Given the lack of prior data on cutoffs for defin-ing “short sleep duration” among college students, we used quartiles. The following quartiles were used to de-fine sleep duration: ≤5.0 hours, 5.1 - 6.0 hours, 6.1 - 7.0 hours, and ≥7.1 hours. The group with the lowest quartile of sleep duration (≤5 hours) was defined as short dura-tion sleepers. This classification is consistent with prior studies of college students [14].
2.6. Other Covariates
We defined alcohol consumption as low (<1 alcoholic beverage a month), moderate (1 - 19 alcoholic beverages a month), and high to excessive consumption (>19 alco-holic beverages a month). We used these cut-points based on prior published literature [15,16]. Other variables were categorized as follows: age (years), sex, smoking
history (never, former, current), and engaging in moder-ate or vigorous physical activity (no vs. yes). Body mass index (BMI) was calculated as weight (kg)/height squared (m2). Different thresholds of BMI were set ac-cording to the World Health Organization protocol [17] (underweight: <18.5 kg/m2; normal: 18.5 - 24.9 kg/m2; overweight: 25.0 - 29.9 kg/m2; and obese ≥30 kg/m2) [18].
2.7. Statistical Analysis
We first examined frequency distributions of socio- demographic and behavioral characteristics of study par- ticipants. Characteristics were summarized using means (±standard deviation) for continuous variables and counts and percentages for categorical variables. Chi-square test and Student’s t-test were used to determine bivariate dif- ferences for categorical and continuous variables, respec- tively. Next, we calculated the distribution of poor sleep quality across socioeconomic and behavioral groups. The distributions of PSQI scores among male and female students, as well as the sex-specific prevalence of poor sleep quality across age groups were also estimated. We used multivariable logistic regression procedures to es- timate odds ratios (OR) and 95% confidence intervals (95% CI) for the associations between poor sleep quality and socio-demographic and behavioral factors. Fre- quency distribution of PSQI subscales were calculated separately for male and female students. Prevalence es- timates were also determined for suboptimal dichoto- mous sleep quality subscales in relation to stimulant drinks and lifestyle characteristics. Confounding vari- ables were considered a priori on the basis of their hy- pothesized relationship with sleep quality and lifestyle characteristics. Logistic regression procedures with change-in-estimate approach were used to adjust for co- variates [19]. Variables of a priori interest (e.g., age) were forced into final models. Linear trends were esti- mated for smoking status, alcohol consumption and number of stimulant use by modeling each as an ordinal continuous variable. All analyses were performed using IBM’s SPSS Statistical Software for Windows (IBM SPSS Version 19, Chicago, Illinois, USA). All reported p-values are two-sided and deemed statistically signify- cant at α = 0.05.
3. RESULTS
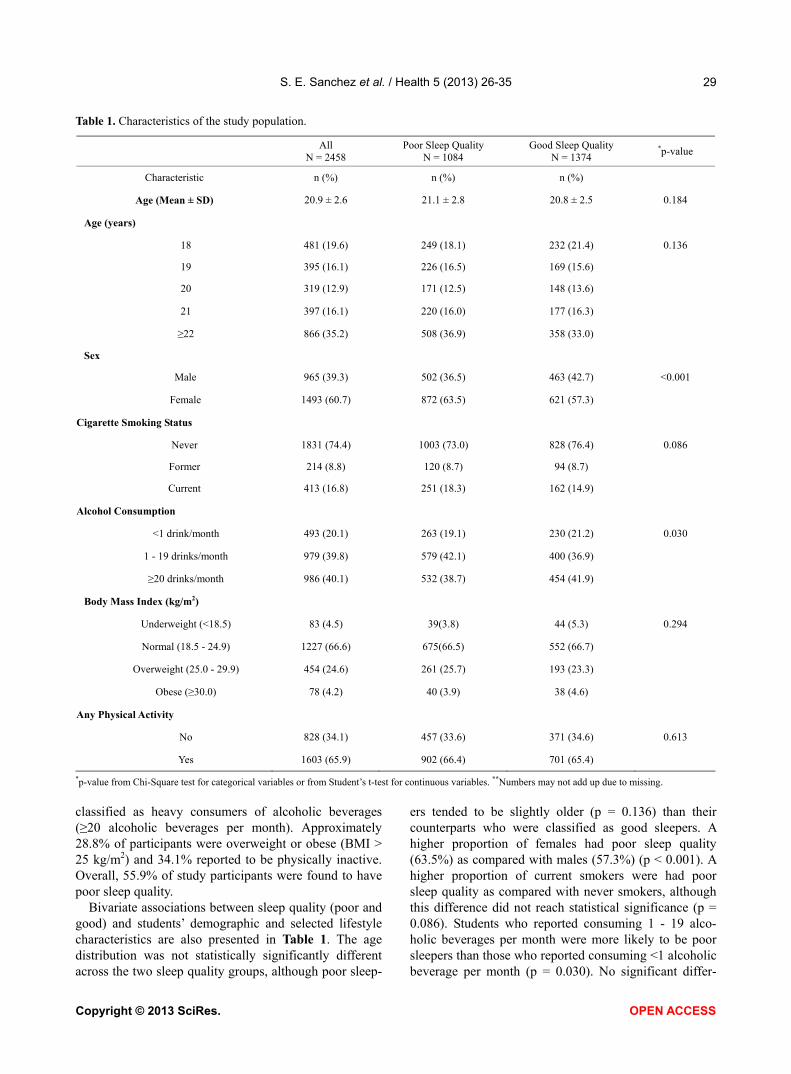
The socio-demographic and selected behavioral char-acteristics of study participants are summarized in Table 1. A total of 2458 students participated in the study. The mean age of study participants was 20.9 years (standard deviation = 2.6); and the majority of participants were females (60.7%). Approximately 17% of the students reported that they were current smokers and 40.1% were
Copyright © 2013 SciRes. OPEN ACCESS
S. E. Sanchez et al. / Health 5 (2013) 26-35
Copyright © 2013 SciRes. OPEN ACCESS
29
Table 1. Characteristics of the study population.
All
N = 2458 Poor Sleep Quality
N = 1084 Good Sleep Quality
N = 1374 *p-value
Characteristic n (%) n (%) n (%)
Age (Mean ± SD) 20.9 ± 2.6 21.1 ± 2.8 20.8 ± 2.5 0.184
Age (years)
18 481 (19.6) 249 (18.1) 232 (21.4) 0.136
19 395 (16.1) 226 (16.5) 169 (15.6)
20 319 (12.9) 171 (12.5) 148 (13.6)
21 397 (16.1) 220 (16.0) 177 (16.3)
≥22 866 (35.2) 508 (36.9) 358 (33.0)
Sex
Male 965 (39.3) 502 (36.5) 463 (42.7) <0.001
Female 1493 (60.7) 872 (63.5) 621 (57.3)
Cigarette Smoking Status
Never 1831 (74.4) 1003 (73.0) 828 (76.4) 0.086
Former 214 (8.8) 120 (8.7) 94 (8.7)
Current 413 (16.8) 251 (18.3) 162 (14.9)
Alcohol Consumption
<1 drink/month 493 (20.1) 263 (19.1) 230 (21.2) 0.030
1 - 19 drinks/month 979 (39.8) 579 (42.1) 400 (36.9)
≥20 drinks/month 986 (40.1) 532 (38.7) 454 (41.9)
Body Mass Index (kg/m2)
Underweight (<18.5) 83 (4.5) 39(3.8) 44 (5.3) 0.294
Normal (18.5 - 24.9) 1227 (66.6) 675(66.5) 552 (66.7)
Overweight (25.0 - 29.9) 454 (24.6) 261 (25.7) 193 (23.3)
Obese (≥30.0) 78 (4.2) 40 (3.9) 38 (4.6)
Any Physical Activity
No 828 (34.1) 457 (33.6) 371 (34.6) 0.613
Yes 1603 (65.9) 902 (66.4) 701 (65.4)
*p-value from Chi-Square test for categorical variables or from Student’s t-test for continuous variables. **Numbers may not add up due to missing.
classified as heavy consumers of alcoholic beverages (≥20 alcoholic beverages per month). Approximately 28.8% of participants were overweight or obese (BMI > 25 kg/m2) and 34.1% reported to be physically inactive. Overall, 55.9% of study participants were found to have poor sleep quality.
Bivariate associations between sleep quality (poor and good) and students’ demographic and selected lifestyle characteristics are also presented in Table 1. The age distribution was not statistically significantly different across the two sleep quality groups, although poor sleep-
ers tended to be slightly older (p = 0.136) than their counterparts who were classified as good sleepers. A higher proportion of females had poor sleep quality (63.5%) as compared with males (57.3%) (p < 0.001). A higher proportion of current smokers were had poor sleep quality as compared with never smokers, although this difference did not reach statistical significance (p = 0.086). Students who reported consuming 1 - 19 alco-holic beverages per month were more likely to be poor sleepers than those who reported consuming <1 alcoholic beverage per month (p = 0.030). No significant differ-
S. E. Sanchez et al. / Health 5 (2013) 26-35 30
ence was observed between sleep quality and BMI (p = 0.294) or physical activity (p = 0.613).
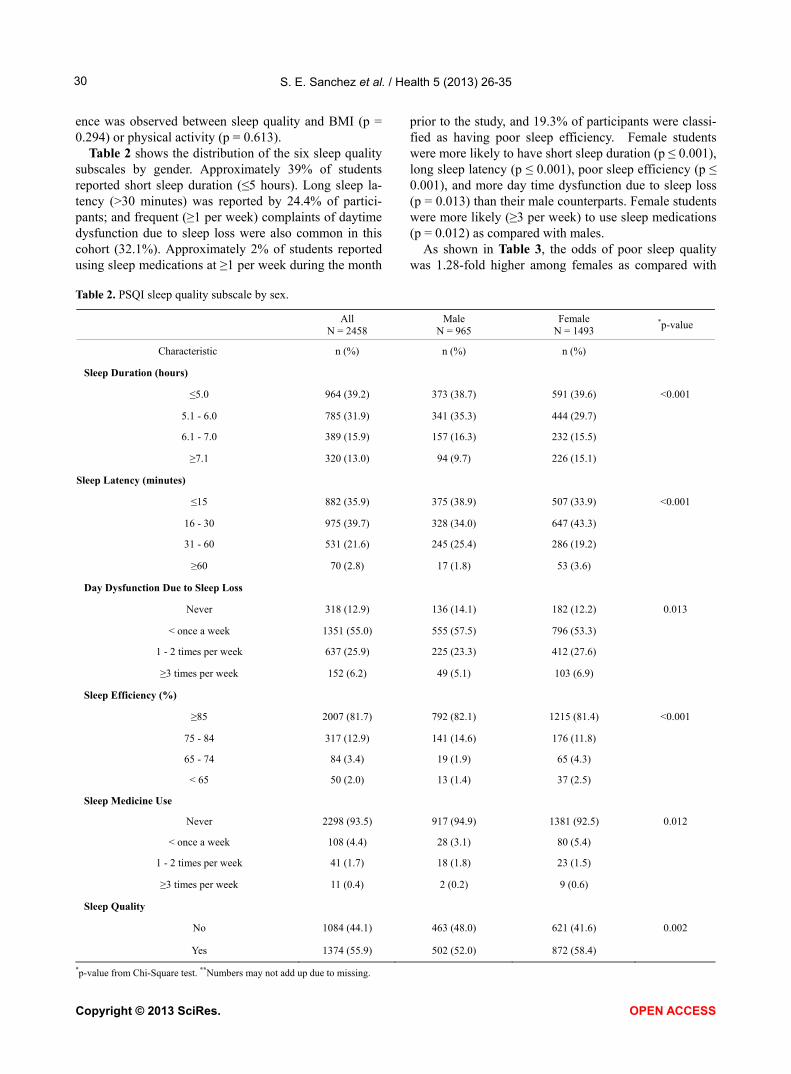
Table 2 shows the distribution of the six sleep quality subscales by gender. Approximately 39% of students reported short sleep duration (≤5 hours). Long sleep la-tency (>30 minutes) was reported by 24.4% of partici-pants; and frequent (≥1 per week) complaints of daytime dysfunction due to sleep loss were also common in this cohort (32.1%). Approximately 2% of students reported using sleep medications at ≥1 per week during the month
prior to the study, and 19.3% of participants were classi-fied as having poor sleep efficiency. Female students were more likely to have short sleep duration (p ≤ 0.001), long sleep latency (p ≤ 0.001), poor sleep efficiency (p ≤ 0.001), and more day time dysfunction due to sleep loss (p = 0.013) than their male counterparts. Female students were more likely (≥3 per week) to use sleep medications (p = 0.012) as compared with males.
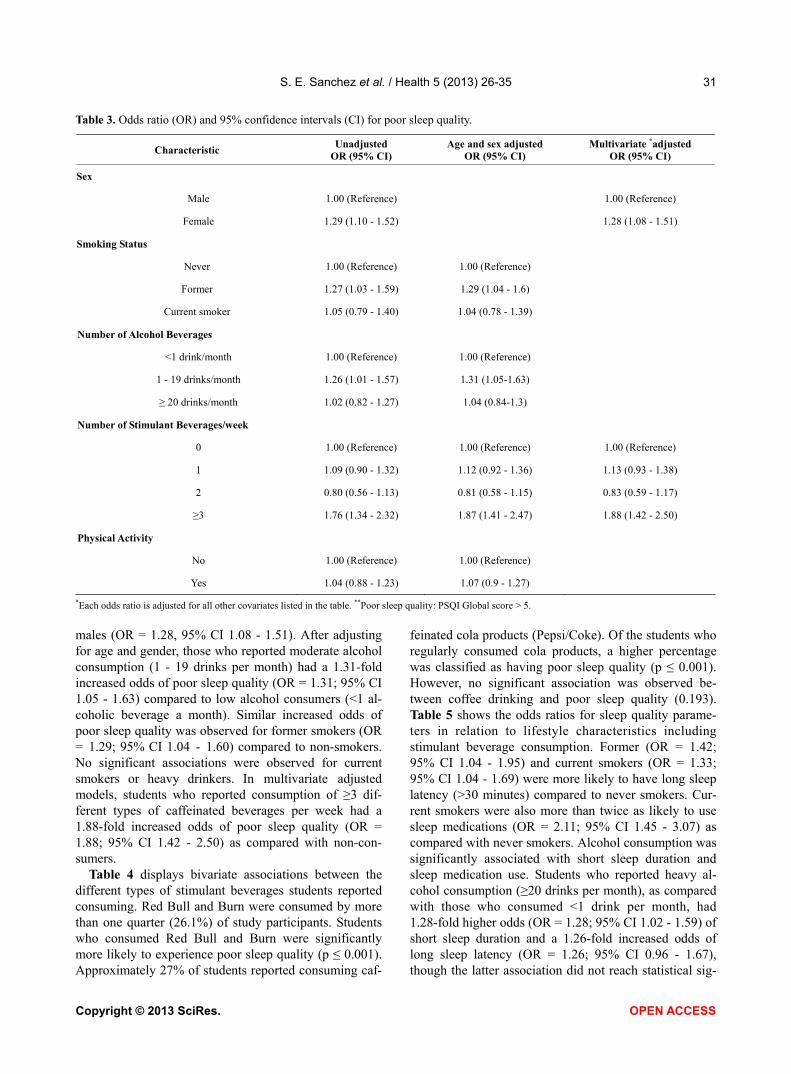
As shown in Table 3, the odds of poor sleep quality was 1.28-fold higher among females as compared with
Table 2. PSQI sleep quality subscale by sex.
All
N = 2458 Male
N = 965 Female
N = 1493 *p-value
Characteristic n (%) n (%) n (%)
Sleep Duration (hours)
≤5.0 964 (39.2) 373 (38.7) 591 (39.6) <0.001
5.1 - 6.0 785 (31.9) 341 (35.3) 444 (29.7)
6.1 - 7.0 389 (15.9) 157 (16.3) 232 (15.5)
≥7.1 320 (13.0) 94 (9.7) 226 (15.1)
Sleep Latency (minutes)
≤15 882 (35.9) 375 (38.9) 507 (33.9) <0.001
16 - 30 975 (39.7) 328 (34.0) 647 (43.3)
31 - 60 531 (21.6) 245 (25.4) 286 (19.2)
≥60 70 (2.8) 17 (1.8) 53 (3.6)
Day Dysfunction Due to Sleep Loss
Never 318 (12.9) 136 (14.1) 182 (12.2) 0.013
< once a week 1351 (55.0) 555 (57.5) 796 (53.3)
1 - 2 times per week 637 (25.9) 225 (23.3) 412 (27.6)
≥3 times per week 152 (6.2) 49 (5.1) 103 (6.9)
Sleep Efficiency (%)
≥85 2007 (81.7) 792 (82.1) 1215 (81.4) <0.001
75 - 84 317 (12.9) 141 (14.6) 176 (11.8)
65 - 74 84 (3.4) 19 (1.9) 65 (4.3)
< 65 50 (2.0) 13 (1.4) 37 (2.5)
Sleep Medicine Use
Never 2298 (93.5) 917 (94.9) 1381 (92.5) 0.012
< once a week 108 (4.4) 28 (3.1) 80 (5.4)
1 - 2 times per week 41 (1.7) 18 (1.8) 23 (1.5)
≥3 times per week 11 (0.4) 2 (0.2) 9 (0.6)
Sleep Quality
No 1084 (44.1) 463 (48.0) 621 (41.6) 0.002
Yes 1374 (55.9) 502 (52.0) 872 (58.4)
*p-value from Chi-Square test. **Numbers may not add up due to missing.
Copyright © 2013 SciRes. OPEN ACCESS
S. E. Sanchez et al. / Health 5 (2013) 26-35 31
Table 3. Odds ratio (OR) and 95% confidence intervals (CI) for poor sleep quality.
Characteristic Unadjusted
OR (95% CI) Age and sex adjusted
OR (95% CI) Multivariate *adjusted
OR (95% CI)
Sex
Male 1.00 (Reference) 1.00 (Reference)
Female 1.29 (1.10 - 1.52) 1.28 (1.08 - 1.51)
Smoking Status
Never 1.00 (Reference) 1.00 (Reference)
Former 1.27 (1.03 - 1.59) 1.29 (1.04 - 1.6)
Current smoker 1.05 (0.79 - 1.40) 1.04 (0.78 - 1.39)
Number of Alcohol Beverages
<1 drink/month 1.00 (Reference) 1.00 (Reference)
1 - 19 drinks/month 1.26 (1.01 - 1.57) 1.31 (1.05-1.63)
≥ 20 drinks/month 1.02 (0.82 - 1.27) 1.04 (0.84-1.3)
Number of Stimulant Beverages/week
0 1.00 (Reference) 1.00 (Reference) 1.00 (Reference)
1 1.09 (0.90 - 1.32) 1.12 (0.92 - 1.36) 1.13 (0.93 - 1.38)
2 0.80 (0.56 - 1.13) 0.81 (0.58 - 1.15) 0.83 (0.59 - 1.17)
≥3 1.76 (1.34 - 2.32) 1.87 (1.41 - 2.47) 1.88 (1.42 - 2.50)
Physical Activity
No 1.00 (Reference) 1.00 (Reference)
Yes 1.04 (0.88 - 1.23) 1.07 (0.9 - 1.27)
*Each odds ratio is adjusted for all other covariates listed in the table. **Poor sleep quality: PSQI Global score > 5.
males (OR = 1.28, 95% CI 1.08 - 1.51). After adjusting for age and gender, those who reported moderate alcohol consumption (1 - 19 drinks per month) had a 1.31-fold increased odds of poor sleep quality (OR = 1.31; 95% CI 1.05 - 1.63) compared to low alcohol consumers (<1 al-coholic beverage a month). Similar increased odds of poor sleep quality was observed for former smokers (OR = 1.29; 95% CI 1.04 - 1.60) compared to non-smokers. No significant associations were observed for current smokers or heavy drinkers. In multivariate adjusted models, students who reported consumption of ≥3 dif-ferent types of caffeinated beverages per week had a 1.88-fold increased odds of poor sleep quality (OR = 1.88; 95% CI 1.42 - 2.50) as compared with non-con- sumers.
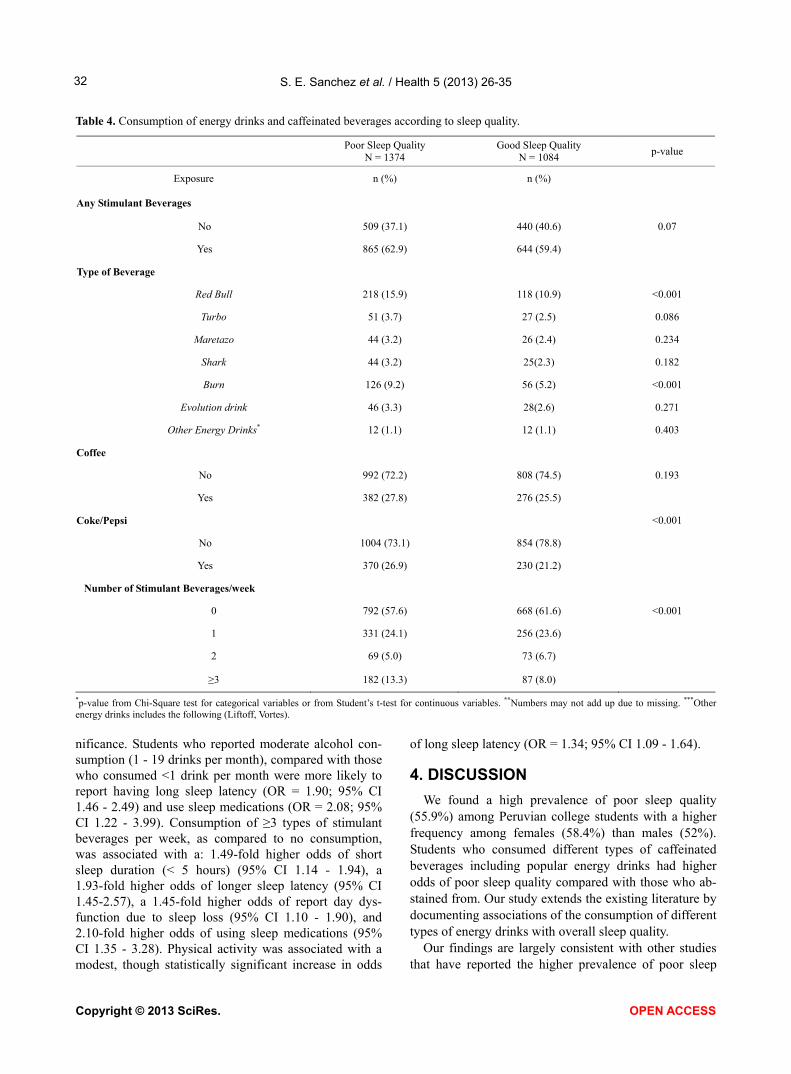
Table 4 displays bivariate associations between the different types of stimulant beverages students reported consuming. Red Bull and Burn were consumed by more than one quarter (26.1%) of study participants. Students who consumed Red Bull and Burn were significantly more likely to experience poor sleep quality (p ≤ 0.001). Approximately 27% of students reported consuming caf-
feinated cola products (Pepsi/Coke). Of the students who regularly consumed cola products, a higher percentage was classified as having poor sleep quality (p ≤ 0.001). However, no significant association was observed be-tween coffee drinking and poor sleep quality (0.193). Table 5 shows the odds ratios for sleep quality parame-ters in relation to lifestyle characteristics including stimulant beverage consumption. Former (OR = 1.42; 95% CI 1.04 - 1.95) and current smokers (OR = 1.33; 95% CI 1.04 - 1.69) were more likely to have long sleep latency (>30 minutes) compared to never smokers. Cur-rent smokers were also more than twice as likely to use sleep medications (OR = 2.11; 95% CI 1.45 - 3.07) as compared with never smokers. Alcohol consumption was significantly associated with short sleep duration and sleep medication use. Students who reported heavy al-cohol consumption (≥20 drinks per month), as compared with those who consumed <1 drink per month, had 1.28-fold higher odds (OR = 1.28; 95% CI 1.02 - 1.59) of short sleep duration and a 1.26-fold increased odds of long sleep latency (OR = 1.26; 95% CI 0.96 - 1.67), hough the latter association did not reach statistical sig- t
Copyright © 2013 SciRes. OPEN ACCESS
S. E. Sanchez et al. / Health 5 (2013) 26-35 32
Table 4. Consumption of energy drinks and caffeinated beverages according to sleep quality.
Poor Sleep Quality
N = 1374 Good Sleep Quality
N = 1084 p-value
Exposure n (%) n (%)
Any Stimulant Beverages
No 509 (37.1) 440 (40.6) 0.07
Yes 865 (62.9) 644 (59.4)
Type of Beverage
Red Bull 218 (15.9) 118 (10.9) <0.001
Turbo 51 (3.7) 27 (2.5) 0.086
Maretazo 44 (3.2) 26 (2.4) 0.234
Shark 44 (3.2) 25(2.3) 0.182
Burn 126 (9.2) 56 (5.2) <0.001
Evolution drink 46 (3.3) 28(2.6) 0.271
Other Energy Drinks* 12 (1.1) 12 (1.1) 0.403
Coffee
No 992 (72.2) 808 (74.5) 0.193
Yes 382 (27.8) 276 (25.5)
Coke/Pepsi <0.001
No 1004 (73.1) 854 (78.8)
Yes 370 (26.9) 230 (21.2)
Number of Stimulant Beverages/week
0 792 (57.6) 668 (61.6) <0.001
1 331 (24.1) 256 (23.6)
2 69 (5.0) 73 (6.7)
≥3 182 (13.3) 87 (8.0)
*p-value from Chi-Square test for categorical variables or from Student’s t-test for continuous variables. **Numbers may not add up due to missing. ***Other energy drinks includes the following (Liftoff, Vortes).
nificance. Students who reported moderate alcohol con-sumption (1 - 19 drinks per month), compared with those who consumed <1 drink per month were more likely to report having long sleep latency (OR = 1.90; 95% CI 1.46 - 2.49) and use sleep medications (OR = 2.08; 95% CI 1.22 - 3.99). Consumption of ≥3 types of stimulant beverages per week, as compared to no consumption, was associated with a: 1.49-fold higher odds of short sleep duration (< 5 hours) (95% CI 1.14 - 1.94), a 1.93-fold higher odds of longer sleep latency (95% CI 1.45-2.57), a 1.45-fold higher odds of report day dys-function due to sleep loss (95% CI 1.10 - 1.90), and 2.10-fold higher odds of using sleep medications (95% CI 1.35 - 3.28). Physical activity was associated with a modest, though statistically significant increase in odds
of long sleep latency (OR = 1.34; 95% CI 1.09 - 1.64).
4. DISCUSSION
We found a high prevalence of poor sleep quality (55.9%) among Peruvian college students with a higher frequency among females (58.4%) than males (52%). Students who consumed different types of caffeinated beverages including popular energy drinks had higher odds of poor sleep quality compared with those who ab-stained from. Our study extends the existing literature by documenting associations of the consumption of different types of energy drinks with overall sleep quality.
Our findings are largely consistent with other studies hat have reported the higher prevalence of poor sleep t
Copyright © 2013 SciRes. OPEN ACCESS
S. E. Sanchez et al. / Health 5 (2013) 26-35 33
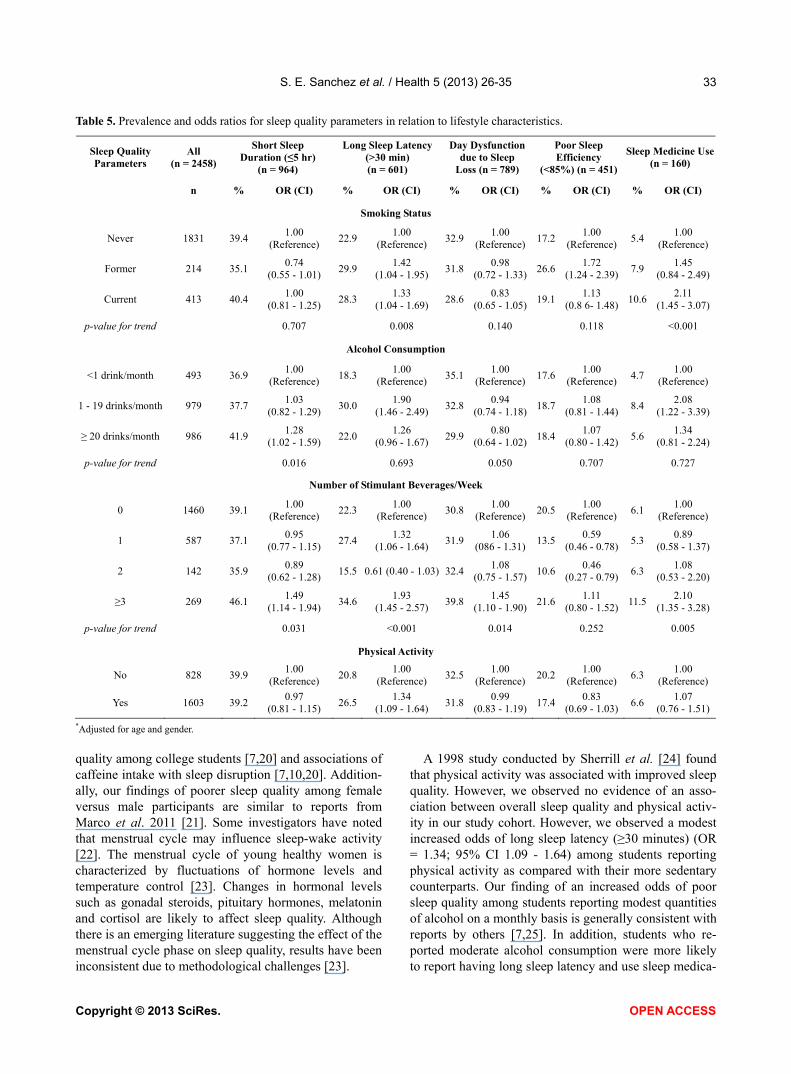
Table 5. Prevalence and odds ratios for sleep quality parameters in relation to lifestyle characteristics.
Sleep Quality Parameters
All (n = 2458)
Short Sleep Duration (≤5 hr)
(n = 964)
Long Sleep Latency (>30 min) (n = 601)
Day Dysfunction due to Sleep
Loss (n = 789)
Poor Sleep Efficiency
(<85%) (n = 451)
Sleep Medicine Use (n = 160)
n % OR (CI) % OR (CI) % OR (CI) % OR (CI) % OR (CI)
Smoking Status
Never 1831 39.4 1.00
(Reference) 22.9
1.00 (Reference)
32.91.00
(Reference)17.2
1.00 (Reference)
5.4 1.00
(Reference)
Former 214 35.1 0.74
(0.55 - 1.01) 29.9
1.42 (1.04 - 1.95)
31.80.98
(0.72 - 1.33)26.6
1.72 (1.24 - 2.39)
7.9 1.45
(0.84 - 2.49)
Current 413 40.4 1.00
(0.81 - 1.25) 28.3
1.33 (1.04 - 1.69)
28.60.83
(0.65 - 1.05)19.1
1.13 (0.8 6- 1.48)
10.6 2.11
(1.45 - 3.07)
p-value for trend 0.707 0.008 0.140 0.118 <0.001
Alcohol Consumption
<1 drink/month 493 36.9 1.00
(Reference) 18.3
1.00 (Reference)
35.11.00
(Reference)17.6
1.00 (Reference)
4.7 1.00
(Reference)
1 - 19 drinks/month 979 37.7 1.03
(0.82 - 1.29) 30.0
1.90 (1.46 - 2.49)
32.80.94
(0.74 - 1.18)18.7
1.08 (0.81 - 1.44)
8.4 2.08
(1.22 - 3.39)
≥ 20 drinks/month 986 41.9 1.28
(1.02 - 1.59) 22.0
1.26 (0.96 - 1.67)
29.90.80
(0.64 - 1.02)18.4
1.07 (0.80 - 1.42)
5.6 1.34
(0.81 - 2.24)
p-value for trend 0.016 0.693 0.050 0.707 0.727
Number of Stimulant Beverages/Week
0 1460 39.1 1.00
(Reference) 22.3
1.00 (Reference)
30.81.00
(Reference)20.5
1.00 (Reference)
6.1 1.00
(Reference)
1 587 37.1 0.95
(0.77 - 1.15) 27.4
1.32 (1.06 - 1.64)
31.91.06
(086 - 1.31)13.5
0.59 (0.46 - 0.78)
5.3 0.89
(0.58 - 1.37)
2 142 35.9 0.89
(0.62 - 1.28) 15.5 0.61 (0.40 - 1.03) 32.4
1.08 (0.75 - 1.57)
10.60.46
(0.27 - 0.79) 6.3
1.08 (0.53 - 2.20)
≥3 269 46.1 1.49
(1.14 - 1.94) 34.6
1.93 (1.45 - 2.57)
39.81.45
(1.10 - 1.90)21.6
1.11 (0.80 - 1.52)
11.5 2.10
(1.35 - 3.28)
p-value for trend 0.031 <0.001 0.014 0.252 0.005
Physical Activity
No 828 39.9 1.00
(Reference) 20.8
1.00 (Reference)
32.51.00
(Reference)20.2
1.00 (Reference)
6.3 1.00
(Reference)
Yes 1603 39.2 0.97
(0.81 - 1.15) 26.5
1.34 (1.09 - 1.64)
31.80.99
(0.83 - 1.19)17.4
0.83 (0.69 - 1.03)
6.6 1.07
(0.76 - 1.51)
*Adjusted for age and gender.
quality among college students [7,20] and associations of caffeine intake with sleep disruption [7,10,20]. Addition-ally, our findings of poorer sleep quality among female versus male participants are similar to reports from Marco et al. 2011 [21]. Some investigators have noted that menstrual cycle may influence sleep-wake activity [22]. The menstrual cycle of young healthy women is characterized by fluctuations of hormone levels and temperature control [23]. Changes in hormonal levels such as gonadal steroids, pituitary hormones, melatonin and cortisol are likely to affect sleep quality. Although there is an emerging literature suggesting the effect of the menstrual cycle phase on sleep quality, results have been inconsistent due to methodological challenges [23].
A 1998 study conducted by Sherrill et al. [24] found that physical activity was associated with improved sleep quality. However, we observed no evidence of an asso-ciation between overall sleep quality and physical activ-ity in our study cohort. However, we observed a modest increased odds of long sleep latency (≥30 minutes) (OR = 1.34; 95% CI 1.09 - 1.64) among students reporting physical activity as compared with their more sedentary counterparts. Our finding of an increased odds of poor sleep quality among students reporting modest quantities of alcohol on a monthly basis is generally consistent with reports by others [7,25]. In addition, students who re-ported moderate alcohol consumption were more likely to report having long sleep latency and use sleep medica-
Copyright © 2013 SciRes. OPEN ACCESS
S. E. Sanchez et al. / Health 5 (2013) 26-35 34
tions. However, we noted no clear pattern of a linear trend in the odds of poor sleep quality with heavy alco- hol consumption. Our observations are in agreement with the results of most prior studies that showed alcohol drinking as a risk factor to poor sleep quality [2]. It is also important to note that there is a growing body of evidence that shows the popularity of alcohol mixed with energy drinks among college students, especially while partying, that warrants further among our study popula- tion [8,12].
Our study had several notable strengths. These include the large sample size of 2458 participants, the fact that anthropometric measures (e.g., weight and height) were directly measured by trained research personnel, and the instruments we used have been widely used in large population based survey settings. However, the results of our study should be interpreted in the context of some limitations. First, we did not use random sampling, but instead considered subjects who were willing to partici- pate in the study, thus our findings may be subject to volunteer bias. Second, there may be substantial hetero- geneity among poor sleepers (PSQI total scores among those classified as poor sleepers), which could mask the association between sleep quality and some of the life- style characteristics considered. Third, although we ad-justed for several potential confounders, we cannot ex-clude the possibility of residual confounding due to mis-classification of adjusted variables or confounding by other unmeasured variables. Fourth, we did not have information concerning the frequency and dose of energy drinks consumption in the present study. As a result, it is possible that the binary grouping of energy drinks con- sumption attenuated the magnitude of association to- wards null. Lastly, as this study followed a cross-sec- tional data collection design, the temporal relationship between poor sleep quality and energy drinks, alcohol consumption, and/or cigarette smoking could not be de-termined. A longitudinal study design would better allow determination of the prospective relationship between stimulant use and altered sleep quality.
Observed associations of poor sleep quality with con- sumption of caffeinated beverages are biologically plau- sible. Briefly, caffeine is a methylxanthine and adenosine receptor antagonist that has potent psychoactive proper- ties [26]. The concentration of adenosine in the brain determines the depth and duration of sleep because it is a physiologic sleep factor [27]. Furthermore, adenosine is an essential component of homeostatic sleep regulation [28]. Adenosine increases drowsiness, decreases electro-encephalogram arousal, and enhances slow wave activity during sleep [26]. As a result of sleep, adenosine levels decrease slowly [29]. When caffeine is consumed, it acts as an adenosine receptor antagonist by binding to G pro- tein coupled receptors in the brain that mediate the cel-
lular effects of adenosine [26]. Additionally, investigators have reported that caffeine reduces homeostatic sleep pressure and decreases slow wave power in the frontal, central and parietal regions [30]. Taken together research documenting diverse mechanisms through which caf- feine acts on, the central nervous system [26,31] rein-forces epidemiological evidence linking sleep distur-bances and poor sleep quality with higher frequencies and doses of consumption.
Energy drinks, especially those containing high caf- feine concentrations, are targeted to young adult con- sumers. Moreover, college students are increasingly re- porting use energy drinks and other stimulants as a means of avoiding sleep or compensating for insufficient sleep and enhancing academic performance. Given these behavioral patterns, and given known adverse health effects of excessive caffeine use and sleep deprivation, parents, young adults and educators should also be made more aware and perhaps be encouraged to develop and implement wellness programs and policies that promote the avoidance of excessive use of caffeine and other stimulants (e.g., discourage consumption of energy drink by prohibiting sale of energy drinks in campus stores). Research that elucidates independent and joint effects of such wellness programs and policies will give public health professionals and educators the information and impetus needing for investing and promoting cam- paigns to address poor sleep quality in young adults.
5. ACKNOWLEDGEMENTS
C.M. and R.O. were research training fellows with the Multidisci-
plinary International Research Training (MIRT) Program of the Har-
vard University School of Public Health when this research study was
completed. The Multidisciplinary International Research Program is
supported by an award from the National Institutes of Health, National
Institute on Minority Health and Health Disparities (T37-MD000149).
REFERENCES
[1] Cheng, S.H., Shih, C.C., Lee, I.H., Hou, Y.W., Chen, K.C., et al. (2012) A study on the sleep quality of incoming uni-versity students. Psychiatry Research, 197, 270-274. doi:10.1016/j.psychres.2011.08.011
[2] Lund, H.G., Reider, B.D., Whiting, A.B. and Prichard, J.R. (2010) Sleep patterns and predictors of disturbed sleep in a large population of college students. Journal of Adoles-cent Health, 46, 124-132. doi:10.1016/j.jadohealth.2009.06.016
[3] Gaultney, J.F. (2011) The prevalence of sleep disorders in college students: Impact on academic performance. The Journal of American College Health, 59, 91-97. doi:10.1080/07448481.2010.483708
[4] Thacher, P.V. (2008) University students and “the all nighter”: Correlates and patterns of students’ engagement in a single night of total sleep deprivation. Behavioral
Copyright © 2013 SciRes. OPEN ACCESS
S. E. Sanchez et al. / Health 5 (2013) 26-35
Copyright © 2013 SciRes. OPEN ACCESS
35
Sleep Medicine, 6, 16-31. doi:10.1080/15402000701796114
[5] IOM (2006) Institute of Medicine, Committee on Sleep Medicine and Research. In: Harvey R.C. and Bruce M.A., Eds., Sleep Disorders and Sleep Deprivation: An Unmet Public Health Problem, National Academy of Sciences Press, Washington DC.
[6] Pollak, C.P. and Bright, D. (2003) Caffeine consumption and weekly sleep patterns in US seventh-, eighth-, and ninth-graders. Pediatrics, 111, 42-46. doi:10.1542/peds.111.1.42
[7] Lohsoonthorn, V., Khidir, H., Casillas, G., Lertmaharit, S., Tadesse, M.G., Pensuksan, W.C., Rattananupong, T., Ge-laye, B. and Williams, M.A. (2012) Sleep quality and sleep patterns in relation to consumption of energy drinks, caffeinated beverages, and other stimulants among Thai college students. Sleep Breath (Epub ahead of print). doi:10.1007/s11325-012-0792-1
[8] Howland, J. and Rohsenow, D.J. (2013) Risks of energy drinks mixed with alcohol. JAMA, 309, 245-246. doi:10.1001/jama.2012.187978
[9] Březinová, V. (1974) Effect of caffeine on sleep: EEG study in late middle age people. British Journal of Clini- cal Pharmacology, 1, 203-208.
[10] Hindmarch, I., Rigney, U., Stanley, N., Quinlan, P., Ry- croft, J., et al. (2000) A naturalistic investigation of the effects of day-long consumption of tea, coffee and water on alertness, sleep onset and sleep quality. Psychophar- macology, 149, 203-216. doi:10.1007/s002130000383
[11] Van Dongen, H.P., Price, N.J., Mullington, J.M., Szuba, M.P., Kapoor, S.C., et al. (2001) Caffeine eliminates psy- chomotor vigilance deficits from sleep inertia. Sleep, 24, 813-819.
[12] Malinauskas, B.M., Aeby, V.G., Overton, R.F., Carpenter- Aeby, T. and Barber-Heidal, K. (2007) A survey of energy drink consumption patterns among college students. Nu- trition Journal, 6, 35. doi:10.1186/1475-2891-6-35
[13] Buysse, D.J., Reynolds, C.F., Monk, T.H., Berman, S.R. and Kupfer, D.J. (1989) The Pittsburgh sleep quality in-dex: A new instrument for psychiatric practice and re-search. Psychiatry Research, 28, 193-213. doi:10.1016/0165-1781(89)90047-4
[14] Carney, C.E., Edinger, J.D., Meyer, B., Lindman, L. and Istre, T. (2006) Daily activities and sleep quality in col- lege students. Chronobiology International, 23, 623-637. doi:10.1080/07420520600650695
[15] WHO (2004) Global status report on alcohol. World Health Organization. Department of Mental Health and Substance Abuse, Geneva.
[16] Freiberg, M.S., Cabral, H.J., Heeren, T.C., Vasan, R.S. and Curtis Ellison, R. (2004) Alcohol consumption and the prevalence of the metabolic syndrome in the US: A cross-sectional analysis of data from the third national health and nutrition examination survey. Diabetes Care, 27, 2954-2959. doi:10.2337/diacare.27.12.2954
[17] WHO (1995) Physical status: The use and interpretation of anthropometry. Report of a WHO Expert Committee, WHO, Geneva.
[18] Lowe, B., Spitzer, R.L., Grafe, K., Kroenke, K., Quenter, A., et al. (2004) Comparative validity of three screening questionnaires for DSM-IV depressive disorders and physicians’ diagnoses. Journal of Affective Disorders, 78, 131-140. doi:10.1016/S0165-0327(02)00237-9
[19] Rothman, K.J. and Greenland, S. (1998) Modern epide- miology. Lippincott-Raven, Philadelphia.
[20] Lemma, S., Patel, S.V., Tarekegn, Y.A., Tadesse, M.G., Berhane, Y., et al. (2012) The epidemiology of sleep quality, sleep patterns, consumption of caffeinated bev- erages, and khat use among Ethiopian college students. Sleep Disorders, 2012, 11. doi:10.1155/2012/583510
[21] Marco, C.A., Wolfson, A.R., Sparling, M. and Azuaje, A. (2011) Family socioeconomic status and sleep patterns of young adolescents. Behavioral Sleep Medicine, 10, 70-80. doi:10.1080/15402002.2012.636298
[22] Leibenluft, E., Fiero, P.L. and Rubinow, D.R. (1994) Effects of the menstrual cycle on dependent variables in mood disorder research. Archives of General Psychiatry, 51, 761-781. doi:10.1001/archpsyc.1994.03950100009002
[23] Krishnan, V. and Collop, N.A. (2006) Gender differences in sleep disorders. Current Opinion in Pulmonary Medi- cine, 12, 383-389. doi:10.1097/01.mcp.0000245705.69440.6a
[24] Sherrill, D.L., Kotchou, K. and Quan, S.F. (1998) Asso-ciation of physical activity and human sleep disorders. Archives of Internal Medicine, 158, 1894-1898. doi:10.1001/archinte.158.17.1894
[25] Roehrs, T. and Roth, T. (2001) Sleep, sleepiness, sleep disorders and alcohol use and abuse. Sleep Medicine Re-views, 5, 287-297. doi:10.1053/smrv.2001.0162
[26] Nehlig, A. and Boyet, S. (2000) Dose-response study of caffeine effects on cerebral functional activity with a spe- cific focus on dependence. Brain Research, 858, 71-77. doi:10.1016/S0006-8993(99)02480-4
[27] Calamaro, C.J., Mason, T.B. and Ratcliffe, S.J. (2009) Adolescents living the 24/7 lifestyle: Effects of caffeine and technology on sleep duration and daytime function- ing. Pediatrics, 123, e1005-e1010. doi:10.1542/peds.2008-3641
[28] Benington, J.H. and Heller, H.C. (1995) Restoration of brain energy metabolism as the function of sleep. Pro- gress in Neurobiology, 45, 347-360. doi:10.1016/0301-0082(94)00057-O
[29] Porkka-Heiskanen, T., Alanko, L., Kalinchuk, A. and Stenberg, D. (2002) Adenosine and sleep. Sleep Medicine Reviews, 6, 321-332. doi:10.1053/smrv.2001.0201
[30] Drapeau, C., Hamel-Hebert, I., Robillard, R., Selmaoui, B., Filipini, D., et al. (2006) Challenging sleep in aging: The effects of 200 mg of caffeine during the evening in young and middle-aged moderate caffeine consumers. Sleep Medicine Reviews, 15, 133-141. doi:10.1111/j.1365-2869.2006.00518.x
[31] Landolt, H.P., Retey, J.V., Tonz, K., Gottselig, J.M., Khatami, R., et al. (2004) Caffeine attenuates waking and sleep electroencephalographic markers of sleep homeo- stasis in humans. Neuropsychopharmacology, 29, 1933- 1939. doi:10.1038/sj.npp.1300526