Academic Stress and Suicidal Ideation: Moderated Mediation ...
Upload
independentCategory
view
0download
0
JN-00894-2003.R2
1
Sleep deprivation effects on growth factor expression in neonatal rats: A
potential role for BDNF in the mediation of delta power
Ilana S Hairston1,2, Christelle Peyron3, Daniel P. Denning2, Norman F. Ruby2, Judith
Flores2, Robert M. Sapolsky2, H. Craig Heller2, Bruce F. O’Hara2,4
1 To whom correspondence should be addressed
Ilana Hairston2 Department of biological sciences, Stanford University
371 Serra Mall
Stanford, CA 94305-5020
Tel: +1-650-7235882; Fax: +1-650-7255356
3 CNRS UMR5167
Faculté de Médecine RTH Laënnec
7, rue Guillaume Paradin
69 372 LYON cedex 08, France
4 Department of Biology, University of Kentucky
101 Morgan Bldg
Lexington, KY 40506-0225
Running header: Sleep deprivation in neonatal rats
FINAL ACCEPTED VERSION
Copyright (c) 2003 by the American Physiological Society.
Articles in PresS. J Neurophysiol (December 10, 2003). 10.1152/jn.00894.2003
JN-00894-2003.R2
2
Abstract:
The sleeping brain differs from the waking brain in its electrophysiological and
molecular properties, including the expression of growth factors and immediate early
genes (IEG). Sleep architecture and homeostatic regulation of sleep in neonates is distinct
from that of adults. Hence, the present study addressed the question whether the unique
homeostatic response to sleep deprivation in neonates is reflected in mRNA expression of
the IEG cFos, brain-derived nerve growth factor (BDNF), and basic fibroblast growth
factor (FGF2) in the cortex. As sleep deprivation is stressful to developing rats, we also
investigated whether the increased levels of corticosterone would affect the expression of
growth factors in the hippocampus, known to be sensitive to glucocorticoid levels. At
postnatal days 16, 20, and 24 rats were subjected to either sleep deprivation, maternal
separation without sleep deprivation, sleep deprivation with two hours recovery sleep, or
no intervention. mRNA expression was quantified in the cortex and hippocampus. cFos
was increased after sleep deprivation, and was similar to control level after two hours
recovery sleep irrespective of age or brain region. BDNF was increased by sleep
deprivation in the cortex at P20 and P24, and only at P24 in the hippocampus. FGF2
increased during recovery sleep at all ages in both brain regions. We conclude that
cortical BDNF expression reflects the onset of adult sleep-homeostatic response, while
the profile of expression of both growth factors suggests a trophic effect of mild sleep
deprivation.
Key words: cFos; FGF2; corticosterone; growth factors; hippocampus; cortex
JN-00894-2003.R2
3
Introduction
Neonatal sleep patterns differ from those of adults (reviewed in Davis et al. 1999).
In adult rats, sleep deprivation of up to 12 hrs causes an increase in the proportion of the
1-4 Hz frequency range (delta power) in the EEG during slow-wave sleep (SWS),
whereby the level of increase is reliably predicted by the duration of preceding wake
(Franken et al. 1991; Tobler and Borbély 1990). Conversely, neonatal rats do not show
this correlation between delta power (DP) and wake history prior to post-natal day 20
(P20) but do display a compensatory increase in the amount of SWS (Frank et al. 1998).
This suggests that the neonate’s sleep regulatory system detects sleep loss but uses a
different compensatory strategy.
In adults, the expression of a number of genes in the cortex, such as immediate
early genes (IEG), and growth factors, is higher during wake than during SWS (Cirelli
2002; O'Hara et al. 1993; Pompeiano et al. 1994; Terao et al. 2003). This study
investigated whether the distinct homeostatic response to sleep deprivation observed in
neonatal rats is reflected in the pattern of gene expression. Brain derived growth factor
(BDNF), basic fibroblast growth factor (FGF2), their receptors (TrkB and FGF2r,
respectively), and cFos were measured after sleep deprivation and recovery sleep at P16,
P20, and P24.
FGF2 mRNA increases with elevated corticosterone (CORT) levels in the
hippocampus (Chao and McEwen 1994; Hansson et al. 2000; Molteni et al. 2001).
Increased CORT levels are associated with a transient (3 hrs) increase (Marmigere et al.
2003) and long-term (>6 hrs) decrease of BDNF in the hippocampus (Nibuya et al. 1999;
Ueyama et al. 1997). Conversely, sleep deprivation and selective paradoxical sleep (PS)
JN-00894-2003.R2
4
deprivation have been shown to have no effect on BDNF expression in the hippocampus
(Sei et al. 2000; Taishi et al. 2001). Consequently, as sleep deprivation has been
previously shown to induce a stress response in neonatal rats (Hairston et al. 2001), we
expected FGF2 expression in the hippocampus to increase, and BDNF expression to
either increase or remain unchanged.
We found that the onset of the sleep deprivation induced-increase in DP coincided
with the onset of sleep deprivation induced-increase in BDNF in the cortex, i.e., P20.
FGF2 expression was increased during recovery sleep irrespective of age and brain
region, consistent with the elevated levels of CORT.
JN-00894-2003.R2
5
Materials and methods:
Animals: A total of 107 animals were used in this study. Long-Evans rats were bred in
the lab and maintained on a 12:12 light/dark cycle, at an ambient temperature of 22°C.
Food and water were available ad libitum. Day of birth was designated postnatal day 0
(P0), and litter sizes were culled to 8-12 pups. Surgery, recording, and sleep deprivation
procedures were performed as previously described (Hairston et al. 2001). Briefly, at P9,
six male and female pups per litter were anaesthetized with methoxyflurane inhalant
(Metofane, Mallinckrodt Veterinary, Australia). Four EEG electrodes (no. 000 stainless
steel screws) were fastened bilaterally in frontal and parietal bones. Three EMG
electrodes (stainless steel wire) were inserted into the nuchal muscles. All electrodes
were attached to a seven-pin electric socket that was fastened to the skull with dental
acrylic and the incision was sutured. After surgery pups were left to regain consciousness
on a heating pad for approximately 1 h and then returned to their litter.
EEG/EMG recording: EEG signals were recorded from either left or right hemispheres
(fronto-parietal derivation) on a Grass 7 polygraph with one channel for differential EEG
and one for differential EMG, per animal. EEG potentials were filtered at 0.3 and 35 Hz
(1/2 max, 6 dB/octave), digitized at 100 Hz and stored in 10 sec epochs on a personal
computer. The EMG signal was full-wave rectified and integrated for each epoch. The
EEG signal was Fourier transformed and vigilance states were scored using a modified
scoring algorithm (Frank and Heller 1997a). Epochs with high power in 1-4 Hz range
(delta power) and low EMG signal were scored as slow-wave sleep (SWS), epochs with
low delta power and low EMG signal were scored as paradoxical sleep (PS), epochs with
JN-00894-2003.R2
6
low delta power and high EMG signal were scored as wake. To determine the effects of
sleep deprivation the amount of SWS was calculated as percent of total recording time
following sleep deprivation at all ages. Vigilance state amounts were compared to time-
matched values obtained from no-SD animals of the same age. DP within SWS was
calculated as the proportion of the mean DP in SWS during the dark phase, preceding the
sleep deprivation.
Radioimmunoassay: The radioimmunoassay was based on a procedure developed by
Jacobson et al. (1993). Briefly, triplicate samples of plasma (10 ml) were heat-denatured
at 80°C. [3H]corticosterone (Sigma, USA) and CORT antiserum (Endocrine Sciences,
CA) were added to the samples that were incubated overnight. [3H]CORT was separated
from non-radiolabeled CORT using Dextran T70 (Amersham Pharmacia Biotech AB,
Sweden) coated charcoal, and quantified in a liquid scintillation counter (Beckmen model
LS 3801, CA). Competition binding was assessed against a standard curve of CORT
(Sigma, USA) ranging from 0.01ng/ml to 5ng/ml. A standard curve was produced by a
non-linear least squares formula and best-fit analysis based on the F distribution. To
maintain between-assay reliability, only assays in which slope coefficients were within
10% of each other’s error were used.
cDNA probes: We measured the mRNA expression of BDNF, TrkB, FGF2, FGF2r, cFos
and b-actin using the following cDNA probes: 1127 bp rat BDNF cDNA (Rosenthal et al.
1991); full length (~5kb) rat TrkB cDNA (Middlemas et al. 1991) courtesy of Dr E.
Shooter); 465 bp mouse FGF2 cDNA (ATCC Cat. # 63348); 2.5 kb mouse FGF2r cDNA
JN-00894-2003.R2
7
(ATCC Cat. # 63344); full length (~2 kb) rat cFos cDNA (Curran et al. 1987); and 800
bp human b-actin (Hanukoglu et al. 1983). To extract inserts, plasmids were digested for
2 hrs at 37ºC with Hind III and NarI for BDNF, HindIII and XbaI for TrkB, EcoRI and
XbaI for FGF2, HindIII and EcoRI for FGF2r, EcoRI for cFos, and PstI for b-actin (Life
technologies, GIBCO BRL). Inserts were separated from vectors by electrophoresis on
1% Low Melting Point agarose gel (Life technologies, GIBCO BRL). The insert bands
were cut from the gel, dissolved in 3 volumes of distilled water and stored at -20°C until
use. 32P-radiolabeled random primed cDNA probes were made with an activity of 5-10 x
106 CPM/mL.
RNA extraction and Northern blotting: A total of 13 northern blots were generated.
Twelve blots contained total RNA from animals of the same age group, and sacrificed at
the same time point, and included sleep-deprived (SD), recorded but not sleep deprived
(no-SD), and litter mate controls (controls). Corresponding sets for cortical and
hippocampal tissue were made for each time point and age. An additional blot contained
cortical tissue samples from no-SD animals from all three age groups, sacrificed at the
end of the sleep deprivation.
Total RNA was extracted from whole cortical and hippocampal samples using the
TRIZOL protocol (Life technologies, GIBCO BRL). Eight mg total RNA from each
sample (one animal/sample) were fractionated by electrophoresis (100mV) on 1.2%
formaldehyde/agarose gel, transferred to positively charged nylon membranes
(Hybond-N+, Amersham Pharmacia Biotech) and cross linked to the membrane by UV
irradiation.
JN-00894-2003.R2
8
Following pre-hybridization, membranes were hybridized overnight at 42°C in 5x SSC,
50% formamide, 50mM sodium phosphate pH 6.8, 1% SDS, 1mM EDTA, 2.5x
Denhardt's, 200mg/ml herring sperm DNA, and a radiolabeled random prime probe
(minimum 7 X 10⁶/mL). Membranes were washed in lX SSC for 10 min at room
temperature and then twice in 0.4X SSC, 0.2% SDS for 25 min at 55°C. Membranes were
then wrapped in a plastic sheet and exposed on BIOMAX MS film (Kodak). Films were
developed and the images were digitized.
For quantification, background densitometry measures were subtracted for each
animal/lane, and values were normalized by regression analysis. The optical density
(O.D.) values for each gene of interest were divided by the values derived from the b-
actin probe.
Experimental procedure: To habituate animals to handling during sleep-deprivation, all
pups were handled for 10 min in their home cages, without separation from dam or litter,
at least twice on the two days prior to the experiment. In preparation for EEG recording,
animals were lightly anaesthetized and flexible recording cables were connected to their
head implants that were connected to slip-ring commutators. To minimize stress due to
separation from the dam, we employed a method developed by Frank et al. (1997a), and
based on van Oers et al. (1998), which enables separation of rat pups from their mother
and litter for a significant period of time without inducing significant changes in CORT
levels (Hairston et al. 2001). Briefly, P16 animals received enriched milk formula via a
cannula inserted through their cheek. An automatic pump (Harvard Apparatus, Inc.)
delivered 53ml every 45 min. throughout the experiment. In addition, P16 animals had
JN-00894-2003.R2
9
their anal-genital region gently stimulated with a Q-Tip to induce elimination reflexes.
The purpose of these interventions was to mimic maternal care. P20 and P24 animals
were fed rat chow and water. Pups were placed in 12.5 x 12.5 x 12.5 cm acrylic
incubators containing bedding from their home cage. An age-appropriate thermoneutral
environment was maintained by placing the incubators in an acrylic water bath heated to
30, 27 or 24°C for P16, P20, and P24 animals, respectively.
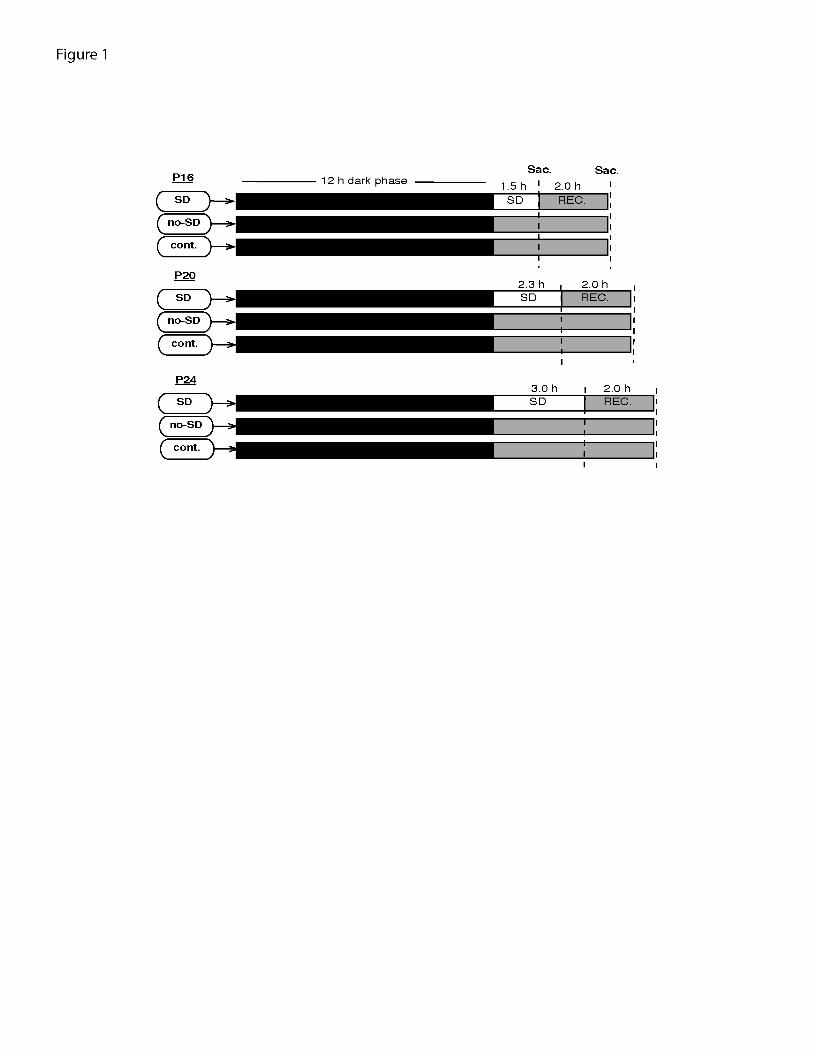
Figure 1 depicts the experimental groups. EEG recording started at lights-off the evening
prior to deprivation. At lights-on the next day, animals were sleep deprived by gentle
handling for 90, 140, or 180 min for P16, P20, or P24 animals, respectively. Animals in
each age group were either sleep-deprived (SD), recorded but not sleep-deprived (no-
SD), and litter-mate controls (controls). At the end of the sleep deprivation, pups were
either sacrificed immediately (no-REC) or allowed to sleep undisturbed for 2 hrs (REC)
(Figure 1). Animals were sacrificed by decapitation within five minutes of the end of the
experiment, trunk blood was collected for RIA, brains were removed, dissected and
rapidly frozen on dry ice.
Statistical analysis: Sleep measures were anlyzed using a three-way ANOVA with age
(P16, P20, P24), treatment (SD, no-SD), and proportion in each state (i.e., wake, SWS,
or PS) in 30 min bins as a repeated measures factor. Plasma CORT levels were analyzed
using a three-way ANOVA with factors age, sleep condition (REC, no-REC), and
treatment (SD, no-SD, controls). mRNA expression was determined from the northern
blots wherein for each animal the O.D. of the gene of interest was divided with the O.D.
for b-actin. Due to differences in exposure and probe potency, no comparisons were

JN-00894-2003.R2
10
made across RNA probes or blots. Comparisons for each gene, within single blots, were
done using the c2 median test, and the standard residual formula was used to determine
the source of the effect for each comparison.
JN-00894-2003.R2
11
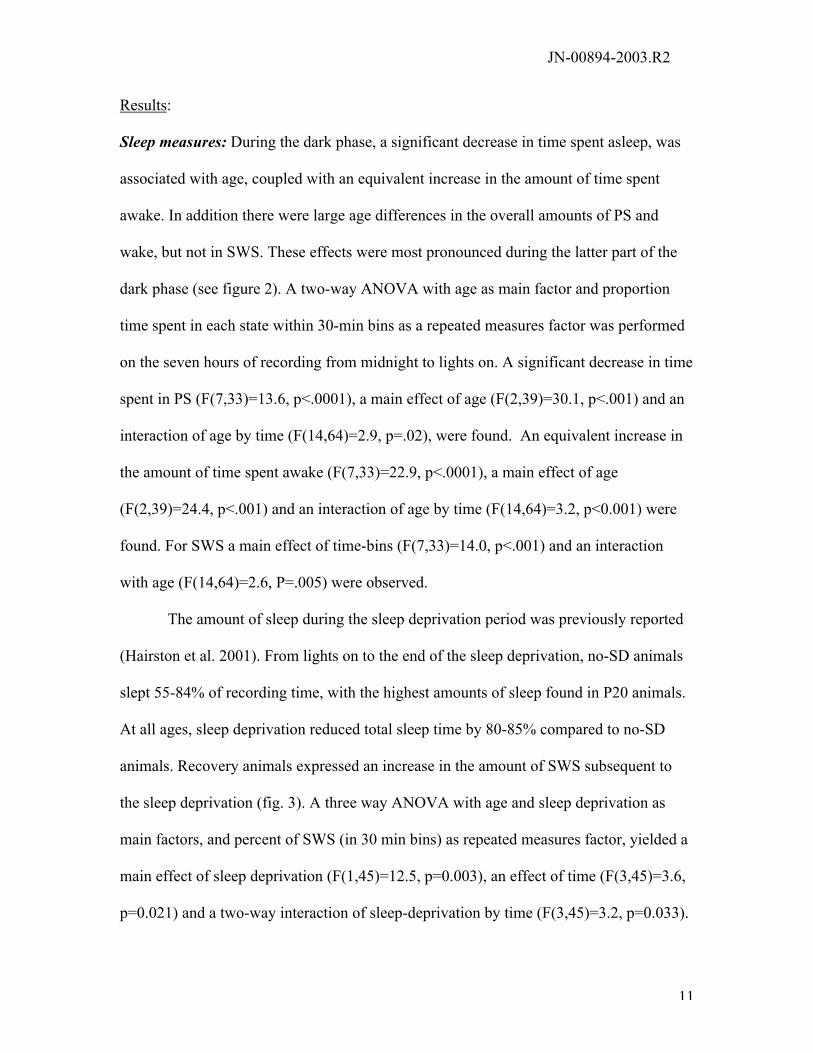
Results:
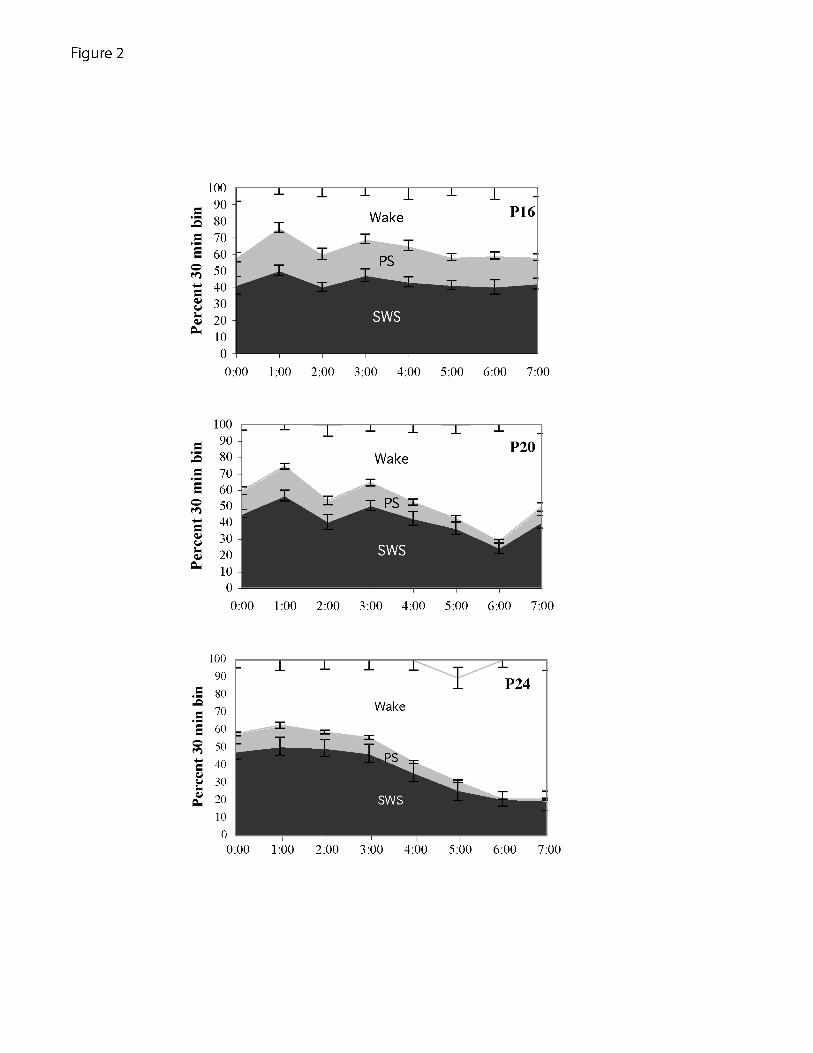
Sleep measures: During the dark phase, a significant decrease in time spent asleep, was
associated with age, coupled with an equivalent increase in the amount of time spent
awake. In addition there were large age differences in the overall amounts of PS and
wake, but not in SWS. These effects were most pronounced during the latter part of the
dark phase (see figure 2). A two-way ANOVA with age as main factor and proportion
time spent in each state within 30-min bins as a repeated measures factor was performed
on the seven hours of recording from midnight to lights on. A significant decrease in time
spent in PS (F(7,33)=13.6, p<.0001), a main effect of age (F(2,39)=30.1, p<.001) and an
interaction of age by time (F(14,64)=2.9, p=.02), were found. An equivalent increase in
the amount of time spent awake (F(7,33)=22.9, p<.0001), a main effect of age
(F(2,39)=24.4, p<.001) and an interaction of age by time (F(14,64)=3.2, p<0.001) were
found. For SWS a main effect of time-bins (F(7,33)=14.0, p<.001) and an interaction
with age (F(14,64)=2.6, P=.005) were observed.
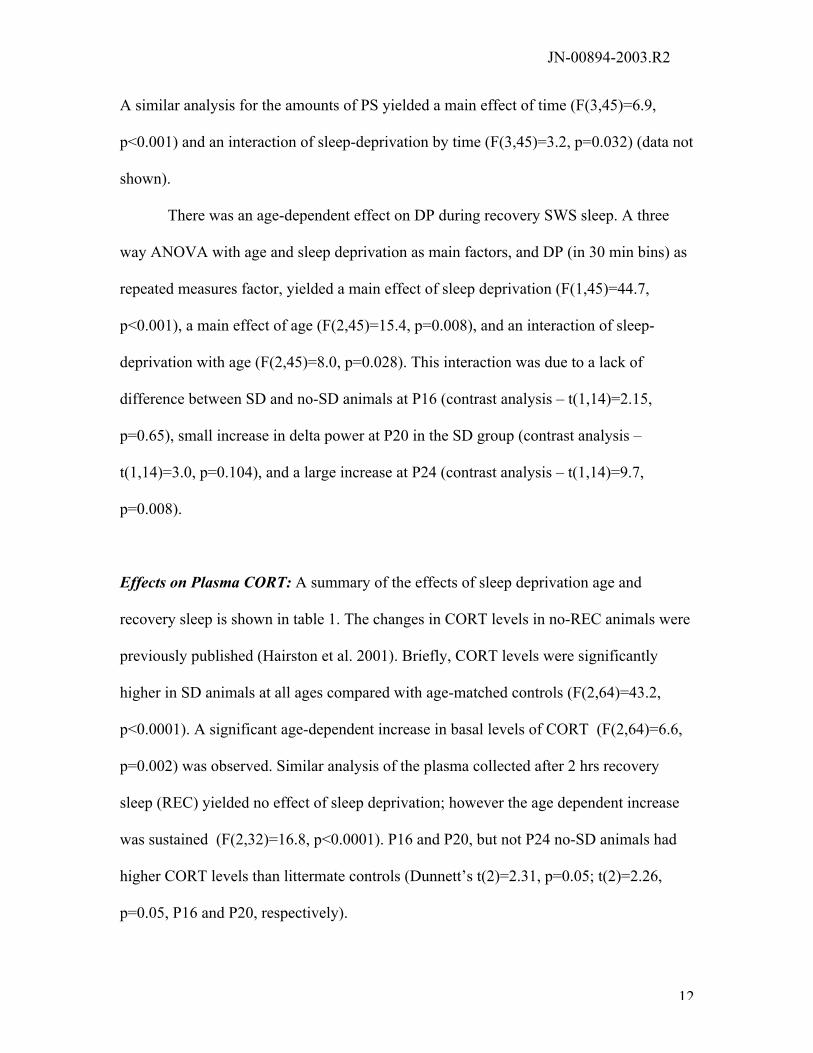
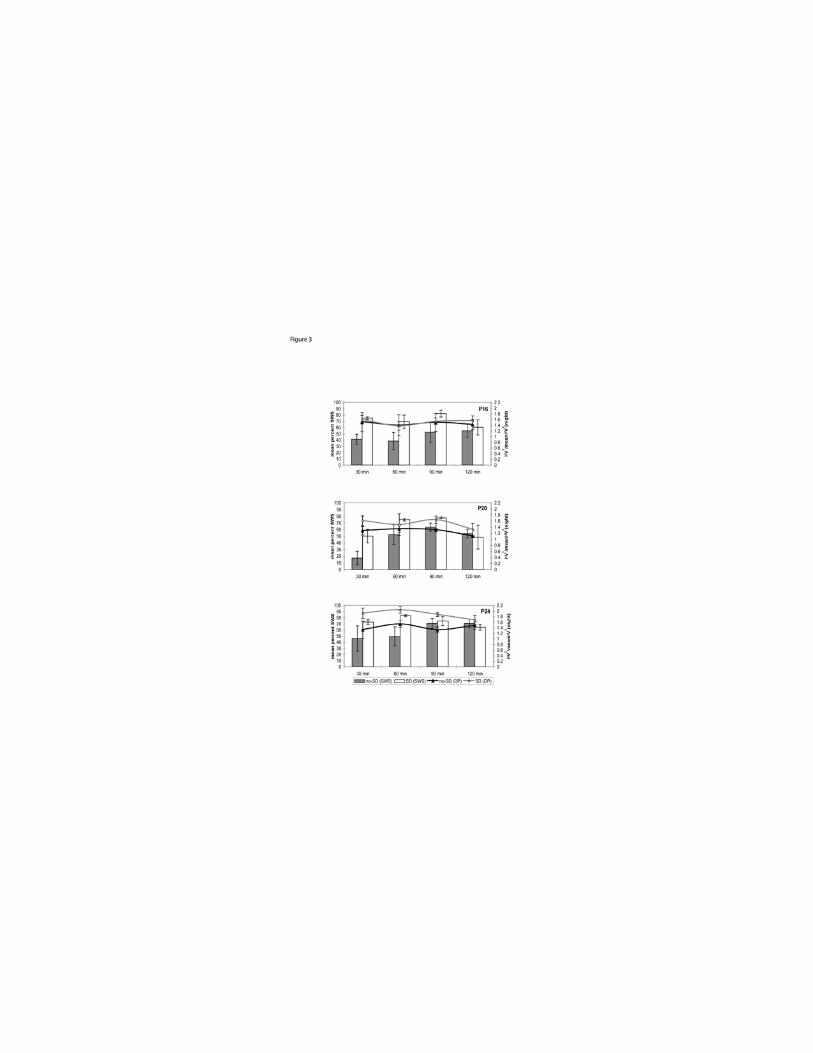
The amount of sleep during the sleep deprivation period was previously reported
(Hairston et al. 2001). From lights on to the end of the sleep deprivation, no-SD animals
slept 55-84% of recording time, with the highest amounts of sleep found in P20 animals.
At all ages, sleep deprivation reduced total sleep time by 80-85% compared to no-SD
animals. Recovery animals expressed an increase in the amount of SWS subsequent to
the sleep deprivation (fig. 3). A three way ANOVA with age and sleep deprivation as
main factors, and percent of SWS (in 30 min bins) as repeated measures factor, yielded a
main effect of sleep deprivation (F(1,45)=12.5, p=0.003), an effect of time (F(3,45)=3.6,
p=0.021) and a two-way interaction of sleep-deprivation by time (F(3,45)=3.2, p=0.033).
JN-00894-2003.R2
12
A similar analysis for the amounts of PS yielded a main effect of time (F(3,45)=6.9,
p<0.001) and an interaction of sleep-deprivation by time (F(3,45)=3.2, p=0.032) (data not
shown).
There was an age-dependent effect on DP during recovery SWS sleep. A three
way ANOVA with age and sleep deprivation as main factors, and DP (in 30 min bins) as
repeated measures factor, yielded a main effect of sleep deprivation (F(1,45)=44.7,
p<0.001), a main effect of age (F(2,45)=15.4, p=0.008), and an interaction of sleep-
deprivation with age (F(2,45)=8.0, p=0.028). This interaction was due to a lack of
difference between SD and no-SD animals at P16 (contrast analysis – t(1,14)=2.15,
p=0.65), small increase in delta power at P20 in the SD group (contrast analysis –
t(1,14)=3.0, p=0.104), and a large increase at P24 (contrast analysis – t(1,14)=9.7,
p=0.008).
Effects on Plasma CORT: A summary of the effects of sleep deprivation age and
recovery sleep is shown in table 1. The changes in CORT levels in no-REC animals were
previously published (Hairston et al. 2001). Briefly, CORT levels were significantly
higher in SD animals at all ages compared with age-matched controls (F(2,64)=43.2,
p<0.0001). A significant age-dependent increase in basal levels of CORT (F(2,64)=6.6,
p=0.002) was observed. Similar analysis of the plasma collected after 2 hrs recovery
sleep (REC) yielded no effect of sleep deprivation; however the age dependent increase
was sustained (F(2,32)=16.8, p<0.0001). P16 and P20, but not P24 no-SD animals had
higher CORT levels than littermate controls (Dunnett’s t(2)=2.31, p=0.05; t(2)=2.26,
p=0.05, P16 and P20, respectively).
JN-00894-2003.R2
13
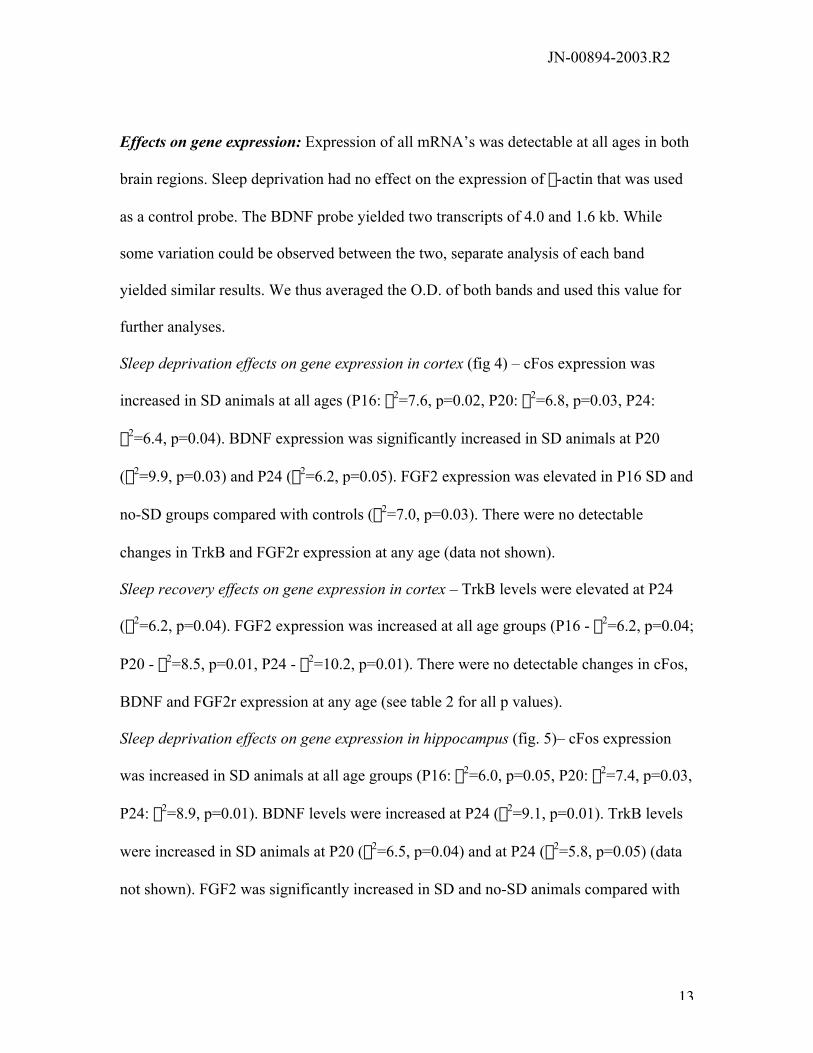
Effects on gene expression: Expression of all mRNA’s was detectable at all ages in both
brain regions. Sleep deprivation had no effect on the expression of b-actin that was used
as a control probe. The BDNF probe yielded two transcripts of 4.0 and 1.6 kb. While
some variation could be observed between the two, separate analysis of each band
yielded similar results. We thus averaged the O.D. of both bands and used this value for
further analyses.
Sleep deprivation effects on gene expression in cortex (fig 4) – cFos expression was
increased in SD animals at all ages (P16: c2=7.6, p=0.02, P20: c2=6.8, p=0.03, P24:
c2=6.4, p=0.04). BDNF expression was significantly increased in SD animals at P20
(c2=9.9, p=0.03) and P24 (c2=6.2, p=0.05). FGF2 expression was elevated in P16 SD and
no-SD groups compared with controls (c2=7.0, p=0.03). There were no detectable
changes in TrkB and FGF2r expression at any age (data not shown).
Sleep recovery effects on gene expression in cortex – TrkB levels were elevated at P24
(c2=6.2, p=0.04). FGF2 expression was increased at all age groups (P16 - c2=6.2, p=0.04;
P20 - c2=8.5, p=0.01, P24 - c2=10.2, p=0.01). There were no detectable changes in cFos,
BDNF and FGF2r expression at any age (see table 2 for all p values).
Sleep deprivation effects on gene expression in hippocampus (fig. 5)– cFos expression
was increased in SD animals at all age groups (P16: c2=6.0, p=0.05, P20: c2=7.4, p=0.03,
P24: c2=8.9, p=0.01). BDNF levels were increased at P24 (c2=9.1, p=0.01). TrkB levels
were increased in SD animals at P20 (c2=6.5, p=0.04) and at P24 (c2=5.8, p=0.05) (data
not shown). FGF2 was significantly increased in SD and no-SD animals compared with
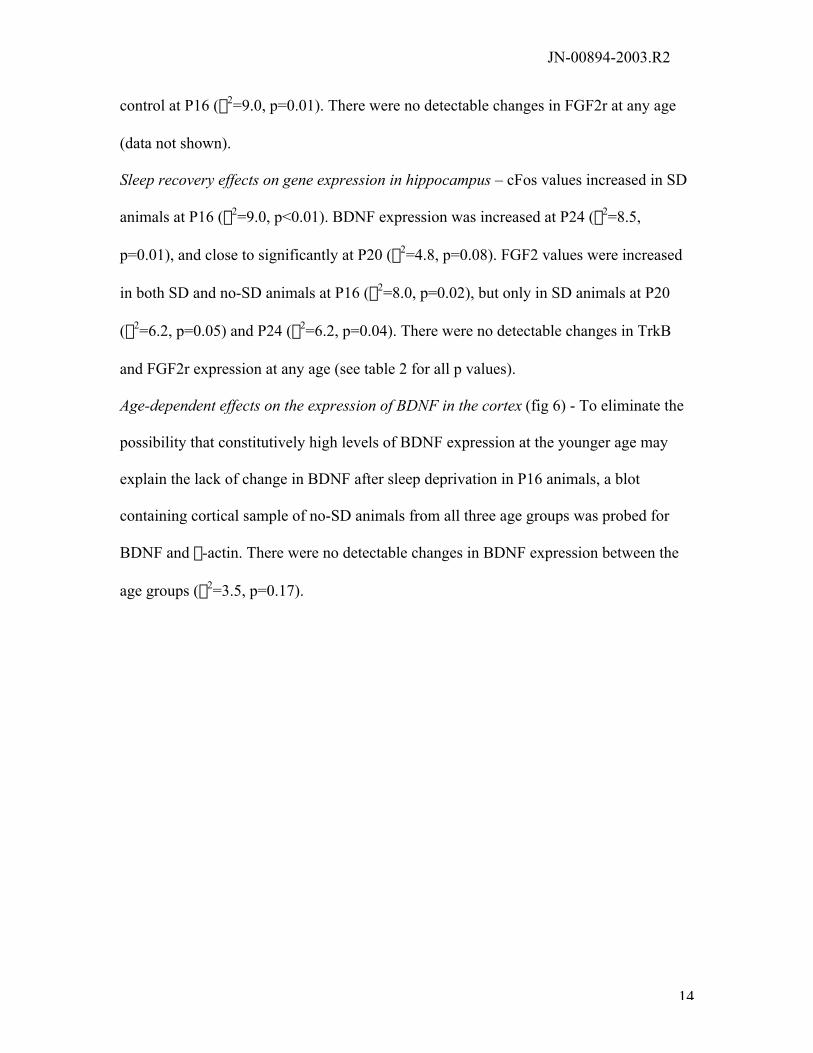
JN-00894-2003.R2
14
control at P16 (c2=9.0, p=0.01). There were no detectable changes in FGF2r at any age
(data not shown).
Sleep recovery effects on gene expression in hippocampus – cFos values increased in SD
animals at P16 (c2=9.0, p<0.01). BDNF expression was increased at P24 (c2=8.5,
p=0.01), and close to significantly at P20 (c2=4.8, p=0.08). FGF2 values were increased
in both SD and no-SD animals at P16 (c2=8.0, p=0.02), but only in SD animals at P20
(c2=6.2, p=0.05) and P24 (c2=6.2, p=0.04). There were no detectable changes in TrkB
and FGF2r expression at any age (see table 2 for all p values).
Age-dependent effects on the expression of BDNF in the cortex (fig 6) - To eliminate the
possibility that constitutively high levels of BDNF expression at the younger age may
explain the lack of change in BDNF after sleep deprivation in P16 animals, a blot
containing cortical sample of no-SD animals from all three age groups was probed for
BDNF and b-actin. There were no detectable changes in BDNF expression between the
age groups (c2=3.5, p=0.17).
JN-00894-2003.R2
15
Discussion
We assessed changes in gene expression following sleep deprivation in neonatal
rats. The main findings were [a] an age- and brain region-independent increase of cFos
after sleep deprivation; [b] an age-dependent increase in BDNF expression in the cortex
and hippocampus after sleep deprivation, which correlated with the age when increased
DP after sleep deprivation was observed; and [c] an age- and brain –region- independent
increase in FGF2 expression during recovery sleep.
The age dependent effects on sleep states and response to sleep deprivation were
largely consistent with previous reports (Frank and Heller 1997b, 1997a; Frank et al.
1998). Following sleep deprivation, there were no changes in DP at P16, a small increase
at P20, and a large increase at P24. Notably, Frank and Heller (1998) did not show an
increase in DP at P20. This divergence from previous published findings is probably due
to natural variance in maturation rate between cohorts.
In this study, the sleep deprivation duration was tittered to the different ages,
based on the assumption that the ability to endure sleep deprivation increases with age.
This assumption is substantiated by our previously reported observation that the
amplitude of CORT increase, due to sleep deprivation, decreased with age (Hairston et al.
2001). Within two hours of recovery sleep, CORT levels were similar to no-SD animals,
indicating that the stress response duration was similar across age groups. The conditions
used for recording sleep in neonatal rats, given the right parameters (i.e., increased
ambient temperature and stimulated elimination reflexes), caused a small increase in
CORT levels in P16 and P20 no-SD animals, suggesting that maternal separation may
have induced a mild stress response in younger animals. As CORT increases FGF2
JN-00894-2003.R2
16
expression (Chao and McEwen 1994), this observation may explain the mild increases in
FGF2 in P16 recorded animals compared with littermate controls.
The sleep deprivation effects on cFos expression were consistent with the effects
in adults. cFos levels were increased independent of age and brain region, despite varying
duration of sleep deprivation and different sleep patterns between age groups. In adult
rats, cFos is highly expressed both during sleep deprivation and during spontaneous wake
(Pompeiano et al. 1994) suggesting that its expression reflects the arousal state and not
the stress of sleep deprivation
Sleep deprivation effects on the two growth factors and their receptors were
markedly different. In the cortex, BDNF expression was increased in SD P20 and P24 but
not P16, while TrkB increases were observed in P24 SD animals after recovery sleep
only. In the hippocampus, P24 SD animals demonstrated increased BDNF, while TrkB
expression was increased in SD animals at P20 and P24. FGF2 expression was increased
after recovery sleep, independent of age and brain region, while FGF2r levels were
unaffected by sleep deprivation.
The time delay between mRNA synthesis and BDNF protein translation is
unknown. However, Nanda and Mack (2000) demonstrated elevated levels of BDNF
protein, >100% of control, in the cortex 1 hr after whisker stimulation, reaching peak
values within four hrs. If a similar time course of transcription-translation occurs post
sleep deprivation it is possible that the correlation between the developmental emergence
of wake induced-expression of BDNF with the emergence of wake-dependent DP -
indicates a functional relationship between BDNF and DP augmentation.
JN-00894-2003.R2
17
The age groups in this study represent a developmental period characterized by
increased synaptic connectivity of the noradrenergic and cholinergic systems to
neocortical regions. Activity in both the noreadrenergic (NA) and cholinergic systems is
associated with wake maintenance and arousal quality (Berridge and Waterhouse 2003;
Sarter and Bruno 1999). NA projections to the cortex are present and innervating the
appropriate cortical layers by P3 (Foote and Morrison 1987; Levitt and Moore 1979).
However, during the third week of postnatal development (i.e., P15-21) an increase in
noradrenaline and tyrosine hydroxylase content in the neocortex occurs, reaching adult
levels at the beginning of week four (Foote and Morrison 1987; Levitt and Moore 1979;
Loizou 1971). Similar to the NA system, cortical cholinergic afferents increase in density
throughout weeks three to six (Coyle and Yamamura 1976).
Cirelli and co-workers have shown that BDNF and TrkB transcription in the
cortex is mediated by ascending NA fibers from the locus coeruleus (Cirelli 2002; Cirelli
and Tononi 2000a; Tononi and Cirelli 2001). Additionally, BDNF is synthesized by
excitatory neurons located in projection fields of basal forebrain cholinergic neurons
(Thoenen et al. 1991), suggesting a cholinergic role in the expression of BDNF.
Mitzoguchi et al. (2002) have recently demonstrated that BDNF caused sustained
increases of intracellular Ca2+ and Ca2+-activated potassium currents in cortical neurons,
both of which are believed to mediate cellular mechanisms underlying slow-wave
oscillations observed during SWS (Bazhenov et al. 2002; Massimini and Amzica 2001).
The potential role for BDNF in activity-dependent increase of DP is further indicated by
the observations that dark rearing reduces DP from visual cortex derivation (Miyamoto et
JN-00894-2003.R2
18
al. 2003), as well as locally attenuates BDNF expression in the same region (Tropea et
al. 2001).
Given the developmental changes in neuromodulator excitatory input to the
cortex, the involvement of BDNF in intracellular Ca2+ and Ca2+-activated potassium
currents, and the relationship between sensory input DP development and BDNF
expression, we propose the following sequence of events: Neuromodulator activity
during wake increases BDNF expression in the adult cortex; BDNF, in turn, facilitates
inhibitory signaling in cortical neurons via its effects on intracellular Ca2+; increased
inhibition of cortical neurons results in the augmented power in delta oscillations. At P16,
BDNF signaling is attenuated, thus slow-wave activity during SWS would not reflect
wake history. Notably, Kushikata et al. (1999) reported that intracerebroventricular
(i.c.v.) administration of BDNF did not increase DP, while an increase in SWS amount
was observed. Combined with our findings, this may suggest that BDNF is necessary but
not sufficient to mediate an increase in DP.
Sleep deprivation resulted in elevated levels of CORT, especially in younger
animals. Repeated and prolonged increases in CORT levels are associated with reduced
levels of hippocampal BDNF (Chao and McEwen 1994; Hansson et al. 2003; Nibuya et
al. 1999), although BDNF expression can be increased after a short duration of stress
(i.e., 3 hrs, (Marmigere et al. 2003), and by excitatory cholinergic (da Penha Berzaghi et
al. 1993; Thoenen et al. 1991), or glutamatergic activity (Thoenen et al. 1991). Thus,
BDNF expression in the hippocampus can be increased under conditions associated with
either decrease or increase in CORT levels.
JN-00894-2003.R2
19
In this study, BDNF increased in the hippocampus only of SD P24 animals, and
remained elevated after recovery sleep. As the hippocampus is anatomically mature by
P16, and pruning constitutes the main developmental event henceforth (Gaarskjaer 1985),
it is unlikely that our results can be explained by an age dependent-increase of excitatory
input. Moreover, our findings are inconsistent with previous studies in adults in which
BDNF mRNA or protein levels in the hippocampus were unaffected by total sleep
deprivation (Taishi et al. 2001) or selective paradoxical sleep deprivation (Sei et al.
2000). On the other hand, it is possible that our findings reflect the time course of BDNF
transcription after stress. In a recent study by Marmigère et al. (2003), BDNF mRNA
levels were measured after immobilization stress of varying duration. These authors
showed that BDNF levels increased within three hours and then proceeded to decline, to
below control levels, after five hours of immobilization stress. Thus, after three hours of
sleep deprivation, our P24 animals would be exactly at the peak of the stress induced
BDNF increase.
FGF2 expression increased in both brain regions only during recovery sleep.
FGF2 expression is mediated by intracellular Ca2+, cAMP, b-adrenergic receptor
activation, and activation of cholinergic nicotinic receptors (Belluardo 1999; Belluardo et
al. 1999; Follesa and Mocchetti 1993; Riva et al. 1996; Riva et al. 1997; Roceri et al.
2000) suggesting that its transcription is activity dependent. The time course observed for
b-adrenergic induced transcription of FGF2 was 4-5 hrs in adult animals (Follesa and
Mocchetti 1993; Hansson et al. 2003). Hence, we conclude that the observed increase in
FGF2, during recovery sleep, was in response to the stimulation of the sleep deprivation.
It is unlikely that FGF2 plays a role in inducing compensatory sleep patterns, as it does
JN-00894-2003.R2
20
not seem to correlate with age and it has been previously shown that FGF2 administration
had no effect on any sleep parameter (Knefati et al. 1995).
In conclusion, this study addressed the changes in gene expression after sleep
deprivation in neonatal rats. It has been established that marked changes in sleep
architecture, homeostatic, and circadian regulation of sleep occur throughout
development. While the mechanism underlying DP increase after prolonged wake is
unknown, it has been proposed to reflect experience- or use-dependent processes (Meerlo
et al. 1997; Vyazovskiy et al. 2000), and not only the time spent awake. Our findings
suggest BDNF signaling as a candidate for facilitating DP increase after prolonged wake
or enriched experience.
We also demonstrated that sleep deprivation increased FGF2 expression during
subsequent recovery sleep. FGF2 stimulates proliferation and neuronal fate (Benharroch
and Birnbaum 1990; Palmer et al. 1999), and is increased after exposure to wheel-
running (Gomez-Pinilla et al. 1997) and enrichment (Schneider et al. 2001). Thus, the
consequence of mild sleep deprivation may have long-term trophic effects. This contrasts
with reduced proliferation observed after 96 hrs of sleep deprivation by Guzman-Marin et
al. (2003) in adult rats, but agrees with the neuroprotective and synaptogenic role of
BDNF increases after short periods of sleep deprivation.
Although it remains to be determined whether sleep is necessary for the down-
stream action of growth-related proteins, our observations contribute to growing evidence
implicating waking experience in sleep quality. Early experiences such as prenatal stress,
postnatal handling, and enriched environment have long lasting effects on sleep patterns
and stress management (Dugovic et al. 1999; Meaney et al. 1991; Mirmiran et al. 1982),

JN-00894-2003.R2
21
and have long-term implications for the quality of aging (Fuxe et al. 1996; Johansson et
al. 1999; Mohammed 1993). It is possible that changes in sleep quality are a necessary
component of the cellular processes underlying these neuroprotective effects.
~ ~ ~
Acknowledgements and funding: The authors thank Dr. Eric M Shooter for generously
providing us with the plasmid containing TrkB, Dr. N. Sobel and Dr P. Franken for their
critical remarks. This work was funded by NIH grants MCHHD #HD37315; NIMH, and
F31-MH65168-01.
JN-00894-2003.R2
22
Bibliography:
1. Bazhenov M, Timofeev I, Steriade M, and Sejnowski TJ. Model of
thalamocortical slow-wave sleep oscillations and transitions to activated States. J
Neurosci 22: 8691-8704, 2002.
2. Belluardo N. The nicotinic acetylcholine receptor agonist ABT-594 increases
FGF-2 expression in various rat brain regions. Neuroreport 10: 3909-3913, 1999.
3. Belluardo N, Mudo G, Blum M, Cheng Q, Caniglia G, Dell'Albani P, and
Fuxe K. The nicotinic acetylcholine receptor agonist (+/-)-epibatidine increases
FGF-2 mRNA and protein levels in the rat brain. Brain Research Molecular Brain
Research 74: 98-110, 1999.
4. Benharroch D and Birnbaum D. Biology of the fibroblast growth factor gene
family. Israel Journal of Medical Sciences 26: 212-219, 1990.
5. Berridge CW and Waterhouse BD. The locus coeruleus-noradrenergic system:
modulation of behavioral state and state-dependent cognitive processes. Brain
Research Reviews 42: 33-84, 2003.
6. Chao HM and McEwen BS. Glucocorticoids and the expression of mRNAs for
neurotrophins, their receptors and GAP-43 in the rat hippocampus. Brain
Research Molecular Brain Research 26: 271-276, 1994.
7. Cirelli C. How sleep deprivation affects gene expression in the brain: a review of
recent findings. [see comments.]. Journal of Applied Physiology 92: 394-400,
2002.
JN-00894-2003.R2
23
8. Cirelli C and Tononi G. Differential expression of plasticity-related genes in
waking and sleep and their regulation by the noradrenergic system. J Neurosci 20:
9187-9194, 2000a.
9. Coyle JT and Yamamura HI. Neurochemical aspects of the ontogenesis of
cholinergic neurons in the rat brain. Brain Res 118: 429-440, 1976.
10. Curran T, Gordan MB, Rubino KL, and Sambucetti LC. Isolation and
characterization of the c-fos (rat) cDNA and analysis of post-translational
modification in vitro. Oncogene 2: 79-94, 1987.
11. da Penha Berzaghi M, Cooper J, Castren E, Zafra F, Sofroniew M, Thoenen
H, and Lindholm D. Cholinergic regulation of brain-derived neurotrophic factor
(BDNF) and nerve growth factor (NGF) but not neurotrophin-3 (NT-3) mRNA
levels in the developing rat hippocampus. J Neurosci 13: 3818-3826, 1993.
12. Davis FC, Frank MG, and Heller HC. Ontogeny of sleep and circadian
rhythms. In: Regulation of Sleep and Circadian Rhythms, edited by Turek FW and
Zee P. New-York; Basel: Marcel Dekker, Inc., 1999, p. 19-79.
13. Dugovic C, Maccari S, Weibel L, Turek FW, and Van Reeth O. High
corticosterone levels in prenatally stressed rats predict persistent paradoxical sleep
alterations. J Neurosci 19: 8656-8664, 1999.
14. Follesa P and Mocchetti I. Regulation of basic fibroblast growth factor and
nerve growth factor mRNA by beta-adrenergic receptor activation and adrenal
steroids in rat central nervous system. Molecular Pharmacology 43: 132-138,
1993.
JN-00894-2003.R2
24
15. Foote SL and Morrison JH. Development of the noradrenergic, serotonergic,
and dopaminergic innervation of neocortex. Current Topics in Developmental
Biology 21: 391-423, 1987.
16. Frank MG and Heller HC. Development of diurnal organization of EEG slow-
wave activity and slow-wave sleep in the rat. Am J Physiol 273: R472-478,
1997b.
17. Frank MG and Heller HC. Development of REM and slow wave sleep in the
rat. Am J Physiol 272: R1792-1799, 1997a.
18. Frank MG, Morrissette RN, and Heller HC. Effects of sleep deprivation in
neonatal rats. Am J Physiol 275: R148-157, 1998.
19. Franken P, Tobler I, and Borbély AA. Sleep homeostasis in the rat: simulation
of the time course of EEG slow-wave activity [published erratum appears in
Neurosci Lett 1991 Nov 11;132(2):279]. Neurosci Lett 130: 141-144, 1991.
20. Fuxe K, Diaz R, Cintra A, Bhatnagar M, Tinner B, Gustafsson JA, Ogren
SO, and Agnati LF. On the role of glucocorticoid receptors in brain plasticity.
Cellular & Molecular Neurobiology 16: 239-258, 1996.
21. Gaarskjaer FB. The development of the dentate area and the hippocampal mossy
fiber projection of the rat. Journal of Comparative Neurology 241: 154-170, 1985.
22. Gomez-Pinilla F, Dao L, and So V. Physical exercise induces FGF-2 and its
mRNA in the hippocampus. Brain Res 764: 1-8, 1997.
23. Guzman-Marin R, Suntsova N, Stewart DR, Gong H, Szymusiak R, and
McGinty D. Sleep deprivation reduces proliferation of cells in the dentate gyrus
of the hippocampus in rats. Journal of Physiology 549: 567-571, 2003.
JN-00894-2003.R2
25
24. Hairston IS, Ruby NF, Brooke S, Peyron C, Denning DP, Heller HC, and
Sapolsky RM. Sleep deprivation elevates plasma corticosterone levels in neonatal
rats. Neurosci Lett 315: 29-32, 2001.
25. Hansson AC, Cintra A, Belluardo N, Sommer W, Bhatnagar M, Bader M,
Ganten D, and Fuxe K. Gluco- and mineralocorticoid receptor-mediated
regulation of neurotrophic factor gene expression in the dorsal hippocampus and
the neocortex of the rat. European Journal of Neuroscience 12: 2918-2934, 2000.
26. Hansson AC, Sommer W, Rimondini R, Andbjer B, Stromberg I, and Fuxe
K. c-fos reduces corticosterone-mediated effects on neurotrophic factor
expression in the rat hippocampal CA1 region. J Neurosci 23: 6013-6022, 2003.
27. Hanukoglu I, Tanese N, and Fuchs E. Complementary DNA sequence of a
human cytoplasmic actin: interspecies divergence of 3' non-coding regions.
Journal of Molecular Biology 163: 673-678, 1983.
28. Jacobson L, Brooke S, and Sapolsky R. Corticosterone is a preferable ligand for
measuring rat brain corticosteroid receptors: competition by RU 28362 and RU
26752 for dexamethasone binding in rat hippocampal cytosol. Brain Res 625: 84-
92, 1993.
29. Johansson BB, Zhao L, and Mattsson B. Environmental influence on gene
expression and recovery from cerebral ischemia. Acta Neurochir Suppl (Wien) 73:
51-55, 1999.
30. Knefati M, Somogyi C, Kapas L, Bourcier T, and Krueger JM. Acidic
fibroblast growth factor (FGF) but not basic FGF induces sleep and fever in
rabbits. Am J Physiol 269: R87-91, 1995.
JN-00894-2003.R2
26
31. Kushikata T, Fang J, and Krueger JM. Brain-derived neurotrophic factor
enhances spontaneous sleep in rats and rabbits. Am J Physiol 276: R1334-1338,
1999.
32. Levitt P and Moore RY. Development of the noradrenergic innervation of
neocortex. Brain Res 162: 243-259, 1979.
33. Loizou LA. The postnatal development of monoamine-containing structures in
the hypothalamo-hypophyseal system of the albino rat. Brain Res 40: 395-418,
1971.
34. Marmigere F, Givalois L, Rage F, Arancibia S, and Tapia-Arancibia L. Rapid
induction of BDNF expression in the hippocampus during immobilization stress
challenge in adult rats. Hippocampus 13: 646-655, 2003.
35. Massimini M and Amzica F. Extracellular calcium fluctuations and intracellular
potentials in the cortex during the slow sleep oscillation. J Neurophysiol 85:
1346-1350, 2001.
36. Meaney MJ, Aitken DH, Bhatnagar S, and Sapolsky RM. Postnatal handling
attenuates certain neuroendocrine, anatomical, and cognitive dysfunctions
associated with aging in female rats. Neurobiol Aging 12: 31-38, 1991.
37. Meerlo P, Pragt BJ, and Daan S. Social stress induces high intensity sleep in
rats. Neurosci Lett 225: 41-44, 1997.
38. Middlemas DS, Lindberg RA, and Hunter T. trkB, a neural receptor protein-
tyrosine kinase: evidence for a full-length and two truncated receptors. Molecular
and Cellular Biology 11: 143-153, 1991.
JN-00894-2003.R2
27
39. Mirmiran M, van den Dungen H, and Uylings HB. Sleep patterns during
rearing under different environmental conditions in juvenile rats. Brain Res 233:
287-298, 1982.
40. Miyamoto H, H K, and T H. Experience-dependent slow-wave sleep
development. Nature Neuroscience online, 2003.
41. Mizoguchi Y, Monji A, and Nabekura J. Brain-derived neurotrophic factor
induces long-lasting Ca2+-activated K+ currents in rat visual cortex neurons. Eur
J Neurosci 16: 1417-1424, 2002.
42. Mohammed A, Henriksson BG, Seoderstreom S, Ebendal T, Olsson T, Seckl
JR. Environmental influences on the central nervous system and their
implications for the aging rat. Behav Brain Res 57: 183-191, 1993.
43. Molteni R, Fumagalli F, Magnaghi V, Roceri M, Gennarelli M, Racagni G,
Melcangi RC, and Riva MA. Modulation of fibroblast growth factor-2 by stress
and corticosteroids: from developmental events to adult brain plasticity. Brain
Research Reviews 37: 249-258, 2001.
44. Nanda SA and Mack KJ. Seizures and sensory stimulation result in different
patterns of brain derived neurotrophic factor protein expression in the barrel
cortex and hippocampus. Molecular Brain Research 78: 1-14, 2000.
45. Nibuya M, Takahashi M, Russell DS, and Duman RS. Repeated stress
increases catalytic TrkB mRNA in rat hippocampus. Neurosci Lett 267: 81-84,
1999.
JN-00894-2003.R2
28
46. O'Hara BF, Young KA, Watson FL, Heller HC, and Kilduff TS. Immediate
early gene expression in brain during sleep deprivation: preliminary observations.
Sleep 16: 1-7, 1993.
47. Palmer TD, Markakis EA, Willhoite AR, Safar F, and Gage FH. Fibroblast
growth factor-2 activates a latent neurogenic program in neural stem cells from
diverse regions of the adult CNS. J Neurosci 19: 8487-8497, 1999.
48. Pompeiano M, C C, and G T. Immediate-early genes in spontaneous
wakefulness and sleep: expression of c-fos and NGFI-A mRNA and protein. J
Sleep Res 3: 80-96, 1994.
49. Riva MA, Molteni R, Lovati E, Fumagalli F, Rusnati M, and Racagni G.
Cyclic AMP-dependent regulation of fibroblast growth factor-2 messenger RNA
levels in rat cortical astrocytes: comparison with fibroblast growth factor-1 and
ciliary neurotrophic factor. Molecular Pharmacology 49: 699-706, 1996.
50. Riva MA, Molteni R, and Racagni G. L-deprenyl potentiates cAMP-induced
elevation of FGF-2 mRNA levels in rat cortical astrocytes. Neuroreport 8: 2165-
2168, 1997.
51. Roceri M, Molteni R, Racagni G, and Riva MA. Calcium-dependent
modulation of FGF-2 expression in cultured cerebellar granule neurons.
Neuroreport 11: 3615-3619, 2000.
52. Rosenthal A, Goeddel DV, Nguyen T, Martin E, Burton LE, Shih A,
Laramee GR, Wurm F, Mason A, Nikolics K, and al. e. Primary structure and
biological activity of human brain-derived neurotrophic factor. Endocrinology
129: 1289-1294, 1991.
JN-00894-2003.R2
29
53. Sarter M and Bruno JP. Cortical cholinergic inputs mediating arousal,
attentional processing and dreaming: differential afferent regulation of the basal
forebrain by telencephalic and brainstem afferents. Neuroscience 95: 933-952,
1999.
54. Schneider JS, Lee MH, Anderson DW, Zuck L, and Lidsky TI. Enriched
environment during development is protective against lead-induced neurotoxicity.
Brain Res 896: 48-55, 2001.
55. Sei H, Saitoh D, Yamamoto K, Morita K, and Morita Y. Differential effect of
short-term REM sleep deprivation on NGF and BDNF protein levels in the rat
brain. Brain Res 877: 387-390, 2000.
56. Taishi P, Sanchez C, Wang Y, Fang J, Harding JW, and Krueger JM.
Conditions that affect sleep alter the expression of molecules associated with
synaptic plasticity. Am J Physiol Regul Integr Comp Physiol 281: R839-R845,
2001.
57. Terao A, Steininger TL, Hyder K, Apte-Deshpande A, Ding J, Rishipathak
D, Davis RW, Heller HC, and Kilduff TS. Differential increase in the
expression of heat shock protein family members during sleep deprivation and
during sleep. Neuroscience 116: 187-200, 2003.
58. Thoenen H, F Z, B H, and D L. The synthesis of nerve growth factor and brain-
derived neurotrophic factor in hippocampal and cortical neurons is regulated by
specific transmitter systems. Ann NY Acad Sci 640: 86-90, 1991.
59. Tobler I and Borbély AA. The effect of 3-h and 6-h sleep deprivation on sleep
and EEG spectra of the rat. Behav Brain Res 36: 73-78, 1990.
JN-00894-2003.R2
30
60. Tononi G and Cirelli C. Modulation of Brain Gene Expression during Sleep and
Wakefulness: A Review of Recent Findings. Neuropsychopharmacology 25:
S28-S35, 2001.
61. Tropea D, Capsoni S, Tongiorgi E, Giannotta S, Cattaneo A, and Domenici
L. Mismatch between BDNF mRNA and protein expression in the developing
visual cortex: the role of visual experience. Eur J Neurosci 13: 709-721, 2001.
62. Ueyama T, Kawai Y, Nemoto K, Sekimoto M, Tone S, and Senba E.
Immobilization stress reduced the expression of neurotrophins and their receptors
in the rat brain. Neuroscience Research 28: 103-110, 1997.
63. van Oers HJ, de Kloet ER, Whelan T, and Levine S. Maternal deprivation
effect on the infant's neural stress markers is reversed by tactile stimulation and
feeding but not by suppressing corticosterone. J Neurosci 18: 10171-10179, 1998.
64. Vyazovskiy V, Borbely A, and Tobler I. Unilateral vibrissae stimulation during
waking induces interhemispheric EEG asymmetry during subsequent sleep in the
rat. J Sleep Res 9: 367371, 2000.
JN-00894-2003.R2
31
Legends of figures and tables:
Figure 1:
The experimental design. Depicts the sleep deprivation protocol where all SD and no-SD
animals were recorded from lights off the night prior to the experiment. At lights on,
sleep deprivation by gentle handling was performed on SD animals, while no-SD animals
were not touched accept for brief stimulation of elimination reflexes at P16. Animals
were sacrificed (sac.) either at the end of the sleep deprivation (SD) or after 2 hrs
recovery sleep (REC.). An additional group of animals (cont.) were in the same room but
kept with their mother and littermates and sacrificed at equivalent time points.
Figure 2:
The distribution of arousal states at the different ages during the dark phase, starting at
midnight. Percent of 30 min bins spent in each state (PS, SWS, wake) were calculated for
each animal during the dark phase before the sleep deprivation, and averaged across age
groups. Panels a-c depict the mean and S.E.M. of the percent in each state within each
age group. There were age-dependent changes in the amounts of wake and PS with no
change in SWS expressed as a main effect of age in PS and wake (F(2,39)=30.1, p<.001,
F(2,39)=24.4, p<.001, respectively), and an interaction of the age factor with all three
sleep states (PS: F(14,64)=2.9, p=.02; SWS: F(14,64)=2.6, P=.005; wake: F(14,64)=3.2,
p<0.001) . In addition, the distribution of states within the dark phase revealed the
emergence of diurnal regulation. At P16 the three states are evenly distributed while in
the older animals an increase in the percent time spent awake increases across the dark
phase.
JN-00894-2003.R2
32
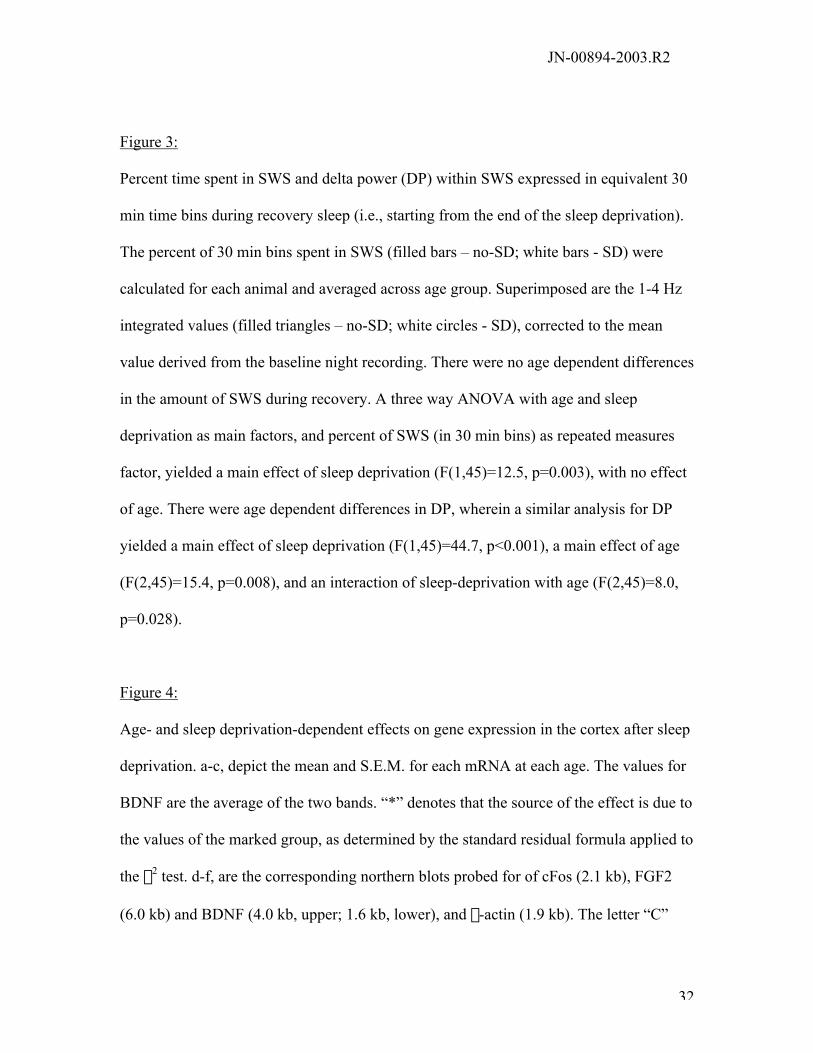
Figure 3:
Percent time spent in SWS and delta power (DP) within SWS expressed in equivalent 30
min time bins during recovery sleep (i.e., starting from the end of the sleep deprivation).
The percent of 30 min bins spent in SWS (filled bars – no-SD; white bars - SD) were
calculated for each animal and averaged across age group. Superimposed are the 1-4 Hz
integrated values (filled triangles – no-SD; white circles - SD), corrected to the mean
value derived from the baseline night recording. There were no age dependent differences
in the amount of SWS during recovery. A three way ANOVA with age and sleep
deprivation as main factors, and percent of SWS (in 30 min bins) as repeated measures
factor, yielded a main effect of sleep deprivation (F(1,45)=12.5, p=0.003), with no effect
of age. There were age dependent differences in DP, wherein a similar analysis for DP
yielded a main effect of sleep deprivation (F(1,45)=44.7, p<0.001), a main effect of age
(F(2,45)=15.4, p=0.008), and an interaction of sleep-deprivation with age (F(2,45)=8.0,
p=0.028).
Figure 4:
Age- and sleep deprivation-dependent effects on gene expression in the cortex after sleep
deprivation. a-c, depict the mean and S.E.M. for each mRNA at each age. The values for
BDNF are the average of the two bands. “*” denotes that the source of the effect is due to
the values of the marked group, as determined by the standard residual formula applied to
the c2 test. d-f, are the corresponding northern blots probed for of cFos (2.1 kb), FGF2
(6.0 kb) and BDNF (4.0 kb, upper; 1.6 kb, lower), and b-actin (1.9 kb). The letter “C”
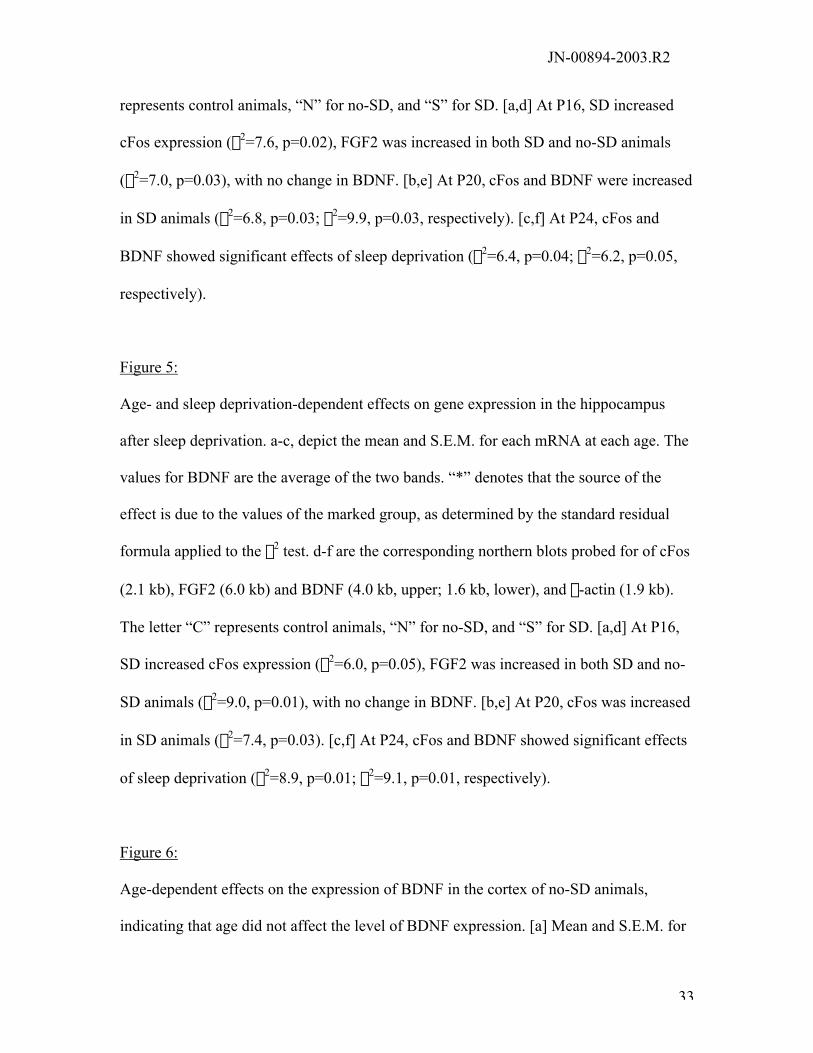
JN-00894-2003.R2
33
represents control animals, “N” for no-SD, and “S” for SD. [a,d] At P16, SD increased
cFos expression (c2=7.6, p=0.02), FGF2 was increased in both SD and no-SD animals
(c2=7.0, p=0.03), with no change in BDNF. [b,e] At P20, cFos and BDNF were increased
in SD animals (c2=6.8, p=0.03; c2=9.9, p=0.03, respectively). [c,f] At P24, cFos and
BDNF showed significant effects of sleep deprivation (c2=6.4, p=0.04; c2=6.2, p=0.05,
respectively).
Figure 5:
Age- and sleep deprivation-dependent effects on gene expression in the hippocampus
after sleep deprivation. a-c, depict the mean and S.E.M. for each mRNA at each age. The
values for BDNF are the average of the two bands. “*” denotes that the source of the
effect is due to the values of the marked group, as determined by the standard residual
formula applied to the c2 test. d-f are the corresponding northern blots probed for of cFos
(2.1 kb), FGF2 (6.0 kb) and BDNF (4.0 kb, upper; 1.6 kb, lower), and b-actin (1.9 kb).
The letter “C” represents control animals, “N” for no-SD, and “S” for SD. [a,d] At P16,
SD increased cFos expression (c2=6.0, p=0.05), FGF2 was increased in both SD and no-
SD animals (c2=9.0, p=0.01), with no change in BDNF. [b,e] At P20, cFos was increased
in SD animals (c2=7.4, p=0.03). [c,f] At P24, cFos and BDNF showed significant effects
of sleep deprivation (c2=8.9, p=0.01; c2=9.1, p=0.01, respectively).
Figure 6:
Age-dependent effects on the expression of BDNF in the cortex of no-SD animals,
indicating that age did not affect the level of BDNF expression. [a] Mean and S.E.M. for
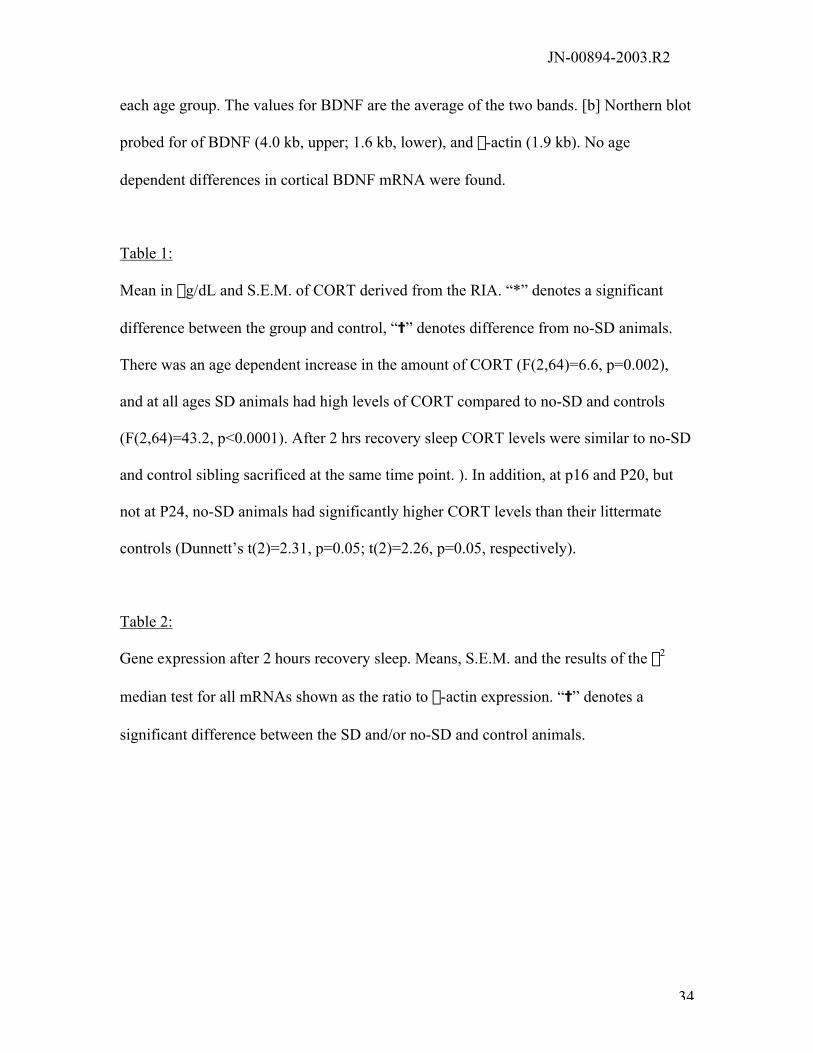
JN-00894-2003.R2
34
each age group. The values for BDNF are the average of the two bands. [b] Northern blot
probed for of BDNF (4.0 kb, upper; 1.6 kb, lower), and b-actin (1.9 kb). No age
dependent differences in cortical BDNF mRNA were found.
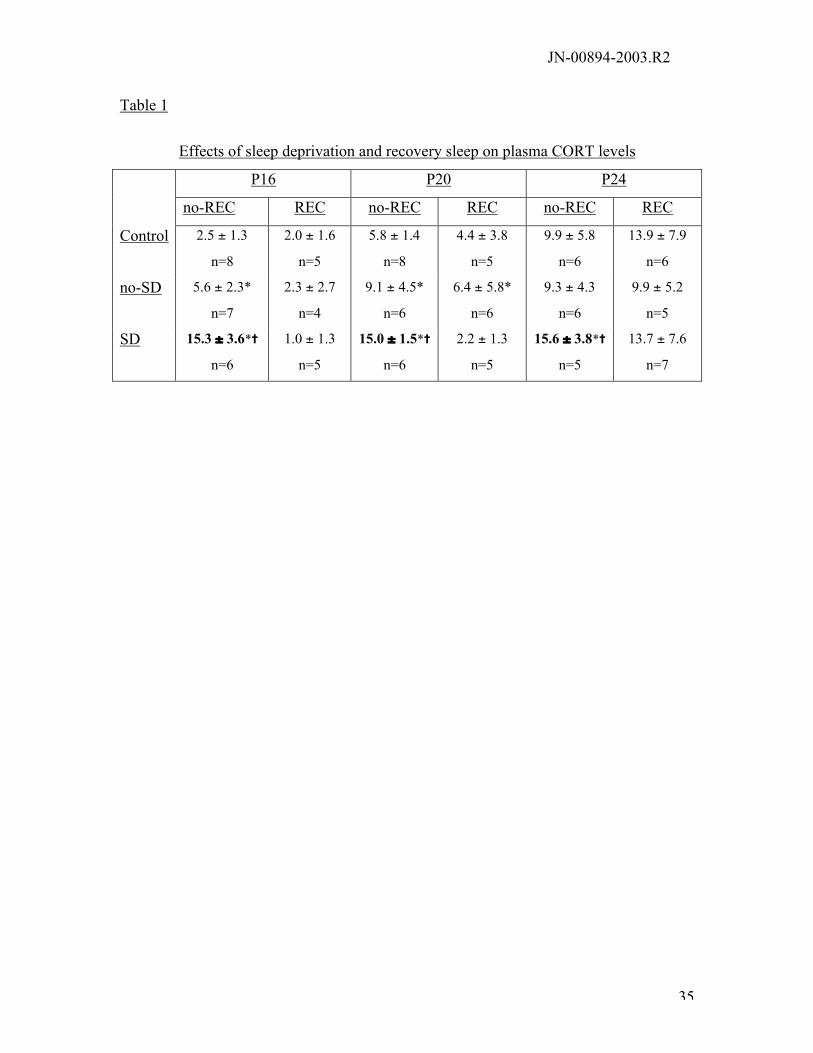
Table 1:
Mean in mg/dL and S.E.M. of CORT derived from the RIA. “*” denotes a significant
difference between the group and control, “=” denotes difference from no-SD animals.
There was an age dependent increase in the amount of CORT (F(2,64)=6.6, p=0.002),
and at all ages SD animals had high levels of CORT compared to no-SD and controls
(F(2,64)=43.2, p<0.0001). After 2 hrs recovery sleep CORT levels were similar to no-SD
and control sibling sacrificed at the same time point. ). In addition, at p16 and P20, but
not at P24, no-SD animals had significantly higher CORT levels than their littermate
controls (Dunnett’s t(2)=2.31, p=0.05; t(2)=2.26, p=0.05, respectively).
Table 2:
Gene expression after 2 hours recovery sleep. Means, S.E.M. and the results of the c2
median test for all mRNAs shown as the ratio to b-actin expression. “=” denotes a
significant difference between the SD and/or no-SD and control animals.
JN-00894-2003.R2
35
Table 1
Effects of sleep deprivation and recovery sleep on plasma CORT levels
P16 P20 P24
no-REC REC no-REC REC no-REC REC
Control 2.5 ± 1.3
n=8
2.0 ± 1.6
n=5
5.8 ± 1.4
n=8
4.4 ± 3.8
n=5
9.9 ± 5.8
n=6
13.9 ± 7.9
n=6
no-SD 5.6 ± 2.3*
n=7
2.3 ± 2.7
n=4
9.1 ± 4.5*
n=6
6.4 ± 5.8*
n=6
9.3 ± 4.3
n=6
9.9 ± 5.2
n=5
SD 15.3 ± 3.6*=
n=6
1.0 ± 1.3
n=5
15.0 ± 1.5*=
n=6
2.2 ± 1.3
n=5
15.6 ± 3.8*=
n=5
13.7 ± 7.6
n=7
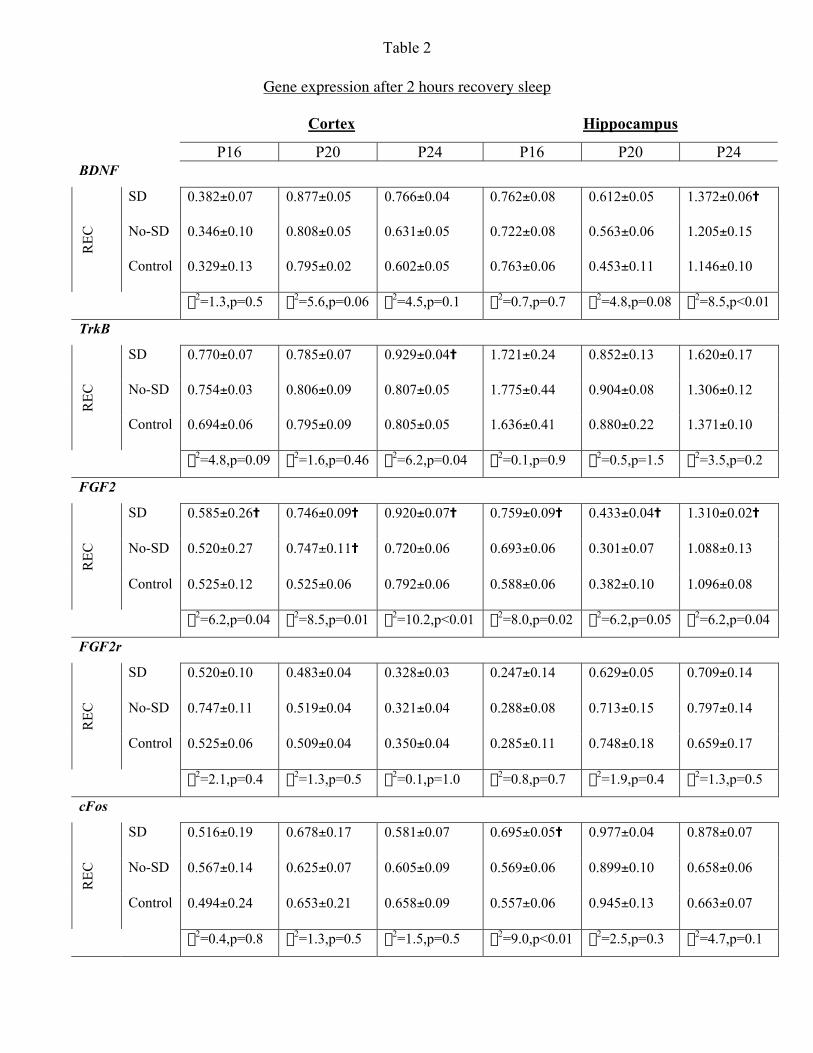
Table 2
36
Gene expression after 2 hours recovery sleep
Cortex Hippocampus
P16 P20 P24 P16 P20 P24BDNF
SD 0.382±0.07 0.877±0.05 0.766±0.04 0.762±0.08 0.612±0.05 1.372±0.06=
No-SD 0.346±0.10 0.808±0.05 0.631±0.05 0.722±0.08 0.563±0.06 1.205±0.15
RE
C
Control 0.329±0.13 0.795±0.02 0.602±0.05 0.763±0.06 0.453±0.11 1.146±0.10
c2=1.3,p=0.5 c2=5.6,p=0.06 c2=4.5,p=0.1 c2=0.7,p=0.7 c2=4.8,p=0.08 c2=8.5,p<0.01
TrkB
SD 0.770±0.07 0.785±0.07 0.929±0.04= 1.721±0.24 0.852±0.13 1.620±0.17
No-SD 0.754±0.03 0.806±0.09 0.807±0.05 1.775±0.44 0.904±0.08 1.306±0.12
RE
C
Control 0.694±0.06 0.795±0.09 0.805±0.05 1.636±0.41 0.880±0.22 1.371±0.10
c2=4.8,p=0.09 c2=1.6,p=0.46 c2=6.2,p=0.04 c2=0.1,p=0.9 c2=0.5,p=1.5 c2=3.5,p=0.2
FGF2
SD 0.585±0.26= 0.746±0.09= 0.920±0.07= 0.759±0.09= 0.433±0.04= 1.310±0.02=
No-SD 0.520±0.27 0.747±0.11= 0.720±0.06 0.693±0.06 0.301±0.07 1.088±0.13
RE
C
Control 0.525±0.12 0.525±0.06 0.792±0.06 0.588±0.06 0.382±0.10 1.096±0.08
c2=6.2,p=0.04 c2=8.5,p=0.01 c2=10.2,p<0.01 c2=8.0,p=0.02 c2=6.2,p=0.05 c2=6.2,p=0.04
FGF2r
SD 0.520±0.10 0.483±0.04 0.328±0.03 0.247±0.14 0.629±0.05 0.709±0.14
No-SD 0.747±0.11 0.519±0.04 0.321±0.04 0.288±0.08 0.713±0.15 0.797±0.14
RE
C
Control 0.525±0.06 0.509±0.04 0.350±0.04 0.285±0.11 0.748±0.18 0.659±0.17
c2=2.1,p=0.4 c2=1.3,p=0.5 c2=0.1,p=1.0 c2=0.8,p=0.7 c2=1.9,p=0.4 c2=1.3,p=0.5
cFos
SD 0.516±0.19 0.678±0.17 0.581±0.07 0.695±0.05= 0.977±0.04 0.878±0.07
No-SD 0.567±0.14 0.625±0.07 0.605±0.09 0.569±0.06 0.899±0.10 0.658±0.06
RE
C
Control 0.494±0.24 0.653±0.21 0.658±0.09 0.557±0.06 0.945±0.13 0.663±0.07
c2=0.4,p=0.8 c2=1.3,p=0.5 c2=1.5,p=0.5 c2=9.0,p<0.01 c2=2.5,p=0.3 c2=4.7,p=0.1
Copyright © 2022 FDOKUMEN